

Page 1

R&S® FSV-K82/-K83
Firmware Option CDMA2000 BTS
Analysis and MS Measurements
Operating Manual
(;ÚÚJ2)
1176.7626.02 ─ 04.1
Operating Manual
Test & Measurement
Page 2

This manual describes the following options:
●
R&S FSV-K82 (1310.8703.02)
●
R&S FSV-K83 (1310.8755.02)
The contents of this manual correspond to the following R&S®FSVR models with firmware version 2.23 or
higher:
●
R&S®FSVR7 (1311.0006K7)
●
R&S®FSVR13 (1311.0006K13)
●
R&S®FSVR30 (1311.0006K30)
●
R&S®FSVR40 (1311.0006K40)
The software contained in this product makes use of several valuable open source software packages. For information, see the
"Open Source Acknowledgement" on the user documentation CD-ROM (included in delivery).
Rohde & Schwarz would like to thank the open source community for their valuable contribution to embedded computing.
© 2015 Rohde & Schwarz GmbH & Co. KG
Mühldorfstr. 15, 81671 München, Germany
Phone: +49 89 41 29 - 0
Fax: +49 89 41 29 12 164
Email: info@rohde-schwarz.com
Internet: www.rohde-schwarz.com
Subject to change – Data without tolerance limits is not binding.
R&S® is a registered trademark of Rohde & Schwarz GmbH & Co. KG.
Trade names are trademarks of the owners.
The following abbreviations are used throughout this manual: R&S®FSV is abbreviated as R&S FSV. R&S®FSVR is abbreviated as
R&S FSVR.
Page 3

R&S® FSV-K82/-K83
Contents
1 Preface.................................................................................................... 5
1.1 Documentation Overview............................................................................................. 5
1.2 Conventions Used in the Documentation...................................................................7
1.3 How to Use the Help System........................................................................................8
2 Introduction.......................................................................................... 10
3 Test Setup for Base Station or Mobile Station Tests........................11
4 Measurement Examples for the CDMA2000 BTS Analysis (option
K82)....................................................................................................... 13
4.1 Test Setup for Base Station Tests.............................................................................13
4.2 Measuring the Signal Channel Power....................................................................... 15
Contents
4.3 Measuring the Spectrum Emission Mask................................................................. 15
4.4 Measuring the Relative Code Domain Power and Frequency Error.......................17
4.5 Measuring the Triggered Relative Code Domain Power......................................... 19
4.6 Measuring the Composite EVM................................................................................. 20
4.7 Measuring the Peak Code Domain Error and the RHO Factor................................22
5 Measurement Examples for the CDMA2000 MS Analysis (option
K83)....................................................................................................... 24
5.1 Test Setup for Base Station or Mobile Station Tests...............................................24
5.2 Measuring the Signal Channel Power....................................................................... 26
5.3 Measuring the Spectrum Emission Mask................................................................. 27
5.4 Measuring the Relative Code Domain Power and Frequency Error.......................28
5.5 Measuring the Triggered Relative Code Domain Power......................................... 30
5.6 Measuring the Composite EVM................................................................................. 31
5.7 Measuring the Peak Code Domain Error and the RHO Factor................................33
6 Instrument Functions of the CDMA2000 Analysis............................ 35
6.1 Measurements and Result Displays..........................................................................35
6.2 Menu and Softkey Description for CDA Measurements..........................................57
6.3 Softkeys and Menus for RF Measurements (K82)....................................................97
6.4 Further Information...................................................................................................151
7 Remote Commands of the CDMA2000 BTS Analysis.....................182
3Operating Manual 1176.7626.02 ─ 04.1
Page 4

R&S® FSV-K82/-K83
7.1 Notation......................................................................................................................183
7.2 CALCulate Subsystem..............................................................................................185
7.3 CONFigure Subsystem............................................................................................. 234
7.4 DISPlay Subsystem...................................................................................................245
7.5 INSTrument Subsystem............................................................................................252
7.6 SENSe Subsystem.................................................................................................... 253
7.7 STATus subsystem...................................................................................................301
7.8 TRACe Subsystem.................................................................................................... 302
7.9 Other Commands Referenced in this Manual........................................................ 310
8 Status Reporting System of the CDMA2000 BTS Analysis (option
K82)..................................................................................................... 327
9 Glossary..............................................................................................328
Contents
10 Appendix.............................................................................................329
List of Commands..............................................................................332
Index....................................................................................................338
4Operating Manual 1176.7626.02 ─ 04.1
Page 5

R&S® FSV-K82/-K83
1 Preface
Preface
Documentation Overview
1.1 Documentation Overview
The user documentation for the R&S FSVR is divided as follows:
●
Quick Start Guide
●
Operating Manuals for base unit and options
●
Service Manual
●
Online Help
●
Release Notes
Quick Start Guide
This manual is delivered with the instrument in printed form and in PDF format on the
CD. It provides the information needed to set up and start working with the instrument.
Basic operations and basic measurements are described. Also a brief introduction to
remote control is given. The manual includes general information (e.g. Safety Instructions) and the following chapters:
Chapter 1 Introduction, General information
Chapter 2 Front and Rear Panel
Chapter 3 Preparing for Use
Chapter 4 Firmware Update and Installation of Firmware Options
Chapter 5 Basic Operations
Chapter 6 Basic Measurement Examples
Chapter 7 Brief Introduction to Remote Control
Appendix Printer Interface
Appendix LAN Interface
Operating Manuals
The Operating Manuals are a supplement to the Quick Start Guide. Operating Manuals
are provided for the base unit and each additional (software) option.
The Operating Manual for the base unit provides basic information on operating the
R&S FSVR in general, and the "Spectrum" mode in particular. Furthermore, the software options that enhance the basic functionality for various measurement modes are
described here. The set of measurement examples in the Quick Start Guide is expanded by more advanced measurement examples. In addition to the brief introduction to
remote control in the Quick Start Guide, a description of the basic analyzer commands
and programming examples is given. Information on maintenance, instrument interfaces and error messages is also provided.
5Operating Manual 1176.7626.02 ─ 04.1
Page 6

R&S® FSV-K82/-K83
In the individual option manuals, the specific instrument functions of the option are
described in detail. For additional information on default settings and parameters, refer
to the data sheets. Basic information on operating the R&S FSVR is not included in the
option manuals.
The following Operating Manuals are available for the R&S FSVR:
●
●
●
●
●
●
●
●
●
●
●
●
●
●
Preface
Documentation Overview
R&S FSVR base unit; in addition:
– R&S FSV-K7S Stereo FM Measurements
– R&S FSV-K9 Power Sensor Support
– R&S FSV-K14 Spectrogram Measurement
R&S FSV-K10 GSM/EDGE Measurement
R&S FSV-K30 Noise Figure Measurement
R&S FSV-K40 Phase Noise Measurement
R&S FSV-K70 Vector Signal Analysis Operating Manual
R&S FSV-K70 Vector Signal Analysis Getting Started (First measurements)
R&S FSV-K72 3GPP FDD BTS Analysis
R&S FSV-K73 3GPP FDD UE Analysis
R&S FSV-K76/77 3GPP TD-SCDMA BTS/UE Measurement
R&S FSV-K82/83 CDMA2000 BTS/MS Analysis
R&S FSV-K84/85 1xEV-DO BTS/MS Analysis
R&S FSV-K91 WLAN IEEE 802.11
R&S FSV-K93 WiMAX IEEE 802.16 OFDM/OFDMA Analysis
R&S FSV-K100/K104 EUTRA / LTE Downlink Measurement Application
R&S FSV-K101/K105 EUTRA / LTE Uplink Measurement Application
These manuals are available in PDF format on the CD delivered with the instrument.
Service Manual
This manual is available in PDF format on the CD delivered with the instrument. It
describes how to check compliance with rated specifications, instrument function,
repair, troubleshooting and fault elimination. It contains all information required for
repairing the R&S FSVR by replacing modules. The manual includes the following
chapters:
Chapter 1 Performance Test
Chapter 2 Adjustment
Chapter 3 Repair
Chapter 4 Software Update / Installing Options
Chapter 5 Documents
Online Help
The online help contains context-specific help on operating the R&S FSVR and all
available options. It describes both manual and remote operation. The online help is
6Operating Manual 1176.7626.02 ─ 04.1
Page 7

R&S® FSV-K82/-K83
installed on the R&S FSVR by default, and is also available as an executable .chm file
on the CD delivered with the instrument.
Release Notes
The release notes describe the installation of the firmware, new and modified functions, eliminated problems, and last minute changes to the documentation. The corresponding firmware version is indicated on the title page of the release notes. The current release notes are provided in the Internet.
Preface
Conventions Used in the Documentation
1.2 Conventions Used in the Documentation
1.2.1 Typographical Conventions
The following text markers are used throughout this documentation:
Convention Description
"Graphical user interface elements"
KEYS Key names are written in capital letters.
File names, commands,
program code
Input Input to be entered by the user is displayed in italics.
Links Links that you can click are displayed in blue font.
"References" References to other parts of the documentation are enclosed by quota-
All names of graphical user interface elements on the screen, such as
dialog boxes, menus, options, buttons, and softkeys are enclosed by
quotation marks.
File names, commands, coding samples and screen output are distinguished by their font.
tion marks.
1.2.2 Conventions for Procedure Descriptions
When describing how to operate the instrument, several alternative methods may be
available to perform the same task. In this case, the procedure using the touchscreen
is described. Any elements that can be activated by touching can also be clicked using
an additionally connected mouse. The alternative procedure using the keys on the
instrument or the on-screen keyboard is only described if it deviates from the standard
operating procedures.
The term "select" may refer to any of the described methods, i.e. using a finger on the
touchscreen, a mouse pointer in the display, or a key on the instrument or on a keyboard.
7Operating Manual 1176.7626.02 ─ 04.1
Page 8

R&S® FSV-K82/-K83
Preface
How to Use the Help System
1.2.3 Notes on Screenshots
When describing the functions of the product, we use sample screenshots. These
screenshots are meant to illustrate as much as possible of the provided functions and
possible interdependencies between parameters.
The screenshots usually show a fully equipped product, that is: with all options installed. Thus, some functions shown in the screenshots may not be available in your particular product configuration.
1.3 How to Use the Help System
Calling context-sensitive and general help
► To display the general help dialog box, press the HELP key on the front panel.
The help dialog box "View" tab is displayed. A topic containing information about
the current menu or the currently opened dialog box and its function is displayed.
For standard Windows dialog boxes (e.g. File Properties, Print dialog etc.), no contextsensitive help is available.
► If the help is already displayed, press the softkey for which you want to display
help.
A topic containing information about the softkey and its function is displayed.
If a softkey opens a submenu and you press the softkey a second time, the submenu
of the softkey is displayed.
Contents of the help dialog box
The help dialog box contains four tabs:
●
"Contents" - contains a table of help contents
●
"View" - contains a specific help topic
●
"Index" - contains index entries to search for help topics
●
"Zoom" - contains zoom functions for the help display
To change between these tabs, press the tab on the touchscreen.
Navigating in the table of contents
●
To move through the displayed contents entries, use the UP ARROW and DOWN
ARROW keys. Entries that contain further entries are marked with a plus sign.
●
To display a help topic, press the ENTER key. The "View" tab with the corresponding help topic is displayed.
8Operating Manual 1176.7626.02 ─ 04.1
Page 9

R&S® FSV-K82/-K83
●
Navigating in the help topics
●
●
Searching for a topic
1. Change to the "Index" tab.
2. Enter the first characters of the topic you are interested in. The entries starting with
3. Change the focus by pressing the ENTER key.
4. Select the suitable keyword by using the UP ARROW or DOWN ARROW keys or
Preface
How to Use the Help System
To change to the next tab, press the tab on the touchscreen.
To scroll through a page, use the rotary knob or the UP ARROW and DOWN
ARROW keys.
To jump to the linked topic, press the link text on the touchscreen.
these characters are displayed.
the rotary knob.
5. Press the ENTER key to display the help topic.
The "View" tab with the corresponding help topic is displayed.
Changing the zoom
1. Change to the "Zoom" tab.
2. Set the zoom using the rotary knob. Four settings are available: 1-4. The smallest
size is selected by number 1, the largest size is selected by number 4.
Closing the help window
► Press the ESC key or a function key on the front panel.
9Operating Manual 1176.7626.02 ─ 04.1
Page 10

R&S® FSV-K82/-K83
2 Introduction
Overview of Firmware Options R&S FSV-K82 and K83
This section contains all information required for operation of an R&S FSVR equipped
with Application Firmware R&S FSV-K82 or K83. It covers operation via menus and the
remote control commands for the CDMA2000 base station (BTS) or mobile station
(MS) analyzer.
This part of the documentation consists of the following chapters:
●
●
●
●
●
●
●
●
Introduction
chapter 3, "Test Setup for Base Station or Mobile Station Tests", on page 11
Describes the measurement setup for base station or mobile station tests.
chapter 4, "Measurement Examples for the CDMA2000 BTS Analysis (option
K82)", on page 13
Explains some basic 1xEV-DO base station tests.
chapter 5, "Measurement Examples for the CDMA2000 MS Analysis (option K83)",
on page 24
Explains some basic 1xEV-DO mobile station tests.
chapter 6, "Instrument Functions of the CDMA2000 Analysis", on page 35
Describes the instrument functions of CDMA2000 Analysis.
chapter 7, "Remote Commands of the CDMA2000 BTS Analysis", on page 182
Describes all remote control commands defined for the code domain measurement. An alphabetic list of all remote control commands and a table of softkeys
with the assignment of commands are provided at the end of this chapter.
chapter 8, "Status Reporting System of the CDMA2000 BTS Analysis (option
K82)", on page 327
Contains device-specific error messages for R&S FSV-K82.
chapter 9, "Glossary", on page 328
Contains an explanation of terms and abbreviations related to the code domain
analysis.
chapter 10, "Appendix", on page 329
This part of the documentation includes only functions of the Application Firmware
R&S FSV-K82 and K83. For all other descriptions, please refer to the description of the
base unit.
10Operating Manual 1176.7626.02 ─ 04.1
Page 11

R&S® FSV-K82/-K83
3 Test Setup for Base Station or Mobile Sta-
tion Tests
This section describes the default settings of the R&S FSVR, if it is used as a
CDMA2000 base or mobile station tester. Before starting the measurements, the
R&S FSVR has to be configured correctly and supplied with power as described in the
Quick Start Guide, "Preparing For Use". Furthermore, the application firmware of the
R&S FSV-K82 (base station) or -K83 (mobile station) must be enabled. Installation and
enabling of the application firmware are described in the Quick Start Guide.
Risk of instrument damage during operation
An unsuitable operating site or test setup can cause damage to the instrument and to
connected devices. Ensure the following operating conditions before you switch on the
instrument:
●
●
●
●
●
●
Test Setup for Base Station or Mobile Station Tests
All fan openings are unobstructed and the airflow perforations are unimpeded. The
minimum distance from the wall is 10 cm.
The instrument is dry and shows no sign of condensation.
The instrument is positioned as described in the following sections.
The ambient temperature does not exceed the range specified in the data sheet.
Signal levels at the input connectors are all within the specified ranges.
Signal outputs are correctly connected and are not overloaded.
Connect the antenna output (or TX output) of the base station/mobile station to the RF
input of the R&S FSVR. Use a power attenuator exhibiting suitable attenuation.
TX signal
3
2
GHI1ABC
DEF
5 64
7
8
9
STU
ÜVW
XYZ
.-0
S CRCL M
RF
INPUT
The following values for external attenuation are recommended to ensure that the RF
input of the analyzer is protected and the sensitivity of the unit is not reduced too
much:
11Operating Manual 1176.7626.02 ─ 04.1
Page 12

R&S® FSV-K82/-K83
Maximum Power Recommended external attenuation
≥ 55 to 60 dBm 35 to 40 dB
≥ 50 to 55 dBm 30 to 35 dB
≥ 45 to 50 dBm 25 to 30 dB
≥ 40 to 45 dBm 20 to 25 dB
≥ 35 to 40 dBm 15 to 20 dB
≥ 30 to 35 dBm 10 to 15 dB
≥ 25 to 30 dBm 0 to 10 dB
≥ 20 to 25 dBm 0 to 5 dB
≤ 20 dBm 0 dB
●
●
●
Test Setup for Base Station or Mobile Station Tests
For signal measurements at the output of two-port networks, connect the reference
frequency of the signal source to the rear reference input of the analyzer.
The R&S FSVR must be operated with an external frequency reference to ensure
that the error limits of the CDMA2000 specification for frequency measurements on
base stations/mobile stations are met. A rubidium frequency standard can be used
as a reference source for example.
If the base station/mobile station has a trigger output, connect the trigger output of
the base station/mobile station to the rear trigger input of the analyzer (EXT TRIG
GATE).
Presettings
●
Enter the external attenuation.
●
Enter the reference level.
●
Enter the center frequency.
●
Set the trigger.
●
If used, enable the external reference.
●
Select the standard and the desired measurement.
●
Set the PN offset.
12Operating Manual 1176.7626.02 ─ 04.1
Page 13

R&S® FSV-K82/-K83
4 Measurement Examples for the CDMA2000
BTS Analysis (option K82)
This section explains basic CDMA2000 base station tests by means of a setup with a
signal generator, e.g. an R&S SMU. It describes how operating and measurement
errors can be avoided using correct settings. The measurements are performed with
an R&S FSVR equipped with the CDMA2000 BTS Analysis option (K82).
The following measurements are described:
●
●
●
●
●
●
Measurement Examples for the CDMA2000 BTS Analysis (option K82)
Test Setup for Base Station Tests
chapter 4.2, "Measuring the Signal Channel Power", on page 15
chapter 4.3, "Measuring the Spectrum Emission Mask", on page 15
chapter 4.4, "Measuring the Relative Code Domain Power and Frequency Error",
on page 17
chapter 4.5, "Measuring the Triggered Relative Code Domain Power",
on page 19
chapter 4.6, "Measuring the Composite EVM", on page 20
chapter 4.7, "Measuring the Peak Code Domain Error and the RHO Factor",
on page 22
As the CDMA2000 BTS Analysis option also supports the CDMA2000 Standard, the
examples are performed on an CDMA2000 signal.
General Test Setup
The measurements are performed with the following units and accessories:
●
An R&S FSVR equipped with the CDMA2000 BTS Analysis option.
●
R&S SMU signal generator equipped with option SMU-B9/B10/B11 baseband generator and SMUK46 CDMA2000 incl. 1xEVDV.
●
1 coaxial cable, 50 Ω, approximately 1 m, N connector
●
2 coaxial cables, 50 Ω, approximately 1 m, BNC connector
4.1 Test Setup for Base Station Tests
This section describes the default settings of the R&S FSVR, if it is used as a
CDMA2000 base station tester. Before starting the measurements, the R&S FSVR has
to be configured correctly and supplied with power as described in the Quick Start
Guide, "Preparing For Use". Furthermore, the application firmware of the R&S FSVK82 must be enabled. Installation and enabling of the application firmware are described in the Quick Start Guide, chapter 3.
13Operating Manual 1176.7626.02 ─ 04.1
Page 14

R&S® FSV-K82/-K83
Risk of damage to the instrument
Before taking the instrument into operation, make sure that
●
●
●
●
Failure to comply may result in damage to the instrument
Connect the antenna output (or TX output) of the base station to the RF input of the
R&S FSVR. Use a power attenuator exhibiting suitable attenuation.
The following values for external attenuation are recommended to ensure that the RF
input of the analyzer is protected and the sensitivity of the unit is not reduced too
much:
Measurement Examples for the CDMA2000 BTS Analysis (option K82)
Test Setup for Base Station Tests
the housing covers are in place and their screws have been tightened,
the ventilation slits are free,
no signal voltage levels above the permissible limits are applied to the inputs,
the outputs of the unit are not overloaded or wrongly connected.
Maximum Power Recommended external attenuation
≥ 55 to 60 dBm 35 to 40 dB
≥ 50 to 55 dBm 30 to 35 dB
≥ 45 to 50 dBm 25 to 30 dB
≥ 40 to 45 dBm 20 to 25 dB
≥ 35 to 40 dBm 15 to 20 dB
≥ 30 to 35 dBm 10 to 15 dB
≥ 25 to 30 dBm 0 to 10 dB
≥ 20 to 25 dBm 0 to 5 dB
20 dBm 0 dB
●
For signal measurements at the output of two-port networks, connect the reference
frequency of the signal source to the rear reference input of the analyzer.
●
The R&S FSVR must be operated with an external frequency reference to ensure
that the error limits of the CDMA2000 specification for frequency measurements on
base stations are met. A rubidium frequency standard can be used as a reference
source for example.
●
If the base station has a trigger output, connect the trigger output of the base station to the rear trigger input of the analyzer (EXT TRIG GATE).
Presettings
●
Enter the external attenuation.
●
Enter the reference level.
●
Enter the center frequency.
●
Set the trigger.
14Operating Manual 1176.7626.02 ─ 04.1
Page 15

R&S® FSV-K82/-K83
●
●
●
Measurement Examples for the CDMA2000 BTS Analysis (option K82)
Measuring the Signal Channel Power
If used, enable the external reference.
Select the standard and the desired measurement.
Set the PN offset.
4.2 Measuring the Signal Channel Power
In the Power measurement, the total channel power of the CDMA2000 signal is displayed. The measurement also displays spurious emissions like harmonics or intermodulation products that occur close to the carrier.
Test setup:
●
Connect the RF output of the signal generator to the RF input of the R&S FSVR
(coaxial cable with N connectors).
Signal generator settings:
Frequency: 878.49 MHz
Level: 0 dBm
Standard: CDMA2000
Procedure:
1. Set the R&S FSVR to its default state.
a) Press the PRESET key.
2. Press the MODE key and activate the CDMA2000 BTS Analysis option.
3. Start the Power measurement
a) Press the MEAS key.
b) Press the "Power" softkey.
4. Set the center frequency to 878.49 MHz.
5. Set the reference level.
a) Press the AMPT key and enter 0 dBm.
On the screen, the spectrum of the signal and the corresponding power levels within
the 1.2288 MHz channel bandwidth are displayed. In the table below the diagram, the
numeric values of the channel bandwidth of the TX Channel and power level of the
analyzed signal are listed.
4.3 Measuring the Spectrum Emission Mask
To detect spurious emissions such as harmonics or intermodulation products, the
R&S FSVR offers a spectrum emission mask measurement. The measurement com-
15Operating Manual 1176.7626.02 ─ 04.1
Page 16

R&S® FSV-K82/-K83
pares the power against the spectrum emission mask in the range from -4 MHz to 4
MHz around the carrier. The exact measurement settings like the filter that is used
depend on the Band Class parameter. For a list of supported bandclasses refer to the
Bandclass softkey in the "Spectrum Emission Mask" menu.
Test setup:
●
Signal generator settings:
●
●
●
●
Procedure:
Measurement Examples for the CDMA2000 BTS Analysis (option K82)
Measuring the Spectrum Emission Mask
Connect the RF output of the signal generator to the RF input of the R&S FSVR
(coaxial cable with N connectors).
Frequency: 878.49 MHz
Level: 0 dBm
Standard: CDMA2000
Link direction: Downlink
1. Set the R&S FSVR to its default state.
a) Press the PRESET key.
2. Activate the CDMA2000 BTS Analysis mode.
a) Press the MODE key and activate the CDMA2000 BTS Analysis option.
3. Start the measurement.
a) Press the MEAS key.
b) Press the "Spectrum Emission Mask" softkey.
4. Set the center frequency.
a) Press the FREQ key and enter 878.49 MHz.
5. Set the reference level.
a) Press the AMPT key and enter 0 dBm.
6. Select a bandclass
a) Press the "Bandclass" softkey and select "BandClass 0: 800 MHz Cellular
Band" from the list.
On the screen, the spectrum of the signal is displayed, including the limit line defined in
the standard. To understand where and about how much the measurement has failed,
the "List Evaluation" table shows the frequencies where spurious emissions occur.
16Operating Manual 1176.7626.02 ─ 04.1
Page 17

R&S® FSV-K82/-K83
Measurement Examples for the CDMA2000 BTS Analysis (option K82)
Measuring the Relative Code Domain Power and Frequency Error
4.4 Measuring the Relative Code Domain Power and Frequency Error
A Code Domain Power measurement analyses the signal over a single Power Control
Group (PCG). It also determines the power of all codes and channels.
The following examples show a Code Domain Power measurement on a test model
with 9 channels. In this measurement, changing some parameters one after the other
should demonstrate the resulting effects: values adapted to the measurement signal
are changed to non-adapted values.
In the following examples, adjusting the settings of the code domain measurements is
described using the dialog boxes. Alternatively, most of the settings can also be modified by using the corresponding hardkeys as in the base unit (e.g. the center frequency
can be either set in the "Frontend Settings" dialog box, or via the FREQ key).
Test setup:
●
Connect the RF output of the signal generator to the RF input of the R&S FSVR.
●
Connect the reference input (EXT REF) on the rear panel of the R&S FSVR to the
reference output (REF) of the signal generator (coaxial cable with BNC connectors).
Signal generator settings:
Frequency: 878.49 MHz
Level: 0 dBm
Standard: CDMA2000
Procedure:
1. Set the R&S FSVR to its default state.
a) Press the PRESET key.
2. Activate the "CDMA2000 BS Analysis" Mode.
a) Press the MODE key and select "CDMA2000 BS Analysis".
3. Enter the Code Domain Analyzer.
a) Press the MEAS key
b) Press the "Code Domain Analyzer" softkey.
4. Start the measurement
a) In the "Code Domain Analyzer" menu, press the "Display Config" softkey.
b) Select the "Code Domain Power" measurement.
5. Set the center frequency and the reference level.
a) In the "Code Domain Analyzer" menu, press the "Frontend Settings" softkey.
17Operating Manual 1176.7626.02 ─ 04.1
Page 18

R&S® FSV-K82/-K83
In the two screens, the following results are displayed: screen A shows the power of
the code domain of the signal. The x-axis represents the individual channels (or
codes), while the y-axis shows the power of each channel.
In screen B the result summary is displayed. It shows the numeric results of the code
domain power measurement, including the frequency error.
By default, the R&S FSV-K82 displays two measurement screens. After a preset
screen A is always the Code Domain Power result display. Screen B is always the
Result Summary display.
For more information on the display concept refer to the Display Config softkey.
Synchronization of the reference frequencies
Measurement Examples for the CDMA2000 BTS Analysis (option K82)
Measuring the Relative Code Domain Power and Frequency Error
b) In the "Center Frequency" field enter 878.49 MHz.
c) In the "Ref Level" field enter 10 dBm.
d) Close the "Frontend Settings" dialog box.
The frequency error can be reduced by synchronizing the transmitter and the receiver
to the same reference frequency.
●
Press the SETUP key.
– Press the "Reference Int/Ext" softkey to switch to an external reference.
Screen A again shows the Code Domain Power measurement and screen B the result
summary. After the synchronization of the reference frequencies of the devices, the
frequency error should now be smaller than 10 Hz.
Behavior with deviating center frequency setting
A measurement can only be valid if the center frequency of the DUT and the analyzer
are balanced.
1. On the signal generator, change the center frequency in steps of 0.1 kHz and
observe the analyzer screen.
Up to a frequency error of approximately 1.0 kHz, a Code Domain Power measurement on the R&S FSVR is still possible. A frequency error within this range causes
no apparent difference in the accuracy of the Code Domain Power measurement.
In case of a frequency error of more than 1.0 kHz, the probability of incorrect synchronization increases. This is indicated by the "SYNC FAILED" error message.
If the frequency error exceeds approximately 1.5 kHz, a Code Domain Power measurement cannot be performed. This is also indicated by the "SYNC FAILED" error
message.
2. Reset the center frequency of the signal generator to 878.49 MHz.
The center frequency of the DUT should not deviate by more than 1.0 kHz from that of
the R&S FSVR.
18Operating Manual 1176.7626.02 ─ 04.1
Page 19

R&S® FSV-K82/-K83
Measurement Examples for the CDMA2000 BTS Analysis (option K82)
Measuring the Triggered Relative Code Domain Power
4.5 Measuring the Triggered Relative Code Domain Power
If the code domain power measurement is performed without external triggering, a section of the test signal is recorded at an arbitrary point of time and the firmware attempts
to detect the start of a PCG. To detect this start, all possibilities of the PN sequence
location have to be tested in Free Run trigger mode. This requires computing time.
This computing time can be reduced by using an external (frame) trigger and entering
the correct PN offset. If the search range for the start of the power control group and
the PN offset are known then fewer possibilities have to be tested. This increases the
measurement speed.
Test setup:
●
Connect the RF output of the signal generator to the input of the R&S FSVR.
●
Connect the reference input (EXT REF) on the rear panel of the R&S FSVR to the
reference input of the signal generator (coaxial cable with BNC connectors).
●
Connect the external trigger input on the rear panel of the R&S FSVR (EXT TRIGGER/GATE IN) to the external trigger output of the signal generator.
Signal generator settings:
●
Frequency: 878.49 MHz
●
Level: 0 dBm
●
Standard: CDMA2000
●
Link direction: Downlink
Procedure:
1. Set the R&S FSVR to its default state.
a) Press the PRESET key.
2. Activate the CDMA2000 BTS Analysis Mode.
a) Press the MODE key and select CDMA2000 BS Analysis.
3. Enter the Code Domain Analyzer.
a) Press the MEAS key
b) Press the "Code Domain Analyzer" softkey.
4. Start the measurement.
a) In the "Code Domain Analyzer" menu, press the "Display Config" softkey.
b) Select the tab for Screen A.
c) Select the "Code Domain Power" measurement.
5. Set the center frequency and the reference level.
a) In the "Code Domain Analyzer" menu, press the "Frontend Settings" softkey.
b) In the "Center Frequency" field enter 878.49 MHz.
c) In the "Ref Level" field enter 10 dBm.
19Operating Manual 1176.7626.02 ─ 04.1
Page 20

R&S® FSV-K82/-K83
In the two screens, the following results are displayed: by default, screen A shows the
code domain power of the signal. Compared to the measurement without an external
trigger (see previous example), the repetition rate of the measurement increases. In
screen B the result summary is displayed. In the row Trigger to Frame, the offset
between the trigger event and and the start of the PCG is shown.
Measurement Examples for the CDMA2000 BTS Analysis (option K82)
Measuring the Composite EVM
d) Close the "Frontend Settings" dialog box.
4.5.1 Adjusting the Trigger Offset
The delay between the trigger event and the start of the PCG can be compensated for
by adjusting the trigger offset.
Set an external trigger source and the trigger offset.
1. Open the "IQ Capture" dialog box.
2. Set the "Trigger Source" option to "External".
3. Set the "Trigger Offset" to 100µs to compensate analog delays of the trigger event.
In the two screens, the following results are displayed: Screen A shows the the same
as above. In screen B the result summary is displayed. In the "Trg to Frame" result, the
offset between the trigger event and the start of the PCG has been adjusted.
4.5.2 Behaviour With the Wrong PN Offset
The last adjustment is setting the PN (Pseudo Noise) offset correctly. The measurement is only valid if the PN offset on the analyzer is the same as that of the transmit
signal.
●
Set a PN Offset.
– Open the "Demodulation Settings" dialog box.
– In the "PN Offset" field enter 200.
Again, screen A shows the CDP measurement, screen B the result summary. In the
result summary, the "Trigger to Frame" result is not correct. Also, the error message
"SYNC FAILED" indicates that the synchronization has failed.
► In the "PN Offset" field enter 0:
After adjusting it, the PN offset on the R&S FSVR is the same as that of the signal. In
the result summary the "Trg To Frame" value is now shown correctly.
4.6 Measuring the Composite EVM
The Error Vector Magnitude (EVM) describes the quality of the measured signal compared to an ideal reference signal generated by the R&S FSVR. In the I-Q plane, the
20Operating Manual 1176.7626.02 ─ 04.1
Page 21

R&S® FSV-K82/-K83
error vector represents the ratio of the measured signal to the ideal signal on symbol
level. The error vector is equal to the square root of the ratio of the measured signal to
the reference signal. The result is given in %.
In the Composite EVM measurement the error is averaged over all channels (by
means of the root mean square) for a given PCG. The measurement covers the entire
signal during the entire observation time. On screen the results are shown in a diagram, in which the x-axis represents the examined PCGs and the y-axis shows the
EVM values.
Test Setup:
●
●
●
Measurement Examples for the CDMA2000 BTS Analysis (option K82)
Measuring the Composite EVM
Connect the RF output of the signal generator to the RF input of the R&S FSVR.
(coaxial cables with N connectors).
Connect the reference input (EXT REF IN/OUT) on the rear panel of the
R&S FSVR.L to the reference output (REF) on the signal generator (coaxial cable
with BNC connectors).
Connect external triggering of the analyzer (EXT TRIG GATE) to the signal generator’s trigger (TRIGOUT1 at PAR DATA).
Signal generator settings:
●
Frequency: 878.49 MHz
●
Level: 0 dBm
●
Standard: CDMA2000
●
Link direction: Downlink
Procedure:
1. Set the R&S FSVR to its default state.
a) Press the PRESET key.
2. Activate the CDMA2000 BTS Analysis Mode.
a) Press the MODE key and select CDMA2000 BTS Analysis.
3. Enter the Code Domain Analyzer.
a) Press the MEAS key
b) Press the "Code Domain Analyzer" softkey.
4. Start the measurement.
a) Press the "Display Config" softkey.
b) Select the tab for Screen A.
c) Select the "Composite EVM" measurement.
5. Set the center frequency and the reference level.
a) Open the "Frontend Settings" dialog box.
b) In the "Center Frequency" field enter 878.49 MHz.
c) In the "Ref Level" field enter 10 dBm.
d) Close the "Frontend Settings" dialog box.
21Operating Manual 1176.7626.02 ─ 04.1
Page 22

R&S® FSV-K82/-K83
6. Set an external trigger source.
In the two screens, the following results are displayed: by default, Screen A shows the
diagram of the Composite EVM measurement result. In screen B the result summary is
displayed. It shows the numeric results of the Code Domain Power measurement,
including the values for the Composite EVM.
Measurement Examples for the CDMA2000 BTS Analysis (option K82)
Measuring the Peak Code Domain Error and the RHO Factor
a) Open the "IQ Capture Settings" dialog box.
b) Set the "Trigger Source" option to "External".
4.7 Measuring the Peak Code Domain Error and the RHO Factor
The Code Domain Error Power describes the quality of the measured signal compared
to an ideal reference signal generated by the R&S FSVR. In the I-Q plane, the error
vector represents the difference of the measured signal and the ideal signal. The Code
Domain Error is the difference in power on symbol level of the measured and the reference signal projected to the class of of the base spreading factor. The unit of the result
is dB.
In the Peak Code Domain Error (PCDE) measurement, the maximum error value over
all channels is determined and displayed for a given PCG. The measurement covers
the entire signal during the entire observation time. On screen the results are shown in
a diagram, in which the x-axis represents the PCGs and the y-axis shows the PCDE
values.
A measurement of the RHO factor is shown in the second part of the example. RHO is
the normalized, correlated power between the measured and the ideal reference signal. The maximum value of RHO is 1. In that case the measured signal and the reference signal are identical. When measuring RHO, it is required that only the pilot channel is active.
Test setup:
●
Connect the RF output of the signal generator to the RF input of the R&S FSVR
(coaxial cable with N connectors).
●
Connect the reference input (EXT REF IN/OUT) on the rear panel of the
R&S FSVR to the reference output (REF) on the signal generator (coaxial cable
with BNC connectors).
●
Connect external triggering of the R&S FSVR (EXT TRIG GATE) to the signal generator trigger (TRIGOUT1 at PAR DATA).
Signal generator settings:
●
Frequency: 878.49 MHz
●
Level: 0 dBm
●
Standard: CDMA2000
●
Link direction: Downlink
22Operating Manual 1176.7626.02 ─ 04.1
Page 23

R&S® FSV-K82/-K83
Procedure:
1. Set the R&S FSVR to its default state.
2. Activate the CDMA2000 BTS Analysis Mode.
3. Enter the Code Domain Analyzer.
4. Start the Peak Code Domain Error measurement.
5. Set the center frequency and the reference level.
Measurement Examples for the CDMA2000 BTS Analysis (option K82)
Measuring the Peak Code Domain Error and the RHO Factor
a) Press the PRESET key.
a) Press the MODE key and activate the CDMA2000 BTS Analysis option.
a) Press the MEAS key.
b) Press the "Code Domain Analyzer" softkey.
a) Press the "Display Config" softkey
b) Select the tab for Screen A.
c) Select the "Peak Code Domain Error" softkey and start the measurement.
a) Open the "Frontend Settings" dialog box.
b) In the "Center Frequency" field enter 878.49 MHz.
c) In the "Ref Level" field enter 0 dBm.
d) Close the "Frontend Settings" dialog box.
6. Set an external trigger source.
a) Open the "IQ Capture Settings" dialog box.
b) Set the "Trigger Source" option to "External".
In the two screens, the following results are displayed: by default, screen A shows the
diagram of the Peak Code Domain Error. In screen B the result summary is displayed.
Displaying RHO
Make sure that all channels except the pilot channel (code 0.64) are OFF, so that only
the pilot channel is available in the measurement.
No specific measurement is required to get the value for RHO. The R&S FSVR always
calculates this value automatically regardless of the code domain measurement performed. Besides the results of the code domain measurements, the numeric result of
the RHO measurement is shown in the result summary, by default shown in screen B.
23Operating Manual 1176.7626.02 ─ 04.1
Page 24

R&S® FSV-K82/-K83
5 Measurement Examples for the CDMA2000
MS Analysis (option K83)
This section explains basic CDMA2000 mobile station tests using a setup with a signal
generator, e.g. an R&S SMU. It describes how operating and measurement errors can
be avoided using correct settings. The measurements are performed with an
R&S FSVR equipped with the CDMA2000 MS Analysis option (K83).
As the CDMA2000 MS Analysis option also supports the CDMA2000 Standard, the
examples are performed on a CDMA2000 signal.
General Test Setup
The measurements are performed with the following units and accessories:
●
●
●
●
Measurement Examples for the CDMA2000 MS Analysis (option K83)
Test Setup for Base Station or Mobile Station Tests
An R&S FSVR equipped with the CDMA2000 MS Analysis option.
R&S SMU signal generator equipped with option SMU-B9/B10/B11 baseband gen-
erator and SMUK46 CDMA2000 incl. 1xEVDV.
1 coaxial cable, 50 Ω, approximately 1 m, N connector
2 coaxial cables, 50 Ω, approximately 1 m, BNC connector
● Test Setup for Base Station or Mobile Station Tests.............................................. 24
● Measuring the Signal Channel Power.....................................................................26
● Measuring the Spectrum Emission Mask................................................................27
● Measuring the Relative Code Domain Power and Frequency Error....................... 28
● Measuring the Triggered Relative Code Domain Power.........................................30
● Measuring the Composite EVM.............................................................................. 31
● Measuring the Peak Code Domain Error and the RHO Factor...............................33
5.1 Test Setup for Base Station or Mobile Station Tests
This section describes the default settings of the R&S FSVR, if it is used as a
CDMA2000 base or mobile station tester. Before starting the measurements, the
R&S FSVR has to be configured correctly and supplied with power as described in the
Quick Start Guide, "Preparing For Use". Furthermore, the application firmware of the
R&S FSV-K82 (base station) or -K83 (mobile station) must be enabled. Installation and
enabling of the application firmware are described in the Quick Start Guide.
24Operating Manual 1176.7626.02 ─ 04.1
Page 25

R&S® FSV-K82/-K83
Risk of instrument damage during operation
An unsuitable operating site or test setup can cause damage to the instrument and to
connected devices. Ensure the following operating conditions before you switch on the
instrument:
●
●
●
●
●
●
Connect the antenna output (or TX output) of the base station/mobile station to the RF
input of the R&S FSVR. Use a power attenuator exhibiting suitable attenuation.
Measurement Examples for the CDMA2000 MS Analysis (option K83)
Test Setup for Base Station or Mobile Station Tests
All fan openings are unobstructed and the airflow perforations are unimpeded. The
minimum distance from the wall is 10 cm.
The instrument is dry and shows no sign of condensation.
The instrument is positioned as described in the following sections.
The ambient temperature does not exceed the range specified in the data sheet.
Signal levels at the input connectors are all within the specified ranges.
Signal outputs are correctly connected and are not overloaded.
TX signal
3
2
GHI1ABC
DEF
5 64
7
8
9
STU
ÜVW
XYZ
.-0
S CRCL M
RF
INPUT
The following values for external attenuation are recommended to ensure that the RF
input of the analyzer is protected and the sensitivity of the unit is not reduced too
much:
Maximum Power Recommended external attenuation
≥ 55 to 60 dBm 35 to 40 dB
≥ 50 to 55 dBm 30 to 35 dB
≥ 45 to 50 dBm 25 to 30 dB
≥ 40 to 45 dBm 20 to 25 dB
≥ 35 to 40 dBm 15 to 20 dB
≥ 30 to 35 dBm 10 to 15 dB
≥ 25 to 30 dBm 0 to 10 dB
≥ 20 to 25 dBm 0 to 5 dB
≤ 20 dBm 0 dB
25Operating Manual 1176.7626.02 ─ 04.1
Page 26

R&S® FSV-K82/-K83
●
●
●
Presettings
●
●
●
●
●
●
●
Measurement Examples for the CDMA2000 MS Analysis (option K83)
Measuring the Signal Channel Power
For signal measurements at the output of two-port networks, connect the reference
frequency of the signal source to the rear reference input of the analyzer.
The R&S FSVR must be operated with an external frequency reference to ensure
that the error limits of the CDMA2000 specification for frequency measurements on
base stations/mobile stations are met. A rubidium frequency standard can be used
as a reference source for example.
If the base station/mobile station has a trigger output, connect the trigger output of
the base station/mobile station to the rear trigger input of the analyzer (EXT TRIG
GATE).
Enter the external attenuation.
Enter the reference level.
Enter the center frequency.
Set the trigger.
If used, enable the external reference.
Select the standard and the desired measurement.
Set the PN offset.
5.2 Measuring the Signal Channel Power
In the Power measurement, the total channel power of the CDMA2000 signal is displayed. The measurement also displays spurious emissions like harmonics or intermodulation products that occur close to the carrier.
Test setup:
●
Connect the RF output of the signal generator to the RF input of the R&S FSVR
(coaxial cable with N connectors).
Signal generator settings:
●
Frequency: 833.49 MHz
●
Level: 0 dBm
●
Standard: CDMA2000
●
Link direction: Uplink
Procedure:
1. Set the R&S FSVR to its default state.
a) Press the PRESET key.
2. Press the MODE key and activate the CDMA2000 MS Analysis option.
3. Start the Power measurement
26Operating Manual 1176.7626.02 ─ 04.1
Page 27

R&S® FSV-K82/-K83
4. Set the center frequency to 833.49 MHz.
5. Set the reference level.
On the screen, the spectrum of the signal and the corresponding power levels within
the 1.2288 MHz channel bandwidth are displayed. In the table below the diagram, the
numeric values of the channel bandwidth of the TX Channel and power level of the
analyzed signal are listed.
Measurement Examples for the CDMA2000 MS Analysis (option K83)
Measuring the Spectrum Emission Mask
a) Press the MEAS key.
b) Press the "Power" softkey.
a) Press the AMPT key and enter 0 dBm.
5.3 Measuring the Spectrum Emission Mask
To detect spurious emissions such as harmonics or intermodulation products, the
R&S FSVR offers a spectrum emission mask measurement. The measurement compares the power against the spectrum emission mask in the range from -4 MHz to 4
MHz around the carrier. The exact measurement settings like the filter that is used
depend on the Band Class parameter. For a list of supported bandclasses refer to the
Bandclass softkey in the "Spectrum Emission Mask" menu.
Test setup:
●
Connect the RF output of the signal generator to the RF input of the R&S FSVR
(coaxial cable with N connectors).
Signal generator settings:
●
Frequency: 833.49 MHz
●
Level: 0 dBm
●
Standard: CDMA2000
●
Link direction: Uplink
Procedure:
1. Set the R&S FSVR to its default state.
a) Press the PRESET key.
2. Activate the "CDMA2000 MS Analysis" mode.
a) Press the MODE key and activate the "CDMA2000 MS Analysis" option.
3. Start the measurement.
a) Press the MEAS key.
b) Press the "Spectrum Emission Mask" softkey.
4. Set the center frequency.
a) Press the FREQ key and enter 878.49 MHz.
27Operating Manual 1176.7626.02 ─ 04.1
Page 28

R&S® FSV-K82/-K83
5. Set the reference level.
6. Select a bandclass
On the screen, the spectrum of the signal is displayed, including the limit line defined in
the standard. To understand where and about how much the measurement has failed,
the "List Evaluation" table shows the frequencies where spurious emissions occur.
Measurement Examples for the CDMA2000 MS Analysis (option K83)
Measuring the Relative Code Domain Power and Frequency Error
a) Press the AMPT key and enter 0 dBm.
a) Press the "Bandclass" softkey and select BandClass 0: 800 MHz Cellular Band
from the list.
5.4 Measuring the Relative Code Domain Power and Frequency Error
A Code Domain Power measurement analyses the signal over a single Power Control
Group (PCG). It also determines the power of all codes and channels.
The following examples show a Code Domain Power measurement on a test model
with 9 channels. In this measurement, changing some parameters one after the other
should demonstrate the resulting effects: values adapted to the measurement signal
are changed to non-adapted values.
In the following examples, adjusting the settings of the code domain measurements is
described using the dialog boxes. Alternatively, most of the settings can also be modified by using the corresponding hardkeys as in the base unit (e.g. the center frequency
can be either set in the "Frontend Settings" dialog box, or via the FREQ key).
Test setup:
●
Connect the RF output of the signal generator to the RF input of the R&S FSVR.
●
Connect the reference input (EXT REF) on the rear panel of the R&S FSVR to the
reference output (REF) of the signal generator (coaxial cable with BNC connectors).
Signal generator settings:
Frequency: 833.49 MHz
Level: 0 dBm
Standard: CDMA2000
Procedure:
1. Set the R&S FSVR to its default state.
a) Press the PRESET key.
2. Activate the "CDMA2000 BS Analysis" Mode.
28Operating Manual 1176.7626.02 ─ 04.1
Page 29

R&S® FSV-K82/-K83
3. Enter the Code Domain Analyzer.
4. Start the measurement
5. Set the center frequency and the reference level.
In the two screens, the following results are displayed: screen A shows the power of
the code domain of the signal. The x-axis represents the individual channels (or
codes), while the y-axis shows the power of each channel.
Measurement Examples for the CDMA2000 MS Analysis (option K83)
Measuring the Relative Code Domain Power and Frequency Error
a) Press the MODE key and select "CDMA2000 BS Analysis".
a) Press the MEAS key
b) Press the "Code Domain Analyzer" softkey.
a) In the "Code Domain Analyzer" menu, press the "Display Config" softkey.
b) Select the "Code Domain Power" measurement.
a) In the "Code Domain Analyzer" menu, press the "Frontend Settings" softkey.
b) In the "Center Frequency" field enter 833.49 MHz.
c) In the "Ref Level" field enter 10 dBm.
d) Close the "Frontend Settings" dialog box.
In screen B the result summary is displayed. It shows the numeric results of the code
domain power measurement, including the frequency error.
By default, the R&S FSV-K83 displays two measurement screens. After a preset
screen A is always the "Code Domain Power" result display. Screen B is always the
"Result Summary" display.
For more information on the display concept refer to chapter 6.1.1, "Display Concept",
on page 36.
Synchronization of the reference frequencies
The frequency error can be reduced by synchronizing the transmitter and the receiver
to the same reference frequency.
●
Press the SETUP key.
– Press the "Reference Int/Ext" softkey to switch to an external reference.
Screen A again shows the Code Domain Power measurement and screen B the result
summary. After the synchronization of the reference frequencies of the devices, the
frequency error should now be smaller than 10 Hz.
Behavior with deviating center frequency setting
A measurement can only be valid if the center frequency of the DUT and the analyzer
are balanced.
1. On the signal generator, change the center frequency in steps of 0.1 kHz and
observe the analyzer screen.
29Operating Manual 1176.7626.02 ─ 04.1
Page 30

R&S® FSV-K82/-K83
2. Reset the center frequency of the signal generator to 833.49 MHz.
The center frequency of the DUT should not deviate by more than 1.0 kHz from that of
the R&S FSVR.
Measurement Examples for the CDMA2000 MS Analysis (option K83)
Measuring the Triggered Relative Code Domain Power
Up to a frequency error of approximately 1.0 kHz, a Code Domain Power measurement on the R&S FSVR is still possible. A frequency error within this range causes
no apparent difference in the accuracy of the Code Domain Power measurement.
In case of a frequency error of more than 1.0 kHz, the probability of incorrect synchronization increases. This is indicated by the "SYNC FAILED" error message.
If the frequency error exceeds approximately 1.5 kHz, a Code Domain Power measurement cannot be performed. This is also indicated by the "SYNC FAILED" error
message.
5.5 Measuring the Triggered Relative Code Domain Power
If the code domain power measurement is performed without external triggering, a section of the test signal is recorded at an arbitrary point of time and the firmware attempts
to detect the start of a PCG. To detect this start, all possibilities of the PN sequence
location have to be tested in Free Run trigger mode. This requires computing time.
This computing time can be reduced by using an external (frame) trigger and entering
the correct PN offset. If the search range for the start of the power control group and
the PN offset are known then fewer possibilities have to be tested. This increases the
measurement speed.
Test setup:
●
Connect the RF output of the signal generator to the input of the R&S FSVR.
●
Connect the reference input (EXT REF) on the rear panel of the R&S FSVR to the
reference input of the signal generator (coaxial cable with BNC connectors).
●
Connect the external trigger input on the rear panel of the R&S FSVR (EXT TRIGGER/GATE IN) to the external trigger output of the signal generator.
Signal generator settings:
●
Frequency: 833.49 MHz
●
Level: 0 dBm
●
Standard: CDMA2000
●
Link direction: Uplink
Procedure:
1. Set the R&S FSVR to its default state.
a) Press the PRESET key.
30Operating Manual 1176.7626.02 ─ 04.1
Page 31

R&S® FSV-K82/-K83
2. Activate the "CDMA2000 MS Analysis" Mode.
3. Enter the Code Domain Analyzer.
4. Start the measurement.
5. Set the center frequency and the reference level.
Measurement Examples for the CDMA2000 MS Analysis (option K83)
Measuring the Composite EVM
a) Press the MODE key and select CDMA2000 BS Analysis.
a) Press the MEAS key
b) Press the "Code Domain Analyzer" softkey.
a) In the "Code Domain Analyzer" menu, press the "Display Config" softkey.
b) Select the tab for Screen A.
c) Select the "Code Domain Power" measurement.
a) In the "Code Domain Analyzer" menu, press the "Frontend Settings" softkey.
b) In the "Center Frequency" field enter 833.49 MHz.
c) In the "Ref Level" field enter 10 dBm.
d) Close the "Frontend Settings" dialog box.
In the two screens, the following results are displayed: by default, screen A shows the
code domain power of the signal. Compared to the measurement without an external
trigger (see previous example), the repetition rate of the measurement increases. In
screen B the result summary is displayed. In the row Trigger to Frame, the offset
between the trigger event and and the start of the PCG is shown.
5.5.1 Adjusting the Trigger Offset
The delay between the trigger event and the start of the PCG can be compensated for
by adjusting the trigger offset.
Set an external trigger source and the trigger offset.
1. Open the "IQ Capture" dialog box.
2. Set the "Trigger Source" option to "External".
3. Set the "Trigger Offset" to 100µs to compensate analog delays of the trigger event.
In the two screens, the following results are displayed: Screen A shows the the same
as above. In screen B the result summary is displayed. In the "Trg to Frame" result, the
offset between the trigger event and the start of the PCG has been adjusted.
5.6 Measuring the Composite EVM
The Error Vector Magnitude (EVM) describes the quality of the measured signal compared to an ideal reference signal generated by the R&S FSVR. In the I-Q plane, the
error vector represents the ratio of the measured signal to the ideal signal on symbol
31Operating Manual 1176.7626.02 ─ 04.1
Page 32

R&S® FSV-K82/-K83
level. The error vector is equal to the square root of the ratio of the measured signal to
the reference signal. The result is given in %.
In the Composite EVM measurement the error is averaged over all channels (by
means of the root mean square) for a given PCG. The measurement covers the entire
signal during the entire observation time. On screen the results are shown in a diagram, in which the x-axis represents the examined PCGs and the y-axis shows the
EVM values.
Test Setup:
●
●
●
Measurement Examples for the CDMA2000 MS Analysis (option K83)
Measuring the Composite EVM
Connect the RF output of the signal generator to the RF input of the R&S FSVR.
(coaxial cables with N connectors).
Connect the reference input (EXT REF IN/OUT) on the rear panel of the
R&S FSVR.L to the reference output (REF) on the signal generator (coaxial cable
with BNC connectors).
Connect external triggering of the analyzer (EXT TRIG GATE) to the signal generator’s trigger (TRIGOUT1 at PAR DATA).
Signal generator settings:
●
Frequency: 833.49 MHz
●
Level: 0 dBm
●
Standard: CDMA2000
●
Link direction: Uplink
Procedure:
1. Set the R&S FSVR to its default state.
a) Press the PRESET key.
2. Activate the "CDMA2000 MS Analysis" Mode.
a) Press the MODE key and select "CDMA2000 MS Analysis".
3. Enter the Code Domain Analyzer.
a) Press the MEAS key
b) Press the "Code Domain Analyzer" softkey.
4. Start the measurement.
a) Press the "Display Config" softkey.
b) Select the tab for Screen A.
c) Select the "Composite EVM" measurement.
5. Set the center frequency and the reference level.
a) Open the "Frontend Settings" dialog box.
b) In the "Center Frequency" field enter 833.49 MHz.
c) In the "Ref Level" field enter 10 dBm.
d) Close the "Frontend Settings" dialog box.
32Operating Manual 1176.7626.02 ─ 04.1
Page 33

R&S® FSV-K82/-K83
6. Set an external trigger source.
In the two screens, the following results are displayed: by default, Screen A shows the
diagram of the Composite EVM measurement result. In screen B the result summary is
displayed. It shows the numeric results of the Code Domain Power measurement,
including the values for the Composite EVM.
Measurement Examples for the CDMA2000 MS Analysis (option K83)
Measuring the Peak Code Domain Error and the RHO Factor
a) Open the "IQ Capture Settings" dialog box.
b) Set the "Trigger Source" option to "External".
5.7 Measuring the Peak Code Domain Error and the RHO Factor
The Code Domain Error Power describes the quality of the measured signal compared
to an ideal reference signal generated by the R&S FSVR. In the I-Q plane, the error
vector represents the difference of the measured signal and the ideal signal. The Code
Domain Error is the difference in power on symbol level of the measured and the reference signal projected to the class of of the base spreading factor. The unit of the result
is dB.
In the Peak Code Domain Error (PCDE) measurement, the maximum error value over
all channels is determined and displayed for a given PCG. The measurement covers
the entire signal during the entire observation time. On screen the results are shown in
a diagram, in which the x-axis represents the PCGs and the y-axis shows the PCDE
values.
A measurement of the RHO factor is shown in the second part of the example. RHO is
the normalized, correlated power between the measured and the ideal reference signal. The maximum value of RHO is 1. In that case the measured signal and the reference signal are identical. When measuring RHO, it is required that only the pilot channel is active.
Test setup:
●
Connect the RF output of the signal generator to the RF input of the R&S FSVR
(coaxial cable with N connectors).
●
Connect the reference input (EXT REF IN/OUT) on the rear panel of the
R&S FSVR to the reference output (REF) on the signal generator (coaxial cable
with BNC connectors).
●
Connect external triggering of the R&S FSVR (EXT TRIG GATE) to the signal generator trigger (TRIGOUT1 at PAR DATA).
Signal generator settings:
●
Frequency: 833.49 MHz
●
Level: 0 dBm
●
Standard: CDMA2000
●
Link direction: Uplink
33Operating Manual 1176.7626.02 ─ 04.1
Page 34

R&S® FSV-K82/-K83
Procedure:
1. Set the R&S FSVR to its default state.
2. Activate the "CDMA2000 MS Analysis" Mode.
3. Enter the Code Domain Analyzer.
4. Start the Peak Code Domain Error measurement.
5. Set the center frequency and the reference level.
Measurement Examples for the CDMA2000 MS Analysis (option K83)
Measuring the Peak Code Domain Error and the RHO Factor
a) Press the PRESET key.
a) Press the MODE key and activate the "CDMA2000 MS Analysis" option.
a) Press the MEAS key.
b) Press the "Code Domain Analyzer" softkey.
a) Press the "Display Config" softkey
b) Select the tab for Screen A.
c) Select the "Peak Code Domain Error" option and start the measurement.
a) Open the "Frontend Settings" dialog box.
b) In the "Center Frequency" field enter 833.49 MHz.
c) In the "Ref Level" field enter 0 dBm.
d) Close the "Frontend Settings" dialog box.
6. Set an external trigger source.
a) Open the "IQ Capture Settings" dialog box.
b) Set the "Trigger Source" option to "External".
In the two screens, the following results are displayed: by default, screen A shows the
diagram of the Peak Code Domain Error. In screen B the result summary is displayed.
Displaying RHO
Make sure that all channels except the pilot channel (code 0.64) are OFF, so that only
the pilot channel is available in the measurement.
No specific measurement is required to get the value for RHO. The R&S FSVR always
calculates this value automatically regardless of the code domain measurement performed. Besides the results of the code domain measurements, the numeric result of
the RHO measurement is shown in the result summary, by default shown in screen B.
34Operating Manual 1176.7626.02 ─ 04.1
Page 35

R&S® FSV-K82/-K83
6 Instrument Functions of the CDMA2000
Analysis
The R&S FSVR equipped with the CDMA2000 BTS Analysis option performs Code
Domain measurements on forward link signals according to the 3GPP2 Standard
(Third Generation Partnership Project 2). It is based on the "Recommended Minimum
Performance Standard for CDMA2000 Spread Spectrum Base Stations", C.S0010-C
version 2.0 dated March 2006. This Standard has been approved by the following
authority with the specified designation:
●
●
When the CDMA2000 specification is mentioned in the document, these standards are
meant.
The CDMA2000 BTS Analysis option supports the radio configurations 1 to 5, i.e. all
radio configurations with a single carrier (1X) are supported. Accordingly, IS95A/B signals conforming to radio configurations 1&2 can be measured with the CDMA2000
BTS Analysis option. In addition to the measurements called for by the CDMA2000
standard in the code domain, the CDMA2000 BTS Analysis option features measurements in the spectral range such as channel power, adjacent channel power, occupied
bandwidth and spectrum emission mask with predefined settings.
Instrument Functions of the CDMA2000 Analysis
Measurements and Result Displays
TIA: TIA-97-F-1
TTA: TTAT.3G-C-S0010-C v2.0
To open the CDMA2000 settings menu
●
Press the MODE key and select the required "CDMA2000" option.
●
If the required "CDMA2000" Mode is already active, press the HOME key.
The CDMA2000 menu is displayed, which is identical to the "Measurement" menu.
For details on the measurement types, see chapter 6.1, "Measurements and Result
Displays", on page 35.
● Measurements and Result Displays........................................................................35
● Menu and Softkey Description for CDA Measurements..........................................57
● Softkeys and Menus for RF Measurements (K82)..................................................97
● Further Information................................................................................................151
6.1 Measurements and Result Displays
The CDMA2000 Analysis options provide the following test measurement types and
result displays. All measurements and result displays are accessed via the
"CDMA2000" menu or the MEAS key.
● Display Concept......................................................................................................36
● Configuring the Display...........................................................................................37
● Code Domain Analysis Results...............................................................................38
● RF Measurement Results....................................................................................... 54
35Operating Manual 1176.7626.02 ─ 04.1
Page 36

R&S® FSV-K82/-K83
Instrument Functions of the CDMA2000 Analysis
Measurements and Result Displays
6.1.1 Display Concept
Measurement results
The code domain analyzer can show up to four result diagrams in four different
screens (windows) at one time. For each screen, you can define which type of result
diagram is to be displayed, or deactivate the screen temporarily. The current configuration of the display, i.e. which screens are displayed and which result diagram is displayed in which screen, can be stored and retrieved later. Thus, you can easily switch
between predefined display configurations.
The available measurement results are described in the following sections.
All results are calculated from the same dataset of the recorded signal. Thus, it is not
necessary to restart the measurement in order to switch the display mode.
Measurement settings
The most important measurement settings are displayed in the diagram header. For
Code Domain Analyzer measurements, the following settings are shown:
Label Description
Ref level Reference level defined in "Ref Level" on page 62
Freq Center frequency defined in "Center" on page 62
Att Attenuation
Channel Channel with spreading factor
PCG Slot
Power Ref Reference used for power results
SymbRate Symbol rate of the current channel
Overview of all measurement settings
You can easily display an overview of all measurement settings using the Settings
Overview softkey.
In addition to the information in the diagram header, each screen title contains diagram-specific trace information.
Screen focus
One of the screens has a blue frame indicating the focus. The screen focus can be
changed just like in the base system. The settings for trace statistics and markers can
only be changed for the focussed screen. Furthermore, the focussed screen can be set
to full screen (for details see the R&S FSVR Quick Start Guide).
36Operating Manual 1176.7626.02 ─ 04.1
Page 37

R&S® FSV-K82/-K83
Instrument Functions of the CDMA2000 Analysis
Measurements and Result Displays
6.1.2 Configuring the Display
1. Select the "Display Config" softkey in the "Code Domain Analyzer" menu.
2. Select the tab for the screen you want to configure (A-D).
3. Select the "Screen X active" option to display the selected screen.
Tip: SCPI command: DISPlay[:WINDow<n>]:STATe on page 246
4. Select the required result diagram to be displayed in the selected screen.
Tip: SCPI command: CALCulate<n>:FEED on page 186
5. Press "Close".
To select a predefined display configuration
You can retrieve previously stored display configurations, and thus easily switch
between different displays of measurement results.
1. Select the "Predefined" tab in the "Display Configuration" dialog box.
The previously stored and default configurations are listed. The current configuration is displayed at the top of the dialog box.
2. Select the required set of screen configurations.
3. Press "Apply".
To store the current display configuration
You can store the current display configuration in the list of predefined settings in order
to switch back to it later.
1. Select the current display configuration at the top of the "Display Configuration"
dialog box.
2. Click "Add".
The current display configuration is added to the list of predefined settings.
To remove a predefined display configuration
You can remove one of the stored display configurations.
1. Select the display configuration to be removed from the "Predefined" tab of the
"Display Configuration" dialog box.
2. Click "Remove".
The selected display configuration is removed from the list of predefined settings.
37Operating Manual 1176.7626.02 ─ 04.1
Page 38

R&S® FSV-K82/-K83
To restore the default display configurations
You can restore the default set of predefined display configurations.
► In the "Predefined" tab of the "Display Configuration" dialog box, click "Restore".
Instrument Functions of the CDMA2000 Analysis
Measurements and Result Displays
6.1.3 Code Domain Analysis Results
The Code Domain Analyzer provides the following result display configurations for
measurements in the code domain:
● Code Domain Power...............................................................................................38
● Channel Table.........................................................................................................40
● Power vs PCG.........................................................................................................41
● Result Summary......................................................................................................42
● Code Domain Error Power......................................................................................44
● Composite EVM (RMS)...........................................................................................45
● Peak Code Domain Error........................................................................................46
● Channel Constellation.............................................................................................47
● EVM vs Symbol.......................................................................................................48
● Composite Constellation......................................................................................... 49
● Power vs Symbol.................................................................................................... 50
● Channel Bitstream...................................................................................................50
● Mag Error vs Chip................................................................................................... 52
● Phase Error vs Chip................................................................................................52
● Symbol Magnitude Error......................................................................................... 53
● Symbol Phase Error................................................................................................54
6.1.3.1 Code Domain Power
This result display determines the power of all channels and plots it in a diagram. The
x-axis represents the channel (code) number, which corresponds to the base spreading factor. Each bar in the diagram represents one code. The order of the codes
depends on the "Code Order" on page 76. The y-axis is a logarithmic level axis that
shows the power of each channel.
The measurement evaluates the total signal over a single PCG. It supports both Hadamard and BitReverse code sorting order.
MS mode: the power is calculated only for the selected branch (I or Q).
38Operating Manual 1176.7626.02 ─ 04.1
Page 39
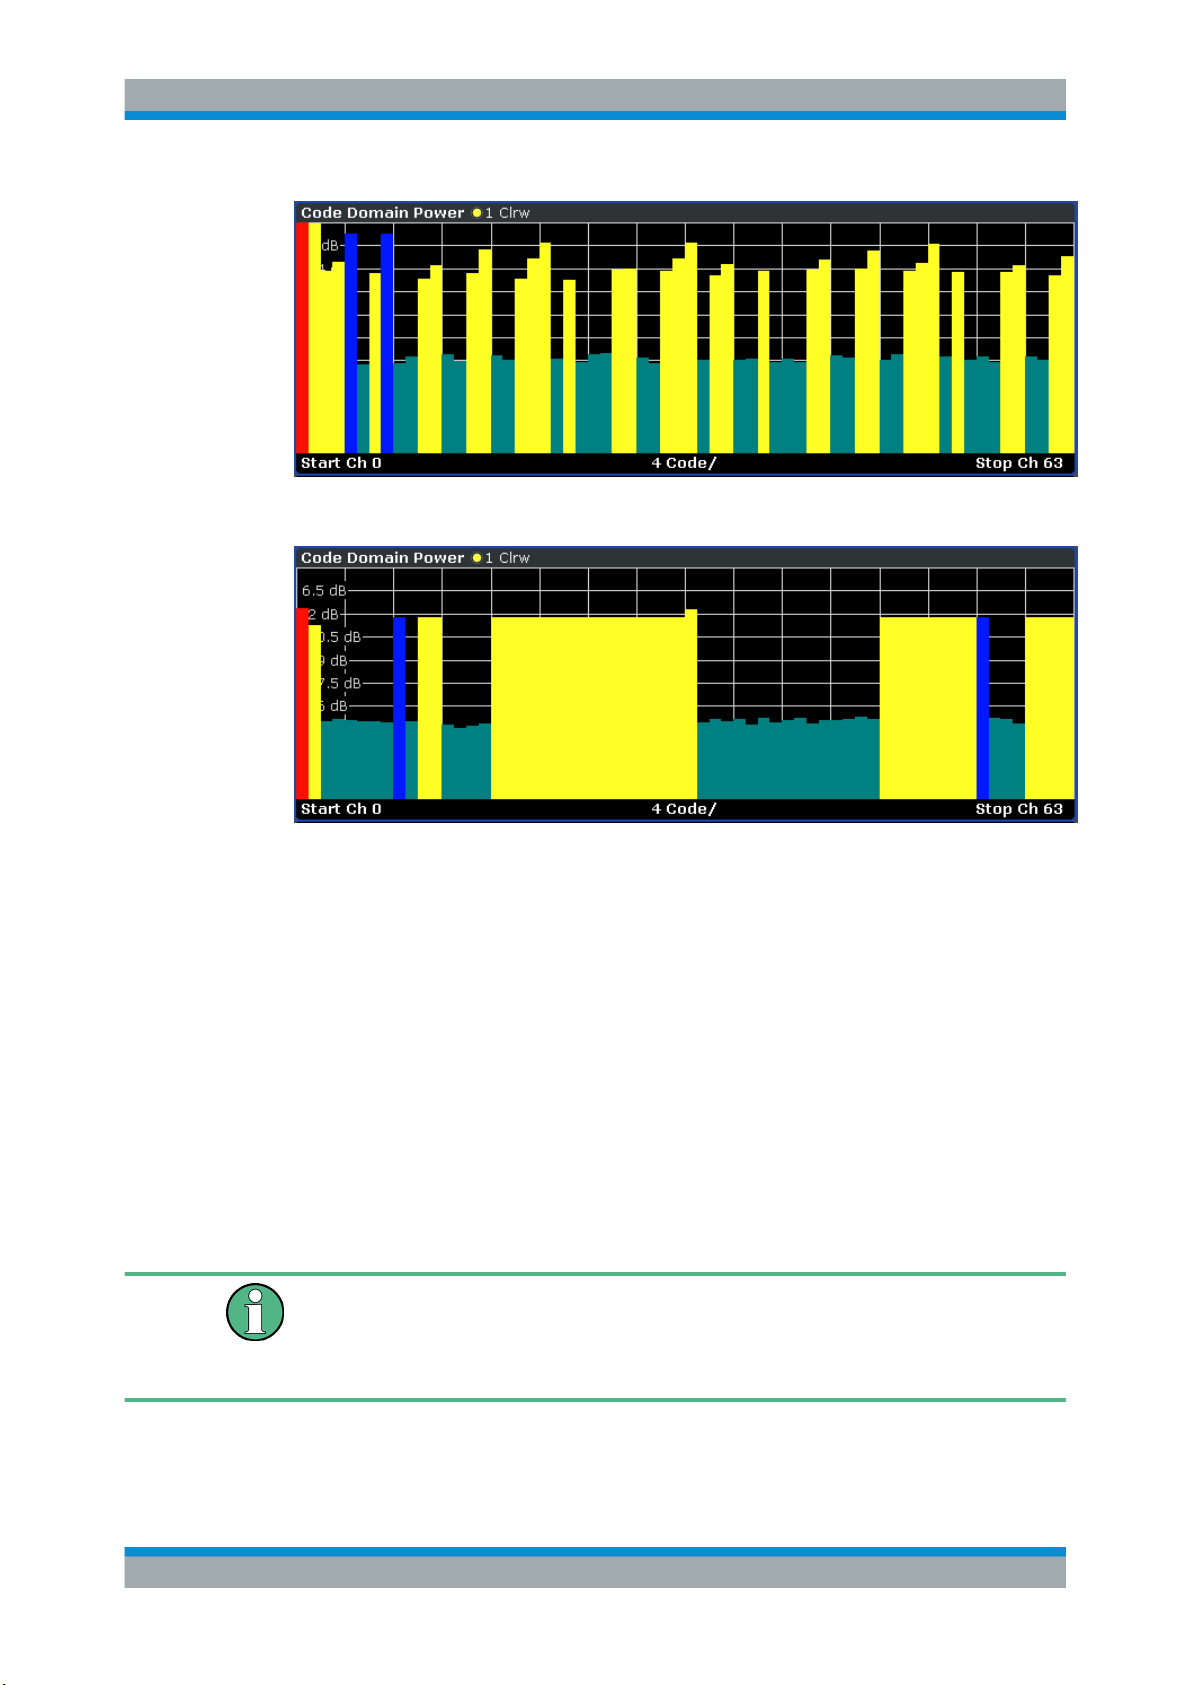
R&S® FSV-K82/-K83
Fig. 6-1: Code Domain Power Result Display in Hadamard code sorting order
Instrument Functions of the CDMA2000 Analysis
Measurements and Result Displays
Fig. 6-2: Code Domain Power Result Display in Hadamard code sorting order
Active and inactive data channels are defined via the "Inactive Channel Threshold"
on page 66. The power values of the active and unassigned channels are shown in
different colors. In addition, codes with alias power can occur. These codes obtain
power components originating either from a spreading factor higher than the base
spreading factor or from the own and/or another antenna as a result of transmit diversity.
The following colors are defined:
●
Red: selected channel (Channel (Code) Number)
●
Yellow: active channel
●
Cyan: inactive channel
●
Light blue: alias power of higher spreading factor
●
Magenta: alias power as a result of transmit diversity
If codes with alias power are displayed, set the highest base spreading factor available
in the Base Spreading Factor field.
It is not recommended to select more detailed result displays (such as "Channel Constell") for unassigned or inactive codes, since the results are not valid.
39Operating Manual 1176.7626.02 ─ 04.1
Page 40
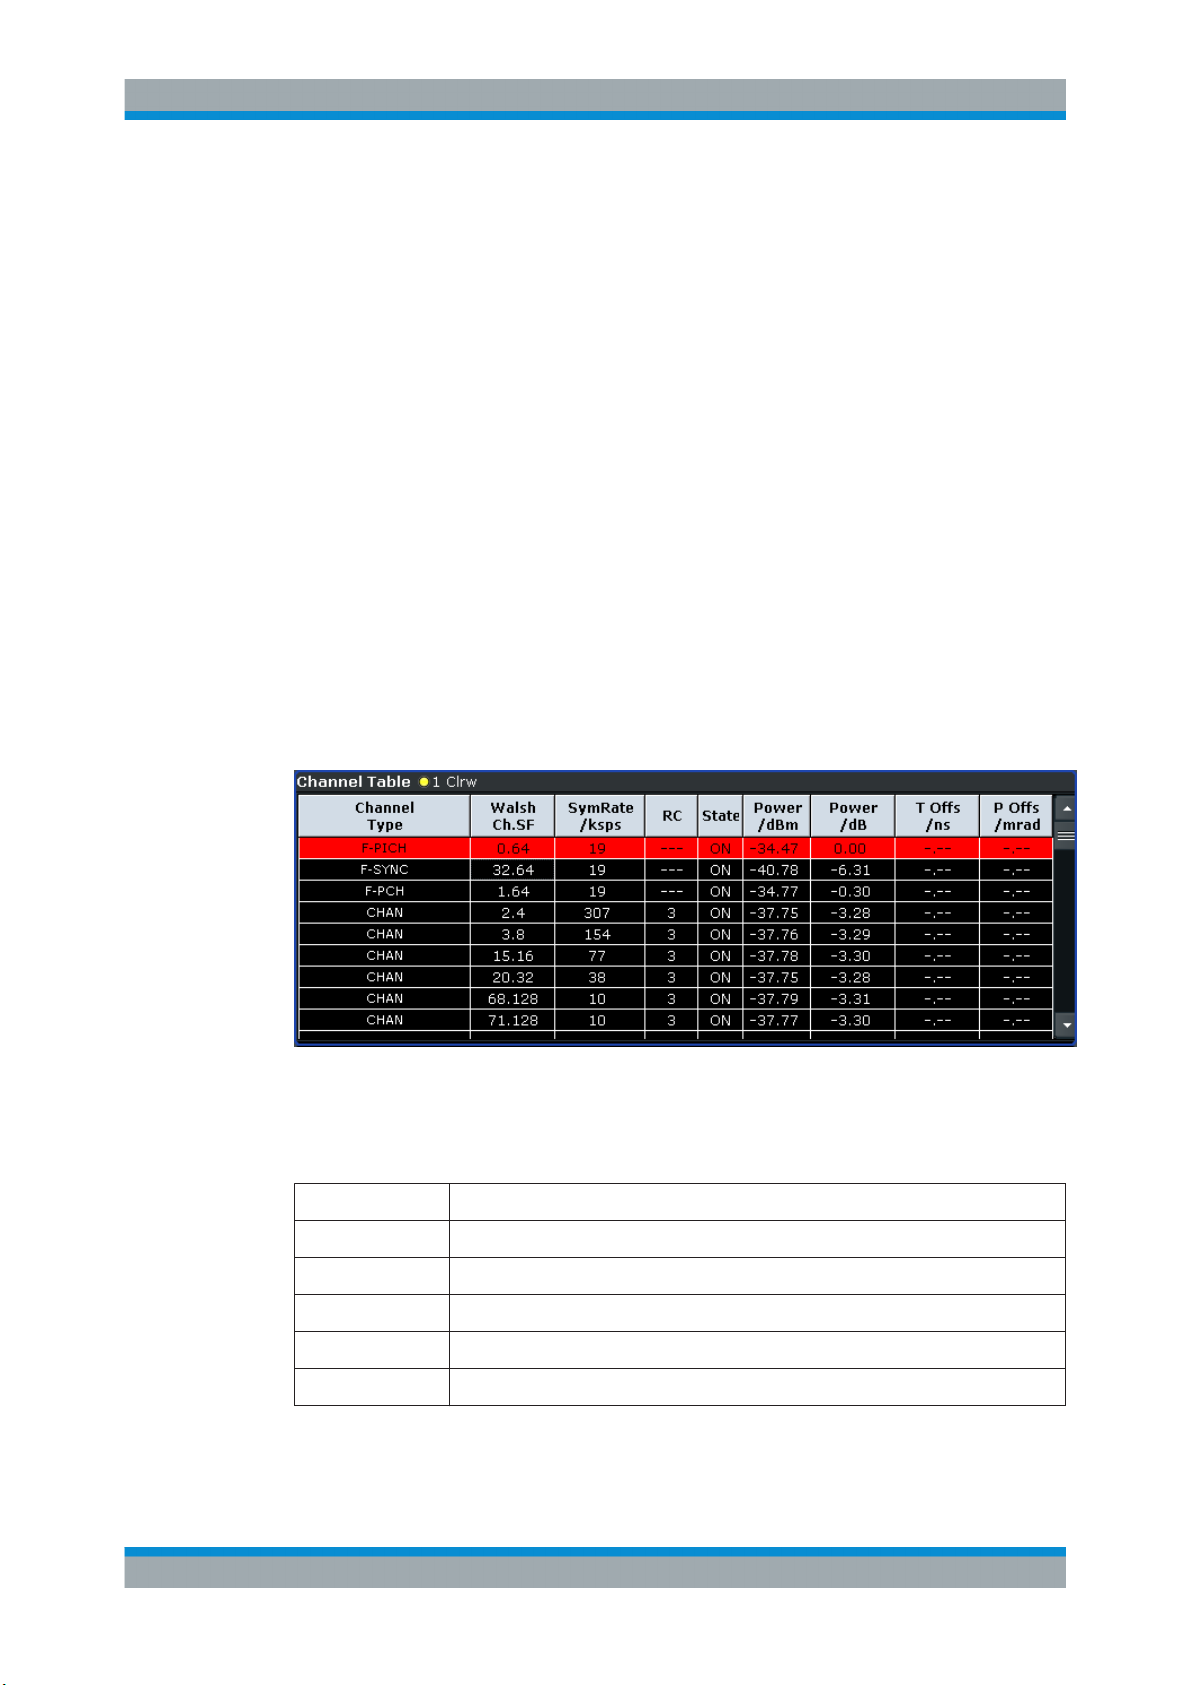
R&S® FSV-K82/-K83
Remote control
In remote control, this display configuration is selected using
CALC:FEED 'XPOW:CDP'; see CALCulate<n>:FEED on page 186.
To query these results, use the command CALC:MARK:FUNC:CDP:RES? CDP or
CALC:MARK:FUNC:CDP:RES? CDPR; see CALCulate<n>:MARKer<m>:FUNCtion:
CDPower[:BTS]:RESult? on page 188.
Instrument Functions of the CDMA2000 Analysis
Measurements and Result Displays
6.1.3.2 Channel Table
This result display shows all channels of the signal. The sorting of the channels is
according to channel type, i.e. special channels like F-PICH, F-SYNC etc. first, then
data channels (CHAN) and last inactive channels (always shown as '---'). Within a
group, channels are sorted according to the spreading factor and then according to
code number, also in ascending order. Within the code number, first active, then inactive channels are listed. The selected channel is marked in red. Active and inactive
data channels are defined via the "Inactive Channel Threshold" on page 66.
The Channel Table result display may contain up to 128 entries, corresponding to the
highest base spreading factor of 128.
The measurement evaluates the total signal over a single PCG.
Fig. 6-3: Channel Table result display
For the Code Domain Power measurement, the following parameters are determined
for the channels:
Parameter Description
Channel Type Shows the channel type ('---' for inactive channels)
Walsh Chan.SF Channel number including the spreading factor (in the form <Channel>.<SF>).
Symb Rate/ksps Symbol rate with which the channel is transmitted (9.6 ksps to 307.2 ksps).
RC Radio configuration.
State Status display. Unassigned codes are identified as inactive channels.
40Operating Manual 1176.7626.02 ─ 04.1
Page 41
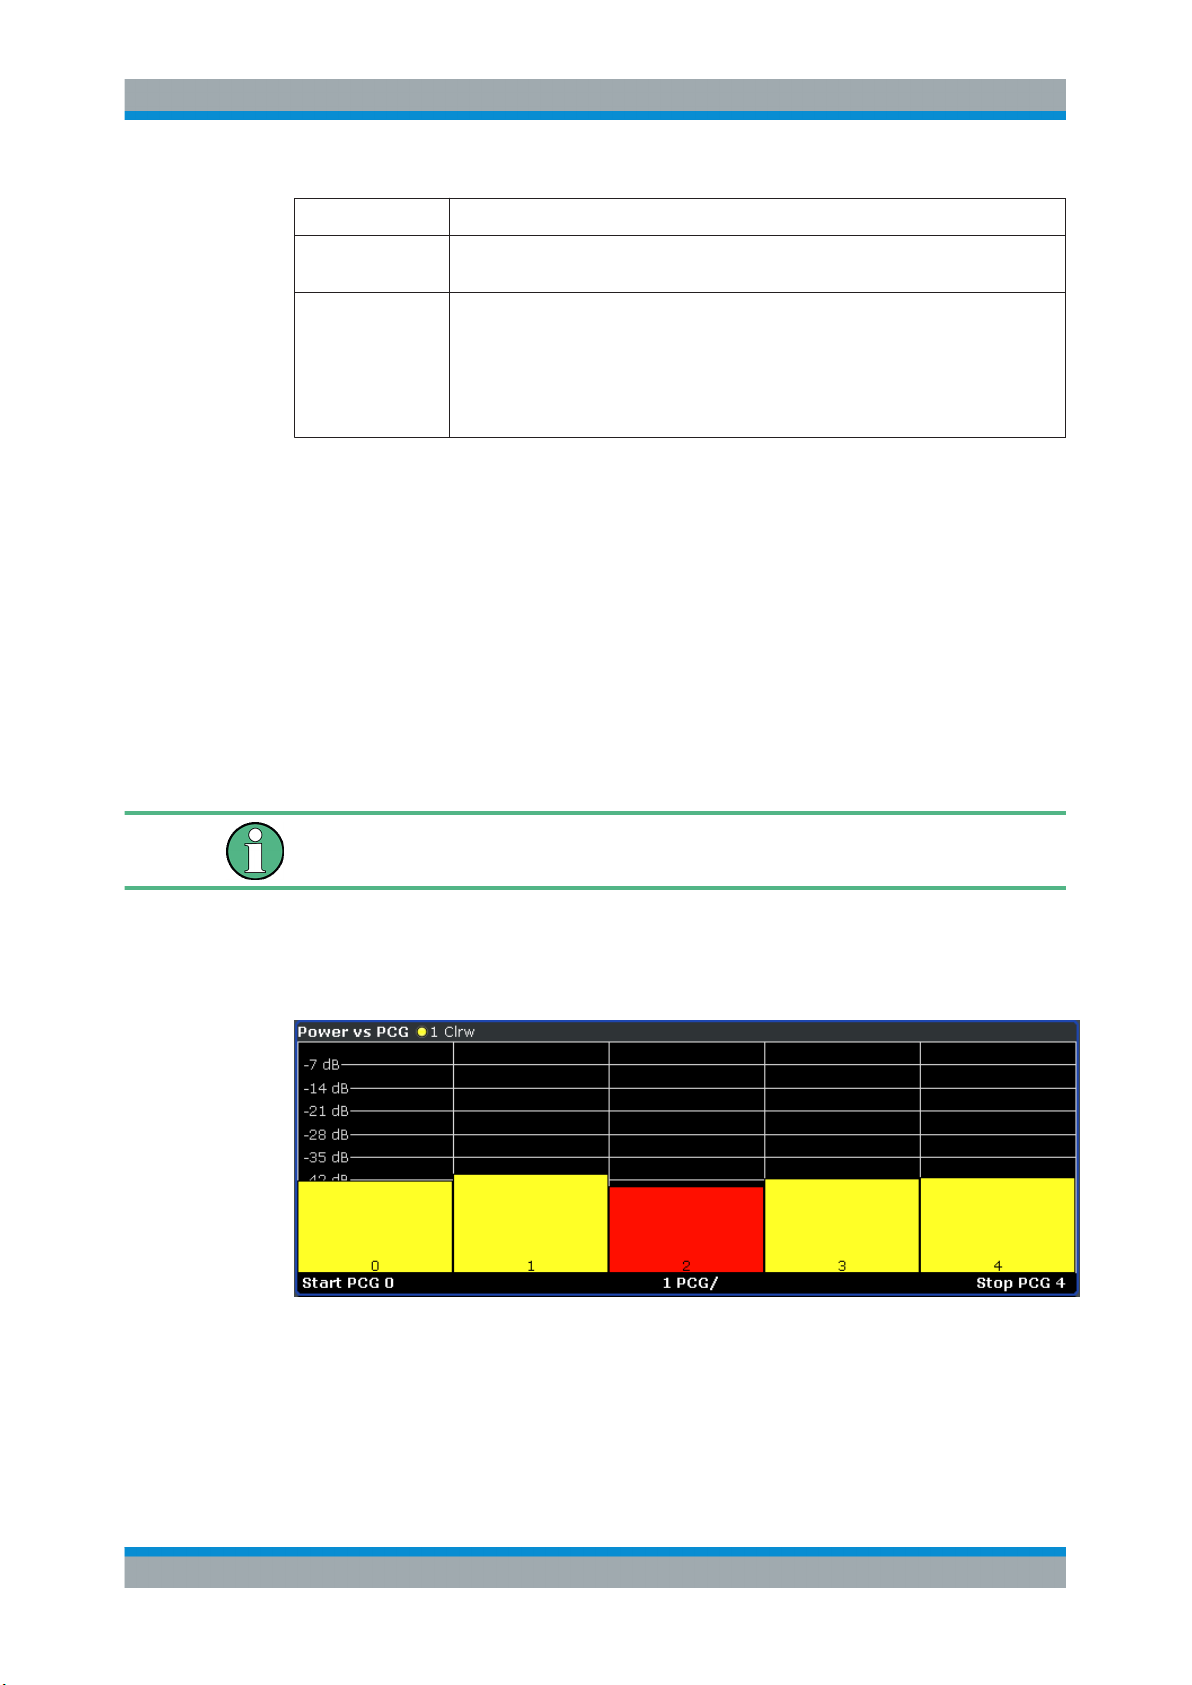
R&S® FSV-K82/-K83
Parameter Description
Pwr dBm/Pwr dB Specification of the absolute (dBm) and relative (dB) power of the channel. Relative
Instrument Functions of the CDMA2000 Analysis
Measurements and Result Displays
powers are either referred to the pilot channel or the total power of the signal.
T Offs/ns and Ph
Offs/mrad
Remote control
In remote control, this display configuration is selected using
CALC:FEED 'XTIM:CDP:ERR:CTABle'; see CALCulate<n>:FEED on page 186.
6.1.3.3 Power vs PCG
In this result display, the power of the selected channel is averaged for each measured
PCG and referred to the pilot power of the PCG. Therefore the unit of the y-axis is dB
(relative to the Pilot Channel). The result display consists of the number of the PCGs in
the measurement and their respective power value.
MS mode: the power is calculated only for the selected branch (I or Q).
For signals with enabled power control, use the default reference power setting. For
details refer to "Power Reference" on page 76.
Timing/phase offset between this channel and the pilot channel (enabled via the
"Demod Settings (BTS mode)" on page 70 dialog box.
If enabled, the maximum value of the timing/phase offset is displayed together with
the associated channel in the last two lines. Since the timing/phase offset values of
each active channel can be either negative or positive, the absolute values are compared and the maximum is displayed with the original sign.
The measurement evaluates one code channel over the entire period of observation.
The selected PCG is displayed red.
You can set the number of PCGs by means of the "Capture Length" on page 64 field.
Fig. 6-4: Power vs PCG result display
For measurements in which Antenna Diversity is inactive (OFF) or set to 'Antenna 1',
the F-PICH channel is used as reference, while the F-TDPICH channel is used for
measurements in which Antenna Diversity is set to 'Antenna 2'.
41Operating Manual 1176.7626.02 ─ 04.1
Page 42
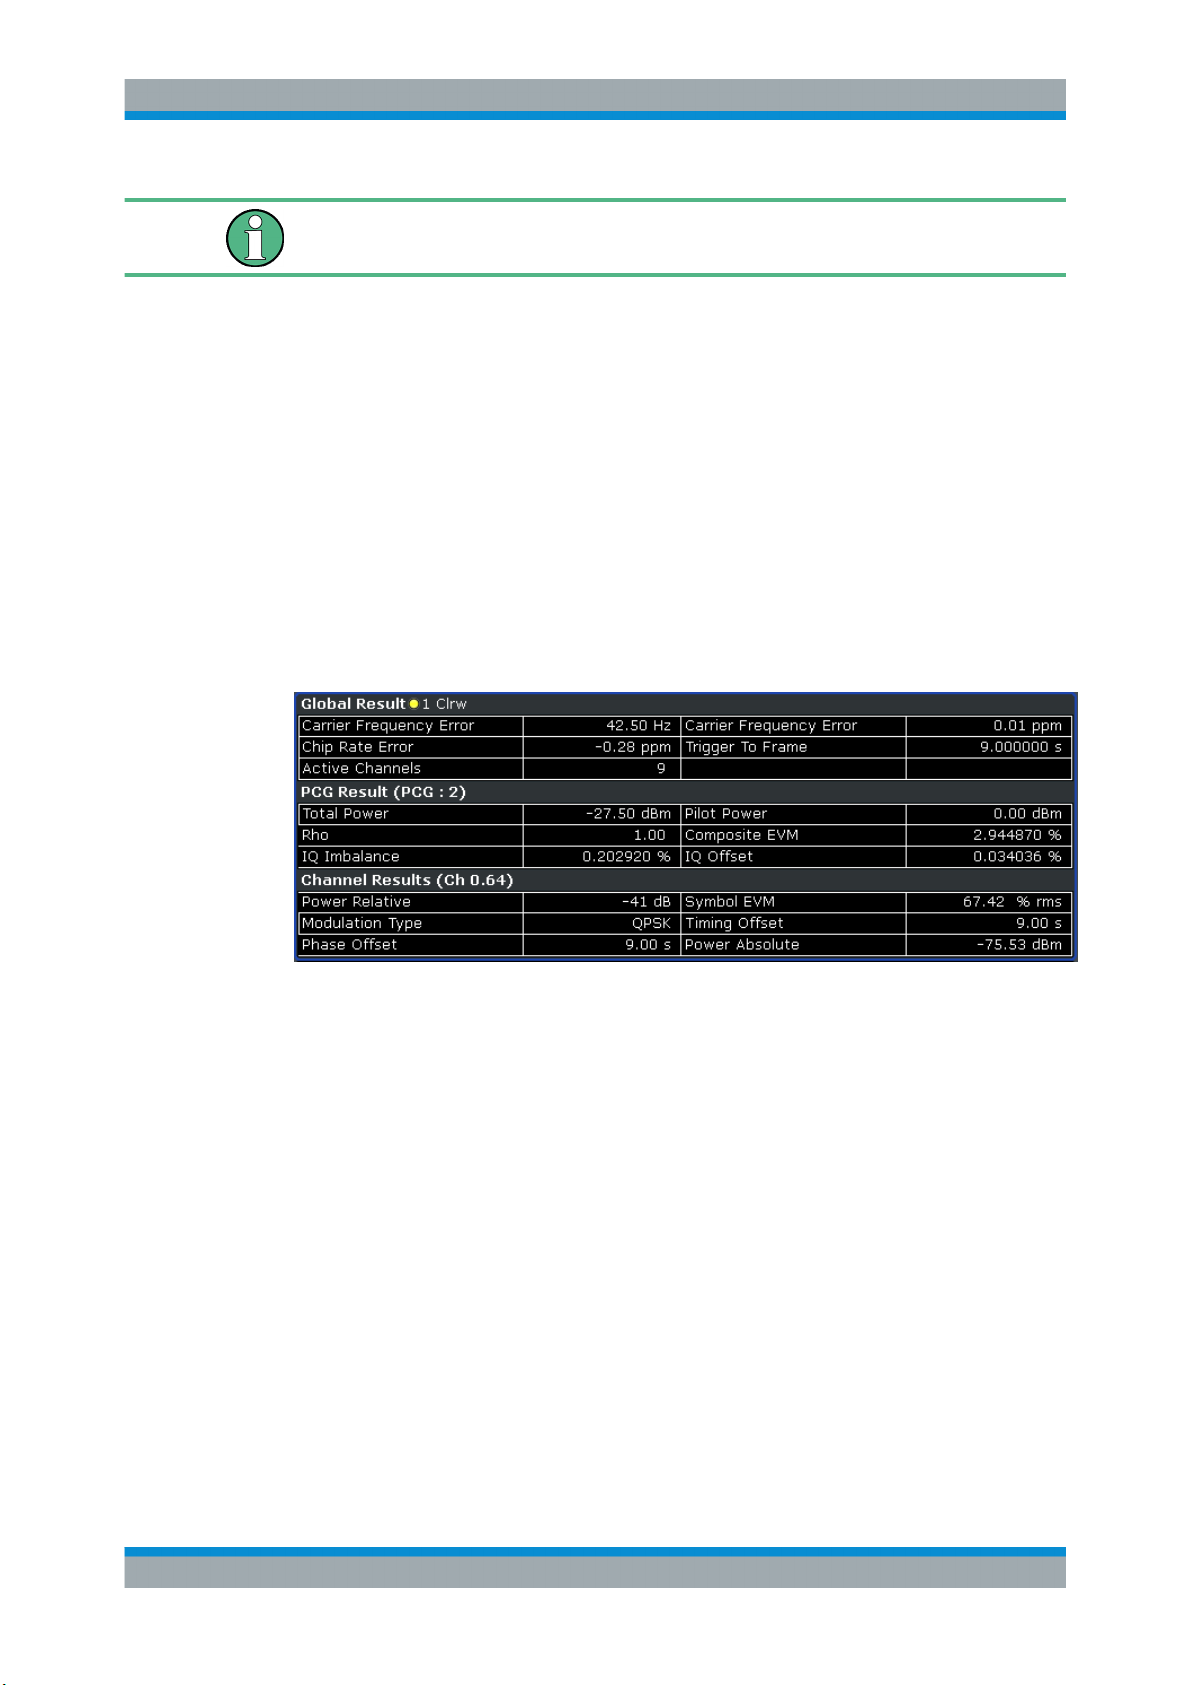
R&S® FSV-K82/-K83
To correctly detect the start of a power control group, the external trigger must be used
for power-regulated signals.
Remote control
In remote control, this display configuration is selected using
CALC:FEED 'XTIM:CDP:PVSLot'; see CALCulate<n>:FEED on page 186.
Instrument Functions of the CDMA2000 Analysis
Measurements and Result Displays
6.1.3.4 Result Summary
The Result Summary shows the results of various code domain measurements in a
table.
The table is divided as follows:
●
Global results
●
PCG results
●
Channel results
Fig. 6-5: Result Summary result display
Remote control
In remote control, this display configuration is selected using
CALC:FEED 'XTIM:CDP:ERR:SUMMary'; see CALCulate<n>:FEED on page 186.
To query these results, use the command CALC:MARK:FUNC:CDP:RES? ; see
CALCulate<n>:MARKer<m>:FUNCtion:CDPower[:BTS]:RESult? on page 188.
Global Results
Under Global Results, the measurement results that concern the total signal (that is, all
channels) for the entire period of observation (that is, all PCGs) are displayed:
●
Carrier Frequency Error
Shows the frequency error referred to the center frequency of the R&S FSVR. The
absolute frequency error is the sum of the frequency error of the R&S FSVR and
that of the device under test. Frequency differences between the transmitter and
receiver of more than 1.0 kHz impair synchronization of the Code Domain Power
measurement. If at all possible, the transmitter and the receiver should be
42Operating Manual 1176.7626.02 ─ 04.1
Page 43

R&S® FSV-K82/-K83
●
●
●
Instrument Functions of the CDMA2000 Analysis
Measurements and Result Displays
synchronized. For further information on correcting the frequency error refer to
chapter 4.4, "Measuring the Relative Code Domain Power and Frequency Error",
on page 17 .
The frequency error is available in the units both Hz and ppm referred to the carrier
frequency.
Chip Rate Error
Shows the chip rate error (1.2288 Mcps) in ppm. A large chip rate error results in
symbol errors and, therefore, in possible synchronization errors for Code Domain
Power measurements. This measurement result is also valid if the R&S FSVR
could not synchronize to the CDMA2000 signal.
Trigger to Frame
Reflects the time offset from the beginning of the recorded signal section to the
start of the first PCG. In case of triggered data recording, this corresponds to the
timing offset:
frame trigger (+ trigger offset) – start of first PCG
If it was not possible to synchronize the R&S FSVR to the CDMA2000 signal, this
measurement result is meaningless. For the Free Run trigger mode, dashes are
displayed.
Active Channels
Specifies the number of active channels found in the signal. Detected data channels as well as special channels are regarded as active. With transmit diversity, the
result applies to the selected "Antenna Diversity" on page 72. No value is displayed in both the Min and Max columns.
PCG Results
Under PCG, the measurement results that concern the total signal (that is, all channels) for the selected PCG are displayed:
●
Total Power
Shows the total power of the signal.
●
Pilot Power
Shows the power of the pilot channel. If antenna 2 is selected, the power of the FTDPICH is displayed, in all other cases that of the F-PICH. For details on antenna
selection refer to "Antenna Diversity" on page 72.
●
RHO
Shows the quality parameter RHO. According to the CDMA2000 standard, RHO is
the normalized, correlated power between the measured and the ideally generated
reference signal. When RHO is measured, the CDMA2000 standard requires that
only the pilot channel be supplied.
●
Composite EVM
The composite EVM is the difference between the test signal and the ideal reference signal. For further details refer to the chapter 6.1.3.6, "Composite EVM
(RMS)", on page 45 result display.
●
IQ Imbalance/Offset
Shows the IQ imbalance and the DC offset of the signal in %.
43Operating Manual 1176.7626.02 ─ 04.1
Page 44
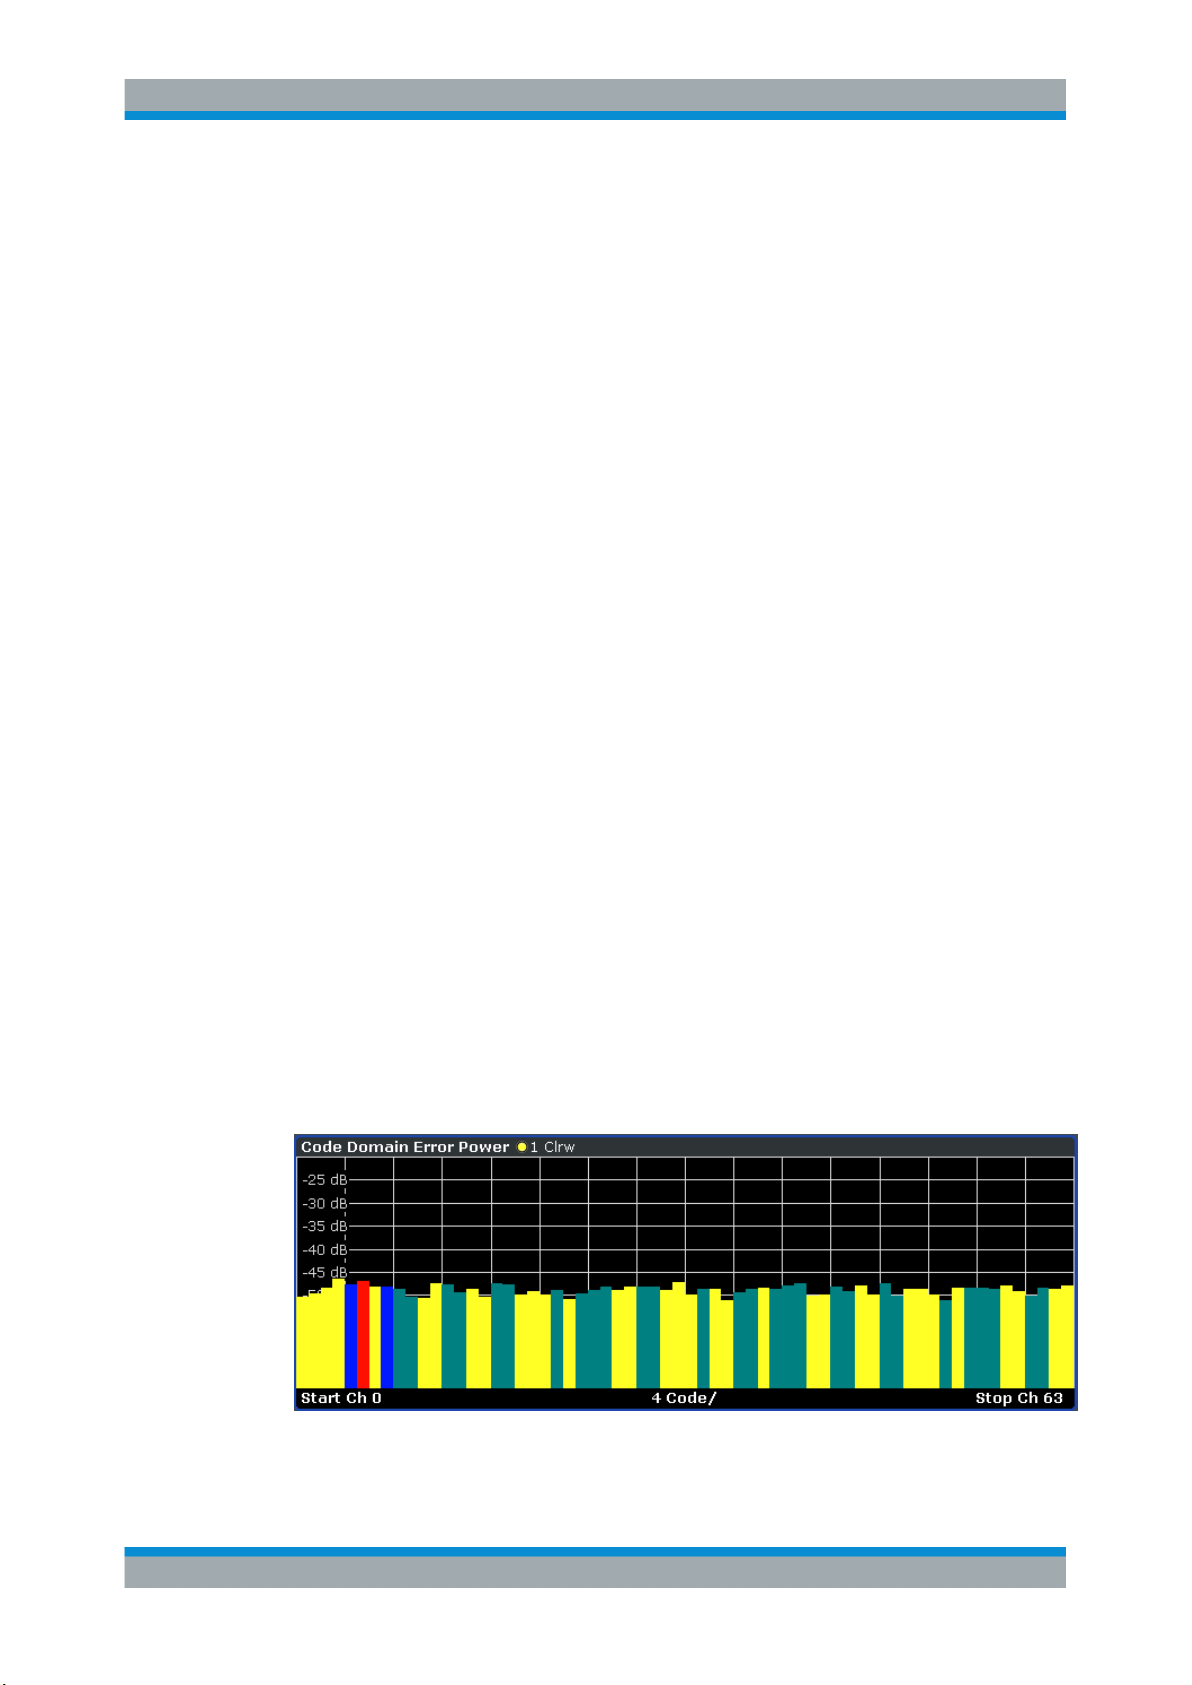
R&S® FSV-K82/-K83
Channel results
Under Channel, the measurement results of the selected channel and the selected
PCG are displayed:
●
●
●
●
●
●
●
Instrument Functions of the CDMA2000 Analysis
Measurements and Result Displays
Power Relative
Shows the channel power of the selected channel and PCG. The result depends
on the selected Code Power, the Power Reference and absolute channel power.
Power Absolute
Shows the absolute channel power of the selected channel and PCG
Timing Offset
Shows the timing offset between the selected channel and the pilot channel.
Phase Offset
Shows the phase offset between the selected channel and the pilot channel.
Symbol EVM
Shows the peak or mean value of the EVM measurement result. For further details
refer to the chapter 6.1.3.9, "EVM vs Symbol", on page 48 result display.
Modulation
BTS mode only:
Displays the modulation type of the channel and PCG: BPSK, QPSK, 8PSK, or
16QAM.
Mapping
Indicates the selected branch (I or Q)
6.1.3.5 Code Domain Error Power
This result display shows the difference in power of the test signal and an ideally generated reference signal and plots in a diagram. The unit is dB. The x-axis represents
the channel (code) number, which corresponds to the base spreading factor. The yaxis is a logarithmic level axis that shows the error power of each channel. Since it is
an error power, active and inactive channels can be rated jointly at a glance.
The measurement evaluates the total signal over a single PCG. It supports both Hadamard and BitReverse code sorting order.
MS mode: the error power is calculated only for the selected branch (I or Q).
Fig. 6-6: Code Domain Error Power result display in Hadamard code sorting order
44Operating Manual 1176.7626.02 ─ 04.1
Page 45
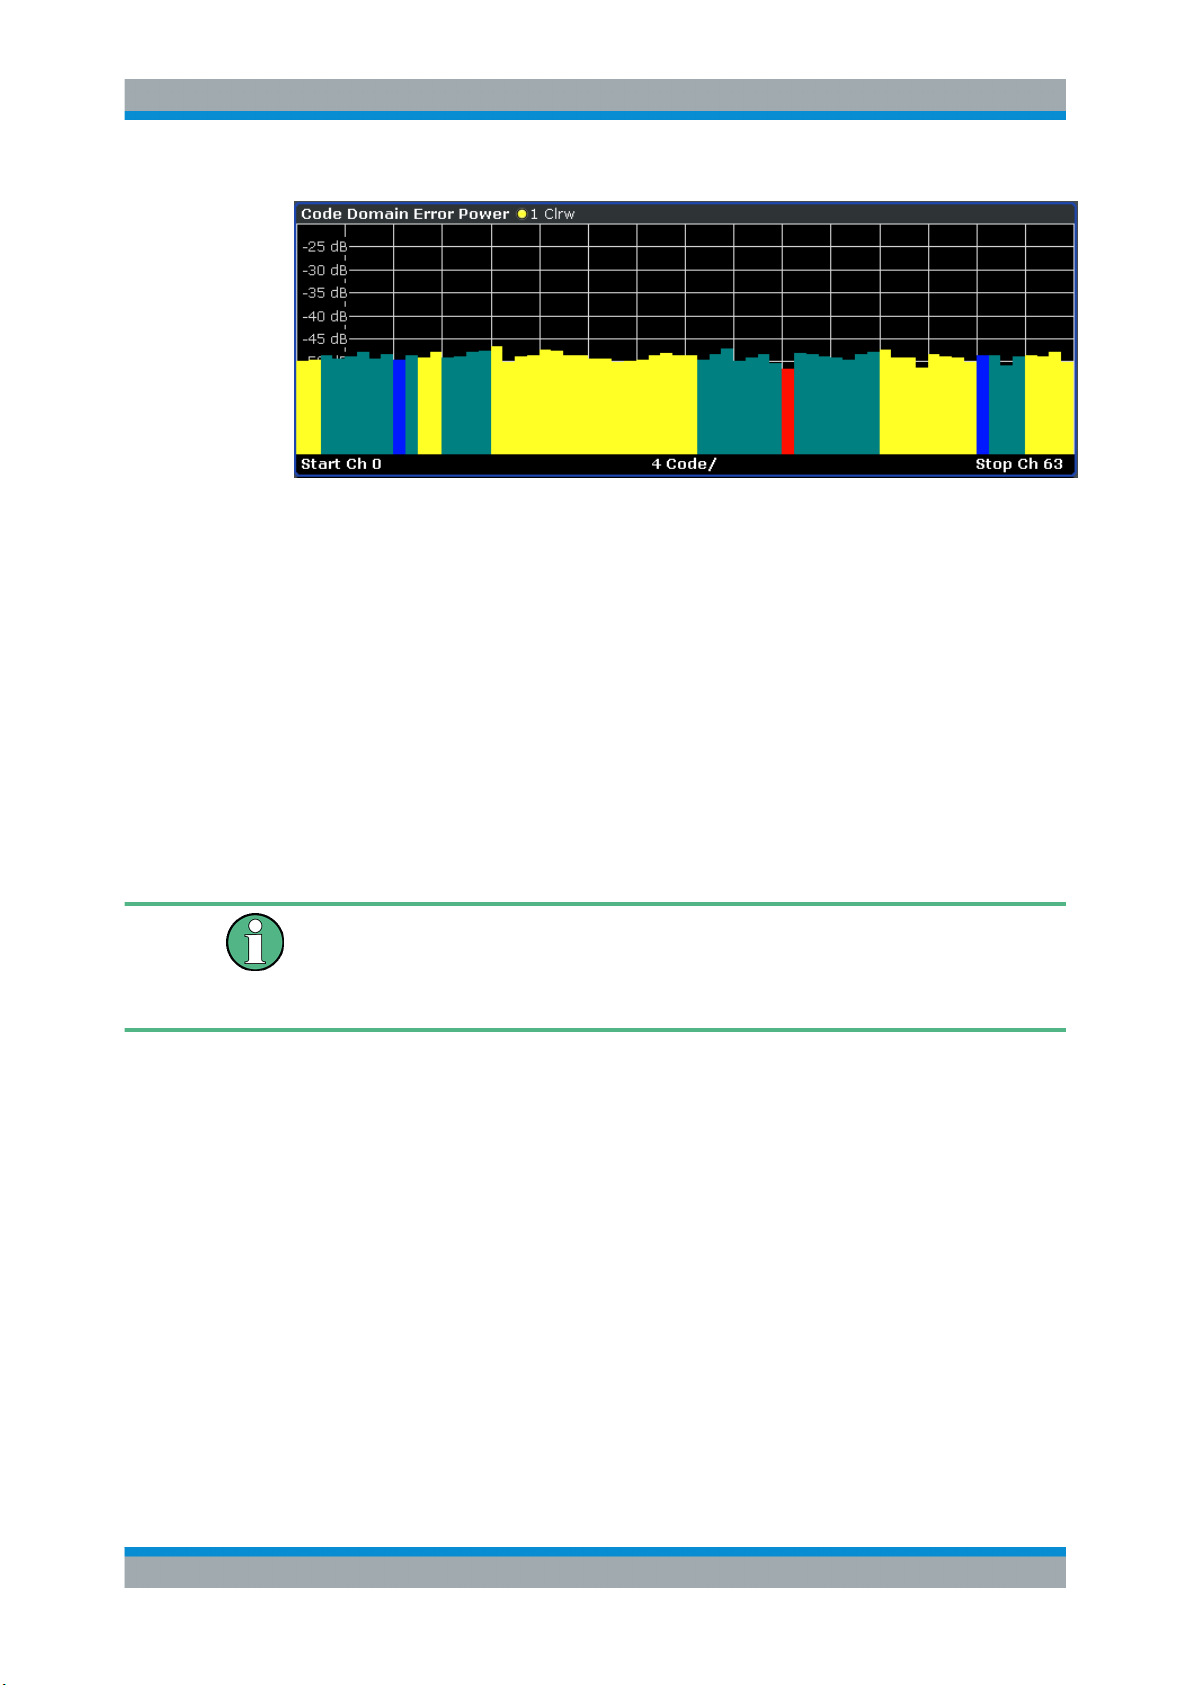
R&S® FSV-K82/-K83
Fig. 6-7: Code Domain Error Power result display in BitReverse code sorting order
Active and inactive data channels are defined via the "Inactive Channel Threshold"
on page 66. The power values of the active and inactive channels are shown in different colors. In addition, codes with alias power can occur. These codes obtain power
components originating either from a spreading factor higher than the base spreading
factor or from the own and/or another antenna as a result of transmit diversity.
Instrument Functions of the CDMA2000 Analysis
Measurements and Result Displays
The following colors are defined:
●
Red: selected channel (Channel (Code) Number)
●
Yellow: active channel
●
Cyan: inactive
●
Light blue: alias power of higher spreading factor
●
Magenta: alias power as a result of transmit diversity
If codes with alias power are displayed, set the highest base spreading factor available
in the "Base Spreading Factor" on page 70 field.
It is not recommended to select more detailed result displays (such as "Channel Constell") for unassigned or inactive codes, since the results are not valid.
Remote control
In remote control, this display configuration is selected using
CALC:FEED 'XPOW:CDEP'; see CALCulate<n>:FEED on page 186.
To query these results, use the command CALC:MARK:FUNC:CDP:RES? ; see
CALCulate<n>:MARKer<m>:FUNCtion:CDPower[:BTS]:RESult? on page 188.
6.1.3.6 Composite EVM (RMS)
This result display is for measuring the modulation accuracy. It determines the error
vector magnitude (EVM) over the total signal. The EVM is the root of the ratio of the
mean error power (root mean square) to the power of an ideally generated reference
signal. Thus, the EVM is shown in %. The diagram consists of a composite EVM for
each PCG.
45Operating Manual 1176.7626.02 ─ 04.1
Page 46
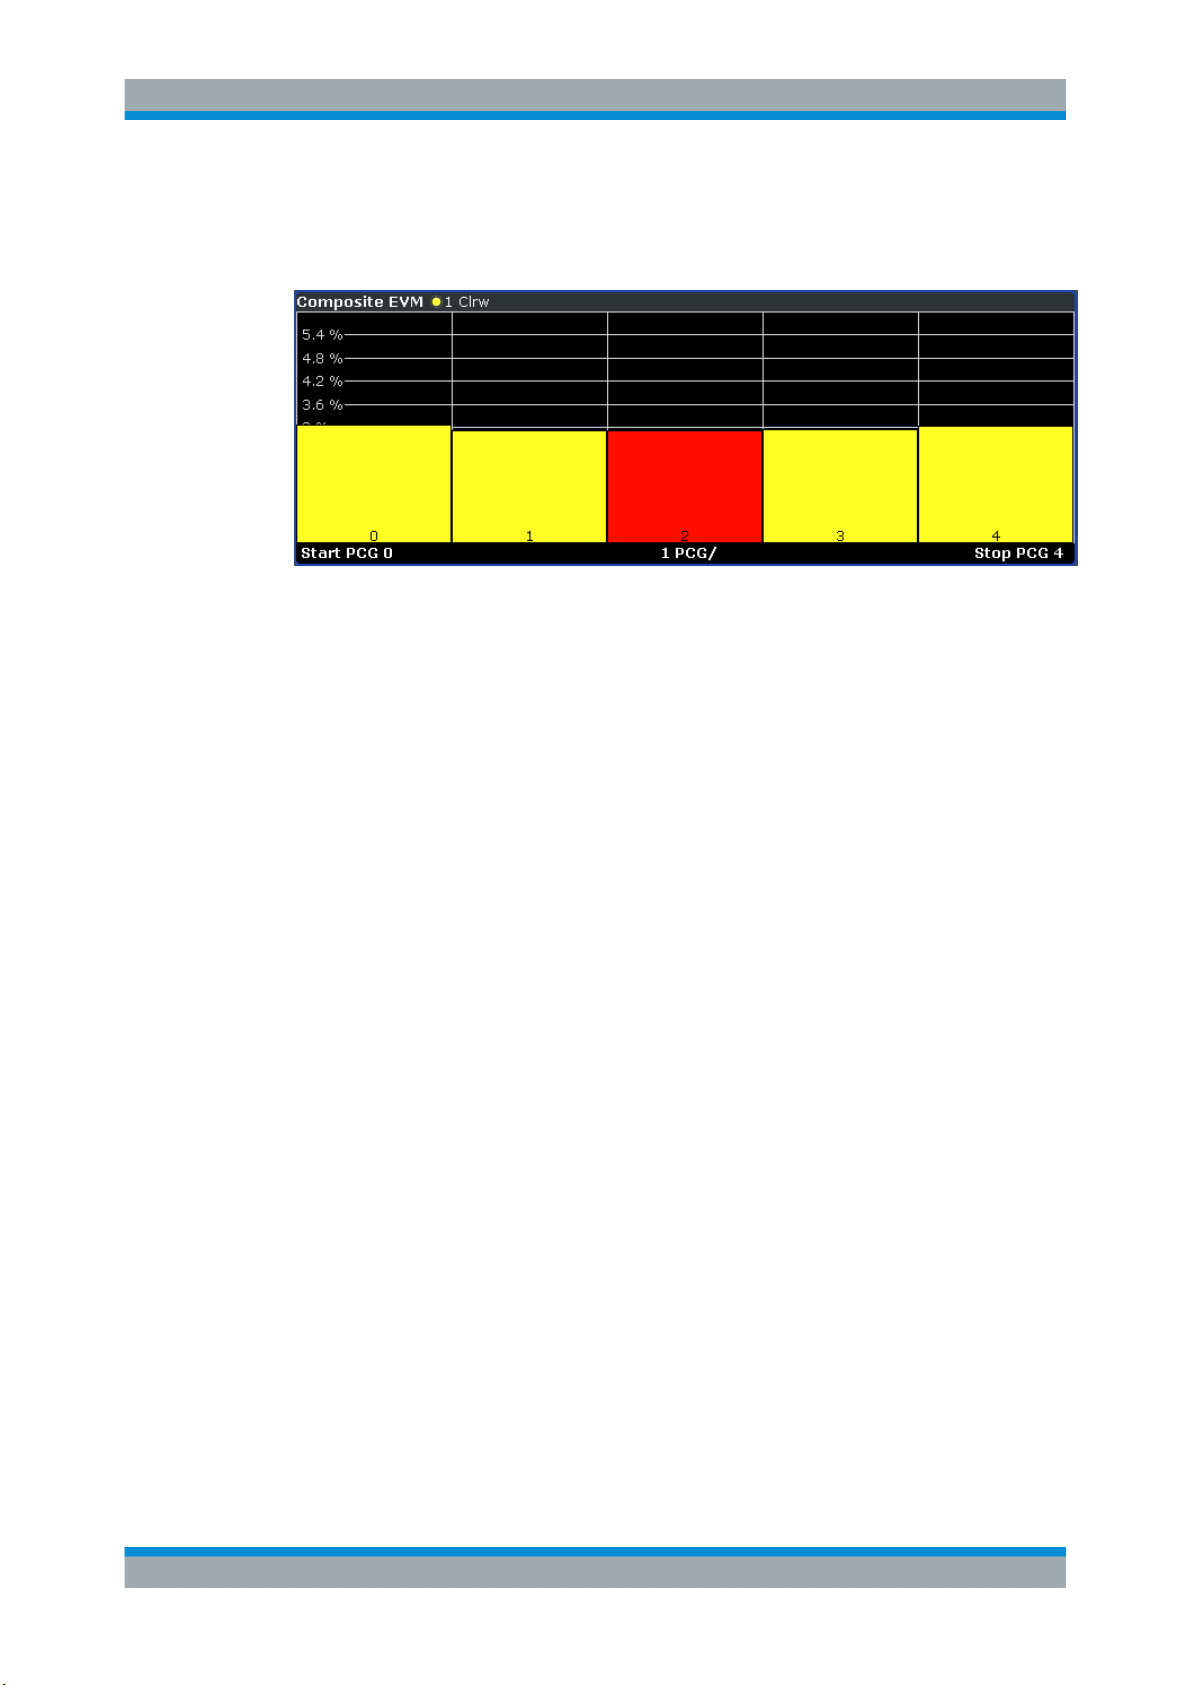
R&S® FSV-K82/-K83
The measurement evaluates the total signal over the entire period of observation. The
selected PCG is displayed red. You can set the number of PCGs in the "Capture
Length" on page 64 field.
Fig. 6-8: Composite EVM result display
Only the channels detected as being active are used to generate the ideal reference
signal. If a channel is not detected as being active, e.g. on account of low power, the
difference between the test signal and the reference signal and therefore the composite EVM is very large. Distortions also occur if unassigned codes are wrongly given
the status of "active channel". To obtain reliable measurement results, select an adequate channel threshold via the "Inactive Channel Threshold" on page 66 field.
Instrument Functions of the CDMA2000 Analysis
Measurements and Result Displays
Remote control
In remote control, this display configuration is selected using
CALC:FEED 'XTIM:CDP:MACCuracy'; see CALCulate<n>:FEED on page 186.
To query these results, use the command CALC:MARK:FUNC:CDP:RES?
MACCuracy; see CALCulate<n>:MARKer<m>:FUNCtion:CDPower[:BTS]:
RESult? on page 188.
6.1.3.7 Peak Code Domain Error
The Peak Code Domain Error is defined as the maximum value for the Code Domain
Error for all codes. That means that in this result display the Code Domain Error Power
is projected onto the code domain at a specific base spreading factor. In the diagram,
each bar of the x-axis represents one PCG. The y-axis represents the error power.
You can select the base spreading factor in the "Base Spreading Factor" on page 70
field and the number of evaluated PCGs in the "Capture Length" on page 64 field.
The measurement evaluates the total signal over the entire period of observation. The
currently selected PCG is displayed red.
MS mode: the error is calculated only for the selected branch (I or Q).
46Operating Manual 1176.7626.02 ─ 04.1
Page 47
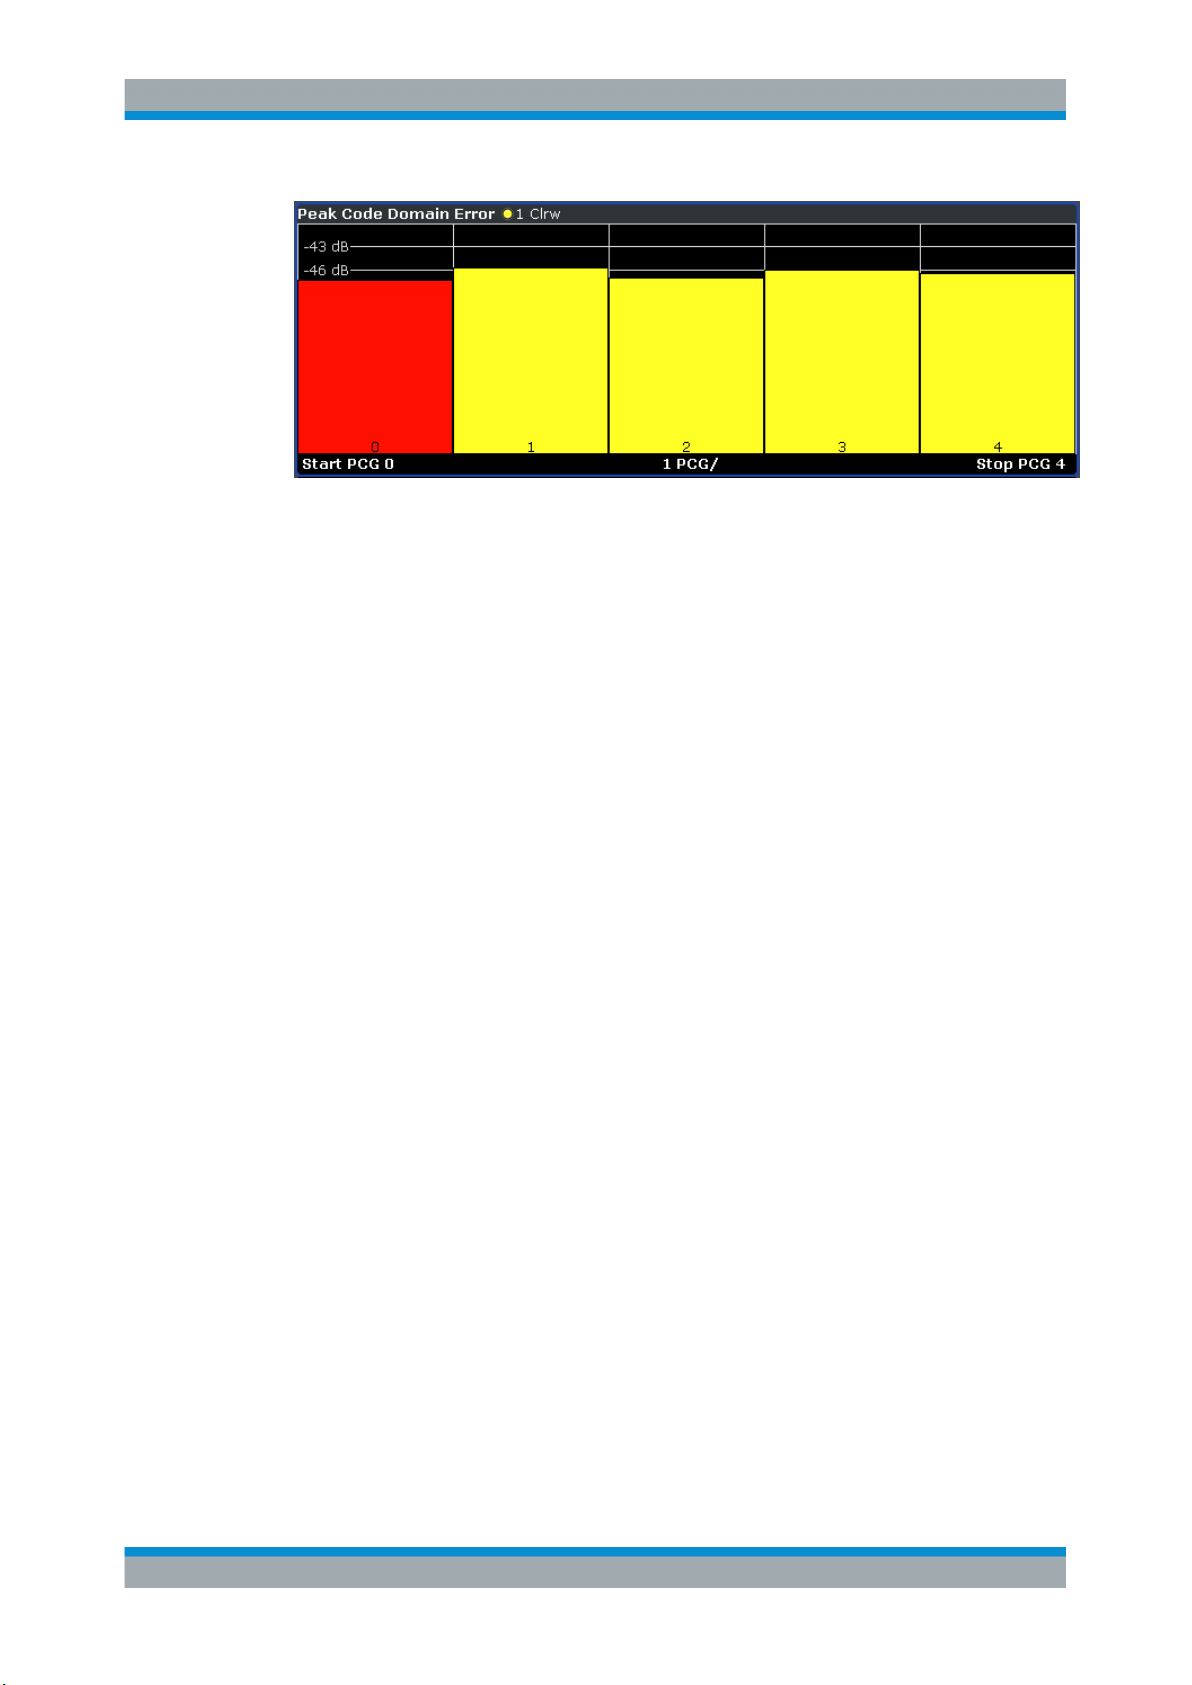
R&S® FSV-K82/-K83
Fig. 6-9: Peak Code Domain Error result display
Only the channels detected as being active are used to generate the ideal reference
signal. If a channel is not detected as being active, e.g. on account of low power, the
difference between the test signal and the reference signal is very large. The result display therefore shows a peak code domain error that is too high. Distortions also occur
if unassigned codes are wrongly given the status of "active channel". To obtain reliable
measurement results, select an adequate channel threshold via the "Inactive Channel
Threshold" on page 66 field.
Instrument Functions of the CDMA2000 Analysis
Measurements and Result Displays
Remote control
In remote control, this display configuration is selected using
CALC:FEED 'XTIM:CDP:ERR:PCDomain'; see CALCulate<n>:FEED
on page 186.
To query these results, use the command CALC:MARK:FUNC:CDP:RES? PCDerror;
see CALCulate<n>:MARKer<m>:FUNCtion:CDPower[:BTS]:RESult?
on page 188.
6.1.3.8 Channel Constellation
This result display shows the channel constellation of the modulated signal at symbol
level.
The measurement evaluates a single channel over a single PCG.
You can select a specific channel and PCG with the Select softkey.
47Operating Manual 1176.7626.02 ─ 04.1
Page 48
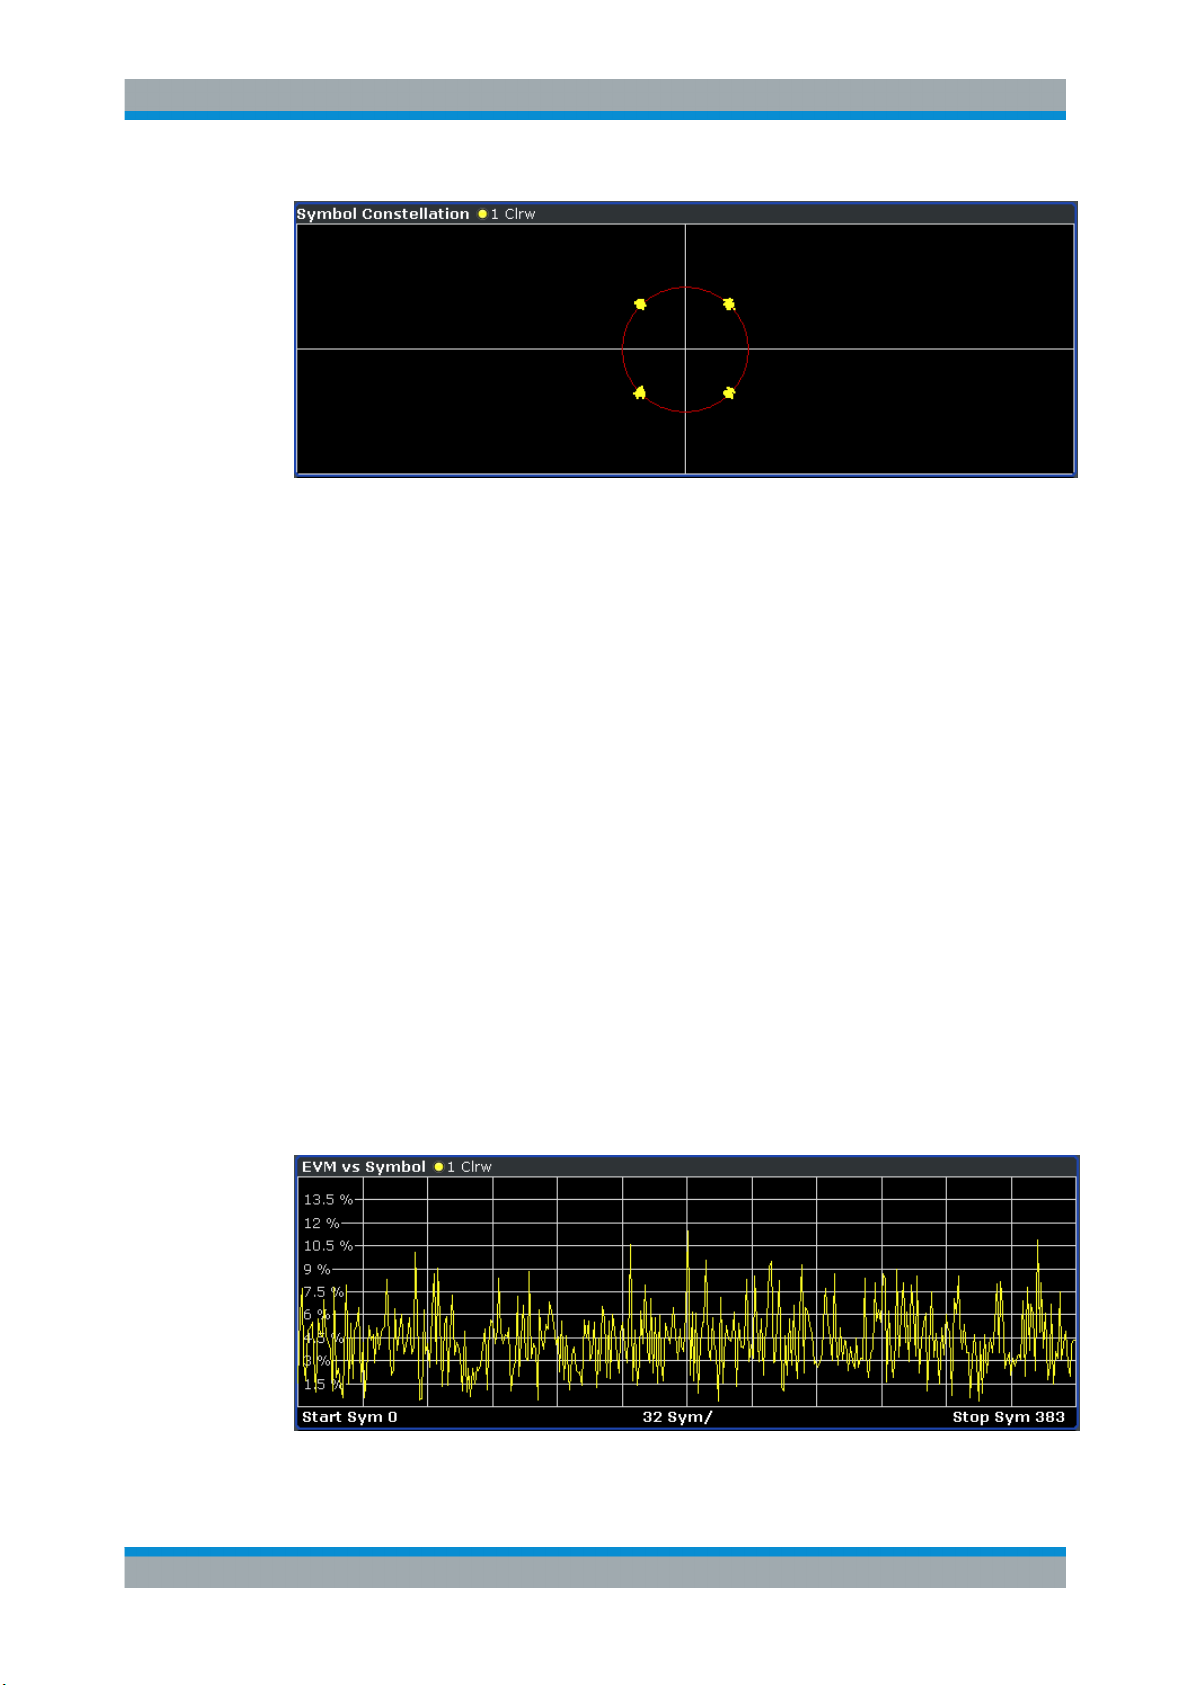
R&S® FSV-K82/-K83
Fig. 6-10: Channel Constellation result display for QPSK-modulated signal
The R&S FSV-K82 supports BPSK, QPSK, 8PSK and 16QAM modulation schemes.
The modulation scheme itself depends on the channel type. Refer to chapter 6.4.1.1,
"Relationship Between Channel and Modulation Type", on page 154 for further infor-
mation.
In case of BPSK the constellation points are located on the x-axis. For the QPSK and
16QAM schemes the constellation points are located on neither axis.
Instrument Functions of the CDMA2000 Analysis
Measurements and Result Displays
Remote control
In remote control, this display configuration is selected using
CALC:FEED 'XTIM:CDP:SYMB:CONStellation'; see CALCulate<n>:FEED
on page 186.
To query these results, use the command CALC:MARK:FUNC:CDP:RES? ; see
CALCulate<n>:MARKer<m>:FUNCtion:CDPower[:BTS]:RESult? on page 188.
6.1.3.9 EVM vs Symbol
This result display shows the EVM on symbol level. The x-axis represents the symbols
and the y-axis shows the EVM in %.
The measurement evaluates a single channel over a single PCG.
You can select a specific channel and PCG with the "Select" on page 79 softkey.
Fig. 6-11: EVM vs Symbol result display
48Operating Manual 1176.7626.02 ─ 04.1
Page 49
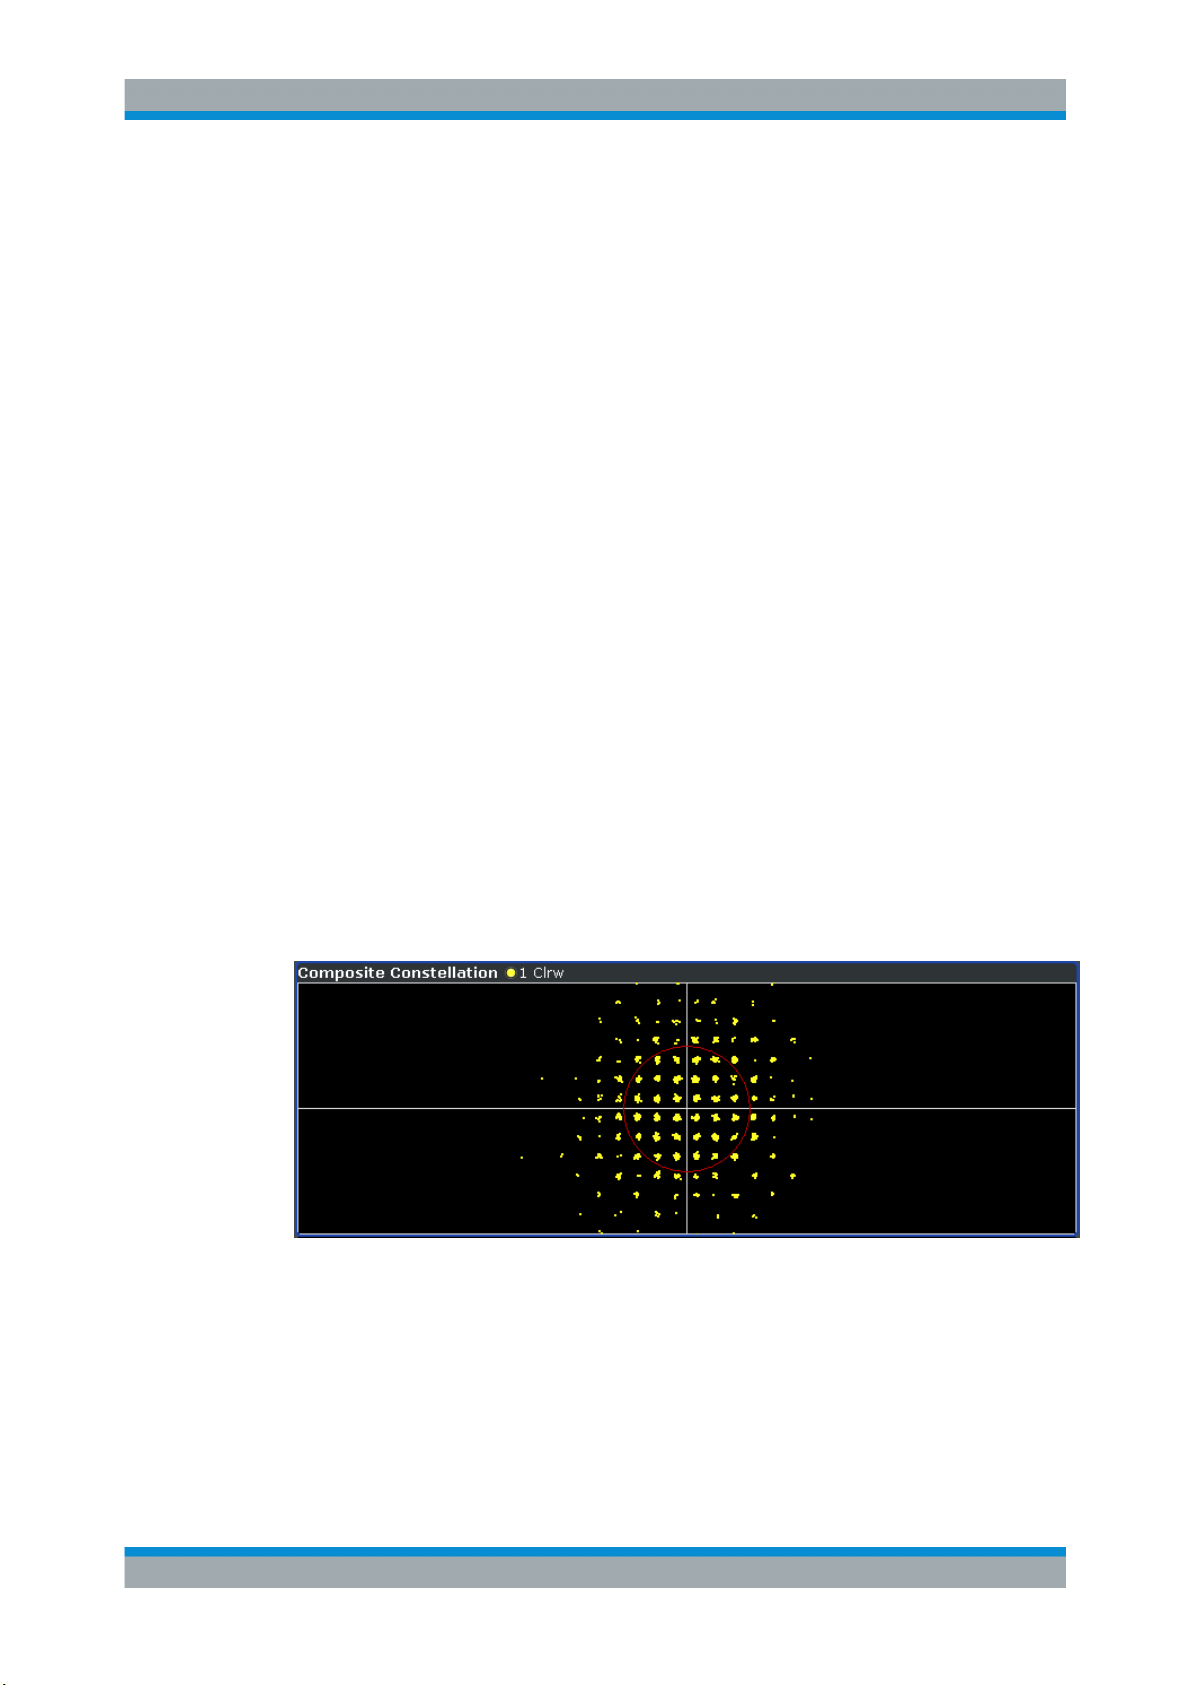
R&S® FSV-K82/-K83
The number of symbols is in the range from 6 to 384 and can be calculated like this:
Number of symbols = Number of chips in one PCG/ChannelSF/K, with
"Number of chips in one PCG = 1536"
"Channel SF = 4, 8, 16, 32, 64 or 128"
"K = 1 for Antenna Diversity = OFF"
"K = 2 for Antenna Diversity = OFF"
This calculation thus takes into account the results of a channel for a power control
group.
Inactive channels can be measured, but the result is meaningless since these channels do not contain data.
Remote control
In remote control, this display configuration is selected using
CALC:FEED 'XTIM:CDP:SYMB:EVM'; see CALCulate<n>:FEED on page 186.
Instrument Functions of the CDMA2000 Analysis
Measurements and Result Displays
To query these results, use the command CALC:MARK:FUNC:CDP:RES? ; see
CALCulate<n>:MARKer<m>:FUNCtion:CDPower[:BTS]:RESult? on page 188.
6.1.3.10 Composite Constellation
This result display shows the constellation of the modulated signal at chip level. For
each of the 1536 chips, a constellation point is displayed in the diagram.
The measurement evaluates the total signal over a single PCG.
You can select a specific PCG with the "Select" on page 79 softkey.
Fig. 6-12: Composite Constellation result display
Remote control
In remote control, this display configuration is selected using
CALC:FEED 'XTIM:CDP:COMP:CONStellation'; see CALCulate<n>:FEED
on page 186.
49Operating Manual 1176.7626.02 ─ 04.1
Page 50
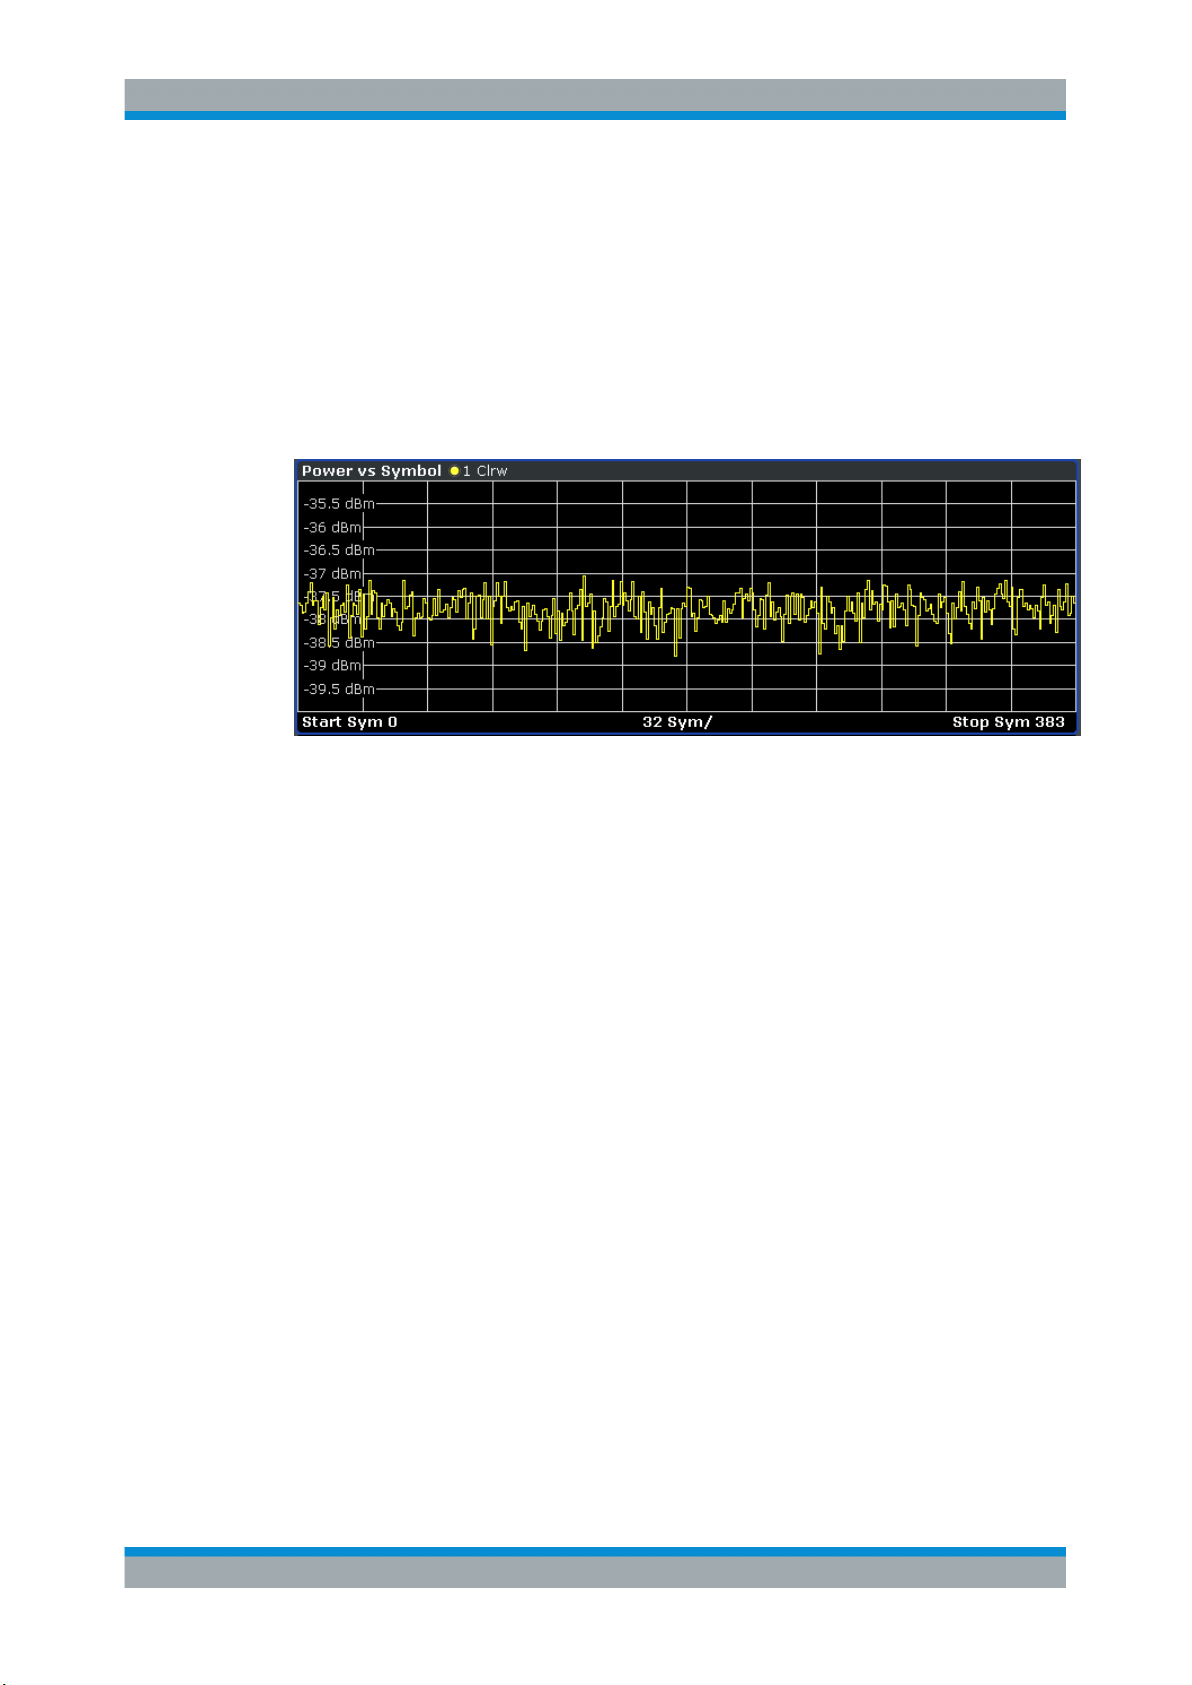
R&S® FSV-K82/-K83
To query these results, use the command CALC:MARK:FUNC:CDP:RES? ; see
CALCulate<n>:MARKer<m>:FUNCtion:CDPower[:BTS]:RESult? on page 188.
Instrument Functions of the CDMA2000 Analysis
Measurements and Result Displays
6.1.3.11 Power vs Symbol
This result display calculates the absolute power in dBm for every symbol number.
The measurement evaluates a single channel over a single PCG.
You can select a specific channel and PCG with the "Select" on page 79 softkey.
Fig. 6-13: Power vs Symbol result display
Remote control
In remote control, this display configuration is selected using
CALC:FEED 'XTIM:CDP:PVSYmbol'; see CALCulate<n>:FEED on page 186.
To query these results, use the command CALC:MARK:FUNC:CDP:RES? ; see
CALCulate<n>:MARKer<m>:FUNCtion:CDPower[:BTS]:RESult? on page 188.
6.1.3.12 Channel Bitstream
The result display provides information on the demodulated bits. All bits that are part of
inactive channels are marked as being invalid by means of dashes. For 16QAM modulation '----' is displayed, for 8PSK modulation '---', for QPSK '--' and for BPSK '-'.
The measurement evaluates a single channel over a single PCG.
You can select a specific channel and PCG with the Select softkey.
50Operating Manual 1176.7626.02 ─ 04.1
Page 51

R&S® FSV-K82/-K83
Fig. 6-14: Bitstream result display
Select a specific symbol using the MKR key. If you enter a number, the marker jumps
to the selected symbol. If there are more symbols than the screen is capable of displaying, use the marker to scroll inside the list.
Depending on the spreading factor (symbol rate) of the channel, a power control group
may contain a minimum of 12 and a maximum of 384 symbols. In case of an active
transmit diversity (Antenna Diversity) the values reduce to the half. Depending on the
modulation type, a symbol consists of the following bits:
Instrument Functions of the CDMA2000 Analysis
Measurements and Result Displays
●
BPSK: 1 bit (only the I-component is assigned)
●
QPSK: 2 bits (I-component followed by the Q-component)
●
8PSK: 3 bits
●
16QAM: 4 bits
In accordance with the radio configuration and the channel type, there are BPSK and
QPSK modulated channels in the CDMA2000 system. For details refer to chap-
ter 6.4.1.1, "Relationship Between Channel and Modulation Type", on page 154.
In MS mode, only BPSK modulated channels are used, thus only the I-component is
assigned.
51Operating Manual 1176.7626.02 ─ 04.1
Page 52
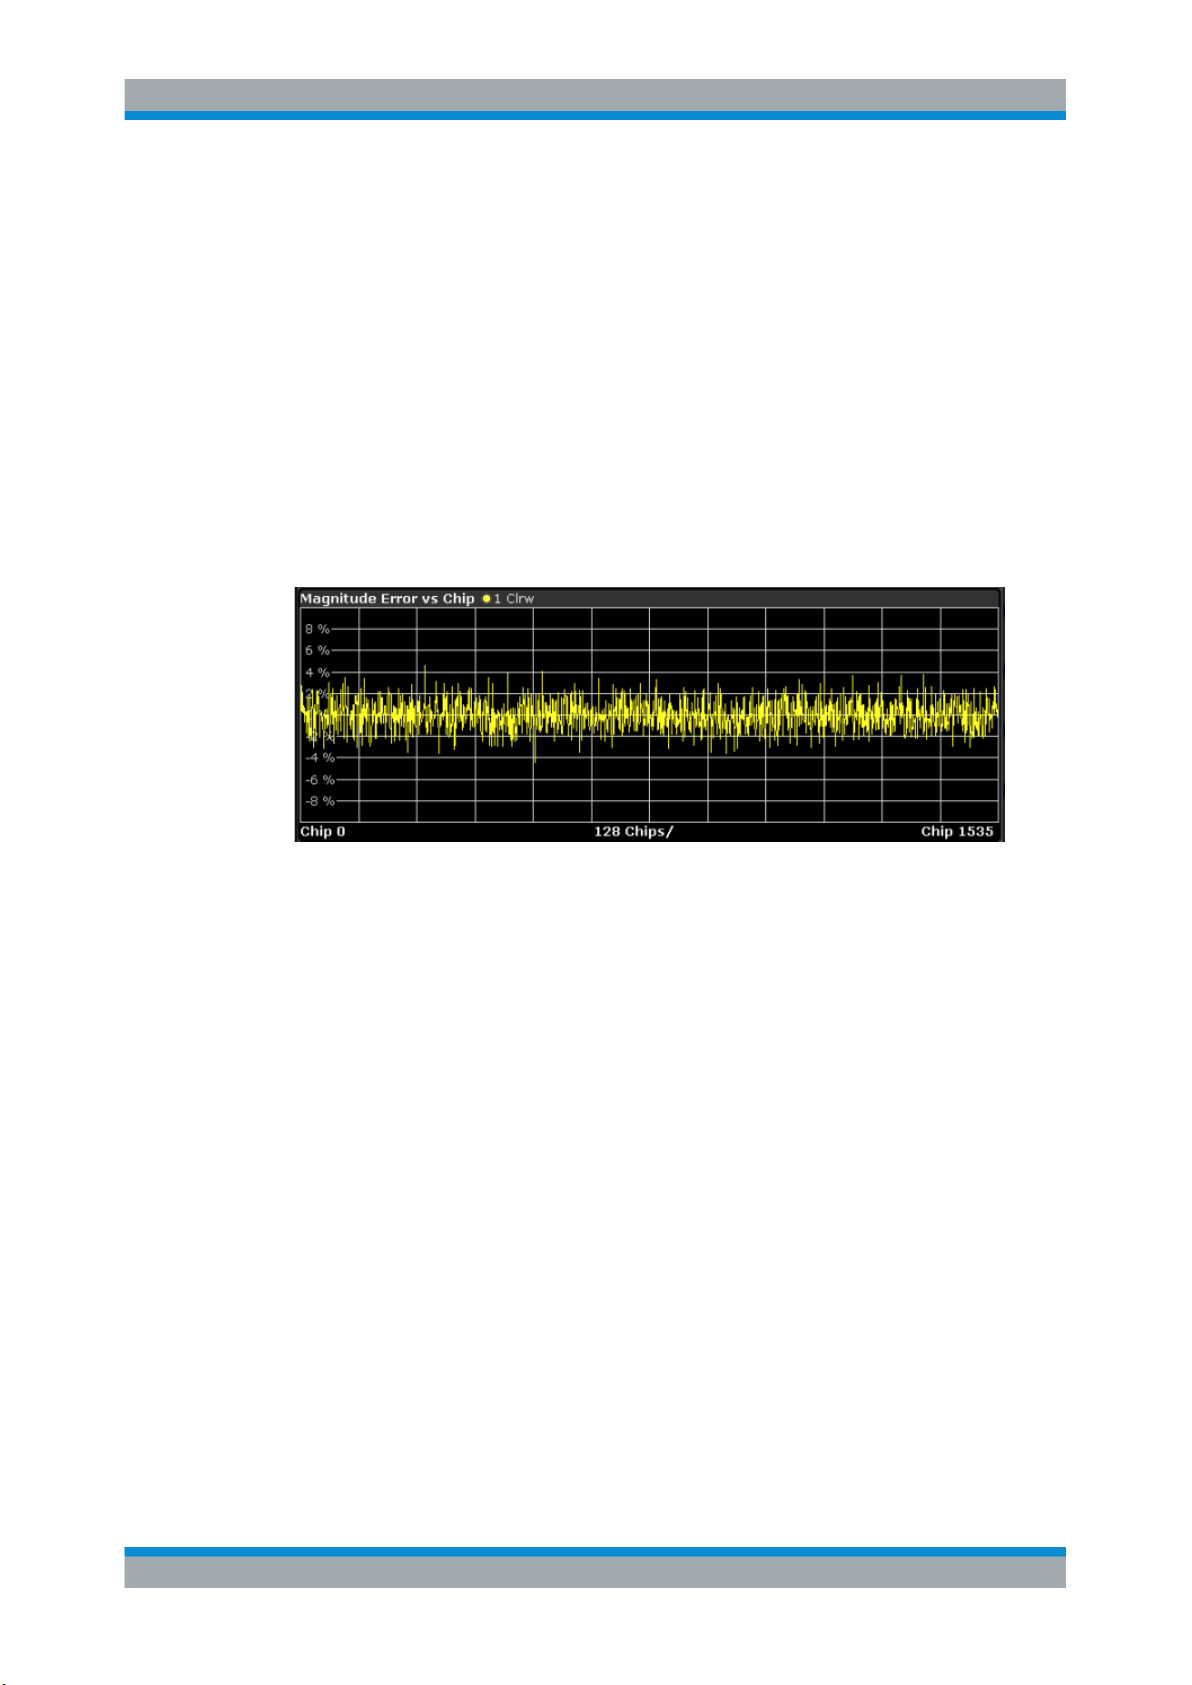
R&S® FSV-K82/-K83
Remote control
In remote control, this display configuration is selected using
CALC:FEED 'XTIM:CDP:BSTReam'; see CALCulate<n>:FEED on page 186.
To query these results, use the command TRACe<1…4>[:DATA]? ABITstream<1...4>.
Instrument Functions of the CDMA2000 Analysis
Measurements and Result Displays
6.1.3.13 Mag Error vs Chip
Mag Error vs Chip activates the Magnitude Error versus chip display. The magnitude
error is displayed for all chips of the slected PCG. The magnitude error is calculated by
the difference of the magnitude of received signal and magnitude of reference signal.
The reference signal is estimated from the channel configuration of all active channels.
The magnitude error is related to the square root of the mean power of reference signal and given in percent.
Remote control
In remote control, this display configuration is selected using
CALC:FEED "XTIM:CDP:CHIP:MAGN"; see CALCulate<n>:FEED on page 186.
To query these results, use the command TRACe<1…4>[:DATA]? TRACE<1...4>.
6.1.3.14 Phase Error vs Chip
"Phase Error vs Chip" activates the phase error versus chip display. The phase error is
displayed for all chips of the slected PCG. The phase error is calculated by the difference of the phase of received signal and phase of reference signal. The reference signal is estimated from the channel configuration of .all active channels. The phase error
is given in degrees in a range of +180° to -180°.
52Operating Manual 1176.7626.02 ─ 04.1
Page 53
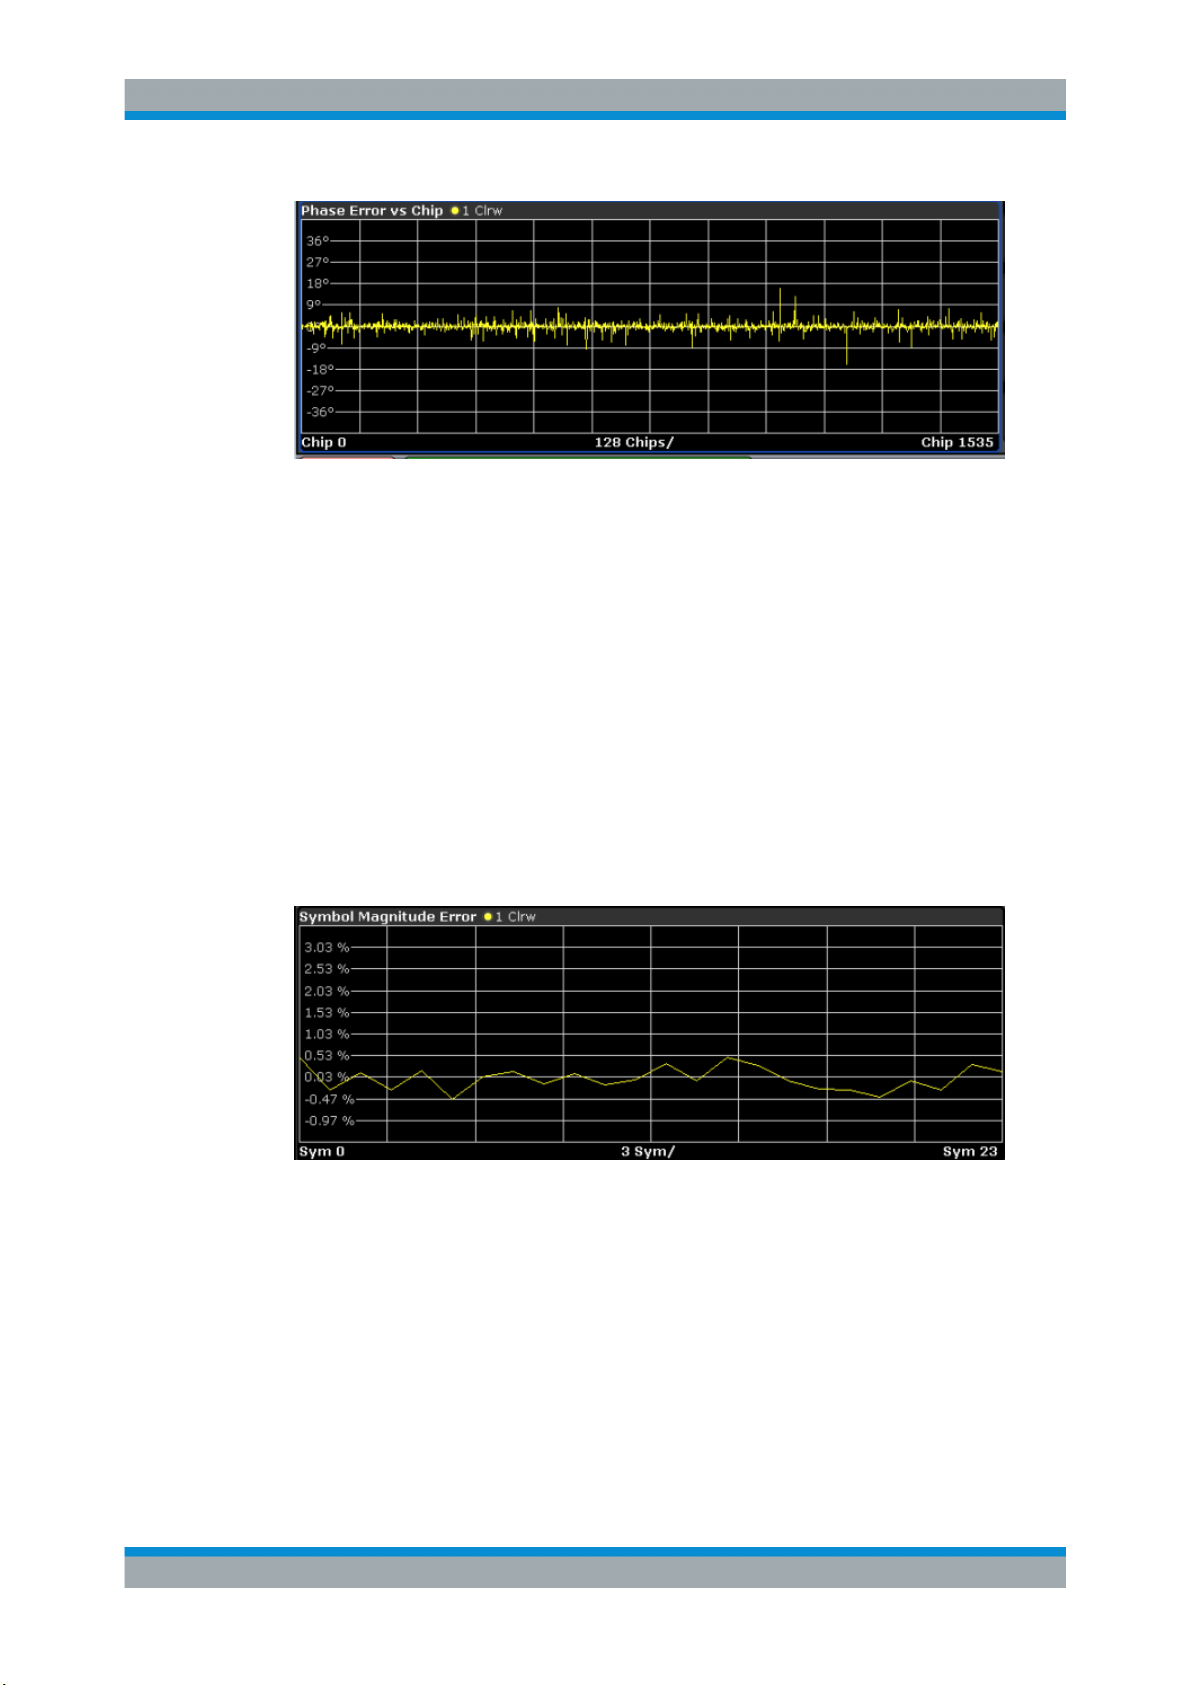
R&S® FSV-K82/-K83
Remote control
In remote control, this display configuration is selected using
CALC:FEED "XTIM:CDP:CHIP:PHAS"; see CALCulate<n>:FEED on page 186.
To query these results, use the command TRACe<1…4>[:DATA]? TRACE<1...4>.
Instrument Functions of the CDMA2000 Analysis
Measurements and Result Displays
6.1.3.15 Symbol Magnitude Error
The "Symbol Magnitude Error" is calculated analogous to symbol EVM. The result of
calculation is one symbol magnitude error value for each symbol of the PCG of a special channel. Positive values of symbol magnitude error indicate a symbol magnitude
that is larger than the expected ideal value; negative symbol magnitude errors indicate
a symbol magnitude that is less than the ideal one.The symbol magnitude error is the
difference of the magnitude of the received symbol and that of the reference symbol,
related to the magnitude of the reference symbol.
Remote control
In remote control, this display configuration is selected using
CALC:FEED "XTIM:CDP:SYMB:EVM:MAGN"; see CALCulate<n>:FEED
on page 186.
To query these results, use the command TRACe<1…4>[:DATA]? TRACE<1...4>.
53Operating Manual 1176.7626.02 ─ 04.1
Page 54

R&S® FSV-K82/-K83
Instrument Functions of the CDMA2000 Analysis
Measurements and Result Displays
6.1.3.16 Symbol Phase Error
The "Symbol Phase Error" is calculated analogous to symbol EVM. The result of calculation is one symbol phase error value for each symbol of the PCG of a special channel. Positive values of symbol phase error indicate a symbol phase that is larger than
the expected ideal value; negative symbol phase errors indicate a symbol phase that is
less than the ideal one.
Remote control
In remote control, this display configuration is selected using
CALC:FEED "XTIM:CDP:SYMB:EVM:PHAS"; see CALCulate<n>:FEED
on page 186.
To query these results, use the command TRACe<1…4>[:DATA]? TRACE<1...4>.
6.1.4 RF Measurement Results
● Signal Channel Power.............................................................................................54
● Adjacent Channel Power.........................................................................................55
● Spectrum Emission Mask........................................................................................55
● Occupied Bandwidth............................................................................................... 56
● Complementary Cumulative Distribution Function (CCDF).....................................56
6.1.4.1 Signal Channel Power
The Signal Channel Power measurement analyses the RF signal power of a single
channel with 1.2288 MHz bandwidth over a single trace. The displayed results are
based on the root mean square. The configuration is according to the CDMA2000
requirements. Beneath the measurement screen the bandwidth and the associated
channel power are displayed. The other screen elements match that of the screen of
the Spectrum Analyzer mode. The default settings are in accordance with the 3GPP2
specifications.
Setting Default Value
Frequency Span 2 MHz
ACP Standard 1xEV-DO0 MC1
54Operating Manual 1176.7626.02 ─ 04.1
Page 55
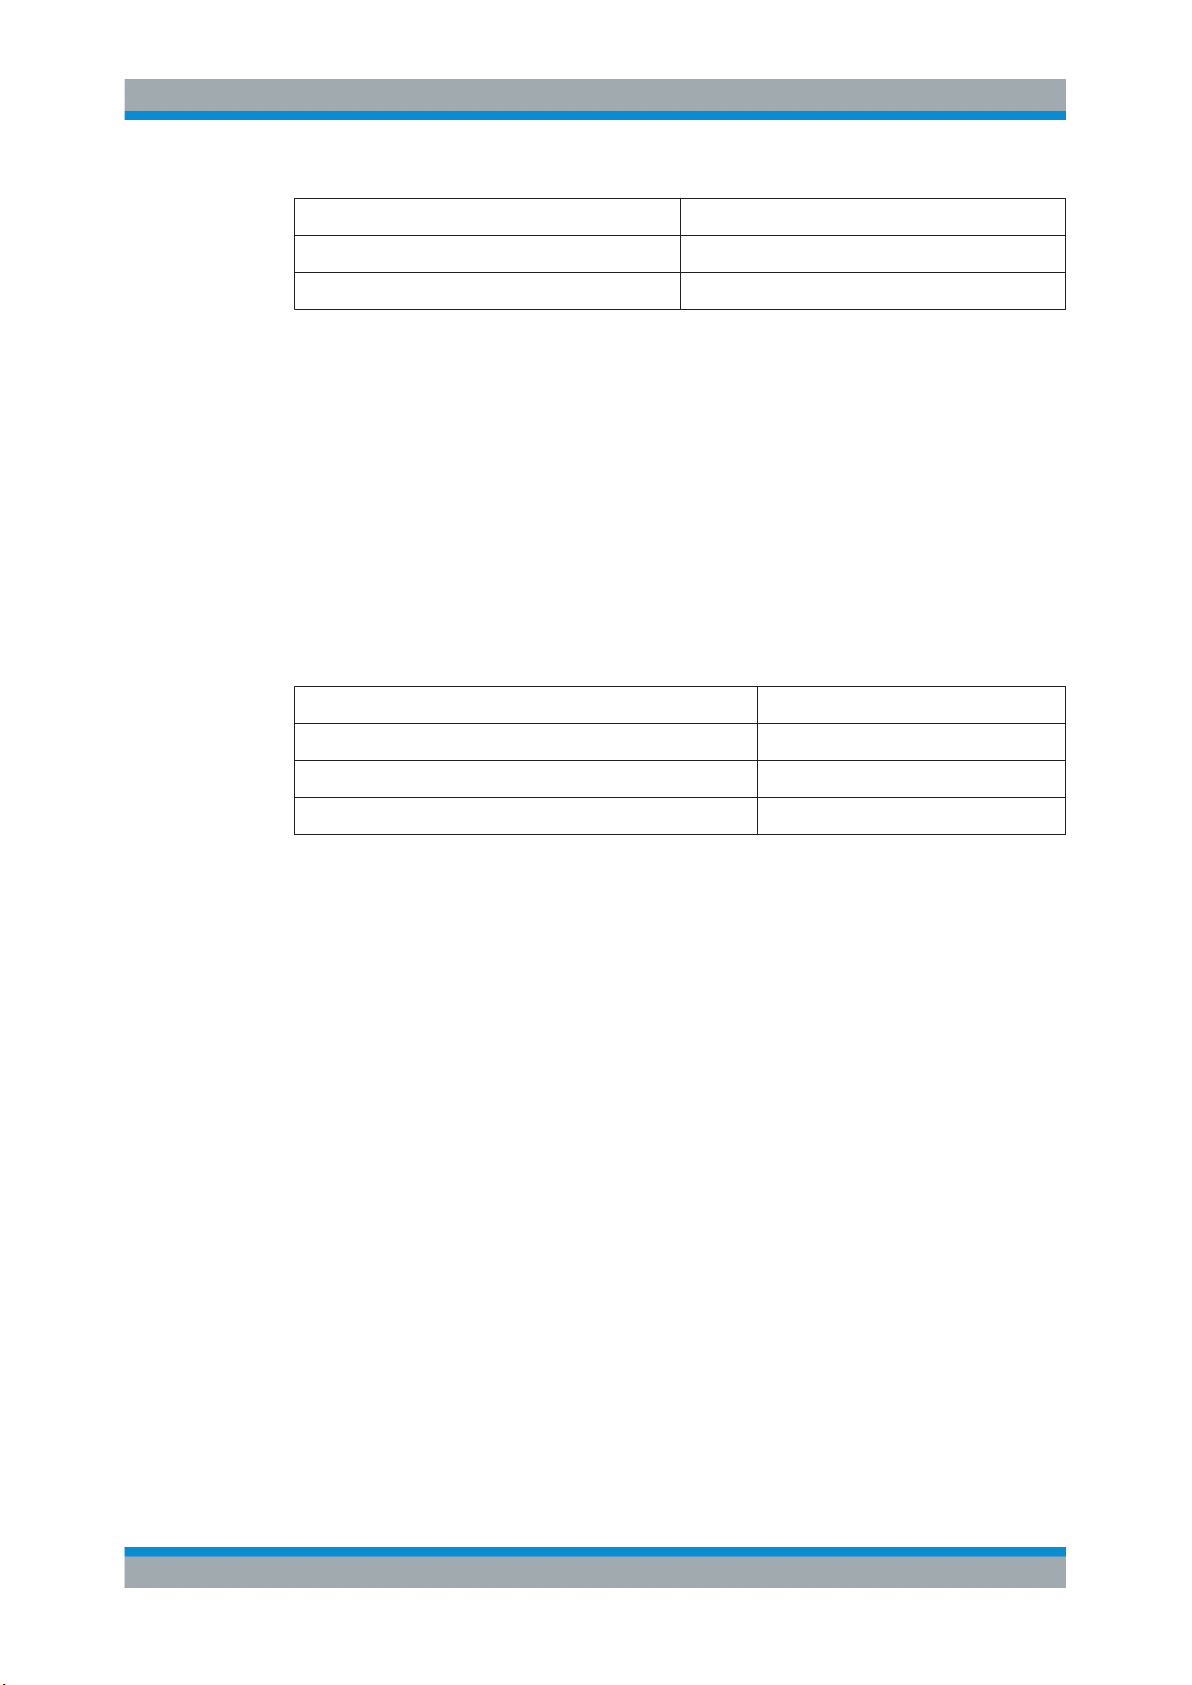
R&S® FSV-K82/-K83
Setting Default Value
Number of adjacent channels 0
Adjacent Channel Power On
For details on the softkeys of the Signal Channel Power measurement refer to the
Power softkey in the "Measurement" menu.
Instrument Functions of the CDMA2000 Analysis
Measurements and Result Displays
6.1.4.2 Adjacent Channel Power
The Adjacent Channel Power measurement analyses the power of the TX channel and
the power of adjacent and alternate channels on the left and right side of the TX channel. The number of TX channels and adjacent channels can be modified as well as the
band class. Beneath the measurement screens the bandwidth and power of the TX
channel and the bandwidth, spacing and power of the adjacent and alternate channels
are displayed.
The default settings are in accordance with the 3GPP2 specifications.
Setting Default value
Adjacent Channel Power On
ACP Standard 1xEV-DO0 MC1
Number of adjacent channels 2
For details on the softkeys of the Adjacent Channel Power measurement refer to the
Ch Power ACLR softkey in the "Measurement" menu.
6.1.4.3 Spectrum Emission Mask
The Spectrum Emission Mask measurement shows the quality of the measured signal
by comparing the power values in the frequency range near the carrier against a spectral mask that is defined by the 3GPP2 specifications. The limits depend on the
selected bandclass. In this way, the performance of the DUT can be tested and the
emissions and their distance to the limit be identified.
Note that the 3GPP2 standard does not distinguish between spurious and spectral
emissions.
Beneath the measurement screen a table showing the peak list. In the peak list the values for the worst spectral emissions are displayed including their frequency and power.
The default settings of the Spectrum Emission Mask measurement are listed in the
table below.
55Operating Manual 1176.7626.02 ─ 04.1
Page 56

R&S® FSV-K82/-K83
Setting Default value
Frequency Span 8 MHz
Sweep Time 100 ms
Detector RMS
For details on the softkeys of the Spectrum Emission Mask measurement refer to the
Spectrum Emission Mask softkey in the "Measurement" menu.
Instrument Functions of the CDMA2000 Analysis
Measurements and Result Displays
6.1.4.4 Occupied Bandwidth
The Occupied Bandwidth measurement determines the bandwidth in which the signal
power can be found. By default the bandwidth is displayed in which 99 % of the signal
is found. The percentage of the signal power included in the measurement can be
modified. In the top right corner of the screen, the bandwidth and frequency markers
are displayed.
The default settings of the Occupied Bandwidth measurement are listed in the table
below.
Setting Default value
Occupied Bandwidth ON
Frequency Span 4.2 MHz
Sweep Time 100 ms
RBW 30 kHz
VBW 300 kHz
Detector RMS
For details on the softkeys of the Occupied Bandwidth measurement see Occupied
Bandwidth in the "Measurement" menu.
6.1.4.5 Complementary Cumulative Distribution Function (CCDF)
The CCDF measurement displays the CCDF and the Crest factor. The CCDF shows
distribution of the signal amplitudes. For the measurement, a signal section of settable
length is recorded continuously in a zero span. The measurement is useful to determine errors of linear amplifiers. The Crest factor is defined as the ratio of the peak
power and the mean power. Beneath the measurement screen a table containing the
number of included samples, mean and peak power and the Crest factor is displayed.
The default settings of the CCDF measurement are listed in the table below.
56Operating Manual 1176.7626.02 ─ 04.1
Page 57
R&S® FSV-K82/-K83
Setting Default value
CCDF ON
RBW 10 MHz
Detector Sample
For details on the softkeys of the CCDF measurement see CCDF in the "Measurement" menu.
Instrument Functions of the CDMA2000 Analysis
Menu and Softkey Description for CDA Measurements
6.2 Menu and Softkey Description for CDA Measurements
This chapter describes the menus and softkeys available in CDMA2000 BTS Analysis
mode for CDA measurements. For RF measurements, the softkeys are described in
chapter 6.3, "Softkeys and Menus for RF Measurements (K82)", on page 97.
The "Lines" menu is not available in the CDMA2000 BTS Analysis mode.
The "Span" menu is not available for code domain measurements and signal power
measurements.
The "Bandwidth" menu is not available for code domain measurements measurements.
All menus not described here are the same as for the base unit, see the description
there.
Importing and Exporting I/Q Data
As of firmware version 1.60, I/Q data can be imported from a file for processing in
R&S FSV-K82/-K83, and captured I/Q data can be stored to a file ("IQ Import"/"IQ
Export" softkeys in the "Save/Rcl" menu). For details see the base unit description.
To display help to a softkey, press the HELP key and then the softkey for which you
want to display help. To close the help window, press the ESC key. For further information refer to chapter 1.3, "How to Use the Help System", on page 8.
6.2.1 Softkeys of the Code Domain Analyzer Menu.............................................................. 58
6.2.2 Softkeys of the Frequency Menu.................................................................................. 80
6.2.3 Softkeys of the Amplitude Menu................................................................................... 81
6.2.4 Softkeys of the Sweep Menu........................................................................................ 84
6.2.5 Softkeys of the Trigger Menu for CDA measurements................................................. 85
6.2.6 Softkeys of the Trace Menu for CDA Measurements....................................................86
6.2.7 Softkeys of the Marker Menu for CDA Measurements..................................................88
57Operating Manual 1176.7626.02 ─ 04.1
Page 58

R&S® FSV-K82/-K83
6.2.8 Softkeys of the Marker To Menu...................................................................................89
6.2.9 Softkeys of the Auto Set Menu......................................................................................91
6.2.10 Softkeys of the Input/Output Menu for CDA Measurements......................................... 93
Instrument Functions of the CDMA2000 Analysis
Menu and Softkey Description for CDA Measurements
6.2.1 Softkeys of the Code Domain Analyzer Menu
The following chapter describes all softkeys available in the "Code Domain Analyzer"
menu of the CDMA2000 Analysis options.
Settings Overview......................................................................................................... 59
Frontend Settings..........................................................................................................61
└ Center............................................................................................................. 62
└ Frequency Offset............................................................................................ 62
└ Ref Level.........................................................................................................62
└ Ref Level Offset.............................................................................................. 63
└ Preamp On/Off................................................................................................63
└ Adjust Ref Lvl..................................................................................................63
IQ Capture Settings.......................................................................................................63
└ Invert Q........................................................................................................... 63
└ Capture Length............................................................................................... 64
└ Set Count........................................................................................................64
└ Set to Analyze.................................................................................................64
└ Trigger Source Free Run................................................................................ 64
└ Trigger Source External..................................................................................64
└ Trigger Polarity................................................................................................64
└ Trigger Offset..................................................................................................65
Channel Table Settings.................................................................................................65
└ Channel Search Mode.................................................................................... 66
└ Inactive Channel Threshold............................................................................ 66
└ Channel Tables...............................................................................................67
└ New / Copy / Edit............................................................................................ 67
└ Add Channel.........................................................................................69
└ Delete Channel.....................................................................................69
└ Meas.....................................................................................................69
└ Sort....................................................................................................... 69
└ Save......................................................................................................69
└ Cancel...................................................................................................69
└ Reload.................................................................................................. 70
└ Delete..............................................................................................................70
└ Restore Default Tables................................................................................... 70
Demod Settings (BTS mode)........................................................................................ 70
└ Base Spreading Factor................................................................................... 70
└ PN Offset........................................................................................................ 71
└ Multi Carrier.................................................................................................... 71
└ Enhanced Algorithm........................................................................................71
└ Multi Carrier Filter........................................................................................... 71
└ Filter Type.......................................................................................................71
└ Roll-Off Factor.................................................................................................72
58Operating Manual 1176.7626.02 ─ 04.1
Page 59

R&S® FSV-K82/-K83
Base SF/Long Code (MS mode)...................................................................................73
Result Settings..............................................................................................................74
Display Config...............................................................................................................77
Select............................................................................................................................ 79
Instrument Functions of the CDMA2000 Analysis
Menu and Softkey Description for CDA Measurements
└ Cut Off Frequency...........................................................................................72
└ Antenna Diversity............................................................................................72
└ Base Spreading Factor................................................................................... 73
└ Long Code Mask.............................................................................................74
└ Long Code Offset............................................................................................74
└ Long Code Gen Mode.....................................................................................74
└ Power Control Group...................................................................................... 75
└ Channel (Code) Number.................................................................................75
└ Code Order..................................................................................................... 76
└ Code Power.................................................................................................... 76
└ Pilot Power (MS mode only)........................................................................... 76
└ Power Reference............................................................................................ 76
└ Time/Phase Estimation...................................................................................77
└ Normalize........................................................................................................77
└ Code Domain Overview (MS mode only)........................................................77
Settings Overview
This softkey opens the "Settings Overview" dialog box that visualizes the data flow of
the Code Domain Analyzer and summarizes all of the current settings. In addition, you
can change the current settings via this dialog box.
To reset all values to their default state, press the "Set to Default" button.
59Operating Manual 1176.7626.02 ─ 04.1
Page 60
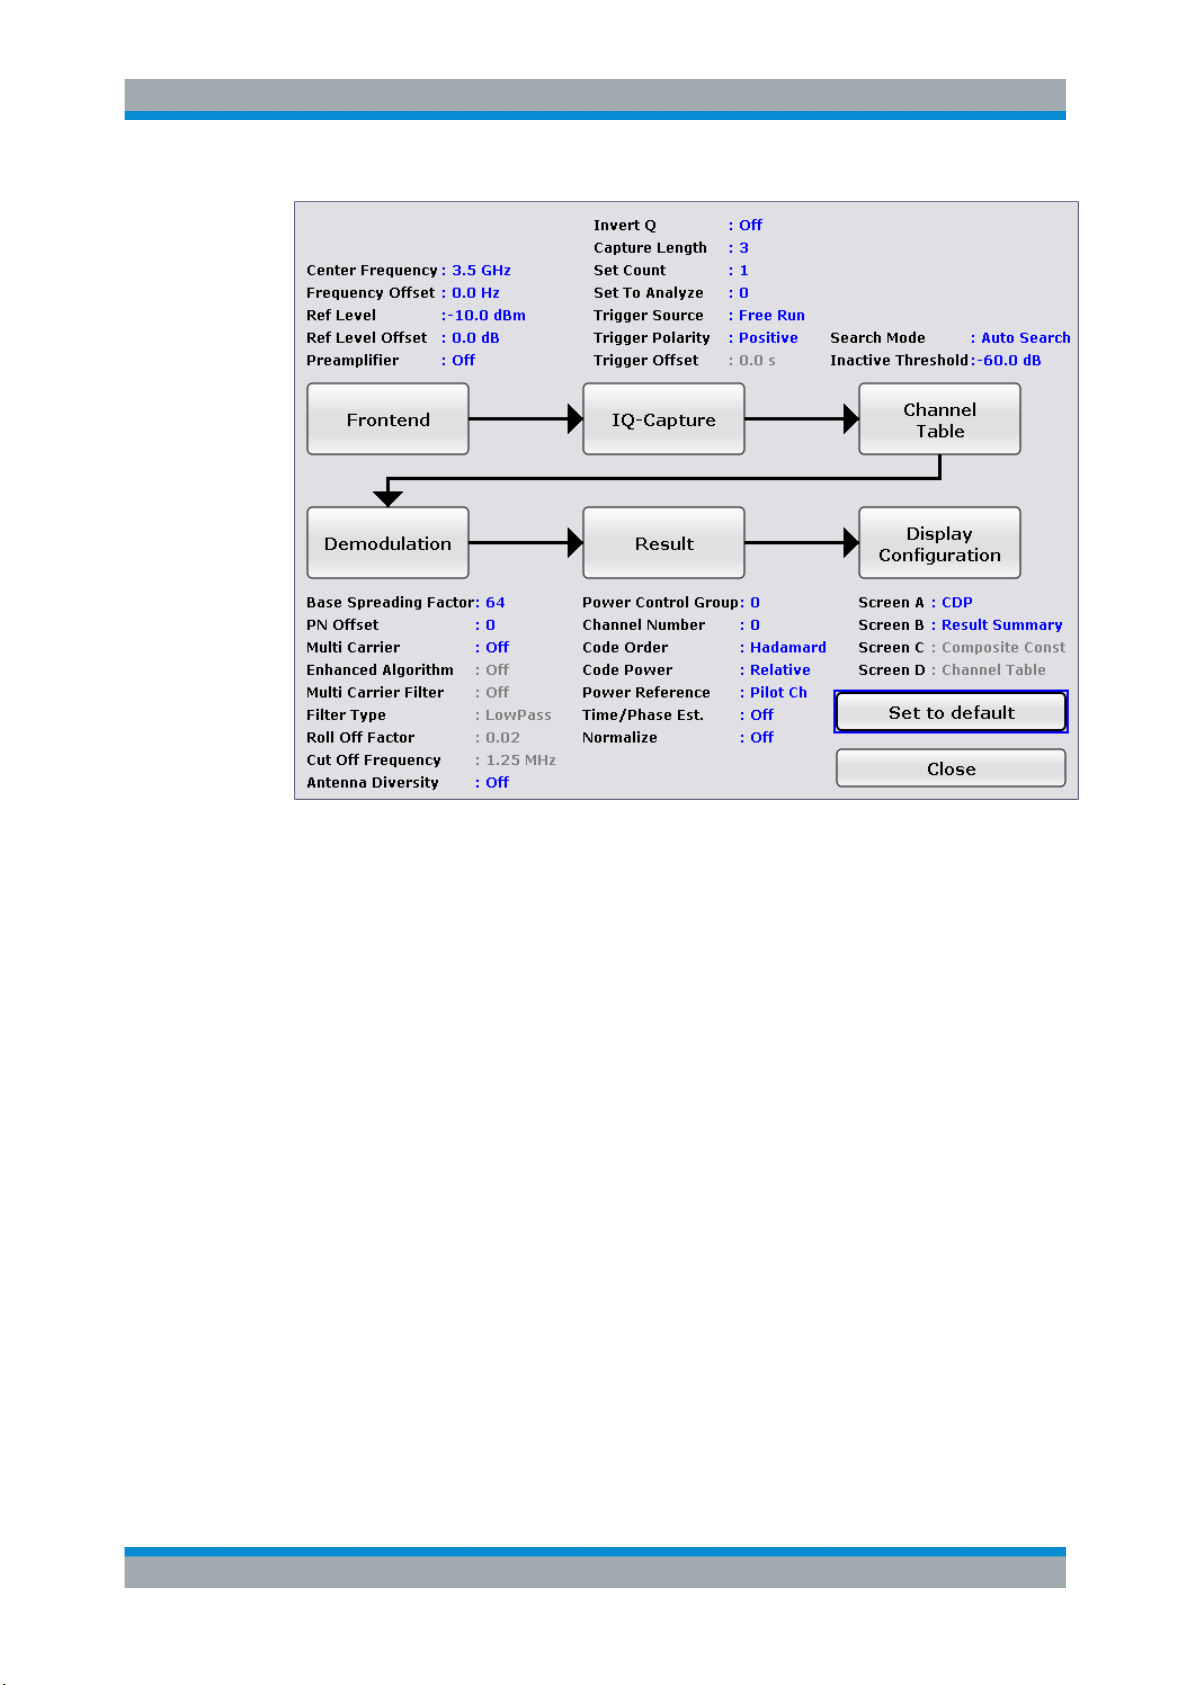
R&S® FSV-K82/-K83
Instrument Functions of the CDMA2000 Analysis
Menu and Softkey Description for CDA Measurements
Fig. 6-15: Settings overview in CDMA2000 BTS mode (K82)
60Operating Manual 1176.7626.02 ─ 04.1
Page 61
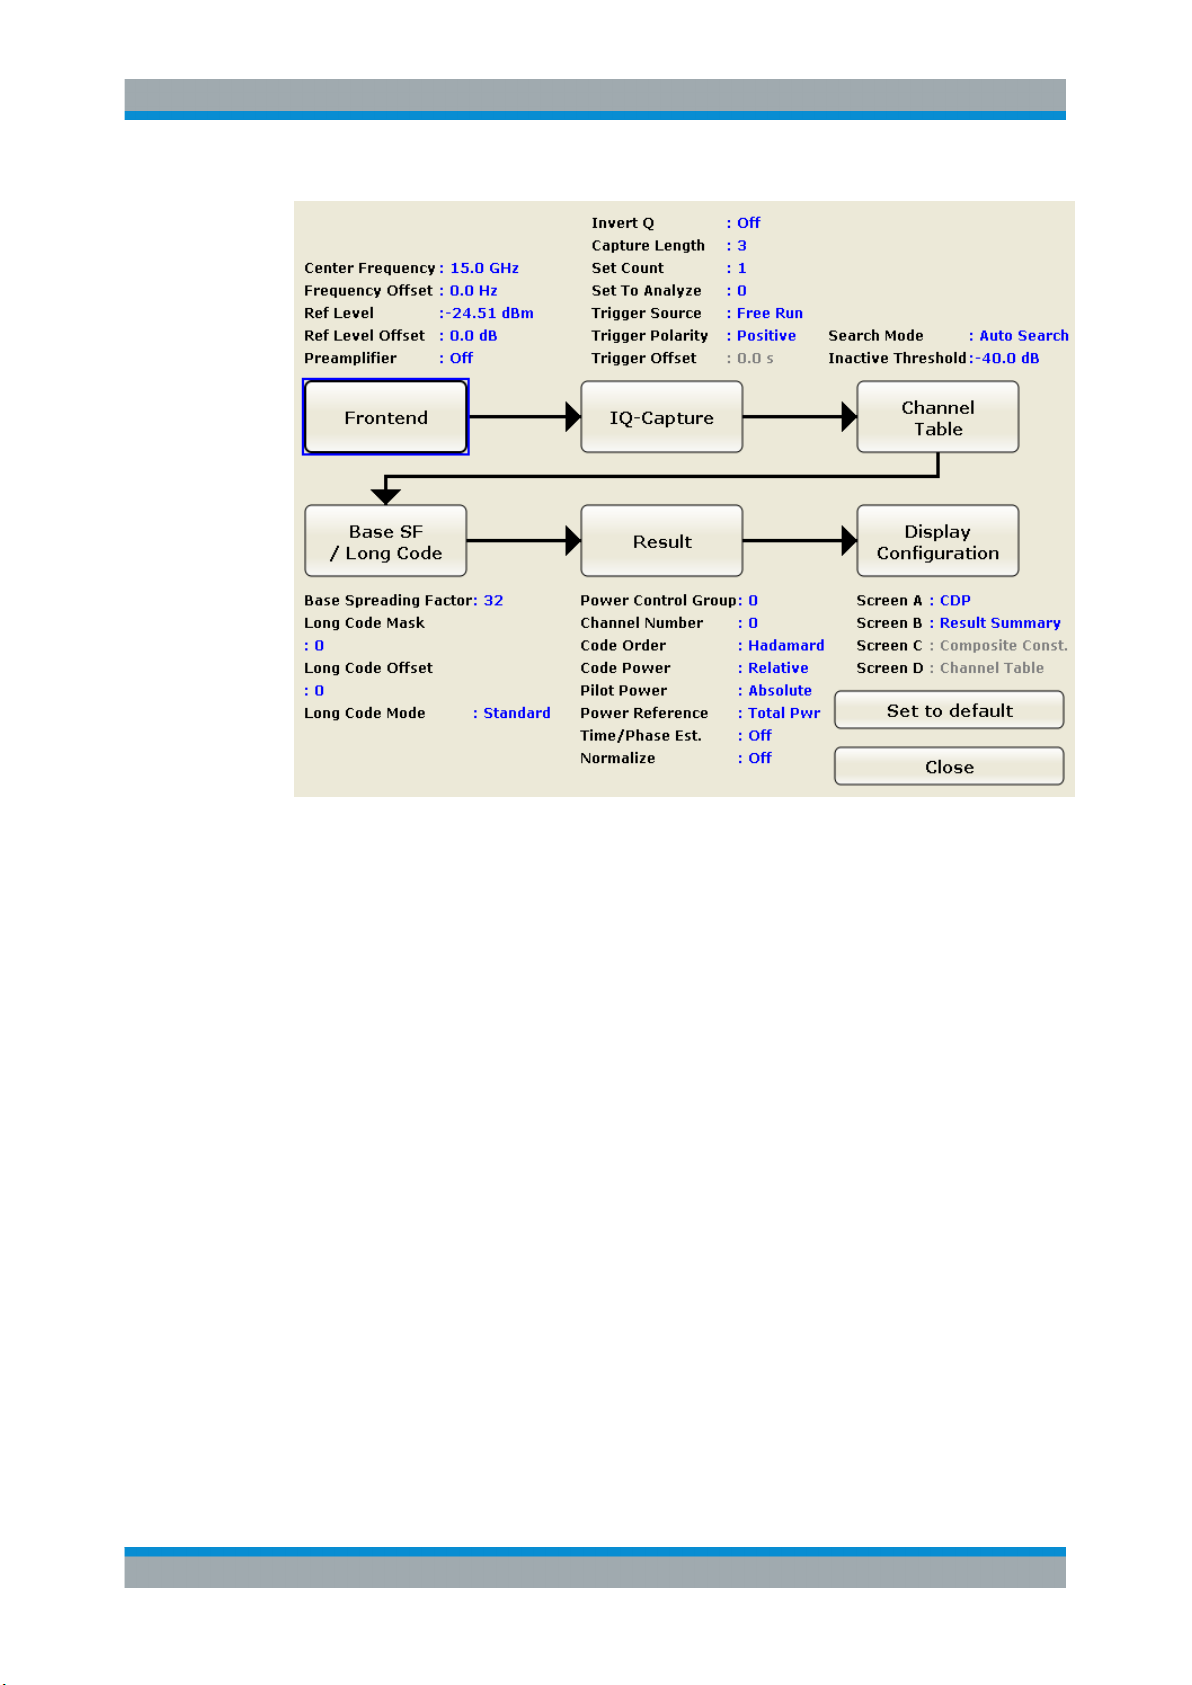
R&S® FSV-K82/-K83
Instrument Functions of the CDMA2000 Analysis
Menu and Softkey Description for CDA Measurements
Fig. 6-16: Settings overview in CDMA2000 MS mode (K83)
To change the settings, either use the rotary knob or the cursor keys to change the
focus to any other block or press one of the following buttons:
●
"Frontend Settings" on page 61
●
"IQ Capture Settings" on page 63
●
"Demod Settings (BTS mode)" on page 70
●
"Base SF/Long Code (MS mode)" on page 73
●
"Channel Table Settings" on page 65
●
"Result Settings" on page 74
●
"Display Config" on page 77
When using the rotary knob or the cursor keys, press the ENTER key to open the corresponding dialog box. The "Settings Overview" dialog box always remains open while
settings are modified.
Frontend Settings
This softkey opens the "Frontend Settings" dialog box to modify the following parameters:
61Operating Manual 1176.7626.02 ─ 04.1
Page 62
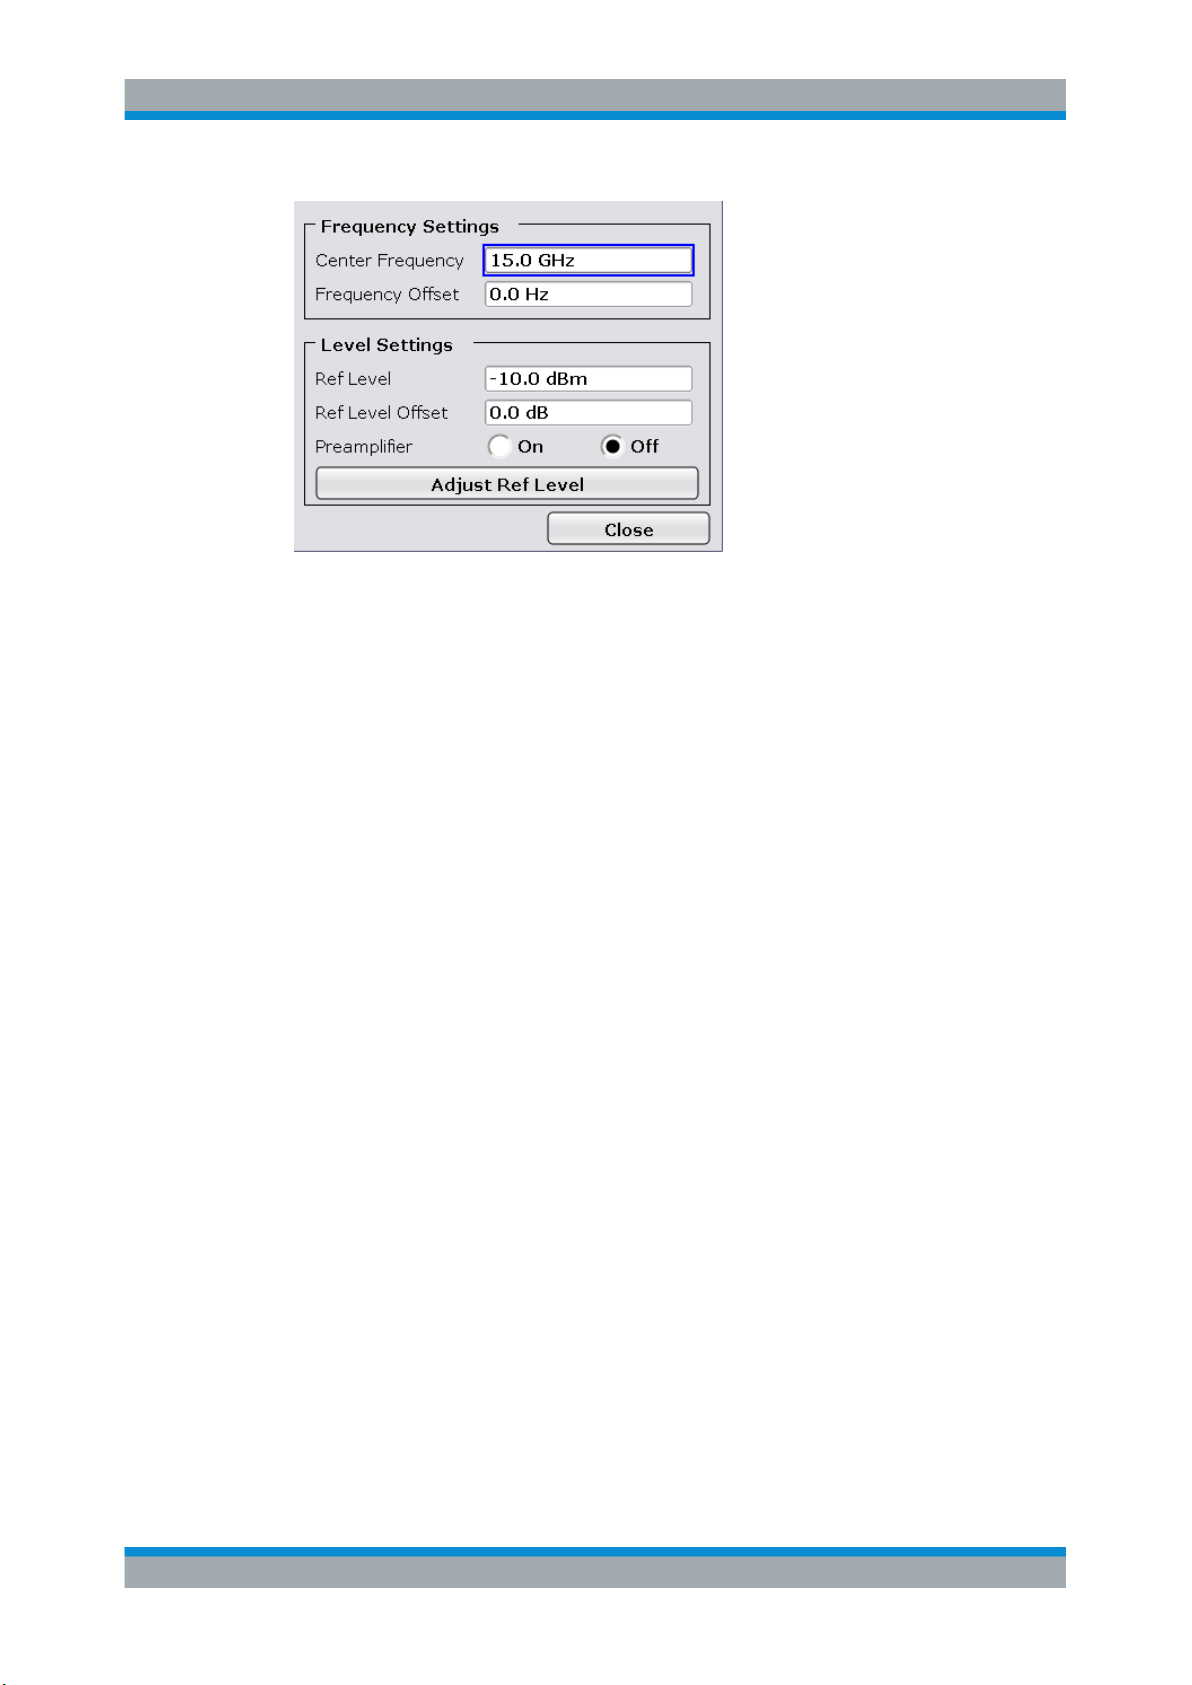
R&S® FSV-K82/-K83
Center ← Frontend Settings
Opens an edit dialog box to enter the center frequency. The allowed range of values
for the center frequency depends on the frequency span.
span > 0: span
span = 0: 0 Hz ≤ f
f
max
Remote command:
[SENSe:]FREQuency:CENTer on page 280
and span
Instrument Functions of the CDMA2000 Analysis
Menu and Softkey Description for CDA Measurements
/2 ≤ f
min
center
are specified in the data sheet.
min
center
≤ f
max
≤ f
max
– span
min
/2
Frequency Offset ← Frontend Settings
Opens an edit dialog box to enter a frequency offset that shifts the displayed frequency
range by the specified offset.
The softkey indicates the current frequency offset. The allowed values range from
-100 GHz to 100 GHz. The default setting is 0 Hz.
Remote command:
[SENSe:]FREQuency:OFFSet on page 282
Ref Level ← Frontend Settings
Opens an edit dialog box to enter the reference level in the current unit (dBm, dBµV,
etc).
The reference level is the maximum value the AD converter can handle without distortion of the measured value. Signal levels above this value will not be measured correctly, which is indicated by the "IFOVL" status display.
Remote command:
DISPlay[:WINDow<n>]:TRACe<t>:Y[:SCALe]:RLEVel on page 249
62Operating Manual 1176.7626.02 ─ 04.1
Page 63
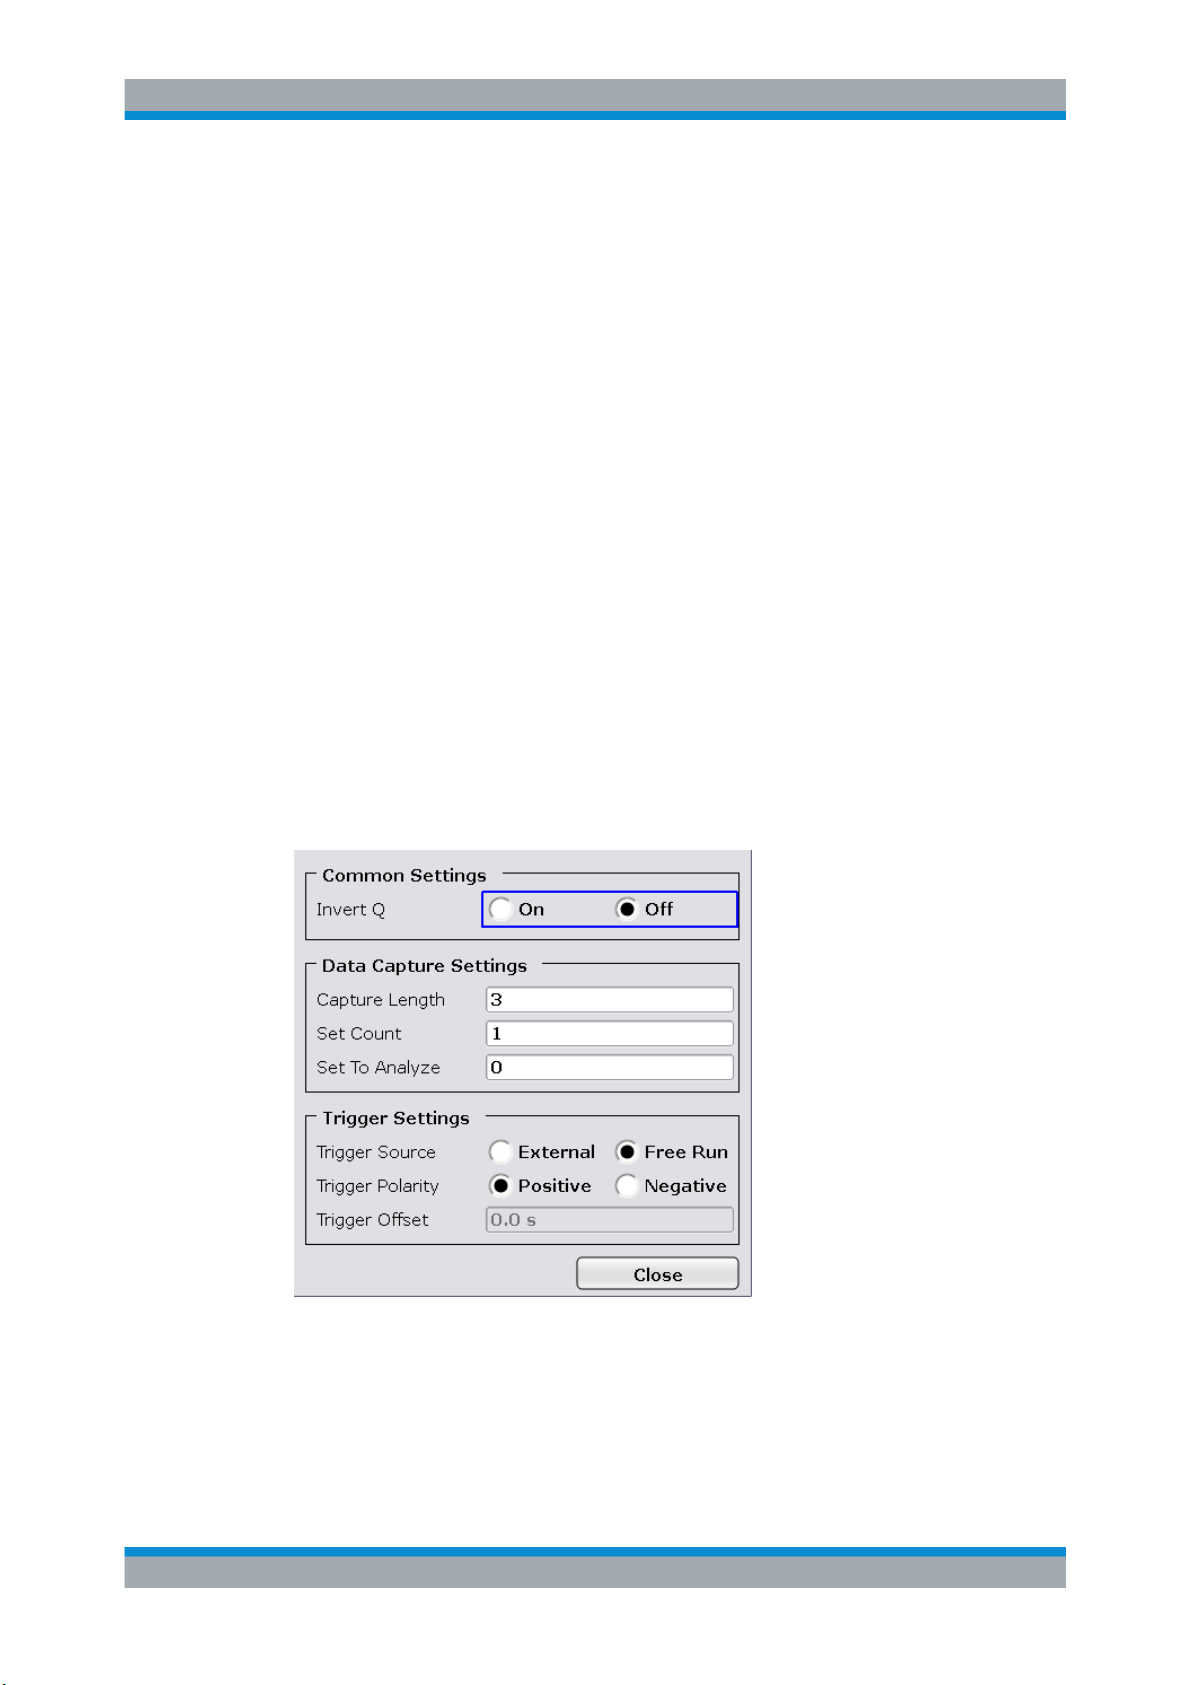
R&S® FSV-K82/-K83
Ref Level Offset ← Frontend Settings
Opens an edit dialog box to enter the arithmetic level offset. This offset is added to the
measured level irrespective of the selected unit. The scaling of the y-axis is changed
accordingly. The setting range is ±200 dB in 0.1 dB steps.
Remote command:
DISPlay[:WINDow<n>]:TRACe<t>:Y[:SCALe]:RLEVel:OFFSet on page 250
Preamp On/Off ← Frontend Settings
Switches the preamplifier on and off.
If option R&S FSV-B22 is installed, the preamplifier is only active below 7 GHz.
If option R&S FSV-B24 is installed, the preamplifier is active for all frequencies.
This function is not available for input from the R&S Digital I/Q Interface (option
R&S FSV-B17).
Remote command:
INPut:GAIN:STATe on page 316
Adjust Ref Lvl ← Frontend Settings
Defines the optimal reference level for the current measurement automatically.
Remote command:
[SENSe:]ADJust:LEVel on page 264
Instrument Functions of the CDMA2000 Analysis
Menu and Softkey Description for CDA Measurements
IQ Capture Settings
This softkey opens the "IQ Capture Settings" dialog box.
Invert Q ← IQ Capture Settings
Inverts the sign of the signal's Q-component. The default setting is OFF.
Remote command:
[SENSe:]CDPower:QINVert on page 259
63Operating Manual 1176.7626.02 ─ 04.1
Page 64

R&S® FSV-K82/-K83
Capture Length ← IQ Capture Settings
Sets the number of PCGs you want to analyze. The input value is always in multiples
of the PCGs. The maximum capture length is 64.
The "Capture Length" field is available if" Set Count" equals 1.
The default value is 3.
Remote command:
[SENSe:]CDPower:IQLength on page 255
Set Count ← IQ Capture Settings
Defines the number of consecutive sets to be stored in the instrument's IQ memory.
One set consists of 64 PCGs. The R&S FSVR can capture up to 31360 PCGs (about
26 seconds) in a single sweep, i.e. the possible value range is from 1 to 490 sets.
The default setting is 1. In that case you can still define the number of PCGs (see
"Capture Length" on page 64). In case you want to capture more than one set, the cap-
ture length is always 64. The R&S FSVR automatically sets the capture length to 64
and the "Capture Length" on page 64 field is not available for modification.
Remote command:
[SENSe:]CDPower:SET:COUNt on page 260
Instrument Functions of the CDMA2000 Analysis
Menu and Softkey Description for CDA Measurements
Set to Analyze ← IQ Capture Settings
Selects a specific set for further analysis. The value range depends on the "Set Count"
and is between 0 and "Set Count" – 1.
Remote command:
[SENSe:]CDPower:SET on page 260
Trigger Source Free Run ← IQ Capture Settings
The start of a sweep is not triggered. Once a measurement is completed, another is
started immediately.
For further details refer to the "Trigger Source" field in the "IQ Capture Settings" dialog
box.
This softkey is available for code domain measurements.
Remote command:
TRIG:SOUR IMM, see TRIGger<n>[:SEQuence]:SOURce on page 320
Trigger Source External ← IQ Capture Settings
Defines triggering via a TTL signal at the "EXT TRIG/GATE IN" input connector on the
rear panel.
An edit dialog box is displayed to define the external trigger level.
For further details refer to the "Trigger Source" field in the "IQ Capture Settings" dialog
box.
This softkey is available for code domain measurements.
Remote command:
TRIG:SOUR EXT, see TRIGger<n>[:SEQuence]:SOURce on page 320
Trigger Polarity ← IQ Capture Settings
Sets the polarity of the trigger source.
64Operating Manual 1176.7626.02 ─ 04.1
Page 65

R&S® FSV-K82/-K83
The sweep starts after a positive or negative edge of the trigger signal. The default setting is "Pos". The setting applies to all modes with the exception of the "Free Run" and
"Time" mode.
This softkey is available for code domain measurements.
"Pos"
"Neg"
Remote command:
TRIGger<n>[:SEQuence]:SLOPe on page 320
[SENSe:]SWEep:EGATe:POLarity on page 295
Trigger Offset ← IQ Capture Settings
Opens an edit dialog box to enter the time offset between the trigger signal and the
start of the sweep.
offset > 0: Start of the sweep is delayed
Instrument Functions of the CDMA2000 Analysis
Menu and Softkey Description for CDA Measurements
Level triggering: the sweep is stopped by the logic "0" signal and
restarted by the logical "1" signal after the gate delay time has
elapsed.
Edge triggering: the sweep is continued on a "0" to "1" transition for
the gate length duration after the gate delay time has elapsed.
offset < 0: Sweep starts earlier (pre-trigger)
Only possible for span = 0 (e.g. I/Q Analyzer mode) and gated trigger
switched off
Maximum allowed range limited by the sweep time:
pretrigger
When using the R&S Digital I/Q Interface (R&S FSV-B17) with I/Q Analyzer mode, the maximum range is limited by the number of pretrigger
samples.
See the R&S Digital I/Q Interface(R&S FSV-B17) description in the base
unit.
= sweep time
max
In the "External" or "IF Power" trigger mode, a common input signal is used for both
trigger and gate. Therefore, changes to the gate delay will affect the trigger delay (trigger offset) as well.
Remote command:
TRIGger<n>[:SEQuence]:HOLDoff[:TIME] on page 319
Channel Table Settings
Opens the "Channel Table Settings" dialog box and the corresponding submenu.
65Operating Manual 1176.7626.02 ─ 04.1
Page 66
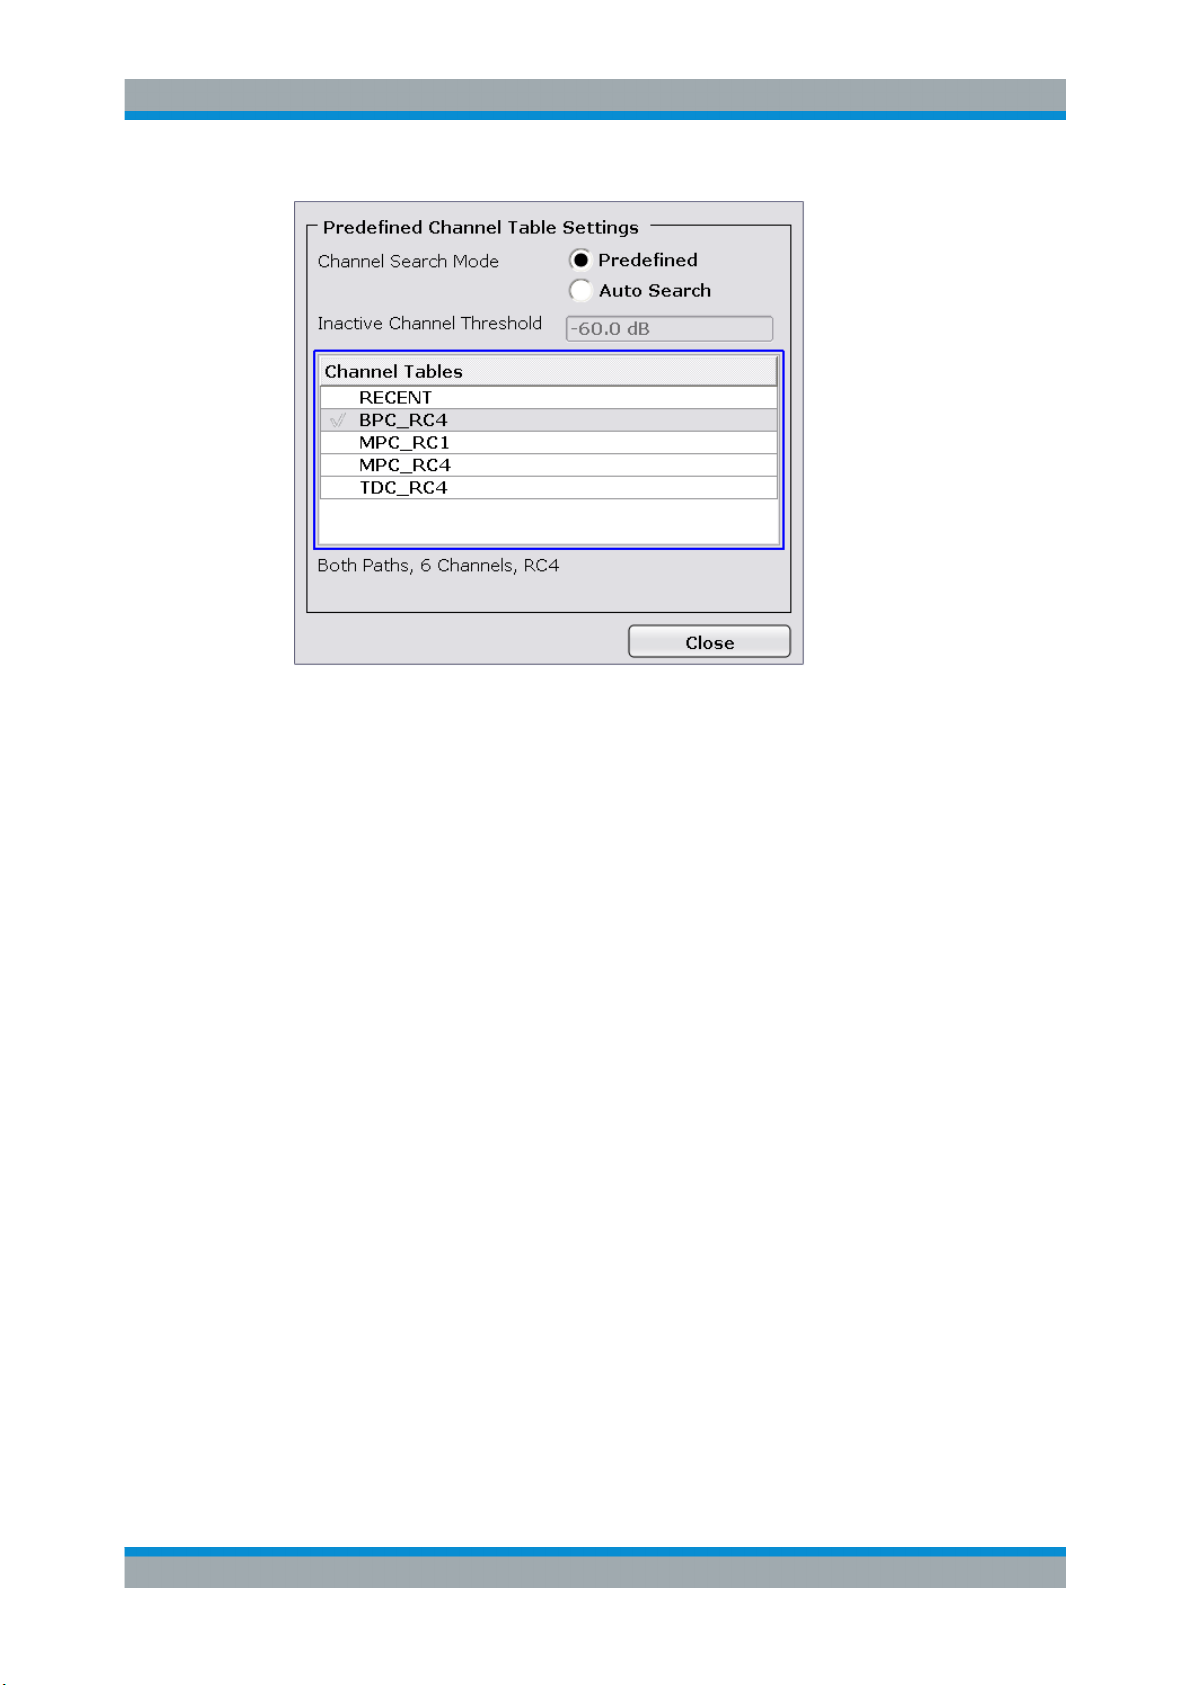
R&S® FSV-K82/-K83
Instrument Functions of the CDMA2000 Analysis
Menu and Softkey Description for CDA Measurements
Predefined channel tables allow you to customize measurements very quickly and
easily. They are included in the option by default and contain settings according to specific standards. For details on the predefined channel tables refer to chapter 6.4.1,
"Predefined Channel Tables", on page 151. In addition, new channel tables can be
created and saved to be used in measurements.
Channel Search Mode ← Channel Table Settings
Defines the kind of channel table used for the measurement.
"Auto"
"Predef"
Remote command:
CONFigure:CDPower[:BTS]:CTABle[:STATe] on page 237
CONFigure:CDPower[:BTS]:CTABle:SELect on page 241
The Auto Search mode scans the whole code domain, including all
permissible symbol rates and channel numbers, for active channels.
The automatic search provides an overview of the channels contained in the signal. If channels are not detected as being active,
change the threshold (see "Inactive Channel Threshold"
on page 66) or select the Predefined channel search type.
Performs the code domain measurement on the basis of the active
predefined channel table. All channels of a channel table are
assumed to be active. For further details also refer to the "Channel
Tables" on page 67 field and the chapter 6.4.1, "Predefined Channel Tables", on page 151 .
Inactive Channel Threshold ← Channel Table Settings
Defines the minimum power which a single channel must have compared to the total
signal in order to be recognized as an active channel. Channels below the specified
threshold are regarded as "inactive". The parameter is available in the Auto Search
mode of the Channel Table Settings dialog box.
66Operating Manual 1176.7626.02 ─ 04.1
Page 67

R&S® FSV-K82/-K83
The default value is -60 dB. With this value all channels with signals such as the
CDMA2000 test models are located by the Code Domain Power analysis. Decrease
the Inactive Channel Threshold value, if not all channels contained in the signal are
detected.
Remote command:
[SENSe:]CDPower:ICThreshold on page 255
Channel Tables ← Channel Table Settings
In this field a list of the available channel tables is shown. The selected channel table is
the basis for future measurements (until you choose another or activate "Auto
Search").
An active channel table must describe the supplied signal completely, also in regard to
the transmit diversity (see "Antenna Diversity" on page 72).
Using the softkeys, customized channel tables can be defined or existing channel
tables can be modified.
The following channel tables are available by default:
"RECENT"
"BPC_RC4,
MPC_RC1,
MPC_RC4,
TDC_RC4"
"EACHOP,
RCCCHOP,
RTCHOP3,
RTCHOP5"
Remote command:
CONFigure:CDPower[:BTS]:CTABle:CATalog? on page 237
Instrument Functions of the CDMA2000 Analysis
Menu and Softkey Description for CDA Measurements
Contains the last configuration used before switching from "Auto
Search" to "Predefined"
Channel tables for BTS mode (K82); configured according to a specific standard
Channel tables for MS mode (K83); configured according to a specific
standard
New / Copy / Edit ← Channel Table Settings
All three softkeys open a dialog box with the same layout and the same corresponding
submenu.
The "New" softkey opens the "New Channel Table" dialog box. In this dialog you can
build a new channel table. All fields are empty.
The "Copy" softkey copies all elements of the selected channel table and opens the
"Copy Channel Table" dialog box. The name of the new channel table is set to "Copy
of <SourceChannelTableName>".
The "Edit" softkey opens the "Edit Channel Table" dialog box and the corresponding
menu. In this dialog box you can edit an existing channel table.
Note that changes are never saved automatically. Save your channel tables before
ending the application (Save softkey). For more information see chapter 6.4.2, "Work-
ing with Channel Tables", on page 155.
The dialog box contains the following items. You can modify the white fields as you
like. The grey fields can not be modified; these are automatically calculated by the
R&S FSVR:
67Operating Manual 1176.7626.02 ─ 04.1
Page 68

R&S® FSV-K82/-K83
Item Description
Name Enter the name of the selected channel table, which will be saved under
Description Enter further information about the channel table.
Channel Type Select one of the channel types from the dropdown menu.
Walsh Ch.SF Enter the Channel Number (Ch) and Spreading Factor (SF). For some
Symbol Rate/ksps Display of the symbol rate
Instrument Functions of the CDMA2000 Analysis
Menu and Softkey Description for CDA Measurements
<name>.xml. The name is case sensitive and may not contain spaces. It
must be a valid MS Windows file name. Note that the old channel table file
is not deleted.
channel types the possible values are limited or preset (e.g. F-PICH, FTDPICH and F-PDCH).
RC
(BTS mode only)
Mapping (MS mode only) Specifies whether the channel is active on the I or Q branch.
Power/dB Contains the measured relative code domain power. The unit is dB. The
State Indicates whether a channel is active or inactive.
DomainConflict A red bullet indicates a conflict of any sorts between two or more channels
The Radio Configuration (RC) can be customized for two channel types.
For the F-PDCH the you can set the configuration to either 10 (QPSK), 10
(8PSK) and 10 (16QAM). For CHAN channels, you can set the radio configuration to 1-2 or 3-5.
fields are filled with values after pressing the Meas softkey.
(e.g. two conflicting channel codes)
68Operating Manual 1176.7626.02 ─ 04.1
Page 69
R&S® FSV-K82/-K83
Add Channel ← New / Copy / Edit ← Channel Table Settings
Inserts a new channel below the selected one. For a description of the parameters of
the channel refer to the "New / Copy / Edit" on page 67 softkey. The default values for
a new channel are:
ChannelType CHAN
Walsh.SF 0.64
Sym Rate/ksps automatically calculated
Instrument Functions of the CDMA2000 Analysis
Menu and Softkey Description for CDA Measurements
RC
(BTS mode only)
Mapping (MS mode only) I
Power/dB automatically calculated
State Off
DomainConflict automatically calculated
3-5
The R&S FSVR automatically checks for conflicts between two active channels.
Remote command:
CONFigure:CDPower[:BTS]:CTABle:DATA on page 238
Delete Channel ← New / Copy / Edit ← Channel Table Settings
Deletes the selected channel without further notice.
Meas ← New / Copy / Edit ← Channel Table Settings
Initiates a measurement in "Auto Search" mode (see "Channel Search Mode"
on page 66). The measurement results are applied to the active channel table. The
active channel table is overwritten without further notice.
The softkey is only available if the "Auto Search" mode is enabled "in the Channel
Table Settings" dialog box.
Sort ← New / Copy / Edit ← Channel Table Settings
Sorts the table according to the following criteria (in the specified order):
●
Channel state (active channels first, then inactive channels)
●
Channel type (special channels like F-PICH or F-SYNC first, then data channels)
●
Spreading factor (in ascending order)
●
Code number (in ascending order)
Save ← New / Copy / Edit ← Channel Table Settings
Saves the table under its specified name in the xml-format. If you edit a channel table
and want to keep the original channel table, change the name of the edited channel
table before saving it.
Cancel ← New / Copy / Edit ← Channel Table Settings
Closes the dialog box and returns to the "Channel Table Settings" dialog box. Changes
applied to the channel table are lost.
69Operating Manual 1176.7626.02 ─ 04.1
Page 70
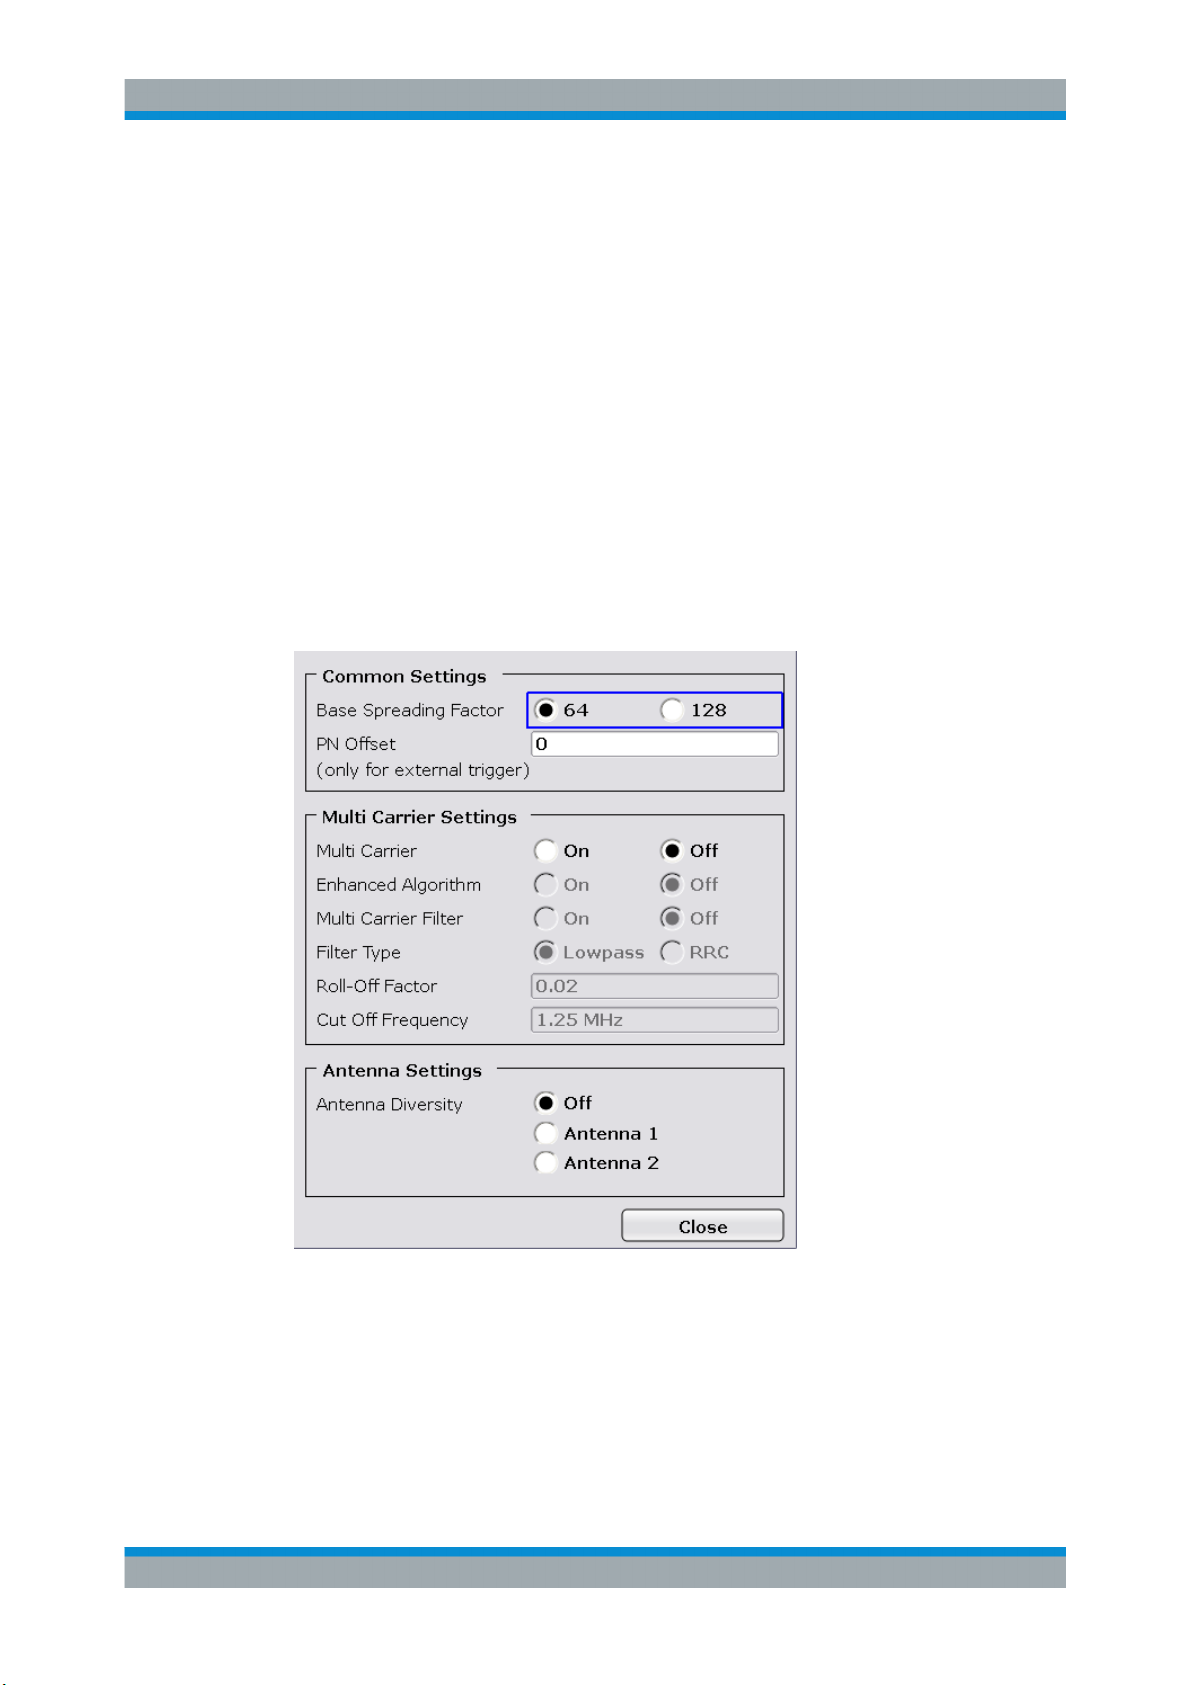
R&S® FSV-K82/-K83
Reload ← New / Copy / Edit ← Channel Table Settings
Reloads the original content of the copied channel table.
This softkey is available for the "New Channel Table" dialog box and the "Edit Channel
Table" dialog box.
Delete ← Channel Table Settings
Deletes the selected channel table. The currently active channel table cannot be
deleted.
Restore Default Tables ← Channel Table Settings
Restores the predefined channel tables (see chapter 6.4.1, "Predefined Channel
Tables", on page 151 ) to their factory-set values. Existing channel tables with the
same name as default channel tables are replaced by this action. In this way, you can
undo unintentional overwriting.
Demod Settings (BTS mode)
This softkey opens the "Demodulation Settings" dialog box.
Instrument Functions of the CDMA2000 Analysis
Menu and Softkey Description for CDA Measurements
Base Spreading Factor ← Demod Settings (BTS mode)
Sets the base spreading factor to either 64 or 128. If you set the base spreading factor
to 64 for channels with a base spreading factor of 128 (code class 7), an alias power is
displayed in the Code Domain Power and Code Domain Error Power diagrams.
Remote command:
[SENSe:]CDPower:SFACtor on page 260
70Operating Manual 1176.7626.02 ─ 04.1
Page 71

R&S® FSV-K82/-K83
PN Offset ← Demod Settings (BTS mode)
Specifies the Pseudo Noise (PN) offset of the base station. In a CDMA2000 system,
the PN offset is used to distinguish the base stations.
The PN offset determines the offset in the circulating PN sequence in multipls of 64
chips with reference to the event second clock trigger.
Although the parameter is always available, it has an effect only in External trigger
mode.
Remote command:
[SENSe:]CDPower:PNOFfset on page 258
Multi Carrier ← Demod Settings (BTS mode)
Activates or deactivates the Multi Carrier mode. The mode improves the processing of
multi carrier signals. It allows the measurement on one carrier out of a multi carrier signal.
Remote command:
CONFigure:CDPower[:BTS]:MCARrier [:STATe] on page 241
Instrument Functions of the CDMA2000 Analysis
Menu and Softkey Description for CDA Measurements
Enhanced Algorithm ← Demod Settings (BTS mode)
Activates or deactivates the enhanced algorithm that is used for signal detection on
multi-carrier signals. This algorithm slightly increases the calculation time.
If both the Enhanced Algorithm and the "Multi Carrier Filter" on page 71 are deactivated, the multi carrier mode is automatically switched off.
Remote command:
CONFigure:CDPower[:BTS]:MCARrier:MALGo on page 243
Multi Carrier Filter ← Demod Settings (BTS mode)
Activates or deactivates the usage of a filter for signal detection on multi-carrier signals.
If both the "Enhanced Algorithm" on page 71 and the Multi Carrier Filter are deactivated, the multi carrier mode is automatically switched off.
Remote command:
CONFigure:CDPower[:BTS]:MCARrier:FILTer [:STATe] on page 242
Filter Type ← Demod Settings (BTS mode)
Selects the filter type if "Multi Carrier Filter" on page 71 is activated.
Two filter types are available for selection: a low-pass filter and a RRC filter.
By default, the low-pass filter is active. The low-pass filter affects the quality of the
measured signal compared to a measurement without a filter. The frequency response
of the low-pass filter is shown below.
71Operating Manual 1176.7626.02 ─ 04.1
Page 72
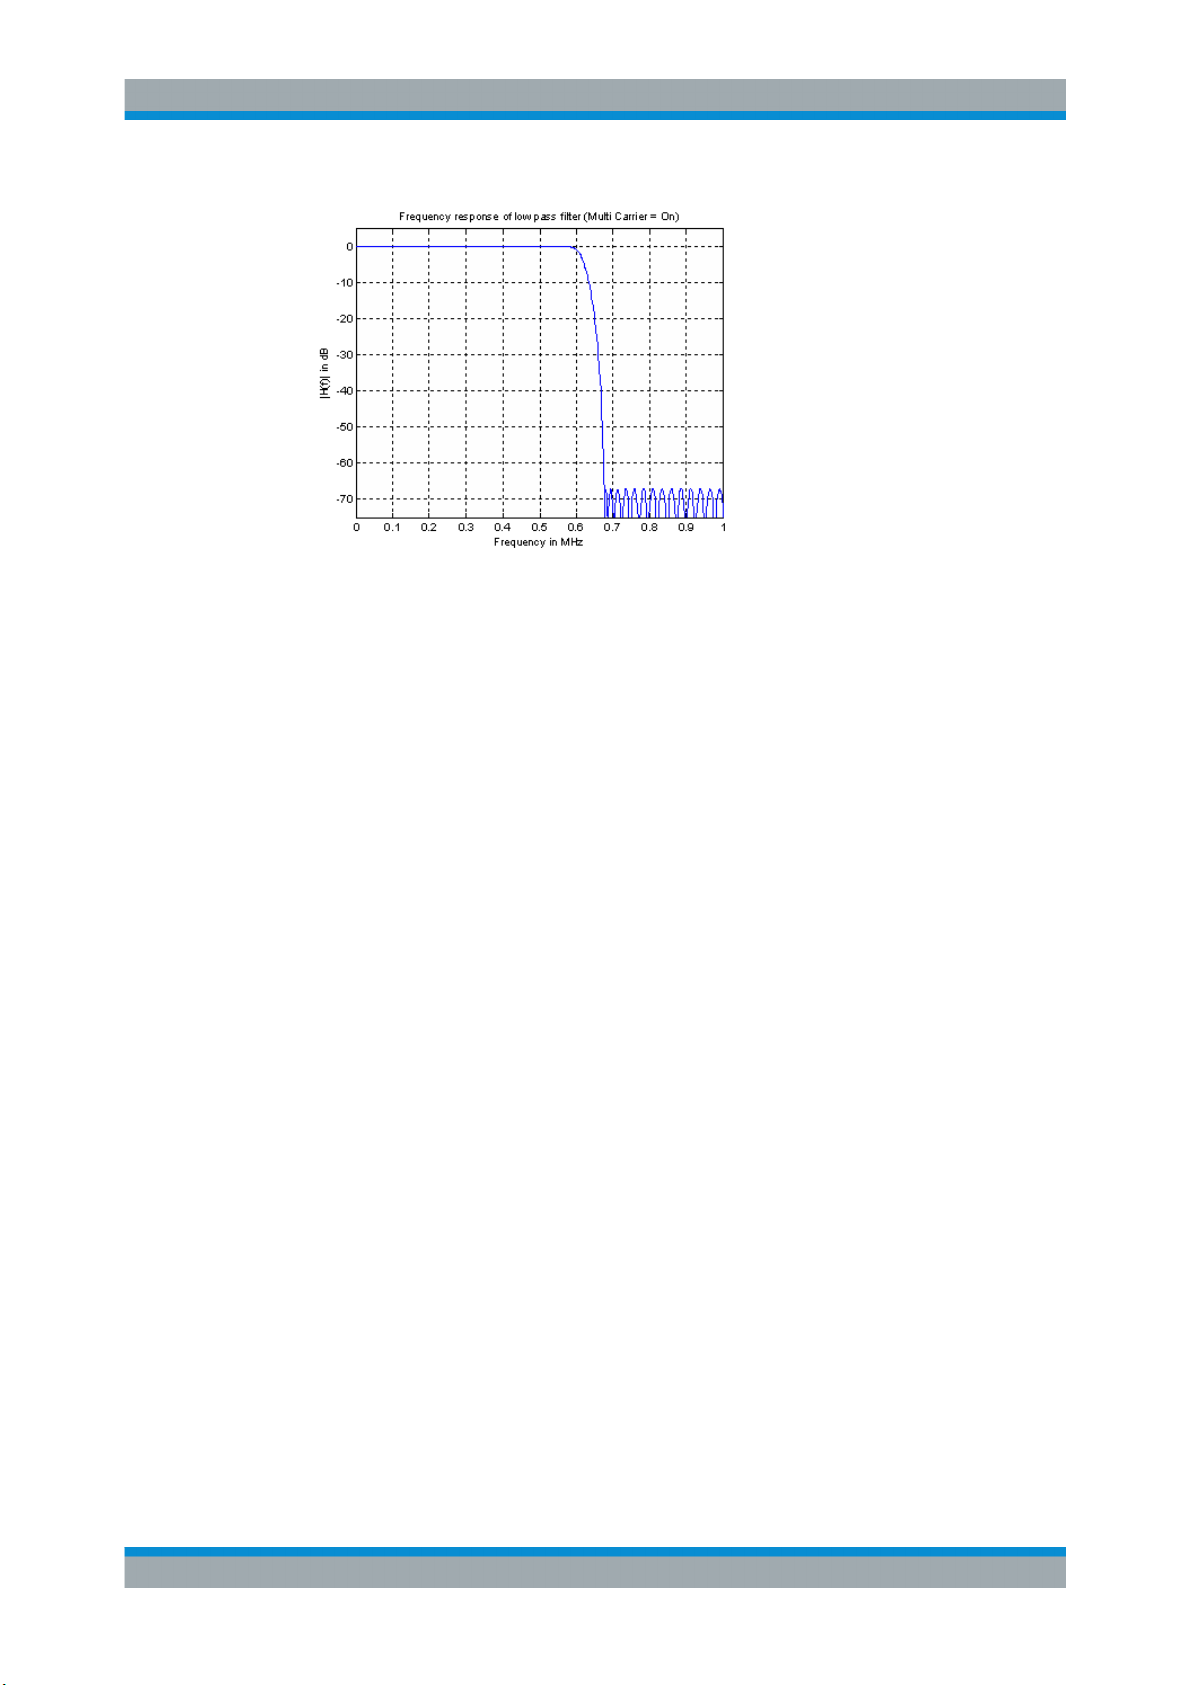
R&S® FSV-K82/-K83
The RRC filter comes with an integrated Hamming window. If selected, two more settings become available for configuration: the "Roll-Off Factor" on page 72 and the
"Cut Off Frequency" on page 72.
Remote command:
CONFigure:CDPower[:BTS]:MCARrier:FILTer:TYPE on page 243
Instrument Functions of the CDMA2000 Analysis
Menu and Softkey Description for CDA Measurements
Roll-Off Factor ← Demod Settings (BTS mode)
Defines the roll-off factor of the RRC filter. The roll-off factor defines the slope of the
filter curve and therefore the excess bandwidth of the filter. Possible values are
between 0.01 and 0.99 in 0.01 steps. The default value is 0.02.
This parameter is available for the RRC filter.
Remote command:
CONFigure:CDPower[:BTS]:MCARrier:FILTer:TYPE on page 243
CONFigure:CDPower[:BTS]:MCARrier:FILTer:ROFF on page 242
Cut Off Frequency ← Demod Settings (BTS mode)
Defines the cut-off frequency of the RRC filter. The cutoff frequency is the frequency at
which the passband of the filter begins. Possible values are between 0.1 MHz and 2.4
MHz in 1 Hz steps. The default value is 1.25 MHz
This parameter is available for the RRC filter.
Remote command:
CONFigure:CDPower[:BTS]:MCARrier:FILTer:TYPE on page 243
CONFigure:CDPower[:BTS]:MCARrier:FILTer:COFRequency on page 242
Antenna Diversity ← Demod Settings (BTS mode)
Activates or deactivates the orthogonal transmit diversity (two-antenna system) and
defines the antenna for which the results are displayed.
72Operating Manual 1176.7626.02 ─ 04.1
Page 73
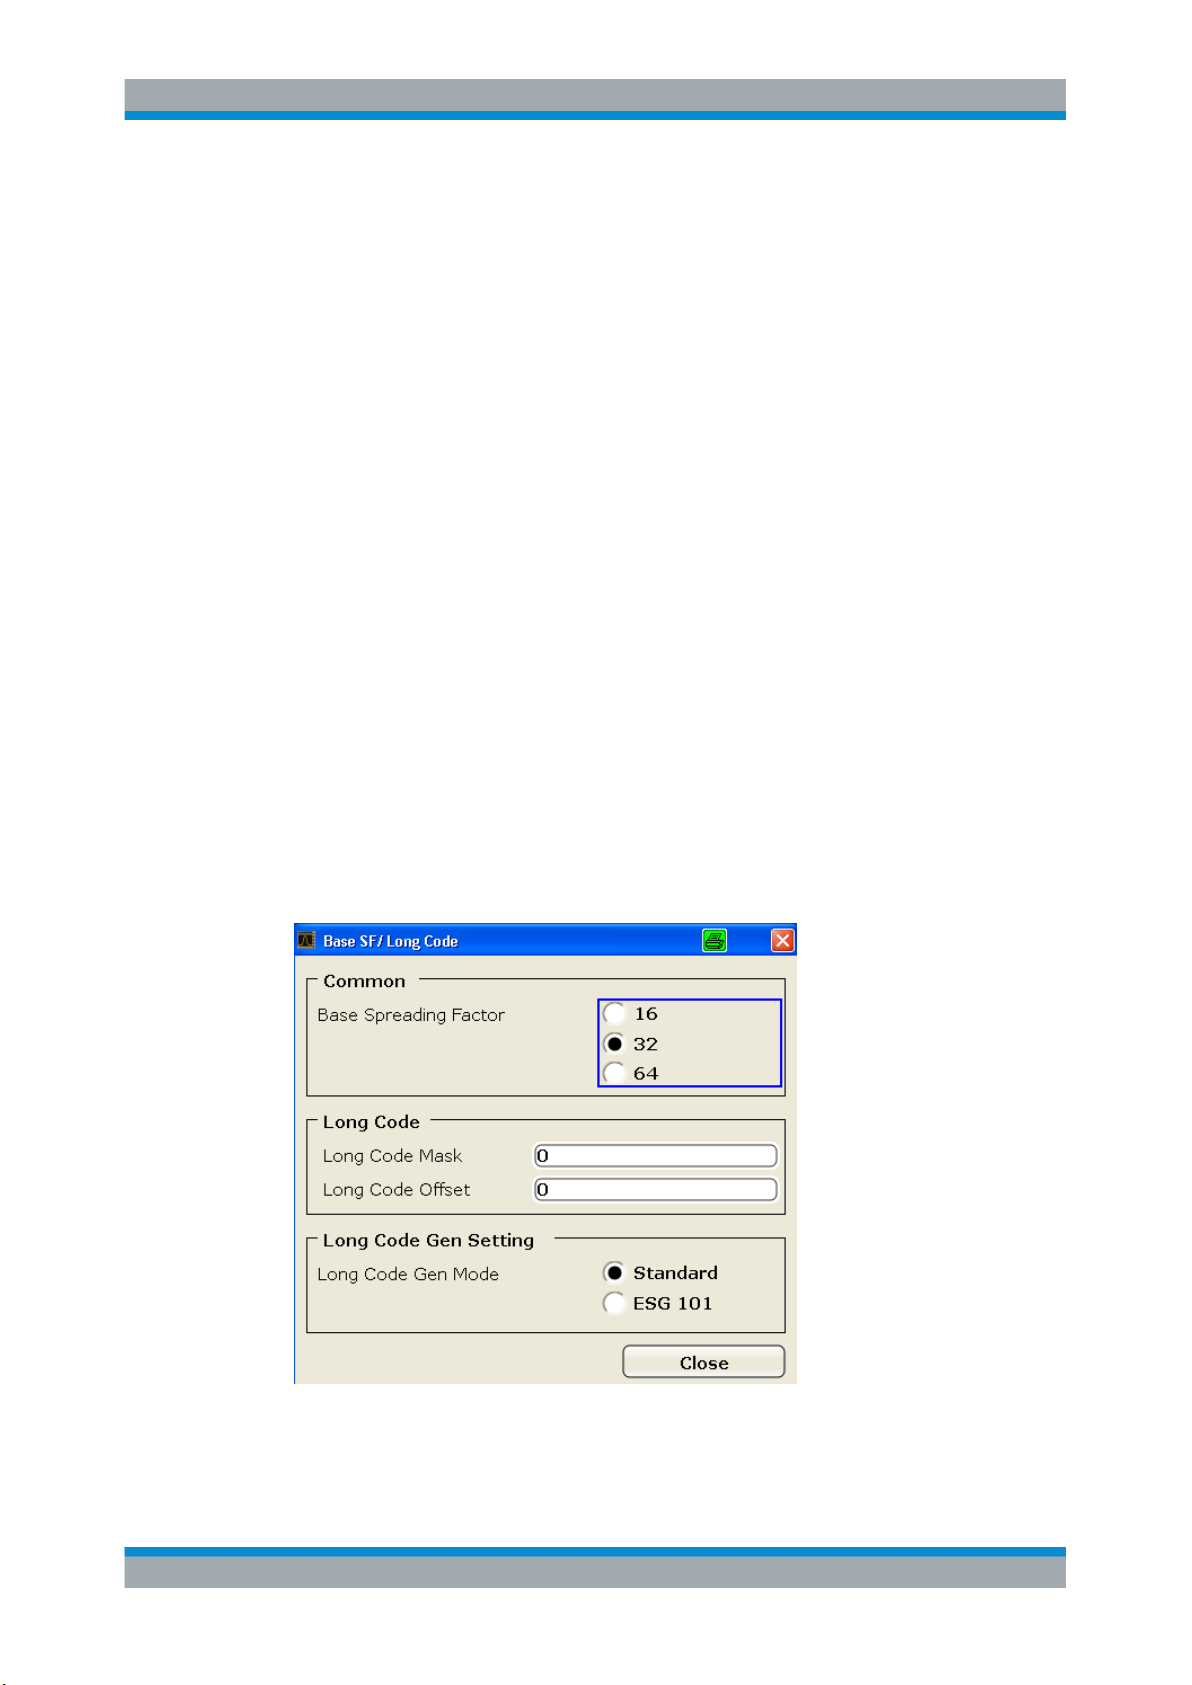
R&S® FSV-K82/-K83
Instrument Functions of the CDMA2000 Analysis
Menu and Softkey Description for CDA Measurements
"Antenna 1"
"Antenna 2"
"Off"
Remote command:
[SENSe:]CDPower:ANTenna on page 254
The signal of antenna 1 is fed in.
The pilot channel (F-PICH) with channel number 0 and spreading factor 64 (0.64) is required.
If a channel table is used in the measurement (see Channel Table), it
must contain the pilot channel (F-PICH), but must not contain the
transmit diversity pilot channel (F-TDPICH).
As reference for the code power (Power Reference), PICH is used.
The signal of antenna 2 is fed in.
The transmit diversity pilot channel (F-TDPICH) with channel number
16 and spreading factor 128 (16.128) is required.
If a channel table is used in the measurement (see Channel Table), it
must contain the transmit diversity pilot channel (F-TDPICH), but
must not contain the pilot channel (F-PICH).
As reference for the code power (Power Reference), F-TDPICH is
used.
The aggregate signal from both antennas is fed in.
The pilot channels of both antennas are required.
If a channel table is used in the measurement (see Channel Table), it
must contain both the transmit diversity pilot channel (F-TDPICH) and
the pilot channel (F-PICH).
As reference for the code power (Power Reference), F-PICH is used.
Base SF/Long Code (MS mode)
This softkey opens the "Base SF/Long Code" dialog box. These settings are used to
identify the base stations during mobile measurements.
Base Spreading Factor ← Base SF/Long Code (MS mode)
Sets the base spreading factor. Possible values are 16, 32, 64.
73Operating Manual 1176.7626.02 ─ 04.1
Page 74

R&S® FSV-K82/-K83
If channels with a spreading factor of 64 are analyzed, use the base spreading factor
64. Otherwise alias power is displayed in the "CODE DOMAIN POWER" and "CODE
DOMAIN ERROR POWER" diagram.
Remote command:
[SENSe:]CDPower:SFACtor on page 260
Long Code Mask ← Base SF/Long Code (MS mode)
Defines the long code mask of the mobile in hexadecimal form. The value range is
from 0 to 4FFFFFFFFFF.
For the default mask value of 0 the long code offset (refer to the "LONG CODE OFFSET" softkey) is not taken into consideration.
Remote command:
[SENSe:]CDPower:LCODe:MASK on page 256
Long Code Offset ← Base SF/Long Code (MS mode)
Defines the long code offset, including the PN offset, in chips in hexadecimal format
with a 52-bit resolution. This value corresponds to the GPS timing since 6.1.1980
00:00:00 UTC. This offset is applied at the next trigger pulse (which cannot occur until
a setup time of 300 ms has elapsed). The default value is 0.
The setting is ignored if the "Long Code Mask" is set to 0.
The chips offset is calculated as follows:
tSinceStartGPS * 1.2288 MChips/s
Instrument Functions of the CDMA2000 Analysis
Menu and Softkey Description for CDA Measurements
where tSinceStartGPS is defined in seconds
Remote command:
[SENSe:]CDPower:LCODe:OFFSet on page 256
Long Code Gen Mode ← Base SF/Long Code (MS mode)
Selects the mode of the long code generation.
"Standard"
"ESG 101"
Remote command:
[SENSe:]CDPower:LCODe:MODE on page 257
Result Settings
This softkey opens the "Result Settings" dialog box to modify the following parameters:
The cdma2000 standard long code generator is used.
The Agilent ESG option 101 long code is used; in this case, only sig-
nals from that generator can be analysed.
74Operating Manual 1176.7626.02 ─ 04.1
Page 75
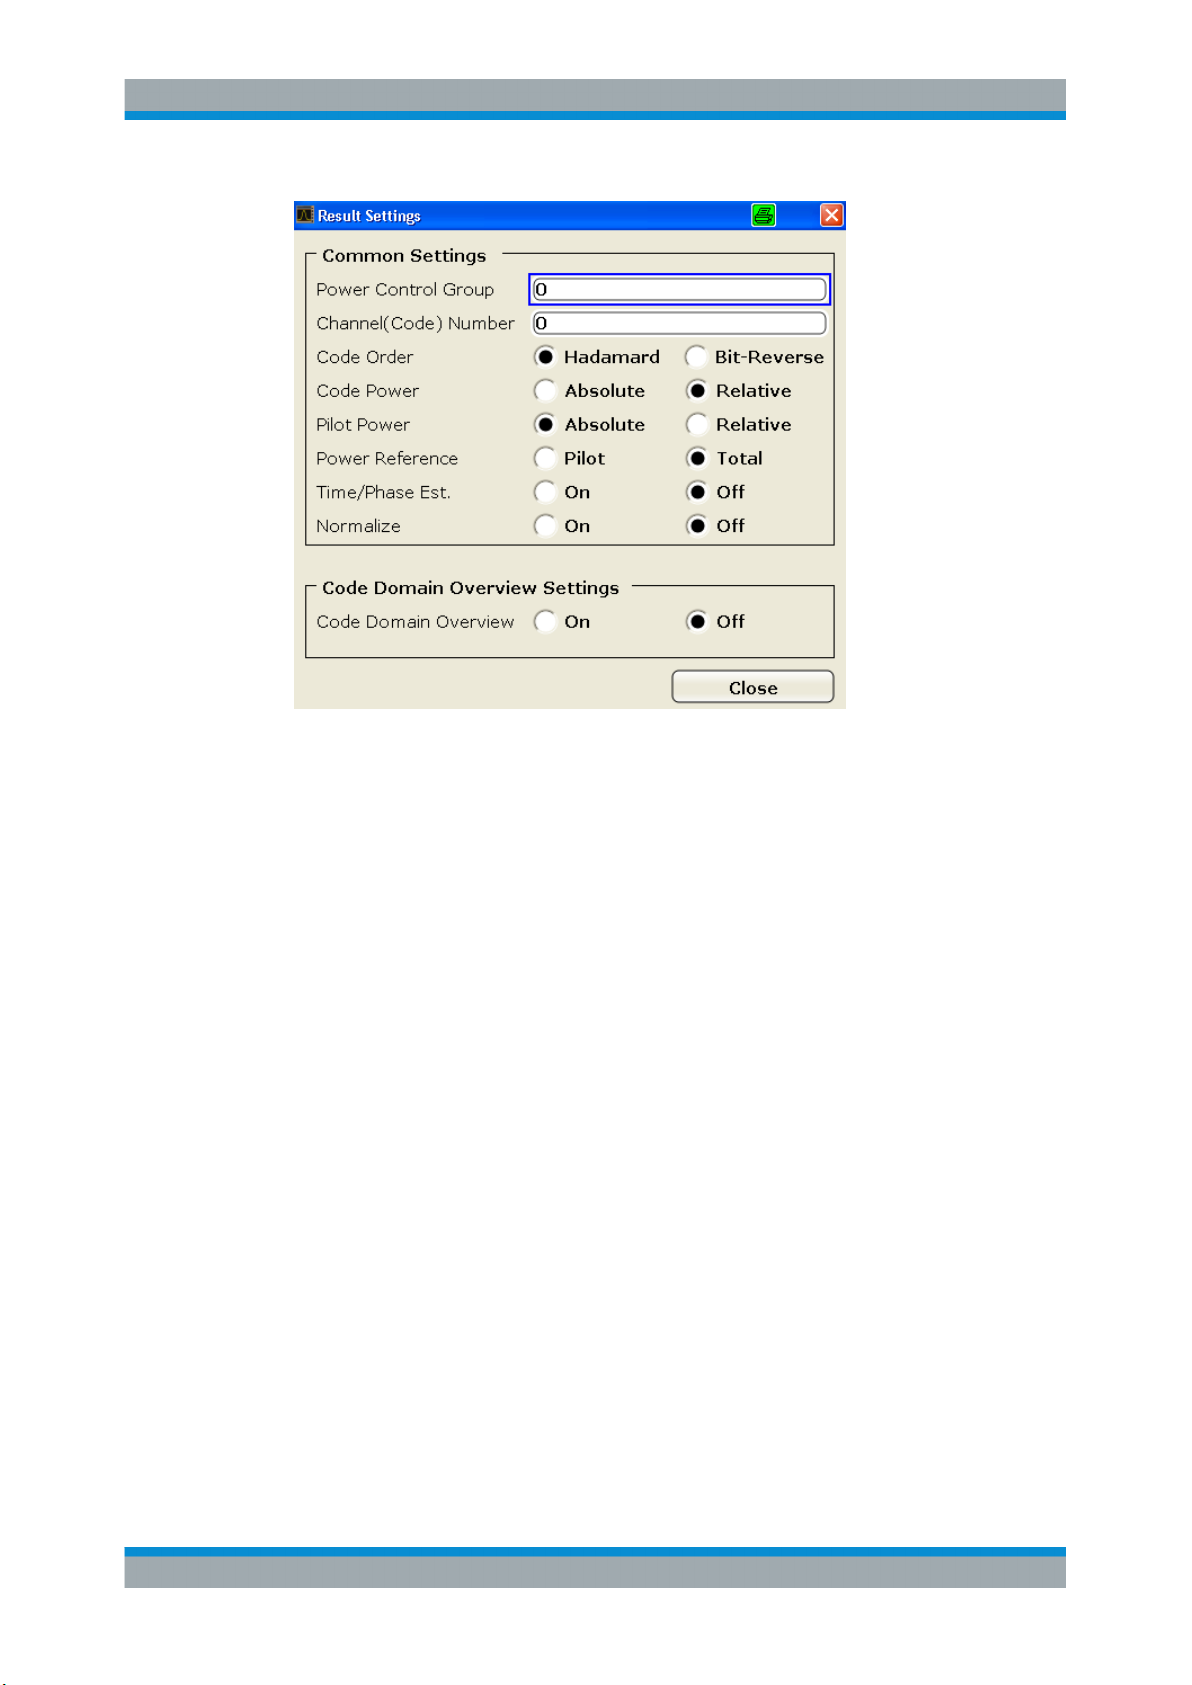
R&S® FSV-K82/-K83
Instrument Functions of the CDMA2000 Analysis
Menu and Softkey Description for CDA Measurements
Power Control Group ← Result Settings
In some measurements it is possible to highlight the data of a specific PCG. Select the
PCG on which to put the focus on in this field. The range of the value depends on the
"Capture Length" on page 64 defined in the IQ Capture Settings dialog box. Therefore
the range is (0 to Capture Length-1).
The defined value is valid for any measurement which takes PCGs into account (for
further information see also the "Select" on page 79 softkey). The selected PCG is
highlighted in red on the screen (as opposed to the others which are displayed in yellow).
Remote command:
[SENSe:]CDPower:SLOT on page 261
Channel (Code) Number ← Result Settings
The entry in this field corresponds to a specific code to be examined. The valid range
is from 0 to BSF-1. The base spreading factor (BSF) is either 64 or 128 depending on
the setting of the "Base Spreading Factor" on page 70 field. It can not be edited via this
field. The selected channel is marked red in the Channel Table. In the Code Domain
Power display and the Code Domain Error Power display, all codes belonging to this
channel are marked red.
The defined value is valid for any measurement that takes a selected channel into
account. For further information see the "Select" on page 79 softkey.
The rotary knob behavior depends on the result display and the graphic display:
●
in the Code Domain Power and Code Domain Error result displays, the rotary knob
always selects the adjacent channel. The position of the adjacent channel in the
diagram depends on the "Code Order" on page 76.
75Operating Manual 1176.7626.02 ─ 04.1
Page 76
R&S® FSV-K82/-K83
●
Remote command:
[SENSe:]CDPower:CODE on page 254
Code Order ← Result Settings
Sets the sorting of the channels for the Code Domain Power and Code Domain Error
result displays.
Hadamard order: By default, the codes are sorted in Hadamard order, i.e. in ascending
Bit-Reverse order: Bundles the channels with concentrated codes, i.e. all codes of a channel
Instrument Functions of the CDMA2000 Analysis
Menu and Softkey Description for CDA Measurements
in the Channel Table result display, the rotary knob is used to scroll through the
list.
order.
You can see the power of each code in this way; there is no distinction
between channels apparent. If there is a channel covering several codes,
the display shows the individual power of each code.
Example (for base spreading factor of 64):
0.64, 1.64, 2.64, …, 63.64.
are next to one another. In this way you can see the total power of a concentrated channel.
Example (for base spreading factor of 64):
0.64, 32.64, 16.64, 48.64, 8.64, 40.64, …, 15.64, 47.64,31.64, 63.64
For further details on the code order refer to the Hadamard and BitReverse Code
Tables in the Appendix on page.
Remote command:
[SENSe:]CDPower:ORDer on page 257
Code Power ← Result Settings
Selects the y-axis scaling for the Code Domain Power result display.
●
Absolute scaling shows the code power in dBm.
●
Relative scaling shows the code power in dB.
You can set the reference in the "Power Reference" on page 76 field.
Remote command:
CALCulate<n>:FEED on page 186
Pilot Power (MS mode only) ← Result Settings
Displays the pilot power in absolute or relative values.
Remote command:
[SENSe:]CDPower:PPReference on page 259
Power Reference ← Result Settings
Determines the reference power for relative power measurements.
Pilot Channel By default, the reference power is the power of the pilot channel. Which
pilot channel is used as the reference depends on the "Antenna Diversity"
on page 72.
Total Power The power is measured over one PCG. The reference power is the total
power of the signal for the corresponding PCG.
76Operating Manual 1176.7626.02 ─ 04.1
Page 77

R&S® FSV-K82/-K83
By default, the power of the channels is referred to the power of the pilot channel (code
number 0). The power of the pilot channel is identical over all PCGs. Therefore it can
be used as a constant reference for the result display. In contrast, the total power can
vary from PCG to PCG due to the possibility of a power level change in the different
code channels.
In the Power vs PCG result display, with enabled power control and reference to the
total power of the signal, the power control of the selected channel is not necessarily
reflected.
Example (theoretical):
There is just one data channel in the signal and its power is controlled.
The power is referred to the total power of the signal (which consists only of the contri-
bution from this one data channel).
In the Power vs. PCG diagram, a straight line is displayed instead of the expected
power staircase.
For relative result displays, the reference value Total Power is therefore only meaning-
ful if the signal does not contain power control. For signals with enabled power control,
use the Pilot Channel setting, since the pilot channel is not subject to power control
under any circumstances.
Remote command:
[SENSe:]CDPower:PREFerence on page 259
Instrument Functions of the CDMA2000 Analysis
Menu and Softkey Description for CDA Measurements
Time/Phase Estimation ← Result Settings
Actives or deactivates the timing and phase offset calculation of the channels as to the
pilot channel. If deactivated or more than 50 active channels are in the signal, the calculation does not take place and dashes instead of values are displayed as results.
Remote command:
[SENSe:]CDPower:TPMeas on page 261
Normalize ← Result Settings
Activate this parameter to eliminate the DC offset from the signal. By default, the
parameter is deactivated.
Remote command:
[SENSe:]CDPower:TPMeas on page 261
Code Domain Overview (MS mode only) ← Result Settings
If enabled, both branches are displayed at once for a code domain power measurement (see chapter 6.1, "Measurements and Result Displays", on page 35). Otherwise,
only the selected branch and the result summary are displayed.
Remote command:
[SENSe:]CDPower:OVERview on page 258
Display Config
This softkey opens the "Display Config" dialog box to select the result display configuration.
The Code Domain Analyzer provides the following result display configurations for
measurements in the code domain:
77Operating Manual 1176.7626.02 ─ 04.1
Page 78
R&S® FSV-K82/-K83
Result Display Configuration Definition
Code Domain Power Code Domain Power result display in relative or absolute scal-
Channel Table Channel occupancy table
Power vs PCG Power of the selected channel versus all PCGs
Result Summary Results in a table
Code Domain Error Power Code Domain Error Power result display
Composite EVM (RMS) Averaged error between the test signal and the ideal reference
Peak Code Domain Error Projection of the maximum error between the test signal and the
Instrument Functions of the CDMA2000 Analysis
Menu and Softkey Description for CDA Measurements
ing
MS mode: only for the selected branch
MS mode: only for the selected branch
MS mode: only for the selected branch
signal
reference signal
MS mode: only for the selected branch
Channel Constellation Channel Constellation result display
EVM vs Symbol Error Vector Magnitude result display
Composite Constellation Composite Constellation result display
Power vs Symbol Power of the selected channel and of the selected PCG versus
all symbols
Channel Bitstream Display of demodulated bits
For details on the displayed results and default settings refer to chapter 6.1.3, "Code
Domain Analysis Results", on page 38.
You can configure the result displays via the "Result Settings" on page 74 dialog box.
78Operating Manual 1176.7626.02 ─ 04.1
Page 79
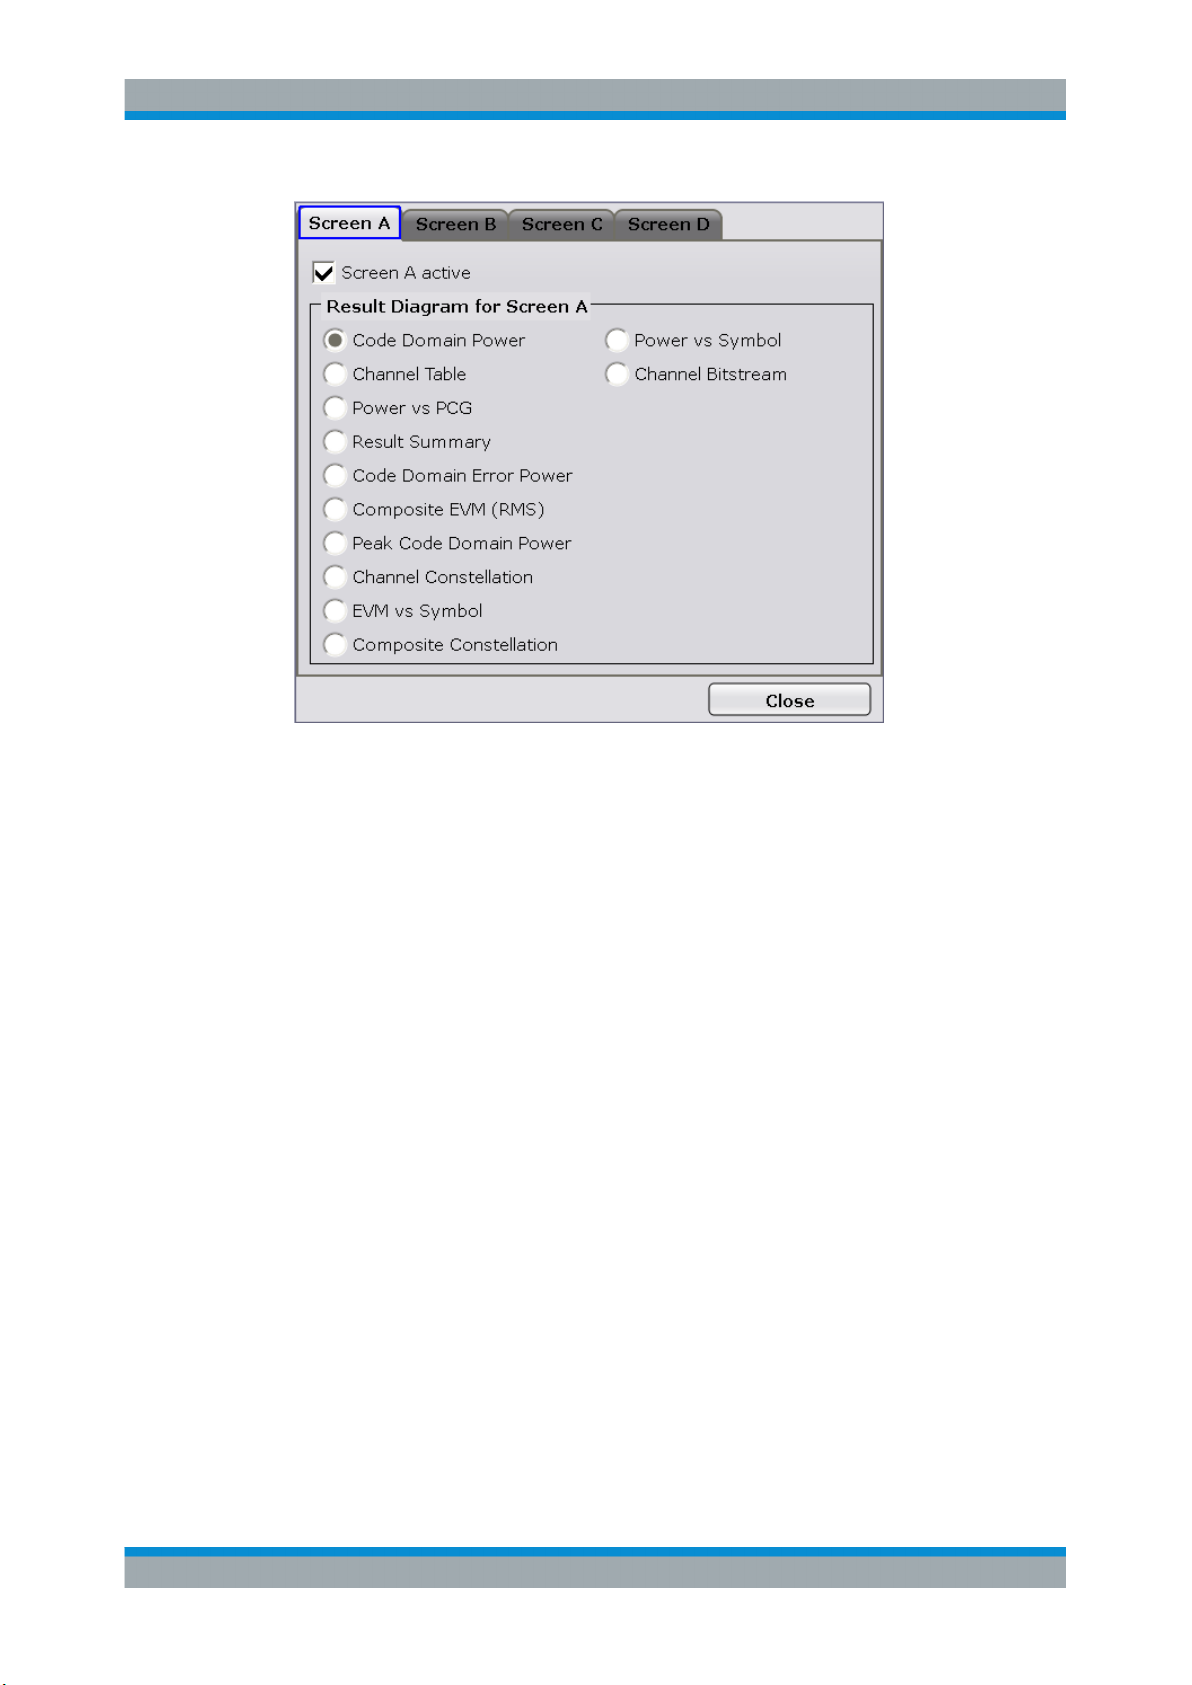
R&S® FSV-K82/-K83
Instrument Functions of the CDMA2000 Analysis
Menu and Softkey Description for CDA Measurements
The code domain analyzer can show up to four result diagrams in four different
screens (windows) at one time. For each screen, you can define which type of result
diagram is to be displayed, or deactivate the screen temporarily.
The current configuration of the display, i.e. which screens are displayed and which
result diagram is displayed in which screen, can be stored and retrieved later. Thus,
you can easily switch between predefined display configurations.
For details see chapter 6.1.2, " Configuring the Display", on page 37.
Select
Opens a dialog box to select a specific channel, PCG or branch (MS mode only). The
results of that channel/PCG/branch are then shown in the result display.
For details on the effects of this softkey, refer to "Channel (Code) Number" on page 75
and "Power Control Group" on page 75.
For the following measurements an evaluation on PCG level is possible:
●
chapter 6.1.3.1, "Code Domain Power", on page 38
●
chapter 6.1.3.2, "Channel Table", on page 40
●
chapter 6.1.3.4, "Result Summary", on page 42
●
chapter 6.1.3.5, "Code Domain Error Power", on page 44
●
chapter 6.1.3.8, "Channel Constellation", on page 47
●
chapter 6.1.3.9, "EVM vs Symbol", on page 48
●
chapter 6.1.3.10, "Composite Constellation", on page 49
●
chapter 6.1.3.11, "Power vs Symbol", on page 50
●
chapter 6.1.3.12, "Channel Bitstream", on page 50
For the following measurements an evaluation on channel level is possible:
●
chapter 6.1.3.3, "Power vs PCG", on page 41
●
chapter 6.1.3.4, "Result Summary", on page 42
●
chapter 6.1.3.8, "Channel Constellation", on page 47
79Operating Manual 1176.7626.02 ─ 04.1
Page 80

R&S® FSV-K82/-K83
●
●
●
Remote command:
[SENSe:]CDPower:CODE on page 254
[SENSe:]CDPower:SLOT on page 261
[SENSe:]CDPower:MAPPing on page 255
Instrument Functions of the CDMA2000 Analysis
Menu and Softkey Description for CDA Measurements
chapter 6.1.3.9, "EVM vs Symbol", on page 48
chapter 6.1.3.11, "Power vs Symbol", on page 50
chapter 6.1.3.12, "Channel Bitstream", on page 50
6.2.2 Softkeys of the Frequency Menu
The following chapter describes all softkeys available in the "Frequency" menu in
"CDMA2000 Analysis" for CDA measurements.
For RF measurements, see the description of the "Frequency" menu for the base unit.
Center........................................................................................................................... 80
CF Stepsize...................................................................................................................80
Frequency Offset...........................................................................................................80
Center
Opens an edit dialog box to enter the center frequency. The allowed range of values
for the center frequency depends on the frequency span.
span > 0: span
span = 0: 0 Hz ≤ f
f
and span
max
/2 ≤ f
min
center
are specified in the data sheet.
min
center
≤ f
max
≤ f
max
– span
Remote command:
[SENSe:]FREQuency:CENTer on page 280
CF Stepsize
Opens an edit dialog box to enter a fixed step size for the center frequency.
The step size defines the value by which the center frequency is increased or
decreased when the arrow keys are pressed. When you use the rotary knob, the center frequency changes in steps of 10% of the "Center Frequency Stepsize".
This softkey is available for code domain and power vs time measurements.
Remote command:
[SENSe:]FREQuency:CENTer:STEP on page 281
min
/2
Frequency Offset
Opens an edit dialog box to enter a frequency offset that shifts the displayed frequency
range by the specified offset.
The softkey indicates the current frequency offset. The allowed values range from
-100 GHz to 100 GHz. The default setting is 0 Hz.
Remote command:
[SENSe:]FREQuency:OFFSet on page 282
80Operating Manual 1176.7626.02 ─ 04.1
Page 81

R&S® FSV-K82/-K83
Instrument Functions of the CDMA2000 Analysis
Menu and Softkey Description for CDA Measurements
6.2.3 Softkeys of the Amplitude Menu
The following chapter describes all softkeys available in the "Amplitude" menu in
"CDMA2000 BTS Analysis" mode for CDA measurements. For RF measurements, see
chapter 6.3.4, "Softkeys of the Amplitude Menu", on page 131.
Ref Level.......................................................................................................................81
Scale............................................................................................................................. 81
└ Auto Scale Once.............................................................................................81
└ Y-Axis Maximum.............................................................................................81
└ Y-Axis Minimum..............................................................................................82
Ref Level Offset............................................................................................................ 82
Preamp On/Off..............................................................................................................82
RF Atten Manual/Mech Att Manual............................................................................... 82
RF Atten Auto/Mech Att Auto........................................................................................82
El Atten On/Off..............................................................................................................83
El Atten Mode (Auto/Man).............................................................................................83
Input (AC/DC)................................................................................................................84
Ref Level
Opens an edit dialog box to enter the reference level in the current unit (dBm, dBµV,
etc).
The reference level is the maximum value the AD converter can handle without distortion of the measured value. Signal levels above this value will not be measured correctly, which is indicated by the "IFOVL" status display.
Remote command:
DISPlay[:WINDow<n>]:TRACe<t>:Y[:SCALe]:RLEVel on page 249
Scale
Opens a submenu to define the amplitude scaling type.
This softkey and its submenu is available for code domain measurements in BTS
mode (K82).
Auto Scale Once ← Scale
Automatically scales the y-axis of the grid of the selected screen with respect to the
measured data.
The softkey is available for code domain measurements.
Remote command:
DISPlay[:WINDow<n>]:TRACe<t>:Y[:SCALe]:AUTO on page 248
Y-Axis Maximum ← Scale
Opens a dialog box to set the maximum value for the y-axis of the grid of the selected
screen.
The softkey is available for code domain measurements.
Remote command:
DISPlay[:WINDow<n>]:TRACe<t>:Y[:SCALe]:MAXimum on page 251
81Operating Manual 1176.7626.02 ─ 04.1
Page 82

R&S® FSV-K82/-K83
Y-Axis Minimum ← Scale
Opens a dialog box to set the minimum value for the y-axis of the grid of the selected
screen.
The softkey is available for code domain measurements.
Remote command:
DISPlay[:WINDow<n>]:TRACe<t>:Y[:SCALe]:MINimum on page 252
Ref Level Offset
Opens an edit dialog box to enter the arithmetic level offset. This offset is added to the
measured level irrespective of the selected unit. The scaling of the y-axis is changed
accordingly. The setting range is ±200 dB in 0.1 dB steps.
Remote command:
DISPlay[:WINDow<n>]:TRACe<t>:Y[:SCALe]:RLEVel:OFFSet on page 250
Preamp On/Off
Switches the preamplifier on and off.
If option R&S FSV-B22 is installed, the preamplifier is only active below 7 GHz.
Instrument Functions of the CDMA2000 Analysis
Menu and Softkey Description for CDA Measurements
If option R&S FSV-B24 is installed, the preamplifier is active for all frequencies.
This function is not available for input from the R&S Digital I/Q Interface (option
R&S FSV-B17).
Remote command:
INPut:GAIN:STATe on page 316
RF Atten Manual/Mech Att Manual
Opens an edit dialog box to enter the attenuation, irrespective of the reference level. If
electronic attenuation is activated (option R&S FSV-B25 only; "El Atten Mode Auto"
softkey), this setting defines the mechanical attenuation.
The mechanical attenuation can be set in 10 dB steps.
The RF attenuation can be set in 5 dB steps (with option R&S FSV-B25: 1 dB steps).
The range is specified in the data sheet. If the current reference level cannot be set for
the set RF attenuation, the reference level is adjusted accordingly.
This function is not available for input from the R&S Digital I/Q Interface (option
R&S FSV-B17).
The RF attenuation defines the level at the input mixer according to the formula:
level
mixer
= level
– RF attenuation
input
Note: As of firmware version 1.63, the maximum mixer level allowed is 0 dBm. Mixer
levels above this value may lead to incorrect measurement results, which are indicated
by the "OVLD" status display. The increased mixer level allows for an improved signal,
but also increases the risk of overloading the instrument!
Remote command:
INPut:ATTenuation on page 311
RF Atten Auto/Mech Att Auto
Sets the RF attenuation automatically as a function of the selected reference level.
This ensures that the optimum RF attenuation is always used. It is the default setting.
82Operating Manual 1176.7626.02 ─ 04.1
Page 83

R&S® FSV-K82/-K83
This function is not available for input from the R&S Digital I/Q Interface (option
R&S FSV-B17).
Remote command:
INPut:ATTenuation:AUTO on page 311
El Atten On/Off
This softkey switches the electronic attenuator on or off. This softkey is only available
with option R&S FSV-B25.
When the electronic attenuator is activated, the mechanical and electronic attenuation
can be defined separately. Note however, that both parts must be defined in the same
mode, i.e. either both manually, or both automatically.
This function is not available for input from the R&S Digital I/Q Interface (option
R&S FSV-B17).
●
●
Note: This function is not available for stop frequencies (or center frequencies in zero
span) >7 GHz. In this case, the electronic and mechanical attenuation are summarized
and the electronic attenuation can no longer be defined individually. As soon as the
stop or center frequency is reduced below 7 GHz, this function is available again.
When the electronic attenuator is switched off, the corresponding RF attenuation mode
(auto/manual) is automatically activated.
Remote command:
INPut:EATT:AUTO on page 316
Instrument Functions of the CDMA2000 Analysis
Menu and Softkey Description for CDA Measurements
To define the mechanical attenuation, use the RF Atten Manual/Mech Att Manual
or RF Atten Auto/Mech Att Auto softkeys.
To define the electronic attenuation, use the El Atten Mode (Auto/Man) softkey.
El Atten Mode (Auto/Man)
This softkey defines whether the electronic attenuator value is to be set automatically
or manually. If manual mode is selected, an edit dialog box is opened to enter the
value. This softkey is only available with option R&S FSV-B25, and only if the electronic attenuator has been activated via the El Atten On/Off softkey.
Note: This function is not available for stop frequencies (or center frequencies in zero
span) >7 GHz. In this case, the electronic and mechanical attenuation are summarized
and the electronic attenuation can no longer be defined individually. As soon as the
stop or center frequency is reduced below 7 GHz, electronic attenuation is available
again. If the electronic attenuation was defined manually, it must be re-defined.
The attenuation can be varied in 1 dB steps from 0 to 30 dB. Other entries are rounded
to the next lower integer value.
To re-open the edit dialog box for manual value definition, select the "Man" mode
again.
If the defined reference level cannot be set for the given RF attenuation, the reference
level is adjusted accordingly and the warning "Limit reached" is output.
Remote command:
INPut:EATT:AUTO on page 316
INPut:EATT on page 315
83Operating Manual 1176.7626.02 ─ 04.1
Page 84

R&S® FSV-K82/-K83
Input (AC/DC)
Toggles the RF input of the R&S FSVR between AC and DC coupling.
This function is not available for input from the R&S Digital I/Q Interface (option
R&S FSV-B17).
Remote command:
INPut:COUPling on page 311
Instrument Functions of the CDMA2000 Analysis
Menu and Softkey Description for CDA Measurements
6.2.4 Softkeys of the Sweep Menu
The following chapter describes all softkeys available in the "Sweep" menu in
"CDMA2000 BTS Analysis" mode for CDA measurements. For RF measurements, see
chapter 6.3.6, "Softkeys of the Sweep Menu", on page 144.
Continuous Sweep........................................................................................................84
Single Sweep................................................................................................................ 84
Continue Single Sweep.................................................................................................84
Sweep Count.................................................................................................................84
Continuous Sweep
Sets the continuous sweep mode: the sweep takes place continuously according to the
trigger settings. This is the default setting.
The trace averaging is determined by the sweep count value (see the "Sweep Count"
softkey, "Sweep Count" on page 84).
Remote command:
INIT:CONT ON, see INITiate<n>:CONTinuous on page 323
Single Sweep
Sets the single sweep mode: after triggering, starts the number of sweeps that are
defined by using the Sweep Count softkey. The measurement stops after the defined
number of sweeps has been performed.
Remote command:
INIT:CONT OFF, see INITiate<n>:CONTinuous on page 323
Continue Single Sweep
Repeats the number of sweeps set by using the Sweep Count softkey, without deleting
the trace of the last measurement.
This is particularly of interest when using the trace configurations "Average" or "Max
Hold" to take previously recorded measurements into account for averaging/maximum
search.
Remote command:
INITiate<n>:CONMeas on page 322
Sweep Count
Opens an edit dialog box to enter the number of sweeps to be performed in the single
sweep mode. Values from 0 to 32767 are allowed. If the values 0 or 1 are set, one
sweep is performed. The sweep count is applied to all the traces in a diagram.
84Operating Manual 1176.7626.02 ─ 04.1
Page 85

R&S® FSV-K82/-K83
If the trace configurations "Average", "Max Hold" or "Min Hold" are set, the sweep
count value also determines the number of averaging or maximum search procedures.
In continuous sweep mode, if sweep count = 0 (default), averaging is performed over
10 sweeps. For sweep count =1, no averaging, maxhold or minhold operations are performed.
Remote command:
[SENSe:]SWEep:COUNt on page 294
Instrument Functions of the CDMA2000 Analysis
Menu and Softkey Description for CDA Measurements
6.2.5 Softkeys of the Trigger Menu for CDA measurements
The following chapter describes all softkeys available in the "Trigger" menu for CDA
measurements.
For RF measurements, see the description for the base unit.
Trigger Source Free Run.............................................................................................. 85
Trigger Source External................................................................................................ 85
Frequency Mask............................................................................................................85
Trigger Polarity..............................................................................................................86
Trigger Offset................................................................................................................ 86
Trigger Source Free Run
The start of a sweep is not triggered. Once a measurement is completed, another is
started immediately.
For further details refer to the "Trigger Source" field in the "IQ Capture Settings" dialog
box.
This softkey is available for code domain measurements.
Remote command:
TRIG:SOUR IMM, see TRIGger<n>[:SEQuence]:SOURce on page 320
Trigger Source External
Defines triggering via a TTL signal at the "EXT TRIG/GATE IN" input connector on the
rear panel.
An edit dialog box is displayed to define the external trigger level.
For further details refer to the "Trigger Source" field in the "IQ Capture Settings" dialog
box.
This softkey is available for code domain measurements.
Remote command:
TRIG:SOUR EXT, see TRIGger<n>[:SEQuence]:SOURce on page 320
Frequency Mask
Activates the frequency mask trigger and opens the dialog box to set up a frequency
mask for the frequency mask trigger.
85Operating Manual 1176.7626.02 ─ 04.1
Page 86

R&S® FSV-K82/-K83
For more information see chapter 6.4.3, "Working with the Frequency Mask Trigger",
on page 156.
Remote command:
see chapter 7.2.3.5, "CALCulate:MASK Subsystem", on page 222
Trigger Polarity
Sets the polarity of the trigger source.
The sweep starts after a positive or negative edge of the trigger signal. The default set-
ting is "Pos". The setting applies to all modes with the exception of the "Free Run" and
"Time" mode.
This softkey is available for code domain measurements.
"Pos"
"Neg"
Remote command:
TRIGger<n>[:SEQuence]:SLOPe on page 320
[SENSe:]SWEep:EGATe:POLarity on page 295
Instrument Functions of the CDMA2000 Analysis
Menu and Softkey Description for CDA Measurements
Level triggering: the sweep is stopped by the logic "0" signal and
restarted by the logical "1" signal after the gate delay time has
elapsed.
Edge triggering: the sweep is continued on a "0" to "1" transition for
the gate length duration after the gate delay time has elapsed.
Trigger Offset
Opens an edit dialog box to enter the time offset between the trigger signal and the
start of the sweep.
offset > 0: Start of the sweep is delayed
offset < 0: Sweep starts earlier (pre-trigger)
Only possible for span = 0 (e.g. I/Q Analyzer mode) and gated trigger
switched off
Maximum allowed range limited by the sweep time:
pretrigger
When using the R&S Digital I/Q Interface (R&S FSV-B17) with I/Q Analyzer mode, the maximum range is limited by the number of pretrigger
samples.
See the R&S Digital I/Q Interface(R&S FSV-B17) description in the base
unit.
= sweep time
max
In the "External" or "IF Power" trigger mode, a common input signal is used for both
trigger and gate. Therefore, changes to the gate delay will affect the trigger delay (trigger offset) as well.
Remote command:
TRIGger<n>[:SEQuence]:HOLDoff[:TIME] on page 319
6.2.6 Softkeys of the Trace Menu for CDA Measurements
The following chapter describes all softkeys available in the "Trace" menu in
"CDMA2000 BTS Analysis" Mode for Code Domain Analysis measurements.
86Operating Manual 1176.7626.02 ─ 04.1
Page 87

R&S® FSV-K82/-K83
For RF measurements, see the description for the base unit.
Clear Write.................................................................................................................... 87
Max Hold.......................................................................................................................87
Min Hold........................................................................................................................87
Average.........................................................................................................................87
View.............................................................................................................................. 88
Clear Write
Overwrite mode: the trace is overwritten by each sweep. This is the default setting.
All available detectors can be selected.
Remote command:
DISP:TRAC:MODE WRIT, see DISPlay[:WINDow<n>]:TRACe<t>:MODE
on page 246
Max Hold
The maximum value is determined over several sweeps and displayed. The
R&S FSVR saves the sweep result in the trace memory only if the new value is greater
than the previous one.
The detector is automatically set to "Positive Peak".
This mode is especially useful with modulated or pulsed signals. The signal spectrum
is filled up upon each sweep until all signal components are detected in a kind of envelope.
This mode is not available for statistics measurements.
Remote command:
DISP:TRAC:MODE MAXH, see DISPlay[:WINDow<n>]:TRACe<t>:MODE
on page 246
Instrument Functions of the CDMA2000 Analysis
Menu and Softkey Description for CDA Measurements
Min Hold
The minimum value is determined from several measurements and displayed. The
R&S FSVR saves the smallest of the previously stored/currently measured values in
the trace memory.
The detector is automatically set to "Negative Peak".
This mode is useful e.g. for making an unmodulated carrier in a composite signal visi-
ble. Noise, interference signals or modulated signals are suppressed whereas a CW
signal is recognized by its constant level.
This mode is not available for statistics measurements.
Remote command:
DISP:TRAC:MODE MINH, see DISPlay[:WINDow<n>]:TRACe<t>:MODE
on page 246
Average
The average is formed over several sweeps. The Sweep Count determines the number
of averaging procedures.
All available detectors can be selected. If the detector is automatically selected, the
sample detector is used (see chapter 6.4.4, "Detector Overview", on page 160).
87Operating Manual 1176.7626.02 ─ 04.1
Page 88

R&S® FSV-K82/-K83
This mode is not available for statistics measurements.
Remote command:
DISP:TRAC:MODE AVER, see DISPlay[:WINDow<n>]:TRACe<t>:MODE
on page 246
View
The current contents of the trace memory are frozen and displayed.
Note: If a trace is frozen, the instrument settings, apart from level range and reference
level (see below), can be changed without impact on the displayed trace. The fact that
the displayed trace no longer matches the current instrument setting is indicated by the
If the level range or reference level is changed, the R&S FSVR automatically adapts
the measured data to the changed display range. This allows an amplitude zoom to be
made after the measurement in order to show details of the trace.
Remote command:
DISP:TRAC:MODE VIEW, see DISPlay[:WINDow<n>]:TRACe<t>:MODE
on page 246
Instrument Functions of the CDMA2000 Analysis
Menu and Softkey Description for CDA Measurements
icon on the tab label.
6.2.7 Softkeys of the Marker Menu for CDA Measurements
The following chapter describes all softkeys available in the "Marker" menu for CDA
measurements. For RF measurements, see chapter 6.3.7, "Softkeys of the Marker
Menu for RF Measurements", on page 147.
Marker 1/2/3/4...............................................................................................................88
Marker Norm/Delta........................................................................................................89
All Marker Off................................................................................................................ 89
Marker 1/2/3/4
Selects the corresponding marker and activates it.
Marker 1 is always a normal marker. After Marker 2 to 4 have been switched on, they
are delta markers that are referenced to Marker 1. These markers can be converted
into markers with absolute value displays using the "Marker Norm/Delta" softkey.
When Marker 1 is the active marker, pressing the "Marker Norm/Delta" softkey
switches on an additional delta marker. Pressing the "Marker 1" to "Marker 4" softkey
again switches the corresponding marker off.
For the Channel Bitstream measurement only one marker (Marker 1) is available. It
can be used for scrolling and to display the number and value of a bit.
Remote command:
CALCulate<n>:MARKer<m>[:STATe] on page 218
CALCulate<n>:MARKer<m>:X on page 220
CALCulate<n>:MARKer<m>:Y on page 221
CALCulate<n>:DELTamarker<m>[:STATe] on page 201
CALCulate<n>:DELTamarker<m>:X on page 202
CALCulate<n>:DELTamarker<m>:X:RELative? on page 202
CALCulate<n>:DELTamarker<m>:Y on page 203
88Operating Manual 1176.7626.02 ─ 04.1
Page 89

R&S® FSV-K82/-K83
Marker Norm/Delta
Changes the active marker to a normal (norm) or delta marker (with respect to marker
1).
Remote command:
CALCulate<n>:MARKer<m>[:STATe] on page 218
CALCulate<n>:DELTamarker<m>[:STATe] on page 201
All Marker Off
Switches all markers off. It also switches off all functions and displays that are associated with the markers/delta markers.
Remote command:
CALCulate<n>:MARKer<m>:AOFF on page 215
Instrument Functions of the CDMA2000 Analysis
Menu and Softkey Description for CDA Measurements
6.2.8 Softkeys of the Marker To Menu
The following chapter describes all softkeys available in the "Marker To" menu in
"CDMA2000 BTS Analysis" mode for CDA measurements.
For RF measurements, see the description for the base unit.
Select 1/2/3/4/∆.............................................................................................................89
Peak..............................................................................................................................89
Next Peak......................................................................................................................90
Next Peak Mode............................................................................................................90
F-PICH (BTS mode only).............................................................................................. 90
F-TDPICH (BTS mode only)......................................................................................... 90
PICH (MS mode only)................................................................................................... 90
Min................................................................................................................................ 91
Next Min........................................................................................................................91
Next Min Mode..............................................................................................................91
Center =Mkr Freq (span > 0).........................................................................................91
Select 1/2/3/4/∆
Selects the normal marker or the delta marker and activates the marker. "∆" stands for
delta marker 1.
CALCulate<n>:MARKer<m>[:STATe] on page 218
CALCulate<n>:MARKer<m>:X on page 220
CALCulate<n>:MARKer<m>:Y on page 221
Peak
Sets the active marker/delta marker to the highest maximum of the trace.
Remote command:
CALCulate<n>:MARKer<m>:MAXimum[:PEAK] on page 216
89Operating Manual 1176.7626.02 ─ 04.1
Page 90

R&S® FSV-K82/-K83
Next Peak
Sets the active marker/delta marker to the next maximum of the selected trace.
Remote command:
CALCulate<n>:MARKer<m>:MAXimum:NEXT on page 216
CALCulate<n>:DELTamarker<m>:MAXimum:NEXT on page 198
Next Peak Mode
Selects the mode of the Next Peak softkey.
This softkey is available for code domain measurements.
Three settings are available:
"<"
"abs"
">"
Remote command:
CALC:MARK:MAX:LEFT (<): CALCulate<n>:MARKer<m>:MAXimum:LEFT
on page 215
CALCulate<n>:DELTamarker<m>:MAXimum:LEFT on page 198
CALC:MARK:MAX:RIGH (>): CALCulate<n>:MARKer<m>:MAXimum:RIGHt
on page 216
CALCulate<n>:DELTamarker<m>:MAXimum:RIGHt on page 199
CALC:DELT:MAX:NEXT (abs): CALCulate<n>:MARKer<m>:MAXimum:NEXT
on page 216
CALCulate<n>:DELTamarker<m>:MAXimum:NEXT on page 198
Instrument Functions of the CDMA2000 Analysis
Menu and Softkey Description for CDA Measurements
Sets the active marker/delta marker to the next maximum left to the
marker of the selected trace.
Sets the active marker/delta marker to the next lower maximum of the
selected trace.
Sets the active marker/delta marker to the next maximum right to the
marker of the selected trace.
F-PICH (BTS mode only)
Sets the marker to the F-PICH channel. The softkey is only available if the x-axis of the
active screen is a code axis.
This softkey is available for code domain measurements.
CALCulate<n>:MARKer<m>:FUNCtion:PICH on page 190
F-TDPICH (BTS mode only)
Sets the marker to the F-TDPICH channel. The softkey is only available if the x-axis of
the active screen is a code axis.
This softkey is available for code domain measurements.
CALCulate<n>:MARKer<m>:FUNCtion:TDPIch on page 194
PICH (MS mode only)
Sets the marker to the PICH channel. The softkey is only available if the x-axis of the
active screen is a code axis.
This softkey is available for code domain measurements.
CALCulate<n>:MARKer<m>:FUNCtion:PICH on page 190
90Operating Manual 1176.7626.02 ─ 04.1
Page 91

R&S® FSV-K82/-K83
Min
Sets the active marker/delta marker to the minimum of the selected trace.
Remote command:
CALCulate<n>:MARKer<m>:MINimum[:PEAK] on page 218
Next Min
Sets the active marker/delta marker to the next minimum of the selected trace.
Remote command:
CALCulate<n>:MARKer<m>:MINimum:NEXT on page 217
CALCulate<n>:DELTamarker<m>:MINimum:NEXT on page 200
Next Min Mode
Sets the mode for the Next Min softkey.
This softkey is available for code domain measurements.
Three settings are available:
"<"
"abs"
">"
Remote command:
CALC:MARK:MIN:LEFT (>): CALCulate<n>:MARKer<m>:MINimum:LEFT
on page 217
CALCulate<n>:DELTamarker<m>:MINimum:LEFT on page 199
CALC:MARK:MIN:RIGH (>): CALCulate<n>:MARKer<m>:MINimum:RIGHt
on page 218
CALCulate<n>:DELTamarker<m>:MINimum:RIGHt on page 200
CALC:MARK:MIN:NEXT (abs): CALCulate<n>:MARKer<m>:MINimum:NEXT
on page 217
CALCulate<n>:DELTamarker<m>:MINimum:NEXT on page 200
Instrument Functions of the CDMA2000 Analysis
Menu and Softkey Description for CDA Measurements
Sets the active marker/delta marker to the next minimum left to the
marker of the selected trace.
Sets the active marker/delta marker to the next higher minimum of
the selected trace.
Sets the active marker/delta marker to the next minimum right to the
marker of the selected trace.
Center =Mkr Freq (span > 0)
Sets the center frequency to the current marker or delta marker frequency. A signal
can thus be set to as center frequency, for example to examine it in detail with a
smaller span.
This softkey is available for RF measurements.
Remote command:
CALCulate<n>:MARKer<m>:FUNCtion:CENTer on page 190
6.2.9 Softkeys of the Auto Set Menu
The following chapter describes all softkeys available in the "Auto Set" menu in
"CDMA2000 BTS Analysis" mode for CDA measurements.
91Operating Manual 1176.7626.02 ─ 04.1
Page 92

R&S® FSV-K82/-K83
Auto All..........................................................................................................................92
Auto Freq...................................................................................................................... 92
Auto Level..................................................................................................................... 92
Settings......................................................................................................................... 92
Auto All
Performs all automatic settings.
●
●
Remote command:
[SENSe:]ADJust:ALL on page 262
Auto Freq
Defines the center frequency and the reference level automatically by determining the
highest frequency level in the frequency span. This function uses the signal counter;
thus it is intended for use with sinusoidal signals.
This function is not available for input from the R&S Digital I/Q Interface (option
R&S FSV-B17).
Instrument Functions of the CDMA2000 Analysis
Menu and Softkey Description for CDA Measurements
└ Meas Time Manual......................................................................................... 92
└ Meas Time Auto..............................................................................................93
└ Upper Level Hysteresis...................................................................................93
└ Lower Level Hysteresis...................................................................................93
"Auto Freq" on page 92
"Auto Level" on page 92
Remote command:
[SENSe:]ADJust:FREQuency on page 264
Auto Level
Defines the optimal reference level for the current measurement automatically.
The measurement time for automatic leveling can be defined using the Settings soft-
key.
Remote command:
[SENSe:]ADJust:LEVel on page 264
Settings
Opens a submenu to define settings for automatic leveling.
Possible settings are:
●
"Meas Time Manual" on page 92
●
"Meas Time Auto" on page 93
Meas Time Manual ← Settings
Opens an edit dialog box to enter the duration of the level measurement in seconds.
The level measurement is used to determine the optimal reference level automatically
(see the "Auto Level" softkey, "Auto Level" on page 92). The default value is 1 ms.
Remote command:
[SENSe:]ADJust:CONFigure:LEVel:DURation on page 263
92Operating Manual 1176.7626.02 ─ 04.1
Page 93

R&S® FSV-K82/-K83
Meas Time Auto ← Settings
The level measurement is used to determine the optimal reference level automatically
(see the Auto Level softkey).
This softkey resets the level measurement duration for automatic leveling to the default
value of 100 ms.
Upper Level Hysteresis ← Settings
Defines an upper threshold the signal must exceed before the reference level is automatically adjusted when the "Auto Level" function is performed.
Remote command:
[SENSe:]ADJust:CONFiguration:HYSTeresis:UPPer on page 263
Lower Level Hysteresis ← Settings
Defines a lower threshold the signal must exceed before the reference level is automatically adjusted when the "Auto Level" function is performed.
Remote command:
[SENSe:]ADJust:CONFiguration:HYSTeresis:LOWer on page 262
Instrument Functions of the CDMA2000 Analysis
Menu and Softkey Description for CDA Measurements
6.2.10 Softkeys of the Input/Output Menu for CDA Measurements
The following chapter describes all softkeys available in the "Input/Output" menu for
CDA measurements. For RF measurements, see chapter 6.3.8, "Softkeys of the Input/
Output Menu for RF Measurements", on page 150.
Input (AC/DC)................................................................................................................93
Noise Source.................................................................................................................94
Signal Source................................................................................................................94
└ Input Path........................................................................................................94
└ Connected Device...........................................................................................94
└ Input Sample Rate.......................................................................................... 94
└ Full Scale Level...............................................................................................94
└ Level Unit........................................................................................................94
└ Adjust Reference Level to Full Scale Level.................................................... 95
Digital IQ Info................................................................................................................ 95
EXIQ..............................................................................................................................95
└ TX Settings..................................................................................................... 96
└ RX Settings.....................................................................................................96
└ Send To.......................................................................................................... 96
└ Firmware Update............................................................................................ 96
└ R&S Support...................................................................................................96
└ DigIConf..........................................................................................................96
Input (AC/DC)
Toggles the RF input of the R&S FSVR between AC and DC coupling.
This function is not available for input from the R&S Digital I/Q Interface (option
R&S FSV-B17).
Remote command:
INPut:COUPling on page 311
93Operating Manual 1176.7626.02 ─ 04.1
Page 94

R&S® FSV-K82/-K83
Noise Source
Switches the supply voltage for an external noise source on or off. For details on connectors refer to the R&S FSVR Quick Start Guide, "Front and Rear Panel" chapter.
Remote command:
DIAGnostic<n>:SERVice:NSOurce on page 321
Signal Source
Opens a dialog box to select the signal source.
For "Digital Baseband (I/Q)", the source can also be configured here.
Input Path ← Signal Source
Defines whether the "RF Radio Frequency" or the "Digital IQ" input path is used for
measurements. "Digital IQ" is only available if option R&S FSV-B17 (R&S Digital I/Q
Interface) is installed.
Note: Note that the input path defines the characteristics of the signal, which differ significantly between the RF input and digital input.
Remote command:
INPut:SELect on page 317
Instrument Functions of the CDMA2000 Analysis
Menu and Softkey Description for CDA Measurements
Connected Device ← Signal Source
Displays the name of the device connected to the optional R&S Digital I/Q Interface
(R&S FSV-B17) to provide Digital IQ input. The device name cannot be changed here.
The device name is unknown.
Remote command:
INPut:DIQ:CDEVice on page 312
Input Sample Rate ← Signal Source
Defines the sample rate of the digital I/Q signal source. This sample rate must correspond with the sample rate provided by the connected device, e.g. a generator.
Remote command:
INPut:DIQ:SRATe on page 314
Full Scale Level ← Signal Source
The "Full Scale Level" defines the level that should correspond to an I/Q sample with
the magnitude "1".
The level can be defined either in dBm or Volt.
Remote command:
INPut:DIQ:RANGe[:UPPer] on page 314
Level Unit ← Signal Source
Defines the unit used for the full scale level.
Remote command:
INPut:DIQ:RANGe[:UPPer]:UNIT on page 314
94Operating Manual 1176.7626.02 ─ 04.1
Page 95
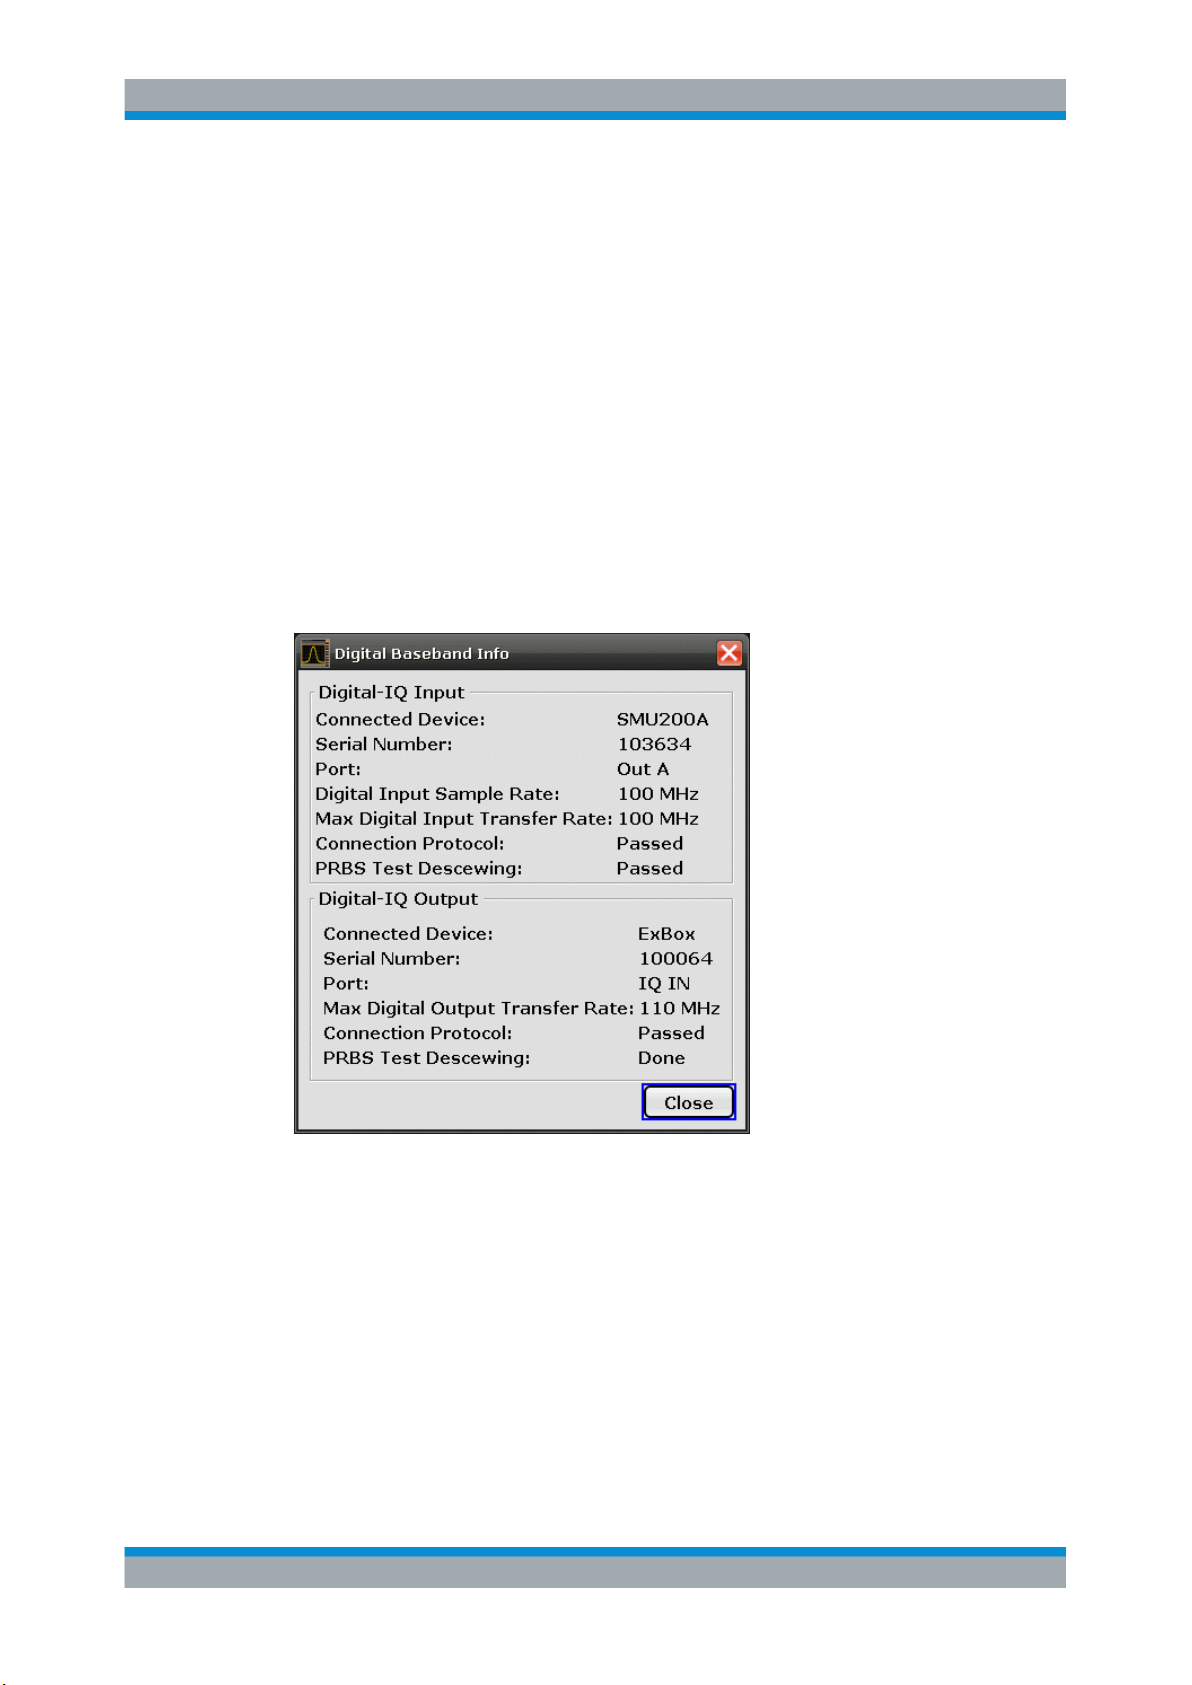
R&S® FSV-K82/-K83
Adjust Reference Level to Full Scale Level ← Signal Source
If enabled, the reference level is adjusted to the full scale level automatically if any
change occurs.
Remote command:
INPut:DIQ:RANGe:COUPling on page 313
Digital IQ Info
Displays a dialog box with information on the digital I/Q input and output connection via
the optional R&S Digital I/Q Interface (R&S FSV-B17), if available. The information
includes:
●
●
●
●
●
Instrument Functions of the CDMA2000 Analysis
Menu and Softkey Description for CDA Measurements
Device identification
Used port
(Maximum) digital input/output sample rates and maximum digital input/output
transfer rates
Status of the connection protocol
Status of the PRBS descewing test
For details see "Interface Status Information" in "Instrument Functions - R&S Digital I/Q
Interface (Option R&S FSV-B17)" in the description of the base unit.
Remote command:
INPut:DIQ:CDEVice on page 312
EXIQ
Opens a configuration dialog box for an optionally connected R&S EX-IQ-BOX and a
submenu to access the main settings quickly.
Note: The EX-IQ-Box functionality is not supported for R&S FSVR models
1321.3008Kxx.
95Operating Manual 1176.7626.02 ─ 04.1
Page 96

R&S® FSV-K82/-K83
If the optional R&S DigIConf software is installed, the submenu consists only of one
key to access the software. Note that R&S DigIConf requires a USB connection
(not LAN!) from the R&S FSVR to the R&S EX-IQ-BOX in addition to the R&S Digital I/Q Interface connection. R&S DigIConf version 2.10 or higher is required.
For typical applications of the R&S EX-IQ-BOX see also the description of the R&S
Digital I/Q Interface (R&S FSV-B17) in the base unit manual.
For details on configuration see the "R&S®Ex I/Q Box - External Signal Interface Module Manual".
For details on installation and operation of the R&S DigIConf software, see the
"R&S®EX-IQ-BOX Digital Interface Module R&S®DigIConf Software Operating Manual".
TX Settings ← EXIQ
Opens the "EX-IQ-BOX Settings" dialog box to configure the R&S FSVR for digital output to a connected device ("Transmitter" Type).
RX Settings ← EXIQ
Opens the "EX-IQ-BOX Settings" dialog box to configure the R&S FSVR for digital
input from a connected device ("Receiver" Type).
Instrument Functions of the CDMA2000 Analysis
Menu and Softkey Description for CDA Measurements
Send To ← EXIQ
The configuration settings defined in the dialog box are transferred to the R&S EX-IQBOX.
Firmware Update ← EXIQ
If a firmware update for the R&S EX-IQ-BOX is delivered with the R&S FSVR firmware,
this function is available. In this case, when you select the softkey, the firmware update
is performed.
R&S Support ← EXIQ
Stores useful information for troubleshooting in case of errors.
This data is stored in the C:\R_S\Instr\user\Support directory on the instru-
ment.
If you contact the Rohde&Schwarz support to get help for a certain problem, send
these files to the support in order to identify and solve the problem faster.
DigIConf ← EXIQ
Starts the optional R&S DigIConf application. This softkey is only available if the
optional software is installed.
To return to the R&S FSVR application, press any key on the front panel. The application is displayed with the "EXIQ" menu, regardless of which key was pressed.
For details on the R&S DigIConf application, see the "R&S®EX-IQ-BOX Digital Interface Module R&S®DigIConf Software Operating Manual".
Note: If you close the R&S DigIConf window using the "Close" icon, the window is
minimized, not closed.
96Operating Manual 1176.7626.02 ─ 04.1
Page 97

R&S® FSV-K82/-K83
If you select the "File > Exit" menu item in the R&S DigIConf window, the application is
closed. Note that in this case the settings are lost and the EX-IQ-BOX functionality is
no longer available until you restart the application using the "DigIConf" softkey in the
R&S FSVR once again.
Remote command:
Remote commands for the R&S DigIConf software always begin with SOURce:EBOX.
Such commands are passed on from the R&S FSVR to the R&S DigIConf automatically which then configures the R&S EX-IQ-BOX via the USB connection.
All remote commands available for configuration via the R&S DigIConf software are
described in the "R&S®EX-IQ-BOX Digital Interface Module R&S®DigIConf Software
Operating Manual".
Example 1:
SOURce:EBOX:*RST
SOURce:EBOX:*IDN?
Result:
"Rohde&Schwarz,DigIConf,02.05.436 Build 47"
Example 2:
SOURce:EBOX:USER:CLOCk:REFerence:FREQuency 5MHZ
Defines the frequency value of the reference clock.
Instrument Functions of the CDMA2000 Analysis
Softkeys and Menus for RF Measurements (K82)
6.3 Softkeys and Menus for RF Measurements (K82)
The following chapter describes the softkeys and menus available for RF measurements in CDMA2000 BTS Analysis mode.
All menus not described here are the same as for the base unit, see the description
there.
6.3.1 Softkeys of the Measurement Menu............................................................................. 97
6.3.2 Softkeys of the Frequency Menu................................................................................ 126
6.3.3 Softkeys of the Span Menu for RF Measurements..................................................... 129
6.3.4 Softkeys of the Amplitude Menu................................................................................. 131
6.3.5 Softkeys of the Bandwidth Menu.................................................................................137
6.3.6 Softkeys of the Sweep Menu...................................................................................... 144
6.3.7 Softkeys of the Marker Menu for RF Measurements.................................................. 147
6.3.8 Softkeys of the Input/Output Menu for RF Measurements..........................................150
6.3.1 Softkeys of the Measurement Menu
The following chapter describes all softkeys available in the "Measurement" menu in
"CDMA2000 Analysis" or "1xEV-DO Analysis" mode. It is possible that your instrument
configuration does not provide all softkeys. If a softkey is only available with a special
97Operating Manual 1176.7626.02 ─ 04.1
Page 98

R&S® FSV-K82/-K83
option, model or (measurement) mode, this information is delivered in the corresponding softkey description.
Code Domain Analyzer............................................................................................... 100
Power..........................................................................................................................100
Ch Power ACLR..........................................................................................................100
Spectrum Emission Mask............................................................................................110
Instrument Functions of the CDMA2000 Analysis
Softkeys and Menus for RF Measurements (K82)
└ Adjust Ref Lvl................................................................................................100
└ Bandclass..................................................................................................... 101
└ CP/ACLR Settings........................................................................................ 101
└ # of TX Chan.......................................................................................102
└ # of Adj Chan......................................................................................102
└ Channel Setup....................................................................................102
└ Bandwidth.................................................................................103
└ ACLR Reference............................................................ 104
└ Spacing.....................................................................................104
└ Names...................................................................................... 105
└ Weighting Filter.........................................................................105
└ Limits........................................................................................ 106
└ Limit Checking................................................................106
└ Relative Limit..................................................................107
└ Absolute Limit.................................................................107
└ Check............................................................................. 107
└ Chan Pwr/Hz.......................................................................................107
└ Power Mode........................................................................................107
└ Clear/Write................................................................................108
└ Max Hold.................................................................................. 108
└ Select Trace........................................................................................108
└ ACLR (Abs/Rel).................................................................................. 108
└ Adjust Settings....................................................................................108
└ Sweep Time..................................................................................................108
└ Fast ACLR (On/Off)...................................................................................... 109
└ Set CP Reference.........................................................................................109
└ Noise Correction........................................................................................... 110
└ Adjust Ref Lvl................................................................................................110
└ Sweep List.................................................................................................... 110
└ Sweep List dialog box.........................................................................111
└ Range Start / Range Stop........................................................ 111
└ Fast SEM..................................................................................111
└ Filter Type.................................................................................112
└ RBW......................................................................................... 112
└ VBW......................................................................................... 112
└ Sweep Time Mode....................................................................112
└ Sweep Time..............................................................................112
└ Ref. Level................................................................................. 112
└ RF Att. Mode............................................................................ 112
└ RF Attenuator........................................................................... 112
└ Preamp.....................................................................................113
└ Transd. Factor.......................................................................... 113
└ Limit Check 1-4.........................................................................113
98Operating Manual 1176.7626.02 ─ 04.1
Page 99

R&S® FSV-K82/-K83
Occupied Bandwidth................................................................................................... 120
CCDF.......................................................................................................................... 121
Instrument Functions of the CDMA2000 Analysis
Softkeys and Menus for RF Measurements (K82)
└ Abs Limit Start.......................................................................... 113
└ Abs Limit Stop.......................................................................... 113
└ Rel Limit Start...........................................................................114
└ Rel Limit Stop........................................................................... 114
└ Close Sweep List................................................................................114
└ Insert before Range............................................................................114
└ Insert after Range...............................................................................114
└ Delete Range......................................................................................114
└ Symmetric Setup................................................................................ 115
└ Edit Reference Range........................................................................ 115
└ List Evaluation...............................................................................................116
└ List Evaluation (On/Off)...................................................................... 116
└ Margin.................................................................................................116
└ Show Peaks........................................................................................116
└ Save Evaluation List........................................................................... 116
└ ASCII File Export......................................................................116
└ Decim Sep................................................................................117
└ Edit Reference Range...................................................................................117
└ Edit Power Classes.......................................................................................118
└ Used Power Classes.......................................................................... 118
└ PMin/PMax......................................................................................... 119
└ Sweep List.......................................................................................... 119
└ Add/Remove.......................................................................................119
└ Bandclass..................................................................................................... 119
└ Load Standard.............................................................................................. 120
└ Save As Standard.........................................................................................120
└ Meas Start/Stop............................................................................................ 120
└ Restore Standard Files................................................................................. 120
└ % Power Bandwidth (span > 0).................................................................... 120
└ Channel Bandwidth (span > 0)..................................................................... 121
└ Adjust Ref Lvl (span > 0).............................................................................. 121
└ Adjust Settings..............................................................................................121
└ Res BW.........................................................................................................121
└ # of Samples.................................................................................................122
└ Scaling.......................................................................................................... 122
└ x-Axis Ref Level..................................................................................122
└ x-Axis Range...................................................................................... 122
└ Range Log 100 dB....................................................................122
└ Range Log 50 dB......................................................................123
└ Range Log 10 dB......................................................................123
└ Range Log 5 dB........................................................................123
└ Range Log 1 dB........................................................................123
└ Range Log Manual................................................................... 124
└ Range Linear %........................................................................124
└ Range Lin. Unit.........................................................................124
└ y-Axis Max Value................................................................................124
└ y-Axis Min Value.................................................................................124
└ y-Unit % / Abs.....................................................................................125
99Operating Manual 1176.7626.02 ─ 04.1
Page 100

R&S® FSV-K82/-K83
Code Domain Analyzer
Starts the Code Domain Analyzer and opens the "Code Domain Analyzer" menu.
Select the desired result display via this menu.
For details refer to chapter 6.2.1, "Softkeys of the Code Domain Analyzer Menu",
on page 58. For details on the measurements in the code domain, initial configuration
and screen layout refer to chapter 6.1, "Measurements and Result Displays",
on page 35.
Remote command:
CONFigure:CDPower[:BTS]:MEASurement on page 244
Power
Starts the Signal Channel Power measurement, in which the power of a single channel
is determined.
Remote command:
CONFigure:CDPower[:BTS]:MEASurement on page 244
CALCulate<n>:MARKer<m>:FUNCtion:POWer:RESult? on page 191
Instrument Functions of the CDMA2000 Analysis
Softkeys and Menus for RF Measurements (K82)
└ Default Settings.................................................................................. 125
└ Adjust Settings....................................................................................125
└ Gated Trigger (On/Off)..................................................................................125
└ Gate Ranges.................................................................................................125
└ Adjust Settings..............................................................................................126
Adjust Ref Lvl ← Power
Adjusts the reference level to the measured channel power. This ensures that the settings of the RF attenuation and the reference level are optimally adjusted to the signal
level without overloading the R&S FSVR or limiting the dynamic range by a too small
S/N ratio.
For details on manual settings see "Settings of CP/ACLR test parameters" in the
description of the base unit.
The reference level is not influenced by the selection of a standard. To achieve an optimum dynamic range, the reference level has to be set in a way that places the signal
maximum close to the reference level without forcing an overload message. Since the
measurement bandwidth for channel power measurements is significantly lower than
the signal bandwidth, the signal path may be overloaded although the trace is still significantly below the reference level.
Remote command:
[SENSe:]POWer:ACHannel:PRESet:RLEVel on page 289
Ch Power ACLR
Activates the Adjacent Channel Power measurement.
In this measurement the power of the carrier and its adjacent and alternate channels is
determined.
Remote command:
CONFigure:CDPower[:BTS]:MEASurement on page 244
CALCulate<n>:MARKer<m>:FUNCtion:POWer:RESult? on page 191
100Operating Manual 1176.7626.02 ─ 04.1
 Loading...