

Page 1
R&S®FSV3-K10x (LTE Uplink)
LTE Uplink Measurement Application
User Manual
(;ÜêJ2)
1178922602
Version 06
Page 2

This manual applies to the following R&S®FSV3000 and R&S®FSVA3000 models with firmware version
1.90 and higher:
●
R&S®FSV3004 (1330.5000K04) / R&S®FSVA3004 (1330.5000K05)
●
R&S®FSV3007 (1330.5000K07) / R&S®FSVA3007 (1330.5000K08)
●
R&S®FSV3013 (1330.5000K13) / R&S®FSVA3013 (1330.5000K14)
●
R&S®FSV3030 (1330.5000K30) / R&S®FSVA3030 (1330.5000K31)
●
R&S®FSV3044 (1330.5000K43) / R&S®FSVA3044 (1330.5000K44)
●
R&S®FSV3050 (1330.5000K50) / R&S®FSVA3050 (1330.5000K51)
The following firmware options are described:
●
R&S®FSV3-K101 (EUTRA/LTE FDD uplink measurement application) (order no. 1330.5151.02)
●
R&S®FSV3-K103 (EUTRA/LTE advanced UL measurements) (order no. 1330.7231.02)
●
R&S®FSV3-K105 (EUTRA/LTE TDD uplink measurement application) (order no. 1330.5180.02)
© 2022 Rohde & Schwarz GmbH & Co. KG
Muehldorfstr. 15, 81671 Muenchen, Germany
Phone: +49 89 41 29 - 0
Email: info@rohde-schwarz.com
Internet: www.rohde-schwarz.com
Subject to change – data without tolerance limits is not binding.
R&S® is a registered trademark of Rohde & Schwarz GmbH & Co. KG.
Trade names are trademarks of the owners.
1178.9226.02 | Version 06 | R&S®FSV3-K10x (LTE Uplink)
Throughout this manual, products from Rohde & Schwarz are indicated without the ® symbol , e.g. R&S®FSW is indicated as
R&S FSW.
Page 3

R&S®FSV3-K10x (LTE Uplink)
Contents
1 Documentation overview.......................................................................5
1.1 Getting started manual................................................................................................. 5
1.2 User manuals and help.................................................................................................5
1.3 Service manual..............................................................................................................6
1.4 Instrument security procedures.................................................................................. 6
1.5 Printed safety instructions...........................................................................................6
1.6 Data sheets and brochures.......................................................................................... 6
1.7 Release notes and open-source acknowledgment (OSA).........................................6
1.8 Application notes, application cards, white papers, etc........................................... 7
2 Welcome to the LTE measurement application...................................8
Contents
2.1 Overview of the LTE applications................................................................................8
2.2 Installation................................................................................................................... 10
2.3 Starting the LTE measurement application.............................................................. 10
2.4 Understanding the display information.................................................................... 10
3 Measurements and result displays.................................................... 13
3.1 Selecting measurements............................................................................................13
3.2 Selecting result displays............................................................................................ 14
3.3 Performing measurements.........................................................................................15
3.4 I/Q measurements....................................................................................................... 15
3.5 Time alignment error measurements........................................................................ 29
3.6 Frequency sweep measurements..............................................................................31
3.7 3GPP test scenarios................................................................................................... 37
4 Measurement basics............................................................................39
4.1 Symbols and variables............................................................................................... 39
4.2 Overview...................................................................................................................... 40
4.3 The LTE uplink analysis measurement application................................................. 40
4.4 Performing time alignment measurements.............................................................. 44
4.5 SRS EVM calculation.................................................................................................. 45
5 Configuration........................................................................................47
5.1 Configuration overview.............................................................................................. 47
3User Manual 1178.9226.02 ─ 06
Page 4

R&S®FSV3-K10x (LTE Uplink)
5.2 I/Q measurements....................................................................................................... 49
5.3 Time alignment error measurements........................................................................ 92
5.4 Frequency sweep measurements..............................................................................92
6 Analysis................................................................................................ 95
6.1 General analysis tools................................................................................................ 95
6.2 Analysis tools for I/Q measurements........................................................................98
6.3 Analysis tools for frequency sweep measurements............................................. 104
7 Remote control...................................................................................105
7.1 Common suffixes...................................................................................................... 105
7.2 Introduction............................................................................................................... 106
7.3 LTE application selection..........................................................................................111
7.4 Screen layout.............................................................................................................114
Contents
7.5 Measurement control................................................................................................124
7.6 Trace data readout.................................................................................................... 128
7.7 Numeric result readout.............................................................................................141
7.8 Limit check result readout....................................................................................... 156
7.9 Configuration.............................................................................................................168
7.10 Analysis..................................................................................................................... 223
List of remote commands (LTE uplink)............................................232
Index....................................................................................................238
4User Manual 1178.9226.02 ─ 06
Page 5

R&S®FSV3-K10x (LTE Uplink)
1 Documentation overview
This section provides an overview of the R&S FSV/A user documentation. Unless
specified otherwise, you find the documents at:
www.rohde-schwarz.com/manual/FSVA3000
www.rohde-schwarz.com/manual/FSV3000
Further documents are available at:
www.rohde-schwarz.com/product/FSVA3000
www.rohde-schwarz.com/product/FSV3000
1.1 Getting started manual
Introduces the R&S FSV/A and describes how to set up and start working with the
product. Includes basic operations, typical measurement examples, and general information, e.g. safety instructions, etc.
Documentation overview
User manuals and help
A printed version is delivered with the instrument. A PDF version is available for download on the Internet.
1.2 User manuals and help
Separate user manuals are provided for the base unit and the firmware applications:
●
Base unit manual
Contains the description of all instrument modes and functions. It also provides an
introduction to remote control, a complete description of the remote control commands with programming examples, and information on maintenance, instrument
interfaces and error messages. Includes the contents of the getting started manual.
●
Firmware application manual
Contains the description of the specific functions of a firmware application, including remote control commands. Basic information on operating the R&S FSV/A is
not included.
The contents of the user manuals are available as help in the R&S FSV/A. The help
offers quick, context-sensitive access to the complete information for the base unit and
the firmware applications.
All user manuals are also available for download or for immediate display on the Internet.
5User Manual 1178.9226.02 ─ 06
Page 6

R&S®FSV3-K10x (LTE Uplink)
1.3 Service manual
Describes the performance test for checking the rated specifications, module replacement and repair, firmware update, troubleshooting and fault elimination, and contains
mechanical drawings and spare part lists.
The service manual is available for registered users on the global Rohde & Schwarz
information system (GLORIS):
R&S®FSVA3000/FSV3000 Service manual
1.4 Instrument security procedures
Deals with security issues when working with the R&S FSV/A in secure areas. It is
available for download on the Internet.
Documentation overview
Release notes and open-source acknowledgment (OSA)
1.5 Printed safety instructions
Provides safety information in many languages. The printed document is delivered with
the product.
1.6 Data sheets and brochures
The data sheet contains the technical specifications of the R&S FSV/A. It also lists the
firmware applications and their order numbers, and optional accessories.
The brochure provides an overview of the instrument and deals with the specific characteristics.
See www.rohde-schwarz.com/brochure-datasheet/FSV3000 /
www.rohde-schwarz.com/brochure-datasheet/FSVA3000
1.7 Release notes and open-source acknowledgment (OSA)
The release notes list new features, improvements and known issues of the current
firmware version, and describe the firmware installation.
The software makes use of several valuable open source software packages. An opensource acknowledgment document provides verbatim license texts of the used open
source software.
See www.rohde-schwarz.com/firmware/FSV3000 /
6User Manual 1178.9226.02 ─ 06
Page 7

R&S®FSV3-K10x (LTE Uplink)
www.rohde-schwarz.com/firmware/FSVA3000
1.8 Application notes, application cards, white papers, etc.
These documents deal with special applications or background information on particular topics.
See www.rohde-schwarz.com/application/FSV3000 /
www.rohde-schwarz.com/application/FSVA3000
Documentation overview
Application notes, application cards, white papers, etc.
7User Manual 1178.9226.02 ─ 06
Page 8

R&S®FSV3-K10x (LTE Uplink)
2 Welcome to the LTE measurement applica-
tion
The R&S FSV/A-K101, -K103 and -K105 are firmware applications that add functionality to perform measurements on LTE signals according to the 3GPP standard to the
R&S FSV/A.
This user manual contains a description of the functionality that the application provides, including remote control operation. Functions that are not discussed in this manual are the same as in the Spectrum application and are described in the R&S FSV/A
User Manual. The latest versions of the manuals are available for download at the
product homepage.
https://www.rohde-schwarz.com/manual/fsv3000.
● Overview of the LTE applications..............................................................................8
● Installation...............................................................................................................10
● Starting the LTE measurement application............................................................. 10
● Understanding the display information....................................................................10
Welcome to the LTE measurement application
Overview of the LTE applications
2.1 Overview of the LTE applications
You can equip the R&S FSV/A with one or more LTE applications. Each of the applications provides functionality for specific measurement tasks.
R&S FSV/A-K100
The R&S FSV/A-K100 is designed to measure LTE FDD signals on the downlink.
The application has the following features:
●
Basic signal characteristics (like frequency, channel bandwidth or cyclic prefix).
●
Demodulation and configuration of the PDSCH transmitted over a single antenna
and without precoding functionality.
●
Characteristics of the Synchronization and Reference signals.
●
Consideration of various control channels in the measurement (for example the
PBCH or the PPDCH).
●
Analysis of individual antennas in a MIMO setup.
●
Tools to refine and filter the measurement results.
●
Various result displays that show the measured signal characteristics in a diagram
or a numeric result table.
●
Available measurements: EVM, ACLR and SEM.
R&S FSV/A-K101
The R&S FSV/A-K101 is designed to measure LTE FDD signals on the uplink.
8User Manual 1178.9226.02 ─ 06
Page 9

R&S®FSV3-K10x (LTE Uplink)
The application has the following features:
●
Basic signal characteristics (like frequency, channel bandwidth or cyclic prefix).
●
Demodulation and configuration of the subframes transmitted over a single
antenna.
●
Characteristics of the demodulation and sounding reference signals.
●
Consideration of the PUSCH, PUCCH and PRACH channels.
●
Analysis of individual antennas in a MIMO setup.
●
Tools to refine and filter the measurement results.
●
Various result displays that show the measured signal characteristics in a diagram
or a numeric result table.
●
Available measurements: EVM, ACLR and SEM.
R&S FSV/A-K102
The R&S FSV/A-K102 is designed to measure LTE Advanced systems and MIMO systems on the downlink.
Note that this application only works in combination with either R&S FSV/A-K100 or K104.
Welcome to the LTE measurement application
Overview of the LTE applications
The application has the following features:
●
Support of 1024QAM modulation.
●
Consideration of the precoding schemes defined in the 3GPP standard.
●
Support of carrier aggregation.
●
Measurements on multimedia broadcast single frequency networks (MBSFNs).
●
Additional measurements: time alignment error, multi-carrier ACLR, cumulative
ACLR and multi-SEM.
R&S FSV/A-K103
The R&S FSV/A-K103 is designed to measure LTE Advanced systems on the uplink.
Note that this application only works in combination with either R&S FSV/A-K101 or K105.
The application has the following features:
●
Support of 256QAM modulation.
●
Consideration of the enhanced PUSCH and PUCCH characteristics.
●
Support of carrier aggregation.
●
Additional measurements: time alignment error, multi-carrier ACLR and multi SEM.
R&S FSV/A-K104
The R&S FSV/A-K104 is designed to measure LTE TDD signals on the downlink.
The features are basically the same as in the R&S FSV/A-K100 with additional features that allow you to configure TDD subframes. It also provides tools to measure the
On/Off Power.
9User Manual 1178.9226.02 ─ 06
Page 10

R&S®FSV3-K10x (LTE Uplink)
R&S FSV/A-K105
The R&S FSV/A-K105 is designed to measure LTE TDD signals on the uplink.
The features are basically the same as in the R&S FSV/A-K101 with additional features that allow you to configure TDD subframes.
2.2 Installation
Find detailed installing instructions in the Getting Started or the release notes of the
R&S FSV/A.
2.3 Starting the LTE measurement application
The LTE measurement application adds a new application to the R&S FSV/A.
Welcome to the LTE measurement application
Understanding the display information
To activate the application
1. Press the [MODE] key on the front panel of the R&S FSV/A.
A dialog box opens that contains all operating modes and applications currently
available on your R&S FSV/A.
2. Select the "LTE" item.
The R&S FSV/A opens a new measurement channel for the LTE measurement
application.
The measurement is started immediately with the default settings. It can be configured
in the "Overview" dialog box, which is displayed when you select the "Overview" softkey from any menu.
For more information see Chapter 5, "Configuration", on page 47.
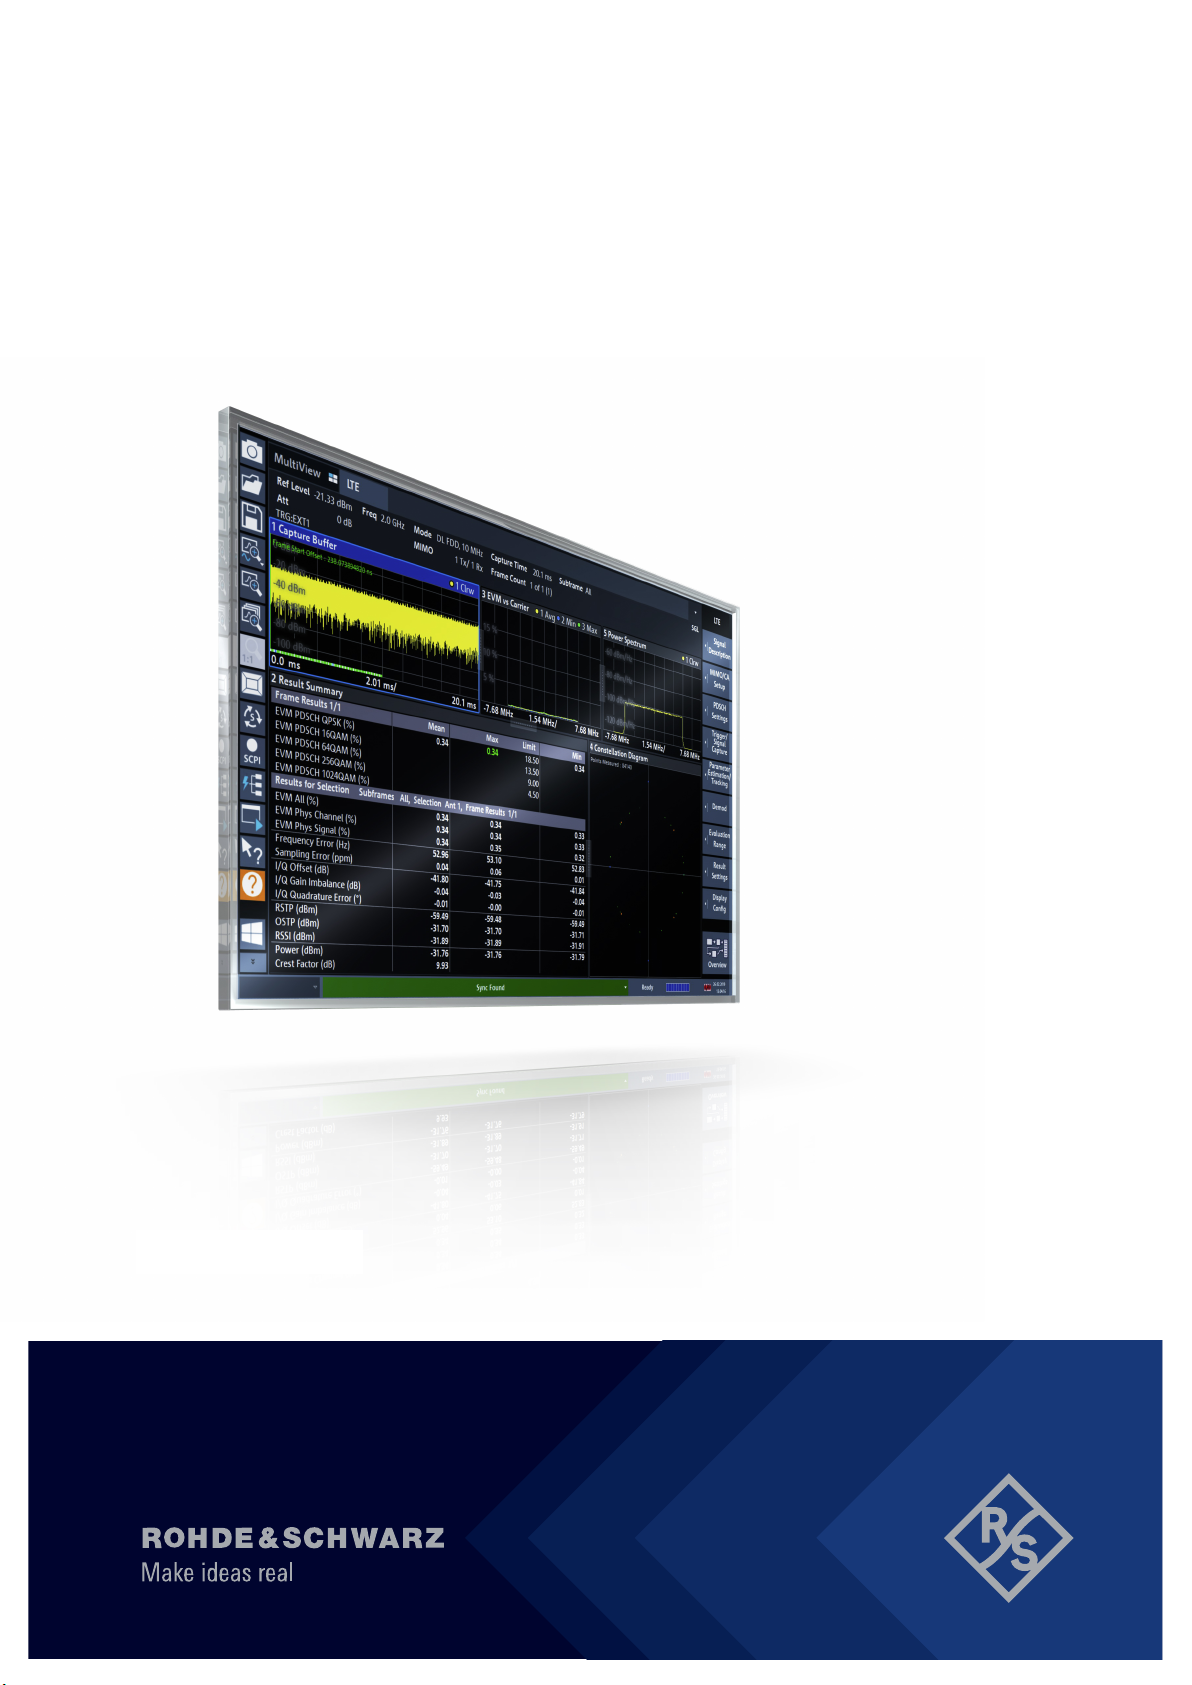
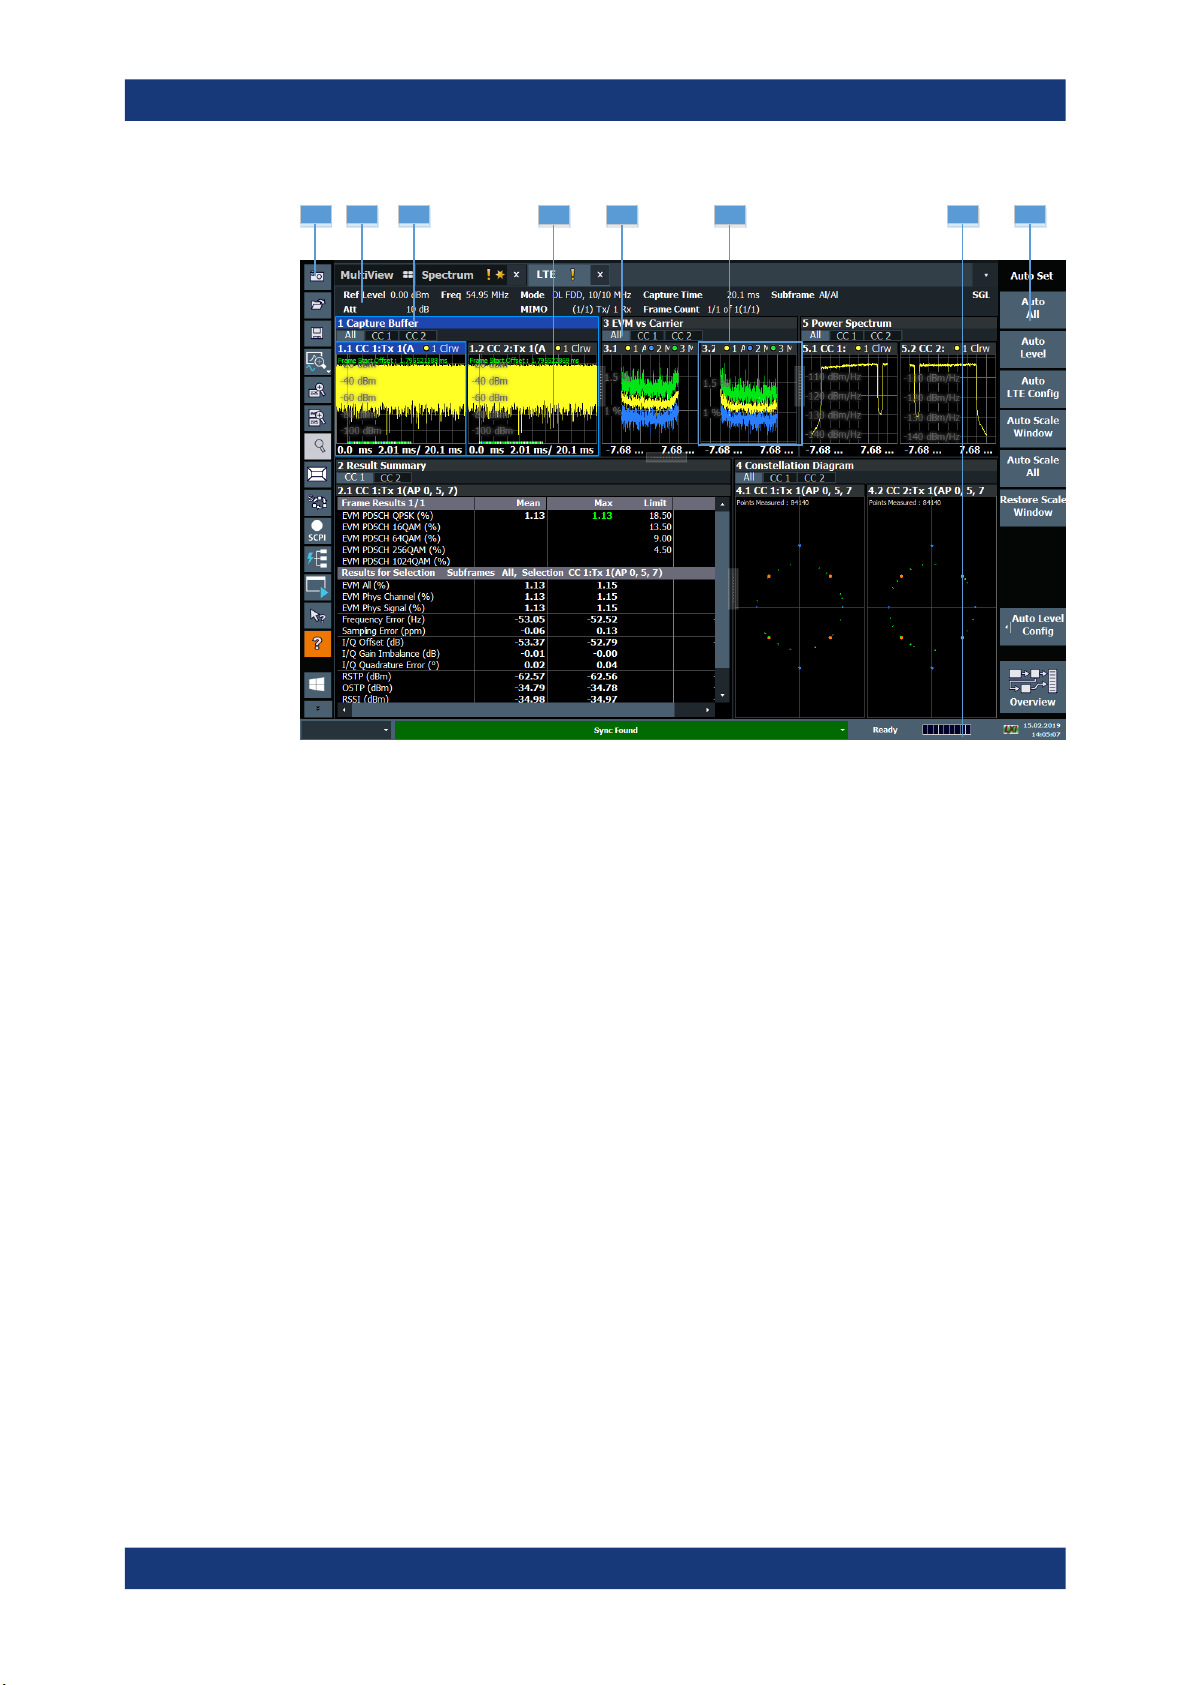
2.4 Understanding the display information
The following figure shows a measurement diagram during analyzer operation. All different information areas are labeled. They are explained in more detail in the following
sections.
10User Manual 1178.9226.02 ─ 06
Page 11
R&S®FSV3-K10x (LTE Uplink)
Welcome to the LTE measurement application
Understanding the display information
1 2 3 7 8
1 = Toolbar
2 = Channel bar
3 = Diagram header
4 = Result display
5 = Tabs to select displayed information for multiple data streams
6 = Subwindows (if more than one data stream is displayed at the same time)
7 = Status bar
8 = Softkeys
4 5 6
Channel bar information
In the LTE measurement application, the R&S FSV/A shows the following settings:
Table 2-1: Information displayed in the channel bar in the LTE measurement application
Ref Level Reference level
Att Mechanical and electronic RF attenuation
Freq Frequency
Mode LTE standard
MIMO Number of Tx and Rx antennas in the measurement setup
Capture Time Signal length that has been captured
Frame Count Number of frames that have been captured
Selected Slot Slot considered in the signal analysis
Selected Subframe Subframe considered in the signal analysis
In addition, the channel bar also displays information on instrument settings that affect
the measurement results even though this is not immediately apparent from the display
11User Manual 1178.9226.02 ─ 06
Page 12

R&S®FSV3-K10x (LTE Uplink)
of the measured values (e.g. transducer or trigger settings). This information is displayed only when applicable for the current measurement. For details see the
R&S FSV/A Getting Started manual.
Window title bar information
The information in the window title bar depends on the result display.
The "Constellation Diagram", for example, shows the number of points that have been
measured.
Status bar information
Global instrument settings, the instrument status and any irregularities are indicated in
the status bar beneath the diagram. Furthermore, the progress of the current operation
is displayed in the status bar.
Regarding the synchronization state, the application shows the following labels.
●
Sync OK
The synchronization was successful. The status bar is green.
●
Sync Failed
The synchronization was not successful. The status bar is red.
There can be three different synchronization errors.
– Sync Failed (Cyclic Prefix): The cyclic prefix correlation failed.
– Sync Failed (P-SYNC): The P-SYNC correlation failed.
– Sync Failed (S-SYNC): The S-SYNC correlation failed.
Welcome to the LTE measurement application
Understanding the display information
12User Manual 1178.9226.02 ─ 06
Page 13

R&S®FSV3-K10x (LTE Uplink)
3 Measurements and result displays
The LTE measurement application measures and analyzes various aspects of an LTE
signal.
It features several measurements and result displays. Measurements represent different ways of processing the captured data during the digital signal processing. Result
displays are different representations of the measurement results. They may be diagrams that show the results as a graph or tables that show the results as numbers.
Remote command:
Measurement selection: CONFigure[:LTE]:MEASurement on page 168
Result display selection: LAYout:ADD[:WINDow]? on page 116
● Selecting measurements.........................................................................................13
● Selecting result displays..........................................................................................14
● Performing measurements......................................................................................15
● I/Q measurements...................................................................................................15
● Time alignment error measurements...................................................................... 29
● Frequency sweep measurements...........................................................................31
● 3GPP test scenarios............................................................................................... 37
Measurements and result displays
Selecting measurements
3.1 Selecting measurements
Access: "Overview" > "Select Measurement"
The "Select Measurement" dialog box contains several buttons. Each button represents a measurement. A measurement in turn is a set of result displays that thematically belong together and that have a particular display configuration. If these predefined display configurations do not suit your requirements, you can add or remove
result displays as you like. For more information about selecting result displays, see
Chapter 3.2, "Selecting result displays", on page 14.
Depending on the measurement, the R&S FSV/A changes the way it captures and processes the raw signal data.
EVM
EVM measurements record, process and demodulate the signal's I/Q data. The result
displays available for EVM measurements show various aspects of the LTE signal
quality.
For EVM measurements, you can combine the result displays in any way.
For more information on the result displays, see Chapter 3.5, "Time alignment error
measurements", on page 29.
Remote command:
CONFigure[:LTE]:MEASurement on page 168
13User Manual 1178.9226.02 ─ 06
Page 14

R&S®FSV3-K10x (LTE Uplink)
Time alignment error
Time alignment error (TAE) measurements record, process and demodulate the signal's I/Q data. The result displays available for TAE measurements indicate how well
the antennas in a multi-antenna system are aligned.
For TAE measurements, you can combine the result displays in any way.
For more information on the result displays, see Chapter 3.5, "Time alignment error
measurements", on page 29.
Remote command:
CONFigure[:LTE]:MEASurement on page 168
Channel power ACLR
(inludes multi carrier ACLR and cumulative ACLR measurements)
ACLR measurements sweep the frequency spectrum instead of processing I/Q data.
The ACLR measurements evaluates the leakage ratio of neighboring channels and
evaluates if the signal is within the defined limits. The measurement provides several
result displays. You can combine the result displays in any way.
For more information on the result displays, see Chapter 3.6, "Frequency sweep mea-
surements", on page 31.
Remote command:
CONFigure[:LTE]:MEASurement on page 168
Measurements and result displays
Selecting result displays
SEM
(inlcudes multi carrier SEM measurements)
SEM measurements sweep the frequency spectrum instead of processing I/Q data.
The SEM measurements tests the signal against a spectrum emission mask and eval-
uates if the signal is within the defined limits. The measurement provides several result
displays. You can combine the result displays in any way.
For more information on the result displays, see Chapter 3.6, "Frequency sweep mea-
surements", on page 31.
Remote command:
CONFigure[:LTE]:MEASurement on page 168
3.2 Selecting result displays
Access:
The R&S FSV/A opens a menu (the SmartGrid) to select result displays. For more
information on the SmartGrid functionality, see the R&S FSV/A Getting Started.
In the default state of the application, it shows several conventional result displays.
●
Capture Buffer
●
EVM vs Carrier
●
Power Spectrum
●
Result Summary
14User Manual 1178.9226.02 ─ 06
Page 15

R&S®FSV3-K10x (LTE Uplink)
●
Constellation Diagram
From that predefined state, add and remove result displays as you like from the SmartGrid menu.
Remote command: LAYout:ADD[:WINDow]? on page 116
Measuring several data streams
When you capture more than one data stream (for example component carriers), each
result display is made up out of several tabs.
The first tab shows the results for all data streams. The other tabs show the results for
each individual data stream. By default, the tabs are coupled to one another - if you
select a certain data stream in one display, the application also selects this data stream
in the other result displays (see Subwindow Coupling).
The number of tabs depends on the number of data streams.
3.3 Performing measurements
Measurements and result displays
I/Q measurements
By default, the application measures the signal continuously. In "Continuous Sweep"
mode, the R&S FSV/A captures and analyzes the data again and again.
●
For I/Q measurements, the amount of captured data depends on the capture time.
●
For frequency sweep measurement, the amount of captured data depends on the
sweep time.
In "Single Sweep" mode, the R&S FSV/A stops measuring after it has captured the
data once. The amount of data again depends on the capture time.
Refreshing captured data
You can also repeat a measurement based on the data that has already been captured
with the "Refresh" function. Repeating a measurement with the same data can be useful, for example, if you want to apply different modulation settings to the same I/Q data.
For more information, see the documentation of the R&S FSV/A.
3.4 I/Q measurements
Access: [MEAS] > "EVM/Frequency Err/Power"
You can select the result displays from the evaluation bar and arrange them as you like
with the SmartGrid functionality.
Remote command:
Measurement selection: CONFigure[:LTE]:MEASurement on page 168
Result display selection: LAYout:ADD[:WINDow]? on page 116
15User Manual 1178.9226.02 ─ 06
Page 16
R&S®FSV3-K10x (LTE Uplink)
Capture Buffer...............................................................................................................16
EVM vs Carrier..............................................................................................................17
EVM vs Symbol.............................................................................................................18
EVM vs Subframe......................................................................................................... 18
Power Spectrum............................................................................................................19
Inband Emission............................................................................................................19
Spectrum Flatness........................................................................................................ 20
Spectrum Flatness SRS................................................................................................20
Group Delay..................................................................................................................21
Spectrum Flatness Difference.......................................................................................21
Constellation Diagram...................................................................................................22
CCDF............................................................................................................................ 22
Allocation Summary...................................................................................................... 23
Bitstream.......................................................................................................................23
EVM vs Symbol x Carrier..............................................................................................24
Power vs Symbol x Carrier............................................................................................25
Result Summary............................................................................................................25
Marker Table................................................................................................................. 28
Measurements and result displays
I/Q measurements
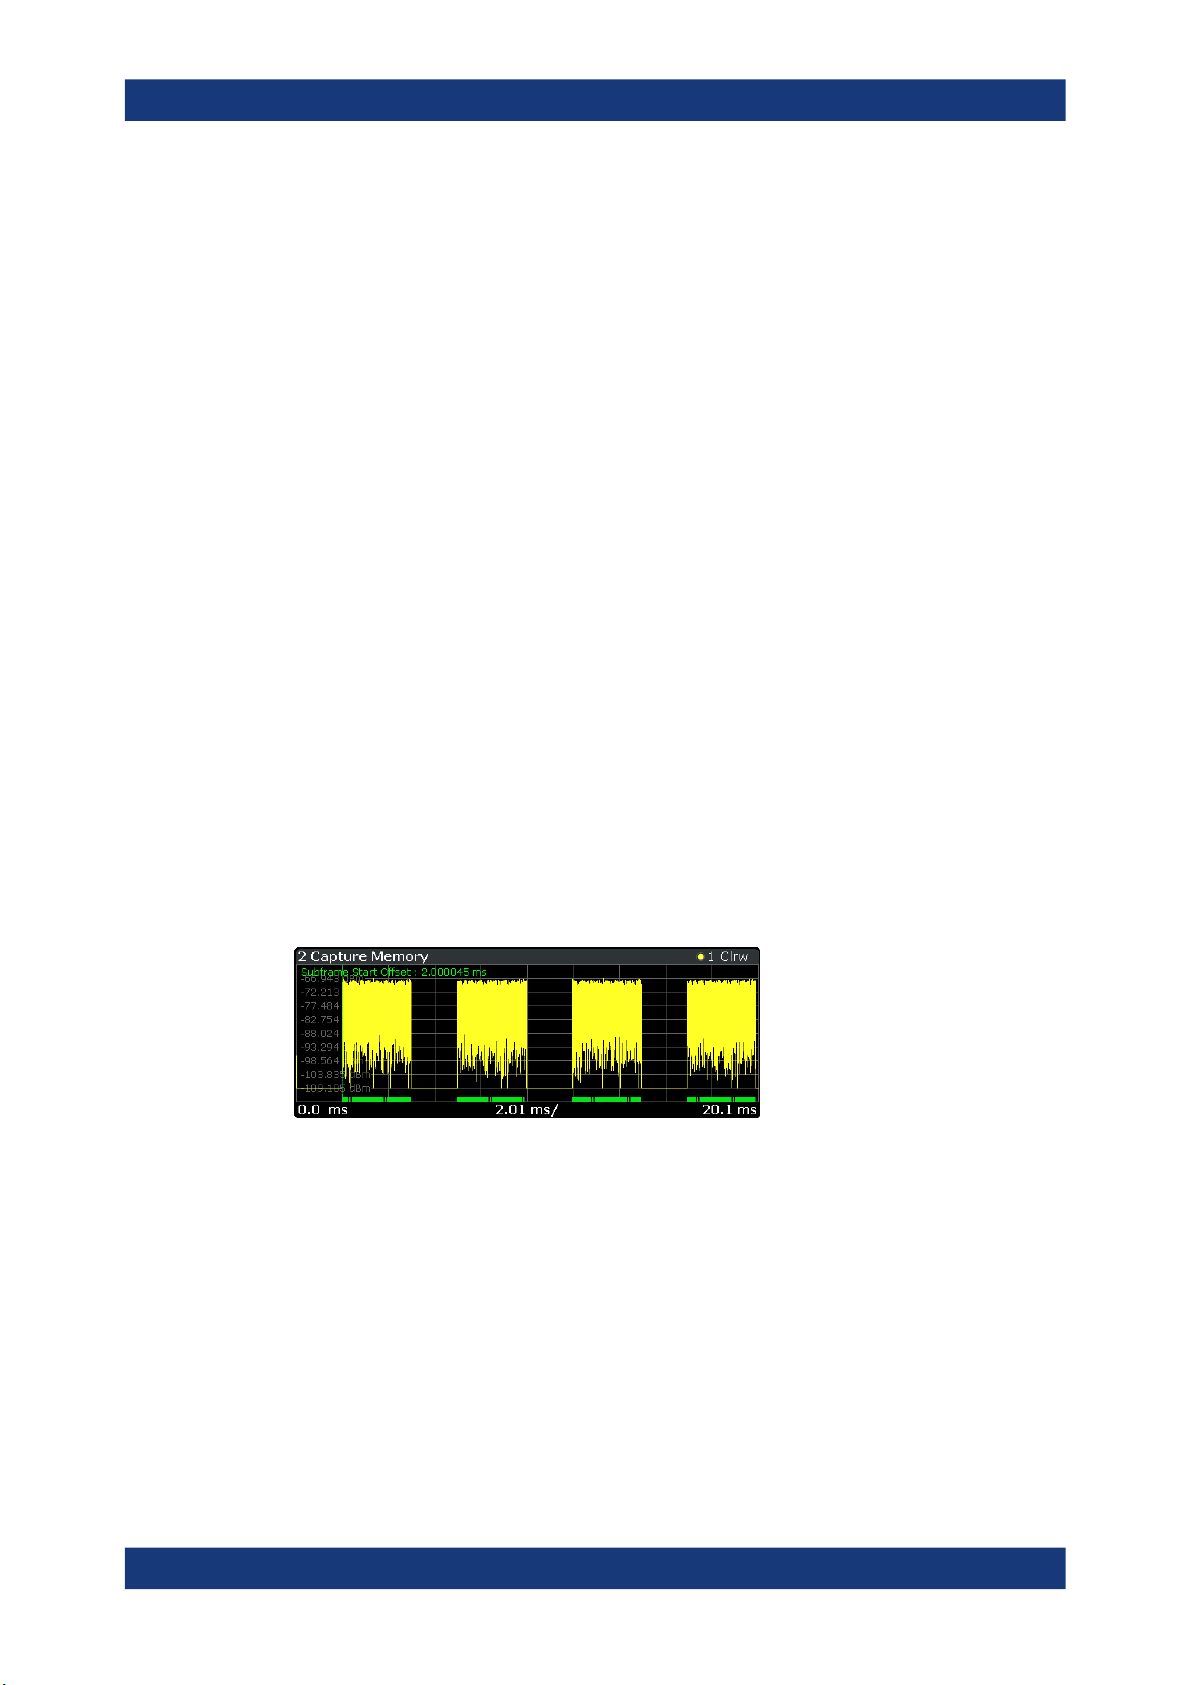
Capture Buffer
The "Capture Buffer" shows the complete range of captured data for the last data capture.
The x-axis represents time. The maximum value of the x-axis is equal to the Capture
Time.
The y-axis represents the amplitude of the captured I/Q data in dBm (for RF input).
The capture buffer uses the auto peak detector to evaluate the measurement data. The
auto peak detector determines the maximum and the minimum value of the measured
levels for each measurement point and combines both values in one sample point.
Figure 3-1: Capture buffer without zoom
A green vertical line at the beginning of the green bar in the capture buffer represents
the subframe start. The diagram also contains the "Start Offset" value. This value is the
time difference between the subframe start and capture buffer start.
When you zoom into the diagram, you will see that the bar is interrupted at certain
positions. Each small bar indicates the useful parts of the OFDM symbol.
16User Manual 1178.9226.02 ─ 06
Page 17
R&S®FSV3-K10x (LTE Uplink)
Figure 3-2: Capture buffer after a zoom has been applied
Remote command:
Selection: LAY:ADD ? '1',LEFT,CBUF
Query (y-axis): TRACe:DATA?
Query (x-axis): TRACe<n>[:DATA]:X? on page 139
Subframe start offset: FETCh[:CC<cc>]:SUMMary:TFRame? on page 149
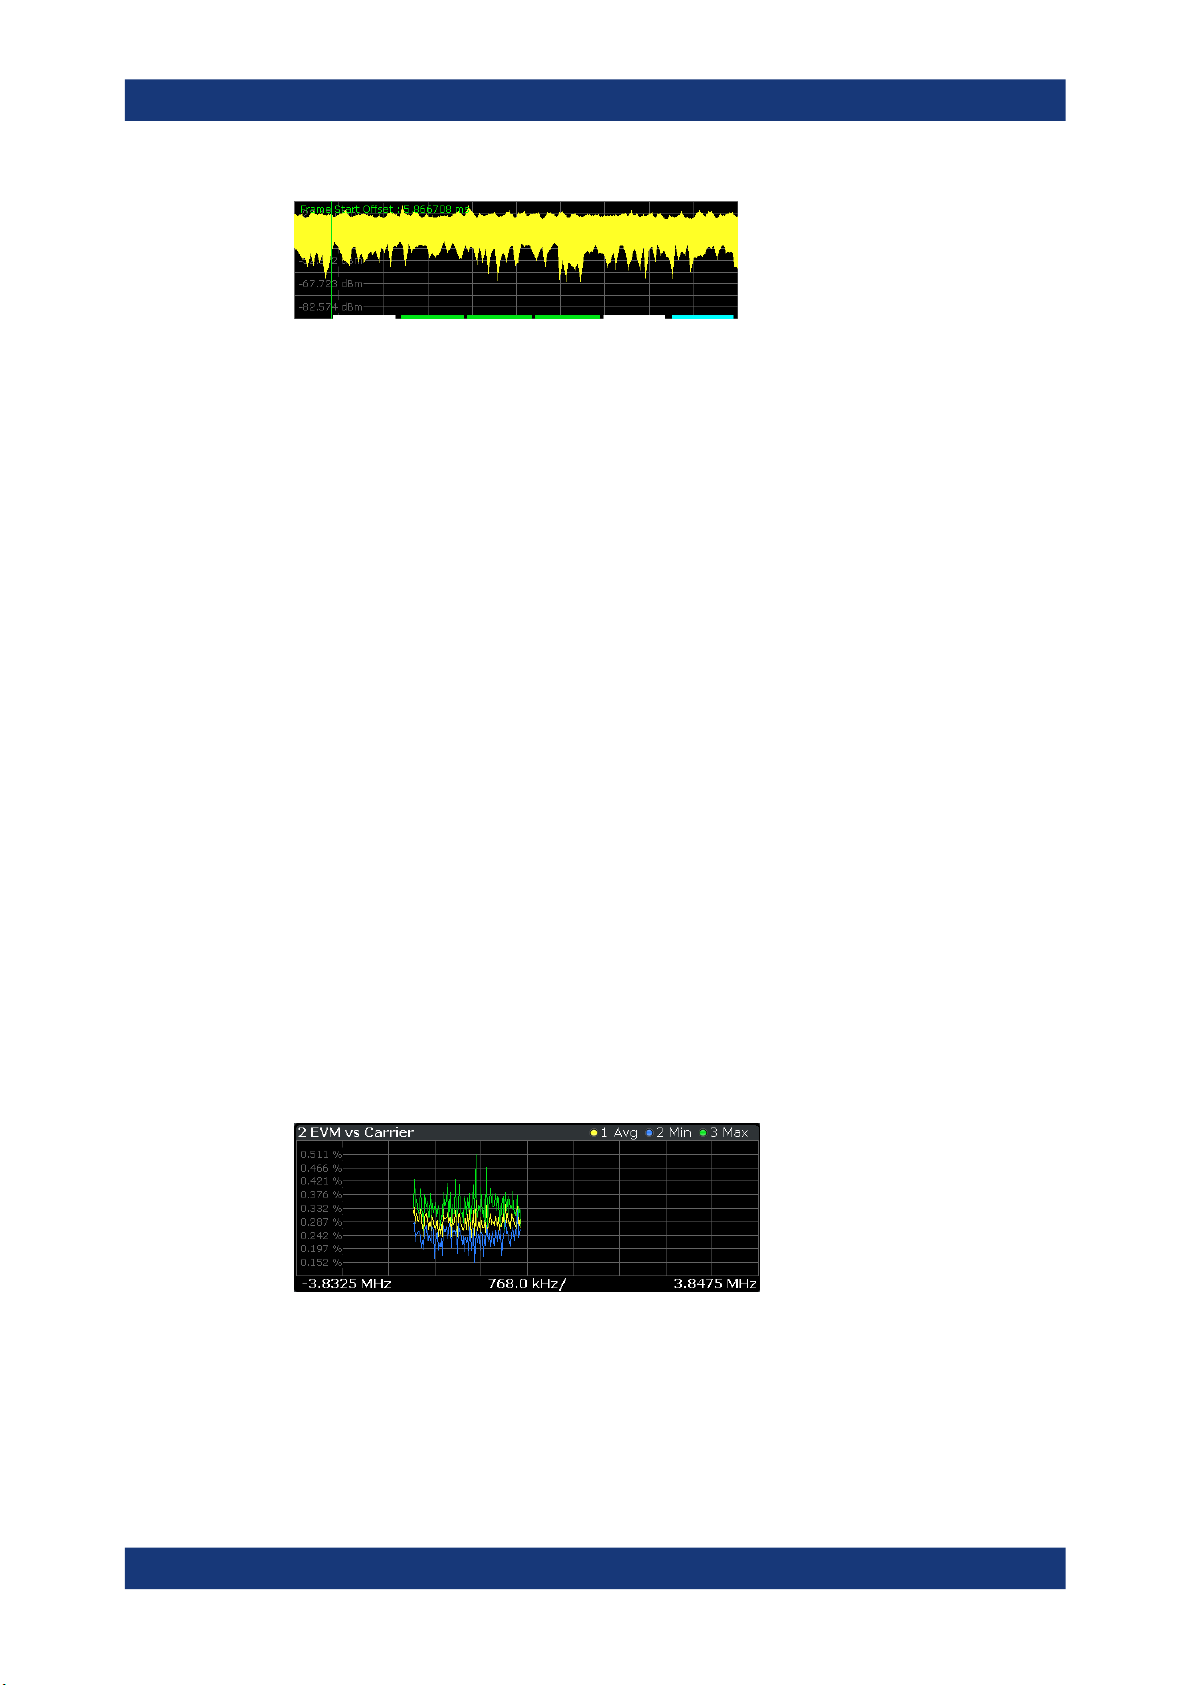
EVM vs Carrier
The "EVM vs Carrier" result display shows the error vector magnitude (EVM) of the
subcarriers. With the help of a marker, you can use it as a debugging technique to
identify any subcarriers whose EVM is too high.
The results are based on an average EVM that is calculated over the resource elements for each subcarrier. This average subcarrier EVM is determined for each analyzed slot in the capture buffer.
If you analyze all slots, the result display contains three traces.
●
Average EVM
This trace shows the subcarrier EVM, averaged over all slots.
●
Minimum EVM
This trace shows the lowest (average) subcarrier EVM that has been found over
the analyzed slots.
●
Maximum EVM
This trace shows the highest (average) subcarrier EVM that has been found over
the analyzed slots.
If you select and analyze one slot only, the result display contains one trace that shows
the subcarrier EVM for that slot only. Average, minimum and maximum values in that
case are the same. For more information, see "Slot Selection" on page 101.
The x-axis represents the center frequencies of the subcarriers. The y-axis shows the
EVM in % or in dB, depending on the EVM Unit.
Measurements and result displays
I/Q measurements
Remote command:
Selection LAY:ADD ? '1',LEFT,EVCA
Query (y-axis): TRACe:DATA?
Query (x-axis): TRACe<n>[:DATA]:X? on page 139
17User Manual 1178.9226.02 ─ 06
Page 18
R&S®FSV3-K10x (LTE Uplink)
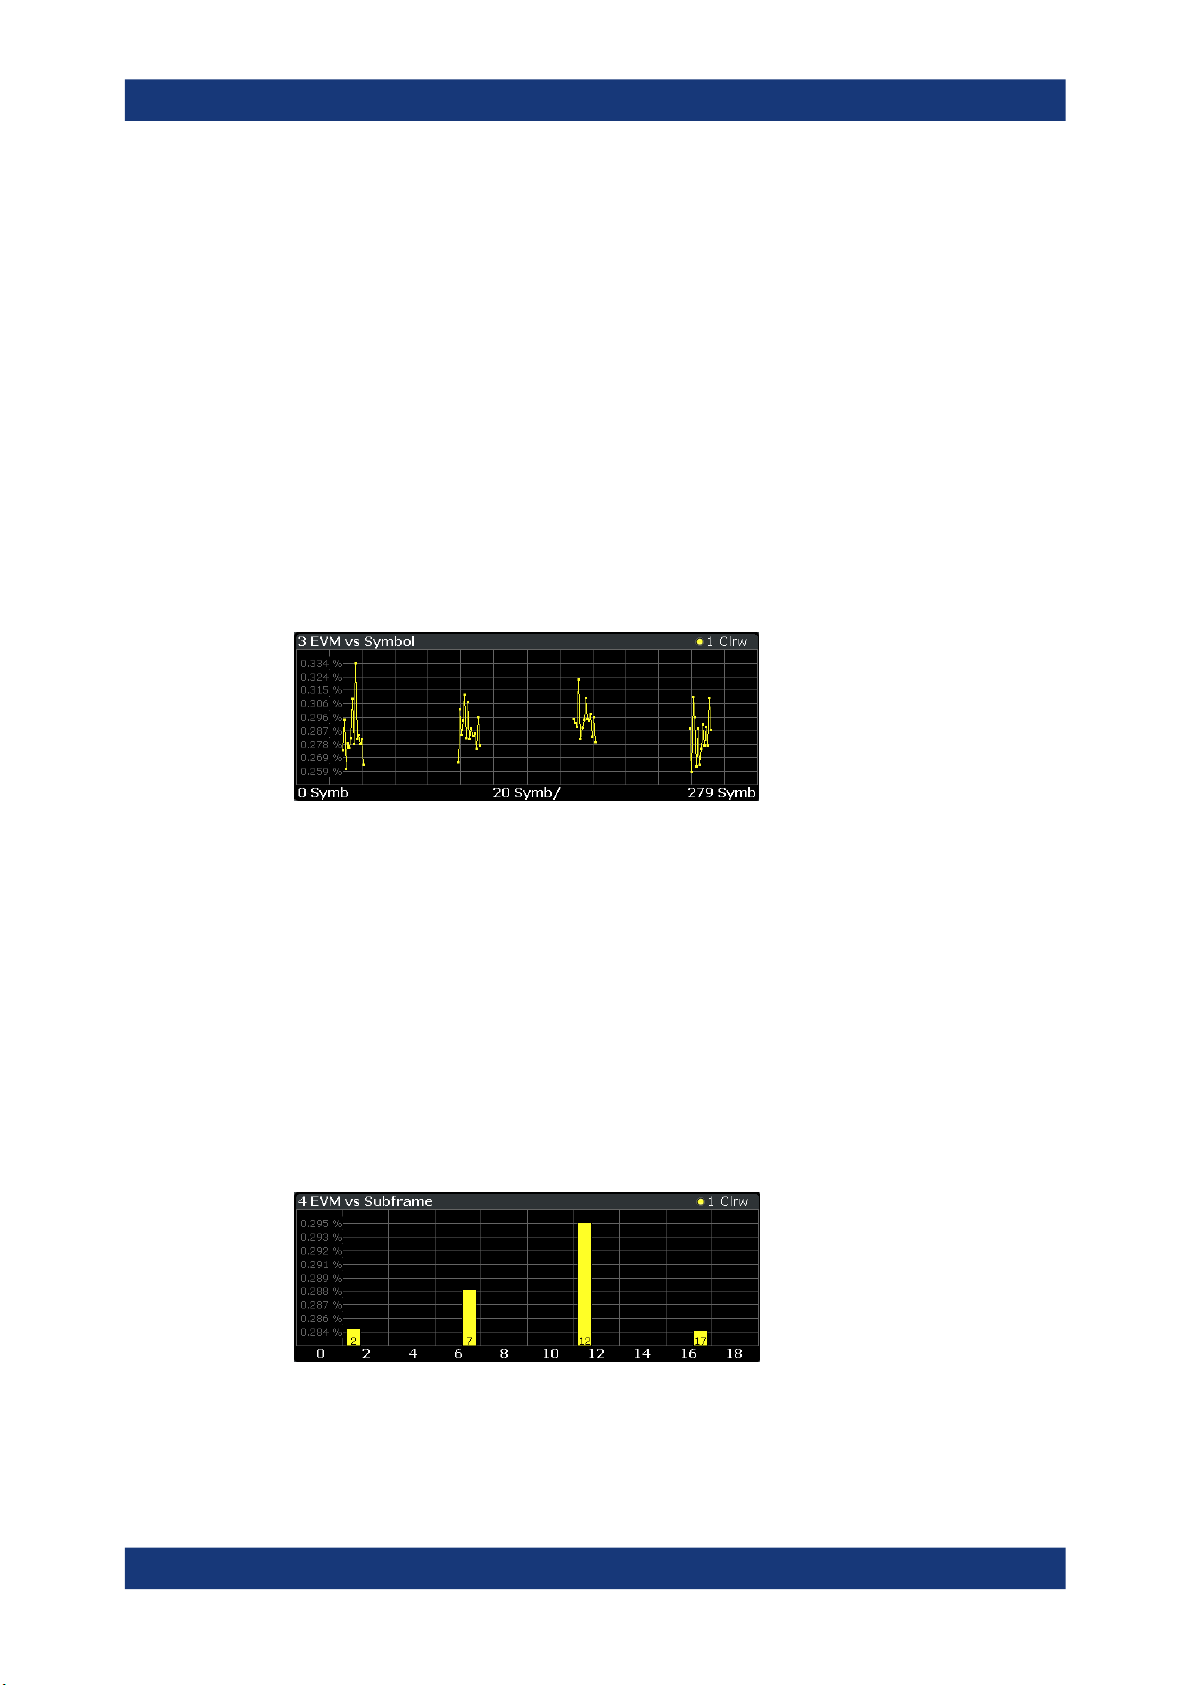
EVM vs Symbol
The "EVM vs Symbol" result display shows the error vector magnitude (EVM) of the
OFDM symbols. You can use it as a debugging technique to identify any symbols
whose EVM is too high.
The results are based on an average EVM that is calculated over all subcarriers that
are part of a certain OFDM symbol. This average OFDM symbol EVM is determined for
all OFDM symbols in each analyzed slot.
The x-axis represents the OFDM symbols, with each symbol represented by a dot on
the line. Any missing connections from one dot to another mean that the R&S FSV/A
could not determine the EVM for that symbol.
The number of displayed symbols depends on the subframe selection and the length of
the cyclic prefix.
For TDD signals, the result display does not show OFDM symbols that are not part of
the measured link direction.
On the y-axis, the EVM is plotted either in % or in dB, depending on the EVM Unit.
Measurements and result displays
I/Q measurements
Remote command:
Selection: LAY:ADD ? '1',LEFT,EVSY
Query (y-axis): TRACe:DATA?
Query (x-axis): TRACe<n>[:DATA]:X? on page 139
EVM vs Subframe
The "EVM vs Subframe" result display shows the Error Vector Magnitude (EVM) for
each subframe. You can use it as a debugging technique to identify a subframe whose
EVM is too high.
The result is an average over all subcarriers and symbols of a specific subframe.
The x-axis represents the subframes, with the number of displayed subframes being
10.
On the y-axis, the EVM is plotted either in % or in dB, depending on the EVM Unit.
18User Manual 1178.9226.02 ─ 06
Page 19
R&S®FSV3-K10x (LTE Uplink)
Remote command:
Selection: LAY:ADD ? '1',LEFT,EVSU
Query (y-axis): TRACe:DATA?
Query (x-axis): TRACe<n>[:DATA]:X? on page 139
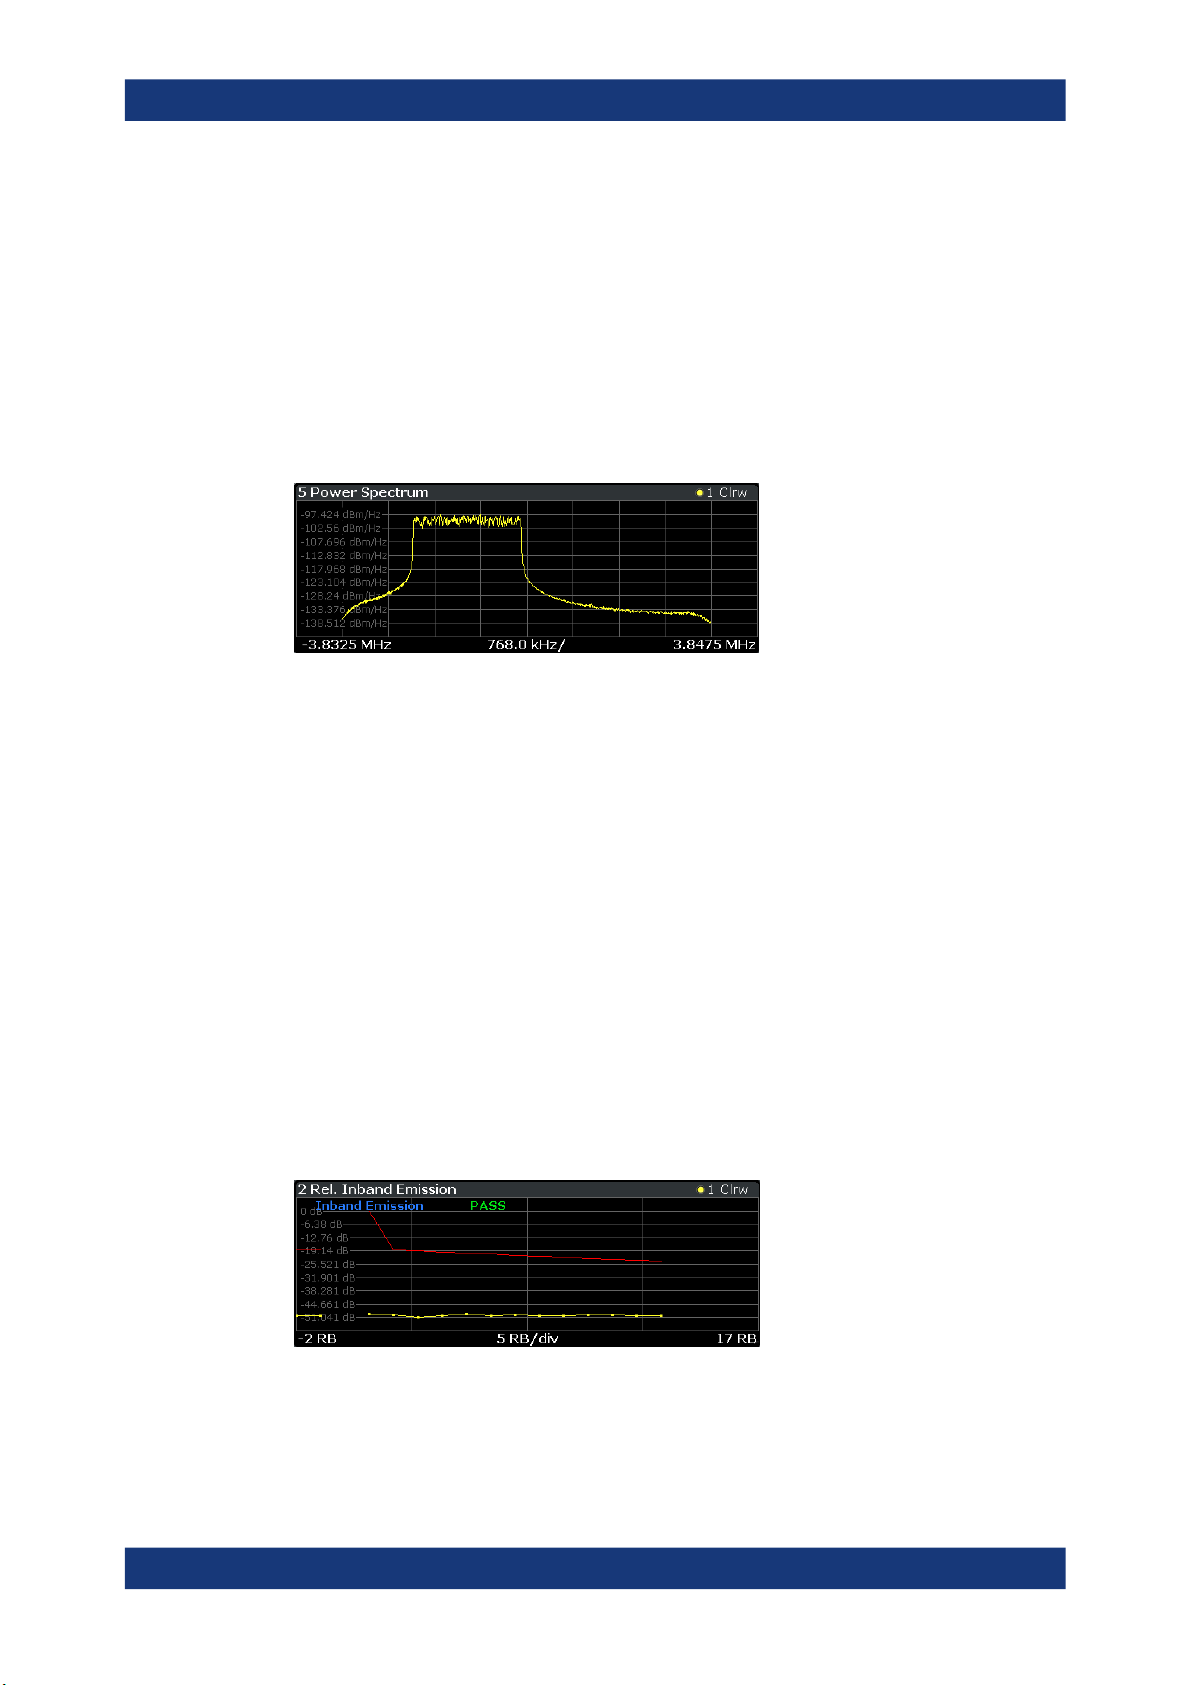
Power Spectrum
The "Power Spectrum" shows the power density of the complete capture buffer in
dBm/Hz.
The displayed bandwidth depends on the selected channel bandwidth.
The x-axis represents the frequency. On the y-axis, the power level is plotted.
Measurements and result displays
I/Q measurements
Remote command:
Selection: LAY:ADD ? '1',LEFT,PSPE
Query (y-axis): TRACe:DATA?
Query (x-axis): TRACe<n>[:DATA]:X? on page 139
Inband Emission
The "Inband Emission" result display shows the power of the unused resource blocks
relative to the allocated resource blocks (yellow trace). The diagram also shows the
inband emission limit lines (red trace). The allocated resource blocks are not evaluated.
The x-axis represents the resource blocks. The numbering of the resource blocks is
based on 3GPP 38.521 as a function of the resource block offset from the edge of the
allocated uplink transmission bandwidth.
The y-axis shows the measured power for each resource block.
Because the measurement is evaluated over a single slot in the currently selected sub-
frame, you have to select a specific slot and subframe to get valid measurement
results.
Limits for the inband emission are specified in 3GPP 36.101.
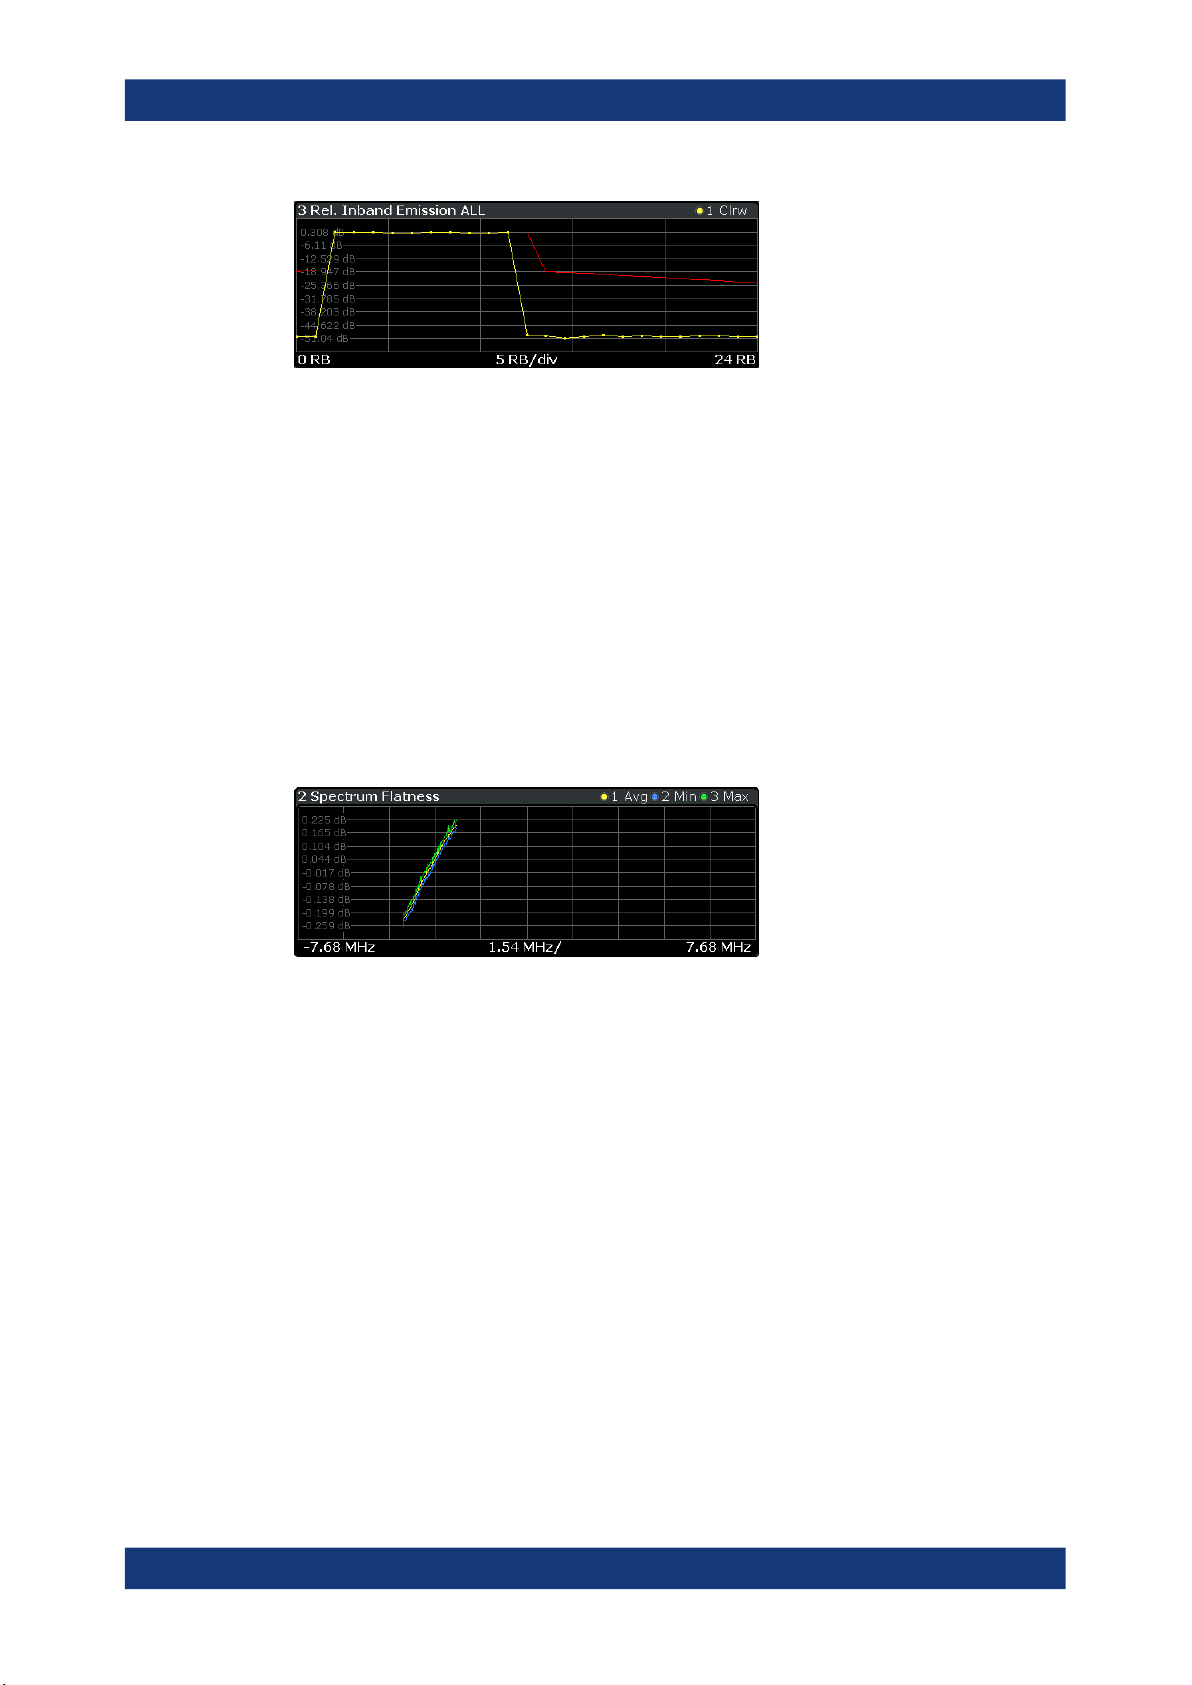
You can also display the inband emissions for the allocated resource block in addition
to the unused resource blocks when you select the "Inband Emissions All" result display.
19User Manual 1178.9226.02 ─ 06
Page 20
R&S®FSV3-K10x (LTE Uplink)
Remote command:
Selection: LAY:ADD ? '1',LEFT,IE
Selection: LAY:ADD ? '1',LEFT,IEA
Query (y-axis): TRACe:DATA?
Query (x-axis): TRACe<n>[:DATA]:X? on page 139
Spectrum Flatness
The "Spectrum Flatness" result display shows the relative power offset caused by the
transmit channel.
The measurement is evaluated over the currently selected slot in the currently selected
subframe.
The currently selected subframe depends on your selection.
The x-axis represents the frequency. On the y-axis, the channel flatness is plotted in
dB.
Measurements and result displays
I/Q measurements
Note that the limit lines are only displayed if you match the Operating Band to the center frequency. Limits are defined for each operating band in the standard.
The shape of the limit line is different when "Extreme Conditions" on page 57 are on.
Remote command:
Selecting the result display: LAY:ADD ? '1',LEFT,SFL
Querying results:
TRACe:DATA?
TRACe<n>[:DATA]:X? on page 139
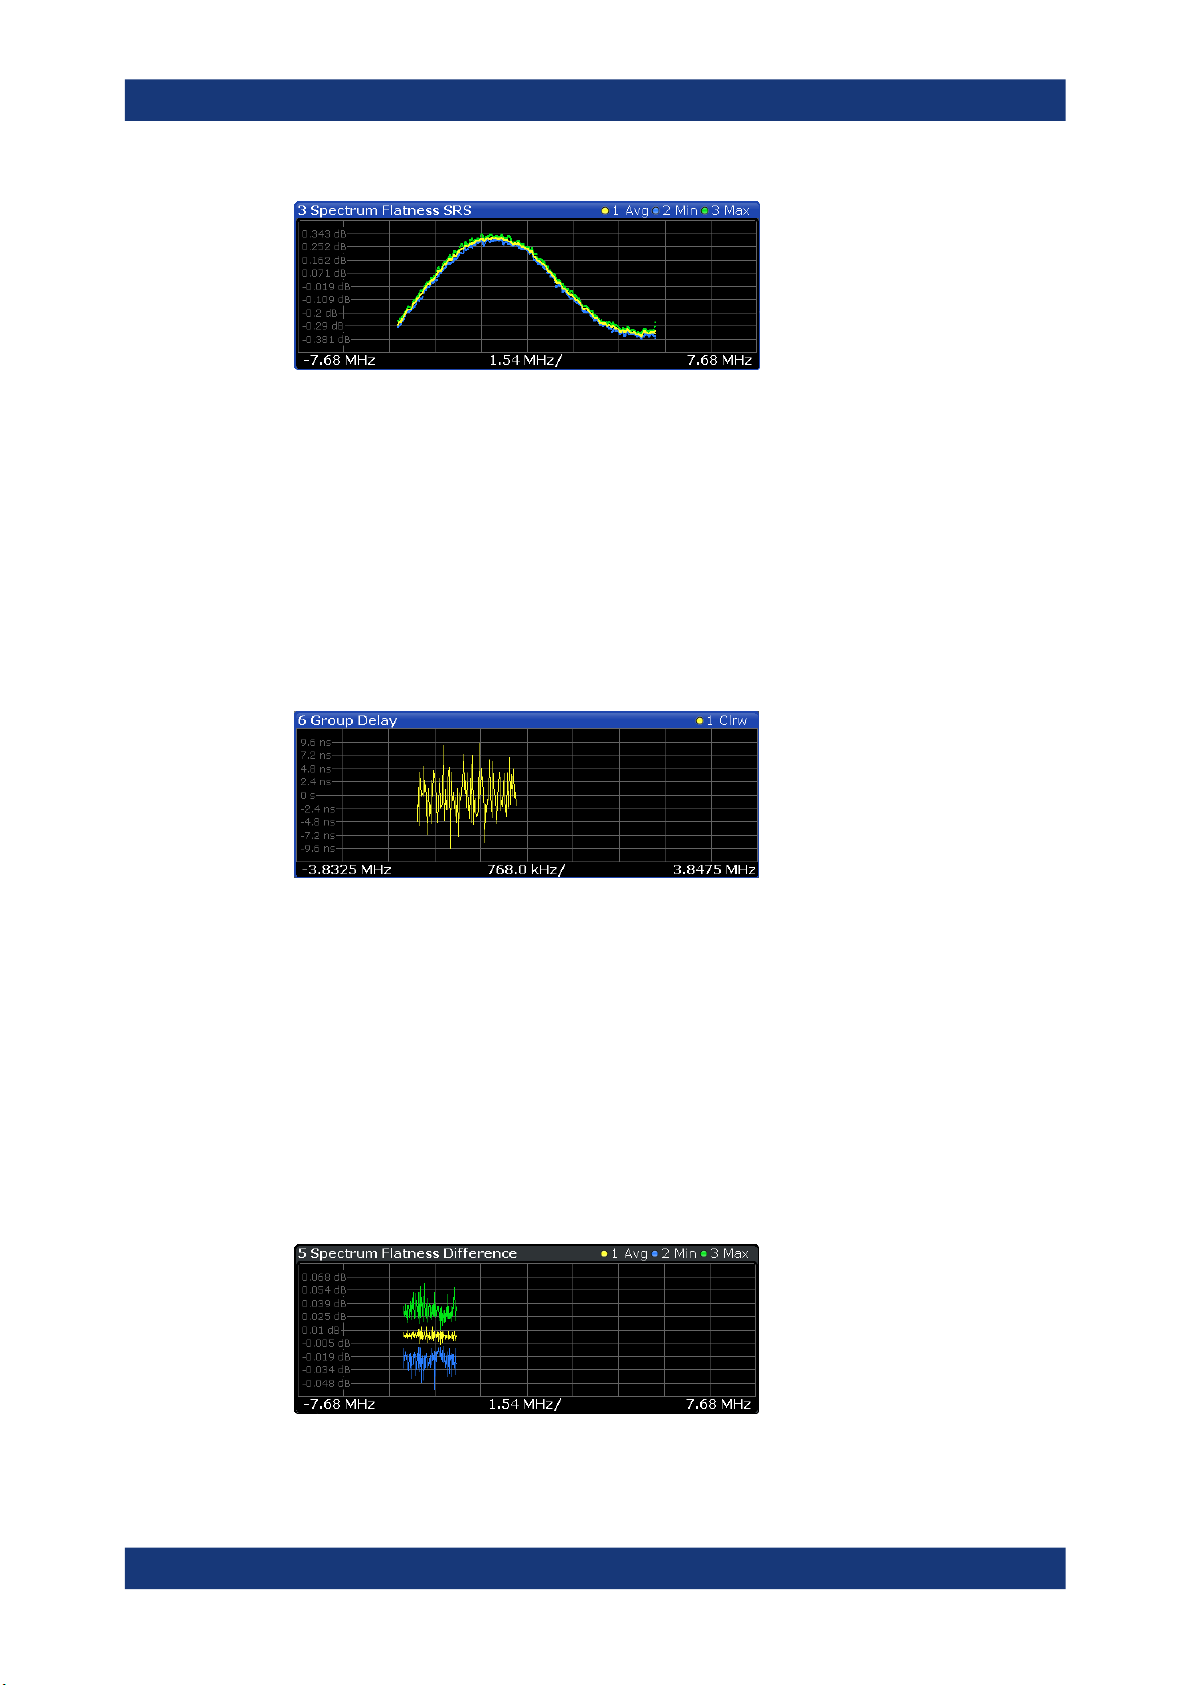
Spectrum Flatness SRS
The "Spectrum Flatness SRS" display shows the amplitude of the channel transfer
function based on the sounding reference signal.
The measurement is evaluated over the currently selected slot in the currently selected
subframe. The slot and subframe selection may be changed in the general settings.
20User Manual 1178.9226.02 ─ 06
Page 21
R&S®FSV3-K10x (LTE Uplink)
Remote command:
Selection: LAY:ADD ? '1',LEFT,SFSR
Query (y-axis): TRACe:DATA?
Query (x-axis): TRACe<n>[:DATA]:X? on page 139
Group Delay
This "Group Delay" shows the group delay of each subcarrier.
The measurement is evaluated over the currently selected slot in the currently selected
subframe.
The currently selected subframe depends on your selection.
The x-axis represents the frequency. On the y-axis, the group delay is plotted in ns.
Measurements and result displays
I/Q measurements
Remote command:
Selection: LAY:ADD ? '1',LEFT,GDEL
Query (y-axis): TRACe:DATA?
Query (x-axis): TRACe<n>[:DATA]:X? on page 139
Spectrum Flatness Difference
The "Spectrum Flatness Difference" result display shows the level difference in the
spectrum flatness result between two adjacent physical subcarriers.
The measurement is evaluated over the currently selected slot in the currently selected
subframe.
The currently selected subframe depends on your selection.
The x-axis represents the frequency. On the y-axis, the power is plotted in dB.
21User Manual 1178.9226.02 ─ 06
Page 22
R&S®FSV3-K10x (LTE Uplink)
Remote command:
Selection: LAY:ADD ? '1',LEFT,SFD
Query (y-axis): TRACe:DATA?
Query (x-axis): TRACe<n>[:DATA]:X? on page 139
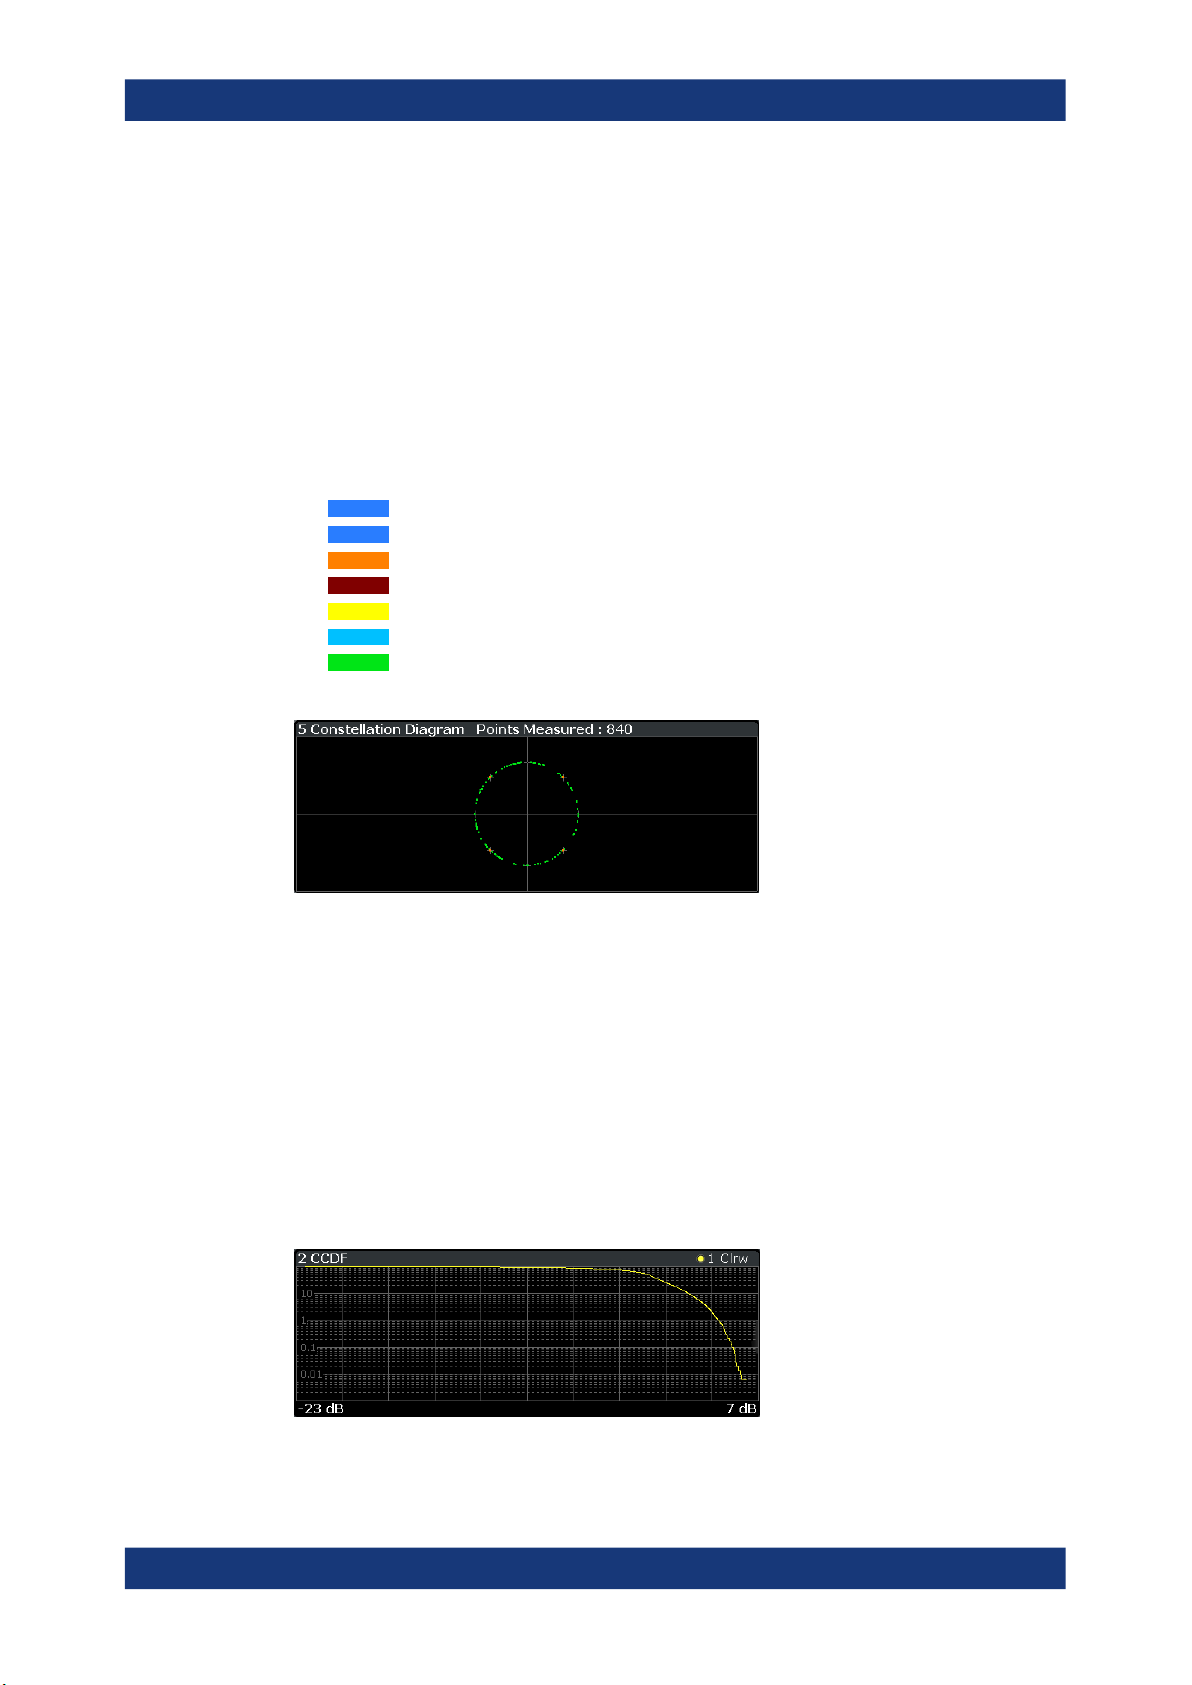
Constellation Diagram
The "Constellation Diagram" shows the in-phase and quadrature phase results and is
an indicator of the quality of the modulation of the signal.
In the default state, the result display evaluates the full range of the measured input
data.
Each color represents a modulation type.
●
●
●
●
●
●
●
You can filter the results by changing the evaluation range.
: RBPSK
: MIXTURE
: QPSK
: 16QAM
: 64QAM
: 256QAM
: PSK (CAZAC)
Measurements and result displays
I/Q measurements
The constellation diagram also contains information about the current evaluation
range, including the number of points that are displayed in the diagram.
Remote command:
Selection: LAY:ADD ? '1',LEFT,CONS
Query: TRACe:DATA?
CCDF
The "Complementary Cumulative Distribution Function (CCDF)" shows the probability
of an amplitude exceeding the mean power. For the measurement, the complete capture buffer is used.
The x-axis represents the power relative to the measured mean power. On the y-axis,
the probability is plotted in %.
22User Manual 1178.9226.02 ─ 06
Page 23

R&S®FSV3-K10x (LTE Uplink)
In addition to the diagram, the results for the CCDF measurement are summarized in
the CCDF table.
Mean Mean power
Peak Peak power
Crest Crest factor (peak power – mean power)
10 % 10 % probability that the level exceeds mean power + [x] dB
1 % 1 % probability that the level exceeds mean power + [x] dB
0.1 % 0.1 % probability that the level exceeds mean power + [x] dB
0.01 % 0.01 % probability that the level exceeds mean power + [x] dB
Remote command:
Selection: LAY:ADD ? '1',LEFT,CCDF
Query (y-axis): TRACe:DATA?
Numerical results: CALCulate<n>:STATistics:CCDF:X<t>? on page 155
Numerical results: CALCulate<n>:STATistics:RESult<res>? on page 155
Measurements and result displays
I/Q measurements
Allocation Summary
The "Allocation Summary" shows various parameters of the measured allocations in a
table.
Each row in the allocation table corresponds to an allocation. A set of several allocations make up a subframe. A horizontal line indicates the beginning of a new subframe.
The columns of the table show the following properties for each allocation.
●
The location of the allocation (subframe number).
●
The ID of the allocation (channel type).
●
Number of resource blocks used by the allocation.
●
The resource block offset of the allocation.
●
The modulation of the allocation.
●
The power of the allocation in dBm.
●
The EVM of the allocation.
The unit depends on the EVM unit
Click once on the header row to open a dialog box that allows you to add and remove
columns.
Remote command:
Selection: LAY:ADD ? '1',LEFT,ASUM
Query: TRACe:DATA?
Bitstream
The "Bitstream" shows the demodulated data stream for the data allocations.
23User Manual 1178.9226.02 ─ 06
Page 24

R&S®FSV3-K10x (LTE Uplink)
Depending on the bitstream format, the numbers represent either bits (bit order) or
symbols (symbol order).
●
For the bit format, each number represents one raw bit.
●
For the symbol format, the bits that belong to one symbol are shown as hexadecimal numbers with two digits.
Resource elements that do not contain data or are not part of the transmission are represented by a "-".
If a symbol could not be decoded because the number of layers exceeds the number
of receive antennas, the application shows a "#" sign.
The table contains the following information:
●
Subframe
Number of the subframe the bits belong to.
●
Allocation ID
Channel the bits belong to.
●
Codeword
Code word of the allocation.
●
Modulation
Modulation type of the channels.
●
Symbol Index or Bit Index
Indicates the position of the table row's first bit or symbol within the complete
stream.
●
Bit Stream
The actual bit stream.
Remote command:
Selection: LAY:ADD ? '1',LEFT,BSTR
Query: TRACe:DATA?
Measurements and result displays
I/Q measurements
EVM vs Symbol x Carrier
The "EVM vs Symbol x Carrier" result display shows the EVM for each carrier in each
symbol.
The x-axis represents the symbols. The y-axis represents the subcarriers. Different colors in the diagram area represent the EVM. A color map in the diagram header indicates the corresponding power levels.
24User Manual 1178.9226.02 ─ 06
Page 25
R&S®FSV3-K10x (LTE Uplink)
Remote command:
Selection: LAY:ADD ? '1',LEFT,EVSC
Query: TRACe:DATA?
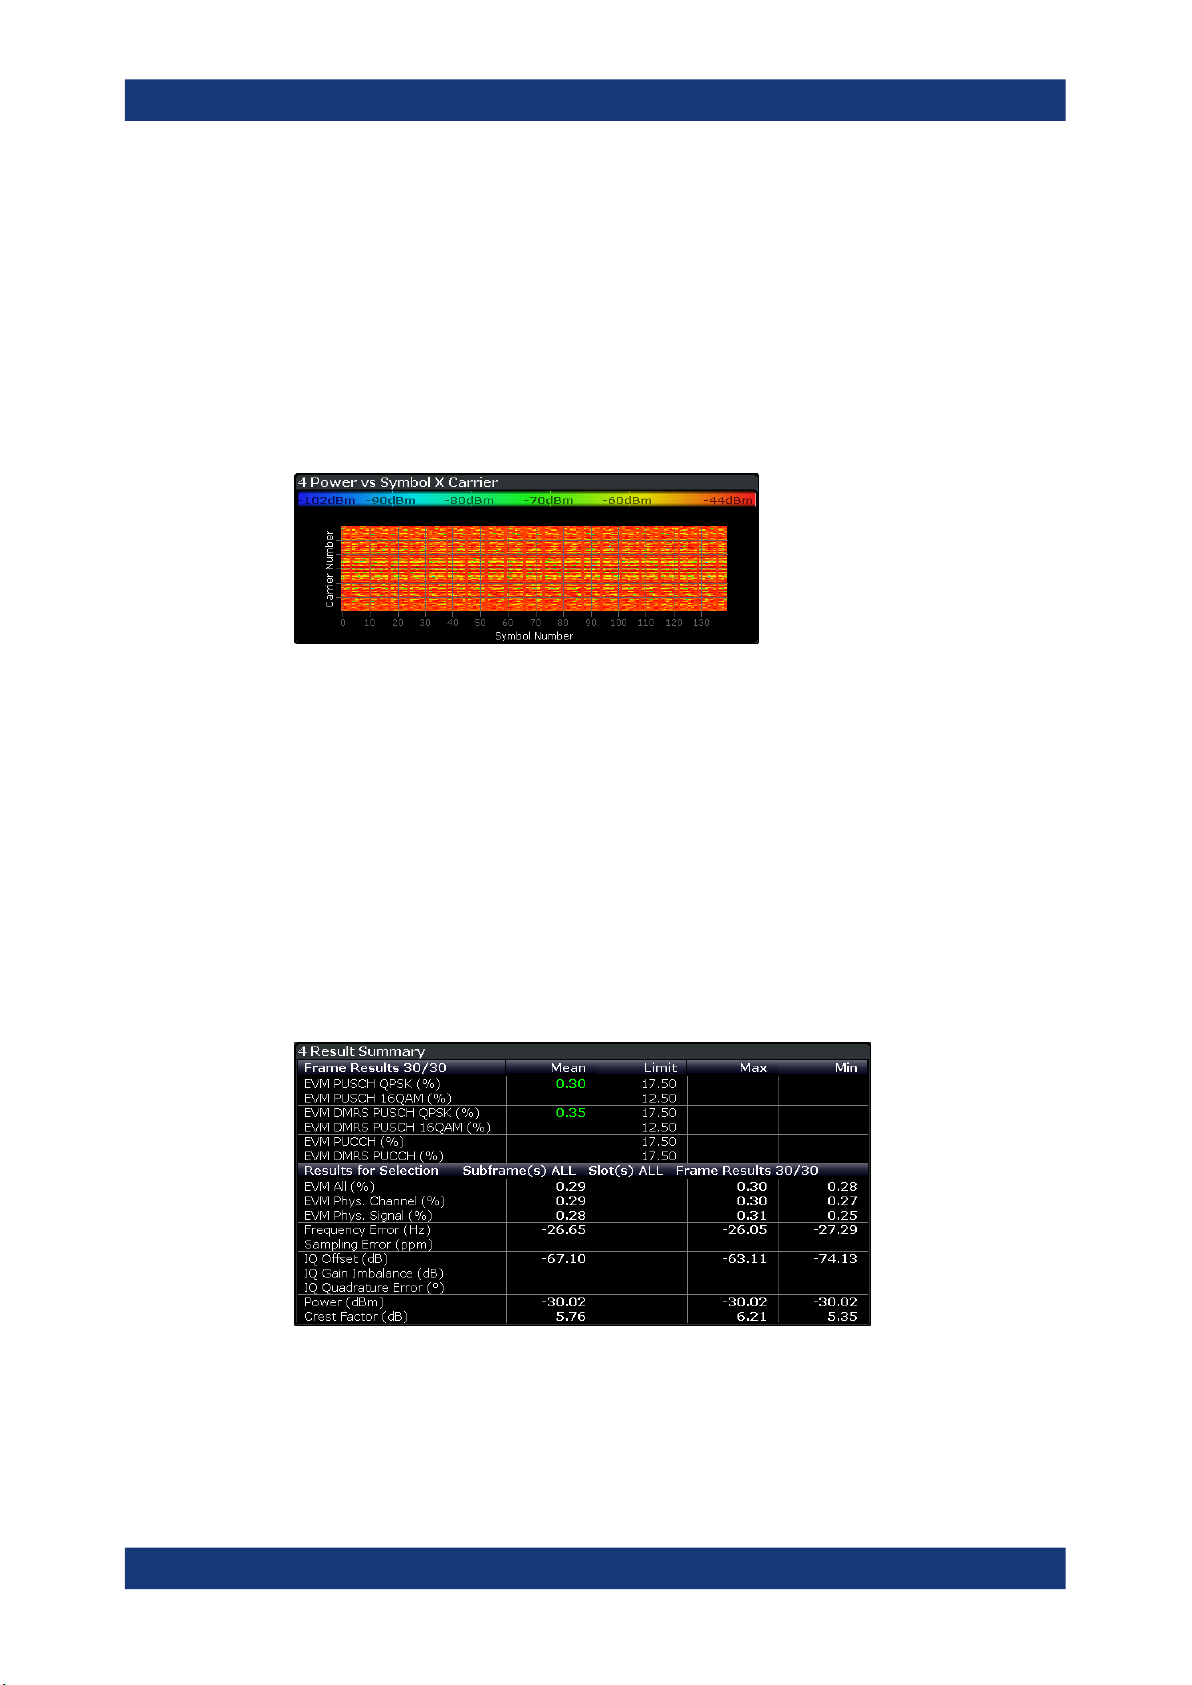
Power vs Symbol x Carrier
The "Power vs Symbol x Carrier" result display shows the power for each carrier in
each symbol.
The x-axis represents the symbols. The y-axis represents the subcarriers. Different colors in the diagram area represent the power. A color map in the diagram header indicates the corresponding power levels.
Remote command:
Selection: LAY:ADD ? '1',LEFT,PVSC
Query: TRACe:DATA?
Measurements and result displays
I/Q measurements
Result Summary
The Result Summary shows all relevant measurement results in numerical form, combined in one table.
Remote command:
LAY:ADD ? '1',LEFT,RSUM
Contents of the result summary
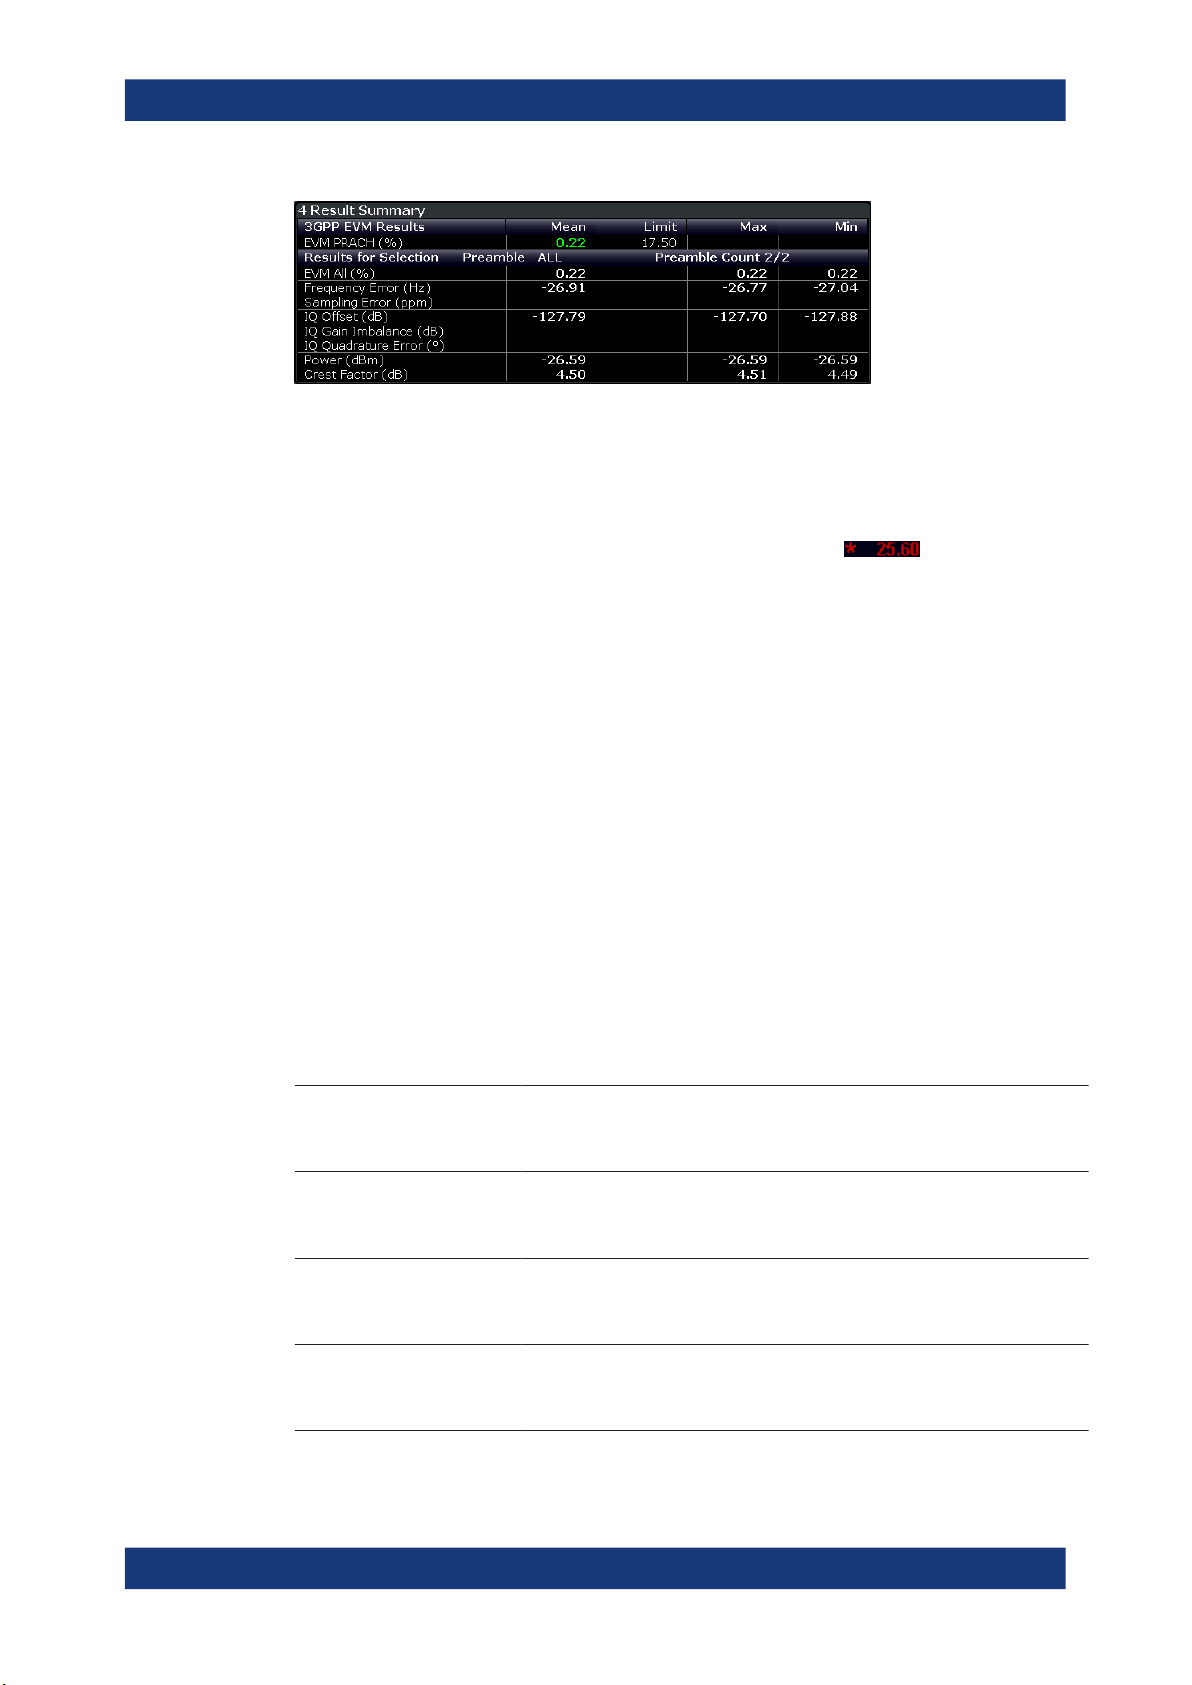
The contents of the result summary depend on the analysis mode you have selected.
The first screenshot shows the results for "PUSCH/PUCCH" analysis mode, the second one those for "PRACH" analysis mode.
Figure 3-3: Result summary in PUSCH/PUCCH analysis mode
25User Manual 1178.9226.02 ─ 06
Page 26
R&S®FSV3-K10x (LTE Uplink)
Figure 3-4: Result summary in PRACH analysis mode
The table is split in two parts. The first part shows results that refer to the complete
frame. It also indicates limit check results where available. The font of 'Pass' results is
green and that of 'Fail' results is red.
In addition to the red font, the application also puts a red star ( ) in front of
failed results.
The second part of the table shows results that refer to a specific selection of the
frame. The statistic is always evaluated over the slots. The header row of the table
contains information about the selection you have made (like the subframe).
Measurements and result displays
I/Q measurements
Note: The EVM results on a frame level (first part of the table) are calculated as
defined by 3GPP at the edges of the cyclic prefix.
The other EVM results (lower part of the table) are calculated at the optimal timing
position in the middle of the cyclic prefix.
Because of inter-symbol interference, the EVM calculated at the edges of the cyclic
prefix is higher than the EVM calculated in the middle of the cyclic prefix.
By default, all EVM results are in %. To view the EVM results in dB, change the EVM
Unit.
Table 3-1: Result summary: part containing results as defined by 3GPP (PUSCH/PUCCH analysis)
EVM PUSCH QPSK Shows the EVM for all QPSK-modulated resource elements of the PUSCH
channel in the analyzed frame.
FETCh[:CC<cc>]:SUMMary:EVM:USQP[:AVERage]? on page 144
EVM PUSCH 16QAM Shows the EVM for all 16QAM-modulated resource elements of the PUSCH
channel in the analyzed frame.
FETCh[:CC<cc>]:SUMMary:EVM:USST[:AVERage]? on page 144
EVM PUSCH 64QAM Shows the EVM for all 64QAM-modulated resource elements of the PUSCH
channel in the analyzed frame.
FETCh[:CC<cc>]:SUMMary:EVM:USSF[:AVERage]? on page 144
EVM PUSCH 256QAM Shows the EVM for all 256QAM-modulated resource elements of the PUSCH
channel in the analyzed frame.
FETCh[:CC<cc>]:SUMMary:EVM:USTS[:AVERage]? on page 145
EVM DMRS PUSCH QPSK Shows the EVM of all DMRS resource elements with QPSK modulation of the
PUSCH in the analyzed frame.
FETCh[:CC<cc>]:SUMMary:EVM:SDQP[:AVERage]? on page 142
26User Manual 1178.9226.02 ─ 06
Page 27

R&S®FSV3-K10x (LTE Uplink)
EVM DMRS PUSCH 16QAM Shows the EVM of all DMRS resource elements with 16QAM modulation of
EVM DMRS PUSCH 64QAM Shows the EVM of all DMRS resource elements with 64QAM modulation of
Measurements and result displays
I/Q measurements
the PUSCH in the analyzed frame.
FETCh[:CC<cc>]:SUMMary:EVM:SDST[:AVERage]? on page 142
the PUSCH in the analyzed frame.
FETCh[:CC<cc>]:SUMMary:EVM:SDSF[:AVERage]? on page 142
EVM DMRS PUSCH
256QAM
EVM PUCCH Shows the EVM of all resource elements of the PUCCH channel in the ana-
EVM DMRS PUCCH Shows the EVM of all DMRS resource elements of the PUCCH channel in the
Table 3-2: Result summary: part containing results as defined by 3GPP (PRACH analysis)
EVM PRACH Shows the EVM of all resource elements of the PRACH channel in the ana-
Table 3-3: Result summary: part containing results for a specific selection
EVM All Shows the EVM for all resource elements in the analyzed frame.
EVM Phys Channel Shows the EVM for all physical channel resource elements in the analyzed
Shows the EVM of all DMRS resource elements with 256QAM modulation of
the PUSCH in the analyzed frame.
FETCh[:CC<cc>]:SUMMary:EVM:SDTS[:AVERage]? on page 143
lyzed frame.
FETCh[:CC<cc>]:SUMMary:EVM:UCCH[:AVERage]? on page 143
analyzed frame.
FETCh[:CC<cc>]:SUMMary:EVM:UCCD[:AVERage]? on page 143
lyzed frame.
FETCh[:CC<cc>]:SUMMary:EVM:UPRA[:AVERage]? on page 143
FETCh[:CC<cc>]:SUMMary:EVM[:ALL][:AVERage]? on page 146
frame.
A physical channel corresponds to a set of resource elements carrying infor-
mation from higher layers. PUSCH, PUCCH and PRACH are physical channels. For more information, see 3GPP 36.211.
FETCh[:CC<cc>]:SUMMary:EVM:PCHannel[:AVERage]? on page 146
("PUSCH/PUCCH" analysis mode only.)
EVM Phys Signal Shows the EVM for all physical signal resource elements in the analyzed
frame.
The reference signal is a physical signal. For more information, see 3GPP
36.211.
FETCh[:CC<cc>]:SUMMary:EVM:PSIGnal[:AVERage]? on page 147
("PUSCH/PUCCH" analysis mode only.)
Frequency Error Shows the difference in the measured center frequency and the reference
center frequency.
FETCh[:CC<cc>]:SUMMary:FERRor[:AVERage]? on page 147
Sampling Error Shows the difference in measured symbol clock and reference symbol clock
relative to the system sampling rate.
FETCh[:CC<cc>]:SUMMary:SERRor[:AVERage]? on page 149
I/Q Offset Shows the power at spectral line 0 normalized to the total transmitted power.
FETCh[:CC<cc>]:SUMMary:IQOFfset[:AVERage]? on page 148
27User Manual 1178.9226.02 ─ 06
Page 28
R&S®FSV3-K10x (LTE Uplink)
I/Q Gain Imbalance Shows the logarithm of the gain ratio of the Q-channel to the I-channel.
I/Q Quadrature Error Shows the measure of the phase angle between Q-channel and I-channel
Power Shows the average time domain power of the allocated resource blocks of the
Crest Factor Shows the peak-to-average power ratio of captured signal.
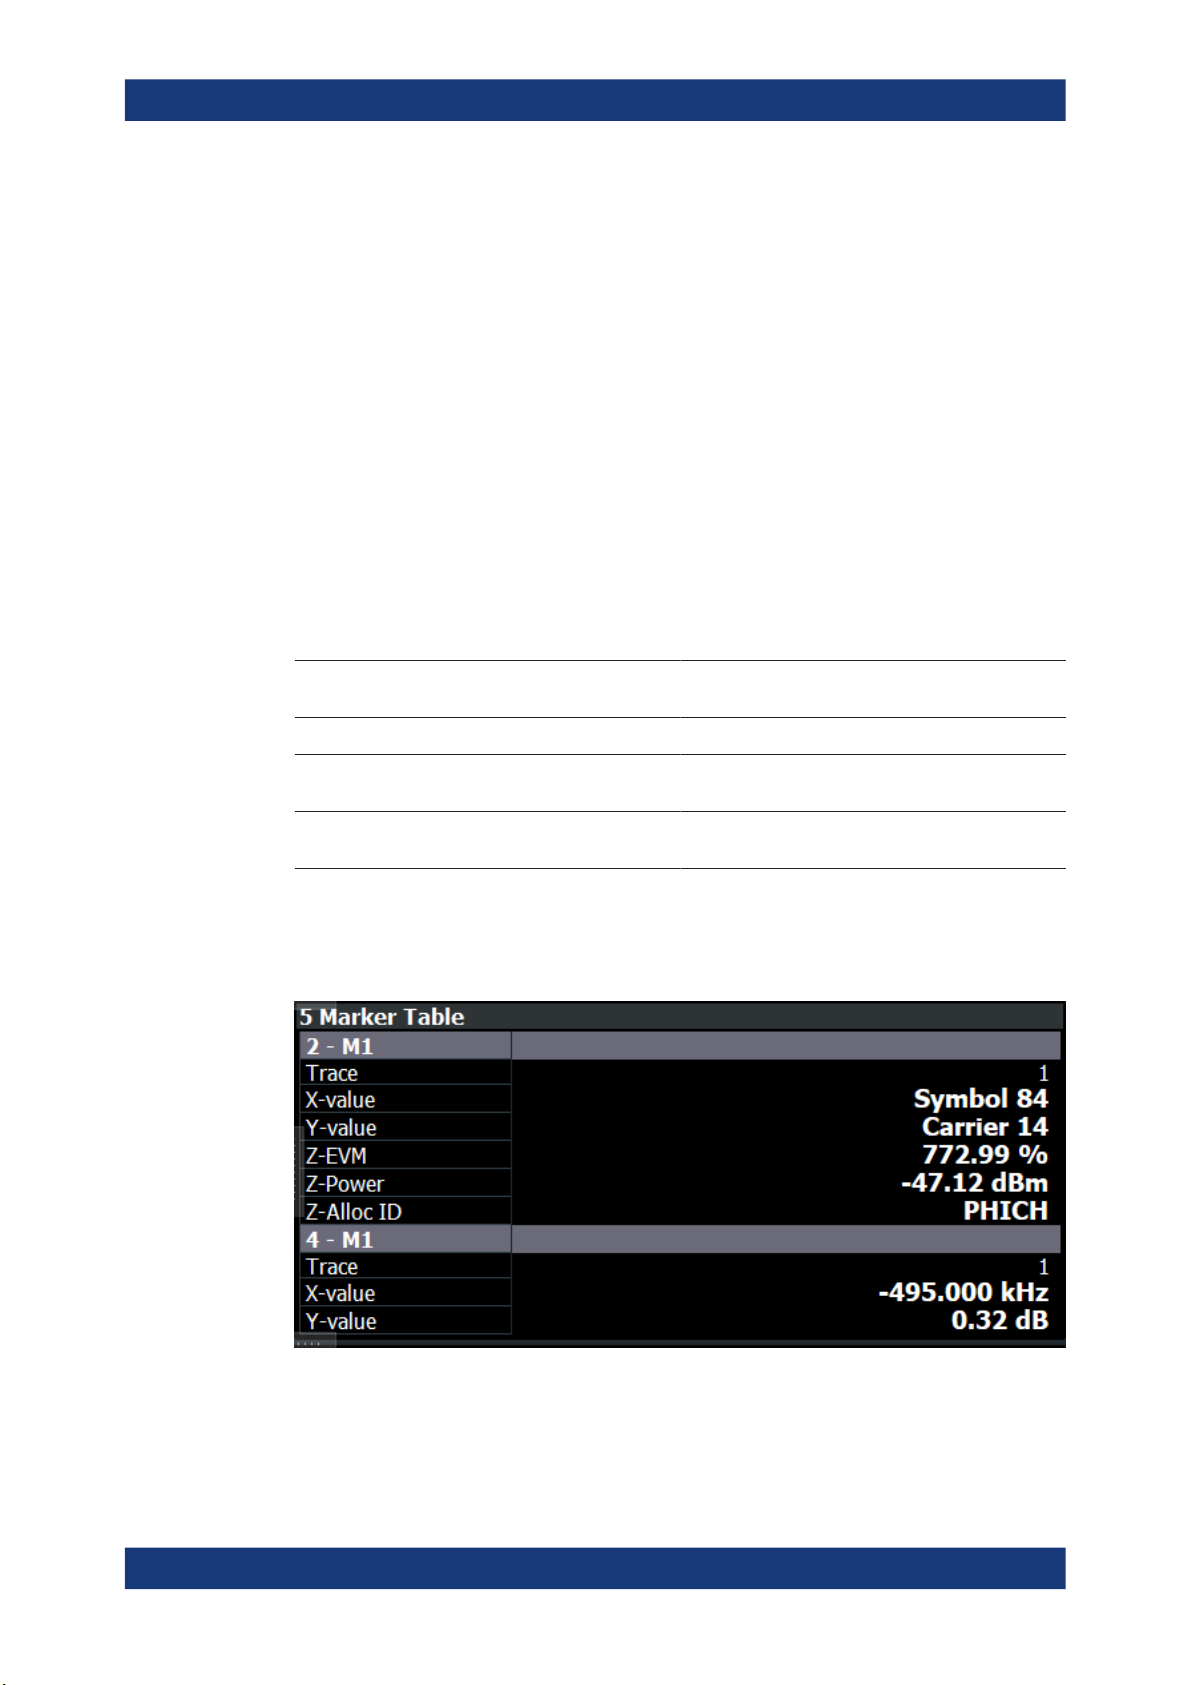
Marker Table
Displays a table with the current marker values for the active markers.
This table is displayed automatically if configured accordingly.
Wnd Shows the window the marker is in.
Type Shows the marker type and number ("M" for a nor-
Measurements and result displays
I/Q measurements
FETCh[:CC<cc>]:SUMMary:GIMBalance[:AVERage]? on page 147
deviating from the ideal 90 degrees.
FETCh[:CC<cc>]:SUMMary:QUADerror[:AVERage]? on page 149
analyzed signal.
FETCh[:CC<cc>]:SUMMary:POWer[:AVERage]? on page 148
FETCh[:CC<cc>]:SUMMary:CRESt[:AVERage]? on page 146
mal marker, "D" for a delta marker).
Trc Shows the trace that the marker is positioned on.
Ref Shows the reference marker that a delta marker
refers to.
X- / Y-Value Shows the marker coordinates (usually frequency
and level).
Z-EVM
Z-Power
Z-Alloc ID
Shows the "EVM", power and allocation type at the
marker position.
Only in 3D result displays (for example "EVM vs
Symbol x Carrier").
Tip: To navigate within long marker tables, simply scroll through the entries with your
finger on the touchscreen.
28User Manual 1178.9226.02 ─ 06
Page 29

R&S®FSV3-K10x (LTE Uplink)
Remote command:
LAY:ADD? '1',RIGH, MTAB, see LAYout:ADD[:WINDow]? on page 116
Results:
CALCulate<n>:MARKer<m>:X on page 152
CALCulate<n>:MARKer<m>:Y on page 153
CALCulate<n>:MARKer<m>:Z? on page 154
CALCulate<n>:MARKer<m>:Z:ALL? on page 154
3.5 Time alignment error measurements
Access: [MEAS] > "Time Alignment Error"
The time alignment error measurement captures and analyzes new I/Q data when you
select it.
Note that the time alignment error measurement only work in a MIMO setup (2 or 4
antennas) or a system with component carriers. Therefore, you have to mix the signal
of the antennas into one cable that you can connect to the R&S FSV/A. For more information on configuring and performing a time alignment error measurement see Chap-
ter 4.4, "Performing time alignment measurements", on page 44.
Measurements and result displays
Time alignment error measurements
In addition to the result displays mentioned in this section, the time alignment error
measurement also supports the following result displays described elsewhere.
●
"Capture Buffer" on page 16
●
"Power Spectrum" on page 19
●
"Marker Table" on page 28
You can select the result displays from the evaluation bar and arrange them as you like
with the SmartGrid functionality.
Remote command:
Measurement selection: CONFigure[:LTE]:MEASurement on page 168
Result display selection: LAYout:ADD[:WINDow]? on page 116
Time Alignment Error.................................................................................................... 29
Carrier Frequency Error................................................................................................ 30
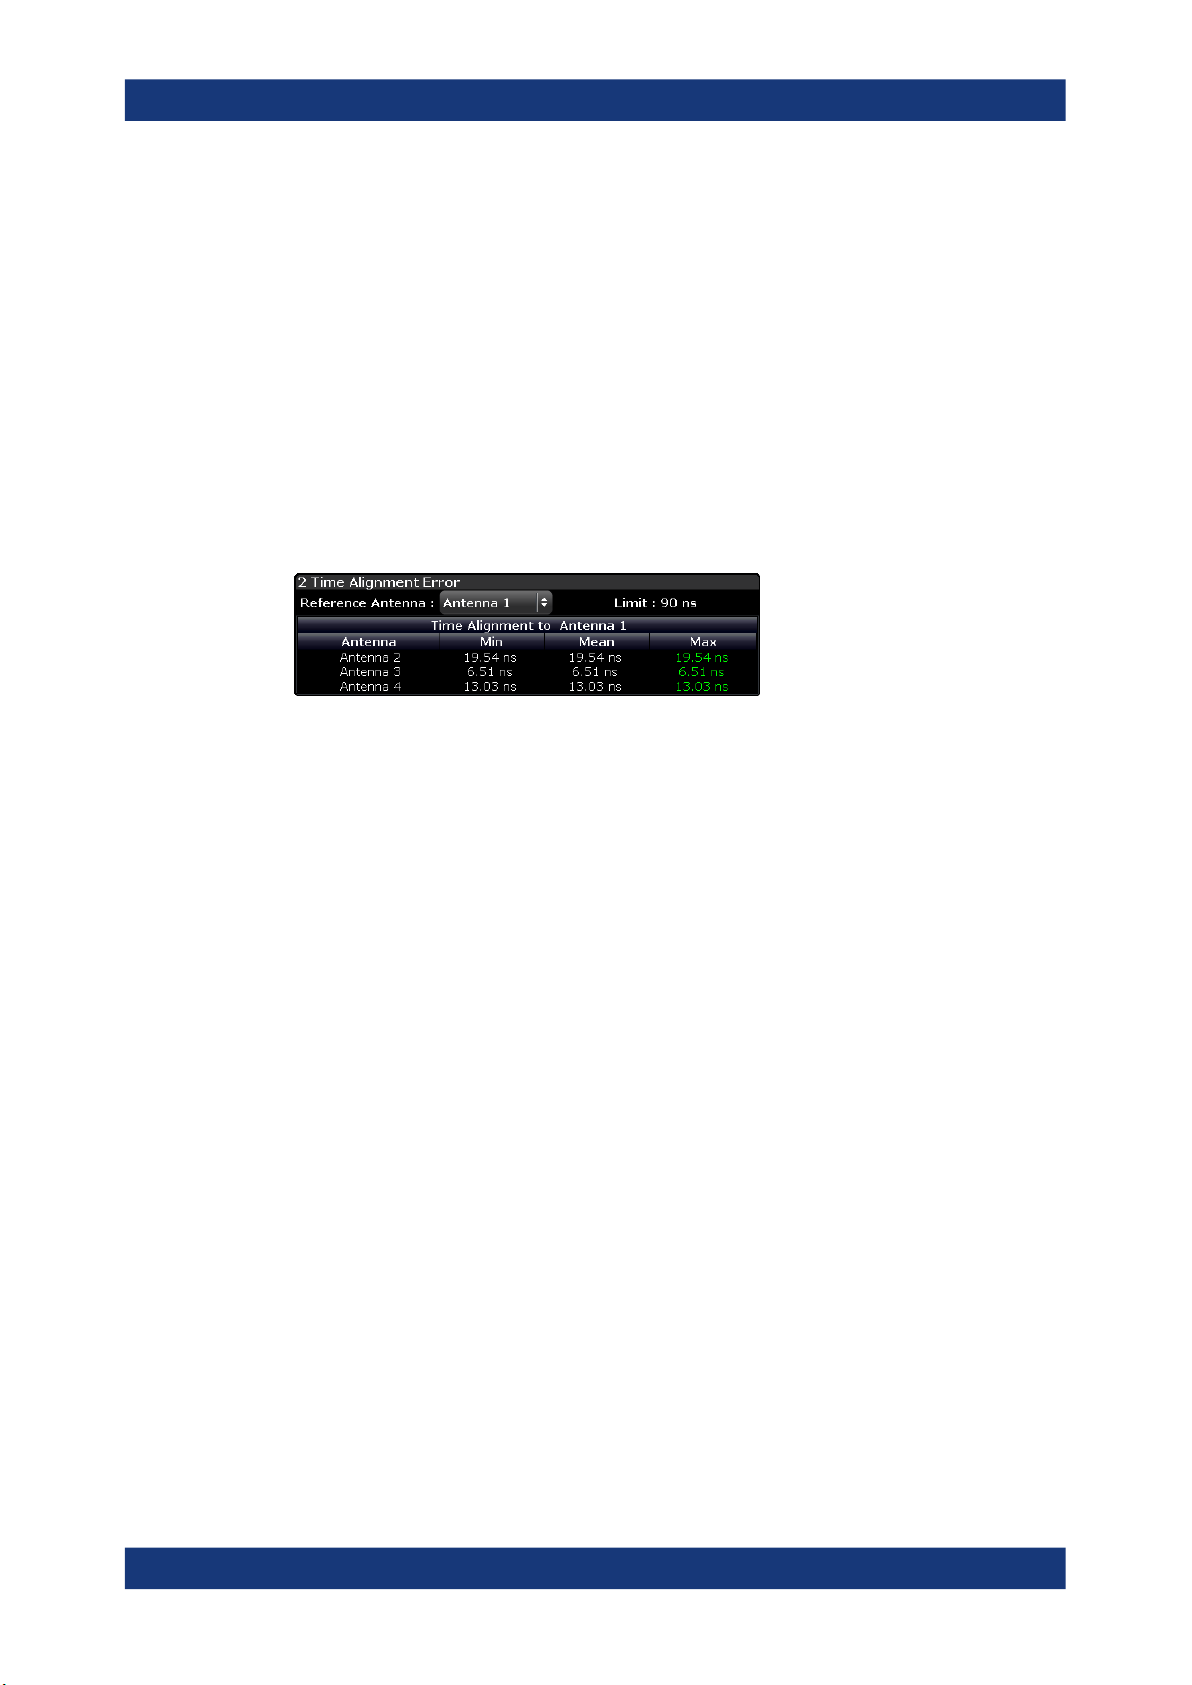
Time Alignment Error
The time alignment is an indicator of how well the transmission antennas in a MIMO
system and component carriers are synchronized. The time alignment error is either
the time delay between a reference antenna (for example antenna 1) and another
antenna or the time delay between a reference component carrier and other component carriers.
The application shows the results in a table.
Each row in the table represents one antenna. The reference antenna is not shown.
For each antenna, the maximum, minimum and average time delay that has been
measured is shown. The minimum and maximum results are calculated only if the
measurement covers more than one subframe.
29User Manual 1178.9226.02 ─ 06
Page 30
R&S®FSV3-K10x (LTE Uplink)
If you perform the measurement on a system with carrier aggregation, each row represents one antenna. The number of lines increases because of multiple carriers. The
reference antenna of the main component carrier (CC1) is not shown.
In case of carrier aggregation, the time alignment error measurement also evaluates
the "Carrier Frequency Error" on page 30 of the component carrier (CC2) relative to
the main component carrier (CC1).
In any case, results are only displayed if the transmission power of both antennas is
within 15 dB of each other. Likewise, if only one antenna transmits a signal, results will
not be displayed (for example if the cabling on one antenna is faulty).
For more information on configuring this measurement see Chapter 5.3, "Time align-
ment error measurements", on page 92.
The "Limit" value shown in the result display is the maximum time delay that may occur
for each antenna (only displayed for systems without carrier aggregation).
Measurements and result displays
Time alignment error measurements
You can select the reference antenna from the dropdown menu in the result display.
You can also select the reference antenna in the MIMO Setup - if you change them in
one place, they are also changed in the other.
In the default layout, the application also shows the "Capture Buffer" and "Power Spectrum" result displays for each component carrier.
Remote command:
Selection: LAY:ADD ? '1',LEFT,TAL
Query: FETCh:TAERror[:CC<cc>]:ANTenna<ant>[:AVERage]? on page 151
Carrier Frequency Error
The "Carrier Frequency Error" shows the frequency deviation between a reference carrier (usually component carrier 1) and another component carrier. It is an indicator of
how well the component carriers in a system with carrier aggregation are synchronized.
The application shows the results in a table.
For each component carrier, the application adds two rows to the table.
●
The first row shows the lowest, average and highest frequency error that has been
measured in Hz. In addition, the limit defined by 3GPP for that scenario is displayed. Note that the application always tests against the highest measured value;
if the limit has been violated, the font color of the maximum value turns red.
If you measure a single slot only, the lowest, average and highest valued are the
same.
●
The second row shows the lowest, average and highest frequency error that has
been measured in ppm. In addition, the limit defined by 3GPP for that scenario is
displayed.
If you measure a single slot only, the lowest, average and highest valued are the
same.
The reference component carrier is not represented in the table.
30User Manual 1178.9226.02 ─ 06
Page 31

R&S®FSV3-K10x (LTE Uplink)
Remote command:
In Hz: FETCh:FERRor[:CC<cc>][:AVERage]? on page 150
In ppm: FETCh:FEPPm[:CC<cc>][:AVERage]? on page 150
3.6 Frequency sweep measurements
Access (ACLR): [MEAS] > "Channel Power ACLR"
Access (MC ACLR): [MEAS] > "Multi Carrier ACLR"
Access (SEM): [MEAS] > "Spectrum Emission Mask"
The LTE aplication supports the following frequency sweep measurements.
●
Adjacent channel leakage ratio (ACLR)
●
Spectrum emission mask (SEM)
Instead of using I/Q data, the frequency sweep measurements sweep the spectrum
every time you run a new measurement. Therefore, it is mandatory to feed a signal into
the RF input for these measurements. Using previously acquired I/Q data for the frequency sweep measurements is not possible (and vice-versa).
Measurements and result displays
Frequency sweep measurements
Because each of the frequency sweep measurements uses different settings to obtain
signal data it is also not possible to run a frequency sweep measurement and view the
results in another frequency sweep measurement.
Make sure to have sufficient bandwidth to be able to capture the whole signal, including neighboring channels.
In addition to the specific diagrams and table (see description below), frequency sweep
measurements support the following result displays.
●
"Marker Table" on page 28
●
Marker peak list
Both result displays have the same contents as the spectrum application.
Remote command:
Measurement selection: CONFigure[:LTE]:MEASurement on page 168
Result display selection: LAYout:ADD[:WINDow]? on page 116
Adjacent Channel Leakage Ratio (ACLR).....................................................................32
└ Result diagram................................................................................................32
└ Result summary..............................................................................................33
Spectrum Emission Mask (SEM).................................................................................. 33
└ Result diagram................................................................................................33
└ Result summary..............................................................................................34
Multi Carrier ACLR (MC ACLR).................................................................................... 35
└ Result diagram................................................................................................35
└ Result summary..............................................................................................36
Marker Peak List........................................................................................................... 37
31User Manual 1178.9226.02 ─ 06
Page 32

R&S®FSV3-K10x (LTE Uplink)
Adjacent Channel Leakage Ratio (ACLR)
The adjacent channel leakage ratio (ACLR) measurement is designed to analyze signals that contain multiple signals for different radio standards. Using the ACLR measurement, you can determine the power of the transmit (Tx) channel and the power of
the neighboring (adjacent) channels to the left and right of the Tx channel. Thus, the
ACLR measurement provides information about the power in the adjacent channels as
well as the leakage into these adjacent channels.
When you measure the ACLR in the LTE application, the R&S FSV/A automatically
selects appropriate ACLR settings based on the selected channel bandwidth.
For a comprehensive description of the ACLR measurement, refer to the user manual
of the R&S FSV/A.
Remote command:
Selection: CONF:MEAS ACLR
Result diagram ← Adjacent Channel Leakage Ratio (ACLR)
The result diagram is a graphic representation of the signals with a trace that shows
the measured signal. Individual channels (Tx and adjacent channels) are indicated by
vertical lines and corresponding labels.
In addition, the R&S FSV/A highlights the channels (blue: Tx channel, green: adjacent
channels).
The x-axis represents the frequency with a frequency span that relates to the specified
LTE channel and adjacent channel bandwidths. On the y-axis, the power is plotted in
dBm.
The power for the Tx channel is an absolute value in dBm. The power of the adjacent
channels is relative to the power of the Tx channel.
In addition, the R&S FSV/A tests the ACLR measurement results against the limits
defined by 3GPP.
Measurements and result displays
Frequency sweep measurements
Remote command:
Result query: TRACe:DATA?
32User Manual 1178.9226.02 ─ 06
Page 33

R&S®FSV3-K10x (LTE Uplink)
Result summary ← Adjacent Channel Leakage Ratio (ACLR)
The result summary shows the signal characteristics in numerical form. Each row in
the table corresponds to a certain channel type (Tx, adjacent channel). The columns
contain the channel characteristics.
●
Channel
Shows the channel type (Tx, adjacent or alternate channel).
●
Bandwidth
Shows the channel bandwidth.
●
Offset
Shows the channel spacing.
●
Power
Shows the power of the Tx channel.
●
Lower / Upper
Shows the relative power of the lower and upper adjacent and alternate channels.
The values turn red if the power violates the limits.
●
Limit
Shows the limit of that channel, if one is defined.
Measurements and result displays
Frequency sweep measurements
Remote command:
Result query: CALCulate<n>:MARKer<m>:FUNCtion:POWer<sb>:RESult[:
CURRent]?
Spectrum Emission Mask (SEM)
Note: The SEM measurement also supports carrier aggregation up to two contiguous
component carriers. You can configure the component carriers in the Carrier Aggrega-
tion panel.
The "Spectrum Emission Mask" (SEM) measurement shows the quality of the measured signal by comparing the power values in the frequency range near the carrier
against a spectral mask that is defined by the 3GPP specifications. In this way, you can
test the performance of the DUT and identify the emissions and their distance to the
limit.
For a comprehensive description of the SEM measurement, refer to the user manual of
the R&S FSV/A.
Remote command:
Selection (SEM): CONF:MEAS ESP
Selection (Multi-SEM): CONF:MEAS MCES
Result diagram ← Spectrum Emission Mask (SEM)
The result diagram is a graphic representation of the signal with a trace that shows the
measured signal. The SEM is represented by a red line.
If any measured power levels are above that limit line, the test fails. If all power levels
are inside the specified limits, the test passes. The application labels the limit line to
indicate whether the limit check has passed or failed.
33User Manual 1178.9226.02 ─ 06
Page 34

R&S®FSV3-K10x (LTE Uplink)
The x-axis represents the frequency with a frequency span that relates to the specified
LTE channel bandwidths. The y-axis shows the signal power in dBm.
Remote command:
Result query: TRACe:DATA?
Measurements and result displays
Frequency sweep measurements
Result summary ← Spectrum Emission Mask (SEM)
The result summary shows the signal characteristics in numerical form. Each row in
the table corresponds to a certain SEM range. The columns contain the range characteristics. If a limit fails, the range characteristics turn red.
●
Start / Stop Freq Rel
Shows the start and stop frequency of each section of the spectrum emission mask
relative to the center frequency.
●
RBW
Shows the resolution bandwidth of each section of the spectrum emission mask.
●
Freq at Δ to Limit
Shows the absolute frequency whose power measurement being closest to the
limit line for the corresponding frequency segment.
●
Power Abs
Shows the absolute measured power of the frequency whose power is closest to
the limit. The application evaluates this value for each frequency segment.
●
Power Rel
Shows the distance from the measured power to the limit line at the frequency
whose power is closest to the limit. The application evaluates this value for each
frequency segment.
●
Δ to Limit
Shows the minimal distance of the tolerance limit to the SEM trace for the corresponding frequency segment. Negative distances indicate that the trace is below
the tolerance limit, positive distances indicate that the trace is above the tolerance
limit.
34User Manual 1178.9226.02 ─ 06
Page 35

R&S®FSV3-K10x (LTE Uplink)
Multi Carrier ACLR (MC ACLR)
The MC ACLR measurement is basically the same as the Adjacent Channel Leakage
Ratio (ACLR) measurement: it measures the power of the transmission channels and
neighboring channels and their effect on each other. Instead of measuring a single carrier, the MC ACLR measures two contiguous component carriers. You can configure
the component carriers in the Carrier Aggregation panel. Note that the component carriers have to be next to each other.
In its default state, the MC ACLR measurement measures three neighboring channels
above and below the carrier. One of the neighboring channels is assumed to be an
EUTRA channel (for example LTE) and the other two are assumed to be UTRA channels (for example WCDMA). Note that you can configure a different neighboring channel setup with the tools provided by the measurement. These tools are the same as
those provided in the spectrum application. For more information, please refer to the
documentation of the R&S FSV/A.
Measurements and result displays
Frequency sweep measurements
The configuration in its default state complies with the test specifications defined in
3GPP 36.521.
Remote command:
Selection: CONF:MEAS MCAC
Result diagram ← Multi Carrier ACLR (MC ACLR)
The result diagram is a graphic representation of the signals with a trace that shows
the measured signal. Individual channels (Tx and adjacent channels) are indicated by
vertical lines and corresponding labels.
In addition, the R&S FSV/A highlights the channels (blue: Tx channel, green: adjacent
channels).
The x-axis represents the frequency with a frequency span that relates to the LTE
channel characteristics and adjacent channel bandwidths. Note that the application
automatically determines the center frequency of the measurement according to the
frequencies of the carriers.
On the y-axis, the power is plotted in dBm. The power for the TX channels is an absolute value in dBm. The powers of the adjacent channels are values relative to the
power of the TX channel. The power of the channels is automatically tested against the
limits defined by 3GPP.
The result display contains several additional elements.
●
Blue and green lines:
Represent the bandwidths of the carriers (blue lines) and those of the neighboring
channels (green lines). Note that the channels can overlap each other.
●
Blue and green bars:
35User Manual 1178.9226.02 ─ 06
Page 36

R&S®FSV3-K10x (LTE Uplink)
Represent the integrated power of the transmission channels (blue bars) and
neighboring channels (green bars).
Remote command:
TRACe:DATA?
Measurements and result displays
Frequency sweep measurements
Result summary ← Multi Carrier ACLR (MC ACLR)
The result summary shows the signal characteristics in numerical form. Each row in
the table corresponds to a certain channel type (Tx, adjacent channel). The columns
contain the channel characteristics.
A table above the result display contains information about the measurement in numerical form:
●
Channel
Shows the type of channel.
The first rows represent the aggregated carrier ("CA EUTRA Ref" and "Total": they
show the characteristics of the aggregated channel and thus are basically the
same). Regarding its characteristics, the two carriers are regarded as a single
channel.
The other rows represent the neighboring channels (one E-UTRA and two UTRA
channels).
The other rows represent the neighboring channels (Adj Lower / Upper and Alt1
Lower / Upper).
●
Bandwidth
Shows the bandwidth of the channel.
The bandwidth of the carrier is the sum of the two component carriers.
●
Offset
Frequency offset relative to the center frequency of the aggregated carrier.
●
Power / Lower / Upper / Gap
Shows the power of the carrier and the power of the lower and upper neighboring
channels relative to the power of the aggregated carrier.
36User Manual 1178.9226.02 ─ 06
Page 37

R&S®FSV3-K10x (LTE Uplink)
Note that the font of the results turns red if the signal violates the limits defined by
3GPP.
Remote command:
Result query: CALCulate<n>:MARKer<m>:FUNCtion:POWer<sb>:RESult[:
CURRent]? on page 140
Limit check adjacent: CALCulate<n>:LIMit<li>:ACPower:ACHannel:RESult?
on page 156
Limit check alternate: CALCulate<n>:LIMit<li>:ACPower:ALTernate<alt>:
RESult? on page 157
Marker Peak List
The marker peak list determines the frequencies and levels of peaks in the spectrum or
time domain. How many peaks are displayed can be defined, as well as the sort order.
In addition, the detected peaks can be indicated in the diagram. The peak list can also
be exported to a file for analysis in an external application.
Measurements and result displays
3GPP test scenarios
Tip: To navigate within long marker peak lists, simply scroll through the entries with
your finger on the touchscreen.
Remote command:
LAY:ADD? '1',RIGH, PEAK, see LAYout:ADD[:WINDow]? on page 116
Results:
CALCulate<n>:MARKer<m>:X on page 152
CALCulate<n>:MARKer<m>:Y on page 153
3.7 3GPP test scenarios
3GPP defines several test scenarios for measuring user equipment. These test scenarios are described in detail in 3GPP TS 36.521-1.
37User Manual 1178.9226.02 ─ 06
Page 38

R&S®FSV3-K10x (LTE Uplink)
The following table provides an overview which measurements available in the LTE
application are suited to use for the test scenarios in the 3GPP documents.
Table 3-4: Test scenarios for E-TMs as defined by 3GPP (3GPP TS 36.521-1)
Test scenario Test described in Measurement
UE maximum output power chapter 6.2.2 Power (➙ "Result Summary")
Maximum power reduction chapter 6.2.3 Power (➙ "Result Summary")
Measurements and result displays
3GPP test scenarios
Additional maximum power reduc-
chapter 6.2.4 Power (➙ "Result Summary")
tion
Configured UE-transmitted output
chapter 6.2.5 Power (➙ "Result Summary")
power
Minimum output power chapter 6.3.2 Power (➙ "Result Summary")
Transmit off power chapter 6.3.3 n/a
On/off time mask chapter 6.3.4 n/a
Power control chapter 6.3.5 n/a
Frequency error chapter 6.5.1 Frequency error (➙ "Result Sum-
mary")
Transmit modulation chapter 6.5.2.1 EVM results
Occupied bandwidth chapter 6.6.1
chapter 6.5.2.2 I/Q offset (➙ "Result Summary")
chapter 6.5.2.3 Inband emission
chapter 6.5.2.4 Spectrum flatness
Occupied bandwidth
1
Out of band emission chapter 6.6.2.1 Spectrum emission mask
Spurious emissions chapter 6.6.3.1
chapter 6.6.2.2 Spectrum emission mask
chapter 6.6.2.3 ACLR
1
1
1
chapter 6.6.3.2
chapter 6.6.3.3
Spurious emissions
Spurious emissions
Spurious emissions
Transmit intermodulation chapter 6.7 ACLR
Time alignment chapter 6.8 Time alignment
1
these measurements are available in the spectrum application of the Rohde & Schwarz signal and spec-
trum analyzers (for example the R&S FSW)
38User Manual 1178.9226.02 ─ 06
Page 39

R&S®FSV3-K10x (LTE Uplink)
4 Measurement basics
● Symbols and variables............................................................................................39
● Overview................................................................................................................. 40
● The LTE uplink analysis measurement application.................................................40
● Performing time alignment measurements............................................................. 44
● SRS EVM calculation..............................................................................................45
4.1 Symbols and variables
The following chapters use various symbols and variables in the equations that the
measurements are based on. The table below explains these symbols for a better
understanding of the measurement principles.
Measurement basics
Symbols and variables
a
l,kâl,k
A
l,k
Δf, Δ
coarse
Δf
res
ζ
H
l,k, l,k
i time index
î
, î
coarse
fine
k subcarrier index
l SC-FDMA symbol index
N
DS
N
FFT
N
g
N
s
N
TX
data symbol (actual, decided)
data symbol after DFT-precoding
carrier frequency offset between transmitter and
receiver (actual, coarse estimate)
residual carrier frequency offset
relative sampling frequency offset
channel transfer function (actual, estimate)
timing estimate (coarse, fine)
number of SC-FDMA data symbols
length of FFT
number of samples in cyclic prefix (guard interval)
number of Nyquist samples
number of allocated subcarriers
N
k,l
n index of modulated QAM symbol before DFT pre-
Φ
l
r
i
R'
k,l
noise sample
coding
common phase error
received sample in the time domain
uncompensated received sample in the frequency
domain
39User Manual 1178.9226.02 ─ 06
Page 40

R&S®FSV3-K10x (LTE Uplink)
Measurement basics
The LTE uplink analysis measurement application
r
n,l
T duration of the useful part of an SC-FDMA symbol
T
g
T
s
4.2 Overview
The digital signal processing (DSP) involves several stages until the software can present results like the EVM.
The contents of this chapter are structured like the DSP.
equalized received symbols of measurement path
after IDFT
duration of the guard interval
total duration of SC-FDMA symbol
4.3 The LTE uplink analysis measurement application
The block diagram in Figure 4-1 shows the general structure of the LTE uplink measurement application from the capture buffer containing the I/Q data up to the actual
analysis block.
After synchronization a fully compensated signal is produced in the reference path
(purple) which is subsequently passed to the equalizer. An IDFT of the equalized symbols yields observations for the QAM transmit symbols a
mates â
are obtained via hard decision. Likewise a user defined compensation as
n,l
well as equalization is carried out in the measurement path (cyan) and after an IDFT
the observations of the QAM transmit symbols are provided. Accordingly, the measurement path might still contain impairments which are compensated in the reference
path. The symbols of both signal processing paths form the basis for the analysis.
from which the data esti-
n.l
40User Manual 1178.9226.02 ─ 06
Page 41

R&S®FSV3-K10x (LTE Uplink)
Measurement basics
The LTE uplink analysis measurement application
Figure 4-1: Block diagram for the LTE UL measurement application
4.3.1 Synchronization
In a first step the areas of sufficient power are identified within the captured I/Q data
stream which consists of the receive samples ri. For each area of sufficient power, the
analyzer synchronizes on subframes of the uplink generic frame structure [3]. After this
coarse timing estimation, the fractional part as well as the integer part of the carrier frequency offset (CFO) are estimated and compensated. In order to obtain an OFDM
demodulation via FFT of length N
lished which refines the coarse timing estimate.
A phase tracking based on the reference SC-FDMA symbols is performed in the frequency domain. The corresponding tracking estimation block provides estimates for
●
the relative sampling frequency offset ζ
●
the residual carrier frequency offset Δf
●
the common phase error Φ
According to references [7] and [8], the uncompensated samples R'
ded domain can be stated as
that is not corrupted by ISI, a fine timing is estab-
FFT
res
l
in the DFT-preco-
k,l
41User Manual 1178.9226.02 ─ 06
Page 42

R&S®FSV3-K10x (LTE Uplink)
lk
lTfNNjlkNNjj
lklklk
NeeeHAR
CFOres
resFFTS
SFO
FFTS
CPE
l
,
22
,,
'
,
.
2
,
,,
,
ˆ
~
ln
lnln
kl
aE
ar
EVM
lnlnln
arEVM
,,,
ˆ
~
Equation 4-1:
with
●
the DFT precoded data symbol A
●
the channel transfer function H
●
the number of Nyquist samples NS within the total duration TS,
●
the duration of the useful part of the SC-FDMA symbol T=TS-T
●
the independent and Gaussian distributed noise sample N
Within one SC-FDMA symbol, both the CPE and the residual CFO cause the same
phase rotation for each subcarrier, while the rotation due to the SFO depends linearly
on the subcarrier index. A linear phase increase in symbol direction can be observed
for the residual CFO as well as for the SFO.
Measurement basics
The LTE uplink analysis measurement application
on subcarrier k at SC-FDMA symbol l,
k,l
,
k,l
g
k,l
The results of the tracking estimation block are used to compensate the samples R'
completely in the reference path and according to the user settings in the measure-
ment path. Thus the signal impairments that are of interest to the user are left uncompensated in the measurement path.
After having decoded the data symbols in the reference path, an additional data-aided
phase tracking can be utilized to refine the common phase error estimation.
4.3.2 Analysis
The analysis block of the EUTRA/LTE uplink measurement application allows to compute a variety of measurement variables.
EVM
The most important variable is the error vector magnitude which is defined as
Equation 4-2:
for QAM symbol n before precoding and SC-FDMA symbol l. Since the normalized
average power of all possible constellations is 1, the equation can be simplified to
k,l
Equation 4-3:
The average EVM of all data subcarriers is then
42User Manual 1178.9226.02 ─ 06
Page 43

R&S®FSV3-K10x (LTE Uplink)
101
0
2
,
1
LB TX
NlN
n
ln
TXDS
data
EVM
NN
EVM
tsjQtsItr
|1|balancegain modulator Q
}1arg{mismatch quadrature Q
S
RB
Tt
Nc
c
RBS
RBabsolute
RBrelative
ftY
NT
Emissions
Emissions
112
2
,
1
Equation 4-4:
for NDS SC-FDMA data symbols and the NTX allocated subcarriers.
I/Q imbalance
The I/Q imbalance contained in the continuous received signal r(t) can be written as
Equation 4-5:
where s(t) is the transmit signal and I and Q are the weighting factors describing the
I/Q imbalance. We define that I:=1 and Q:=1+ΔQ.
The I/Q imbalance estimation makes it possible to evaluate the
Measurement basics
The LTE uplink analysis measurement application
Equation 4-6:
and the
Equation 4-7:
based on the complex-valued estimate .
Basic in-band emissions measurement
The in-band emissions are a measure of the interference falling into the non-allocated
resources blocks.
The relative in-band emissions are given by
Equation 4-8:
where TS is a set |TS| of SC-FDMA symbols with the considered modulation scheme
being active within the measurement period, ΔRB is the starting frequency offset
between the allocated RB and the measured non-allocated RB (e.g. ΔRB=1 or ΔRB=-1
for the first adjacent RB), c is the lower edge of the allocated BW, and Y(t,f) is the fre-
quency domain signal evaluated for in-band emissions. NRB is the number of allocated
RBs .
The basic in-band emissions measurement interval is defined over one slot in the time
domain.
43User Manual 1178.9226.02 ─ 06
Page 44

R&S®FSV3-K10x (LTE Uplink)
Other measurement variables
Without going into detail, the EUTRA/LTE uplink measurement application additionally
provides the following results:
●
Total power
●
Constellation diagram
●
Group delay
●
I/Q offset
●
Crest factor
●
Spectral flatness
4.4 Performing time alignment measurements
The measurement application allows you to perform time alignment measurements
between different antennas.
Measurement basics
Performing time alignment measurements
The measurement supports setups of up to two Tx antennas.
The result of the measurement is the time alignment error. The time alignment error is
the time offset between a reference antenna (for example antenna 1) and another
antenna.
The time alignment error results are summarized in the corresponding result display.
A schematic description of the results is provided in Figure 4-2.
Tx Antenna 1 (Reference)
Time
Tx Antenna 2
LTE Frame Start Indicator
Figure 4-2: Time Alignment Error (2 Tx antennas)
Time Alignment Error
Δ2,1
Time
Test setup
Successful Time Alignment measurements require a correct test setup.
A typical test setup is shown in Figure 4-3.
44User Manual 1178.9226.02 ─ 06
Page 45

R&S®FSV3-K10x (LTE Uplink)
Tx Ant 1
DUT
Tx Ant 2
Figure 4-3: Hardware setup
For best measurement result accuracy, it is recommended to use cables of the same
length and identical combiners as adders.
In the application, make sure to correctly apply the following settings.
●
Select a reference antenna in the MIMO Configuration dialog box (not "All")
●
Select more than one antenna in the MIMO Configuration dialog box
●
Select Codeword-to-Layer mapping "2/1" or "2/2"
●
Select an Auto Demodulation different to "Subframe Configuration & DMRS"
●
The transmit signals of all available Tx antennas have to be added together
Measurement basics
SRS EVM calculation
FSx
+
4.5 SRS EVM calculation
In order to calculate an accurate EVM, a channel estimation needs to be done prior to
the EVM calculation. However, the channel estimation requires a minimum of two
resource elements containing reference symbols on a subcarrier. Depending on the
current Channel Estimation Range setting, this means that either at least two reference
symbols ("Pilot Only") or one reference symbol and at least one data symbol ("Pilot
and Payload") need to be available on the subcarrier the EVM is to be measured.
For PUSCH, PUCCH and PRACH regions, these conditions are normally fulfilled
because the DMRS (= Demodulation Reference Signal) is already included. However,
the SRS may also be located on subcarriers which do not occupy any other reference
symbols (see Figure 4-4).
Figure 4-4: No EVM can be measured for the SRS
45User Manual 1178.9226.02 ─ 06
Page 46

R&S®FSV3-K10x (LTE Uplink)
In this case it is not reasonable to calculate an EVM and no SRS EVM value will be
displayed for the corresponding subframe.
If the SRS subcarriers contain two DMRS symbols (or one DMRS and one PUSCH for
"Pilot and Payload" channel estimation range) the SRS EVM can be measured (see
Figure 4-5).
Measurement basics
SRS EVM calculation
Figure 4-5: The EVM of the complete SRS can be measured
The SRS allocation might cover subcarriers which partly fulfill the conditions mentioned
above and partly do not. In this case the EVM value given in the Allocation Summary
will be calculated based only on the subcarriers which fulfill the above requirements
(see Figure 4-6).
Figure 4-6: The EVM for parts of the SRS can be measured
46User Manual 1178.9226.02 ─ 06
Page 47

R&S®FSV3-K10x (LTE Uplink)
5 Configuration
LTE measurements require a special application on the R&S FSV/A, which you activate using the [MODE] key on the front panel.
When you start the LTE application, the R&S FSV/A starts to measure the input signal
with the default configuration or the configuration of the last measurement (when you
haven't performed a preset since then). After you have started an instance of the LTE
application, the application displays the "Meas Config" menu which contains functions
to define the characteristics of the signal you are measuring.
Automatic refresh of preview and visualization in dialog boxes after configuration changes
The R&S FSV/A supports you in finding the correct measurement settings quickly and
easily - after each change in settings in dialog boxes, the preview and visualization
areas are updated immediately and automatically to reflect the changes. Thus, you can
see if the setting is appropriate or not before accepting the changes.
Configuration
Configuration overview
Unavailable hardkeys
Note that the [SPAN], [BW], [TRACE], [LINES] and [MKR FUNC] keys have no contents and no function in the LTE application.
● Configuration overview............................................................................................47
● I/Q measurements...................................................................................................49
● Time alignment error measurements...................................................................... 92
● Frequency sweep measurements...........................................................................92
5.1 Configuration overview
Throughout the measurement channel configuration, an overview of the most important
currently defined settings is provided in the "Overview". The "Overview" is displayed
when you select the "Overview" icon, which is available at the bottom of all softkey
menus.
47User Manual 1178.9226.02 ─ 06
Page 48

R&S®FSV3-K10x (LTE Uplink)
In addition to the main measurement settings, the "Overview" provides quick access to
the main settings dialog boxes. The individual configuration steps are displayed in the
order of the data flow. Thus, you can easily configure an entire measurement channel
from input over processing to output and analysis by stepping through the dialog boxes
as indicated in the "Overview".
Configuration
Configuration overview
In particular, the "Overview" provides quick access to the following configuration dialog
boxes (listed in the recommended order of processing):
1. Signal Description
See Chapter 5.2.1, "Signal characteristics", on page 50.
2. Input / Frontend
See Chapter 5.2.11, "Input source configuration", on page 78.
3. Trigger / Signal Capture
See Chapter 5.2.15, "Trigger configuration", on page 86.
See Chapter 5.2.14, "Data capture", on page 84
4. Tracking
See Chapter 5.2.16, "Tracking configuration", on page 88.
5. Demodulation
see Chapter 5.2.17, "Signal demodulation", on page 89.
6. Evaluation Range
See Chapter 6.2.2, "Evaluation range", on page 99.
7. Analysis
See Chapter 6, "Analysis", on page 95.
8. Display Configuration
See Chapter 3, "Measurements and result displays", on page 13.
48User Manual 1178.9226.02 ─ 06
Page 49

R&S®FSV3-K10x (LTE Uplink)
In addition, the dialog box provides the "Select Measurement" button that serves as a
shortcut to select the measurement type.
Note that the "Overview" dialog box for frequency sweep measurement is similar to
that of the Spectrum mode.
For more information refer to the documentation of the R&S FSV/A.
To configure settings
► Select any button in the "Overview" to open the corresponding dialog box.
Select a setting in the channel bar (at the top of the measurement channel tab) to
change a specific setting.
Preset Channel
Select the "Preset Channel" button in the lower left-hand corner of the "Overview" to
restore all measurement settings in the current channel to their default values.
Note: Do not confuse the "Preset Channel" button with the [Preset] key, which restores
the entire instrument to its default values and thus closes all channels on the
R&S FSV/A (except for the default channel)!
Configuration
I/Q measurements
Remote command:
SYSTem:PRESet:CHANnel[:EXEC] on page 169
Select Measurement
Opens a dialog box to select the type of measurement.
For more information about selecting measurements, see Chapter 3.1, "Selecting mea-
surements", on page 13.
Remote command:
CONFigure[:LTE]:MEASurement on page 168
Specific Settings for
The channel can contain several windows for different results. Thus, the settings indicated in the "Overview" and configured in the dialog boxes vary depending on the
selected window.
Select an active window from the "Specific Settings for" selection list that is displayed
in the "Overview" and in all window-specific configuration dialog boxes.
The "Overview" and dialog boxes are updated to indicate the settings for the selected
window.
5.2 I/Q measurements
● Signal characteristics.............................................................................................. 50
● Test scenarios.........................................................................................................57
● MIMO configuration.................................................................................................58
● Subframe configuration...........................................................................................59
● Global signal characteristics................................................................................... 64
● Demodulation reference signal configuration..........................................................65
49User Manual 1178.9226.02 ─ 06
Page 50

R&S®FSV3-K10x (LTE Uplink)
● Sounding reference signal configuration.................................................................68
● PUSCH structure.....................................................................................................71
● PUCCH structure.................................................................................................... 73
● PRACH structure.....................................................................................................76
● Input source configuration.......................................................................................78
● Frequency configuration..........................................................................................80
● Amplitude configuration...........................................................................................81
● Data capture............................................................................................................84
● Trigger configuration............................................................................................... 86
● Tracking configuration.............................................................................................88
● Signal demodulation................................................................................................89
● Automatic configuration...........................................................................................91
5.2.1 Signal characteristics
Access: "Overview" > "Signal Description" > "Signal Description"
The general signal characteristics contain settings to describe the general physical
attributes of the signal.
Configuration
I/Q measurements
Selecting the LTE mode................................................................................................ 51
Carrier Aggregation.......................................................................................................51
└ Basic component carrier configuration............................................................52
└ Features of the I/Q measurements................................................................. 52
└ Features of the time alignment error measurement........................................53
└ Features of the MC ACLR measurement........................................................54
└ Remote commands to configure carrier aggregation......................................54
Channel Bandwidth / Number of Resource Blocks....................................................... 54
Cyclic Prefix.................................................................................................................. 55
Configuring TDD Frames.............................................................................................. 55
└ TDD UL/DL Allocations...................................................................................55
50User Manual 1178.9226.02 ─ 06
Page 51

R&S®FSV3-K10x (LTE Uplink)
└ Conf. of Special Subframe..............................................................................56
Configuring the Physical Layer Cell Identity..................................................................56
Operating Band Index................................................................................................... 57
Extreme Conditions.......................................................................................................57
Selecting the LTE mode
The "Mode" selects the LTE standard you are testing.
The choices you have depend on the set of options you have installed.
●
Option xxx-K100 enables testing of 3GPP LTE FDD signals on the downlink
●
Option xxx-K101 enables testing of 3GPP LTE FDD signals on the uplink
●
Option xxx-K102 enables testing of 3GPP LTE MIMO signals on the downlink
●
Option xxx-K103 enables testing of 3GPP MIMO signals on the uplink
●
Option xxx-K104 enables testing of 3GPP LTE TDD signals on the downlink
●
Option xxx-K105 enables testing of 3GPP LTE TDD signals on the uplink
●
Option xxx-K106 enables testing of 3GPP LTE NB-IoT TDD signals on the downlink
FDD and TDD are duplexing methods.
●
FDD mode uses different frequencies for the uplink and the downlink.
●
TDD mode uses the same frequency for the uplink and the downlink.
Downlink (DL) and Uplink (UL) describe the transmission path.
●
Downlink is the transmission path from the base station to the user equipment.
The physical layer mode for the downlink is always OFDMA.
●
Uplink is the transmission path from the user equipment to the base station.
The physical layer mode for the uplink is always SC-FDMA.
The application shows the currently selected LTE mode (including the bandwidth) in
the channel bar.
Configuration
I/Q measurements
Remote command:
Link direction: CONFigure[:LTE]:LDIRection on page 171
Duplexing mode: CONFigure[:LTE]:DUPLexing on page 171
Carrier Aggregation
Carrier aggregation has been introduced in the LTE standard to increase the bandwidth. In those systems, several carriers can be used to transmit a signal.
Each carrier usually has one of the channel bandwidths defined by 3GPP.
The R&S FSV/A features several measurements that support contiguous and non-con-
tiguous intra-band carrier aggregation (the carriers are in the same frequency band).
●
I/Q based measurements (EVM, frequency error, etc.) (downlink)
●
I/Q based measurements (EVM, frequency error, etc.) (uplink)
●
Time alignment error (downlink)
●
Time alignment error (uplink)
●
Cumulative ACLR (downlink, non-contiguous intra-band carrier aggregation)
●
Multi carrier ACLR (downlink, non-contiguous intra-band carrier aggregation)
●
Multi carrier ACLR (uplink, contiguous intra-band carrier aggregation)
●
SEM (downlink, non-contiguous intra-band carrier aggregation)
●
SEM (uplink, contiguous intra-band carrier aggregation)
51User Manual 1178.9226.02 ─ 06
Page 52

R&S®FSV3-K10x (LTE Uplink)
The way to configure these measurements is similar (but not identical, the differences
are indicated below).
●
"Basic component carrier configuration" on page 52
●
"Features of the I/Q measurements" on page 52
●
"Features of the time alignment error measurement" on page 53
●
"Features of the MC ACLR measurement" on page 54
●
"Remote commands to configure carrier aggregation" on page 54
Basic component carrier configuration ← Carrier Aggregation
The number of component carriers (CCs) you can select depends on the measurement.
●
I/Q based measurements (EVM etc.): up to 5 CCs
●
Time alignment error: up to 2 CCs
●
Multi-carrier ACLR: 2 CCs (fix value)
●
SEM: up to 2 CCs
●
The "Center Frequency" defines the carrier frequency of the carriers.
●
For each carrier, you can select the "Bandwidth" from the corresponding dropdown
menu.
●
For all component carriers, the R&S FSV/A also shows the "Frequency Offset" relative to the center frequency of the first carrier.
Note that the application automatically calculates the frequency and offset of the second (or subsequent) carrier according to the specification.
Note that the actual measurement frequency differs from the carrier frequencies: the
application calculates that frequency based on the carrier frequencies. It is somewhere
in between the carrier frequencies.
The measurement frequency is displayed in the channel bar.
Selecting the channel bandwidths of each carrier is possible in two ways.
●
Predefined bandwidth combinations
Select a typical combination of channel bandwidths from the dropdown menu.
This way, you just have to define the center frequency of the first carrier. The application calculates the rest of the frequency characteristics.
●
User Defined
Select "User Defined" from the dropdown menu to test a system with channel
bandwidths not in the list of predefined combinations.
When you select a user-defined combination, you can select the channel bandwidth for each carrier from the "Bandwidth" dropdown menus.
When the defined carrier configuration is not supported by the application, a corresponding error message is displayed. This can be the case, for example, if the carriers
occupy a bandwidth that is too large.
Configuration
I/Q measurements
Features of the I/Q measurements ← Carrier Aggregation
For measurements on component carriers, results are shown for each component carrier separately. The layout of the diagrams is adjusted like this:
52User Manual 1178.9226.02 ─ 06
Page 53

R&S®FSV3-K10x (LTE Uplink)
●
The first tab ("All") shows the results for all component carriers.
●
The other tabs ("CC <x>") show the results for each component carrier individually.
The application also shows the "Occupied Bandwidth" of the aggregated carriers and
the "Sample Rate" in a read-only field below the carrier configuration.
Configuration
I/Q measurements
The application also allows you to select the location of the local oscillator (LO) in your
system. You can thus define if your system uses one LO (for both carriers) or two LOs
(one for each carrier). This can be useful if you want to reliably exclude the DC component from the measurement results in both scenarios.
The application supports the following "LO locations".
●
Center of each component carrier
One LO for each carrier that is located at the center frequency of the component
carrier. See Basic component carrier configuration for information about how center
frequencies are defined.
●
Center of aggregated channel bandwidth
One LO for both carriers that is located at the center of the aggregated carriers.
●
User defined
One LO for both carriers that is not necessarily located at the center of the aggregated carriers.
When you select this option, the application opens an input field to define the real
"LO Frequency", which you arbitrarily define.
Features of the time alignment error measurement ← Carrier Aggregation
Note that the TAE measurements are possible on one R&S FSV/A only. Therefore the
number of devices to measure is always "1".
You can configure additional signal characteristics of the first and second carrier in the
"CC1" and "CC2" tabs.
In case you are testing a MIMO DUT, you can also select the number of antennas the
DUT supports. When you select "1 Tx Antenna", the application measures the timing
difference between two SISO carriers, when you select more than one antenna, it
measures the timing difference between the antennas. In that case, you can select the
reference antenna from the dropdown menu in the time alignment error result display.
Note that the application shows measurement results for the second component carrier
even if only one antenna of the second component carrier is attached (i.e. no combiner
is used).
53User Manual 1178.9226.02 ─ 06
Page 54

R&S®FSV3-K10x (LTE Uplink)
Features of the MC ACLR measurement ← Carrier Aggregation
The diagram at the bottom of the dialog box represents the current configuration.
When you change the bandwidth of a carrier (represented by blue bars), the application adjusts the bandwidth of the carriers in the diagram accordingly.
The characteristics of the neighboring channels in the MC ACLR measurement are
defined in 3GPP 36.251 (represented by green bars).
Configuration
I/Q measurements
Remote commands to configure carrier aggregation ← Carrier Aggregation
Remote command:
Number of carriers: CONFigure[:LTE]:NOCC on page 220
Carrier frequency: [SENSe:]FREQuency:CENTer[:CC<cc>] on page 201
Measurement frequency: SENSe:FREQuency:CENTer?
Offset: [SENSe:]FREQuency:CENTer[:CC<cc>]:OFFSet on page 202
Channel bandwidth: CONFigure[:LTE]:UL:CABW on page 221
Channel bandwidth: CONFigure[:LTE]:UL[:CC<cc>]:BW on page 171
Number of devices: CONFigure[:LTE]:NDEVices on page 221
LO location: [SENSe:][LTE:]UL:DEMod:LOLocation on page 177
LO frequency: [SENSe:][LTE:]UL:DEMod:LOFRequency on page 176
Channel Bandwidth / Number of Resource Blocks
Specifies the channel bandwidth and number of resource blocks (RB).
The channel bandwidth and number of resource blocks (RB) are interdependent. Cur-
rently, the LTE standard recommends six bandwidths (see table below).
The application also calculates the FFT size, sampling rate, occupied bandwidth and
occupied carriers from the channel bandwidth. Those are read only.
Channel Bandwidth [MHz] 1.4 20151053
Number of Resource Blocks 6 10075502515
Sample Rate [MHz] 1.92 30.7230.7215.367.683.84
FFT Size 128 204820481024512256
54User Manual 1178.9226.02 ─ 06
Page 55

R&S®FSV3-K10x (LTE Uplink)
For more information about configuring aggregated carriers, see "Carrier Aggregation"
on page 51.
The application shows the currently selected LTE mode (including the bandwidth) in
the channel bar.
Remote command:
CONFigure[:LTE]:UL[:CC<cc>]:BW on page 171
Cyclic Prefix
The cyclic prefix serves as a guard interval between OFDM symbols to avoid interferences. The standard specifies two cyclic prefix modes with a different length each.
The cyclic prefix mode defines the number of OFDM symbols in a slot.
●
Normal
A slot contains 7 OFDM symbols.
●
Extended
A slot contains 6 OFDM symbols.
The extended cyclic prefix is able to cover larger cell sizes with higher delay
spread of the radio channel.
●
Auto
The application automatically detects the cyclic prefix mode in use.
Remote command:
CONFigure[:LTE]:UL[:CC<cc>]:CYCPrefix on page 172
Configuration
I/Q measurements
Configuring TDD Frames
TDD frames contain both uplink and downlink information separated in time with every
subframe being responsible for either uplink or downlink transmission. The standard
specifies several subframe configurations or resource allocations for TDD systems.
TDD UL/DL Allocations ← Configuring TDD Frames
Selects the configuration of the subframes in a radio frame in TDD systems.
The UL/DL configuration (or allocation) defines the way each subframe is used: for
uplink, downlink or if it is a special subframe. The standard specifies seven different
configurations.
Configuration
0
1
2
3
4
5
6
0 987654321
D
D
D
D
D
D
D
S
S
S
S
S
S
S
Subframe Number and Usage
U
U
U
U
U
D
U
D
D
U
U
U
U
U
D
U
D
D
U
U
U
D
S
U
U
U
D
S
U
U
D
D
S
U
D
D
D
D
D
D
D
D
D
D
D
D
D
D
D
D
D
D
S
U
U
D
55User Manual 1178.9226.02 ─ 06
Page 56

R&S®FSV3-K10x (LTE Uplink)
)2()1(
3
IDID
cell
ID
NNN
U = uplink
D = downlink
S = special subframe
Remote command:
Subframe: CONFigure[:LTE]:UL[:CC<cc>]:TDD:UDConf on page 173
Conf. of Special Subframe ← Configuring TDD Frames
In combination with the cyclic prefix, the special subframes serve as guard periods for
switches from uplink to downlink. They contain three parts or fields.
●
DwPTS
The DwPTS is the downlink part of the special subframe. It is used to transmit
downlink data.
●
GP
The guard period makes sure that there are no overlaps of up- and downlink signals during a switch.
●
UpPTS
The UpPTS is the uplink part of the special subframe. It is used to transmit uplink
data.
The length of the three fields is variable. This results in several possible configurations
of the special subframe. The LTE standard defines 10 different configurations for the
special subframe. However, configurations 8 and 9 only work for a normal cyclic prefix.
If you select configurations 8 or 9 using an extended cyclic prefix or automatic detection of the cyclic prefix, the application will show an error message.
Remote command:
Special subframe: CONFigure[:LTE]:UL[:CC<cc>]:TDD:SPSC on page 173
Configuration
I/Q measurements
Configuring the Physical Layer Cell Identity
The "Cell ID", "Cell Identity Group" and physical layer "Identity" are interdependent
parameters. In combination, they are responsible for synchronization between network
and user equipment.
The physical layer cell ID identifies a particular radio cell in the LTE network. The cell
identities are divided into 168 unique cell identity groups. Each group consists of 3
physical layer identities. According to:
(1)
= cell identity group, {0...167}
N
(2)
= physical layer identity, {0...2}
N
there is a total of 504 different cell IDs.
If you change one of these three parameters, the application automatically updates the
other two.
The cell ID determines:
●
The reference signal grouping hopping pattern
●
The reference signal sequence hopping
●
The PUSCH demodulation reference signal pseudo-random sequence
●
The cyclic shifts for PUCCH formats 1/1a/1b and sequences for PUCCH formats
2/2a/2b
56User Manual 1178.9226.02 ─ 06
Page 57

R&S®FSV3-K10x (LTE Uplink)
●
The pseudo-random sequence used for scrambling
●
The pseudo-random sequence used for type 2 PUSCH frequency hopping
It is possible to select a separate "Identity" for Demodulation Reference Signal,
PUSCH and PUCCH allocations from the "Identity" property in the "Advanced Signal
Characteristics". When you select "From Cell ID", the "Identity" for the DMRS, PUSCH
and PUCCH is the same as the Cell ID.
Remote command:
Cell ID: CONFigure[:LTE]:UL[:CC<cc>]:PLC:CID on page 172
Cell Identity Group: CONFigure[:LTE]:UL[:CC<cc>]:PLC:CIDGroup
on page 173
Identity: CONFigure[:LTE]:UL[:CC<cc>]:PLC:PLID on page 173
Identity (DRS): CONFigure[:LTE]:UL[:CC<cc>]:DRS:PLID on page 185
Identity (PUCCH): CONFigure[:LTE]:UL[:CC<cc>]:PUCCh:PLID on page 195
Identity (PUSCH): CONFigure[:LTE]:UL[:CC<cc>]:PUSCh:PLID on page 192
Operating Band Index
Selects one of the 40 operating bands for spectrum flatness measurements as defined
in TS 36.101.
The operating band defines the frequency band and the dedicated duplex mode.
Remote command:
[SENSe:][LTE:][CC<cc>:]SFLatness:OBANd on page 176
Configuration
I/Q measurements
Extreme Conditions
Turns extreme conditions on and off.
If you turn the extreme conditions on, the R&S FSV/A adjusts the limits for the limit
check of the spectrum flatness evaluation.
Remote command:
[SENSe:][LTE:][CC<cc>:]SFLatness:ECONditions on page 176
5.2.2 Test scenarios
Access: "Overview" > "Signal Description" > "Test Models"
Test scenarios are descriptions of specific LTE signals for standardized testing of
DUTs. These test scenarios are stored in .allocation files. You can select, manage
and create test scenarios in the "Test Models" dialog box.
User defined test scenarios
User defined test scenarios are custom signal descriptions for standardized measurements that you can save and restore as you like. To create a custom test scenario,
describe a signal as required and then save it with the corresponding button. The
R&S FSV/A stores custom scenarios in .allocation files.
If you do not need test scenarios any longer, you can also delete them.
Remote command:
Save: MMEMory:STORe<n>[:CC<cc>]:DEModsetting on page 175
Restore: MMEMory:LOAD[:CC<cc>]:DEModsetting on page 175
57User Manual 1178.9226.02 ─ 06
Page 58

R&S®FSV3-K10x (LTE Uplink)
5.2.3 MIMO configuration
Access: "Overview" > "Signal Description" > "MIMO / CA Setup"
The MIMO Configuration contains settings to configure MIMO test setups.
Configuration
I/Q measurements
Configuring component carriers
When you are doing measurements on aggregated carriers, you can configure each
carrier separately.
When available, each carrier in the dialog boxes is represented by an additional tab
labeled "CC<x>", with <x> indicating the number of the component carrier.
Note that the additional tabs are only added to the user interface after you have
selected more than "1" component carrier.
MIMO Configuration......................................................................................................58
Input Source Configuration Table..................................................................................59
MIMO Configuration
Selects the antenna configuration and test conditions for a MIMO system.
The MIMO configuration selects the number of transmit antennas for selected chan-
nels in the system.
In setups with multiple antennas, the antenna selection defines the antenna you'd like
to test. Note that as soon as you have selected a transmission on more than one
antenna for one of the channels, the corresponding number of antennas becomes
available for testing.
Antenna 1 Tests antenna 1 only.
Antenna 2 Tests antenna 2 only.
Antenna 3 Tests antenna 3 only.
Antenna 4 Tests antenna 4 only.
58User Manual 1178.9226.02 ─ 06
Page 59

R&S®FSV3-K10x (LTE Uplink)
Remote command:
CONFigure[:LTE]:UL[:CC<cc>]:MIMO:ASELection on page 177
Input Source Configuration Table
not supported
5.2.4 Subframe configuration
Access: "Overview" > "Signal Description" > "Subframe Configuration"
An LTE frame consists of 10 subframes. Each individual subframe can have a different
resource block configuration. This configuration is shown in the "Subframe Configuration Table".
The application supports two ways to determine the characteristics of each subframe.
●
Automatic demodulation of the channel configuration and detection of the subframe
characteristics.
For automatic demodulation, the contents of the table are determined according to
the signal currently evaluated.
For more information, see "Auto Demodulation" on page 60.
●
Custom configuration of the configuration of each subframe.
For manual configuration, you can customize the table according to the signal that
you expect. The signal is demodulated even if the signal does not fit the description
in the table or, for Physical Detection, only if the frame fits the description in the
table.
Remote command:
Conf. subframes: CONFigure[:LTE]:UL[:CC<cc>]:CSUBframes on page 178
Configuration
I/Q measurements
Frame number offset
A frame number offset is also supported. The frame number offset assigns a number to
the demodulated frame in order to identify it in a series of transmitted (and captured)
frames. You can define this frame in the Global Settings.
59User Manual 1178.9226.02 ─ 06
Page 60

R&S®FSV3-K10x (LTE Uplink)
Remote command:
CONFigure[:LTE]:UL[:CC<cc>]:SFNO on page 183
● General subframe configuration..............................................................................60
● Individual subframe configuration........................................................................... 61
● Enhanced settings...................................................................................................62
5.2.4.1 General subframe configuration
Auto Demodulation........................................................................................................60
Subframe Configuration Detection................................................................................60
Auto Demodulation
Turns automatic demodulation on and off.
When you select "Predefined" mode, you can configure the subframe manually.
When you select "Auto" mode, the R&S FSV/A automatically detects the characteris-
tics of each subframe in the signal (resource allocation of the signal). Two methods of
detection are supported:
●
Auto Demodulation, DMRS Auto Detection (Off)
This method automatically determines the characteristics for each subframe as
shown in the Subframe Configuration Table.
The table is populated accordingly.
●
Subframe Configuration & DMRS
Auto Demodulation, DMRS Auto Detection (On)
This method automatically detects the PUSCH and SRS (i.e. no PUCCH can be
detected).
To determine these characteristics, the software detects the CAZAC base parameters. Thus, the DMRS configuration parameters are not required for the synchronization and therefore are not available using this method.
Note however that it is not possible to derive the DMRS configuration parameters
from the CAZAC base parameters so that the disabled DMRS configuration parameters do not reflect the current parameters used for the synchronization. Also note
that it can happen that the software successfully synchronizes on non-3GPP signals without a warning.
Automatic demodulation is not available if you suppress interferers for synchronization
is active.
Remote command:
[SENSe:][LTE:]UL:DEMod:ACON on page 182
Configuration
I/Q measurements
Subframe Configuration Detection
Turns the detection of the subframe configuration on and off.
When you select "Physical Detection", the R&S FSV/A compares the currently
demodulated LTE frame to the subframe configuration you have defined in the table.
The application only analyzes the LTE frame if the signal is consistent with the configuration.
When you turn the feature "Off", the software analyzes the signal even if it is not consistent with the current subframe configuration.
60User Manual 1178.9226.02 ─ 06
Page 61

R&S®FSV3-K10x (LTE Uplink)
Subframe configuration detection is available if you are using a Predefined subframe
configuration.
Remote command:
[SENSe:][LTE:]UL:FORMat:SCD on page 183
5.2.4.2 Individual subframe configuration
The "Subframe Configuration Table" contains the characteristics for each subframe.
The software supports a maximum uplink LTE frame size of 10 subframes. The subframe number in the table depends on the number of "Configurable Subframes" that
you have defined or that have been detected for automatic demodulation.
Configuration
I/Q measurements
Each row of the table represents one subframe. If the fields in a row are unavailable for
editing, the corresponding subframe is occupied by a downlink subframe or the special
subframe (in TDD systems).
Configuring component carriers
When you are doing measurements on aggregated carriers, you can configure each
carrier separately.
When available, each carrier in the dialog boxes is represented by an additional tab
labeled "CC<x>", with <x> indicating the number of the component carrier.
Note that the additional tabs are only added to the user interface after you have
selected more than "1" component carrier.
Subframe Number.........................................................................................................61
Enable PUCCH............................................................................................................. 61
Enable PUSCH............................................................................................................. 62
Modulation.....................................................................................................................62
Enhanced Settings........................................................................................................62
Number of RB............................................................................................................... 62
Offset RB.......................................................................................................................62
Subframe Number
Shows the number of a subframe.
Note that, depending on the TDD configuration, some subframes may not be available
for editing. The R&S FSV/A labels those subframes "(not used)".
Enable PUCCH
Turns the PUCCH in the corresponding subframe on and off.
61User Manual 1178.9226.02 ─ 06
Page 62

R&S®FSV3-K10x (LTE Uplink)
Remote command:
CONFigure[:LTE]:UL[:CC<cc>]:SUBFrame<sf>:ALLoc:CONT on page 178
Enable PUSCH
Turns the PUSCH in the corresponding subframe on and off.
If you turn on a PUSCH, "Modulation", "Number of RBs" and "Offset RB" become avail-
able.
Remote command:
CONFigure[:LTE]:UL[:CC<cc>]:SUBFrame<sf>:ALLoc:CONT on page 178
Modulation
Selects the modulation scheme for the corresponding PUSCH allocation.
The modulation scheme is either QPSK, 16QAM, 64QAM or 256QAM.
Remote command:
CONFigure[:LTE]:UL[:CC<cc>]:SUBFrame<sf>:ALLoc:MODulation
on page 179
Configuration
I/Q measurements
Enhanced Settings
Opens a dialog box to configure enhanced functionality for selected channels in each
subframe.
For more information see Enhanced settings.
Number of RB
Sets the number of resource blocks the PUSCH allocation covers. The number of
resource blocks defines the size or bandwidth of the PUSCH allocation.
Remote command:
CONFigure[:LTE]:UL[:CC<cc>]:SUBFrame<sf>:ALLoc[:CLUSter<cl>]:
RBCount on page 182
Offset RB
Sets the resource block at which the PUSCH allocation begins.
Make sure not to allocate PUSCH allocations into regions reserved for PUCCH alloca-
tions.
Remote command:
CONFigure[:LTE]:UL[:CC<cc>]:SUBFrame<sf>:ALLoc[:CLUSter<cl>]:
RBOFfset on page 182
5.2.4.3 Enhanced settings
The "Enhanced Settings" contain functionality to define enhanced characteristics for
selected channels.
Enhanced PUSCH Configuration..................................................................................63
Enhanced Demodulation Reference Signal Configuration............................................63
Enhanced PUCCH Configuration..................................................................................64
62User Manual 1178.9226.02 ─ 06
Page 63

R&S®FSV3-K10x (LTE Uplink)
Enhanced PUSCH Configuration
Configures the PUSCH in individual subframes.
Resource Allocation Type 1
Turns a clustered PUSCH allocation on and off. If on, a second row is added to the corresponding allocation. This second row represents the second cluster.
You can define the number of resource block, the offset resource block and modulation
for each cluster. All other parameters are the same for both clusters.
Precoding Settings
If you measure several antennas, you can define the number of layers and the codebook index for any allocation.
The number of layers of an allocation in combination with the number of code words
determines the layer mapping. The available number of layers depends on the number
of transmission antennas. Thus, the maximum number of layers you can select is four.
The codebook index determines the precoding matrix. The available number of indices
depends on the number of transmission antennas in use. The range is from 0 to 23.
Remote command:
CONFigure[:LTE]:UL[:CC<cc>]:SUBFrame<sf>:ALLoc:RATO on page 181
CONFigure[:LTE]:UL[:CC<cc>]:SUBFrame<sf>:ALLoc:PRECoding:
CLMapping on page 179
CONFigure[:LTE]:UL[:CC<cc>]:SUBFrame<sf>:ALLoc:PRECoding:CBINdex
on page 179
Configuration
I/Q measurements
Enhanced Demodulation Reference Signal Configuration
Configures the Demodulation Reference Signal in individual subframes.
n(2)_DMRS
Defines the part of the demodulation reference signal index that is part of the uplink
scheduling assignment. Thus, this part of the index is valid for corresponding UE and
subframe only.
The index applies when multiple shifts within a cell are used. It is used for the calculation of the DMRS sequence.
Cyclic Shift Field
If Activate-DMRS-With OCC is on, the "Cyclic Shift Field" becomes available to define
the cyclic shift field.
63User Manual 1178.9226.02 ─ 06
Page 64

R&S®FSV3-K10x (LTE Uplink)
The Cyclic Shift Field is signaled by the PDCCH downlink channel in DCI format 0 and
4. It selects n(2)_DMRS and the orthogonal sequence (OCC) for signals according to
LTE release 10.
If the "Cyclic Shift Field" is off, the demodulation reference signal is configured by the
n(2)_DMRS parameter.
Remote command:
CONFigure[:LTE]:UL[:CC<cc>]:SUBFrame<sf>:ALLoc:PUSCh:NDMRs
on page 181
CONFigure[:LTE]:UL[:CC<cc>]:SUBFrame<sf>:ALLoc:PUSCh:CSField
on page 180
Enhanced PUCCH Configuration
Configures the PUCCH in individual subframes.
n_PUCCH
Defines the n_PUCCH parameter for the selected subframe.
Available only if you have selected "Per Subframe" for the N_PUCCH.
PUCCH Format
Selects the PUCCH format for the selected subframe.
Available only if you have selected "Per Subframe" for the Format.
Remote command:
n_PUCCH: CONFigure[:LTE]:UL[:CC<cc>]:SUBFrame<sf>:ALLoc:PUCCh:
NPAR on page 180
Format: CONFigure[:LTE]:UL[:CC<cc>]:SUBFrame<sf>:ALLoc:PUCCh:
FORMat on page 180
Configuration
I/Q measurements
5.2.5 Global signal characteristics
Access: "Overview" > "Signal Description" > "Advanced Settings" > "Global Settings"
The global settings contain settings that apply to the complete signal.
The global signal settings are part of the "Advanced Settings" tab of the "Signal
Description" dialog box.
64User Manual 1178.9226.02 ─ 06
Page 65

R&S®FSV3-K10x (LTE Uplink)
Configuring component carriers
When you are doing measurements on aggregated carriers, you can configure each
carrier separately.
When available, each carrier in the dialog boxes is represented by an additional tab
labeled "CC<x>", with <x> indicating the number of the component carrier.
Note that the additional tabs are only added to the user interface after you have
selected more than "1" component carrier.
Configuration
I/Q measurements
Frame Number Offset....................................................................................................65
UE ID/n_RNTI............................................................................................................... 65
Frame Number Offset
Defines a frame number offset for the analyzed frame.
The frame number offset assigns a number to the demodulated frame in order to iden-
tify it in a series of transmitted (and captured) frames.
Remote command:
CONFigure[:LTE]:UL[:CC<cc>]:SFNO on page 183
UE ID/n_RNTI
Sets the radio network temporary identifier (RNTI) of the UE.
Remote command:
CONFigure[:LTE]:UL[:CC<cc>]:UEID on page 183
5.2.6 Demodulation reference signal configuration
Access: "Overview" > "Signal Description" > "Advanced Settings" > "Demodulation
Reference Signal"
The demodulation reference signal (DRS) settings contain settings that define the
physical attributes and structure of the demodulation reference signal. This reference
signal helps to demodulate the PUSCH.
65User Manual 1178.9226.02 ─ 06
Page 66

R&S®FSV3-K10x (LTE Uplink)
Functions to configure the DRS described elsewhere:
●
Identity
Configuration
I/Q measurements
Configuring component carriers
When you are doing measurements on aggregated carriers, you can configure each
carrier separately.
When available, each carrier in the dialog boxes is represented by an additional tab
labeled "CC<x>", with <x> indicating the number of the component carrier.
Note that the additional tabs are only added to the user interface after you have
selected more than "1" component carrier.
Relative Power PUSCH................................................................................................ 66
Group Hopping..............................................................................................................67
Sequence Hopping........................................................................................................67
Relative Power PUCCH................................................................................................ 67
n(1)_DMRS................................................................................................................... 67
Delta Sequence Shift.................................................................................................... 67
Activate-DMRS-With OCC............................................................................................ 68
Relative Power PUSCH
Defines the power of the DMRS relative to the power level of the PUSCH allocation in
the corresponding subframe (P
DMRS_Offset
).
The effective power level of the DMRS depends on the allocation of the subframe and
is calculated as follows.
P
DMRS
= PUE + P
PUSCH
+ P
DMRS_Offset
The relative power of the DMRS is applied to all subframes.
The power of the PUSCH (P
) may be different in each subframe.
PUSCH
Remote command:
CONFigure[:LTE]:UL[:CC<cc>]:DRS[:PUSCh]:POWer on page 186
66User Manual 1178.9226.02 ─ 06
Page 67

R&S®FSV3-K10x (LTE Uplink)
Group Hopping
Turns group hopping for the demodulation reference signal on and off.
The group hopping pattern is based on 17 hopping patterns and 30 sequence shift pat-
terns. It is generated by a pseudo-random sequence generator.
If on, PUSCH and PUCCH use the same group hopping pattern.
Remote command:
CONFigure[:LTE]:UL[:CC<cc>]:DRS:GRPHopping on page 185
Sequence Hopping
Turns sequence hopping for the uplink demodulation reference signal on and off.
Sequence hopping is generated by a pseudo-random sequence generator.
Remote command:
CONFigure[:LTE]:UL[:CC<cc>]:DRS:SEQHopping on page 186
Relative Power PUCCH
Defines the power of the DMRS relative to the power level of the PUCCH allocation in
the corresponding subframe (P
The effective power level of the DMRS depends on the allocation of the subframe and
is calculated as follows.
P
= PUE + P
DMRS
The relative power of the DMRS is applied to all subframes.
The power of the PUCCH (P
Remote command:
CONFigure[:LTE]:UL[:CC<cc>]:DRS:PUCCh:POWer on page 186
PUCCH
+ P
DMRS_Offset
DMRS_Offset
PUCCH
Configuration
I/Q measurements
).
) may be different in each subframe.
n(1)_DMRS
Defines the part of the demodulation reference signal index that is broadcast. It is valid
for the whole cell.
The index applies when multiple shifts within a cell are used. It is used for the calculation of the DMRS sequence.
The n_DMRS parameter can be found in 3GPP TS36.211 V8.5.0, 5.5.2.1.1 Reference
signal sequence.
Remote command:
CONFigure[:LTE]:UL[:CC<cc>]:DRS:NDMRs on page 185
Delta Sequence Shift
Defines the delta sequence shift ΔSS.
The standard defines a sequence shift pattern fss for the PUCCH. The corresponding
sequence shift pattern for the PUSCH is a function of f
PUCCH
ss
and the delta sequence
shift.
For more information refer to 3GPP TS 36.211, chapter 5.5.1.3 "Group Hopping".
Remote command:
CONFigure[:LTE]:UL[:CC<cc>]:DRS:DSSHift on page 184
67User Manual 1178.9226.02 ─ 06
Page 68

R&S®FSV3-K10x (LTE Uplink)
Activate-DMRS-With OCC
Turns the configuration of the demodulation reference signal on a subframe basis via
the "Cyclic Shift Field" on and off.
If on, the "Cyclic Shift Field" becomes available. Otherwise, the demodulation reference signal is configured by the n(2)_DMRS parameter.
Note that this parameter is automatically turned on if at least one of the physical channels uses more than one antenna.
For more information see Enhanced settings and MIMO Configuration.
Remote command:
CONFigure[:LTE]:UL[:CC<cc>]:DRS:AOCC on page 184
5.2.7 Sounding reference signal configuration
Access: "Overview" > "Signal Description" > "Advanced Settings" > "Sounding Refer-
ence Signal"
The sounding reference signal (SRS) settings contain settings that define the physical
attributes and structure of the sounding reference signal.
Configuration
I/Q measurements
Configuring component carriers
When you are doing measurements on aggregated carriers, you can configure each
carrier separately.
When available, each carrier in the dialog boxes is represented by an additional tab
labeled "CC<x>", with <x> indicating the number of the component carrier.
Note that the additional tabs are only added to the user interface after you have
selected more than "1" component carrier.
Present..........................................................................................................................69
SRS Subframe Configuration........................................................................................69
SRS MaxUpPts............................................................................................................. 69
SRS Bandwidth B_SRS................................................................................................ 69
68User Manual 1178.9226.02 ─ 06
Page 69

R&S®FSV3-K10x (LTE Uplink)
Hopping BW b_hop.......................................................................................................70
SRS Cyclic Shift N_CS................................................................................................. 70
SRS Rel Power............................................................................................................. 70
SRS BW Conf. C_SRS................................................................................................. 70
Conf. Index I_SRS........................................................................................................ 70
Transm. Comb. k_TC....................................................................................................71
Freq. Domain Pos. n_RRC........................................................................................... 71
A/N + SRS Simultaneous TX........................................................................................ 71
Present
Includes or excludes the sounding reference signal (SRS) from the test setup.
Remote command:
CONFigure[:LTE]:UL[:CC<cc>]:SRS:STAT on page 190
SRS Subframe Configuration
Defines the subframe configuration of the SRS.
The subframe configuration of the SRS is specific to a cell. The UE sends a shortened
PUCCH/PUSCH in these subframes, regardless of whether the UE is configured to
send an SRS in the corresponding subframe or not.
Remote command:
CONFigure[:LTE]:UL[:CC<cc>]:SRS:SUConfig on page 190
Configuration
I/Q measurements
SRS MaxUpPts
Turns the parameter srs_MaxUpPts on and off.
srs_MaxUpPts controls the SRS transmission in the UpPTS field in TDD systems. If
on, the SRS is transmitted in a frequency range of the UpPTS field that does not overlap with resources reserved for PRACH preamble 4 transmissions.
To avoid an overlap, the number of SRS resource blocks otherwise determined by
C_SRS and B_SRS is reconfigured.
Remote command:
CONFigure[:LTE]:UL[:CC<cc>]:SRS:MUPT on page 189
SRS Bandwidth B_SRS
Defines the parameter B
B
is a UE specific parameter that defines the bandwidth of the SRS. The SRS either
SRS
SRS
.
spans the entire frequency bandwidth or uses frequency hopping when several narrowband SRS cover the same total bandwidth.
The standard defines up to four bandwidths for the SRS. The most narrow SRS bandwidth (B
The other three values of B
= 3) spans four resource blocks and is available for all channel bandwidths.
SRS
define more wideband SRS bandwidths. Their availabil-
SRS
ity depends on the channel bandwidth.
The availability of SRS bandwidths additionally depends on the bandwidth configura-
tion of the SRS (C
SRS
).
For more information refer to 3GPP TS 36.211, chapter 5.5.3.2 "Mapping to Physical
Resources" for the Sounding Reference Signal.
69User Manual 1178.9226.02 ─ 06
Page 70

R&S®FSV3-K10x (LTE Uplink)
Remote command:
CONFigure[:LTE]:UL[:CC<cc>]:SRS:BSRS on page 188
Hopping BW b_hop
Defines the parameter b
b
is a UE specific parameter that defines the frequency hopping bandwidth. SRS fre-
hop
quency hopping is active if b
For more information refer to 3GPP TS 36.211, chapter 5.5.3.2 "Mapping to Physical
Resources" for the Sounding Reference Signal.
Remote command:
CONFigure[:LTE]:UL[:CC<cc>]:SRS:BHOP on page 187
SRS Cyclic Shift N_CS
Defines the cyclic shift (nCS) used for the generation of the SRS CAZAC sequence.
Because the different shifts of the same Zadoff-Chu sequence are orthogonal to each
other, applying different SRS cyclic shifts can be used to schedule different UE to
simultaneously transmit their SRS.
Remote command:
CONFigure[:LTE]:UL[:CC<cc>]:SRS:CYCS on page 188
hop
Configuration
I/Q measurements
.
hop
< B
SRS
.
SRS Rel Power
Defines the power of the SRS relative to the power of the corresponding UE (P
).
set
SRS_Off-
The effective power level of the SRS is calculated as follows.
P
= PUE + P
SRS
SRS_Offset
The relative power of the SRS is applied to all subframes.
Remote command:
CONFigure[:LTE]:UL[:CC<cc>]:SRS:POWer on page 189
SRS BW Conf. C_SRS
Defines the bandwidth configuration of the SRS.
The bandwidth configuration is a cell-specific parameter that, in combination with the
SRS bandwidth and the channel bandwidth, defines the length of the sounding reference signal sequence. For more information on the calculation, refer to 3GPP TS
36.211 chapter 5.5.3 "Sounding Reference Signal".
Remote command:
CONFigure[:LTE]:UL[:CC<cc>]:SRS:CSRS on page 188
Conf. Index I_SRS
Defines the configuration index of the SRS.
The configuration index I
dicity (T
on T
) and the SRS subframe offset (T
SRS
SRS
and T
depends on the duplexing mode.
offset
is a cell specific parameter that determines the SRS perio-
SRS
). The effects of the configuration index
offset
For more information refer to 3GPP TS 36.213, Table 8.2-1 (FDD) and 8.2-2 (TDD).
70User Manual 1178.9226.02 ─ 06
Page 71

R&S®FSV3-K10x (LTE Uplink)
Remote command:
CONFigure[:LTE]:UL[:CC<cc>]:SRS:ISRS on page 188
Transm. Comb. k_TC
Defines the transmission comb kTC.
The transmission comb. is a UE specific parameter. For more information refer to
3GPP TS 36.211, chapter 5.5.3.2 "Mapping to Physical Resources" for the Sounding
Reference Signal.
Remote command:
CONFigure[:LTE]:UL[:CC<cc>]:SRS:TRComb on page 190
Freq. Domain Pos. n_RRC
Defines the parameter n
n
is a UE specific parameter and determines the starting physical resource block of
RRC
the SRS transmission.
For more information refer to 3GPP TS 36.211, chapter 5.5.3.2 "Mapping to Physical
Resources" for the Sounding Reference Signal.
Remote command:
CONFigure[:LTE]:UL[:CC<cc>]:SRS:NRRC on page 189
RRC
Configuration
I/Q measurements
.
A/N + SRS Simultaneous TX
Turns simultaneous transmission of the Sounding Reference Signal (SRS) and ACK/
NACK messages (via PUCCH) on and off.
By turning the parameter on, you allow for simultaneous transmission of PUCCH and
SRS in the same subframe.
If off, the SRS not transmitted in the subframe for which you have configured simultaneous transmission of PUCCH and SRS.
Note that simultaneous transmission of SRS and PUCCH is available only if the
PUCCH format is either 1, 1a, 1b or 3. The other PUCCH formats contain CQI reports
which are not transmitted with the SRS.
Remote command:
CONFigure[:LTE]:UL[:CC<cc>]:SRS:ANST on page 187
5.2.8 PUSCH structure
Access: "Overview" > "Signal Description" > "Advanced Settings" > "PUSCH Struc-
ture"
The PUSCH structure settings contain settings that describe the physical attributes and
structure of the PUSCH.
71User Manual 1178.9226.02 ─ 06
Page 72

R&S®FSV3-K10x (LTE Uplink)
Functions to configure the PUSCH described elsewhere:
●
Identity
Configuration
I/Q measurements
Configuring component carriers
When you are doing measurements on aggregated carriers, you can configure each
carrier separately.
When available, each carrier in the dialog boxes is represented by an additional tab
labeled "CC<x>", with <x> indicating the number of the component carrier.
Note that the additional tabs are only added to the user interface after you have
selected more than "1" component carrier.
Frequency Hopping Mode.............................................................................................72
Number of Subbands.................................................................................................... 72
PUSCH Hopping Offset.................................................................................................73
Info. in Hopping Bits......................................................................................................73
Frequency Hopping Mode
Selects the frequency hopping mode of the PUSCH.
Several hopping modes are supported.
●
None
No frequency hopping.
●
Inter Subframe Hopping
PUSCH changes the frequency from one subframe to another.
●
Intra Subframe Hopping
PUSCH also changes the frequency within a subframe.
Remote command:
CONFigure[:LTE]:UL[:CC<cc>]:PUSCh:FHMode on page 191
Number of Subbands
Defines the number of subbands reserved for PUSCH.
For more information refer to 3GPP TS 36.211, chapter 5.5.3.2 "Mapping to Physical
Resources" for the Sounding Reference Signal.
72User Manual 1178.9226.02 ─ 06
Page 73

R&S®FSV3-K10x (LTE Uplink)
Remote command:
CONFigure[:LTE]:UL[:CC<cc>]:PUSCh:NOSM on page 192
PUSCH Hopping Offset
Defines the PUSCH Hopping Offset N
The PUSCH Hopping Offset determines the first physical resource block and the maxi-
mum number of physical resource blocks available for PUSCH transmission if PUSCH
frequency hopping is active.
Remote command:
CONFigure[:LTE]:UL[:CC<cc>]:PUSCh:FHOFfset on page 191
Info. in Hopping Bits
Defines the information available in the hopping bits according to the PDCCH DCI format 0 hopping bit definition.
The information in the hopping bits determines whether type 1 or type 2 hopping is
used in the subframe and, in case of type 1, additionally determines the exact hopping
function to use.
For more information on PUSCH frequency hopping refer to 3GPP TS36.213.
Remote command:
CONFigure[:LTE]:UL[:CC<cc>]:PUSCh:FHOP:IIHB on page 192
RB
HO
Configuration
I/Q measurements
.
5.2.9 PUCCH structure
Access: "Overview" > "Signal Description" > "Advanced Settings" > "PUCCH Struc-
ture"
The PUCCH structure settings contain settings that describe the physical attributes
and structure of the PUCCH.
Functions to configure the PUCCH described elsewhere:
●
Identity
73User Manual 1178.9226.02 ─ 06
Page 74

R&S®FSV3-K10x (LTE Uplink)
Configuring component carriers
When you are doing measurements on aggregated carriers, you can configure each
carrier separately.
When available, each carrier in the dialog boxes is represented by an additional tab
labeled "CC<x>", with <x> indicating the number of the component carrier.
Note that the additional tabs are only added to the user interface after you have
selected more than "1" component carrier.
No. of RBs for PUCCH..................................................................................................74
N(1)_cs..........................................................................................................................74
Delta Shift......................................................................................................................74
Format...........................................................................................................................75
N(2)_RB........................................................................................................................ 75
N_PUCCH.....................................................................................................................75
No. of RBs for PUCCH
Defines the number of resource blocks reserved for PUCCH.
The resource blocks for PUCCH are always allocated at the edges of the LTE spec-
trum.
In case of an even number of PUCCH resource blocks, half of the available PUCCH
resource blocks is allocated on the lower, the other half on the upper edge of the LTE
spectrum (outermost resource blocks).
In case of an odd number of PUCCH resource blocks, the number of resource blocks
on the lower edge is one resource block larger than the number of resource blocks on
the upper edge of the LTE spectrum.
If you select the "Auto" menu item, the application automatically detects the number of
RBs.
Remote command:
CONFigure[:LTE]:UL[:CC<cc>]:PUCCh:NORB on page 194
Configuration
I/Q measurements
N(1)_cs
Defines the number of cyclic shifts used for PUCCH format 1/1a/1b in a resource block
used for a combination of the formats 1/1a/1b and 2/2a/2b.
Only one resource block per slot can support a combination of the PUCCH formats
1/1a/1b and 2/2a/2b.
The number of cyclic shifts available for PUCCH format 2/2a/2b N(2)_cs in a block with
combination of PUCCH formats is calculated as follows.
N(2)_cs = 12 - N(1)_cs - 2
For more information refer to 3GPP TS36.211, chapter 5.4 "Physical Uplink Control
Channel".
Remote command:
CONFigure[:LTE]:UL[:CC<cc>]:PUCCh:N1CS on page 194
Delta Shift
Defines the delta shift parameter.
74User Manual 1178.9226.02 ─ 06
Page 75

R&S®FSV3-K10x (LTE Uplink)
The delta shift is the difference between two adjacent PUCCH resource indices with
the same orthogonal cover sequence (OC).
It determines the number of available sequences in a resource block that can be used
for PUCCH formats 1/1a/1b.
For more information refer to 3GPP TS36.211, chapter 5.4 "Physical Uplink Control
Channel".
Remote command:
CONFigure[:LTE]:UL[:CC<cc>]:PUCCh:DESHift on page 193
Format
Selects the format of the PUCCH.
You can define the PUCCH format for all subframes or define the PUCCH format for
each subframe individually.
●
F1, F1a, F1b, F2, F2a, F2b, F3
Selects the PUCCH format globally for every subframe.
●
Per Subframe
You can select the PUCCH format for each subframe separately in the Enhanced
settings of the "Subframe Configuration".
Note that formats F2a and F2b are only supported for normal cyclic prefix length.
For more information refer to 3GPP TS36.211, table 5.4-1 "Supported PUCCH For-
mats".
Remote command:
CONFigure[:LTE]:UL[:CC<cc>]:PUCCh:FORMat on page 193
Configuration
I/Q measurements
N(2)_RB
Defines bandwidth in terms of resource blocks that are reserved for PUCCH formats
2/2a/2b transmission in each subframe.
Since there can be only one resource block per slot that supports a combination of the
PUCCH formats 1/1a/1b and 2/2a/2b, the number of resource block(s) per slot available for PUCCH format 1/1a/1b is determined by N(2)_RB.
For more information refer to 3GPP TS36.211, chapter 5.4 "Physical Uplink Control
Channel".
Remote command:
CONFigure[:LTE]:UL[:CC<cc>]:PUCCh:N2RB on page 194
N_PUCCH
Defines the resource index for PUCCH format 1/1a/1b respectively 2/2a/2b.
You can select the PUCCH format manually or allow the application to determine the
PUCCH format automatically based on the measurement.
It is also possible to define N
on a subframe level by selecting the "Per Subframe"
PUCCH
menu item. For more information see Chapter 5.2.4, "Subframe configuration",
on page 59.
Remote command:
CONFigure[:LTE]:UL[:CC<cc>]:PUCCh:NPAR on page 195
75User Manual 1178.9226.02 ─ 06
Page 76

R&S®FSV3-K10x (LTE Uplink)
5.2.10 PRACH structure
Access: "Overview" > "Signal Description" > "Advanced Settings" > "PRACH Struc-
ture"
The PRACH structure settings contain settings that describe the physical attributes and
structure of the PRACH.
Configuration
I/Q measurements
Configuring component carriers
When you are doing measurements on aggregated carriers, you can configure each
carrier separately.
When available, each carrier in the dialog boxes is represented by an additional tab
labeled "CC<x>", with <x> indicating the number of the component carrier.
Note that the additional tabs are only added to the user interface after you have
selected more than "1" component carrier.
PRACH Configuration................................................................................................... 76
Restricted Set................................................................................................................76
Frequency Offset...........................................................................................................77
PRACH Preamble Mapping.......................................................................................... 77
Ncs Conf....................................................................................................................... 77
Logical Root Sequ. Idx..................................................................................................77
Sequence Index (v).......................................................................................................77
PRACH Configuration
Sets the PRACH configuration index as defined in the 3GPP TS 36.211, i.e. defines
the subframes in which random access preamble transmission is allowed.
The preamble format is automatically derived from the PRACH Configuration.
Remote command:
CONFigure[:LTE]:UL[:CC<cc>]:PRACh:CONF on page 196
Restricted Set
This command turns the restricted preamble set on and off.
76User Manual 1178.9226.02 ─ 06
Page 77

R&S®FSV3-K10x (LTE Uplink)
A restricted preamble set corresponds to high speed mode. An unrestricted preamble
set to normal mode.
Remote command:
CONFigure[:LTE]:UL[:CC<cc>]:PRACh:RSET on page 198
Frequency Offset
The "Frequency Offset" defines the PRACH frequency offset for preamble formats 0 to
3 as defined in the 3GPP TS 36.211. The frequency offset determines the first physical
resource block available for PRACH expressed as a physical resource block number.
Remote command:
CONFigure[:LTE]:UL[:CC<cc>]:PRACh:FOFFset on page 196
PRACH Preamble Mapping
The frequency resource index fRA and the half frame indicator t1RA are necessary for
clear specification of the physical resource mapping of the PRACH, in case a PRACH
configuration index has more than one mapping alternative.
If you turn on the "Auto Preamble Mapping", the R&S FSV/A automatically detects f
and t1RA.
Configuration
I/Q measurements
RA
The values for both parameters are defined in table '5.7.1-4: Frame structure type 2
random access preamble mapping in time and frequency' (3GPP TS 36.211 v10.2.0).
The frequency resource index and half frame indicator are available in TDD mode.
Remote command:
CONFigure[:LTE]:UL[:CC<cc>]:PRACh:APM on page 196
CONFigure[:LTE]:UL[:CC<cc>]:PRACh:FRINdex on page 196
CONFigure[:LTE]:UL[:CC<cc>]:PRACh:HFINdicator on page 197
Ncs Conf
Selects the Ncs configuration, i.e. determines the Ncs value set according to TS
36.211, table 5.7.2.-2 and 5.7.2-3.
Remote command:
CONFigure[:LTE]:UL[:CC<cc>]:PRACh:NCSC on page 197
Logical Root Sequ. Idx
Selects the logical root sequence index.
The logical root sequence index is used to generate PRACH preamble sequences. It is
provided by higher layers.
Remote command:
CONFigure[:LTE]:UL[:CC<cc>]:PRACh:RSEQ on page 197
Sequence Index (v)
Defines the sequence index (v).
The sequence index controls which of the 64 preambles available in a cell is used.
If you select the "Auto" menu item, the software automatically selects the required
sequence index.
77User Manual 1178.9226.02 ─ 06
Page 78

R&S®FSV3-K10x (LTE Uplink)
Remote command:
CONFigure[:LTE]:UL[:CC<cc>]:PRACh:SINDex on page 198
5.2.11 Input source configuration
The R&S FSV/A supports several input sources and outputs.
For a comprehensive description of the supported inputs and outputs, refer to the
R&S FSV/A user manual.
● RF input...................................................................................................................78
● External frontends...................................................................................................78
● I/Q file......................................................................................................................79
5.2.11.1 RF input
Access: "Overview" > "Input / Frontend" > "Input Source" > "Radio Frequency"
Functions to configure the RF input described elsewhere:
●
"Input Coupling" on page 84
●
"Impedance" on page 84
Configuration
I/Q measurements
YIG-Preselector.............................................................................................................78
YIG-Preselector
Enables or disables the YIG-preselector.
This setting requires an additional option on the R&S FSV/A.
An internal YIG-preselector at the input of the R&S FSV/A ensures that image frequen-
cies are rejected. However, image rejection is only possible for a restricted bandwidth.
To use the maximum bandwidth for signal analysis you can disable the YIG-preselector
at the input of the R&S FSV/A, which can lead to image-frequency display.
Note: Note that the YIG-preselector is active only on frequencies greater than
7.5 GHz. Therefore, switching the YIG-preselector on or off has no effect if the frequency is below that value.
To use the optional 54 GHz frequency extension (R&S FSV3-B54G), the YIG-preselector must be disabled.
Remote command:
INPut<ip>:FILTer:YIG[:STATe] on page 199
5.2.11.2 External frontends
Access: "Overview" > "Input / Frontend" > "Input Source" > "Ext. Frontend"
Controlling external frontends is available with the optional external generator control.
The functionality is the same as in the I/Q analyzer application.
For more information about using external frontends, refer to the R&S FSV/A I/Q analyzer user manual.
78User Manual 1178.9226.02 ─ 06
Page 79

R&S®FSV3-K10x (LTE Uplink)
5.2.11.3 I/Q file
Access: "Overview" > "Input / Frontend" > "Input Source" > "I/Q File"
As an alternative to capturing the measurement (I/Q) data live, you can also load previously recorded I/Q data stored in an iq.tar file. The file is then used as the input
source for the application.
Available for I/Q based measurements.
For details, see the user manual of the I/Q analyzer.
I/Q Input File State........................................................................................................ 79
Select I/Q data file.........................................................................................................79
File Repetitions............................................................................................................. 79
Selected Channel..........................................................................................................79
I/Q Input File State
Enables input from the selected I/Q input file.
If enabled, the application performs measurements on the data from this file. Thus,
most measurement settings related to data acquisition (attenuation, center frequency,
measurement bandwidth, sample rate) cannot be changed. The measurement time
can only be decreased to perform measurements on an extract of the available data
only.
Note: Even when the file input is disabled, the input file remains selected and can be
enabled again quickly by changing the state.
Remote command:
INPut<ip>:SELect on page 200
Configuration
I/Q measurements
Select I/Q data file
Opens a file selection dialog box to select an input file that contains I/Q data.
The I/Q data must have a specific format (.iq.tar) as described in R&S FSV/A I/Q
Analyzer and I/Q Input user manual.
The default storage location for I/Q data files is C:\R_S\INSTR\USER.
Remote command:
INPut<ip>:FILE:PATH on page 198
File Repetitions
Determines how often the data stream is repeatedly copied in the I/Q data memory to
create a longer record. If the available memory is not sufficient for the specified number of repetitions, the largest possible number of complete data streams is used.
Remote command:
TRACe:IQ:FILE:REPetition:COUNt on page 201
Selected Channel
Only available for files that contain more than one data stream from multiple channels:
selects the data stream to be used as input for the currently selected channel.
79User Manual 1178.9226.02 ─ 06
Page 80

R&S®FSV3-K10x (LTE Uplink)
In "Auto" mode (default), the first data stream in the file is used as input for the channel. Applications that support multiple data streams use the first data stream in the file
for the first input stream, the second for the second stream etc.
Remote command:
MMEMory:LOAD:IQ:STReam on page 200
MMEMory:LOAD:IQ:STReam:AUTO on page 200
MMEMory:LOAD:IQ:STReam:LIST? on page 201
5.2.12 Frequency configuration
Access: "Overview" > "Input / Frontend" > "Frequency"
Frequency settings define the frequency characteristics of the signal at the RF input.
They are part of the "Frequency" tab of the "Signal Characteristics" dialog box.
Configuration
I/Q measurements
The remote commands required to configure the frequency are described in Chap-
ter 7.9.2.3, "Frequency configuration", on page 201.
Signal Frequency.......................................................................................................... 80
└ Center Frequency........................................................................................... 80
└ Frequency Stepsize........................................................................................ 80
Signal Frequency
For measurements with an RF input source, you have to match the center frequency
of the analyzer to the frequency of the signal.
Center Frequency ← Signal Frequency
Defines the center frequency of the signal and thus the frequency the R&S FSV/A
tunes to.
The frequency range depends on the hardware configuration of the analyzer you are
using.
Remote command:
Center frequency: [SENSe:]FREQuency:CENTer[:CC<cc>] on page 201
Frequency offset: [SENSe:]FREQuency:CENTer[:CC<cc>]:OFFSet on page 202
Frequency Stepsize ← Signal Frequency
In addition to the frequency itself, you can also define a frequency stepsize. The frequency stepsize defines the extent of a frequency change if you change it, for example
with the rotary knob.
You can define the stepsize in two ways.
●
= Center
80User Manual 1178.9226.02 ─ 06
Page 81

R&S®FSV3-K10x (LTE Uplink)
One frequency step corresponds to the current center frequency.
●
Manual
Define any stepsize you need.
Remote command:
Frequency stepsize: [SENSe:]FREQuency:CENTer:STEP on page 203
5.2.13 Amplitude configuration
Access: "Overview" > "Input / Frontend" > "Amplitude"
Amplitude settings define the expected level characteristics of the signal at the RF
input.
Configuration
I/Q measurements
The remote commands required to configure the amplitude are described in Chap-
ter 7.9.2.4, "Amplitude configuration", on page 203.
Reference Level............................................................................................................81
└ Auto Level.......................................................................................................82
└ Reference Level Offset................................................................................... 82
Attenuating the Signal...................................................................................................82
└ RF Attenuation................................................................................................82
└ Electronic Attenuation.....................................................................................83
Preamplifier...................................................................................................................83
Input Coupling...............................................................................................................84
Impedance.................................................................................................................... 84
Reference Level
The reference level is the power level the analyzer expects at the RF input. Keep in
mind that the power level at the RF input is the peak envelope power for signals with a
high crest factor like LTE.
To get the best dynamic range, you have to set the reference level as low as possible.
At the same time, make sure that the maximum signal level does not exceed the reference level. If it does, it will overload the A/D converter, regardless of the signal power.
Measurement results can deteriorate (e.g. EVM), especially for measurements with
more than one active channel near the one you are trying to measure (± 6 MHz).
Note that the signal level at the A/D converter can be stronger than the level the application displays, depending on the current resolution bandwidth. This is because the
resolution bandwidths are implemented digitally after the A/D converter.
81User Manual 1178.9226.02 ─ 06
Page 82

R&S®FSV3-K10x (LTE Uplink)
The reference level is a value in dBm.
Remote command:
Reference level: DISPlay[:WINDow<n>][:SUBWindow<w>]:TRACe<t>:Y[:
SCALe]:RLEVel on page 203
Auto Level ← Reference Level
Automatically determines the ideal reference level. The automatic leveling process
measures the signal and defines the ideal reference signal for the measured signal.
Automatic level detection also optimizes RF attenuation.
Auto leveling slightly increases the measurement time, because of the extra leveling
measurement prior to each sweep. By default, the R&S FSV/A automatically defines
the time for auto leveling, but you can also define it manually ([Auto Set] > "Auto Level
Config" > "Meas Time").
The application shows the current reference level (including RF and external attenuation) in the channel bar.
Configuration
I/Q measurements
Remote command:
Automatic: [SENSe:]ADJust:LEVel<ant> on page 219
Auto level mode: [SENSe:]ADJust:CONFigure:LEVel:DURation:MODE
on page 218
Auto level time: [SENSe:]ADJust:CONFigure:LEVel:DURation on page 218
Reference Level Offset ← Reference Level
The reference level offset is an arithmetic level offset. A level offset is useful if the signal is attenuated or amplified before it is fed into the analyzer. All displayed power level
results are shifted by this value. Note however, that the reference value ignores the
level offset. Thus, it is still mandatory to define the actual power level that the analyzer
has to handle as the reference level.
Remote command:
DISPlay[:WINDow<n>][:SUBWindow<w>]:TRACe<t>:Y[:SCALe]:RLEVel:
OFFSet on page 204
Attenuating the Signal
Attenuation of the signal becomes necessary if you have to reduce the power of the
signal that you have applied. Power reduction is necessary, for example, to prevent an
overload of the input mixer.
For a comprehensive information about signal attenuation, refer to the user manual of
the R&S FSV/A.
The LTE measurement application provides several attenuation modes.
RF Attenuation ← Attenuating the Signal
Controls the RF (or mechanical) attenuator at the RF input.
If you select automatic signal attenuation, the attenuation level is coupled to the refer-
ence level.
82User Manual 1178.9226.02 ─ 06
Page 83

R&S®FSV3-K10x (LTE Uplink)
If you select manual signal attenuation, you can define an arbitrary attenuation (within
the supported value range).
Positive values correspond to signal attenuation and negative values correspond to
signal gain.
The application shows the attenuation level (mechanical and electronic) in the channel
bar.
Remote command:
State: INPut<ip>:ATTenuation<ant>:AUTO on page 205
Level: INPut<ip>:ATTenuation<ant> on page 204
Electronic Attenuation ← Attenuating the Signal
Controls the optional electronic attenuator.
If you select automatic signal attenuation, the attenuation level is coupled to the refer-
ence level.
If you select manual signal attenuation, you can define an arbitrary attenuation (within
the supported value range).
Positive values correspond to signal attenuation and negative values correspond to
signal gain.
Note that the frequency range must not exceed the specification of the electronic
attenuator for it to work.
The application shows the attenuation level (mechanical and electronic) in the channel
bar.
Configuration
I/Q measurements
Remote command:
Electronic attenuation: INPut<ip>:EATT<ant>:STATe on page 207
Electronic attenuation: INPut<ip>:EATT<ant>:AUTO on page 207
Electronic attenuation: INPut<ip>:EATT<ant> on page 207
Preamplifier
If the (optional) internal preamplifier hardware is installed, a preamplifier can be activated for the RF input signal.
You can use a preamplifier to analyze signals from DUTs with low output power.
For an active external frontend, a preamplifier is not available.
For R&S FSV/A3004, 3007, 3013, and 3030 models, the following settings are availa-
ble:
"Off"
"15 dB"
Deactivates the preamplifier.
The RF input signal is amplified by about 15 dB.
83User Manual 1178.9226.02 ─ 06
Page 84

R&S®FSV3-K10x (LTE Uplink)
Configuration
I/Q measurements
"30 dB"
The RF input signal is amplified by about 30 dB.
For R&S FSV/A44 or higher models, the input signal is amplified by 30 dB if the preamplifier is activated. In this case, the preamplifier is only available under the following
conditions:
●
In zero span, the maximum center frequency is 43.5 GHz
●
For frequency spans, the maximum stop frequency is 43.5 GHz
●
For I/Q measurements, the maximum center frequency depends on the analysis
bandwidth:
≤
43.5 GHz - (<Analysis_bw> / 2)
f
center
If any of the conditions no longer apply after you change a setting, the preamplifier is
automatically deactivated.
Remote command:
INPut<ip>:GAIN:STATe on page 205
INPut<ip>:GAIN[:VALue] on page 206
Input Coupling
The RF input of the R&S FSV/A can be coupled by alternating current (AC) or direct
current (DC).
For an active external frontend, input coupling is always DC.
AC coupling blocks any DC voltage from the input signal. AC coupling is activated by
default to prevent damage to the instrument. Very low frequencies in the input signal
can be distorted.
However, some specifications require DC coupling. In this case, you must protect the
instrument from damaging DC input voltages manually. For details, refer to the data
sheet.
Remote command:
INPut<ip>:COUPling on page 205
Impedance
For some measurements, the reference impedance for the measured levels of the
R&S FSV/A can be set to 50 Ω or 75 Ω.
Select 75 Ω if the 50 Ω input impedance is transformed to a higher impedance using a
75 Ω adapter of the RAZ type. (That corresponds to 25Ω in series to the input impedance of the instrument.) The correction value in this case is 1.76 dB = 10 log (75Ω/
50Ω).
This value also affects the unit conversion.
This function is not available for input from the optional "Digital Baseband" interface or
from the optional "Analog Baseband" interface. For analog baseband input, an impedance of 50 Ω is always used.
Remote command:
INPut<ip>:IMPedance on page 206
5.2.14 Data capture
Access: "Overview" > "Trig / Sig Capture" > "Signal Capture"
84User Manual 1178.9226.02 ─ 06
Page 85

R&S®FSV3-K10x (LTE Uplink)
The data capture settings contain settings that control the data capture.
The data capture settings are part of the "Signal Capture" tab of the "Trigger/Signal
Capture" dialog box.
Capture Time.................................................................................................................85
Swap I/Q....................................................................................................................... 85
Overall Frame Count.....................................................................................................85
Auto According to Standard.......................................................................................... 86
Number of Frames to Analyze...................................................................................... 86
Single Subframe Mode..................................................................................................86
Configuration
I/Q measurements
Capture Time
The "Capture Time" corresponds to the time of one measurement. Therefore, it defines
the amount of data the application captures during a single measurement (or sweep).
By default, the application captures 20.1 ms of data to make sure that at least one
complete LTE frame is captured in the measurement.
The application shows the current capture time in the channel bar.
Remote command:
[SENSe:]SWEep:TIME on page 210
Swap I/Q
Swaps the real (I branch) and the imaginary (Q branch) parts of the signal.
Remote command:
[SENSe:]SWAPiq on page 209
Overall Frame Count
The "Overall Frame Count" turns the manual selection of the number of frames to capture (and analyze) on and off.
When you turn on the overall frame count, you can define the number of frames to cap-
ture and analyze. The measurement runs until all frames have been analyzed, even if it
takes more than one capture.
85User Manual 1178.9226.02 ─ 06
Page 86

R&S®FSV3-K10x (LTE Uplink)
The results are an average of the captured frames.
When you turn off the overall frame count, the application analyzes all LTE frames
found in one capture buffer.
The application shows the current frame count in the channel bar.
Remote command:
[SENSe:][LTE:]FRAMe:COUNt:STATe on page 209
Auto According to Standard
Turns automatic selection of the number of frames to capture and analyze on and off.
When you turn on this feature, the R&S FSV/A captures and evaluates a number of
frames the 3GPP standard specifies for EVM tests.
If you want to analyze an arbitrary number of frames, turn off the feature.
This parameter is not available when the overall frame count is inactive.
Remote command:
[SENSe:][LTE:]FRAMe:COUNt:AUTO on page 208
Configuration
I/Q measurements
Number of Frames to Analyze
Defines the number of frames you want to capture and analyze.
If the number of frames you have set last longer than a single measurement, the appli-
cation continues the measurement until all frames have been captured.
The parameter is read only in the following cases:
●
If you turn off the overall frame count.
●
If you capture the data according to the standard.
Remote command:
[SENSe:][LTE:]FRAMe:COUNt on page 208
Single Subframe Mode
Turns the evaluation of a single subframe only on and off.
Evaluating a single subframe only improves the measurement speed. For successful
synchronization, the subframe must be located within the captured data (= 1.2 ms).
You can make sure that this is the case by using, for example, an external frame trigger signal.
For maximum measurement speed, the application turns off Auto According to Stan-
dard and sets the Number of Frames to Analyze to 1. These settings prevent the appli-
cation from capturing data more than once for a single run measurement.
Remote command:
[SENSe:][LTE:]FRAMe:SSUBframe on page 209
5.2.15 Trigger configuration
Access: "Overview" > "Trig / Sig Capture" > "Trigger"
86User Manual 1178.9226.02 ─ 06
Page 87

R&S®FSV3-K10x (LTE Uplink)
A trigger allows you to capture those parts of the signal that you are really interested
in.
While the application runs freely and analyzes all signal data in its default state, no
matter if the signal contains information or not, a trigger initiates a measurement only
under certain circumstances (the trigger event).
Except for the available trigger sources, the functionality is the same as that of the
R&S FSV/A base system.
For a comprehensive description of the available trigger settings not described here,
refer to the documentation of the R&S FSV/A.
Gated measurements
In addition to the general trigger functions, the frequency sweep measurements (for
example ACLR) also support gated measurements.
The functionality is basically the same as in the spectrum application. However, the
LTE application automatically selects the correct gate settings (delay and length)
according to the TDD configuration.
Configuration
I/Q measurements
Trigger Source...............................................................................................................87
Trigger Source
The application supports several trigger modes or sources.
●
Free Run
Starts the measurement immediately and measures continuously.
●
External <x>
The trigger event is the level of an external trigger signal. The measurement starts
when this signal meets or exceeds a specified trigger level at the trigger input.
Some measurement devices have several trigger ports. When you use one of
these, several external trigger sources are available.
●
I/Q Power
The trigger event is the magnitude of the sampled I/Q data. The measurement
starts when the magnitude of the I/Q data meets or exceeds the trigger level.
●
IF Power
The trigger event is the level of the intermediate frequency (IF). The measurement
starts when the level of the IF meets or exceeds the trigger level.
●
RF Power
The trigger event is the level measured at the RF input. The measurement starts
when the level of the signal meets or exceeds the trigger level.
87User Manual 1178.9226.02 ─ 06
Page 88

R&S®FSV3-K10x (LTE Uplink)
For all trigger sources, except "Free Run", you can define several trigger characteristics.
●
The trigger "Level" defines the signal level that initiates the measurement.
●
The trigger "Offset" is the time that must pass between the trigger event and the
start of the measurement. This can be a negative value (a pretrigger).
●
The trigger "Drop-out Time" defines the time the input signal must stay below the
trigger level before triggering again.
●
The trigger "Slope" defines whether triggering occurs when the signal rises to the
trigger level or falls down to it.
●
The trigger "Holdoff" defines a time period that must at least pass between one trigger event and the next.
●
The trigger "Hysteresis" is available for the IF power trigger. It defines a distance to
the trigger level that the input signal must stay below to fulfill the trigger condition.
For a detailed description of the trigger parameters, see the user manual of the I/Q
analyzer.
Remote command:
Source: TRIGger[:SEQuence]:SOURce<ant> on page 214
Level (external): TRIGger[:SEQuence]:LEVel<ant>[:EXTernal<tp>]
on page 212
Level (I/Q power): TRIGger[:SEQuence]:LEVel<ant>:IQPower on page 212
Level (IF power): TRIGger[:SEQuence]:LEVel<ant>:IFPower on page 212
Level (RF power): TRIGger[:SEQuence]:LEVel<ant>:RFPower on page 213
Offset: TRIGger[:SEQuence]:HOLDoff<ant>[:TIME] on page 211
Hysteresis: TRIGger[:SEQuence]:IFPower:HYSTeresis on page 211
Drop-out time: TRIGger[:SEQuence]:DTIMe on page 210
Slope: TRIGger[:SEQuence]:SLOPe on page 214
Holdoff: TRIGger[:SEQuence]:IFPower:HOLDoff on page 211
Configuration
I/Q measurements
5.2.16 Tracking configuration
Access: "Overview" > "Signal Description" > "Tracking"
The tracking settings contain settings that compensate for various common measurement errors that may occur.
Phase............................................................................................................................88
Time Tracking................................................................................................................89
Phase
Turns phase tracking on and off.
When you turn on phase tracking, the application compensates the measurement
results for the phase error on a symbol level.
"Off"
Phase tracking is not applied.
88User Manual 1178.9226.02 ─ 06
Page 89

R&S®FSV3-K10x (LTE Uplink)
Configuration
I/Q measurements
"Pilot Only"
"Pilot and Payload"
Remote command:
[SENSe:][LTE:]UL:TRACking:PHASe on page 217
Time Tracking
Turns time tracking on and off.
Clock deviations (slower or faster sampling time) lead to a drift of the ideal sampling
instant over time, causing a rotating constellation diagram.
When you turn on time tracking, the application compensates the measurement results
for timing errors on a symbol level.
Remote command:
[SENSe:][LTE:]UL:TRACking:TIME on page 218
Only the reference signal is used for the estimation of the phase
error.
Both reference signal and payload resource elements are used for
the estimation of the phase error.
5.2.17 Signal demodulation
Access: "Overview" > "Demodulation"
Analysis Mode...............................................................................................................89
Channel Estimation Range........................................................................................... 90
EVM with Exclusion Period........................................................................................... 90
Analyze TDD Transient Slots........................................................................................90
Compensate DC Offset.................................................................................................90
Scrambling of Coded Bits..............................................................................................90
Suppressed Interference Synchronization.................................................................... 91
Multicarrier Filter........................................................................................................... 91
Analysis Mode
Selects the channel analysis mode.
You can select from "PUSCH/PUCCH" mode and "PRACH" mode.
"PUSCH/PUCCH" mode analyzes the PUSCH and PUCCH (default mode).
89User Manual 1178.9226.02 ─ 06
Page 90

R&S®FSV3-K10x (LTE Uplink)
"PRACH" mode analyzes the PRACH only. In PRACH analysis mode, no subframe or
slot selection is available. Instead you can select a particular preamble that the results
are shown for. Note that PRACH analysis mode does not support all result displays.
Remote command:
[SENSe:][LTE:]UL:DEMod:MODE on page 215
Channel Estimation Range
Selects the method for channel estimation.
You can select if only the pilot symbols are used to perform channel estimation or if
both pilot and payload carriers are used.
Remote command:
[SENSe:][LTE:]UL:DEMod:CESTimation on page 216
EVM with Exclusion Period
Turns exclusion periods for EVM measurements as defined in 3GPP TS 36.521 on and
off.
The exclusion period affects the PUSCH data EVM of the first and last symbol.
The software automatically determines the length of the exclusion period according to
3GPP TS 36.521-1.
The exclusion period has no effect on the EVM vs Carrier and EVM vs Symbol x Car-
rier result displays.
Remote command:
[SENSe:][LTE:]UL:DEMod:EEPeriod on page 216
Configuration
I/Q measurements
Analyze TDD Transient Slots
Includes or excludes the transient slots present after a switch from downlink to uplink in
the analysis.
If on, the transient slots are not included in the measurement.
Remote command:
[SENSe:][LTE:]UL:DEMod:ATTSlots on page 215
Compensate DC Offset
Turns DC offset compensation when calculating measurement results on and off.
According to 3GPP TS 36.101 (Annex F.4), the R&S FSV/A removes the carrier leak-
age (I/Q origin offset) from the evaluated signal before it calculates the EVM and inband emissions.
Remote command:
[SENSe:][LTE:]UL:DEMod:CDCoffset on page 216
Scrambling of Coded Bits
Turns the scrambling of coded bits for the PUSCH on and off.
The scrambling of coded bits affects the bitstream results.
90User Manual 1178.9226.02 ─ 06
Page 91

R&S®FSV3-K10x (LTE Uplink)
Source of bitstream results when
=ON
(unscrambled bits)
codewords
Configuration
I/Q measurements
'Scrambling of coded bits' is
=OFF
(scrambled bits)
layers
Scrambling
Scrambling
Figure 5-1: Source for bitstream results if scrambling for coded bits is on and off
Modulation
mapper
Layer mapper
Modulation
mapper
[...]
[...]
Remote command:
[SENSe:][LTE:]UL:DEMod:CBSCrambling on page 216
Suppressed Interference Synchronization
Turns suppressed interference synchronization on and off.
If active, the synchronization on signals containing more than one user equipment (UE)
is more robust. Additionally, the EVM is lower in case the UEs have different frequency
offsets. Note that Auto Demodulation is not supported in this synchronization mode
and the EVM may be higher in case only one UE is present in the signal.
Remote command:
[SENSe:][LTE:]UL:DEMod:SISYnc on page 217
Multicarrier Filter
Turns the suppression of interference of neighboring carriers on and off.
Remote command:
[SENSe:][LTE:]UL:DEMod:MCFilter on page 217
5.2.18 Automatic configuration
Access: [AUTO SET]
The R&S FSV/A features several automatic configuration routines. When you use one
of those, the R&S FSV/A configures different parameters based on the signal that you
are measuring.
Auto leveling
You can use the auto leveling routine for a quick determination of preliminary amplitude
settings for the current LTE input signal.
Remote command:
[SENSe:]ADJust:LEVel<ant> on page 219
Auto Scaling
Scales the y-axis for best viewing results. Also see "Automatic scaling of the y-axis"
on page 97.
91User Manual 1178.9226.02 ─ 06
Page 92

R&S®FSV3-K10x (LTE Uplink)
Remote command:
DISPlay[:WINDow<n>][:SUBWindow<w>]:TRACe<t>:Y[:SCALe]:AUTO
on page 228
5.3 Time alignment error measurements
Several settings supported by time alignment error measurements are the same as
those for I/Q measurements. For a comprehensive description of those, refer to the following chapters.
●
Chapter 5.2.1, "Signal characteristics", on page 50
●
Chapter 5.2.6, "Demodulation reference signal configuration", on page 65
●
Chapter 5.2.8, "PUSCH structure", on page 71
●
Chapter 7.9.2.2, "Input configuration", on page 198
●
Chapter 5.2.12, "Frequency configuration", on page 80
●
Chapter 5.2.13, "Amplitude configuration", on page 81
●
Chapter 5.2.14, "Data capture", on page 84
●
Chapter 5.2.15, "Trigger configuration", on page 86
●
Chapter 5.2.17, "Signal demodulation", on page 89
Configuration
Frequency sweep measurements
For more information about configuring carrier aggregation see "Carrier Aggregation"
on page 51.
5.4 Frequency sweep measurements
After starting one of the frequency sweep measurements, the application automatically
loads the configuration required by measurements according to the 3GPP standard:
the spectral mask as defined in the 3GPP standard for SEM measurements and the
channel configuration defined in the standard for the ACLR measurement.
If you need a different measurement configuration, you can change all parameters as
required. Except for the dialog box decribed below, the measurement configuration
menus for the frequency sweep measurements are the same as in the Spectrum application.
Please refer to the User Manual of the R&S FSV/A for a detailed description on how to
configure ACLR and SEM measurements.
● ACLR signal description..........................................................................................92
● SEM signal description............................................................................................93
● MC ACLR signal description................................................................................... 94
5.4.1 ACLR signal description
Access: [MEAS CONFIG] > "Signal Description"
92User Manual 1178.9226.02 ─ 06
Page 93

R&S®FSV3-K10x (LTE Uplink)
The signal description for ACLR measurements contains settings to describe general
physical characteristics of the signal you are measuring.
Functions in the "Signal Description" dialog box described elsewhere:
●
LTE mode
●
Test Model
●
Channel bandwidth
All other settings available for the ACLR measurement are the same as in the spectrum application. For more information, refer to the user manual of the R&S FSV/A.
Assumed Adjacent Channel Carrier..............................................................................93
Assumed Adjacent Channel Carrier
Selects the assumed adjacent channel carrier for the ACLR measurement.
The supported types are EUTRA of same bandwidth, 1.28 Mcps UTRA, 3.84 Mcps
UTRA and 7.68 Mcps UTRA.
Note that not all combinations of LTE channel bandwidth settings and assumed adja-
cent channel carrier settings are defined in the 3GPP standard.
Remote command:
[SENSe:]POWer:ACHannel:AACHannel on page 222
Configuration
Frequency sweep measurements
5.4.2 SEM signal description
The signal description for SEM measurements contains settings to describe general
physical characteristics of the signal you are measuring.
Access: "Overview" > "Signal Description"
Functions in the "Signal Description" dialog box described elsewhere:
●
LTE mode
●
Test Model
●
Channel bandwidth
●
Cyclic prefix
●
TDD configuration
All other settings available for the SEM measurement are the same as in the spectrum
application. For more information, refer to the user manual of the R&S FSV/A.
SEM Requirement.........................................................................................................93
SEM Requirement
Selects the type of spectrum emission mask used for the Out of Band emission measurement.
The software supports general and specific (additional) spectrum emission masks. The
specific spectrum emission masks contain additional SEM requirements. The additional requirement masks to use for the measurement depend on the network signaled
value "NS_03", "NS_04", "NS_06" or "NS_07".
If "NS_06" or "NS_07" is indicated in the cell, use SEM requirement "NS_06_07".
93User Manual 1178.9226.02 ─ 06
Page 94

R&S®FSV3-K10x (LTE Uplink)
Remote command:
[SENSe:]POWer:SEM:UL:REQuirement on page 222
5.4.3 MC ACLR signal description
Access: "Overview" > "Signal Description" > "Physical Settings CC<x>" / "Carrier Con-
figuration"
You can configure the characteristics of the carriers in the "Carrier Configuration" tab.
Note: the "Carrier Configuration" button in the "Physical Settings" tab also opens the
"Carrier Configuration" tab.
The signal description for MC ACLR measurements contain settings to describe general physical characteristics of the signal you are measuring.
Configuration
Frequency sweep measurements
Functions in the "Signal Description" dialog box described elsewhere:
●
LTE mode
●
Test Model
●
Channel bandwidth
●
Cyclic prefix
●
TDD configuration
●
Component carriers
94User Manual 1178.9226.02 ─ 06
Page 95

R&S®FSV3-K10x (LTE Uplink)
6 Analysis
The R&S FSV/A provides various tools to analyze the measurement results.
● General analysis tools.............................................................................................95
● Analysis tools for I/Q measurements...................................................................... 98
● Analysis tools for frequency sweep measurements..............................................104
6.1 General analysis tools
The general analysis tools are tools available for all measurements.
● Data export..............................................................................................................95
● Microservice export.................................................................................................96
● Diagram scale......................................................................................................... 96
● Zoom.......................................................................................................................97
● Markers................................................................................................................... 97
Analysis
General analysis tools
6.1.1 Data export
Access: [TRACE] > "Trace Export Config"
You can export the measurement results to an ASCII file, for example to backup the
results or analyze the results with external applications (for example in a Microsoft
Excel spreadsheet).
You can also export the I/Q data itself, for example if you want to keep it for later
reevaluation.
The data export is available for:
●
I/Q measurements
●
Time alignment error measurements
Exporting trace data
1. Select the "Trace Export Config" dialog box via the [TRACE] key.
2. Select the data you would like to export.
3. Select the results you would like to export from the "Specifics For" dropdown menu.
4. Export the data with the "Export Trace to ASCII File" feature.
5. Select the location where you would like to save the data (as a .dat file).
Note that the measurement data stored in the file depend on the selected result
display ("Specifics For" selection).
Exporting I/Q data
1. Select the disk icon in the toolbar.
95User Manual 1178.9226.02 ─ 06
Page 96

R&S®FSV3-K10x (LTE Uplink)
2. Select "Export" > "I/Q Export".
3. Define a file name and location for the I/Q data.
The file type is iq.tar.
4. Select the folder icon from the toolbar to import I/Q data again later ("Import" > "I/Q
Import").
Data import and export
The basic principle for both trace export and I/Q data export and import is the same as
in the spectrum application. For a comprehensive description, refer to the R&S FSV/A
user manual.
Remote command:
Trace export: TRACe<n>[:DATA]? on page 138
I/Q export: MMEMory:STORe<n>:IQ:STATe on page 169
I/Q import: MMEMory:LOAD:IQ:STATe on page 169
6.1.2 Microservice export
Analysis
General analysis tools
Access:
In addition to exporting the signal configuration locally, you can export the signal configuration in a file format compatible to the cloud-based microservice (.m5g file extension).
For a comprehensive description of the microservice, refer to the microservice user
manual.
Remote command:
MMEMory:STORe<n>:MSERvice on page 224
/ > "Export" > "Microservice Export"
6.1.3 Diagram scale
Access: "Overview" > "Analysis" > "Scale"
You can change the scale of the y-axis in various diagrams. The y-axis scale determines the vertical resolution of the measurement results.
The scale of the x-axis in the diagrams is fix. If you want to get a better resolution of
the x-axis, you have to zoom into the diagram.
The remote commands required to configure the y-axis scale are described in Chap-
ter 7.10.4, "Y-axis scale", on page 228.
Manual scaling of the y-axis..........................................................................................96
Automatic scaling of the y-axis......................................................................................97
Manual scaling of the y-axis
The "Y Minimum" and "Y Maximum" properties define a custom scale of the y-axis.
96User Manual 1178.9226.02 ─ 06
Page 97

R&S®FSV3-K10x (LTE Uplink)
The "Y Minimum" corresponds to the value at the origin. The "Y Maximum" corresponds to the last value on the y-axis. The scale you select applies to the currently
active window.
You can restore the original scale anytime with the "Restore Scale" button.
Remote command:
DISPlay[:WINDow<n>][:SUBWindow<w>]:TRACe<t>:Y[:SCALe]:MAXimum
on page 228
DISPlay[:WINDow<n>][:SUBWindow<w>]:TRACe<t>:Y[:SCALe]:MINimum
on page 229
Automatic scaling of the y-axis
Usually, the best way to view the results is if they fit ideally in the diagram area and
display the complete trace. The "Auto Scale Once" automatically determines the scale
of the y-axis that fits this criteria in the currently active window.
Tip: You can also scale the windows in the "Auto Set" menu. In addition to scaling the
selected window ("Auto Scale Window"), you can change the scale of all windows at
the same time ("Auto Scale All").
You can restore the original scale anytime with the "Restore Scale" button.
Remote command:
DISPlay[:WINDow<n>][:SUBWindow<w>]:TRACe<t>:Y[:SCALe]:AUTO
on page 228
Analysis
General analysis tools
6.1.4 Zoom
The zoom feature allows you to zoom into any graphical result display. This can be a
useful tool if you want to analyze certain parts of a diagram in more detail.
The zoom functionality is the same as in the spectrum application.
The following zoom functions are supported.
●
: Magnifies the selected diagram area.
●
: Magnifies the selected diagram area, but keeps the original diagram in a sepa-
rate window.
●
: Restores the original diagram.
Note that the zoom is a graphical feature that magnifies the data in the capture buffer.
Zooming into the diagram does not reevaluate the I/Q data.
For a comprehensive description of the zoom, refer to the R&S FSV/A user manual.
6.1.5 Markers
Access: "Overview" > "Analysis" > "Marker"
Markers are a tool that help you to identify measurement results at specific trace
points. When you turn on a marker, it gives you the coordinates of its position, for
example the frequency and its level value or the symbol and its EVM value.
97User Manual 1178.9226.02 ─ 06
Page 98

R&S®FSV3-K10x (LTE Uplink)
In general, the marker functionality of setting and positioning markers is similar to the
spectrum application.
For I/Q measurement, the R&S FSV/A supports up to four markers, for frequency
sweep measurements there are more. Markers give either absolute values (normal
markers) or values relative to the first marker (deltamarkers). If a result display has
more than one trace, for example the "EVM vs Symbol" result display, you can position
the marker on either trace. By default, all markers are positioned on trace 1.
Note that if you analyze more than one bandwidth part, each bandwidth part is represented by a different trace.
The R&S FSV/A also supports several automatic positioning mechanisms that allow
you to move the marker to the maximum trace value (peak), the minimum trace value
or move it from peak to subsequent peak.
The marker table summarizes the marker characteristics.
For a comprehensive description, refer to the R&S FSV/A user manual.
Markers in result displays with a third quantity
Analysis
Analysis tools for I/Q measurements
In result displays that show a third quantity, for example the "EVM vs Symbol x Carrier"
result, the R&S FSV/A provides an extended marker functionality.
You can position the marker on a specific resource element, whose position is defined
by the following coordinates:
●
The "Symbol" input field selects the symbol.
●
The "Carrier" input field selects the carrier.
Alternatively, you can define the marker position in the "Marker Configuration" dialog
box, which is expanded accordingly.
The marker information shows the EVM, the power and the allocation ID of the
resource element you have selected as the marker position.
6.2 Analysis tools for I/Q measurements
● Layout of numerical results..................................................................................... 98
● Evaluation range..................................................................................................... 99
● Result settings.......................................................................................................102
6.2.1 Layout of numerical results
You can customize the displayed information of some numerical result displays or
tables, for example the allocation summary.
► Select some point in the header row of the table.
98User Manual 1178.9226.02 ─ 06
Page 99

R&S®FSV3-K10x (LTE Uplink)
The application opens a dialog box to add or remove columns.
Add and remove columns as required.
6.2.2 Evaluation range
Access: "Overview" > "Evaluation Range"
Analysis
Analysis tools for I/Q measurements
The evaluation range defines the signal parts that are considered during signal analysis.
Configuring component carriers
When you are doing measurements on aggregated carriers, you can configure each
carrier separately.
When available, each carrier in the dialog boxes is represented by an additional tab
labeled "CC<x>", with <x> indicating the number of the component carrier.
Note that the additional tabs are only added to the user interface after you have
selected more than "1" component carrier.
Subframe Selection.....................................................................................................100
Slot Selection.............................................................................................................. 101
Preamble Selection.....................................................................................................101
Evaluation range for the constellation diagram...........................................................102
99User Manual 1178.9226.02 ─ 06
Page 100

R&S®FSV3-K10x (LTE Uplink)
Subframe Selection
The "Subframe" selection filters the results by a specific subframe number.
If you apply the filter, only the results for the subframe you have selected are dis-
played. Otherwise, the R&S FSV/A shows the results for all subframes that have been
analyzed.
The R&S FSV/A shows three traces if you display the results for all subframes.
●
One trace ("Min") shows the minimum values measured over all analyzed subframes.
●
One trace ("Max") shows the maximum values measured over all analyzed subframes.
●
One trace ("Avg") shows the average values measured over all subframes.
Analysis
Analysis tools for I/Q measurements
If you filter by a single subframe, the R&S FSV/A still shows three traces, but with different information.
●
One trace ("Min") shows the minimum values measured over all slots in the
selected subframe.
●
One trace ("Max") shows the maximum values measured over all slots in the
selected subframe.
●
One trace ("Avg") shows the average values measured over all slots in the
selected subframe.
The number of traces is only reduced to one trace if you filter by a single slot.
In PRACH analysis mode, you cannot filter by a single subframe.
You can apply the filter to the following result displays.
●
Result Summary
●
EVM vs Carrier / EVM vs Symbol / EVM vs Symbol X Carrier
●
Spectrum Flatness / Spectrum Flatness SRS / Spectrum Flatness Difference
●
Inband Emission
●
Group Delay
●
Power vs Symbol X Carrier
●
Constellation Diagram
●
DFT Precoded Constellation
●
Allocation Summary
●
Bit Stream
●
Time Alignment Error
100User Manual 1178.9226.02 ─ 06
 Loading...