

Page 1

User Manual
Enpac 2500 Data Collector
Catalog Numbers 1441-PEN25 and 1441-PEN25-Z
Page 2
Important User Information
IMPORTANT
Solid-state equipment has operational characteristics differing from those of electromechanical equipment. Safety
Guidelines for the Application, Installation and Maintenance of Solid State Controls (publication SGI-1.1
your local Rockwell Automation® sales office or online at http://www.rockwellautomation.com/literature/
important differences between solid-state equipment and hard-wired electromechanical devices. Because of this difference,
and also because of the wide variety of uses for solid-state equipment, all persons responsible for applying this equipment
must satisfy themselves that each intended application of this equipment is acceptable.
In no event will Rockwell Automation, Inc. be responsible or liable for indirect or consequential damages resulting from the
use or application of this equipment.
The examples and diagrams in this manual are included solely for illustrative purposes. Because of the many variables and
requirements associated with any particular installation, Rockwell Automation, Inc. cannot assume responsibility or
liability for actual use based on the examples and diagrams.
No patent liability is assumed by Rockwell Automation, Inc. with respect to use of information, circuits, equipment, or
software described in this manual.
Reproduction of the contents of this manual, in whole or in part, without written permission of Rockwell Automation,
Inc., is prohibited.
Throughout this manual, when necessary, we use notes to make you aware of safety considerations.
available from
) describes some
WARNING: Identifies information about practices or circumstances that can cause an explosion in a hazardous environment,
which may lead to personal injury or death, property damage, or economic loss.
ATTENTION: Identifies information about practices or circumstances that can lead to personal injury or death, property
damage, or economic loss. Attentions help you identify a hazard, avoid a hazard, and recognize the consequence.
SHOCK HAZARD: Labels may be on or inside the equipment, for example, a drive or motor, to alert people that dangerous
voltage may be present.
BURN HAZARD: Labels may be on or inside the equipment, for example, a drive or motor, to alert people that surfaces may
reach dangerous temperatures.
Identifies information that is critical for successful application and understanding of the product.
Allen-Bradley, Rockwell Software, Rockwell Automation, Enpac, Emonitor, Enshare, and TechConnect are trademarks of Rockwell Automation, Inc.
Trademarks not belonging to Rockwell Automation are property of their respective companies.
Page 3

Summary of Changes
This manual contains new and updated information. Changes throughout this
revision are marked by change bars, as shown to the right of this paragraph.
New and Updated Information
This table contains the changes made to this revision.
Top ic Pag e
Upgrade Options 13
Additional Resources 17
Added safety warnings 20
Setup Screen 30
Data Collection Screen 33
Engineer Mode Menu Screen 37
Setting Up the Enpac 2500 Data Collector 40
Module ICP 42
Using Memory Cards 47
Operating System Update Procedures 50
Bias Check 125
FRF Frequency Response Function Extension Module 287
Specifications 301
Rockwell Automation Publication GMSI10-UM002D-EN-E - August 2012 3
Page 4

Summary of Changes
Notes:
4 Rockwell Automation Publication GMSI10-UM002D-EN-E - August 2012
Page 5

Table of Contents
Preface
The Enpac 2500 Data Collector
Using the Manual . . . . . . . . . . . . . . . . . . . . . . . . . . . . . . . . . . . . . . . . . . . . . . . . 13
Upgrade Options. . . . . . . . . . . . . . . . . . . . . . . . . . . . . . . . . . . . . . . . . . . . . . . . . 13
Enpac 2500 Data Collector and the Emonitor Software . . . . . . . . . . . . . 14
Software Compatibilities. . . . . . . . . . . . . . . . . . . . . . . . . . . . . . . . . . . . . . . . . . 14
USB and Communication Software. . . . . . . . . . . . . . . . . . . . . . . . . . . . 14
Operating System. . . . . . . . . . . . . . . . . . . . . . . . . . . . . . . . . . . . . . . . . . . . . 14
Document Conventions . . . . . . . . . . . . . . . . . . . . . . . . . . . . . . . . . . . . . . . . . . 14
Using Online Help . . . . . . . . . . . . . . . . . . . . . . . . . . . . . . . . . . . . . . . . . . . . . . . 15
Help Screen. . . . . . . . . . . . . . . . . . . . . . . . . . . . . . . . . . . . . . . . . . . . . . . . . . 15
Organization. . . . . . . . . . . . . . . . . . . . . . . . . . . . . . . . . . . . . . . . . . . . . . . . . 16
Document Conventions . . . . . . . . . . . . . . . . . . . . . . . . . . . . . . . . . . . . . . 16
Additional Resources . . . . . . . . . . . . . . . . . . . . . . . . . . . . . . . . . . . . . . . . . . . . . 17
Chapter 1
Safety Information . . . . . . . . . . . . . . . . . . . . . . . . . . . . . . . . . . . . . . . . . . . . . . . 20
Optical Ports. . . . . . . . . . . . . . . . . . . . . . . . . . . . . . . . . . . . . . . . . . . . . . . . . 20
Laser Radiation Ports . . . . . . . . . . . . . . . . . . . . . . . . . . . . . . . . . . . . . . . . . 20
Parts of the Enpac . . . . . . . . . . . . . . . . . . . . . . . . . . . . . . . . . . . . . . . . . . . . . . . . 21
Enpac 2500 Diagram and Key Definitions . . . . . . . . . . . . . . . . . . . . . . 21
External Connections. . . . . . . . . . . . . . . . . . . . . . . . . . . . . . . . . . . . . . . . . 23
Status Indicators. . . . . . . . . . . . . . . . . . . . . . . . . . . . . . . . . . . . . . . . . . . . . . 25
Strap Attachment . . . . . . . . . . . . . . . . . . . . . . . . . . . . . . . . . . . . . . . . . . . . 26
Battery Pack . . . . . . . . . . . . . . . . . . . . . . . . . . . . . . . . . . . . . . . . . . . . . . . . . . . . . 26
Checking Battery Life. . . . . . . . . . . . . . . . . . . . . . . . . . . . . . . . . . . . . . . . . 27
Inserting and Removing the Battery Pack . . . . . . . . . . . . . . . . . . . . . . . 28
Powering on the Enpac . . . . . . . . . . . . . . . . . . . . . . . . . . . . . . . . . . . . . . . . . . . 29
Enpac 2500 Screens . . . . . . . . . . . . . . . . . . . . . . . . . . . . . . . . . . . . . . . . . . . . . . 29
Main Menu . . . . . . . . . . . . . . . . . . . . . . . . . . . . . . . . . . . . . . . . . . . . . . . . . . 29
Setup Screen . . . . . . . . . . . . . . . . . . . . . . . . . . . . . . . . . . . . . . . . . . . . . . . . . 30
Set the Date, Time, and Date Format. . . . . . . . . . . . . . . . . . . . . . . . . . . 32
Data Collection Screen . . . . . . . . . . . . . . . . . . . . . . . . . . . . . . . . . . . . . . . 33
Help Screen. . . . . . . . . . . . . . . . . . . . . . . . . . . . . . . . . . . . . . . . . . . . . . . . . . 37
Engineer Mode Menu Screen . . . . . . . . . . . . . . . . . . . . . . . . . . . . . . . . . . 37
View Settings for Current Measurement Definition . . . . . . . . . . . . . 39
Setting Up the Enpac 2500 Data Collector . . . . . . . . . . . . . . . . . . . . . . . . . 40
Configure the Data Collector. . . . . . . . . . . . . . . . . . . . . . . . . . . . . . . . . . 40
Configure the Data Collection Options . . . . . . . . . . . . . . . . . . . . . . . . 42
Using Memory Cards. . . . . . . . . . . . . . . . . . . . . . . . . . . . . . . . . . . . . . . . . . . . . 47
Types of Memory Cards Used with Enpac 2500. . . . . . . . . . . . . . . . . 48
Inserting and Removing a Memory Card . . . . . . . . . . . . . . . . . . . . . . . 48
Operating System Update Procedures. . . . . . . . . . . . . . . . . . . . . . . . . . . . . . 50
Update the Enpac 2500 Data Collector Operating
System, Firmware Version 3.10 . . . . . . . . . . . . . . . . . . . . . . . . . . . . 50
Restarting the Data Collector . . . . . . . . . . . . . . . . . . . . . . . . . . . . . . . . . . . . . 56
Perform Soft Restart . . . . . . . . . . . . . . . . . . . . . . . . . . . . . . . . . . . . . . . . . . 56
Rockwell Automation Publication GMSI10-UM002D-EN-E - August 2012 5
Page 6

Table of Contents
Perform Hard Restart. . . . . . . . . . . . . . . . . . . . . . . . . . . . . . . . . . . . . . . . . 56
Adding Applications to the Enpac 2500 Data Collector . . . . . . . . . . . . . 58
Chapter 2
Setting Up Measurements
Measurement Definition Options . . . . . . . . . . . . . . . . . . . . . . . . . . . . . . . . . 60
Measurement Types . . . . . . . . . . . . . . . . . . . . . . . . . . . . . . . . . . . . . . . . . . 60
Measurement Filters . . . . . . . . . . . . . . . . . . . . . . . . . . . . . . . . . . . . . . . . . . 61
Measurement Units. . . . . . . . . . . . . . . . . . . . . . . . . . . . . . . . . . . . . . . . . . . 66
Setting Up Collection Specifications. . . . . . . . . . . . . . . . . . . . . . . . . . . . . . . 67
Measurement Input Types . . . . . . . . . . . . . . . . . . . . . . . . . . . . . . . . . . . . 68
Measurement Window Types . . . . . . . . . . . . . . . . . . . . . . . . . . . . . . . . . 69
Measurement Signal Detection Types . . . . . . . . . . . . . . . . . . . . . . . . . . 69
Measurement Maximum Frequencies . . . . . . . . . . . . . . . . . . . . . . . . . . 70
Measurement Resolution. . . . . . . . . . . . . . . . . . . . . . . . . . . . . . . . . . . . . . 71
Number and Type of Averages. . . . . . . . . . . . . . . . . . . . . . . . . . . . . . . . . 72
Order Normalization for Orders Track Spectrum . . . . . . . . . . . . . . . 73
Using Frequency Items for the Diagnostic Frequency Cursor. . . . . 74
Setting Up Speed References . . . . . . . . . . . . . . . . . . . . . . . . . . . . . . . . . . 74
Setting Up Measurement Definitions . . . . . . . . . . . . . . . . . . . . . . . . . . . . . . 76
Magnitude Measurement Definitions . . . . . . . . . . . . . . . . . . . . . . . . . . 77
Magnitude and Phase Measurements at Orders. . . . . . . . . . . . . . . . . . 79
Numeric (process) Measurement Definitions . . . . . . . . . . . . . . . . . . . 82
Spectrum Measurement Definitions. . . . . . . . . . . . . . . . . . . . . . . . . . . . 84
Time Waveform Measurement Definitions . . . . . . . . . . . . . . . . . . . . . 87
Voltage Measurement Definitions . . . . . . . . . . . . . . . . . . . . . . . . . . . . . 90
Combining Measurement Definitions for a Location . . . . . . . . . . . . 91
Setting Up Tri-axial Measurements . . . . . . . . . . . . . . . . . . . . . . . . . . . . 92
Setting Up Alarms, Lists, and Inspection Codes. . . . . . . . . . . . . . . . . . . . . 93
Alarms and the Data Collector . . . . . . . . . . . . . . . . . . . . . . . . . . . . . . . . 93
Lists and the Data Collector. . . . . . . . . . . . . . . . . . . . . . . . . . . . . . . . . . . 94
Inspection Codes and the Data Collector. . . . . . . . . . . . . . . . . . . . . . . 94
Chapter 3
Loading and Unloading
6 Rockwell Automation Publication GMSI10-UM002D-EN-E - August 2012
Setting Up for Communication . . . . . . . . . . . . . . . . . . . . . . . . . . . . . . . . . . . 95
Set Up the Current Data Collector in Emonitor . . . . . . . . . . . . . . . . 96
Set Up Computer Communication Options in Emonitor. . . . . . . . 99
Set Up the Data Collector for Communication . . . . . . . . . . . . . . . . 100
Connecting the Data Collector and Computer (RS-232) . . . . . . . 100
Using the USB Port. . . . . . . . . . . . . . . . . . . . . . . . . . . . . . . . . . . . . . . . . . 101
Using a PCMCIA Card Reader. . . . . . . . . . . . . . . . . . . . . . . . . . . . . . . 103
Loading Lists to the Data Collector . . . . . . . . . . . . . . . . . . . . . . . . . . . . . . . 104
Preparing the Data Collector before Loading . . . . . . . . . . . . . . . . . . 104
Initializing the Data Collector before Loading . . . . . . . . . . . . . . . . . 105
Loading Inspection Codes. . . . . . . . . . . . . . . . . . . . . . . . . . . . . . . . . . . . 107
Loading Frequency Labels . . . . . . . . . . . . . . . . . . . . . . . . . . . . . . . . . . . . 107
Overriding the Collect on Alarm Setting . . . . . . . . . . . . . . . . . . . . . . 108
Page 7

Collecting and Reviewing Data
Table of Contents
Selecting the List(s). . . . . . . . . . . . . . . . . . . . . . . . . . . . . . . . . . . . . . . . . . 109
Loading Selected Lists to the Data Collector . . . . . . . . . . . . . . . . . . . 109
Displaying the Data Collector Driver Version Number . . . . . . . . . 110
Unloading Lists from the Data Collector. . . . . . . . . . . . . . . . . . . . . . . . . . 111
Unloading Lists in Emonitor . . . . . . . . . . . . . . . . . . . . . . . . . . . . . . . . . 111
Unloading Multiple Measurements Points in Emonitor. . . . . . . . . 112
Unloading Unscheduled (off route) Data from the
Enpac 2500 Data Collector . . . . . . . . . . . . . . . . . . . . . . . . . . . . . . . 113
Unloading Measurements using Smart Unscheduled Mode . . . . . 113
Automatically Printing Reports after Unloading . . . . . . . . . . . . . . . 115
Chapter 4
Preparing for Data Collection . . . . . . . . . . . . . . . . . . . . . . . . . . . . . . . . . . . . 117
Connect a Transducer to the Data Collector. . . . . . . . . . . . . . . . . . . 118
Select the Data Collection Options . . . . . . . . . . . . . . . . . . . . . . . . . . . 118
Collecting Route Data. . . . . . . . . . . . . . . . . . . . . . . . . . . . . . . . . . . . . . . . . . . 119
Select a Route . . . . . . . . . . . . . . . . . . . . . . . . . . . . . . . . . . . . . . . . . . . . . . . 119
Move through a List . . . . . . . . . . . . . . . . . . . . . . . . . . . . . . . . . . . . . . . . . 120
Start Data Collection . . . . . . . . . . . . . . . . . . . . . . . . . . . . . . . . . . . . . . . . 122
Bias Check. . . . . . . . . . . . . . . . . . . . . . . . . . . . . . . . . . . . . . . . . . . . . . . . . . 123
Select Inspection Codes . . . . . . . . . . . . . . . . . . . . . . . . . . . . . . . . . . . . . . 124
Manually Enter a Numeric Measurement. . . . . . . . . . . . . . . . . . . . . . 125
Collect a Process DC Voltage Measurement . . . . . . . . . . . . . . . . . . . 126
Collect a Magnitude Measurement. . . . . . . . . . . . . . . . . . . . . . . . . . . . 127
Collect a Spectrum Measurement . . . . . . . . . . . . . . . . . . . . . . . . . . . . . 128
Collect a Time Waveform Measurement . . . . . . . . . . . . . . . . . . . . . . 132
Collect Magnitude and Phase Measurements at Orders . . . . . . . . . 133
Collect Multiple Measurements for a Point . . . . . . . . . . . . . . . . . . . . 135
Collecting Offroute Data . . . . . . . . . . . . . . . . . . . . . . . . . . . . . . . . . . . . . . . . 136
Methods for Collecting Offroute Data . . . . . . . . . . . . . . . . . . . . . . . . 136
Collect Offroute Data using a Pre-defined Measurement. . . . . . . . 137
Create and Collect a User-defined Point. . . . . . . . . . . . . . . . . . . . . . . 139
Storing Unscheduled Data . . . . . . . . . . . . . . . . . . . . . . . . . . . . . . . . . . . . . . . 147
Changing Display View. . . . . . . . . . . . . . . . . . . . . . . . . . . . . . . . . . . . . . . . . . 148
Reviewing Data . . . . . . . . . . . . . . . . . . . . . . . . . . . . . . . . . . . . . . . . . . . . . . . . . 149
Review Route Data . . . . . . . . . . . . . . . . . . . . . . . . . . . . . . . . . . . . . . . . . . 149
Review Offroute Data. . . . . . . . . . . . . . . . . . . . . . . . . . . . . . . . . . . . . . . . 150
Review Data . . . . . . . . . . . . . . . . . . . . . . . . . . . . . . . . . . . . . . . . . . . . . . . . 151
Use Diagnostic Frequency Cursors with a Spectrum . . . . . . . . . . . . 153
Review Waterfall Spectra Data. . . . . . . . . . . . . . . . . . . . . . . . . . . . . . . . 154
Delete a Measurement . . . . . . . . . . . . . . . . . . . . . . . . . . . . . . . . . . . . . . . 154
Capturing Screens. . . . . . . . . . . . . . . . . . . . . . . . . . . . . . . . . . . . . . . . . . . . . . . 155
Print Reports and Plots by Using the Emonitor Software . . . . . . . 155
Rockwell Automation Publication GMSI10-UM002D-EN-E - August 2012 7
Page 8

Table of Contents
Chapter 5
Multi-channel Measurements
Predictive Maintenance Program . . . . . . . . . . . . . . . . . . . . . . . . . . . . . 157
Orbit Measurements . . . . . . . . . . . . . . . . . . . . . . . . . . . . . . . . . . . . . . . . . . . . 158
Understanding an Orbit Plot . . . . . . . . . . . . . . . . . . . . . . . . . . . . . . . . . 158
Set Up Orbit Measurements Definitions in
the Emonitor Software . . . . . . . . . . . . . . . . . . . . . . . . . . . . . . . . . . . 161
Set Up Offroute Orbit Measurements. . . . . . . . . . . . . . . . . . . . . . . . . 163
Collect Orbit Measurements . . . . . . . . . . . . . . . . . . . . . . . . . . . . . . . . . 166
Review Orbit Data Screen. . . . . . . . . . . . . . . . . . . . . . . . . . . . . . . . . . . . 170
Cross Channel Phase Measurements . . . . . . . . . . . . . . . . . . . . . . . . . . . . . . 171
Phase Tables . . . . . . . . . . . . . . . . . . . . . . . . . . . . . . . . . . . . . . . . . . . . . . . . 171
Multi-channel Cursor, Display Expand, and
Full Scale Adjustments . . . . . . . . . . . . . . . . . . . . . . . . . . . . . . . . . . . 172
Set Up Cross Channel Phase Measurement Definitions in the
Emonitor Software. . . . . . . . . . . . . . . . . . . . . . . . . . . . . . . . . . . . . . . 172
Set Up an Offroute Cross Channel Phase Measurement . . . . . . . . 174
Collect a Cross Channel Phase Measurement . . . . . . . . . . . . . . . . . . 176
Review Cross Channel Phase Data . . . . . . . . . . . . . . . . . . . . . . . . . . . . 178
Two-channel Measurements . . . . . . . . . . . . . . . . . . . . . . . . . . . . . . . . . . . . . 180
Set Up Two-channel Measurement Definitions in
the Emonitor Software . . . . . . . . . . . . . . . . . . . . . . . . . . . . . . . . . . . 180
Collect an Offroute Two-channel Measurement . . . . . . . . . . . . . . . 181
Magnitude and Phase Offroute Measurement . . . . . . . . . . . . . . . . . . . . . 184
Installing Optional Extension
Modules
Bump Test Application
Balancing Application
Chapter 6
Install Optional Extension Modules . . . . . . . . . . . . . . . . . . . . . . . . . . . . . . 187
Uninstall an Extension Module. . . . . . . . . . . . . . . . . . . . . . . . . . . . . . . . . . . 189
Manage Extension Modules . . . . . . . . . . . . . . . . . . . . . . . . . . . . . . . . . . . . . . 191
Chapter 7
Overview of the Bump Test Application . . . . . . . . . . . . . . . . . . . . . . . . . . 193
Setting Up and Collecting Bump Test Measurements . . . . . . . . . . . . . . 194
Setting Up Bump Test Measurements . . . . . . . . . . . . . . . . . . . . . . . . . 194
Collecting Bump Test Measurements . . . . . . . . . . . . . . . . . . . . . . . . . 197
Saving a Bump Test Setup and Measurement . . . . . . . . . . . . . . . . . . 198
Recalling a Setup . . . . . . . . . . . . . . . . . . . . . . . . . . . . . . . . . . . . . . . . . . . . . . . . 199
Reviewing Bump Test Measurements . . . . . . . . . . . . . . . . . . . . . . . . . . . . . 200
Backing Up and Deleting Bump Test Files . . . . . . . . . . . . . . . . . . . . . . . . 202
Backing Up Bump Test Files . . . . . . . . . . . . . . . . . . . . . . . . . . . . . . . . . 202
Deleting a Bump Test Measurement and Setup . . . . . . . . . . . . . . . . 204
Chapter 8
Overview of Balancing Measurements. . . . . . . . . . . . . . . . . . . . . . . . . . . . . 207
Setting Up the Balancing Parameters. . . . . . . . . . . . . . . . . . . . . . . . . . . . . . 208
Balance Setup Screen . . . . . . . . . . . . . . . . . . . . . . . . . . . . . . . . . . . . . . . . 208
8 Rockwell Automation Publication GMSI10-UM002D-EN-E - August 2012
Page 9

Table of Contents
Advanced Setup Screen . . . . . . . . . . . . . . . . . . . . . . . . . . . . . . . . . . . . . . 211
One Plane Balancing . . . . . . . . . . . . . . . . . . . . . . . . . . . . . . . . . . . . . . . . . . . . 212
Taking the Initial Vibration Measurement. . . . . . . . . . . . . . . . . . . . . 213
Adding the Trial Weight and Taking a Measurement. . . . . . . . . . . 214
Adding the Correction Weight and Taking a
Residual Measurement. . . . . . . . . . . . . . . . . . . . . . . . . . . . . . . . . . . . . 216
Two Plane Balancing . . . . . . . . . . . . . . . . . . . . . . . . . . . . . . . . . . . . . . . . . . . . 220
Taking the Initial Vibration Measurement. . . . . . . . . . . . . . . . . . . . . 220
Adding the Trial Weight and Taking a Measurement in Plane 1 . 222
Adding the Trial Weight and Taking a Measurement in Plane 2 . 225
Adding the Correction Weights and
Taking a Residual Measurement . . . . . . . . . . . . . . . . . . . . . . . . . . . . 227
Moving Around in a Balance Run. . . . . . . . . . . . . . . . . . . . . . . . . . . . . . . . . 231
Reviewing Data . . . . . . . . . . . . . . . . . . . . . . . . . . . . . . . . . . . . . . . . . . . . . . . . . 231
Vibration Summary Table. . . . . . . . . . . . . . . . . . . . . . . . . . . . . . . . . . . . 232
Weights Summary Table . . . . . . . . . . . . . . . . . . . . . . . . . . . . . . . . . . . . . 232
Combining Weights Screen . . . . . . . . . . . . . . . . . . . . . . . . . . . . . . . . . . 233
Capturing and Printing the Summary Tables . . . . . . . . . . . . . . . . . . 234
Saving and Reloading a Balance. . . . . . . . . . . . . . . . . . . . . . . . . . . . . . . . . . . 234
Saving a Balance . . . . . . . . . . . . . . . . . . . . . . . . . . . . . . . . . . . . . . . . . . . . . 234
Reloading a Balance. . . . . . . . . . . . . . . . . . . . . . . . . . . . . . . . . . . . . . . . . . 235
Time Recorder Application
Run Up/Coast Down Application
Chapter 9
Overview of the Time Recorder Application. . . . . . . . . . . . . . . . . . . . . . . 237
Setting Up and Collecting Time Recorder Measurements . . . . . . . . . . 238
Setting Up Time Recorder Measurements . . . . . . . . . . . . . . . . . . . . . 238
Recorder Status Indicators . . . . . . . . . . . . . . . . . . . . . . . . . . . . . . . . . . . 240
Previewing the Measurement . . . . . . . . . . . . . . . . . . . . . . . . . . . . . . . . . 241
Recording the Measurement. . . . . . . . . . . . . . . . . . . . . . . . . . . . . . . . . . 242
Saving a Time Recorder Setup and Measurement. . . . . . . . . . . . . . . 242
Recalling a Setup . . . . . . . . . . . . . . . . . . . . . . . . . . . . . . . . . . . . . . . . . . . . . . . . 244
Reviewing Time Recorder Measurements . . . . . . . . . . . . . . . . . . . . . . . . . 246
Capturing and Printing the Review Data Screen. . . . . . . . . . . . . . . . 247
Backing Up and Deleting Time Recorder Files. . . . . . . . . . . . . . . . . . . . . 248
Backing Up Time Recorder Files. . . . . . . . . . . . . . . . . . . . . . . . . . . . . . 248
Copying Time Recorder Files to the Host Computer . . . . . . . . . . . 249
Deleting a Time Recorder Measurement and Setup. . . . . . . . . . . . . 250
Chapter 10
Overview of the Run Up/Coast Down Application . . . . . . . . . . . . . . . . 253
Setting Up Run Up/Coast Down Measurements . . . . . . . . . . . . . . . . . . 255
Collecting Run Up/Coast Down Measurements. . . . . . . . . . . . . . . . . . . 257
Run Up/Coast Down Status Indicators . . . . . . . . . . . . . . . . . . . . . . . 257
Collecting and Analyzing Run Up/Coast Down . . . . . . . . . . . . . . . 257
Displaying Measurements Using a Bode Plot . . . . . . . . . . . . . . . . . . . . . . 260
Setting Up the Bode Plot. . . . . . . . . . . . . . . . . . . . . . . . . . . . . . . . . . . . . 260
Rockwell Automation Publication GMSI10-UM002D-EN-E - August 2012 9
Page 10

Table of Contents
Displaying the Bode Plot . . . . . . . . . . . . . . . . . . . . . . . . . . . . . . . . . . . . . 262
Displaying Measurements Using a Nyquist Plot. . . . . . . . . . . . . . . . . . . . 263
Setting Up the Nyquist Plot . . . . . . . . . . . . . . . . . . . . . . . . . . . . . . . . . . 263
Displaying the Nyquist Plot . . . . . . . . . . . . . . . . . . . . . . . . . . . . . . . . . . 265
Displaying Measurements in Table Format . . . . . . . . . . . . . . . . . . . . . . . . 266
Setting Up the Table. . . . . . . . . . . . . . . . . . . . . . . . . . . . . . . . . . . . . . . . . 266
Displaying the Table. . . . . . . . . . . . . . . . . . . . . . . . . . . . . . . . . . . . . . . . . 268
Displaying Measurements Using a Waterfall. . . . . . . . . . . . . . . . . . . . . . . 269
Setting Up the Waterfall . . . . . . . . . . . . . . . . . . . . . . . . . . . . . . . . . . . . . 269
Displaying the Waterfall Plot . . . . . . . . . . . . . . . . . . . . . . . . . . . . . . . . . 271
Displaying Measurements Using a Spectrogram. . . . . . . . . . . . . . . . . . . . 274
Setting Up the Spectrogram Plot. . . . . . . . . . . . . . . . . . . . . . . . . . . . . . 274
Displaying the Spectrogram Plot . . . . . . . . . . . . . . . . . . . . . . . . . . . . . . 276
Saving Run Up/Coast Down Measurements. . . . . . . . . . . . . . . . . . . . . . . 277
Recalling a Setup . . . . . . . . . . . . . . . . . . . . . . . . . . . . . . . . . . . . . . . . . . . . . . . . 279
Reviewing Run Up/Coast Down Measurements . . . . . . . . . . . . . . . . . . . 280
Deleting Run Up/Coast Down Files . . . . . . . . . . . . . . . . . . . . . . . . . . . . . . 282
Chapter 11
FRF Frequency Response Function
Extension Module
Newtons Law and Apparent Mass . . . . . . . . . . . . . . . . . . . . . . . . . . . . . . . . 286
Setting Up an FRF Measurement . . . . . . . . . . . . . . . . . . . . . . . . . . . . . . . . . 286
Test Hardware Setup . . . . . . . . . . . . . . . . . . . . . . . . . . . . . . . . . . . . . . . . 286
Avoid Bad Data . . . . . . . . . . . . . . . . . . . . . . . . . . . . . . . . . . . . . . . . . . . . . 287
FRF Module Setup . . . . . . . . . . . . . . . . . . . . . . . . . . . . . . . . . . . . . . . . . . . . . . 288
FRF Analysis Set-up Parameters . . . . . . . . . . . . . . . . . . . . . . . . . . . . . . 290
Collect FRF Data . . . . . . . . . . . . . . . . . . . . . . . . . . . . . . . . . . . . . . . . . . . . . . . 292
Field Calibration . . . . . . . . . . . . . . . . . . . . . . . . . . . . . . . . . . . . . . . . . . . . . . . . 295
Saving, Reviewing, and Deleting FRF Measurements . . . . . . . . . . . . . . . 297
Save an FRF Test Setup and Measurement. . . . . . . . . . . . . . . . . . . . . 297
Importing to ODS Analysis Software.. . . . . . . . . . . . . . . . . . . . . . . . . . . . . 298
Appendix A
Specifications Appendix B
Frequently Asked Questions and
Answers
Setting Up Measurement Definitions in Emonitor . . . . . . . . . . . . . . . . . 303
How do I set up measurement definitions?. . . . . . . . . . . . . . . . . . . . . 303
Why do unsupported selections appear in Emonitor? . . . . . . . . . . . 303
Why can’t I edit the measurement definitions units?. . . . . . . . . . . . 304
Loading Lists to the Enpac 2500. . . . . . . . . . . . . . . . . . . . . . . . . . . . . . . . . . 304
I think I lost some data. What happened?. . . . . . . . . . . . . . . . . . . . . . 304
Why won’t Emonitor load a list to the Enpac 2500? . . . . . . . . . . . . 305
Why does Emonitor rebuild the Quickload files? . . . . . . . . . . . . . . . 305
How do I load a list to the PCMCIA card? . . . . . . . . . . . . . . . . . . . . 305
How do I tell when loading or unloading is done? . . . . . . . . . . . . . . 305
Collecting Data with the Enpac 2500 . . . . . . . . . . . . . . . . . . . . . . . . . . . . . 306
Why does the Enpac 2500 seem to skip
measurements at a location? . . . . . . . . . . . . . . . . . . . . . . . . . . . . . . . . 306
10 Rockwell Automation Publication GMSI10-UM002D-EN-E - August 2012
Page 11

Accessories
Glossary
Table of Contents
Why wont the Enpac 2500 combine magnitude and
phase or manual entry measurements at a location? . . . . . . . . . 306
What does the USER (eus) units mean? . . . . . . . . . . . . . . . . . . . . . . . 307
Why are the alarms in the Enpac 2500 not what I selected?. . . . . . 307
Why aren't inspection codes available for a list? . . . . . . . . . . . . . . . . 307
How can I reduce the ranging time required during collection? . . 308
Unloading Data from the Enpac 2500 . . . . . . . . . . . . . . . . . . . . . . . . . . . . 308
How do I unload data from more than one list? . . . . . . . . . . . . . . . . 308
How do I clear data from lists after unloading? . . . . . . . . . . . . . . . . . 308
How do I print reports after unloading data?. . . . . . . . . . . . . . . . . . . 308
Analyzing Data in Emonitor . . . . . . . . . . . . . . . . . . . . . . . . . . . . . . . . . . . . . 309
Why does the magnitude reading not correspond to the
calculated overall value? . . . . . . . . . . . . . . . . . . . . . . . . . . . . . . . . . . 309
Appendix C
Upgrade Options. . . . . . . . . . . . . . . . . . . . . . . . . . . . . . . . . . . . . . . . . . . . 311
Cables and Sensors . . . . . . . . . . . . . . . . . . . . . . . . . . . . . . . . . . . . . . . . . . 312
Index
Rockwell Automation Publication GMSI10-UM002D-EN-E - August 2012 11
Page 12

Table of Contents
Notes:
12 Rockwell Automation Publication GMSI10-UM002D-EN-E - August 2012
Page 13

Preface
The content in this manual is based on the following firmware revision and
software version.
• Enpac® 2500 data collector, firmware revision 3.10
• Emonitor® software, version 3.4
Using the Manual
Upgrade Options
This manual covers the Enpac 2500 data collector module which is used for
predictive maintenance using noise and vibration analysis. It describes also how
to use the Emonitor software to load and unload lists.
When using the Enpac 2500 data collector, you can do the following:
• Create lists of measurement definitions.
• Load lists from Emonitor into the data collector.
• Use a 40 Khz fmax, Route and Offroute.
• Collect magnitude, process, spectrum, time, and phase data.
• View selected alarms.
• Select inspection codes to store with a measurement.
• Define and collect unscheduled measurements
• Unload the data from the data collector directly into the Emonitor
database.
• View the high resolution, up to 12,800 lines on the data collector.
These are the upgrade options for the Enpac 2500 data collector:
• 1441-PEN25-MOD-2CH 2 - Channel Upgrade Kit
Two Channel application allows for advanced use of orbits, cross channel
phase, and simultaneous data collection in route and off route collection.
• 1441-PEN25-MOD-BMP - Bump Test
A bump test (or hammer test) determines the natural frequencies of a
machine or a structure.
• 1441-PEN25-KIT-BAL - Balancing
Balancing application resolves single-plane, two-plane, and static-couple
balances with high precision.
• 1441-PEN25-MFRF - Frequency Response Function
The FRF test lets you determine the natural frequencies of a machine as
well as sophisticated information about the frequency response of the
structure being tested.
• 1441-PEN25-MOD-REC - Time Recorder
The Time Recorder test uses a the instrument as a data recorder for realtime data acquisition and analysis.
• 1441-PEN25-MOD-RUCD - Run Up Coast Down
The RUCD test records and analyzes data from intermittent events and
transient vibration signals from non-steady state machines.
Rockwell Automation Publication GMSI10-UM002D-EN-E - August 2012 13
Page 14

Preface
TIP
Enpac 2500 Data Collector and the Emonitor Software
Software Compatibilities
The terminology in the data collector and the software differ in several ways.
This table illustrates the differences.
Table 1 - Terminology Differences
Enpac 2500 Terminology Emonitor Terminology
Offroute
Measurements that are taken but are not downloaded on
to the instrument from Emonitor.
These measurements can be upload to Emonitor.
Route
The Enpac 2500 data collector uses the term route to refer
to a list loaded in the data collector.
Unscheduled measurements
Measurements that are not defined in the list of
measurements downloaded by Emonitor.
These measurements are unscheduled.
List
The Emonitor software uses the term `list for an ordered
set of measurement definitions.
The Enpac 2500 data collector requires the following software versions.
USB and Communication Software
These are the supported communication software versions.
• USB communication with Microsoft Windows 2000 and Windows XP is
supported using Microsoft ActiveSync software version 4.5 or greater
• USB communication with Microsoft Windows 7 is supported using
Microsoft Mobile Device Center
• Microsoft Windows 7 32 bit and/or Microsoft Windows 7 64 bit are
supported
Document Conventions
Operating System
• Microsoft Windows 2000 (SP4) with ActiveSync software
• Microsoft Windows XP (SP3) with ActiveSync software
• Microsoft Windows 7 with Mobile Device Center software
Microsoft Windows Mobile Device Center replaces ActiveSync for Windows
Vista, and Microsoft Windows 7. Windows Mobile Device Center offers device
management and data synchronization between a Windows Mobile-based
device and a computer. For Windows XP or earlier operating systems, you must
use Microsoft ActiveSync.
These are document conventions used in this manual.
• The Enpac 2500 data collector is referred to as a data collector and an
instrument in this manual.
• The different versions of the Emonitor software are Enterprise, Factory,
and Workstation. These are all are referred to as the Emonitor software in
this manual.
14 Rockwell Automation Publication GMSI10-UM002D-EN-E - August 2012
Page 15
Preface
Using Online Help
The Emonitor software and the Enpac 2500 data collector each include online
help:
• Emonitor Online Help
The Emonitor online help is available from the Emonitor Help menu or by
pressing F1.
• Enpac 2500 Online Help
The Enpac 2500 data collector online help is available from any screen
where the Help function appears. Press F1 (Help) to access the online help.
On some screens that do not display the Help function, pressing Shift(0)
provides access also to the Help.
Help Screen
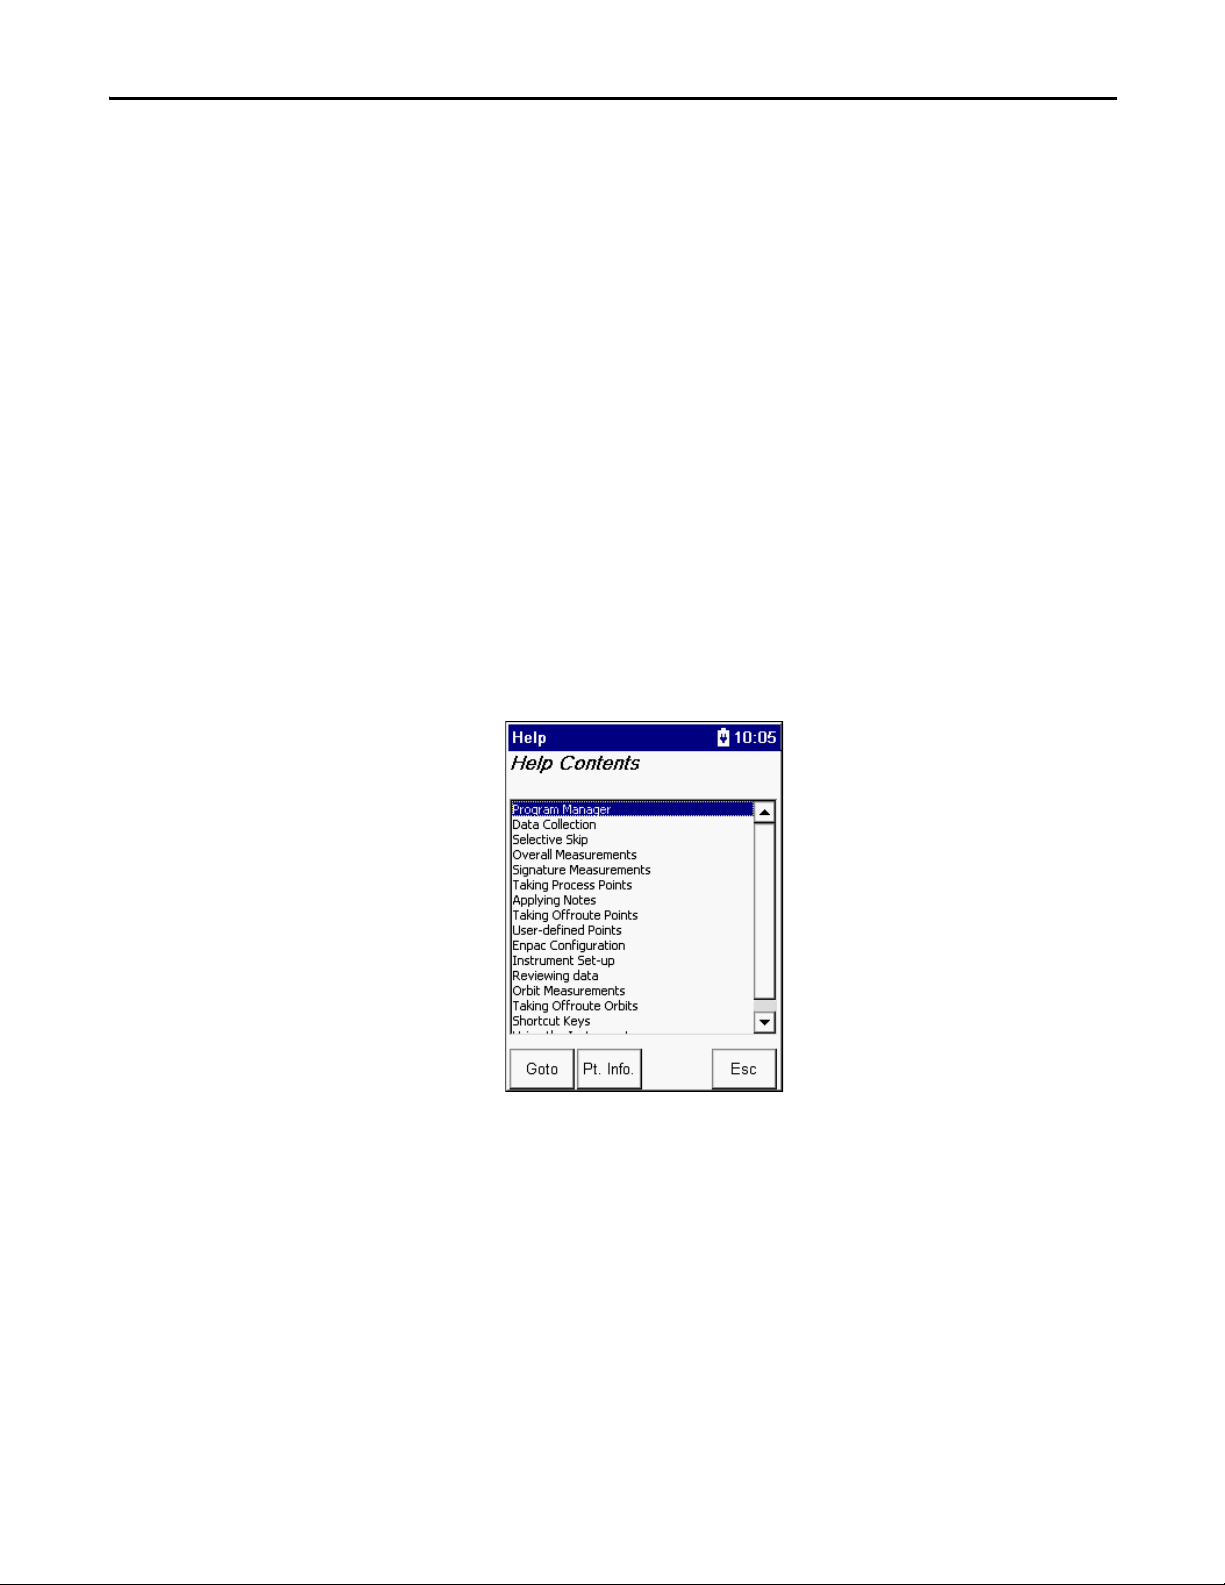
Press F1 (Help) to access online help from any screen where the Help function is
displayed on the screen.
1. Press F1 (Help) to access the online help.
The Help Contents screen appears.
2. Select the topic for which you want to view and press F1 (Goto).
3. When you are finished viewing the topic, press F1 (Contents) to return to
the Help Contents screen or press F4 (Esc) to exit the online help.
Rockwell Automation Publication GMSI10-UM002D-EN-E - August 2012 15
Page 16

Preface
Organization
To help you navigate through this manual, it is organized in chapters based on
these tasks and topics.
Section Description
Preface Contains an overview of the manual.
Chapter 1, The Enpac 2500 Describes the Enpac 2500 data collector and covers the basic operations
Chapter 2, Setting up Measurements Describes setting up measurement definitions in Emonitor for use with
Chapter 3, Loading and Unloading Describes loading lists and unloading data.
Chapter 4, Collecting and Reviewing Data Describes the tasks associated with collecting data including list data.
Chapter 5, Multi-channel Measurements Shows you how to set up and collect dual channel, cross channel phase,
Chapter 6, Balancing Application Describes methods used for performing one- or two-plane balancing by
Chapter 7, Time Recording Application Describes how to set up and collect time recording measurements.
Chapter 8, Bump Test Application Describes the tasks needed to set up and collec t bump test
Chapter 9, Run Up/Coast Down Application Describes recording and analyzing run up/coast down measurements.
Chapter 10, FRF Frequency Response
Function Extension Module
Appendix A, Specifications Lists the technical specifications for the Enpac 2500 data collector.
Appendix B, Frequently Asked Questions Contains answers to frequently asked questions.
Appendix C, Accessories Provides a current list of accessories available for the Enpac 2500 data
Glossary Definitions of terms.
and configuration of the data collector.
the data collector. It also explains lists, inspection codes, and alarms.
and orbit measurements.
using the data collector coupled with a speed measuring device.
measurements.
Describes how to determine the natural frequencies where resonances
occur, as well as capturing data about the frequency response of the
structure being tested.
collector. For definitions of terms used in this Guide.
Document Conventions
There are several document conventions used in this manual, including the
following:
• The Enpac 2500 is referred to as Enpac, instrument, unit, or data collector
throughout this manual.
• The different versions of Emonitor (Enshare®, Odyssey Deluxe, and
Odyssey Basic) are referred to as Emonitor throughout this manual.
• Emonitor uses the term ‘list’ for an ordered set of measurement
definitions. The Enpac uses the term ‘route’ to refer to a list loaded in the
Enpac. This manual uses the two terms interchangeably.
16 Rockwell Automation Publication GMSI10-UM002D-EN-E - August 2012
Page 17

Preface
Additional Resources
These documents contain additional information concerning related products
from Rockwell Automation.
Resource Description
Emonitor Users Guide, publication
EMONTR-UM001
Enpac 2500 Data Collector Release Notes, publication
GMSI10-RN004B
Industrial Automation Wiring and Grounding Guidelines,
publication 1770-4.1
Product Certifications website, http://www.ab.com
Describes data management for predictive
maintenance services.
Provides important information on the latest updates,
for example, firmware, certifications, warnings, and
hardware changes for the data collector.
Provides general guidelines for installing a Rockwell
Automation industrial system.
Provides declarations of conformity, certificates, and
other certification details.
You can view or download publications at
http://www.rockwellautomation.com/literature
. To order paper copies of
technical documentation, contact your local Allen-Bradley® distributor or
Rockwell Automation sales representative.
Rockwell Automation Publication GMSI10-UM002D-EN-E - August 2012 17
Page 18

Preface
Notes:
18 Rockwell Automation Publication GMSI10-UM002D-EN-E - August 2012
Page 19

Chapter 1
The Enpac 2500 Data Collector
This chapter describes the Enpac 2500 in detail and covers the basic operations
and configuration of the data collector.
Top ic Pa ge
Safety Information 20
Parts of the Enpac 21
Battery Pack 26
Powering on t he Enpa c 29
Enpac 2500 Screens 29
Data Collection Screen 33
Setting Up the Enpac 2500 Data Collector 40
Using Memory Cards 47
Operating System Update Procedures 50
Adding Applications to the Enpac 2500 Data Collector 59
The combination of the Enpac 2500 data collector with Emonitor software
provides a complete package for predictive maintenance by using noise and
vibration analysis. The Enpac can also be used for a variety of other applications,
such as Balancing or Bearing Analysis.
A predictive maintenance program helps you decide when equipment needs to be
serviced or replaced. Part of a complete predictive maintenance program includes
vibration monitoring. Emonitor and the Enpac 2500 allow you to perform
vibration analysis by collecting data samples.
With the combination of predictive maintenance software and the Enpac 2500,
you can:
• Create lists of measurement definitions for data collection.
• Load lists from Emonitor into the Enpac 2500.
• Collect magnitude, process, spectrum, time, and phase data.
• View selected alarms with the data. The Enpac 2500 alerts you when a
measurement exceeds an alarm.
• Select inspection codes to store with a measurement, documenting the
condition of the machine.
• Unload the data from the Enpac 2500 directly into the Emonitor database,
along with any inspection codes and unscheduled measurements.
Rockwell Automation Publication GMSI10-UM002D-EN-E - August 2012 19
Page 20
Chapter 1 The Enpac 2500 Data Collector
IMPORTANT
In addition, Emonitor can optimize your data collection by combining
measurement definitions at a location. For example, Emonitor could combine
two magnitude and one spectrum measurement definitions so that the list
appears to contain only a single measurement. This allows you to collect all three
measurements at one time, minimizing the time you spend collecting data.
The Enpac 2500 is a two-channel, real-time Fast Fourier Transformer (FFT)
analyzer and data collector for predictive maintenance and machinery vibration
diagnostics. It is capable of measuring, processing, displaying and storing a wide
range of analysis functions. It can operate as a stand-alone instrument or you can
download your measurements to your software application for program analysis.
Safety Information
Be aware of these safety precautions.
Avoid Water
The Enpac 2500 data collector is splash and dust resistant. However, avoid
direct contact with water, wet surfaces, or condensing humidity. Keep this
instrument away from wet locations, for example, laundry, wet basements,
swimming pools.
If the data collector subject to these conditions, adverse operation may result.
Before you use it, let the instrument dry thoroughly before operating.
ATT EN TI ON : To avoid damage or injury, place the Enpac 2500 data collector on
a solid stable surface when not in use and do not place any heavy objects on it.
Use only the accessories recommended by Rockwell Automation. Keep liquids
and foreign objects away from the instrument, and never operate it if any liquid
or foreign object has entered it.
Optical Ports
ATTENTION: When the laser on the data collector is active, viewing the laser
beam can expose your eyes beyond the maximum permissible exposure
recommendations and cause harm.
Laser Radiation Ports
ATTENTION: Class 1 laser product. Laser radiation is present when the system is
open and interlocks bypassed. Only trained and qualified personnel should be
allowed to install, replace, or service the instrument.
20 Rockwell Automation Publication GMSI10-UM002D-EN-E - August 2012
Page 21
The Enpac 2500 Data Collector Chapter 1
READ/OK Key
Arrow Keys
ON/OFF
Numeric Keys
+/-
Decimal
0 or Shift
READ/OK Key
Funct ion Keys
(F1 to F4)
Parts of the Enpac
This section describes the basic components of the Enpac 2500 including key
definitions, hardware connections and status indicators. If you are already
familiar with the components of the data collector, you may want to skip this
section.
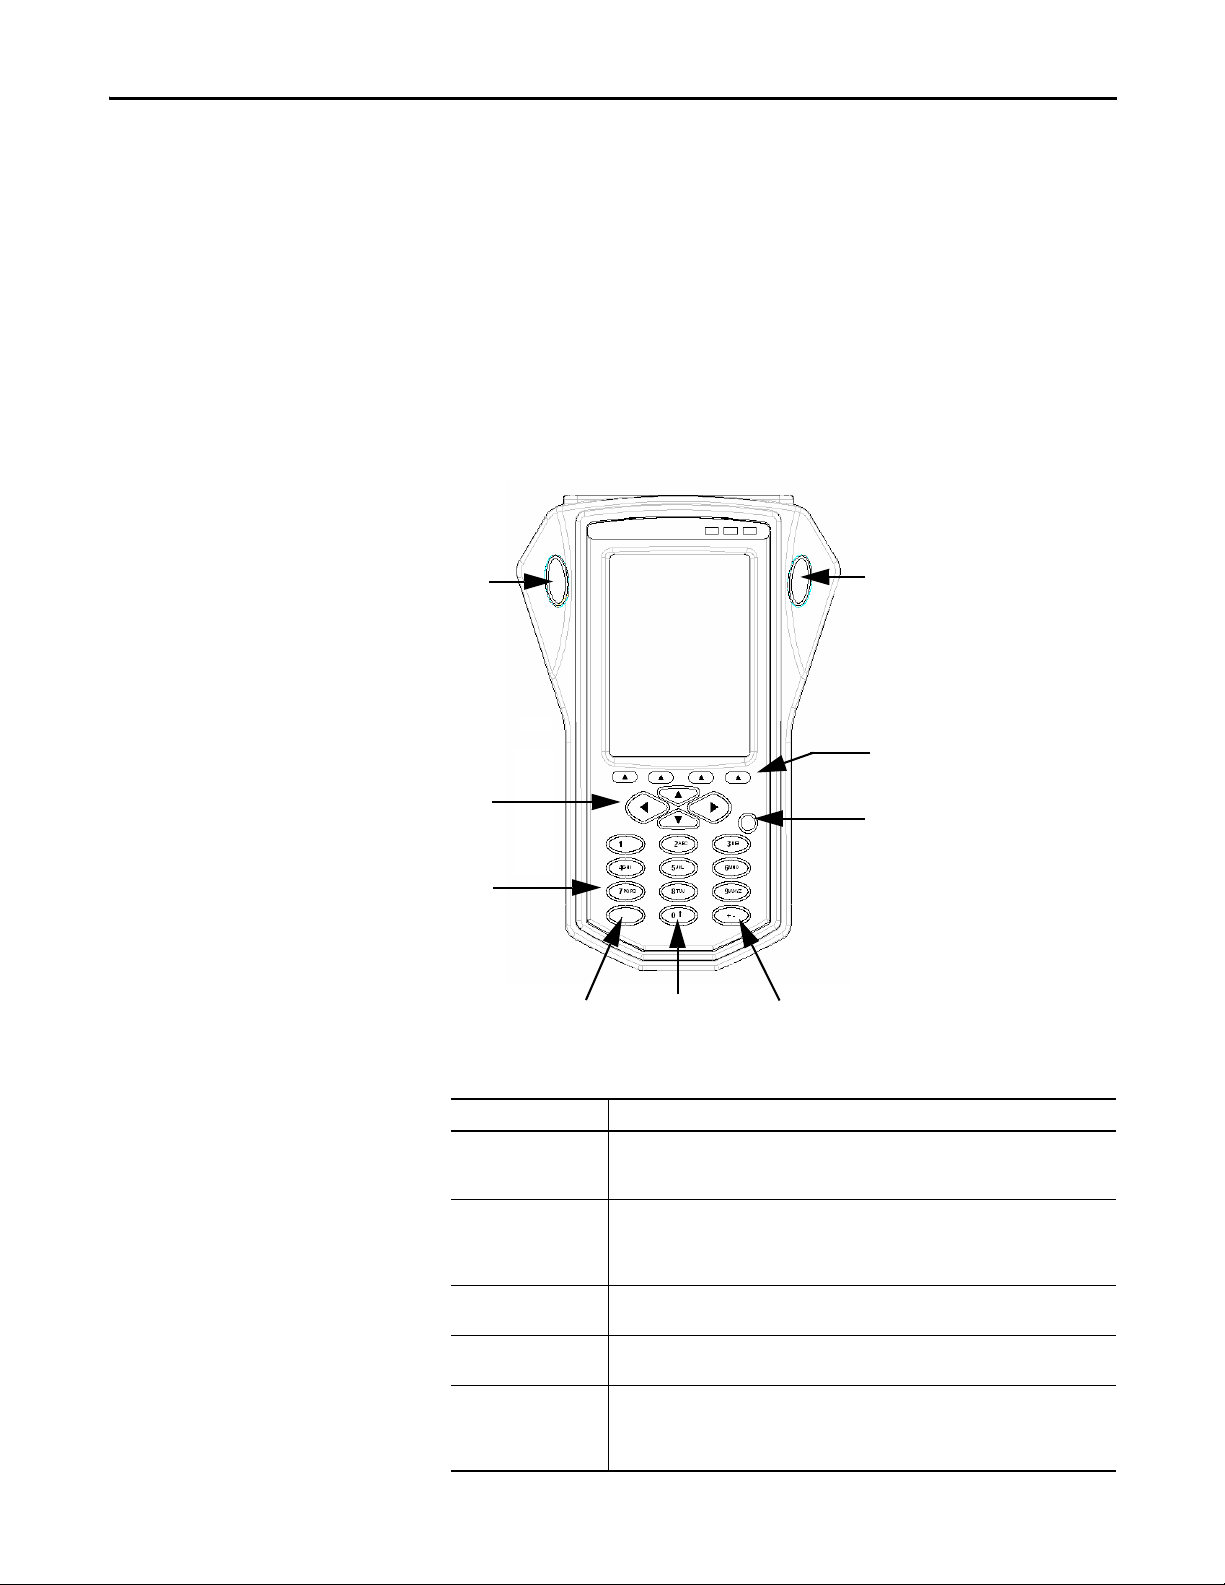
Enpac 2500 Diagram and Key Definitions
This is a diagram of the Enpac 2500 data collector showing the keys used for
operation.
Figure 1 - Diagram of the Enpac 2500
Table 2 - Key Definitions
Keys Definition
Read/OK The READ/OK key starts collecting data for the current point or accepts the current
Function Keys Below the display are four function keys referred throughout this manual as F1, F2, F3,
Up Arrow • Moves to the previous field or menu selection.
Down Arrow • Moves to the next field or menu selection.
Left Arrow • Displays the previous screen of information if there is more than one screen (for
Rockwell Automation Publication GMSI10-UM002D-EN-E - August 2012 21
measurement. There are two keys so you can use the data collector with either your left or
right hand.
and F4. The function keys change depending on the current state of the data collector. The
data collector displays the current function of the keys in the display above the key. When
no text appears above a function key, the key is inactive in the current window.
• Decreases the Y-axis scaling in a signature plot.
• Increases the Y-axis scaling in a signature plot.
example, selecting a point in the Data Collection screen).
• Closes the menu selection on the Setup and Instrument Configuration screens.
• Moves the signature cursor to the left.
Page 22

Chapter 1 The Enpac 2500 Data Collector
Table 2 - Key Definitions
Keys Definition
Right Arrow • Displays the next screen of information if there is more than one screen (for example,
selecting a point in the Data Collection screen).
• Opens the menu selection on the Setup and Instrument Configuration screens.
• Moves the signature cursor to the right.
ON/OFF The ON/OFF key turns the data collector on and off. To turn the data collector off, press and
hold the ON/OFF key for one second.
Numeric The numeric keys allow you to enter numeric values or move to the appropriate menu
selection on the Main Menu screen.
Decimal The Decimal (.) key allows you check the status of the battery, or enter a decimal point in a
numeric field.
Refer to Checking Battery Life on page 27 for more information.
+/- The +/- key allows you to expand or compress a signature plot on the screen.
0 The 0 key acts as a `Shift‘ key that has multiple uses depending on the current operation.
• In a Setup screen numeric input field, the key acts as a zero.
• In Setup screens, the key moves the selection to the first parameter when you are not
in an input field.
• In all other screens, pressing and holding the key displays alternate functions for the
function keys.
22 Rockwell Automation Publication GMSI10-UM002D-EN-E - August 2012
Page 23
The Enpac 2500 Data Collector Chapter 1
IrDA Window, is not
supported.
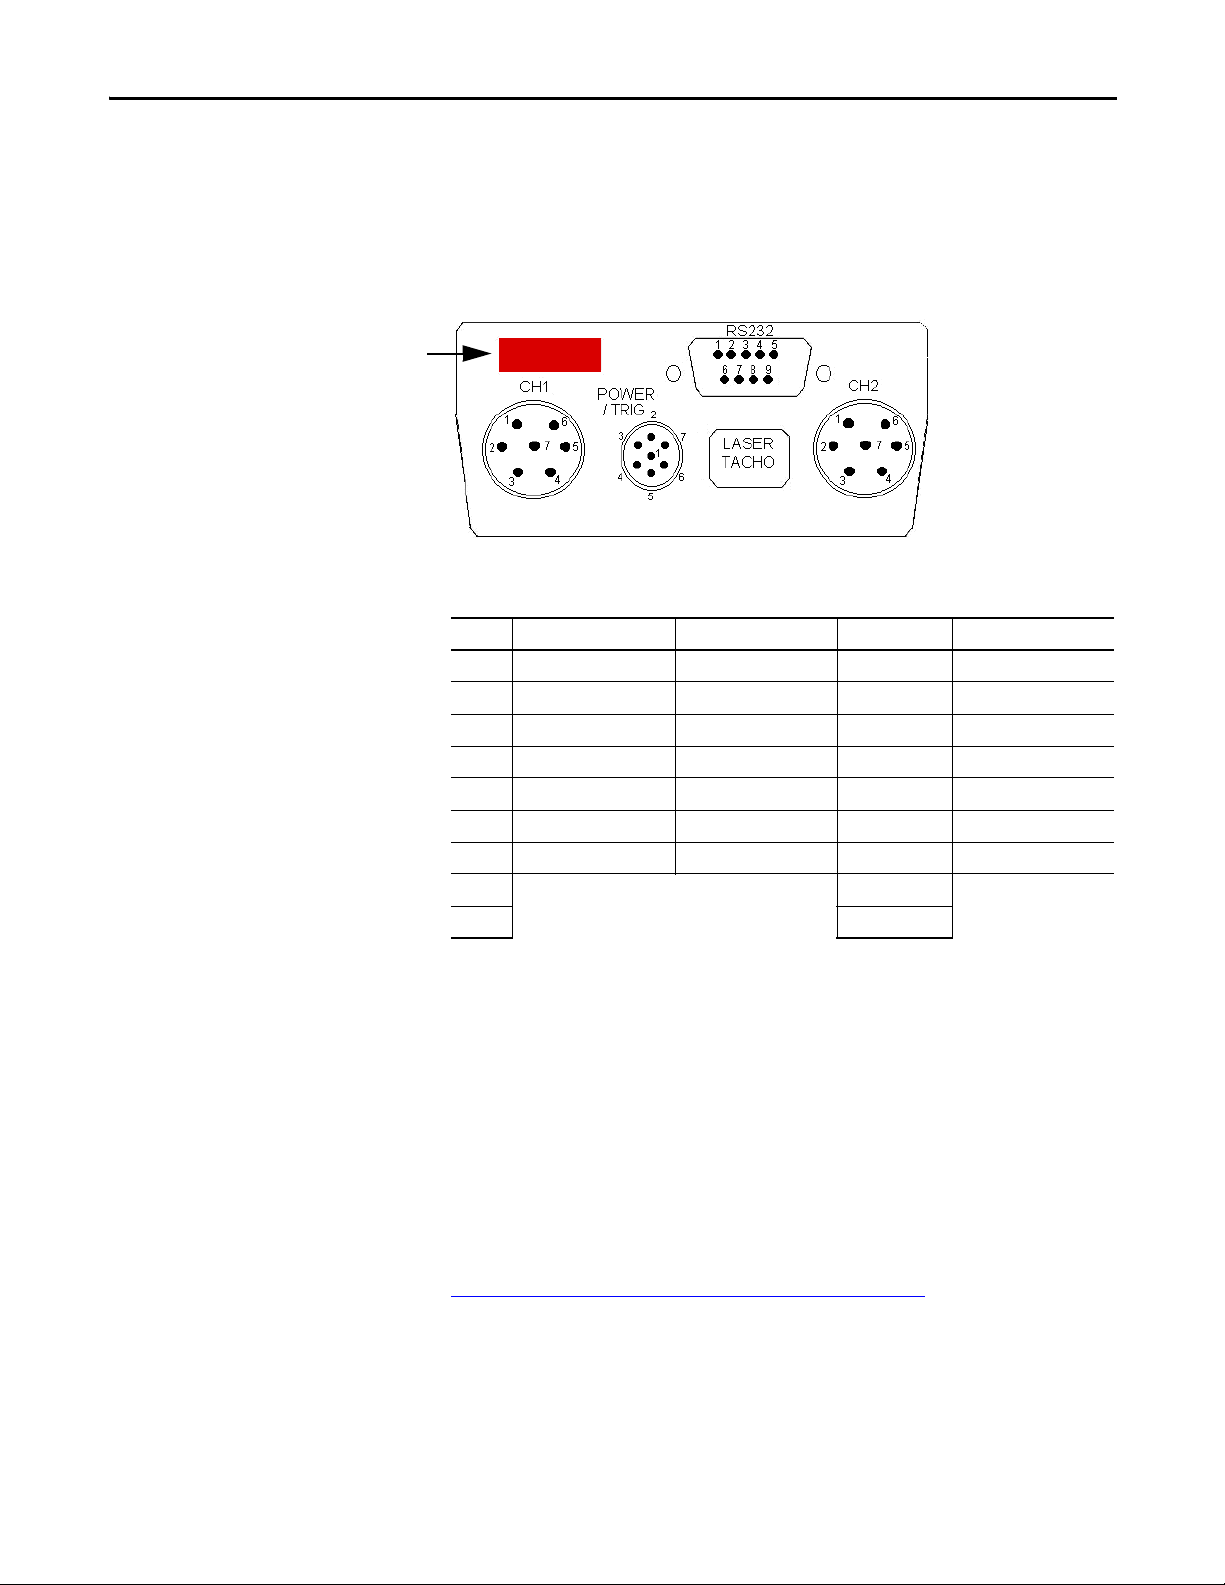
External Connections
The external hardware connections for communications and data collection are
located on the top panel of the Enpac 2500, as illustrated in this figure.
Figure 2 - External Hardware Connections
Table 3 - Pin Assignments
Pin No. CH 1 CH 2 RS-232 POWER/TRIG
1 N/C N/C N/C USBV
2 CHANNEL X CHANNEL Y TxD-OUT USB+
3 CHANNEL Z N/C RxD-IN USB4 STO RE/FIRE STO RE/FIRE DT R-OUT DIGITAL GND
5 ANALOG GND ANALOG GND DIGITAL GND EXT-DC-IN
6 CHANNEL Y N/C N/C EXT-TRIG-IN
7 N/C N/C CTS-IN +5V-TACHO-OUT
8RTS-OUT
9+5V
CH1 / CH2 Inputs
Signal inputs are made through the LEMO connectors marked CH1 and CH2
on the top of the Enpac.
The maximum measurement range is ±40 V while the minimum full-scale range
voltage available is ±10 mV (peak). The inputs are protected against high voltage
transients, but sustained over-voltage input levels must be avoided. Voltage can be
DC or AC coupled, while the third option, Accel (ICP), is available for direct
connection of integrated circuit piezoelectric transducers. These settings are
specified in the Emonitor software.
Refer to
Rockwell Automation Publication GMSI10-UM002D-EN-E - August 2012 23
Setting Up Measurement Definitions on page 78.
Page 24
Chapter 1 The Enpac 2500 Data Collector
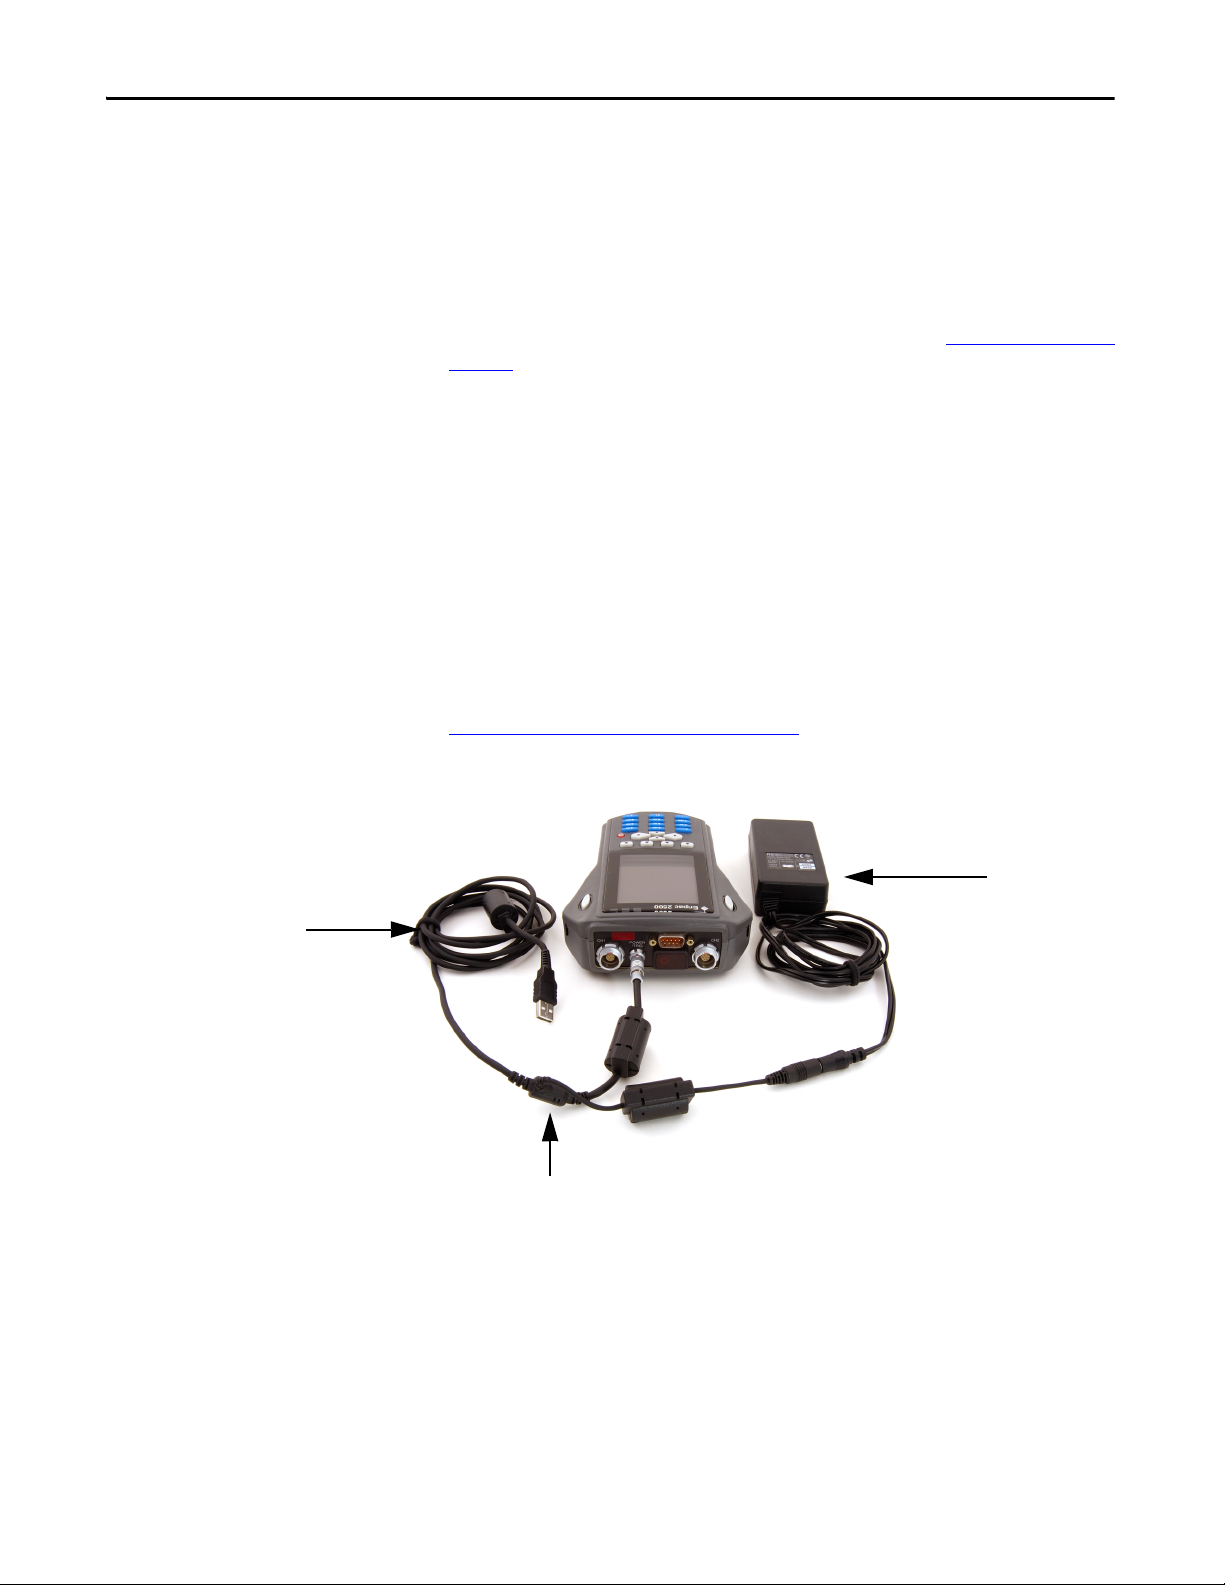
External power
adapter
USB cable
In line socket
POWER / TRIG / USB
This socket connects the Enpac to either an external trigger, power adapter or
USB interface. The external trigger enables synchronization of the data
acquisition process to external events, such as tachometer inputs for rotational
synchronization for balancing applications, or for order normalization of
frequency spectrum. The trigger pulse can also be used to collect running speeds
of machinery. The pin assignment for the trigger is shown in Pin Assignments
page 23.
The external power adapter can be used to charge the internal battery. This can
be connected to the Enpac by connecting the DC output of the mains power
supply to the in line socket of the USB Power Splitter cable (Cat. No. 1441PEN25-COMS-US). Then connect the Fischer plug into the Power socket on
top of the Enpac. Only the provided transformer may be used. Any other supply
may cause permanent damage to the data collector.
A USB interface is also provided via the POWER/TRIG connector and the USB
Power Splitter cable. The interface is configured as a Client to allow automatic
connection to a PC through Microsoft ActiveSync™ software. This interface
allows you to copy files and transfer data from the data collector to your PC.
on
Refer to
Figure 3 - USB Power Splitter Cable
Installing ActiveSync on page 103.
RS-232 Interface
Data can also be transferred between the Enpac and your computer over an
RS-232 interface. The RS-232 interface is provided via a 9-way (Plug) Dconnector on the top of the Enpac 2500 data collector. The cable catalog number
is 1441-PEN25-COMS-RS.
24 Rockwell Automation Publication GMSI10-UM002D-EN-E - August 2012
Page 25
The Enpac 2500 Data Collector Chapter 1
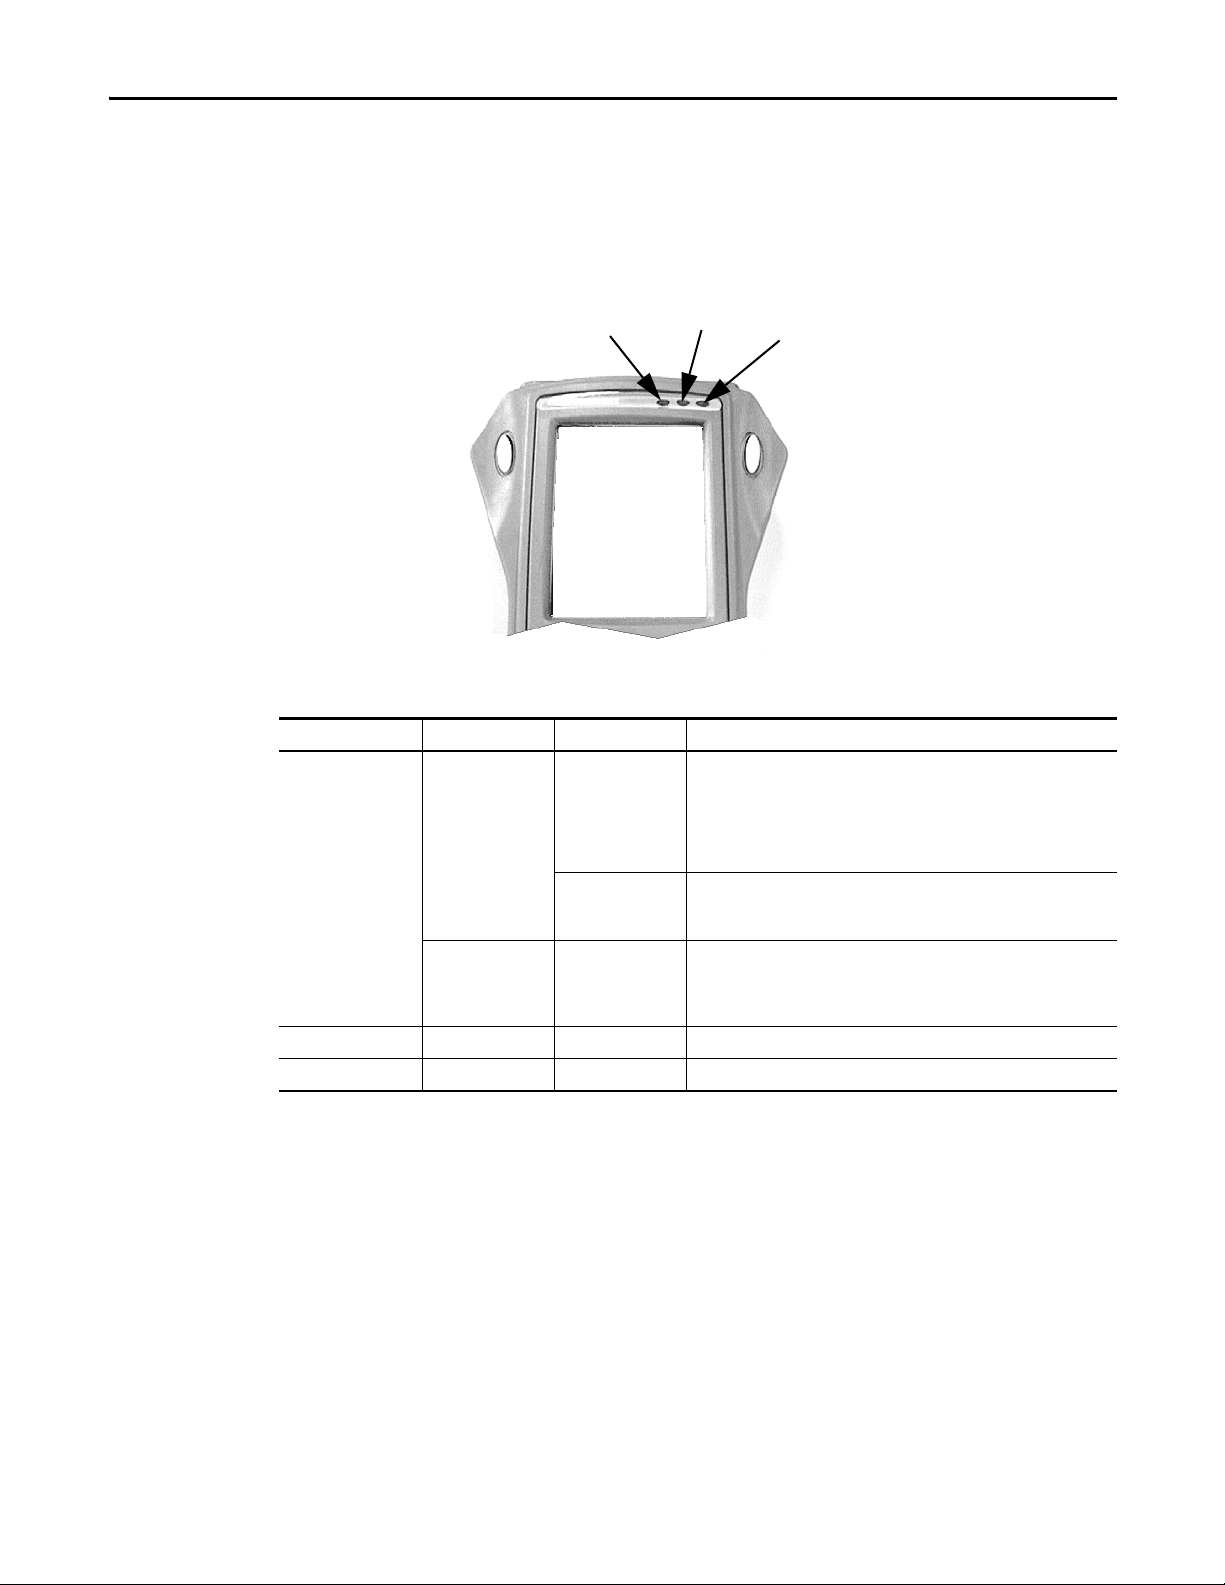
Red
Amber
Green
Status Indicators
The Enpac 2500 has three status indicators located in the upper-right side of the
Enpac nameplate.
Figure 4 - Status Indicators
Table 4 - Stat us In dicators
Status Indicators Operation State Definition
Red Charging Battery Flashing When first connected to the power adapter, the Enpac 2500 tests the
condition of the main battery. Within 30 seconds, the status indicators
should go to a solid state. If the status indicators continues to flash, the unit
has diagnosed a fault in the main battery and it will not charge the battery.
The problem may be that the cell temperature is too high or there is a fault
with the battery.
Solid The main battery is OK. The power adapter is connected to the Enpac 2500
and charging the main battery. The battery will be maintained by a trickle
charge from the power adapter for as long as it remains attached to the unit.
Data Collection Solid • An alarm condition has been set.
• Input signal is out of range.
• ICP Fail is active.
• The power adapter is connected to the Enpac 2500.
Amber Data Collection Solid Acquisition sub-system is settling.
Green Data Collection Solid Input signal is stable and data is ready to be stored.
Rockwell Automation Publication GMSI10-UM002D-EN-E - August 2012 25
Page 26
Chapter 1 The Enpac 2500 Data Collector
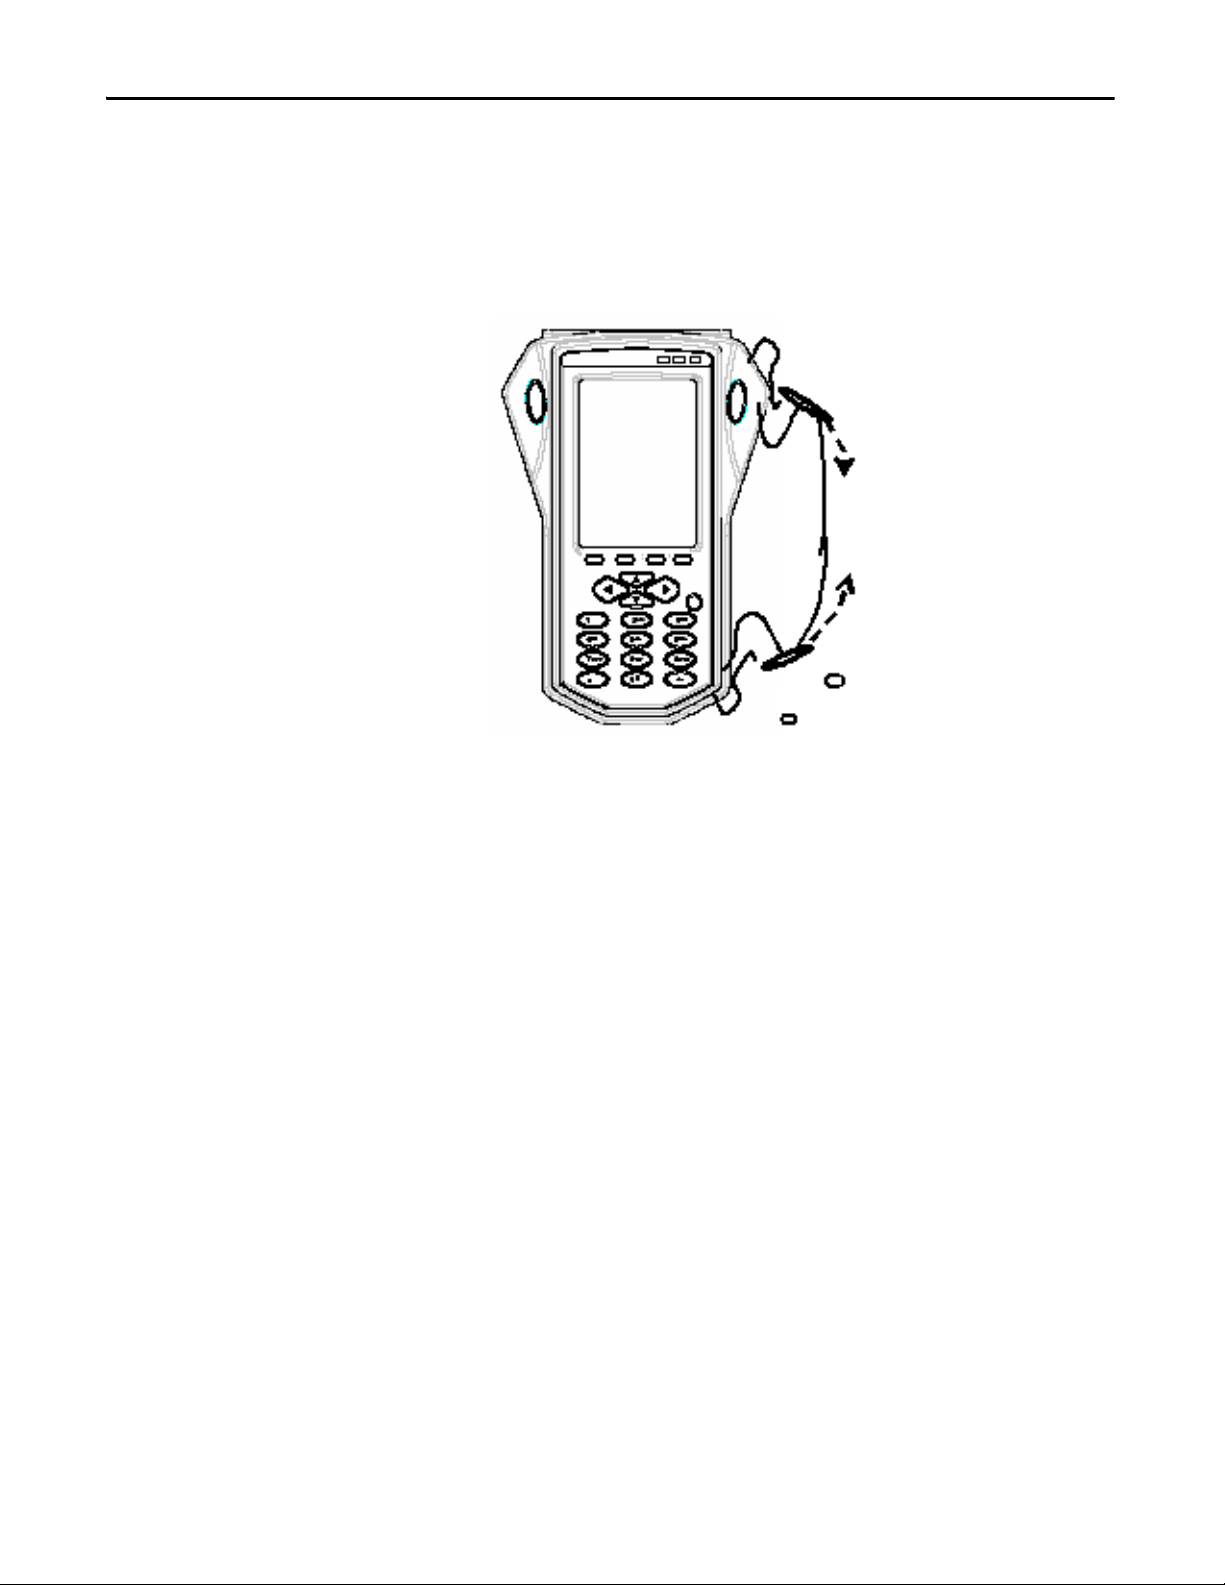
Strap Attachment
The strap can be fitted to either the left or right side of the Enpac 2500.
1. Feed the ends of the strap through the top and bottom corner pillars as
shown in the illustration below.
Battery Pack
2. Loop the ends of the strap through the buckles and adjust the tightness to
suit.
The Enpac 2500 data collector can be powered either from its own internal
Lithium Ion battery or by connecting the DC output of the mains power supply
to the in line socket of the USB Power Splitter cable. Then connect the Fischer
plug into the Power socket on top of the Enpac. The Enpac also has an internal
backup battery which maintains the system settings should the battery become
discharged or removed while the unit is not being powered by an external DC
supply.
This section describes how to check the battery level information and remove the
battery pack from the data collector. The Enpac battery pack is located on the
underside of the Enpac.
26 Rockwell Automation Publication GMSI10-UM002D-EN-E - August 2012
Page 27
The Enpac 2500 Data Collector Chapter 1
IMPORTANT
The condition of the internal
backup battery.
Main battery indicator bar
gauge.
Indicates the unit is operating under
internal battery. This changes to a plug
when under Mains power.
battery status indicator
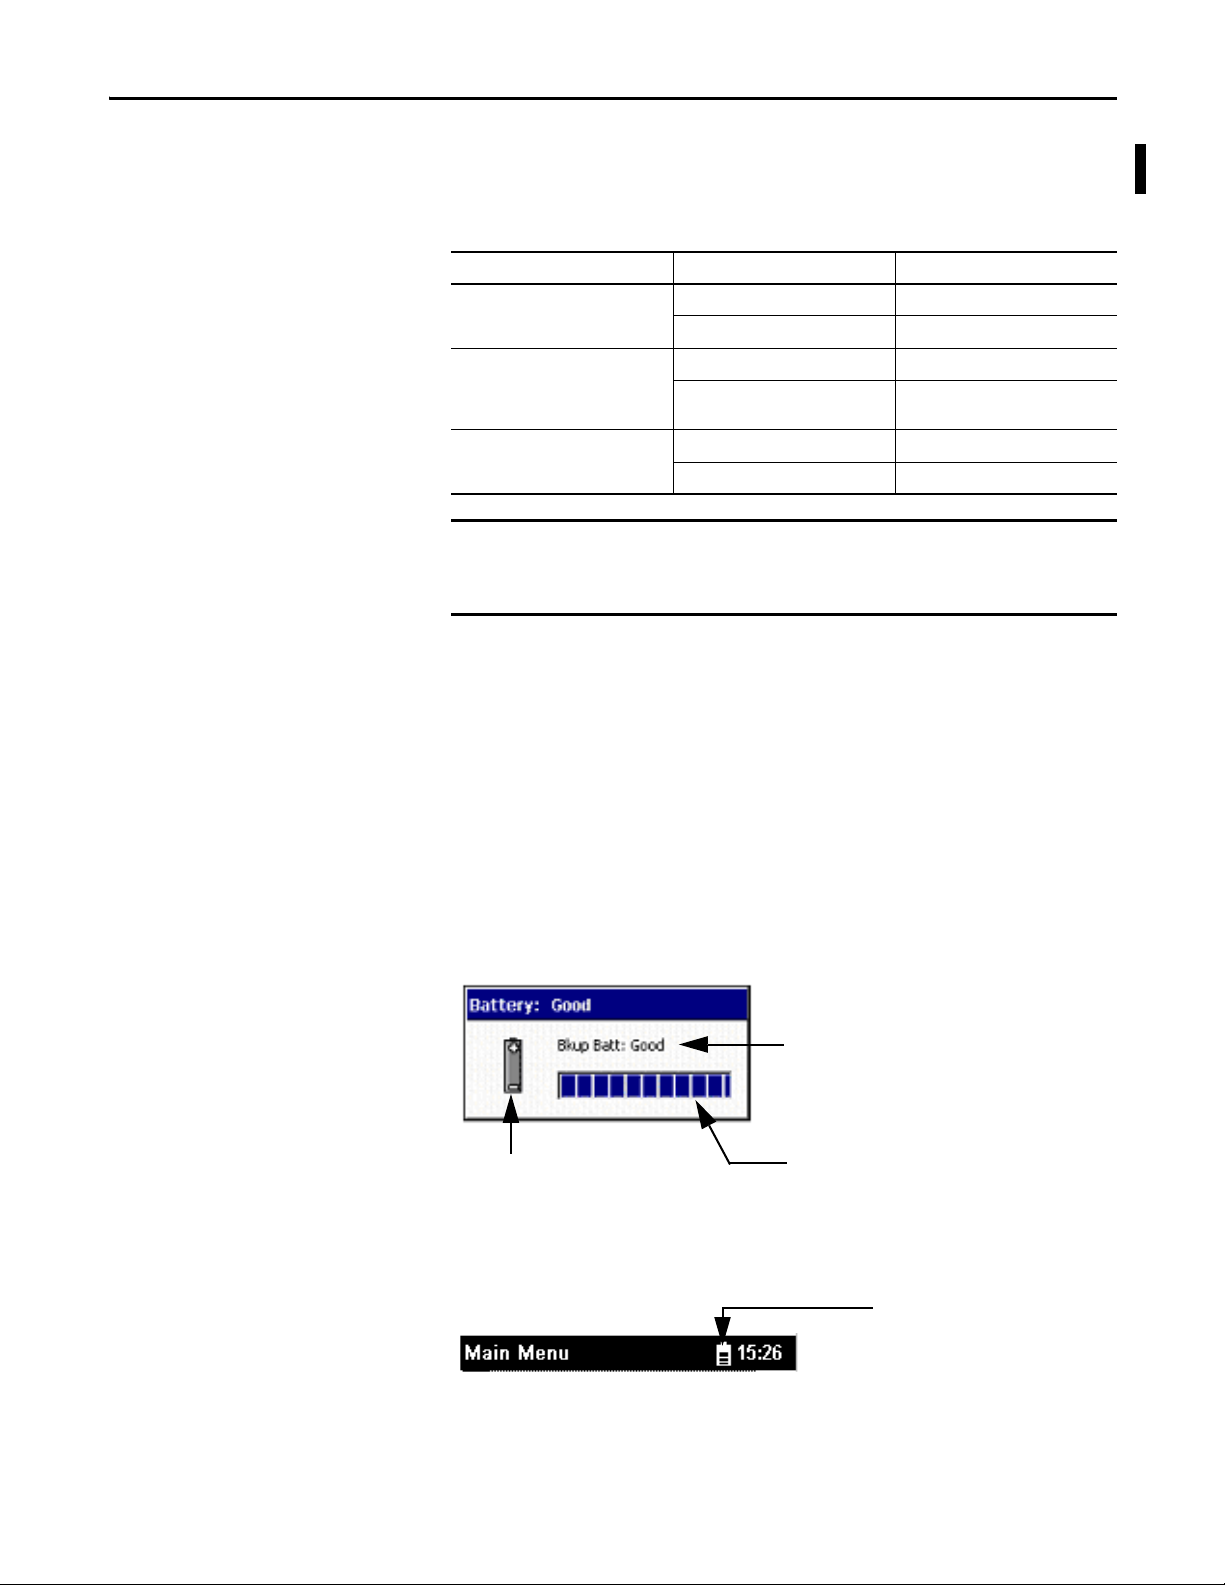
This table shows the typical battery life for the lithium ion battery, assuming the
battery is properly charged.
Table 5 - Battery capacity
Mode State Typical Battery Life
On (Windows CE) Performing typical data collection 8 hours minimum
Idle mode 14 hours minimum
Off Main battery & backup battery 14 days minimum
Main battery removed & instrument
running on backup battery
Main Battery Charge Time 100% 5 hours
70% 3 hours
2 days minimum
If the main battery is allowed to discharge completely, the instrument will
behave as if it has experienced a hardware reset. When you reapply power,
the current date, time and status information will be lost.
Checking Battery Life
You can check the status of the battery in the Enpac 2500 by pressing the Decimal
(.) key. (This function is available on most screens.)
The Battery Status dialog reports the status of the internal battery and the
condition of the units backup battery. The backup battery charges while the unit
is connected to the external DC power adapter or when the unit is powered on by
using the internal battery.
Figure 5 - Battery Status Dialog
The battery status is also displayed in the upper-right corner of the caption bar.
Rockwell Automation Publication GMSI10-UM002D-EN-E - August 2012 27
Page 28
Chapter 1 The Enpac 2500 Data Collector
IMPORTANT
TIP
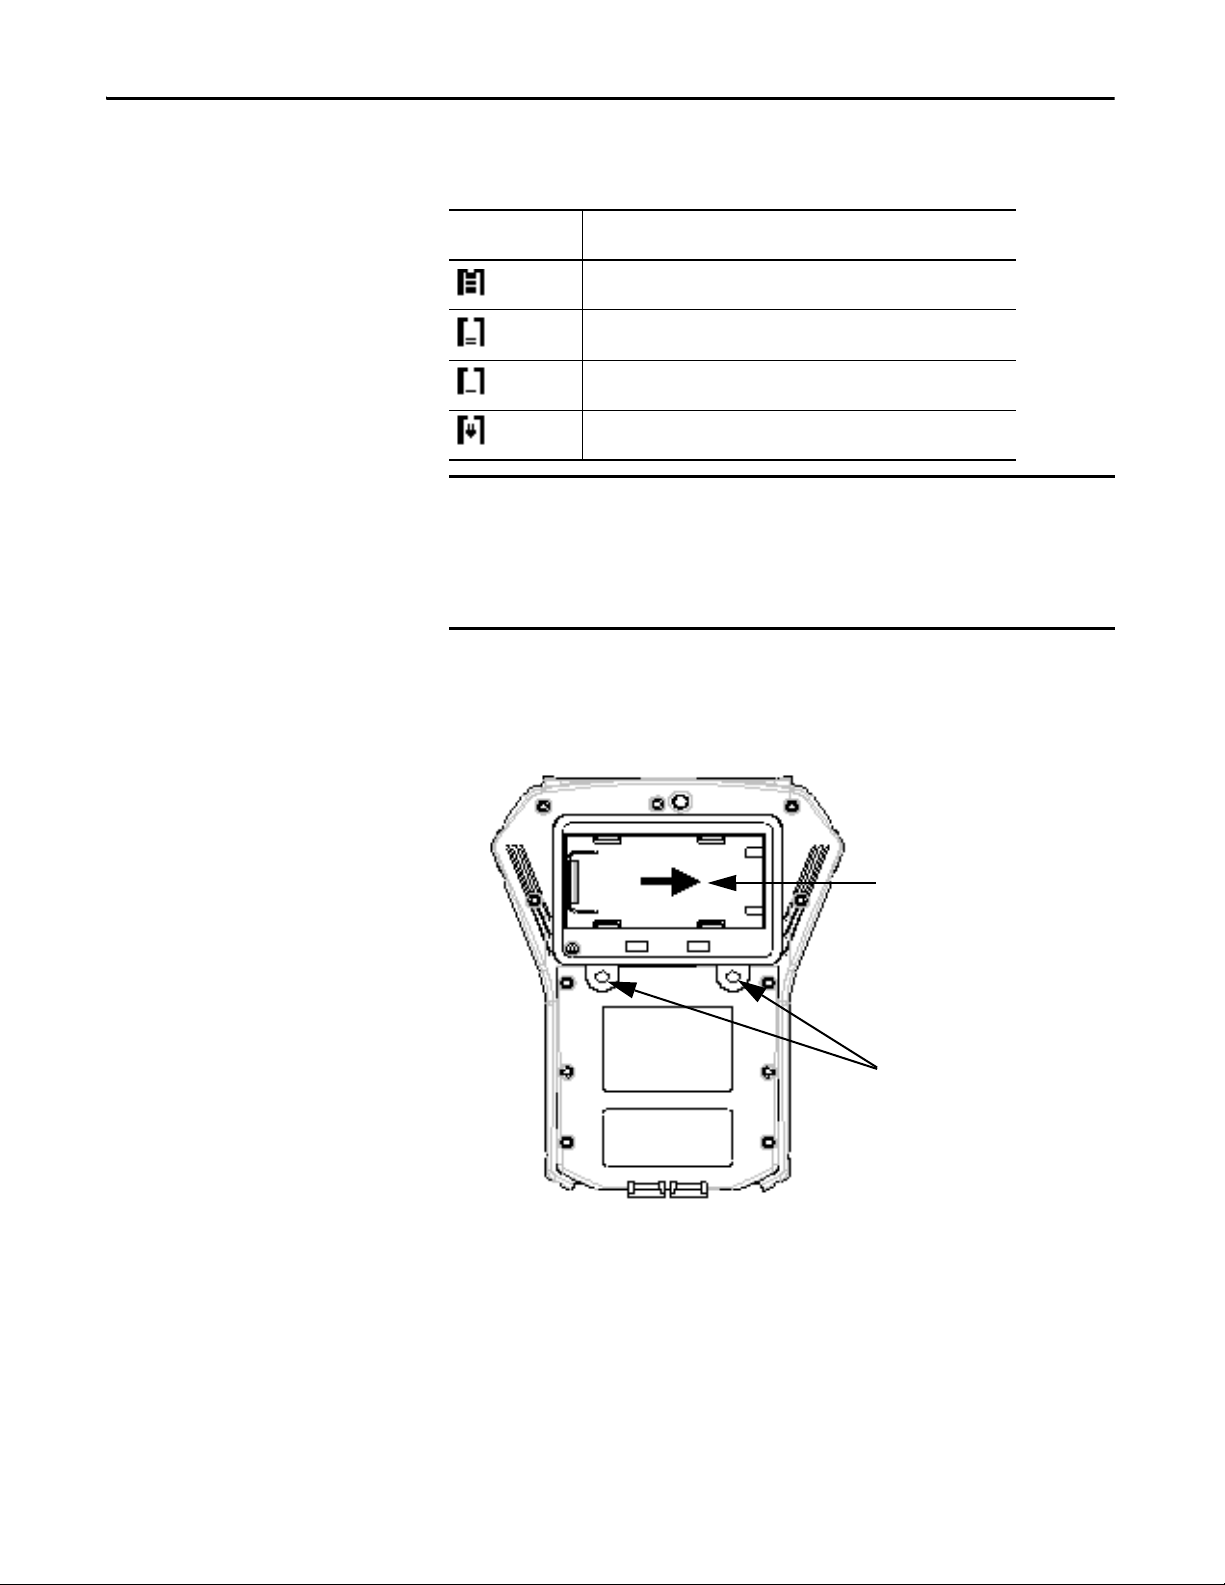
Release screws to access battery
pack.
Once battery cover is removed,
slide cell to left and lift out.
This table shows battery status icons relative strength of the battery.
Table 6 - Battery status icons
Battery Icon Meaning
Battery status is good (>30% life remaining)
Battery status is low (>10% life remaining)
Battery status is very low (<10% life remaining)
Battery charging
The Enpac 2500 will automatically notify you when the battery status is
30% or lower. To clear the notification, press the Decimal (.) key. The
notification will periodically appear until the battery is recharged or the
power adapter is attached.
When the battery status is 10% or lower, communications is prohibited.
Inserting and Removing the Battery Pack
1. Using a flat head screwdriver, remove the quick release screws (underside
of the data collector).
2. Remove the battery cover.
The Enpac has a safety switch positioned under the plate of the
battery compartment. When you remove this cover, the data
collector shuts down (as if the ON/OFF key was pressed.)
3. Slide the cell to the left and lift it out from the data collector.
The battery is inserted into the data collector by following this process in
28 Rockwell Automation Publication GMSI10-UM002D-EN-E - August 2012
reverse order.
Page 29
The Enpac 2500 Data Collector Chapter 1
TIP
Bump Test, Balancing, Recorder
and RUCD are optional
applications.
Powering on the Enpac
Enpac 2500 Screens
The ON/OFF key powers the Enpac 2500 on and off. A single press of the key
powers on the data collector. However, to power off the Enpac 2500, press the
ON/OFF key for a period of one second. The Enpac 2500 resumes operation at
the last screen you viewed when you powered off the unit.
The first time you power on the Enpac 2500 or following a reset, the
Instrument Setup screen automatically appears in the display.
Refer to
Set the Date, Time, and Date Format on page 32.
This section introduces you to the main screens that appear when operating the
Enpac 2500. There are many other screens that appear while operating the Enpac
2500. These screen are described with the operation.
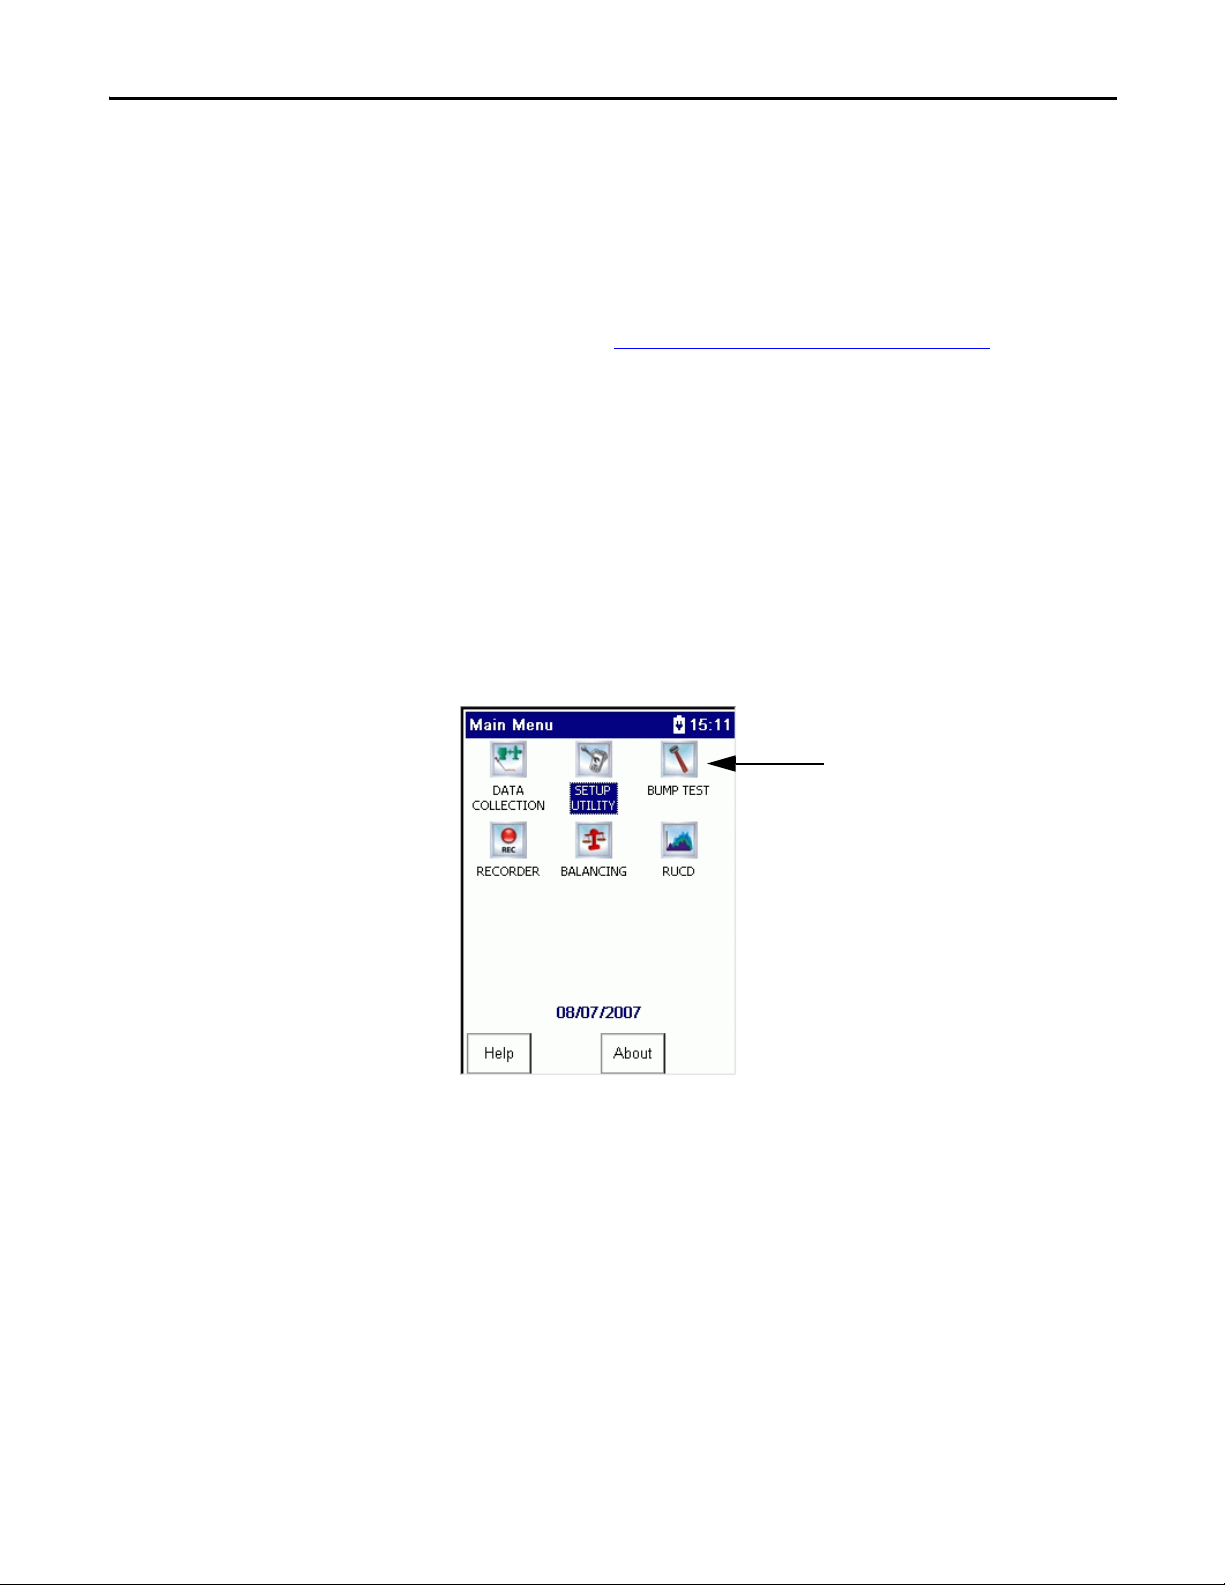
Main Menu
The Main Menu allows you to navigate to the different programs in the Enpac
2500. Each option in the Main Menu allows you to complete different tasks, such
as collecting data, defining the setup options, and reviewing data.
To make a selection from the Main Menu, highlight the option by using the
arrow keys and press either of the READ/OK keys.
Rockwell Automation Publication GMSI10-UM002D-EN-E - August 2012 29
Page 30
Chapter 1 The Enpac 2500 Data Collector
The Main Menu includes these standard options.
•Data Collection - The Data Collection option allows you to collect both
route and unscheduled (off route) data. It also allows you to view any data
stored in Enpac 2500. The data can be viewed on the screen by using the
RS-232 interface.
Refer to
Data Collection Screen on page 33 for more information.
•Setup Utility - The Setup option allows you to set up global options for
collecting data.
Refer to
Setup Screen on page 30 for more information.
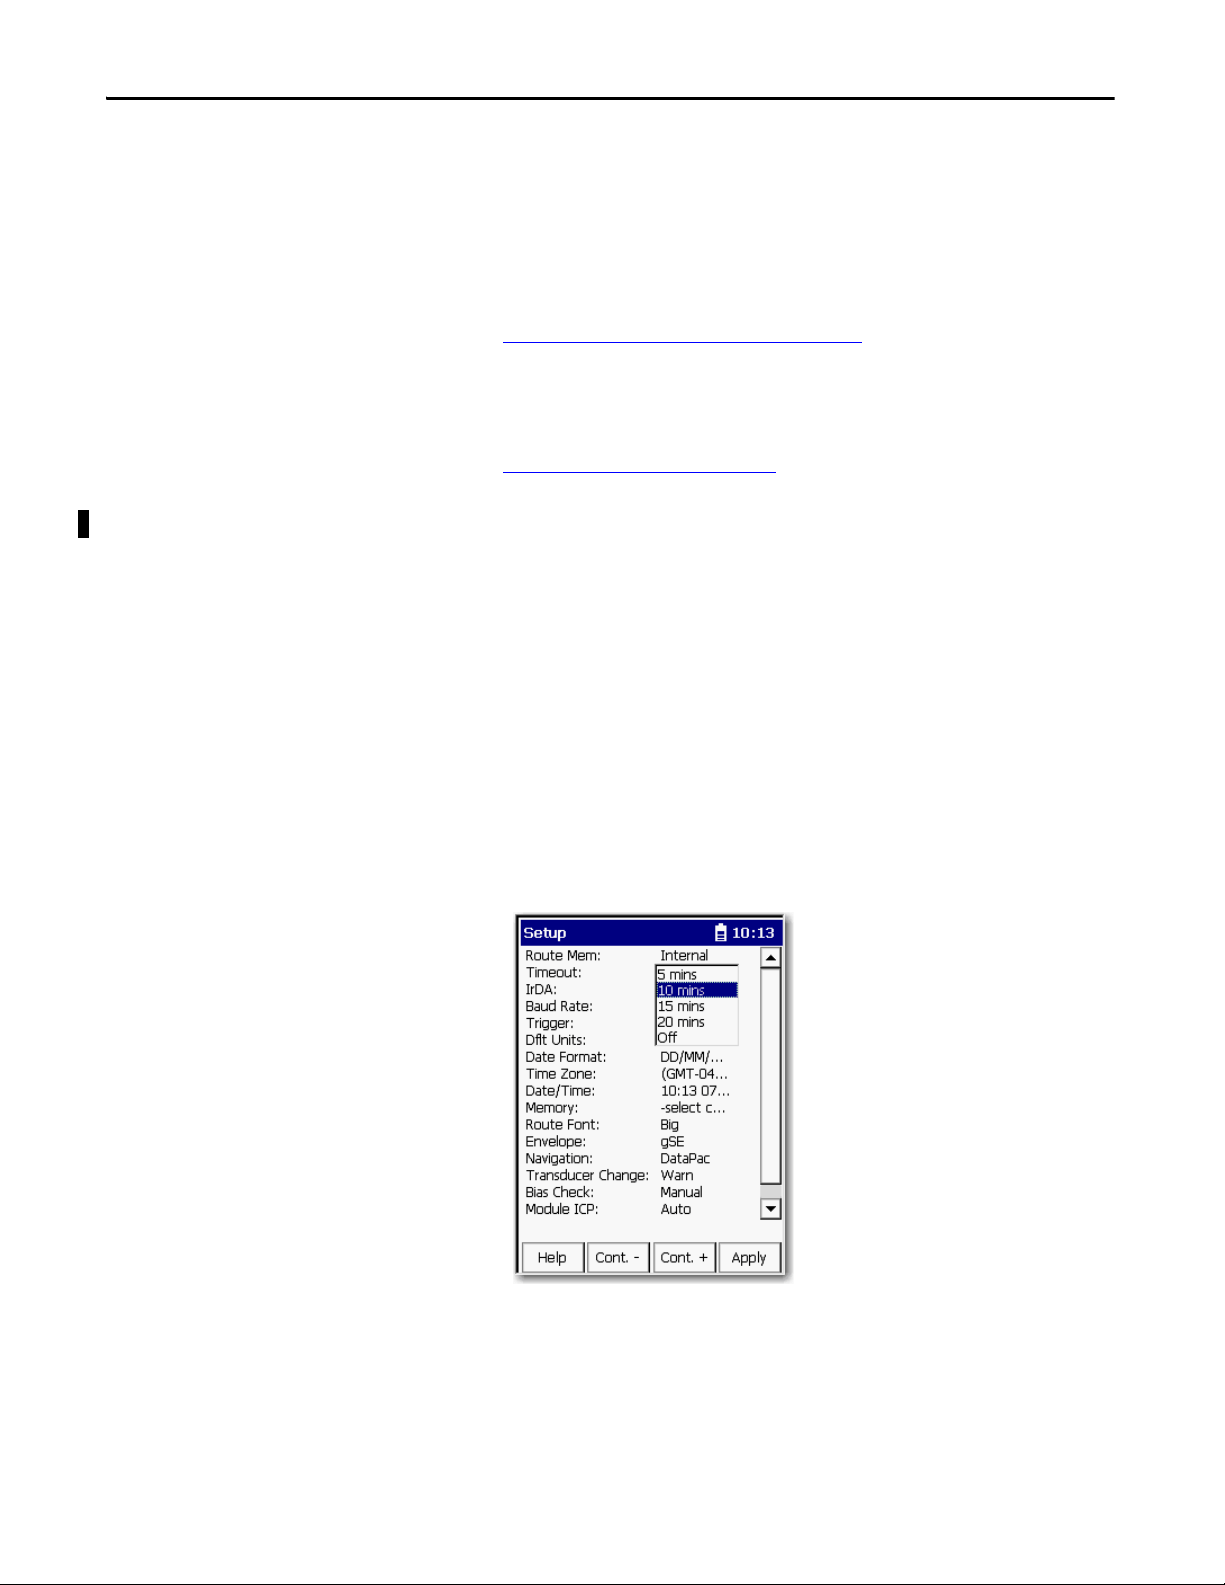
Setup Screen
The Setup screen allows you to set up global options for the Enpac 2500,
including date and time. The Enpac 2500 displays the Setup screen when you
first power on the instrument or after you reboot or hardware reset the Enpac
2500. You can also access this screen by selecting Setup Utility from the Main
Menu.
Follow these steps to edit an option.
1. Use the up or down arrow keys to select the parameter.
2. Press the right arrow key to open a list of choices.
This is an example of the timeout list of options.
3. Select the choice by pressing the arrow keys or type in a value using the
numeric key pad.
4. Press the left arrow key to make your selection.
5. Press 0 to display the additional options on the Setup dialog box.
30 Rockwell Automation Publication GMSI10-UM002D-EN-E - August 2012
Page 31

The Enpac 2500 Data Collector Chapter 1
The Extension Manager and Calibration buttons appear.
The Extension Manager lists the option extension modules installed on
the data collector.
Refer to
Install Optional Extension Modules on page 189.
When you are finished, press F4 (Apply) to return to the Main Menu.
Rockwell Automation Publication GMSI10-UM002D-EN-E - August 2012 31
Page 32

Chapter 1 The Enpac 2500 Data Collector
TIP
Set the Date, Time, and Date Format
The Enpac 2500 data collector keeps the current date format, date, and time even
when the instrument is powered off. However, there may be times when you need
to change these settings. For example, after restarting or resetting the Enpac 2500,
the date and time get set to 00:00:00.
Follow these steps to set the date, time, and select a date format.
1. Select Setup Utility from the Main Menu and press Enter.
The Setup screen appears.
On powering on the Enpac 2500 data collector for the first time or
after a restart or hardware reset, the Setup screen automatically
appears.
2. To change the format of the date, highlight Date Format and press the
Right arrow key to display the format choices.
3. Select the appropriate format and press the Left arrow key to save your
choice.
4. To change the date and time, highlight Date/Time and press the Right
arrow key to open the date and time window.
5. Enter the current time and date.
6. When you get to the Year field, press the Right arrow key to save your
entry.
7. When you are finished, press Enter to return to the Main Menu.
32 Rockwell Automation Publication GMSI10-UM002D-EN-E - August 2012
Page 33

The Enpac 2500 Data Collector Chapter 1
Displays the instrument configuration
screen, which lets you access global
data collection settings.
If you press 0, the Help button appears
in the next level of function keys.
Data Collection Screen
The Data Collection screen allows you to navigate around the Routes loaded in
the data collector, collect and store route and off route data, and edit the data
collection options.
It also allows you to navigate through the stored data and to review previously
collected route and off route data.
When you select Data Collection from the Main Menu, the Route Manager
screen appears. All of the routes that you download from Emonitor to the data
collector appear on the Route Manager screen.
Follow these steps to open a Route.
1. Select the route and press Enter.
Rockwell Automation Publication GMSI10-UM002D-EN-E - August 2012 33
Page 34

Chapter 1 The Enpac 2500 Data Collector
To highlight an item, press the
Up or Down arrow key.
To view previously collected
route dat a.
Collect and review Offroute data.
Displays the Instrument
Configuration screen.
Backlight adjustments
The information for the first point taken appears.
To access four additional functions for the Data Collection screen, press 0.
Follow these steps to move around in the Data Collection screen.
1. Select the hierarchy level, for example, Plant, Train, Machine, and
Location.
The Enpac 2500 supports up to six hierarchy levels for each point. These
levels are defined by the structure of the Route database in the Emonitor
software. The number and labels of these levels vary according to the way
your Route database was set up.
2. Display the next screen of information, for example, a list of location
measurement points, press the Right arrow key.
34 Rockwell Automation Publication GMSI10-UM002D-EN-E - August 2012
Page 35

The Select Location screen appears.
TIP
Use the Up and Down arrow keys
to highlight the point.
The Selection screen does not appear if you set the route
Navigation mode to `DataPac’ in the Setup Utility menu. Instead,
the Enpac 2500 data collector automatically moves to the next
point in the route when you press the Right arrow.
The Enpac 2500 Data Collector Chapter 1
Task Action
Select an item. Highlight the item and press the Left arrow key.
Leave the screen without selecting an item. F4 (Esc)
Start collecting data. Enter
Review previously collected route data. F1 (Review)
Collect and review Offroute data. F2 (Offroute)
See Collecting and Reviewing Data on page 119
for more information.
3. To select an item, highlight the item and press the LEFT ARROW key.
To leave the screen without selecting an item, press F4 (Esc).
Rockwell Automation Publication GMSI10-UM002D-EN-E - August 2012 35
Page 36

Chapter 1 The Enpac 2500 Data Collector
4. To start collecting data, press READ/OK.
5. To review previously collected route data, press F1 (Review).
6. To collect and review off route data, press F2 (Offroute).
7. When you are finished in the Data Collection screen, press F4 (Esc) to
return to the Main Menu.
Refer to Collecting and Reviewing Data on page 119
collecting and reviewing data.
for more information about
36 Rockwell Automation Publication GMSI10-UM002D-EN-E - August 2012
Page 37

The Enpac 2500 Data Collector Chapter 1
To highlight a topic, press the UP or
DOWN ARROW key.
Help Screen
Online help is available from any screen where the Help function is displayed on
the screen.
1. Press F1 (Help) to access the online help. The Help Contents screen
appears.
2. Highlight the topic for which you want to view and press F1 (Goto).
3. When you are finished viewing the topic, press F1 (Contents) to return to
the Help Contents screen or press F4 (Esc) to exit the online help.
Engineer Mode Menu Screen
The Engineer Mode Menu screen allows you to perform various maintenance
operations such as resetting the unit to the default settings, or loading an
operating system to the data collector. The Engineer Mode Menu can only be
initiated manually.
To initiate the Engineer Mode Menu, perform a hardware reset and hold down
the RIGHT and LEFT ARROW keys.
Rockwell Automation Publication GMSI10-UM002D-EN-E - August 2012 37
Page 38

Chapter 1 The Enpac 2500 Data Collector
Option 4 is not supported in the Enpac 2500.
Figure 6 - Engineer Mode Menu Screen
The Engineer Mode Menu provides you the following options. To select one of
the options, press the respective numeric key.
1. Force Clean Boot - During a normal boot sequence, the unit will
automatically update the registry contents into Flash memory so that any
changes are permanently stored. Select this option to bypass the normal
boot sequence and revert back to a ‘clean or default setup.
2. Download Image from Serial - Select this option to install a new
operating system onto the unit over the RS-232 serial interface. The
WinSerDL utility is required with this option.
Refer to
Operating System Update Procedures on page 50.
3. Download Image from PCMCIA - Select this option to install a new
operating system onto the unit using a PCMCIA ATA Flash card (FAT
format).
4. Touch Recalibration - This option is not supported in the Enpac 2500.
5. Exit and Launch CE - Select this option to exit the Engineer Mode Menu
and launch the Windows CE operating system.
38 Rockwell Automation Publication GMSI10-UM002D-EN-E - August 2012
Page 39

The Enpac 2500 Data Collector Chapter 1
TIP
View Settings for Current Measurement Definition
You can review the measurement definitions for the current active measurement
point from the online help.
1. Press F1 (Help) to access the online help.
The Help Contents screen appears.
On some screens, Help is located on the second set of functions, press
(shift) to display F1 (Help).
2. Press F2 (Pt. Info.) to view the measurement definition.
The Current Point Info screen appears.
3. When you are finished, press F4 (Esc) to exit the online help or press F1
(Contents) to return to the Help Contents screen.
Rockwell Automation Publication GMSI10-UM002D-EN-E - August 2012 39
Page 40

Chapter 1 The Enpac 2500 Data Collector
For the Route data to be accurately
time based, you must set the date and
time before leaving this screen.
Setting Up the Enpac 2500 Data Collector
Before you begin to take readings, you need to configure the instrument
parameters by using the Setup Utility, Instrument Configuration and Data
Collection screens.
Configure the Data Collector
By using the Setup Utility, you can configure the global options for your data
collector.
Follow these steps to configure the data collector.
1. Select Setup Utility from the Main Menu and press Enter.
The Setup screen appears.
2. Review the default values and edit if necessary.
3. When finished, press F4 (Apply) to return to the Main Menu.
40 Rockwell Automation Publication GMSI10-UM002D-EN-E - August 2012
Page 41

The Enpac 2500 Data Collector Chapter 1
Table 7 - Setup Screen Parameter Descriptions
Parameter Description Value
Route Mem Sets the location where the loaded route data is stored. Internal (default)
Storage Card
Timeout The number of minutes the Enpac 2500 can remain idle before it shuts itself off to
conserve battery power.
Press On/Off to reactivate the instrument following a timeout. The instrument returns to
the point in the program where it was when it shut off. No stored data will be lost.
Trigger Sets the Phase/Order input trigger synchronization:
• Laser Tach enables the internal Laser Tachometer when a Phase or Order
measurement is collected.
• External uses the trigger input from the POWER/USB/TRIGGER connector as the
trigger source.
• RS-232 transfers data can also be transferred between the data collector and your
computer.
Dflt Units Defines the units of measurement for Offroute standard velocity measurements.
Important: Used only* for Offroute standard velocity measurements.
Date Format The format of the date displayed in the Enpac 2500. MM/DD/YYY Y (default)
Time Zone Sets the time zone.
Only used when using ActiveSync software data synchronization. The time zone on the
instrument must match the time zone on the computer. If you are not using ActiveSync
software then the time zone setting has no effect.
Important: Always set your instrument to the correct time zone or your files will not be
in sync by time zone.
Date/Time Displays the date and time in the format you select in the Date and Time parameters. Current data and time
Memory Configures the memory:
• Select cmd to exit this field without selecting an option.
• Delete all routes and data from memory.
• Initialize formats the memory. Deletes all files from memory including any route files
and directories.
Important: These commands are performed on the memory location as set by Route
Memory.
Route Font You can select the font size for the Route. Big or Small
Envelope The type of envelope to use for high frequency and rolling element bearing analysis.
Determines which pre-defined measurement you can use to collect Offroute data.
Navigation Determines how the instrument navigates through the routes in the Data Collection
screens when the Right arrow key is pressed:
• Enpac- The instrument displays a Selection screen from which you select the item
you want to collect or review.
• DataPac - The instrument functions like a dataPAC 1500 in that it automatically
advances to the next point in the route.
Transducer Change Notification of a transducer change.
If set to Warn, a prompt appears on the screen warning you of the transducer change.
Off (default)
5 min
10 min
15 min
20 min
External (default)
Laser Tach
RS-232
English (ips) (default)
Metric (mm/s)
DD/MM/YYY Y
YYYY/MM/DD
List of 30 time zones
Select cmd (default)
Delete all routes
Initialize
gSE (default), collects an Offroute gSE point.
ESP, collects an Offroute ESP point
Enpac
DataPac (default)
Warn (defa ult)
Do not warn
Rockwell Automation Publication GMSI10-UM002D-EN-E - August 2012 41
Page 42

Chapter 1 The Enpac 2500 Data Collector
Table 7 - Setup Screen Parameter Descriptions
Parameter Description Value
Bias Check The bias of the transducer before taking the measurement. Manual (default)
Automatic
Module ICP The Module ICP option allows the manual control of turning off/on ICP power to
transducers in application modules.
Language Sets the language for the user inter face. Chinese
Never
Always
Auto
English
Francais
Deutsch
Italiano
Portuguese (Brasil)
Russkiy
Espanol (Spain, traditional)
Configure the Data Collection Options
The data collection options affect the measurement, the data collection process,
and how the data displays on the Enpac 2500. The instrument stores the data
collection settings even when the instrument is powered off. However, you
should check these options each time you start data collection.
Follow these steps to download a Route onto the data collector by using the
Emonitor software.
1. Using the Route Manager, select an appropriate route and press Enter.
The Data Collection screen appears.
2. Press 0 (Shift) to display the Config function.
42 Rockwell Automation Publication GMSI10-UM002D-EN-E - August 2012
Page 43

The Enpac 2500 Data Collector Chapter 1
The Config function should remain on the screen for approximately three
seconds after releasing the 0 key.
3. Press F4 (Config) to display the data collection options.
The Instrument Configuration screen appears.
4. Review the default values and edit if necessary.
5. When you are finished, press F4 (Apply) to return to the Data Collection
screen.
Rockwell Automation Publication GMSI10-UM002D-EN-E - August 2012 43
Page 44

Chapter 1 The Enpac 2500 Data Collector
Value Description
On Default
The display is updated only when the data collector has collected and averaged all the data.
For example, if the number of averages is set to 20, then data is displayed only when 20 blocks have been collected and
averaged. There is no progress indication during data collection, only a `Collecting data... message.
This speeds up the data collection of the spect ra by using the percent overlap specified in Emonitor. The interim averages
are not displayed.
Off The display is updated as often as possible while the data collector is collecting and averaging the data. For example, if
the number of averages is set to 20, then data might be displayed for averages 1, 6, 12, 18, and 20. The averages that are
displayed depends on the Fmax and number of lines selected. If each block is acquired very quickly then only the first
and last updates may be seen. Data can be stored at any time once the spectrum has been displayed.
Important: The Off option applies only to spectral averaging, not time synchronous averaging. This means it has no
effect on Phase points or other time synchronous averaged measurements.
Value Description
On The instrument automatically accepts both the overall and signature measurements and proceeds to the next point in
the list.
The overall measurement is accepted based on an algorithm. The algorithm is based on a percent fluctuation over a
period of time (seconds).
If the overall stays with the % specified by Percent for the number of seconds specified with Time, the overall magnitude
is accepted.
You must press Enter to accept the overall measurement, and then press Enter again to accept the signature
measurement.
Off Default
Value Description
On The instrument automatically moves forward to the next point in the list after
collecting data for the current point. No spectrum is displayed.
Off Default
The instrument displays a spectrum after collecting data for the current point.
Table 8 - Instrument Configuration Parameters
Parameter Description Value
Freq. Units The frequency units for displaying spectra/FFT data in the data collector.
This parameter is initially set to the default frequency (Hz or CPM) in
Emonitor when you load a list.
Fast Averaging Sets the averaging display and overlap processing.
Hz: displays spectra in Hertz, cycles per second.
CPM (default): displays spectra in cycles per minute.
Orders: spectra in orders of the operating speed.
This is used only when order normalized or phase data is collected by
using a tachometer or strobe to trigger data collection.
Auto Store Controls the number of key presses required to accept data.
Time The number of seconds that the input signal must be steady for Auto
Percent The fluctuation percent for Auto Store to occur. 30% (default)
Auto Advance Determines whether the Enpac 2500 automatically moves forward to the next point in the list after collecting data for the current point.
44 Rockwell Automation Publication GMSI10-UM002D-EN-E - August 2012
Store to occur.
2 s (default)
This parameter is used only when Auto Store is set to On.
This parameter is used only when Auto Store is set to On.
Page 45

The Enpac 2500 Data Collector Chapter 1
Value Description
Single shot Measures a single average for the signature and then stops.
Continuous Default
Continuously measures the signature until you press Enter to stop the averaging. This will pause the acquisition. Press
the Continue function to restart the acquisition. Press Enter a second time to store the data.
Value Description
Aggressive Default
Limits the auto-ranging to 20 mV level and sets the range limits from 1% to 70% of range.
When the input is under-range, the instrument recalculates the most appropriate setting and begin data sampling. The
range will not be adjusted a second time or checked prior to data collection.
Use Aggressive autoranging when faster data collection is desired. When using Aggres sive autoranging, set Auto Store to
Off, or set Auto Store Time to 2 seconds when Auto Store is set to On.
Conservative Allows auto-ranging to go as low as 2 mV and sets the range limits from 10% to 70% of range.
The instrument perform a series of checks prior to sampling data. This will result in longer data collection times and
potentially lengthy acquisition.
When the input is under-range, the instrument recalculates the most appropriate range setting and sample data to
make sure the range has been properly selected. In addition, the dynamic range will be adjusted several times prior to
data collection.
Use Conservative autoranging when large variations in signal amplitude are present for proper input range selection but
increases the settling time required.
Fixed No autoranging measurements are taken. Input range is set based on the transducer type and sensitivity.
For example, an accelerometer, the input range will be 5 V for 100 mV/G sensitivity or 500 mV for 10 mV/G sensitivity.
Transducer Input Range (EUs)
Accelerometer 50 g
Veloc imeter 50 i ps
Displacement probe 200 mils
Volts, A.C . 2 V
Table 8 - Instrument Configuration Parameters
Parameter Description Value
Acquisition Determines how the Enpac 2500 collects a signature when the measurement definition specifies just one average.
Autoranging Sets the input range during data collection.
• If Autorang ing is set to Fixed or Aggressive, the sof tware integration is used on all FFT mea surements. This is to give improved dynamic range and
faster hardware settl ing times.
• If hardware integration is required, set Autoranging to Conservative.
• For all autoranging settings (including Fixed), the input range is automatically increased and the data retaken if clipping occurs. This means that
the final input range used will never be too low for the signal being measured.
Rockwell Automation Publication GMSI10-UM002D-EN-E - August 2012 45
Page 46

Chapter 1 The Enpac 2500 Data Collector
Value Description
Normal Sets the auto-ranging algorithm to only track signals above 120 rpm. Therefore, use this setting when the machine
speed is greater than 120 rpm.
The normal speed setting guarantees the waiting time be no longer than 0.5 seconds. It will significantly improve
auto-ranging times and therefore data collection times for any points that have low filters (<2 Hz) selected.
Slow Sets the auto-ranging algorithm down to the Low Pass Filter setting. (If none, it will track down to approximately
0.33 Hz or 20 CPM.) Therefore, use this setting when the machine speed is less than 120 rpm.
The slow speed setting enables low frequency auto-ranging to accommodate collection of low frequency
components. For slow speed equipment, this is necessary to be sure adequate sampling and collection of the peak
signal. The slow speed setting allows the Enpac 2500 to auto-range on machines running as slow as 20 rpm. The
auto-ranging algorithm makes an assumption about the speed of the machine that is being monitored to determine
how long to wait for the peak signal value to be seen. With the slow speed setting, the wait-time is calculated as 1 /
f
hpf
where f
hpf
is the high-pass filter cutoff in Hz for the current point.
For example, if a 0.36 Hz filter is selected, the auto-ranging algorithm will wait for 1 / 0.36 = 2.78 seconds to make
sure it has seen the peak signal value.
Auto (default) Select to have the Enpac 2500 automatically select Normal or Slow depending on the measurements speed setting
specified by Emonitor.
Value Description
Select cmd: Default Exit this parameter without selecting an option.
Purge Marks all the points on the route as taken, sets the current reading to be the previous
reading for each point, and deletes all the Offroute data.
Delete route Deletes the current route in memory.
If you have an internal or SD storage card, the route to be deleted depends on what you
have chosen on the Setup Utility screen.
Delete all routes Deletes all routes and data in memory.
If you have an internal or SD storage card, the route to be deleted depends on what you
have chosen on the Setup Utility screen.
Initialize Formats the active memory. Note this will delete all routes and data in active memory.
TIP
Configure only when you open data collection. You must have a Route open for
the memory option to display. A Route must be in active memory.
Table 8 - Instrument Configuration Parameters
Parameter Description Value
Mach. Speed Controls the amount of time auto-ranging will wait to be sure it has seen the peak signal value of the sample.
When faster data collection is desired, set Autoranging to `Aggressive and Mach. Speed to `Normal.
Settling Delay The amount of time the instrument should delay data acquisition after
applying power to an ICP accelerometer.
The specified delay applies only to the first ICP measurement after
turning ICP on, for example, the first measurement at the start of a
ROUTE or a measurement following a non-ICP measurement
After the first measurement, data acquisition times are not affected. If
ski slope anomalies occur, try increasing the settling delay by one or two
seconds.
Memory Configures the data collectors memory.
0.00…60.00 s
5.00 s (default)
Multi Meas View Determines what is viewed on the screen while taking multiple
46 Rockwell Automation Publication GMSI10-UM002D-EN-E - August 2012
measurement location.
First (default)
Last
All
None
Page 47

The Enpac 2500 Data Collector Chapter 1
Value Description
Automatic Samples the trigger signal before collecting the triggered measurement and sets an appropriate trigger level
automatically. When collecting data on a triggered point, a message displays on the screen while the trigger level is being
sampled.
The length of time for which the trigger is sampled during autotriggering is dependent on two factors:
• The high pass filter selected for the point.
• The lower the high pass filter cutoff, the longer the trigger will be sampled.
Mach. Speed
If the Mach. Speed is set to Normal, the maximum trigger sampling time is about one second. If the Mach. Speed is set to
Slow, the maximum trigger sampling time is about 10 seconds. The Normal setting suppor ts autotriggering on machines
running at speeds down to ~120 rpm. The Slow setting will support autotriggering on machines running at speeds down
to ~6 rpm, depending on the width of the trigger pulse.
Fixed: Default The Enpac 2500 data collector uses the signal level entered in the point setup information (either Route or Offroute) as the
trigger point.
IMPORTANT
Table 8 - Instrument Configuration Parameters
Parameter Description Value
Trigger Sets the trigger source. External (default)
Uses the trigger input from the POWER/USB/TRIGGER connector as the
trigger source.
Laser Tach
Enables the internal Laser Tachometer when a Phase or Order
measurement is collected.
Trig Level Sets the trigger level. Applies only to triggered measurements (rpm points, phase points, time-synchronous averaged points).
Hist. Data Collect Determines how data is stored in the Enpac 2500 data collector when
collecting multiple measurements for a signal point:
• If you want to conserve space, you should select Always Overwrite.
• If you want multiple data sets to be stored and unloaded, select
Using Memory Cards
Always Append.
The Enpac 2500 can store program information and collected data on memory
Always Append: adds the new data for a point to existing data.
Always Overwrite: replaces existing data with new data.
Always Ask (default): displays a dialog box before attempting to store
the data.
cards. The Enpac 2500 is configured to accept any standard PCMCIA compact
flash (via adapter), Secure Digital (SD) memory card up to 2 GB that is
supported with a Microsoft Windows CE driver.
The Enpac 2500 data collector, version 3.10 and later supports the Secure Digital
High Capacity (SDHC) storage cards up to storage card up to 16 GB that is
supported with a Microsoft Windows CE driver.
The Enpac 2500 data collector is only certified for use with the Sandisk
PC cards may be inserted when the instrument is powered on or off. If any
memory card is not formatted to the correct standard, the instrument
automatically opens a dialog prompting you to format the card. We recommend
that memory cards be formatted Fat 16.
In this dialog, press either of the READ/OK buttons to format the card for use
with the Enpac 2500.
Rockwell Automation Publication GMSI10-UM002D-EN-E - August 2012 47
Secure Digital (SD) card SDSDx-yyy.
Page 48

Chapter 1 The Enpac 2500 Data Collector
TIP
IMPORTANT
TIP
Types of Memory Cards Used with Enpac 2500
Most any PCMCIA adapter and Secure Digital (SD) memory card, up to 2GB
can operate with the Enpac 2500.
Table 9 - Types of Memory Cards
Manufacturer Size Speed
PQI 1 GB Hi Speed 60
Tra nsc end 2 G B 40
Kingston 512 MB 40
Sandisk Secure Digital Card, SDSDx-yyy 2 GB Not compatible with SDHC cards.
The Enpac 2500 also supports the following ATA flash PCMCIA cards.
Table 10 - ATA Memory Cards
Manufacturer Model
Simple Technology PCMCIA Flash Memory Cards STI-ATAFL/8A to STI-ATAFL/512
Pretec Compact Flash Memory Cards (R)CFxxxxx + CF-PC Card adapter
Inserting and Removing a Memory Card
You load the memory card into the Enpac through the base cover at the bottom
of the unit. The memory card can be inserted while the Enpac 2500 is powered
on or off.
To Insert a Memory Card
1. With the bottom of the Enpac facing you, press down the latches of the
base cover.
2. Pull the base cover towards you.
3. Turn the memory card so the logo side of the card is facing you and gently
slide the card into the unit until it is firmly seated in place.
4. Close the base cover.
If the memory card has not been formatted or not formatted to the correct
standard, the Enpac will open a dialog asking if you wish to format the card.
Press READ/OK to format the card so it can be used in the Enpac.
Formatting the card deletes everything on the card.
The Enpac does not initialize the SD memory card.
48 Rockwell Automation Publication GMSI10-UM002D-EN-E - August 2012
Page 49

The Enpac 2500 Data Collector Chapter 1
To Remove a Memory Card
1. With the bottom of the Enpac facing you, press down the latches of the
base cover.
2. Pull the base cover towards you.
3. Press the release button and gently work the card out of its slot.
Rockwell Automation Publication GMSI10-UM002D-EN-E - August 2012 49
Page 50

Chapter 1 The Enpac 2500 Data Collector
IMPORTANT
TIP
Operating System Update Procedures
Download the Enpac 2500 .zip upgrade file from http://
www.rockwellautomation.com/support/. Click Downloads > Firmware Updates
> Condition Monitoring.
We recommend that you delete all older versions of the installer loader .msi files from
your computer before updating the Enpac 2500 data collector’s operating system.
Refer to this table when completing the following upgrade sections to determine
which Emonitor version and service release correspond to your Enpac 2500
operating system version.
Enpac 2500 Version Emonitor Version Service Release
3.10 3.5 Build 12 N/A
3.0 3.4 N/A
2.0 3.3 SR070628
1.03 3.2 SR060222
For instructions on how to upgrade you Emonitor software, refer to one of the
Emonitor Installation Instructions.
Table 11 - Emonitor Installation Publications
Publication Publication Number
Emonitor Gupta Single User Installation Manual EMONTR-IN001
Emonitor Gupta Multi User Installation Manual EMONTR-IN002
Emonitor Oracle Multi User Installation Manual EMONTR-IN003
Emonitor MSSQL Multi User Installation Manual EMONTR-IN004
Update the Enpac 2500 Data Collector Operating System, Firmware Version
3.10
Follow these instructions to update the data collector operating system.
We recommend that you upload your data to Emonitor before you update the
operating system just in case there is an error with the firmware installation, such as a
cable disconnect.
50 Rockwell Automation Publication GMSI10-UM002D-EN-E - August 2012
Page 51

The Enpac 2500 Data Collector Chapter 1
TIP
Before performing the 3.10 firmware upgrade, take note of the modules installed
on the Enpac 2500 data collector.
To confirm which modules that are installed and the version by press F3 (About) on the
Main Screen.
Table 12 - Data Collector Modules
Cat. No. Module Version
1441-PEN25-MOD-BAL Balancing Upgrade
1441-PEN25-MOD-BMP Bump Test
1441-PEN25-MOD-FRF FRF - Frequency Response Function
1441-PEN25-MOD-RUCD RuCD - RunUp CoastDown
1441-PEN25-MOD-REC Recorder
1. After downloading the Enpac 2500 3.10 Upgrade .zip file as instructed in
Operating System Update Procedures
on page 50, follow these
instructions.
2. Connect your data collector to your computer by using the USB
connection.
3. Start Microsoft ActiveSync to be connected to the data collector.
4. Extract the .zip file.
5. Double-click the OS Loader.msi file.
Rockwell Automation Publication GMSI10-UM002D-EN-E - August 2012 51
Page 52

Chapter 1 The Enpac 2500 Data Collector
6. Use the default location.
7. Click Next.
8. The installation procedure is ready, click Next.
The Enpac OS Loader installs.
9. From the Windows Start menu, click Start > Programs > Allen-Bradley >
Enpac2500 > Enpac2500 OS Loader.
At the beginning of the upgrade process, a message is shown saying that the
upgrade can take a long time, depending on the selections made.
10. Click OK.
The OS Loader automatically backs up any core files, such as Calibration
Data and License Files.
52 Rockwell Automation Publication GMSI10-UM002D-EN-E - August 2012
Page 53

The Enpac 2500 Data Collector Chapter 1
TIP
TIP
The option to Backup any Module Data, for example, Balance jobs or .wav
file recordings.
11. Decide if you need to backup data.
We recommend that you click yes to backup your data.
Next, you are given the option to backup any Routes.
We recommend that before you decide to backup any routes, upload your data to
Emonitor just in case there is an error with the firmware installation, such as a cable
disconnect.
12. Decide if you need to backup Routes.
After any requested backups have been completed, the OS Loader will
copy on the new NK.bin file and begin programming the new OS.
Rockwell Automation Publication GMSI10-UM002D-EN-E - August 2012 53
Page 54

Chapter 1 The Enpac 2500 Data Collector
At this stage, you can see the OS programming occur on the unit.
Remember that this process can take some time. You should see the
firmware upgrade appear on the Enpac 2500 screen.
Once the programming of the new OS is complete, you need to perform a
Hard reset/Cold reboot. See Restarting the Data Collector
on page 57.
13. Click OK.
14. Disconnect the USB cable.
15. Reconnect the USB cable to re-establish ActiveSync.
16. Click OK.
If ActiveSync hasn’t been reconnected within a few minutes, the OS
Loader will re-prompt for suggested ways to re-connect.
54 Rockwell Automation Publication GMSI10-UM002D-EN-E - August 2012
Page 55

The Enpac 2500 Data Collector Chapter 1
TIP
The OS Loader then completes the final stages of the upgrading the
Firmware, by automatically restoring any backed up files, for example,
Calibration Data, License Files, and Module Data and Routes.
17. Determine if you need to install any modules.
18. Choose to install All Modules (Yes to All) or individually (Yes/No).
We recommend that you select to install modules individually based on the modules
you have activations for listed in the table Data Collector Modules
If you click Yes to All, the modules that you have not purchased activations for will
appear greyed and are unavailable.
on page 51.
After the Modules have been installed, the OS Loader completes and tells
you to wait for the Reboot.
Rockwell Automation Publication GMSI10-UM002D-EN-E - August 2012 55
Page 56

Chapter 1 The Enpac 2500 Data Collector
IMPORTANT
TIP
Module Licensing
Any Modules that were licensed prior to the upgrade will still be licensed. Any
Modules that are installed, but which have not been licensed will appear greyed
out as unavailable.
To active greyed-out modules, contact your contact your local Allen-Bradley
distributor or Rockwell Automation sales representative. Use the table Data
Collector Modules on page 51 to identify what modules you need to order.
It will be necessary to re-enter the date and time in the Enpac 2500 data collector.
To confirm that the correct version was loaded, press F3 (About) on the Main
Screen. The firmware version should match the operating system file just loaded.
56 Rockwell Automation Publication GMSI10-UM002D-EN-E - August 2012
Page 57

The Enpac 2500 Data Collector Chapter 1
TIP
Reset Switch
Restarting the Data Collector
You should restart the Enpac 2500 data collector if the instrument locks up and
does not respond to any key presses including the On/Off key.
When you need to reset the data collector you can perform a hard or soft reset. A
hard reset resets the defaults vales of the date, time, and time zone. A soft reset
keeps the current values. A reset does not delete data or Routes.
Perform Soft Restart
When doing a soft restart, all files and programs present in memory remain in
memory following the restart.
Most of the time, a soft restart will reset any anomalies you are having
with the data collector.
With the data collector on, simultaneously hold down the 2, 7, 8, and 9 keys for
about a second. The data collector restarts and the Main Screen appears.
Perform Hard Restart
A hardware reset lets you to reconfigure the Enpac 2500 data collector back to
the factory default setup. Programs or data files stored in RAM are cleared, but
any programs or files stored in internal memory and any registry changes will be
maintained.
The reset switch is located behind the battery access panel on the underside of the
instrument. The reset switch can only by pressed using a 1/16- in diameter pin or
a straightened paper clip.
Rockwell Automation Publication GMSI10-UM002D-EN-E - August 2012 57
Page 58

Chapter 1 The Enpac 2500 Data Collector
IMPORTANT
IMPORTANT
IMPORTANT
A hardware reset can also initiate the Engineer Mode Menu.
See Engineer Mode Menu Screen on page 37 for more information.
Follow these steps to replace the battery.
1. Using a flat head screwdriver, remove the two latch screws on the battery
access panel.
2. Remove the battery access panel.
3. Press the Reset button using a 1/16th inch diameter pin or a straightened
paper clip.
4. Replace the battery access panel and tighten the two screws.
The Enpac 2500 data collector automatically powers on.
Allow at least thirty seconds for the instrument to reconfigure and activate the
display after the Instrument Setup screen appears.
The current date, time and some status information will be lost, and
the backlight setting will be returned to the default setting following a
hardware reset.
See Set the Date, Time, and Date Format
information.
Any data held in internal memory is secure and will not be lost nor
destroyed during a hardware reset.
on page 32 for more
58 Rockwell Automation Publication GMSI10-UM002D-EN-E - August 2012
Page 59

The Enpac 2500 Data Collector Chapter 1
IMPORTANT
Adding Applications to the Enpac 2500 Data Collector
The Enpac 2500 data collector uses the Extension Manager to install and
uninstall application extensions and functions that are licensed and sold
separately from the basic entry level product (for example, Balancing and Two
Channel).
The installation cards that you receive from Rockwell Automation will work with
any Enpac 2500 data collector. Once an application is installed on an Enpac 2500
data collector, the card is locked so that it can only be used with that unit.
One installation card is required for each unit that will be upgraded.
You can uninstall applications if required. When uninstalling an application, you
have the option to free up the license so that it can be used to install the
application on another Enpac 2500 data collector. This allows applications to be
transferred between units.
Refer toInstalling Optional Extension Modules
information about installing the extensions.
on page 189 for complete
Rockwell Automation Publication GMSI10-UM002D-EN-E - August 2012 59
Page 60

Chapter 1 The Enpac 2500 Data Collector
60 Rockwell Automation Publication GMSI10-UM002D-EN-E - August 2012
Page 61

Chapter 2
IMPORTANT
Setting Up Measurements
This chapter describes setting up the measurement definitions in Emonitor to use
with the Enpac 2500. Measurement definitions define how to collect and store
measurements. You can create several different types of measurement definitions
at each location. Emonitor can then take advantage of the abilities of your data
collector by combining some of the measurement definitions when you load
them into the data collector. By combining measurements, Emonitor can shorten
the data collection time. This chapter describes also how the Emonitor software
and the Enpac 2500 handle alarms, lists, and inspection codes.
Top ic Pa ge
Measurement Definition Options 62
Setting Up Collection Specifications 69
Setting Up Measurement Definitions 78
Setting Up Alarms, Lists, and Inspection Codes 95
For complete information on all Emonitor features, tasks, and interface
elements, refer to the Emonitor online help.
Rockwell Automation Publication GMSI10-UM002D-EN-E - August 2012 61
Page 62

Chapter 2 Setting Up Measurements
IMPORTANT
The names of the active data
collectors appear in inverse text.
Measurement Definition Options
These topics describe the available selections for setting up measurement
definitions in Emonitor. You determine these selections by choosing Tools > Set
Active Collectors in Emonitor.
Figure 7 - Set active collectors
If no data collectors are active, the selections that appear in the
Measurement Definition pane are the ones available to ALL data collectors.
If only the Enpac is active, then only the valid choices for the Enpac appear
in the lists. If the Enpac and other data collectors are active at the same
time, you see the selections that are common to all data collectors that are
active. Therefore, you may not see all the selections available for the Enpac.
In some cases, both Emonitor and Enpac 2500 support certain options. In other
cases, Emonitor can support an option that the Enpac 2500 cannot support. For
example, Emonitor can apply a software high pass filter to the data after it
unloads the data from the Enpac 2500. This allows you to use a filter that is not
available in the Enpac 2500.
Measurement Types
Emonitor and Enpac 2500 support the following measurement definition types:
•Magnitude - This measurement type is a single value representing the total
energy of a measurement. For example, a vibration magnitude represents
the total energy in a vibration spectrum. The Enpac 2500 can also collect
magnitude+phase measurements, for the first through the eighth orders.
•Numeric - Manual entry or DC voltage measurement of an overall value
such as temperature, pressure, flow rate, operating speed, or proximity
probe gap readings.
•Spectrum - Frequency domain measurement of frequency vs. amplitude,
usually for velocity or acceleration. The Enpac can collect phase with
spectrum measurement definitions.
•Time Waveform - Time domain measurement of time vs. amplitude,
usually for displacement, velocity, or acceleration.
Remember that the available measurement types in Emonitor depend on the
active collectors you select with the Tools > Set Active Collectors. If you have two
62 Rockwell Automation Publication GMSI10-UM002D-EN-E - August 2012
Page 63

Setting Up Measurements Chapter 2
IMPORTANT
or more active data collectors, you may not see all the selections available for the
Enpac.
Measurement Filters
Emonitor and Enpac 2500 each support certain measurement filters. Some of the
filters are supported in both Emonitor and Enpac 2500. You can define custom
band filters (high pass, low pass, band pass) by creating a new band filter using
Setup > Band Filter. You can choose to use a filter in the Enpac 2500 by selecting
the Analog or RSS (digital) option when you define a filter.
Figure 8 - Defining a Band Filter
Filters in Emonitor are referred to as software filters. Filters in data
collectors are referred to as hardware filters. Hardware filters alter the
signal in the Enpac 2500. Emonitor software filters alter the signal (data
representing the signal) after you unload the data into Emonitor. In
general, if the filter you want to use is available in both Emonitor and in the
data collector, it is to your advantage to use the hardware filter in the data
collector.
Hardware filters have the following advantage:
They can remove low frequency, high amplitude signal components that
would dominate the dynamic range in the data collector. This results in
improved amplitude resolution of the remaining signal range.
Software filters have the following advantage:
If there is no corresponding filter in the data collector, or you choose not to
use it, Emonitor can apply a digital filter after you unload the data from the
data collector.
Rockwell Automation Publication GMSI10-UM002D-EN-E - August 2012 63
Page 64

Chapter 2 Setting Up Measurements
IMPORTANT
TIP
gSE Filters
Use a gSE filter to detect bearing and other component defects. The gSE filters
provide a demodulated measurement similar to the envelope measurements in
other instruments. You can use gSE filters with the following measurement
definitions:
• Magnitude
• Spectrum
These six gSE filters are available in the Enpac 2500. If you select the Envelope
filter, Emonitor automatically picks the 5 kHz gSE filter.
100 Hz gSE (6000 CPM)
200 Hz gSE (12000 CPM)
500 Hz gSE (30000 CPM)
1000 Hz gSE (60000 CPM)
2000 Hz gSE (120000 CPM)
5000 Hz gSE (300000 CPM)
The Datapac Emulation parameter in the Data Collector Advanced Settings
dialog (Setup > Data Collector) in Emonitor must be set to Yes.
See Table 31 on page 100
.
ESP Filters
Use an Envelope Spectrum Processing (ESP) filter to detect bearing and other
component defects. The ESP filters apply a band pass filter, envelope the time
domain signal, and then perform a frequency analysis on the result. ESP filters are
built into the Enpac 2500, and you cannot change them in Emonitor. You can use
ESP filters with the following measurement definitions:
• Magnitude
• Spectrum
The following ESP filters are available with Emonitor and the Enpac 2500.
0.6 to 1.25 kHz
1.25 to 2.5 kHz
2.5 to 5 kHz
5 to 10 kHz
10 to 20 kHz
Contact Technical Support for assistance in using the ESP filters in Emonitor.
64 Rockwell Automation Publication GMSI10-UM002D-EN-E - August 2012
Page 65

Setting Up Measurements Chapter 2
IMPORTANT
EXAMPLE
2 (max frequency)
number of lines
--------------------------------------------
2 120,000 CPM
400 lines
-------------------------------------------
240000
400
------------------
600 CPM 10 Hz== =
The Datapac Emulation parameter in the Data Collector Advanced Settings
dialog (Setup > Data Collector) in Emonitor must be set to No.
See Table 31 on page 100
for more information.
High Pass Filters
Use a high pass filter to remove high vibration, low frequency signal components
that would dominate the signal. Examples include structural vibration or signal
components generated by an integrator. The high pass filter excludes all
frequencies below a defined frequency. It allows, or passes, frequencies above the
defined frequency. You define these and other band filters using Setup > Band
Filter. You can use a high pass filter with the following measurement definitions:
• Magnitude
• Spectrum
If you select Analog (as the data collector filter type) when you define a high pass
filter, the data collector uses one of the following filters determined by the
following formula.
Emonitor uses a high pass filter with one of the low frequency cutoff shown in
the table below. It uses the filter whose cutoff is greater than or equal to the result
of the formula.
Integrated (A to V, A to D, V to D) Non-integrated (A, V, and D)
0.36 Hz (21.6 CPM) 0.18 Hz (10.8 CPM)
5.30 Hz (318 CPM) 2.67 Hz (160.2 CPM)
23.80 Hz (1428 CPM)
ATTENTION:
Emonitor uses the 5.30 Hz (318 CPM) filter for an integrated
mea surement. It uses t he 2.6 7 Hz (1 60.2 CPM) filter for a non-integrated
measurement.
Rockwell Automation Publication GMSI10-UM002D-EN-E - August 2012 65
Page 66

Chapter 2 Setting Up Measurements
IMPORTANT
2 (max frequency)
number of lines
--------------------------------------------
Order (magnitude) Filters
Use order filters to define the bands around orders for magnitude and
magnitude+phase measurements. You define these filters using Setup > Band
Filter. You can use order filters with the following measurement definitions:
• Magnitude
• Spectrum
You can define and use order filters for the first through the eighth orders with
the Enpac 2500. If you specify the Maximum frequency in Orders, select Analog
and Order normalize when you define the orders filters, then the Enpac calculates
the orders from an external trigger.
The Enpac 2500 then uses its own filters to calculate the magnitude and phase for
the first through the eighth orders. Emonitor calculates magnitude values
(without phase) for additional orders after you unload the data. Emonitor also
calculates magnitude values after you unload the data if you select None instead
of Analog.
If you want phase, remember to specify the Maximum frequency (in
Collection Specification dialog) in Orders, select Analog in the Band Filter
Specification dialog and Order normalize in the Collection Specification
dialog. Emonitor does not select these options by default.
Default Filters
There are also four default filters in Emonitor that map to specific filters in the
Enpac 2500. The filters are High Frequency, Envelope, Smart HP, and Overall.
•High Frequency - Typically this filter maps to a high frequency filter in
the data collector and is available only for magnitude acceleration
measurements. In the Enpac 2500, it maps to the 5 kHz gSE filter.
•Envelope - Typically this filter maps to one of the gSE filters in the data
collector and is available for magnitude and spectrum acceleration
measurements. In the Enpac 2500, it maps to the 5 kHz gSE filter.
•Smart HP - (Smart High Pass) Typically this filter maps to a specific high
pass filter in the data collector and is available for magnitude, spectrum,
and time waveform measurements. In the Enpac 2500, it maps to the
Enpac filters shown in the table below, depending on the results of
comparing the filter choice to the formula below.
Emonitor uses the following formula.
66 Rockwell Automation Publication GMSI10-UM002D-EN-E - August 2012
Page 67

Setting Up Measurements Chapter 2
EXAMPLE
EXAMPLE
2 120,000 CPM
400 lines
-------------------------------------------
240000
400
------------------
600 CPM 10 Hz== =
2 (max frequency)
number of lines
--------------------------------------------
2 30,000 CPM
400 lines
----------------------------------------
60000
400
---------------
150 CPM 2.5 Hz== =
Emonitor chooses an overall filter with one of the low frequency cutoffs
shown in the table below. It uses the filter whose cutoff is less than the
result of the formula.
Integrated (A to V, A to D, V to D) Non-integrated (A, V, and D)
5.30 Hz (318 CPM) 2.67 Hz (160.2 CPM)
23.80 Hz (1428 CPM)
ATTENTION: Emonitor uses the 5.30 Hz (318 CPM) filter for an
integrated measurement. It uses the 2.67 Hz (160.2 CPM) filter for a
non-integrated measurement.
•Overall - Typically this filter maps to a specific high pass filter in the data
collector and is available for magnitude, spectrum, and time waveform
measurements. In the Enpac 2500, it maps to the Enpac filters shown in
the table below, depending on the results of comparing the filter choice to
the formula below.
Emonitor uses the following formula.
Emonitor uses an overall filter with one of the low frequency cutoffs
shown in the table below. It uses the filter whose cutoff is greater than or
equal to the result of the formula.
Integrated (A to V, A to D, V to D) Non-integrated (A, V, and D)
0.36 Hz (21.6 CPM) 0.18 Hz (10.8 CPM)
5.30 Hz (318 CPM) 2.67 Hz (160.2 CPM)
23.80 Hz (1428 CPM)
ATTENTION:
Emonitor uses the 5.30 Hz (318 CPM) filter for an integrated
mea surement. It uses t he 2.6 7 Hz (1 60.2 CPM) filter for a non-integrated
measurement.
Rockwell Automation Publication GMSI10-UM002D-EN-E - August 2012 67
Page 68

Chapter 2 Setting Up Measurements
IMPORTANT
IMPORTANT
Select to use the RSS filter
The available filters in Emonitor depend on the data collectors you select as
active data collectors using Tools > Set Active Collectors. If you have two or
more active data collectors, you may not see all the selections available for
the Enpac. If you have no active data collectors, you see all the selections for
every data collector, not just the selections for the Enpac.
RSS Overall
The Enpac 2500 allows you to take a digital overall measurement, instead of
analog. This set up makes measurement collection faster. Be aware that this Root
Sum Squares (RSS) overall value is not as complete because it does not include
the power in the signal from below the first spectral bin or above the highest
spectral bin. Please note that the RSS overall values may not trend well with
analog overall measurements.
To use the RSS filter, you must create a Band Filter in Emonitor. Choose Setup >
Band Filter and click New. Then select RSS (digital) as the filter type.
Figure 9 - RSS Filter
Using the 0.36 Hz (21.6 CPM) low cutoff filter for integrated measurements
or the 0.18 Hz (10.8 CPM) low cutoff filter for non-integrated
measurements will always cause the Enpac 2500 to go into a long
autorange mode. Only use these filter settings when very low frequency
data is required.
Measurement Units
Emonitor and the Enpac 2500 support many different measurement units. The
measurement units that appear in the Enpac 2500 are text that depend on:
• the type of measurement definition.
• the units for the measurement definition.
• the transducer specification used in the collection specification for the
measurement definition.
68 Rockwell Automation Publication GMSI10-UM002D-EN-E - August 2012
Page 69

Setting Up Measurements Chapter 2
TIP
Measurement Input Type
Measurement Window Type
Measurement Maximum Frequency
Measurement Zoom
Measurement Resolution
Measurement Signal Detection Type
Number and Type of Averages
Orders Track
Magnitude and Phase
Measurement at Orders
The Enpac 2500 can collect data for English units, Metric units, or Decibels. It
uses the units that you select in Emonitor. You can select units from a single
system (for example, English g, in/sec, etc.), or you can mix units from different
2
systems (for example, English gs, in/sec and Metric m/s
, m/sec) in one list. The
Enpac 2500 loads the exact text string from Emonitor. The signal detection type
(peak, rms, true peak, etc.) is appended to the units on the Enpac 2500 screen.
The measurement units cannot be changed after you collect data for the
measurement definition.
Setting Up Collection Specifications
Measurement definitions are controlled in part by the collection specification
(Setup > Collection). You select the collection specification when you set up the
measurement definition. You can create new collection specifications based on
your specific measurement by choosing Setup > Collection.
Figure 10 - Collection Specification dialog
The transducer specification used in the collection specification includes both
the base unit and the calibration value.
Figure 11 - Transducer Specification
Rockwell Automation Publication GMSI10-UM002D-EN-E - August 2012 69
Page 70

Chapter 2 Setting Up Measurements
Table 13 - STD (Hz) 2000 Collection Specification
Transducer Window Signal Detection Fmax Lines Phase? Order Norm? Averages
Accelerometer Hanning Peak 2 kHz 400 No No 4 linear
The figures in a typical measurement setup in the following sections refer to
making selections in these dialogs. For example, a table for STD (HZ) 2000
collection specification would look like this.
The table for the transducer specification in the STD (Hz) 2000 collection
specification would look like this.
Table 14 - Transducer specification in STD (Hz) 2000 collection specification
Name Base Unit Input Type Units DC Offset
Accelerometer Acceleration ICP Accel gs 0
Measurement Input Types
The input type is part of the transducer specification (Setup > Calibration). The
transducer is part of the collection specification (Setup > Collection). You select
the collection specification when you set up the measurement definition.
Emonitor and the Enpac 2500 support the following input types.
• ICP Accel - Use for ICP accelerometers requiring current from a power
supply.
• AC Coupled - Use for AC voltage measurements and non-ICP
accelerometers.
• DC Coupled - Use for DC voltage measurements. This includes numeric
(process) measurements taken from a DC voltage output.
•Manual Entry - Use for numeric (process) measurements where you enter
the value for the measurement with the data collector keyboard.
To specify an input type, choose Setup > Calibration, then select the correct
Enpac from the Collector list. You can then assign Input types, Calibration, and
appropriate Units to the transducer you wish to use.
Figure 12 - Transducer Calibration Dialog Box
70 Rockwell Automation Publication GMSI10-UM002D-EN-E - August 2012
Page 71

Setting Up Measurements Chapter 2
Measurement Window Types
The measurement window type is part of the collection specification (Setup >
Collection). See
collection specification when you set up the measurement definition.
Emonitor and the Enpac 2500 support the following measurement window
types. In general, the Hanning measurement window provides the best
compromise of frequency and amplitude accuracy for most predictive
maintenance measurements.
•Hanning - A general purpose window to use on random type data when
frequency resolution is more important than amplitude accuracy. Use this
setting for most of your machinery monitoring activities.
•Rectangular - The data collector does not apply a window. Use this only
for transient signals that die out before the end of the time sample, or for
exactly periodic signals within the time sample.
•Flattop - Use this when amplitude accuracy is more important than
frequency resolution. In data with closely spaced peaks, a Flattop window
may smear the peaks together into one wide peak. Use this setting for
sinusoidal or calibration signals.
•Hamming - A general purpose window that is similar to the Hanning
window. It provides better frequency resolution but decreased amplitude
accuracy when compared to the Hanning window. You can use it to
separate close frequency components.
Setting Up Collection Specifications on page 69. You select the
Measurement Signal Detection Types
The signal detection is part of the collection specification (Setup > Collection).
See
Setting Up Collection Specifications on page 69. You select the collection
specification when you set up the measurement definition.
Emonitor and the Enpac 2500 support the following signal detection types.
•None - Use for numeric measurements. None defaults to RMS when
applied to magnitude or spectrum measurement definition.
•RMS - Use for detection of voltage and current. For the frequency domain,
the dynamic signal is measured as the square root of the mean of the square
of the signal. This is the RMS amplitude of a sine wave at the frequency of
interest. For the time domain, the dynamic time signal is squared,
integrated over some time period, and then the square root is taken.
•Peak - Use for detection of acceleration, velocity, and high frequency
energy. This is the peak (0 to maximum) amplitude of a sine wave at the
frequency of interest and is calculated from the RMS value.
•Peak-Peak - Use for detection of displacement; sometimes used for high
frequency energy. This is the peak-to-peak (minimum to maximum)
amplitude of a sine wave at the frequency of interest and is calculated from
the RMS value.
Rockwell Automation Publication GMSI10-UM002D-EN-E - August 2012 71
Page 72

Chapter 2 Setting Up Measurements
•True Peak - Use to detect impacts and random transients. The dynamic
time signal contains the absolute value of the largest peak (positive or
negative) within a specified time window. Returns a magnitude value only.
If used with a spectrum measurement, Emonitor uses a Peak signal
detection type instead. This value is not calculated but is measured
directly.
•True Peak-Peak - Use to detect impacts and random transients. The
dynamic time signal contains the absolute value of the largest peak to peak
distance within a specified time window. Returns a magnitude value only.
If used with a spectrum measurement, Emonitor uses a Peak-Peak signal
detection type instead. This value is not calculated but is measured
directly.
Measurement Maximum Frequencies
The measurement maximum frequency is part of the collection specification
(Setup > Collection). See Figure on page 69
You select the collection specification when you set up the measurement
definition. Emonitor and the Enpac 2500 support the following maximum
frequencies in Hz (CPM).
.
Table 15 - Maximum Frequencies
Hz CPM Hz CPM Hz CPM Hz CPM Hz CPM
10 (600) 200 (12,000) 1100 (66,000) 3000 (180,000) 12,800* (768,000)*
20 (1200) 250 (15,000) 1200 (72,000) 3125* (187,500)* 13,000 (780,000)
25 (1500) 256* (15,360)* 1250 (75,000) 3200 (192,000) 15,000 (900,000)
32* (1920)* 300 (18,000) 1280* (76,800)* 4000 (240,000) 16,000 (960,000)
40 (2400) 320 (19,200) 1300 (78,000) 5000 (300,000) 18,000 (1,080,000
50 (3000) 400 (24,000) 1400 (84,000) 6000 (360,000) 20,000 (1,200,000)
64* (3840)* 500 (30,000) 1500 (90,000) 6250* (375,000)* 25,000 (1,500,000)
80 (4800) 600 (36,000) 1600 (96,000) 6400 (384,000) 30,000 (1,800,000)
100 (6000) 625 (37,500) 1700 (102,000) 7000 (420,000) 32,000* (1,920,000)*
120 (7200) 640* (38,400)* 1800 (108,000) 8000 (480,000) 40,000 (2,400,000)
125 (7500) 700 (42,000) 1900 (114,000) 9000 (540,000)
128* (7680)* 800 (48,000) 2000 (120,000) 10,000 (600,000)
150 (9000) 900 (54,000) 2500 (150,000) 12,000 (720,000)
160 (9600) 1000 (60,000) 2560* (153,600)* 12,500* (750,000)*
* These values are available in the Enpac 2500 only in off route data collection
You can either select a value from the drop down list, or you can enter a value in
Maximum frequency in the Collection Specification dialog. If you enter a value
that does not match one of the values above, Emonitor uses the next higher
maximum frequency.
72 Rockwell Automation Publication GMSI10-UM002D-EN-E - August 2012
Page 73

Setting Up Measurements Chapter 2
time samples spectral lines 2.56=
Fmax (Hz)
Fmax (CPM)
60
-------------------------------
=
Measurement Resolution
The measurement resolution is part of the collection specification (Setup >
Collection). See
collection specification when you set up the measurement definition.
Emonitor and the Enpac 2500 support the following resolutions.
Table 16 - Measurement Resolutions
Spectral Lines Time Samples
100 256
200 512
400 1024
800 2048
1600 4096
3200 8192
6400 16,384
12,800 32,768
Setting Up Collection Specifications on page 69. You select the
The values that appear in the Number of lines drop down list in the Collection
Specification dialog are those for spectrum measurements. Emonitor uses the
corresponding number of time samples from the table above for time
measurement definition.
You can calculate the number of time samples from the number of spectral lines
using the following formula.
You can calculate the total time required to collect a time waveform measurement
from the Number of lines value and the Maximum frequency value in the
Collection Specification dialog (Setup > Collections).
If your Maximum frequency is specified in CPM, convert CPM to Hertz using
the following formula.
Rockwell Automation Publication GMSI10-UM002D-EN-E - August 2012 73
Page 74

Chapter 2 Setting Up Measurements
EXAMPLE
collection time
spectral lines
Fmax (Hz)
-------------------------------
=
7200 CPM
60
--------------------------
120 Hz=
400 lines
120 Hz
---------------------
3.3 seconds=
Next, find the total collection time for the time waveform measurement using
this formula.
If you had a Maximum frequency value of 7200 CPM and a Number of
lines value of 400, you would:
ATTENTION: 1. Convert CPM to Hz.
ATTENTION: 2. Find the total collection time.
Number and Type of Averages
The number and type of averages are part of the collection specification (Setup >
Collection). You select the collection specification when you set up the
measurement definition. See
Emonitor and the Enpac 2500 support the following number and types of
averages for data collection.
•Linear - Up to 4096 averages.
•Time Synchronous - Up to 255 averages, and requires a trigger.
•Exponential - Up to 99 averages. Uses exponential weighting. Use for
measurements on a continuous signal that may be slowly varying. Also use
to obtain a uniform statistical error over all frequencies.
•Peak Hold - Up to 99 averages. Holds the highest measured value in each
bin (line).
Averaging is useful for reducing random errors. Random errors include
background vibration due to some source other than the machine being
measured. If you collect more averages, you have fewer random errors. However,
collecting more averages requires more time.
Overlap processing (Percent overlap) speeds up the averaging process. The
overlap amount determines how much of the time samples are overlapped for
successive averages. The greater the overlap, the faster the sample can be collected.
The disadvantage is that the greater the overlap, the less new data there is, and the
greater the influence of random errors.
Setting Up Collection Specifications on page 69.
74 Rockwell Automation Publication GMSI10-UM002D-EN-E - August 2012
Page 75

Setting Up Measurements Chapter 2
Orders Track
Order Normalization for Orders Track Spectrum
There are two requirements for implementing Orders Track measurements. The
Fmax value must fall within the range of 10…5000 Hz, and the machine speed
may not vary by more than 10% during the measurement collection. For example,
if you set up a machine that runs at 3500 RPM for an Fmax of 100 Orders, the
measurement will not work because the required Fmax is 15,000 Hz.
To Set Up Orders Track FFT Collection
The Enpac supports the specification and collection of a spectrum with an Fmax
defined in terms of number of orders for a varying machine speed. For Orders
Track data collection, you are required to use a trigger to continually determine
machine speed.
With orders tracking, the sampling rate is not fixed during the collection period.
Instead, the time spacing between the samples may be constantly varying so that a
fixed number of samples per shaft revolution is collected. The x-axis of the time
waveform is no longer measured in seconds, but instead it is measured in degrees
or shaft position. From this, the corresponding spectral information is no longer
measured in Hz or CPM, but instead it is measured in orders. Orders tracking
removes all non-synchronous frequencies from the spectrum.
To set up route points using Orders Track collection, follow these steps.
1. Create a collection specification in Emonitor that uses Orders for the
maximum frequency (Fmax). Also, check the Order Normalization
checkbox to signify Orders Track to the Enpac.
2. Create a Spectrum measurement definition that uses the Orders Based
collection specification.
3. Tag that measurement and load it to the Enpac with a list.
Rockwell Automation Publication GMSI10-UM002D-EN-E - August 2012 75
Page 76

Chapter 2 Setting Up Measurements
For Orders Track data collection, you are required to use a trigger to continually
determine machine speed.
Orders tracking analysis can be used effectively to diagnose the vibrations of
variable speed machines. The orders tracking yields data in the revolution
domain, not the time domain. In an orders spectrum, signals that are periodic in
the revolution domain appear as peaks and orders or harmonic components
remain fixed in their position through speed changes. This is a clear advantage
when comparing the characteristics of variable speed machines over a period of
time.
Using Frequency Items for the Diagnostic Frequency Cursor
Using the Enpac 2500, you set up frequency items in Emonitor and download
them to the Enpac. Then, you can review the data using the Diagnostic
Frequencies cursor. This feature allows you to diagnose the peaks you see in the
Enpac using the frequency items from the host software.
In order to load the Diagnostic Frequency labels, you must check the Load
Frequency Labels checkbox in the Load Options dialog.
Setting Up Speed References
The Enpac can determine the speed using speed references in Emonitor. The
speed reference value is used by the frequency items to calculate the Fmax of the
dependent measurements.
To set up speed references in Emonitor, double-click in the RPM column in the
Location pane. The following dialog appears.
76 Rockwell Automation Publication GMSI10-UM002D-EN-E - August 2012
Page 77

Setting Up Measurements Chapter 2
TIP
These options are not supported in the
Enpac 2500.
You can choose a frequency reference item as your machine speed reference. This
allows for machine speeds to be stored and retrieved dynamically. The Enpac
supports two types of frequency types: speed reference and linear rotational.
If you want to use a collected measurement from the Enpac to set the machine
speed, you have two options.
• Use a manual entry process measurement to enter machine speed by
reading it from any instrument in your plant. The measurement can then
be referenced for the machine speed, and would be updated every time you
unload that measurement.
• Use a measurement with Order normalization checked in the collection
specification. The machine speed from an internal or external tachometer
will be used for the machine speed. If the Order normalization checkbox is
not checked, the Enpac will use a fixed Fmax value and will not calculate
the Fmax based on the current speed of the machine.
The Orders normalization checkbox does not produce Orders
Tracking measurements when used with speed references.
Emonitor orders all the measurements in the route so that the dependent
machine speed measurement is collected first. This way, the route is set up for the
most accurate machine speed entry, and the measurements refer to the correct
machine speed. The band alarms and frequency labels adjust to changes in the
machines speed.
To set up the Speed Reference Frequency for the Enpac, double-click in the
Definition column in the Speed Reference row in the Frequency Item pane. The
Speed Reference Frequency dialog appears.
Rockwell Automation Publication GMSI10-UM002D-EN-E - August 2012 77
Page 78

Chapter 2 Setting Up Measurements
There are three ways to obtain a speed references.
• You can enter a constant for the speed.
• You can use the value in the Machine Speed column for a location on an
item in the Hierarchy Tree.
• You can use the value from a process measurement as the speed.
Press F1 to find out more information about each option in the Speed Reference
Frequency dialog .
You can set up the Linear to Rotational Frequency by double-clicking the
Definition column in the Linear to Rotational row in the Frequency Item pane.
This dialog allows you to set up a rotational frequency item based on a linear
speed. .
Setting Up Measurement Definitions
Press F1 to find out more information about each option in this dialog.
The topics in this section describe setting up different types of measurement
definitions in Emonitor for your data collector. The topics describe the way
Emonitor works with the Enpac 2500 for each different type of measurement
definition. These include answers to questions such as:
• How does Emonitor handle measurement units and alarms available in
Emonitor but not supported in the Enpac 2500?
• How many orders of magnitude and phase can the Enpac 2500 collect?
• How does the Enpac 2500 support collecting a spectrum when a
magnitude measurement is in alarm?
Emonitor combines measurement definitions when it creates a load file from a
list of measurement definitions. For example, Emonitor can combine the
measurement definitions at a location so that the data collector collects all the
measurements at one time. This makes data collection faster and more efficient
since you do not have to start each measurement individually. For more general
information on setting up measurement definitions, see the Emonitor online
help.
78 Rockwell Automation Publication GMSI10-UM002D-EN-E - August 2012
Page 79

Setting Up Measurements Chapter 2
Magnitude Measurement Definitions
Emonitor and the Enpac 2500 support magnitude measurement definitions.
This topic lists the unique characteristics of the Enpac 2500 that you may need to
know when setting up and collecting magnitude data.
Measurement Units Not Supported in the Enpac 2500 Data Collector
• Magnitude measurement definitions with unit not supported by the
Enpac 2500 map to units of USER (eus) in the data collector. This results
in a process (DC) voltage measurement.
• For a list of supported measurement units, see
page 68.
Magnitude Alarms in the Enpac 2500 Data Collector
• The Enpac 2500 supports above, below, in window, and out of window
magnitude alarms.
• You must set Trigger to Yes for any magnitude alarms you want to appear
in the Enpac 2500 during data collection.
• For more on how Emonitor combines alarms before sending them to the
Enpac 2500, see Alarms and the Data Collector
Measurement Units on
on page 95.
Collecting Magnitude Measurements in Multiple Frequency Bands
You can set up multiple measurement definitions at a location to collect
magnitude values for individual frequency bands. Use band filters to define the
different frequency bands in the measurement definitions.
Make sure you select None in the Band Filter dialog. This forces the Enpac 2500
to collect a spectrum measurement. After you unload the measurement,
Emonitor calculates the magnitude values in the bands from the spectrum.
If your measurements include both magnitude and phase, the Enpac 2500 can
collect up to eight orders. If your measurements include magnitude only, the
Enpac 2500 can collect up to 200 orders.
Proximity Probe Measurements
• Proximity probes measure the movement of a shaft within a bearing.
• You usually make two types of proximity probe measurements with
magnitude measurement definitions. The dynamic or AC component
indicates the changing (dynamic) distance between the probe and bearing
shaft. The static or DC component indicates the average distance between
the probe and the shaft. This is also referred to as the DC gap.
Dynamic (AC) component
• Set up a displacement transducer in the Transducer Calibration dialog
with Input type set to AC Coupled and Units set mils or um. Make sure
you enter the Calibration value that converts the voltage to a
displacement.
Rockwell Automation Publication GMSI10-UM002D-EN-E - August 2012 79
Page 80

Chapter 2 Setting Up Measurements
• Set up a Collection Specification with Transducer set to the AC
displacement and Signal detection set to Peak-peak.
• Finish setting up the dynamic proximity probe measurement by setting
Data Type to Magnitude and Units to mils or um. You can use a Filter if
desired.
Static (DC) component or gap
• Set up a displacement transducer in the Transducer Calibration dialog
with Input type set to ‘DC Coupled’ and Units set to mils or um. Make
sure you enter the Calibration value that converts the voltage to a
displacement. If you are using the DC Input Module to remove the AC
component and attenuate the signal be a factor of 2.5, then you must
divide your transducers calibration by 2.5.
• Set up a Collection Specification with Transducer set to the DC
displacement and Signal detection set to ‘RMS.’
• Finish setting up the dynamic proximity probe measurement by setting
Data Type to ‘Magnitude and Units to mils or um.’ You must set the
Filter to ‘None’ since any type of high pass filtering removes the DC
component.
Typical Magnitude Measurement Definitions
This figure shows the setup for a typical magnitude measurement definition
Figure 13 - Magnitude Measurement Definition
This table shows the STD (Hz) 2000 collection specification.
Table 17 - Collection Specification for Magnitude Measurement Definition
Transducer Window Signal Detection Fmax Lines Phase Order Norm? Averages
Accelerometer Hanning Peak 2 kHz 400 No No 4 linear
This table shows the transducer specification in the STD (Hz) 2000 collection
specification.
Table 18 - Transducer Specification in STD (Hz) 2000 Collection Specification
Name Base Unit Input Type UnitsCalibration ValueDC Offset
Accelerometer acceleration ICP Accel g 100 0
This figure shows the setup for a typical set of measurement definitions with
multiple frequency bands. Note that the filter specifications used in the tables are
not currently defined in the Emonitor database. To define a new filter
specification, choose Setup > Band Filters and click New.
80 Rockwell Automation Publication GMSI10-UM002D-EN-E - August 2012
Page 81

Setting Up Measurements Chapter 2
Figure 14 - Magnitude with Multiple Frequency Bands Measurement Definitions
The filter specifications are shown in the table below:
Table 19 - Filter Specifications for Magnitude with Multiple Frequencies
Name Low Cutoff High Cutoff Data collector filter type
0.8-1.2 Order 0.8 Orders 1.2 Orders None
1.2-3.5 Order 1.2 Orders 3.5 Orders None
3.5-8.5 Order 3.5 Orders 8.5 Orders None
8.5-50% Fmax 8.5 Orders 50% Max Freq None
50%-100% Fmax 50% Max Freq 100% Max Freq None
0.8-100% Fmax 0.8 Orders 100% Max Freq None
Magnitude and Phase Measurements at Orders
Emonitor and the Enpac support collecting the magnitude and phase at orders.
This topic describes the steps to set up measurement definitions to collect
magnitude and phase with the Enpac. There are several things you may need to
know about collecting magnitude and phase at orders.
• You must select Also collect phase data in the collection specification to
collect phase.
• You must select Analog when you define orders filters. The Enpac
automatically uses its internal order filters if you are collecting phase. If you
are collecting only magnitude values and you do not select this option, the
Enpac collects a spectrum and Emonitor calculates the magnitudes after
unloading.
• When collecting magnitude and phase at orders, the Enpac always collects
a spectrum measurement, and then calculates the magnitude and phase
values from the spectrum.
• The Enpac can collect phase only at the first through eighth orders.
• The Enpac can collect magnitude only at the first through the eighth
orders. If you request additional orders, Emonitor calculates magnitude
values at additional orders from the spectrum after unloading the data.
• The Enpac may collect more orders than requested, but it does not collect
fewer than requested. Only the requested values are unloaded into
Emonitor.
• The Enpac may display a phase value that differs from the value that
appears in Emonitor by up to one degree.
Rockwell Automation Publication GMSI10-UM002D-EN-E - August 2012 81
Page 82

Chapter 2 Setting Up Measurements
IMPORTANT
• Phase and magnitude measurements at orders require a trigger signal. This
can be from the internal laser tachometer or from an external trigger source
such as a key phasor.
To Set Up Multiple Measurement Definitions for Magnitude and Phase
You create only one measurement definition for magnitude and phase at each
order. The Also collect phase data checkbox in the Collection Specification
dialog determines whether you also want to collect phase as well as magnitude
data.
1. Create a new measurement definition by selecting Magnitude in the Data
Type column in the Measurement Definition pane.
2. Select the units for the measurement definition, using a dynamic unit such
as g, m/s2, ips, mm/s, mils, um, or V.
3. Select the measurement filter. To collect the magnitude and phase at an
order, select a band filter centered on the order. For example, select (create
if necessary) a first order band filter with a Low cutoff of 0.8 Orders, and a
High cutoff of 1.2 Orders.
Refer to
Measurement Filters on page 63 for details and the examples on
the following pages.
It is very important that order band filters be centered on the order. For
example, 0.7…1.3 orders, 0.8…1.2 orders, 0.9…1.1 orders. If you do not
center the band filters, magnitude and phase readings may not be accurate.
4. Select the collection specification. You must check the Also collect phase
data checkbox in the Collection Specification dialog so the data collector
collects phase at orders.
5. Select the storage specification. The first measurement definition is now
complete.
6. If you want to create more than one measurement, copy the measurement
definition by selecting the correct row and choosing Edit > Copy.
7. Move down to the next empty row in the measurement definition
spreadsheet, and choose Edit > Paste to paste the copied measurement
definition.
8. Edit the new measurement definition by changing the measurement filter.
Select a band filter centered on the next order.
9. Repeat steps 6 and 7 to create measurement definitions for the desired
orders. You can then include these measurement definitions in a list and
load it to the data collector. Remember that you must have a trigger signal
to collect magnitude and phase at an order.
82 Rockwell Automation Publication GMSI10-UM002D-EN-E - August 2012
Page 83

Setting Up Measurements Chapter 2
Typical Magnitude and Phase Measurement Definitions
this is what the Measurement Definition pane for one through four orders might
look like. All measurement definitions have the same units and collection
specification.
Figure 15 - Magnitude and Phase Measurement Definitions
The following table shows the collection specification for Mag & Phase.
Table 20 - Collection Specification for Mag & Phase Measurement Definitions
Transducer Window Signal Detection Fmax Lines Phase Order Norm? Averages
Accelerometer Hanning Peak 500 Hz 400 Yes Yes 4 linear
The transducer specification in the Mag & Phase collection specification is
shown in the table below.
Table 21 - Transducer Specification in Mag & Phase Collection Specification
Name Base Unit Input Type Units Calibration Value DC Offset
Accelerometer Acceleration ICP Accel g 100 0
The filter specifications are shown in the table below.
Table 22 - Filter Specifications in Mag & Phase Measurement Definitions
Name Low Cutoff High Cutoff Data Collector Filter Type
1st Order 0.8 Orders 1.2 Orders None
2nd Order 1.8 Orders 2.2 Orders None
3rd Order 2.8 Orders 3.2 Orders None
4th Order 3.8 Orders 4.2 Orders None
Rockwell Automation Publication GMSI10-UM002D-EN-E - August 2012 83
Page 84

Chapter 2 Setting Up Measurements
Numeric (process) Measurement Definitions
Emonitor and the Enpac 2500 support numeric measurement definitions. This
topic lists the unique characteristics of the Enpac 2500 that you may need to
know when setting up and collecting numeric data.
Measurements Units Not Supported in the Enpac 2500 Data Collector
• You can make a numeric measurement definition for any available
measurement unit by setting Data Type to ‘Numeric.’
• Numeric measurement definitions with Input type set to ‘DC Coupled’
with units not supported by the Enpac 2500 map to units of USER (eus).
The input type is part of the transducer specification that you select for the
collection specification. This results in a process (DC) voltage
measurement in the Enpac 2500.
• For a list of support measurement units, see Measurement Units
page 68.
Full Scale Values for Numeric Measurements in the Enpac 2500 Data Collector
• The full scale value in the Enpac 2500 for a numeric measurement is
defined as ten times the value of the alarm or the baseline measurement.
• If no alarm or baseline measurement exists for the measurement in the data
collector, the Enpac 2500 assumes a full scale value of 10,000.
• A full scale value of 10,000 can be a problem if you want to enter a very
large or very small value for the numeric measurement. For example, you
can not enter a value greater than the full scale value. If you enter a value
that is very small compared to the full scale, the Enpac 2500 may round the
value off. If you enter 0.01 with a full scale value of 10,000, the Enpac 2500
stores it as a 0 (zero).
on
Temperature Measurements
• Set up a temperature measurement definition by setting Data Type to
‘Numeric’ and Units to ‘RPM,’ ‘CPM,’ or ‘deg. C.’
• Set up the temperature transducer in the Transducer Calibration dialog
with Input type set to ‘DC Coupled‘ and Units set to ‘deg. F’ or ‘deg. C.’
Make sure you enter the Calibration value that converts the voltage to a
temperature.
• Set up the collection specification to include a Signal detection of ‘RMS.’
84 Rockwell Automation Publication GMSI10-UM002D-EN-E - August 2012
Page 85

Setting Up Measurements Chapter 2
Machine Speed (RPM) Measurements
• Set up a tachometer measurement definition by setting Data Type to
‘Numeric’ and Units to ‘RPM,’ ‘CPM,’ or ‘Hz.’
• Set up the tachometer transducer in the Transducer Calibration dialog
with Input type set to ‘ICP Accel’ for either the internal laser tachometer
or an external TTL device (such as entach laser sensor, an optical trig ger, or
a strobe light with TTL output). Set the Input type to ‘AC Coupled’ or
‘DC Coupled’ if your speed sensor has an AC or DC voltage signal
proportional to speed. Set Units to ‘RPM,’ ‘CPM,’ or ‘Hz.’ Make sure you
enter the Calibration value that converts the voltage to speed.
• Set up a Collection Specification with Transducer set to the tachometer
transducer you set up above, Window set to ‘Rectangular,‘ and Signal
detection set to ‘None.’ Do not fill in any fields in the Resolution area or
the Averaging area of the dialog.
• Connect the speed sensor to the trigger connector on the Enpac 2500
when collecting data.
Magnitude Alarms in the Enpac 2500 Data Collector
You can use magnitude alarms with numeric measurements.
• The Enpac 2500 supports above, below, in window, and out of window
magnitude alarms with numeric measurements.
• You must set Trigger to ‘Yes’ for any alarms you want to appear in the
Enpac 2500 during data collection.
• For more on how Emonitor combines alarms before sending them to the
Enpac 2500, see
Alarms and the Data Collector on page 95.
Typical Numeric Measurement Definitions
This figure shows the setup for typical numeric measurement definitions. The
first two measurements are numeric (DC) voltage measurements, and the third is
a numeric manual entry measurement.
Figure 16 - Numeric Measurement Definitions
The collection specifications appear in the table below. N/A means not applied.
Table 23 - Collection Specifications for Numeric Measurement Definitions
Transducer Window Signal Detection Fmax Lines Phase Order Norm? Averages
Temperature N/A RMS N/A N/A No No N/A
Tachometer N/A None N/A N/A No No N/A
Manual Entry N/A None N/A N/A No No N/A
Rockwell Automation Publication GMSI10-UM002D-EN-E - August 2012 85
Page 86

Chapter 2 Setting Up Measurements
The following table shows the transducer specifications in the collection
specifications
Table 24 - Transducer Specifications in Numeric Collection Specifications
Name Base Unit Input Type Units Calibration Value
Temperature Temperature DC Coupled deg. F See note below. 0
Tachometer Frequency DC Coupled RPM See note below. 0
Manual Entry None Manual Entry None See note below. 0
(1) Make sure you enter the Calibration value that converts the voltage to a known unit such as speed.
.
(1)
DC Offset
Spectrum Measurement Definitions
Emonitor and the Enpac 2500 support spectrum measurement definitions. This
topic lists the unique characteristics of the Enpac 2500 that you may need to
know when setting up and collecting spectrum data.
• The Enpac cannot collect phase with a spectrum measurement definition.
In other words, do NOT check the Also collect phase data checkbox in the
Collection Specification dialog.
• You can choose to have the Enpac 2500 collect a spectrum only if a
magnitude measurement at the same location is in alarm. Set the Collect
and store condition in the Edit Storage Specification dialog to ‘On
Magnitude Alarm’ for the storage specification for the spectrum
measurement definition.
Time Synchronous Averaging in the Enpac 2500 Data Collector
• Time synchronous averaging cancels out the effects of signals not related
to the synchronizing trigger. Time synchronous mechanical effects include
imbalance, misalignment, eccentricity of bent shafts, blade passing, and
gear meshing.
• Time synchronous averaging requires the internal laser tachometer or
external trigger.
• Set up a Collection Specification with the averaging Type set to ‘Time
Synchronous’ and enter the Number of averages. Use a large number of
averages (such as 20 or 30) to get the desired reduction in nonsynchronous effects.
For more on supported averaging in the Enpac 2500, see
Typ e of Avera ges on page 74.
Number and
86 Rockwell Automation Publication GMSI10-UM002D-EN-E - August 2012
Page 87

Setting Up Measurements Chapter 2
Order Normalized Spectra in the Enpac 2500 Data Collector
• Order normalized spectrum measurements have a frequency axis based on
multiples of the running speed (orders). This quickly identifies the
frequency relationship between each measured vibration amplitude and
the running speed of the machine. It is particularly useful on variable speed
machinery.
• An order normalized spectrum measurement requires a trigger input to the
Enpac 2500.
• Set up a Collection Specification with Window set to ‘Hanning.’ Select
the Maximum frequency in ‘Orders,’ and make sure to select the Order
normalization option. The Averaging can be either ‘linear’ or ‘time
synchronous,’ but should include at least four averages.
• The Enpac 2500 may collect more orders than required. For example, if
you set the Maximum frequency to ‘10 Orders,’ the Enpac 2500 may
collect more than ten orders. The Enpac 2500 always collects at least the
number of orders you request in the Collection Specification.
• The Enpac 2500 displays an order normalized spectrum. If the Collection
Specification dialog has the Also collect phase data checkbox checked, and
if the Maximum frequency is eight orders or less, the table on the Enpac
2500 screen shows the magnitude and phase values at each order. If the
Collection Specification dialog does not have the Also collect phase data
checkbox checked, or if the Maximum frequency is more than eight orders,
the table on the Enpac 2500 screen shows magnitude values only. The
Enpac 2500 displays a maximum of eight orders in the table.
If the table has eight orders or less, the Enpac 2500 arrow keys move the
spectrum cursor. If the table has more than eight orders, the Enpac 2500
arrow keys scroll the table values.
Proximity Probe Measurements
• Proximity probes measure the position and motion of a shaft within a
bearing.
• You can use a spectrum measurement definition to measure the dynamic or
AC component of a proximity probe measurement. This indicates the
motion of the shaft within the bearing at each frequency.
• Set up a displacement transducer in the Transducer Calibration dialog
with Input type set to ‘AC Coupled’ and Units set to ‘mils’ or ‘um.’ Make
sure you enter the Calibration value that converts the voltage to a
displacement.
• Set up the Collection Specification to include the displacement
Transducer, and set the Signal detection to ‘Peak-Peak.’ You also need to
select the window, frequency range, and averaging options.
• Finish setting up the dynamic proximity probe measurement by setting
Data Type to ‘Magnitude’ and Units to ‘mils’ or ‘um.’ You can use a Filter if
desired, but make sure it does not interfere with the frequency of interest.
Rockwell Automation Publication GMSI10-UM002D-EN-E - August 2012 87
Page 88

Chapter 2 Setting Up Measurements
Spectrum Alarms in the Enpac 2500 Data Collector
The Enpac 2500 supports band alarms with up to ten bands.
• You can have the data collector collect a spectrum measurement if a
magnitude alarm is in alarm. Set the Collect and store condition in the
Edit Storage Specification dialog to ‘On Magnitude Alarm’ for the storage
specification for the spectrum measurement definition.
• You must set Trigger to ‘Yes’ for any alarms you want to appear in the
Enpac 2500 during data collection. If you set Trigger to ‘Yes’ for two or
more alarms for the same measurement definition, Emonitor combines the
alarms before sending the combined alarm to the Enpac 2500.
For more on how Emonitor combines alarms before sending them to the
Enpac 2500, see
The Enpac does not support spectrum alarms. You can still set up the alarms for
the spectrum measurement definitions. Emonitor tests the data against the
alarms after you unload the data.
Alarms and the Data Collector on page 95.
Typical Spectrum Measurement Definitions
This figure shows the setup for typical spectrum measurement definitions. The
first is a standard spectrum, the second is an order normalized spectrum, and the
third is a time synchronous spectrum.
Figure 17 - Spectrum Measurement Definitions
The following table shows the collection specifications (in the same order as the
measurement definition table above).
Table 25 - Collection Specifications for Spectrum Measurement Definitions
Transducer Window Signal Detection Fmax Lines Phase Order Norm? Averages
Accelerometer Hanning Peak 2 kHz 400 No No 4 linear
Accelerometer Hanning Peak 10 orders 400 No Yes 4 linear
Accelerometer Hanning Peak 2 kHz 400 No No 4 time synch.
The following table shows the transducer specification in the collection
specifications.
Table 26 - Transducer Specification in Spectrum Collection Specifications
Name Base Unit Input Type Units Calibration Value DC Offset
Accelerometer Acceleration ICP Accel g 100 0
88 Rockwell Automation Publication GMSI10-UM002D-EN-E - August 2012
Page 89

Setting Up Measurements Chapter 2
time samples spectral lines 2.56=
Fmax (Hz)
Fmax (CPM)
60
-------------------------------
=
Time Waveform Measurement Definitions
Emonitor and the Enpac support time waveform measurement definitions. This
topic lists the unique characteristics of the Enpac that you may need to know
when setting up and collecting time waveform data.
• The Enpac 2500 cannot collect phase with time waveform measurement
definitions.
• You can choose to have the Enpac collect a time waveform only if a
magnitude measurement at the same location is in alarm. Set the Collect
and store condition in the Edit Storage Specification dialog to ‘On
Magnitude Alarm’ for the storage specification for the time waveform
measurement definition.
• The Enpac supports integrated time waveform measurements (single
integration). This means you can collect a time waveform with velocity
units using an accelerometer or displacement units using a velocity
transducer.
• The length of the time waveform depends on the maximum frequency you
select in the collection specification.
• You can calculate the number of time samples from the number of spectral
lines (Collection Specification dialog) using this formula.
You can calculate the total time required to collect a time waveform
measurement from the Number of lines value and the Maximum
frequency value in the Collection Specification dialog (Setup > Collection
Specification).
If your Maximum frequency is specified in CPM, convert CPM to Hertz
using this formula.
Rockwell Automation Publication GMSI10-UM002D-EN-E - August 2012 89
Page 90

Chapter 2 Setting Up Measurements
EXAMPLE
collection time
spectral lines
Fmax (Hz)
-------------------------------
=
7200 CPM
60
--------------------------
120 Hz=
400 lines
120 Hz
---------------------
3.3 seconds=
Next, find the total collection time for the time waveform measurement
using this formula.
If you had a Maximum frequency value of 7200 CPM and a Number of lines
value of 400, you would:
ATTENTION: 1. Convert CPM to Hz.
ATTENTION: 2. Find the total collection time.
Time Synchronous Averaging in the Enpac 2500 Data Collector
• Time synchronous averaging cancels out the effects of signals not related
to the synchronizing trigger. Time synchronous mechanical effects include
imbalance, misalignment, eccentricity of bent shafts, blade passing, and
gear meshing.
• Time synchronous averaging requires the internal laser tachometer or an
external trigger input to the Enpac 2500.
• Set up a collection specification with the averaging Type set to ‘Time
Synchronous’ and enter the Number of averages. Use a large number of
averages (such as 20 or 30) to get the desired reduction in nonsynchronous effects.
For more on supported averaging in the Enpac, see
Number and Type of
Ave ra ge s on page 74.
Typical Time Waveform Measurement Definitions
This figure shows the setup for a typical time waveform measurement definition.
Figure 18 - Time Waveform Measurement Definitions
90 Rockwell Automation Publication GMSI10-UM002D-EN-E - August 2012
Page 91

Setting Up Measurements Chapter 2
The following table shows the collection specification.
Table 27 - Collection Specification for Time Waveform Measurement Definition
Transducer Window Signal Detection Fmax Lines Phase Order Norm? Averages
Accelerometer Hanning Peak 2 kHz 400 No No 1 linear
The following table shows the
transducer specification in the collection
specification.
Table 28 - Transducer Specification in Time Waveform Collection Specification
Name Base Unit Input Type Units Calibration Value DC O ffset
Accelerometer Acceleration ICP Accel g 100 0
Rockwell Automation Publication GMSI10-UM002D-EN-E - August 2012 91
Page 92

Chapter 2 Setting Up Measurements
TIP
Voltage Measurement Definitions
Emonitor and the Enpac support measurement definitions with units of volts
(AC or DC). You can collect several different types of voltage measurements.
This topic shows the typical measurement definition setup for three voltage
measurements.
Voltage is similar to other units in that you can collect magnitude, numeric,
spectrum, and time waveform voltage measurements.
Typical Voltage Measurement Definitions
This figure shows the setup for three typical voltage measurement definitions.
Figure 19 - Voltage Measurement Definitions
The following table shows the collection specifications.
Table 29 - Collection Specifications for Voltage Measurement Definition
Transducer Window Signal Detection Fmax Lines Phase Order Norm? Averages
Voltage Hanning RMS 2 kHz 400 No No 4 linear
Voltage DC Rec tangular None 2 kHz 400 No No 4 linear
The `Voltage‘ transducer is for Volts AC. The `Voltage DC‘ transducer is for
Volts DC.
The following table shows the transducer specifications in the collection
specifications.
Table 30 - Transducer Specifications in Voltage Collection Specification
Name Base Unit Input Type Units Calibration Value DC Offset
Voltage Voltage AC Coupled V 1000 0
Voltage DC Voltage DC Coupled Vdc 1000 0
92 Rockwell Automation Publication GMSI10-UM002D-EN-E - August 2012
Page 93

Setting Up Measurements Chapter 2
Combining Measurement Definitions for a Location
You can use Emonitor to set up many different measurement definitions for data
collection at a location. These can include magnitude, spectrum, time waveform,
and numeric measurements. You can then select the measurement definitions you
want to load to the data collector by creating a list of those measurement
definitions. When you want to load the data collector, Emonitor builds a load file
containing the measurement definitions in the list.
Emonitor combines measurement definitions at each location to make data
collection more efficient. This allows you to collect two or more measurements
automatically, without having to start each measurement separately. The rules for
combining measurement definitions depend on several factors. In general,
however, Emonitor can combine measurement definitions at the same location
when they have the same:
• Measurement units (part of the measurement definition)
• Measurement filter (part of the measurement definition)
• Transducer calibration and input type (from the transducer specification
used in the measurement definitions collection specification)
In addition, there are some specialized cases that allow or prevent Emonitor from
combining measurement definitions from the same location when they meet the
above conditions.
• In general, Emonitor cannot combine a magnitude and a spectrum
measurement if they have different measurement filters.
• Emonitor can combine an envelope acceleration magnitude measurement
with a spectrum with the same units.
• Emonitor can combine a non-filtered measurement definition with a high
pass, low pass, or band filtered measurement when the band filter is
applied by Emonitor after the spectrum is unloaded.
• Emonitor can combine two signatures if they are the same type (time, fixed
frequency spectrum, order normalized spectrum) and the same resolution.
Rockwell Automation Publication GMSI10-UM002D-EN-E - August 2012 93
Page 94

Chapter 2 Setting Up Measurements
TIP
Setting Up Tri-axial Measurements
You can set up and collect tri-axial measurements with the Enpac 2500 if you
have a tri-axial transducer and a special tri-axial cable for your Enpac. This allows
you to collect measurements in three directions without moving the transducer.
Tri-axial measurements require setting up separate locations, and measurement
definitions for each of the three transducers. This section shows the method for
setting up these measurements.
To Set Up Tri-axial Locations and Measurement Definitions
You must set up a different location for each axis of a tri-axial transducer.
The tri-axial data is multiplexed one direction at a time.
1. Open the Database window by choosing Window > Database.
2. Select the Measurement view and click OK.
3. Select the machine in the Hierarchy Tree for which you want to set up tri-
axial measurements.
4. In the Location pane, choose View > Pane Options to add the Lo. Channel
column to the Location pane. Press F1 in the Pane Options dialog for
assistance.
5. Create a Location for the first tri-axial measurement and set Lo. Channel
to ‘1X.’
6. In the Measurement Definition pane, create the measurement definition
for that location.
7. Select the location you just created. Choose Edit > Copy to copy the
location.
8. Move to an empty row in the Location pane and choose Edit > Paste to
paste the location into the spreadsheet.
9. Edit the new location to change the Direction and set Lo. Channel to ‘1Y.’
10. Repeat steps 7 and 8 to copy and paste the third location into the Location
pane. Edit the new location to change the Direction and set Lo. Channel
to ‘1Z.’
The Location ID and Position must be the same for all three tri-axial
measurements.
11. Now include these measurement definitions in a list. You can create a new
list or recall the current list.
The locations must be tagged in order to create a group list.
12. Add the three locations to a group list by double-clicking the Group
column in the Location pane. The current group number appears in the
Group column. Make sure you assign the locations to the same group
number. The group is then loaded with the list to the Enpac 2500.
94 Rockwell Automation Publication GMSI10-UM002D-EN-E - August 2012
Page 95

Setting Up Measurements Chapter 2
This figure shows the typical measurement location setup for tri-axial
measurements.
Figure 20 - Tri-axial Measurement Location Setup
Setting Up Alarms, Lists, and Inspection Codes
This section describes the way Emonitor loads alarms, lists, and inspection codes
into the Enpac 2500. For more information on alarms, lists, and inspection codes,
see the Emonitor online help.
Alarms and the Data Collector
Emonitor and the Enpac 2500 support loading alarms with the list of
measurement definitions to the data collector.
Selecting Alarms to Load to the Enpac 2500 Data Collector
• If you want to load an alarm to the data collector with a measurement
definition, you must set Trigger to ‘Yes‘ in the Alarm spreadsheet in
Emonitor.
• If you set Tr igge r to ‘Yes‘ for two or more alarms for the same
measurement definition, Emonitor combines them to make a single alarm.
Supported Alarms with the Enpac 2500 Data Collector
This list describes alarms the Enpac 2500 supports, alarms it does not support,
and substitutes for some of the unsupported alarms.
• The Enpac 2500 supports above, below, in window, and out of window
magnitude alarms for magnitude and numeric measurements.
• You cannot select a magnitude out of window alarm in Emonitor. You
must create one by combining an above and a below alarm for the same
measurement definition. Emonitor creates an out of window alarm when
it builds the load file if both alarms are active.
• The Enpac 2500 does not support spectrum (narrowband) alarms for
spectrum measurements. You can still set up spectrum alarms with
spectrum measurement definitions. Emonitor tests the measurements
against the alarms after you unload the data.
Rockwell Automation Publication GMSI10-UM002D-EN-E - August 2012 95
Page 96

Chapter 2 Setting Up Measurements
For unsupported alarms, Emonitor tests the measurements against the alarms
when you unload the data collector. This means that Emonitor always accurately
indicates when a measurement is in alarm, regardless of the number or complexity
of the alarm(s). This is true for all active alarms, regardless of their trigger status.
Lists and the Data Collector
Emonitor and the Enpac 2500 support loading lists of measurement definitions
to the data collector.
Inspection Codes and the Data Collector
Emonitor and the Enpac 2500 support loading inspection codes to the data
collector.
Inspection Code Support in the Enpac 2500 Data Collector
• You can load inspection codes into the Enpac 2500 only with a list.
• You can use only the inspection codes loaded with the list with
measurements in that list. This includes both measurements in a list and
unscheduled measurements associated with that list.
• You can load up to 100 inspection codes into the Enpac 2500. Emonitor
numbers the inspection codes from 1…100. The Enpac 2500 numbers the
inspection codes from 00…99.
• The Enpac 2500 displays the first 16 characters of each inspection code.
Loading Inspection Codes to the Enpac 2500 Data Collector
You can load and remove inspection codes.
• You must load the inspection codes when you load a list. You do this by
selecting Load inspection codes in the Load Options dialog . If you do not
select this option, no inspection codes are available for measurements from
the list or for unscheduled measurements associated with the list.
You can remove the inspection codes from the Enpac 2500 by initializing the data
collector.
96 Rockwell Automation Publication GMSI10-UM002D-EN-E - August 2012
Page 97

Chapter 3
IMPORTANT
Loading and Unloading
This chapter describes using the Enpac 2500 with Emonitor to load and unload
lists.
Top ic P age
Setting Up for Communication 97
Loading Lists to the Data Collector 106
Unloading Lists from the Data Collector 113
For more information about loading lists and the Load/Unload dialog, refer
to the Emonitor online help.
Setting Up for Communication
This section describes the steps to set up communication both in Emonitor and
in your data collector. The steps include:
• Selecting the computer communication options in Emonitor.
• Selecting the Enpac 2500 as the current data collector.
• Setting up the data collector to communicate with the computer.
• Installing ActiveSync to communicate through a USB port.
• Connecting the data collector and the computer.
Many of the steps are completed from the Load/Unload dialog (Figure 21
use the Set Up Collector button and the Set Up Computer button to set up the
Enpac 2500 and computer for communication.
). You
Rockwell Automation Publication GMSI10-UM002D-EN-E - August 2012 97
Page 98

Chapter 3 Loading and Unloading
Click to set
computer
communication
options.
Click to set data
collector
communication
options.
Figure 21 - Load/Unload Dialog Box
Set Up the Current Data Collector in Emonitor
You can have several active data collectors in Emonitor. However, you must select
one specific data collector before you load a list. The data collector you select is
called the current data collector. If you use several different models of data
collectors, you may need to select the current data collector before unloading and
loading. If you use only one model of data collector, you can select the current
data collector only once and not change it again.
An icon of the Enpac 2500 appears in the Set Up Collector button in the Load/
Unload dialog if it is the current data collector. If not, follow these steps to make
the Enpac 2500 the current data collector and select the correct communication
settings.
1. Choose Tools > Load/Unload. The Load/Unload dialog appears.
2. Click the large Set Up Collector button in the Load/Unload dialog. The
Set Up Data Collectors dialog appears.
98 Rockwell Automation Publication GMSI10-UM002D-EN-E - August 2012
Page 99

Loading and Unloading Chapter 3
TIP
IMPORTANT
3. The Current column shows the word ‘Yes’ for the current data collector.
To make the Enpac 2500 the current data collector, move to the Current
column for the Enpac 2500. Press Enter or double-click in the column to
change the word from ‘No’ to ‘Yes.’ The previously selected data collector
automatically changes to ‘No.’
4. Move to the Baud column in the Enpac 2500 row and set the Baud rate to
the same baud rate you select in the Enpac 2500.
Refer to
Set Up the Data Collector for Communication on page 102.
5. Move to the Protocol column and set the Protocol to ‘N81.’
6. Click Advanced if you want to change the data/route display and some of
the data collection characteristics of the Enpac 2500. You can also select a
different version of the data collector operating system.
The Data Collector Advanced Settings dialog appears.
See Data Collector Advanced Settings Parameters
on page 100 for a
description of the parameters.
You must log in with a Supervisor- or Administrator-level user name
and password to make any changes to these data collector settings.
Changing the configuration options for the data collector may prevent
Emonitor from communicating with the data collector, or may cause the
data collector to malfunction. Make sure you understand a configuration
option before you change it.
7. Click OK to close the Data Collector Advanced Settings dialog.
Rockwell Automation Publication GMSI10-UM002D-EN-E - August 2012 99
Page 100

Chapter 3 Loading and Unloading
8. Click OK when finished.
Use the descriptions in this table to help you configure the parameters in the
Advanced Settings dialog.
Table 31 - Data Collector Advanced Settings Parameters
Parameter Name Description Values/Comments
Operating System Sets the operating system version of the data collector.
2CHEnable Enables Emonitor to download measurements configured for 2-
channel collection.
Current Baud The baud rate for the serial communication. Recommend setting this to 115200.
Current Parity The combination of parity, data bits and stop bits. The first
letter in the setting is the parity: None, Even, Odd. The first
number is the number of data bits. The second number is the
number of stop bits. N81 stands for no parity, 8 data bits, and 1
stop bit.
Datapac Enumeration Configures the Enpac 2500 to collect data the same as the
dataPAC.
Direction The default direction to be used for off route measurements.
• 0 - None
• 1 - Horizontal
• 2 - Vertical
• 3 - Axial
Log Display Display plots in log format in the data collector. Options:
Machine Speed The default machine speed to use for off route measurements.
Options: Yes
No
The Enpac uses only N81.
Options: Yes
No
Options:
0
1
2
3
Yes
No
Phone Number Not Used
Position The default position label to use for off route measurements. 1 to 16 characters
Sync Trigger Level The amplitude level for externally triggering the measurement. This parameter is used when you set Trig Level to Fixed in
Sync Trigger Slope The input signal slope to be used for externally triggering the
measurement.
Sync Trigger Type Sets the trigger type. Options:
Trigger Range The maximum range (in Volts) that the trigger signal can
produce.
the Instrument Setup screen.
Refer to
Configure the Data Collection Options on page 42.
Options:
Posi tive
Negative
This parameter is used when you set Trig Level to Fixed in
the Instrument Setup screen.
Configure the Data Collection Options on page 42.
Refer to
TTL
External
100 Rockwell Automation Publication GMSI10-UM002D-EN-E - August 2012
 Loading...