

Page 1

User Manual
PowerMonitor 5000 Unit
Catalog Numbers 1426
Page 2
Important User Information
IMPORTANT
Read this document and the documents listed in the additional resources section about installation, configuration, and
operation of this equipment before you install, configure, operate, or maintain this product. Users are required to
familiarize themselves with installation and wiring instructions in addition to requirements of all applicable codes, laws,
and standards.
Activities including installation, adjustments, putting into service, use, assembly, disassembly, and maintenance are required
to be carried out by suitably trained personnel in accordance with applicable code of practice.
If this equipment is used in a manner not specified by the manufacturer, the protection provided by the equipment may be
impaired.
In no event will Rockwell Automation, Inc. be responsible or liable for indirect or consequential damages resulting from the
use or application of this equipment.
The examples and diagrams in this manual are included solely for illustrative purposes. Because of the many variables and
requirements associated with any particular installation, Rockwell Automation, Inc. cannot assume responsibility or
liability for actual use based on the examples and diagrams.
No patent liability is assumed by Rockwell Automation, Inc. with respect to use of information, circuits, equipment, or
software described in this manual.
Reproduction of the contents of this manual, in whole or in part, without written permission of Rockwell Automation,
Inc., is prohibited.
Throughout this manual, when necessary, we use notes to make you aware of safety considerations.
WARNING: Identifies information about practices or circumstances that can cause an explosion in a hazardous environment,
which may lead to personal injury or death, property damage, or economic loss.
ATTENTION: Identifies information about practices or circumstances that can lead to personal injury or death, property
damage, or economic loss. Attentions help you identify a hazard, avoid a hazard, and recognize the consequence.
Identifies information that is critical for successful application and understanding of the product.
Labels may also be on or inside the equipment to provide specific precautions.
SHOCK HAZARD: Labels may be on or inside the equipment, for example, a drive or motor, to alert people that dangerous
voltage may be present.
BURN HAZARD: Labels may be on or inside the equipment, for example, a drive or motor, to alert people that surfaces may
reach dangerous temperatures.
ARC FLASH HAZARD: Labels may be on or inside the equipment, for example, a motor control center, to alert people to
potential Arc Flash. Arc Flash will cause severe injury or death. Wear proper Personal Protective Equipment (PPE). Follow ALL
Regulatory requirements for safe work practices and for Personal Protective Equipment (PPE).
Allen-Bradley, Rockwell Software, Rockwell Automation, PowerMonitor, FactoryTalk, ControlLogix, SLC, RSLog ix, RSLinx, RSNetWorx, PLC-5, Logix5000, CompactLogix, Studio 500 0, and ControlFLASH are
trademarks of Roc kwell Automation, Inc.
Trademarks not belonging to Rockwell Automation are property of their respective companies.
Page 3

Summary of Changes
This manual contains new and updated information. Changes throughout this
revision are marked by change bars, as shown to the right of this paragraph.
New and Updated Information
This table contains the changes made to this revision.
Top ic Pag e
Added information about the M6 model. Throughout
Added information on connecting to a ControlNet network. 40
Added information on setting up ControlNet network communication. 47
Added information about Power Quality monitoring 74
Updated the Logging Overview section 99
Added information on Waveform Log 105
Added parameters to the Data Log Parameter list 114
Added parameters to the Alarm Codes and Description list 137
Added information about the Power Quality Log 141
Added information about the Trigger Data Log 145
Added information about the Snapshot Log 148
Added information about Setpoint Logic Gates 160
Added parameters to the Setpoint Output Action List 167
Added information about Optional ControlNet Communication 183
Added information about Electronic Data Sheet 184
Added ControlNet netwrok information Chapter 9
Added ControlNet I/O Connection information 208
Added information about Upgrading the PowerMonitor 5000 Model and Communication 223
Added data table information for the following:
• Configuration.Setpoints_11_15 (M6 model)
• Configuration.Setpoints_16_20 (M6 model)
• Configuration.Setpoint_Logic (M6 Model)
• Configuration.TriggerDataLogFile (M6 Model)
• Configuration.TriggerSetpointInfoFile (M6 model)
• Configuration.TriggerData(M6 model)
• Configuration.WaveformFileName (M6 model)
• Status.Option alComm
• Status.IEEE1588 (M6 model)
• Statistics.Setpoint_Output
• Statistics.Logging
• Statistics.Setpoint_Logic (M6 model)
• LoggingResults. TriggerLog_Setpoint_Info_File_Name (M6 model)
• LoggingResults.TriggerLog_FileName (M6 model)
• LoggingResults.TriggerData_Header Data Table (M6 model)
• LoggingResults.TriggerData_Log (M6 model)
• LoggingResults.Power_Quality_Log (M6 model)
• LoggingResults.Snapshot_Log (M6 model)
• LoggingResults.WaveformFileName (M6 model)
• LoggingResults.Waveform_Log (M6 model)
• Power Quali ty.Harm onics _Results (M6 model)
• PowerQuality.IEEE1159_Results (M6 model)
• PowerQuality.Synchro_Phasor_Results
• PowerQuality.IEEE519_ Results (M6 model)
• PowerQuality.Harmonics Results (M6 model)
Removed reserved elements in Table 116 - Status.Alarms Data Table 302
Added information for PowerMonitor 5000 Waveform Capture and Compression (M6 model) Appendix D
Appendix A
Rockwell Automation Publication 1426-UM001F-EN-P - November 2013 3
Page 4
Summary of Changes
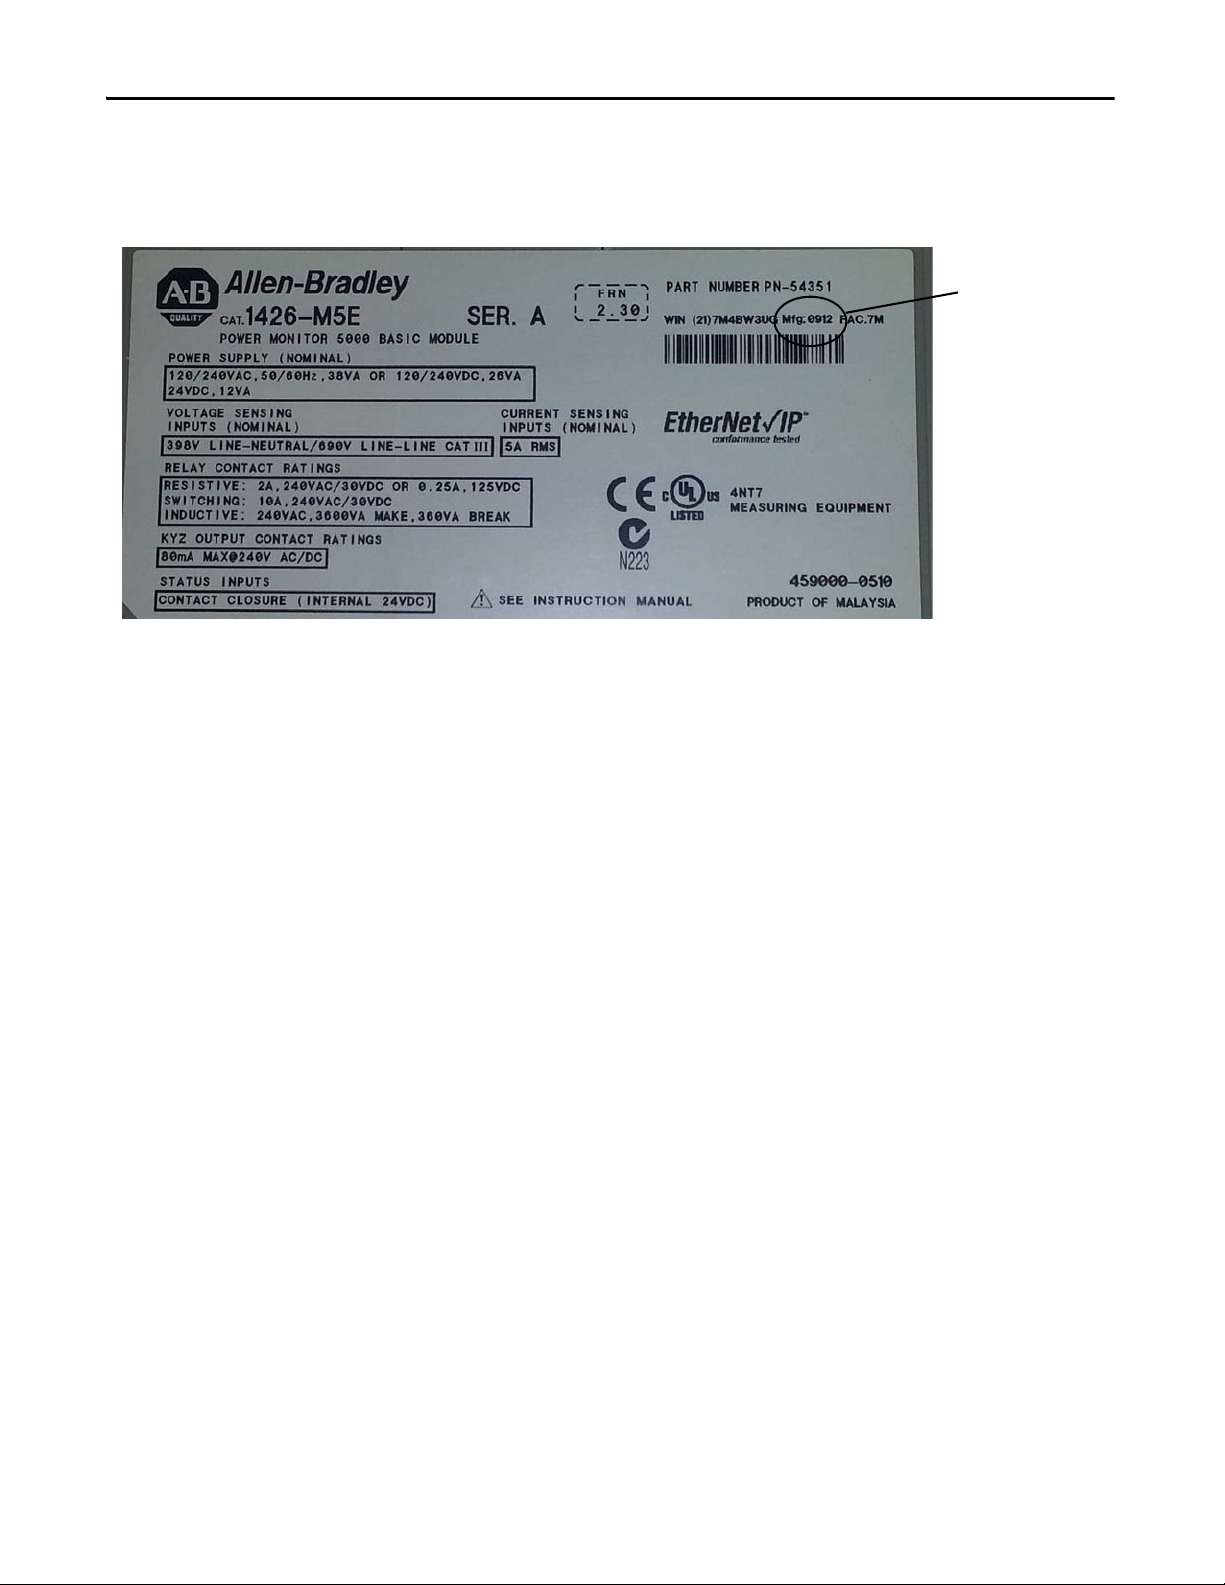
Manufacturing Date Code
on Product Label
For catalog number 1426-M5E (PN-54351) units manufactured from
July 2012…January 2013, the accuracy is Class 0.5 not Class 0.2. All other
characteristics and products are not impacted. The impacted units are those with
manufacturing date codes of 0712, 0812, 0912, 1012, 1112, 1212, and 0113.
4 Rockwell Automation Publication 1426-UM001F-EN-P - November 2013
Page 5

Table of Contents
Preface
PowerMonitor 5000 Unit Overview
Install the PowerMonitor 5000 Unit
Setup
Catalog Number Explanation . . . . . . . . . . . . . . . . . . . . . . . . . . . . . . . . . . . . . . . 9
Additional Resources . . . . . . . . . . . . . . . . . . . . . . . . . . . . . . . . . . . . . . . . . . . . . . . 9
Chapter 1
Safety . . . . . . . . . . . . . . . . . . . . . . . . . . . . . . . . . . . . . . . . . . . . . . . . . . . . . . . . . . . 11
Product Description. . . . . . . . . . . . . . . . . . . . . . . . . . . . . . . . . . . . . . . . . . . . . . 11
PowerMonitor 5000 Unit Features and Functions . . . . . . . . . . . . . . . . . . 12
Before You Begin . . . . . . . . . . . . . . . . . . . . . . . . . . . . . . . . . . . . . . . . . . . . . . . . 15
Product Disposal. . . . . . . . . . . . . . . . . . . . . . . . . . . . . . . . . . . . . . . . . . . . . . . . . 15
Chapter 2
Mounting Considerations . . . . . . . . . . . . . . . . . . . . . . . . . . . . . . . . . . . . . . . . 17
Wire the PowerMonitor 5000 Unit. . . . . . . . . . . . . . . . . . . . . . . . . . . . . . . . 19
Connect Communication . . . . . . . . . . . . . . . . . . . . . . . . . . . . . . . . . . . . . . . . 31
Chapter 3
Setup Using the Web Interface . . . . . . . . . . . . . . . . . . . . . . . . . . . . . . . . . . . . 41
Setup Using Optional Software . . . . . . . . . . . . . . . . . . . . . . . . . . . . . . . . . . . 50
Setup Using Communication . . . . . . . . . . . . . . . . . . . . . . . . . . . . . . . . . . . . . 50
Metering
Power Quality Monitoring
Chapter 4
Basic Metering . . . . . . . . . . . . . . . . . . . . . . . . . . . . . . . . . . . . . . . . . . . . . . . . . . . 51
Wiring Diagnostics. . . . . . . . . . . . . . . . . . . . . . . . . . . . . . . . . . . . . . . . . . . . . . . 53
Wiring Correction . . . . . . . . . . . . . . . . . . . . . . . . . . . . . . . . . . . . . . . . . . . . . . . 57
Metering Overview. . . . . . . . . . . . . . . . . . . . . . . . . . . . . . . . . . . . . . . . . . . . . . . 60
Energy Metering . . . . . . . . . . . . . . . . . . . . . . . . . . . . . . . . . . . . . . . . . . . . . . . . . 61
Demand Metering . . . . . . . . . . . . . . . . . . . . . . . . . . . . . . . . . . . . . . . . . . . . . . . 62
Power Metering. . . . . . . . . . . . . . . . . . . . . . . . . . . . . . . . . . . . . . . . . . . . . . . . . . 67
Voltage, Current, Frequency Metering . . . . . . . . . . . . . . . . . . . . . . . . . . . . . 69
Configuration Lock . . . . . . . . . . . . . . . . . . . . . . . . . . . . . . . . . . . . . . . . . . . . . . 71
Chapter 5
Harmonic Analysis . . . . . . . . . . . . . . . . . . . . . . . . . . . . . . . . . . . . . . . . . . . . . . . 75
Sag and Swell Detection . . . . . . . . . . . . . . . . . . . . . . . . . . . . . . . . . . . . . . . . . . 79
Power Quality Event Classification (M6 model) . . . . . . . . . . . . . . . . . . . . 81
Short Duration RMS Variations (Category 2.0 - Sags, Swells, and
Interruptions) (M6 model) . . . . . . . . . . . . . . . . . . . . . . . . . . . . . . . . . . . . . . . 82
Long Duration RMS Variations (Category 3.0 - Undervoltage,
Overvoltage, Sustained Interruptions) (M6 model) . . . . . . . . . . . . . . . . . 84
Power Quality Event Example. . . . . . . . . . . . . . . . . . . . . . . . . . . . . . . . . . . . . 85
Voltage and Current Imbalance (Category 4.0) . . . . . . . . . . . . . . . . . . . . . 87
Waveform Distortion (Category 5.1 - DC Offset, and
5.2 - Harmonics) (M6 model) . . . . . . . . . . . . . . . . . . . . . . . . . . . . . . . . . . . . . 88
Rockwell Automation Publication 1426-UM001F-EN-P - November 2013 5
Page 6

Table of Contents
Logging
Power Frequency Variations (Category 7.0) . . . . . . . . . . . . . . . . . . . . . . . . 89
IEEE 519 Pass/Fail Capability (M6 model) . . . . . . . . . . . . . . . . . . . . . . . . . 90
IEEE 519 Pass/Fail Results . . . . . . . . . . . . . . . . . . . . . . . . . . . . . . . . . . . . . . . . 91
IEEE519_Overall_Status . . . . . . . . . . . . . . . . . . . . . . . . . . . . . . . . . . . . . . . . . 91
IEEE-519 Short Term and Long Term Harmonic Results . . . . . . . . . . . 92
Waveform Recording (M6 model) . . . . . . . . . . . . . . . . . . . . . . . . . . . . . . . . . 93
Chapter 6
Logging Overview . . . . . . . . . . . . . . . . . . . . . . . . . . . . . . . . . . . . . . . . . . . . . . . 100
Waveform Log (M6 Model). . . . . . . . . . . . . . . . . . . . . . . . . . . . . . . . . . . . . . 105
Energy Log. . . . . . . . . . . . . . . . . . . . . . . . . . . . . . . . . . . . . . . . . . . . . . . . . . . . . . 109
Data Log . . . . . . . . . . . . . . . . . . . . . . . . . . . . . . . . . . . . . . . . . . . . . . . . . . . . . . . 113
Min/Max Log. . . . . . . . . . . . . . . . . . . . . . . . . . . . . . . . . . . . . . . . . . . . . . . . . . . 123
Load Factor Log. . . . . . . . . . . . . . . . . . . . . . . . . . . . . . . . . . . . . . . . . . . . . . . . . 126
Time-of-use (TOU) Log . . . . . . . . . . . . . . . . . . . . . . . . . . . . . . . . . . . . . . . . . 128
Event Log. . . . . . . . . . . . . . . . . . . . . . . . . . . . . . . . . . . . . . . . . . . . . . . . . . . . . . . 130
Setpoint Log . . . . . . . . . . . . . . . . . . . . . . . . . . . . . . . . . . . . . . . . . . . . . . . . . . . . 134
Alarm Log . . . . . . . . . . . . . . . . . . . . . . . . . . . . . . . . . . . . . . . . . . . . . . . . . . . . . . 136
Power Quality Log (M6 model) . . . . . . . . . . . . . . . . . . . . . . . . . . . . . . . . . . 141
Trigger Data Log (M6 model) . . . . . . . . . . . . . . . . . . . . . . . . . . . . . . . . . . . . 145
Snapshot Log . . . . . . . . . . . . . . . . . . . . . . . . . . . . . . . . . . . . . . . . . . . . . . . . . . . 148
Logic Functions
Other Functions
Communication
Chapter 7
Relay and KYZ Outputs . . . . . . . . . . . . . . . . . . . . . . . . . . . . . . . . . . . . . . . . . 151
Status Inputs. . . . . . . . . . . . . . . . . . . . . . . . . . . . . . . . . . . . . . . . . . . . . . . . . . . . 155
Setpoints . . . . . . . . . . . . . . . . . . . . . . . . . . . . . . . . . . . . . . . . . . . . . . . . . . . . . . . 157
Chapter 8
Security. . . . . . . . . . . . . . . . . . . . . . . . . . . . . . . . . . . . . . . . . . . . . . . . . . . . . . . . . 171
Date and Time Functions . . . . . . . . . . . . . . . . . . . . . . . . . . . . . . . . . . . . . . . . 173
Network Time Synchronization . . . . . . . . . . . . . . . . . . . . . . . . . . . . . . . . . . 175
System Error Response. . . . . . . . . . . . . . . . . . . . . . . . . . . . . . . . . . . . . . . . . . . 178
Miscellaneous Commands . . . . . . . . . . . . . . . . . . . . . . . . . . . . . . . . . . . . . . . 180
Chapter 9
Native Ethernet Communication . . . . . . . . . . . . . . . . . . . . . . . . . . . . . . . . . 181
Optional DeviceNet Communication. . . . . . . . . . . . . . . . . . . . . . . . . . . . . 182
Optional ControlNet Communication . . . . . . . . . . . . . . . . . . . . . . . . . . . 183
Electronic Data Sheet (EDS) . . . . . . . . . . . . . . . . . . . . . . . . . . . . . . . . . . . . . 184
PowerMonitor 5000 Unit Memory Organization . . . . . . . . . . . . . . . . . . 184
Communication Command Summary . . . . . . . . . . . . . . . . . . . . . . . . . . . . 186
EtherNet/IP Object Model . . . . . . . . . . . . . . . . . . . . . . . . . . . . . . . . . . . . . . 187
DeviceNet and ControlNet Object Model. . . . . . . . . . . . . . . . . . . . . . . . . 188
Explicit Messaging. . . . . . . . . . . . . . . . . . . . . . . . . . . . . . . . . . . . . . . . . . . . . . . 188
Examples: Explicit Message Setup. . . . . . . . . . . . . . . . . . . . . . . . . . . . . . . . . 189
6 Rockwell Automation Publication 1426-UM001F-EN-P - November 2013
Page 7

Maintenance
PowerMonitor 5000 Unit Data Tables
Technical Specifications
Table of Contents
SCADA Applications . . . . . . . . . . . . . . . . . . . . . . . . . . . . . . . . . . . . . . . . . . . 196
Controller Applications: Class 1 Connection. . . . . . . . . . . . . . . . . . . . . . 202
CIP Energy Object . . . . . . . . . . . . . . . . . . . . . . . . . . . . . . . . . . . . . . . . . . . . . . 216
Chapter 10
Update the PowerMonitor 5000 Unit Firmware. . . . . . . . . . . . . . . . . . . 221
Upgrading the PowerMonitor 5000 Model and Communication . . . 223
Use the ControlFLASH Utility to Update Firmware . . . . . . . . . . . . . . 223
Appendix A
Summary of Data Tables. . . . . . . . . . . . . . . . . . . . . . . . . . . . . . . . . . . . . . . . . 225
Data Tables. . . . . . . . . . . . . . . . . . . . . . . . . . . . . . . . . . . . . . . . . . . . . . . . . . . . . 228
Information Tables. . . . . . . . . . . . . . . . . . . . . . . . . . . . . . . . . . . . . . . . . . . . . . 366
Appendix B
Certifications . . . . . . . . . . . . . . . . . . . . . . . . . . . . . . . . . . . . . . . . . . . . . . . . . . . 369
PowerMonitor 5000 Display Module
Application Summary
PowerMonitor 5000 Waveform
Capture and Compression
(M6 model)
Glossary
Index
Appendix C
Introduction. . . . . . . . . . . . . . . . . . . . . . . . . . . . . . . . . . . . . . . . . . . . . . . . . . . . 371
Terminal Setup . . . . . . . . . . . . . . . . . . . . . . . . . . . . . . . . . . . . . . . . . . . . . . . . . 371
Appendix D
Compression Algorithm . . . . . . . . . . . . . . . . . . . . . . . . . . . . . . . . . . . . . . . . . 379
. . . . . . . . . . . . . . . . . . . . . . . . . . . . . . . . . . . . . . . . . . . . . . . . . . . . . . . . . . . . . . . . 383
. . . . . . . . . . . . . . . . . . . . . . . . . . . . . . . . . . . . . . . . . . . . . . . . . . . . . . . . . . . . . . . . 389
Rockwell Automation Publication 1426-UM001F-EN-P - November 2013 7
Page 8

Table of Contents
Notes:
8 Rockwell Automation Publication 1426-UM001F-EN-P - November 2013
Page 9
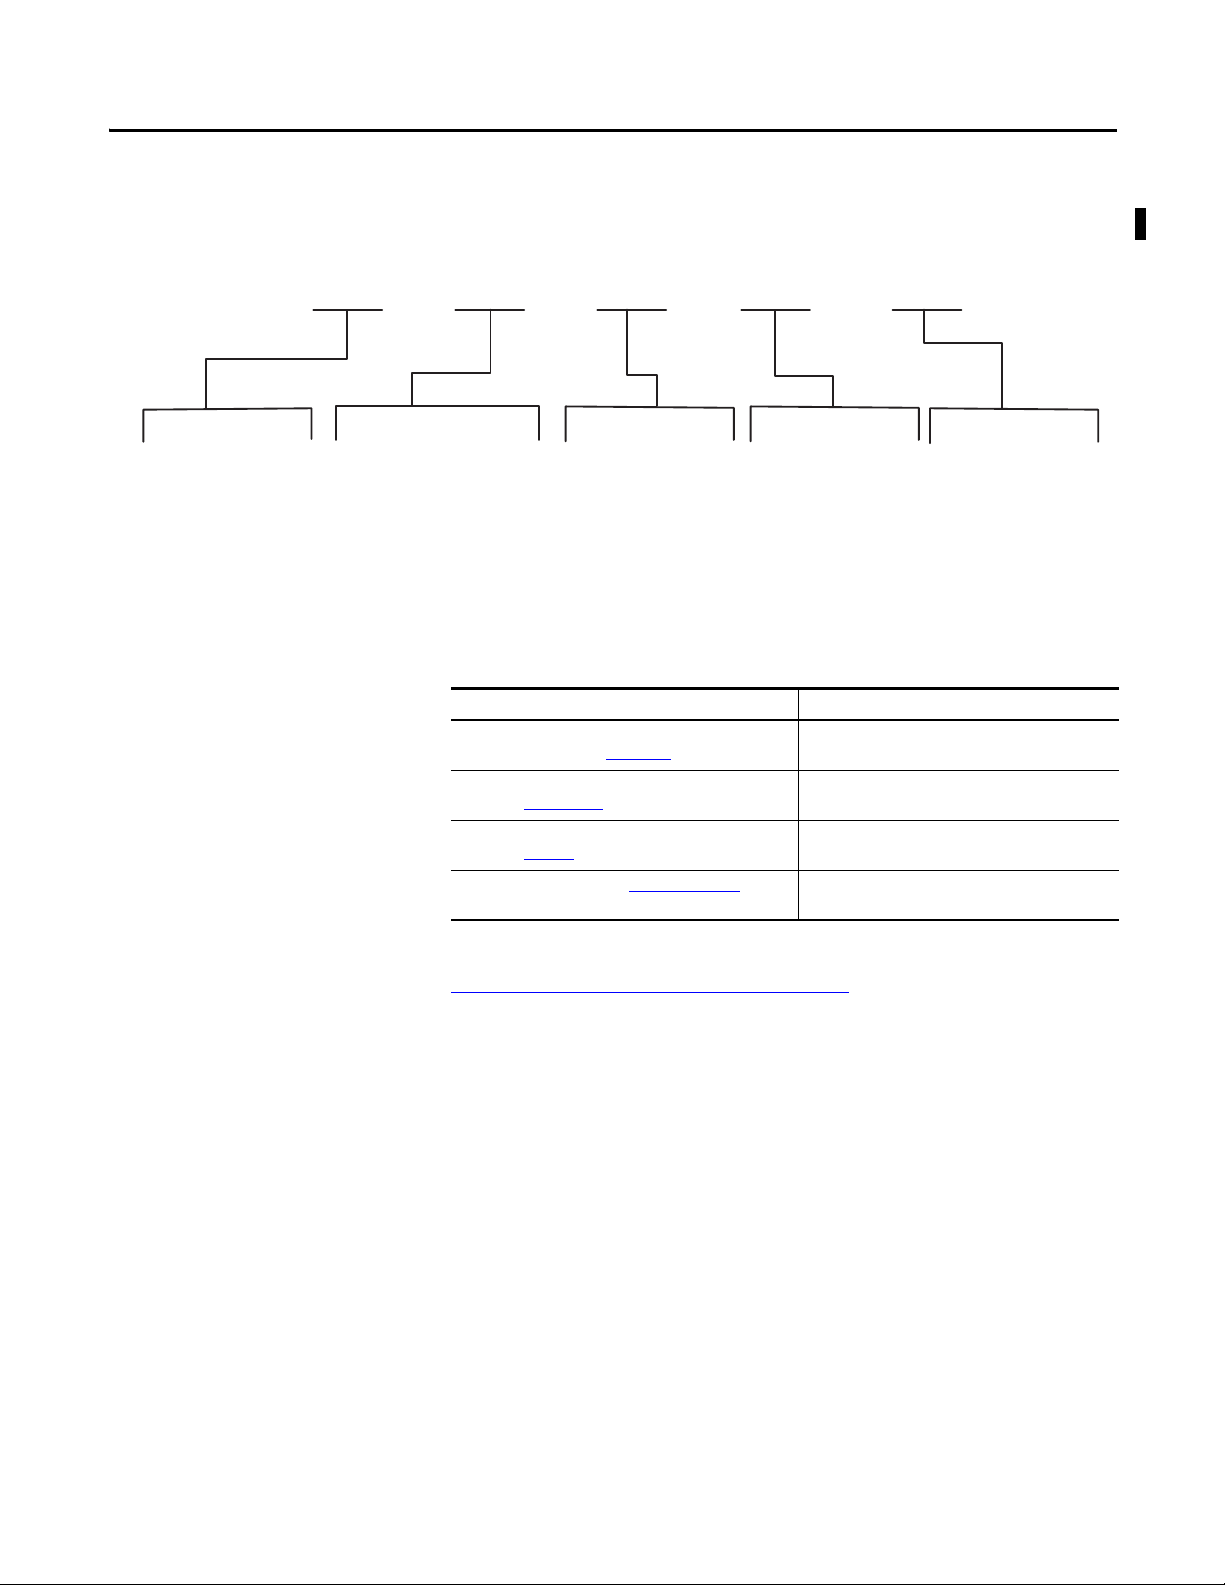
Catalog Number Explanation
Preface
1426
Bulletin Number
1426 - PowerMonitor™ 5000
Additional Resources
-M5 E -CNT -A
Model
M5 - Base Power Monitor
M6 - Basic Power Quality Monitor
These documents contain additional information concerning related products
from Rockwell Automation.
Resource Description
PowerMonitor 5000 USB Driver Installation and
Configuration, publication 1426-IN001
PanelView Component HMI Terminals User Manual,
publication 2711C-UM001
Industrial Automation Wiring and Grounding Guidelines,
publication 1770-4.1
Product Certifications website, http://www.ab.com Provides declarations of conformity, certificates, and
Native Comms
E - EtherNet/IP
Optional Comms
CNT - ControlNet Port
DNT - DeviceNet Port
[Blank] - No Optional Port
Provides instructions for installing and configuring the
USB driver.
Provides instructions for setup and operation of the
PanelView Component terminal.
Provides general guidelines for installing a Rockwell
Automation® industrial system.
other certification details.
Series
A
You can view or download publications at
http:/www.rockwellautomation.com/literature/
technical documentation, contact your local Allen-Bradley distributor or
Rockwell Automation sales representative.
Rockwell Automation Publication 1426-UM001F-EN-P - November 2013 9
. To order paper copies of
Page 10

Preface
Notes:
10 Rockwell Automation Publication 1426-UM001F-EN-P - November 2013
Page 11
Safety
IMPORTANT
Chapter 1
PowerMonitor 5000 Unit Overview
ATT EN TI ON : Only qualified personnel, following accepted safety procedures,
can install, wire, and service the PowerMonitor 5000 unit and its associated
components. Before beginning any work, disconnect all sources of power and
verify that they are de-energized and locked out. Failure to follow these
instructions can result in personal injury or death, property damage, or
economic loss.
ATT EN TI ON : Never open a current transformer (CT) secondary circuit with
primary current applied. Wiring between the CTs and the PowerMonitor 5000
unit must include a shorting terminal block in the CT secondary circuit. Shorting
the secondary with primary current present allows other connections to be
removed if needed. An open CT secondary with primary current applied
produces a hazardous voltage, which can lead to personal injury, death,
property damage, or economic loss.
Product Description
The PowerMonitor 5000 unit is not designed for nor intended for use as a
circuit protective device. Do not use this equipment in place of a motor
overload relay or circuit protective relay.
The PowerMonitor 5000 unit is the next generation of high-end electric
metering products from Rockwell Automation. This new family of meters
provides advanced technology, new functionality, faster response, and superior
accuracy. The M5 model is the base version and provides an extensive range of
metering functionality. The M6 model expands the metering capabilities of the
M5 with basic power quality monitoring functionality, including harmonics up
to the 63rd, waveforms and logging, and classification of power quality events.
The PowerMonitor 5000 unit communicates power and energy parameters to
controllers, HMI software, and applications such as FactoryTalk
software over the Ethernet network or other optional networks. The
PowerMonitor 5000 unit works with controllers or software applications to
address key customer applications including the following:
• Load profiling – logging power parameters such as real power, apparent
power and demand, for analysis of power usage by loads over time
®
EnergyMetrix
Rockwell Automation Publication 1426-UM001F-EN-P - November 2013 11
Page 12
Chapter 1 PowerMonitor 5000 Unit Overview
Virtual Wiring
Correction
---- S1
S2
---- S3
S4
---- S com
S com
---- K
Y
---- Z
R1 O
---- R1 com
R1 C
---- R2 O
R2 com
---- R2 C
R3 O
---- R3 com
R3 C
Module
status
Network
status
Cong Lock
EtherNet √
IP
PowerMonitor 5000
Power
USB
Device
USB
Host
LNK
ACT
I 1
I 2
I 3
I 4
L1
L2
GND
24V
com
V1
V2
V3
VN
VG
1
DS NS
2345
DeviceNet
2
1
3
4
5
6
7
8
9
10
12
11
• Cost allocation – reporting actual energy cost by department or process to
integrate energy information into management decisions
• Billing and sub-billing – charging users of energy the actual usage cost
rather than allocating by square footage or other arbitrary methods
• Power system monitoring and control – display and control power flow
and energy utilization
• Demand management – monitoring power usage and controlling loads to
reduce demand costs
• Demand response – controlling and monitoring usage in response to an
energy provider’s instruction to reduce demand
• Power quality - monitoring, measuring, recording, and logging power
system irregularities that can result in malfunctions or damage to
equipment
PowerMonitor 5000 Unit Features and Functions
The PowerMonitor 5000 unit connects to your three-phase or split-phase AC
power system directly or through instrument transformers (PTs and CTs). It
converts instantaneous voltage and current values to digital values, and uses the
resulting digital values in calculations of parameters such as voltage, current,
power, and energy.
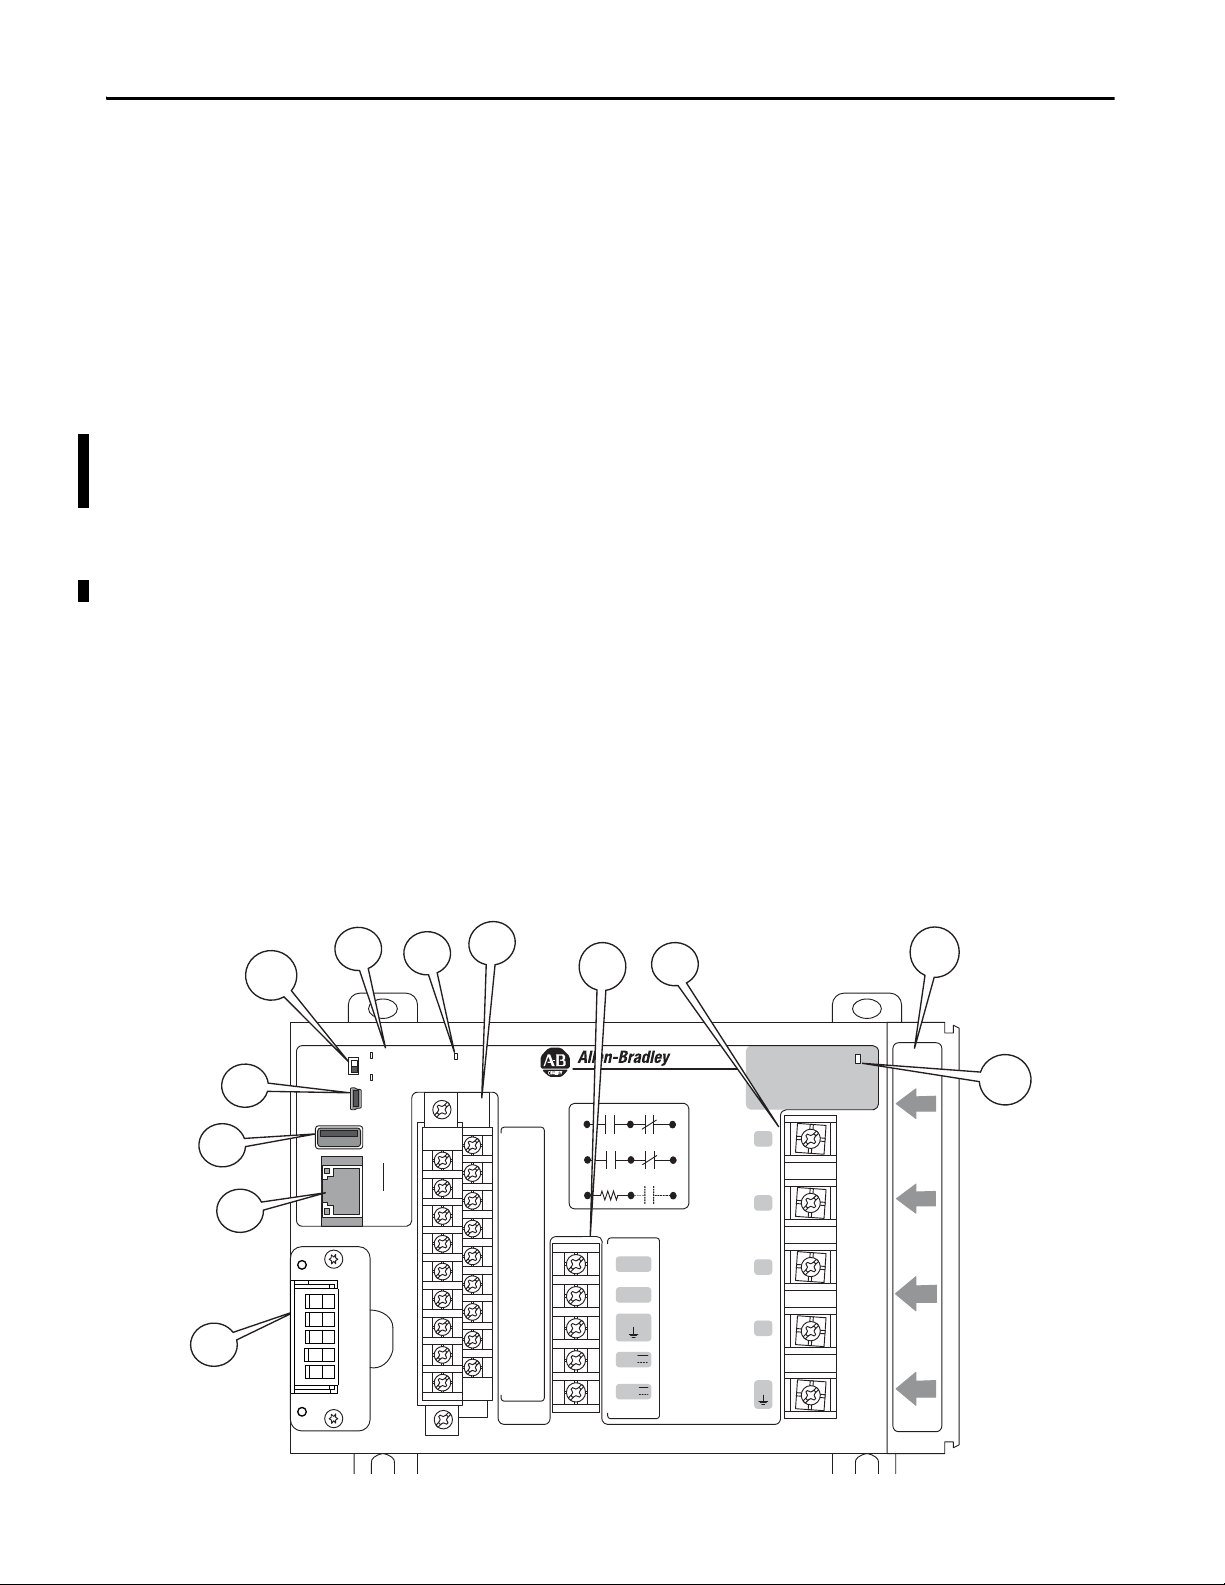
Features
The PowerMonitor 5000 unit includes a number of hardware features that are
common to all models.
Figure 1 - Hardware Features
12 Rockwell Automation Publication 1426-UM001F-EN-P - November 2013
Z
K
Y
Rx com Rx C
Rx O
Internal
S n
24 VDC
Scom
Page 13

PowerMonitor 5000 Unit Overview Chapter 1
Table 1 - Hardware Features
Feature Description
1. Ethernet port – standard RJ45 jack with status
indicators
2. Optional communication port DeviceNet and ControlNet networks
3. USB host port USB standard A receptacle. Not used in this model.
4. USB device port The USB device port is a USB Mini-B receptacle that accepts standard USB Mini-B plugs, for connection to a host device,
5. Configuration Lock switch When enabled, this switch prevents changes in configuration that can affect revenue accuracy.
6. Device and Network status indicators • Device status
7. Power • Power stat us
8. Status input, KYZ output, and control relay wiring
terminals
9. Control power and ground wiring terminals • 120…240V AC, 50/60 Hz or 120...240V DC
10.Voltage sensing wiring terminals • Direct connect to up to 690V AC 3-phase line to line
11.Current sensing wiring openings • Nominal input current 5 A
12.Virtual wiring correction indicator Indicates that the sensing voltage and/or current wiring has been modified in the power monitor configuration.
Ethernet port hardware is included on all models. These protocols and functions are supported:
• EtherNet/IP network
• HTML web page for configuration and data access
Ethernet indicators
• LNK indicator
– Solid GREEN: IP link established
– Off: No link established
• ACT indicator
– Flashing YELLOW: Data present on Ethernet port
– Off: No data activity present
• Module Status
– OFF: No control power
– Flashing GREEN/RED: Self-test
– Flashing GREEN: Power monitor has not been configured
– GREEN: Power monitor is running
– Flashing RED: Power monitor has detected a recoverable minor fault
– RED: Power monitor has detected a non-recoverable major fault
• Network Status
– OFF: No control power
– Flashing GREEN/RED: Self-test
– Flashing GREEN: No CIP connection
– Solid GREEN: CIP connection established
– Flashing RED: CIP connection timed out
– Solid RED: Duplicate address detected
such as a notebook computer.
– OFF: No control power
– Flashing GREEN/RED: Self-test
– Flashing GREEN: Power monitor has not been configured
– GREEN: Power monitor is running
– Flashing RED: Power monitor has detected a recoverable minor fault
– RED: Power monitor has detected a non-recoverable major fault
• Network status (Native Ethernet port)
– OFF: No control power
– Flashing GREEN/RED: Self-test
– Flashing GREEN: No CIP connection
– Solid GREEN: CIP connection established
– Flashing RED: CIP connection timed out
– Solid RED: Duplicate IP address detected
– OFF: No control power
– GREEN: Control power is present
• Four internally-powered (24V DC) status inputs
• Status input 2 can be used for demand period synchronization
• KYZ DPDT solid-state relay for signaling use
• Three DPDT control relays
• 24V DC
• Maximum nominal line to ground voltage 690
• Use potential transformers (PTs) for higher voltages
• Neutral voltage and ground voltage connections
• Use current transformers (CTs) to connect to power system
Rockwell Automation Publication 1426-UM001F-EN-P - November 2013 13
Page 14
Chapter 1 PowerMonitor 5000 Unit Overview
Functionality
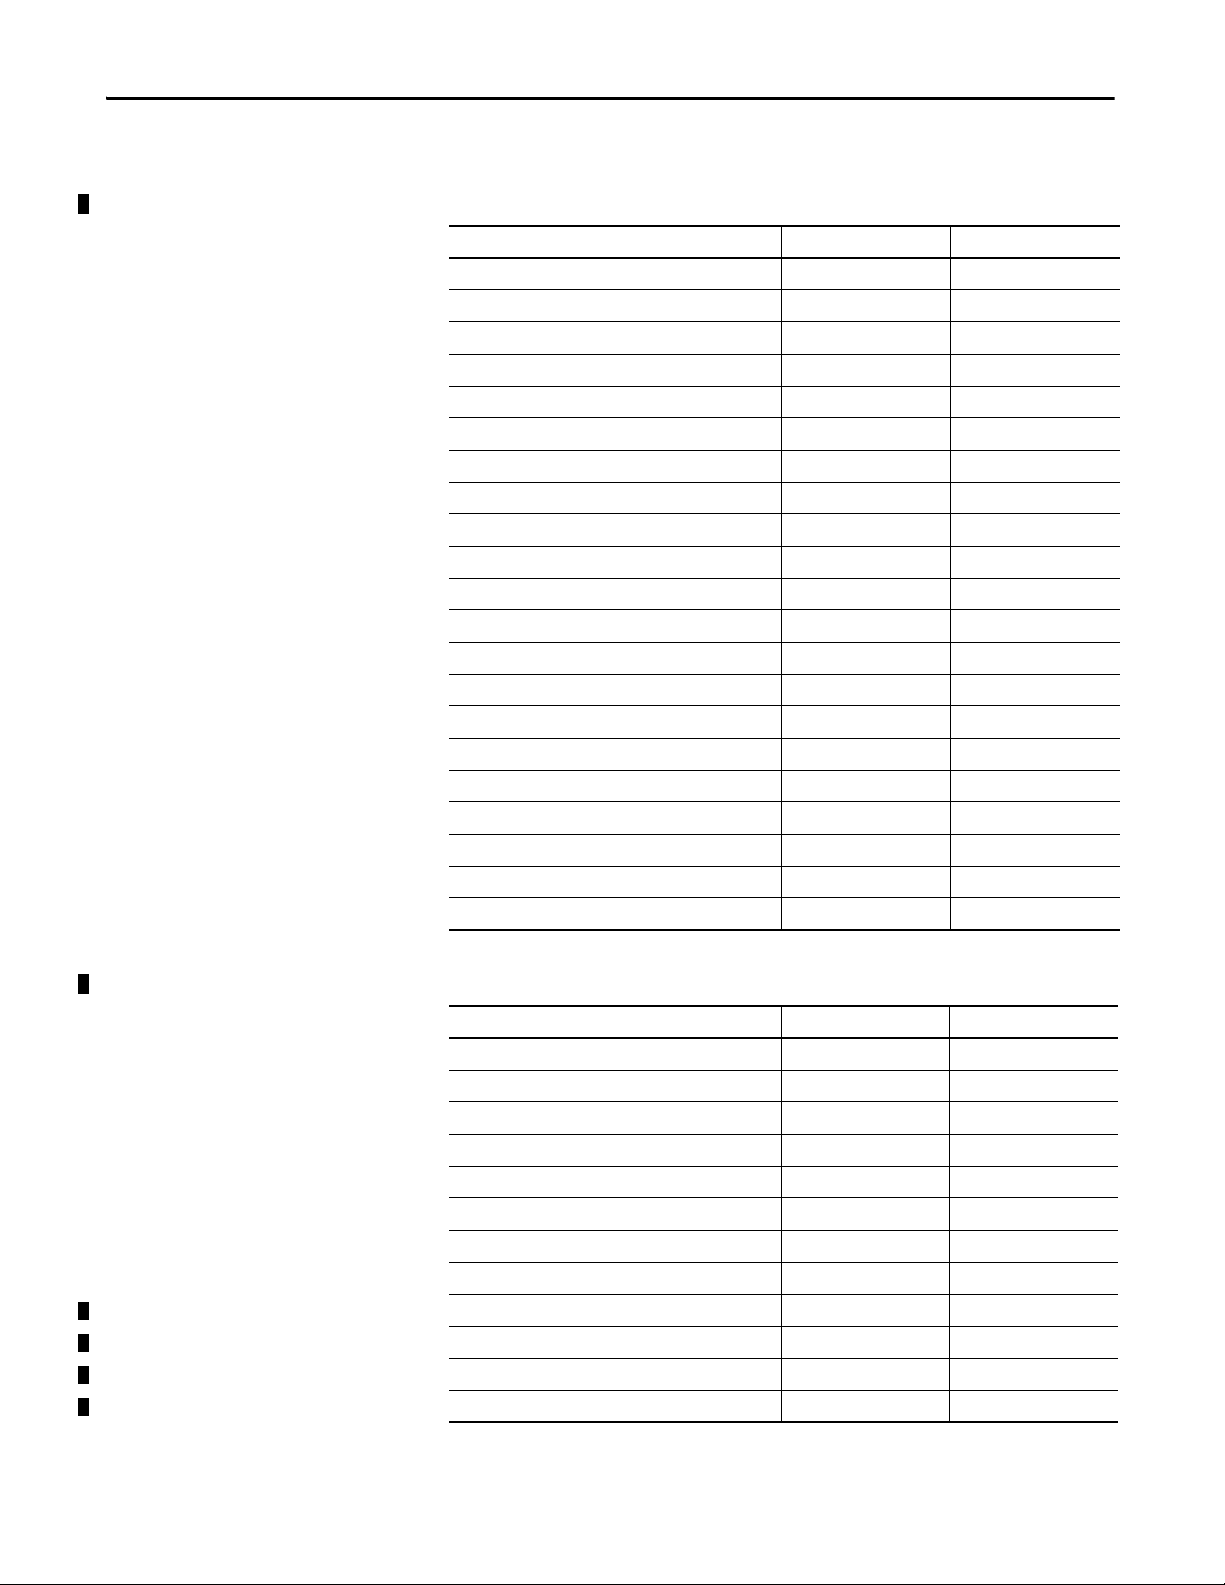
Table 2 - PowerMonitor 5000 Unit Functions
Measured Parameters 1426-M5 1426-M6
Voltage, L-L and L-N • •
Current, per phase and total • •
Frequency, last cycle and average • •
Voltage unbalance • •
Current unba lance • •
Real power, kW • •
Symmetrical Component Analysis • •
Reactive power, kVAR • •
Apparent power, kVA • •
True power factor, per phase and total • •
Displacement power factor, per phase and total • •
Reactive energy, kVARh • •
Real energy, kWh • •
Apparent energy, kVAh • •
Real power demand, kW • •
Reactive power demand, kVAR • •
Apparent power demand, kVA • •
Projected kW demand • •
Projected kVAR demand • •
Projected kVA demand • •
Demand power factor • •
\
Table 3 - Logging Functions
Logging Function 1426-M5 1426-M6
Energy log • •
Data log • •
Min/max log • •
Load factor log • •
Time of use log • •
Event log • •
Setpoint log • •
Alarm log • •
Power Qualit y log •
Waveform log •
Trigger Data log •
Snapshot log •
14 Rockwell Automation Publication 1426-UM001F-EN-P - November 2013
Page 15
PowerMonitor 5000 Unit Overview Chapter 1
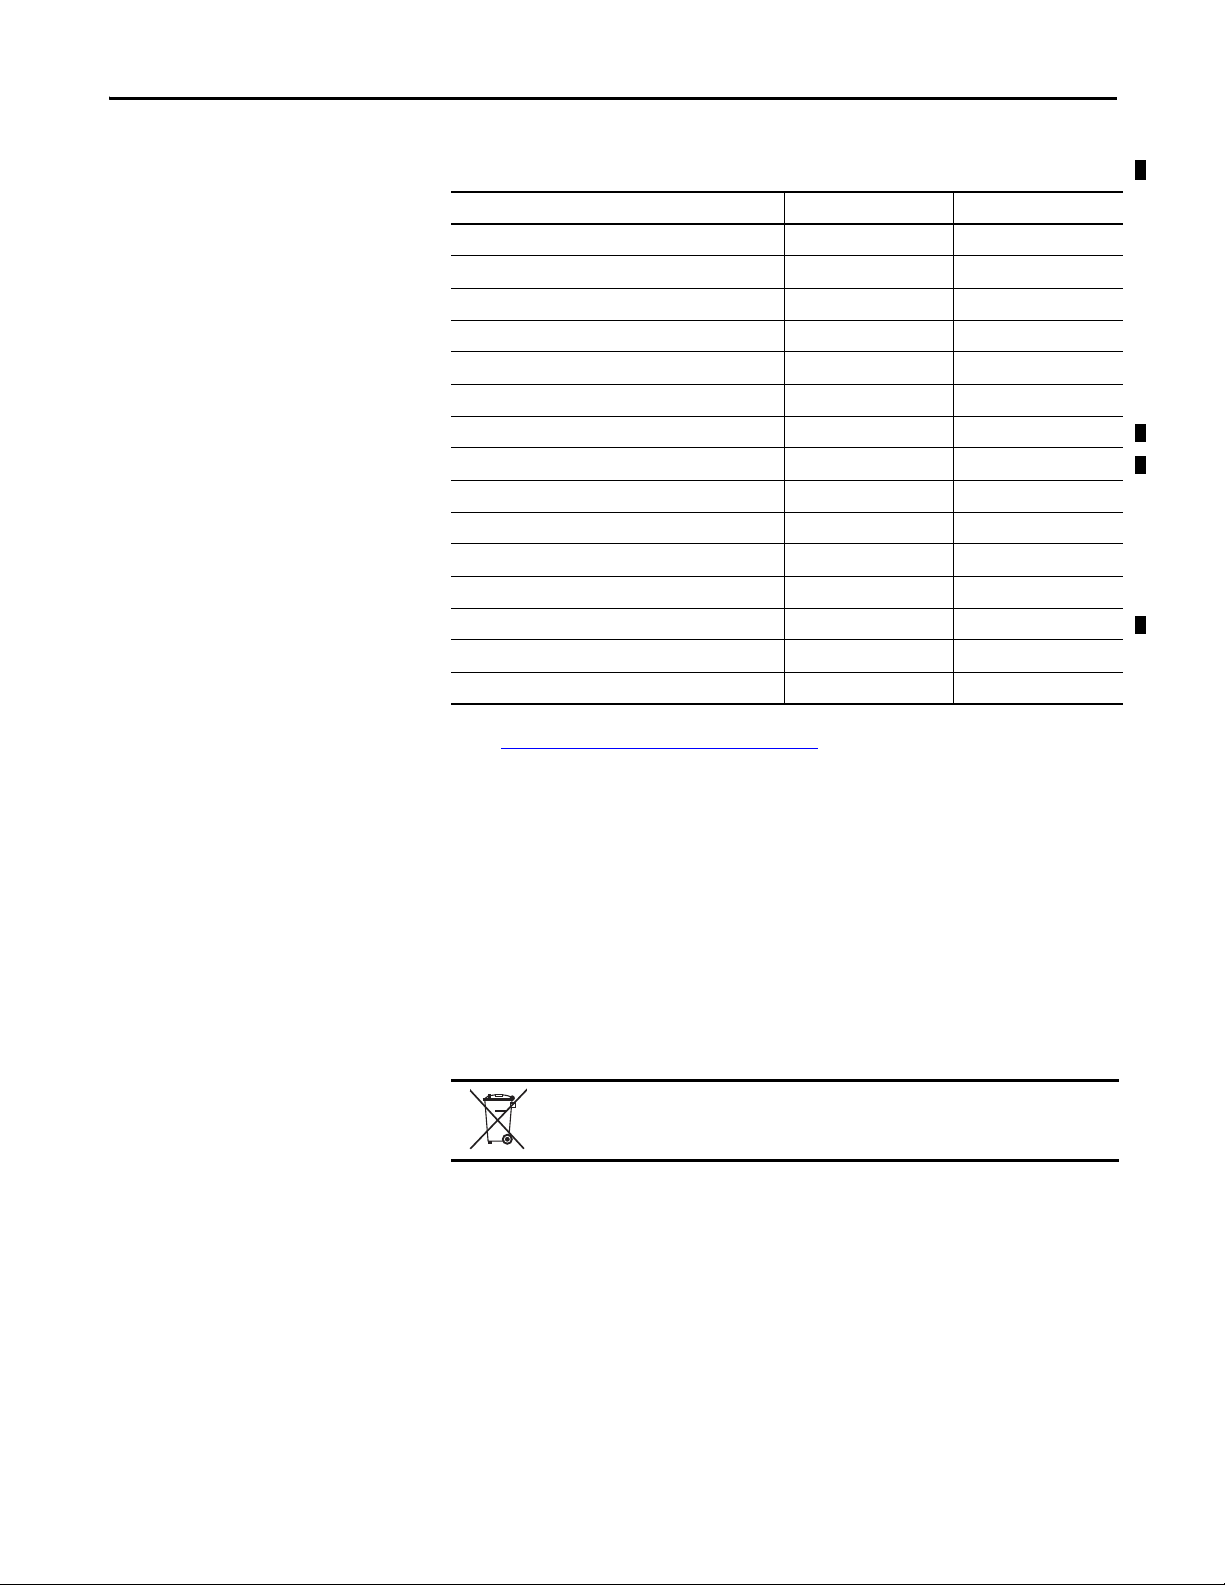
Table 4 - Other Functions
Function 1426-M5 1426-M6
Security • •
Wiring diagnostics • •
Wiring correction • •
Network time synchronization • •
Network demand synchronization • •
Configuration lock • •
IEEE 1588 Precision Time Protocol • •
Waveform synchronization broadcast (WSB) •
Relay (3) and KYZ (1) outputs • •
Status inputs (4) • •
Setpoint programming • •
Sag and swell detection • •
Logical setpoint programming •
Web page • •
CIP energy object • •
Before You Begin
Product Disposal
Refer Power Quality Monitoring on page 73 for a listing of power quality
functions.
Use this document as a guide for installing, wiring, connecting, applying power,
and configuring your power monitor to provide electric power, energy, and power
quality information through your web browser, FactoryTalk EnergyMetrix
software, or other applications. You must already be familiar with AC power and
power metering.
At the end of its life, this equipment must be collected separately from any
unsorted municipal waste.
Rockwell Automation Publication 1426-UM001F-EN-P - November 2013 15
Page 16

Chapter 1 PowerMonitor 5000 Unit Overview
Notes:
16 Rockwell Automation Publication 1426-UM001F-EN-P - November 2013
Page 17

Chapter 2
Install the PowerMonitor 5000 Unit
Only qualified personnel can install, wire, service, and maintain this equipment.
Refer to and follow the safety guidelines and pay attention to all warnings and
notices in these instructions.
ATT EN TI ON : Electrostatic discharge can damage integrated circuits or
semiconductors. Follow these guidelines when you handle the module:
• Touch a grounded object to discharge static potential.
• Wear an approved wrist strap grounding device.
• Do not open the module or attempt to service internal components.
• Use a static safe work station, if available.
• Keep the module in its static shield bag when not in use.
Mounting Considerations
Mount the PowerMonitor 5000 unit in a suitable protective enclosure. Select an
enclosure that protects the unit from atmospheric contaminants, such as oil,
water, moisture, dust, corrosive vapors, and other harmful airborne substances.
Make sure the enclosure protects against personal contact with energized circuits.
The ambient temperature within the enclosure must remain within the limits
listed in Appendix B
adequate clearance for ventilation and wiring for the power monitor and other
equipment to be installed within the enclosure.
See PowerMonitor 5000 Unit Dimensions
spacing guidelines for the power monitor.
When installed within a substation or switchgear lineup, we recommend that the
power monitor be mounted within a low-voltage cubicle, isolated from medium
and high-voltage circuits. Be sure that the mounting panel is properly connected
to a low-impedance earth ground.
Mount the enclosure in a position that allows full access to the unit. Install the
unit with the ventilation slots in the bottom and top of the unit unobstructed to
assure adequate free convection cooling of its internal electronic components.
, Technical Specifications. Select an enclosure that provides
on page 18 for dimensions and
Rockwell Automation Publication 1426-UM001F-EN-P - November 2013 17
Page 18
Chapter 2 Install the PowerMonitor 5000 Unit
IMPORTANT
Virtual Wiring
Correction
---- S1
S2
---- S3
S4
---- S com
S com
---- K
Y
---- Z
R1 O
---- R1 com
R1 C
---- R2 O
R2 com
---- R2 C
R3 O
---- R3 com
R3 C
Module
status
Network
status
Cong Lock
EtherNet/
IP
Power
USB
Device
USB
Host
LNK
ACT
I 1
I 2
I 3
I 4
L1
L2
GND
24V
com
V1
V2
V3
VN
VG
C
O
M M U N I
C
A T I
O
N P
O
R T
185
7.29
25
1.00
132
5.23
132
5.20
3.3
0.13
124
4.88
118
4.65
PowerMonitor 5000
Mounting Hole Tolerance:
±0.4 mm (0.016 in.)
Dimensions are in mm/in.
Depth: 178/7.0
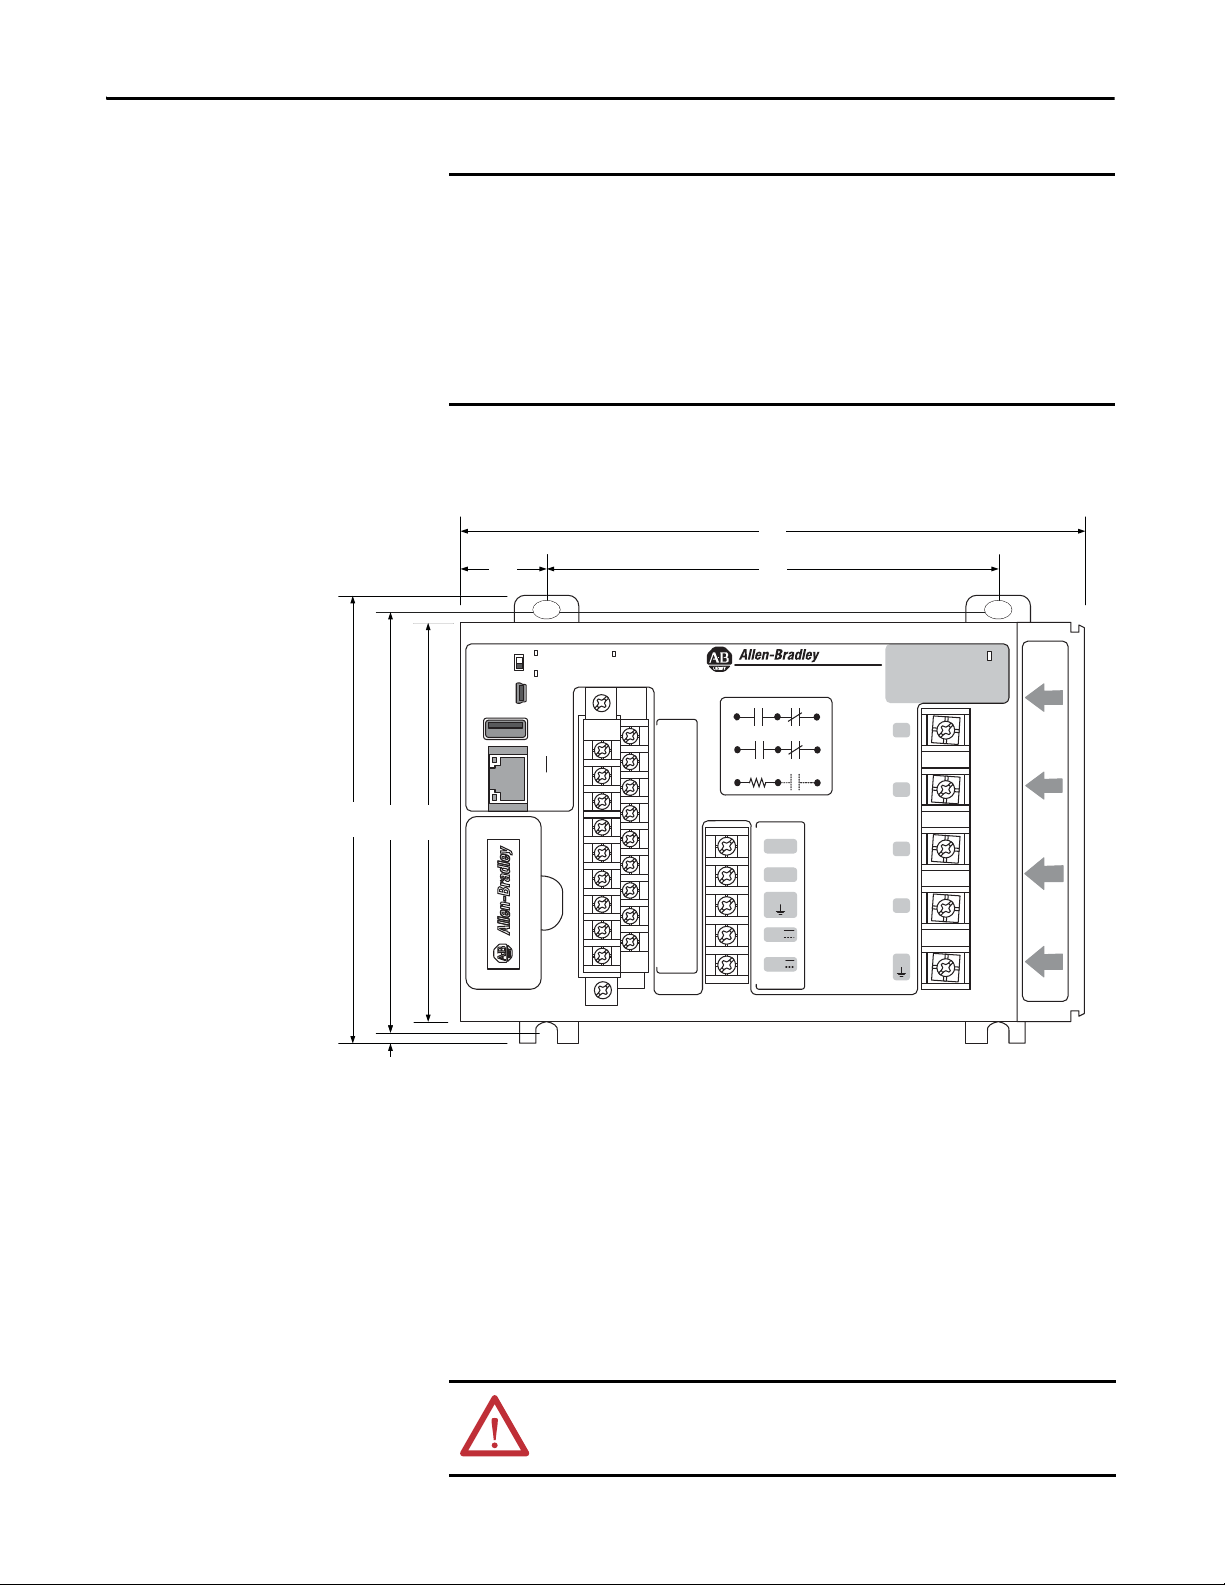
Use caution not to block the ventilation slots of the power monitor. All wiring,
wire ways, enclosure components, and other obstructions must be a minimum
of 50 mm (2.0 in.) from the top and bottom of the unit to provide ventilation
and electrical isolation. Units can be mounted side-by-side.
Note that access to the USB device port is required for initial configuration of
the power monitor and can be required for eventual administration and
maintenance. Consider safe and convenient access to the power monitor front
panel when planning the installation location.
PowerMonitor 5000 Unit Dimensions
Z
K
Y
Rx com Rx C
Rx O
Internal
S n
24 VDC
Scom
Panel Mounting
Follow these steps for panel mounting a PowerMonitor 5000 unit.
1. Use the power monitor as a template and mark pilot holes on your panel.
2. Drill pilot holes for M4 or #8 screws.
ATT EN TI ON : During mounting of all devices, make sure that all debris (such as
metal chips or wire strands) is kept from falling into the power monitor. Debris
that falls into the module could cause damage when the device is energized.
18 Rockwell Automation Publication 1426-UM001F-EN-P - November 2013
Page 19
Install the PowerMonitor 5000 Unit Chapter 2
IMPORTANT
L1
L2
GND
24V
com
V1
V2
V3
VN
VG
---- S 1
S2
---- S 3
S4
---- S c om
S com
---- K
Y
---- Z
R1 O
---- R 1 com
R1 C
---- R 2 O
R2 com
---- R 2 C
R3 O
---- R 3 com
R3 C
3. Use M4 or #8 screws to mount the power monitor to your panel with
1.16 N•m (10 lb•in) of torque.
4. Ground the power monitor on a ground bus with a low-impedance earth
ground connection.
5. Connect the ground bus to a functional earth ground on the panel.
The upper mounting slots are equipped with protective conductor terminals,
that must make metal-to-metal contact with the grounded mounting panel.
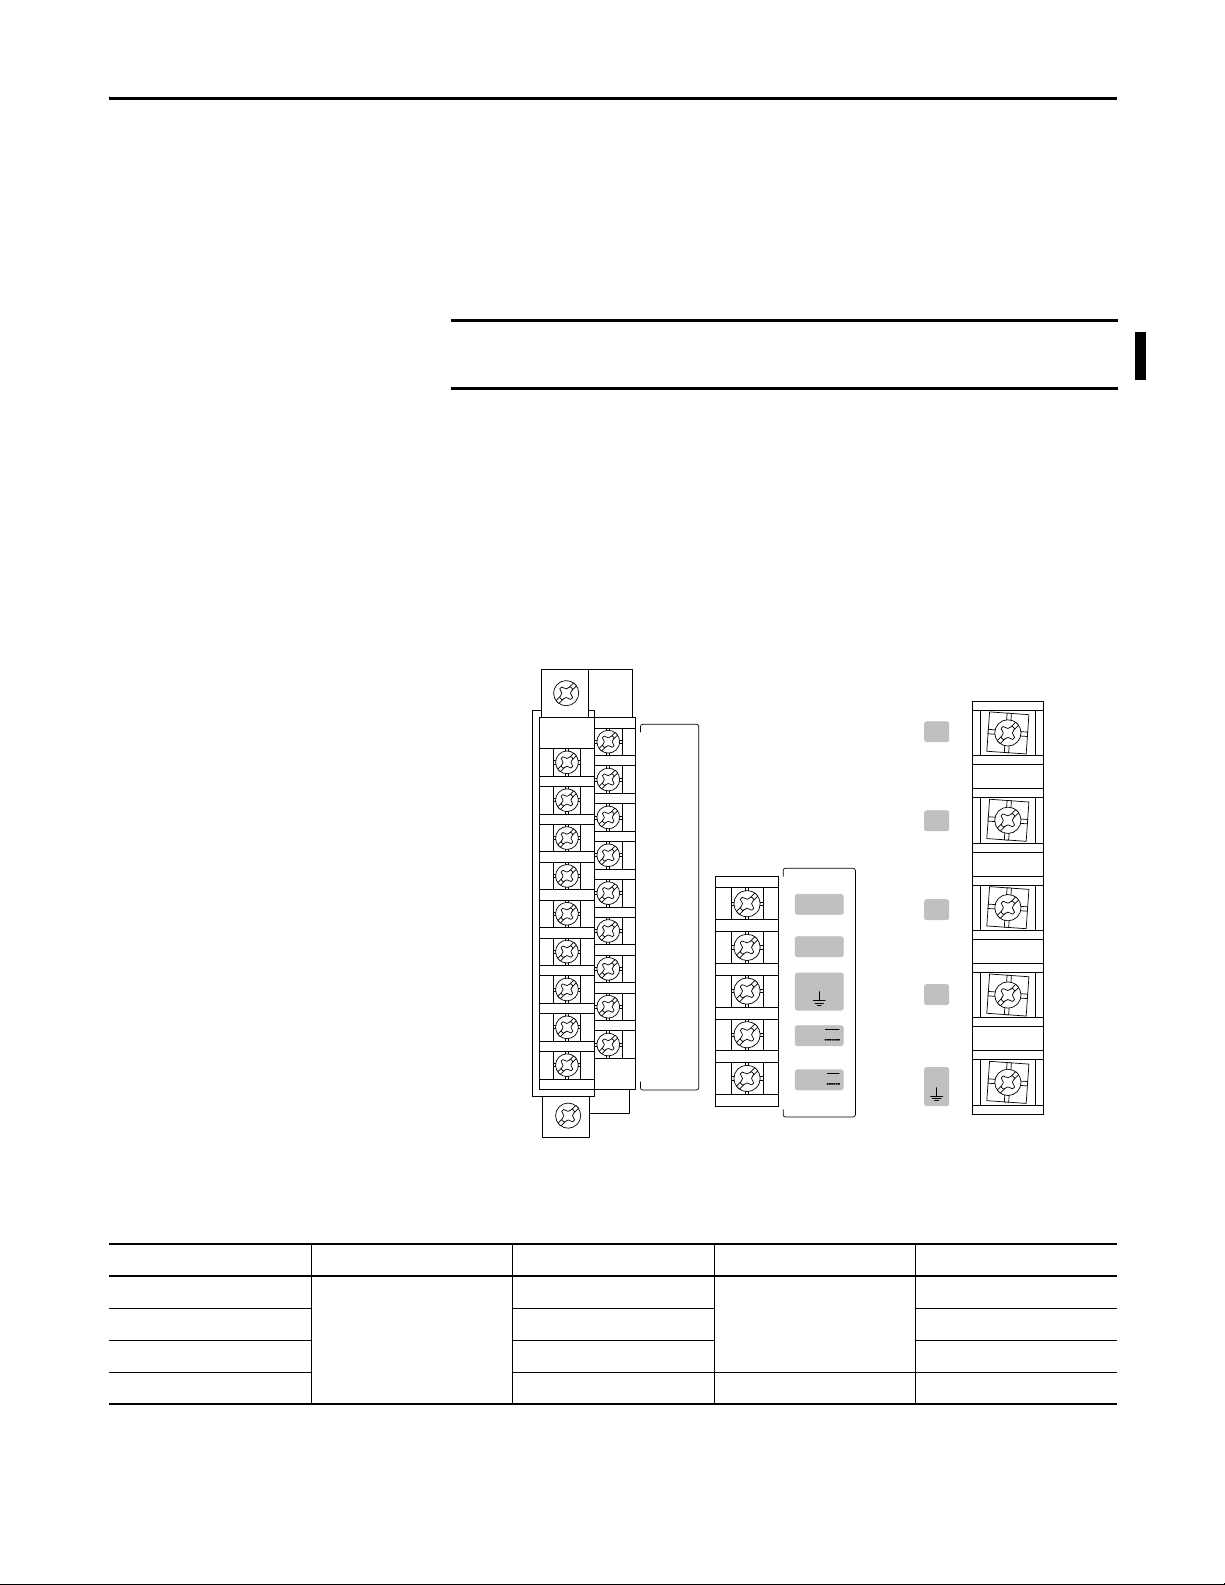
Wire the PowerMonitor 5000 Unit
The PowerMonitor 5000 unit is equipped with screw terminals with pressure
plates and finger protection for the control power, I/O wiring, and voltage
connections. The I/O wiring block is removable.
Current sensing conductors are routed through openings in the power monitor
housing.
Figure 2 - Terminal Block Layout
Wiring Category Wire Type Wire Size Range Wires per Terminal Recommended Torque
Control Power Cu - 75 °C (167 °F) 0.25…2.5 mm
Input/Output (I/O) 0.5…0.8 mm2 (20…18 AWG) 0.68 N•m (6 lb•in)
Voltage Sensing 0.75…2.5 mm
Current S ensing 4 mm
Wire Requirements
2
(22…14 AWG) 2 max 1.27 N•m (11.24 lb•in)
Rockwell Automation Publication 1426-UM001F-EN-P - November 2013 19
2
(18…14 AWG) 1.50 N•m (13.3 lb•in)
2
max (12 AWG max) 1 max N/A
Page 20

Chapter 2 Install the PowerMonitor 5000 Unit
Grounding
This product is intended to be mounted to a well-grounded mounting surface,
such as a metal panel. The upper mounting slots are equipped with protective
conductor terminals, which must must make metal-to-metal contact with the
mounting panel. In solid-state systems, grounding helps limit the effects of noise
due to electromagnetic interference (EMI).
2
Connect a 2.5 mm
PowerMonitor 5000 unit to the ground bus or other low-impedance earth
ground prior to connecting the control power or any other connections.
You must ground voltage and current sensing circuits to limit the maximum
voltage to ground for safety. Ground CT secondary circuits at either the CT or
the shorting terminal block. All grounds must be made to a common ground bus
or terminal.
Refer to the Industrial Automation Wiring and Grounding Guidelines,
publication 1770-4.1
(14 AWG) wire from the GND terminal of the
, for additional information.
Wiring Accessory Kit
The power monitor accessory kit simplifies the installation of a
PowerMonitor 5000 unit by making all the required installation accessories
available in one catalog number, 1400-PM-ACC. The accessory kit includes
three, 10 A fuses and blocks for protecting voltage sensing wiring, a 1 A fuse and
block for control wiring protection, and an 8-pole shorting terminal block for
CT wiring. Please contact your local Rockwell Automation representative for
more information.
Voltage and Current Sensing Connections
The PowerMonitor 5000 unit is capable of monitoring a variety of three-phase
and split-phase circuits. The voltage sensing connections, current sensing wiring,
and metering mode need to be selected to match the configuration of the circuit
being monitored.
Ta b l e 5
modes.
provides a key to selecting the proper wiring diagrams and metering
20 Rockwell Automation Publication 1426-UM001F-EN-P - November 2013
Page 21

Install the PowerMonitor 5000 Unit Chapter 2
Table 5 - Selecting Wiring Diagrams and Metering Modes
Circuit Type Line - Line Voltage No. of CTs No. of PTs Voltage Sensing Current Sensing Metering_Mode
3-phase, 4-wire Wye ≤690 V 3 - Diagram V1 Diagram I3 Wye
> 690 V 3 Diagram V3
3-phase, 3-wire
grounded Wye
3-phase, 4-wire
impedance grounded
Wye
3-phase, 3-wire Delta
or ungrounded Wye
Split-phase/Single-
(1)
phase
3-phase, 3-wire Delta,
Grounded B Phase
3-phase, 4-wire high-
(2)
leg
(wildcat)
For demo use-----Demo
≤690 V - Diagram V2
> 690 V 3 Diagram V5
≤690 V - Diagram V1
> 690 V 3 L-N Diagram V3
3 L-N, 1 N-G Diagram V4
≤690 V 2 - Diagram V2 Diagram I2 Delta 2 CT
3 Diagram I3 Delta 3 CT
> 690 V 2 2
3 Diagram I3 Open Delta 3 CT
≤690 V 2/1 - Diagram V7 Diagram I1 Split-phase
> 690 V 2/1 2/1 Diagram V8
≤690 V 2 - Diagram V9 Diagram I2 Delta Grd B Ph 2 CT
(2)
3 - Diagram I3 Delta Grd B Ph 3 CT
≤690 V 3 - Diagram V10 Diagram I3 Delta High Leg
(3)
Diagram V6 Diagram I2 Open Delta 2 CT
(1) For true single-phase circuits, connect only V1 to N and wire the CT to I1. Use only the Phase 1 results.
(2) Delta Grounded B Phase and Delta High-Leg are not supported above 690 V L-L. Use the 3-phase, 3-wire Delta circuit type.
(3) 2 PTs used in open-delta configuration.
Voltage Sensing
Circuits rated up to 690V AC line-to-line can be connected directly. Higher
voltages require potential transformers (PTs), also known as voltage transformers
(VTs), to step the voltage down.
Wiring must conform to all applicable codes and standards. In particular, suitable
overcurrent protection must be provided by the user, with current and
interrupting ratings selected to protect the wiring.
Pay particular attention to correct phasing and polarity of voltage connections.
The diagrams use the ‘dot’ convention to indicate transformer polarity. The dot
indicates the H1 and X1 terminals on the high side and low side of the
transformer respectively.
When wiring a PowerMonitor 5000 unit to existing PTs and metering devices,
the voltage sensing terminals of the PowerMonitor 5000 unit must be connected
in parallel with the voltage sensing terminals of the existing metering devices.
Rockwell Automation Publication 1426-UM001F-EN-P - November 2013 21
Page 22
Chapter 2 Install the PowerMonitor 5000 Unit
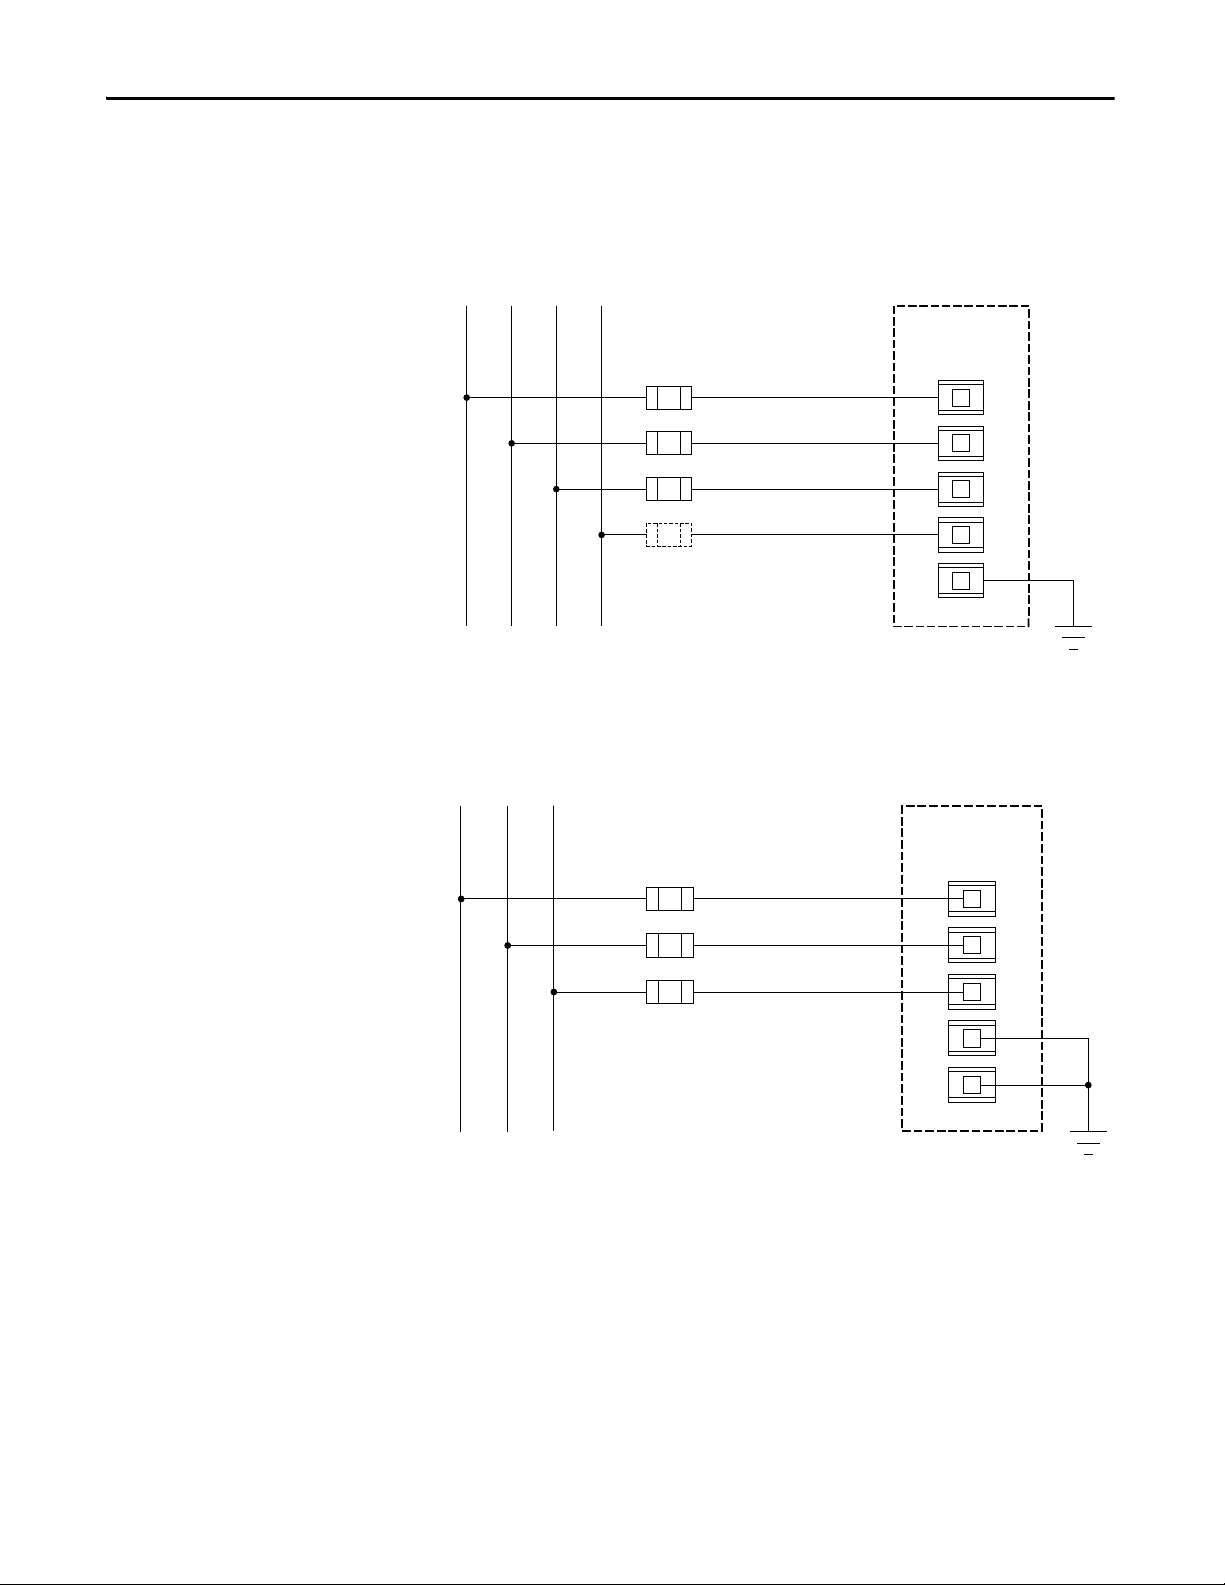
Metering_Mode = Wye
V1
V2
VG
V3
VN
PowerMonitor 5000
Fuses (by user)
L1 L2 L3 N
Line
Load
Ground
(1) Fuse in neutral connection is required for impedance grounded systems.
(1)
V1
V2
VG
V3
VN
Metering_Mode = Wye,
Delta 2 CT or Delta 3 CT,
as applicable
PowerMonitor 5000
Fuses (by user)
L1 L2 L3
Line
Load
Ground
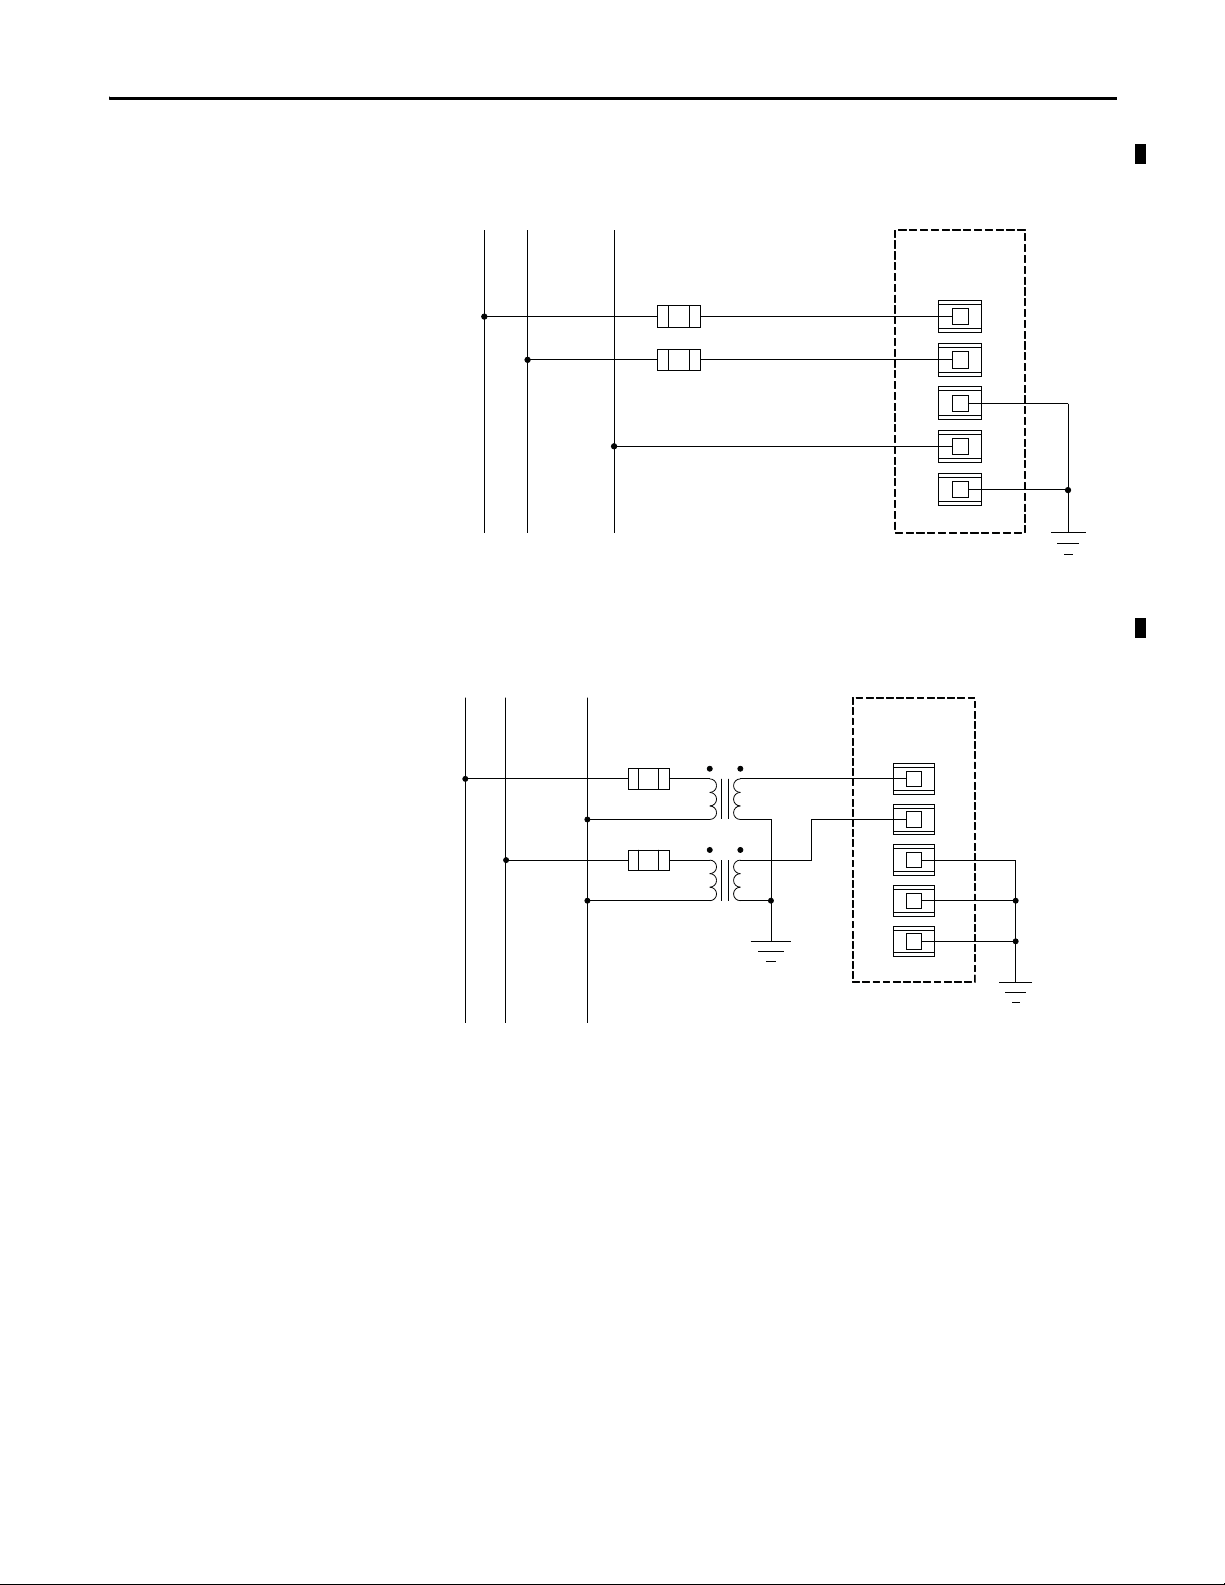
The following wiring diagrams indicate typical voltage sensing connections to
various types of power systems.
Figure 3 - Diagram V1 - 3-phase, 4-wire Wye, (690V AC line-to-line maximum)
Figure 4 - Diagram V2 - 3-phase, 3-wire Grounded Wye, or 3-phase, 3-wire Delta (690V AC line-toline maximum)
22 Rockwell Automation Publication 1426-UM001F-EN-P - November 2013
Page 23
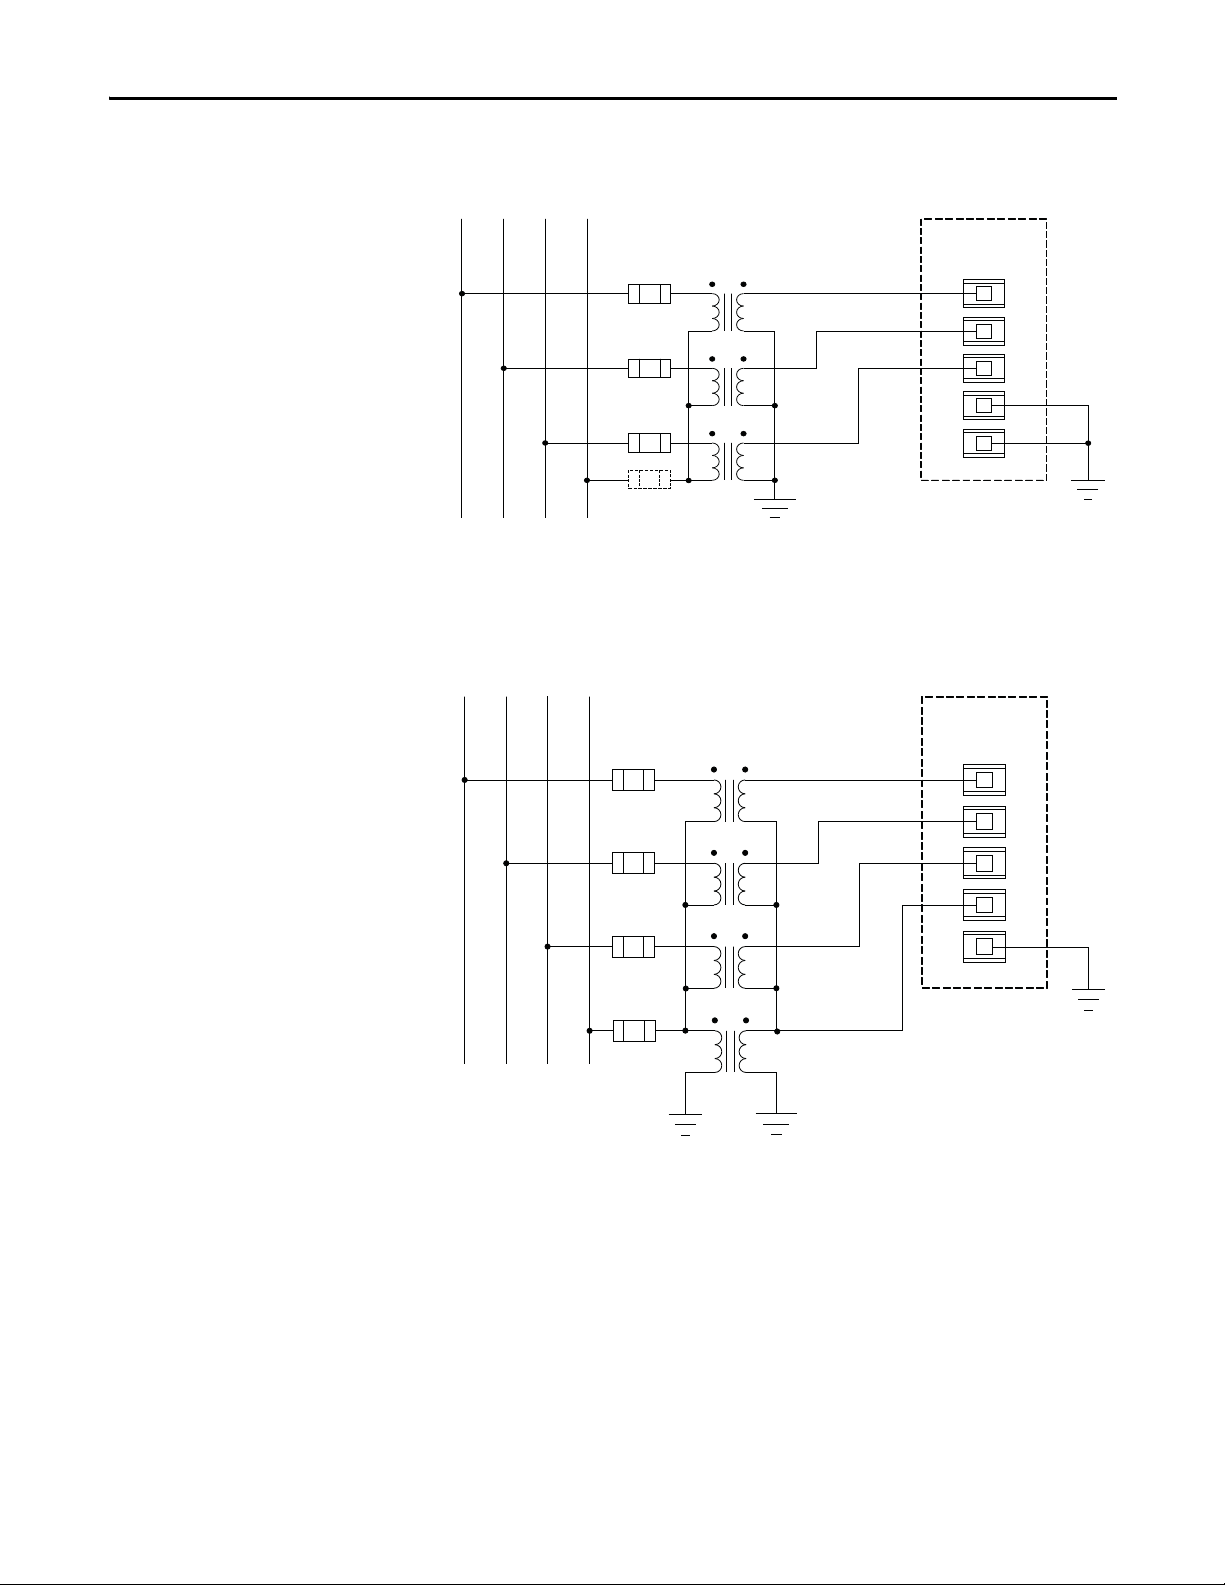
Install the PowerMonitor 5000 Unit Chapter 2
Figure 5 - Diagram V3 - 3-phase, 4-wire Wye or Impedance Grounded Wye with PTs (no neutral PT)
Line
L1 L2 L3 N
Load
(1) Fuse in neutral connection is required for impedance grounded systems.
Metering_Mode = Wye
Fuses (by user)
(1)
PTs (by user)
PowerMonitor 5000
V1
V2
V3
VN
VG
Ground
Ground
Figure 6 - Diagram V4 - 3-phase, 4-wire Impedance Grounded Wye with Line and Neutral PTs
Line
L1 L2 L3 N
Metering_Mode = Wye
Load
Fuses (by user) PTs (by user)
Ground
PowerMonitor 5000
V1
V2
V3
VN
VG
Ground
Ground
Rockwell Automation Publication 1426-UM001F-EN-P - November 2013 23
Page 24
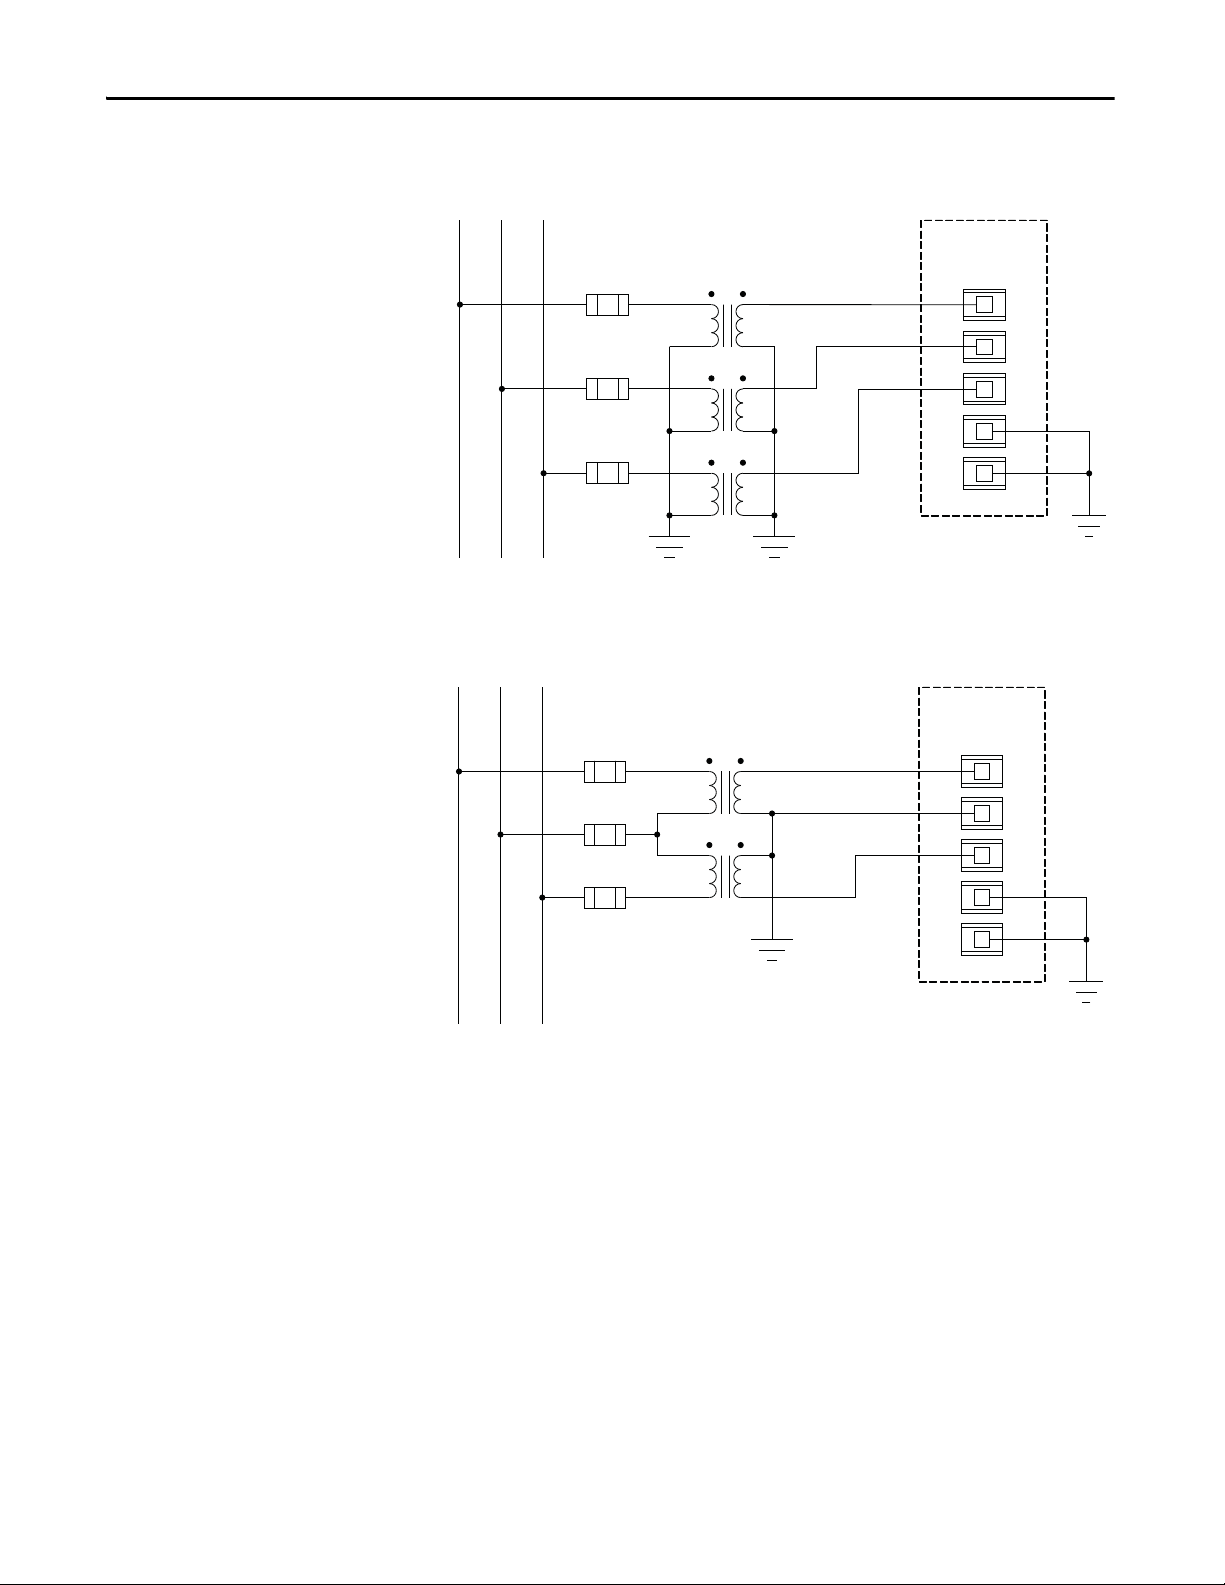
Chapter 2 Install the PowerMonitor 5000 Unit
Metering_Mode = Open Delta 2 CT
or Open Delta 3 CT, as applicable
V1
V2
VG
V3
VN
PowerMonitor 5000
Fuses (by user) PTs (by user)
L1 L2 L3
Line
Ground
Ground
Load
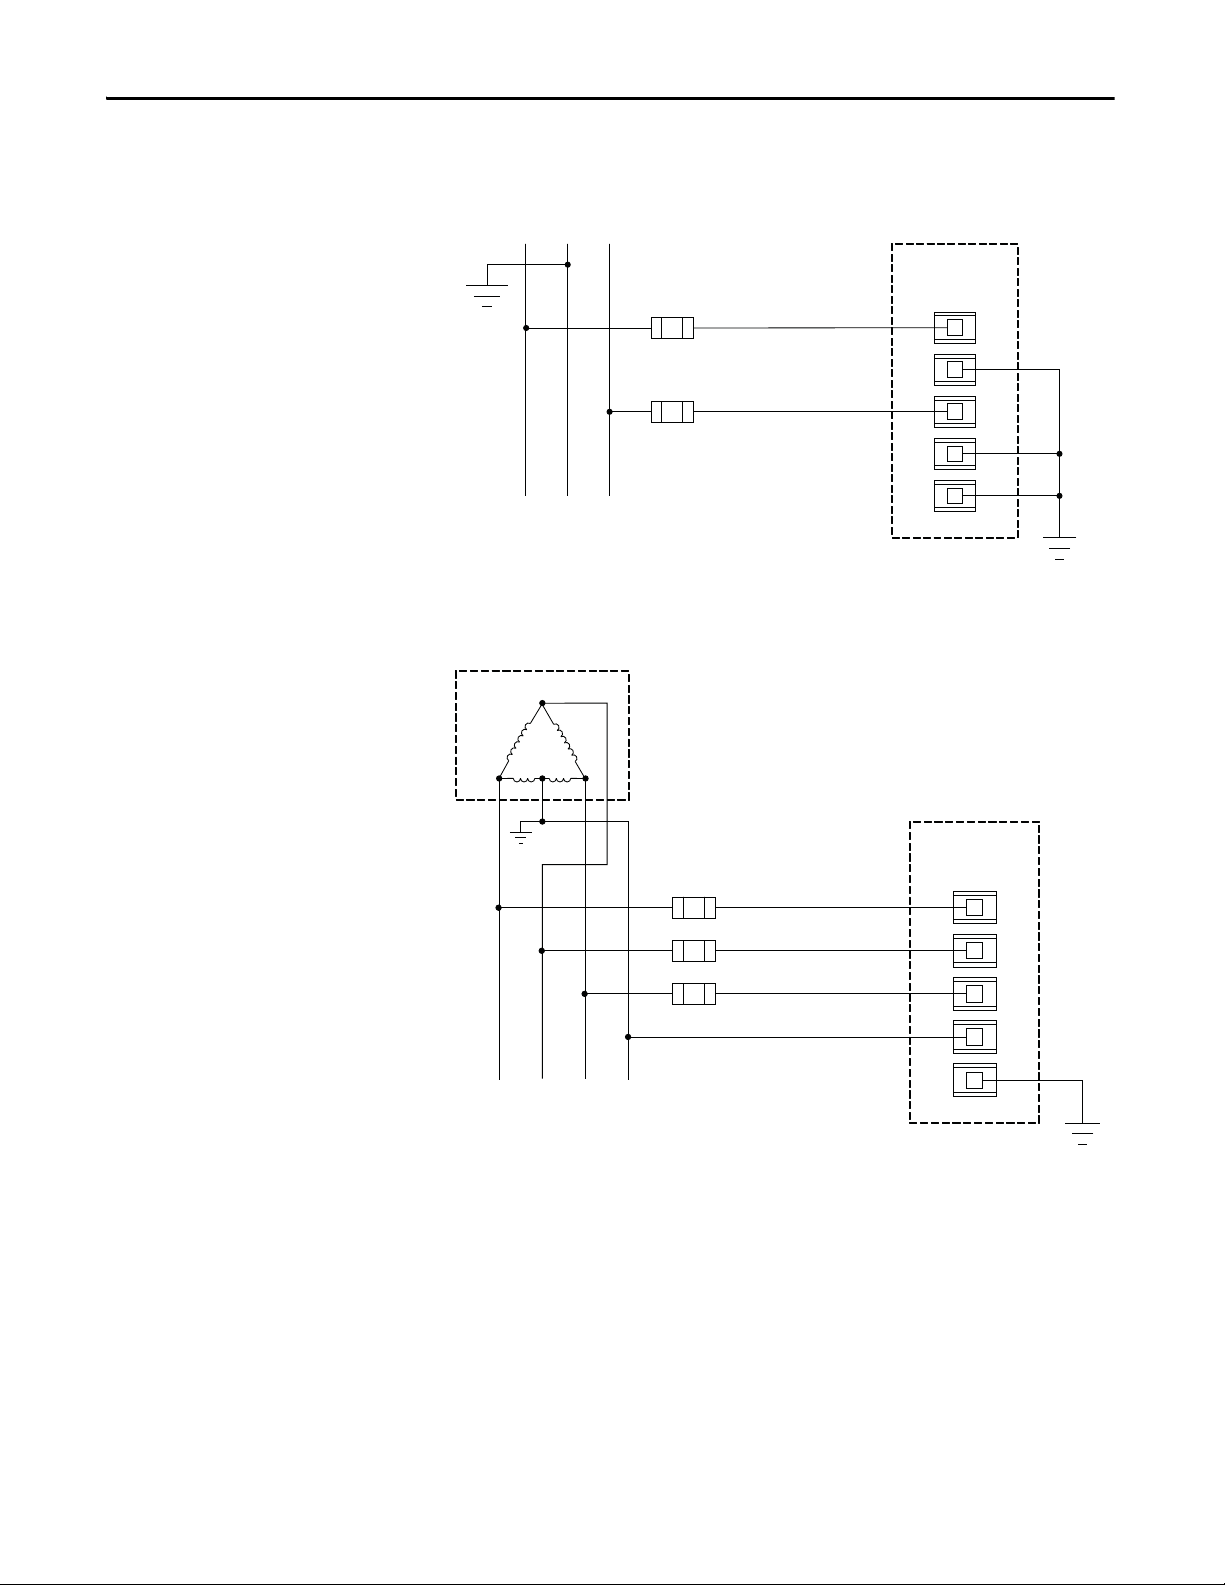
Figure 7 - Diagram V5 -3-phase, 3-wire Grounded Wye with PTs
Line
L1 L2 L3
Metering_Mode = Wye
Fuses (by user) PTs (by user)
Ground GroundLoad
Figure 8 - Diagram V6 - 3-phase, 3-wire Open Delta with Two PTs
PowerMonitor 5000
V1
V2
V3
VN
VG
Ground
24 Rockwell Automation Publication 1426-UM001F-EN-P - November 2013
Page 25
Install the PowerMonitor 5000 Unit Chapter 2
Metering_Mode = Split-phase
V1
V2
VG
V3
VN
PowerMonitor 5000
Fuses (by user)
PTs (by user)
L1 L2 N
Line
Ground
Ground
Load
Figure 9 - Diagram V7 - Split-phase (690V AC line-to-line maximum)
Line
L1 L2 L3 N
Metering_Mode = Split-phase
PowerMonitor 5000
Fuses (by user)
Load
Figure 10 - Diagram V8 - Split-phase with PTs
V1
V2
V3
VN
VG
Ground
Rockwell Automation Publication 1426-UM001F-EN-P - November 2013 25
Page 26
Chapter 2 Install the PowerMonitor 5000 Unit
(1)
Metering_Mode = Delta High-leg
V1
V2
VG
V3
VN
PowerMonitor 5000
Fuses (by user)
High-leg
Transformer
(by user)
L1 L2 L3 N
N
C
B
A
Ground
Load
Figure 11 - Diagram V9 - 3-phase, 3-wire Grounded B-phase (690V AC line-to-line maximum)
Metering_Mode = Delta Grd B Ph 2 CT
Line
L1 L2 L3
Distribution
Ground
or Delta Grd B Ph 3 CT, as applicable
Fuses (by user)
PowerMonitor 5000
V1
V2
V3
VN
Load
(1) You can also connect V2 to L2. In this case, omit the connection from V2 to VN.
VG
Ground
Figure 12 - Diagram V10 - 3-phase, 4-wire High-leg Delta (690V AC line-to-line maximum)
26 Rockwell Automation Publication 1426-UM001F-EN-P - November 2013
Page 27
Install the PowerMonitor 5000 Unit Chapter 2
IMPORTANT
To s horti ng te rmin al bl ock
and current transformer (CT).
X1
X2
I1
I2
I3
I4
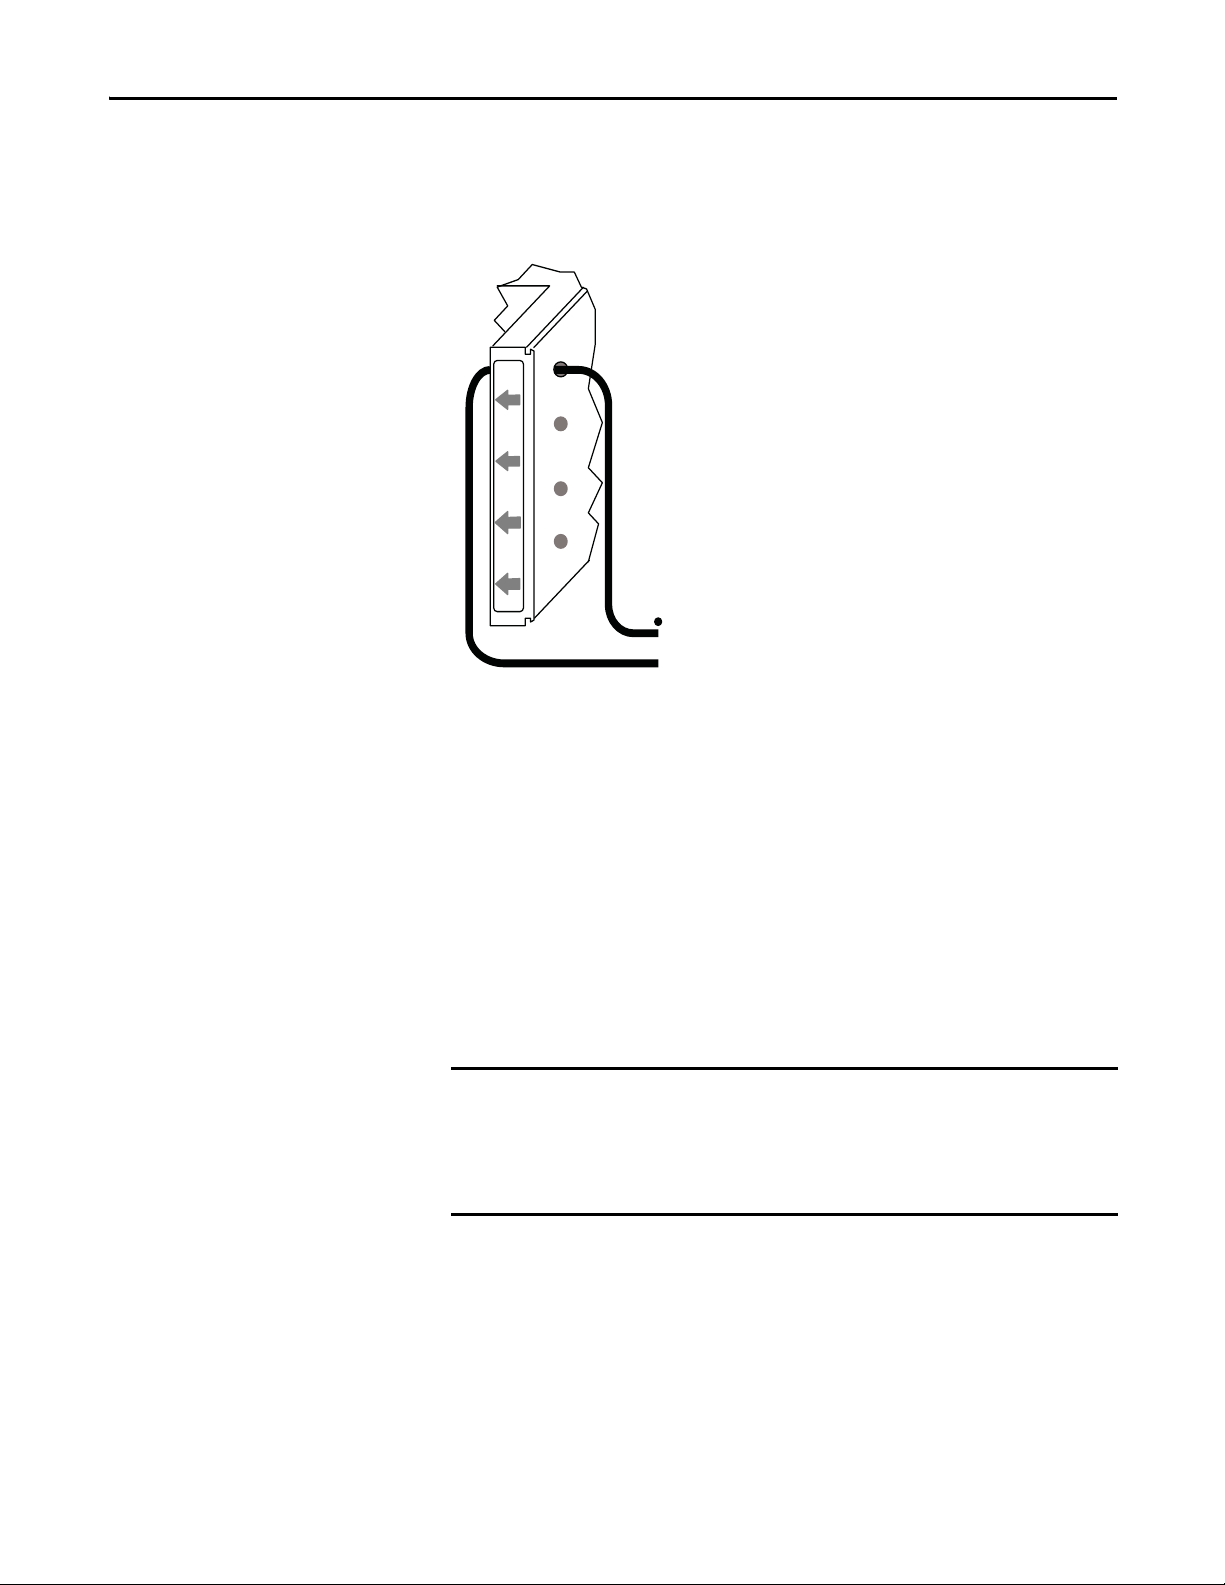
Current Sensing
Route the CT secondary wiring through the openings in the
PowerMonitor 5000 unit as shown.
Use a shorting terminal block (included in the 1400-PM-ACC accessory kit),
test block, or shorting switch (by user) for CT wiring to permit safely servicing
connected equipment such as the PowerMonitor 5000 unit without deenergizing the power system.
Use 2.5 mm
PowerMonitor 5000 unit and the shorting block. Use 2.5 mm
2
(14 AWG) or 3.3 mm2 (12 AWG) (maximum) wiring between the
2
(14 AWG) or
larger wire between the shorting block and the CTs, depending on the length of
the circuit. Longer circuits require larger wire so that the wiring burden does not
exceed the CT burden rating and reduce system accuracy. Note that the diameter
of the current sensing wiring openings is 7 mm (0.27 in.).
Ring lugs are recommended for making CT secondary connections. Standard
ring lugs do not pass through the current sensing openings of the
PowerMonitor 5000 unit. We recommend that the installer pass the wire from
the shorting terminal block through the current sensing opening before
crimping on ring lugs.
When wiring a PowerMonitor 5000 unit to existing CTs and metering devices,
current sensing circuits of the PowerMonitor 5000 unit must be wired in series
with the CT secondary and current sensing circuits of the existing metering
devices.
Do not install overcurrent protection or non-shorting disconnecting means in
CT secondary wiring. Connect the current sensing circuit to a low-impedance
earth ground at only one point.
Rockwell Automation Publication 1426-UM001F-EN-P - November 2013 27
Page 28
Chapter 2 Install the PowerMonitor 5000 Unit
L1 L2
N
(if used)
Line
CTs (by user)
CT1
CT2
CTN
(if used)
Load
Ground
Shorting Terminal
Block (by user)
Metering_Mode = Split-phase
PowerMonitor 5000
I1
I2
I3
I4
X1
X1
X1
X1
Pay particular attention to the correct phasing and polarity of current sensing
connections. The diagrams use the ‘dot’ convention to indicate transformer
polarity. The dot indicates the H1 and X1 terminals on the primary and
secondary of the CT respectively. Phasing of the CTs must correspond to the
phasing of the voltage sensing connections.
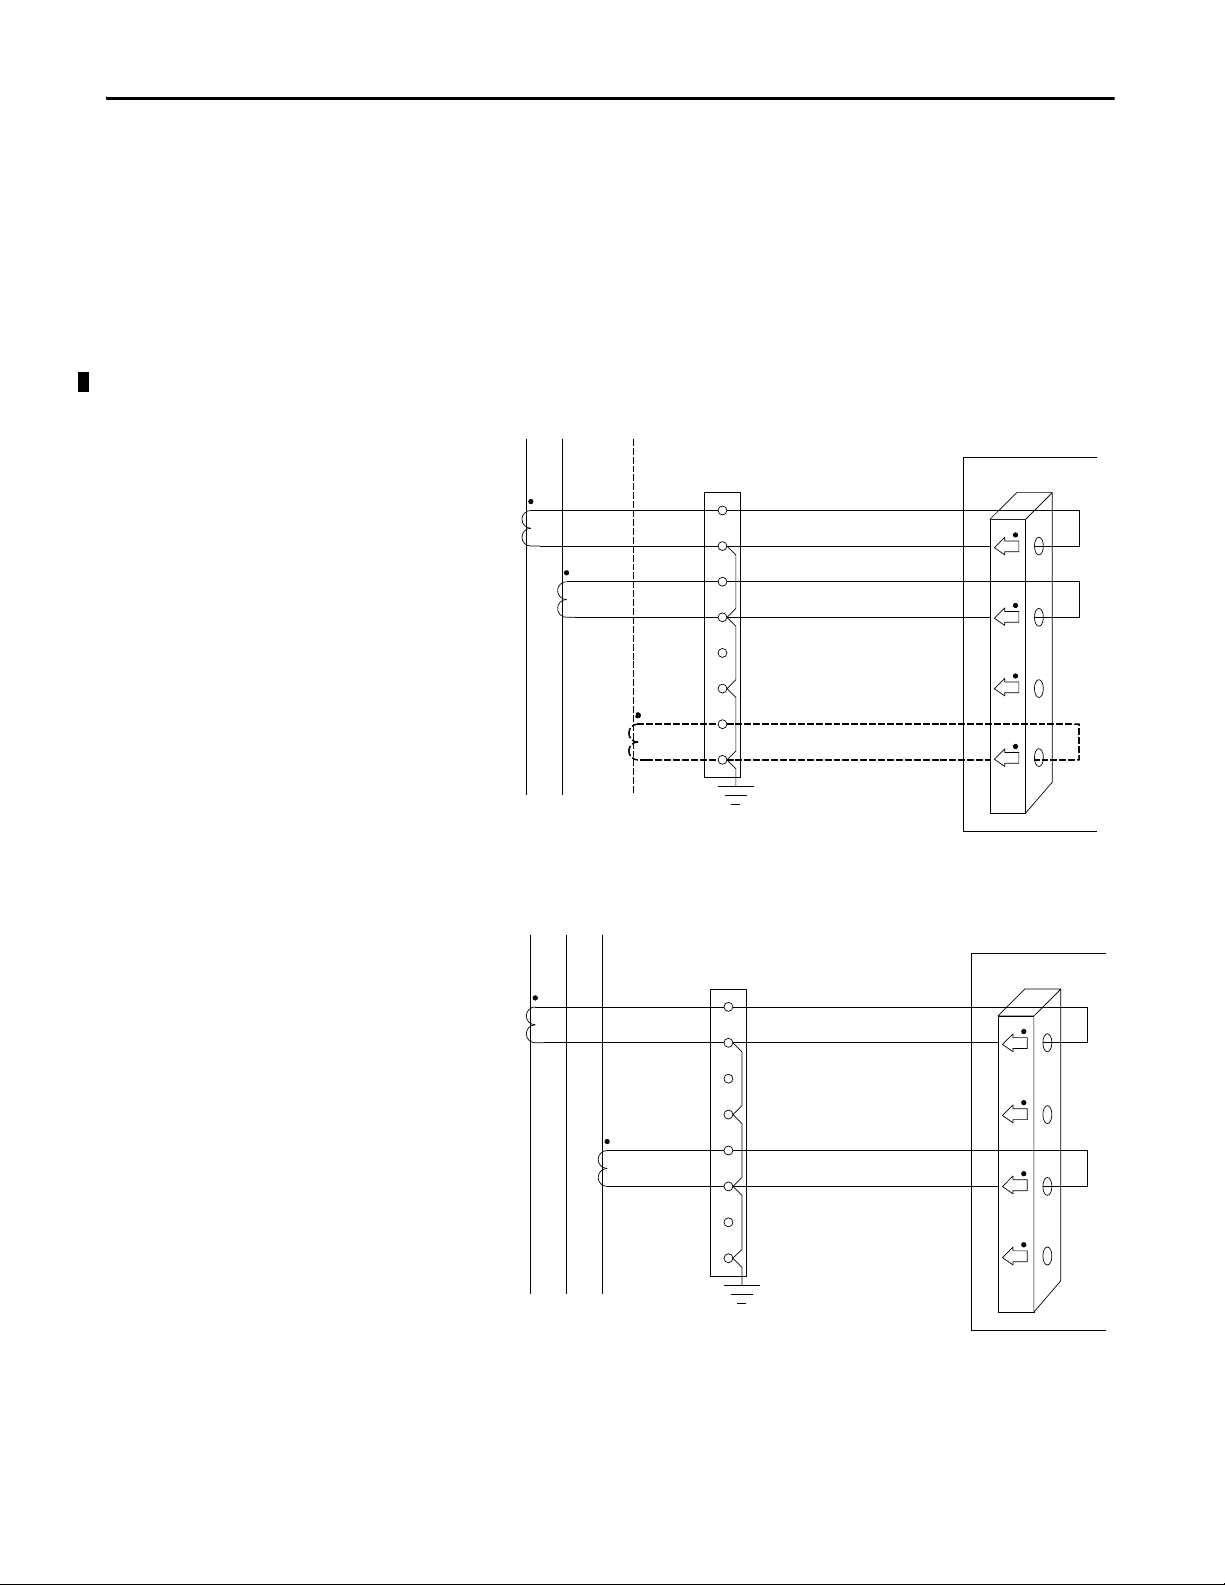
The following wiring diagrams indicate typical current sensing connections to
various types of power systems.
Figure 13 - Diagram I1 - Split-phase, 2 CTs
Figure 14 - Diagram I2 - 3-phase, 3-wire, 2 CTs
Line
L1 L2 L3
CTs (by user)
CT1
CT3
Load
28 Rockwell Automation Publication 1426-UM001F-EN-P - November 2013
Metering_Mode = Delta 2 CT, Open Delta 2 CT,
Shorting Terminal
Block (by user)
or Delta Grd B Ph 2 CT, as applicable
2 CTs Can Be Used Only
On 3-wire Systems
Ground
PowerMonitor 5000
I1
X1
I2
X1
I3
X1
I4
X1
Page 29
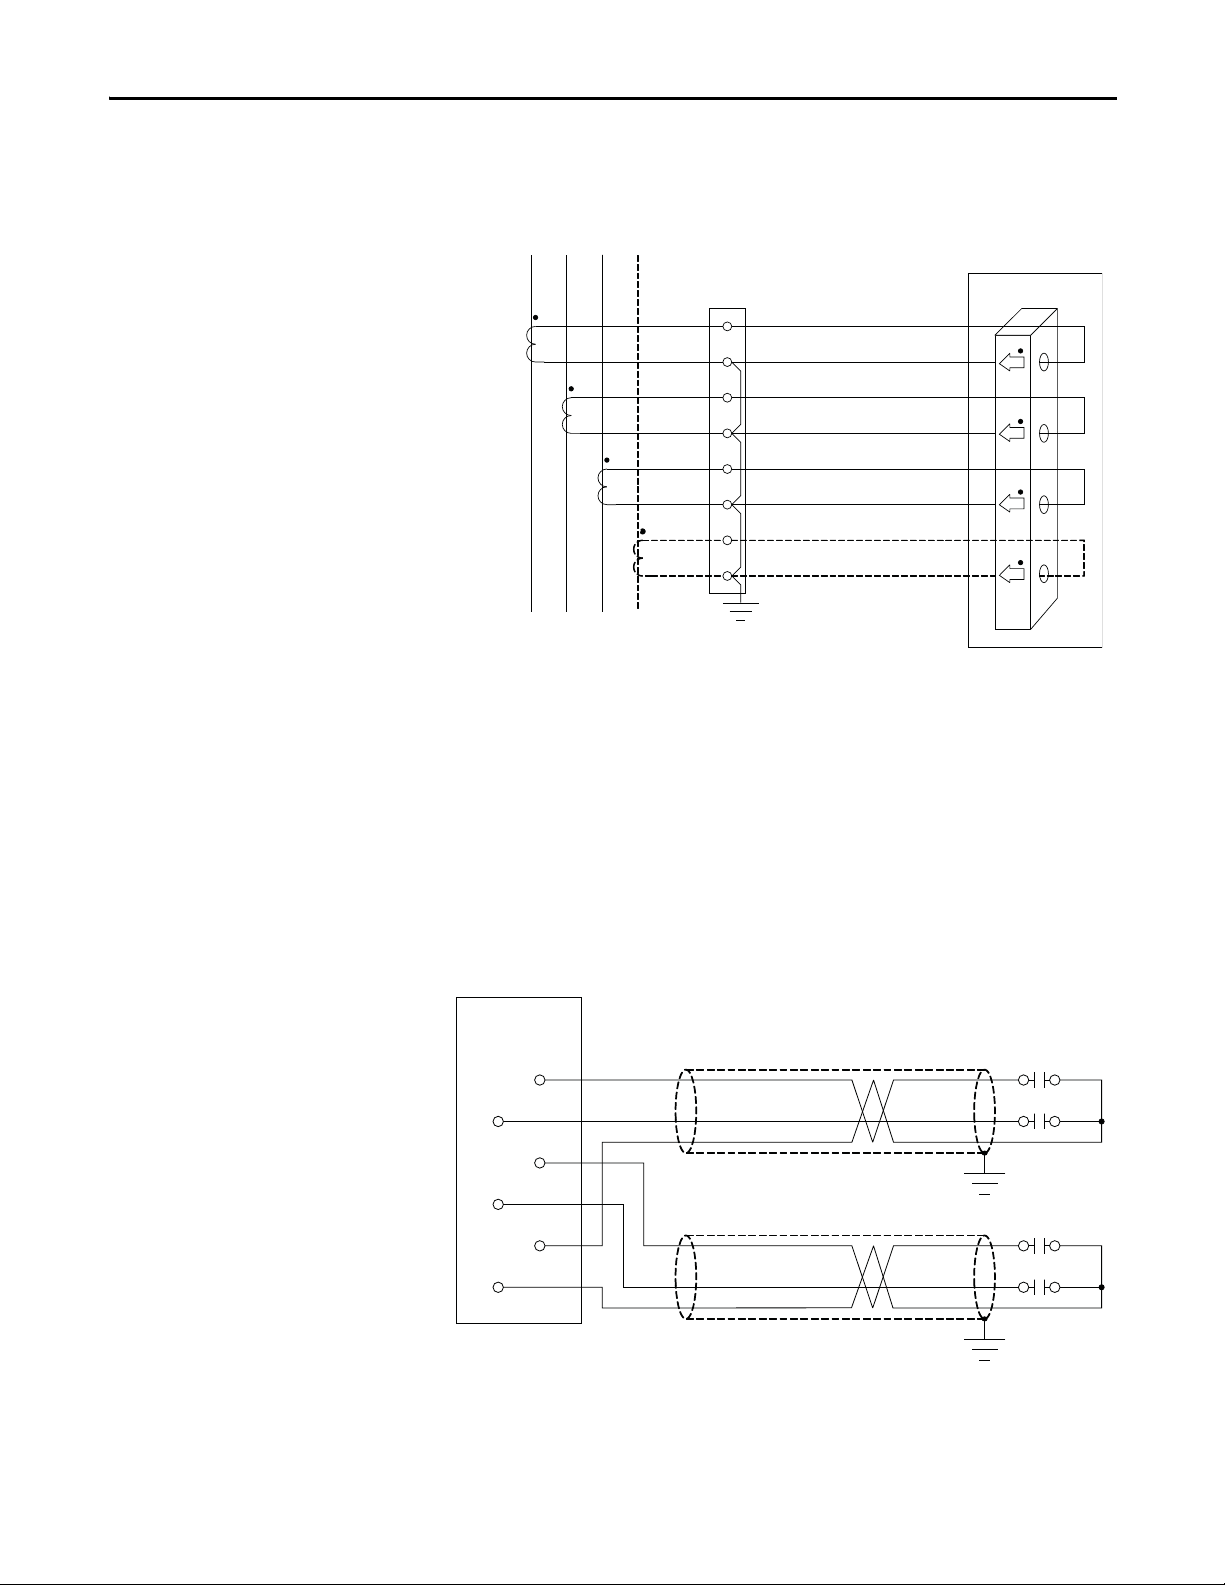
Figure 15 - Diagram I3 - 3-phase, 3- or 4-wire, 3 CTs
S1
S2
S3
S4
Scom
Scom
Ground
Ground
Contact 1
Contact 2
Contact 3
Contact 4
PowerMonitor 5000
Metering_Mode = Wye, Delta 3 CT, Open Delta 3 CT,
Delta Grd B Ph 3 CT, or Delta High-leg, as applicable
N
Shorting Terminal
Block (by user)
CTs (by user)
CT1
Line
L1 L2 L3
(if used)
Install the PowerMonitor 5000 Unit Chapter 2
PowerMonitor 5000
I1
X1
CT2
CT3
Load
CT4
(if
used)
Ground
I2
X1
I3
X1
I4
X1
Status Inputs
Up to four dry (non-powered) contacts can be connected to the
PowerMonitor 5000 unit status inputs. The status input derives 24V DC power
from its internal power supply.
Connect status inputs by using shielded, twisted-pair cable with the shield
connected to the ground bus or other low-impedance earth ground at the contact
end only. The diagram indicates typical status input wiring.
Figure 16 - Status Inputs
Rockwell Automation Publication 1426-UM001F-EN-P - November 2013 29
Page 30
Chapter 2 Install the PowerMonitor 5000 Unit
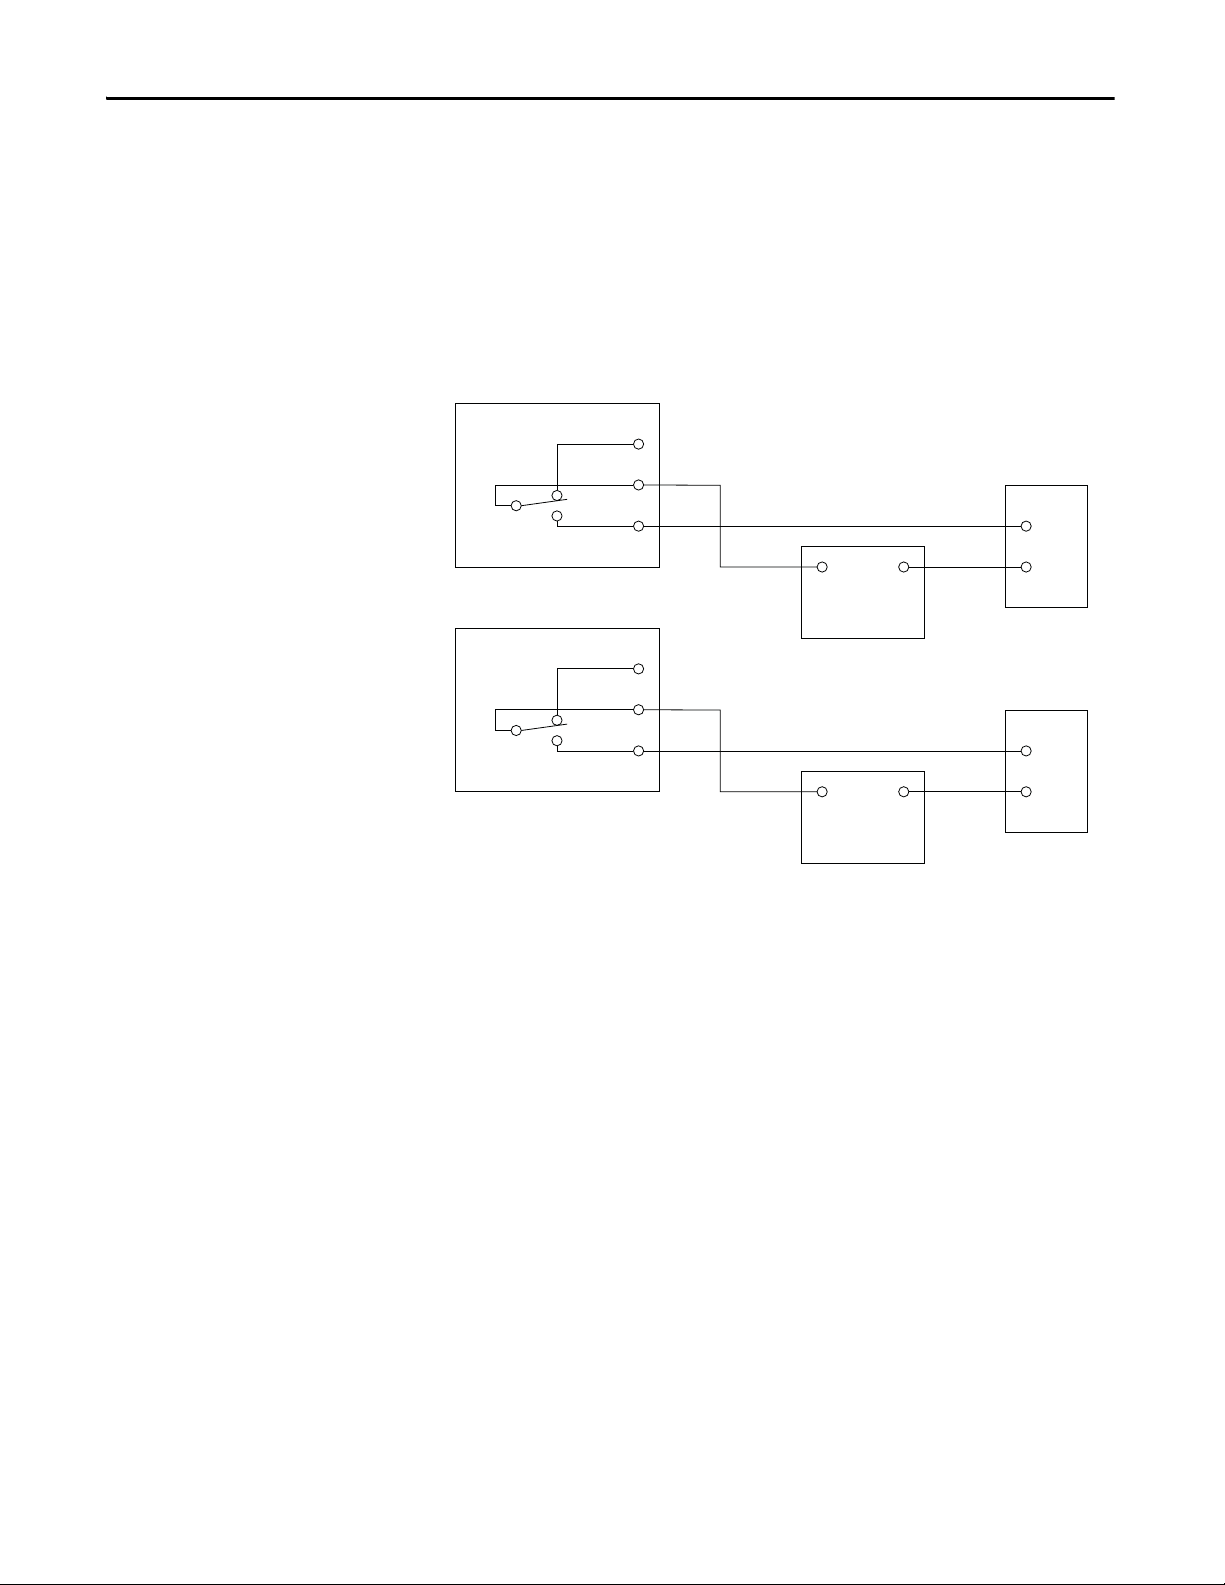
KYZ and Relay Outputs
The KYZ solid-state relay output can be connected to an external pulse
accumulator or controller. Relay outputs can be used for control of loads,
switching of circuit breakers, signaling, and other applications. Wetting voltage
must be provided by the external device or circuit. The KYZ output is designed
for low-current switching. The diagram indicates typical KYZ and relay output
wiring.
Figure 17 - KYZ and Relay Outputs
(N.C.)
(COM)
(N.O.)
PowerMonitor 5000
(equivalent circuit)
(N.C.)
(COM )
(N.O.)
PowerMonitor 5000
(typical for R1, R2, and R3)
Z
K
Y
Rn C
Rn com
Rn O
( + ) ( - )
Wetting Power
Supply
Max 240V AC/DC
(by user)
( + ) ( - )
Wetting Power
Supply
Max 240V AC/DC
(by user)
IN 1
COM
Pulse Accumulator
or Controller
(by user)
T1
T2
Controlled Load
(by user)
30 Rockwell Automation Publication 1426-UM001F-EN-P - November 2013
Page 31

Install the PowerMonitor 5000 Unit Chapter 2
* Provided by user.
TIP
Control Power
Connect the PowerMonitor 5000 unit to a source of 120/240V AC (or 24V DC,
shown with dashed lines) control power through a user-provided disconnecting
means, such as a switch or circuit breaker close to the power monitor. Provide
overcurrent protection sized to protect the wiring, for example, a 5 A rated fuse.
Overcurrent protection is included in the 1400-PM-ACC accessory kit. The
PowerMonitor 5000 unit is internally protected. Apply control power only after
all wiring connections are made to the unit.
Figure 18 - Control Power
**
L1
L2
GND
**
24V
com
120/240V AC 50/60 Hz,
or 120/ 240V DC
24V DC
Connect Communication
Ground
This section describes how to connect communication networks.
USB Communication
The USB Device port can be used to set-up a temporary, point-to-point
connection between a personal computer and the PowerMonitor 5000 unit. This
connection is used for configuration, data monitoring, diagnostics, and
maintenance by using the unit's built-in web pages. The USB Device port is a
standard USB Mini-B receptacle. You need to install drivers to enable USB
communication.
To connect your personal computer to the PowerMonitor 5000 unit, use a
standard USB cable with a Type-A and Mini-B male plugs, Allen-Bradley catalog
number 2711C-CBL-UU02 or equivalent.
You can also display the PowerMonitor 5000 web interface by using a
PanelView Plus 6 terminal with a 2711P-RP9_ logic module with extended
features. USB communication drivers are already installed in the logic module.
Refer to Configure the Connection
on page 34 to continue the setup.
Rockwell Automation Publication 1426-UM001F-EN-P - November 2013 31
Page 32

Chapter 2 Install the PowerMonitor 5000 Unit
Install Drivers
Yo u c an do wn lo ad dr iv er s f ro m
http://www.rockwellautomation.com/compatibility
Follow the steps listed below to install the USB driver.
1. Connect the PowerMonitor 5000 unit to your computer with a USB cable
and apply power to the power monitor.
The computer detects the new device and prompts you to install the driver.
2. Click ‘Yes, this time only’ and click Next.
.
3. Click Install from a list or specific location (Advanced) and click Next.
32 Rockwell Automation Publication 1426-UM001F-EN-P - November 2013
Page 33

Install the PowerMonitor 5000 Unit Chapter 2
4. Click Browse and select the folder containing the driver .inf file.
5. Click Next.
Wait while the driver installs.
6. Click Finish when the driver installation is complete.
Rockwell Automation Publication 1426-UM001F-EN-P - November 2013 33
Page 34

Chapter 2 Install the PowerMonitor 5000 Unit
TIP
Configure the Connection
Follow these steps to configure the connection.
1. From the Windows desktop, choose Start > Settings > Network
Connections.
A new Local Area Connection with a Device Name ‘Remote NDIS based
Device’ was added when you installed the driver.
2. Right-click the connection name and choose Properties.
Setting up a PanelView 6 terminal in Windows CE follows a similar process.
Please refer to the Rockwell Automation Knowledgebase answer ID 115608 or
455067 if you need further details.
34 Rockwell Automation Publication 1426-UM001F-EN-P - November 2013
Page 35

Install the PowerMonitor 5000 Unit Chapter 2
3. Select Internet Protocol (TCP/IP) and click Properties.
4. Click Use the following IP address and type in the address
192.168.169.100.
The default subnet mask 255.255.255.0 is correct. The default IP address
of the PowerMonitor 5000 unit is 192.168.169.3.
Rockwell Automation Publication 1426-UM001F-EN-P - November 2013 35
Page 36

Chapter 2 Install the PowerMonitor 5000 Unit
IMPORTANT
Browse the PowerMonitor 5000 Web Page by Using the USB Connection
Open the Internet Explorer browser on the computer and browse to the url
http://192.168.169.3.
The PowerMonitor 5000 web page displays in your browser.
Your browser must have Allow Scriptlets set to Enable for the
applicable security zone for configuration changes to be made to the
power monitor by using the web page.
By default the security setting of the power monitor's webpage is disabled.
36 Rockwell Automation Publication 1426-UM001F-EN-P - November 2013
Page 37

Install the PowerMonitor 5000 Unit Chapter 2
C
O M M U N IC AT I O N P O
R T
C O M M U N I C A T IO N P O R T
Ethernet Switch Uplink to LAN
PowerMonitor 5000 Unit PowerMonitor 5000 Unit
Native Ethernet Communication
The PowerMonitor 5000 unit connects easily to industry-standard Ethernet hubs
and switches by using standard CAT-5 UTP (unshielded twisted-pair) cables
with RJ45 connectors. The table below shows the cable and connector pin
assignments.
Table 6 - Cable and Connector Pin Assignments
Terminal Signal Function
1TX+TX+
2TX-TX-
3RX+RX+
4
5
6RX-RX-
7
8
Typical Ethernet connections are shown in the diagram below.
Figure 19 - Typical Ethernet Connections
Module
Power
status
Cong Lock
Network
status
USB
Device
USB
Host
IP
LNK
EtherNet √
ACT
C
PowerMonitor 5000
Y
---- S1
Rx com Rx C
Rx O
S2
---- S3
Internal
24VDC
S4
---- S com
S com
---- K
Y
---- Z
R1 O
---- R1 com
R1 C
---- R2 O
GND
R2 com
---- R2 C
R3 O
24V
---- R3 com
R3 C
com
Virtual Wiring
Correction
Z
K
S n
Scom
L1
L2
I 1
V1
I 2
V2
V3
I 3
VN
VG
I 4
Module
Power
status
Cong Lock
Network
status
USB
Device
USB
Host
---- S1
S2
IP
LNK
ACT
---- S3
S4
---- S com
EtherNet √
S com
---- K
Y
---- Z
R1 O
---- R1 com
R1 C
---- R2 O
R2 com
---- R2 C
R3 O
---- R3 com
R3 C
Virtual Wiring
KYZ
S n
L1
L2
GND
Correction
I 1
V1
Scom
I 2
V2
V3
I 3
VN
VG
I 4
PowerMonitor 5000
Rx com Rx C
Rx O
Internal
24VDC
24V
com
Rockwell Automation Publication 1426-UM001F-EN-P - November 2013 37
Page 38

Chapter 2 Install the PowerMonitor 5000 Unit
IMPORTANT
Optional DeviceNet Network Communication
An optional DeviceNet port can be factory-installed in PowerMonitor 5000
units with a catalog number ending in -DNT, and can also be purchased from
Rockwell Automation and installed by the user.
ATT EN TI ON : Power must be removed from the power monitor before inserting
or removing an optional communication card. Inserting or removing an
optional communication card under power can damage the card or the power
monitor.
For information on installing the optional communication card, see the
PowerMonitor 5000 Optional Communication Modules Installation
Instructions, publication 1426-IN002
For detailed DeviceNet system installation information, including cable lengths,
the placement of terminating resistors, power supplies, and other media
components, refer to the DeviceNet Cable System Planning and Installation
Manual, publication DNET-UM072
.
.
Install suitable terminating resistors at the ends of the DeviceNet cable.
You must install and wire a suitable 24V DC power supply to the V+ and Vconductors in the DeviceNet cable. The power monitor consumes less than
50 mA from the DeviceNet 24V DC supply.
Configuration options for optional DeviceNet communication include the node
address (MAC ID) and data rate. Defaults are node 63 and 125 Kbps.
Table 7 - DeviceNet Terminal Block Wiring Connections
Terminal Signal Function Color
1 COM (V-) Common Black
2 CAN_L Signal Low Blue
3 SHIELD Shield Uninsulated
4 CAN_H Signal High White
5 VDC+ (V+) Power Supply Red
38 Rockwell Automation Publication 1426-UM001F-EN-P - November 2013
Page 39

121 Ω
Terminating
Resistor
(See Note 2)
121 Ω
Terminating
Resistor
(see Note 2)
Personal Computer With
1784-PCDPCMCIA Interface Card
Or
1770-KFD Interface Box
Or
SLC™ Controller With
1747-SDN Scanner
1) Example network protrayed.
For detailed DeviceNet
installations, including
cable requirements, refer to
the DeviceNet Cable System
Planning and Installation Manual,
publication DNET-UM072.
2) Terminating resistors
must be connected
to each end of the
DeviceNet network. Omit the
terminating resistors
if the devices are already
equipped with internal
terminating resistors.
V-
V+
CAN_L
SHLD
CAN_H
V-
V+
CAN_L
SHLD
CAN_H
V-
V+
CAN_L
SHLD
CAN_H
V-
V+
CAN_L
SHLD
CAN_H
+
-
DeviceNet
24V DC
Power Supply
Or Other DeviceNet
Scanner Devices
Or
ControlLogix® Controller
With 1756-DNB Scanner
Virtual Wiring
Correction
---- S1
S2
---- S3
S4
---- S com
S com
---- K
Y
---- Z
R1 O
---- R1 com
R1 C
---- R2 O
R2 com
---- R2 C
R3 O
---- R3 com
R3 C
Module
status
Network
status
Cong Lock
EtherNet √
IP
PowerMonitor 5000
Power
USB
Device
USB
Host
LNK
ACT
I 1
I 2
I 3
I 4
L1
L2
GND
24V
com
Rx O
V1
V2
V3
VN
VG
1
DS NS
2345
DeviceNet
12345
Internal
24VDC
Y
K
Rx com Rx C
S n
Install the PowerMonitor 5000 Unit Chapter 2
Figure 20 - Connecting a Powermonitor 5000 Unit to Other DeviceNet Devices
Z
Scom
Rockwell Automation Publication 1426-UM001F-EN-P - November 2013 39
Page 40

Chapter 2 Install the PowerMonitor 5000 Unit
Optional ControlNet Communications
An optional ControlNet port can be factory-installed in PowerMonitor 5000
units with a catalog number ending in -CNT, and can also be purchased from
Rockwell Automation and installed by the user.
ATT EN TI ON : Power must be removed from the power monitor before inserting
or removing an optional communication card. Inserting or removing an
optional communication card under power may damage the card or the power
monitor.
For information on installing the optional communication card, see the
PowerMonitor 5000 Optional Communication Modules Installation
Instructions, publication 1426-IN002
A ControlNet media installation includes trunk cable, taps and terminators, and
can include optional redundant media. For detailed ControlNet system
installation information, refer to the ControlNet Coax Media Planning and
Installation Guide, publication CNET-IN002
Configuration User Manual, publication CNET-UM001
.
, and the ControlNet Network
.
This diagram shows a simple ControlNet network installation using redundant
media.
Module
Power
status
Cong Lock
Network
status
USB
Device
USB
Host
IP
LNK
EtherNet √
ACT
MS
ControlNet
AB
---- S1
S2
---- S3
S4
---- S com
S com
---- K
Y
---- Z
R1 O
---- R1 com
R1 C
---- R2 O
R2 com
---- R2 C
R3 O
---- R3 com
R3 C
Y
Rx O
Internal
24VDC
PowerMonitor 5000
K
Rx com Rx C
S n
L1
L2
GND
24V
com
Virtual Wiring
Correction
Z
V1
Scom
V2
V3
VN
VG
I 1
I 2
I 3
I 4
40 Rockwell Automation Publication 1426-UM001F-EN-P - November 2013
Page 41

Chapter 3
Setup
Although the PowerMonitor 5000 unit ships from the factory with default
settings, you need to configure it for your particular requirements. The
PowerMonitor 5000 unit provides a built-in Web interface for monitoring and
configuration through its native Ethernet communication port and its USB
device port. You perform initial configuration by using the power monitor's builtin USB Web interface. Once initial setup is complete, you can continue
configuring the PowerMonitor 5000 unit by using its USB or network Web
interface, by using optional software, or by communicating with the power
monitor's data table.
This section describes how to use the USB and Ethernet Web interface for setup.
You can find information on configuring various functions of the
PowerMonitor 5000 unit in the following chapters:
• Chapter 4
• Chapter 5
• Chapter 6 Logging
• Chapter 7 Logic Functions
• Chapter 8 Other Functions
, Metering.
Power Quality Monitoring
Setup Using the Web Interface
If you are using optional software, such as FactoryTalk EnergyMetrix software,
please refer to publication
FTALK-UM001,
refer to the Communication
For initial setup, connect a personal computer to the PowerMonitor 5000 unit by
using a USB cable. Refer to USB Communication
Initial setup is usually performed by using the USB Web interface and initial
security setup can be performed only by using the USB Web interface.
for information. If you are using data communication for setup,
on page 181 for information.
on page 31.
Rockwell Automation Publication 1426-UM001F-EN-P - November 2013 41
Page 42

Chapter 3 Setup
Open the Internet Explorer browser and browse to http://192.168.169.3. The
PowerMonitor 5000 home page displays in your browser as shown below. The
home page displays general information about the PowerMonitor 5000 unit. You
can navigate by clicking folders and pages from the tree on the left.
Initial setup by using the USB Web interface includes at least the following
configuration steps:
• Basic Metering - this aligns the power monitor metering functionality with
the properties of the circuit to which it connects
• Native Ethernet Network Communication - this permits access to the unit
for data monitoring and setup through an Ethernet network
• Optional Communication - this permits access to the unit for data
monitoring and setup through an optional communication card
• Date and Time - this sets the unit's internal clock so that time stamps in
logged data are correct
• Security (if desired) - enabling and configuring security guards against
unauthorized changes to the power monitor configuration
Once initial setup has been completed, including configuration of the Ethernet
IP address, you can also access the Web interface from a computer connected
through a network to the PowerMonitor 5000 unit’s native Ethernet port. Open
the Internet Explorer browser and browse to the IP address of the unit.
42 Rockwell Automation Publication 1426-UM001F-EN-P - November 2013
Page 43

Setup Chapter 3
Obtaining Access to the Configuration Pages
The PowerMonitor 5000 unit initially has security disabled by default. If your
power monitor's security is disabled, you can continue setting up the unit without
logging in.
If Security is Enabled
If security is enabled, the web page header displays ‘Logged in as:’ and a Log in
link.
If security is enabled, you need to log in as an administrator to configure setup
parameters. If not logged in as an administrator, you can view, but not change,
configuration parameters. If you need to log in, click the Log in link.
The USB connection has a special administrator account. Follow these steps to
log in with this account.
1. Type in the user name usbadmin.
2. Type in the password usbadmin.
3. Click Log In.
A dialog box reports the result.
To log in from the network Web interface, select a previously configured
administrator account user name and password. The PowerMonitor 5000 unit
does not permit logging in with the USB administrator login from the network.
You remain logged in until you log out or until 30 minutes have passed since
configuration changes have been applied.
Rockwell Automation Publication 1426-UM001F-EN-P - November 2013 43
Page 44

Chapter 3 Setup
How to Set Up the PowerMonitor 5000 Unit
From any power monitor web page, click the Configuration folder. A list of
available configuration pages is displayed in the tree. The steps for entering,
editing, and applying configuration parameters are similar for each configuration
page. The configuration parameters and their properties are described nin the
following chapters:
• Chapter 4
• Chapter 5
• Chapter 6 Logging
• Chapter 7 Logic Functions
• Chapter 8 Other Functions
The configuration pages contain text boxes for entering parameter values, pulldown menus for selecting enumerated parameter values, and an Apply Changes
button for committing changes to the power monitor. The power monitor
checks that parameter values are within their valid range before applying them. A
dialog box appears to report the success or reason for failure of an attempt to
apply new parameters.
, Metering.
Power Quality Monitoring
Basic Metering Setup
Follow these steps to configure the basic metering parameters.
1. Click the Metering_Basic page under the open Configuration folder.
This page displays the existing basic metering configuration of the power
monitor, including the metering mode, PT (VT) and CT ratios, nominal
voltage and frequency, and demand.
You can select other configuration pages by clicking the desired page in the
tree, or by clicking the corresponding tab in the page.
2. To change the basic metering setup, enter the desired values into the text
boxes, scroll down, and click Apply Changes.
A dialog box appears to report the result of the setup change.
44 Rockwell Automation Publication 1426-UM001F-EN-P - November 2013
Page 45

Setup Chapter 3
EXAMPLE
This Metering_Basic page illustrates the setup for a 480V, 3-phase system with 1000:5 current transformer
(CT) ratios on all phases and the neutral.
Native Ethernet Communication Setup
Choose the Configuration folder and choose the CommunicationsNative page.
The PowerMonitor 5000 unit is set up by default to obtain an IP address
automatically from a DHCP (Dynamic Host Configuration Protocol) server. If
your power monitor is on a network served by a DHCP server, and the power
monitor is connected to the network, it has probably already been assigned an IP
address.
We recommend that each power monitor be assigned a static, or fixed, IP address,
because DHCP addresses can change from time to time, resulting in loss of
communication with client applications. Obtain a fixed IP address, subnet mask,
default gateway, and other network setup parameters from your network
administrator. Another option can be to set up the power monitor as a reserved
client in the DHCP server.
Refer to Communication
setup parameters.
on page 181 for more information on communication
Rockwell Automation Publication 1426-UM001F-EN-P - November 2013 45
Page 46

Chapter 3 Setup
EXAMPLE
IMPORTANT
This example explains how to change from a DHCP-assigned to a static IP address.
The initial network configuration is shown below. The IP address assigned is 192.168.200.8. The network
administrator has provided a range of static IP addresses in the same subnet, beginning with
192.168.200.100. In this case, the default gateway and DNS servers remain the same for static or DHCPobtained addresses (verify if this is true in your case with your network administrator).
To change to the new address, from the IP_Address_Obtain pull-down menu choose Static, type in the new
IP address, and click Apply Changes.
You can change the network configuration from the USB or network web
pages. If you change the IP address from the network Web interface, you need
to browse to the new IP address to re-establish communication.
46 Rockwell Automation Publication 1426-UM001F-EN-P - November 2013
Page 47

Setup Chapter 3
IMPORTANT
Optional DeviceNet Communication Setup
Choose the Configuration folder and choose the OptionalComm page, which
lets you set the address and communication rate to operate in your system. The
range for DeviceNet_Address is 0…63 (default). The selections for
DeviceNet_Baudrate are the following:
• 0 = 125 Kbps (default)
• 1 = 250 Kbps
• 2 = 500 Kbps
• 3 = Autobaud
Refer to Optional DeviceNet Communication
on page 182 for more
information on optional DeviceNet communication parameters.
You can also set up or change the DeviceNet port parameters by using
RSNetWorx for DeviceNet software or similar utilities.
Optional ControlNet Communication Setup
Choose the Configuration folder and then choose the OptionalComm page. The
ControlNet address is the only configurable parameter. The default is 255.
Set Up Date and Time
Follow these steps to set the date and time.
1. Choose the Configuration folder and choose the DateTime page.
2. Enter the year, month, day, hour, and minute into the corresponding input
fields and click Apply Changes.
If your power monitor is set up for time synchronization with either a
SNTP or IEEE 1588 PTP server, the time is already set.
Rockwell Automation Publication 1426-UM001F-EN-P - November 2013 47
Page 48

Chapter 3 Setup
Set Up Initial Security
If you choose to enable security on the power monitor, you must perform the
initial security setup by using the USB Web interface.
1. In the USB web page, choose the Security folder and then the Security
page.
2. From the Security Defaults pull-down menu, choose Enable Security.
3. Accept the prompt regarding enabling security and accept the prompt to
reload the web pages.
4. Log in with user name usbadmin and password usbadmin.
5. Accept the prompt that the login was successful.
6. To add a network administrator, click AddNew.
48 Rockwell Automation Publication 1426-UM001F-EN-P - November 2013
Page 49

Setup Chapter 3
7. Enter a username and password for a network administrator.
The username and password can be any string up to 32 characters in
length. This example sets a username of admin with a password of admin.
Make a note of the new network administrator login for future use and
keep it in a secure location.
Now that the network administrator user has been created, you can continue
setting up the PowerMonitor 5000 unit by using the USB web page or by
connecting through the native EtherNet/IP port and using the network Web
interface. This includes the ability to configure additional users, administrators,
and application security accounts. Only one administrator class user can be
logged in at a time. Be sure to log out when finished editing the unit
configuration.
To utilize security with optional communication, set up an application class
account by using the USB or Ethernet web page. Security cannot be configured
by using optional communications. DeviceNet communication uses application
class security, which requires a client application to write the username and
password by using explicit messaging before writing configuration and
commands or reading logged data.
Test Security
To test the network administrator login, follow these steps.
1. Browse to the network address of the PowerMonitor 5000 unit.
2. Click Log in from the page header and enter the user name and password
just created and click Log In.
Rockwell Automation Publication 1426-UM001F-EN-P - November 2013 49
Page 50

Chapter 3 Setup
Note that only the USB Web interface can be used to enable, disable, or reset
security. If security accounts are lost or forgotten, you need to connect to the
USB Web interface and log in with the usbadmin account to create new network
security accounts.
Setting Up Remaining Functions of the PowerMonitor 5000 Unit
The remaining functions are set up in the same way as the examples discussed in
this section. This manual lists configuration parameters and options for basic
metering, communication, and other functions and features of the
PowerMonitor 5000 unit in these chapters:
• Metering
• Power Quality Monitoring on page 73
• Logging on page 99
• Logic Functions on page 151
• Other Functions on page 171
on page 51
Setup Using Optional Software
Setup Using Communication
FactoryTalk EnergyMetrix software, with the RT option, provides a
configuration interface for the PowerMonitor 5000 unit, including the ability to
upload, edit, download, and back up the unit configuration on a server. Please
refer to the FactoryTalk EnergyMetrix User Manual, publication
FTALK-UM001
PowerMonitor 5000 unit by using FactoryTalk EnergyMetrix software. Contact
your local Rockwell Automation sales office or Allen-Bradley distributor, or visit
http://www.software.rockwell.com
packages.
Refer to Communication on page 181 for detailed information on unit setup by
using communication with a programmable controller or custom software
application.
, or online help topics for information on configuring the
for more information on available software
50 Rockwell Automation Publication 1426-UM001F-EN-P - November 2013
Page 51

Chapter 4
Metering
Top ic Pag e
Basic Metering 51
Wiring Diagnostics 53
Wiring Co rrection 57
Metering Overview 60
Energy Metering 61
Demand Metering 62
Power Metering 67
Voltage, Current, Frequency Metering 69
Configuration Lock 71
This section describes the functions of the PowerMonitor 5000 unit. Most
functions require you to configure set-up parameters to align the unit with your
installation and your application requirements. The set-up parameters are listed
by name and described in this section. You can view set-up parameters by using
the PowerMonitor 5000 web page, and when logged in to an Admin account,
make changes to the setup. Set-up parameters are also accessible by using
communication.
Basic Metering
Please refer to the Data Tables for additional information on setup parameters
including the following:
• Range of valid values
• Default values
• Data type
Set-up parameters can be found in data tables with names beginning with
‘Configuration’, for instance Configuration.Metering_Basic.
The PowerMonitor 5000 unit calculates metering results based on the values of a
number of set-up parameters. These basic metering parameters are listed in the
table that follows. The basic metering setup is necessary to obtain accurate,
properly scaled metering results.
This applies to all models of the PowerMonitor 5000 unit.
Rockwell Automation Publication 1426-UM001F-EN-P - November 2013 51
Page 52

Chapter 4 Metering
Set-up Parameters
The following set-up parameters specify the configuration of the voltage and
current sensing circuit, how the metered values are scaled, nominal values, update
rate, and averaging. These parameters are found in the power monitor's
Configuration > Metering_Basic web page.
Metering_Mode
Metering_Mode must match the external electrical system and how it is wired to
the PowerMonitor voltage and current input terminals. Refer to the wiring
diagrams in Chapter 2
0 = Demo
1 = Split-phase
2 = Wye (default)
3 = Delta, 2 CT
4 = Delta, 3 CT
5 = Open Delta, 2 CT
6 = Open Delta, 3 CT
7 = Delta, Grounded B Phase, 2 CT
8 = Delta, Grounded B Phase, 3 CT
9 = Delta, High Leg
. The following are the selections for the Metering_Mode:
V1_V2_V3_PT_Primary
V1_V2_V3_PT_Secondary
VN_PT_Primary
VN_PT_Secondary
These parameters define the transformation ratios of the potential (voltage)
transformers (PTs or VTs) used to connect the power monitor to the measured
power circuit. When the power monitor is directly connected to the measured
circuit (up to 690V L-L), you can specify any 1:1 ratio.
I1_I2_I3_CT_Primary
I1_I2_I3_CT_Secondary
I4_CT_Primary
These parameters define the transformation ratios of the current transformers
(CTs) used to connect the power monitor to the measured power circuit. The
secondary value is permitted to be only 5 A.
Nominal_System_LL_Voltage
Nominal_System_Frequency
These parameters specify the nominal system (line-to-line) voltage and
frequency. The power monitor uses these values to optimize metering accuracy,
and the M6 model uses these values to set thresholds for detection of power
quality events.
52 Rockwell Automation Publication 1426-UM001F-EN-P - November 2013
Page 53

Metering Chapter 4
Realtime_Update_Rate
This parameter specifies the averaging used and the update rate of metering
results to the data tables and setpoint calculations. You can select from the
following:
0 = Single cycle averaged over 8 cycles
1 = Single cycle averaged over 4 cycles
2 = 1 cycle with no averaging
Related Functions
• Voltage and Current Metering
• Power Metering
• Energy Metering
• Demand Metering
• Configuration Lock
• Data Logging
• Power Quality monitoring
Wiring Diagnostics
The PowerMonitor 5000 unit provides a means for you to verify proper power
monitor connections and diagnose wiring errors. To meter power and energ y
correctly, voltage and current inputs must be connected to the power circuit with
the correct phase rotation and polarity. Indications of wiring errors include the
following:
• Indication of negative real power (kW) on a load, or indication of positive
power on a generator
• Power factor outside the range of 45% lagging to 80% leading
• Very different power and/or power factor values on different phases
Wiring diagnostics operate on command in any wiring mode, and require a level
of measured current at least 5% of the nominal metering scale, or 250 mA of CT
secondary current.
The PowerMonitor 5000 unit calculates phase angles of voltage and current, and
checks these against three distinct ranges of system power factor:
• Range 1: lagging 97% to leading 89%. This range is for very high lagging or
significantly leading power factors. Examples of loads in this range include
data centers, over-excited synchronous motors, and circuits with power
factor correction.
• Range 2: lagging 85% to leading 98%. This range includes most industrial
circuits that range from lagging to slightly leading power factors, including
circuits feeding AC variable-frequency drives.
• Range 3: lagging 52% to lagging 95%. This range exhibits lower lagging
power factors. Examples include lightly-loaded motor circuits and DC
SCR drives.
Rockwell Automation Publication 1426-UM001F-EN-P - November 2013 53
Page 54

Chapter 4 Metering
The power monitor displays wiring diagnostic status results for all three power
factor ranges when a command is issued. You decide which power factor range
applies based upon your knowledge of the circuit and its load characteristics. You
can expect more reliable wiring diagnostic results when the circuit is operating in
a normal condition, that is, not especially lightly loaded.
Figure 21
ranges show the I1 phase angle limits for each range. The phasor diagram shows
the fundamental voltage and currents in a three-phase, 4-wire system operating
with a lagging power factor of roughly 85%. In this example, ranges 2 and 3
wiring diagnostic can return good results, but range 1 can incorrectly indicate
that all currents are inverted and displaced by a phase, as shown by the –I1, -I2
and –I3 phasors.
Figure 21 - Power Factors and Wiring Diagnostics
In addition to wiring diagnostics on command, the PowerMonitor 5000 unit
updates voltage and current magnitude and phase angle data continually. These
values are used by FactoryTalk EnergyMetrix RT software to display a system
phasor diagram.
illustrates the part power factor plays in wiring diagnostics. The PF
Wiring diagnostic results can also be used for automatic virtual wiring correction,
as described in the next section.
Applications
This applies to all models.
Setup
Only basic metering setup is required.
54 Rockwell Automation Publication 1426-UM001F-EN-P - November 2013
Page 55

Metering Chapter 4
Command
Command Word 2
Set this command word value to 11 (decimal) or make selection in web page to
initiate wiring diagnostics.
Wiring Diagnostic Results
The PowerMonitor 5000 unit returns the following wiring diagnostic results for
all three power factor ranges. Results are available for about 5 minutes after the
command is received.
Command_Status
These are the values:
0 = Command Active
1 = Input Level Low
2 = Disabled
3 = Waiting Command
RangeN_Voltage_Input_Missing
RangeN_Current_Input_Missing
These are the values for these parameters:
-1 = Test not run
0 = Test passed
1 = Phase 1 missing
2 = Phase 2 missing
3 = Phase 3 missing
12 = Phase 1 and 2 missing
13 = Phase 1 and 3 missing
23 = Phase 2 and 3 missing
123 = All phases missing
Range1_L97_C89_Status
Range2_L85_C98_Status
Range3_L52_L95_Status
0 = pass
1 = fail
Rockwell Automation Publication 1426-UM001F-EN-P - November 2013 55
Page 56

Chapter 4 Metering
RangeN_Voltage_Input_Inverted
RangeN_Current_Input_Inverted
These are the values:
-1 = Test not run
0 = Test passed
1 = Phase 1 inverted
2 = Phase 2 inverted
3 = Phase 3 inverted
12 = Phase 1 and 2 inverted
13 = Phase 1 and 3 inverted
23 = Phase 2 and 3 inverted
123 = All phases inverted
Voltage_Rotation
Current_Rotation
These are the values:
123…321 designating phase and rotation. Example: 213 = Phase 2 then
phase 1 then phase 3
-1 = Test not run
4 = Invalid Rotation
5 = Out of range
Phasor Magnitudes and Angles
The PowerMonitor 5000 unit updates these values continually.
Voltage_Phase_1_Angle (always zero)
Voltage_Phase_1_Magnitude
Voltage_Phase_2_Angle
Voltage_Phase_2_Magnitude
Voltage_Phase_3_Angle
Voltage_Phase_3_Magnitude
Current_Phase_1_Angle
Current_Phase_1_Magnitude
Current_Phase_2_Angle
Current_Phase_2_Magnitude
Current_Phase_3_Angle
Current_Phase_3_Magnitude
56 Rockwell Automation Publication 1426-UM001F-EN-P - November 2013
Page 57

Metering Chapter 4
IMPORTANT
Semantics
Magnitudes are the scaled RMS value of the voltage or current. In Wye and splitphase modes, voltages are reported as line-to-neutral. In Delta modes, voltage is
reported as line-to-line. Phase angles are referenced to Phase 1 Voltage, which is
defined as zero, consistent with the 4-quadrant metering diagram included in
Power Metering
Note that current angles in Delta modes include a 30° offset due to the phase
angle difference between Wye and Delta modes as shown in the following
diagram.
on page 67.
Wiring Correction
Related Functions
• Voltage and Current Metering
• Power Metering
• Energy Metering
The PowerMonitor 5000 unit can correct for wiring errors by logically mapping
physical voltage and current inputs to voltage and current metering channels. You
determine if and when this occurs by issuing a Wiring Corrections Command.
The wiring corrections command offers a number of options:
• Automatically correct the wiring according to the wiring diagnostics
results for the power factor range 1, 2, or 3 that you select.
• Manually apply wiring correction by filling in mapping values in the web
page or other application.
• Remove previously-applied wiring corrections.
The ‘Virtual Wiring Correction’ status indicator next to the voltage terminal
blocks indicates when wiring corrections are in effect.
Only one wiring correction command can be applied (one command can
correct for multiple errors). If a change is needed, first remove the previous
wiring correction, and then apply the new wiring correction.
Rockwell Automation Publication 1426-UM001F-EN-P - November 2013 57
Page 58

Chapter 4 Metering
Applications
This applies to all models.
Setup
Only basic metering setup is required.
Command
The Command.Wiring_Corrections table comprises the following parameters.
Wiring_Correction_Commands
Wiring_Correction_Commands determines the type of wiring correction to be
performed when the command executes. These are the selections:
0 = No command
1 = Correct wiring automatically by using Power Factor Range 1 results
2 = Correct wiring automatically by using Power Factor Range 2 results
3 = Correct wiring automatically by using Power Factor Range 3 results
4 = Correct wiring by using manual input mapping parameters
5 = Remove all wiring corrections.
Input_V1_Mapping
Input_V2_Mapping
Input_V3_Mapping
Input_I1_Mapping
Input_I2_Mapping
Input_I3_Mapping
This collection of parameters determines the mapping of physical voltage inputs
to logical voltage channels and physical current inputs to logical current channels.
The following are the permitted values:
1 = Map the physical input to logical channel 1
2 = Map the physical input to logical channel 2
3 = Map the physical input to logical channel 3
-1 = Map the physical input to logical channel 1 and invert its polarity
-2 = Map the physical input to logical channel 2 and invert its polarity
-3 = Map the physical input to logical channel 3 and invert its polarity
The values of these parameters are ignored if automatic wiring correction is
selected in the command. If manual input mapping is selected, all mapping
parameters are required and the combination is checked for validity (mapping of
two physical inputs to the same metering channel is not permitted).
58 Rockwell Automation Publication 1426-UM001F-EN-P - November 2013
Page 59

Metering Chapter 4
Status
The Status.Wiring_Corrections table mirrors the parameters of the most recent
wiring correction command. In addition, the following parameters report the
status of the most recent command.
Last_Cmd_Rejection_Status
These are the values:
0 = No rejection
1 = Rejected; see rejection information
Rejection_Information
These are the values:
0 = No information
1 = Selected range is incomplete
2 = Command is already active. Please use command 5 (remove all wiring
corrections) to start over
3 = Two like inputs wired to one terminal
4 = Invalid Input parameter
Related Functions
• Voltage and Current Metering
• Power Metering
• Energy Metering
• Configuration Lock
Rockwell Automation Publication 1426-UM001F-EN-P - November 2013 59
Page 60

Chapter 4 Metering
Metering Overview
The PowerMonitor 5000 unit performs calculations on scaled, digital voltage,
and current values. Signals connected to the voltage and current inputs are
sampled and their instantaneous values are converted to digital values in an
analog-to-digital (A/D) converter section. These values are scaled according to
configured PT Primary, PT Secondary, CT Primary, and CT Secondary
parameters, and evaluated according to the configured Wiring Mode parameter.
All metering results can be viewed by using the Web interface,
FactoryTalk EnergyMetrix software, version 2.0, or standard CIP
communication.
Summary of Measurements
• Current: Average Current, Positive/Negative/Zero Sequence, Percent
Unbalance
• Voltage: Line-Line, Line-Neutral, Average, Positive/Negative/Zero
Sequence, Percent Unbalance
• Frequency, Average Frequency
• Power: Real (W), Reactive (VARs), Apparent (VA), Total
• Power Factor: True (Full Bandwidth), Displacement (Fundamental ),
Lead, Lag, Demand
• Real Energy Consumption (kWh, GWH), Forward, Reverse, Net
• Reactive Energy Consumption (kVARh, GVARh) Forward, Reverse, Net
• Apparent Energ y Consumption (kVAh, GVAh) Net
• Current Consumption (Amp-h)
• Demand and Projected Demand (kA, kW, kVAR, kVA)
• IEEE Percent Total Harmonic Distortion
• IEC Percent Total Harmonic Distortion
• Crest Factor
• K-Factor
• Phase Rotation (ABC, ACB)
• Time of Use
Metering Accuracy Class
ANSI C12.20 -2010 (clause 8) Class 0.2 and
EN 62053-22 - 2003 (clause 5.5.4) Class 0.2
60 Rockwell Automation Publication 1426-UM001F-EN-P - November 2013
Page 61

Metering Chapter 4
Energy Metering
The power monitor meters the following energy consumption parameters:
• Real Energy Consumption (kWh, GWH), Forward, Reverse, Net
• Reactive Energy Consumption (kVARh, GVARh) Forward, Reverse, Net
• Apparent Energ y Consumption (kVAh, GVAh) Net
• Current Consumption (Amp-h)
Applications
This function applies to all PowerMonitor 5000 models.
Table 8 - Energy Metering Metered Parameters
Parameter Description Range Units
GWh_Fwd Total real energy consumed 0…9,999,999 GWh
kWh_Fwd Total real energy consumed 0.000…999,999 kWh
GWh_Rev Total real energy produced 0…9,999,999 GWh
kWh_Rev Total real energy produced 0.000…999,999 kWh
GWh_Net The sum of for ward and reverse real energy ± 0…9,999,999 GWh
kWh_Net The sum of forward and reverse real energy ± 0.000…999,999 kWh
GVARh_Fwd Total reactive energy consumed 0…9,999,999 GVARh
kVARh_Fwd Total reactive energy consumed 0.000…999.999 kVARh
GVARh_Rev Total reactive energy produced 0…9,999,999 GVARh
kVARh_Rev Total reactive energy produced 0.000…999.1000 kVARh
GVARh_Net Total sum of forward and reverse reactive energy ±0…9,999,999 GVARh
kVARh_Net Total sum of forward and reverse reactive energy ±0.000…999,999 kVARh
GVAh Total apparent energy consumed 0…9,999,999 GVAh
kVAh Total apparent energy consumed 0.000…999,999 kVAh
GAh Accumulated amp-hours consumed 0…9,999,999 GAh
kAh Accumulated amp-hours consumed 0.000…999,999 kAh
Example
A large energy value could be displayed as 123,456,789,234.567 kWh where
123,456 is the GWh metering result and 789,234.567 is the kWh metering result.
Energy results (kWh, kVARh, and kVAh) roll over to 0 after the value of
13
9,999,999,999,999 or 10
-1 is reached.
Setup
Only basic metering setup is required for energy metering.
Rockwell Automation Publication 1426-UM001F-EN-P - November 2013 61
Page 62

Chapter 4 Metering
Commands
The following commands are supported by the power monitor:
• Set GWh/kWh register
• Set GVARh/kVARh register
• Set GVAh/kVAh register
• Clear all energy registers
Related Functions
• KYZ output
• Energy log
• Configuration lock
Demand Metering
Demand is an electric power term that expresses the average energy usage over a
predefined period of time. The power monitor can be configured to measure
demand by using a fixed demand period or a sliding window. The demand period
can be timed internally, synchronized to an external demand end-of-interval
contact connected to the S2 status input, or synchronized by using
communication. The PowerMonitor 5000 unit, by default, calculates demand on
a fixed 15-minute demand period, synchronized to the power monitor internal
clock.
Table 9 - Dema nd Me teri ng Metered Parameters
Parameter Description Range Units
kW_Demand The average total real power during the
last demand period.
kVAR_Demand The average total reactive power during
the last demand period.
kVA_Demand The average total apparent power during
the last demand period.
Demand_PF The average PF during the last demand
period.
Demand_Amperes The average demand for amperes during
the last demand period.
Projected_kW_Demand The projected total real power for the
current demand period.
Projected_kVAR_Demand The projected total reactive power for the
current demand period.
Projected_kVA_Demand The projected total apparent power for the
current demand period.
Projected_Ampere_Demand The projected average amperes for the
current demand period.
± 0.000…9,999,999 kW
±0.000…9,999,999 kVAR
0.000…9,999,999 kVA
-100.0…100.0 PF
0.000…9,999,999 A
± 0.000…9,999,999 kW
±0.000…9,999,999 kVAR
0.000…9,999,999 kVA
0.000…9,999,999 A
Projected demand calculates an instantaneous or linear projection of demand at
the end of a demand interval.
62 Rockwell Automation Publication 1426-UM001F-EN-P - November 2013
Page 63

Metering Chapter 4
kWDemand
kVADemand
-------------------------------- -
Demand
1
T
-- -
Pt() td
t
tT+()
×=
Demand power factor is calculated by using the following formula.
Demand Calculation
Demand is equal to the average power level during a predefined time interval.
This interval continuously repeats and is typically 15 minutes but can be between
5 and 30 minutes in length. The power monitor computes demand levels for
watts, VA, amps, and VARs, and provides two different methods for projecting
demand. The formula for real power (kW) demand is shown below.
T = Demand interval duration
T = Time at beginning of interval
P(t) = Power as a function of time
If your electric utility provides a pulse that indicates the end of each demand
interval, the power monitor can be set up to determine its demand interval from
the utility pulse.
Some electric service providers use the sliding window method. This method
breaks the demand interval into many sub-intervals and updates the demand
value at the end of each sub-interval.
For example, a 15 minute interval can be divided into 15 one-minute subintervals. Each minute, the following occurs:
• The demand for the sub-interval is calculated and stored.
• The average value of the most recent fifteen sub-intervals is computed to
obtain a demand value.
• Sub-interval values older than fifteen minutes are discarded.
Projected Demand Calculation
Projected demand calculates an instantaneous (default) or first-order projection
of demand at the end of a demand interval. Select the best projection method for
your system by comparing the projected values from each method with the actual
demand at the end of the interval. The methods of projecting demand are
described below.
Rockwell Automation Publication 1426-UM001F-EN-P - November 2013 63
Page 64

Chapter 4 Metering
Instantaneous
The power monitor computes instantaneous demand by substituting the elapsed
interval duration for the total interval duration (T) in the demand equation. It is
therefore identical to the standard computation except it integrates the power
only over the elapsed interval duration and calculates the average value over the
elapsed duration. The modified equation thus becomes:
(t2 - t1) = Elapsed interval duration and is less than T
First Order Projection
The first order demand projection does the following:
• Uses the instantaneous demand as a starting point
• Computes the trend of the instantaneous demand
• Computes the time remaining in the interval
• Performs a first order projection of what the final demand is at the end of
the interval
This method can be useful where your system has a significant base load with
additional loads that are switched in and out during the interval.
Setup
Basic Metering and Date and Time setup are required. If the default demand
configuration (15-minute fixed interval based on internal clock) satisfies your
demand metering requirements, you do not need to change any demand setup
parameters.
If you want to customize the demand calculation to match that of your electric
service provider, or to satisfy other application requirements, then there are two
groups of setup parameters you can change.
Basic demand set-up parameters are found in the Metering_Basic tab under the
Configuration tab.
Demand_Source
Selects the source of the demand end-of-interval (EOI) signal. These are the
values:
0 = Internal Timer (default)
1 = Status Input 2
2 = Controller Command (Unit must be set up as a demand sync master)
3 = Ethernet Demand Broadcast
64 Rockwell Automation Publication 1426-UM001F-EN-P - November 2013
Page 65

Metering Chapter 4
These are the semantics:
• If Demand_Broadcast_Mode_Select is set to master, then a Demand
Source value of 0…2 selects the EOI source that is used to trigger the
demand-sync master broadcast.
• If Demand_Broadcast_Mode_Select is set to slave, then a Demand Source
value of 0…3 selects the EOI source.
Demand_Period_Length (Minutes)
Specifies the desired period for demand calculations. These are the values:
0 = See semantics
1…99 = Length of time of each demand period in minutes
These are the semantics:
• When set to 0 there is no projected demand calculations.
• If the internal timer is selected, a setting of 0 turns the demand function
off.
Number_Demand_Periods
Specifies the number of demand periods to average for demand measurement.
These are the values:
1 = Used for fixed demand period
2…15 = Used for sliding window demand period
Forced_Demand_Sync_Delay
When configured for an external demand source, this parameter defines how
long the unit waits for the expected control input (for example, EOI pulse or
network demand broadcast), before it starts a new demand period. If this occurs
an entry is made in the Event Log. These are the values:
0 = Wait forever
1…900 = Wait this many seconds before starting a new demand period
Network demand synchronization is available on units connected to an Ethernet
network. Network-demand synchronization parameters are found in the
Communications_Native tab under Configuration tab.
Rockwell Automation Publication 1426-UM001F-EN-P - November 2013 65
Page 66

Chapter 4 Metering
IMPORTANT
Demand_Broadcast_Mode_Select
Demand Ethernet broadcast selection. These are the values:
0 = Slave (default)
1 = Master
There must be only one master per demand network.
Demand_Broadcast_Port
The common port for demand broadcast messages. These are the values:
300 (default)…400
Commands
Controller command (EOI signal)
Related Functions
• Status inputs
• Time of use log
• Configuration lock
66 Rockwell Automation Publication 1426-UM001F-EN-P - November 2013
Page 67

Metering Chapter 4
Power Metering
This function applies to all PowerMonitor 5000 models.
Table 10 - Power Metering Metered Parameters
Parameter Description Range Units
L1_kW Power of individual phase or sum of phases;
L2_kW
L3_kW
Tot a l _k W
L1_kVAR Reactive power of individual phase or sum of
L2_kVAR
L3_kVAR
Total_kVAR
L1_kVA Apparent power of individual phase or sum of
L2_kVA
L3_kVA
Tot a l _k VA
L1_True_PF_% The ratio between power and apparent power
L2_True_PF_%
L3_True_PF_%
Avg_True_PF
L1_Disp_PF The cosine of the phase angle between the
L2_Disp_PF
L3_Disp_PF
Avg_Disp_PF
L1_PF_Lead_Lag_Indicator Lead or lag indicator for power factor
L2_PF_Lead_Lag_Indicator
L3_PF_Lead_Lag_Indicator
Total_PF_Lead_Lag_Indicator
signed to show direction
all phases; signed to show direction
all phases
for individual phase or all phases
fundamental voltage and current for an
individual phase or all phases
1 = leading
-1 = lagging
-9.999E15…9.999E15 kW
-9.999E15…9.999E15 kVAR
0…9.999E15 kVA
0.00…100.00 %
0.00…100.00 %
-1…1 ±
Only total three-phase power results are provided when Direct Delta or Open
Delta wiring modes are selected.
Rockwell Automation Publication 1426-UM001F-EN-P - November 2013 67
Page 68

Chapter 4 Metering
I
IV
II
III
90˚
270˚
0˚
180˚
Pf = 0
+kVAR (Import)
kVARHR-F (Forward)
Pf = 0
-kVAR (Export)
kVARHR-R (Reverse)
Pf = 100%
+kW (Import)
kWH-F (Forward)
Pf = 100%
-kW (Export)
kWH-R (Reverse)
(Power Factor
Lagging)
(-)
(Power Factor
Leadin g)
(+)
(Power Factor
Lagging)
(-)
(Power Factor
Leading)
(+)
The Magnitude and Direction of Power Quantities chart indicates the
relationship between the magnitude and direction of the power quantities and
the numeric signs used by the power monitor.
Figure 22 - Magnitude and Direction of Power Quantities
Setup
Only basic metering setup is required for power metering.
Related Functions
• Metering result averaging
• Configuration lock
68 Rockwell Automation Publication 1426-UM001F-EN-P - November 2013
Page 69

Metering Chapter 4
Negative Sequence
Positive Sequence
--------------------------------------------- -
100×
Voltage, Current, Frequency Metering
This function applies to all PowerMonitor 5000 models.
Table 11 - Voltage, Current, and Frequency Metering Metered Parameters
Parameter Description Range Units
V1_N_Volts RMS line to neutral voltage of individual phase or average
V2_N_Volts
V3_N_Volts
Avg_V _N_Vol ts
VN_G_Volts RMS ground to neutral voltage 0…9.999E15 V
V1_V2_Volts RMS line to line voltage of individual phase or average of
V2_V3_Volts
V3_V1_Volts
Avg_V L_VL _Volts
I1_Amps RMS line current of individual phase or average of I1, I2 and
I2_Amps
I3_Amps
Avg_A mps
I4_Amps RMS current of phase 4, also known as the neutral or zero-
Frequency_Hz The frequency of the voltage 40.00…70.00 Hz
Avg_Frequency_Hz Average Frequency over 6 cycles 40.00…70.00 Hz
Voltage Rotation Voltage rotation has the following designations:
Pos_Seq_Volts Positive Sequence Voltage 0…9.999E15 V
Neg_Seq_Volts Negative Sequence Voltage 0…9.999E15 V
Zero_Seq_Volts Zero Sequence Voltage 0…9.999E15 V
Pos_Seq_Amps Positive Sequence Amps 0…9.999E15 A
Neg_Seq_Amps Negative Sequence Amps 0…9.999E15 A
Zero_Seq_Amps Zero Sequence Amps 0…9.999E15 A
Voltage_Unbalance_% Voltage percent unbalance 0.00…100.00 %
Current_Unbalance_% Current percent unbalance 0.00…100.00 %
of V1, V2, V3
V1_V2, V2_V3 and V3_V1
I3 amps.
sequence current
0 = Not metering
123 = ABC rotation
132 = ACB rotation
4 = No rotation
0…9.999E15 V
0…9.999E15 V
0…9.999E15 A
0…9.999E15 A
0…132
Line-to-neutral voltage results are provided in Wye, split-phase and high-leg
Delta metering modes. Line-to-neutral voltage results are not provided in Delta
(other than high-leg Delta) and Open Delta metering modes.
Voltage and current unbalance are calculated by using the following formula.
Rockwell Automation Publication 1426-UM001F-EN-P - November 2013 69
Page 70

Chapter 4 Metering
Symmetrical Component Analysis Results
The power monitor calculates sequence voltages and currents for use in
symmetrical component analysis, which transforms a set of unbalanced threephase vectors into three sets of balanced vectors. The positive sequence
components are a set of vectors that rotate the same direction as the original
power vectors, and represent that portion of the applied voltage or current
capable of doing work. Negative sequence components rotate opposite to the
original vectors, and represent the portion of the applied power that results in
losses due to unbalance. The percent unbalance value is the ratio between the
negative and positive current sequence in a three-phase system and is the most
accurate measurement of current unbalance because it takes into account the
magnitude of the individual currents and the relative phase displacement. The
zero sequence component is a single vector that does not rotate, and represents
ground or neutral current (I4) or voltage. The component analysis results are
included in the table above.
Setup
Only basic metering input setup is required for voltage and current metering.
Related Functions
• Metering result averaging
• Configuration lock
Viewing Metering Results by Using Web Page
You can view voltage, current, frequency, energy, and power metering results from
the PowerMonitor 5000 web page. Browse to the network address of the power
monitor. From the home page, choose the MeteringResults folder and then the
desired metering results page.
70 Rockwell Automation Publication 1426-UM001F-EN-P - November 2013
Page 71

Metering Chapter 4
You can use the Web interface to view power quality results, power monitor
status and statistics, and configuration. CalibrationData links to a printable
calibration certificate for the power monitor. Configuration lets you review the
configuration parameters, and, if logged in as an administrator, change them.
While logged in as an administrator, you can also issue commands to the power
monitor from the Command link.
Viewing Metering Results with a Door Mounted Display
The PowerMonitor 5000 Display Module (catalog number 1426-DM, purchased
separately) can be applied as a panel display for one, two, or three PowerMonitor
5000 units.
Configuration Lock
Appendix C
Module for a PowerMonitor 5000 unit.
Unauthorized changes to the PowerMonitor 5000 unit setup are prevented when
the configuration lock switch is placed in the lock position.
provides further information on setting up and using a Display
Applications
This applies to all models.
Operation
The following setup parameters and commands are locked when the
configuration lock is applied.
Configuration.Metering_Basic
All parameters.
Configuration.SystemGeneral
• KYZ and Relay Outputs setup
• Status inputs scale
Configuration.CommunicationsNative
• Network demand setup
Rockwell Automation Publication 1426-UM001F-EN-P - November 2013 71
Page 72

Chapter 4 Metering
Command.System_Registers
• Command Word 1, which includes the following commands:
• Set kWh, kVARh, kVAh, all energy registers
• Set status input count
• Force KYZ output on, off, or clear force
• Restore factory defaults
• Reset power monitor
Setup
No setup is needed.
72 Rockwell Automation Publication 1426-UM001F-EN-P - November 2013
Page 73

Power Quality Monitoring
a
Top ic Pag e
Harmonic Analysis 75
Sag and Swell Detection 79
Power Quality Event Classification (M6 model) 81
Short Duration RMS Variations (Category 2.0 - Sags, Swells, and Interruptions) (M6 model) 82
Long Duration RMS Variations (Category 3.0 - Undervoltage, Overvoltage, Sustained
Interruptions) (M6 model)
Power Quality Event Example 85
Voltage and Current Imbalance (Category 4.0) 87
Waveform Distortion (Category 5.1 - DC Offset, and 5.2 - Harmonics) (M6 model) 88
Power Frequency Variations (Category 7.0) 89
IEEE 519 Pass/Fail Capability (M6 model) 90
IEEE 519 Pass/Fail Results 91
IEEE519_Overall_Status 91
IEEE-519 Short Term and Long Term Harmonic Results 92
Waveform Recording (M6 model) 93
Chapter 5
84
This section describes the functions of the PowerMonitor 5000 unit. Most
functions require you to configure set-up parameters to align the unit with your
installation and your application requirements. The set-up parameters are listed
by name and described in this section. You can view set-up parameters by using
the PowerMonitor 5000 web page, and when logged in to an Admin account,
make changes to the setup. Set-up parameters are also accessible by using
communication.
Please refer to the Data Tables for additional information on setup parameters
including the following:
• Range of valid values
• Default values
• Data type
Set-up parameters can be found in data tables with names beginning with
‘Configuration’, for instance Configuration.Metering_Basic.
Rockwell Automation Publication 1426-UM001F-EN-P - November 2013 73
Page 74

Chapter 5 Power Quality Monitoring
The term ‘power quality’ is associated with electromagnetic irregularities in
voltage and current in a power circuit that can interfere with or cause failures of
electronic equipment. A number of national and international standards have
been developed that define and classify power quality events and issues, and
provide guidelines for detecting and reporting these events and issues. The design
of the power quality functions in the PowerMonitor 5000 unit has been aligned
with these standards. The purpose of these functions is to assist users to
determine and correct the causes of poor power quality, resulting in more reliable
operation and reduced cost.
Power quality functions are classified into three broad categories:
• Measurement and reporting the value of power circuit attributes that
comprise power quality
• Classification of power quality events according to applicable standards
and annunciation of such events
• Recording power quality events and their metadata for statistical and
diagnostic purposes
The PowerMonitor 5000 unit provides a range of power quality monitoring
functions. The basic M5 model detects sags and swells, and measures THD, crest
factor, and K-factor. The M6 model builds upon the M5 functionality, adding
IEEE-519 THD/TDD pass/fail reporting, user configurable voltage sag/swell
settings, power quality logging, waveform recording, harmonic analysis, and
synchronized event recording among multiple power monitors.
FactoryTalk EnergyMetrix software and its RealTime (RT) option provide
comprehensive, web-based software tools for presenting the power quality
monitoring data produced by the PowerMonitor 5000 M6 model.
Ta b l e 1 2
Table 12 - Power Quality Capabilities
Power Quality Attributes 1426-M5 1426-M6 Per phase Average / Total
IEEE Voltage THD % • • • •
IEEE Current THD % • • • •
IEC Voltage THD % • • • •
IEC Current THD % • • • •
Crest Factor, Voltage and Current • • •
K-factor, Current • • •
Harmonic voltages DC … 63rd, magnitude and angle • •
Harmonic currents DC … 63rd,, magnitude and angle • •
Harmonic kW, kVAR, kVA, DC … 63rd, total and per-phase • • •
Sag and swell detection • • • •
Classification of Power Quality Events Per IEEE 1159 • • •
IEEE 519 pass/fail and TDD % (2nd through 40th) • • • •
Waveform recording • • •
Network synchronized waveform recording •
Power quality logging •
compares the power quality capabilities of the M5 and M6 models.
74 Rockwell Automation Publication 1426-UM001F-EN-P - November 2013
Page 75

Power Quality Monitoring Chapter 5
THD
∞
Σ
n 2=
H
n
()
2
H
1
-------------------------=
Where:
• H
n
= magnitude of the nth harmonic
(n ≤ 63)
• H
1
= magnitude of fundamental
DIN
∞
Σ
n 2=
H
n
()
2
∞
Σ
n 1=
H
n
()
2
---------------------
=
Where:
• H
n
= magnitude of the nth harmonic
(n ≤ 63)
• DIN is equivalent to IEC THD
Crest Factor Peak Value RMS Value⁄=
2
Harmonic Analysis
The PowerMonitor 5000 provides harmonic data to help you understand this
important element of power quality in your facility.
Setup
Only basic metering setup is required.
Operation - IEEE and IEC Total Harmonic Distortion
These total harmonic distortion calculation methods provide a summary
indication of the amount of distortion due to harmonics present in a system.
The standard IEEE definition of harmonic distortion is ‘Total Harmonic
Distortion (THD)’ and is computed for each voltage (V1, V2, V3, VN) and
current (I1, I2, I3, I4) channel as follows:
The standard IEC definition of harmonic distortion is the Distortion Index
(DIN) and is computed for each channel as follows:
Crest Factor
Crest factor is another measure of the amount of distortion present in a
waveform. It can also be used to express the dynamic range of a measurement
device. Crest Factor is the ratio of the peak to the RMS.
A pure sinusoid Crest Factor equals .
K-fac tor
K-factor measures additional heating in a power transformer due to harmonics in
the power signal. These harmonics cause additional heating due to increased core
losses that occur at higher frequencies.
Rockwell Automation Publication 1426-UM001F-EN-P - November 2013 75
Page 76

Chapter 5 Power Quality Monitoring
K-Factor
∞
Σ
n 1=
H
n
2n2
•
∞
Σ
n 1=
H
n
()
2
----------------------------------------=
Where:
• H
n
= magnitude of the nth harmonic
(n ≤ 63).
The increased losses are related to the square of the harmonic frequency.
Therefore, a slight harmonic content can significantly increase the heat rise in a
power transformer. The additional harmonic heating can cause a transformer to
exceed designed temperature limits even though the RMS current is less than the
transformer rating. The K-factor is used as justification to oversize a power
transformer to allow extra margin for harmonic losses or to select an appropriate
K-factor rated transformer. A K-factor rated transformer is the preferred choice
because it has known performance in the presence of harmonics.
The formula for K-factor is as follows:
Harmonic Magnitude and Angle (M6 model)
The PowerMonitor 5000 M6 model calculates the RMS magnitude and angle of
each individual harmonic. Results are calculated for harmonics DC to 63 for all
voltage and current channels. Each magnitude is expressed in rms volts or rms
amps. DC offset is always zero for current channels. Only directly-connected
voltage channels return non-zero DC offset values.
Angles are expressed in degrees, with zero degrees corresponding to the time
stamp of the metering results.
Harmonic Power (M6 model)
The PowerMonitor 5000 M6 model calculates the magnitudes of real, reactive,
and apparent power of each individual harmonic. Results are calculated for
harmonics DC to 63. L1, L2, L3, and total power values are returned for Wye and
split-phase wiring modes. Delta wiring modes return only total power values.
Each magnitude is expressed in kW, kVARs, or kVA.
Harmonic Analysis Results (M6 model)
The PowerMonitor 5000 M6 model returns results for IEEE and IEC THD,
crest factor and K-factor in the PowerQuality.RealTime_PowerQuality tab.
Table 13 - Harmonic Analysis Results
Tag Name Units Range
V1_Crest_Factor 0
V2_Crest_Factor 0
V3_Crest_Factor 0
V1_V2_Crest_Factor 0
V2_V3_Crest_Factor 0
76 Rockwell Automation Publication 1426-UM001F-EN-P - November 2013
V3_V1_Crest_Factor 0
…9.999E15
…9.999E15
…9.999E15
…9.999E15
…9.999E15
…9.999E15
Page 77

Power Quality Monitoring Chapter 5
Table 13 - Harmonic Analysis Results
Tag Name Units Range
I1_Crest_Factor 0…9.999E15
I2_Crest_Factor 0
I3_Crest_Factor 0…9.999E15
I4_Crest_Factor 0 …9.999E15
V1_IEEE_THD_% % 0.00…100.00
V2_IEEE_THD_% % 0.00
V3_IEEE_THD_% % 0.00…100.00
VN_G_IEEE_THD_% % 0.00 …100.00
Avg_IEEE_THD_V_% % 0.00
V1_V2_IEEE_THD_% % 0.00…100.00
V2_V3_IEEE_THD_% % 0.00…100.00
V3_V1_IEEE_THD_% % 0.00
Avg_IEEE_THD_V_V_% % 0.00…100.00
I1_IEEE_THD_% % 0.00…100.00
I2_IEEE_THD_% % 0.00
I3_IEEE_THD_% % 0.00…100.00
I4_IEEE_THD_% % 0.00…100.00
Avg_IEEE_THD_I_% % 0.00
V1_IEC_THD_% % 0.00…100.00
V2_IEC_THD_% % 0.00…100.00
V3_IEC_THD_% % 0.00
VN_G_IEC_THD_% % 0.00…100.00
Avg_IEC_THD_V_% % 0.00…100.00
V1_V2_IEC_THD_% % 0.00
V2_V3_IEC_THD_% % 0.00
V3_V1_IEC_THD_% % 0.00
Avg_IEC_THD_V_V_% % 0.00
I1_IEC_THD_% % 0.00
I2_IEC_THD_% % 0.00
I3_IEC_THD_% % 0.00
I4_IEC_THD_% % 0.00
Avg_IEC_THD_I_% % 0.00
I1_K_Factor 1.00
I2_K_Factor 1.00
I3_K_Factor 1.00…25000.00
…9.999E15
…100.00
…100.00
…100.00
…100.00
…100.00
…100.00
…100.00
…100.00
…100.00
…100.00
…100.00
…100.00
…100.00
…100.00
…100.00
…25000.00
…25000.00
Rockwell Automation Publication 1426-UM001F-EN-P - November 2013 77
Page 78

Chapter 5 Power Quality Monitoring
Individual harmonic results are returned in an array of data tables. You can view
any harmonic results table by selecting it from the PowerQuality >
Harmonics_Results tab in the PowerMonitor 5000 web page. The available
harmonic results data tables are listed below.
• PowerQuality.Total_kW_H1_RMS (DC…31)
• PowerQuality.Total_kW_H2_RMS (32…63)
• PowerQuality.Total_kVAR_H1_RMS (DC…31)
• PowerQuality.Total_kVAR_H2_RMS (32…63)
• PowerQuality.Total_kVA_H1_RMS (DC…31)
• PowerQuality.Total_kVA_H2_RMS (32…63)
• PowerQuality.V1_N_Volts_H1_RMS (DC…31)
• PowerQuality.V1_N_Volts_H2_RMS (32…63)
• PowerQuality.V2_N_Volts_H1_RMS (DC…31)
• PowerQuality.V2_N_Volts_H2_RMS (32…63)
• PowerQuality.V3_N_Volts_H1_RMS (DC…31)
• PowerQuality.V3_N_Volts_H2_RMS (32…63)
• PowerQuality.VN_G_Volts_H1_RMS (DC…31)
• PowerQuality.VN_G_Volts_H2_RMS (32…63)
• PowerQuality.V1_V2_Volts_H1_RMS (DC…31)
• PowerQuality.V1_V2_Volts_H2_RMS (32…63)
• PowerQuality.V2_V3_Volts_H1_RMS (DC…31)
• PowerQuality.V2_V3_Volts_H2_RMS (32…63)
• PowerQuality.V3_V1_Volts_H1_RMS (DC…31)
• PowerQuality.V3_V1_Volts_H2_RMS (32…63)
• PowerQuality.I1_Amps_H1_RMS (DC…31)
• PowerQuality.I1_Amps_H2_RMS (32…63)
• PowerQuality.I2_Amps_H1_RMS (DC…31)
• PowerQuality.I2_Amps_H2_RMS (32…63)
• PowerQuality.I3_Amps_H1_RMS (DC…31)
• PowerQuality.I3_Amps_H2_RMS (32…63)
• PowerQuality.I4_Amps_H1_RMS (DC…31)
• PowerQuality.I4_Amps_H2_RMS (32…63)
• PowerQuality.L1_kW_H1_RMS (DC…31)
• PowerQuality.L1_kW_H2_RMS (32…63)
• PowerQuality.L2_kW_H1_RMS (DC…31)
• PowerQuality.L2_kW_H2_RMS (32…63)
• PowerQuality.L3_kW_H1_RMS (DC…31)
• PowerQuality.L3_kW_H2_RMS (32…63)
• PowerQuality.L1_kVAR_H1_RMS (DC…31)
• PowerQuality.L1_kVAR_H2_RMS (32…63)
• PowerQuality.L2_kVAR_H1_RMS (DC…31)
• PowerQuality.L2_kVAR_H2_RMS (32…63)
78 Rockwell Automation Publication 1426-UM001F-EN-P - November 2013
Page 79

Power Quality Monitoring Chapter 5
• PowerQuality.L3_kVAR_H1_RMS (DC…31)
• PowerQuality.L3_kVAR_H2_RMS (32…63)
• PowerQuality.L1_kVA_H1_RMS (DC…31)
• PowerQuality.L1_kVA_H2_RMS (32…63)
• PowerQuality.L2_kVA_H1_RMS (DC…31)
• PowerQuality.L2_kVA_H2_RMS (32…63)
• PowerQuality.L3_kVA_H1_RMS (DC…31)
• PowerQuality.L3_kVA_H2_RMS (32…63)
• PowerQuality.V1_N_Volts_H1_Ang (DC…31)
• PowerQuality.V1_N_Volts_H2_Ang (32…63)
• PowerQuality.V2_N_Volts_H1_Ang (DC…31)
• PowerQuality.V2_N_Volts_H2_Ang (32…63)
• PowerQuality.V3_N_Volts_H1_Ang (DC…31)
• PowerQuality.V3_N_Volts_H2_Ang (32…63)
• PowerQuality.VN_G_Volts_H1_Ang (DC…31)
• PowerQuality.VN_G_Volts_H2_Ang (32…63)
• PowerQuality.V1_V2_Volts_H1_Ang (DC…31)
• PowerQuality.V1_V2_Volts_H2_Ang (32…63)
• PowerQuality.V2_V3_Volts_H1_Ang (DC…31)
• PowerQuality.V2_V3_Volts_H2_Ang (32…63)
• PowerQuality.V3_V1_Volts_H1_Ang (DC…31)
• PowerQuality.V3_V1_Volts_H2_Ang (32…63)
• PowerQuality.I1_Amps_H1_Ang (DC…31)
• PowerQuality.I1_Amps_H2_Ang (32…63)
• PowerQuality.I2_Amps_H1_Ang (DC…31)
• PowerQuality.I2_Amps_H2_Ang (32…63)
• PowerQuality.I3_Amps_H1_Ang (DC…31)
• PowerQuality.I3_Amps_H2_Ang (32…63)
• PowerQuality.I4_Amps_H1_Ang (DC…31)
• PowerQuality.I4_Amps_H2_Ang (32…63)
Sag and Swell Detection
The PowerMonitor 5000 unit continually monitors line voltages and sets an
alarm flag when the voltage varies below (sag) or above (swell) a predetermined
threshold, expressed as a percentage of the nominal system voltage. The M5
model detects sags and swells with fixed voltage thresholds and reports them in
the Alarm Log. The M6 model retains the simple sag/swell capabilities of the M5
model and lets you adjust sag and swell thresholds; default sag and swell
thresholds correspond to definitions found in IEEE 1159 and EN 50160; records
waveforms on command or event; and records detailed event information in a
power quality log.
Rockwell Automation Publication 1426-UM001F-EN-P - November 2013 79
Page 80

Chapter 5 Power Quality Monitoring
Operation
The power monitor detects and annunciates a sag when any phase voltage varies
below the sag threshold. The sag indication continues for 90 seconds after the
event is detected.
A swell is indicated when any phase voltage exceeds the swell threshold. The
indication continues until 90 seconds has elapsed after all phase voltages return to
the threshold level.
Sag and swell detection operate on line-to-line voltages in Delta wiring modes,
and on line-to-neutral voltages in Wye and split-phase wiring modes. The 90second delay on return to normal provides a more reliable indication of sags and
swells when the status tags are logged at a one-minute interval.
Setup
Only basic metering configuration is required. The default sag and swell
thresholds are set at 90% and 110% of the nominal system voltage.
• In the M5 model thresholds and hysteresis are fixed.
• In the M6 model, thresholds and hysteresis can be adjusted.
See Power Quality Event Classification (M6 model)
on page 81.
Status
The Status.Alarms Data Table provides the following tags for monitoring of sags
and swells.
• Sag_Indication_Detected
• Swell_Indication_Detected
Sags and swells are also recorded in the alarm log with alarm type = 4 and alarm
code = 1 for sag, 2 for swell. In the M6 model, sags and swells and references to
their associated waveform records are recorded also in the Power Quality log.
Related Functions
• Basic Metering setup
• Power Quality setup (M6 model)
80 Rockwell Automation Publication 1426-UM001F-EN-P - November 2013
Page 81

Power Quality Monitoring Chapter 5
IMPORTANT
Power Quality Event Classification (M6 model)
IEEE 1159-2009, Recommended Practice for Monitoring Electric Power
Quality, categorizes various power quality events based on the parameters of the
event such as voltage change, frequency content, rise time, event duration, etc.
The table below, excerpted from the standard, summarizes the classifications in
the recommended practice.
Tab le 14 is excerpted from standard IEEE 1159-2009 and is used with
permission.
Table 14 - Categories and Typical Characteristics of Power System Electromagnetic Phenomena
Categories Typical Spectral Content Typical Duration Typical Voltage Magnitude
1.0 Transients
1.1 Impulsive
1.1.1 Nanosecond 5 ns rise < 50 ns
1.1.2 Microsecond 1 μs rise 50 ns - 1 ms
1.1.3 Millisecond 0.1 ms rise > 1 ms
1.2 Oscillatory
1.2.1 Low frequency < 5 kHz 0.3-50 ms 0-4 pu
1.2.2 Medium frequency 5-500 kHz 20 μs 0-8 pu
1.2.3 High frequency 0.5-5 MHz 5 μs 0-4 pu
2.0 Short-duration root-mean-square
(rms) variations
2.1 Instantaneous
2.1.1 Sag 0.5-30 cycles 0.1-0.9 pu
2.1.2 Swell 0.5-30 cycles 1.1-1.8 pu
2.2 Momentary
2.2.1 Interruption 0.5 cycles - 3 s < 0.1 pu
2.2.2 Sag 30 cycles - 3 s 0.1-0.9 pu
2.2.3 Swell 30 cycles - 3 s 1.1-1.4 pu
2.3 Temporary
2.3.1 Interruption >3 s - 1 min < 0.1 pu
2.3.2 Sag >3 s - 1 min 0.1-0.9 pu
2.3.3 Swell >3 s - 1 min 1.1-1.2 pu
3.0 Long duration rms variations
3.1 Interruption, sustained > 1 min 0.0 pu
3.2 Undervoltages > 1 min 0.8-0.9 pu
3.3 Overvoltages > 1 min 1.1-1.2 pu
3.4 Current overload > 1 min
4.0 Imbalance
4.1 Voltage steady state 0.5-2%
4.2 Current steady state 1.0-30%
5.0 Waveform distortion
5.1 DC offset steady state 0-0.1%
(1)
(2)
Rockwell Automation Publication 1426-UM001F-EN-P - November 2013 81
Page 82

Chapter 5 Power Quality Monitoring
Table 14 - Categories and Typical Characteristics of Power System Electromagnetic Phenomena
Categories Typical Spectral Content Typical Duration Typical Voltage Magnitude
5.2 Harmonics 0-9 kHz steady state 0-20%
5.3 Interharmonics 0-9 kHz steady state 0-2%
5.4 Notching steady state
5.5 Noise broadband steady state 0-1%
6.0 Voltage fluctuations < 25 Hz intermittent 0.1-7%
0.2-2 Pstb
7.0 Power frequency variations < 10 s ± 0.10 Hz
(1) These terms and categories apply to power quality measurements and are not to be confused with similar terms defined in IEEE Std 1366™-2003 [B27] and other reliability-related standards,
recommended practices, and guides.
(2) The quantity pu refers to per unit, which is dimensionless. The quantity 1.0 pu corresponds to 100%. The nominal condition is often c onsidered to b e 1.0 pu. In th is table, the nominal pea k value is use d as
the base for transients and the nominal rms value is used as the base for rms variations.
(1)
The PowerMonitor 5000 unit classifies power quality events it detects according
to the table. The M6 model does not detect events in categories 1, 5.3, 5.4, 5.5, or
6.
Short Duration RMS
Variations (Category 2.0 Sags, Swells, and
Interruptions) (M6 model)
The PowerMonitor 5000 M6 model detects and records instantaneous,
momentary and temporary variations in the RMS voltage. Interruptions are
recorded where the residual voltage is less than 10% of nominal. Configurable
parameters are provided for 5 levels of sag detection and 4 levels of swell
detection.
Setup
Basic metering configuration is required. The default values of the sag and swell
trip points and hysteresis configuration parameters are selected to conform to the
guidelines in IEEE 1159 and EN 50160 and are listed in the following table. The
associated configuration parameters are found in the
Configuration.PowerQuality tab.
Table 15 - Sag and Swell Configuration Parameters
Parameter Default Range
Sag1_Trip_Point_% 90 0.00…100.00
Sag1_Hysteresis_% 2 0.00…10.00
Sag2_Trip_Point_% 80 0.00…100.00
Sag2_Hysteresis_% 2 0.00…10.00
Sag3_Trip_Point_% 70 0.00…100.00
Sag3_Hysteresis_% 2 0.00…10.00
Sag4_Trip_Point_% 40 0.00…100.00
Sag4_Hysteresis_% 2 0.00…10.00
Sag5_Trip_Point_% 5 0.00…100.00
82 Rockwell Automation Publication 1426-UM001F-EN-P - November 2013
Page 83

Power Quality Monitoring Chapter 5
Table 15 - Sag and Swell Configuration Parameters
Parameter Default Range
Sag5_Hysteresis_% 2 0.00…10.00
Swell1_Trip_Point_% 110 100.00…200.00
Swell1_Hysteresis_% 2 0.00…10.00
Swell2_Trip_Point_% 120 100.00…200.00
Swell2_Hysteresis_% 2 0.00…10.00
Swell3_Trip_Point_% 140 100.00…200.00
Swell3_Hysteresis_% 2 0.00…10.00
Swell4_Trip_Point_% 180 100.00…200.00
Swell4_Hysteresis_% 2 0.00…10.00
Operation
A sag event is activated when the rms value of the voltage dips to less than or
equal to a sag trip point and released when the voltage again exceeds the same sag
trip point plus its hysteresis value.
A swell event is activated when the rms value of the voltage rises to greater than or
equal to a swell trip point and released when the voltage drops back to the same
swell trip point less its hysteresis value.
The PowerMonitor 5000 unit records each detected power quality event and
associated waveform record, as applicable. For example, with the default sag and
swell configuration values, the rms value drops to between 90% and 80% for one
second. The rms value then drops to between 80% percent and 70% for one
second. In the next cycle the rms value returns to normal.
In this case, the log records two events, one with two seconds below Sag1 Trip
Point and another with one second below Sag2 Trip Point. Because Sag1 is the
first event, the time stamp becomes the main event trigger time stamp.
According to the classifications defined in IEEE 1159 this event is classified as
Momentary Short Duration of RMS Variation with a total time of two seconds.
Related Functions
• Long Duration RMS Variations
• Wave fo rm Re co rd in g
• Power Quality Log
Rockwell Automation Publication 1426-UM001F-EN-P - November 2013 83
Page 84

Chapter 5 Power Quality Monitoring
Long Duration RMS
Variations (Category 3.0 Undervoltage, Overvoltage,
Sustained Interruptions) (M6
model)
A sag or swell with a duration that exceeds one minute is classified as an
undervoltage or overvoltage, respectively. An interruption with a duration that
exceeds one minute is classified as a sustained interruption.
Setup
These Sag and Swell parameters also determine that operation of undervoltage
and overvoltage detection.
• Sag1_Trip_Point_%
• Sag1_Hysteresis_%
• Swell1_Trip_Point_%
• Swell1_Hysteresis_%
Operation
When the duration of a sag or swell event exceeds 60 seconds, the new
classification is recorded in the power quality log with the time stamp of the
original sag or swell event, and the original sag or swell record in the power
quality log is updated with a duration of 60 seconds and its associated waveform
recording.
During an overvoltage or undervoltage event the PowerMonitor 5000 M6 model
records a new sag or swell condition if the voltage crosses a lower sag or higher
swell trip point.
Status
The Status.Alarms Data Table provides the following tags for monitoring of long
duration rms variations.
• IEEE1159_Over_Voltage
• IEEE1159_Over_Voltage_V1
• IEEE1159_Over_Voltage_V2
• IEEE1159_Over_Voltage_V3
• IEEE1159_Under_Voltage
• IEEE1159_Under_Voltage_V1
• IEEE1159_Under_Voltage_V2
• IEEE1159_Under_Voltage_V3
The alarm flags are released when the condition no longer exists.
84 Rockwell Automation Publication 1426-UM001F-EN-P - November 2013
Page 85

Power Quality Monitoring Chapter 5
V1 Rms
% of nominal
Time
(seconds )
100
70
40
10
60 120 180 240
120
t1
t2
t3
t5
t6
t7
t8
t9
t4
Alarm tags
Sag_Indication_Det ecte d
Swell_Indication_De tecte d
IEEE 1159_Under_Volta ge_V1
1
0
1
0
1
0
300
T8 + 90 sec
T9 + 90 sec
...
Pre
Event
Post
Event
80% Sag
3600 Cycles
90% Sag
t1
t2
t4
Power Quality Event Example
This example illustrates the actions taken by the PowerMonitor 5000 M6 model
in response to various types of power quality events.
Three waveforms are captured in this example. Waveform A represents two
cascading sags, the first one of which becomes an undervoltage after 60 seconds.
Rockwell Automation Publication 1426-UM001F-EN-P - November 2013 85
Page 86

Chapter 5 Power Quality Monitoring
Pre
Event
Post
Event
Swell
t8 t9
Waveform B represents the third sag, which occurs after the first waveform
recording reached its maximum duration and ended.
Pre
Event
t5
80% Sag
t6
Waveform C represents the swell following the interruption.
Post
Event
The power quality log includes the following events. The log records have been
simplified to make the example clearer.
Record ID Event Type Time Stamp Waveform
1 Voltage Sag t1 t1 60,000.0 408.0 90.00%
2 Voltage Sag t2 t1 133.3 369.6 80.00%
3Undervoltaget100090.00%
4 Voltage Sag t5 t5 200.0 369.6 80.00%
5 Voltage Swell t8 T8 133.3 542.4 110.00%
Timestamp
Event Duration Min or Max Trip Point
Related Functions
• Sag and Swell detection
• Power Quality Log
86 Rockwell Automation Publication 1426-UM001F-EN-P - November 2013
Page 87

Power Quality Monitoring Chapter 5
Voltage and Current Imbalance (Category 4.0)
The PowerMonitor 5000 includes long-term voltage and current unbalance in its
metering results. The M6 model reports voltage and current imbalance as power
quality events.
Setup
Basic metering setup is required. These configuration parameters are found in the
Configuration.PowerQuality tab:
• IEEE1159_Imbalance_Averaging_Intvl_m - rolling average interval for
Imbalance, default 15 minutes
• IEEE1159_Voltage_Imbalance_Limit_% - percent of voltage imbalance
to report an event, default 3 per cent.
• IEEE1159_Current_Imbalance_Limit_% - percent of current imbalance
to report an event, default 25 per cent
Operation
The M6 model calculates voltage and current imbalance over a rolling average
with a configurable range of 15 minutes (default) to 60 minutes. The rolling
average is updated at a rate of 10 seconds per minute of the specified interval.
When the rolling average value of voltage or current imbalance exceeds the
configured limit an event is recorded in the power quality log.
Status
The Status.Alarms table provides the following tags for monitoring of unbalance
events:
• IEEE1159_Imbalance_Condition_Volts - 1 = unbalance is above the limit
• IEEE1159_Imbalance_Condition_Current - 1 = unbalance is above the
limit
Rockwell Automation Publication 1426-UM001F-EN-P - November 2013 87
Page 88

Chapter 5 Power Quality Monitoring
Waveform Distortion
(Category 5.1 - DC Offset, and
5.2 - Harmonics) (M6 model)
The PowerMonitor 5000 M6 model detects and reports long-term waveform
distortion in excess of configured limits. Categories 5.3, 5.4 and 5.5 are not
supported in the M6 model.
Setup
Basic metering setup required. These configuration parameters are found in the
Configuration.PowerQuality tab:
• IEEE1159_DCOffsetAndHarmonics_Averaging_Intvl_m - rolling
average interval for DC offset and harmonics, range = 1
default = 5 minutes
• IEEE1159_Voltage_DCOffset_Limit_% - DC offset alarm threshold,
range = 0.00
• IEEE1159_Voltage_THD_Limit_% - voltage THD alarm threshold,
range = 0.00
• IEEE1159_Current_THD_Limit_% -current THD alarm threshold,
range = 0.00
…1.00 per cent of fundamental, default = 0.1 per cent
… 20.00 per cent of fundamental, default = 5 per cent
…20.00 per cent of fundamental, default = 10 per cent
…15 minutes,
Operation
The M6 model measures voltage and current THD, over the specified rolling
average interval and annunciates if these THD values exceed the specified
thresholds. The rolling average is updated at a rate of 10 seconds per minute of
the specified interval.
The PowerMonitor 5000 unit does not measure current DC offset because the
CTs do not pass DC. DC offset is measured on directly-connected voltage
channels and is tracked in the power quality log.
Status
These status bits annunciate over limit conditions and remain asserted until the
parameter is no longer over the threshold. A value of 1 indicates over limit. They
are found in the Status.Alarms tab.
• IEEE1159_DCOffset_Condition_V1
• IEEE1159_DCOffset_Condition_V2
• IEEE1159_DCOffset_Condition_V3
• IEEE1159_Voltage_THD_Condition_V1
• IEEE1159_Voltage_THD_Condition_V2
• IEEE1159_Voltage_THD_Condition_V3
• IEEE1159_Current_THD_Condition_ I1
• IEEE1159_Current_THD_Condition_ I2
• IEEE1159_Current_THD_Condition_ I3
88 Rockwell Automation Publication 1426-UM001F-EN-P - November 2013
Page 89

Related Functions
• Harmonic Analysis
• Power Quality Log
Power Quality Monitoring Chapter 5
Power Frequency Variations (Category 7.0)
The PowerMonitor 5000 M6 model detects and reports short-term power
frequency variations in excess of configured limits.
Setup
Basic metering setup is required. These configuration parameters are found in the
Configuration.PowerQuality tab:
• IEEE1159_PowerFrequency_Averaging_Intvl_s - rolling average interval
for power frequency , range = 1 (default)
• IEEE1159_PowerFrequency_Limit_Hz - power frequency variation alarm
threshold, range = 0.1 (default)
• IEEE1159_PowerFrequency_Hysteresis_Hz -power frequency hysteresis,
range = 0.01
…0.05 Hz, default = 0.02 Hz
…0.2 Hz
…10 seconds
Operation
The M6 model measures frequency variation over the specified rolling average
interval and annunciates if the value exceed the specified threshold. The rolling
average updates once per second. The hysteresis parameter is taken into account
when the alarm condition is released.
Status
This status bit annunciates an over limit condition and remains asserted until the
parameter is under the threshold less hysteresis. A value of 1 indicates over limit.
It is found in the Status.Alarms tab:
• IEEE1159_PowerFrequency_Condition
Related Functions
• Basic Metering
• Power Quality Log
Rockwell Automation Publication 1426-UM001F-EN-P - November 2013 89
Page 90

Chapter 5 Power Quality Monitoring
IEEE 519 Pass/Fail Capability (M6 model)
IEEE 519-1992, the standard for Recommended Practices and Requirements for
Harmonic Control in Electrical Power Systems, provides recommended limits for
the level of harmonics in a circuit. The standard applies these limits to current
and voltage harmonics up to the 40th order present at the Point of Common
Coupling (PCC) between your electric power supplier and your facility, typically
where utility meters are connected. The standard recommends limits for
individual harmonic components as well as limits for Total Demand Distortion
(TDD).
TDD is similar to THD except it is based on the maximum, rather than
measured, fundamental load current.
The standard specifies distortion limits for long term conditions, greater than
one hour. In the short term, these limits can be exceeded by 50%. The
PowerMonitor 5000 unit provides these results:
• Short Term: the 1 minute rolling average, updated at a 10 second rate.
• Long Term: the 1 hour rolling average, updated at a 10 minute rate.
The recommended limits for current and voltage harmonic distortion, expressed
as a percentage of the fundamental, are listed in the tables below.
Table 16 - IEEE 519 Current Distortion Limits (120 V … 69 kV)
Ratio of MAX_Isc
to MAX_IL
Less than 20 Odd 4.0 2.0 1.5 0.6 0.3 5.0
20…49.99 Odd 7.0 3.5 2.5 1.0 0.5 8.0
50…99.99 Odd 10.0 4.5 4.0 1.5 0.7 12.0
100…999.99 Odd 12.0 5.5 5.0 2.0 1.0 15.0
1000 and higher Odd 15.0 7.0 6.0 2.5 1.5 20.0
Individual Harmonic Order
1 … 10 11 …16 17 … 22 23 … 34 35 … 40 TDD
Even 1.0 0.5 0.4 0.2 0.1
Even 1.8 0.9 0.6 0.3 0.1
Even 2.5 1.1 1.0 0.4 0.2
Even 3.0 1.4 1.3 0.5 0.3
Even 3.8 1.8 1.5 0.6 0.4
Table 17 - IEEE 519 Voltage Distortion Limits (0 … 69 kV)
Individual voltage distortion, % Total voltage THD, %
3.0 5.0
Application
This applies only to the M6 model.
90 Rockwell Automation Publication 1426-UM001F-EN-P - November 2013
Page 91

Power Quality Monitoring Chapter 5
IMPORTANT
Setup
Basic Metering setup is required. Three configuration parameters required for
calculating the IEEE 519 Pass/Fail requirements are found in the
Configuration.PowerQuality tab.
• IEEE519_Compliance_Parameter - Selects 0 = current (default) or 1 =
voltage as the compliance parameter.
• IEEE519_MAX_Isc_Amps - Short circuit current available at the PCC,
in Amps. Default = 0
• IEEE519_MAX_IL_Amps - Average current related to the maximum
demand for the preceding 12 months. Default = 0
Zero values for Max Isc and IL disable the calculation.
IEEE 519 Pass/Fail Results
IEEE519_Overall_Status
The PowerMonitor 5000 reports the IEEE 519 pass/fail status for short term and
long term conditions in the Status.Alarms
values of IEEE519_MAX_Isc_Amps = 0 or IEEE519_MAX_IL_Amps = 0,
then the first row in Ta b l e 1 6
measure compliance. If the value of IEEE519_MAX_IL_Amps = 0, then current
THD rather than TDD is used to measure compliance.
This bitfield reports overall status.
0 = PASS
1 = FAIL
• Bit0 - ShortTerm_TDD_THD_PASS_FAIL
• Bit1 - LongTerm_TDD_THD_PASS_FAIL
• Bit2 - ShortTerm_Individual_Harmonic_PASS_FAIL
• Bit3 - LongTerm_Individual_Harmonic_PASS_FAIL
• Bit4 … 15 - Future Use
• ShortTerm_2nd_To_17th_Harmonic_Status
• LongTerm_2nd_To_17th_Harmonic_Status
These bitfields reports the short-term or long-term status of harmonics of order
2
…17.
IEEE 519 Current Distortion Limits is used to
table in the tags listed below. If the
0 = PASS
1 = FAIL
• Bit0 - 2nd_Harmonic_PASS_FAIL
• Bit1 - 3rd_Harmonic_PASS_FAIL
• …
• Bit15 - 17th_Harmonic_PASS_FAIL
• ShortTerm_18th_To_33rd_Harmonic_Status
• LongTerm_18th_To_33rd_Harmonic_Status
Rockwell Automation Publication 1426-UM001F-EN-P - November 2013 91
Page 92

Chapter 5 Power Quality Monitoring
These bitfields reports the short-term or long-term status of harmonics of order
18
…33.
0 = PASS
1 = FAIL
• Bit0 - 18th_Harmonic_PASS_FAIL
• Bit1 - 19th_Harmonic_PASS_FAIL
• …
• Bit15 - 33rd_Harmonic_PASS_FAIL
• ShortTerm_34th_To_40th_Harmonic_Status
• LongTerm_34th_To_40th_Harmonic_Status
These bitfields reports the short-term or long-term status of harmonics of order
34 through 40.
0 = PASS
1 = FAIL
• Bit0 - 34th_Harmonic_PASS_FAIL
• Bit1 - 35th_Harmonic_PASS_FAIL
• …
• Bit6 - 40th_Harmonic_PASS_FAIL
• Bit 7 … Bit 15 - Reserved, always = 0
IEEE-519 Short Term and Long Term Harmonic Results
The six data tables listed below provide an indication of individual current
harmonic distortion and TDD (Total Demand Distortion). If the user has
selected voltage as the output parameter the tables list voltage distortions and
THD (Total Harmonic Distortion).
• PowerQuality.IEEE519_CH1_ShortTerm_Results
• PowerQuality.IEEE519_CH2_ShortTerm_Results
• PowerQuality.IEEE519_CH3_ShortTerm_Results
• PowerQuality.IEEE519_CH1_LongTerm_Results
• PowerQuality.IEEE519_CH2_LongTerm_Results
• PowerQuality.IEEE519_CH3_LongTerm_Results
Each table provides the following:
• Timestamp of the most recent results
• Fundamental magnitude
• Individual harmonic distortion as a percentage of the fundamental
magnitude
• Overall distortion
– With current selected as the compliance parameter (default), if the
IEEE519_MAX_Isc and IEEE519_MAX_IL parameter values are
non-zero, then TDD is returned. Otherwise, THD is returned.
92 Rockwell Automation Publication 1426-UM001F-EN-P - November 2013
Page 93

Power Quality Monitoring Chapter 5
Refer to the PowerMonitor 5000 Unit Data Tables on page 225 for further
details on these data tables.
Related Functions
• Harmonic Analysis
• Alarm Log
Waveform Recording (M6 model)
The PowerMonitor 5000 M6 model can capture and record waveforms of all
current and voltage channels.
Setup
Basic metering setup is required. These configuration parameters are found in the
Configuration.PowerQuality tab:
• Capture_Pre_Event_Cycles - pre-event cycles for waveform capture,
range = 5 (default)…10 cycles
• Capture_Post_Event_Cycles - post-event cycles for waveform capture,
range = 2…30 cycles, default 15
These configuration parameters are found in the
Configuration.Communications_Native tab, and specify the synchronized
waveform broadcast parameters:
• WSB_Mode - waveform synchronization broadcast mode. The options are
the following:
– 0 = Disable (default)
– 1 = Enable
• WSB_Port - specified UDP port for WSB feature,
range = 1001 (default)…1009
To enable WSB capture of waveforms, PTP (IEEE 1588) must be enabled and
the power monitor must be synchronized with the PTP clock. Refer to Network
Time Synchronization.
Operation
Waveforms are recorded as a sequence of single-cycle harmonic data and stored in
a compressed file format in the power monitor. The PowerMonitor 5000 unit can
store up to 256 waveform files or a total of 21,600 cycles of waveform data. The
maximum size of a single waveform record is 3600 cycles plus the specified preevent and post-event numbers of cycles.
Rockwell Automation Publication 1426-UM001F-EN-P - November 2013 93
Page 94

Chapter 5 Power Quality Monitoring
Waveform capture is triggered in three ways:
• Manually, through a command
• Automatically by the power monitor when it detects a sag or swell event
• In response to a waveform synchronization broadcast message
Waveform triggers are ignored when insufficient space remains to store a new
waveform.
Waveform files can be cleared by using the Clear_Waveform command. See
Commands
on page 95.
The waveform voltage source depends on the Metering_Mode parameter value.
For Demo, split-phase, or Wye modes, phase voltage (V-N) is used. For Delta,
line-to-line voltages are used. If the metering mode is changed while a waveform
capture is active, the active capture is stopped and saved.
Manual Waveform Recording on Command
A manually triggered waveform recording has a length of 30 cycles plus the preevent and post-event cycles.
Waveform Recording Triggered by Sag or Swell
The length of a waveform recording triggered by a power quality event is equal to
the duration of the event (but no more than to 3600 cycles) plus the pre-event
and post-event cycles.
Network Synchronized Waveform Recording
The PowerMonitor 5000 M6 model can receive and send remote waveform
capture triggers by using Waveform Synchronization Broadcast (WSB) messages
through a UDP port by using native Ethernet communication. The two types of
WSB messages are start waveform and end waveform. Each type of message also
contains a network id (last 3 bytes of the originator's MAC ID), trigger type (sag ,
swell, or user command) and timestamp information.
WSB is disabled by default. If WSB is disabled, the unit neither sends nor
receives WSB messages. If WSB is enabled, and PTP is enabled and
synchronized, the unit broadcasts a WSB start message when an internal
triggering event begins and broadcast a WSB end message when the event is
finished. When a unit receives a WSB message through the selected UDP port, it
starts recording a waveform aligned with the WSB start message timestamp,
ending the waveform recording when the WSB end message is received from the
originator. If the WSB end message is lost, the recording ends when 3600 cycles
have been recorded.
If the PTP clock is not synchronized (IsSynchronized value = 0), WSB messages
are not broadcast or acted upon if received.
94 Rockwell Automation Publication 1426-UM001F-EN-P - November 2013
Page 95

Power Quality Monitoring Chapter 5
Waveform Cap ture Application Considerations
The PowerMonitor 5000 captures one waveform record at a time. It is possible
that more than one triggering event can occur in a short time. The starting point
of a waveform capture is determined by the first triggering event and the defined
pre-event cycles. If fewer cycles of data are available, then the first available cycle
is the starting point.
If more than one triggering event occurs during a waveform capture, the capture
duration extends to include the duration of the event that ends latest, plus the
post-trigger cycles. A waveform record that includes more than one triggering
event is referenced in all power quality log records of the triggering events.
Pre-event or post-event cycle settings that are changed during a waveform capture
do not take effect until the next capture. Any change to
Configuration.Metering_Basic immediately ends a waveform capture that is in
process.
In the unlikely event that the PowerMonitor 5000's resources are overstressed so
that it is unable to write a waveform record to non-volatile memory in a timely
fashion, the in-process waveform record ends with the latest cycle captured in
RAM.
Commands
The following waveform-related commands are found in the
Command.System_Registers table.
Command Word 2
Set this command word value to execute the listed action. These are the
selections:
• 14 = Trigger Waveform
• 15 = Clear Waveform
Clear Waveform operates by using the value contained in the tag listed below.
The default value is zero.
Clear Waveform File ID
Waveform File ID, the choices are the following:
• 0 = Clear All
• 1…32767 = Clear selected; if the ID does not exist, the command is
ignored
Rockwell Automation Publication 1426-UM001F-EN-P - November 2013 95
Page 96

Chapter 5 Power Quality Monitoring
IMPORTANT
Waveform File Names
Waveform files are stored with names that contain file identification and a local
timestamp. The file name syntax is:
Waveform_ID_YYYYMMDD_hhmmss_MicroS_HH, where
• ID = the file identifier, used in the Clear_Waveform command
• YYYMMDD_hhmmss = the local date and time stamp of the record,
used to associate the waveform file with a power quality log record
• MicroS = the microsecond timestamp of the record, used for aligning
WSB waveform records
• HH = the UTC hour avoids duplication during daylight-saving time
transition
Retrieving Waveform Records by Using FTP
You can retrieve compressed waveform files by using File Transfer Protocol (ftp)
and native Ethernet communication. A number of ftp clients are available many
at no cost. This example uses Microsoft Internet Explorer as the ftp client. To
access and download waveform files by using a web browser, follow these steps.
1. Open Internet Explorer and browse to the ftp server of the PowerMonitor
5000. The url is ftp://<ip_address>/, where <ip_address> is the one
assigned to the native Ethernet port.
2. Browse to the Waveform directory.
3. Select a waveform file name from the list and click the Save to save the file
in the location of your choosing
If you are using FactoryTalk EnergyMetrix software to log data from your
PowerMonitor 5000 unit, the software can automatically download and clear
waveform files shortly after they have been recorded. In this case, the file list in
the ftp client is empty. Use the software to view and manage waveform files.
96 Rockwell Automation Publication 1426-UM001F-EN-P - November 2013
Page 97

Power Quality Monitoring Chapter 5
Reading Waveform Records by Using the Data Table Interface
The procedure for reading waveform records is similar to that used for reading
data logging records. Refer to Reading Logging Records by Using the Data Table
Interface on page 103.
Related Functions
• Sag and Swell Detection
• Network Time Synchronization
• Power Quality Log
Rockwell Automation Publication 1426-UM001F-EN-P - November 2013 97
Page 98

Chapter 5 Power Quality Monitoring
Notes:
98 Rockwell Automation Publication 1426-UM001F-EN-P - November 2013
Page 99

Logging
Top ic P age
Logging Overview 100
Waveform Log (M6 Model) 105
Energy Log 109
Data Log 113
Min/Max Log 123
Load Factor Log 126
Time- of-use (TOU) Log 128
Event Log 130
Setpoint Log 134
Alarm Log 136
Power Quality Log (M6 model) 141
Trigger Data Log (M6 model) 145
Snapshot Log 148
Chapter 6
This section describes the functions of the PowerMonitor 5000 unit. Most
functions require you to configure set-up parameters to align the unit with your
installation and your application requirements. The set-up parameters are listed
by name and described in this section. You can view set-up parameters by using
the PowerMonitor 5000 web page, and when logged in to an Admin account,
make changes to the setup. Set-up parameters are also accessible by using
communication.
Please refer to the Data Tables for additional information on setup parameters
including the following:
• Range of valid values
• Default values
• Data type
Set-up parameters can be found in data tables with names beginning with
‘Configuration’, for instance Configuration.Metering_Basic.
Rockwell Automation Publication 1426-UM001F-EN-P - November 2013 99
Page 100

Chapter 6 Logging
Logging Overview
The PowerMonitor 5000 unit maintains a number of types of internal data logs
and records metering, status, event, and alarm data into these logs as specified in
the logging configuration. This table summarizes the data log types and sizes, and
how their records can be retrieved.
Log Type Model Max Number of Records Log Data Retrieval Method
Read Selected
Record
Waveform log M6 21,600 cycles, 256 files • • •
Energy log All 90 days (129,600 @ 1 minute log rate) • • •
Data log All 60,000 @ 32 parameters • • •
Min/Max log All 82 parameters • • • •
Load Factor log All 13 Including Current Month • • • •
Time-of-Use log All 13 Including Current Month • • • •
Alarm log All 100 Alarms • • •
Event log All 100 Events • • •
Setpoint log All 100 Setpoint Events • • •
Power Quality log M6 100 • • •
Trigger Data log M6 3,600 cycles, 60 files • • •
Snapshot log M6 2270 parameters 1 file • • •
Read Records
Sequentially, in
Forw ard or
Reverse Order
Web Fi le
Download
FTP File
Download
Setup
The following set-up parameters define the behavior of the data logging functions
in the PowerMonitor 5000 unit, except for the Data Log, which has its own set of
set-up parameters. These parameters are found in the Configuration.Logging
table.
Energy_Log_Interval
Energy_Log_Interval selects how often a record is logged, in minutes:
0 = Disables energy logging
1…60 = Length of logging interval in minutes
-1 = Synchronizes energy logging to the end of the demand interval
Energy_Log_Mode
Energy_Log_Mode defines the log behavior when full:
0 = Stop logging
1 = Delete oldest energy log file and create a new file
100 Rockwell Automation Publication 1426-UM001F-EN-P - November 2013
 Loading...