

Page 1

Eagle 2 Data Logger
Management Program
Operator’s Manual
Part Number: 71-0170RK
Revision: C
Released: 6/12/12
www.rkiinstruments.com
Page 2

Warranty
RKI Instruments, Inc. warrants gas alarm equipment sold by us
to be free from defects in materials and workmanship, and
performance for a period of one year fr om date of shipment from
RKI Instruments, Inc. Any parts found defective within that
period will be repaired or repla ced, at our op tion , free of charge.
This warranty does not apply to those items which by their
nature are subject to deterioration or consumption in normal
service, and which must be cleaned, repaired, or replaced on a
routine basis. Examples of such items are:
Absorbent cartridges Batteries
Pump diaphragms and valves Filter elements
Fuses
Warrant y is voi ded by abuse including mechanical damage,
alteration, rough handling, or repairs procedures not in
accordance with the instruction manual. This warranty indicates
the full extent of our liability, and we are not responsible for
removal or replacement costs, local repair costs, transportation
costs, or contingent expenses incurred without our prior
approval.
This warranty is expressly in lieu of any and all other warranties
and representations, expressed or implied, and all other
obligations or liabilities on the part of RKI Instruments, Inc.
including but not limited to the warranty of merchantability or
fitness for a particular pur pose. In no event shall RKI
Instruments, Inc. be liable for indirect, incidental, or
consequential loss or damage of any kind connected with the
use of its product s or f ailure of it s prod ucts to function or operate
properly.
This warranty covers instruments and part s sold to users o nly by
authorized distributors, dealers, and representatives as
appointed by RKI Instruments, Inc.
Warranty
We do not assume indemnification for any accident or damage
caused by the operation of this gas monitor and our warranty is
limited to replacement of parts or our complete goods.
Page 3

Table of Contents
Introduction . . . . . . . . . . . . . . . . . . . . . . . . . . . . . . . . . . . . . . . . . . . . . . . 1
System Requirements . . . . . . . . . . . . . . . . . . . . . . . . . . . . . . . . . . . . . . . 2
Installing the Eagle 2 Data Logger Management Program . . . . . . . . . . 3
IrDA Downloading Cable . . . . . . . . . . . . . . . . . . . . . . . . . . . . . . . . . . . . . 5
Installing an IrDA Adapter Cable . . . . . . . . . . . . . . . . . . . . . . . . . . . 5
®
Windows
Launching the Program . . . . . . . . . . . . . . . . . . . . . . . . . . . . . . . . . . . . . . 8
Control Buttons . . . . . . . . . . . . . . . . . . . . . . . . . . . . . . . . . . . . . . . . . . . . 9
Wireless Link Operation Note . . . . . . . . . . . . . . . . . . . . . 6
Download Button . . . . . . . . . . . . . . . . . . . . . . . . . . . . . . . . . . . . . . 10
Instrument Information Button . . . . . . . . . . . . . . . . . . . . . . . . . . . . 10
Data Button . . . . . . . . . . . . . . . . . . . . . . . . . . . . . . . . . . . . . . . . . . . .11
Last Calibration Button . . . . . . . . . . . . . . . . . . . . . . . . . . . . . . . . . . 13
Set Button . . . . . . . . . . . . . . . . . . . . . . . . . . . . . . . . . . . . . . . . . . . . 14
Downloading Data from the Eagle 2 . . . . . . . . . . . . . . . . . . . . . . . . . . . 15
Eagle 2 Data Logging Capacity . . . . . . . . . . . . . . . . . . . . . . . . . . . . . . . 20
Overwriting Data in the Eagle 2. . . . . . . . . . . . . . . . . . . . . . . . . . . . . . . 21
Viewing Data in the Instrument Information Screen . . . . . . . . . . . . . . 22
Viewing, Printing, Exporting, & Deleting Data in the Data Window . . 24
Data Window . . . . . . . . . . . . . . . . . . . . . . . . . . . . . . . . . . . . . . . . . 24
Calibration History . . . . . . . . . . . . . . . . . . . . . . . . . . . . . . . . . . . . . 26
Event Data . . . . . . . . . . . . . . . . . . . . . . . . . . . . . . . . . . . . . . . . . . . 30
Interval Trend Data . . . . . . . . . . . . . . . . . . . . . . . . . . . . . . . . . . . . . 34
Alarm Trend Data . . . . . . . . . . . . . . . . . . . . . . . . . . . . . . . . . . . . . . 50
Deleting Data in the Data Window. . . . . . . . . . . . . . . . . . . . . . . . . . 60
Table of Contents
Page 4

Changing the Password . . . . . . . . . . . . . . . . . . . . . . . . . . . . . . . . . 63
Viewing, Printing, & Deleting Data in the Last Calibration Window. . 66
Viewing & Printing Last Calibration Data. . . . . . . . . . . . . . . . . . . . . 66
Deleting Last Calibration Data. . . . . . . . . . . . . . . . . . . . . . . . . . . . . 70
Calibrating An Eagle 2 With the Data Logging Software . . . . . . . . . . 73
Changing Eagle 2 Instrument Parameters . . . . . . . . . . . . . . . . . . . . . . 77
Detail Settings Button. . . . . . . . . . . . . . . . . . . . . . . . . . . . . . . . . . . . . . . 80
Station & User Tab. . . . . . . . . . . . . . . . . . . . . . . . . . . . . . . . . . . . . . 82
Conversion Table Tab . . . . . . . . . . . . . . . . . . . . . . . . . . . . . . . . . . . 88
PID Sensor Tab . . . . . . . . . . . . . . . . . . . . . . . . . . . . . . . . . . . . . . . . 94
Obtaining a Relative Response Factor . . . . . . . . . . . . . . . . . . . . . 101
Changing the Appearance of the Pro gram Screens . . . . . . . . . . . . . .113
Sp are Parts List . . . . . . . . . . . . . . . . . . . . . . . . . . . . . . . . . . . . . . . . . . .116
CAUTION: Read and understand this manual before using the
Eagle 2 Setup Program. Also read and understand
the Eagle 2 Operator’s Manual included with the
Eagle 2 portable gas detector.
Table of Contents
Page 5

Introduction
Using an advanced detection system consisting of up to six gas
sensors, the Eagle 2 Gas Monitor detects the presence of
combustible gases, oxygen (O
hydrogen sulfide (H
Eagle 2’s compact size and easy-to-use design make it ideally
suited for a wide range of applicatio ns as described i n the Eagle
2 Operator’s Manual. Please read the Eagle 2 Operator’s
Manual first before using th e Eagl e 2 Data Logger Management
Program.
The Eagle 2 Data Logger Management Program downloads
stored data in the Eagle 2 to a Windows-based PC. After the
data has been downloaded, you can view, save, or print it using
your computer and the Eagle 2 Data Logger Management
Program.
), carbon monoxide (CO),
2
S), and 2 other gases simultaneously. The
2
The purpose of this manual is to explain how to use and set up
the Eagle 2 Data Logger Management Program. You will learn
how to:
• install and launch the program
• install the downloading cable (if needed)
• download data from the Eagle 2
• view, print, and save data
• change data logging parameters
• perform a calibration
• change the appearance of the program screens
• change the color of graphed readings for a particular gas
Before you get started, be sure to review the system
requirements in the next section.
Introduction • 1
Page 6

CAUTION: The Eagle 2 detects oxygen deficiency and
elevated levels of oxygen, combustible gases,
carbon monoxide, and hydrogen sulfide, all of
which can be dangerous or life threatening. When
using the Eagle 2, you must follow the instructions
and warnings in the Eagle 2 Operator’s Manual to
assure proper and safe operation of the unit and to
minimize the risk of personal injury.
CAUTION: The operator of this instrument is advised that if t he
equipment is used in a manner not specified in this
manual, the protection provided by th e equipment
may be impaired.
System Requirements
To use the Eagle 2 Data Logger Management Program , your
personal computer must meet the following requirements:
• Operating Systems: Windows® 2000, Windows® XP,
®
Windows
• Processor: IBM
higher.
• Memory: 32 MB RAM minimum
• Available Har d Disk Space: 32 MB minimum
• CD-ROM Drive
• Infrared port or
USB port and a USB/IrDA adapter cable
Vista, or Windows® 7.
®
compatible PC running Pentium® 2 or
2 • System Requirements
Page 7

Installing the Eagle 2 Data Logger
Management Program
1. Launch Windows®.
2. Exit from all applications and open windows.
3. There are two ways to install the Eagle 2 Data Logger
Management Program: by using the Eagle 2 Product CD or
by using the Eagle 2 Data Logger Management Program
Installation CD.
• If you are using the Eagle 2 Product CD, insert the Product
CD in your computer’s CD-ROM drive. The CD will
automatically open revealing several folders. Open the
Data Downloading Program folder, double click on
setup.exe, then continue with step 4.
• If you are using the Eagle 2 Data Logger Management
Program Installation CD, it will automatically begin the
installation process. Insert it in your computer’s CD-ROM
drive, then continue with step 4.
4. After a few seconds, a screen appears indicating that the
InstallShield Wizard is preparing to install the Data Logger
Management Program, then the Eagle 2 InstallS hield Wizard
window appears to guide you through installation.
Installing the Eagle 2 Data Logger Management Program • 3
Page 8
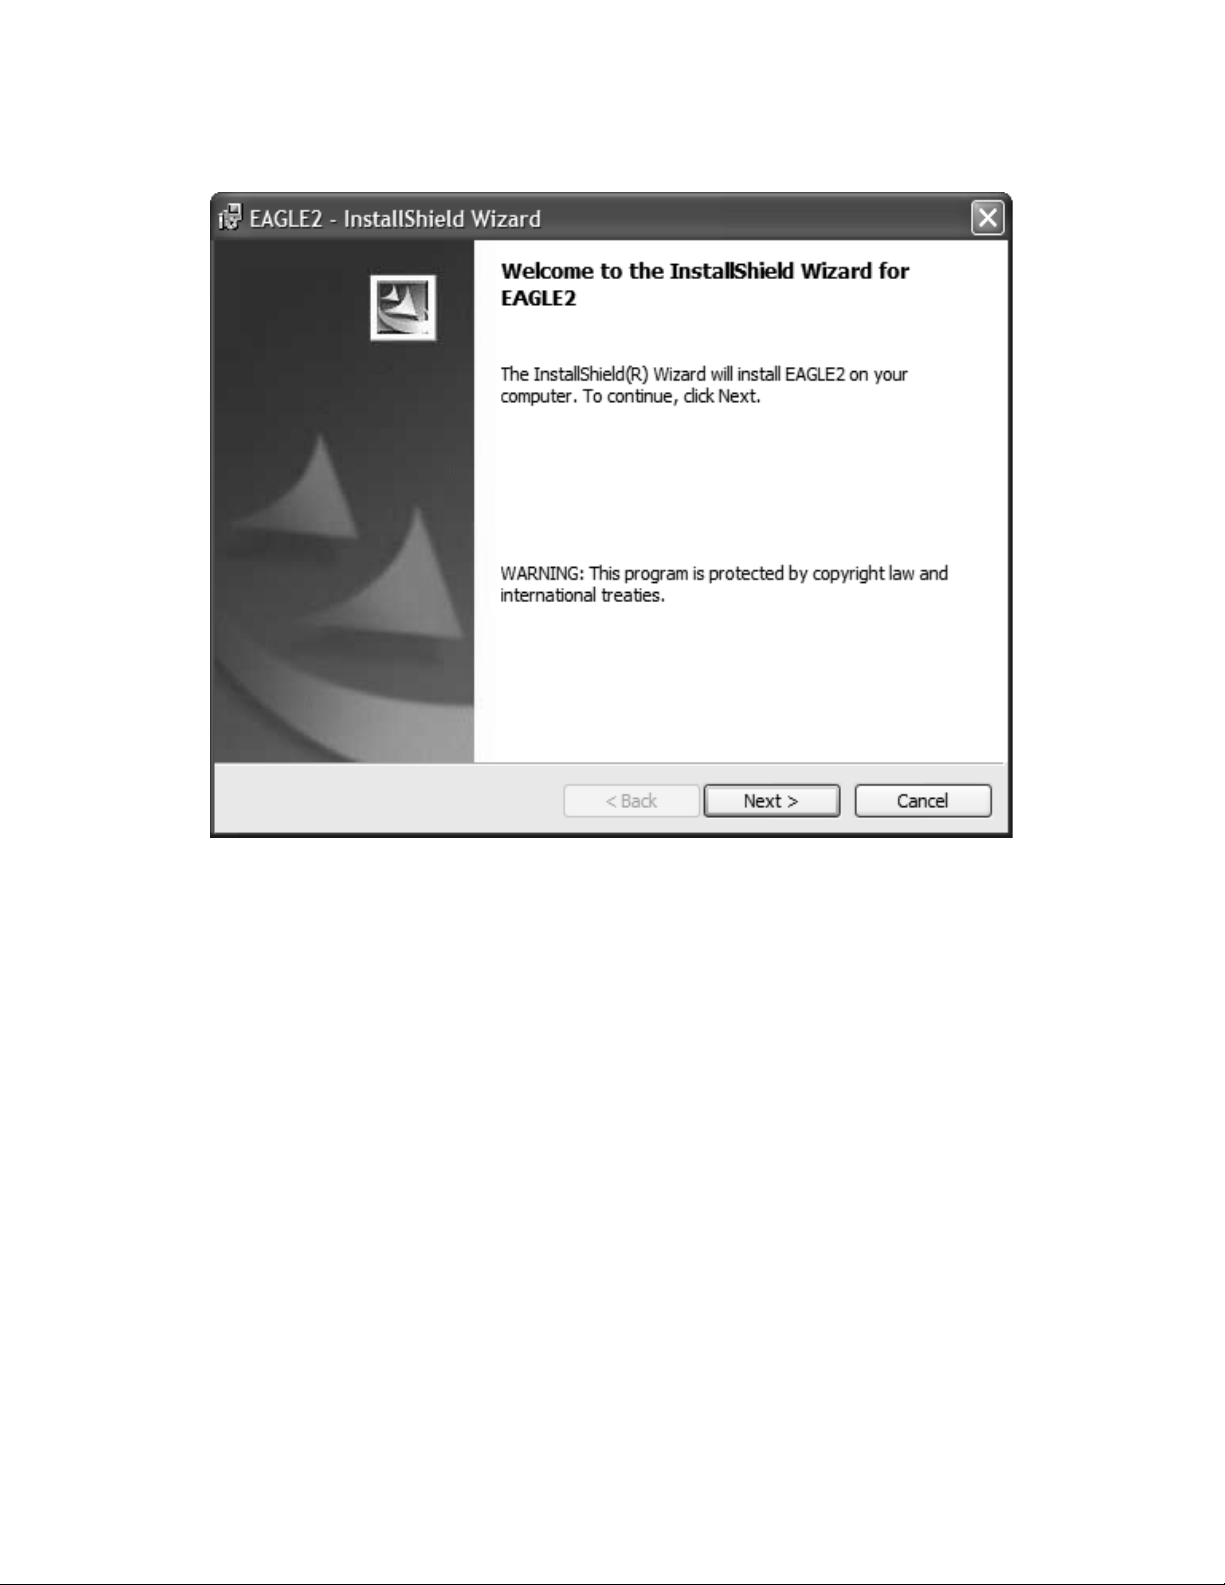
Figure 1: Eagle 2 Data Management Installation Program
5. Follow the on-screen instructions in the InstallShield Wizard
Window to install the program.
6. If the InstallShield Wizard finds versions of Windows
on your computer newer than those in the product CD or
installation CD, it will ask you if you want to keep these
newer files. Click Yes.
7. When the InstallShield Wizard indicates that installation is
complete, click the Finish button.
8. Eject the CD from the CD-ROM drive and store it in a safe
place.
4 • Installing the Eagl e 2 Data Logger Management Program
®
files
Page 9

IrDA Downloading Cable
The Eagle 2 communicates with a computer via an on-board
infrared communication port that co mp lies with IrDA prot ocol
standards.
NOTE: If your computer has a built-in infrared port, you do not
need an adapter cable to download data.
If your computer does not have an infrar ed port, you will need to
install an IrDA/USB adapter cable on your computer to use the
Eagle 2 Data Logger Management Program with yo ur
Eagle 2. The IrDA/USB cable is availabl e f rom RKI In struments,
Inc. See the Spare Parts List at the end of this manual for the
RKI part number. This cable can also be found on many
electronic supply websites.
®
Some versions of Windows
device drivers loaded in Windows
already have several infrared
®
and will automatically
recognize a cable during the installation process and guide you
in installing the drivers. Other versions of Windows
®
will require
you to load device drivers provided by the manufacturer of the
cable during the install ation pr ocess. RKI makes n o warranty for
the operation or compatibility of the drivers with any particular
device.
Installing an IrDA Adapter Cable
After installing the Eagle 2 Data Logger Management Program,
connect the IrDA/USB cable to your computer and follow the
manufacturer’s instructions for installing the cable on your
computer. Make sure the cable is compatible with your
Windows
If you do not have instructions from the cable manufacturer for
installing your cable, see your Windows documentation. In
general, you must go to the Control Panel and use the Add
Hardware Wizard to install the cable drivers.
®
operating system.
IrDA Downloading Cable • 5
Page 10

Windows
®
Wireless Link Operation Note
When using an IrDA adapter cable and the Eagle 2 Data Logger
Management Program on a Windows
®
computer , it is necessary
to make a special setting in the Wireless Link Configuration
window for proper communication between the Eagle 2 and the
Eagle 2 Data Logger Management P rogram. This must be don e
before attempting to use the program. Follow these steps to
make this setting:
®
1. Click Start on the Windows
Icon Tray.
2. If Control Panel is available to select in the Start menu,
select it. The Control Panel will appear.
If Control Panel is not selectable in the Start menu but
Settings is, select Settings, then select Control Panel. The
Control Panel will appear.
3. Double click on Wireless Link. The Wireless Link
Configuration Window will appear.
4. Click on the Image Transfer tab.
5. Deselect the selection box for “Use Wireless Link to transfer
images from a digital camera to your computer.”
6 • IrDA Downloading Cable
Page 11
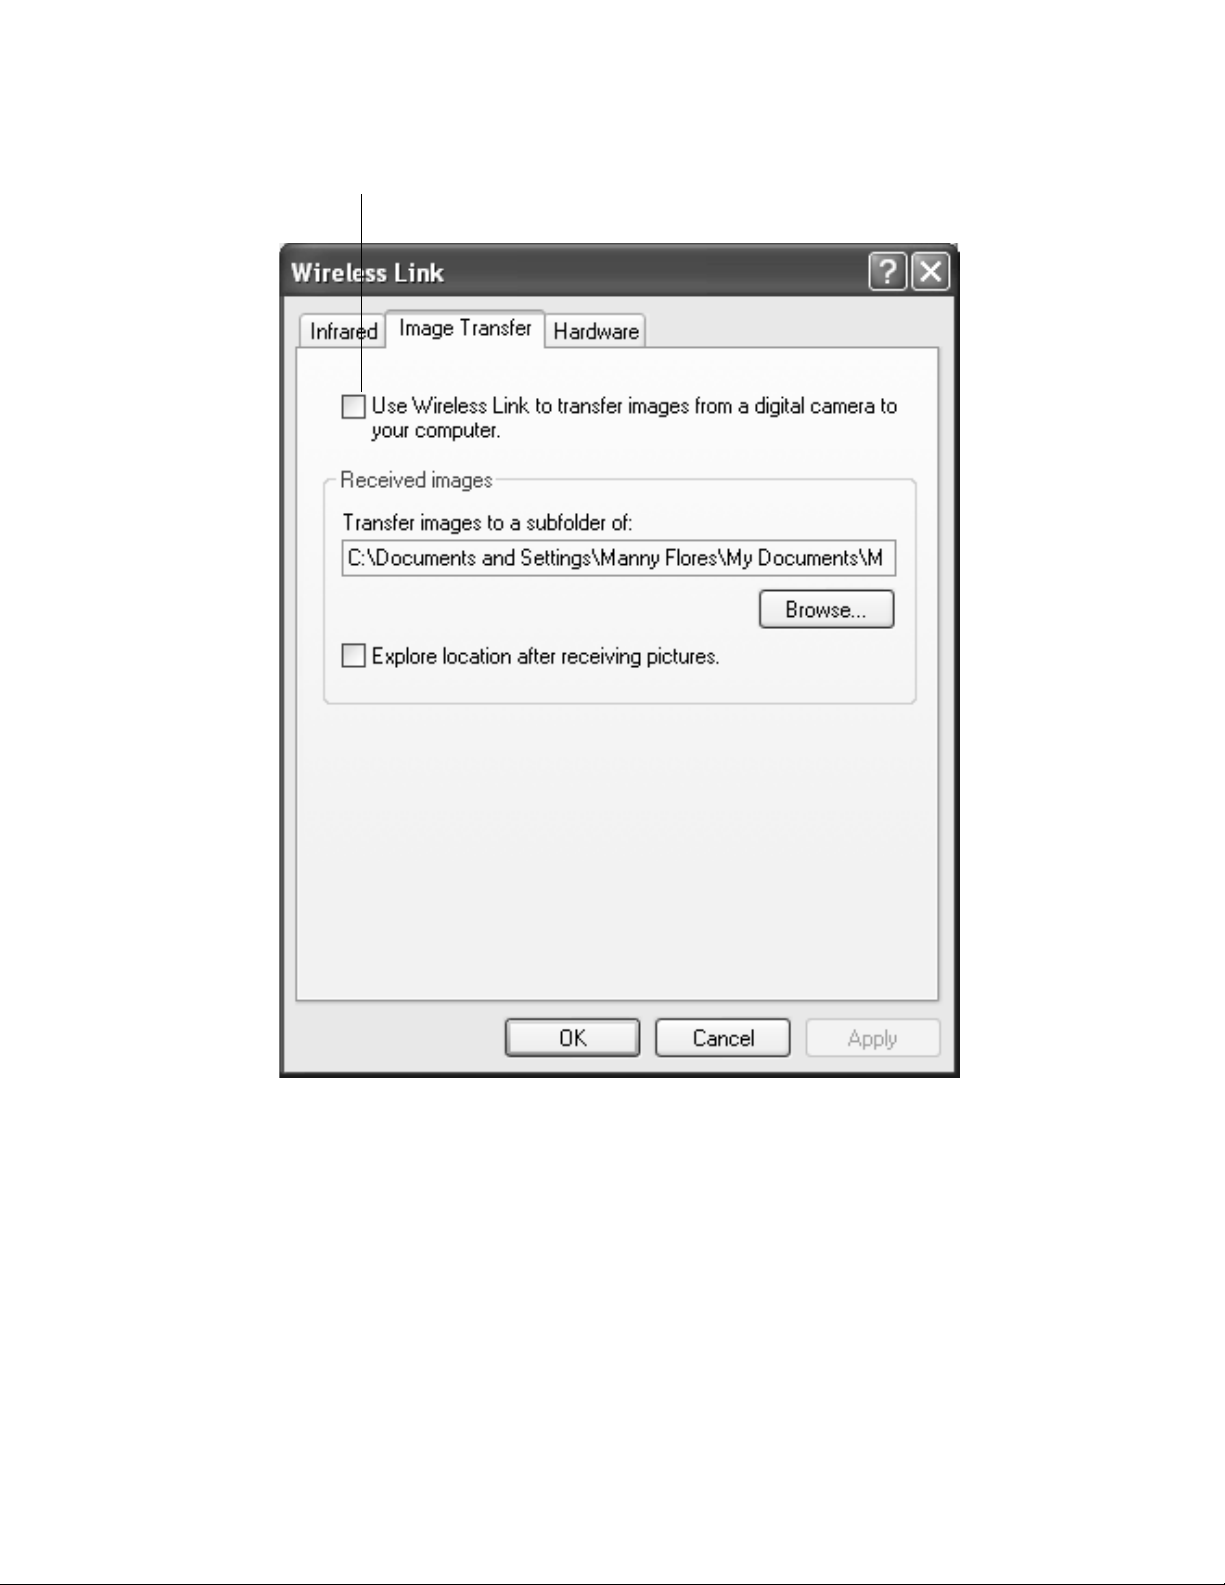
Figure 2: Image Transfer Tab
Deselect
6. Click OK.
7. Close the Control Panel window.
IrDA Downloading Cable • 7
Page 12
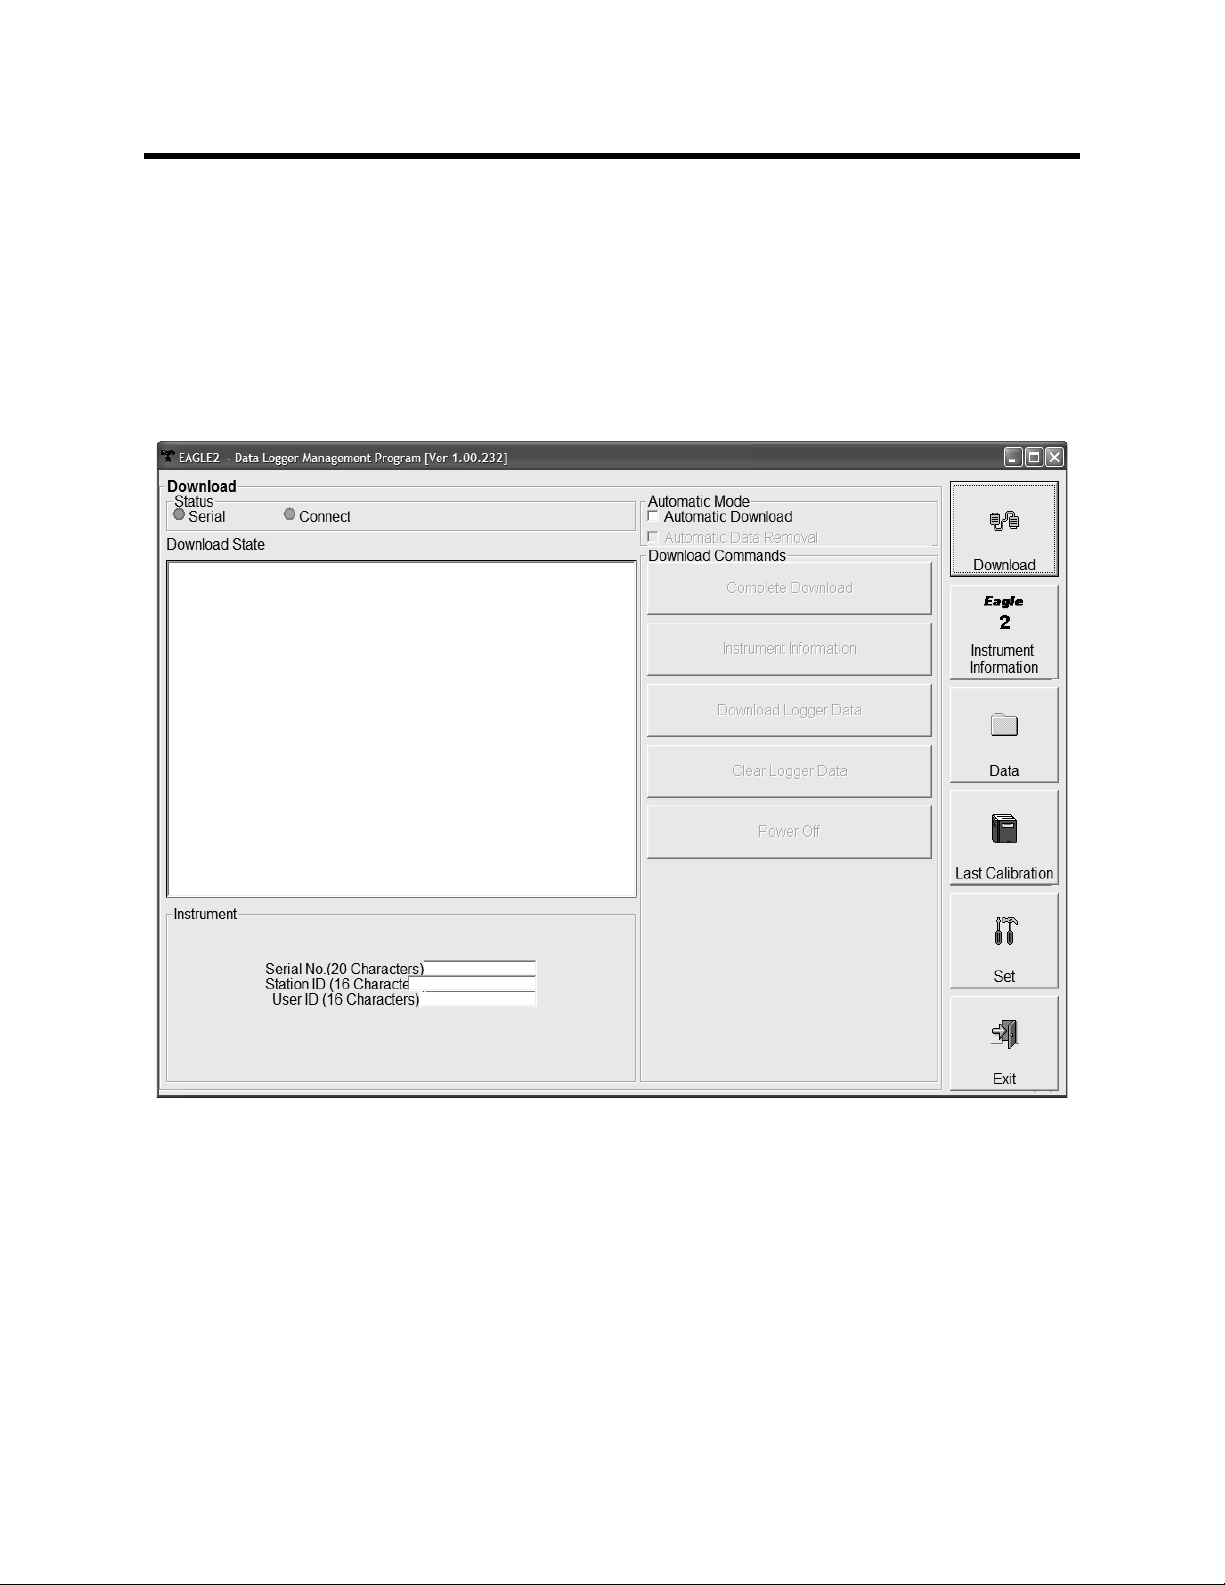
Launching the Program
Figure 3: The Download Window
1. Click Start on the Windows® Icon Tray, then select All
Programs, then select Eagle 2. Your operating system may
also have a shortcut installed in the St art menu.
2. The program will launch and the Download Window will
appear.
3. For convenience, make a shortcut of the Eagle 2 Data
Logger Management Program and place it on the Windows
desktop. See your Windows
about making shortcuts.
8 • Launching the Program
®
documentation for information
®
Page 13
Control Buttons
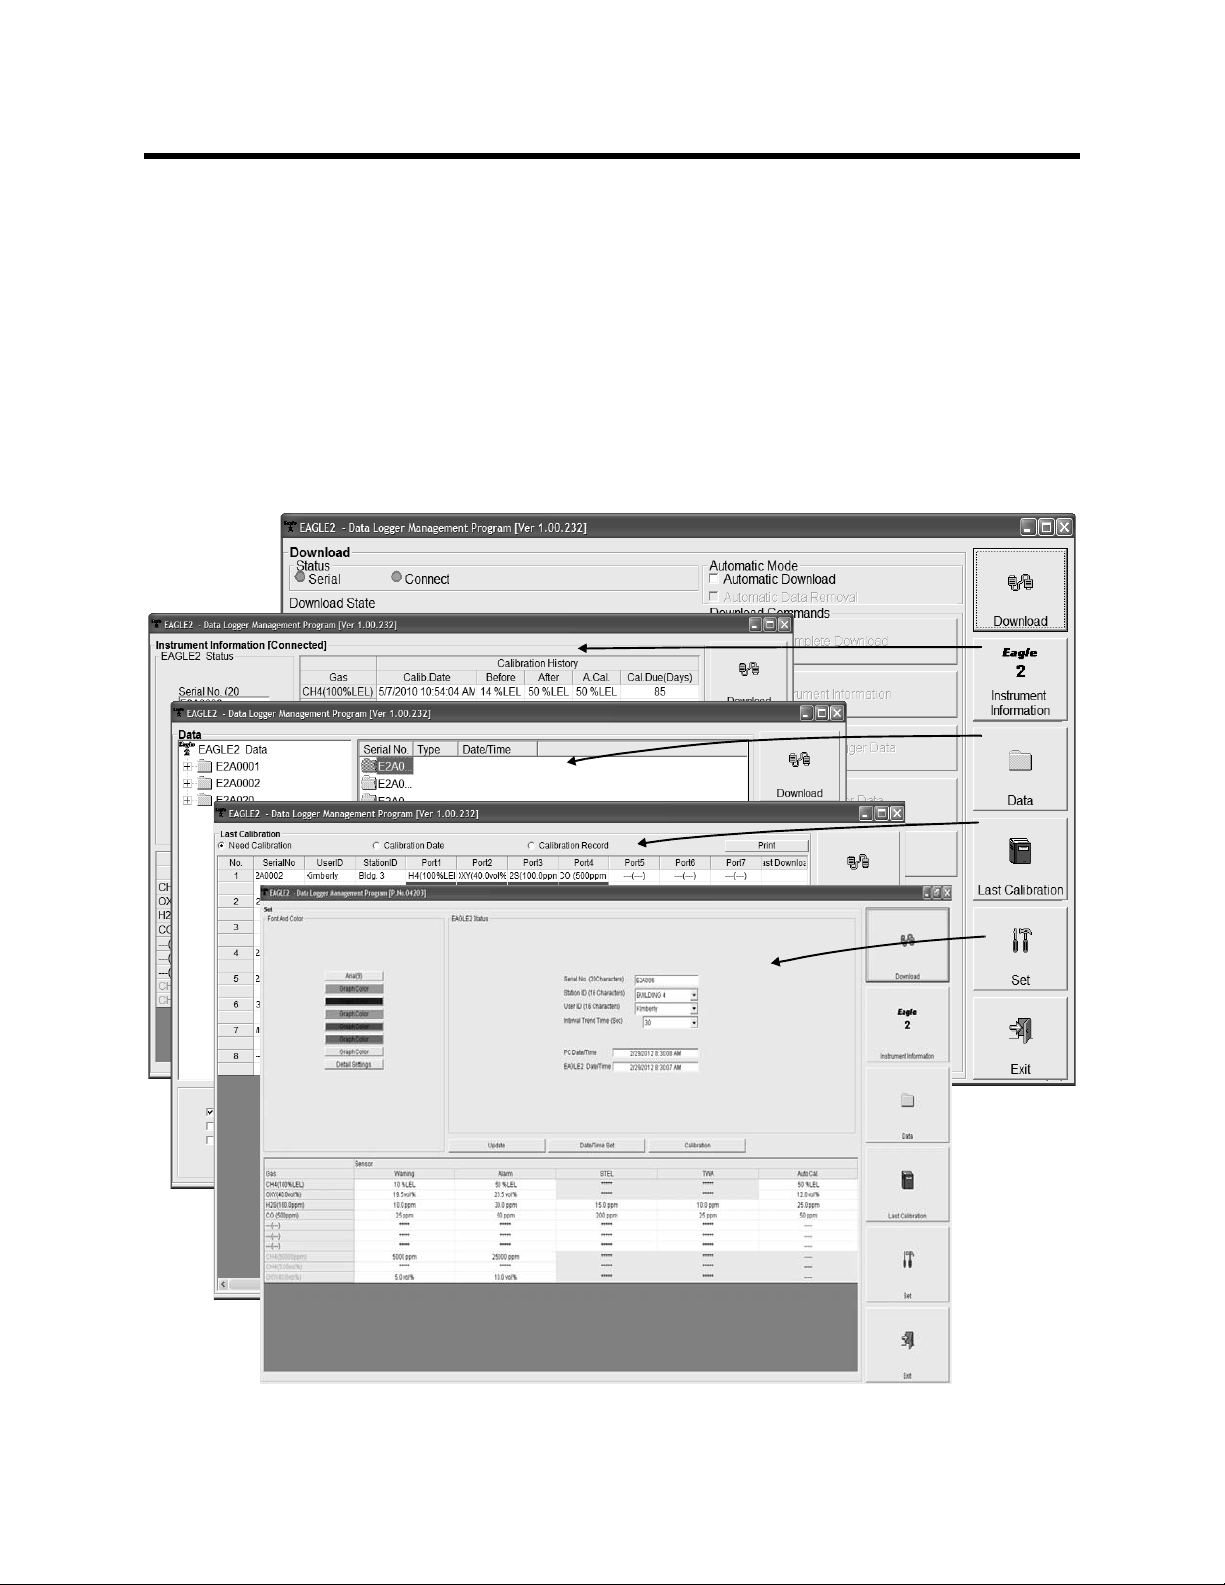
Figure 4: Windows Accessed by Control Buttons
This section provides an overview of the control buttons.
Instructions for using the various pa rts of the program accessed
by the control buttons are given in other parts of this manual.
When the program is launched, it opens in the Download
Window. Along the right side of the Download Window are six
control buttons that access other windows in the program.The
figure below shows the various windows that you can access
when you click the control buttons.
Control Buttons • 9
Page 14
Download Button
Figure 5: Instrument Information Window
If you are in another program window, clicking the Download
button opens the Download Window (see Figure 3). The
Download window has several download commands that allow
you to perform various data retrieval functions with an
instrument that is connected to the program. Data can be
retrieved from the instrument, data can be cleared from the
instrument, and the instrument can be turned off. See
“Downloading Data from the Eagle 2” on p age 15 for a complete
description of downloading data from an Eagle 2.
Instrument Information Button
Clicking the Instrumen t Information button opens the
Instrument Information Window.
The Instrument Information Window displays various inst rument
parameters for an instrument that has been downloaded using
the Complete Download or Inst rument Informati on download
10 • Control Buttons
Page 15
commands and is currently connected to the program. If an
Figure 6: Data Window
instrument is turned off after being connected to the program,
then the program will lose the connection with the instrument
and the fields in the Instrument Information Window will become
empty.
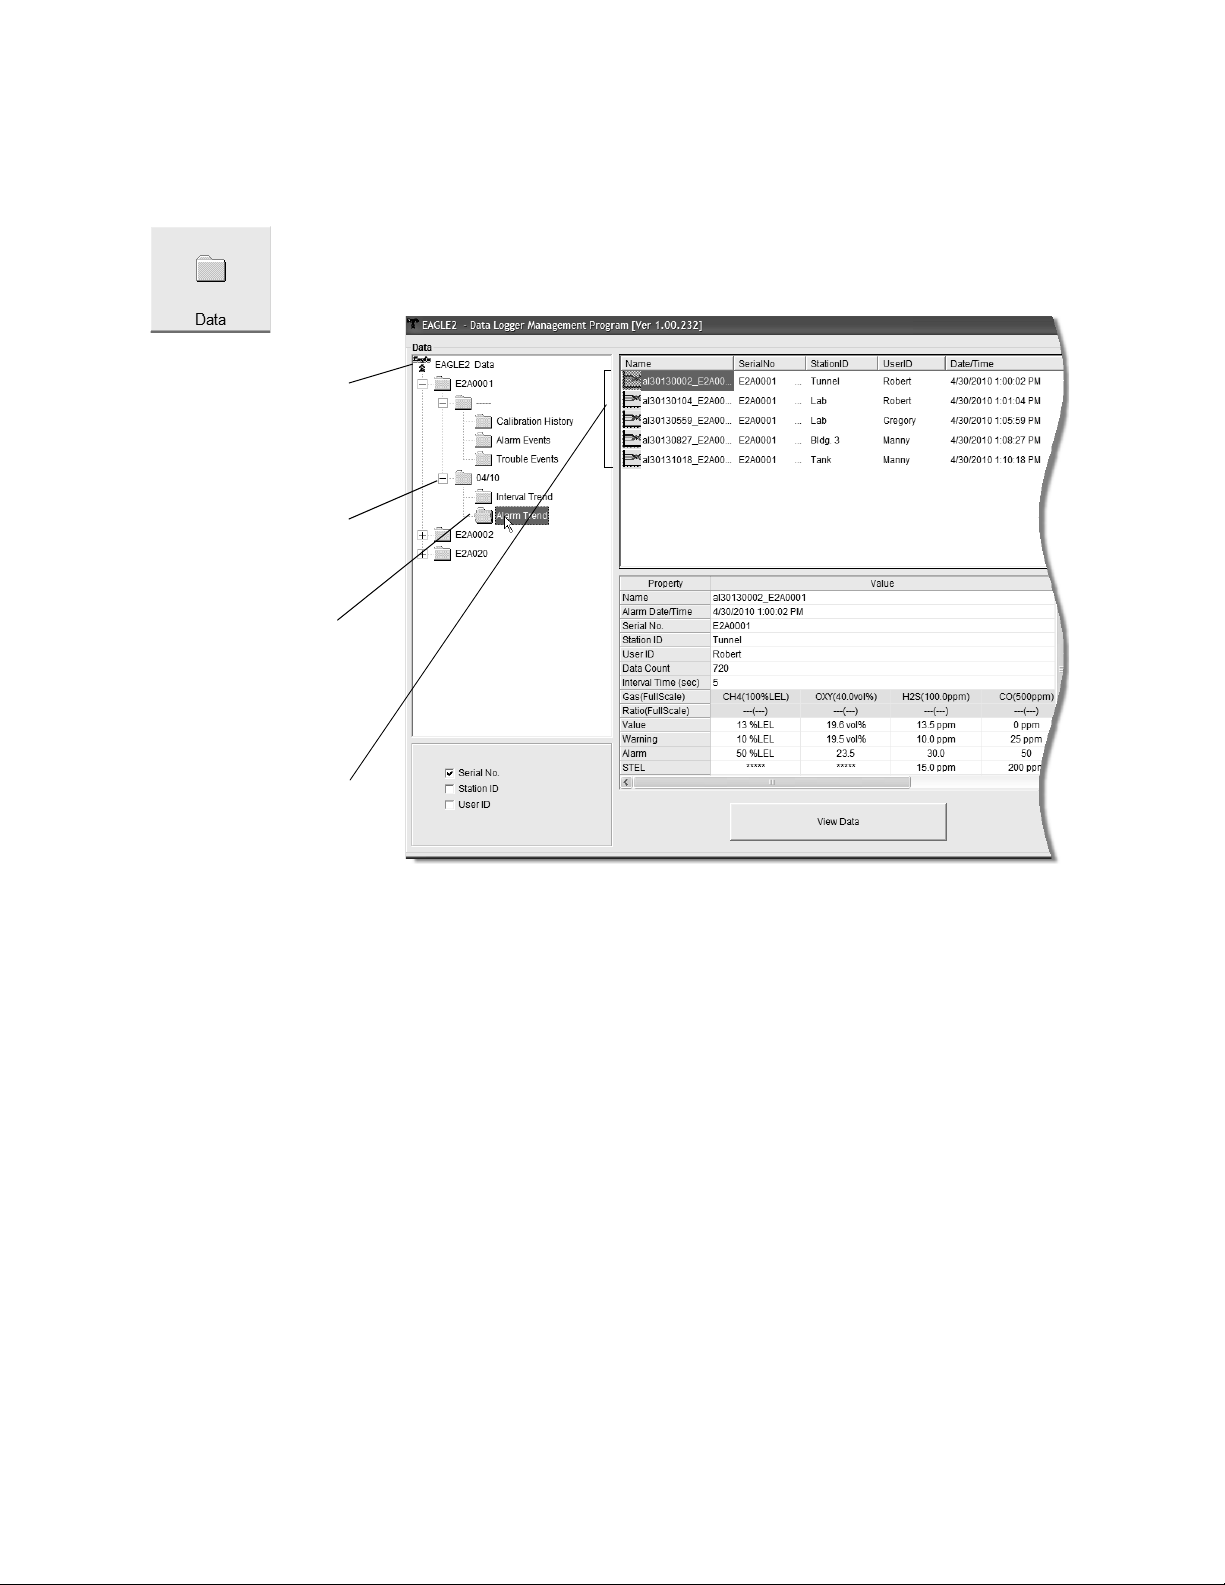
Data Button
Clicking the Data button opens the Data Window.
In the Data Window, you can view, pr int, e xport, and de lete data
that has been downloaded from instruments. The following
types of data files are saved in the Data window:
• Calibration History Files
A calibration history file is sa ved for each instr ument that has
been downloaded. It records the calibration information for
every calibration that was downloaded. The Eagle 2 can save
information for up to 100 calibrations in its memory.
Control Buttons • 1 1
Page 16

• Interval Trend Data Files
Interval trend data is logged at the inter val t ime defined in the
Eagle 2. Each logged point is an average reading over the
previous time interval.
• Alarm Trend Data Files
Alarm trend data is logged around an alarm event. The Eagle
2 can save up to 8 alarm trend data files in its memory.
• Alarm Event Files
Alarm event files record gas alarm events that have been
downloaded from instruments. The Eagle 2 can save up to
100 alarm events in its memory.
• Trouble Event Files
Trouble event files record sensor failure and system failure
events that have been downloaded from instruments. The
Eagle 2 can save up to 100 trouble events in its memory.
12 • Control Buttons
Page 17
Last Calibration Button
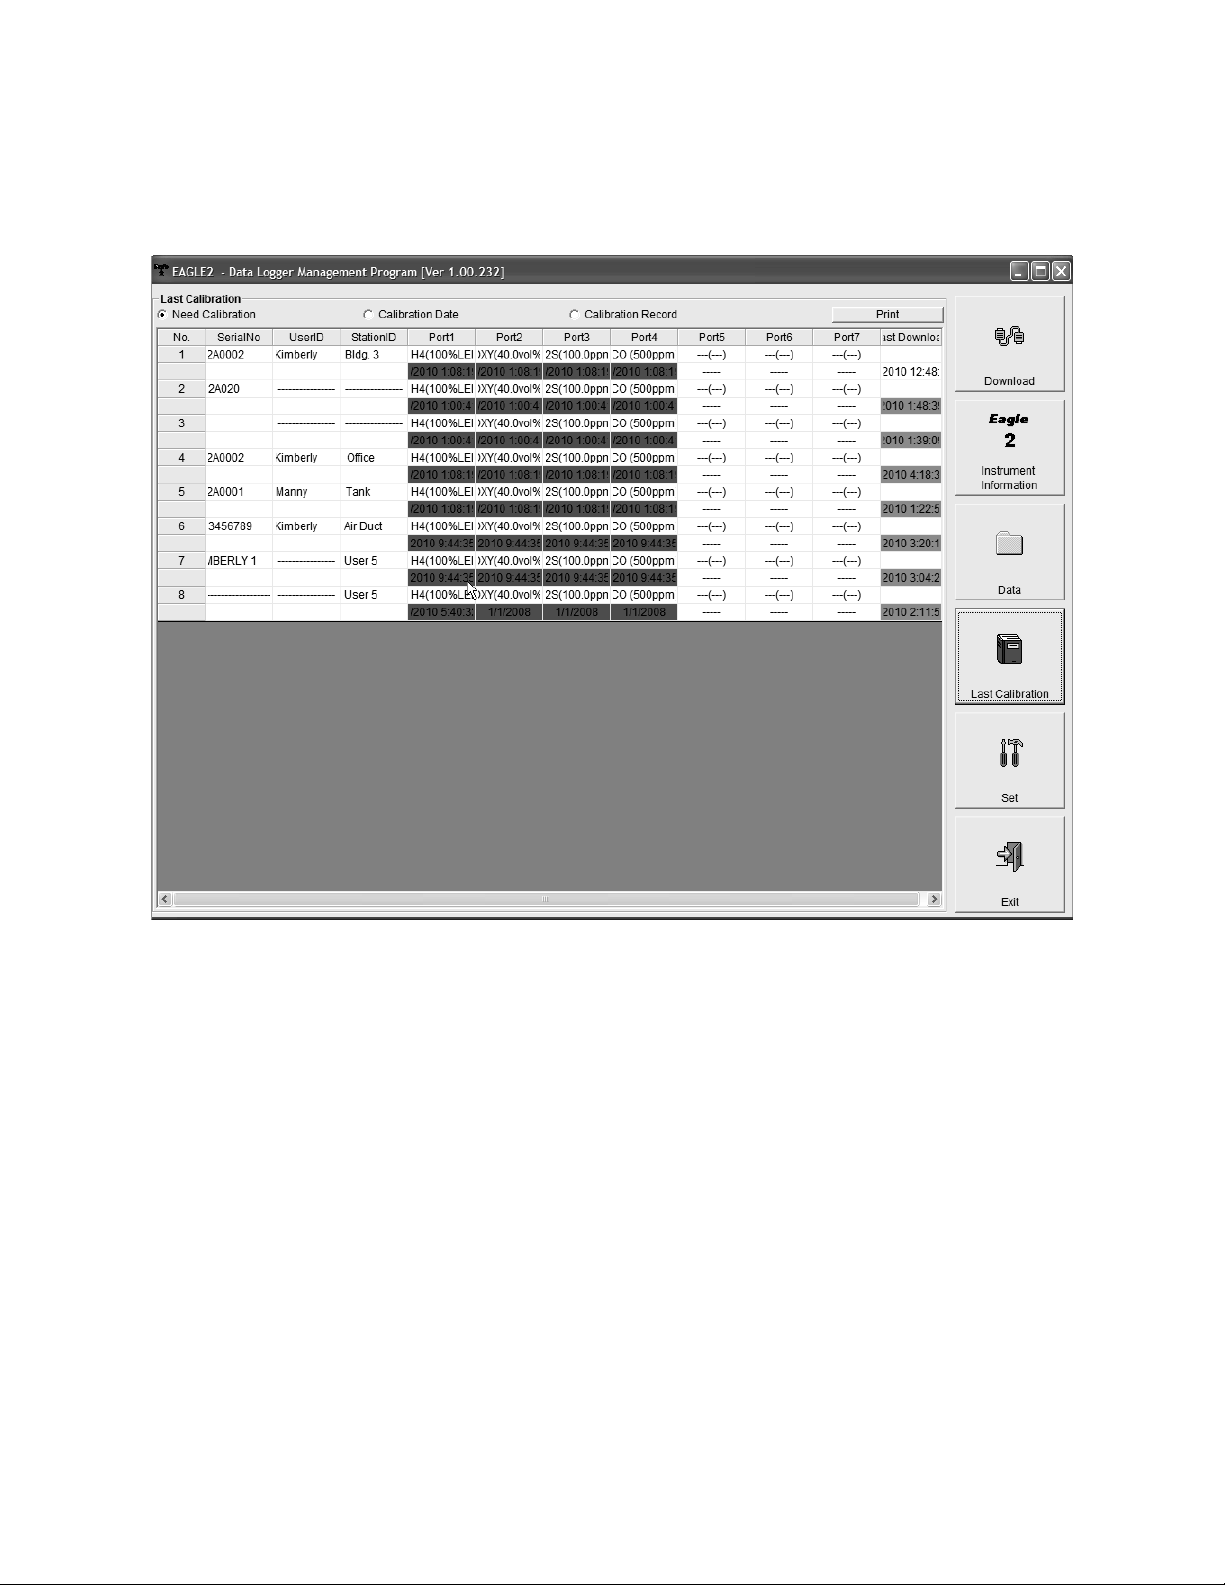
Figure 7: Last Calibration Window
Clicking the Last Calibration button opens the Last Calibration
Window.
The Last Calibration Window stores the informatio n for the most
recent successful calibration for each Eagle 2 that has been
downloaded. You can display the information three ways by
using the Need Calibration, Calibration Date, or Calibration
Record selection buttons. You can also print the information if
you select the Need Calibration or Calibration Date display
options.
Control Buttons • 1 3
Page 18
Set Button
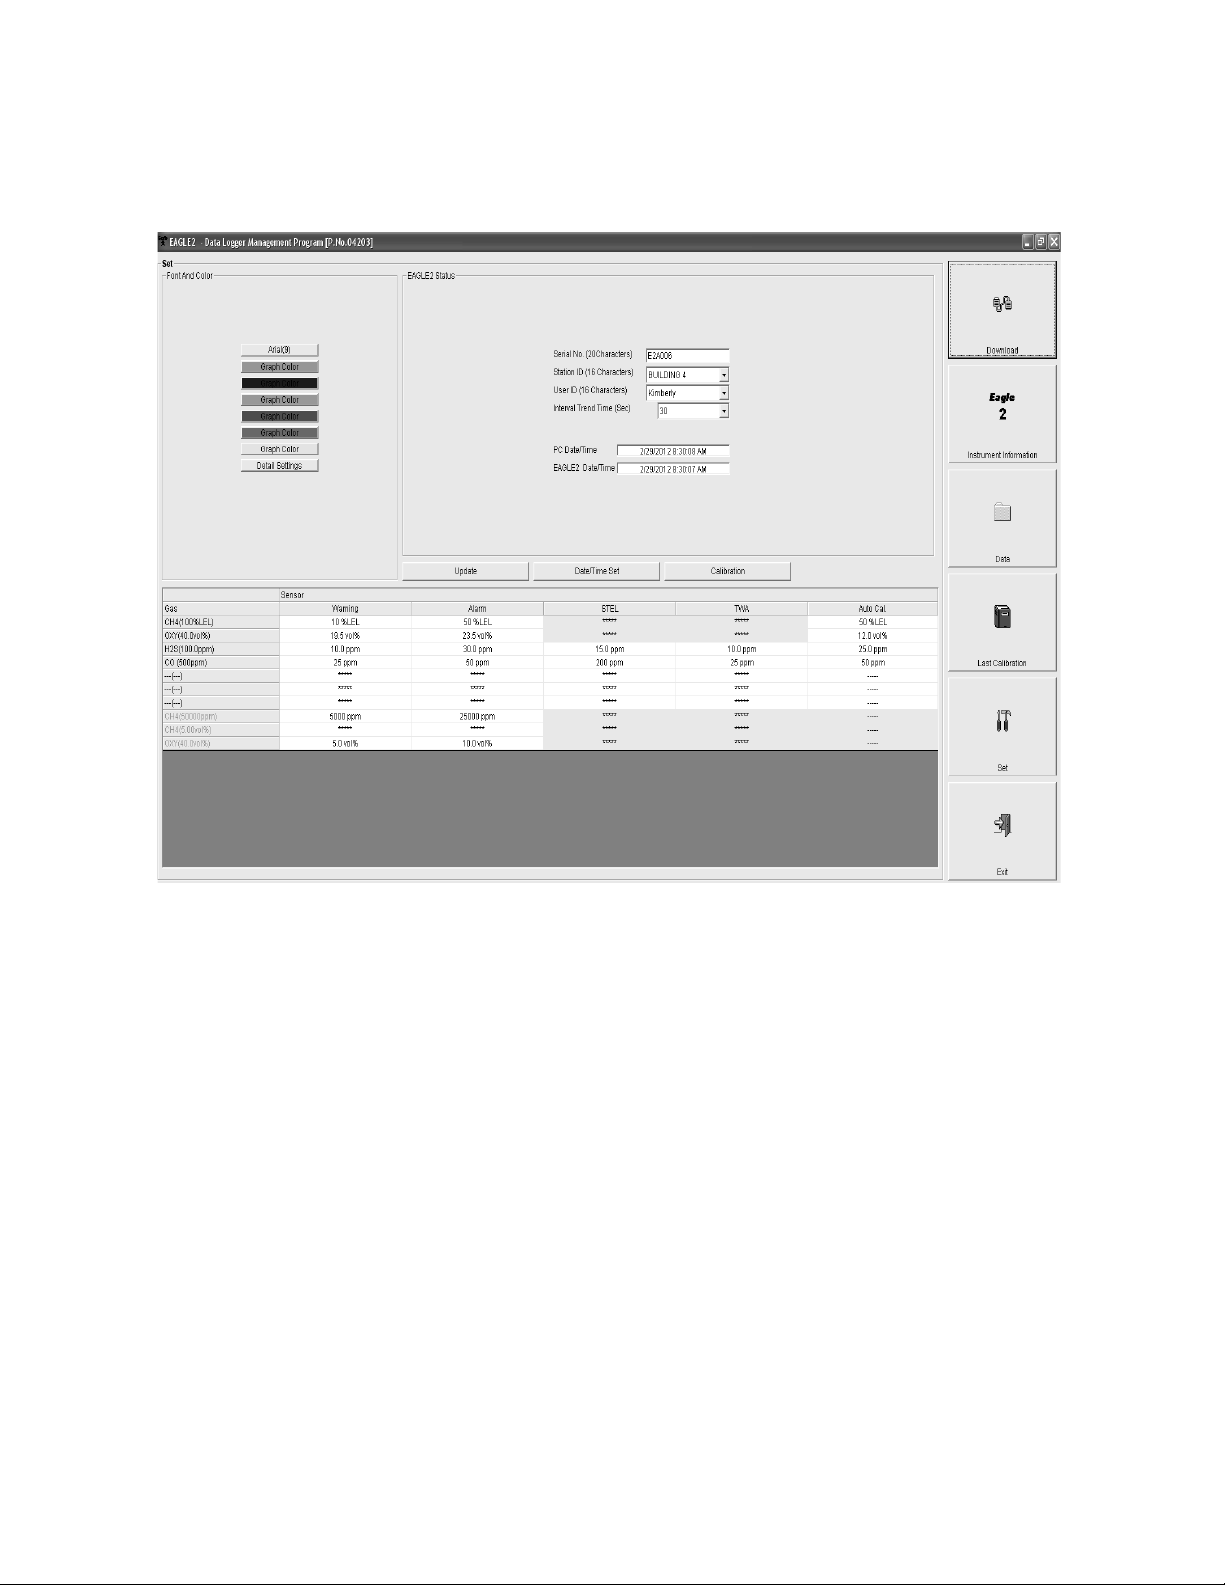
Figure 8: Set Window
Clicking the Set button opens the Set Window.
In the Set Window, you can perform the following functions:
• Alter the appearance of the software windows with the Font
and Color buttons
• Change parameters of a connected instrument by editi ng the
fields in the Eagle 2 Status frame and in the Gas/Sensor
frame at the bottom of the window and clicking the Update
button
• Update the date and time in a connected i nstrument by using
the Date/Time Set button
• Calibrate a connected instrument by using the Calibration
button
14 • Control Buttons
Page 19
Downloading Data from the
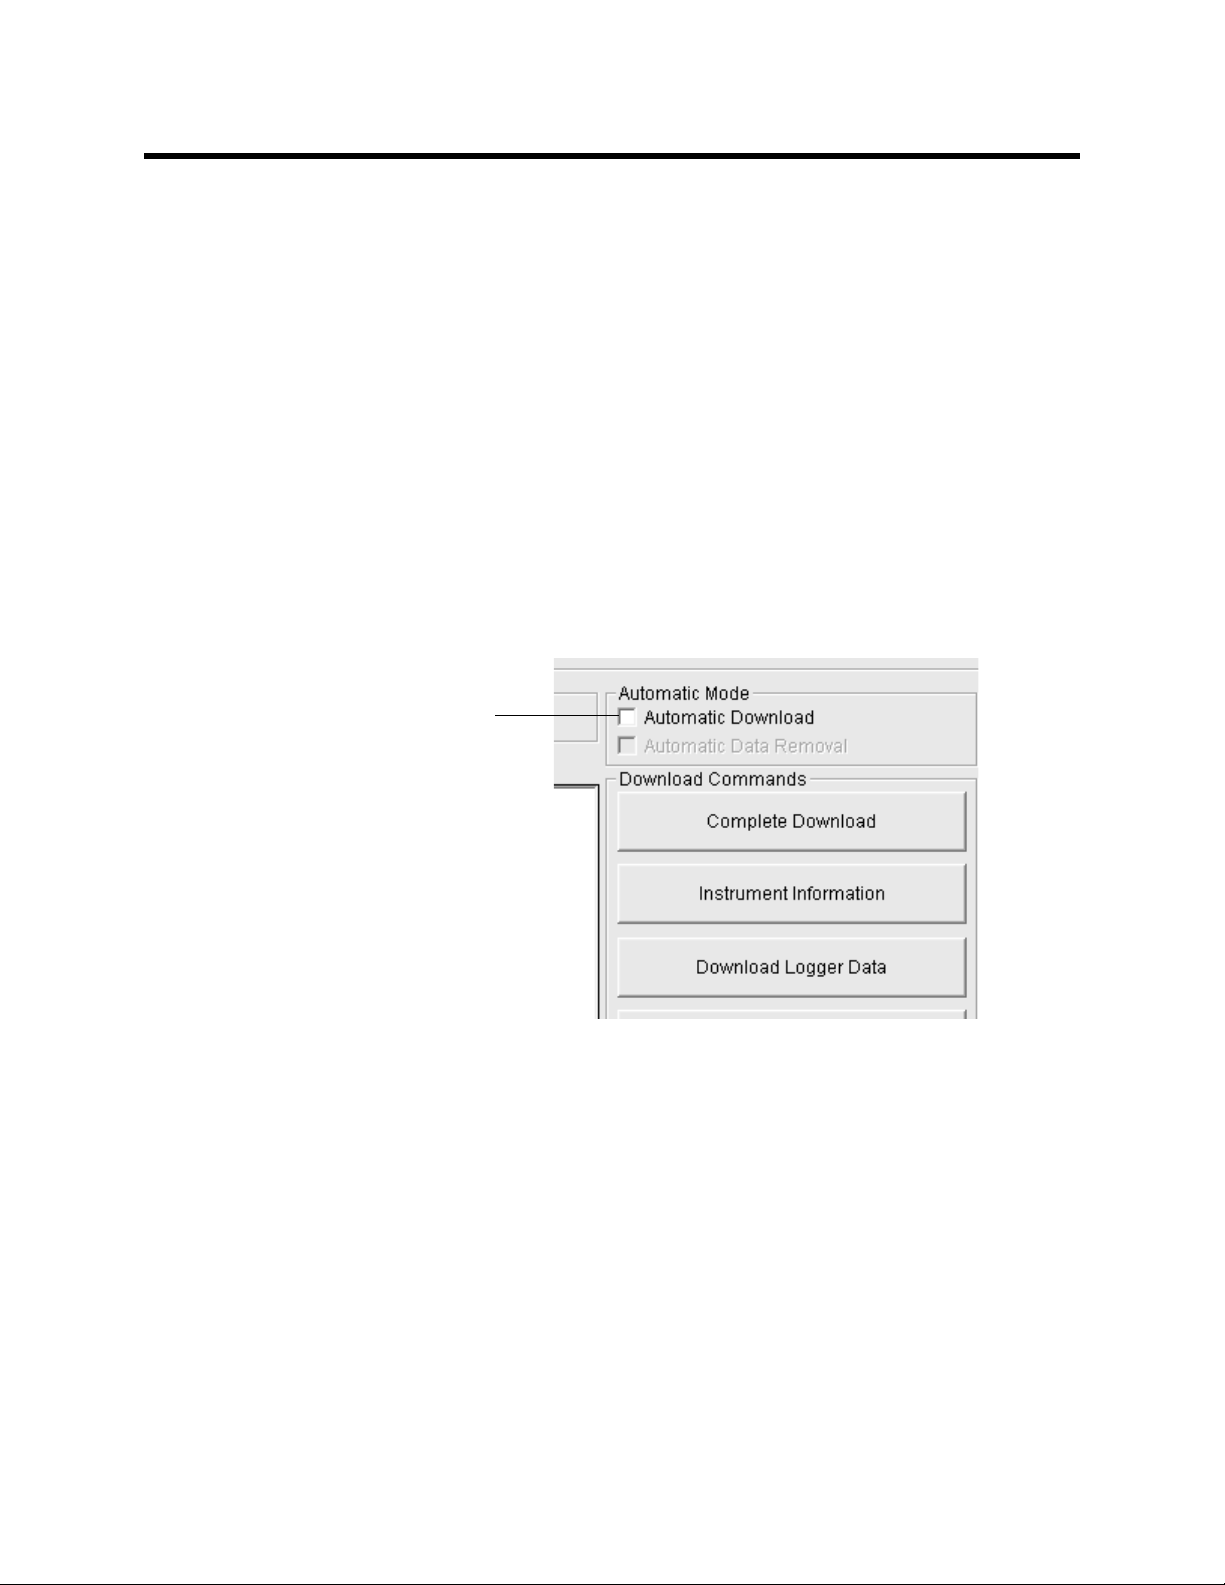
Figure 9: Automatic Download Selection Box
Click here for
automatic
downloads
Eagle 2
You have the option of downloading data manually or
automatically. If you want to download data using the automatic
download feature, click the Aut omatic Download selection box in
the Download Window before at t empting t o d ownload dat a fr om
the Eagle 2. Remember that if Automatic Download is selected,
the Instrument Information Window will remain blank and the
Eagle 2 will turn off automatically after the data has been
downloaded. If you want the data in the Eagle 2 to be cleared
automatically after an automatic downloa d, select the Automatic
Data Removal box. The Automatic Data Removal box is only
available for selection if the Automatic Download box is
selected.
To download data from an Eagle 2:
1. Launch the Eagle 2 Data Logger Management Program. The
Download Window displays. When the program comes up
and no instrument is connected, the Download Commands
are not selectable.
2. Place the Eagle 2 within an inch or two of the infrared port on
your computer aligning the infrared port on the front of the
Eagle 2 with the infrared port on your computer.
If your computer does not have a built in infrared port, place
the Eagle 2 within an inch or two of the infrared port on the
Downloading Data from the Eagle 2 • 15
Page 20
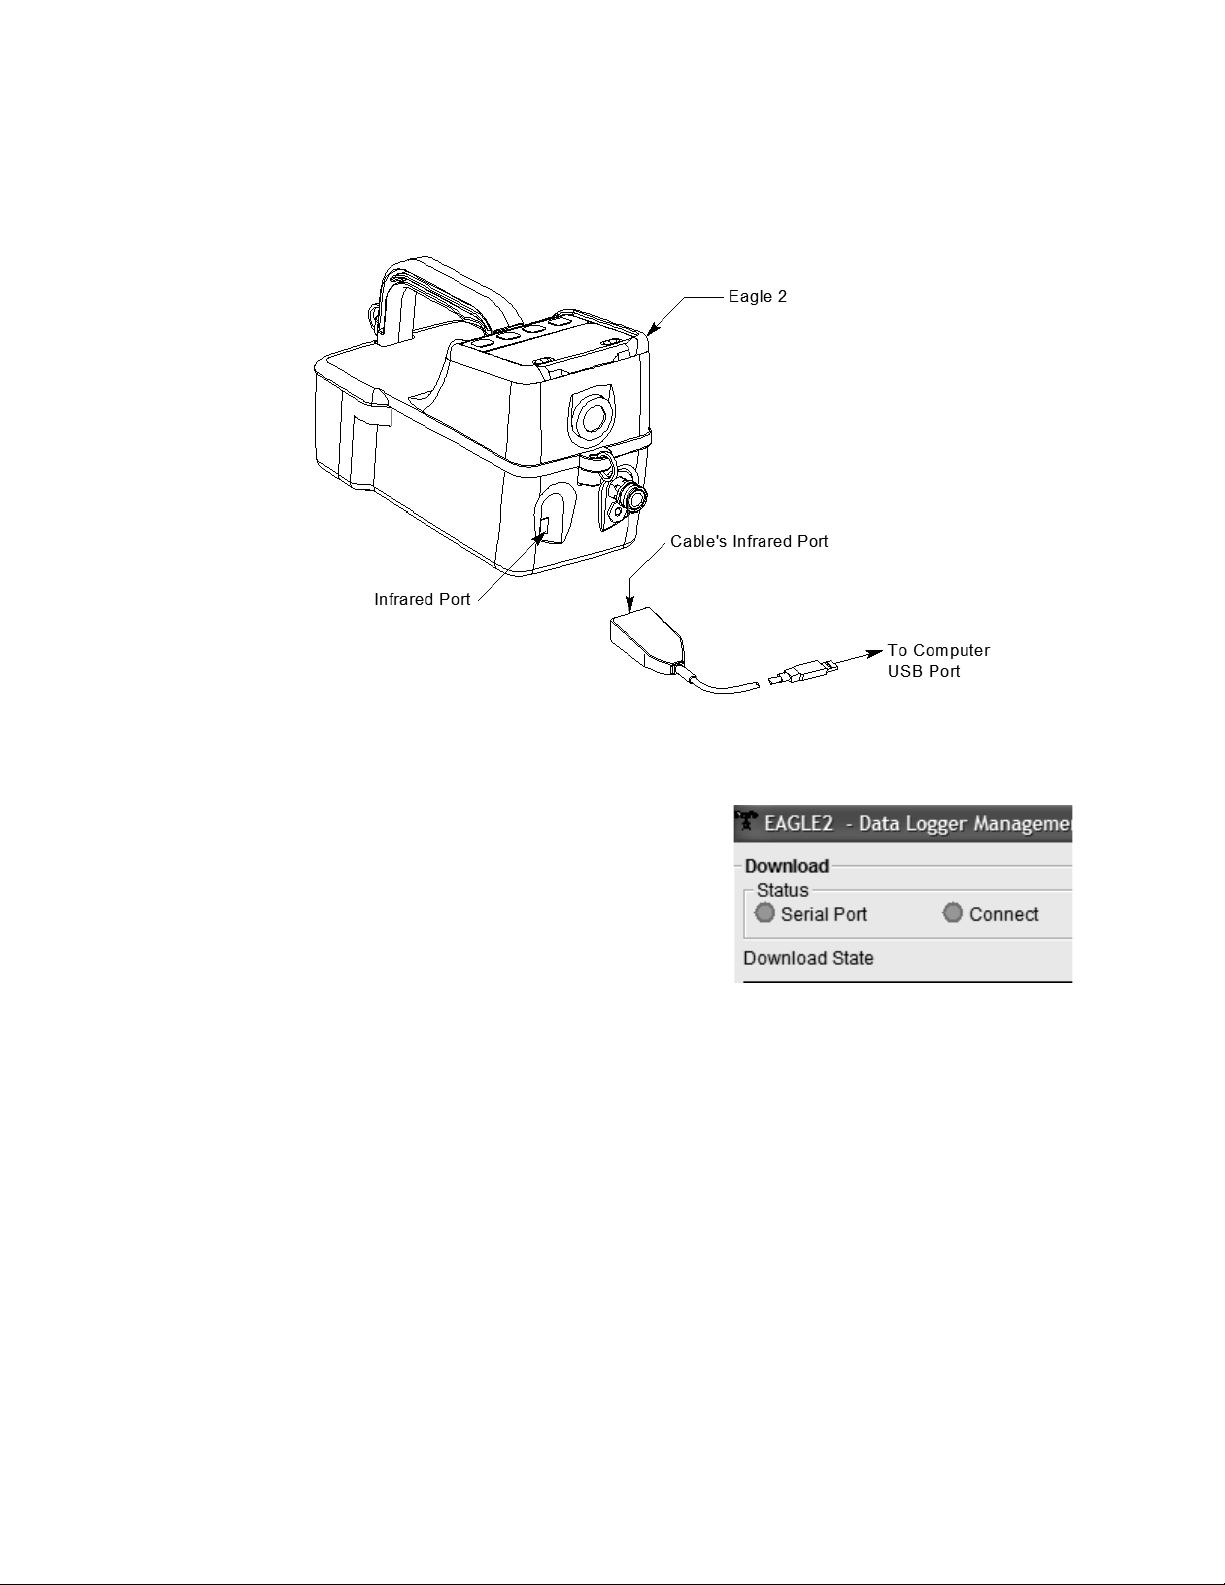
IrDA adapter cable a s shown in Figure 10 below , aligning the
Figure 10: Aligning the Eagle 2 with the Cable Infrared Receiver
Figure 11: Connection
Message
infrared port on the front of the Eagle 2 with the infrared port
on the cable.
3. Press and hold the POWER
ENTER RESET button on the
Eagle 2 until you hear a beep,
then release it. The Eagle 2 will
begin its power up sequence. If
a successful connection
between the Eagle 2 and the
computer occurs, the Connect
light in the Download window
turns green after a few
seconds and “Connection Successful.” displays in the
Download area of the Download window. The Windows
icon tray will indicate that a wireless connection is in effect.
4. If you selected Automatic Download, the downloading
process begins automatically after a successful connectio n
is made.
If Automatic Download is not selected, the Complete
®
Download, Instrument Information, Clear Logger Data, and
16 • Downloading Data from the Eagle 2
Page 21
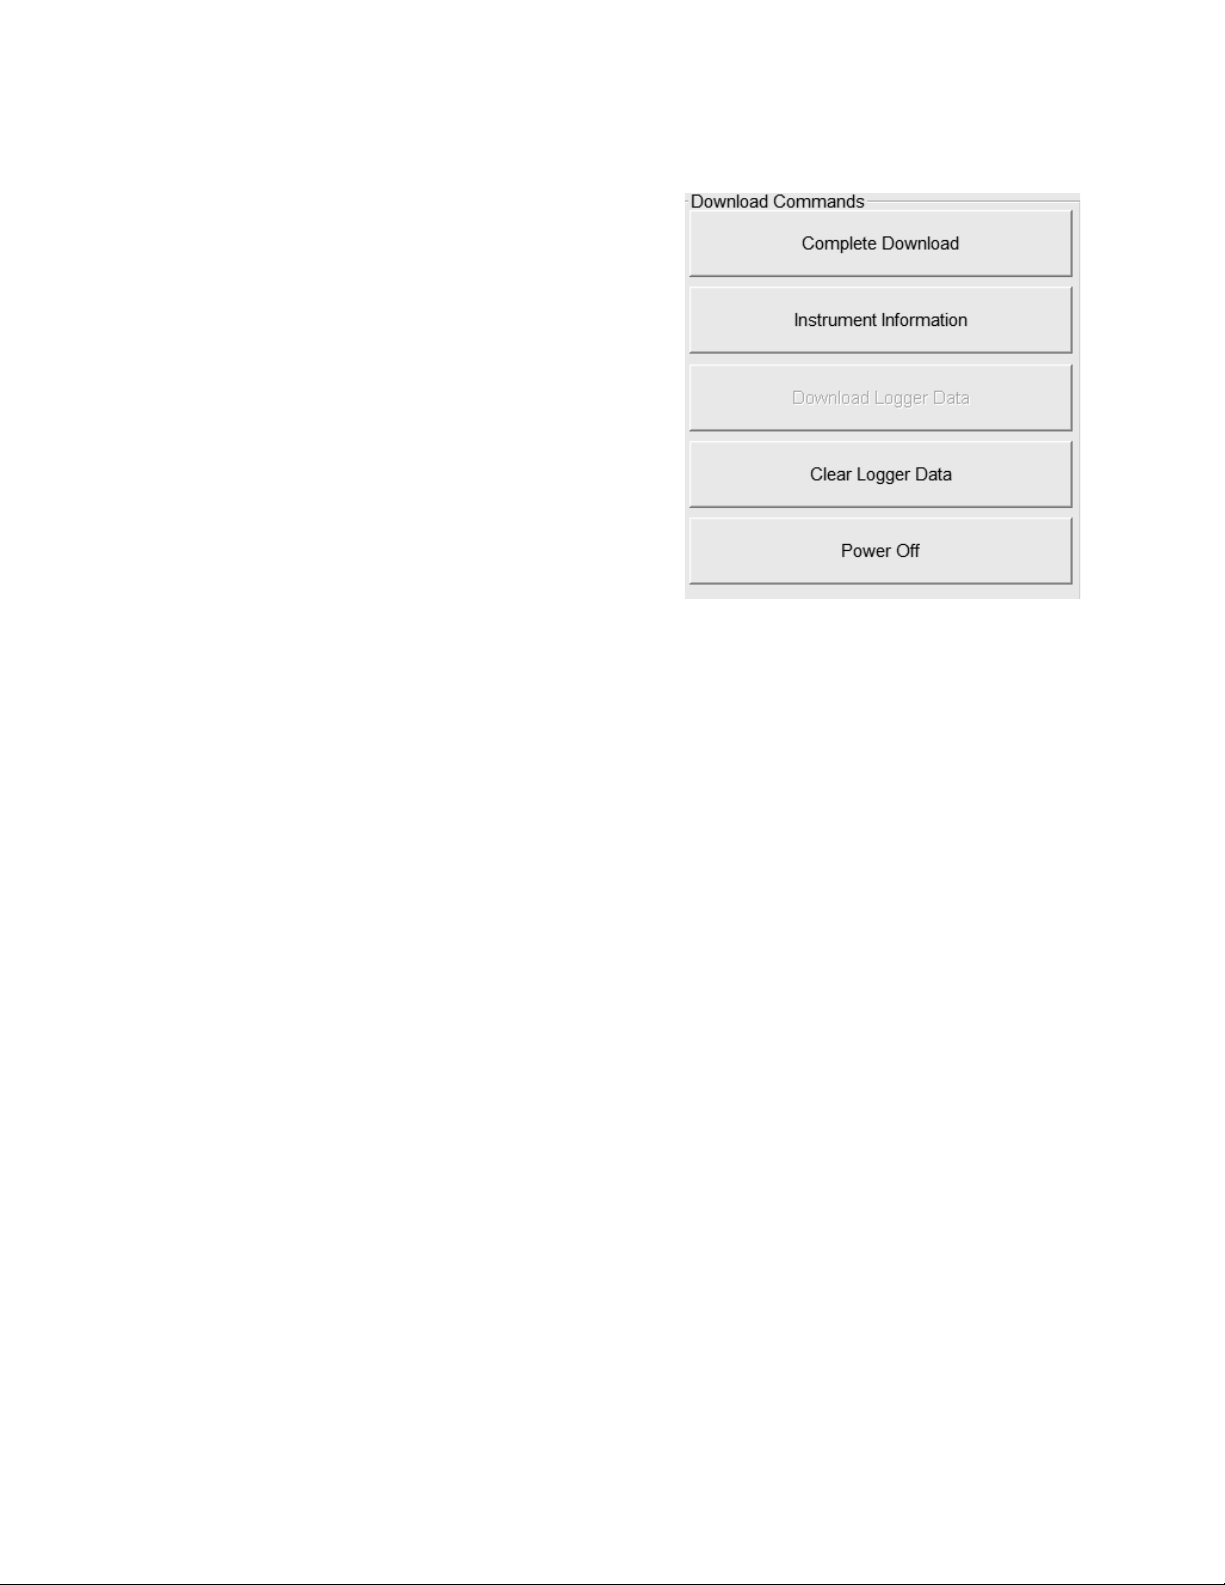
Power Off Download Commands become selectable.
Figure 12: Download
Commands
5. If you are going to
download data manually,
you can perform a
complete download,
download only the
instrument information, or
download only the data
files by using the Download
Commands.
• To download all data and
instrument information
from the instrument, click
Complete Download.
• To download instrument
information only, click Instrument Information.
• To download all data, click Download Logger Data.
Download Logger Data becomes selectable only after a
Complete Download or Instrument Information Download
Command has been performed.
6. While the data is being downloaded, messages in the
download message area of the Download window indicate
what actions the program is performing and if there are any
communication or downloading problems. These messages
also tell you what type of information has been downloaded.
Downloading Data from the Eagle 2 • 17
Page 22
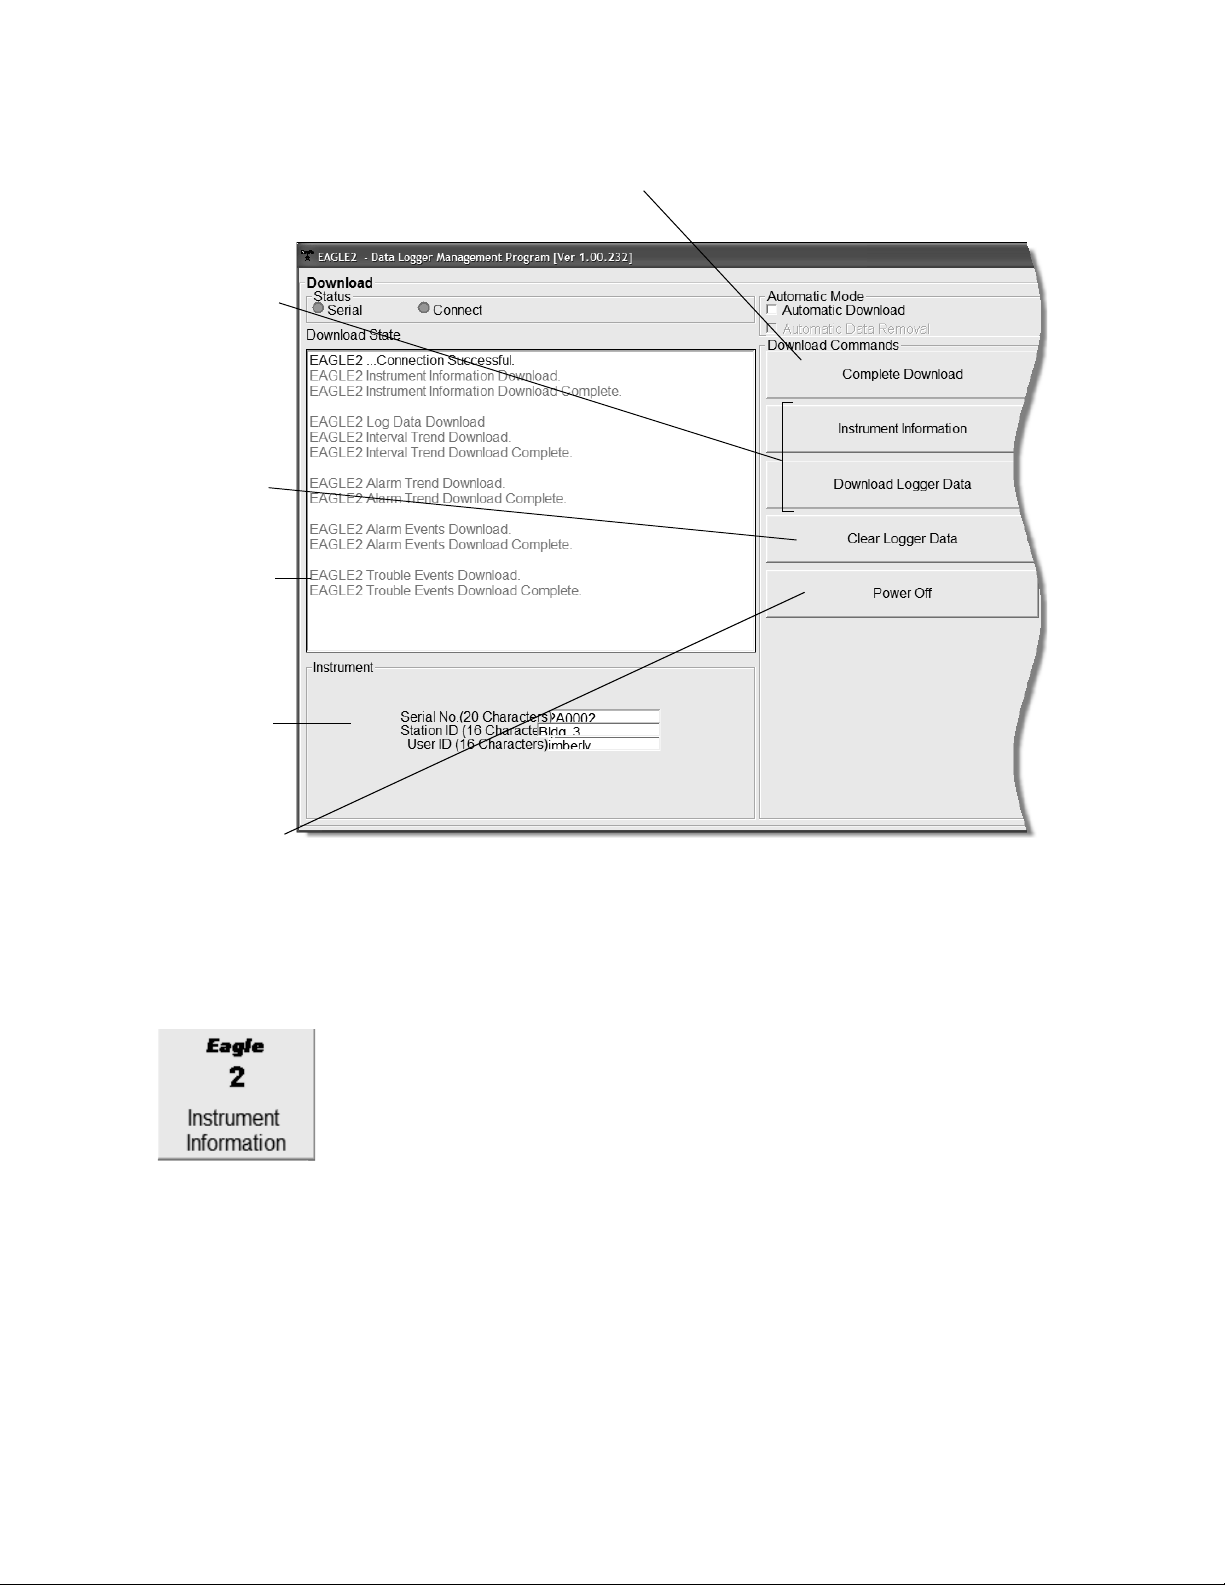
Figure 13: Download Messages & Download Commands
Download
messages
Instrument
Clear data
Use to download all data
Use to
download
subsets of
the data
button
Use to turn
off Eagle 2
ID
7. If the unit has been downloaded manually (Automatic
Download not selected), the unit’s instrument information
may be viewed after downloading by using the Instrument
Information control button if the unit is still turned on and
connected to the computer. For more information on the
Instrument Information screen, see “Viewing Data in the
Instrument Information Screen” on page 22.
18 • Downloading Data from the Eagle 2
Page 23
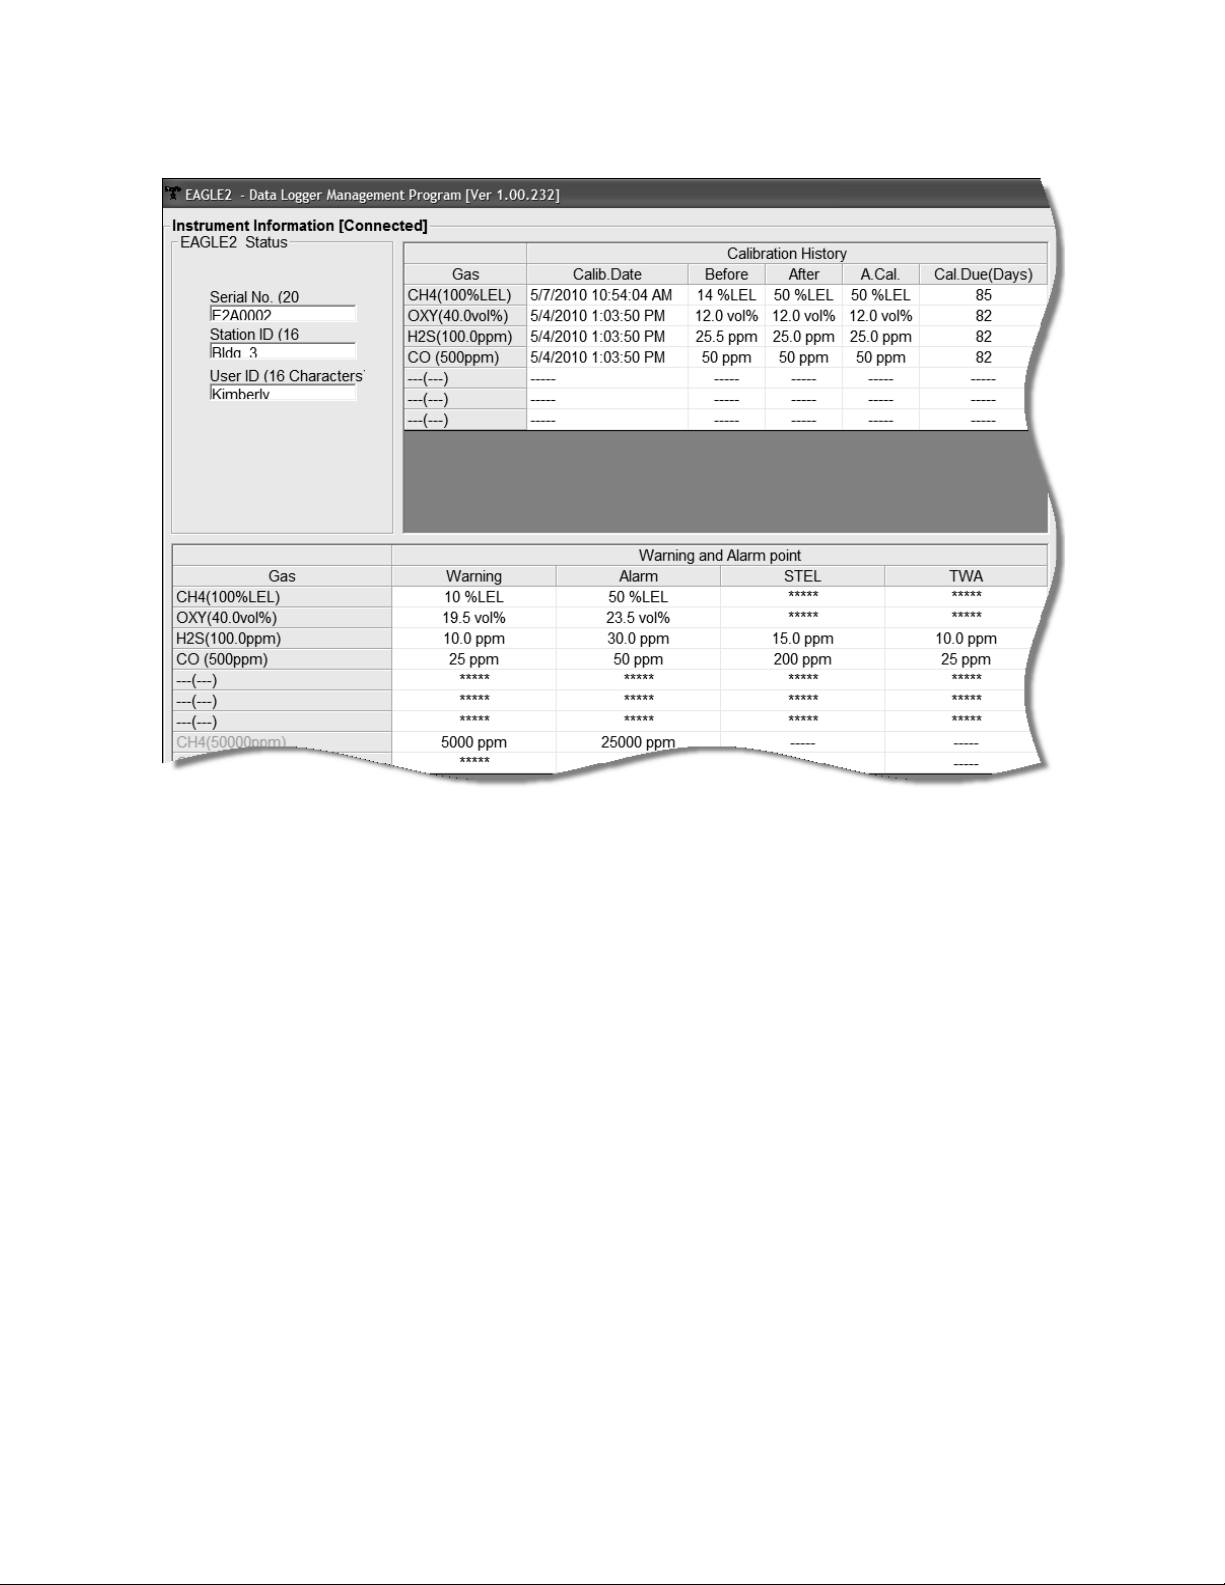
Figure 14: Instrument Information Window
8. You can view, print, export, or delete downloaded data by
entering the Data or Last Calibratio n Windows. These
windows are accessed by clicking Data or Last Calibration
along the right side of the Download Window. See “Viewing,
Printing, Exporting, and Deleting Data in the Data Window”
on page 24 or “Viewing, Printing, and Delet i ng Data in the
Last Calibration Window” on page 66.
9. After downloading data from an instrument, you can delete
all the data in the Eagle 2 by clicking Clear Logger Data if
desired. This will not delete instrument parameters such as
serial number, alarm settings, or autocalibration settings.
Downloading Data from the Eagle 2 • 19
Page 24

W ARNING: If you click Clear Logger Data, all data is erased
in the Eagle 2, but not in your computer’s
memory. So it’s advisable that you download
the data from the Eagle 2 first before clearing
the data.
Eagle 2 Data Logging Capacity
Table 1: Data Logging Capacity, 4-gas Eagle 2
Interval Trend Time
Data Logging Hours
5 seconds 239 hours (10 days)
10 seconds 479 hours (20 days)
20 seconds 959 hours (40 days)
30 seconds 1439 hours (60 days)
60 seconds 2879 hours (120 days)
180 seconds (3 minutes) 8639 hours (360 days)
300 seconds (5 minutes) 14,399 hours (600 days)
600 seconds (10 minutes) 28,798 hours (2,000 days)
Table 1 above lists the Eagle 2’s data logging capacity for a 4gas unit for each interval trend time setting assuming no alarms
or other events. The interval trend time setting can be set using
the Set Window (see “Changing Eagle 2 Instrument
Parameters” on page 77). It can also be set in the Eagle 2 Set up
Mode (see the Eagle 2 Operator’s Manual).
20 • Eagle 2 Data Logging Capacity
Page 25

Overwriting Data in the Eagle 2
The Eagle 2’s Data Log Overwrite function is factory set to On
so that when the Eagle 2’s dat a logging memory be comes full, it
begins to overwrite the oldest interval trend data with new
internal trend data. Download data regularly to avoid overwriting data in the Eagle 2 before it can be downloaded. The
Data Log Overwrite function is accessible using the Eagle 2
Setup Mode. To set the Data Log Overwrite function to Off, see
the Eagle 2 Operator’s Manual. When the Data Log Overwrite
function is set to off, the Eagle 2 will stop saving data when its
data logging memory is full.
The Data Log Overwrite function applies only to interval trend
data. All other dat a, such as alarm trend data, event data, or
calibration data, will continue to be saved when the memory is
full. If the maximum number of each of these types of data has
been reached, the oldest data will be overwritten.
Overwriting Data in the Eagle 2 • 21
Page 26
Viewing Data in the Instrument
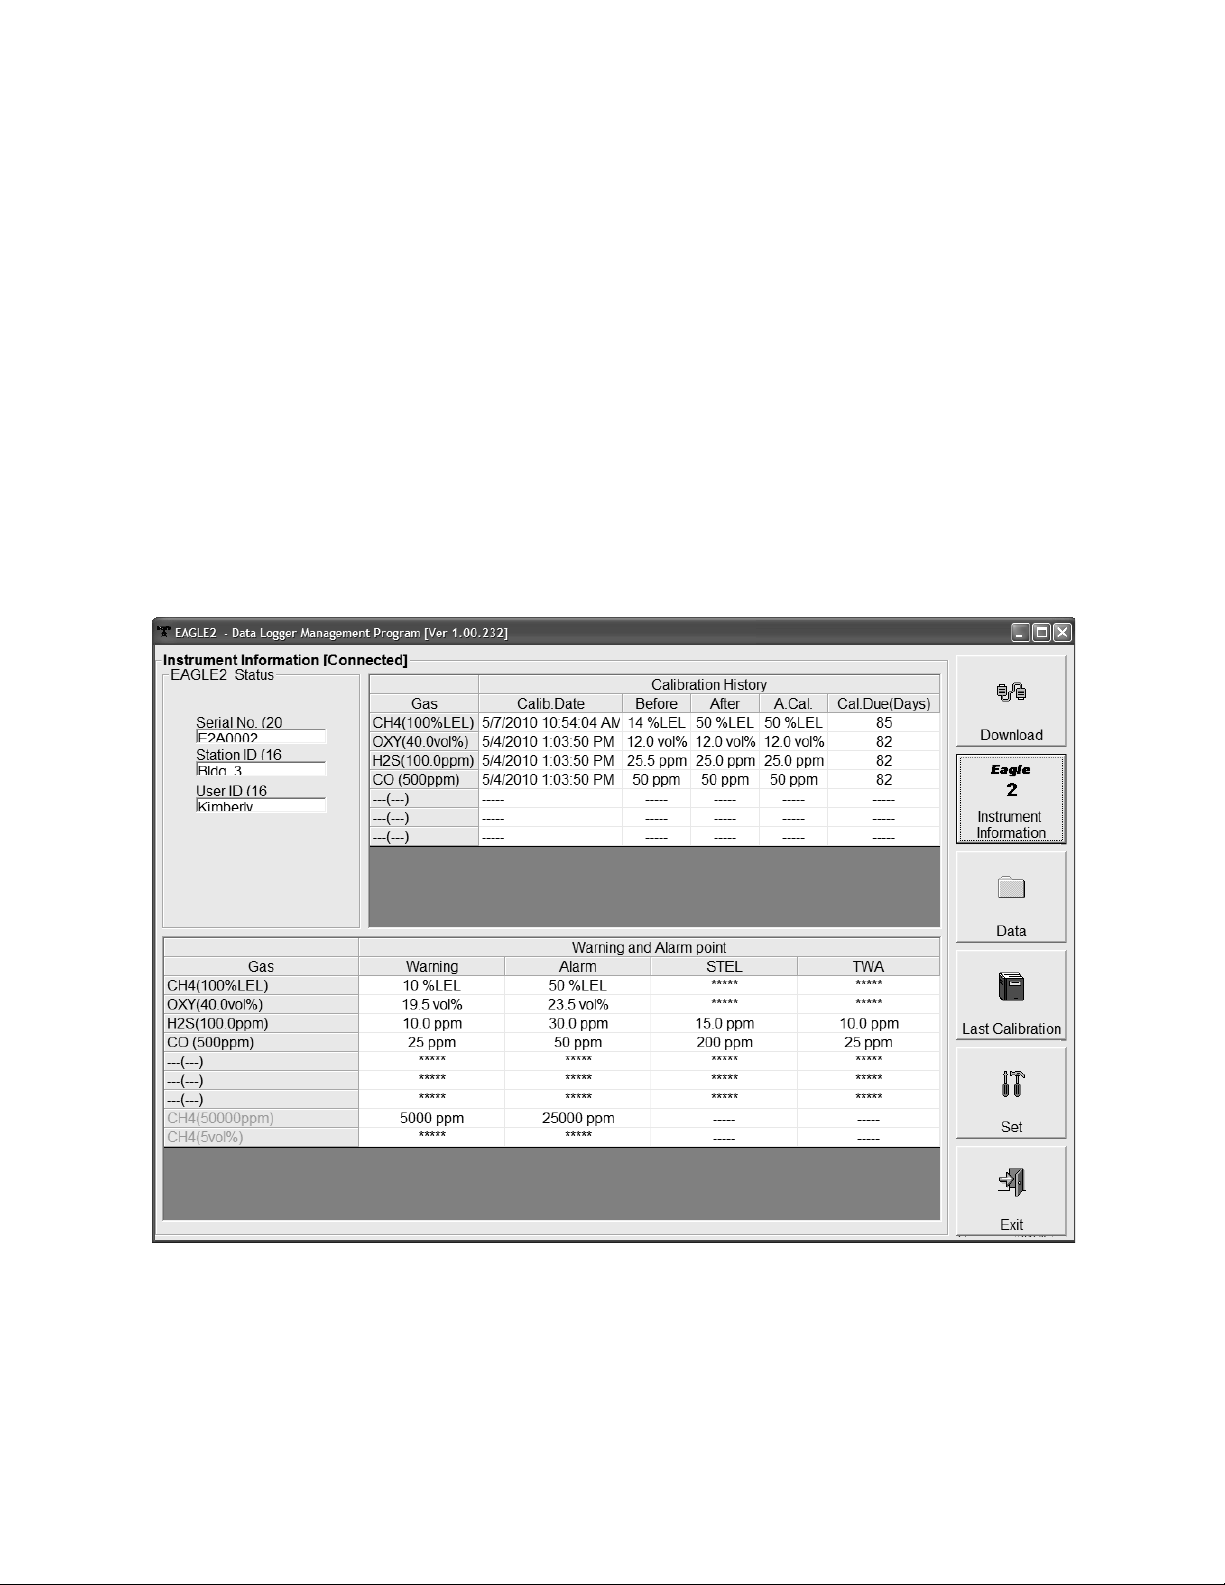
Figure 15: Instrument Information Window
Information Screen
You can view information for an instrument that has been
downloaded and is currently connected by using the Instrument
Information Window. Informatio n cannot be print ed or deleted in
this window. Once the instrument is turned off, the Instrument
Information Window becomes blank. Access the Instrument
Information Window by clicking the Instrumen t Information
button along the right side of the program window. The
Instrument Information Window will display.
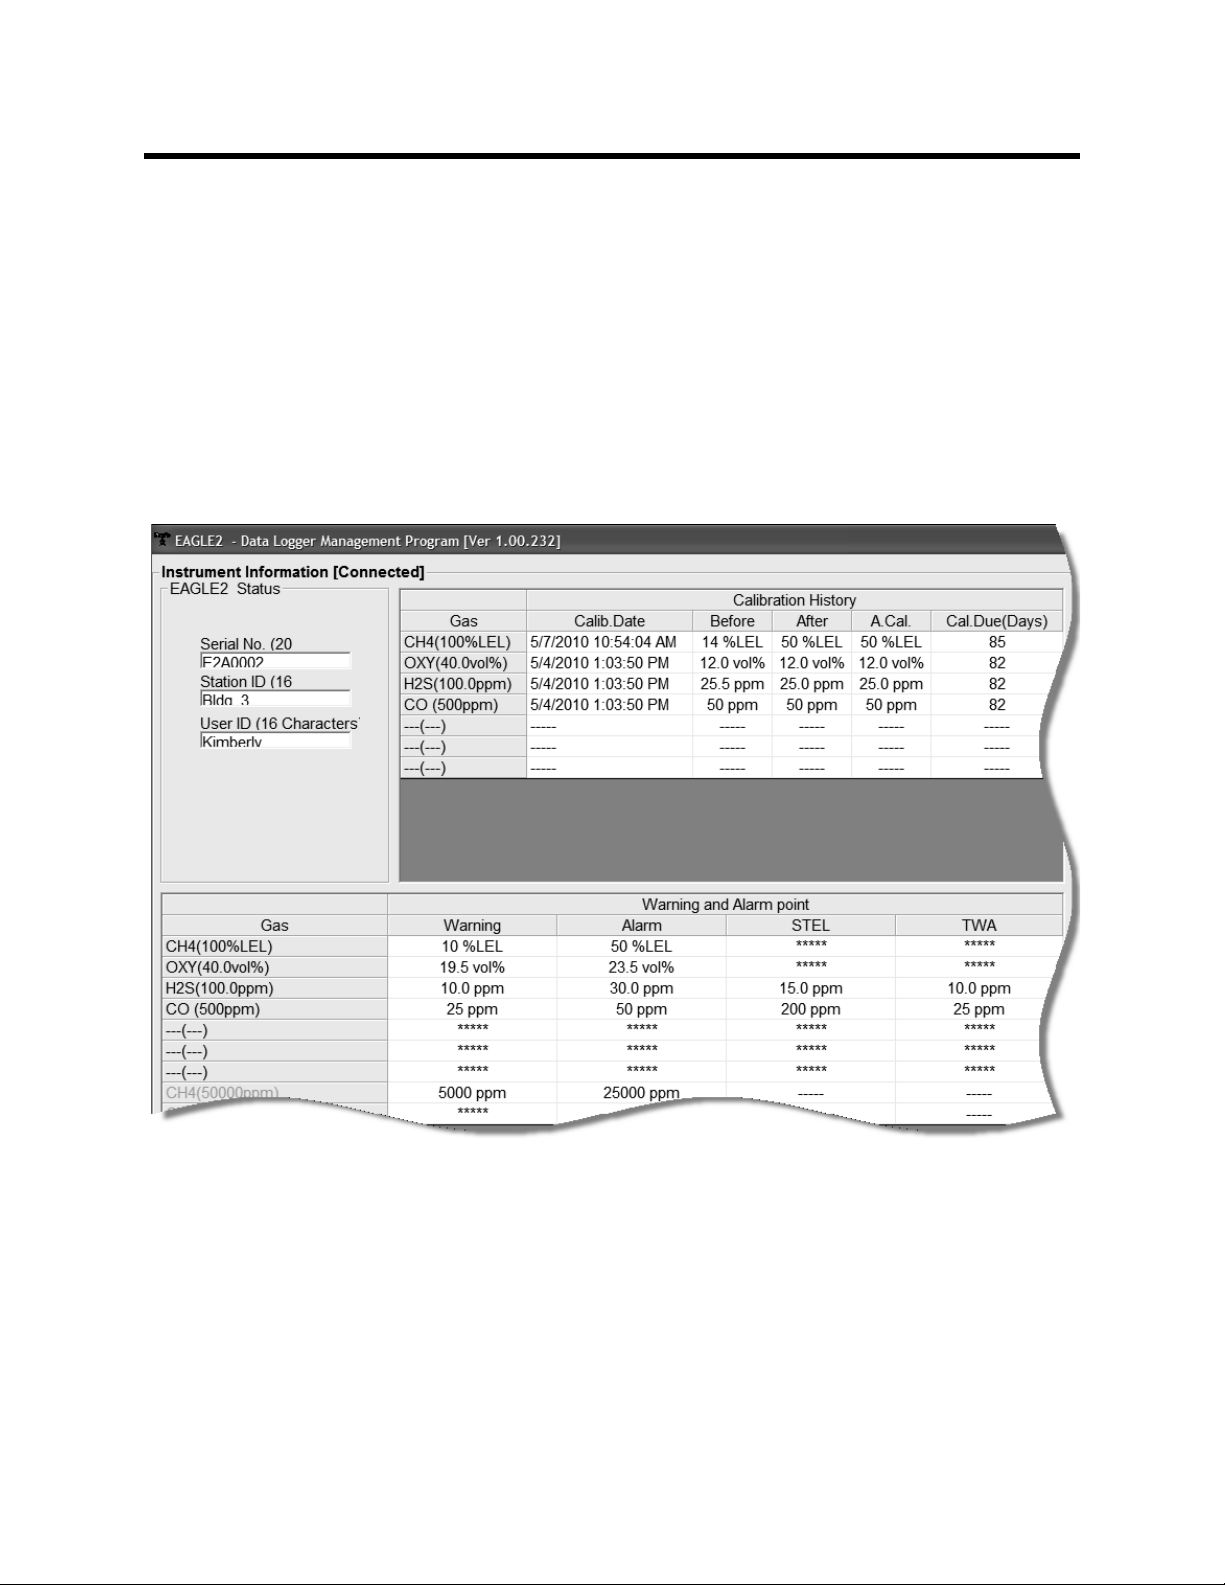
• The serial number, station ID, and user ID are displayed in
the upper left portion of the Instrument Information Window.
• The Calibration History Frame is displayed in the upper right
section of the window and it shows the information for the
most recent successful calibration of the connected
instrument.
22 • Viewing Data in the Instrument Information Screen
Page 27

• Gas - Lists each channel’s gas in the order it appears on
the Eagle 2 screen.
• Calib. Date - Shows the date and time of the most recent
successful calibration for each channel.
• Before — shows the gas response prior to calibration.
• After — shows the gas response after calibration.
• A. Cal. — lists the auto-ca libration setting for each channe l
of the Eagle 2. If a Eagle 2 passes its calibrat i on, the
“After” column should match the “A. Cal.” column. If the
Eagle 2 fails calibration on any of its channels, those
channels will retain the previous calibration information.
NOTE: If a unit is calibrated using Single Calibration in the
Eagle 2’s Calibration Mode (see the Eagle 2 Operator’s
Manual) it is possible for the “After” reading to be
different from the “A.Cal” setting if the unit was set to a
level different than the “A.Cal” setting.
• Cal. Due (Days) - Shows how many days remain before
calibration is required for each gas.
• The Warning and Alarm Point Frame is displayed in the lower
half of the window.
• Gas - Lists each channel’s gas in the order it appears on
the Eagle 2 screen.
• Warning - Shows the warning setpoint .
• Alarm - Shows the alarm setpoint.
• STEL - Shows the STEL (short term exposure limit)
setpoint for applicable gases.
• TWA - Shows the TWA (time-weighted average) setpoint
for applicable gases.
All values in the Wa rning and Alarm Point Frame can be
changed using the Set window.
Viewing Data in the Instrument Information Screen • 2 3
Page 28
Viewing, Printing, Exporting, and
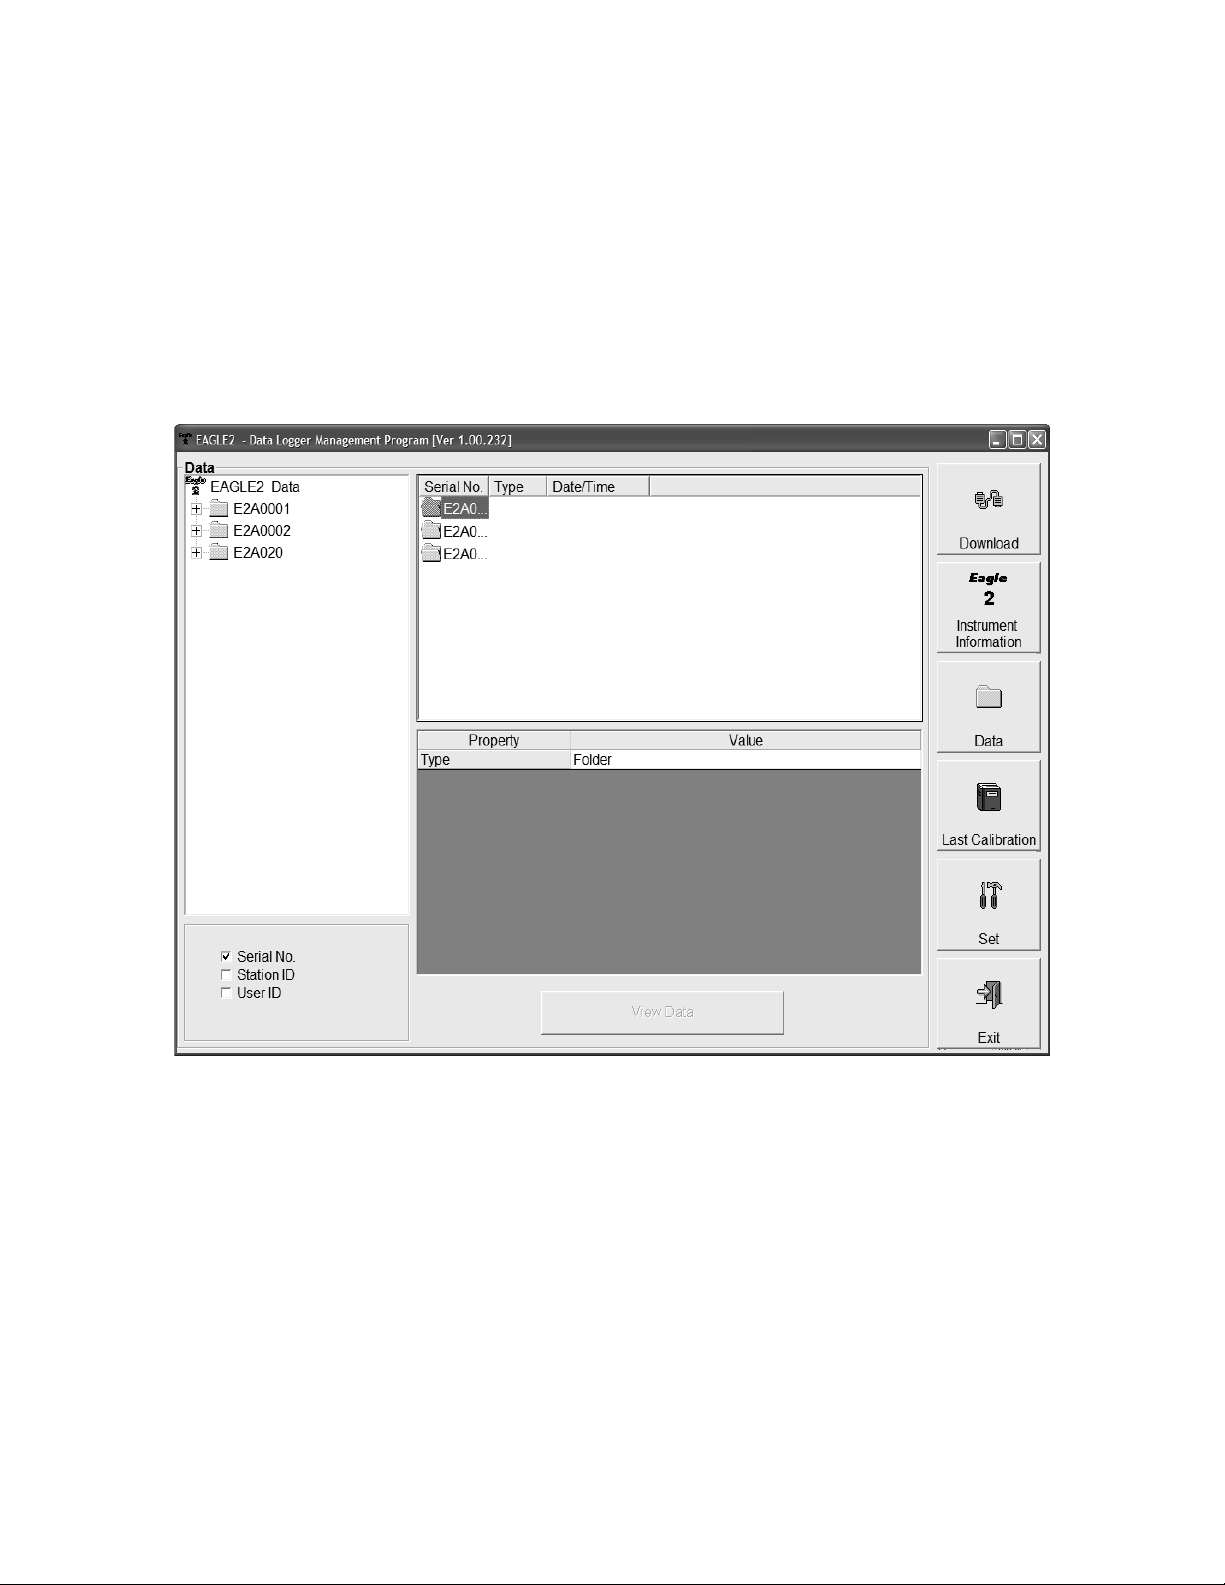
Figure 16: Data Window, Basic Data Organization
Double-click to
show data
Click to
expand
folder
Click to show
interval trend
Interval trend
files
folders
files
Deleting Data in the Data Window
The Eagle 2 logs four types of data files: calibration history,
interval trend data, alarm trend data, and event data.
You can view, print, and export (save to a file) each of these
types of data files. All of these types of data files can also be
deleted. The deleting of files is password protected and is
described in “Deleting Data in the Data Window” on page 60.
Data Window
All the data, other than the most recent calibration information
accessible in the Last Calibration Window, can be accessed in
the Data Window. The Data Window is accessed by clicking
Data along the right side of the program window.
24 • Viewing, Printing, Exporting, and Deleting Data in the Data Window
Page 29

The Data Window is divided into four frames. The upper left
frame is the Data Frame and displays all the data folders. They
are grouped under the Eagle 2 icon in the upper left part of the
frame. If the data folders are not visible, double click the
Eagle 2 icon to make them visible. If no data has been saved,
then no folders will appear when the Eagle 2 icon is double
clicked.
The lower left frame contains three selection boxes for
organizing data. If none of the boxes are selected, then the dat a
is organized as shown in Figure 16. The data may be organized
by one or more of the following parameters: serial number,
station ID, or user ID. Click the selection box or boxes in the
lower left frame to organize the data as desired.
NOTE: In the examples that follow, the data will be shown
organized by serial number. If you do not select any of
the organization boxes or select the Station ID or User
ID boxes instead of or in addition to the Serial No. box,
your Data Window will look slightly different. The
following examples also show the combustible channel
as “CH4”. The catalytic combustible channel may be
configured for a different gas. See the Eagle 2
Operator’s Manual for details regarding the
configuration of the catalytic combusti ble channel.
The upper right frame shows the content s of a data folder t hat is
selected in the Data Frame. The lower right frame shows the
summary information for a data file that is selected in the upper
right frame.
The View Data control button is located at the bottom of the
lower right frame. The View Data button becomes active when a
data file is selected in the upper right frame. Clicking View Data
opens the data file and displays the data.
NOTE: If data is being viewed a nd the dat a folders are lef t open
before instrument downloading is done, close all fold ers
after downloading and re-open th em to be able to view
newly downloaded files.
Viewing, Printing, Exporting, and Deleting Data in the Data Window • 25
Page 30

Calibration History
The Eagle 2 is capable of saving calibration information for up to
the 100 most recent calibrations. This calibration history is
retrieved by the Data Logger Managemen t Program when data
is downloaded from the Eagle 2 using either the Complete
Download download command or the Download Logger Data
download command.
Instrument calibration information is also available in the Last
Calibration Window. The information regarding the most recent
successful calibration for each downloaded instrument along
with whether or not an instrument is due for calibration can be
accessed using the Last Calibration button on the right side of
the program window. See “Viewing, Printing, and Deleting Data
in the Last Calibration Window” on page 66 for a complete
description of the information that ca n be accessed by the Last
Calibration button.
All downloaded calibration information for all downloaded
instruments is available in the Calibration History folders in the
Data Window. This information is saved in a Calibration History
Folder that is located in an untitled folder for each instrument.
The calibration history files are dif ferentia ted by instrument. The
calibration information available here is more comprehensive
than that in the Last Calibration Window. The calibration
information for all calibrations downloaded, whet her successful
or not, is saved instead of just the most recent successful
calibration for each instrument.
26 • Viewing, Printing, Exporting, and Deleting Data in the Data Window
Page 31

To view, print, or export th e calibrati on hist ory for any inst rument
Figure 17: Data Window - Selecting Calibration History Files
Double-click to
show data
Click to
expand folder
Click to
Cal.
show Cal.
Histories File
file
Histories
folders
in the database:
1. With the software already launched, click the Data control
button along the right side of the program window. The Data
Window will appear.
2. If necessary, double-click the Eagle 2 icon in the top of the
Data Window’s upper l eft frame to see the folders of
downloaded data.
3. Find your instrument by serial number, then click the
expanded view symbol (+) of or double-click the serial
number folder to view the contents.The top folder is untitled
and contains the Calibration History Folder along with folders
for alarm events and trouble events. The rest of the folders
contain folders for the interval trend files and alarm trend
files and are named and organized by date (month/year).
4. Click the expanded view symbol (+) of or double-click the
untitled folder. The Calibration History fold er will appear
Viewing, Printing, Exporting, and Deleting Data in the Data Window • 27
Page 32

below the untitled folder along with the Alarm Events and
Figure 18: Data View, Calibration History
Trouble Events folders.
5. Click the Calibration History folder. The Calibration Histories
file or files for that instrument will appear in the top right
frame. If multiple Station ID’s or User ID’s are used for an
instrument, then more than one Calibration Histories file will
appear.
6. Click a file to select it. The first two calibrations saved will be
shown in the bottom right frame along with the tot al number
of calibrations saved if it is more than two.
7. To view the Calibration Histories file in table format, double
click the Calibration Histories file or click the View Data
button. Calibration Histories files can only be vie wed in t a ble
format.
8. If you click the Summary button, the Data Window will split
into two frames one above the other with the calibrati on
history list in the lower frame and the summary information
shown in the upper frame. The summary information is the
instrument serial number, station ID, user ID, and the last
download date. To return to the one frame format, click
Summary again.
28 • Viewing, Printing, Exporting, and Deleting Data in the Data Window
Page 33

9. If you want to print the data, click the Print but ton. A Printer
Figure 19: Printer List Dialog Box, Calibration History
Figure 20: Save as Dialog Box
List dialog box will appear for you to select a printer.
10.Select a printer and click OK to print the data.
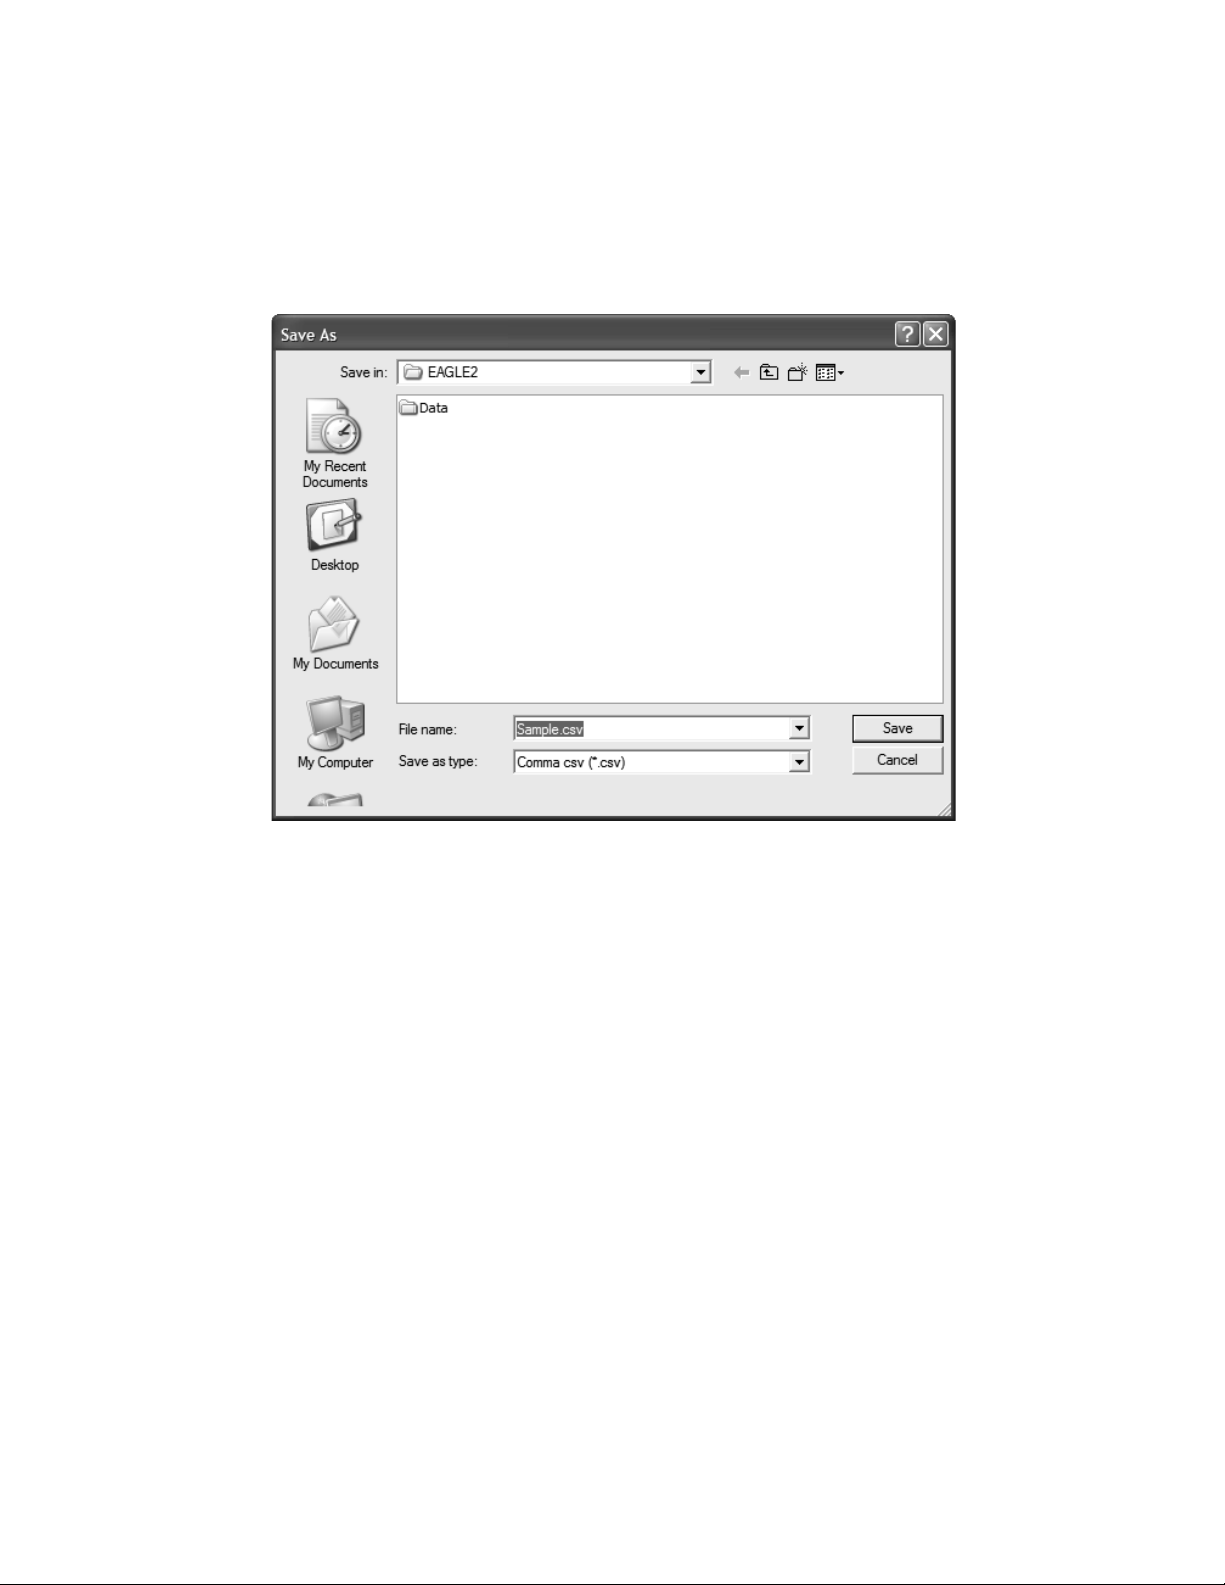
11.To export the d ata for use i n another applicati on, for example
a spreadsheet or database, click the Export but ton. A “Save
As” dialog box will appear for you to specify the filename, file
type, and file location. The default file type is “.csv” (commaseparated values).
Viewing, Printing, Exporting, and Deleting Data in the Data Window • 29
Page 34

After specifying the file name, file type, and file location click
the Save button to save the file to the specified location.
12.To go back and view other data, click the Return button in
the upper right corner of the Data Window or the Data
control button on the right side of the program window and
select the data you want to view.
Event Data
The Eagle 2 not only saves trend files which include logged dat a
at scheduled times, but also saves the 100 most recent alarm
events and the 100 most recent trouble events. When an
instrument is downloaded, the Eagle 2 Data Logger
Management Program will retrieve these events from an
instrument and save them in alarm event files and trou ble event
files for each instrument that is downloaded.
Alarm event files save the time, instrument channel, gas, and
alarm type of every gas alarm event that occurs on a particular
instrument. Warning (low alarm), Alarm (high alarm), STEL,
TWA, and overscale events are saved.
Trouble event files note the time, instrument channel, whether
the event is an instrument system failure or sensor failure and
the specific type of failure. Calibration failures, dead battery
alarms, and sensor failures are among the trouble events that
are saved.
30 • Viewing, Printing, Exporting, and Deleting Data in the Data Window
Page 35

To view, print, or export the event data for any instrument in the
Figure 21: Data Window - Selecting Event Data Files
Double-click to
show data folders
Click to expand
folder
Click to show
alarm event file
Alarm event
file
database:
1. With the program already launched, click the Data control
button along the right side of the program window. The Data
Window will appear.
2. If necessary, double-click the Eagle 2 icon in the top of the
Data Window’s upper l eft frame to see the folders of
downloaded data.
3. Find your instrument by serial number, then click the
expanded view symbol (+) of or double-click the serial
number folder to view the contents.The top folder is untitled
and contains the Alarm Events Folder and Trouble Events
Folder along with the Calibration History Folder. The rest of
the folders contain folders for the interval trend files and
alarm trend files and are named and organized by date
(month/year).
4. Click the expanded view symbol (+) of or double-click the
Viewing, Printing, Exporting, and Deleting Data in the Data Window • 31
Page 36

untitled folder. The Alarm Events Folder and Trouble Events
Figure 22: Data View - Alarm Events
Folder will appear below the untitled folder along with the
Calibration History Folder.
5. Click the Alarm Events or T rouble Events folder. One or
more alarm or trouble event files will appear in the top right
frame. An Alarm Events Folder has been opened in the
example in Figure 21. If multiple User IDs or Station IDs are
used for an instrument, then more than one event file will
appear.
6. Click the desired event file to select it. An event list will
appear in the bottom right frame with the date, time, channel,
gas for an alarm file or general failure type for a trouble file,
and specific event type for the first ten events saved in the
selected file. If more than ten events are sa ved, the first eight
events are shown and the tot al number of event s in the file is
shown at the bottom of the list (see Figure 21).
7. Click the View Data button at t he bottom of the Dat a Window
or double-click the event file n ame to open the file and view it
in table format. Event files can only be viewed in table
format.
32 • Viewing, Printing, Exporting, and Deleting Data in the Data Window
Page 37

8. If you click the Summary button, the Data Window will split
Figure 23: Data View - Trouble Events
Figure 24: Printer List Dialog Box, Event Data
into two frames one above the other with t he event list in t he
lower frame and the summary information shown in the
upper frame. The summary information is the same as the
information shown in the upper right frame in Figure 21. The
summary information is the instrument serial number, station
ID, user ID, and the last download date. To return to the one
frame format, click Summary again.
9. If you want to print the data, click the Print button. A Printer
List dialog box will appear for you to select a printer.
10.Select a printer and click OK to print the data.
Viewing, Printing, Exporting, and Deleting Data in the Data Window • 33
Page 38
11.To export the d ata for use i n another applicati on, for example
Figure 25: Save as Dialog Box
a spreadsheet or database, click the Export but ton. A “Save
As” dialog box will appear for you to specify the filename and
file location. The default file type is “.csv” (comma-sep arated
values).
12.After specifying the file name, fi le locatio n, and file type click
the Save button to save the file to the specified location.
13.To go back and view other data, click the Return button in
the upper right corner of the Data Window or the Data
control button on the right side of the program window and
select the data you want to view.
Interval Trend Data
Average gas concentrations over the user defined interval trend
time are logged in the interval trend d at a files. The inte rval tr end
time is set using either the Data Log Interval menu item in the
Eagle 2 Setup Mode or the Interval Trend Time item in the Set
window. See “Changing Eagle 2 Instrument Parameters” on
page 77 or the Eagle 2 O perator’s Manual for instructions to set
the interval trend time. Events such as gas alarms or sensor
failures are saved in the interval trend data fil e when they occur.
34 • Viewing, Printing, Exporting, and Deleting Data in the Data Window
Page 39

An interval trend data file is created and saved in the Eagle 2
when the instrument is turned off or when a user ID, station ID,
or catalytic combustible channel gas configuration (using the
relative response feature in Display Mode) is changed during
operation. The serial number, user ID, station ID, and catalytic
combustible channel configuration that are entered in the
instrument when it is turned on or that are updated during
operation are saved for the correspo nding interval trend file. If
the instrument’s user ID or station ID are changed during
operation, any interval trend files that result from subsequent
operating sessions will have the new user ID or stat ion ID saved
in them. If the catalytic combustibl e channel gas configurat ion is
changed during operation using the relative response feature in
Display Mode, the new configuration will be saved in the data
until it is changed or the unit is turned off. Any catalytic
combustible channel gas configuration changes made using the
relative response feature in Display Mode are cleared when th e
unit is turned off and the unit returns to its original configuration
when it is turned on.
The data may be viewed either in table format or graph format if
at least 5 scheduled data points have been logged at the
programmed interval trend time. This does no t include even ts . If
an interval data file has fewer than five scheduled data points,
the graph controls are not functional and the data cannot be
graphed.
Viewing, Printing, Exporting, and Deleting Data in the Data Window • 35
Page 40

To view and perform desired operations with the interval trend
Figure 26: Data Window - Selecting Interval Trend Data Files
Double-click
to show
Click to
expand
folder
Click to show
interval trend
Interval trend
files
data folders
files
files:
1. With the program already launched, click the Data control
button along the right side of the program window. The Data
Window will appear.
2. If necessary, double-click the Eagle 2 icon in the top of the
Data Window’s upper l eft frame to see the folders of
downloaded data.
3. Find your instrument by serial number, then click the
expanded view symbol (+) of or double-click the serial
number folder to view the contents.The top folder is untitled
and contains the Calibration History, Alarm Event, and
Trouble Event folders. The rest of the folders contain folders
for the interval trend files and alarm trend files and are
named and organized by date (month/year).
4. Click the expanded view symbol (+) of or double-click the
36 • Viewing, Printing, Exporting, and Deleting Data in the Data Window
Page 41

dated folder whose contents you want to see.
Figure 27: Interval Trend Data in Table Format
Click to see
Click to save data to a file
Click to show
Select table or
graph view
Click to see
Click to print data
condensed data
session summary
events only
Click to return to
Data Window
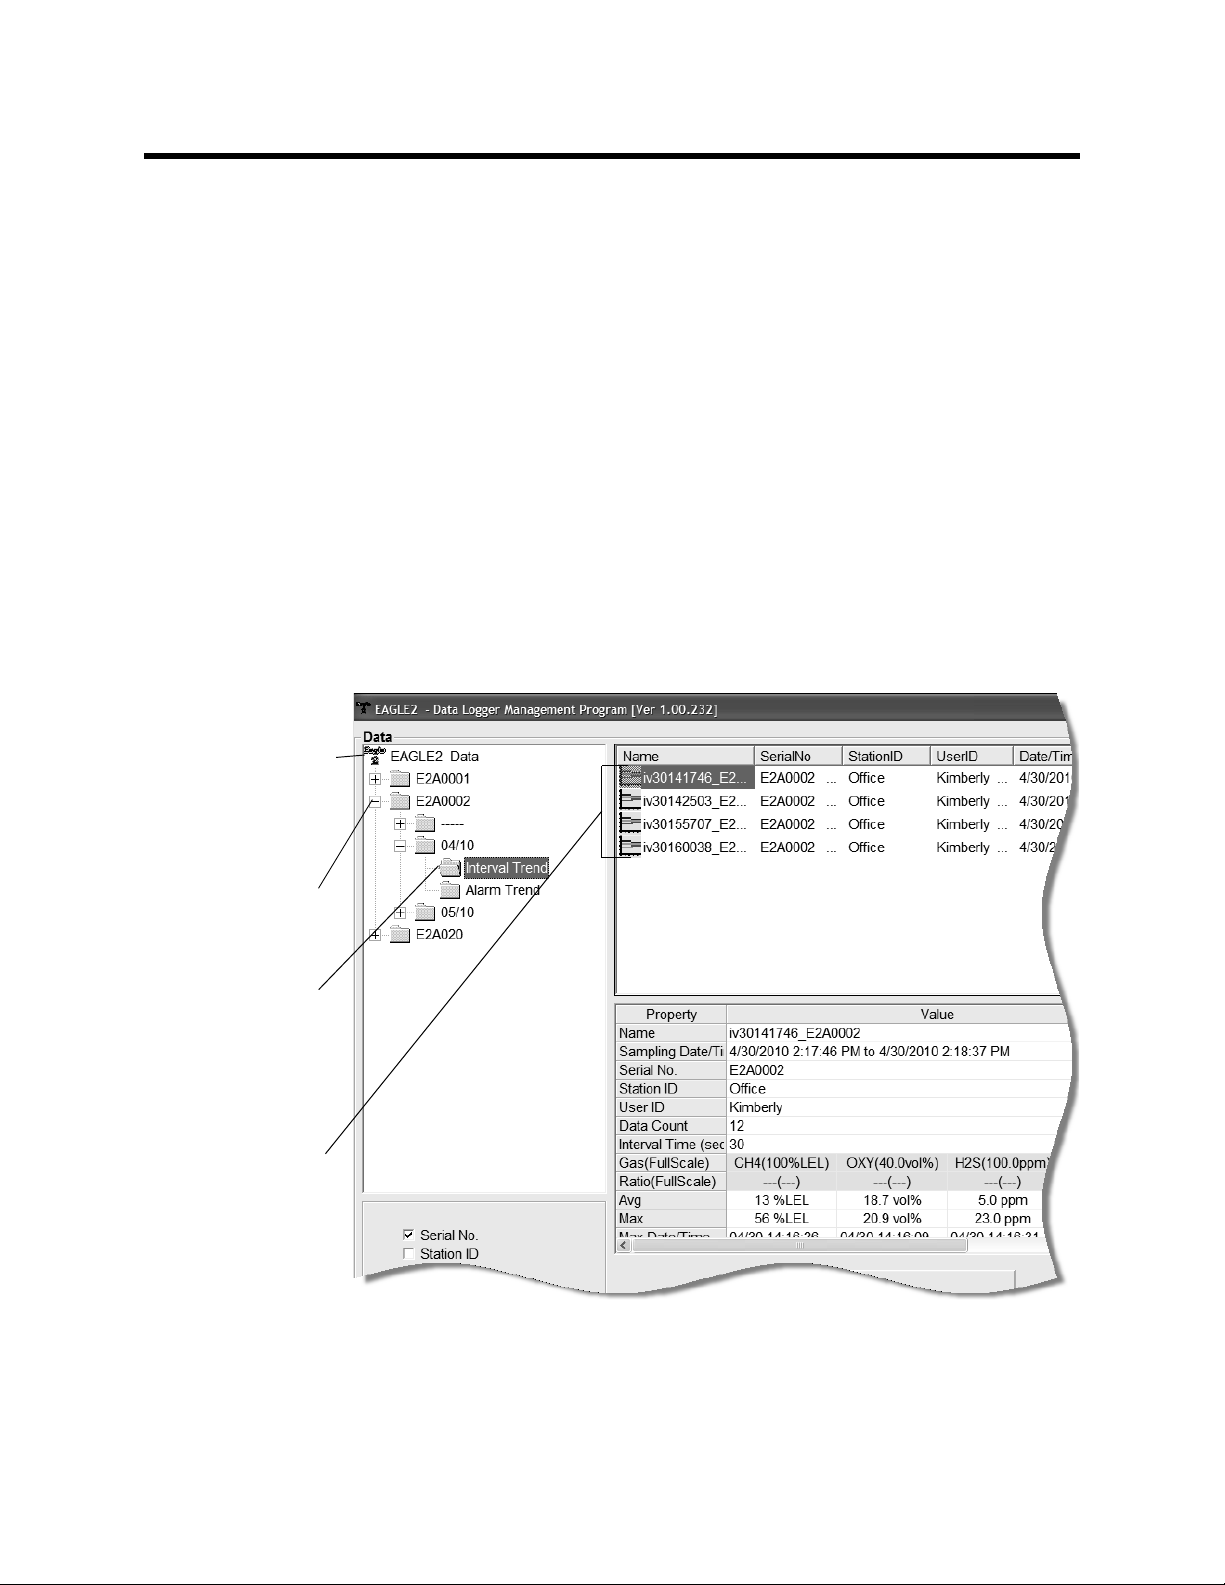
5. Click on the Interval T rend Folder. In the upper right frame of
the Data Window, a list of file names will appear in the Name
column. A prefix of “iv” indicates an interval trend data file.
6. Click one of the interval trend data file names. A summary
will appear in the bottom right frame with instrument and
alarm setting information. If you want to view, graph, print, or
export the interval trend data, double-click the filename or
click the View Data button at the bottom of the window.
7. Interval trend data can be viewed in either table or graph
format by selecting the Table or Graph selection buttons.
The example below in Figure 27 is shown in table format.
Viewing, Printing, Exporting, and Deleting Data in the Data Window • 37
Page 42

• In table format, the interval trend data is shown as the
average gas readings over the user defined interval trend
time. So if the data logging session started at 4:13:38 PM
and the interval time is set to 1 minute, then the readings
logged at 4:14:38 PM are the average reading for each
channel over that one minute period.
• Events are displayed on the screen under the channel in
which they occur and with the time of the event. Events
are displayed whether they occurred at scheduled log
times or in between them. Event s include gas a larms such
as a warning condition, trouble conditions such as a
sensor failure, and an indication t hat the unit is returning to
“normal” condition after an a larm has been reset using the
POWER ENTER RESET button on the Eagle 2.
• If you click the Summary button, the Data Window will
split into two frames, one above the other, with the data
table in the lower frame and the summary information
shown in the upper frame. The summar y information is the
same as the one shown in the lower right frame in
Figure 26. To return to the one frame format, click
Summary again.
38 • Viewing, Printing, Exporting, and Deleting Data in the Data Window
Page 43

• The catalytic combustible channel can be recorded in
Figure 28: Interval Trend Data Table Format (4 Gas)
%LEL, ppm, or %volume units depending on the
instrument setting. When viewing the in terval tr end dat a in
table format, the units are displaye d as the unit the reading
was recorded in.
Viewing, Printing, Exporting, and Deleting Data in the Data Window • 39
Page 44

• If installed, an infrared methane or hydrocarbon channel
Figure 29: Interval Trend Dat a Table Format (Autoranging)
records data in %LEL and/or % volume units depending
on whether the channel is configured as a % LEL channel
or a %LEL/% volume autoranging channel. When viewing
the interval trend data in t able format, the units are
displayed as the unit the reading was recorded in. In the
following figure, the first ch annel is a catalytic LEL chan nel
and the fifth channel is an IR autoranging CH
channel.
4
40 • Viewing, Printing, Exporting, and Deleting Data in the Data Window
Page 45

8. When the data is viewed in table format, if you move the
Figure 30: Alarm Trend Cursor Symbol
Alarm
Cursor
Symbol
Trend
cursor over an alarm event, it will change i nto a small symbol
that looks like an alarm trend data file while it is kept over the
alarm event.
Viewing, Printing, Exporting, and Deleting Data in the Data Window • 41
Page 46

If you click on the event, the corresponding alarm trend data
Figure 31: Data Displayed by Alarm Trend Cursor Symbol
Click to return to interval trend data
file will be opened in a new window that pops up over the
Data Window. No control buttons will be visible along the
right side of the new window when an alarm trend data fi le is
displayed in this way. To return to the interval trend data file,
click the Return button or click the “X” in the upper right
corner of the new window to close the window.
9. To view only events in the interval trend data file, click the
Events On ly selection box to select it.
10.To view the interval trend data in condensed form, click the
Condensed selection box to select it. When the data is
condensed, the software shows only important and eventful
data as follows:
• The first and last scheduled data points in the session are
shown.
42 • Viewing, Printing, Exporting, and Deleting Data in the Data Window
Page 47

• If there are more than t wo consecutive data point s with the
same readings for all channels, only the first and last of
these consecutive data points are shown.
• All events, such as gas alarms or sensor failures, are
shown.
• For any event, the data point before and after the event is
always shown.
11.To view the data in graph format, click the Graph selection
button. Five or more scheduled data points are required in
an interval trend data file to be able to display it in graph
format.
NOTE: The data count shown when you have selected an
interval trend data file, as in Figure 26 above, can be
more than five if you have events, such as the Eagle 2
going into and out of alarm, but you may not have five
scheduled data points.
Viewing, Printing, Exporting, and Deleting Data in the Data Window • 43
Page 48

Figure 32: Interval Trend Data in Graph Format
Zoom Level
Cursor FeatureEvent Select
Catalytic Combustible Channel Reading Units
When viewing interval trend data in graph format, you have
several options:
• You can choose which gas(es) you want to graph by
selecting or deselecting the boxes next to each ga s name.
The color of the gas name corresponds with its color on
the graph and on the scale.
• You can choose the zoom level, or displayed time interval,
on the graph. The zoom feature shows greater detail
relative to time. Thus, the length of a time division on the
graph will depend on both the length of the datalogging
44 • Viewing, Printing, Exporting, and Deleting Data in the Data Window
Page 49

session and on the zoom factor. Depending on the length
of the data session, data sessions that show changing
readings will normally have more choices for zoom levels
than sessions that show stable dat a to allow for vie wing of
gas reading changes in greater detail.
• When selected, the Event feature shows on the graph
where each channel went into and out of alarm and at
what concentration each event occurred.
• When selected, the Cursor feature allows you to display
the gas reading and log time f or each data point saved on
the graph. The number of data points on the graph is
minimized depending on the length of a data session by
several means including omitting consecutive data points
that have the same gas readings. As you use the left and
right arrow buttons on your keyboard to move the cursor
across the graph horizontally, readings at specific log
times are displayed. Use the up and down arrows on the
keyboard to move the readings up or down on the screen.
• The catalytic combustible channel can be graphed in
%LEL, ppm, or %volume units. While readings can be
recorded in any of these units and stored in the same file,
those readings may only be graphed in one unit at a time.
If %LEL is chosen as the unit, any ppm or %volume data is
converted and graphed as %LEL. The user may change
back and forth between the units for the graph and still
have all data shown. The CAT Range Select box is where
the user may select %LEL, ppm, o r % volume as the unit s
for the graph. The box just to the right of the selection dot s
shows what channel the catalytic combustible detector is
associated with and what color it is displayed in on the
graph. In the example below, the catalytic combustible
Viewing, Printing, Exporting, and Deleting Data in the Data Window • 45
Page 50

channel is the first channel and is displayed in green.
Figure 33: Interval Trend Data in Graph Format
Zoom Level
Cursor FeatureEvent Select
Catalytic Combustible Channel Reading Units
• If installed, an IR HC or CH
channel can be graphed in
4
%LEL or % volume in order to accurately depict the full
range of the sensor.
If the channel is configured as a %LEL only channel, then
data will only be recorded in %LEL and the ran ge will be 0100% LEL. Any gas concentration above that level will not
be recorded.
If the channel is configured as a %LEL/% volume
autoranging channel, then data will be recorded in %LEL
and % volume where appropriate. It will record data in
46 • Viewing, Printing, Exporting, and Deleting Data in the Data Window
Page 51

%LEL up to 100% LEL and then it will start recording data
in % volume up to 100% volume. If %LEL is chosen as the
graphing units, all data collected for a %LEL only channel
will be displayed. Any data collected in an autoranging
configuration that exceeds 100% LEL will not be shown. In
order to view data above 100% LEL, % volume must be
selected. When % volume is selected, all data will be
shown in terms of % volume.
The IR Range Select box located in the bottom right
corner of the screen is where the unit selection is made for
the IR channel. The box next to the selection dot s
indicates what channel the IR sensor is associated with
and what color is used to indicate that channel on the
graph. In the example below, the IR channel is the first
channel and its information is displayed in green.
Viewing, Printing, Exporting, and Deleting Data in the Data Window • 47
Page 52

Figure 34: Interval Trend Data in Graph Format With Autoranging
Catalytic combustible
channel reading units
Zoom Level
Event select
Cursor feature
IR HC or CH4
autoranging sensor
channel reading units
NOTE: The IR Range Select selection box in the lower right
hand corner only appears if an IR HC or CH
installed, is in use, and is set up for autoranging . If an IR
HC or CH
sensor is not inst alled, if it s channel is turned
4
off, or if the channel is set up for % LEL only, this box
will not appear.
• If you click the Summary button, the data window will split
into two frames one above the other with the graph in the
lower frame and the summary information shown in the
upper frame. The summary information is the sa me as the
48 • Viewing, Printing, Exporting, and Deleting Data in the Data Window
sensor is
4
Page 53

information shown in the lower right frame in Figure 26. To
Figure 35: Printer List Dialog Box, Interval Data
Figure 36: Save as Dialog Box
return to the one frame format, click Summary again.
12.To print the data, whether it is viewed in table or graph
format, click the Print button. A Printer List dialog box will
appear for you to select a printer.
13.Select a printer and click OK to print the data. Data
displayed in Graph view will print as a graph and data
displayed in Table view will print as a table.
14.To export the data to a file so it can be used by another
application, for example a spr eadsheet or database (f or table
data) or a word processing or present ation program (for
graph data), click the Export button. A “Save As” dialog box
will appear for you to specify the filename, file location, and
file type.
Viewing, Printing, Exporting, and Deleting Data in the Data Window • 49
Page 54

For Graph view, the export file type is Windows bitmap
(.bmp). For Table view, the default file type is “.csv” (commaseparated values). After specifying the file name, file
location, and file type, click the Save button to save the file to
the specified location.
15.To go back and view other data, click the Return button in
the upper right corner of the Data Window or the Data
control button on the right side of the program window and
select the data you want to view.
Alarm Trend Data
In addition to the interval t rend dat a, the Eagle 2 also saves files
that describe the most recent gas alarm events. If a gas alarm
event occurs, then an alarm trend file that is centered aroun d
the event is saved separately from the interval trend dat a files. It
shows the readings up to 30 minutes before and 30 minutes
after the event, wit h the log interval time e very five seconds. The
gas readings logged at the alarm event time are highlighted in
red and the gas readings logged every 5 seconds around the
alarm event are the peak (minimum for oxygen) readings for the
previous five seconds. If the Eagle 2 was operating in Inert
Mode at the time of the alarm, the maximum oxygen readings
will be saved. If the Eagle 2 has not been on for 30 minutes
before the alarm event occurs, the data during this time is left
blank. If the Eagle 2 is turned off less than 30 minutes after an
alarm event occurs, the data file will only have logged data until
the unit was turned off.
The Eagle 2 saves up to 8 alarm trend files. When an alarm
event triggers an alarm trend file to be saved, subsequent alarm
events must occur 15 minut es after the previous tri ggering event
in order to trigger the saving of another alarm trend file. If 8
alarm trend files are already saved in th e Eag le 2’s memory, the
oldest alarm trend file is overwritten when a new alarm trend file
is saved. Alarm trend data can always be displayed in either
table or graph format.
50 • Viewing, Printing, Exporting, and Deleting Data in the Data Window
Page 55
To view and perform desired operations with the alarm trend
Figure 37: Data Window - Selecting Alarm Trend Data Files
Double-click to
show data folders
Click to expand
folder
Click to show
alarm trend files
Alarm trend files
files:
1. With the software already launched, click the Data control
button along the right side of the program window. The Data
Window will appear.
2. If necessary, double-click the Eagle 2 icon in the top of the
Data window’s upper left frame to see the folders of
downloaded data.
3. Find your instrument by serial number, then click the
expanded view symbol (+) of or double-click the serial
number folder to view the contents.The top folder is untitled
and contains the Calibrat ion History f older along with fo lders
for alarm events and trouble events. The rest of the folders
contain folders for the interval trend files and alarm trend
files and are named and organized by date (month/year).
4. Click the expanded view symbol (+) of or double-click the
dated folder whose contents you want to see.
Viewing, Printing, Exporting, and Deleting Data in the Data Window • 51
Page 56

5. Click on the Alarm Trend Folder in the upper left frame. In
Alarm Event
Figure 38: Alarm Trend Data in Table Format
Click to print data
Click to save data to a file
Click for a summary
of the data
Select table or
graph view
Unit Selection Box
the upper right frame of the Data window, a list of file names
will appear in the Name column. A prefix of “al” indicates an
alarm trend data file.
6. Click one of the alarm trend data file names. A summary will
appear in the bottom right frame with instrument and alarm
setting information. If you want to view , graph, print, or export
the alarm trend data, double-click the filename or click the
Vie w Data button at the bottom of the window.
7. Alarm trend data can be viewed in either table or graph
format by selecting the Table or Graph selection buttons.
The example below in Figure 38 is in table format.
52 • Viewing, Printing, Exporting, and Deleting Data in the Data Window
Page 57

• In table format, the log times are shown along with the
peak (minimum for oxygen) gas readings for the previous
five seconds.
• The gas readings at the time of the alarm event around
which the logged data are centered are highlighted in red
and are the instantaneous readings at that time.
• The catalytic combustible channel can be recorded in
%LEL, ppm, or %volume units depending on the
instrument setting. When viewing the alarm trend data in
table format, the unit s for the catalytic LEL channel are
shown in %LEL. The displayed units can be changed to
ppm or %volume using the selection box in th e botto m left
portion of the screen.
Viewing, Printing, Exporting, and Deleting Data in the Data Window • 53
Page 58

• If installed, an infrared methane or hydrocarbon channel
Figure 39: Alarm Trend Data in Table Format
IR Autoranging Channel Catalytic Combustible Channel
Catalytic Units Selection Box
records data in %LEL and/or % volume units depending
on whether the channel is configured as a % LEL channel
or a %LEL/% volume autoranging channel. When viewing
the alarm trend data in table format, the units are
displayed as the unit the reading was recorded in. In the
following figure, the first ch annel is a catalytic LEL chan nel
and the fifth channel is an IR autoranging CH
channel.
4
• If you click the Summary button, the data window will split
into two frames one above the other with the data table in
the lower frame and the summary information shown in
the upper frame. The summary information is th e same as
the information shown in the lower right frame in
Figure 37.
54 • Viewing, Printing, Exporting, and Deleting Data in the Data Window
Page 59

8. The Event Only and Condensed selection boxes are not
Figure 40: Alarm Trend Data in Graph Format
Zoom level
Catalytic combustible channel reading units
Cursor feature
selectable for alarm trend files.
9. To view the data in graph format, click the Graph button. An
alarm trend file can always be graphed regardless of the
number of logged points.
When viewing alarm trend data in graph format, you have
several options:
• You can choose which gas(es) you want to graph by
selecting or deselecting the boxes next to each ga s name.
The color of the gas name corresponds with its color on
the graph and on the scale.
• The catalytic combustible channel can be graphed in
%LEL, ppm, or %volume units. While readings can be
Viewing, Printing, Exporting, and Deleting Data in the Data Window • 55
Page 60

recorded in any of these units and stored in the same file,
Figure 41: Alarm Trend Data in Graph Format
Zoom level
Catalytic combustible channel reading units
Cursor feature
those readings may only be graphed in one unit at a time.
If %LEL is chosen as the unit, any ppm or %volume data is
converted and graphed as %LEL. The user may change
back and forth between the units for the graph and still
have all data shown. The CAT Range Select box is where
the user may select %LEL, ppm, o r % volume as the unit s
for the graph. The box just to the right of the selection dot s
shows what channel the catalytic combustible detector is
associated with and what color it is displayed in on the
graph. In the example below, the catalytic combustible
channel is the first channel and is displayed in green.
56 • Viewing, Printing, Exporting, and Deleting Data in the Data Window
• If installed, an IR HC or CH
channel can be graphed in
4
%LEL or % volume in order to accurately depict the full
Page 61

range of the sensor.
If the channel is configured as a %LEL only channel, then
data will only be recorded in %LEL and the range will be
0-100% LEL. Any gas concentration above that level will
not be recorded.
If the channel is configured as a %LEL/% volume
autoranging channel, then data will be recorded in %LEL
and % volume where appropriate. It will record data in
%LEL up to 100% LEL and then it will start recording data
in % volume up to 100% volume. If %LEL is chosen as the
graphing units, all data collected for a %LEL only channel
will be displayed. Any data collected in an autoranging
configuration that exceeds 100% LEL will not be shown. In
order to view data above 100% LEL, % volume must be
selected. When % volume is selected, all data will be
shown in terms of % vol.
The IR Range Select box located in the bottom right
corner of the screen is where the unit selection is made for
the IR channel. The box next to the selection dot s
indicates what channel the IR sensor is associated with
and what color is used to indicate that channel on the
graph. In the example below, the IR channel is the first
channel and its information is displayed in green.
Viewing, Printing, Exporting, and Deleting Data in the Data Window • 57
Page 62

Figure 42: Alarm Trend Data in Graph Format
Zoom level
Catalytic combustible channel reading units
Cursor feature IR HC or CH4
channel units
58 • Viewing, Printing, Exporting, and Deleting Data in the Data Window
NOTE: The IR Range Select selection box in the lower right
hand corner only appears if an IR HC or CH
installed, is in use, and is set up for autoranging . If an IR
HC or CH
sensor is not inst alled, if it s channel is turned
4
off, or if it’s set up for % LEL only, this box will not
appear.
• You can choose the zoom level, or displayed time interval,
on the graph. The zoom feature shows greater detail
relative to time. Thus, the length of a time division on the
graph will depend on both the length of the datalogging
session and on the zoom factor.
sensor is
4
Page 63

• When selected, the Event feature shows on the graph
Figure 43: Printer List Dialog Box, Interval Data
where each channel went into and out of alarm and at
what concentration each event occurred.
• When selected, the Cursor feature allows you to display
the gas reading and log time for each data point in the
alarm trend file. As you use the lef t and right arrow button s
on your keyboard to move the cursor across the graph
horizontally, readings at specific log times are displayed.
Use the up and down arrows on the keyboard to move the
readings up or down on the screen.
• If you click the Summary button, the data window will split
into two frames one above the other with the graph in the
lower frame and the summary information shown in the
upper frame. The summary information is the sa me as the
information shown in the lower right frame in Figure 37. To
return to the one frame format, click Summary again.
10.To print the data, whether it is viewed in table or graph
format, click the Print button. A Printer List dialog box will
appear for you to select a printer.
11.Select a printer and click OK to print the data. Data
displayed in Graph view will print as a graph and data
displayed in Table view will print as a table.
Viewing, Printing, Exporting, and Deleting Data in the Data Window • 59
Page 64

12.T o export the dat a for use in another application, for example
Figure 44: Save as Dialog Box
a spreadsheet or database (for table data) or a word
processing or presentation program (for graph data), click
the Export button. A “Save As” dialog box will appear for you
to specify the filename, file location, and file type.
For Graph view, the export file type is Windows bitmap
(.bmp). For Table view, the default file type is “.csv” (commaseparated values). After specifying the file name, file
location, and file type, click the Save button to save the file to
the specified location.
13.To go back and view other data, click the Return button in
the upper right corner of th e Data Window or the Data button
on the right side of the program window and select the data
you want to view.
Deleting Data in the Data Window
The following items can be deleted in the Data Window:
• Data folders
• Calibration History files
• Alarm and Trouble Event files
60 • Viewing, Printing, Exporting, and Deleting Data in the Data Window
Page 65

• Interval Tr end and Alarm Trend data files
Figure 45: Delete Box
Figure 46: Password Window
To delete any of the above items in the Data Window:
1. With the program launched, click the Data control button on
the right side of the program window.
2. Find the folder or file you want to delete.
3. Place the cursor on the fol der or file you want to delete and
click it with the right mouse button. The Delete box will
appear.
4. Click Delete with the left mouse button. The Password
Window appears.
5. Enter the password and click Continue. The password when
Viewing, Printing, Exporting, and Deleting Data in the Data Window • 61
Page 66

the program is first installed is “rki”. The p assword is case
Figure 47: Delete Data Window
sensitive. See “Changing the Password” on page 63 for
instructions to change the password if desired.
6. When the password has been entered and Continue
clicked, the Delete Data Window (if a folder is selected for
deletion) or Delete Sample Window (if a file is selected fo r
deletion) will appear asking you to confirm that you want to
delete the selected folder or file. In the example below, the
Delete Data Window appears because the dat a folder shown
in Figure 45 has been selected for deletion.
7. If you want to delete the selected item, click Yes. The item
will be deleted by the program.
If you do not want to delete the selected item, click No and
the operation will be cancelled.
62 • Viewing, Printing, Exporting, and Deleting Data in the Data Window
Page 67

Changing the Password
Figure 48: Delete Box
Figure 49: Password Window
CAUTION: Changing the password requires use of the Delete
box. Take care to avoid accidentally deleting dat a if
you decide to change the password.
It is possible to change that password as follows:
1. Right-click a data folder, data file, or event file. The Delete
box will appear.
2. Click Delete with the left mouse button. The Password
Window appears.
Viewing, Printing, Exporting, and Deleting Data in the Data Window • 63
Page 68

3. Click Change Password. The Password Window asks you
Figure 50: Inputting Current Password
Figure 51: Inputting New Password
Figure 52: Confirming New Password
to input the current password.
4. Type the current password, then click Current password.
The Password Window asks you to input the new password.
5. Type the new password and click New Password. The
Password Window asks you to input the new password
again to confirm it.
6. Type the new password again, then click Confirm New
Password.
64 • Viewing, Printing, Exporting, and Deleting Data in the Data Window
Page 69

7. Click OK when the pro gram confirms that you have changed
Figure 53: Confirming New Password
the password.
8. Close the Password Window by clicking the red “X” in the
upper right corner of the window.
Viewing, Printing, Exporting, and Deleting Data in the Data Window • 65
Page 70

Viewing, Printing, and
Deleting Data in the Last
Calibration Window
You can access data on the most recent successful calibration
for each instrument that has been downloaded in the Last
Calibration Window. You can view, print (calibration date view
option only), and delete this da t a in the Last Calibrat ion Window.
Viewing and Printing Last Calibration Data
Open the Last Calibration Window by clicking Last Calibration
along the right side of the program window. When you open the
Last Calibration Window the first time after launching the
program, it will open with the Need Calibration view option
selected. There are three view options in the Last Calibration
window: Need Calibration, Calibration Date, and Calibration
Record.
Need Calibration Option
Selecting this option shows the last calibration date and the last
download date for the Eagle 2s that are due for calibration.
NOTE: The calibration interval, the number of days after a
calibration that a new calibration is due, is saved in the
Eagle 2. If the calibration interval is changed in the
Eagle 2, the new calibration interval will not be known
by the program until the Eagle 2 is downloaded.
66 • Viewing, Printing, and Deleting Data in the Last Calibration Window
Page 71

The Need Calibration view option shows the following fields:
Figure 54: Last Calibration Window: Need Calibration View Option
• No. — lists, in numerical order, the sequence of Eagle 2s
whose data have been downloaded to the program. The
most recently downloaded Eagle 2 will be No. 1.
• SerialNo — shows the serial number of the Eagle 2 tha t
was downloaded.
• UserID — shows the user ID of the Eagle 2 that was
downloaded.
• StationID — shows the station ID of the unit that was
downloaded.
• Ports (1-4) — shows when the unit was calibrated for each
of the channels using the MM/DD/YY format and 24-hour
military standard time. Each port number corresponds with
a channel number in the Eagle 2. Ports 1-4 correspond
with Channels 1-4 displayed from top to bottom on the
Eagle 2 display when in Measuring Mode. For each serial
number, each port has 2 display lines. The first line
displays the target gas and sensor range. The second li ne
displays the most recent calibration date or the date the
channel is due for calibration.
NOTE: Your Eagle 2 may have more than 4 sensors installed.
Viewing, Printing, and Deleting Data in the Last Calibration Window • 6 7
Page 72

• Last Downloaded — shows when the last download took
Figure 55: Printer List Dialog Box, Need Calibration View Option
Figure 56: Last Calibration Window: Calibration Date View Option
place for a unit using th e MM/DD/YY format and a 12-hour
clock. This parameter is displa yed on the second display
line for each unit downloaded.
The Eagle 2s that are due for calibration (in the case of the
Need Calibration view option, that will be all of them), will have
their last calibration date highlighted in red. The Eagle 2s that
have not been downloaded for more than 90 days will have their
last download date highlighted in purple.
To print a list of the instruments shown in the Need Calibration
view option along with their user ID and last calibration date,
click the Print button. A Printer List dialog box will appear.
Select a printer and click the OK button to print the instrument
list.
Calibration Date View Option
Selecting this option shows the last calibration date and the last
download date for all the Eagle 2s that are in the program’s
database. The fields for t he Calibra tion Date vi ew op tion ar e the
same as for the Need Calibration view option.
68 • Viewing, Printing, and Deleting Data in the Last Calibration Window
Page 73
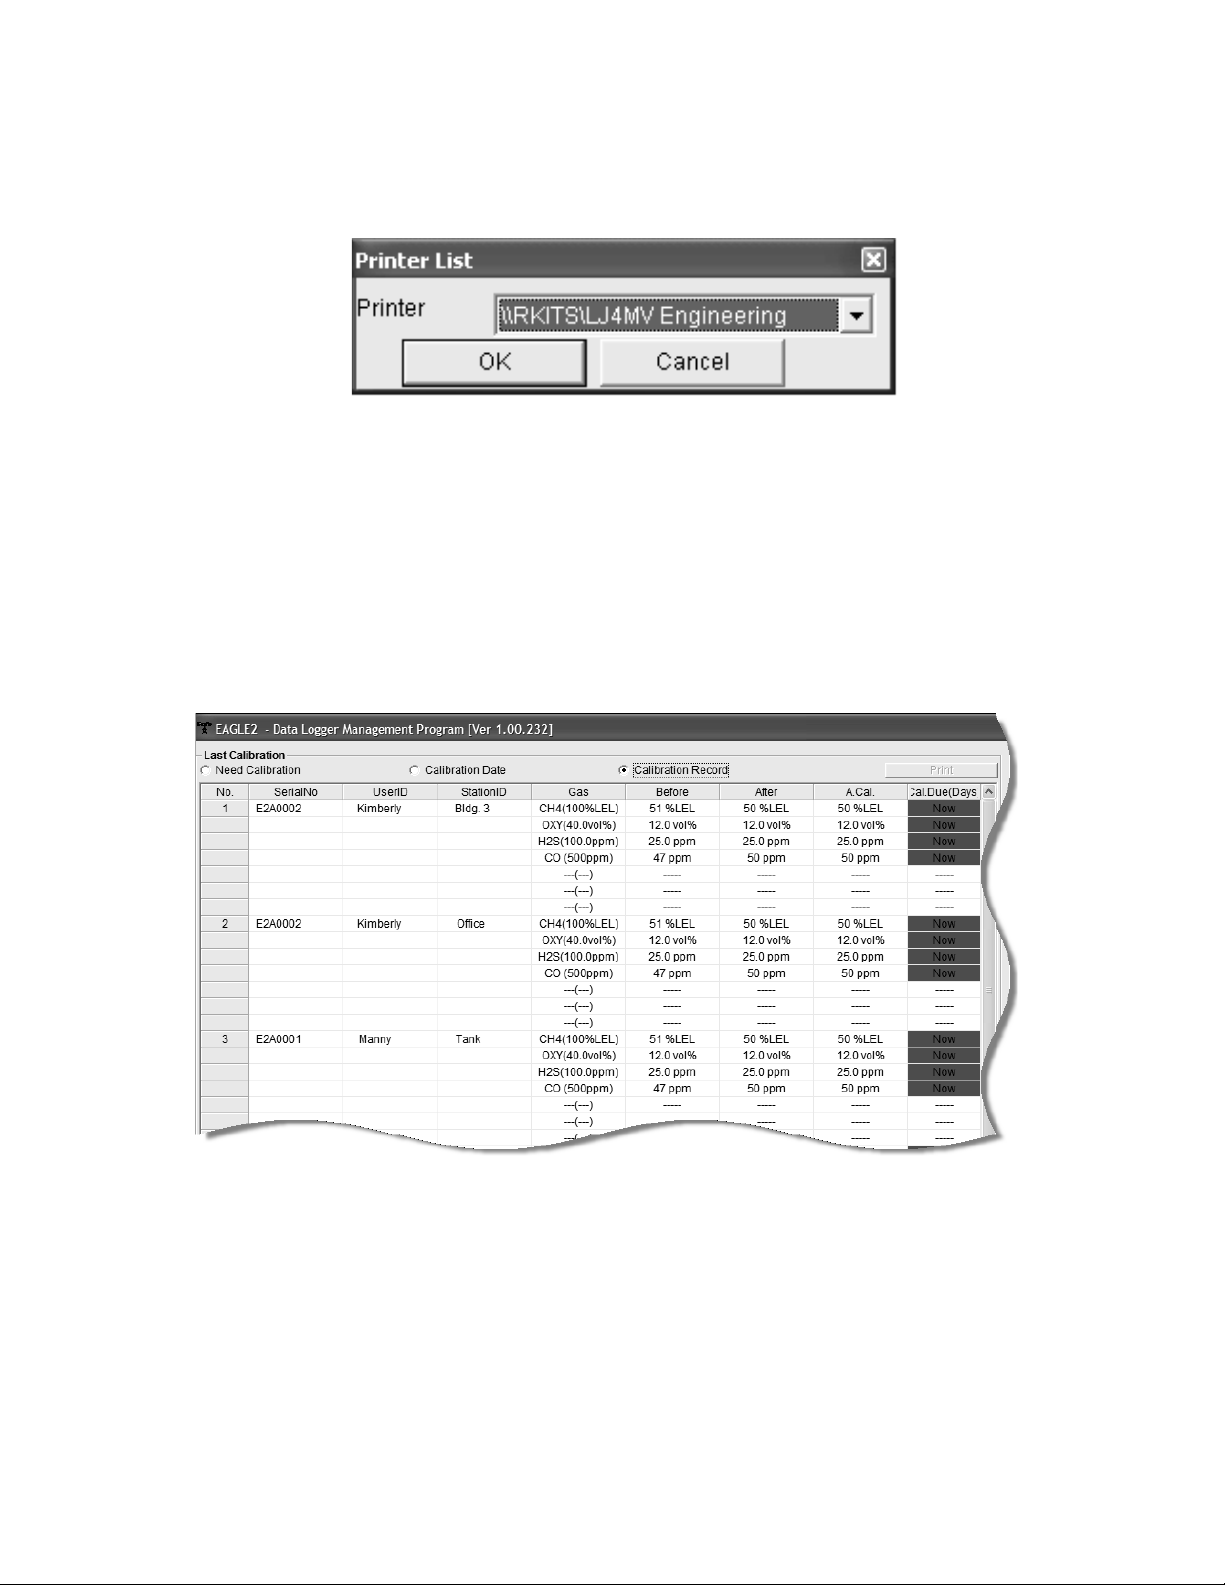
To print a list of the instruments shown in the Calibration Date
Figure 57: Printer List Dialog Box, Calibration Date View Option
Figure 58: Last Calibration Window: Calibration Record View Option
view option along with their user ID and last calibration date,
click the Print button. A Printer List dialog box will appear.
Select a printer and click the OK button to print the instrument
list.
Calibration Record View Opti on
Selecting the Calibration Record view option shows detailed
calibration information for each Eagle 2’ s most recent successful
calibration.
The fields on this screen include No., SerialNo, UserID, and
StationID just as in the Need Calibration and Calibrati on Date
screens. The fields also include the following:
• Gas — Lists the target gas for which t he Before, Af ter, and
A.Cal readings are displayed.
Viewing, Printing, and Deleting Data in the Last Calibration Window • 6 9
Page 74

• Before — shows the settings prior to calibration.
• After — shows the settings after calibration.
• A. Cal. — lists the auto-ca libration setting for each channe l
of the Eagle 2. If a Eagle 2 passes its calibrat i on, the
“After” column should match the “A. Cal.” column. If the
Eagle 2 fails calibration on any of its channels, those
channels will retain the previous calibration information.
NOTE: If a unit is calibrated using Single Calibration in the
Eagle 2’s Calibration Mode (see the Eagle 2 Operator’s
Manual) it is possible for the “After” reading to be
different from the “A.Cal” setting if the unit was set to a
level different than the “A.Cal” setting.
• Cal. Due (Days) — shows when calibration is due in days
(e.g., “Remaining 25 Day” means that calibration is due in
25 days, and “Now” means that calibration is due
immediately).
It is not possible to print any information when the Calibration
Record view option is selected.
To view and print all past calibrations for an instrument, see
“Calibration History” on page 26.
Deleting Last Calibration Data
To delete an instrument and its calibration data from the Last
Calibration Window:
1. With the program launched, click Last Calibration on the
right side of the program window. The Last Calibration
Window will appear.
2. Select the Need Calibration or Calibration Date option.
3. Click the first row for the instrument whose calibration
information you want to delete to select it. It will be
highlighted to show that it is selected.
70 • Viewing, Printing, and Deleting Data in the Last Calibration Window
Page 75

4. Click the row with the right mouse button. The Delete box
Figure 59: Delete Box
Figure 60: Password Window, Deleting Last Calibration Data
appears.
5. Click Delete with the left mouse button. The Password
window appears.
6. Enter the password and click the Continue button. The
password when the software is first installed is “rki”. The
password is case sensitive. See “Changing the Password”
on page 63 for instructions to change the password if
desired.
Viewing, Printing, and Deleting Data in the Last Calibration Window • 7 1
Page 76

7. When the password has been entered and the Continue
Figure 61: Delete History Window
button clicked, the Delete History window will appear asking
you to confirm that you want to delete the most recent
calibration information for the selected instrument.
8. If you want to delete the calibration informati on, click Yes.
The information will be deleted by the program.
If you do not want to delete the calibration information, click
No and the operation will be cancelled.
72 • Viewing, Printing, and Deleting Data in the Last Calibration Window
Page 77

Calibrating an Eagle 2 With
The Eagle 2 Data Logger
Management Program
An Eagle 2 can be calibrated using the Eagle 2 Data Logger
Management Program. The calibration function is available in
the Set window. To perform a calibration you will need a
calibration kit. This section describes calibration usin g a
calibration kit that includes a demand flow regulator. If a
calibration kit is used that includes a sample bag and a
dispensing valve instead of a demand flow regulator, connect a
sample bag filled with calibration gas to the Eagle 2’s probe tube
when applying gas instead of connecting the demand flow
regulator to the Eagle 2’s probe tube.
To calibrate the Eagle 2, you will need the following items:
• Known calibrating samples of the gases being detected.
The combustible and toxic gas samples should have
concentrations in approximately the middle of the range of
detection. For the standar d 4-gases, a 3-gas or 4-gas mix,
depending on your instrument version, is recommended
so that all channels may be calibrated at once.
• If an optional sensor is installed, this sensor will probably
need to be calibrated individually because it s t arg et gas is
not included in a 3-gas or 4-gas mix. The available
optional sensors are PID, ESM-01, IR, or TC sensors.
• A demand-flow regulator to provide adequate sample gas
flow.
• Non-absorbent tubing to connect the regulator to the
Eagle 2’s probe tube.
Calibrating an Eagle 2 With The Eagle 2 Data Logger Management Program • 73
Page 78

CAUTION: Calibration using the Eagle 2 Data Logger
Management Program should be done in a fresh air
environment, an area free of comb ustible and to xic
gases and of normal oxygen content (20.9%). If
you suspect the area is not a fresh air environment,
apply zero air to the instrument when performing a
zero operation.
To calibrate an Eagle 2, perform the following steps:
1. Install the Eagle 2’s probe on the inlet fitting.
2. Launch the Eagle 2 Data Logger Management Program.
3. If Automatic Download is selected, deselect it. The Eagle 2
will be turned off by the program after an automatic
download, so calibration will not be possible if Automatic
Download is selected.
4. Connect an Eagle 2 to the program. See “Downloading Data
from the Eagle 2” on page 15 and follow instructions 1-3 to
connect an instrument to the program.
5. Once the connection is made, the Complete Download,
Instrument Information, Clear Logger Data, and Power
Off download commands will be selectable. Click the
Instrument Information download command to retrieve the
instrument information from the Eagle 2. If you wish to
download data before calibrating, click Complete Download
instead of Instrument Info rm at i o n.
74 • Calibrating an Eagle 2 With The Eagle 2 Data Logger Management Pro-
Page 79

6. Click the Set button to display the Set window.
Figure 62: Set Window
Click to begin calibration of Eagle 2
7. Click the Calibration button in the Eagle 2 S tat us frame. The
Eagle 2’s pump will turn on. The Calibration frame will
replace the Eagle 2 Status frame and the control buttons
along the right side of the window will become inactive.
Calibrating an Eagle 2 With The Eagle 2 Data Logger Management Program • 75
Page 80

Figure 63: Set Window With Calibration Frame
Click boxes to select
channels for calibration
Set Cal values to match
gas cylinder
8. Use the selection boxes under the Select column to select
the channels you want to calibrate.
9. Click the Zero button. The software will perform a zero
adjustment setting the oxygen channel to 20.9% and all
other channels to 0.
10.If an optional sensor is installed and its target gas is not
included in the 3-gas or 4-gas mix, the span will need to be
adjusted individually.
11.Verify that the value(s) in the Cal. column match the gas
concentration(s) in the calibration cylinder that will be used.
If not, place the cursor in the field that needs to be changed
and update the value.
12.Screw the demand flow regulator onto the calibration
cylinder.
76 • Calibrating an Eagle 2 With The Eagle 2 Data Logger Management Pro-
Page 81

13.Connect the regulator to the Eagle 2 probe tube using the
sample tubing provided with the calibration kit.
14.Allow the gas to flow for one minute. The current gas
readings will be shown in the Current Reading column.
15.Click the Span button. The program will make the span
adjustments.
16.Disconnect the tubing from the Eagle 2’s probe tube.
17.Remove the regulator from the cylinder.
18.Allow the current readings to return to normal and click the
Exit Calibration button to retu rn to the Eagle 2 S t atus frame.
The Eagle 2’s pump will turn off.
19.If you wish to use other function s in the sof tware, click one of
the control buttons.
20.If you wish to exit the software, click the Download button to
return to the Download window. Turn off th e Eagle 2 by using
the POWER ENTER RESET button on the Eagle 2 or by
clicking the Power Off button and confirming that you want
to turn off the Eagle 2 when the Power Off window appears.
Then click the Exit button to exit the program.
Changing Eagle 2 Instrument Parameters
To make changes to parameters stored in the Eagle 2, use the
Eagle 2’s Data Logger Manage me nt Program’s Set Window.
Follow the steps below to make these changes.
1. Launch the Eagle 2 Data Logger Management Program.
2. If the Automatic Download selection box is selected,
deselect it.
3. Connect an Eagle 2 to the program. See “Downloading Data
from the Eagle 2” on page 15, instruction 2 through
instruction 3, to connect an instrument to the program.
4. Once the connection is made, the Complete Download,
Instrument Information, Clear Logger Data, and Power
Changing Eagle 2 Instrument Parameters • 77
Page 82

Off download commands will be selectable. Click the
Figure 64: Set Window
Click to upload changes to Eagle 2
Instrument Information download command to retrieve the
instrument information from the Eagle 2. If you wish to
download data before making changes, click Complete
Download instead of Instrument Information.
5. Click the Set button to display the Set Window. Use the
Eagle 2 S tatus Frame and the Gas/Sensor Frame t o change
parameters stored in the Eagle 2.
Alarm settings are shown in the Gas/Sensor Frame at the
bottom of the screen. Settings for installed sensors are
shown in black text. Additional alarm settin gs for the installed
sensors are shown in green text. The oxygen alarm settings
shown in green at the bottom of the Gas/Sensor Frame are
for Inert Mode. Inert Mode must be activated in the Eagle 2
for this alarm setting to appear. Alarm setting changes made
to the Inert Mode oxygen alarms will not affect the Normal
Mode oxygen alarms. The Normal Mode oxygen alarms can
be viewed and edited above t he Inert Mode oxygen alarms in
78 • Changing Eagle 2 Instrument Parameters
Page 83

the standard four gas section.
Figure 65: Update Window
6. To change the serial number , click the serial number field
and use the backspace key to remove the curr ent entry, then
type the new information. To change the station ID or user
ID, click the drop-down menu and select the desired station
or user ID.
7. To change the datalogging trend interva l time, click on the
down arrow in the Interval T rend Time Field and select the
desired interval time in seconds. The available choices are
5, 10, 20, 30, 60, 180, 300, and 600 seconds.
8. T o change the channel p arameters, click the field you wish to
change (e.g. H2S AutoCal.) to select it, then type the new
information.
9. After you have finished entering new parameters, you must
upload this information to the Eagle 2 by clicking the Update
button, then confirming that you want to update the
information by clicking the Yes button when the Update
window appears.
10.To update the Eagle 2’s date and time to match the
computer’s, click the Date/Time Set button and then click
the Yes button when the Update window appears.
11.If you wish to use other funct i ons in the program, click the
appropriate control button along the right side of the program
window.
12.If you wish to exit the software, click the Download control
button to return to the Down load Window. Turn off the Eagle
Changing Eagle 2 Instrument Parameters • 79
Page 84

2 by using the POWER ENTER RESET button on the Eagle
2 or by clicking the Power Off button and confirming that you
want to turn off the Eagl e 2 when the Power Off Window
appears. Then click the Exit button to exit the software.
Detail Settings Button
The Detail Settings button al lows the user t o create or chan ge a
User ID list or Station ID list and upload it to an instrument , view
the pre-defined relative response gases for the catalytic
combustible channel and edit or add user-defined gases, and
view the pre-defined relati ve re sponse gases for the PID sensor
and to view or define the 1 user-defined relative response gas.
A Select Distributed File button is located in the bottom right
corner of the Detail Settings window. This control button only
becomes active after data has been downloaded to the Data
Logger Management Program. The function controlled by this
button is not needed for normal field use of the program. This
function is for use by field service personnel with a factory
program at their disposal to generate a distributed file.
The detail settings but ton is located alon g th e lef t p art of th e Set
window under the font and gra ph color buttons. To update any of
the parameters found in the Detail Set tings window in an
instrument, you must first connect the instrument to the
program.
1. Launch the Eagle 2 Data Logger Management Program.
2. If the Automatic Download selection box is selected,
deselect it.
3. Connect an instrument to the program. See “Downloading
Data from the Eagle 2” on page 15, instruction 2 through
instruction 3, to connect an instrument to the program.
4. Once the connection is made, the Complete Download,
Instrument Information, and Power Off download
commands will be selectable. Click the Instrument
Information download command to retrieve the inst rument
information from the instrument. If you wish to download dat a
before making changes, click Complete Download instead
80 • Detail Settings Button
Page 85

of Instrument Information.
Figure 66: Set Window
5. Click the Set button to display the Set window.
Detail Settings Button • 8 1
Page 86

Station & User Tab
Figure 67: Station & User Tab
The Station & User tab displays a list of Station IDs and User
IDs. The first time the Eagle 2 is connected to the Eagle 2 Data
Logger Management Program, this list will be blank. No Station
IDs or User IDs are loaded into the Eagle 2 at the factory. These
are user-defined parameters that may only be configured using
the Eagle 2 Data Logger Management Program. Up to 128
Station IDs and up to 32 User IDs may be defined.
82 • Detail Settings Button
Page 87

CSV Files
Figure 68: Station csv File Export
Click to generate Station csv file
Click to generate User csv file
To edit the S tation ID or User ID list, you will need to import a csv
(comma separated values) file into the program. A Station csv
file and a User csv file are provided with the program. In
addition, you can generate csv files for editin g from the program.
1. To create a csv file for editing, click the “Export csv file”
button located to the right of th e Station I D list or the User I D
list.
Detail Settings Button • 8 3
Page 88

2. Navigate to the location you would like to save the csv file,
Figure 69: Station csv File Save As
type in a file name, and click Save.
84 • Detail Settings Button
Page 89

3. The csv files can be opened, edited, and saved using a word
Figure 70: Station csv File
processing program such as Word, WordPad, or Notepad.
The Station and User csv files consist of the Station or User
ID number and its associated name. Below is an example of
a Station csv file opened in WordPad.
Any existing Station or User IDs will be displayed. Undefined
Station or User IDs will appear as dashes. To edit a Station or
User ID, delete either the existing name or the dashes and
replace them with the desired name. The name may consist of
any letter, number, or character. If desired, you can save
multiple Station and User ID files.
Loading User and Station IDs
To load new User and Station IDs, do the following:
1. With an instrument connected to the program, locate an
existing Station or User csv file or generate a new one for
editing. See the instructions above to generate a csv file.
Detail Settings Button • 8 5
Page 90

2. In the Station and User tab, click “Import csv file” for either
Figure 71: Import csv File
Click to import Station csv file
Click to import User csv file
the Station ID or User ID and select a csv file.
86 • Detail Settings Button
Page 91

3. Select the file you want to import and click Open.
Figure 72: Station csv File Save As
4. Once the S tat ion ID and/or User ID list s ha ve been imported,
click OK to save changes and return to the Set window.
If you do not want to save the changes, click Cancel.
5. The new station and user ID lists will be visible i n th e Station
ID and User ID selection boxes in the Set window. Use the
drop down menu to select a current station and user ID for
the instrument.
6. To upload the new information from the Data Logger
Management Program to the Eagle 2, click the Update
button in the Set window.
Detail Settings Button • 8 7
Page 92

7. Click Yes in the confirmation window that appears.
Figure 73: Update Confirmation Window
Figure 74: Conversion Table
Conversion Table Tab
The Conversion Table tab is used to view the pre-defined
relative response gases for the catalytic combustible channel
and to edit or add user-defined gases. The pre-defined gases
can be found in the Pre-Defined Table tab while the user-defined
gases can be found under the User-Defined Table tab.
88 • Detail Settings Button
Page 93

There are 8 columns in both the Pre-Defined Table tab and the
User-Defined Table tab:
•No
This column represents the gas number. The gas numbers
are 1-30.
•Name
This is what will appear in the Relative Response list of
gases. The name can be up to 3 characters long and the
characters must be upper case letters or numbers. No
special characters may be used in the Name column.
• Long Name
The Long Name column is used to better describe the target
gas. It may contain any character in upper- or lower-case.
•Factor
This value is the response factor for the listed gas relative to
methane. The factor for each pre-defined gas is factory
defined. The factor for any user-defined gases must be
obtained through testing as described in “Obtaining a
Relative Response Factor” on page 101. Even if not all of the
user-defined catalytic combustible channels are being
defined, the Factor column must have a valid number
entered. A valid number for the Factor is a value between
0.01 and 25.00.
•1st
This column is for the low alarm point of each gas in ppm
units.
•2nd
This column is for the high alarm point of each gas in ppm
units.
•Ratio
The ratio is the ppm value of the LEL for each gas. Thi s value
is specific to each gas and can be easily determined. The
maximum value it may be set to is 150,000 ppm. If an invalid
number is entered, the box will turn red when the csv file is
imported back into the Data Logger Management Program.
Detail Settings Button • 8 9
Page 94

NOTE: If you define a gas whose LEL i s above 50,000 ppm, th e
%LEL reading in Measuring Mode will reflect the
defined ppm ratio, but the ppm reading in Measuring
Mode will not indicate above 50,000 ppm. For example,
if you set the ratio to be 150,000 ppm and set the
catalytic combustible channel to display the reading in
ppm, the gas reading will not indicate higher than
50,000 ppm, the equ ivalent of 33 %LEL and 5% volume
for this ratio, but will continue to indicate %LEL readings
up to 100 %LEL and %volume readings up to 15
%volume, the equivalent of 150,000 ppm, if the display
units are changed to %LEL or %volume. In addition, all
adjustable ppm pa r ameters cannot be set higher than
50,000 ppm.
•Volt
This value determines the sensor voltage for the catalytic
combustible sensor. It can be set to 1.3 or 2.4. When set to
1.3, the sensor is in methane elimination mode. When set to
2.4, the sensor is reading at full response. Even if not all of
the user-defined catalytic combustible channels are being
defined, the V olt column must have a valid number entered. A
valid number for the Volt column is either 1.3 or 2.4.
90 • Detail Settings Button
Page 95

While the pre-defined gases may not be edited, the 5 user-
Figure 75: User-Defined Table
defined gases may be edited by doing the following:
1. With the Data Logger Management Program running, click
the Set button to display the Set window. Click the Detail
Settings button to display t he Detail Settings window. Click
on the Conversion Table tab and then click on the UserDefined Table tab.
2. If no user-defined gases have been previously defined for
the connected instrument, the columns in User-Defined
Table will be blank. Any previously defined gases will appear .
3. Export the current data by pressing the “Export csv file”
button. Choose the file path you wish to save the file in.
Detail Settings Button • 9 1
Page 96

4. Open the csv file using Notepad, W ord, or WordPad. The
Figure 76: CSV File
Figure 77: Blank CSV File
example below shows a csv file opened in W ordPad. The li st
of gases are associated with the numbers 1-5.
If there were no previously defined gases, the csv file will
appear as the following:
5. The values in the csv file are all separated by commas.
These values are in the same order as the columns in the
Data Logger Management Program. The first value is the
gas number, the second is the gas name, etc.
6. Edit the values you wish to change and save and close the
file.
92 • Detail Settings Button
Page 97

7. Return to the Data Logger Management Program with the
Figure 78: Update Confirmation Window
User-Defined Table tab still up and press “Import csv file”.
8. Choose the file you just edited and press “Open”.
9. The values you entered in the csv file will appear in the User-
Defined Table.
10.If the program finds anything wrong with the values t hat
were entered, the box containing those values will turn red.
Make sure that you have entered valid characters for each
field.
11.Click OK to save the changes and return to the Set window.
If you do not want to save the changes, click Cancel.
12.To upload the new information from the Data Logger
Management Program to the Eagle 2, click the Update
button in the Set window.
13.Click Yes in the confirmation window that appears.
Detail Settings Button • 9 3
Page 98

PID Sensor Tab
Figure 79: PID Sensor
The PID Sensor tab is used to view the pre-defined relative
response gases and to view or define the 1 user-define d relative
response gas. Every gas has a low and high range which are
displayed in the Low Range tab and High Range tab,
respectively.
There are 13 columns in both the High and Low Range tabs:
•No
This column represents the gas number. They are numbered
1-17.
•Name
This is what will appear in the Relative Response list of
gases. The name can be up to 3 characters long and the
characters must be upper case letters or numbers. No
special characters may be used in the Name column.
• Long Name
The Long Name column is used to better describe the target
gas. It may contain any character in upper- or lower-case.
94 • Detail Settings Button
Page 99

• Full Scale
This is the full scale value for the target gas.
•Point
The point value indicates to what decimal place the gas
readings are shown. A value of 1/1 indicates a reading to the
“ones” place while a value of 1/100 indicates a readin g to t he
“hundredths” place.
•Unit
The unit describes what units the gas reading is provided in.
All units are in ppm. While this parameter may be changed in
the csv file, units of ppm are the only acceptable units and
changing this parameter to %L EL or %vol will change the unit
box to red.
• Digit
The digit is the increment of the gas readings.
•1st
This column is for the low alarm point of each gas in ppm
units.
•2nd
This column is for the high alarm point of each gas in ppm
units.
•STEL
The STEL column displays the STEL values for each gas.
•TWA
The TWA column displays the TWA values for each gas.
• AutoCal
The AutoCal values are those that come up during the auto
calibration procedure. They are default values that may be
changed if the gas concentration in the calibration cylinder is
different.
•Factor
This value is the Relative Response Factor for the PID
channel. The factor for each pre-defined gas is factory
defined. The factor for the user defined gas must be obt ained
Detail Settings Button • 9 5
Page 100

from Table 5 on page 102 or through testing as described in
“Obtaining a Relative Response Factor” on p ag e 101. A valid
character for the Factor is a value between 0.01 and 25.00.
There are limitations for the fu ll scale and increment values that
depend on the factor for both the high range and the low range.
Table 2 and Table 3 below list these limitations.
Table 2: High Range PID
Factor
Full Scale
(ppm)
Increment
0.25-0.36 1000 1
0.37-0.49 1500 1
0.50-0.61 2000 1
0.62-0.74 2500 1
0.75-0.99 3000 2
1.00-1.24 4000 2
1.25-2.49 5000 2
2.50-3.74 10000 10
3.75-4.99 15000 10
5.00-7.49 20000 10
7.50-9.99 30000 20
10.00-
12.49
12.50 50000 2500
Factor
0.20-0.29 10.00 0.01
0.30-0.39 15.00 0.01
0.40-0.49 20.00 0.01
96 • Detail Settings Button
40000 20
Table 3: Low Range PID
Full Scale
(ppm)
Increment
 Loading...