

Page 1

TECHNICAL NOTES
Sound Level Meter
NL-42 / NL-52
3-20-41 Higashimotomachi, Kokubunji, Tokyo 185-8533, Japan
http://www.rion.co.jp/english/
Page 2

Page 3

Organization of the NL-42/NL-52 documentation
Documentation for the Sound Level Meter NL-42/NL-52 comes in three
parts, as listed below.
Instruction Manual
Describes operating procedures for the Sound Level Meter NL-42/NL-52,
connection and use of peripheral equipment such as a level recorder and
printer, and use of the memory card.
Serial Interface Manual
Describes communication with a computer, using the serial interface built
into the Sound Level Meter NL-42/NL-52. The manual covers the com-
munication protocol, use of control commands for the sound level meter,
format of data output by the sound level meter, and other topics.
Technical Notes (this document)
This document provides in-depth information about sound level meter
performance, microphone construction and characteristics, in uence of
extension cables and windscreen on the measurement, and other topics.
* Company names and product names mentioned in this manual are usually
trademarks or registered trademarks of their respective owners.
i
Page 4

Contents
Organization of the NL-42/NL-52 documentation .......................... i
Microphone .....................................................................................1
Construction and operation principle .........................................1
Thermal characteristics ..............................................................2
Humidity characteristics ............................................................3
Speci cations of microphone UC-59 ..........................................4
Speci cations of microphone UC-52 ..........................................5
Preampli er ....................................................................................6
Preampli er Requirement ..........................................................6
Preampli er Speci cations .......................................................6
In uence of Microphone Extension Cable .......................................7
Frequency Weighting Network ........................................................8
RMS Detection Circuit and Time Weighting ...................................9
Measurement Functions ................................................................12
(equivalent continuous sound level) .................................12
L
Aeq
LAE (Sound exposure level) .....................................................13
LN (percentile sound level) ...................................................... 14
L
, L
(maximum and minimum sound level) ...................14
min
(takt-max sound level) ....................................................15
(peak sound level) ..........................................................15
L
L
max
Atm5
peak
In uence of Background Noise .....................................................16
Description for IEC 61672-1 .......................................................... 17
IEC 61672-1 (JIS C 1509-1) frequency response ......................27
Reference incidence direction and reference point position ......28
Frequency response ................................................................29
In uence of body re ection ....................................................30
Acoustical in uence of operator ..............................................31
Reduction of wind noise by windscreen .................................. 32
Effect of All-Weather Windscreen WS-15 ...............................34
Effect of Rain-protection Windscreen WS-16 .........................35
ii
Page 5

The greatest susceptibility con guration for
radio frequency elds ...............................................................36
Statement of conforming to the basic statement ......................36
Adjustment data for sound calibrator .......................................37
The lower and upper limits of the linear operating range .........38
Directional Characteristics ......................................................39
Random incidence response .....................................................43
iii
Page 6

iv
Page 7
Microphone
Measurements of sound pressure level can be carried out with a variety of
microphone types. The sound level meter NL-52 employs the prepolarized
condenser microphone UC-59 (NL-42 employs UC-52) that is compact and
delivers stable and reliable response.
Construction and operation principle
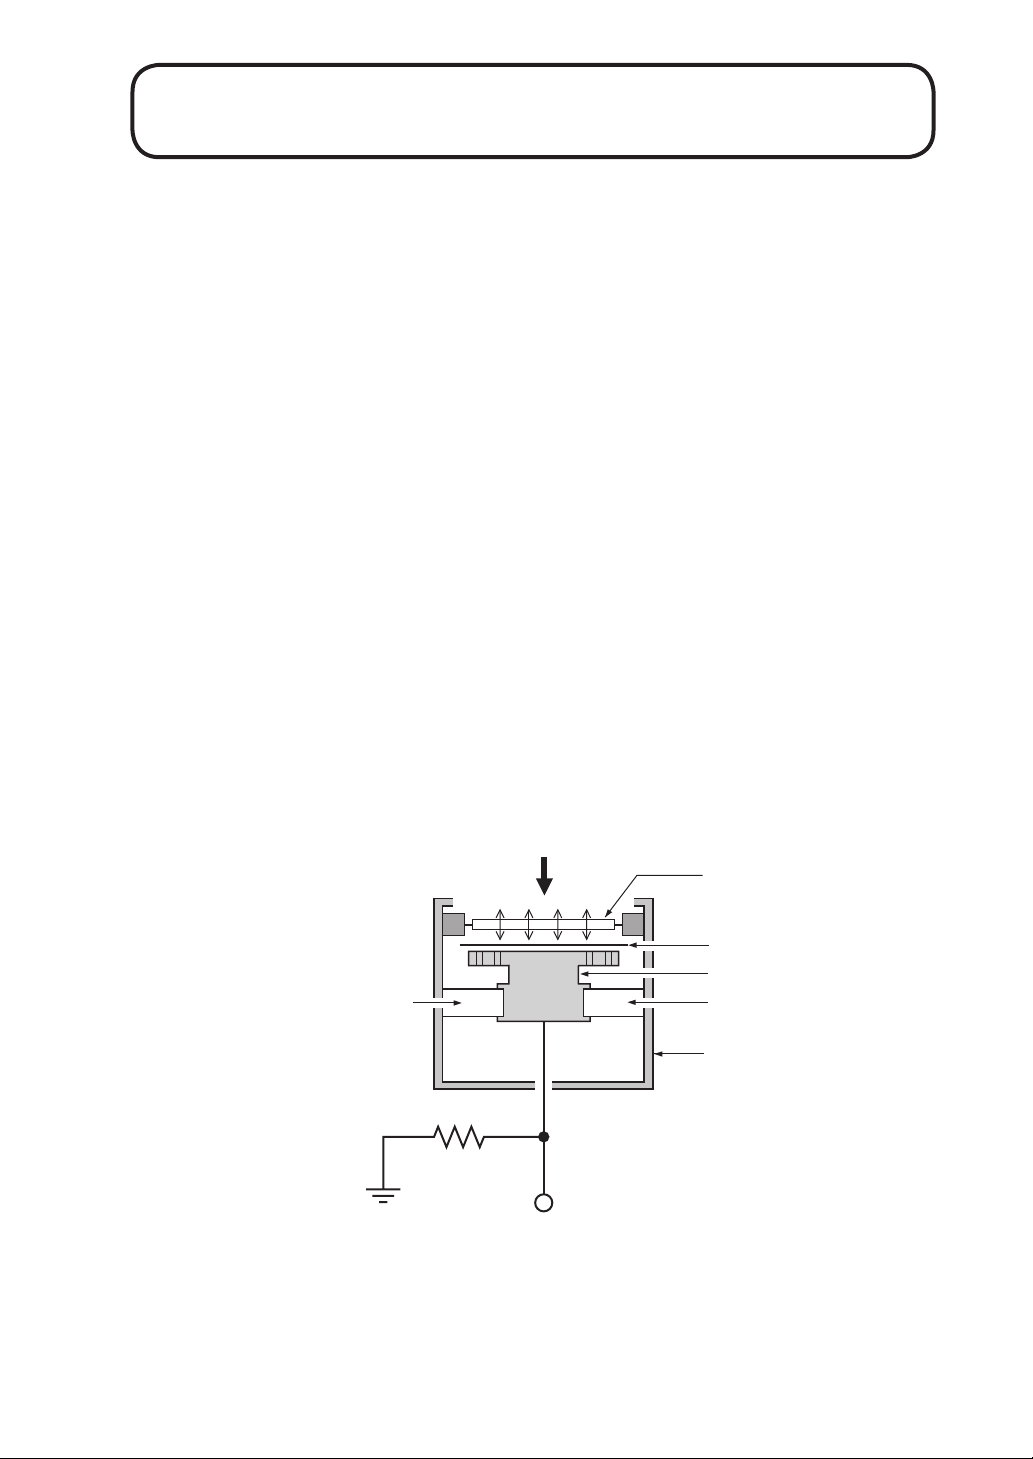
As shown in the illustration below, an electret condenser microphone normally
consists of ve main parts, namely the diaphragm, lm, backplate, insulator,
and case. A lm with an electrical charge is normally mounted to the back-
plate. When sound pressure is applied to the diaphragm, the distance between
the diaphragm and the backplate changes, thereby altering the capacitance.
Using a load resistor, this change can be turned into a voltage change. The
frequency response as well as the temperature and humidity characteristics
of an prepolarized condenser microphone depend considerably on the type
and properties of the materials used. The high frequency range is determined
by the resonance frequency of the diaphragm assembly.
Sound pressure
Diaphragm
Film
Backplate
Insulator
Load resistance
Output
Construction of prepolarized condenser microphone
Insulator
Case
1
Page 8
Microphone
Thermal characteristics
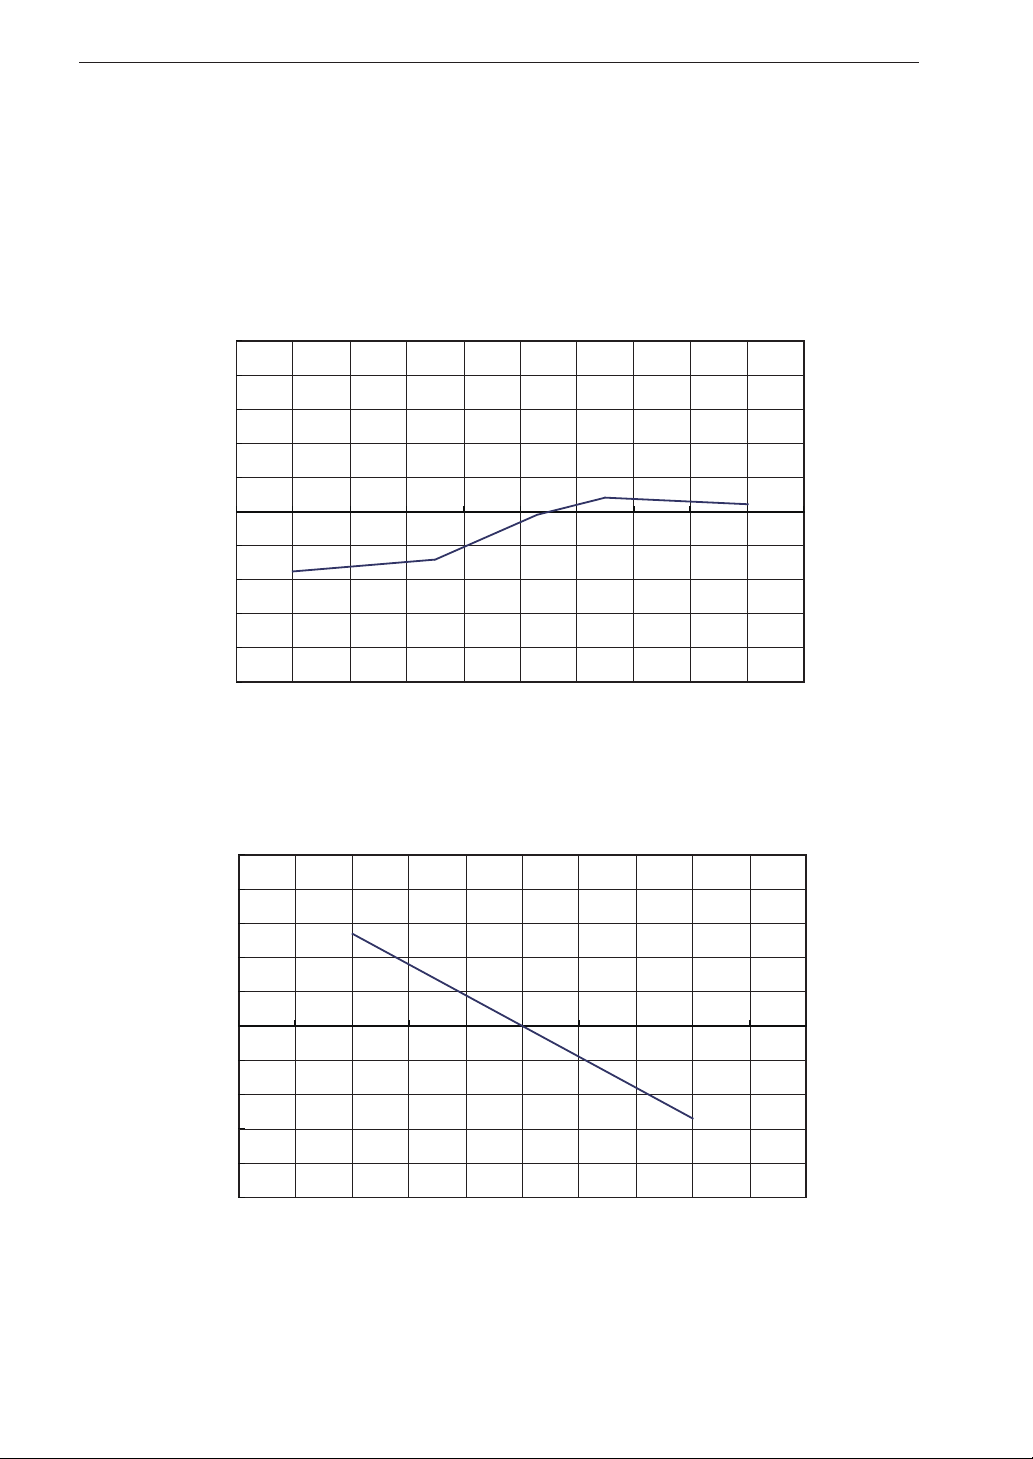
The thermal characteristics of a microphone indicate how sensitivity changes
at various temperatures. The diagrams below show the thermal characteristics
of the microphone UC-59 and UC-52.
0.5
0.4
0.3
0.2
0.1
0
-0.1
Response (dB)
-0.2
-0.3
-0.4
-0.5
-30 -20 -10 0 10 20 30 40 50 60 70
Temperature (°C)
Thermal characteristics of UC-59 (at 250 Hz)
0.5
0.4
0.3
0.2
0.1
0
-0.1
Response (dB)
-0.2
-0.3
-0.4
-0.5
-30 -20 -10 0 10 20 30 40 50 60 70
Temperature (°C)
Thermal characteristics of UC-52 (at 250 Hz)
2
Page 9
Humidity characteristics
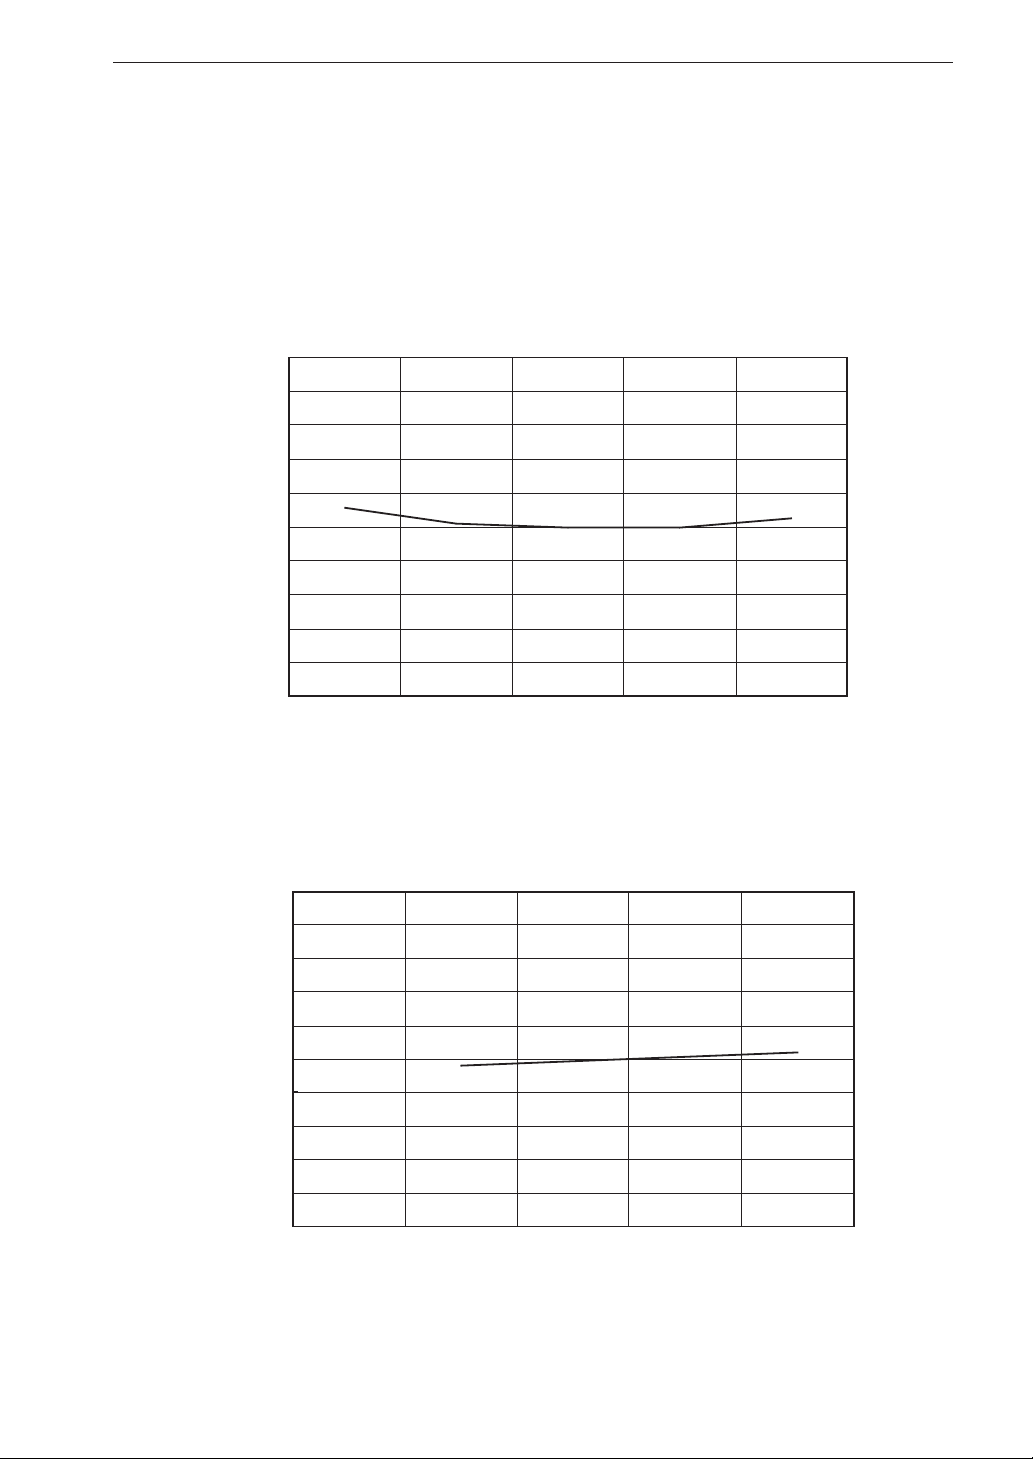
The humidity characteristics of a microphone indicate how sensitivity changes
at various humidity levels. The diagrams below show the microphone UC-59
and UC-52.
0.5
0.4
0.3
0.2
0.1
0
-0.1
Response (dB)
-0.2
Microphone
-0.3
-0.4
-0.5
020406080100
Relative humidity (%)
Humidity characteristics of UC-59 (at 250 Hz)
0.5
0.4
0.3
0.2
0.1
0
-0.1
Response (dB)
-0.2
-0.3
-0.4
-0.5
0 20 40 60 80 100
Relative humidity (%)
Humidity characteristics of UC-52 (at 250 Hz)
3
Page 10

Microphone
Speci cations of microphone UC-59
Model: UC-59
Nominal diameter: 1/2 inch
Sensitivity: -27 dB ±2 dB (re. 1 V/Pa)*
Frequency response: 10 to 20000 Hz
Capacitance: 13 pF ±1.5 pF
Temperature dependent sensitivity level uctuation:
±0.35 dB max. from -10 to +50ºC
referenced to 23ºC (at 1 kHz)
±0.5 dB max. from -20 to +60ºC
referenced to 23ºC (at 1 kHz)
Humidity dependent sensitivity level uctuation:
±0.14 dB max. referenced to 23ºC, 50%RH
90%RH max.
(at 1 kHz no condensation)
Ambient temperature/humidity range for operation:
-20 to +60ºC, 90%RH max.
(no condensation)
Ambient temperature range for storage:
-20 to +60ºC
Dimensions, weight: 13.2 dia × approx. 14.3 mm, approx. 4.7 g
*Reference environment conditions:
Temperature: 23ºC, Humidity: 50%RH
Atmospheric pressure: 101.325 kPa
4
Page 11

Speci cations of microphone UC-52
Model: UC-52
Nominal diameter: 1/2 inch
Sensitivity: -33 dB (re. 1 V/Pa)*
Frequency response: 20 to 8000 Hz
Capacitance: 19 pF
Diaphragm type: Titan alloy lm
Temper a tu re co e f cient: -0.008 dB / ºC (at 250 Hz)
Humidity-dependent sensitivity change:
0.1 dB or less
(at 250 Hz, 95%RH or below, no condensation)
Dimensions, weight: 13.2 dia. × 12 mm, 5.4 g
*Reference environment conditions:
Microphone
Temperature: 23ºC, Humidity: 50%RH
Atmospheric pressure: 101.325 kPa
5
Page 12
Preampli er
Preampli er Requirement
Since the condenser microphone is a small-capacity transducer, it has high
impedance, especially at low frequencies. Therefore a very high load resis-
tance is required to ensure uniform response extending to the low frequency
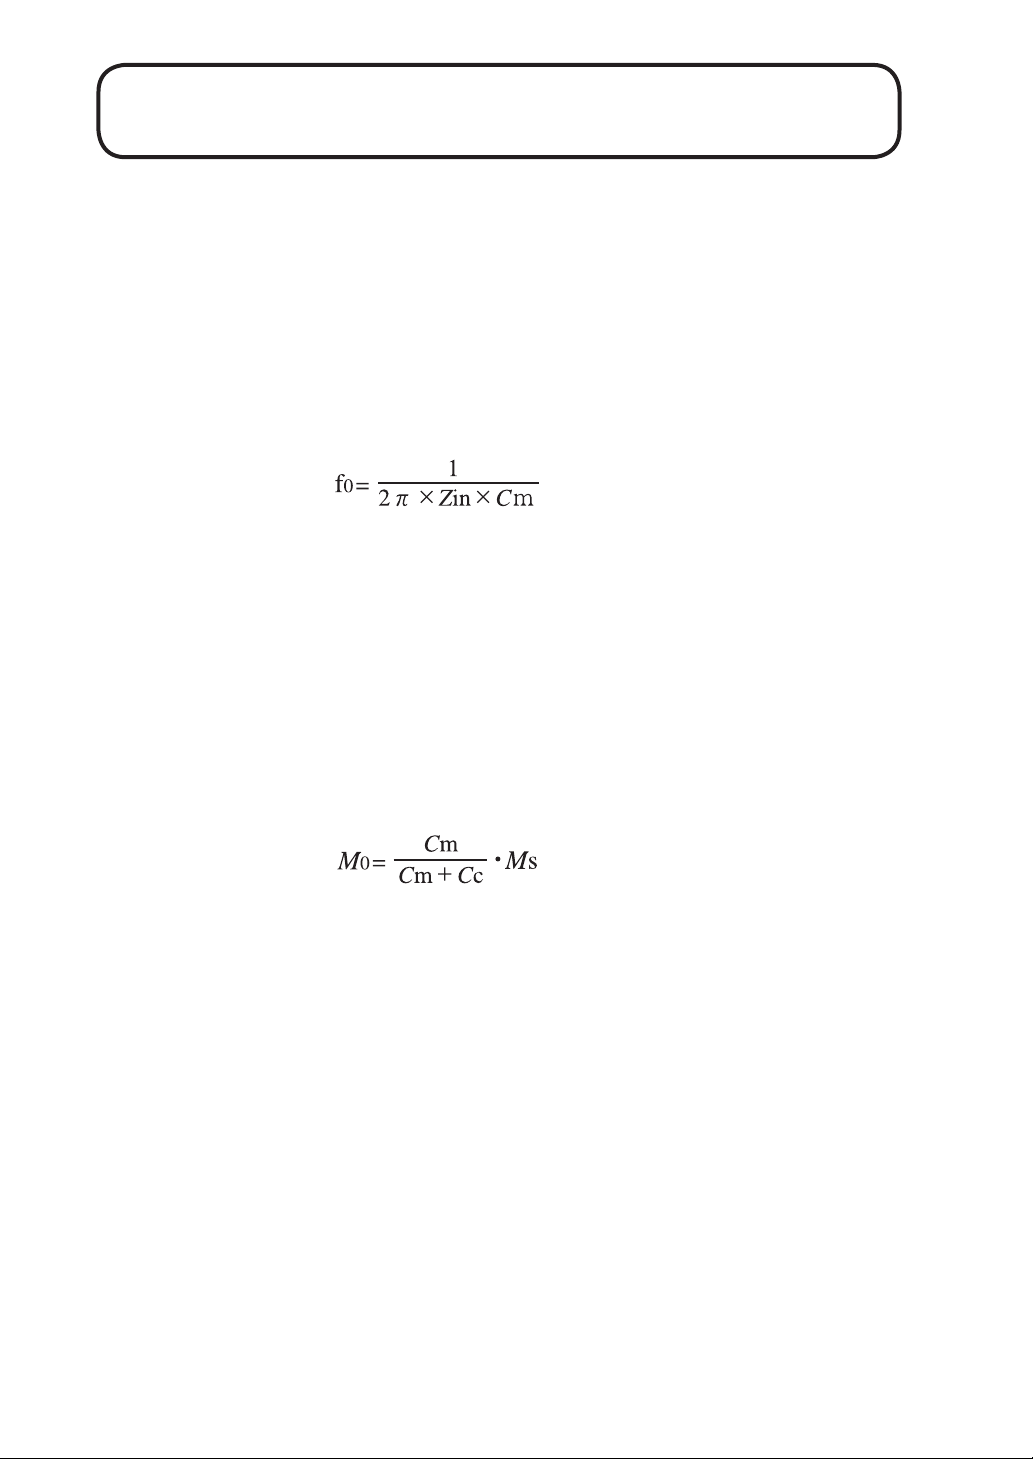
range. The relationship between the microphone capacitance and the low-
range cutoff frequency can be expressed as follows.
f
0: Low-range cutoff frequency (Hz)
Zin: Preampli er input impedance (Ω)
Cm: Capacitance of condenser microphone (F)
If the output of the microphone were directly routed through a long shielded
cable, the capacitance between the cable conductors would cause a sharp
drop in sensitivity, as is evident from the following equation.
M0: Output voltage into directly connected shielded cable (V)
Ms: Output voltage in microphone open condition (V)
Cc: Cable capacitance of shielded cable (F)
For the above reasons, a preampli er of high input impedance is connected
directly after the microphone, to provide a low-impedance output signal.
Preampli er Speci cations
Model name: NH-24 (NL-42) NH-25 (NL-52)
Input impedance: Approx. 3 GΩ // 9 pF Approx. 3 GΩ // 27 pF
Output resistance: Approx. 50 Ω Approx. 50 Ω
6
Page 13
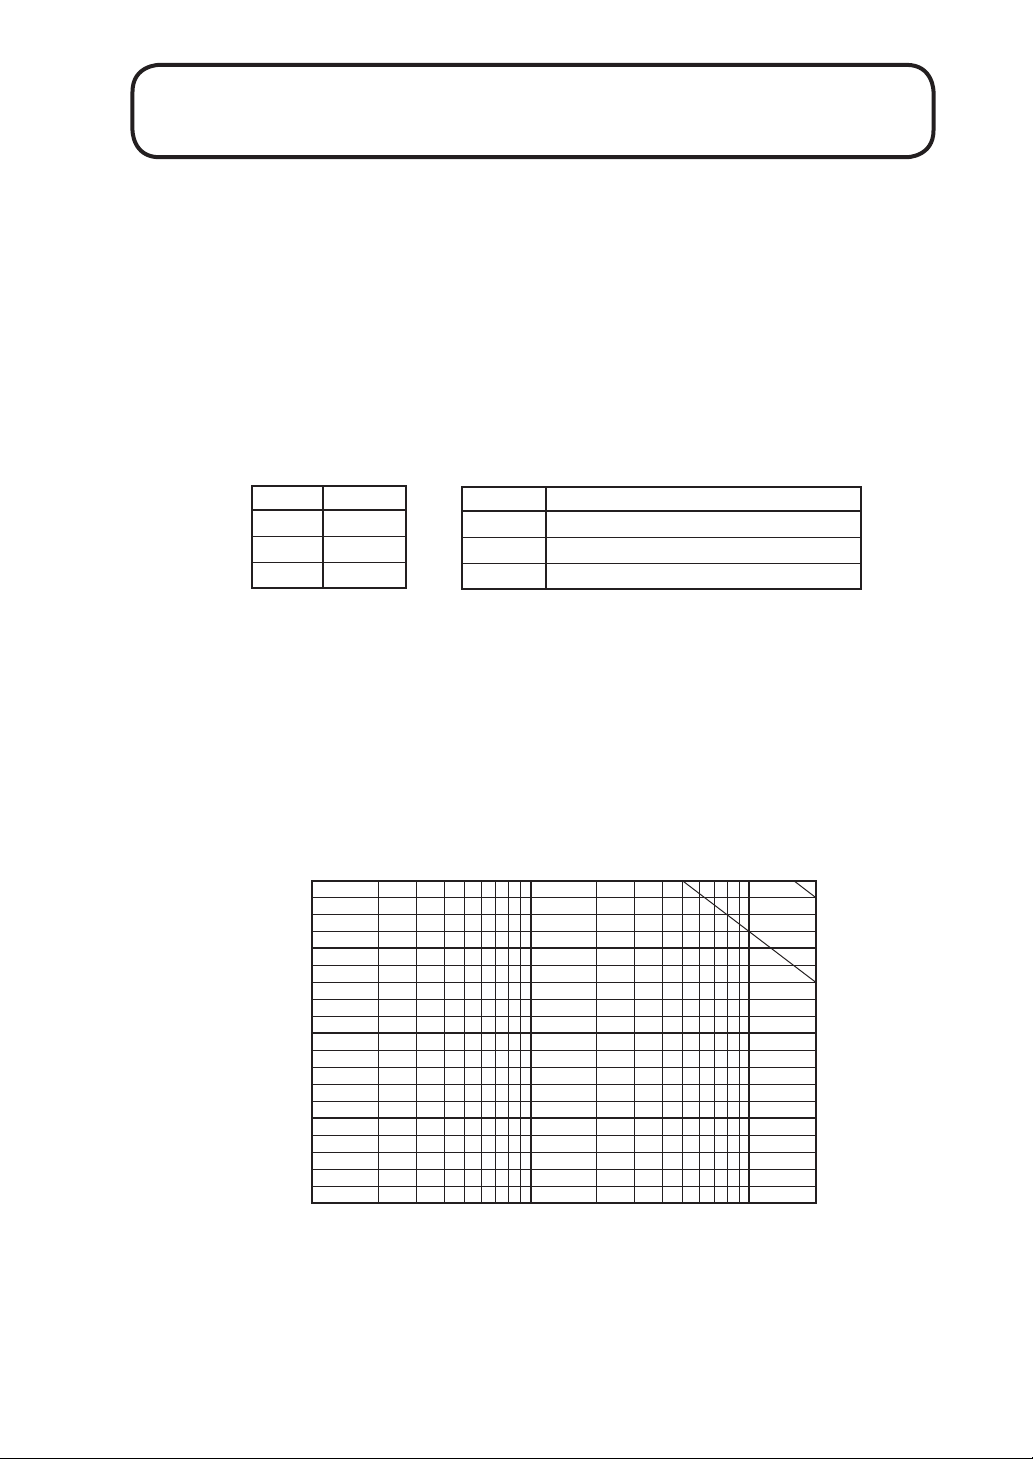
In uence of Microphone Extension Cable
When the output of the microphone/preampli er is routed through an exten-
sion cable, certain limitations regarding measurable sound pressure level and
frequency range will apply. This is due to the in uence of the cable capaci-
tance. The longer the cable, the lower the measurable sound pressure level
and the lower the frequency limit.
Available cables are listed in the table below. Combining multiple cables is
also possible.
Model
EC-04
EC-04A
EC-04B
Length
2m
5m
10 m
Extension cable EC-04 series
Model
EC-04C
EC-04D
EC-04E
30m(
50m(reel)+5 m (connection cable)
100m(reel)+5 m (connection cable)
Length
reel)+5 m (connection cable)
The diagram below shows the relationship among cable length, measurable
sound pressure level, and frequency.
If for example a sound pressure level of 132 dB is to be measured up to 10
kHz, an extension cable length of up to 500 meters can be used.
Cable length
138
400 m
130
500 m
120
110
Measurable sound pressure level (dB SPL)
100
100 200 500 1 k 2 k 5 k 10 k 20k
Frequency (Hz)
7
Page 14
Frequency Weighting Network
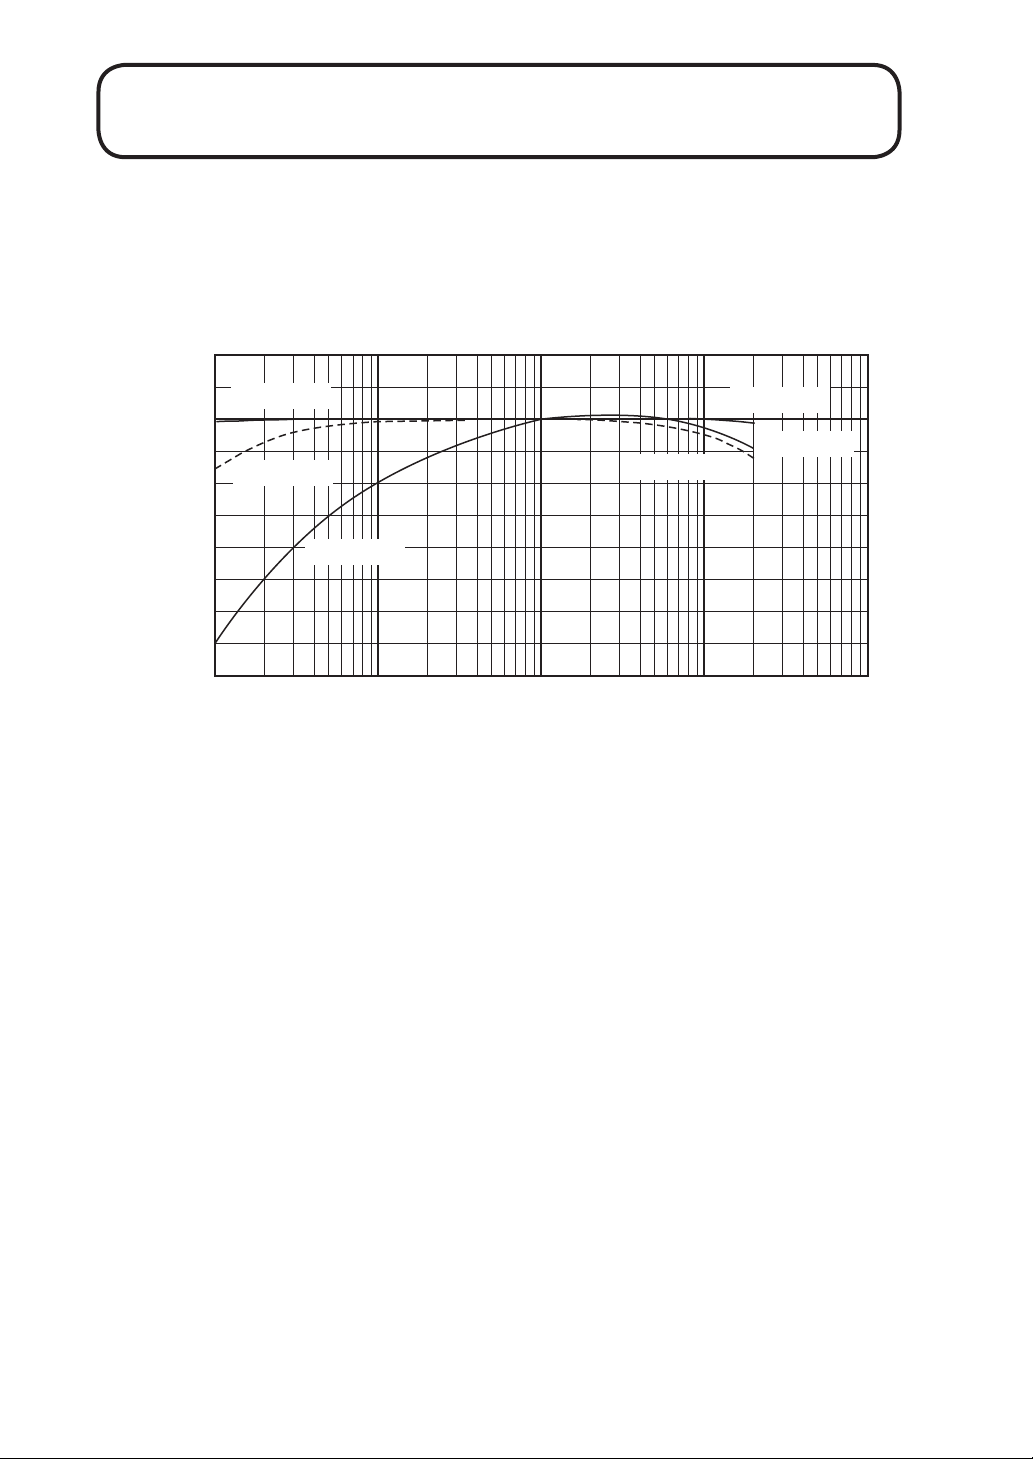
The NL-42/NL-52 provides frequency weightings A, C and Z. The electri-
cal characteristics of the weighting network at AC output connector are as
shown below.
10
Z weighting
0
-10
C weighting
A weighting
10 20 50 100 200 500 1 k 2 k 5 k 10 k 20 k 50 k
Frequency (Hz)
Response (dB)
-20
-30
-40
-50
-60
-70
C weighting
Z weighting
A weighting
Frequency weighting
The volume impression (loudness) of a sound depends not only on the sound
pressure level, but also on the frequency. At high or low frequencies, a sound
is felt to be less loud than a sound of equal level in the midrange. The fre-
quency weighting A compensates for this effect and produces measurement
results which are close to the actual impression of loudness. For this reason,
this type of frequency weighting is widely used for purposes such as sound
level evaluation.
With the frequency weighting Z, frequency response is linear, which is suit-
able for sound pressure level measurements and for using the sound level
meter output for frequency analysis.
The frequency weighting C curve produces almost at response, but with a
roll off below 31.5 Hz and above 8 kHz. This is suitable for sound pressure
level measurements in situations with unwanted low-frequency or high-fre-
quency components.
8
Page 15
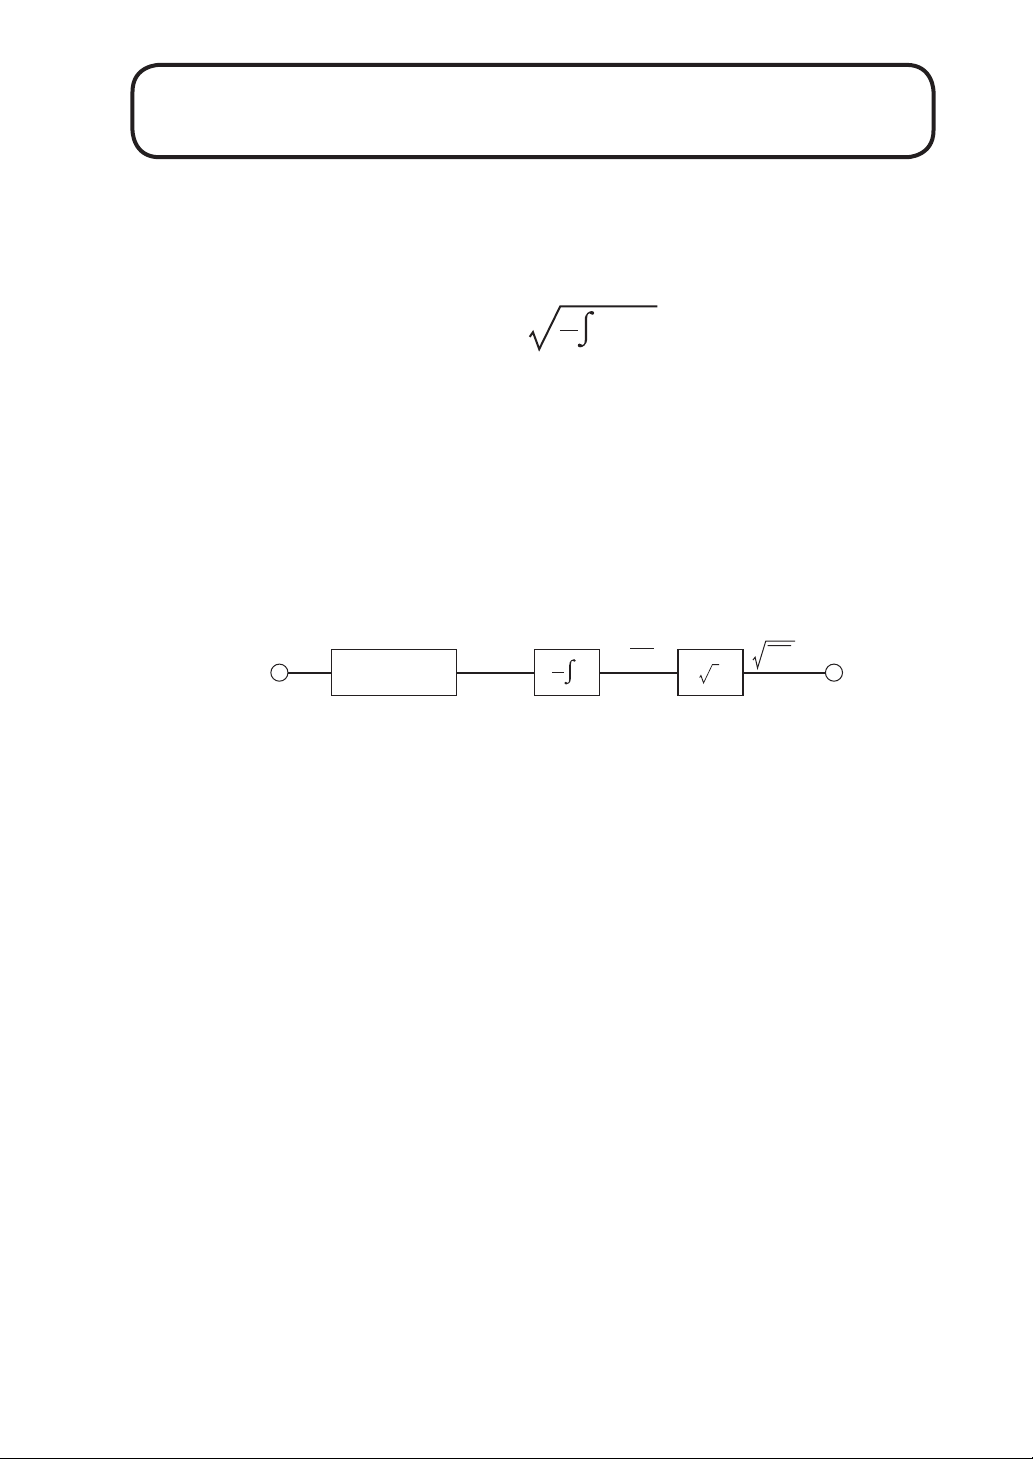
RMS Detection Circuit and Time Weighting
The sound level meter uses rms detection. The rms value E (rms) is de ned
by the following equation.
T
1
E(rms) =
The voltage e which changes over time is raised to the second power, and
integration for the time interval T is performed. The result is divided by T
and the square root is extracted. The circuit con guration for performing the
above mathematical operation looks as follows.
The NL-42/NL-52 uses digital processing to determine the rms value.
e2dt
T
0
ei
Input Voltage
Second power
2
ei
T
1
T
0
2
ei
E(rms)
2
ei
Output Voltage
9
Page 16

RMS Detection Circuit and Time Weighting
During sound level measurements, the level often uctuates drastically,
which would make it dif cult to evaluate readings if some kind of averaging
is not applied. Sound level meters therefore provide the capability for index
weighting (index averaging) using the rms circuit. The parameters of this
weighting process are called the time weightings, determined by the time
constant (see next page).
Sound level meters usually have a F (Fast) and S (Slow) setting for the time
weighting. The time range that is considered for averaging is narrow in the
F (Fast) setting and wide in the S (Slow) setting. In the F (Fast) setting, the
instantaneous level has a larger bearing on the displayed value than in the S
(Slow) setting. From the point of view of the measurement objective, the F
(Fast) setting is more suitable to situations wit h swiftly cha nging sound level,
whereas the S (Slow) setting yields a more broadly averaged picture.
The F (Fast) setting is more commonly used, and sound pressure level values
given without other indication are usually made with F (Fast) characteris-
tics.
The S (Slow) setting is suitable for measuring the average of sound with
fairly constant levels. For example, in Japan aircraft noise and high-speed
train noise is usually transient noise with high uctuation, but the S (Slow)
setting is used to determine the maximum level for each noise event.
The I (Impulse) setting enables the meter to track noise bursts of very
short duration. (When optional Extended Function Program NX-42EX is
installed.)
10
Page 17
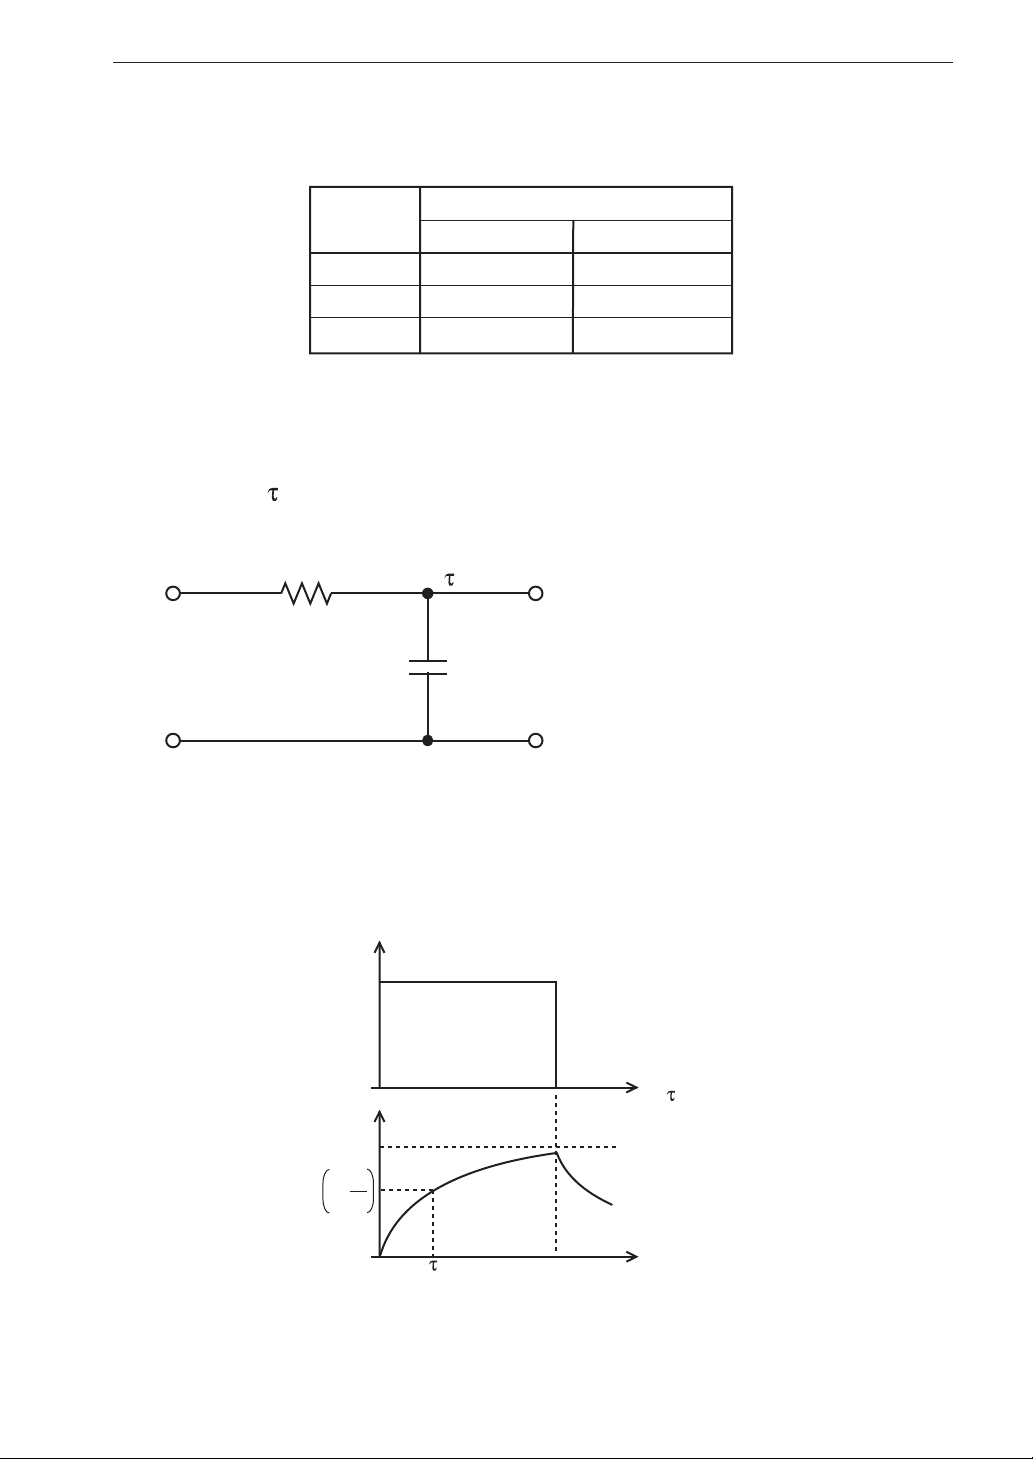
Time weightings and time constant
RMS Detection Circuit and Time Weighting
1s
35 msec
Time constant
Decay time
125 msec
1s
1.5 sec
Time
Weighting
F (Fast)
S (Slow)
I (Impulse)
Rise time
125 msec
The time weighting network of the sound level meter performs index averaging
on the square of the sound pressure signal. The equivalent circuit is shown
below. is the time constant, which equals CR.
R
e
i
Equivalent electrical circuit
C
=CR
ei: Input voltage (proportional to square
e
o
of sound pressure)
eo: Output voltage
The response of the index averaging circuit to a single burst signal is shown
below.
e1: Burst signal voltage
e : Logarithm base
: Time constant
t : Time
t
11
e1
1-
rms amplitude
Signal amplitude
e1
1
e
Burst signal response
Page 18
Measurement Functions
L
L
L
(equivalent continuous sound level)
Aeq
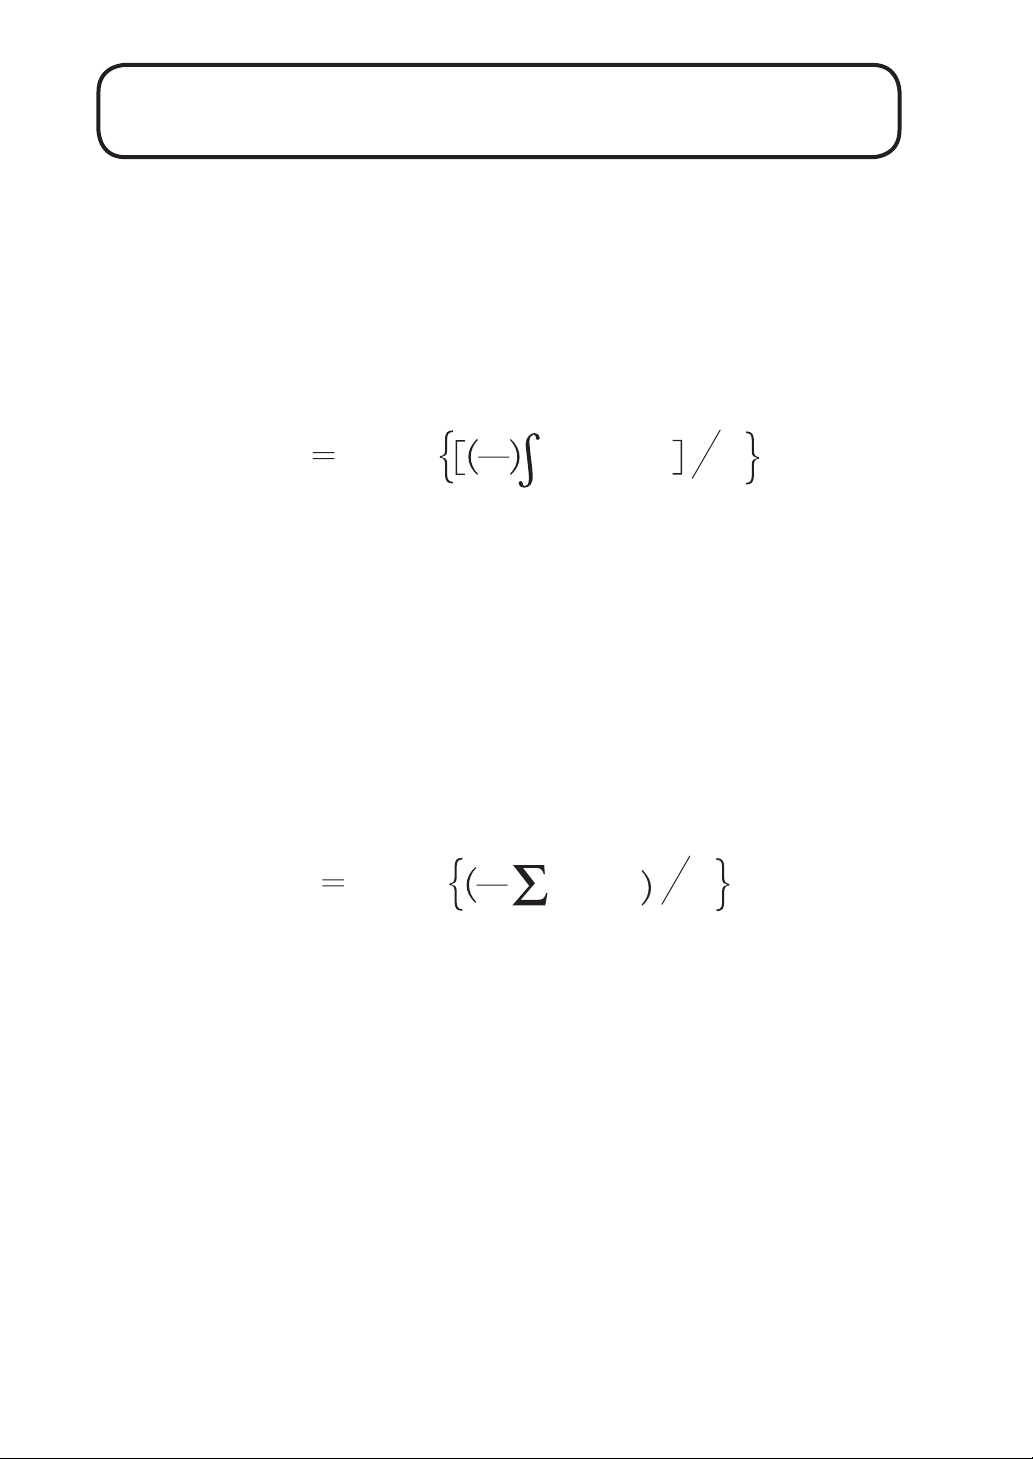
For a sound pressure level signal that changes over time, the L
continuous sound level) is a hypothetical constant sound pressure level that
has the same energy as the actually measured signal in the measurement
interval. It is determined by the following equation.
t2
AeqT
t: Time variable of integration from an arbitrary start time at t
the end of the interval at t2
T: Time interval T = t2 - t1
pA(t): A-weighted instantaneous sound pressure at running time t
p0: Reference sound pressure (20 μPa)
In sound pressure level meter NL-42/NL-52, the digital processing to deter-
mine L
is carried out according to the following equation.
Aeq
20 log
10
1
T
2
p
(t )
A
t1
dt
½
p
Aeq
0
(equivalent
1 to
12
N
2
p
A
Aeq
N: Number of samples
In NL-42/NL-52, the sampling interval is 20.8 μs (48000 samples per sec-
ond).
20 log
10
N
1
i=1
(i )
½
p
0
Page 19
LAE (Sound exposure level)
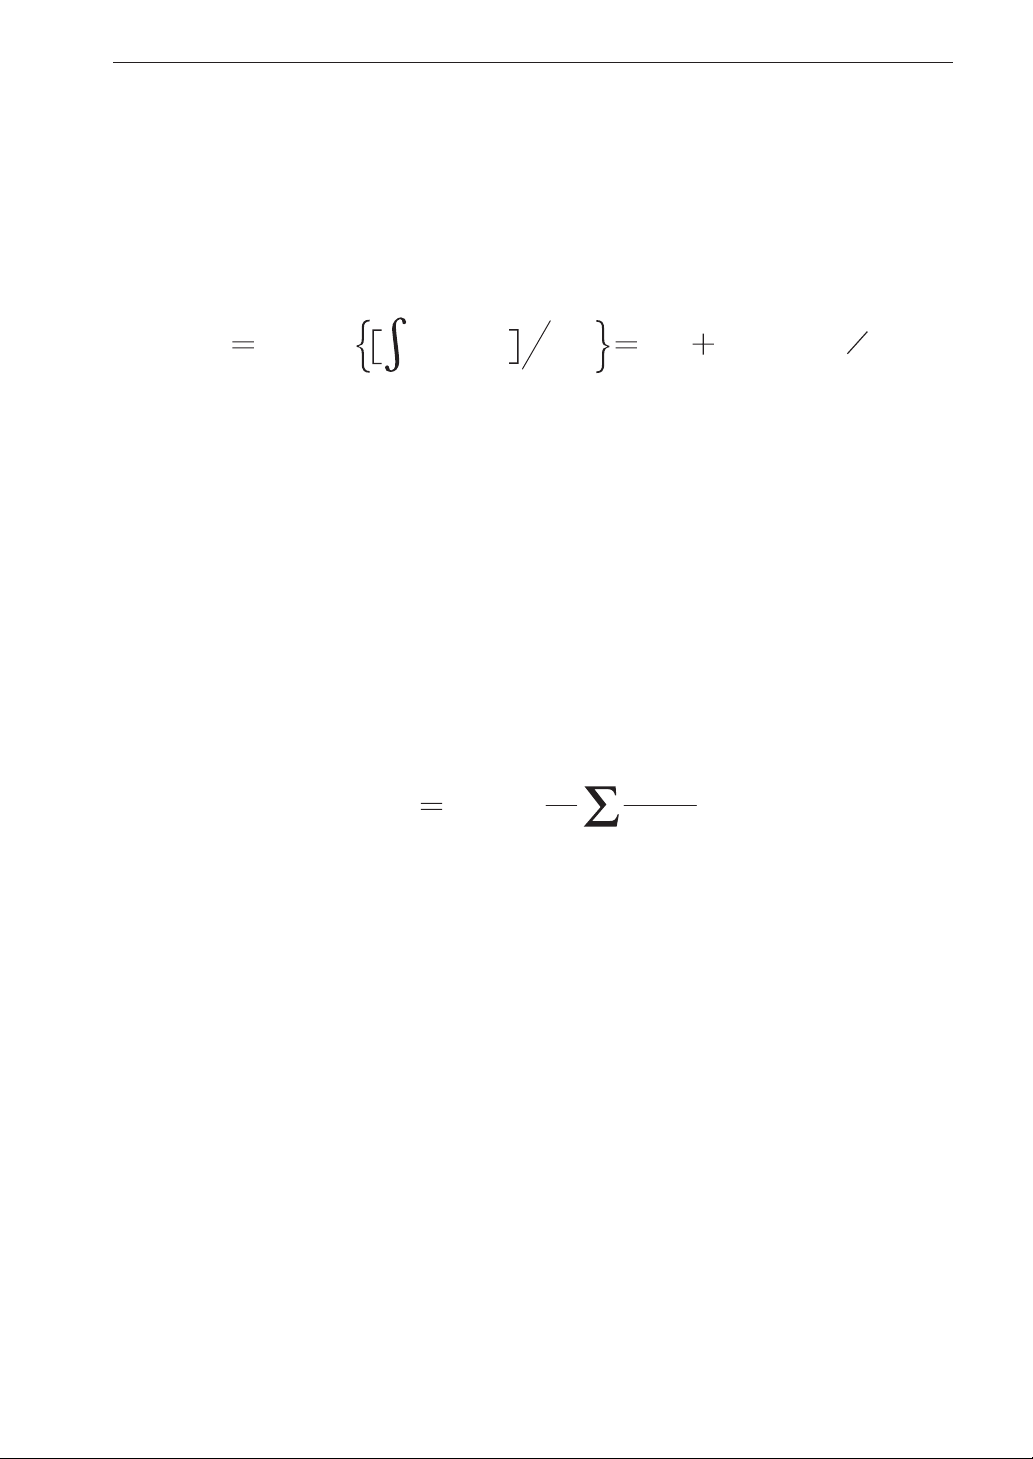
The LAE (sound exposure level) is a hypothetical constant 1-second sound
pressure level having the same energy as a single-event sound pressure level
measured with A weighting. It is determined by the following equation.
2
t
2
L
10 log
AE
10
t: Time variable of integration from an arbitrary start time at t1 to
the end of the interval at t2
T: Time interval T = t2 - t1
T0: Reference time (1 second)
pA(t): A-weighted instantaneous sound pressure at running time t
p0: Reference sound pressure (20 μPa)
p
(t )
dt
A
t1
Measurement Functions
2
p
T
0
L
0
Aeq
10 log
(TT0)
10
In NL-42/NL-52, the digital processing to determined L
is carried out
AE
according to the following equation.
2
N
p
L
0: Number of samples per second
N
AE
10 log
10
N0
1
i=1
(i )
A
2
p
0
In NL-42/NL-52, the sampling interval is 20.8 μs (48000 samples per sec-
ond).
13
Page 20

Measurement Functions
LN (percentile sound level)
The LN (percentile sound level) is the sound level which was N percent or
more of the measurement time. The NL-42/NL-52 allows the user to select
L
ve values for N (from 1 to 99, in 1 steps). The sampling interval for L
processing is 100 ms (10 samples per second) or L
max
, L
L
(maximum and minimum sound level)
min
is the maximum sound level and L
max
the minimum sound level encoun-
min
eq, 1s
.
tered during a measurement.
In NL-42 / NL-52, t he sampling i nterva l is 20.8 μs (4800 0 samples per second).
The maximum and minimum values since the start of the measurement are
stored. Therefore the L
max
and L
readings up to the current point can be
min
displayed already during measurement.
N
14
Page 21

Measurement Functions
N
L
Atm5
(takt-max sound level)
For the duration of the measurement, the maximum level within a 5-second
interval is sampled and the power average is determined. L
according to the following equation.
N
L
Atm
: Maximum level within interval (5 seconds)
L
m
N: Number of samples
The number of samples is determine according to the following equation.
For L
t1: Measurement start time
Atm5
:
10 log
t
(
2
5
1
10
N
i=1
t
)
1
Lm/10
10
is calculated
Atm
L
t2: Measurement end time
(peak sound level)
peak
The peak sound level is a maximum absolute value of frequency weighted
instantaneous sound pressure level during the measuring time.
15
Page 22
In uence of Background Noise
When measuring a certain sound in a certain location, all other sounds present
at that location except the measurement target sound are background noise
(also called ambient noise or dark noise). Since the sound level meter will
display the combination of target sound and background noise, the amount
of background noise must be taken into consideration when determining the
level of the target sound.
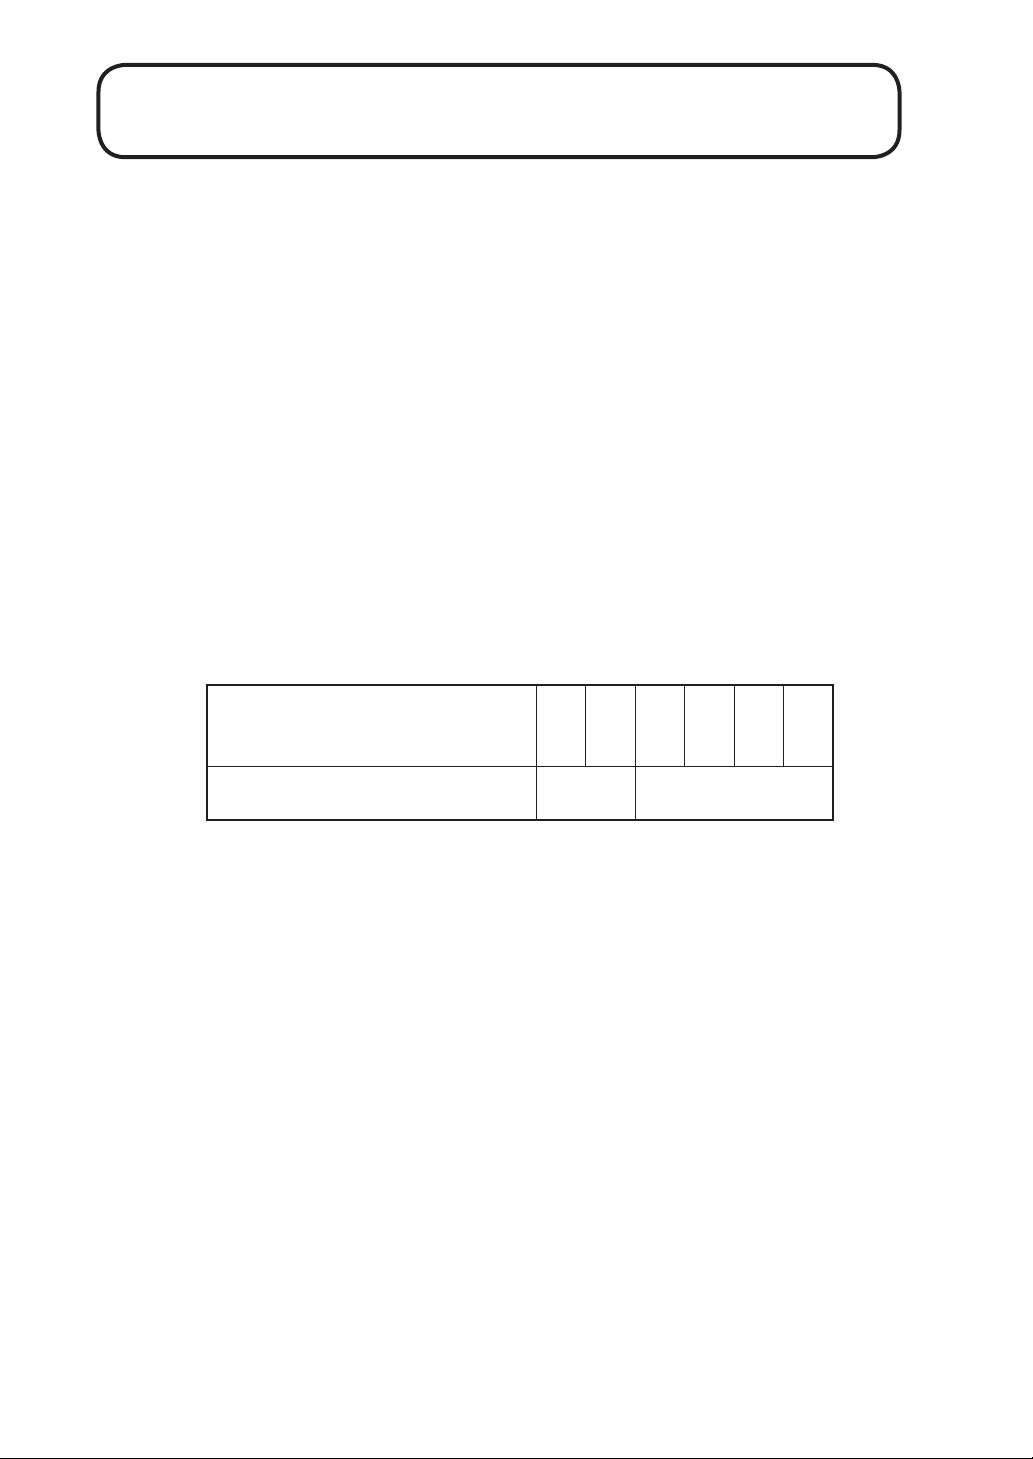
If the difference between the meter reading in absence of the target sound
and the reading with the target sound is 10 dB or more, the in uence of back-
ground noise is small and may be disregarded. If the difference is less than
10 dB, the values shown in the table below may be used for compensation,
to estimate the level of the target sound.
Background noise compensation
Display reading difference with
and without target sound (dB)
Compensation value (dB)
If for example the measured sound level when operating a machine is 70 dB,
and the background noise level when the machine is not operating is 63 dB,
the compensation value for the difference of 7 dB is -1 dB. Therefore the
sound level of the machine can be taken to be 70 dB + (-1 dB) = 69 dB.
The above principle for compensating the in uence of the background noise
assumes that both the background noise and the target sound are approxi-
mately constant. If the background noise uctuates, and especially if it is
close in level to the target sound, compensation is dif cult and will often be
meaningless.
456 789
-2 -1
16
Page 23
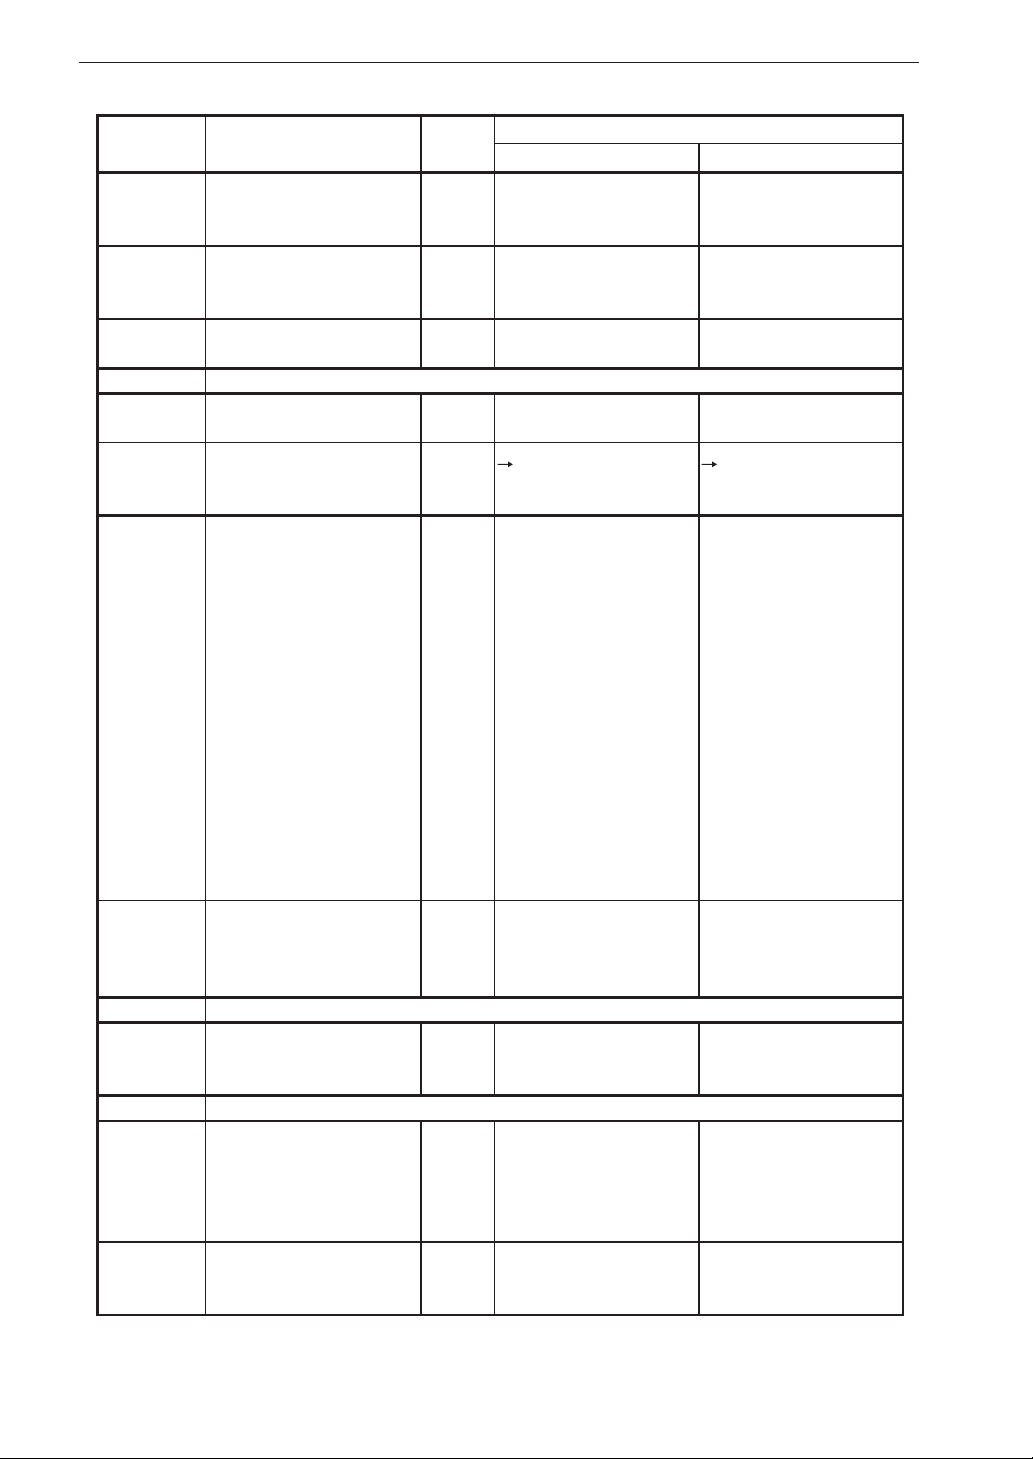
Description for IEC 61672-1
Standard
paragraph
4 Reference environmental
5Performance speci cations
5.1 General
5.1.4 Con guration & normal
5.1.6 Models of microphone
5.1.7 Mounting of microphone 9.2.1 b)
5.1.8 Identi cation of computer
5.1.10 Description of frequency
5.1.12 Description of level ranges
5.1.13 Reference SPL
5.1.14 Operating of the hold fa-
5.1.15 Dummy microphone: De-
Description
conditions
mode of operation
Appropriate procedures for
use the sound level meter
software
weightings that are provided
(@ A-weig hted SPL @
1 kHz )
Instruction manual of the
level range controls and
function.
Recommendation for selecting the optimum level
range.
reference level range,
reference orientation, reference position of microphone.
cility and the means for
clearing a display that is
held.
sign goal and tolerance
See
also
9.1 Ambient temperat ure:
9.2 .1 b) Con guration
9.2 .1 c)
9.2 .5 b)
9.2.2 c) A, C, Z A, C, Z
9.2 .2 h)
9.2 .5 c)
9.2 .5 a),
9.3 a),
b), c)
9.3 g) Capacitance of dummy
Remark
NL-52 NL-42
Ambient temperature:
23°C
Static pressure:
101.325 kPa
Relative humidity:50%
• NL-52
• WS-10
Controls and Functions,
Preparations
UC-59
Measurement
Controls and Functions,
Preparations
N/A N/A
25 dB to 138 dB
N/A
N/A
94 dB
N/A
Reference incidence
direction and reference
point position (Fig. 1)
Measurement Measurement
microphone: 13 pF
Tole r a n c e : ±1.5 pF
23°C
Static pressure:
101.325 kPa
Relative humidity:50%
Con guration
• NL- 42
• WS-10
Controls and Functions,
Preparations
UC-52
Measurement
Controls and Functions,
Preparations
25 dB to 138 dB
N/A
N/A
94 dB
N/A
Reference incidence
direction and reference
point position (Fig. 1)
Capacitance of dummy
microphone: 19 pF
Tole r a n c e : ±3 pF
17
Page 24
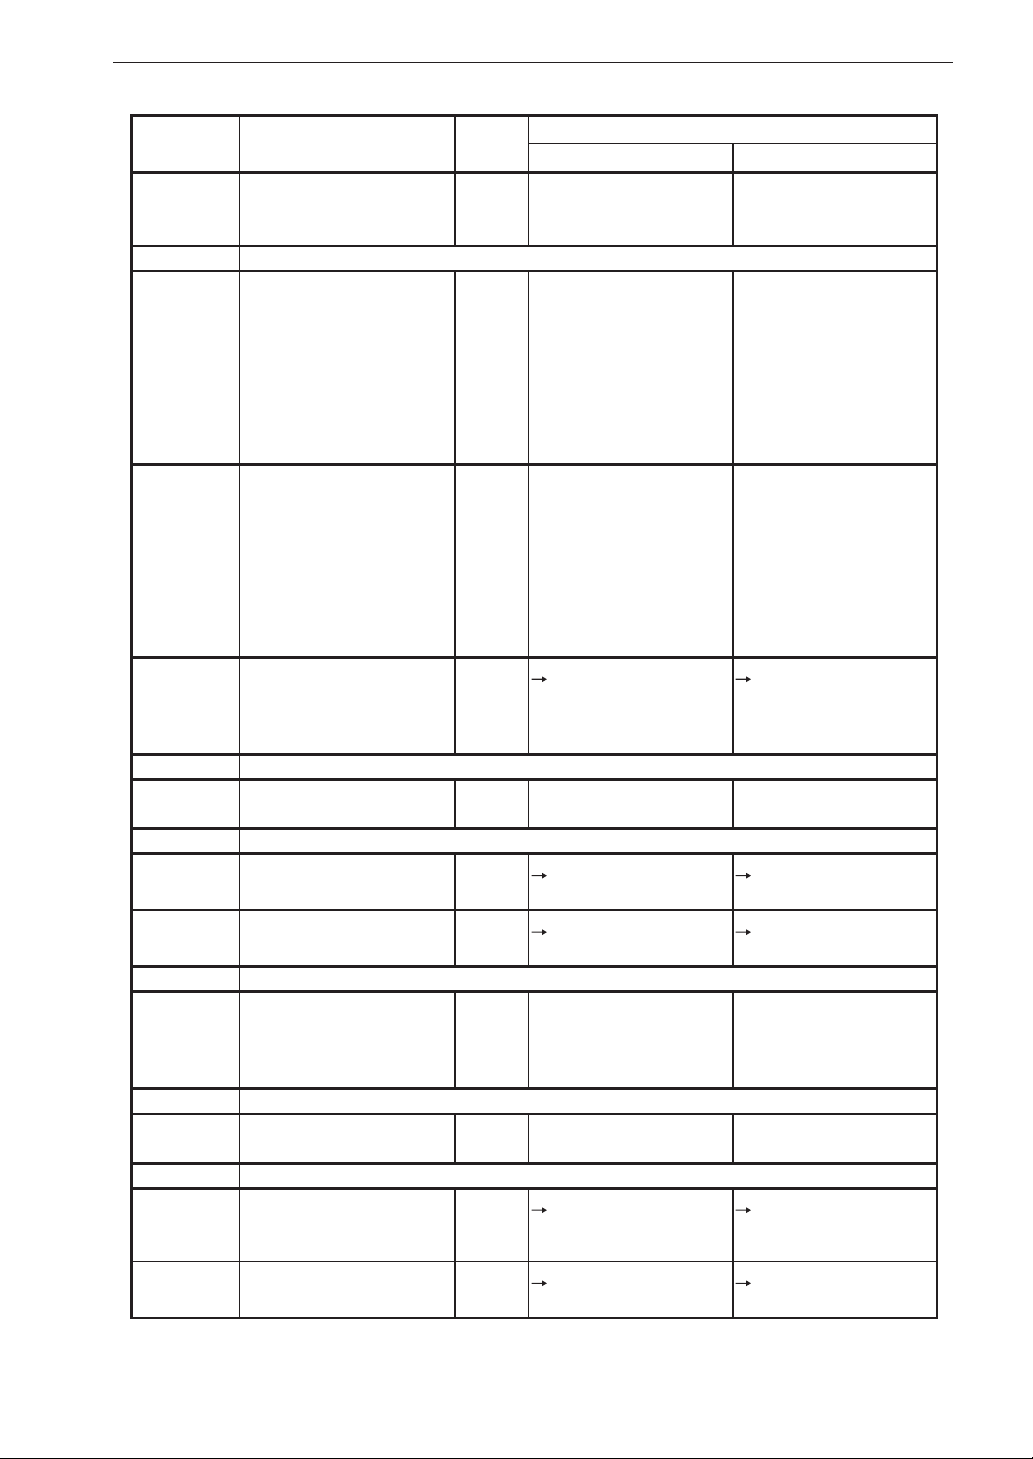
Description for IEC 61672-1
Standard
paragraph
5.1.16 Highest SPL and Peak-
5.1.17 Characteristics of each in-
5.1.18 Initial time interval after
5.2 Adjustment to indicated levels
5.2.1 Model of
5.2.3 Procedure for calibration
5.2.4
5.2.5
5.2.7 Adjustment data for sound
5.4 Frequency weightings
5.4.12 Frequency response & tol-
5.5 Level linearity
5.5.9 A, C and Z weighted levels
Description
Peak input voltage without
causing damage.
dependent channel to be
described
switching on power
sound calibrator(s)
& adjustment with sound
calibrator
Data for correction - with
and without windscreen
- for :
- Deviation of average frequency response to uniform frequency response.
- Case re ection and microphone diffraction
Including values for expanded uncertainties.
In 1/3 octave frequencies
for 63 Hz to 1 kHz and
1/12 octave frequencies
for 1 kHz to 16 kHz
calibrator or electrostatic
actuator (for A-weighted
sound levels)
erances of optional frequency responses
for the lower and upper
limit of the linear operating range.
See
also
9.3 i) 148 dB
9.2.5 e) Less than 90 seconds Less than 90 seconds
9.2.4 a) NC-74 (RION) NC-74 (RION)
9.2 .4 c)
9.2 .4 d)
9.2 .5 b)
9.3 d) Adjustment data for sound
9.2 .2 c) N/A N/A
9.3 e) The lower and upper lim-
Remark
NL-52 NL-42
150 dB
11 Vp-p
N/A N/A
Calibration Calibration
Frequency response of
the microphone UC-59
(Fig. 2)
Frequency response of
the NL-52/NL-42 (including the case re ection) (Fig. 4)
In uence of WS-10 on
acoustic performance of
NL-52/NL-42 (Fig. 10)
Frequency response with
windscreen correction
(WS-10) (Fig. 11)
Refer to IEC 61672-1 (JIS
C 1509-1) frequency response (Tab. 1)
calibrator (Tab. 3)
its of the linear operating
range (Tab. 4)
11 Vp-p
Frequency response of
the microphone UC-52
(Fig. 3)
Frequency response of
the NL-52/NL-42 (including the case re ection) (Fig. 4)
In uence of WS-10 on
acoustic performance of
NL-52/NL-42 (Fig. 10)
Frequency response with
windscreen correction
(WS-10) (Fig. 11)
Refer to IEC 61672-1 (JIS
C 1509-1) frequency response (Tab. 1)
Adjustment data for sound
calibrator (Tab. 3)
The lower and upper limits of the linear operating
range (Tab. 4)
5.5.10 Starting point for the level
linearity error
18
9.3 f) The lower and upper limits of the linear operating
range (Tab. 4)
The lower and upper limits of the linear operating
range (Tab. 4)
Page 25
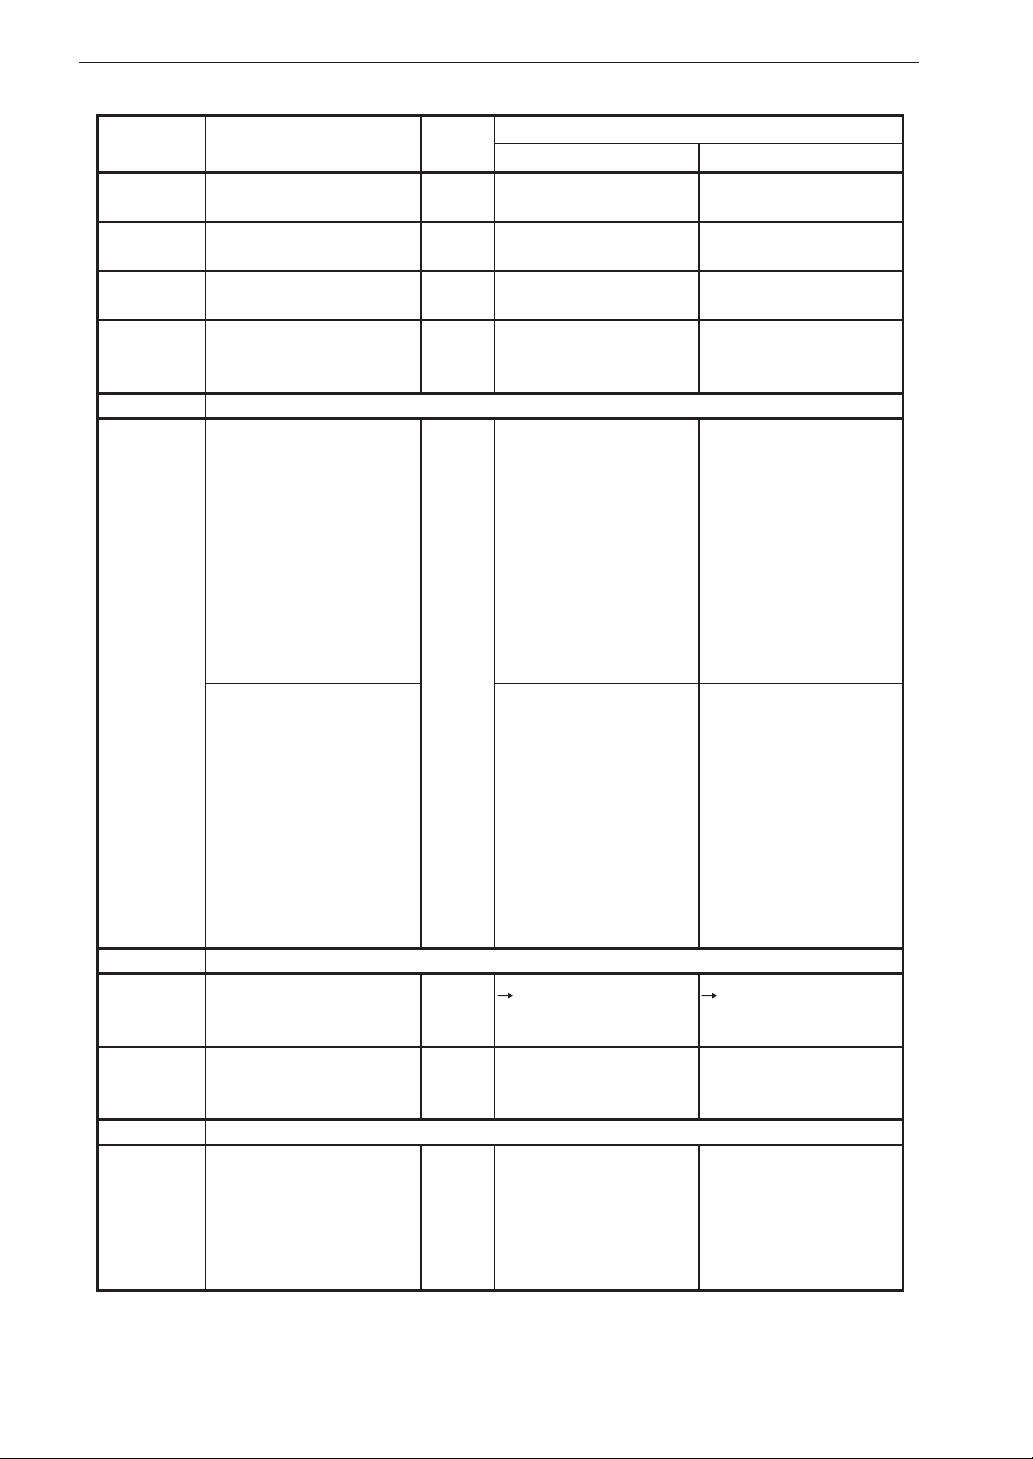
Description for IEC 61672-1
Standard
paragraph
5.5.11 How to test level linearity
5.6 Self generated noise
5.6.1 Self-noise at the more
5.6.3 Self-noise at the more sen-
5.6.5 Instruction to measure low
5.7 Time weighting F and S
5.7.1 Description of time weight-
5.10 - 5.11
5.10.1 Operation & interpretation
5.11.1 Operation & interpretation
5.12 Peak C sound level
5.12.1 Nominal range of L
5.14 Thresholds
5.14 Operation of user-select-
5.15 Display
5.15.2 Description of the indica-
5.15.3 Description of the dis-
Description
if display range < linearity range
sensitive ranges (including microphone)
sitive ranges with dummy
microphone
level sounds with consideration of influence of
self-noise
ings that are provided
Overload and Under-range indication
of overload indicators
of under-range indicators
at
Cpeak
for each level range
able thresholds
tion of displayed quantities
play
See
also
9.3 k) N/A N/A
9.2 .5 o)
9.3 h)
9.3 h) Dummy microphone (13
9.2 .5 d)
9.2.2 d) F(Fast), S(Slow) F(Fast), S(Slow)
9.2 .5 k)
9.2 .2 i) N/A
9.2 .5 l) N/A N/A
9.2 .2 g)
9.2 .2 g)
Maximum value
A: <17 dB
C: <25 dB
Z: <30 dB
Typica l va l u e
A: 13 dB
C: 20 dB
Z: 25 dB
pF)
Maximum value
Equal to 5.6.1
Typica l va l u e
A: 11 dB
C: 16 dB
Z: 21 dB
The lower and upper limits of the linear operating
range (Tab. 4)
NL-52 NL-42
In uence of back-
ground noise
Controls and Functions
Controls and Functions
Controls and Functions
Controls and Functions
Remark
Maximum value
A: <19 dB
C: <27 dB
Z: <32 dB
Typica l va l u e
A: 15 dB
C: 22 dB
Z: 27 dB
Dummy microphone (18
pF)
Maximum value
Equal to 5.6.1
Typica l va l u e
A: 13 dB
C: 18 dB
Z: 24 dB
In uence of back-
ground noise
Controls and Functions
Controls and Functions
N/A
The lower and upper limits of the linear operating
range (Tab. 4)
Controls and Functions
Controls and Functions
19
Page 26
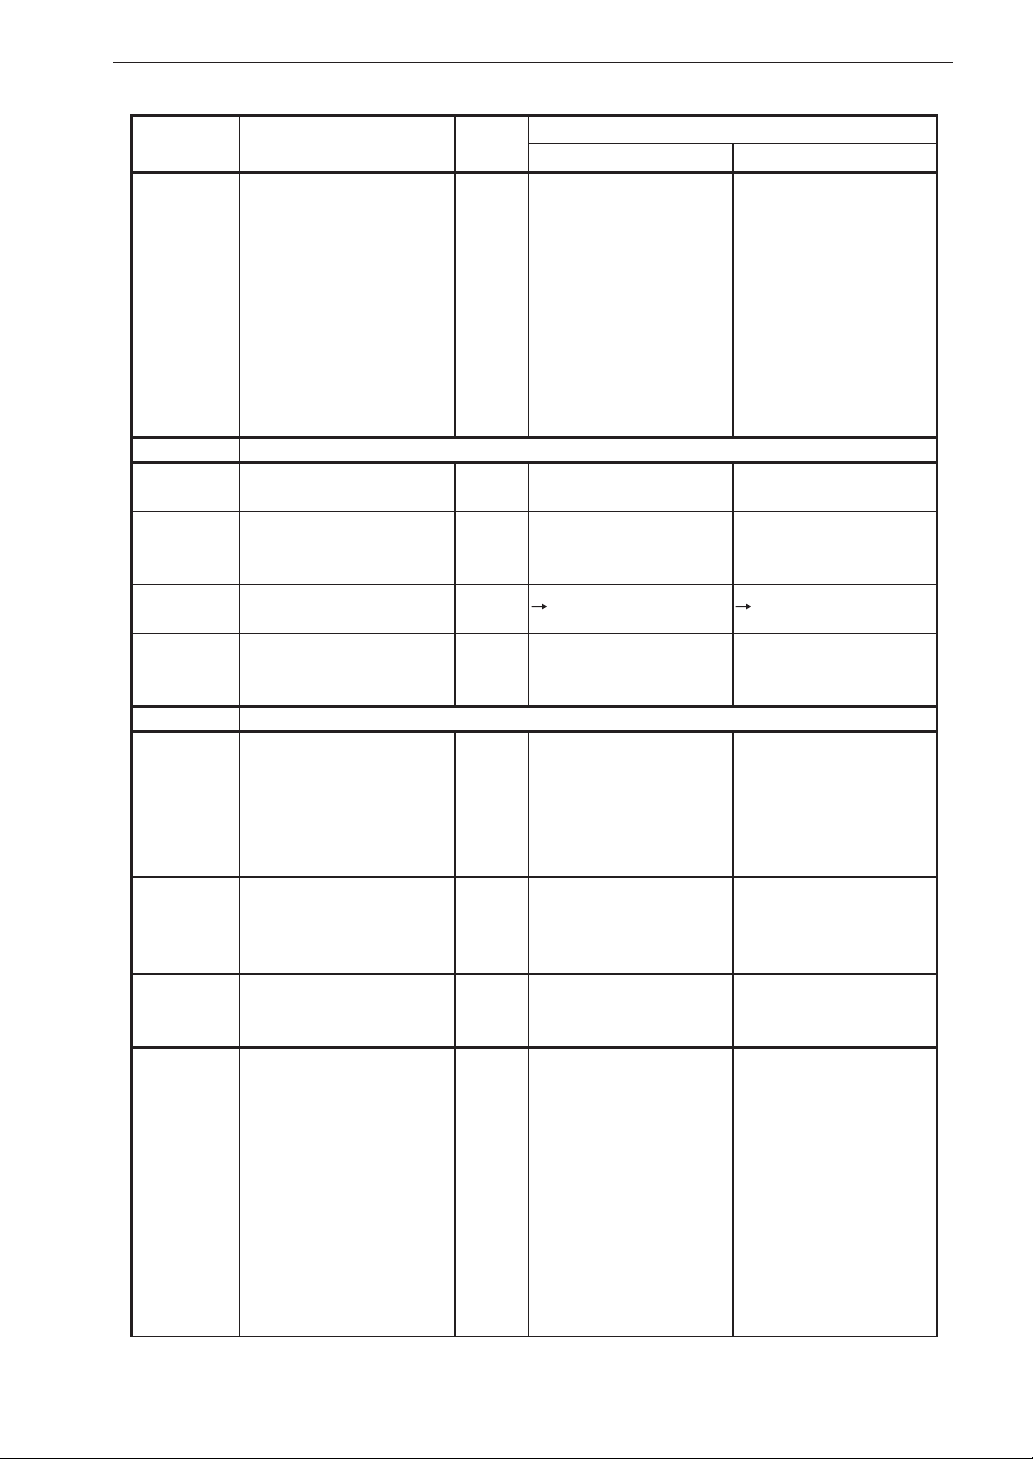
Description for IEC 61672-1
Standard
paragraph
5.15.4 Description of the dis-
5.15.5 Statement of the display
5.15.6 Time inter val for comple-
5.15.7 Description of method for
5.16 Analogue and digital outputs
5.16.1 Electric output connector
5.17 Timing facilities
5.17.1 Procedure to preset the
5.17.2 Statement of the minimum
5.18 RF emissions and power supply disturbance
5.18.1 Length & type of interface
Description
played quantities
update rate
tion of the integration
transferring data to PC
(AC output)
Electric output connector
(DC output)
integration time & time
of the day
& maximum integration
time
cable and characteristics of
connected devices
See
also
9.2 .2 a) N/A N/A
9.2.2 g) 1 second 1 second
9.2.5 f) Less than 1 second Less than 1 second
9.2 .5 m) N/A
Refer to serial interface
manual
9.2 .5 p) Frequency weighti ng: A,
C, Z
Output voltage:
1 Vrms (at output level
range upper)
Output range:
4 Vrms or less
Output impedance: 600
Ω
Load impedance: >10
kΩ
Frequency weighting: A,
C, Z
Output voltage:
2.5 V (at output level
range upper), 25 mV/dB
Output range:
0 to 5 V
Output impedance: 50
Ω
Load impedance: >10
kΩ
9.2 .5 g)
9.2.5 h) Minimum: 1 second
Maximum: 24 hours
9.2 .5 n)
Microphone extension
cable EC-04 series (up
to 35 m)
Output cable CC-24 (2.5
m)
All cables shielded
NL-52 NL-42
Preparations
Remark
N/A
Refer to serial interface
manual
Frequency weighting: A,
C, Z
Output voltage:
1 Vrms (at output level
range upper)
Output range:
4 Vrms or less
Output impedance: 600
Ω
Load impedance: >10
kΩ
Frequency weighting: A,
C, Z
Output voltage:
2.5 V (at output level
range upper), 25 mV/dB
Output range:
0 to 5 V
Output impedance: 50
Ω
Load impedance: >10
kΩ
Preparations
Minimum: 1 second
Maximum: 24 hours
Microphone extension
cable EC-04 series (up
to 35 m)
Output cable CC-24 (2.5
m)
All cables shielded
20
Page 27
Description for IEC 61672-1
Standard
paragraph
5.18.2 Operating mode or h igh-
5.20 Power supply
5.20.2 Maximum and minimum
5.20.3 Battery types & battery
5.20.4 Operation from an external
5.20.5 Public power supply volt-
6 Environmental, electrostatic and radio frequency criteria
6.1.2 Time interval for needed
6.2.2
(Note)
6.5.2 Degradation of functions
6.6.1 Operating mode with least
Description
est radio frequency emissions
power supply voltage
life
power supply
age
to stabilize after environmental changes
Measurement when static
pressure is < 85 kPa
by electrostatic discharge
immunity to AC power
frequency elds and RF
elds
See
also
9.3 n) Operation mode: normal
operation
Connection pattern:
AC adapter NC-98
Output cable CC-24
Communication cable
CC-42R
USB cable (with ferrite
cores)
Microphone extension
cable EC-04 series 35 m
9.3 j Maximum: 7 V
Minimum: 4 V
9.2 .3 a) N/A
LR6 × 4: approx. 15
hours
9.2 .3 c)
9.2.3 d) 100 to 240 V AC (toleranc e range 9 0 to 264 V),
50/60 Hz (47 to 63 Hz)
9.3 l) Temperature change: <
1 hour
Humidity change:
< 1 hour
Static pressure change:
< 5 minutes
Calibration and measurement performed in this
environment using Sound
Calibrator NC-74
9.2.7 b) Measurement value affected temporarily by
electrostatic discharge
9.3 o) Fig. 16
Operation mode: normal
operation
Connection pattern:
AC adapter NC-98
Output cable CC-24
Communication cable
CC-42R
USB cable (with ferrite
cores)
Microphone extension
cable EC-04 series 35 m
NL-52 NL-42
Preparations
Remark
Operation mode: normal
operation
Connection pattern:
AC adapter NC-98
Output cable CC-24
Communication cable
CC-42R
USB cable (with ferrite
cores)
Microphone extension
cable EC-04 series 35 m
Maximum: 7 V
Minimum: 4 V
N/A
LR6 × 4: approx. 15
hours
Preparations
100 to 240 V AC (toleranc e range 9 0 to 264 V),
50/60 Hz (47 to 63 Hz)
Temperature change: <
1 hour
Humidity change:
< 1 hour
Static pressure change:
< 5 minutes
Calibration and measurement performed in this
environment using Sound
Calibrator NC-74
Measurement value affected temporarily by
electrostatic discharge
Fig. 16
Operation mode: normal
operation
Connection pattern:
AC adapter NC-98
Output cable CC-24
Communication cable
CC-42R
USB cable (with ferrite
cores)
Microphone extension
cable EC-04 series 35 m
21
Page 28
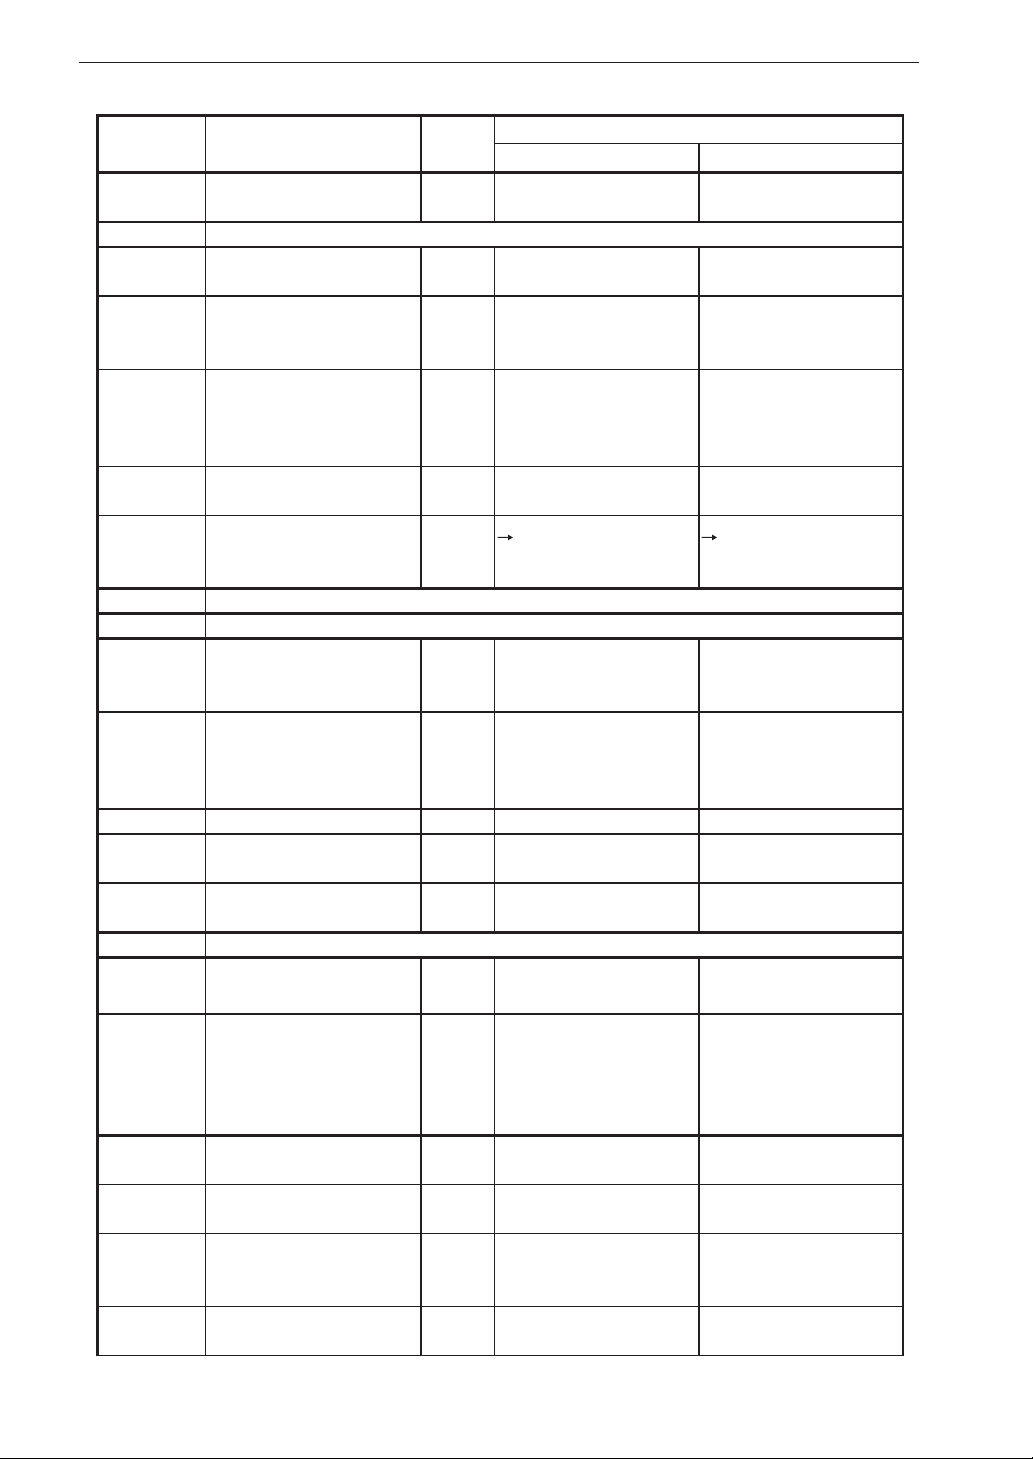
Description for IEC 61672-1
Standard
paragraph
6.6.4
(Note)
Description
Field strength for conforming (in case > 10 V/m)
See
also
9.3 m) N/A N/A
NL-52 NL-42
Remark
7 Provisions for use with auxiliary devices
7.1 Correction for use of mi-
9.2 .6 b) N/A N/A
crophone cable
7.2 Ef fe c t of option a l a c c e s sories (windscreen)
7.3 St atem ent of con for ma nce
with optional accessories
(wi ndscreen)
7.4 Operation of 1/1 - 1/3 oc-
9.2 .6 a) In uence of WS-10 on
acoustic performance of
NL-52/NL-42 (Fig. 10)
Compliant with IEC
61672-1 (JIS C 1509-1),
with Windscreen WS-10
mounted
In uence of WS-10 on
acoustic performance of
NL-52/NL-42 (Fig. 10)
Compliant with IEC
61672-1 (JIS C 1509-1),
with Windscreen WS-10
mounted
9.2 .6 c) N/A N/A
tave band lters
7.5 Details about connection
9.2.6 d)
Preparations Preparations
& effects of auxiliary devices
9 Instruction manual
9.2 .1 General
9.2.1 a) Description of type, clas-
Group X, Class 1 Group X, Class 2
si cation (X, Y, Z) and
class
9.2.1 b) Overall con guration,
Normal operation con g-
5.1.4
5.1.7
Refer to 5.1.4
Refer to 5.1.7
Refer to 5.1.4
Refer to 5.1.7
uration (including windscreen)
9.2.1 c) Models of microphones 5.1.6 Refer to 5.1.6 Refer to 5.1.6
9.2.1 d) Re q u i r e d m icro p hone
N/A N/A
cable to conform
9.2 .1 e) Cha r acteristics & o pera-
N/A N/A
tion each channel
9.2.2 Design features
9.2.2 a) Description of quantities
which can be measured
9.2 .2 b) Relative f ree- eld response
as function of incidence angle and frequency (detailed
tabular description)
9.2.2 c) Description of the frequency weightings
9.2.2 d) Description of the time
5.15.4 Lp, Leq, L
LN, L
peak
Directional Characteristics with Horizontal Direction (Fig. 17, Tab. 5),
Vertic a l D i rectio n ( Fig.
18, Tab. 6)
5.1.10
5.4.12
Refer to 5.1.10
Refer to 5.4.12
, L
max
, L
Atm5
min
, LE,
Lp, Leq, L
LN, L
peak
max
, L
Directional Characteristics with Horizontal Direction (Fig. 17, Tab. 5),
Vertic a l D i rectio n (Fig.
18, Tab. 6)
Refer to 5.1.10
Refer to 5.4.12
5.7.1 Refer to 5.7.1 Refer to 5.7.1
weightings
9.2 .2 e) Identi cation of the level
5.1.12 Refer to 5.1.12 Refer to 5.1.12
ranges (A-weighted @ 1
kHz)
9.2.2 f) Operation of the level
5.1.12 Refer to 5.1.12 Refer to 5.1.12
range control
, L
Atm5
min
, LE,
22
Page 29
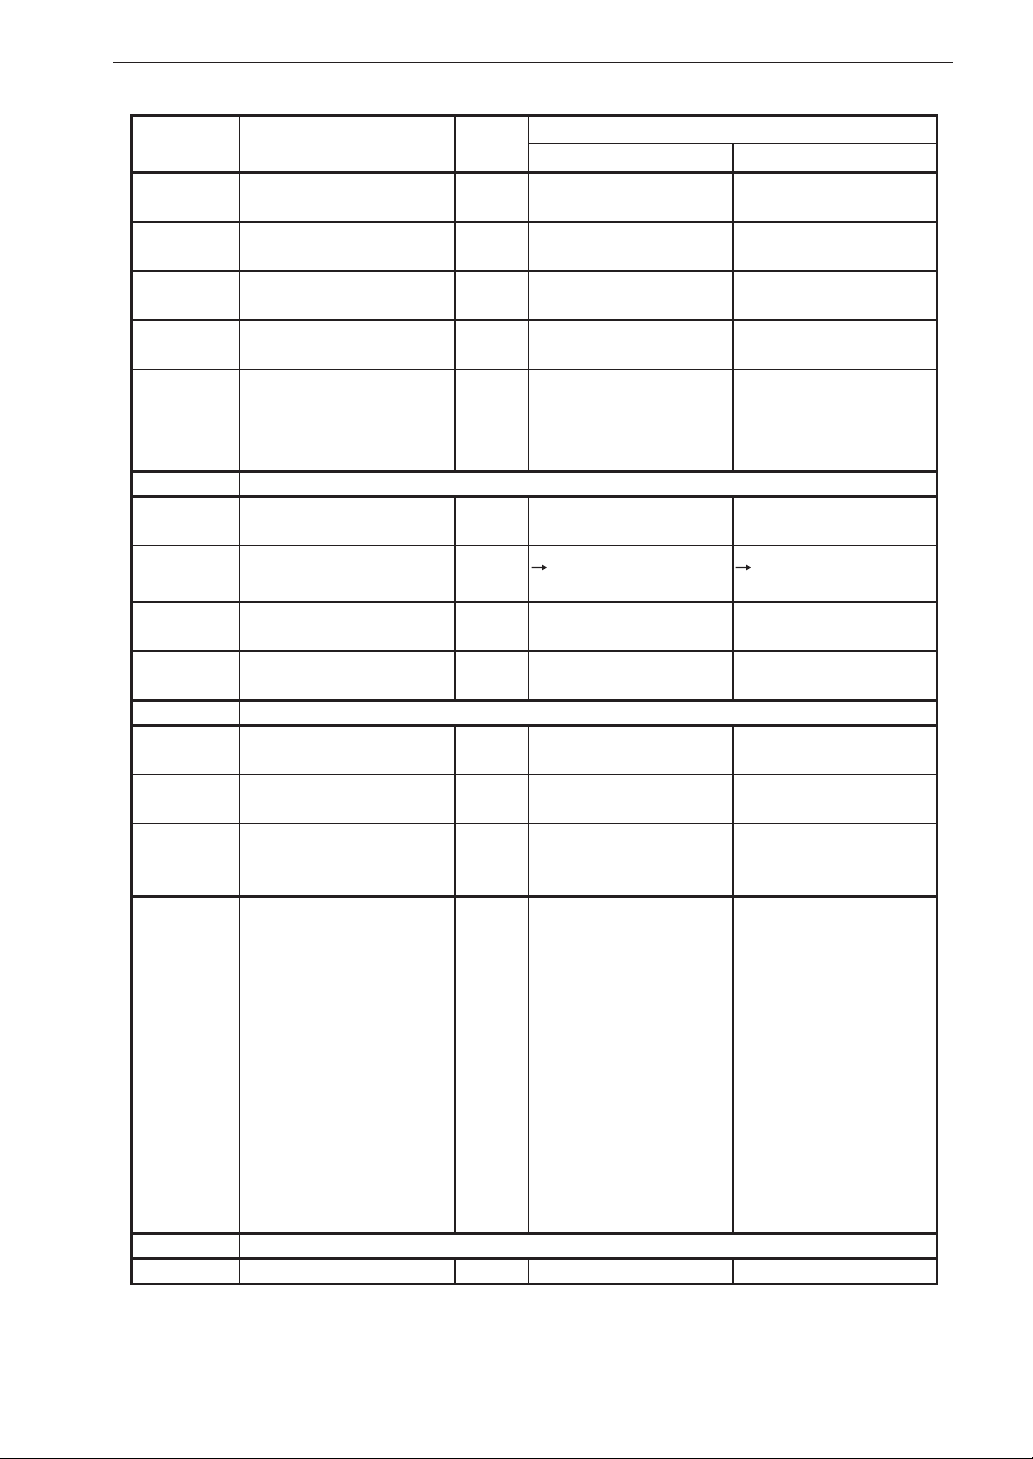
Description for IEC 61672-1
Standard
paragraph
9.2.2 g) Description of the display
9.2.2 h) Total range of A- weighted
9.2 .2 i) Nominal range of L
9.2 .2 j) Computer softwa re to op -
9.2 .2 k) Desig n g oa l s a nd tole r-
9.2 .3 Power supply
9.2.3 a) Battery types & battery
9.2.3 b) Description of the function
9.2 .3 c) Operation from an external
9.2.3 d) Public power supply volt-
9.2.4 Adjustment to indicated levels
9.2.4 a) M o d e l of s o u n d
9.2.4 b) Calibration check fre-
9.2.4 c) Procedure for calibration
9.2.4 d) Data for correction - with
9.2.5 Operating the sound level meter
9.2.5 a) Reference direction 5.1.13 Refer to 5.1.13 Refer to 5.1.13
Description
and update rates
SPL (@ 1 kHz)
Cpeak
for each level range
erate the SLM
ances for quantities which
are not in the standard (Tweight 10 ms, L
life
of battery check
power supply
age
calibrator(s)
quency
& adjustment with sound
calibrator
and without windscreen
- for :
- Deviation of average frequency response to uniform frequency response.
- Case re ection and microphone diffraction
Including values for expanded uncertainties.
In 1/3 octave frequencies
for 63 Hz to 1 kHz and
1/12 octave frequencies
for 1 kHz to 16 kHz
AIeq
)
See
also
5.15.23-4-5
5.1.12 Refer to 5.1.12 Refer to 5.1.12
at
5.12.1 Refer to 5.12.1 Refer to 5.12.1
5.1.8 Refer to 5.1.8 Refer to 5.1.8
5.20.3 Refer to 5.20.3 Refer to 5.20.3
5.20.4 Refer to 5.20.4 Refer to 5.20.4
5.20.5 Refer to 5.20.5 Refer to 5.20.5
5.2.1 Refer to 5.2.1 Refer to 5.2.1
5.2.3 Refer to 5.2.3 Refer to 5.2.3
5.2.4 -
5.2.5
Refer to 5.15.2-3-4-5 Refer to 5.15.2-3-4-5
The lower and upper limits of the linear operating
range (Tab. 4)
1 kHz 1 kHz
Refer to 5.2.4 -
5.2.5
NL-52 NL-42
Controls and Functions
Remark
The lower and upper limits of the linear operating
range (Tab. 4)
Controls and Functions
Refer to 5.2.4 -
5.2.5
23
Page 30
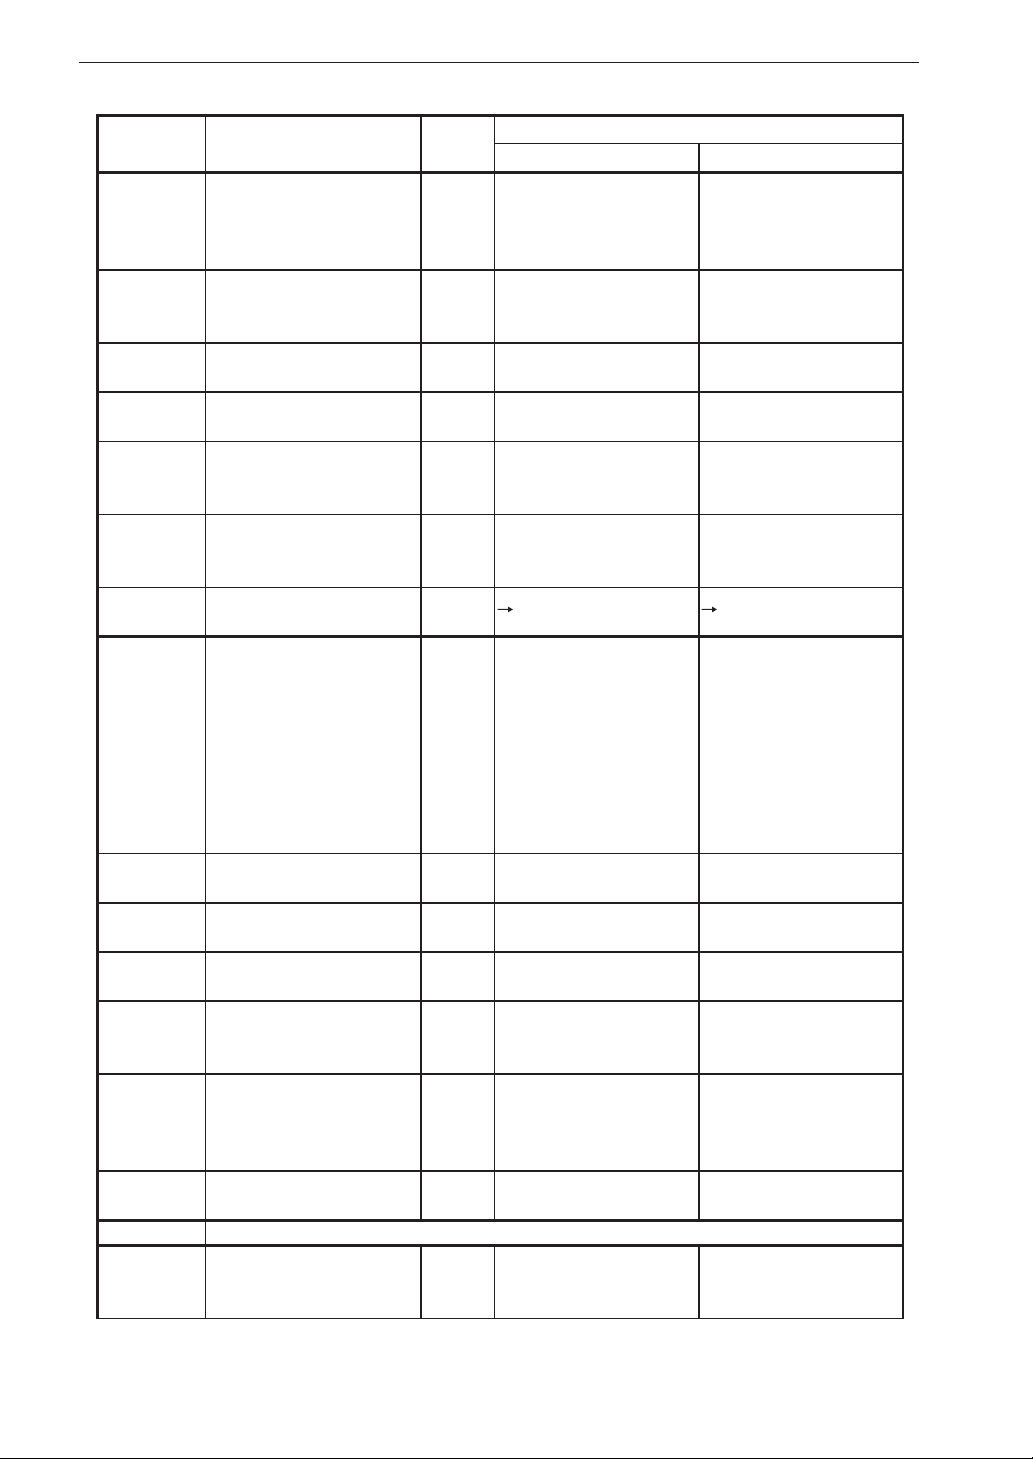
Description for IEC 61672-1
Standard
paragraph
9.2.5 b) Procedure to measure
9.2 .5 c) Recom mendat ion for se-
9.2.5 e) Initial time interval after
9.2.5 f) Time interval for comple-
9.2.5 g) Procedure to preset the
9.2.5 h) Statement of the minimum
9.2.5 i) Operation of the “Hold”
9.2.5 j) Operation of the reset
9.2.5.k) Operation & interpretation
9.2.5 l) Operation of user-select-
9.2.5 m) Description of method for
9.2.5 n) Length & type of interface
9.2.5 o) Self-noise at the more sen-
9.2.5 p) Characteristics of AC and
9.2.6 Accessories
9.2.6 a) Effect of windscreen (di-
Description
sound,
In uence of the instrument
case and operator.
lecting optimum level
range
switching on power
tion of the integration
integration time & time
of the day
& maximum integration
time
function
function or Leq, LE, L
and overload
of overload indicators
able thresholds
transferring data to PC
cable and characteristics of
connected devices
sitive ranges (including
microphone). Averaging
time ≥ 30 s.
DC output
rectional response and
frequency weighting)
peak
See
also
5.1.6
5.2.4
5.2.5
5.1.12 Refer to 5.1.12 Refer to 5.1.12
5.1.18 Refer to 5.1.18 Refer to 5.1.18
5.15.6 Refer to 5.15.6 Refer to 5.15.6
5.17.1 Refer to 5.17.1 Refer to 5.17.1
5.17.2 Refer to 5.17.2 Refer to 5.17.2
5.10.1 Refer to 5.10.1 Refer to 5.10.1
5.14 Refer to 5.14 Refer to 5.14
5.15.7 Refer to 5.15.7 Refer to 5.15.7
5.18.1 Refer to 5.18.1 Refer to 5.18.1
5.6.1 Refer to 5.6.1 Refer to 5.6.1
5.16.1 Refer to 5.16.1 Refer to 5.16.1
7.2 Re fer to 7.2 Refer to 7.2
Refer to 5.1.6
Refer to 5.2.4
Refer to 5.2.5
Measurement results
(measurement values,
overload indication, under-range indication) are
reset when a new measurement is started.
Time required for measurement initialization:
< 1 second
NL-52 NL-42
Measurement Measurement
Remark
Refer to 5.1.6
Refer to 5.2.4
Refer to 5.2.5
Measurement results
(measurement values,
overload indication, under-range indication) are
reset when a new measurement is started.
Time required for measurement initialization:
< 1 second
24
Page 31
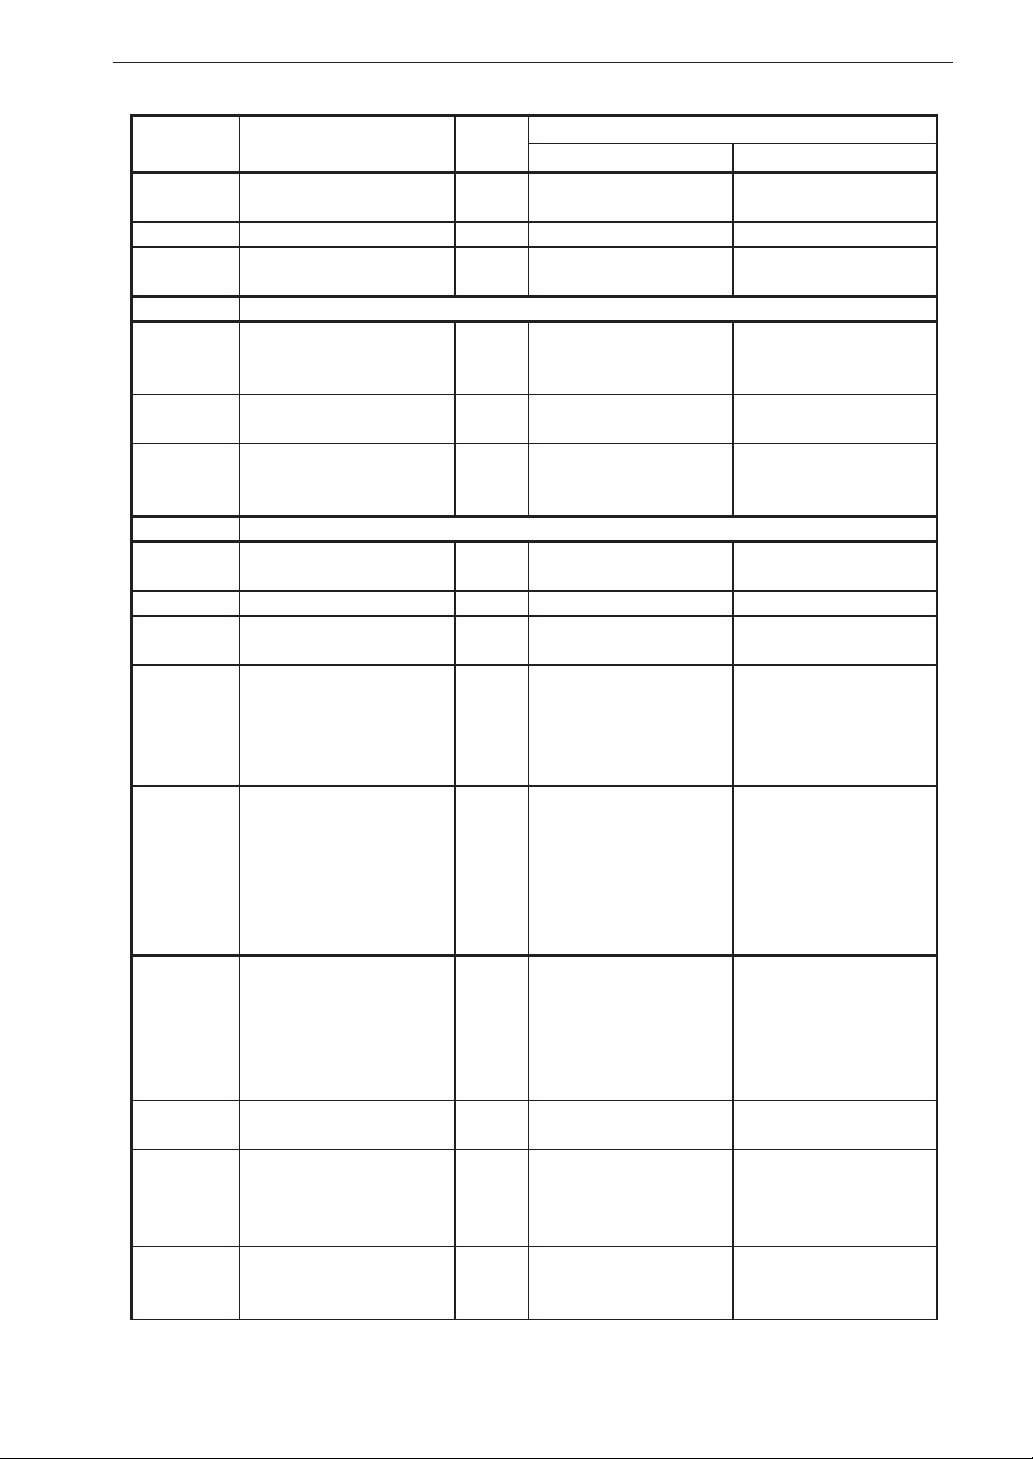
Description for IEC 61672-1
Standard
paragraph
9.2 .6 b)
9.2.6 c) Use of bandpass lters 7.4 Refer to 7.4 Refer to 7.4
9.2 .6 d)
9.2 .7 In uence of environmental conditions
9.2.7 a) Components intended for
9.2.7 b) Degradation of functions
9.2.7 c) Statement for conformance
9.3 Information for testing
9.3 a) Reference sound pressure
9.3 b) Reference level range 5.1.13 Refer to 5.1.13 Refer to 5.1.13
9.3 c) Microphone reference
9.3 d) For A-weighted sound lev-
9.3 e) N o m in a l A - w e i g h t ed
9.3 f) Starting point for the level
9.3 g) Dummy microphone: De-
9.3 h) Self-noise at the more sen-
9.3 i) Highest SPL and Peak-
Description
Corrections for microphone
cable
Connection of auxiliary
devices
operation in controlled
environment
by electrostatic discharge
to AC power frequency
elds and RF elds
level
point
els: Adjustment data for
multi-frequency sound
calibrator and/or electrostatic actuator
sound levels at the upper
and lower limits of the
linear operating range on
each level range.
- For frequencies 31.5 Hz,
1, 4, 8 and 12.5 kHz
linearity error
- For frequencies 31.5 Hz,
1, 4, 8 and 12.5 kHz
- At the reference level
range
sign goal and tolerance
sitive ranges with microphone and with dummy
microphone
Peak input voltage to accommodate
See
also
7.1 Refe r t o 7.1 Refe r t o 7.1
7.5 Re fer to 7.5 R efer t o 7. 5
None None
6.5.2 Refer to 6.5.2 Refer to 6.5.2
Statement of conforming to the basic statement
(Tab. 2)
5.1.13 Refer to 5.1.13 Refer to 5.1.13
5.1.13 Refer to 5.1.13 Refer to 5.1.13
5.2.7 Refer to 5.2.7 Refer to 5.2.7
5.5.9 Refer to 5.5.9 Refer to 5.5.9
5.5.10 Refer to 5.5.10 Refer to 5.5.10
5.1.15 Refer to 5.1.15 Refer to 5.1.15
5.6.1 /
5.6.3
5.1.16 Refer to 5.1.16 Refer to 5.1.16
Refer to 5.6.1 /
5.6.3
NL-52 NL-42
Remark
Statement of conforming to the basic statement
(Tab. 2)
Refer to 5.6.1 /
5.6.3
25
Page 32
Description for IEC 61672-1
Standard
paragraph
9.3 j) Maximum and minimum
9.3 k) How to test level linearity
9.3 l)
9.3 m) Field strength for conform-
9.3 n) Operating mode or high-
9.3 o) Operating mode with least
Description
power supply voltage
if display range < linearity range
Time interval for needed to
stabilize after environmental
changes
ing (in case > 10 V/m)
est radio frequency emissions
immunity to AC power
frequency elds and RF
elds
See
also
5.20.2 Refer to 5.20.2 Refer to 5.20.2
5.5.11 Refer to 5.5.11 Refer to 5.5.11
6.1.2 Refer to 6.1.2 Refer to 6.1.2
6.6.4 Refer to 6.6.4 Refer to 6.6.4
5.18.2 Refer to 5.18.2 Refer to 5.18.2
6.6.1 Refer to 6.6.1 Refer to 6.6.1
NL-52 NL-42
Remark
26
Page 33
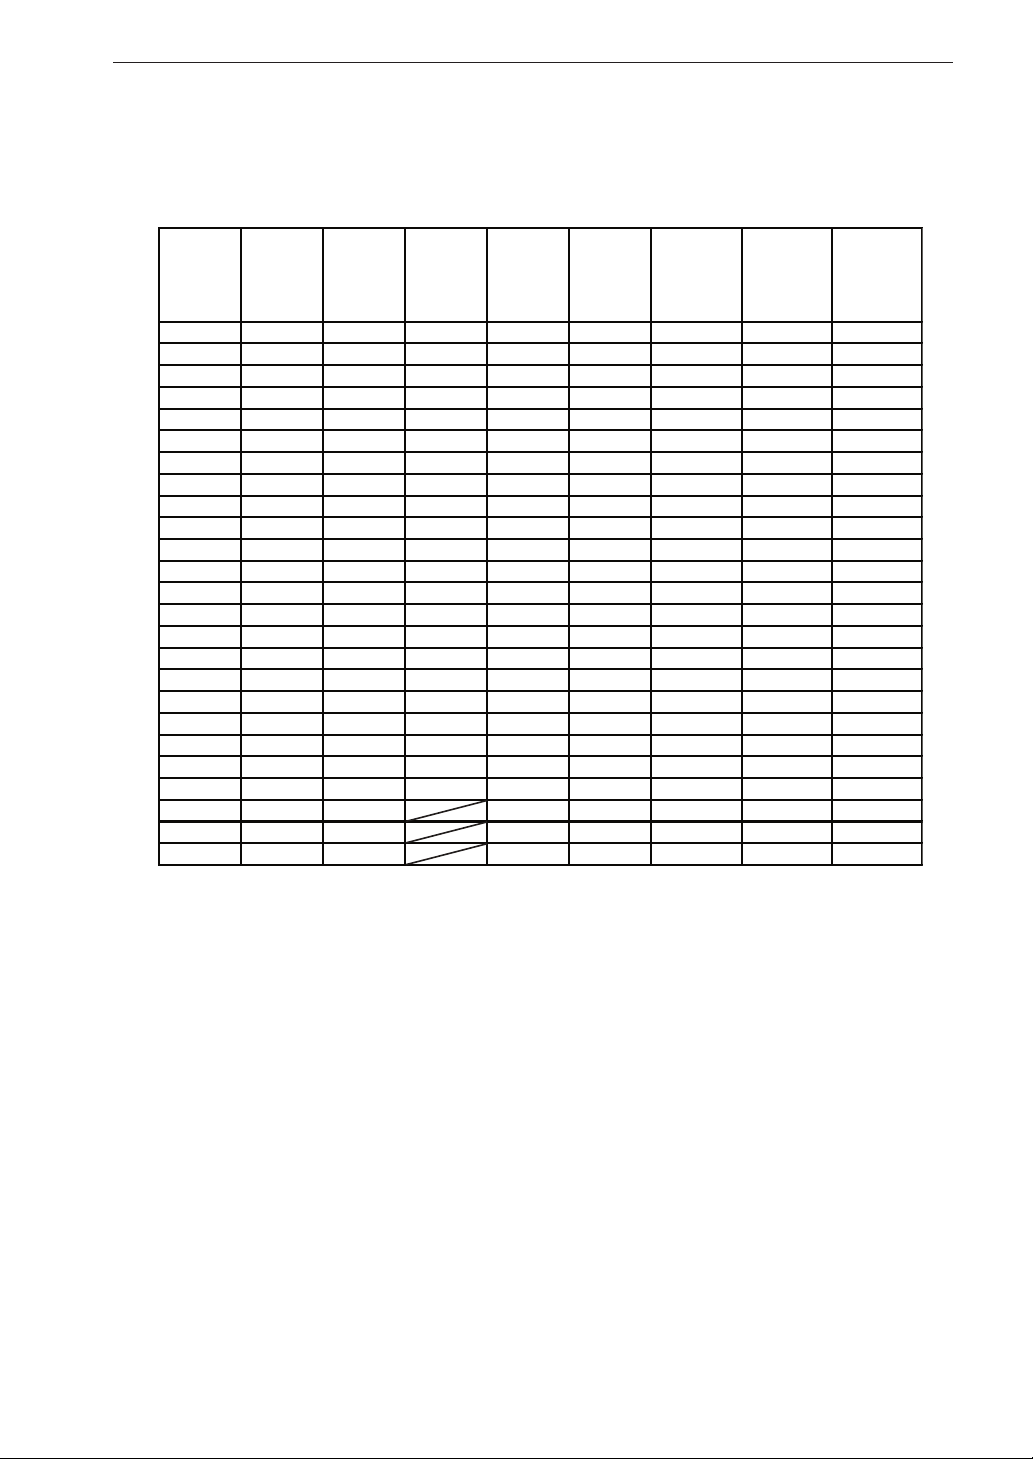
Description for IEC 61672-1
IEC 61672-1 (JIS C 1509-1) frequency response
Tab. 1 IEC 61672-1 (JIS C 1509-1) frequency response
Nominal
Frequency
(Hz)
Exact
Frequency
(Hz)
63 63.10 0.1 0.0 -0.1 0.0 0.0 0.0 0.3
80 79.43 0.1 0.0 -0.1 0.0 0.0 0.0 0.3
100 100.0 0.1 0.0 -0.1 0.0 0.0 0.0 0.3
125 125.9 0.1 0.0 0.0 0.0 0.0 0.0 0.3
160 158.5 0.1 0.0 -0.1 0.0 0.0 0.0 0.3
200 199.5 0.1 0.0 0.0 0.0 0.0 0.0 0.2
250 251.2 0.1 0.0 0.0 0.0 0.0 0.0 0.2
315 316.2 0.0 0.0 0.0 0.0 0.1 0.0 0.2
400 398.1 0.0 0.0 0.0 0.0 0.1 0.0 0.2
500 501.2 0.0 0.0 0.1 0.0 0.1 0.0 0.2
630 631.0 0.0 0.0 0.1 0.0 0.1 0.0 0.2
800 794.3 -0.1 0.0 0.1 0.0 0.1 -0.1 0.2
1000 1000 0.0 0.0 0.0 0.0 0.1 -0.1 0.2
1250 1259 0.0 0.0 -0.2 0.0 0.2 -0.1 0.3
1600 1585 0.0 0.1 -0.4 0.0 0.2 -0.2 0.3
2000 1995 0.0 0.2 0.0 0.0 0.3 -0.3 0.3
2500 2512 0.0 0.3 0.2 0.0 0.4 -0.3 0.3
3150 3162 0.1 0.4 0.1 0.0 0.5 -0.4 0.3
4000 3981 0.1 0.4 -0.1 0.0 0.3 -0.4 0.4
5000 5012 0.1 0.3 0.4 0.0 0.0 -0.4 0.4
6300 6310 0.1 0.0 -0.1 0.0 -0.2 -0.3 0.4
8000 7943 0.0 -0.5 0.0 0.0 0.0 -0.1 0.4
10000 10000 -0.1 0.2 0.0 -0.2 0.1 0.6
12500 12589 -0.3 -0.1 0.0 -0.5 0.3 0.6
16000 15849 -0.8 -0.2 0.0 -0.7 0.4 0.6
UC-59
Frequency
Response
(dB)
UC-52
Frequency
Response
(dB)
NL-42/52
Frequency
Response
(dB)
NL-42/52
Electrical
Response
(dB)
Windscreen
(WS-10)
Effect
(dB)
Windscreen
(WS-10)
Correction
(dB)
Total
Expanded
Uncertainty
(dB)
27
Page 34
Description for IEC 61672-1
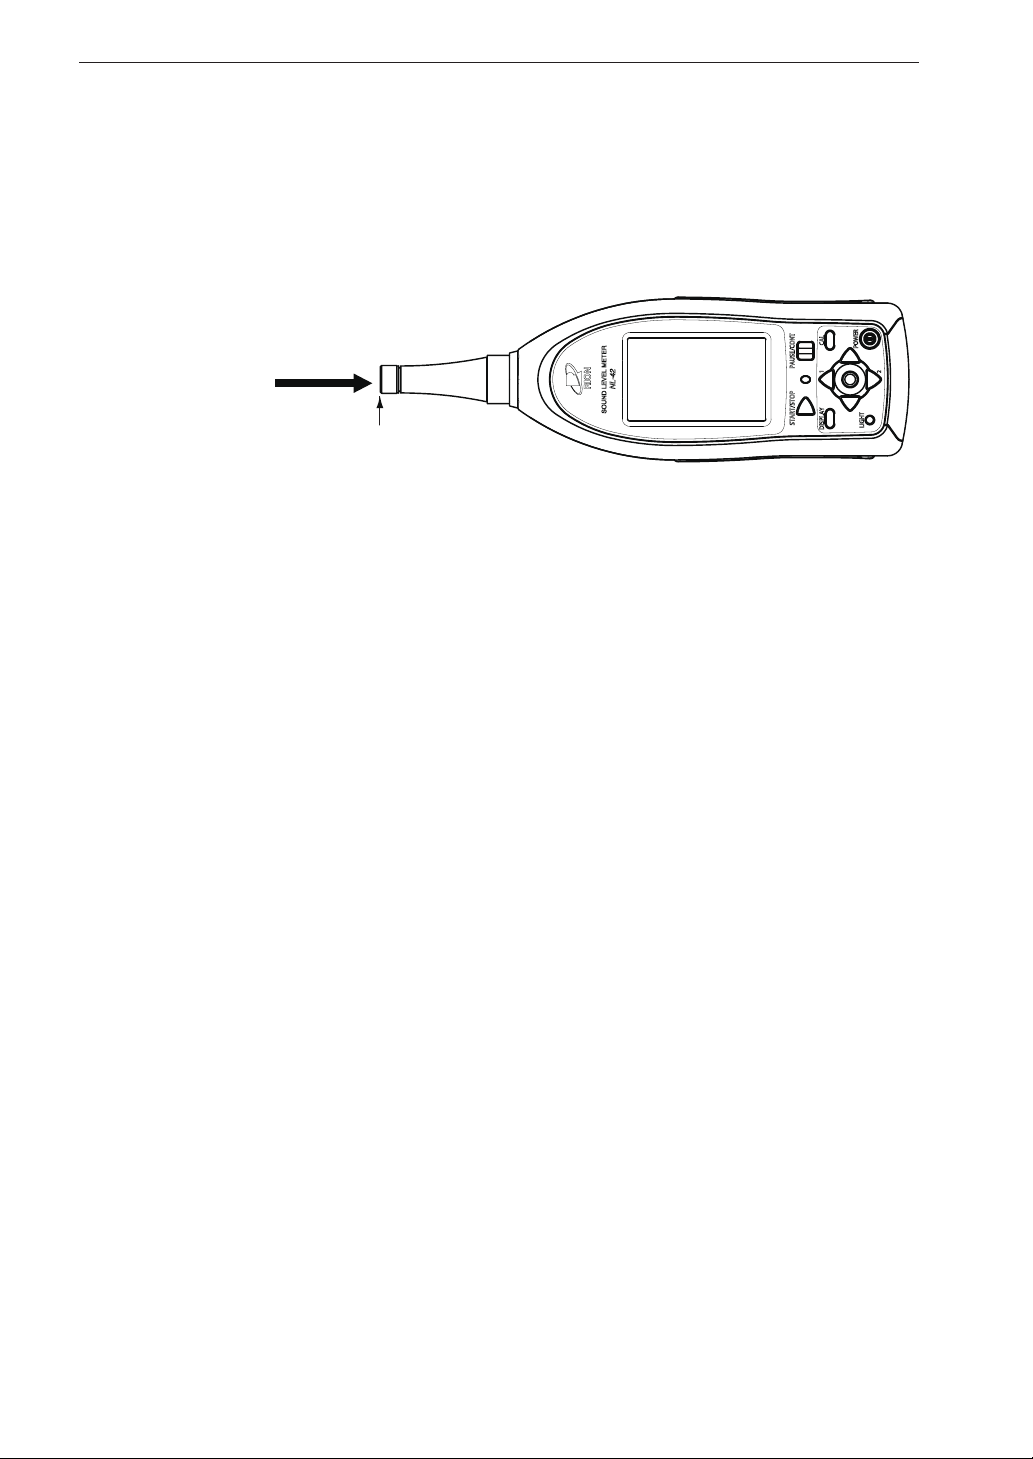
Reference incidence direction and reference point position
Reference direction
of incidence
Reference point position
Center of diaphragm plane
Fig. 1 Reference incidence direction and reference point position
28
Page 35
Frequency response
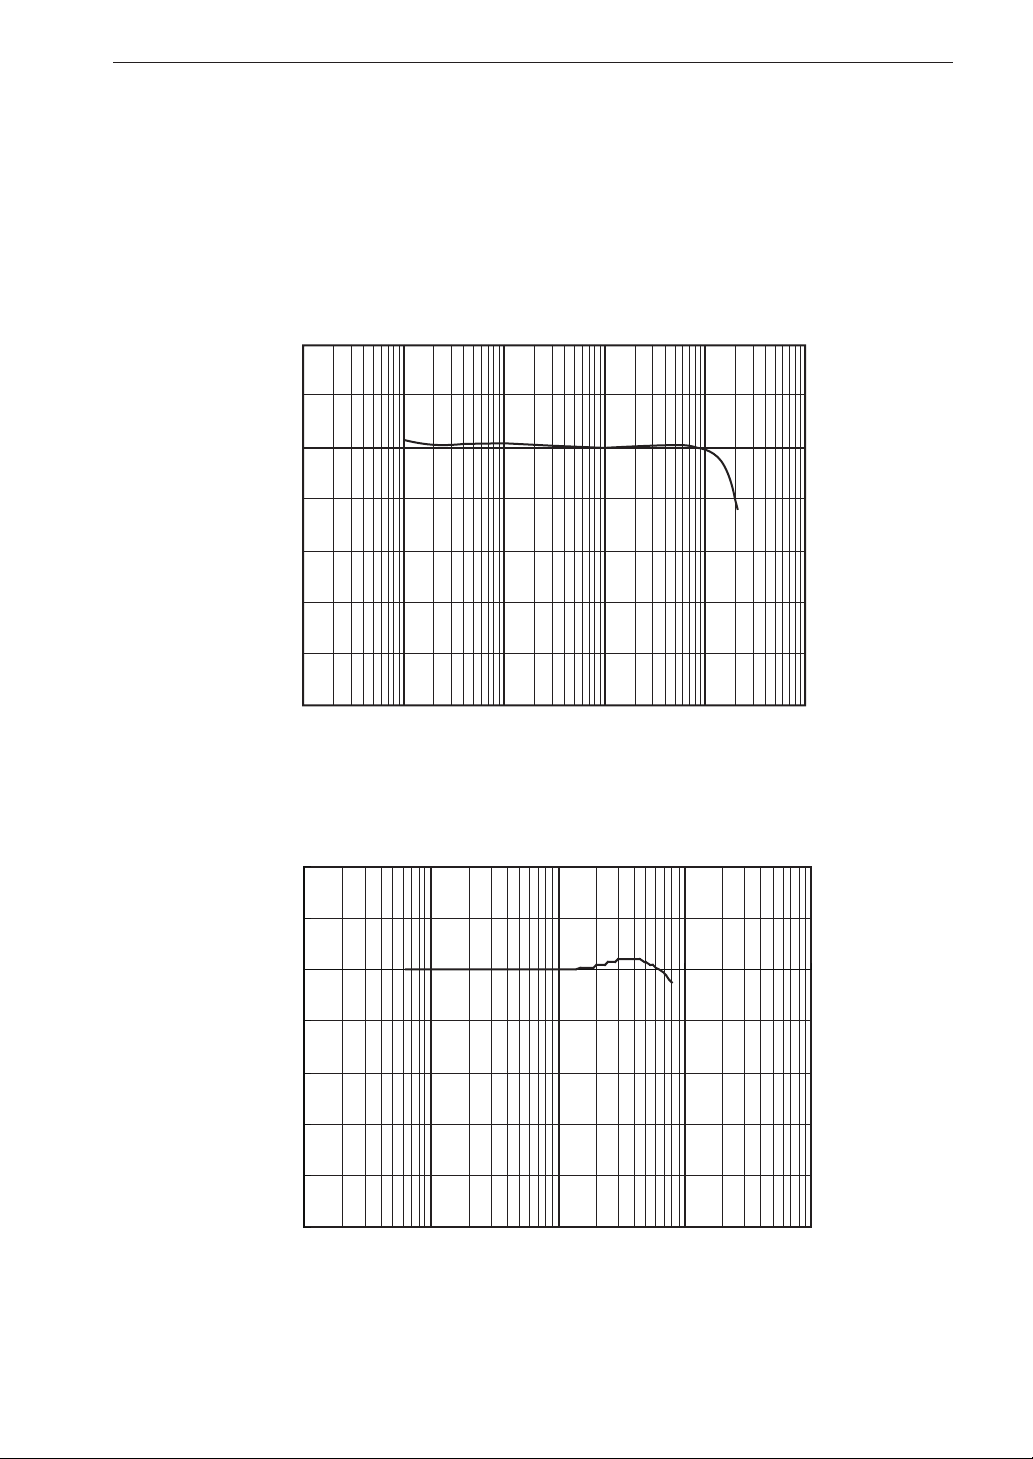
The frequency response of a sound eld microphone is expressed as the fre-
quency response in the reference direction of incidence (0º).
The diagram below shows an example for the frequency response of the
microphone UC-59 and UC-52.
4
2
0
-2
-4
Response (dB)
-6
Description for IEC 61672-1
-8
-10
1 10 100 1 k 10 k 100 k
Frequency (Hz)
Fig. 2 Frequency response of the microphone UC-59
4
2
0
-2
-4
Response (dB)
-6
-8
-10
10 100 1k 10 k 100 k
Frequency (Hz)
Fig. 3 Frequency response of the microphone UC-52
29
Page 36
Description for IEC 61672-1
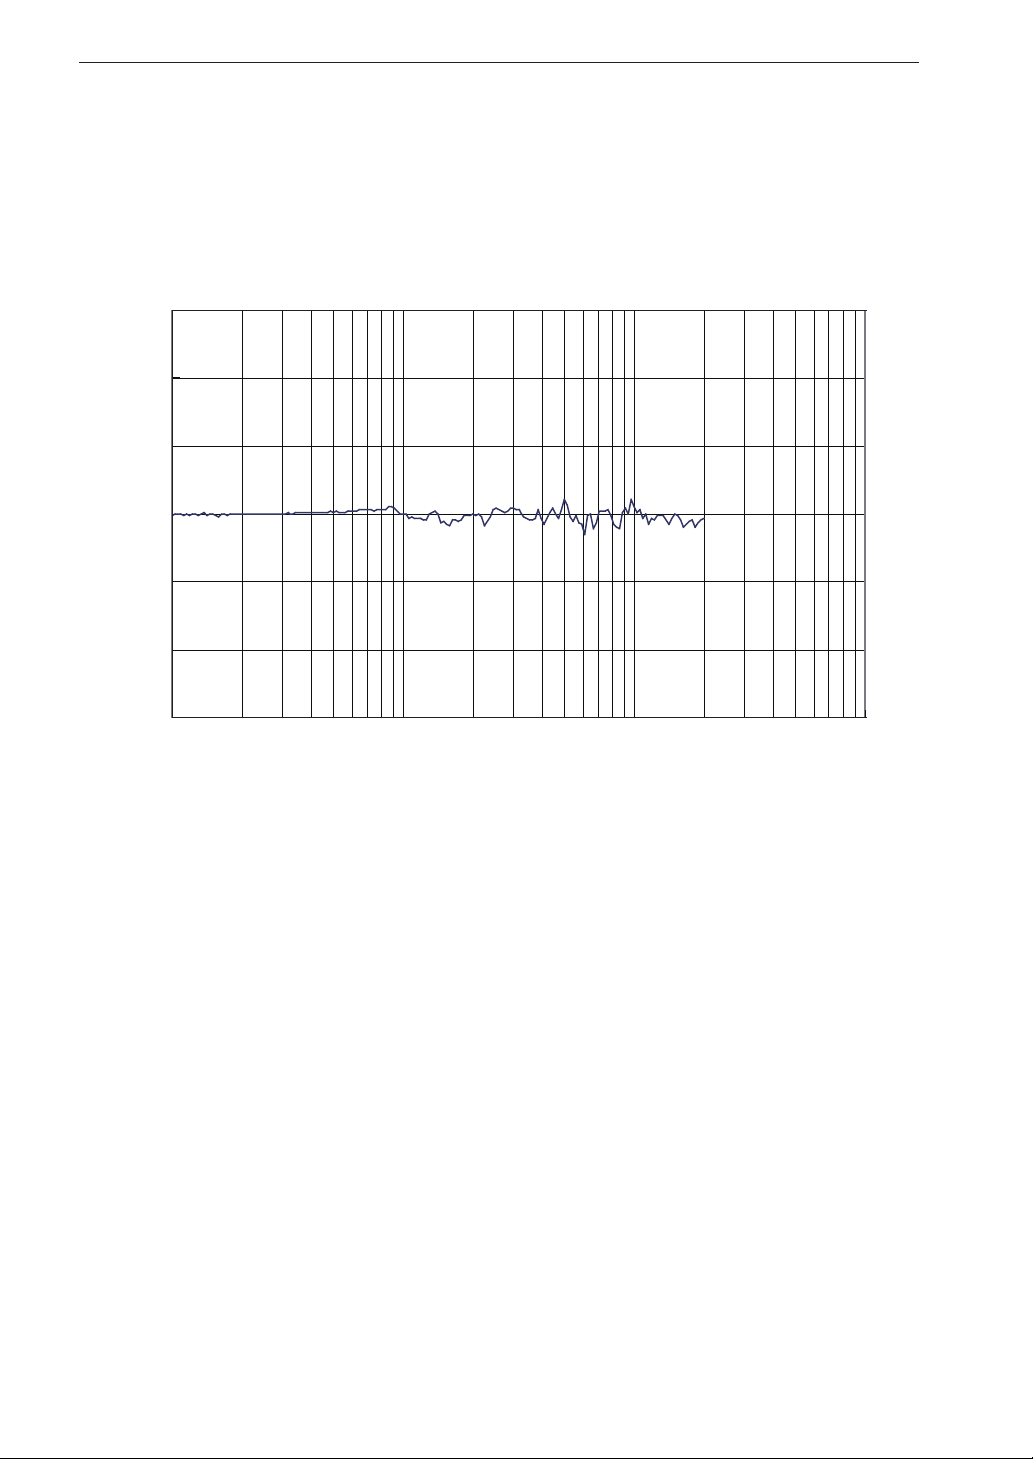
In uence of body re ection
The NL-52/NL-42 is designed to minimize re ections caused by the body
of the unit.
The chart below shows the in uence on the measurement.
6
4
2
0
Response (dB)
-2
-4
-6
100
1000
Frequency (Hz)
10000
Fig. 4 In uence of Body re ection
100000
30
Page 37
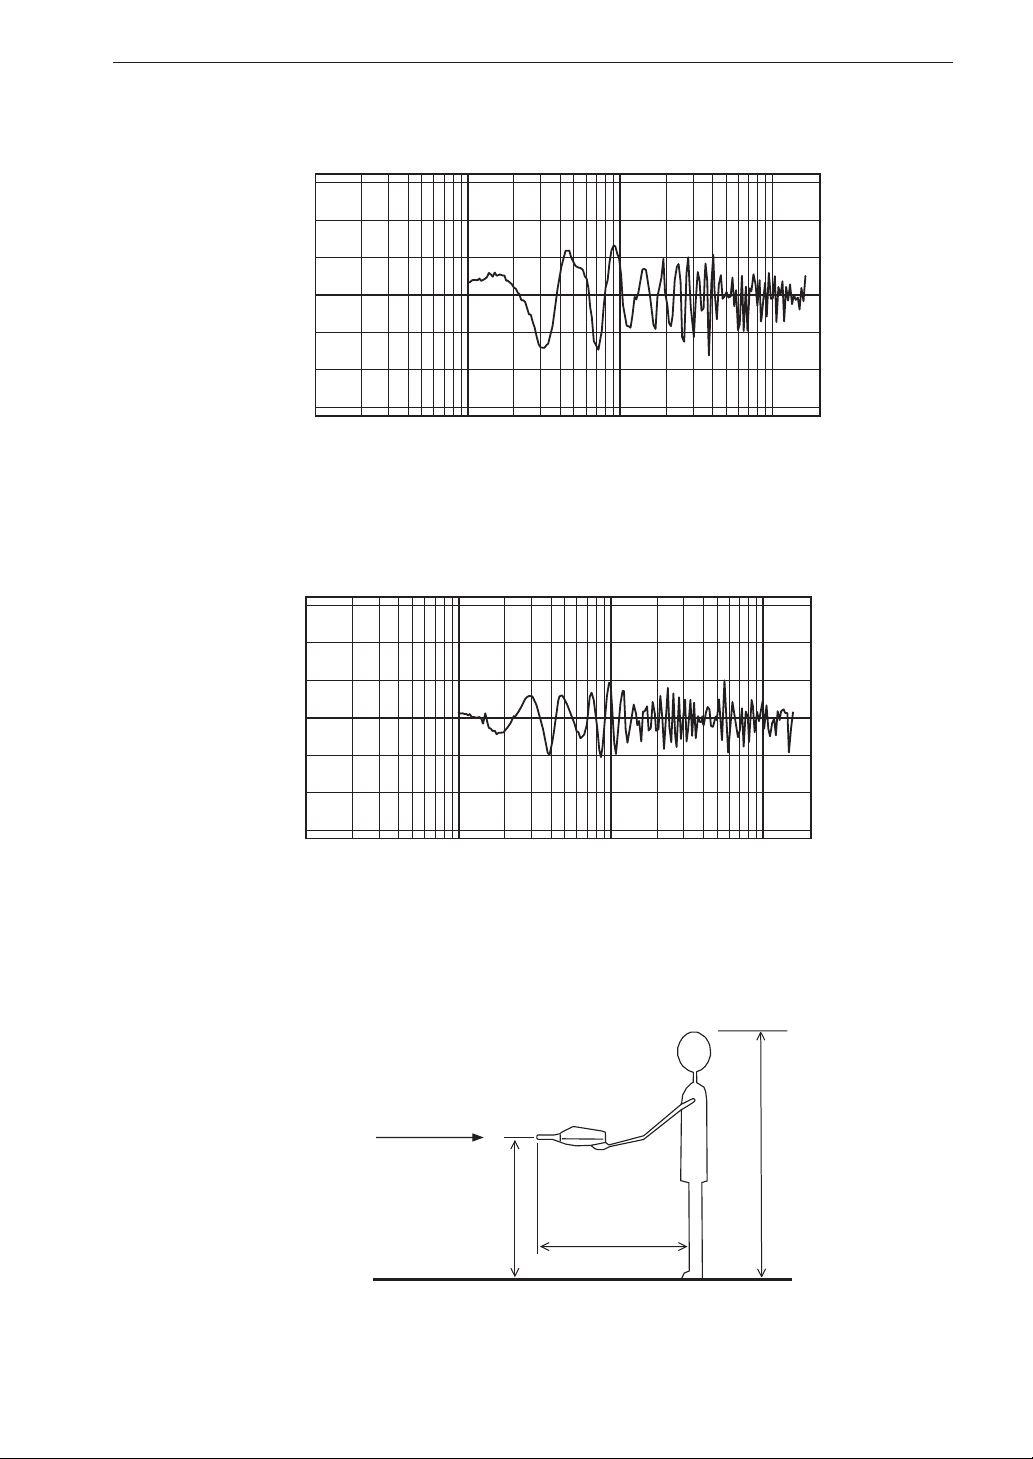
Acoustical in uence of operator
6
4
2
0
Response (dB)
-2
-4
-6
10 20 50 100 200 500 1 k 2 k 5k 10 k 20k
Frequency (Hz)
Fig. 5 Acoustical in uence of operator (the distance from the top
of the microphone to the operator is approx. 40 cm)
6
Description for IEC 61672-1
4
2
0
Response (dB)
-2
-4
-6
10 20 50 100 200 500 1 k 2 k 5k 10 k 20k
Frequency (Hz)
Fig. 6 Acoustical in uence of operator (the distance from the top
of the microphone to the operator is approx. 70 cm)
Sound arrival direction
Sound level meter
160 cm
120 cm
Approx. 40cm or 70 cm
Fig. 7 Measurement conditions for acoustical in uence of operator
31
Page 38
Description for IEC 61672-1
Reduction of wind noise by windscreen
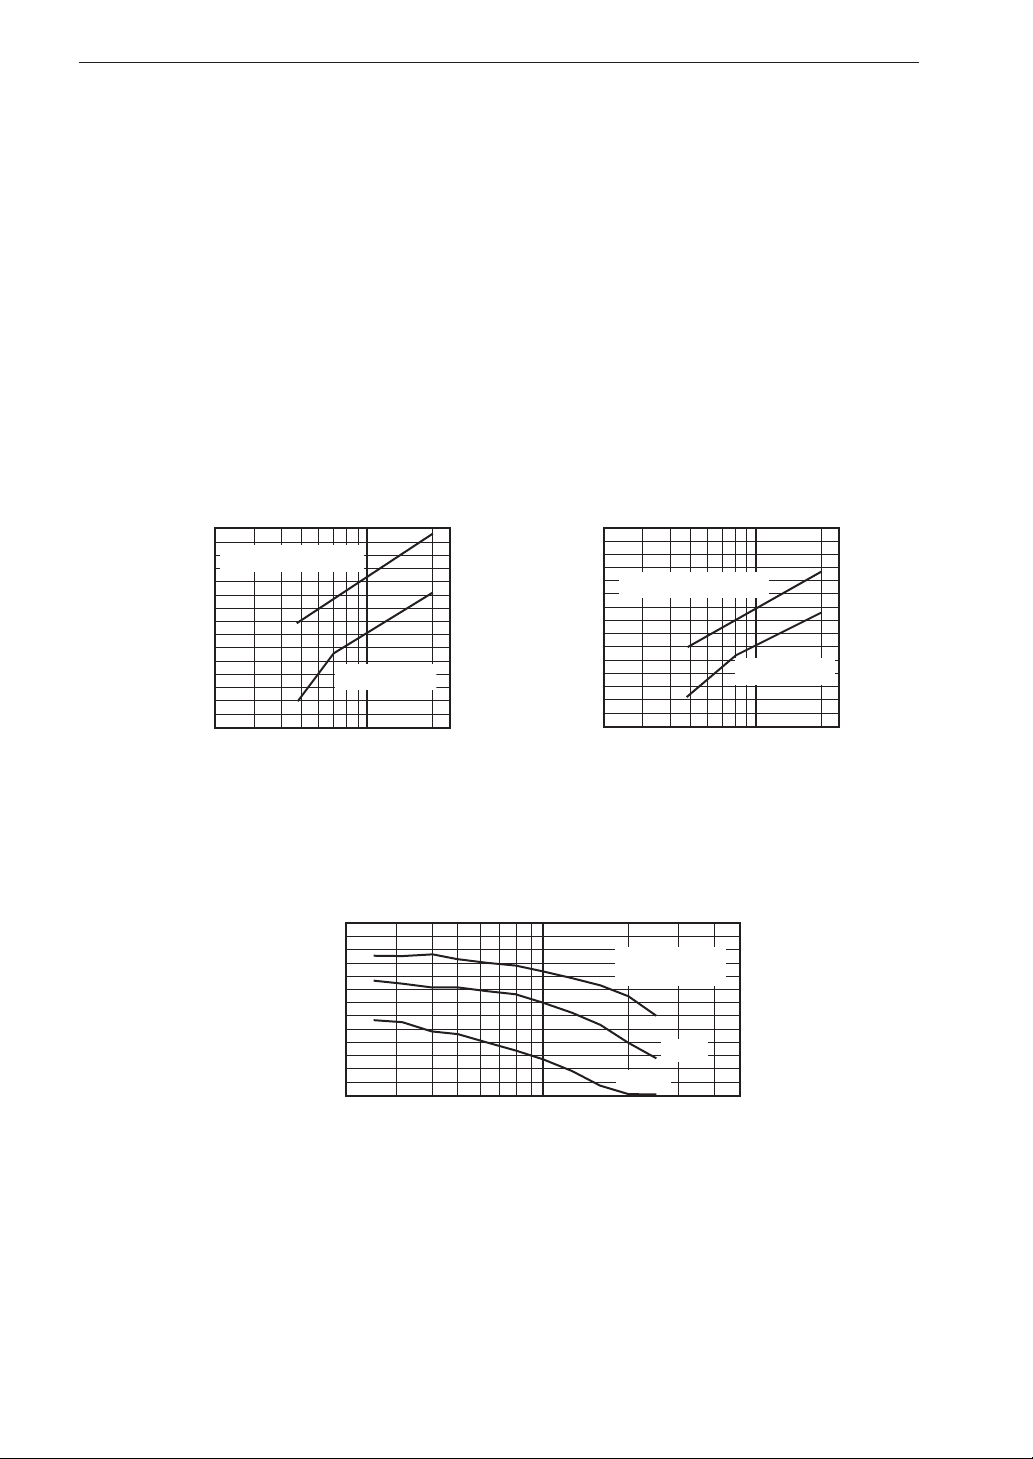
During outdoor measurements or measurement of ventilation devices, wind
noise can falsify measurement results. To counter such problems, the supplied
windscreen WS-10 should be mounted on the microphone. The characteristics
of the WS-10 are shown below. The attenuation of wind noise produced by
the windscreen is about 25 dB with frequency weighting A and 15 dB with
frequency weighting C.
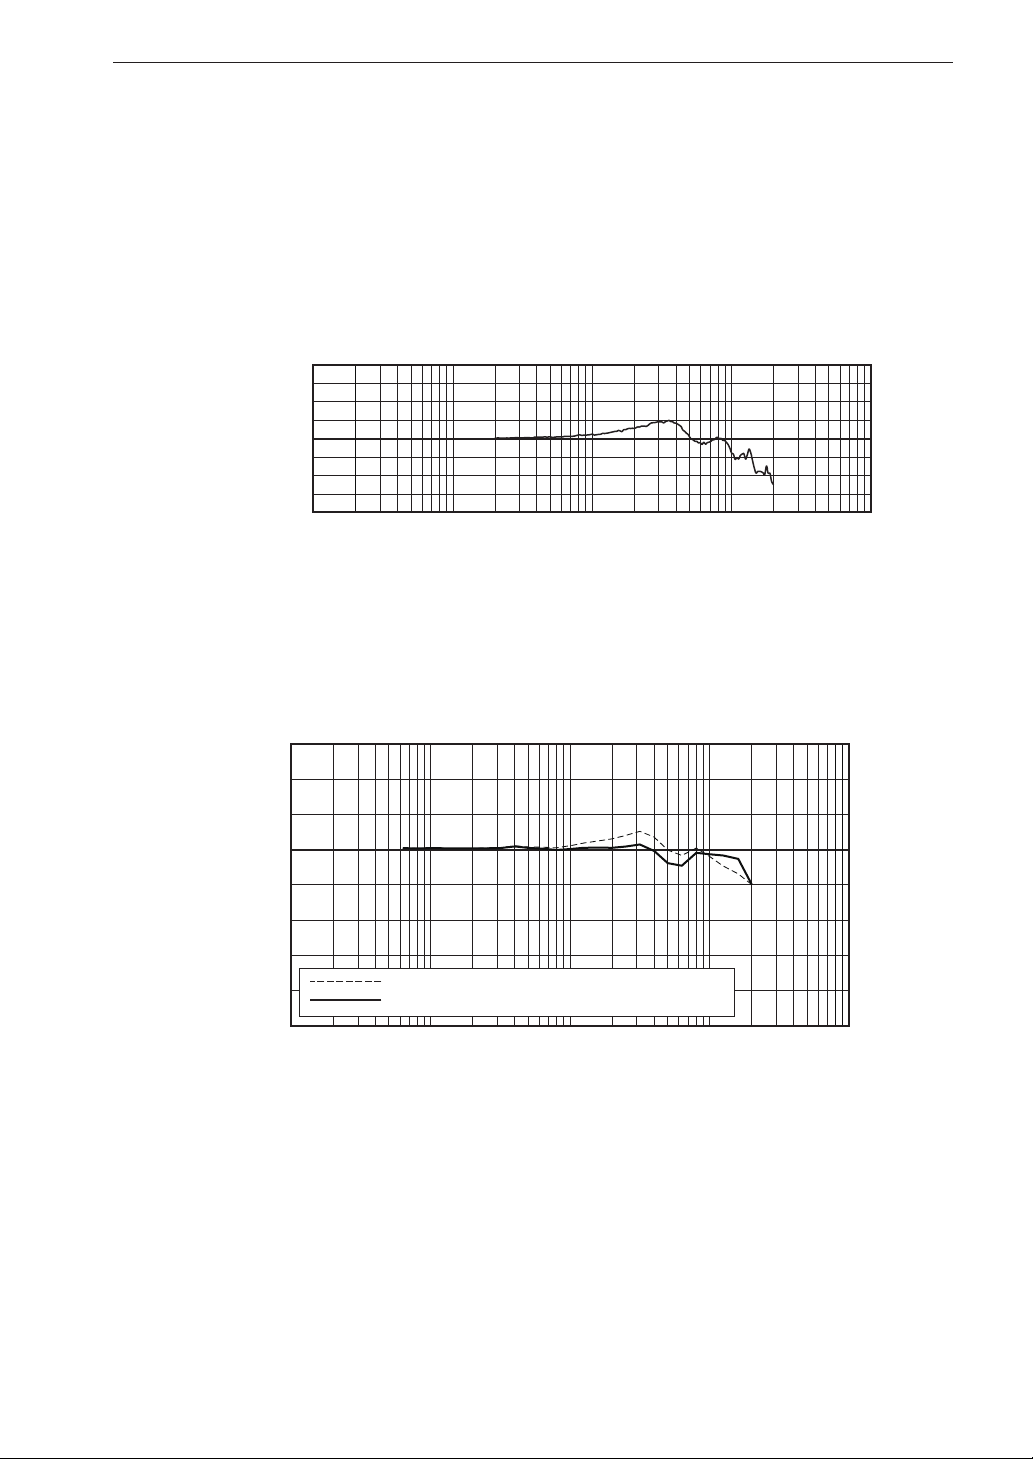
The in uence of the windscreen WS-10 on the acoustic performance of the
microphone is within ±1.0 dB up to 12.5 kHz, as shown in the diagram on
the next page.
100
Microphone only
90
80
70
60
50
40
Wind noise level (dB A)
30
2 5 10 20
With WS-10
130
120
Microphone only
110
100
90
80
70
60
Wind noise level (dB C)
2 5 10 20
With WS-10
wind velocity (m/s) wind velocity (m/s)
Fig. 8-1 Frequency weighting A Fig. 8-2 Frequency weighting C
100
wind velocity
15 m/s
10 m/s
5 m/s
1/3 octave band sound
pressure level (dB)
90
80
70
60
50
40
20 50 100 200 500
Frequency (Hz)
32
Fig. 9 Frequency response of wind noise measured with
windscreen WS-10 mounted microphone
Page 39
Description for IEC 61672-1
1.0
0.0
-1.0
Response (dB)
10 50 100 500 1 k 5 k 10 k 50 k
Frequency (Hz)
Fig. 10 In uence of windscreen WS-10 on acoustical properties
of microphone (refer red to microphone response without
windscreen)
3.0
2.0
1.0
0.0
-1.0
Response (dB)
-2.0
-3.0
-4.0
-5.0
10 50 100 500 1 k 5 k 10 k 50 k
Windscreen attached, with no correction for it
Windscreen attached, with correction for it
Frequency
(Hz)
Fig. 11 Frequency response with windscreen correction (WS-10)
33
Page 40
Description for IEC 61672-1
Effect of All-Weather Windscreen WS-15
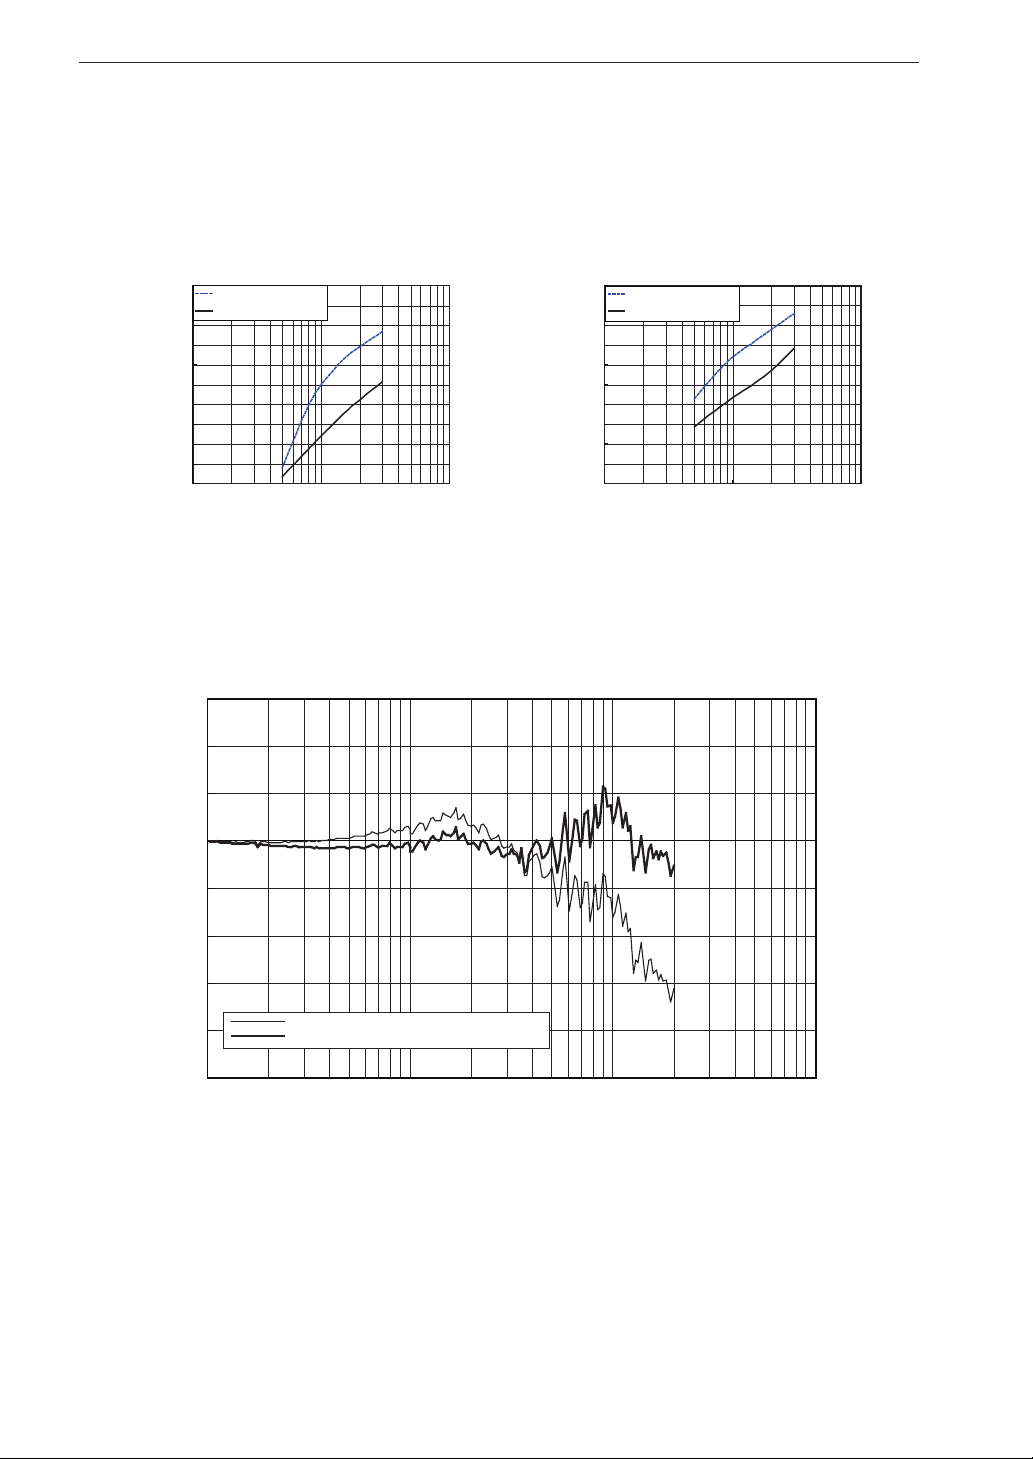
The windscreen WS-15 not only reduces measurement errors due to wind
noise, it also protects the microphone from rain.
The WS-15 characteristics are shown below.
130
Microphone only
120
With WS-15
110
100
90
80
70
60
50
Wind noise level (dB)
40
30
1 10 100
Wind velocity (m/s)
Fig. 12-1 Frequency weighting A Fig. 12-2 Frequency weighting C
130
Microphone only
120
With WS-15
110
100
90
80
70
60
50
Wind noise level (dB)
40
30
110100
Wind velocity (m/s)
3
2
1
0
-1
Response (dB)
-2
-3
-4
-5
100 1000 10000 100000
Windscreen attached, with no correction for it
Windscreen attached, with correction for it
Frequency (Hz)
Fig. 13 Frequency response with windscreen correction (WS-15)
34
Page 41
Description for IEC 61672-1
Effect of Rain-protection Windscreen WS-16
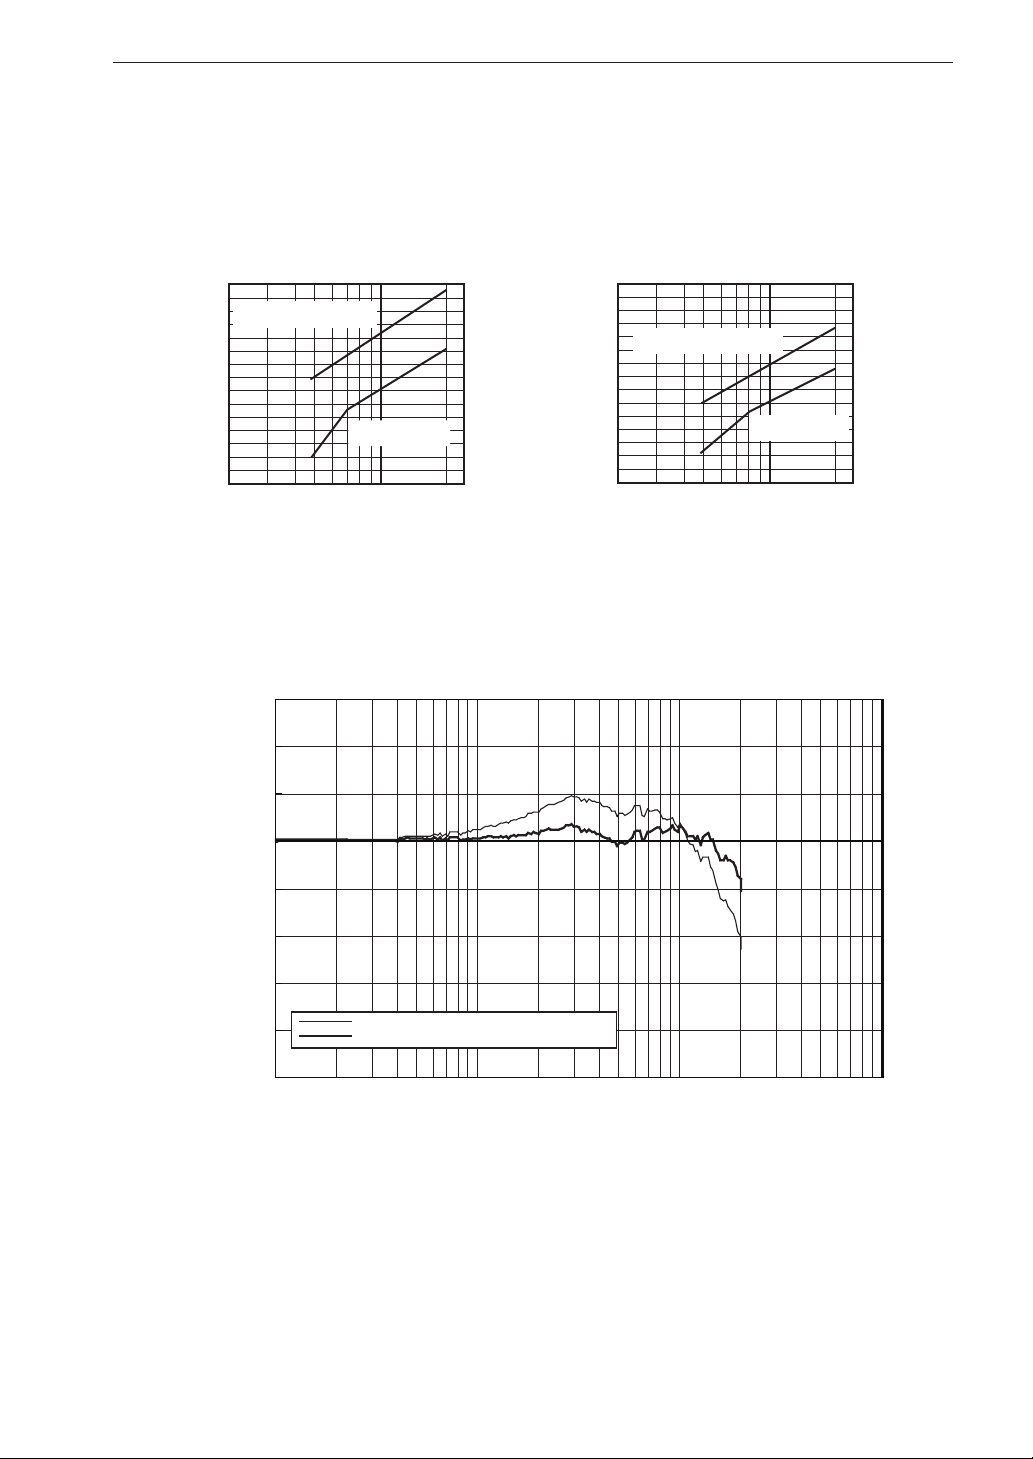
The windscreen WS-16 not only reduces measurement errors due to wind
noise, it also protects the microphone from rain.
The WS-16 characteristics are shown below.
100
Microphone only
90
80
70
60
50
40
Wind noise level (dB A)
30
2 5 10 20
With WS-16
130
120
Microphone only
110
100
90
80
70
60
Wind noise level (dB C)
2 5 10 20
With WS-16
wind velocity (m/s) wind velocity (m/s)
Fig. 14-1 Frequency weighting A Fig. 14-2 Frequency weighting C
3
2
1
0
-1
Response (dB)
-2
-3
-4
-5
100 1000 10000 100000
Windscreen attached, with no correction for it
Windscreen attached, with correction for it
Frequency (Hz)
Fig. 15 Frequency response with windscreen correction (WS-16)
35
Page 42
Description for IEC 61672-1
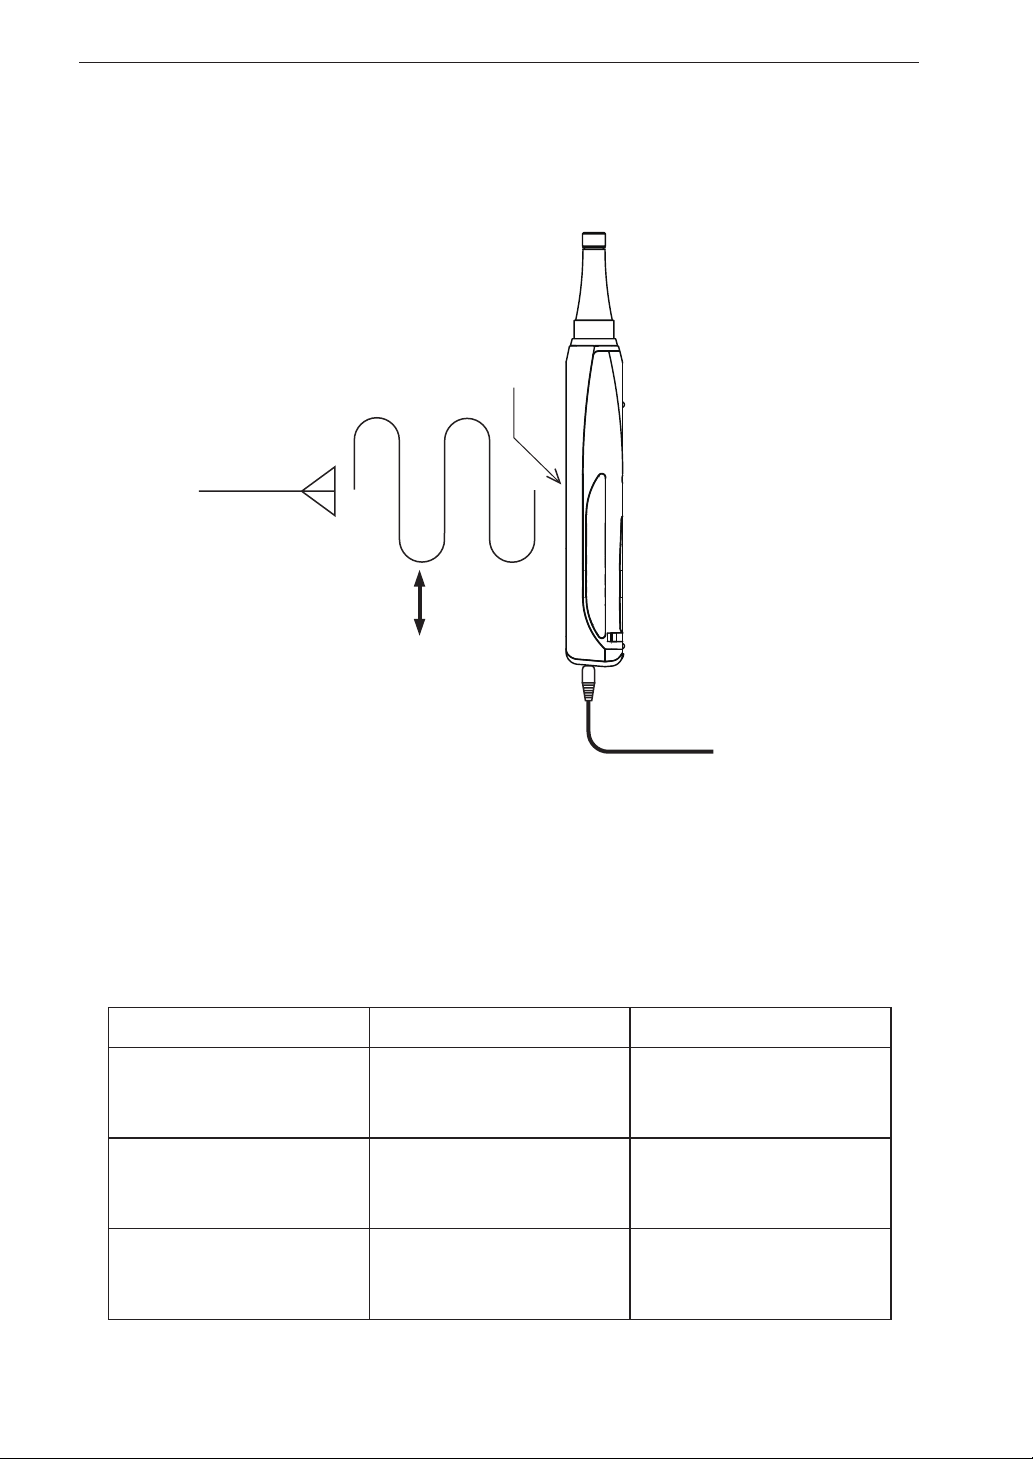
The greatest susceptibility configuration for radio
frequency elds
LCD
Antenna
Polarized electromagnetic
radiation is parallel to this space
AC OUTPUT, DC OUTPUT,
Comparator and USB cable connected
Fig. 16 The greatest susceptibility con guration for radio frequency elds
Statement of conforming to the basic statement
Tab. 2 Statement of conforming to the basic statement
NL-52 NL-42
Immunity (AC power frequency magnetic eld)
Immunity (Radio frequency electromagnetic
eld)
The speci cation of IEC
61672-1 Class 1 is satis ed
The speci cation of IEC
61672-1 Class 1 is satis ed
The speci cation of IEC
61672-1 Class 2 is satis ed
The speci cation of IEC
61672-1 Class 2 is satis ed
Emissions
36
The speci cation of IEC
61672-1 Class 1 is satis ed
The speci cation of IEC
61672-1 Class 2 is satis ed
Page 43
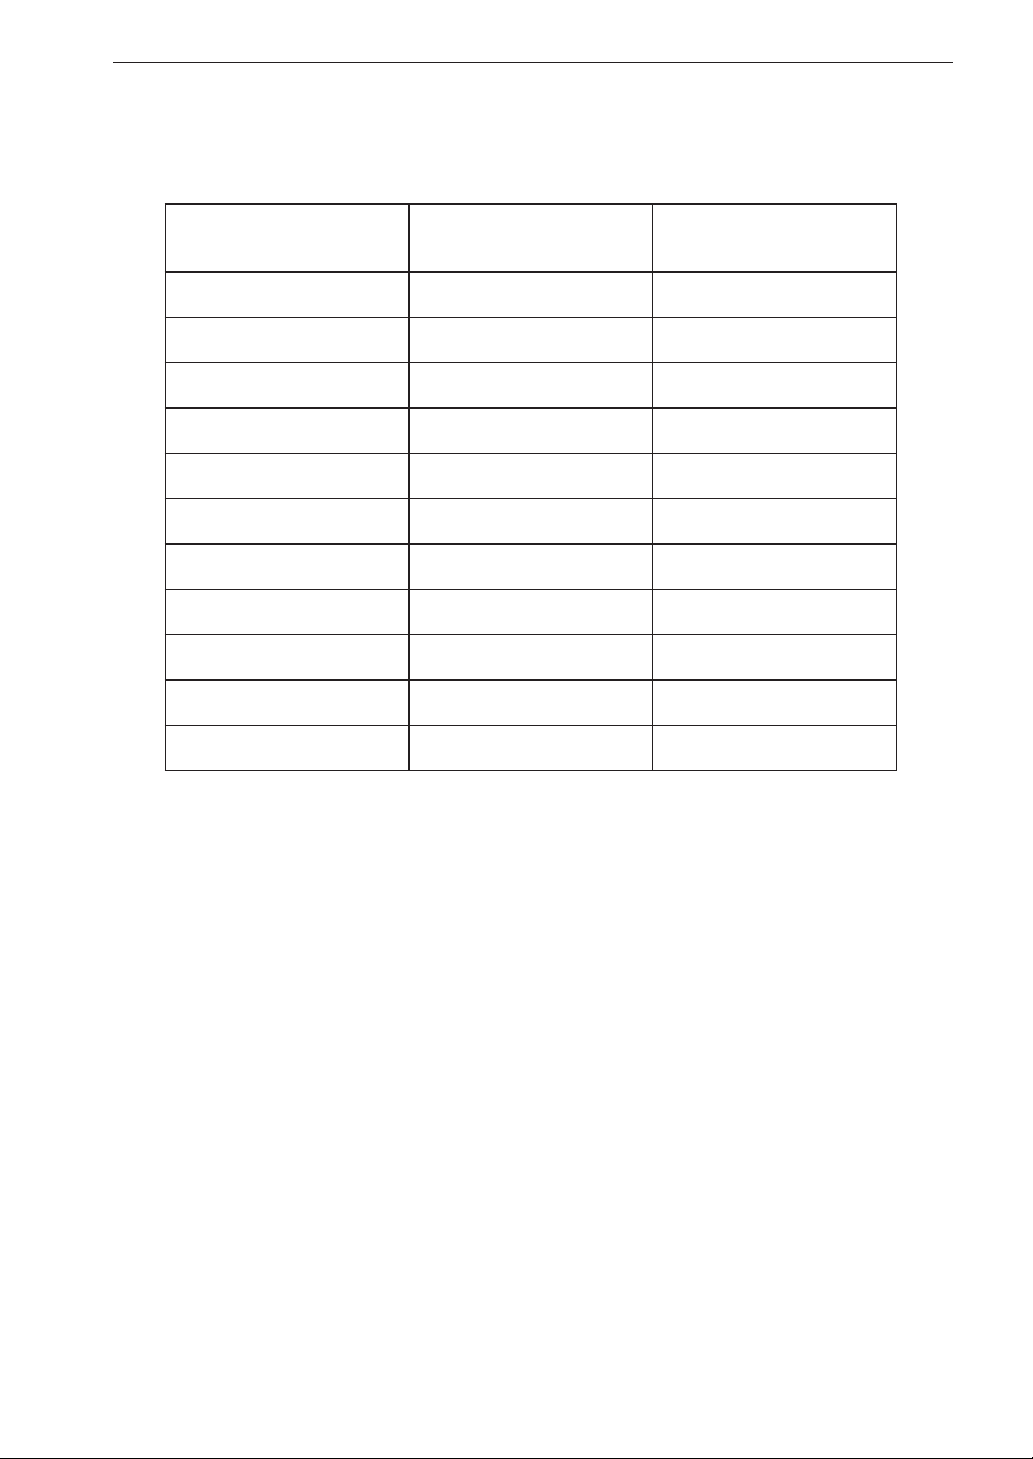
Adjustment data for sound calibrator
Tab. 3 Adjustment data for sound calibrator
Description for IEC 61672-1
Frequency (Hz)
NL-52
Correction (dB)
31.5 0.0 0.0
63 0.0 0.0
125 0.0 0.0
250 0.0 0.0
500 0.0 0.0
1000 0.0 0.1
2000 0.2 0.3
4000 0.9 1.3
8000 3.0 3.2
12500 5.9 6.5
16000 7.3 6.7
NL-42
Correction (dB)
37
Page 44
Description for IEC 61672-1
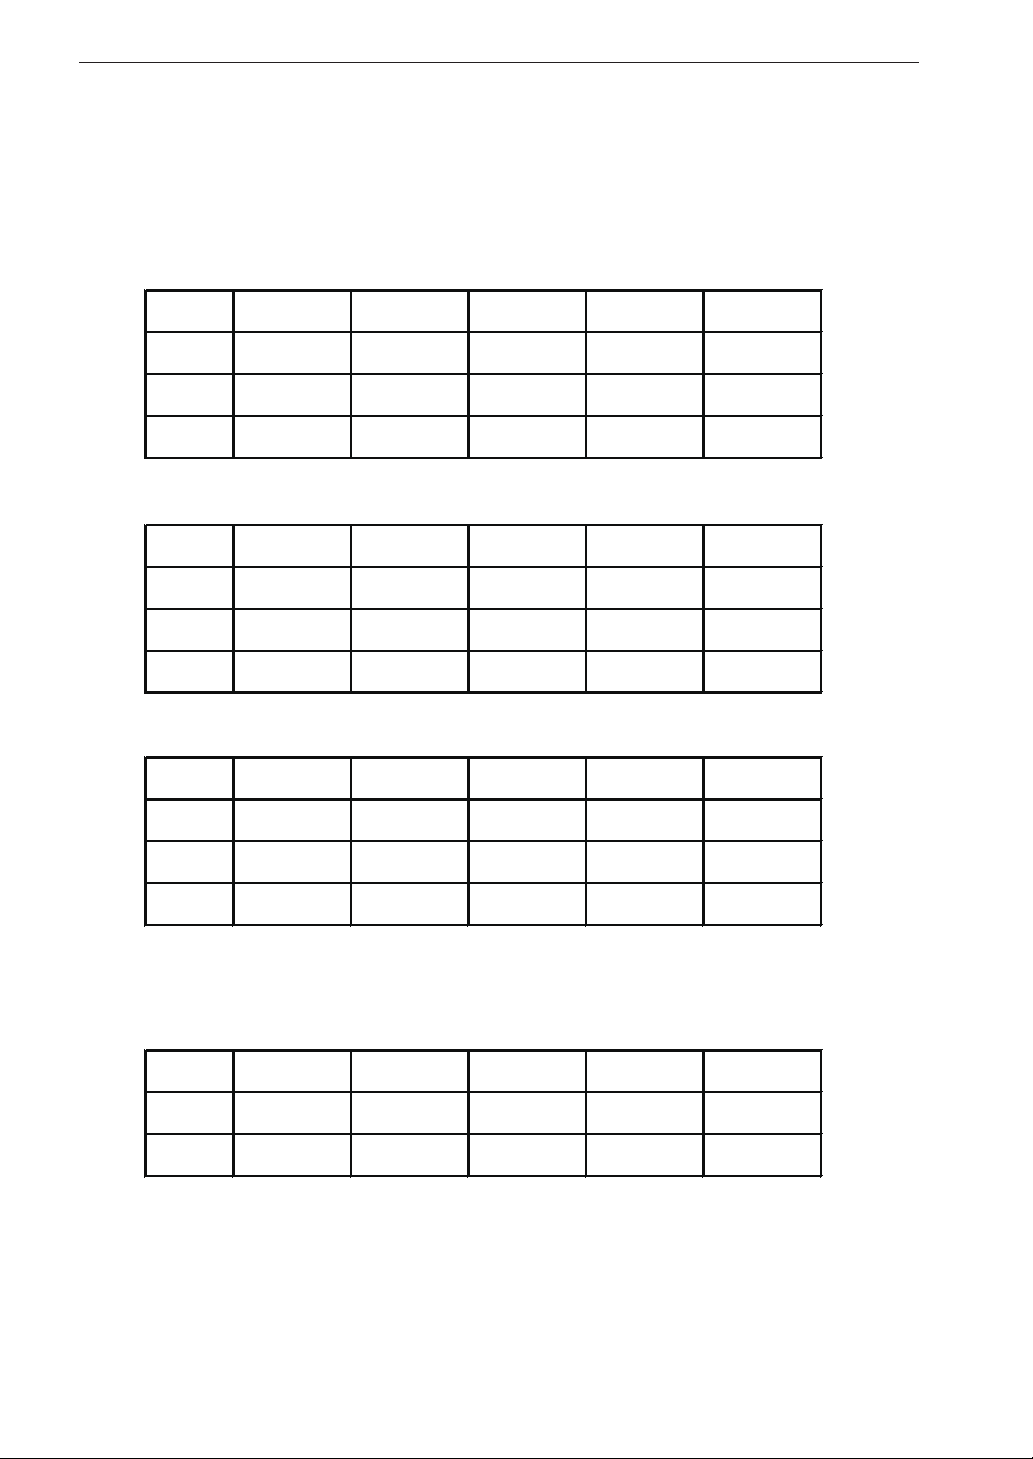
The lower and upper limits of the linear operating range
Tab. 4 The lower and upper limits of the linear operating range
A weighting
31.5 Hz 1 kHz 4 kHz 8 kHz 12.5 kHz
Upper
Start
Lower
C weighting
Upper
Start
Lower
Z weighting
Upper
Start
Lower
98.0 138.0 138.0 136.0 133.0
94.0 94.0 94.0 94.0 94.0
25.0 25.0 25.0 25.0 25.0
31.5 Hz 1 kHz 4 kHz 8 kHz 12.5 kHz
135.0 138.0 137.0 135.0 131.0
94.0 94.0 94.0 94.0 94.0
33.0 33.0 33.0 33.0 33.0
31.5 Hz 1 kHz 4 kHz 8 kHz 12.5 kHz
138.0 138.0 138.0 138.0 138.0
94.0 94.0 94.0 94.0 94.0
38.0 38.0 38.0 38.0 38.0
Measurement range
Upper
Lower
38
(dB)
L
A
(dB)
L
C
(dB)
L
Z
L
Cpeak
(dB)
L
Zpeak
138.0 138.0 138.0 141.0 141.0
25.0 33.0 38.0 55.0 60.0
(dB)
Page 45
Directional Characteristics
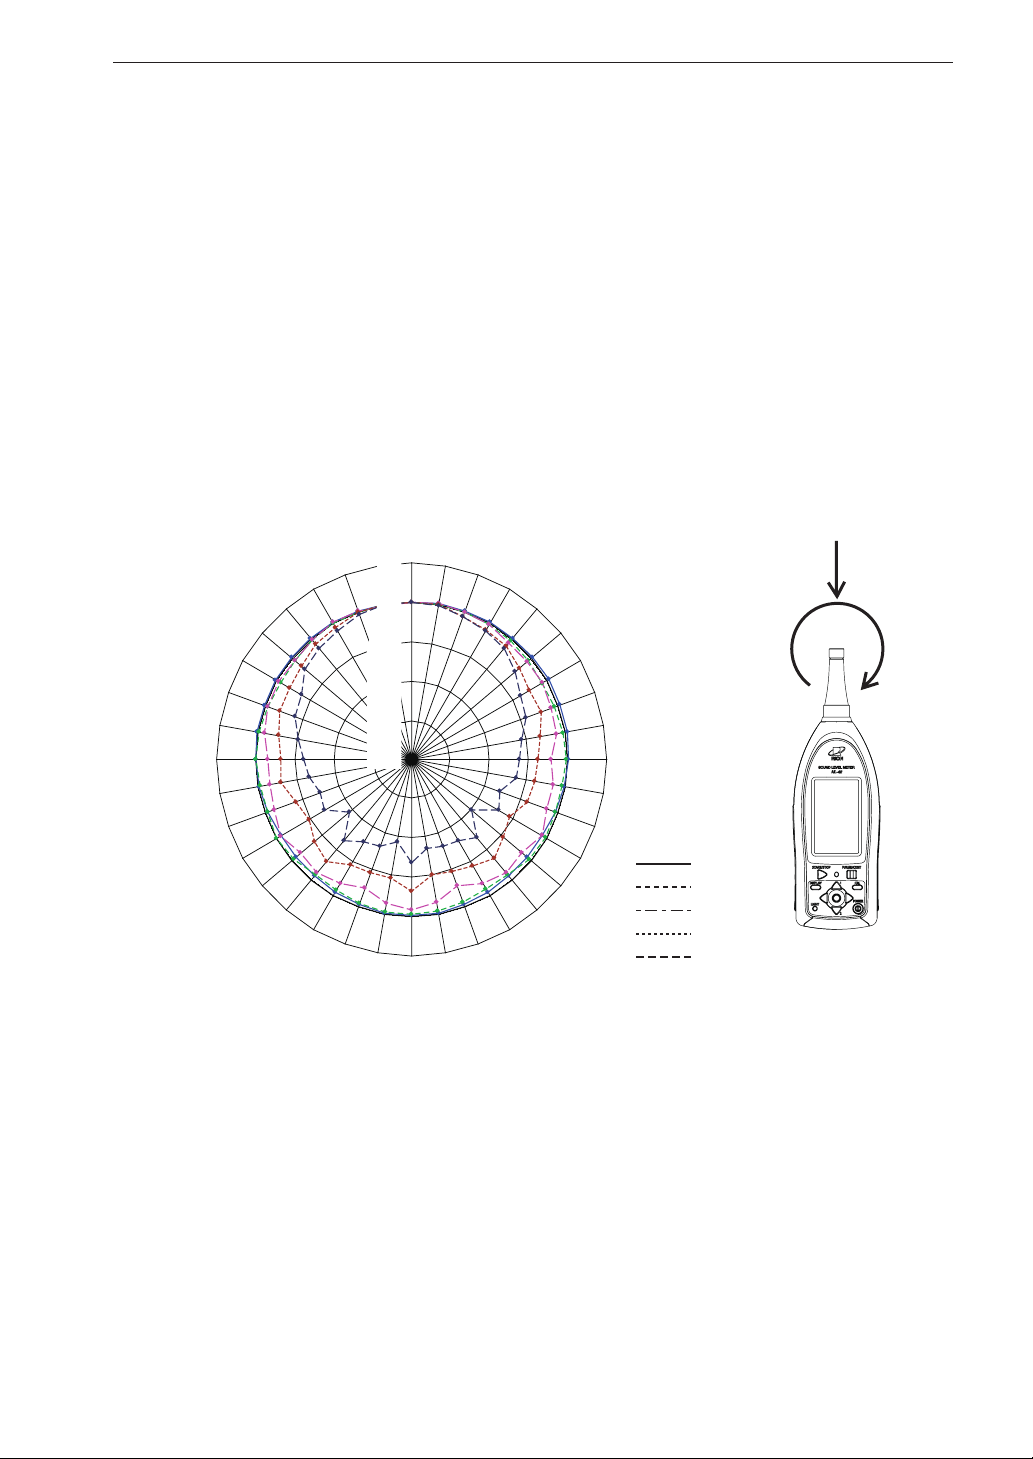
The directional characteristics of a microphone is a measure of its differing
sensitivity for sound waves arriving from various angles. Since the prepolar-
ized condenser microphone used in the NL-52/NL-42 is a pressure-sensitive
type, it should be equally sensitive in all directions. However, refraction
and cavity effects cause a certain microphone directional response at high
frequencies.
The diagrams below shows the directional characteristics for the NL-52/
NL-42.
00°
10°
20°
280°
290°
300°
310°
320°
330°
340°
350°
5dB
0dB
-5dB
-10dB
-15dB
Description for IEC 61672-1
Reference direction
of incidence
30°
40°
50°
60°
70°
80°
130°
120°
90°
100°
110°
1 kHz
2 kHz
4 kHz
8 kHz
12.5 kHz
270°
260°
250°
240°
230°
220°
210°
200°
190°
-20dB
180°
170°
160°
140°
150°
Fig. 17 Directional Characteristics of NL-52/NL-42 (Rotated horizontal)
39
Page 46
Description for IEC 61672-1
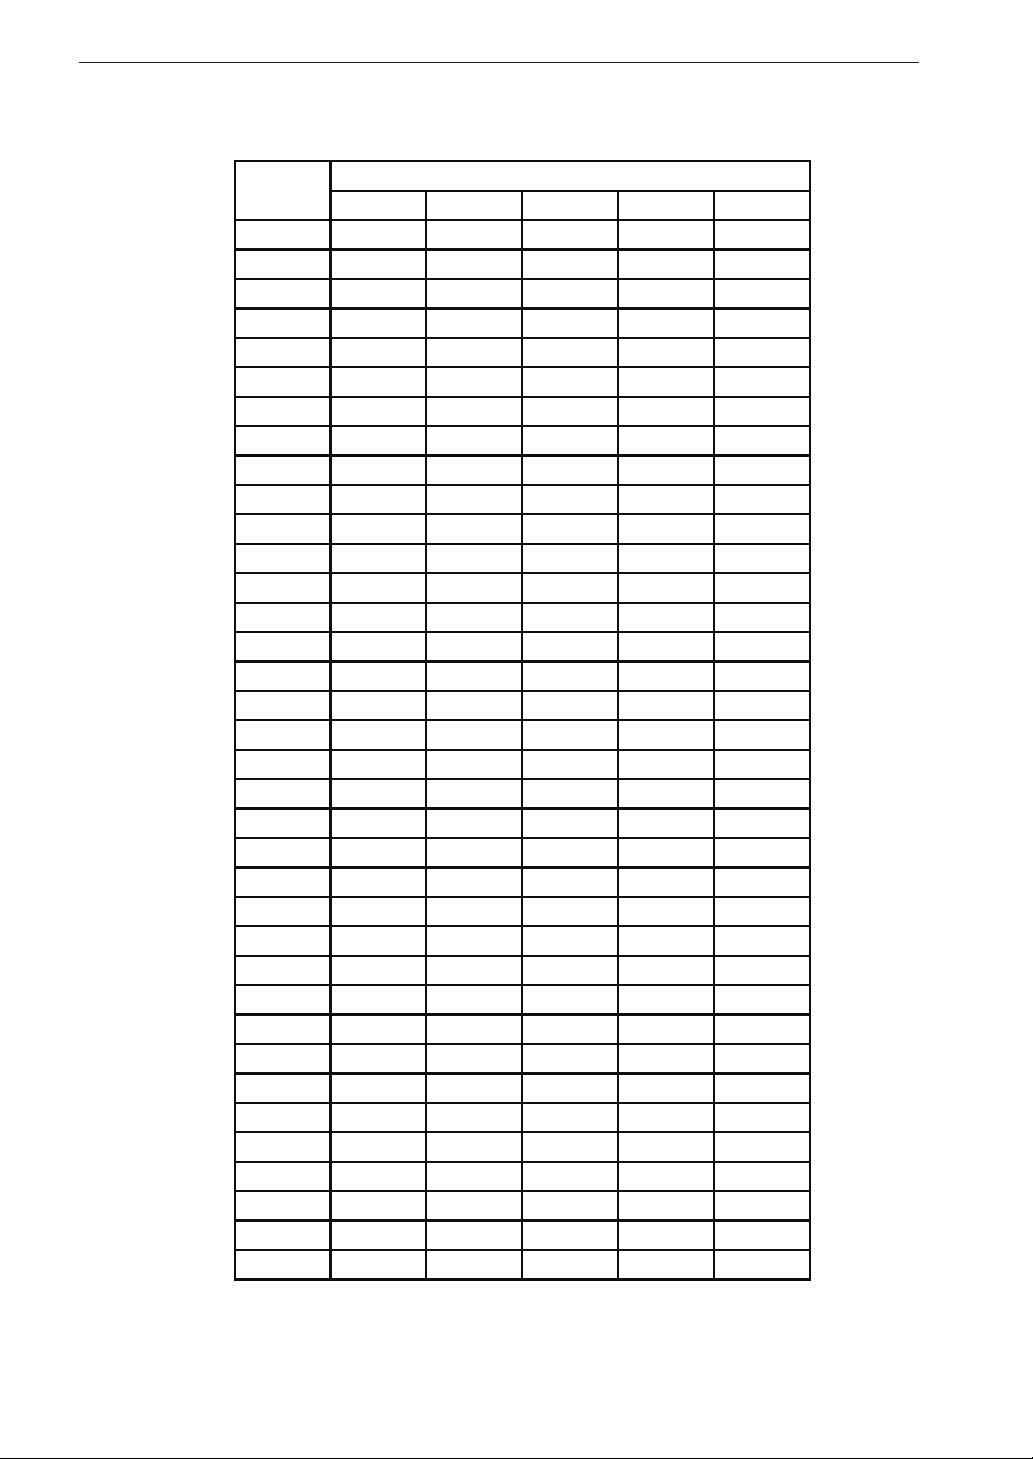
Tab. 5 Directional Characteristics of NL-52/NL-42 (Rotated horizontal)
Angle
°
0
10
20
30
40
50
60
70
80
90
100
110
120
130
140
150
160
170
180
190
200
210
220
230
240
250
260
270
280
290
300
310
320
330
340
350
Frequency (Hz)
1k 2k 4k 8k 12.5k
0.00 0.00 0.00 0.00 0.00
°
°
°
°
°
°
°
°
°
°
°
°
°
°
°
°
°
°
°
°
°
°
°
°
°
°
°
°
°
°
°
°
°
°
°
0.12 -0.02 0.05 -0.07 -0.20
0.09 -0.09 0.01 -0.67 -0.79
0.17 -0.16 -0.13 -0.94 -1.17
0.16 -0.28 -0.66 -1.13 -1.59
0.25 -0.50 -0.72 -1.96 -2.73
0.26 -0.72 -0.54 -2.52 -3.89
0.27 -0.58 -1.07 -2.23 -4.35
0.21 -0.30 -1.19 -3.29 -5.64
0.10 -0.18 -2.09 -3.83 -6.23
-0.23 -0.44 -1.53 -3.87 -6.47
-0.42 -0.51 -1.57 -4.17 -7.93
-0.66 -0.22 -0.69 -5.48 -7.19
-0.76 -0.36 -1.56 -4.61 -9.92
-0.68 -0.87 -1.11 -3.51 -6.97
-0.49 -1.04 -1.91 -4.34 -7.94
-0.29 -0.73 -2.98 -4.72 -8.22
-0.18 -0.45 -1.60 -5.04 -8.48
-0.13 -0.32 -0.87 -3.24 -6.93
-0.11 -0.32 -1.41 -4.66 -9.42
-0.25 -0.61 -2.55 -4.61 -8.24
-0.45 -0.91 -1.83 -4.51 -7.85
-0.67 -0.82 -1.18 -3.07 -6.65
-0.78 -0.30 -1.44 -3.85 -9.49
-0.73 -0.07 -0.61 -4.76 -7.16
-0.49 -0.28 -1.28 -4.16 -7.54
-0.20 -0.36 -1.55 -2.90 -6.68
0.03 -0.04 -1.57 -3.28 -6.24
0.14 -0.14 -0.86 -2.70 -5.22
0.15 -0.48 -0.38 -1.96 -4.06
0.18 -0.65 -0.32 -1.92 -3.59
0.14 -0.43 -0.41 -1.63 -2.10
0.13 -0.20 -0.19 -0.88 -1.56
0.08 -0.07 0.08 -0.63 -1.11
0.07 -0.04 0.13 -0.01 -0.50
0.02 -0.06 -0.10 0.02 -0.03
40
Page 47
280°
270°
290°
300°
310°
320°
330°
340°
350°
5dB
0dB
-5dB
-10dB
-15dB
-20dB
00°
10°
20°
Description for IEC 61672-1
Reference direction
of incidence
30°
40°
50°
60°
70°
80°
90°
130°
120°
100°
110°
1kHz
2kHz
4kHz
8kHz
12.5 kHz
260°
250°
240°
230°
220°
210°
200°
190°
180°
170°
160°
140°
150°
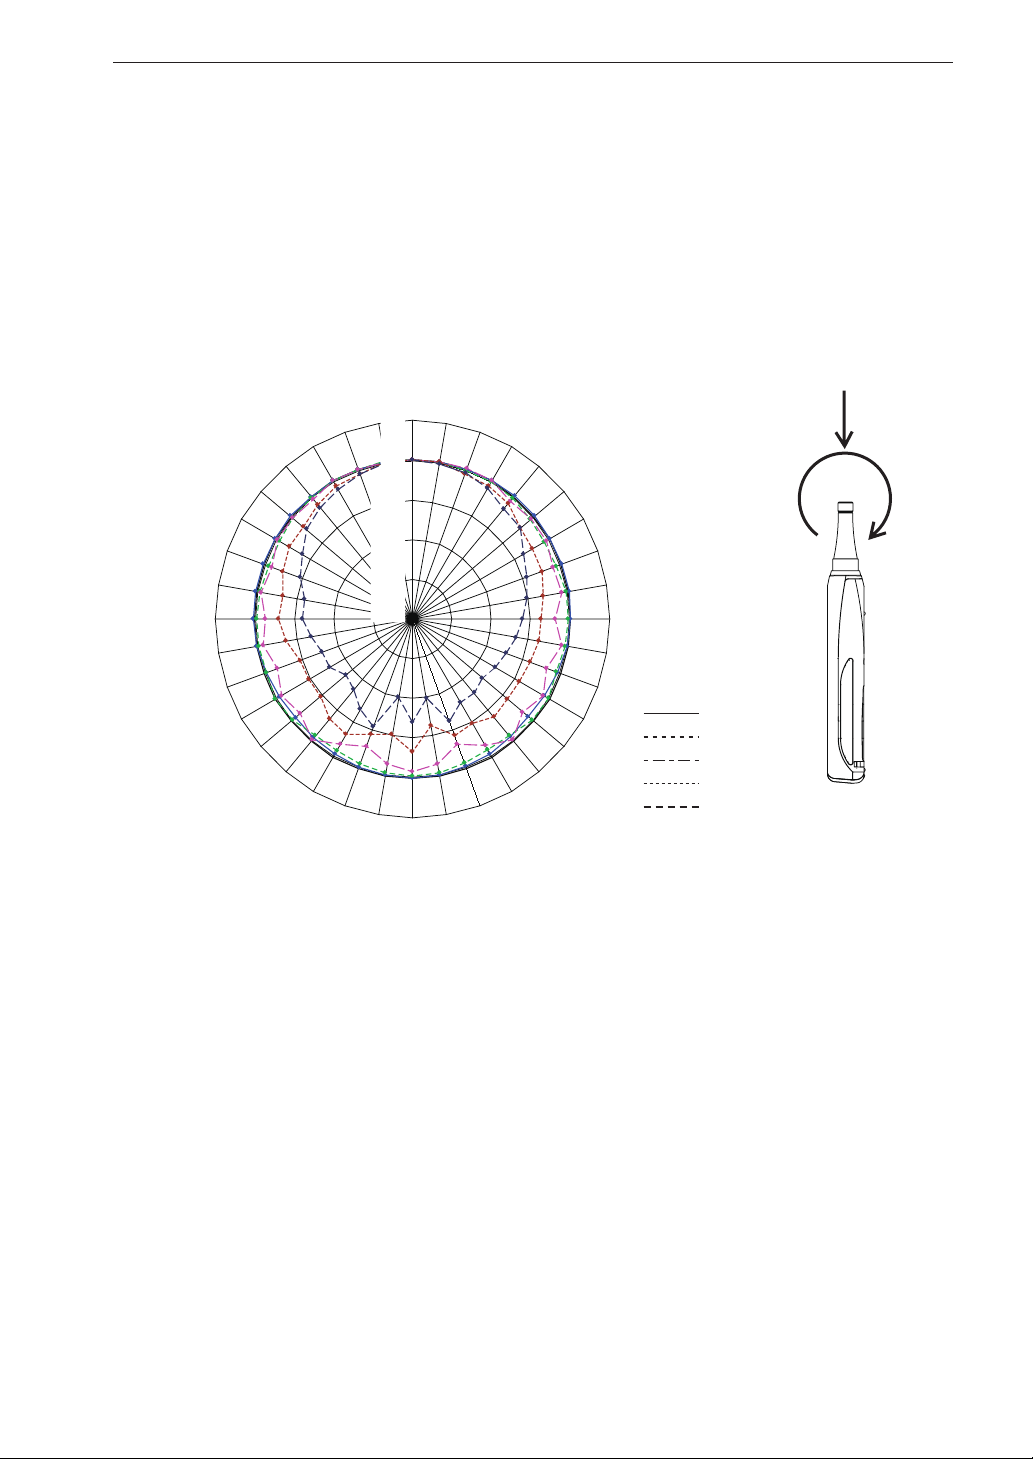
Fig. 18 Directional Characteristics of NL-52/NL-42 (Rotated vertical)
41
Page 48
Description for IEC 61672-1
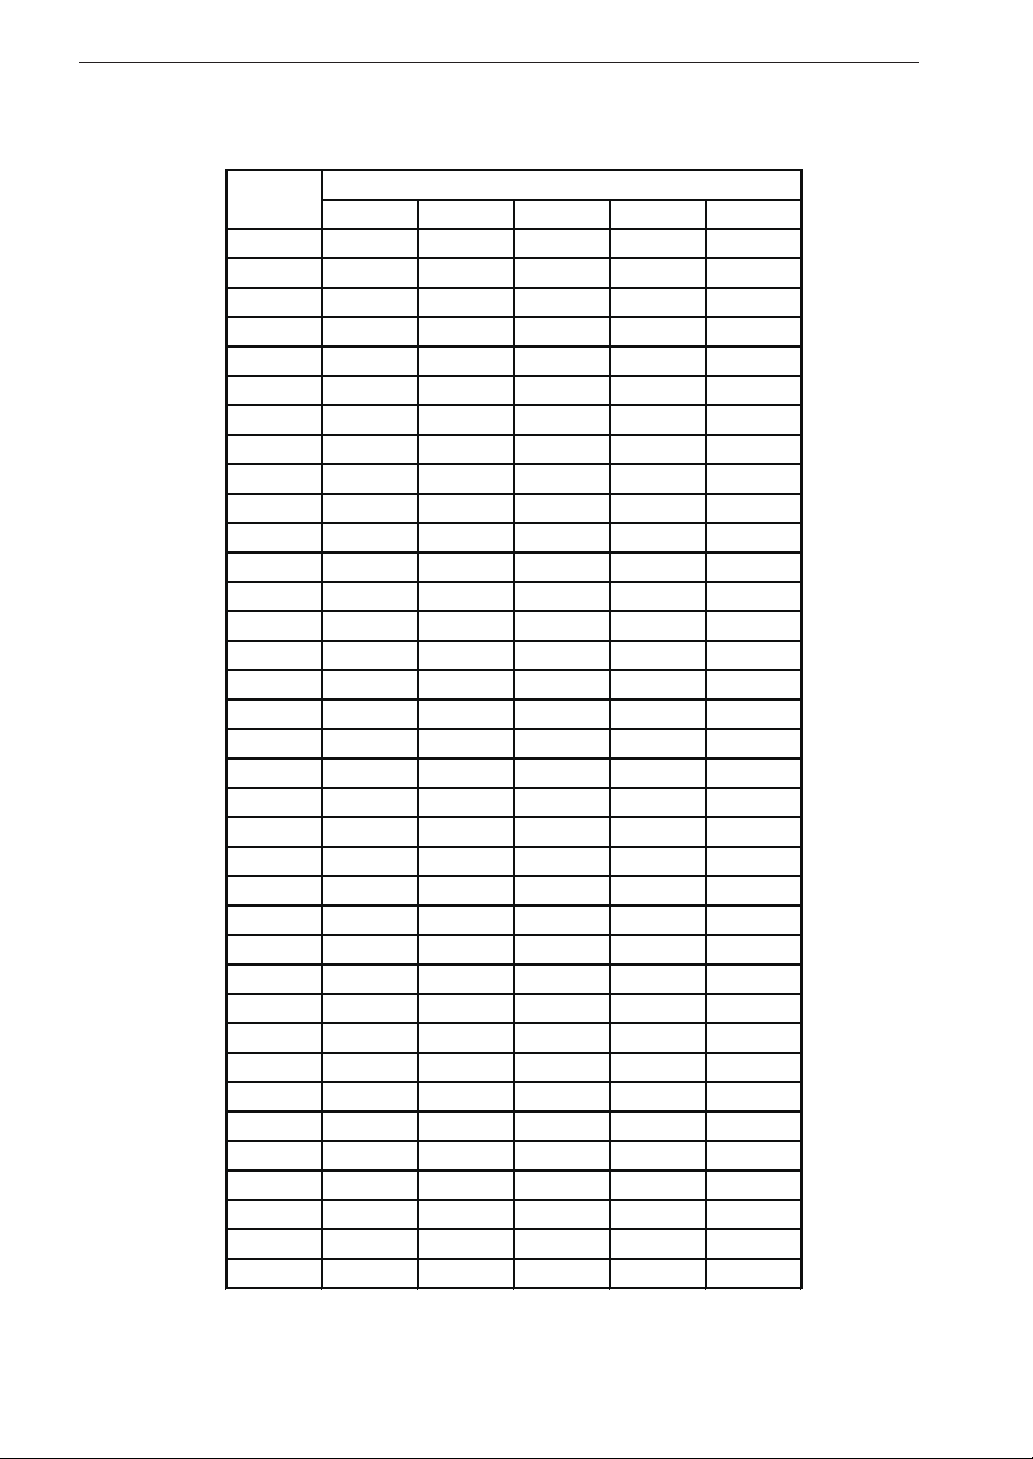
Tab. 6 Directional Characteristics of NL-52/NL-42 (Rotated vertical)
Angle
°
0
10
20
30
40
50
60
70
80
90
100
110
120
130
140
150
160
170
180
190
200
210
220
230
240
250
260
270
280
290
300
310
320
330
340
350
Frequency (Hz)
1k 2k 4k 8k 12.5k
0.00 0.00 0.00 0.00 0.00
°
°
°
°
°
°
°
°
°
°
°
°
°
°
°
°
°
°
°
°
°
°
°
°
°
°
°
°
°
°
°
°
°
°
°
0.06 0.01 0.06 -0.03 -0.20
0.05 -0.04 0.15 -0.46 -0.42
0.08 -0.11 0.06 -0.64 -1.06
0.13 -0.26 -0.61 -1.03 -1.90
0.16 -0.49 -0.43 -2.12 -2.23
0.23 -0.70 -0.39 -2.40 -3.64
0.23 -0.49 -1.11 -2.51 -4.54
0.12 -0.25 -0.76 -3.22 -5.22
0.05 -0.27 -1.91 -3.66 -6.06
-0.07 -0.32 -0.78 -3.77 -6.73
-0.35 -0.51 -1.91 -4.17 -7.28
-0.61 -0.12 -0.85 -4.46 -7.85
-0.76 -0.23 -1.79 -4.31 -8.37
-0.67 -0.89 -0.23 -3.99 -7.78
-0.45 -1.06 -1.68 -4.75 -7.90
-0.19 -0.79 -3.29 -4.38 -6.31
-0.05 -0.37 -1.51 -6.40 -9.85
-0.02 -0.27 -0.81 -3.23 -7.07
-0.10 -0.33 -1.52 -5.28 -10.12
-0.18 -0.66 -3.07 -4.54 -5.65
-0.41 -0.97 -1.78 -3.34 -6.85
-0.56 -0.87 -0.25 -3.53 -8.46
-0.67 -0.30 -1.50 -4.77 -8.89
-0.56 0.15 -0.86 -4.80 -7.81
-0.26 -0.19 -1.83 -4.81 -7.86
0.01 -0.22 -0.81 -3.77 -6.99
0.16 -0.32 -1.40 -3.02 -6.00
0.20 -0.41 -0.58 -3.30 -6.02
0.21 -0.53 -1.01 -2.44 -4.74
0.16 -0.57 -0.24 -1.93 -3.83
0.14 -0.31 -0.25 -1.91 -2.44
0.06 -0.09 -0.39 -1.25 -1.82
0.02 -0.03 -0.02 -0.62 -1.23
0.07 -0.02 0.06 -0.73 -0.64
0.04 0.12 -0.03 -0.02 -0.17
42
Page 49
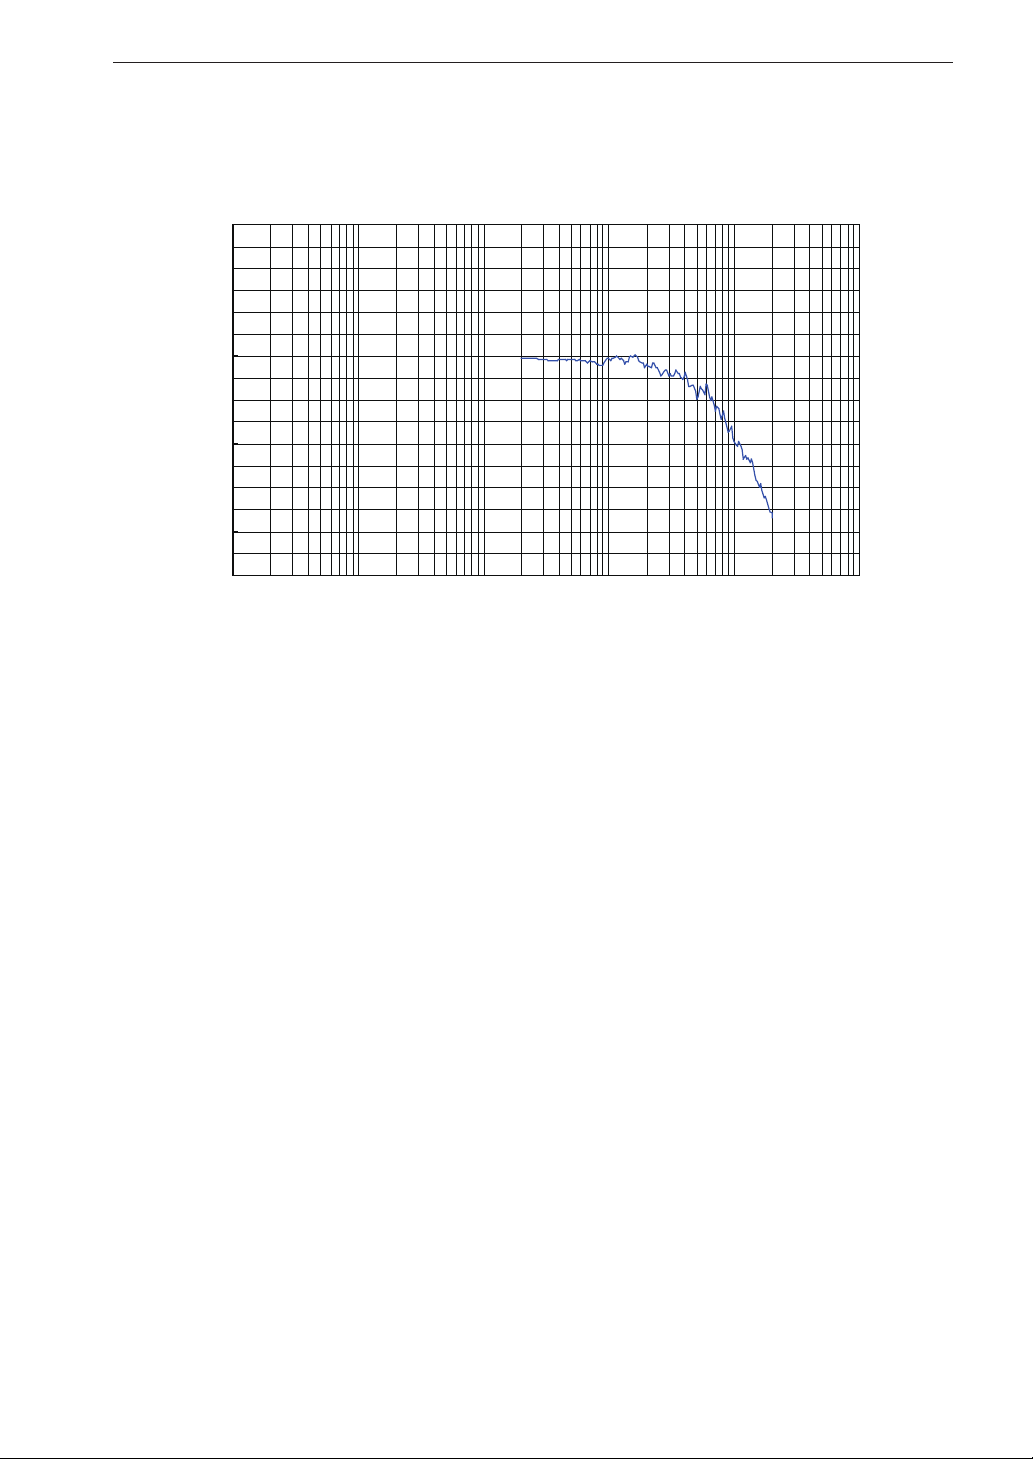
Random incidence response
(dB)
6
4
2
0
-2
Response (dB)
-4
-6
-8
-10
1 10 100 1000 10000 100000
Description for IEC 61672-1
Frequency (Hz)
Fig. 19 Random incidence response
43
Page 50

No. 55753 13-06
 Loading...