

Page 1

Aficio Color 6010/6110
(Cattleya, A257/A269)
Service Manual
Issued March 30, 1999, Ricoh CO., LTD.
Page 2

ø
IMPORTANT SAFETY NOTICES
PREVENTION OF PHYSICAL INJURY
1. Before disassembling or assembling parts of the copier and peripherals,
make sure that the copier power cord is unplugged.
2. The wall outlet should be near the copier and easily accessible.
3. Note that some components of the copier and the paper tray unit are
supplied with electrical voltage even if the main power switch is turned off.
4. If any adjustment or operation check has to be made with exterior covers off
or open while the main switch is turned on, keep hands away from electrified
or mechanically driven components.
5. If the Start key is pressed before the copier completes the warm-up period
(the Start key starts blinking red and green alternatively), keep hands away
from the mechanical and the electrical components as the copier starts
making copies as soon as the warm-up period is completed.
6. The inside and the metal parts of the fusing unit become extremely hot while
the copier is operating. Be careful to avoid touching those components with
your bare hands.
HEALTH SAFETY CONDITIONS
1. Never operate the copier without the ozone filters installed.
2. Always replace the ozone filters with the specified ones at the specified
intervals.
3. Toner and developer are non-toxic, but if you get either of them in your eyes
by accident, it may cause temporary eye discomfort. Try to remove with eye
drops or flush with water as first aid. If unsuccessful, get medical attention.
OBSERVANCE OF ELECTRICAL SAFETY STANDARDS
1. The copier and its peripherals must be installed and maintained by a
customer service representative who has completed the training course on
those models.
2. The NVRAM on the system control board has a lithium battery which can
explode if replaced incorrectly. Replace the NVRAM only with an identical
one. The manufacturer recommends replacing the entire NVRAM. Do not
recharge or burn this battery. Used NVRAM must be handled in accordance
with local regulations.
Page 3

SAFETY AND ECOLOGICAL NOTES FOR DISPOSAL
1. Do not incinerate toner bottles or used toner. Toner dust may ignite suddenly
when exposed to an open flame.
2. Dispose of used toner, developer, and organic photoconductors in
accordance with local regulations. (These are non-toxic supplies.)
3. Dispose of replaced parts in accordance with local regulations.
4. When keeping used lithium batteries in order to dispos e of them later, do not
put more than 100 batteries per sealed box. Storing larger numbers or not
sealing them apart may lead to chemical reactions and heat build-up.
LASER SAFETY
The Center for Devices and Radiological Health (CDRH) prohibits the repair of
laser-based optical units in the field. The optical housing unit can only be repaired
in a factory or at a location with the requisite equipment. The laser subsystem is
replaceable in the field by a qualified Customer Engineer. The laser chassis is not
repairable in the field. Customer engineers are therefore directed to return all
chassis and laser subsystems to the factory or service depot when replacement of
the optical subsystem is required.
WARNING
ø
Use of controls, or adjustment, or performance of procedures other than
those specified in this manual may result in hazardous radiation exposure.
WARNING
ø
Turn off the main switch before attempting any of the procedures in the
Laser Unit section. Laser beams can seriously damage your eyes.
CAUTION MARKING:
Page 4

TABLE OF CONTENTS
1. OVERALL MACH INE INFORMATION........................................1-1
1.1 SPECIFICATIONS.................................................................................... 1-1
1.1.1 MAJOR UNITS................................................................................. 1-1
1.1.2 BASIC SPECIFICATIONS............................................................... 1-2
1.1.3 PLATEN/ARDF ORIGINAL SIZE DETECTION................................ 1-6
1.1.4 COPY PAPER SIZES...................................................................... 1-7
1.1.5 NOISE EMISSION........................................................................... 1-8
1.1.6 POWER CONSUMPTION................................................................ 1-8
1.2 MECHANISM OVERVIEW ....................................................................... 1-9
1.2.1 IMAGE GENERATION PROCESS.................................................. 1-9
1.2.2 MAJOR UNITS AND PAPER PATH .............................................. 1-11
1.3 PARTS LAYOUT .................................................................................... 1-13
1.3.1 MAJOR UNIT LAYOUT DIAGRAM................................................ 1-13
1.4 DRIVE LAYOUT ..................................................................................... 1-14
1.5 AIR FLOW .............................................................................................. 1-15
1.5.1 AIR FLOW SYSTEM 1 ................................................................... 1-15
1.5.2 AIR FLOW SYSTEM 2 ................................................................... 1-16
1.6 ELECTRICAL PARTS LAYOUT............................................................. 1-17
1.6.1 ELECTRICAL PARTS LAYOUT 1.................................................. 1-17
1.6.2 ELECTRICAL PARTS LAYOUT 2.................................................. 1-18
1.6.3 ELECTRICAL PARTS LAYOUT 3.................................................. 1-19
1.6.4 ELECTRICAL PARTS LAYOUT 4.................................................. 1-20
1.6.5 ELECTRICAL PARTS LAYOUT 5.................................................. 1-21
1.6.6 ELECTRICAL PARTS LAYOUT 6.................................................. 1-22
1.6.7 ELECTRICAL PARTS LAYOUT 7.................................................. 1-23
1.7 ELECTRICAL PARTS DESCRIPTIONS................................................. 1-24
2. DETAILED SECTION DESCRIPTIONS.......................................2-1
2.1 PROCESS CONTROL.............................................................................. 2-1
2.1.1 OVERVIEW ..................................................................................... 2-1
2.1.2 POTENTIAL CONTROL .................................................................. 2-2
Overview.............................................................................................. 2-2
Potential Control Timing....................................................................... 2-2
2.1.3 PROCESS CONTROL γ CORRECTION ......................................... 2-4
What is process control γ?................................................................... 2-4
How is it done?..................................................................................... 2-4
Process Control γ Correction Timing.................................................... 2-5
Relationship Between Process Control γ Correction, ACC,
and Other γ Corrections.................................................................... 2-5
2.1.4 PROCESS CONTROL SELF CHECK OPERATION FLOW............ 2-6
Step 1: VSG Adjustment...................................................................... 2-7
Step 2: Generating ID Sensor Patch Patterns...................................... 2-7
i
Page 5

Step 3: Sensor Pattern Potential Detection.......................................... 2-8
Step 4: Sensor Pattern Density Detection............................................ 2-9
Process................................................................................................ 2-9
Step 5: Toner Amount Calculation ..................................................... 2-11
Step 6: Development Potential Calculation........................................ 2-11
Step 7: Selecting the Optimum VD, VB, VL .......................................2-12
2.1.5 TONER SUPPLY CONTROL......................................................... 2-13
Toner Supply Control Modes ............................................................. 2-13
TD Sensor Output.............................................................................. 2-14
Toner Supply Calculation...................................................................2-14
Detecting VSP for Toner Supply Control............................................ 2-14
Calculating the Amount of Toner on the Drum................................... 2-15
Toner Near End/Toner End Detection................................................ 2-15
2.2 DRUM UNIT............................................................................................ 2-17
2.2.1 MAJOR COMPONENTS................................................................ 2-17
2.2.2 DRUM UNIT DRIVE....................................................................... 2-18
Drum Drive......................................................................................... 2-18
Cleaning Drive.................................................................................... 2-18
2.2.3 CHARGE CORONA UNIT ............................................................. 2-19
2.2.4 CHARGE CORONA UNIT CLEANER............................................ 2-20
2.2.5 CLEANING MECHANISM.............................................................. 2-21
Cleaning............................................................................................. 2-21
Lubricant Application.......................................................................... 2-21
2.2.6 PRE-CLEANING CORONA (PCC) ................................................ 2-21
2.2.7 QUENCHING................................................................................. 2-22
2.2.8 CARRIER CATCHER .................................................................... 2-22
2.3 SCANNER UNIT..................................................................................... 2-23
2.3.1 OVERVIEW ................................................................................... 2-23
2.3.2 SCANNER..................................................................................... 2-24
2.3.3 SCANNER DRIVE ......................................................................... 2-25
2.3.4 COLOR CCD ................................................................................. 2-26
2.3.5 WHITE PLATE SCANNING........................................................... 2-27
2.3.6 SCANNER IPU .............................................................................. 2-27
2.3.7 ORIGINAL SIZE DETECTION....................................................... 2-28
2.3.8 OTHERS........................................................................................ 2-30
Anti-condensation Heater................................................................... 2-30
Fans................................................................................................... 2-30
2.4 IMAGE PROCESSING ........................................................................... 2-31
2.4.1 OVERVIEW ................................................................................... 2-31
2.4.2 SCANNER SECTION BLOCK DIAGRAM...................................... 2-32
2.4.3 SCANNER FUNCTIONS ............................................................... 2-33
Photoelectric Conversion................................................................... 2-33
Signal Processing (Analog ASIC)....................................................... 2-33
A/D Conversion.................................................................................. 2-33
Shading Compensation Circuit........................................................... 2-34
D/A Conversion.................................................................................. 2-35
Scan Line Correction Circuit .............................................................. 2-35
2.4.4 IPU SECTION BLOCK DIAGRAM................................................. 2-36
2.4.5 IPU FUNCTIONS...........................................................................2-37
ii
Page 6

Scanner γ Conversion and Picture Element Correction...................... 2-37
ACS (Auto Color Selection)................................................................ 2-39
Automatic Original Type Selection..................................................... 2-40
Image Separation............................................................................... 2-41
Filtering and Color Conversion........................................................... 2-42
Magnification Processing................................................................... 2-46
Image Creation................................................................................... 2-47
Gradation Processing......................................................................... 2-49
Area Manipulation Functions.............................................................. 2-52
CPU ................................................................................................... 2-52
IPU Board Test................................................................................... 2-52
2.5 LASER EXPOSURE............................................................................... 2-53
2.5.1 OVERVIEW ................................................................................... 2-53
2.5.2 LD UNIT......................................................................................... 2-54
LD Safety Switch................................................................................ 2-54
LD Unit Configuration......................................................................... 2-55
Auto Power Control (APC)................................................................. 2-56
2.5.3 LASER OPTICS SYSTEM............................................................. 2-57
Cylindrical Lens.................................................................................. 2-57
Polygon Mirror.................................................................................... 2-57
f θ Lenses and the BTL...................................................................... 2-58
Laser Synchronization Mechanism.................................................... 2-58
Laser Exposure Control ..................................................................... 2-59
Multibeam Laser Exposure ................................................................ 2-60
Laser Diode Control Board Functions................................................ 2-60
2.6 DEVELOPMENT UNIT........................................................................... 2-61
2.6.1 OVERVIEW ................................................................................... 2-61
2.6.2 REVOLVER MECHANISM............................................................. 2-62
Revolver Drive.................................................................................... 2-63
Revolver Home Position Detection..................................................... 2-64
2.6.3 DEVELOPMENT MECHANISM..................................................... 2-65
2.6.4 DEVELOPMENT DRIVE................................................................ 2-66
2.6.5 DEVELOPER AGITATION............................................................. 2-66
2.6.6 TONER AGITATION...................................................................... 2-67
2.6.7 DEVELOPMENT BIAS................................................................... 2-67
2.6.8 TD SENSOR NONCONTACT COUPLER ..................................... 2-68
2.6.9 TONER SUPPLY MECHANISM.................................................... 2-69
2.6.10 TONER CARTRIDGE DETECTION............................................. 2-70
2.6.11 TONER CARTRIDGE SHUTTER LOCK PIN............................... 2-70
2.6.12 INCORRECT TONER INSTALLATION PREVENTION ............... 2- 70
2.6.13 TONER END SENSOR................................................................ 2-71
2.6.14 TONER END RECOVERY........................................................... 2-72
2.6.15 TONER LOOSENING..................................................................2-73
2.6.16 REVOLVER LOCK MECHANISM................................................ 2-74
2.7 TRANSFER BELT UNITS....................................................................... 2-75
2.7.1 OVERVIEW ................................................................................... 2-75
2.7.2 IMAGE TRANSFER BELT SECTION............................................ 2-76
Image Transfer Belt Drive Mechanism............................................... 2-76
Belt Tension Release Mechanism...................................................... 2-77
iii
Page 7

Image Transfer Belt Bias.................................................................... 2-78
Belt Mark Sensor Mechanism............................................................ 2-78
Belt Cleaning Mechanism .................................................................. 2-79
Cleaning Vacuum............................................................................... 2-81
Toner Collection Mechanism.............................................................. 2-81
2.7.3 PAPER TRANSFER BELT SECTION............................................ 2-82
Paper Transfer Unit Contact/Release Mechanism............................. 2-82
Paper Transfer Belt Drive................................................................... 2-82
Paper Transfer Belt Cleaning............................................................. 2-83
Paper Transfer Bias........................................................................... 2-84
Paper Transfer Belt Discharge........................................................... 2-85
Paper Separation Mechanism............................................................ 2-85
2.8 PAPER FEED AND REGISTRATION SECTION.................................... 2-86
2.8.1 MAJOR COMPONENTS................................................................ 2-86
Diagram ............................................................................................. 2-86
2.8.2 PAPER TRAY SECTION............................................................... 2-87
Paper Feed/Separation Mechanism................................................... 2-87
Reverse Roller Release Mechanism.................................................. 2-87
Paper Feed Operation........................................................................ 2-87
Paper Lift Mechanism ........................................................................2-88
Paper End Detection..........................................................................2-89
Paper Near End Detection................................................................. 2-89
2.8.3 BY-PASS PAPER FEED SECTION............................................... 2-90
By-pass Feed Table........................................................................... 2-90
By-pass Feed Unit.............................................................................. 2-90
By-pass Paper End Sensor................................................................ 2-90
By-pass Pick-up Roller Pressure........................................................ 2-91
By-pass Pick-up/Reverse Solenoid Timing Chart...............................2-92
2.8.4 PAPER FEED DRIVE.................................................................... 2-93
Tray Feed Unit Drive.......................................................................... 2-93
Registration Roller Drive.................................................................... 2-93
By-pass Feed Unit Drive.................................................................... 2-93
2.9 TRANSPORT, FUSING, AND EXIT........................................................ 2-94
2.9.1 MAJOR COMPONENTS................................................................ 2-94
2.9.2 DRIVE MECHANISM..................................................................... 2-95
2.9.3 FUSING OVERVIEW..................................................................... 2-96
2.9.4 FUSING TEMPERATURE CONTROL........................................... 2-97
2.9.5 FUSING PRESSURE..................................................................... 2-97
2.9.6 OIL SUPPLY.................................................................................. 2-98
2.9.7 CLEANING MECHANISM.............................................................. 2-98
2.9.8 PAPER EXIT AND PAPER INVERSION....................................... 2-99
Paper Exit Mechanism....................................................................... 2-99
Junction Gate Mechanism.................................................................. 2-99
Paper Exit Cover................................................................................2-99
2.10 DUPLEX TRAY................................................................................... 2-100
2.10.1 OVERVIEW ............................................................................... 2-100
2.10.2 DRIVE MECHANISM................................................................. 2-101
2.10.3 PAPER FEED INTO THE DUPLEX TRAY................................. 2-102
Duplex Stacking............................................................................... 2-102
iv
Page 8

Paper Feed from the Duplex Tray.................................................... 2-102
Duplex Entrance to Duplex Tray...................................................... 2-103
2.10.4 JOGGER MECHANISM............................................................. 2-104
2.10.5 PAPER FEED FROM THE DUPLEX TRAY............................... 2-105
Bottom Plate Lift Mechanism ........................................................... 2-105
2.10.6 PAPER FEED-OUT MECHANISM............................................. 2-106
2.11 SYSTEM CONFIGURATION.............................................................. 2-107
2.11.1 CONFIGURATION..................................................................... 2-107
2.11.2 NORMAL COPY MODE............................................................. 2-108
Main Power Switch Off State ........................................................... 2-108
Power-off (Sleep) State.................................................................... 2-108
Copier Modes................................................................................... 2-109
2.11.3 OPERATION PANEL................................................................. 2-110
2.11.4 PRINTER CONTROLLER INTERFACE .................................... 2-111
3. INSTALLATION PROCEDURES................................................. 3-1
3.1 INSTALLATION REQUIREMENTS .......................................................... 3-1
3.1.1 DIMENSIONS.................................................................................. 3-1
3.1.2 ENVIRONMENT ..............................................................................3-2
Environmental Requirements............................................................... 3-2
Minimum Space Requirements............................................................ 3-3
Power Requirements............................................................................ 3-4
3.2 COPIER.................................................................................................... 3-5
3.2.1 ACCESSORY CHECK..................................................................... 3-5
3.2.2 PREPERATION............................................................................... 3-6
3.2.3 DEVELOPER INSTALLATION....................................................... 3-10
3.2.4 LOADING TONER CARTRIDGES................................................. 3-14
3.2.5 FUSING UNIT................................................................................ 3-16
3.2.6 DEFAULT SETTINGS AND OPERATION CHECKS..................... 3-17
3.2.7 HEIGHT ADJUSTMENT................................................................ 3-19
3.2.8 COUNTER DISPLAY SETTING...................................................... 3-19
3.2.9 RESETTING THE ELECTRONIC TOTAL COUNTER................... 3-19
3.2.10 PREPARATION FOR TRANSPORT............................................ 3-20
3.3 PLATEN COVER (A749-01)................................................................... 3-21
3.3.1 INSTALLATION............................................................................. 3-21
3.4 ARDF (A663).......................................................................................... 3-22
3.4.1 ACCESSORY CHECK................................................................... 3-22
3.4.2 INSTALLATION............................................................................. 3-23
3.5 SORTER STAPLER (A831).................................................................... 3-24
3.5.1 INSTALLATION............................................................................. 3-24
3.6 LCT (A683)............................................................................................. 3-29
3.6.1 INSTALLATION............................................................................. 3-29
3.7 LCT ADAPTER (A840)........................................................................... 3-30
3.7.1 INSTALLATION............................................................................. 3-30
3.8 FILM PROJECTOR TABLE (A702-19)................................................... 3-36
3.8.1 INSTALLATION............................................................................. 3-36
v
Page 9

3.9 FILM PROJECTOR UNIT(A846) ............................................................ 3-38
3.9.1 ACCESSORY CHECK................................................................... 3-38
3.9.2 INSTALLATION............................................................................. 3-39
3.10 KEY COUNTER HOLDER.................................................................... 3-46
3.11 USER CODE SETTING........................................................................ 3-47
4. SERVICE TABLES......................................................................4-1
4.1 SERVICE PROGRAM (SP) MODES........................................................ 4-1
4.1.1 HOW TO ENTER AN SP MODE...................................................... 4-1
4.1.2 SP MODE TYPES............................................................................ 4-3
4.1.3 SP MODE CHART........................................................................... 4-3
4.1.4 SP4-301 APS OPERATION CHECK DETAILS ............................... 4-3
4.1.5 TEST PATTERN.............................................................................. 4-5
4.1.6 SP5-803 INPUT CHECK.................................................................. 4-6
4.1.7 SP5-804 OUTPUT CHECK.............................................................. 4-9
4.1.8 SP5-955 PRINTER INTERNAL PATTERN .................................... 4-11
5-955-018: Internal Pattern Types...................................................... 4-11
4.2 USER TOOLS......................................................................................... 4-11
4.2.1 HOW TO ENTER USER TOOLS................................................... 4-11
4.2.2 DETAILED DESCRIPTION OF USER TOOLS.............................. 4-12
4.3 TP/SW/LED/FUSE.................................................................................. 4-12
4.3.1 MAIN CONTROL BOARD TEST PINS.......................................... 4-12
4.3.2 LD MAIN CONTROL BOARD TEST PINS..................................... 4-13
4.3.3 I/O CONTROL BOARD TEST PINS.............................................. 4-13
4.3.4 FUSE SPECIFICATIONS .............................................................. 4-19
4.3.5 LED/SW SPECIFICATIONS OF SCANNER IPU BOARD............. 4-20
LED Specifications............................................................................. 4-20
SW Specifications.............................................................................. 4-20
5. PREVENTIVE MAINTENANCE...................................................5-1
5.1 PM PROCEDURES.................................................................................. 5-1
5.1.1 PM-RELATED COUNTERS............................................................. 5-1
SP7-803 (PM Counter Display)............................................................ 5-1
5.1.2 REGULAR PREVENTIVE MAINTENANCE FLOW DIAGRAM........ 5-4
5.2 REGULAR PM ITEMS.............................................................................. 5-7
5.2.1 REGULAR PM TABLE..................................................................... 5-7
Peripherals......................................................................................... 5-11
vi
Page 10

6. REPLACEMENT AND ADJUSTMENT ........................................ 6-1
6.1 PM-RELATED COUNTERS...................................................................... 6-1
6.2 SERVICE REMARKS............................................................................... 6-1
6.3 COVERS AND FILTERS.......................................................................... 6-2
6.3.1 UPPER AND LOWER FRONT COVER........................................... 6-2
6.3.2 RIGHT-SIDE FRONT COVER AND RIGHT EDGE COVER............ 6-2
6.3.3 INNER COVERS.............................................................................. 6-3
6.3.4 REAR COVERS............................................................................... 6-3
6.3.5 LEFT COVERS................................................................................ 6-4
6.3.6 EXPOSURE GLASS........................................................................ 6-4
6.3.7 OPERATION PANEL....................................................................... 6-5
6.3.8 USED TONER TANK....................................................................... 6-5
6.3.9 CHARGE CORONA FILTER............................................................ 6-6
6.3.10 DUST AND OZONE FILTERS....................................................... 6-6
6.3.11 SCANNER FILTER........................................................................ 6-7
6.3.12 REVOLVER FILTER...................................................................... 6-7
6.3.13 INNER COVER FILTER................................................................. 6-8
6.3.14 FUSING UNIT FILTER................................................................... 6-8
6.4 UNIT REMOVAL....................................................................................... 6-9
6.4.1 REVOLVER/DRUM DRAWER......................................................... 6-9
6.4.2 DRUM UNIT REMOVAL................................................................ 6-10
6.4.3 REINSTALLING THE REVOLVER/DRUM DRAWER.................... 6-11
6.4.4 IMAGE TRANSFER BELT UNIT REMOVAL................................. 6-12
Reinstalling the Image Transfer Belt Unit........................................... 6-13
6.4.5 PAPER TRANSFER UNIT REMOVAL........................................... 6-14
6.4.6 REMOVING THE FUSING UNIT................................................... 6-15
6.5 DRUM UNIT............................................................................................ 6-16
6.5.1 DRUM REPLACEMENT................................................................ 6-16
Post-replacement Procedure ............................................................. 6-17
6.5.2 CLEANING BLADE REPLACEMENT............................................ 6-18
6.5.3 CLEANING BRUSH REPLACEMENT........................................... 6-19
6.5.4 LUBRICANT BAR REPLACEMENT.............................................. 6-19
6.5.5 BIAS ROLLER BLADE REPLACEMENT....................................... 6-20
6.5.6 CHARGE GRID AND CORONA WIRE REPLACEMENT.............. 6-20
6.5.7 PCC REPLACEMENT ................................................................... 6-21
6.5.8 DRUM POTENTIAL SENSOR REPLACEMENT........................... 6-22
6.5.9 ID SENSOR REPLACEMENT....................................................... 6-23
6.6 SCANNER UNIT..................................................................................... 6-24
6.6.1 EXPOSURE LAMP REPLACEMENT............................................ 6-24
6.6.2 SBU REPLACEMENT.................................................................... 6-25
6.6.3 OPENING THE SCANNER UNIT.................................................. 6-26
6.6.4 SCANNER IPU MAIN/SUB BOARD REPLACEMENT................... 6-28
6.6.5 SCANNER WIRE REPLACEMENT............................................... 6-29
6.6.6 APS AND H.P. SENSOR REPLACEMENT ................................... 6-32
6.7 COPY IMAGE ADJUSTMENT................................................................ 6-33
6.7.1 PRINTER γ ADJUSTMENT............................................................ 6-33
Auto Color Calibration (ACC)............................................................. 6-33
KCMY Color Balance Adjustment...................................................... 6-33
vii
Page 11

ACC Target Modification.................................................................... 6-36
6.7.2 MAIN SCAN POSITION DOT CORRECTION............................... 6-37
6.8 LASER OPTICS SECTION..................................................................... 6-40
6.8.1 POLYGON MIRROR MOTOR REPLACEMENT............................ 6-40
6.8.2 LASER SYNCHRONIZING DETECTOR REPLACEMENT............ 6-42
6.8.3 LD UNIT REPLACEMENT............................................................. 6-42
LD Pitch Check and Adjustment]........................................................ 6-43
6.8.4 SQUARENESS ADJUSTMENT..................................................... 6-47
6.8.5 LD CONTROL BOARD REPLACEMENT...................................... 6-49
6.9 DEVELOPMENT UNIT........................................................................... 6-50
6.9.1 DEVELOPER REPLACEMENT..................................................... 6-50
Developer Collection.......................................................................... 6-50
6.9.2 DEVELOPER INSTALLATION....................................................... 6-53
6.9.3 DEVELOPMENT UNIT REPLACEMENT....................................... 6-58
6.9.4 TONER CATCH COVER CLEANING............................................ 6-59
6.9.5 REVOLVER MOTOR REPLACEMENT......................................... 6-60
6.9.6 TONER DENSITY SENSOR REPLACEMENT.............................. 6-61
6.9.7 TD SENSOR NONCONTACT COUPLER REPLACEMENT.......... 6-62
Main Unit Element.............................................................................. 6-62
TD Sensor Interface (I/F) Board......................................................... 6-63
6.8 IMAGE TRANSFER SECTION............................................................... 6-65
6.8.1 IMAGE TRANSFER BELT REPLACEMENT ................................. 6-65
6.8.2 IMAGE TRANSFER BELT BLADE REPLACEMENT..................... 6-67
6.8.3 TRANSFER BELT LUBRICANT BAR AND LUBRICANT
BRUSH REPLACEMENT .............................................................. 6-68
6.8.4 PAPER TRANSFER BELT REPLACEMENT ................................. 6-69
6.8.5 PAPER TRANSFER BELT BLADE/CLEANING BRUSH
REPLACEMENT............................................................................ 6-69
6.8.6 BACK BRUSH REPLACEMENT.................................................... 6-70
6.8.7 PAPER TRANSFER BELT DISCHARGE CORONA WIRE
REPLACEMENT............................................................................ 6-70
6.8.8 PAPER DISCHARGE CORONA WIRE REPLACEMENT.............. 6-71
6.9 PAPER FEED AND REGISTRATION SECTION.................................... 6-72
6.9.1 BY-PASS FEED TABLE REMOVAL.............................................. 6-72
6.9.2 BY-PASS FEED PAPER WIDTH SENSOR REPLACEMENT....... 6-73
6.9.3 BY-PASS PICK-UP ROLLER REPLACEMENT............................. 6-74
6.9.4 BY-PASS FEED ROLLER REPLACEMENT.................................. 6-74
6.9.5 BY-PASS SEPARATION ROLLER REPLACEMENT.................... 6-75
6.9.6 BY-PASS PAPER FEED UNIT REMOVAL.................................... 6-75
6.9.7 BY-PASS PAPER FEED UNIT INSTALLATION............................ 6-76
6.9.8 REGISTRATION SENSOR REPLACEMENT................................ 6-78
6.9.9 PAPER TRAY ROLLER REPLACEMENT..................................... 6-78
6.9.10 PAPER FEED UNIT AND PAPER FEED CLUTCH
REPLACEMENT.......................................................................... 6-79
6.9.11 COPY IMAGE AREA ADJUSTMENT .......................................... 6-80
PAPER TRANSPORT, FUSING, AND PAPER EXIT......................... 6-83
6.10.1 TRANSPORT UNIT REMOVAL................................................... 6-83
6.10.2 FUSING UNIT TOP COVER REMOVAL ..................................... 6-83
6.10.3 OIL SUPPLY UNIT REPLACEMENT AND CLEANING............... 6-84
viii
Page 12

6.10.4 HOT ROLLER BLADE REPLACEMENT ..................................... 6-85
6.10.5 CLEANING THE CLEANING ROLLER SCRAPER...................... 6-86
6.10.6 FUSING THERMOFUSE AND THERMISTOR REPLACEMENT 6-86
6.10.7 FUSING UNIT DISASSEMBLY.................................................... 6-87
6.10.8 FUSING LAMP REPLACEMENT................................................. 6-88
6.10.9 HOT ROLLER REPLACEMENT.................................................. 6-88
6.10.10 HOT ROLLER CLEANING ROLLER CLEANING...................... 6-89
6.10.11 PRESSURE ROLLER LAMP/ROLLER REPLACEMENT.......... 6-89
6.10.12 PRESSURE THERMOFUSE AND THERMISTOR
REPLACEMENT........................................................................ 6-90
6.10.13 PRESSURE CLEANING ROLLER CLEANING......................... 6-90
6.10.14 NIP BAND WIDTH ADJUSTMENT............................................ 6-91
6.10.15 CAUTIONS TO BE TAKEN WHEN USING A FUSING UNIT
THAT HAS BEEN IN STOCK FOR A LONG PERIOD .............. 6-92
6.11 DUPLEX UNIT...................................................................................... 6-93
6.11.1 DUPLEX UNIT REMOVAL........................................................... 6-93
6.11.2 SEPARATION ROLLER REPLACEMENT................................... 6-93
6.11.3 FEED ROLLER REPLACEMENT................................................ 6-94
6.11.4 DUPLEX FEED MOTOR REPLACEMENT.................................. 6-95
6.12 SYSTEM AND ELECTRONICS............................................................ 6-97
6.12.1 SOFTWARE UPDATE USING AN IC CARD............................... 6-97
Care of the IC Card............................................................................ 6-97
Upgrading the Main Control Board Software...................................... 6-97
Upgrading the Scanner IPU Software................................................ 6-98
NV-RAM Uploading and Downloading............................................. 6-101
Upload/download procedure............................................................ 6-101
6.12.2 RAM CLEAR.............................................................................. 6-102
RAM Clear Procedure...................................................................... 6-102
6.12.3 MAIN CONTROL BOARD.......................................................... 6-103
Main Control Board Replacement Procedure................................... 6-103
6.12.4 COUNTERS............................................................................... 6-104
About the Total Counter................................................................... 6-104
Mechanical Counter......................................................................... 6-104
NV-RAM Replacement Procedure................................................... 6-105
6.12.5 TOUCH PANEL CALIBRATION................................................. 6-106
7. TROUBLESHOOTING.................................................................7-1
7.1 PROCESS CONTROL ERROR CONDITIONS ........................................ 7-1
7.1.1 PROCESS CONTROL SELF CHECK RESULTS (SP3-975-00)...... 7-1
7.1.2 DEVELOPER SETUP RESULTS (SP3-964-00).............................. 7-2
“Developer Agitation (SP2-225)” OPERATION FLOW........................ 7-3
7.1.3 TD SENSOR INITIALIZATION RESULTS (SP3-005-006)............... 7-3
7.1.4 SELF-CHECK PROCESS CONTROL RELATED SCS ................... 7-4
SC385: Vsg Adjustment Error.............................................................. 7-4
7.2 SC CODE TABLE..................................................................................... 7-4
7.3 DRUM LIGHT FATIGUE............................................................................ 7-5
ix
Page 13

OPTIONS
ARDF (A663)
1. SPECIFICATIONS.................................................................A663-1
2. COMPONENT LAYOUT........................................................A663-2
2.1 MECHANICAL COMPONENTS..........................................................A663-2
2.2 ELECTRICAL COMPONENTS...........................................................A663-3
3. ELECTRICAL COMPONENT DESCRIPTION.......................A663-4
4. DETAILED DESCRIPTIONS.................................................A663-5
4.1 ORIGINAL PICK-UP MECHANISM....................................................A663-5
4.2 SEPARATION AND PAPER FEED MECHANISM..............................A663-6
4.3 FRICTION BELT DRIVE MECHANISM..............................................A663-7
4.4 ORIGINAL SIZE DETECTION............................................................A663-8
4.5 PAPER TRANSPORT MECHANISM..................................................A663-9
4.6 THICK/THIN ORIGINAL MODES ..................................................... A663-10
4.7 ORIGINAL FEED-OUT MECHANISM...............................................A663-11
4.8 TWO-SIDED ORIGINAL FEED MECHANISM..................................A663-12
5. TIMING CHARTS ................................................................A663-13
5.1 A4 SIDEWAYS: 1 SIDED ORIGINAL ...............................................A663-13
5.2 COMBINE 2 ORIGINAL MODE........................................................A663-14
5.3 A4 SIDEWAYS: DUPLEX.................................................................A663-15
6. SERVICE TABLES..............................................................A663-16
6.1 DIP SWITCHES................................................................................A663-16
6.2 VARIABLE RESISTORS...................................................................A663-17
6.3 LED...................................................................................................A663-17
6.4 FUSE................................................................................................A663-17
7. REPLACEMENT AND ADJUSTMENT................................A663-18
7.1 TRANSPORT BELT REPLACEMENT..............................................A663-18
7.2 FEED ROLLER REPLACEMENT..................................................... A663-19
7.3 FRICTION BELT REPLACEMENT...................................................A663-20
7.4 ORIGINAL SET AND WIDTH SENSOR REPLACEMENT................A663-21
7.5 VERTICAL REGISTRATION ADJUSTMENT...................................A663-22
7.5.1 ONE SIDED THIN ORIGINAL MODE......................................A663-22
7.5.2 TWO SIDED ORIGINAL MODE...............................................A663-23
7.6 SIDE-TO-SIDE REGISTRATION (DF POSITIONING)
ADJUSTMENT..................................................................................A663-24
x
Page 14

LCT (A683)
1. OVERALL MACH IN E INF O RMATION..................................A683-1
1.1 SPECIFICATIONS..............................................................................A683-1
1.2 MECHANICAL COMPONENT LAYOUT.............................................A683-2
1.3 ELECTRICAL COMPONENT LAYOUT..............................................A683-3
1.4 ELECTRICAL COMPONENT DESCRIPTION....................................A683-4
1.5 DRIVE LAYOUT .................................................................................A683-5
2. DETAILED DESCRIPTIONS.................................................A683-6
2.1 PAPER FEED MECHANISM..............................................................A683-6
2.2 TRAY LIFT AND PAPER HEIGHT DETECTION MECHANISM.........A683-7
Tray lifting conditions ..................................................................... A683-7
Tray lowering conditions ................................................................A683-7
2.3 TRAY UNIT SLIDE MECHANISM.......................................................A683-8
3. SERVICE TABLES................................................................A683-9
3.1 DIP SWITCHES..................................................................................A683-9
3.2 TEST POINTS....................................................................................A683-9
3.3 SWITCHES.........................................................................................A683-9
3.4 FUSES................................................................................................ A683-9
4. REPLACEMENT AND ADJUSTMENT................................A683-10
4.1 COVER REPLACEMENT.................................................................A683-10
Tray Cover...................................................................................A683-10
Front Cover..................................................................................A683-10
Rear Cover...................................................................................A683-10
Right Lower Cover .......................................................................A683-10
Upper Cover.................................................................................A683-10
4.2 ROLLER REPLACEMENT................................................................A683-11
4.2.1 PAPER FEED, SEPARATION, AND PICK-UP ROLLERS ......A683-11
Pick-up Roller...............................................................................A683-11
Paper Feed Roller........................................................................A683-11
Separation Roller.........................................................................A683-11
4.3 TRAY LIFT AND PAPER END SENSOR REPLACEMENT .............. A683-12
Tray Lift Sensor............................................................................A683-12
Paper End Sensor........................................................................ A683-12
4.4 RELAY SENSOR REPLACEMENT..................................................A683-13
4.5 SIDE FENCE POSITION CHANGE..................................................A683-14
SORTER STAPLER (A831)
1. OVERALL MAHC INE INFORMATION..................................A831-1
1.1 SPECIFICATIONS..............................................................................A831-1
1.2 COMPONENT LAYOUT.....................................................................A831-3
1.2.1 MECHANICAL COMPONENT LAYOUT .................................... A831-3
1.2.2 DRIVE LAYOUT.........................................................................A831-4
xi
Page 15

2. DETAILED DESCRIPTION.................................................... A831-5
2.1 BASIC OPERATION...........................................................................A831-5
2.1.1 NORMAL (PROOF MODE) AND SORT/STACK MODE............A831-5
Normal (Proof) Mod e (From the Turn Gate Section
to the Proof Tray) ...............................................................A831-5
Sort Mode (From the Turn Gate Section to the Bins).....................A831-6
Stack Mode (From the Turn Gate Section to the Bins)...................A831-7
Reverse Mode (From the Turn Gate Section to the Bins)..............A831-8
2.1.2 STAPLE MODE.........................................................................A831-9
2.2 TURN GATE SECTION....................................................................A831-11
2.3 BIN DRIVE MECHANISM.................................................................A831-12
2.4 BIN HOME POSITION......................................................................A831-13
2.5 JOGGER SECTION..........................................................................A831-14
2.6 BIN REAR PLATE DRIVE SECTION................................................ A831-15
2.7 GRIP ASSEMBLY.............................................................................A831-16
2.7.1 GRIP MOTOR..........................................................................A831-17
2.7.2 GRIP SHIFT MOTOR ..............................................................A831-18
2.8 STAPLE UNIT...................................................................................A831-19
2.8.1 STAPLE UNIT DRIVE MECHANISM.......................................A831-19
2.8.2 STAPLER ................................................................................A831-20
Staple Prohibit Conditions............................................................ A831-21
2.8.3 STAPLE UNIT PULLED-OUT MECHANISM...........................A831-22
3. REPLACEMENTS AND ADJUSTMENTS...........................A831-23
3.1 EXTERIOR COVER REMOVAL....................................................... A831-23
3.2 STAPLER REMOVAL AND REINSTALLATION...............................A831-24
3.3 JOGGER PLATE REMOVAL AND INSTALLATIOIN........................A831-25
Removal.......................................................................................A831-25
Installation....................................................................................A831-25
3.4 BINS REMOVAL...............................................................................A831-26
Removal.......................................................................................A831-26
Installation....................................................................................A831-28
3.5 MAIN MOTOR REMOVAL................................................................A831-30
3.6 GRIP ASSEMBLY REMOVAL..........................................................A831-31
3.7 UPPER GRIP ASSEMBLY REMOVAL ............................................. A831-32
3.8 GRIP SHIFT MOTOR REMOVAL.....................................................A831-33
3.9 HELICAL WHEELS REMOVAL........................................................A831-34
Removal.......................................................................................A831-34
Front Helical Wheel......................................................................A831-34
Rear Helical Wheel ...................................................................... A831-35
Installation....................................................................................A831-36
Rear Helical Wheel ...................................................................... A831-36
Front Helical Wheel......................................................................A831-37
Alignment of the 2 Helical Wheels................................................A831-38
3.10 GRIP MOTOR AND SENSORS REMOVAL...................................A831-39
3.10.1 GRIP MOTOR/GRIP MOTOR HP SENSOR/GRIP
SHIFT MOTOR HP SENSOR REMOVAL............................. A831-39
3.11 MAIN CONTROL BOARD REPLACEMENT...................................A831-40
xii
Page 16

4. SP MODE AND STAPLE POSITION ADJUSTMENT..........A831-41
4.1 SERVICE TABLES (MAIN CONTROL BOARD)...............................A831-41
4.1.1 DIP SWITCHES.......................................................................A831-41
DIP 1 (Mode) SP Mode................................................................A831-41
DIP 2 (Staple) Staple Position Adjustment (A) DIP 3 (Chuck)
Staple Position Adjustment (B).................................................A831-41
FPU (A846)
1. SPECIFICAT IONS..................................................................
A846-
2. ELECTRICAL COMPONENT LAYOUT
AND DESCRIPTIONS...........................................................
3. SECTIONAL DESCRIPTIONS................................................
3.1 OVERVIEW ........................................................................................ A846-3
3.2 SHADING ...........................................................................................A846-4
3.3 MIRROR UNIT....................................................................................A846-5
A846A846-
APPENDIX
APPENDIX-1
SC CODE TABLE
APPENDIX-2
SP MODE
APPENDIX-3
POP-UP DISPALYS
APPENDIX-4
TIMING CHARTS
1
2
3
xiii
Page 17

30 March 1999 SPECIFICATIONS
1. OVERALL MACHINE INFORMATION
1.1 SPECIFICATIONS
1.1.1 MAJOR UNITS
•
A257 copier: Basic model
•
A269 copier: Editing model
Overall
Information
6
1
2
3
5
1. Original tray (A430)
2. FPU (A846)
3. FPU table (A702-19)
4. LCT (A683) + LCT adapter (A840-01)
5. 20 bin sorter stapler (A831)
6. ARDF (A663)
4
A269V001.PCX
Other options
•
Platen cover (A749-01)
•
Controller interface (A839)
1-1
Page 18

SPECIFICATIONS 30 March 1999
1.1.2 BASIC SPECIFICATIONS
Type: Console type
Copy process: Dry electrostatic transfer system
Number of scans: 1 (image memory for A3/DLT full color copy is
installed)
Pre-scan: Only when Auto Original Type mode is used
Resolution: Copy mode (read/write): 400 dpi/600 dpi
Print mode (write): 600 dpi
Gradations: 256 gradations (8 bits)
Original types: Sheet, book, object
Maximum original size: A3/11" x 17"
Original reference position: Left rear corner
Maximum print size: 323 mm x 473 mm
Copy paper size: First tray
Maximum: A4 (S/L)/8
Minimum: A5 (S)/ 8
Other trays
Maximum: A3/11" x 17"
Minimum: A5 (S)/ 8
By-pass
Maximum: 13" x 19" (330 x 483 mm)
Minimum: Postcard (100 x 148 mm)
Auto/duplex
Maximum: A3/11" x 17"
Minimum: A5 (S)/ 8
" x 11" (S/L)
1/2
" x 5
1/2
" x 5
1/2
" x 5
1/2
1/2
1/2
1/2
" (S)
" (S)
" (S)
Paper thickness: Tray feed (including duplex):
64 to 105 g/m2, 17 to 28 lb
By-pass feed:
64 to 256 g/m2, 17 to 68 lb
Thick paper 1 (105 ~ 157 g/m2, 28 ~ 42 lb)
Thick paper 2 (157 ~ 256 g/m2, 42 ~ 68 lb)
Non-reproduction area:
Leading edge: 4±2 mm
Left and right: 2±2 mm (4 mm or less in total)
Trailing edge: 2±2 mm
1-2
Page 19

30 March 1999 SPECIFICATIONS
Copying speed (cpm):
Normal paper/
normal mode
OHP/thick
paper
ARDF 1 to 1
Duplex feed
Full
color
A4/8
A4/8
A4/8
A4/8
" x 11" or less 10 40 13.5 10 13.5 10
1/2
A3/11" x 17" 5207575
" x 11" or less 4.5 7 5 4.5 5 4.5
1/2
A3/11" x 17" 2 3.5 2.5 2 2.5 2
" x 11" or less8318888
1/2
A3/11" x 17" 5155554
" x 11" or less 10 35 13.5 10 13.5 10
1/2
A3/11" x 17"T 5207575
C/M/
Y/K
B, G R
Warm-up time: 8 minutes and 30 seconds or less
First copy time (A4/8
" x 11") Normal Paper:
1/2
Full color: 16.5 seconds or less
K, C, M, Y: 8 seconds or less
B, G: 14 seconds or less
R: 16.5 seconds or less
Thick paper/OHP:
Full color: 29 seconds or less
Paper feed capacity: Tray:
500-sheet paper tray: 3 trays
By-pass feed:
50 sheets
Duplex tray:
50-sheet s (30 sheets for A3/11" x 17"
20 sheets (Full color)
K+M
K+Y
K+C
Overall
Information
Paper feed system: Tray:
FRR system (Stack height: 53 mm max.)
By-pass feed:
FRR system (Stack height: 6 mm max.)
Duplex tray:
Friction roller separation system
Reproduction Ratios:
8
" x 11"LT/11" x 17"DLT version A4/A3 version
1/2
Enlargement
Full size
Reduction
Programmable
Zoom
121, 129, 155, 200, 400% 115, 122, 141, 200, 400%
100% 100%
25, 50, 65, 73, 78, 85, 93% 25, 50, 65, 71, 75, 82, 93%
2 user ratios 2 user ratios
25% to 400% in 1% steps 25% to 400% in 1% steps
1-3
Page 20
SPECIFICATIONS 30 March 1999
Number of continuous copies: 1 to 999 sheets
Scanning system: 3-line 1-chip CCD sensor (400 dpi/5,000 pixels)
Light source: 1-halogen-lamp indirect lighting (frosted surface)
Print system: Twin laser beam, 600 dpi
Development system: 2-component magnetic brush
Drum cleaning system: Counter blade
Image Transfer system: Belt transfer system
Fusing system: Heat and pressure roller system with oil application
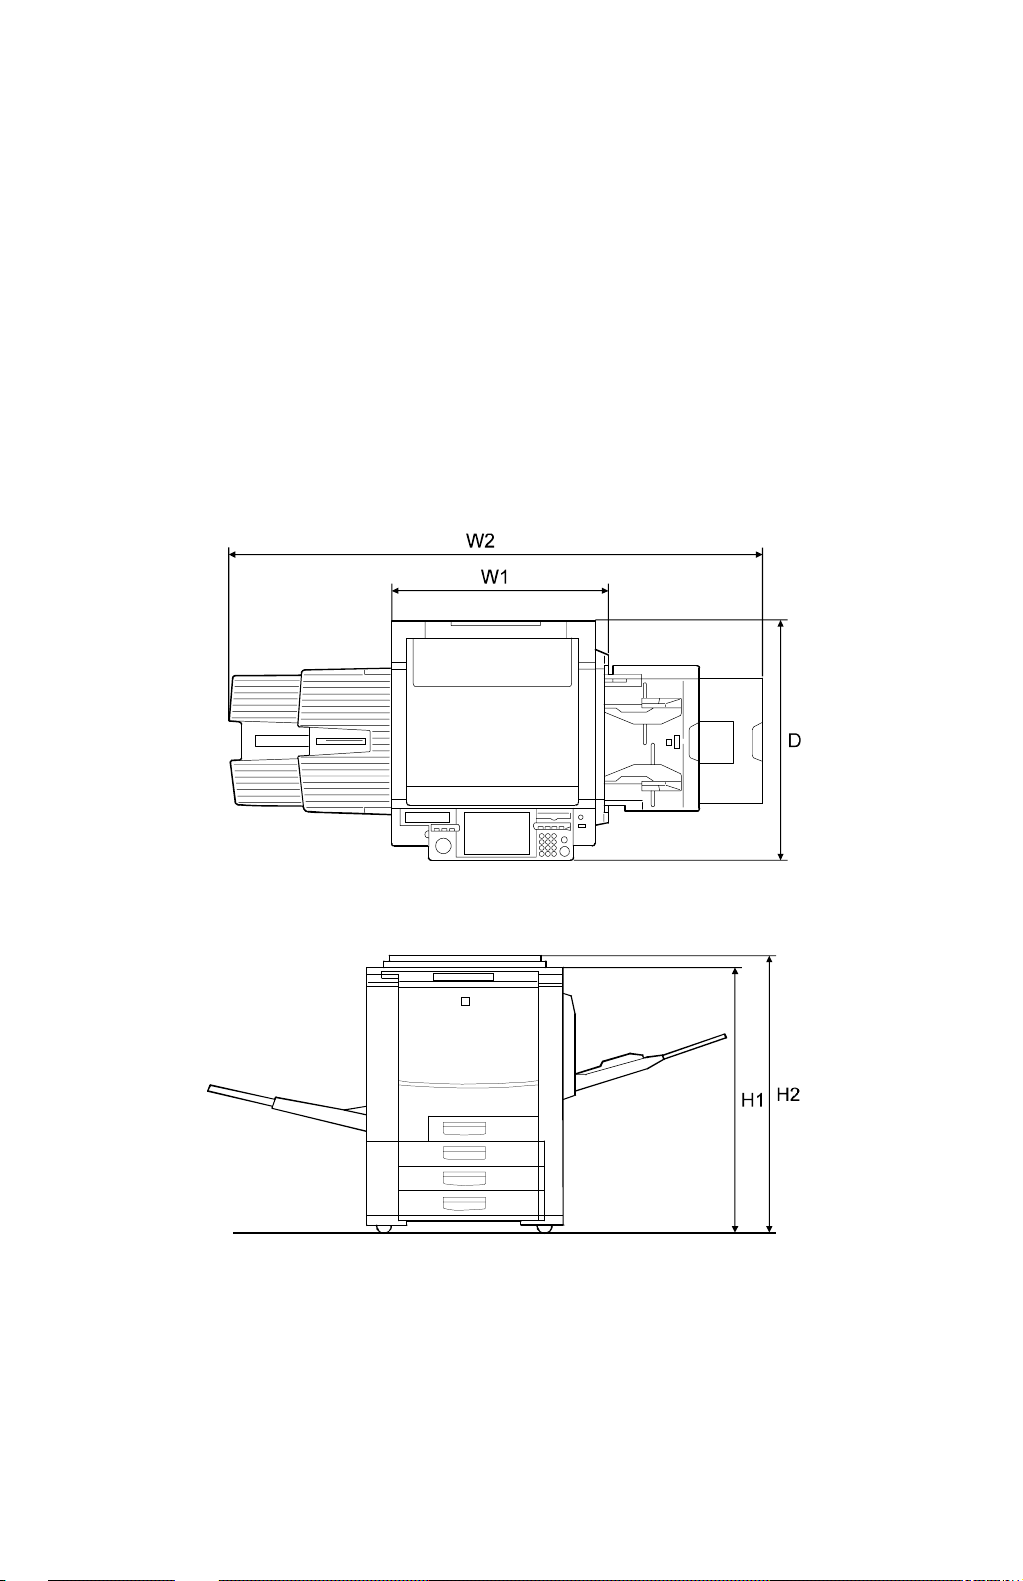
Dimensions:
A269V155.WMF
A269V156.WMF
1. Copier
730 mm (W1) x 780 mm (D) x 980 mm (H1)
2. Copier + Platen Cover + Paper Exit Tray + By-pass Tray
1,643 mm (W2) x 780 mm (D) x 1,045 mm (H2)
1-4
Page 21
30 March 1999 SPECIFICATIONS
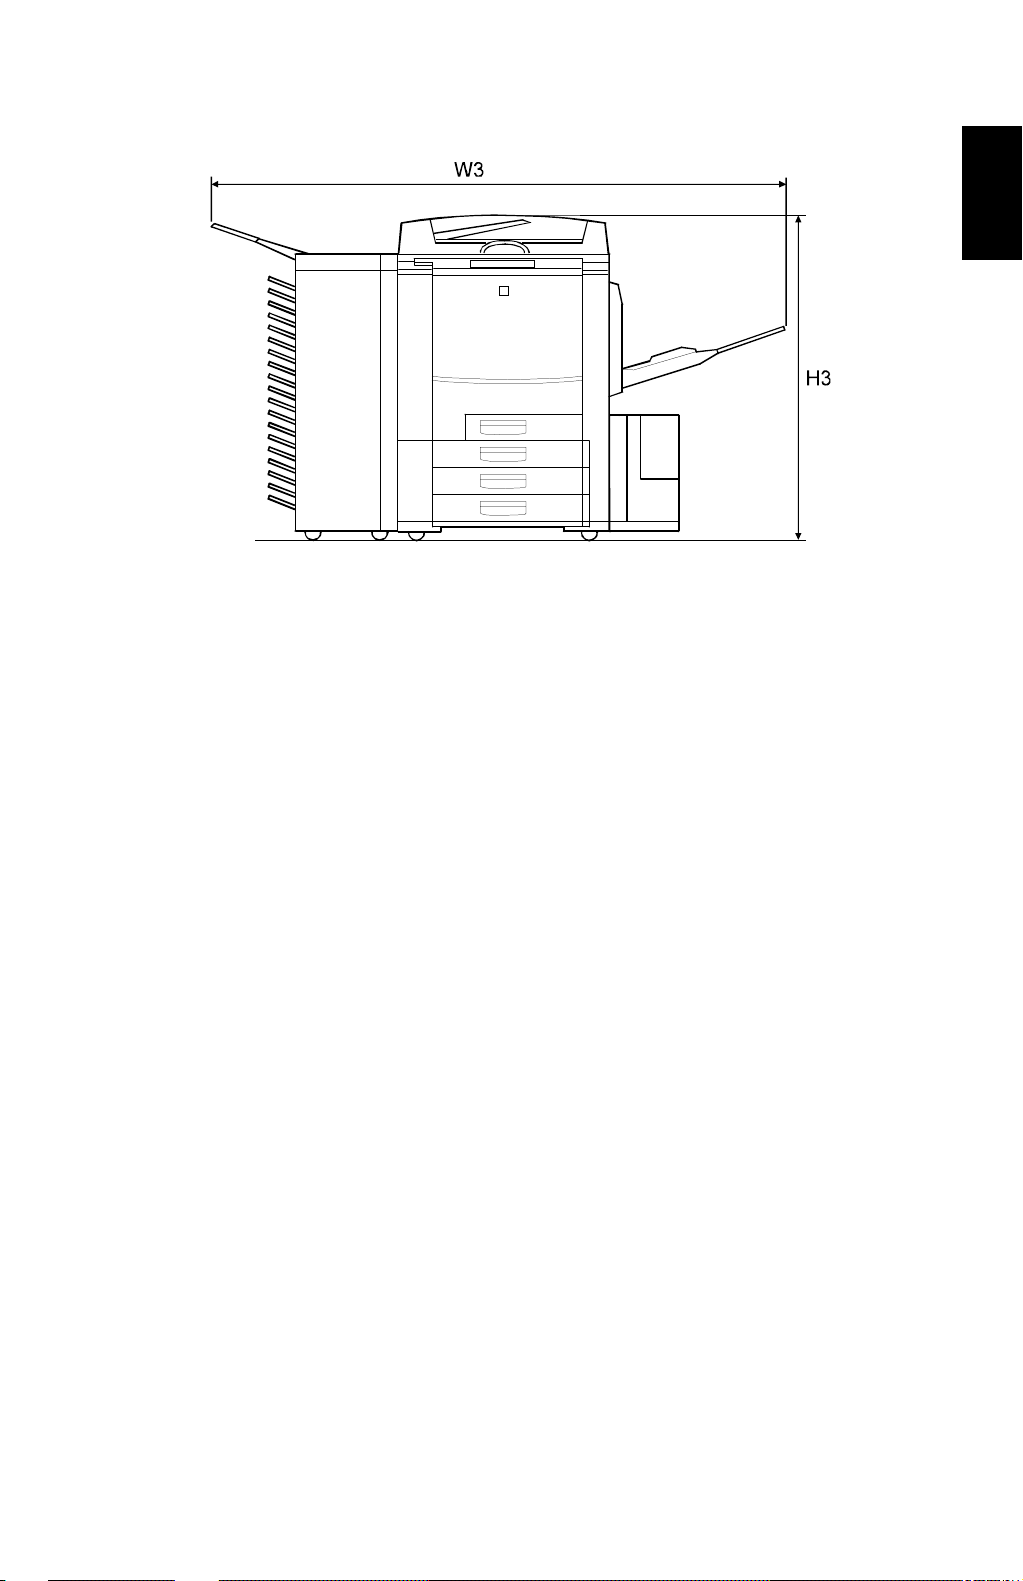
A269V158.WMF
3. Copier + ARDF + LCT + Sorter Stapler + By-pass Tray
1,930 mm (W3) x 780 mm (D) x 1,110 mm (H3)
Overall
Information
Weight: 240 kg
Power source: 120 V, 60 Hz, 16 A (North America)
220 ~ 240 V, 50 Hz, 8 A (Europe, Mid-East)
220 ~ 240 V, 50/60 Hz, 8 A (Asia)
1-5
Page 22

SPECIFICATIONS 30 March 1999
1.1.3 PLATEN/ARDF ORIGINAL SIZE DETECTION
Size (width x length)
[mm]
A3 (297 x 420) L No Yes No Yes
B4 (257 x 364) L No Yes No Yes
A4 (210 x 297) L No Yes Yes Yes
A4 (297 x 210) S No Yes Yes Yes
B5 (182 x 257) L No Yes No Yes
B5 (257 x 182) S No Yes No Yes
A5 (148 x 210) L No Yes No Yes
A5 (210 x 148) S No Yes No Yes
B6 (128 x 182) L No No No Yes
B6 (182 x 128) S No No No Yes
11" x 17" (DLT) Yes No Yes Yes
11" x 15" No No Yes No
10" x 14" Yes No Yes Yes
8.5" x 14" (LG) Yes No Yes No
8.5" x 13" (F4) Yes Yes Yes Yes
8.25" x 13" No No No No
8" x 13"(F) Yes No Yes No
8.5" x 11" (LT) Yes No Yes Yes
11" x 8.5" (LT) Yes No Yes Yes
8" x 10.5" No No No No
8" x 10" Yes No Yes No
5.5" x 8.5" (HLT) Yes No Yes No
8.5" x 5.5" (HLT) Yes No Yes No
A6 (105 x 148) L No No No No
Inch Metric Inch Metric
Platen ARDF
NOTE:
In the above table "Inch" refers to versions of the machine that use nonmetric traditional paper sizes and "Metric" refers to versions that use ISO
standard paper sizes.
1-6
Page 23

30 March 1999 SPECIFICATIONS
1.1.4 COPY PAPER SIZES
Size (width x length)
[mm]
A3 (297 x 420) L No Yes Yes Yes
B4 (257 x 364) L No Yes Yes Yes
A4 (210 x 297) L Yes Yes Yes Yes
A4 (297 x 210) S Yes Yes Yes Yes
B5 (182 x 257) L Yes Yes Yes Yes
B5 (257 x 182) S Yes Yes Yes Yes
A5 (148 x 210) L No No No Yes
A5 (210 x 148) S Yes Yes Yes Yes
B6 (128 x 182) L No No No Yes
B6 (182 x 128) S No No No Yes
13" x 19" No No No Yes
12" x 18" No No No Yes
11" x 17" (DLT) No Yes Yes Yes
11" x 15" No Yes No No
10" x 14" No Yes Yes No
8.5" x 14" (LG) No Yes Yes No
8.5" x 13" (F4) No Yes Yes No
8.25" x 13" No Yes Yes No
8" x 13"(F) No Yes Yes No
8.5" x 11" (LT) Yes Yes Yes Yes
11" x 8.5" (LT) Yes Yes Yes Yes
8" x 10.5" No Yes Yes No
8" x 10" No Yes Yes No
5.5" x 8.5" (HLT) No No No Yes
8.5" x 5.5" (HLT) Yes Yes Yes Yes
A6 (105 x 148) L No No No Yes
1st Tray 2nd/3rd Tray Duplex Tray By-pass Tray
Overall
Information
NOTE:
The by-pass sizes shown above are those that the machine can
automatically detect. When by-pass feeding other sizes, the user should
select "Custom Size" and input the length and width. (Length limitations =
148 ~ 483 mm, Width limitations = 100 ~ 330 mm).
1-7
Page 24

SPECIFICATIONS 30 March 1999
1.1.5 NOISE EMISSION
Copier Only
Stand-by mode 54 dB (A)
Copy-mode average 70 dB (A)
1.1.6 POWER CONSUMPTION
1. Maximum power consumption
1.75 kVA
2. Average power consumption
Sleep mode 0.015 kW
Stand-by mode 0.6 kW
Warm-up time 1.7 kW
Copying 1.5 kW
1-8
Page 25

30 March 1999 MECHANISM OVERVIEW
1.2 MECHANISM OVERVIEW
1.2.1 IMAGE GENERATION PROCESS
14
13
12
11
10
1 2
3
4
5
Overall
Information
6
9
8
7
A269V101.WMF
1. Drum charge
The charge corona applies a negative charge to the OPC drum and the grid
ensures that this charge is even.
2. Quenching
After cleaning, the OPC is fully exposed to light from an array of red LEDs,
quenching the residual charge on the OPC drum in preparation for the next
copy cycle.
3. Drum cleaning
The cleaning brush increases drum cleaning efficiency by applying lubricant to
the OPC drum. The cleaning blade scrapes the residual toner off the OPC
drum.
4. PCC (Pre-cleaning corona)
The PCC discharges the photoconductor drum and applies AC and negative
DC discharges to reduce the charge holding the residual toner to the drum,
thereby improving the efficiency of cleaning.
1-9
Page 26

MECHANISM OVERVIEW 30 March 1999
5. Image transfer to image transfer belt
Positive charge applied to the back of the image transfer belt transfers the
toner image on the OPC drum to the image transfer belt.
6. Image transfer to paper
The negatively charged toner image is transferred to the paper by giving a
positive charge to the back of the paper.
7. Image transfer belt cleaning and lubricant application
The brush applies lubricant, which makes it easier for the counter blade to
scrape excess toner off the transfer belt. The lubricant improves toner transfer
ability and reduces the amount of the partial blanking image.
8. Paper transfer belt cleaning
The paper transfer belt blade and brush always contact the paper transfer belt
to clean the belt surface.
9. Paper transfer belt discharging
The belt discharge corona unit removes the charge on the paper transfer belt.
10. Paper Separation
A combination of curvature separation and corona discharge separate the
paper from the paper transfer belt. The pick-off plate provides mechanical
assistance to the separation process.
11. ID sensor
The ID sensor senses the density of the test patch patterns developed on the
OPC drum.
12. Development
The latent image on the drum attracts the negatively charged toner. Toner is
preferentially attracted to those places on the drum surface where the laser
reduced the negative charge. (The development units for each color are
included in the revolver unit.)
13. Drum potential sensor
The electrical potential on the OPC drum is sensed by the drum potential
sensor for process control.
14. Laser exposure
The laser beam emitted from the laser assembly is reflected by the polygon
mirror and projected onto the drum through the fθ lens, drum mirror, and toner
shield glass. The laser output varies in intensity to correspond to the image
data, and this forms a latent image.
1-10
Page 27

30 March 1999 MECHANISM OVERVIEW
1.2.2 MAJOR UNITS AND PAPER PATH
21
3
4
Overall
Information
8
7 6
1. Scanner
•
400 dpi, 10-bit scanning in both main and sub scan directions
•
3-line CCD with reduction optics
•
Halogen exposure lamp
•
5-phase micro-stepper motor drive
5
A269V102.WMF
2. Operation panel
•
10.4-inch (640 x 480) color LCD (8 bit) touch-panel
3. Laser exposure unit
•
2 laser diode multi-beam system
•
Optics: 6-sided polygon mirror + 2 fθ lenses + barrel toroidal lens (BTL)
•
Polygon motor (23,622 rpm)
•
600 dpi (8 bit) print density
•
Modulation: power modulation + pulse width modulation
1-11
Page 28

MECHANISM OVERVIEW 30 July, 1999 (Revised)
4. Drum unit
•
Drum unit contains OPC drum, charge corona unit, and cleaning unit.
•
Charge corona unit: Single scorotron charge
•
Quenching lamp: LED
•
Drive: Synchronized with the image transfer belt (timing belt + flywheel)
•
Potential sensor and ID sensor included
•
Cleaning unit: Blade, brush, lubricant, and pre-cleaning corona
5. Image transfer and belt drive
•
Image transfer belt: Full time contact with the drum
•
Image transfer: Bias/roller indirect application
•
Paper transfer: Belt transfer
•
Registration: Synchronization by the belt mark detection sensor
•
Image transfer belt: Driven by the image transfer belt motor
•
Paper transfer belt: Driven by the paper transfer motor
•
Separation: Curvature separation + corona discharge
•
Belt cleaning: Counter blade system
•
Lubrication: Brush roller with lubricant bar
6. Paper feed/transport system
•
Paper feed: 3 front loading 500-sheet trays + by-pass transport
•
Transport: Transport belt + vacuum fan
•
Duplexing: Duplex unit installed
7. Development and toner supply
•
Development: Two-component magnetic brush development
•
Development color switching: Revolver system
•
Image density control: TD sensor + ID sensor + process control
•
Toner supply: Cartridge type
•
Toner supply unit: Front of development units (on the revolver)
8. Fusing and paper exit section
•
Fusing: Silicone rubber roller fusing
•
Oil application method: roller
•
Cleaning: Roller cleaning for hot and pressure rollers (-15, -17, -19)
Roller cleaning for hot and cleaning blade for pressure roller
(-22, -26, -27, -29)
•
OHP/thick paper speed selection
1-12
Page 29
30 March 1999 PARTS LAYOUT
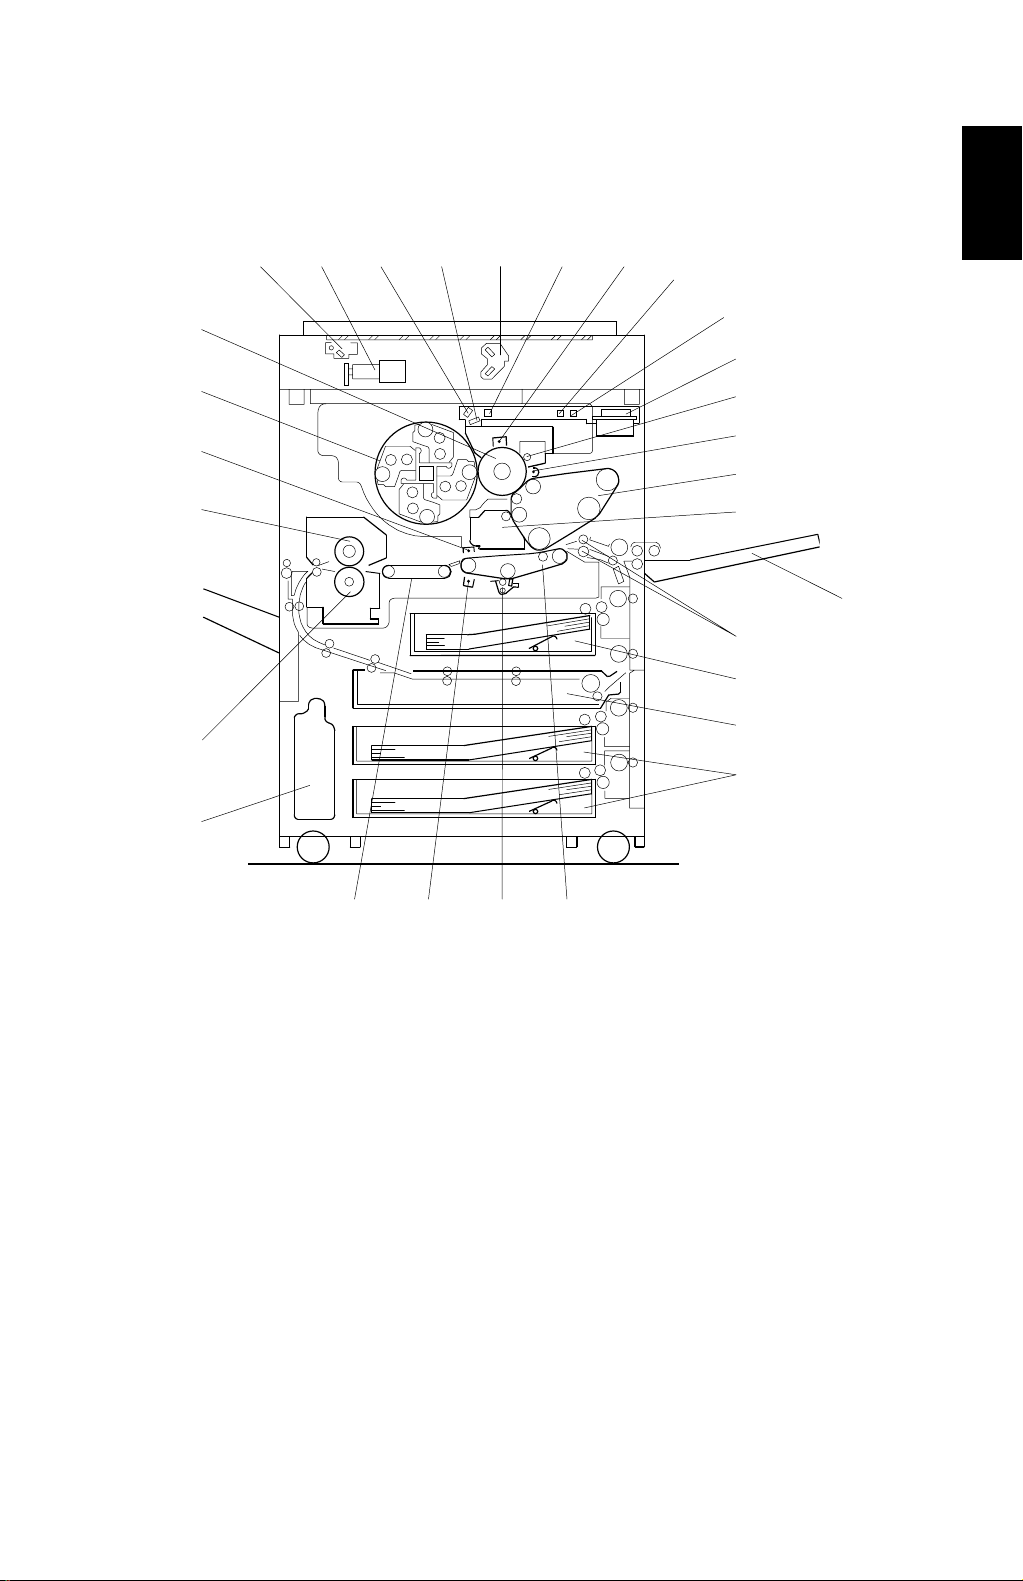
1.3 PARTS LAYOUT
1.3.1 MAJOR UNIT LAYOUT DIAGRAM
29
28
5
4321
6 7
8
9
10
11
Overall
Information
27
26
25
24
1. 1st scanner
2. Sensor board unit (SBU)
3. Drum mirror
4. Toner shield glass
5. 2nd scanner
6. Barrel toroidal lens (BTL)
7. Charge corona unit
8. 2nd fθ lens
9. 1st fθ lens
10. Polygon mirror
11. Drum cleaning unit
12. Pre-cleaning corona (PCC)
13. Image transfer unit
14. Image transfer belt cleaning unit
15. By-pass feed table
12
13
14
16
17
18
19
21 202223
A269V103.WMF
16. Registration rollers
17. 1st paper tray
18. Duplex unit
19. 2nd/3rd paper trays
20. Paper transfer belt unit
21. Paper transfer belt cleaning unit
22. Belt discharge corona unit
23. Transport belt
24. Used toner tank
25. Pressure roller
26. Hot roller
27. Separation corona unit
28. Revolver (development units)
29. OPC drum
15
1-13
Page 30

DRIVE LAYOUT 30 July, 1999 (Revised)
1.4 DRIVE LAYOUT
4
3
2
5
6
7
1
8
1. Fusing transport drive
2. Revolver drive
3. Drum drive
4. Scanner drive
A269V110a.WMF
5. Drum peripheral drive
6. Image transfer belt drive
7. Registration drive
8. Paper feed drive
1-14
Page 31
30 March 1999 AIR FLOW
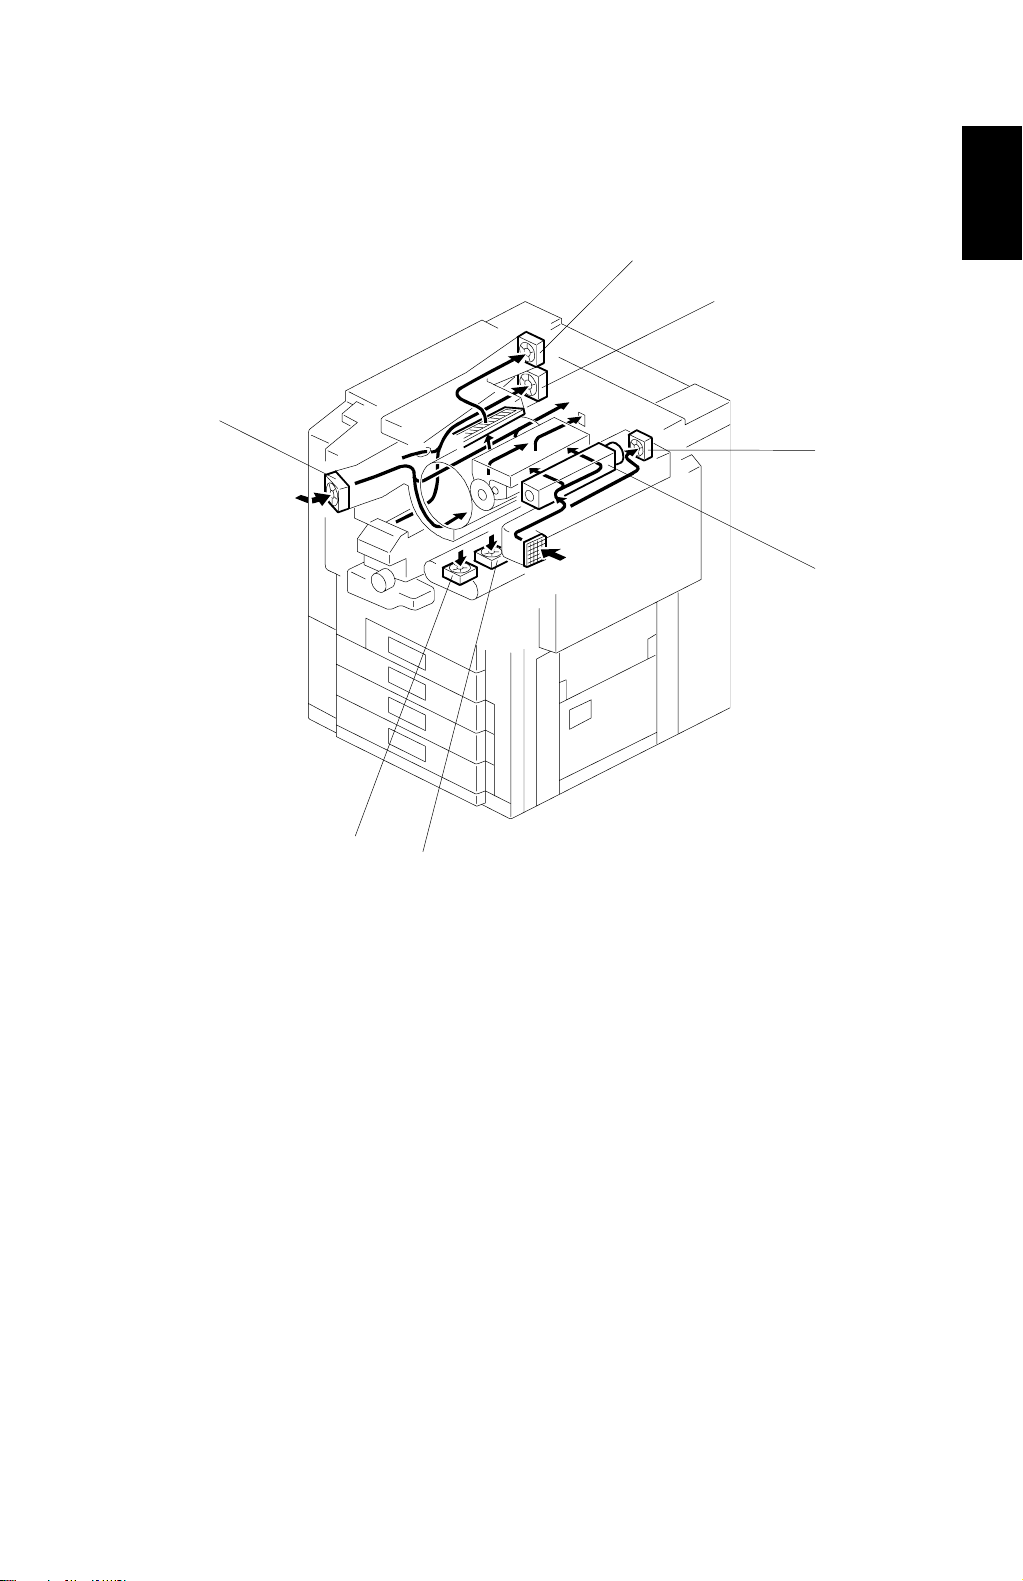
1.5 AIR FLOW
1.5.1 AIR FLOW SYSTEM 1
1
2
7
3
4
Overall
Information
1. Fusing fan (upper)
2. Fusing fan (bottom)
3. ID sensor fan
4. Charge fan
6
5
A269V111.WMF
5. Transport fan (rear)
6. Transport fan (front)
7. Development cooling fan
1-15
Page 32
AIR FLOW 30 March 1999
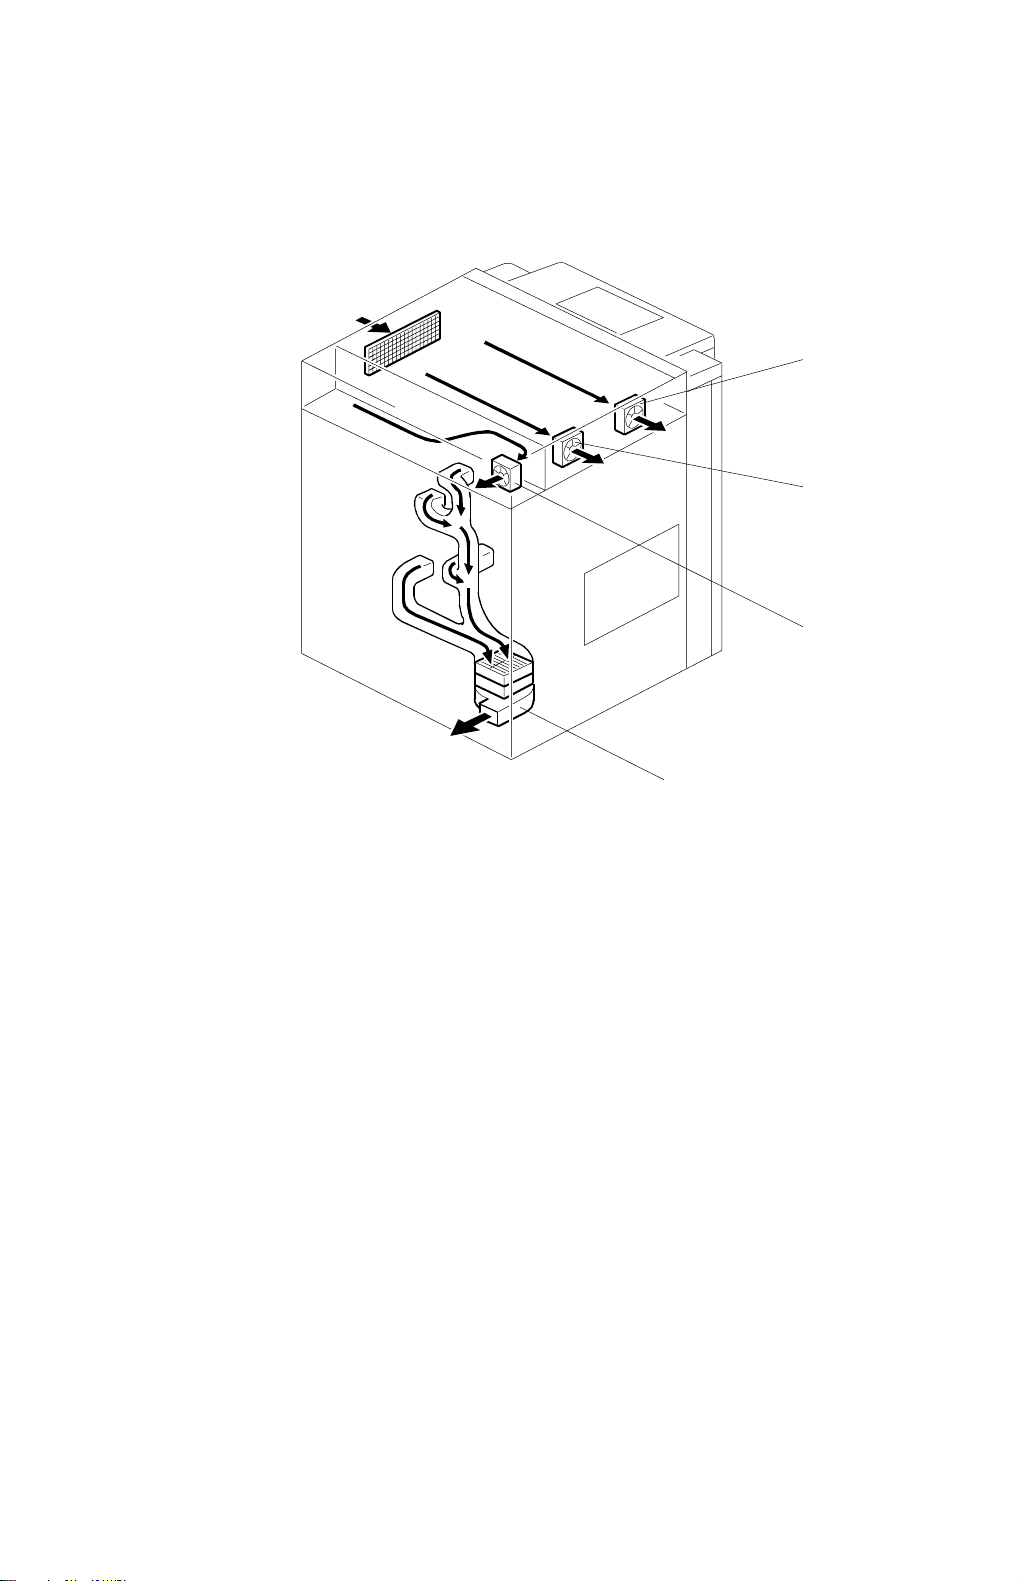
1.5.2 AIR FLOW SYSTEM 2
1
2
3
1. Optics cooling fan (front)
2. Optics cooling fan (rear)
4
A269V112.WMF
3. IPU cooling fan
4. Exhaust fan
1-16
Page 33
30 March 1999 ELECTRICAL PARTS LAYOUT
1.6 ELECTRICAL PARTS LAYOUT
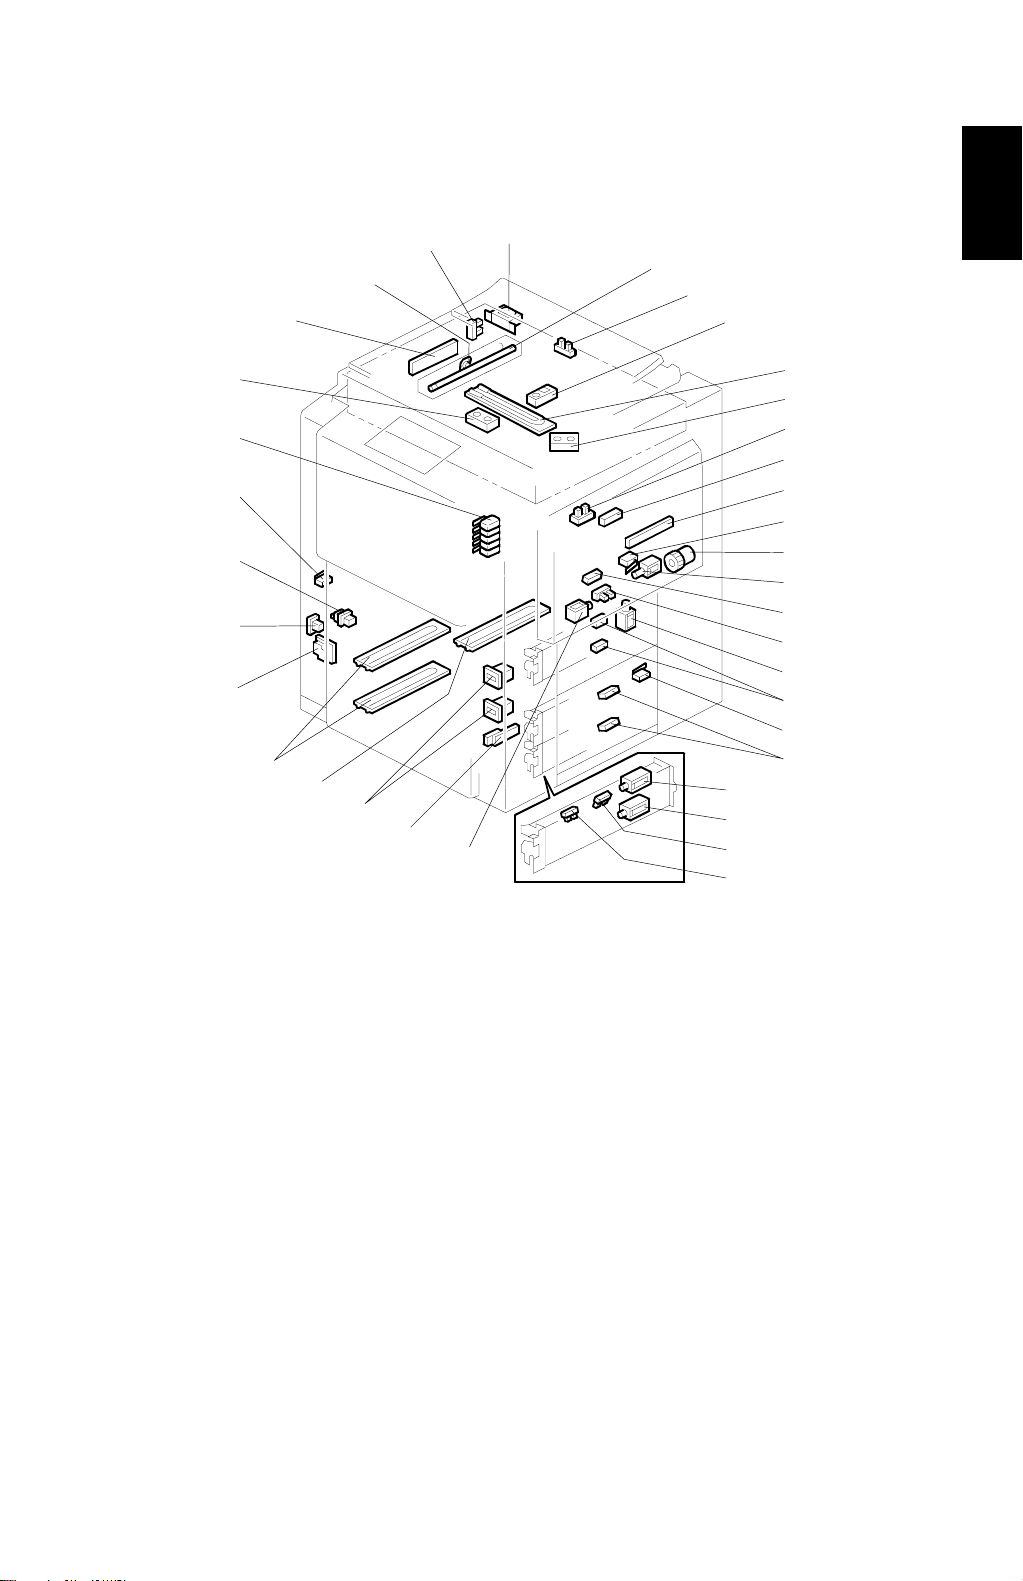
1.6.1 ELECTRICAL PARTS LAYOUT 1
36
35
34
1
2
3
4
Overall
Information
33
32
31
30
29
28
27
26
25
24
23
5
6
7
8
9
10
11
12
13
14
15
16
17
18
19
20
21
22
A269V104.WMF
1. Choke coil
2. Exposure lamp
3. Platen cover position sensor
4. Original length sensor 2
5. Optics anti-condensation heater
6. Original length sensor 1
7. By-pass paper end sensor
8. By-pass paper length sensor
9. By-pass paper width detection board
10. By-pass feed unit switch
11. By-pass feed clutch
12. Main by-pass pick-up solenoid
13. Registration sensor
14. By-pass table sensor
15. By-pass reverse roller solenoid
16. 1st/Duplex paper feed sensor
17. Vertical transport door switch
18. 2nd/3rd paper feed sensor
19. 1st/2nd/3rd pick-up solenoid
20. 1st/2nd/3rd reverse roller solenoid
21. 1st/2nd/3rd upper limit sensor
22. 1st/2nd/3rd paper end sensor
23. Sub by-pass pick-up solenoid
24. Humidity sensor
25. Mechanical total counter
26. Paper transfer heater
27. Paper tray heaters (option)
28. Toner overflow sensor
29. Main switch
30. Paper exit door switch 2
31. Paper exit door switch 1
32. Front door switch
33. Original width sensor
34. CCD
35. Thermostat
36. Scanner H.P. sensor
1-17
Page 34
ELECTRICAL PARTS LAYOUT 30 March 1999
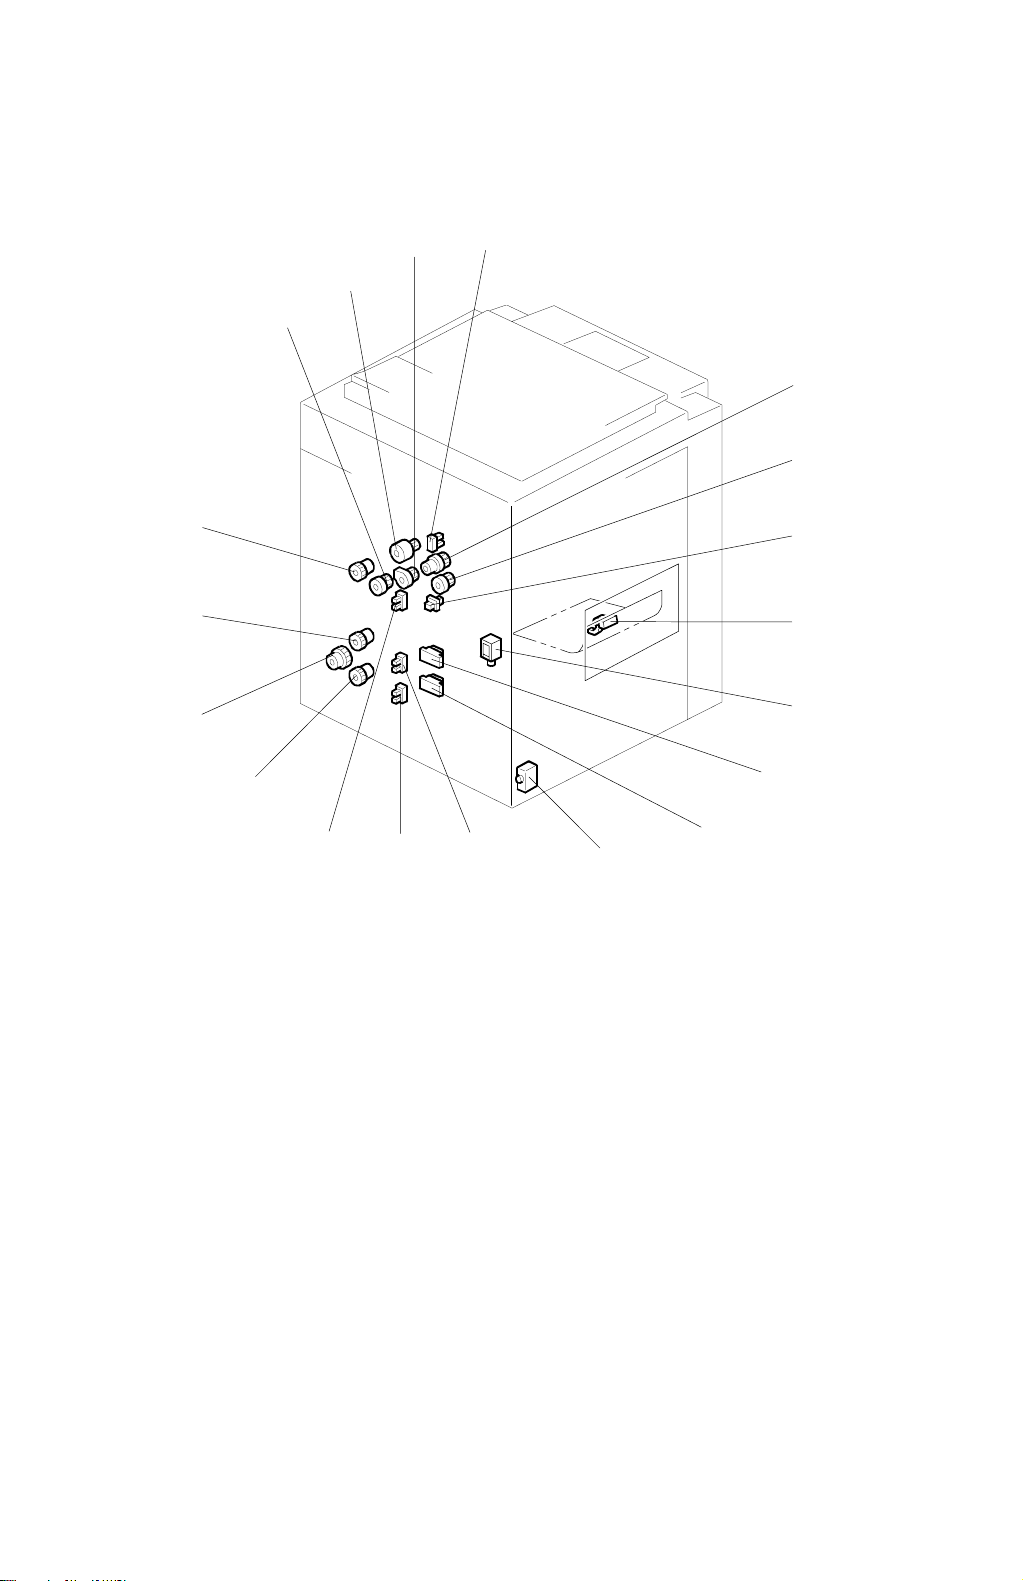
1.6.2 ELECTRICAL PARTS LAYOUT 2
19
18
17
16
3
4
2
1
5
6
7
8
9
10
15
14 13
1. Paper transfer belt shift clutch
2. Image transfer belt cleaning drive clutch
3. Image transfer belt cleaning shift clutch
4. Image transfer belt cleaning H.P. sensor
5. Development clutch
6. Toner supply clutch
7. 1st tray set switch
8. Duplex turn guide sensor
9. Junction gate solenoid
10. 2nd tray paper size switch
11
12
A269V105.WMF
11. 3rd tray paper size switch
12. Circuit breaker
13. 2nd paper height sensor
14. 3rd paper height sensor
15. 1st paper height sensor
16. 3rd feed clutch
17. Paper feed drive clutch
18. 2nd tray feed clutch
19. 1st feed clutch
1-18
Page 35
30 March 1999 ELECTRICAL PARTS LAYOUT
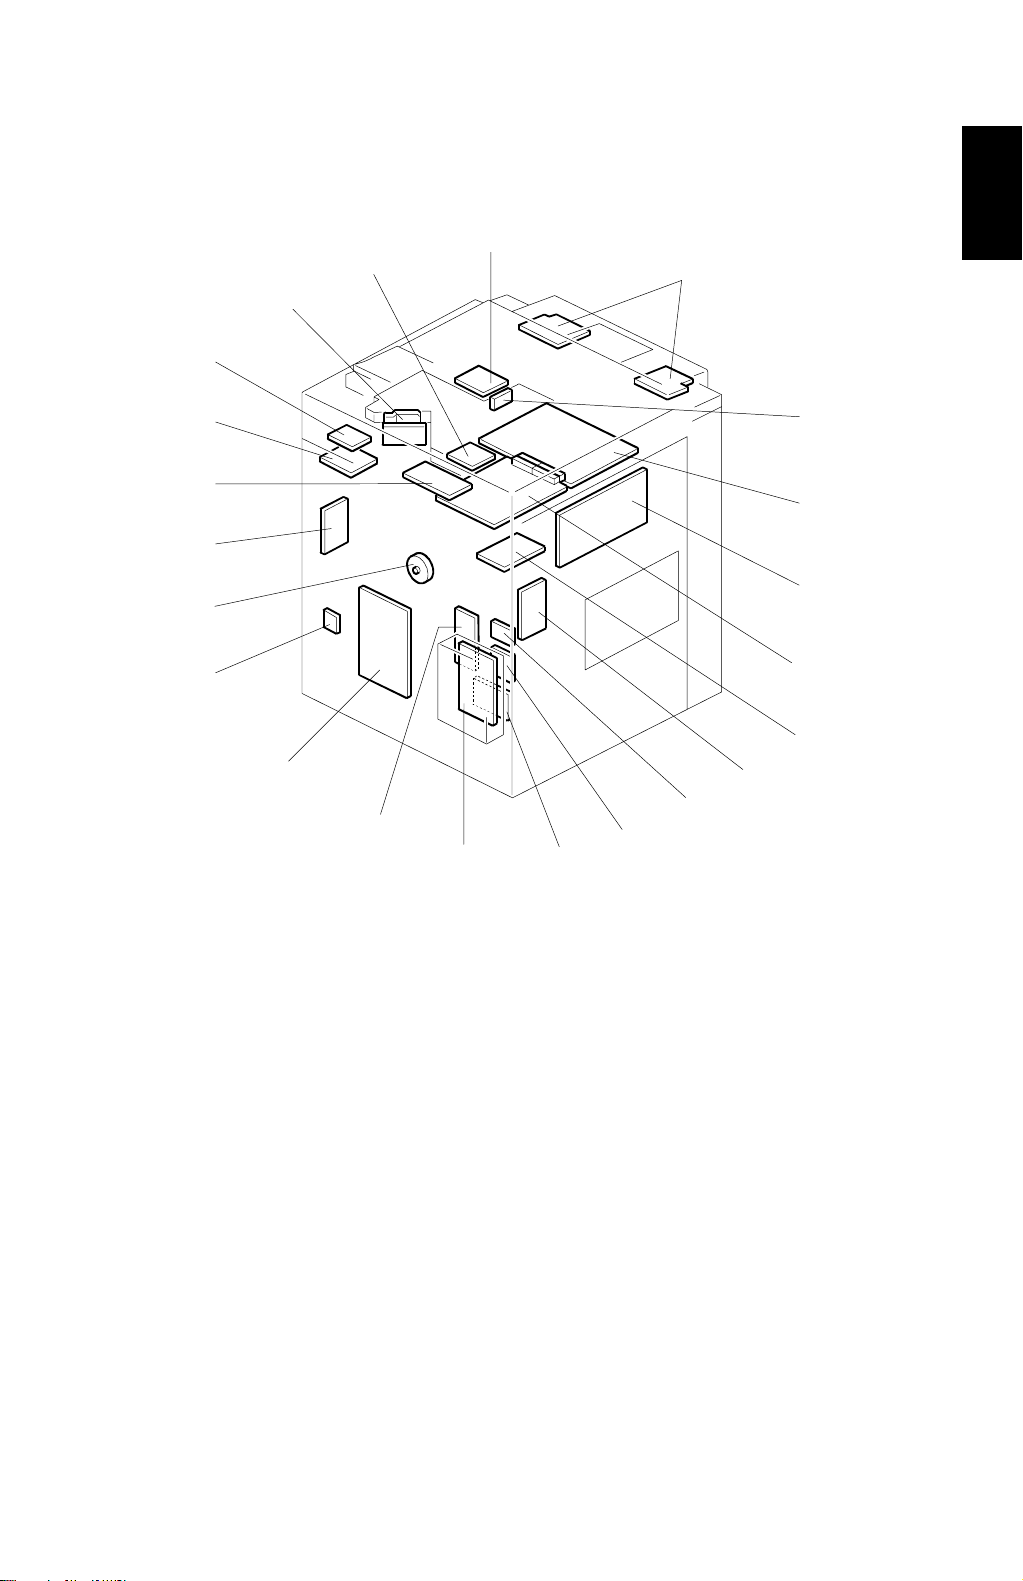
1.6.3 ELECTRICAL PARTS LAYOUT 3
5
4
3
2
6
Overall
Information
22
21
20
19
1
7
8
9
10
11
18
12
13
17
16
15
14
A269V106.WMF
1. LD control board
2. Scanner motor drive board
3. LD drive board
4. Image detection unit
5. Polygon motor drive board
6. Operation panel board
7. Laser synchronizing detector board
8. Main scanner IPU board
9. Main control board
10. Sub scanner IPU board
11. High voltage supply board C/G/B
12. Revolver motor drive board
13. High voltage supply board Q1
14. High voltage supply board D
15. AC drive board
16. Power supply unit
17. High voltage supply board
T1/PCC/BR
18. I/O control board
19. Interface board RDS/LCT
20. TD sensor interface board 1
21. Image transfer belt motor drive
board
22. Lamp regulator
1-19
Page 36
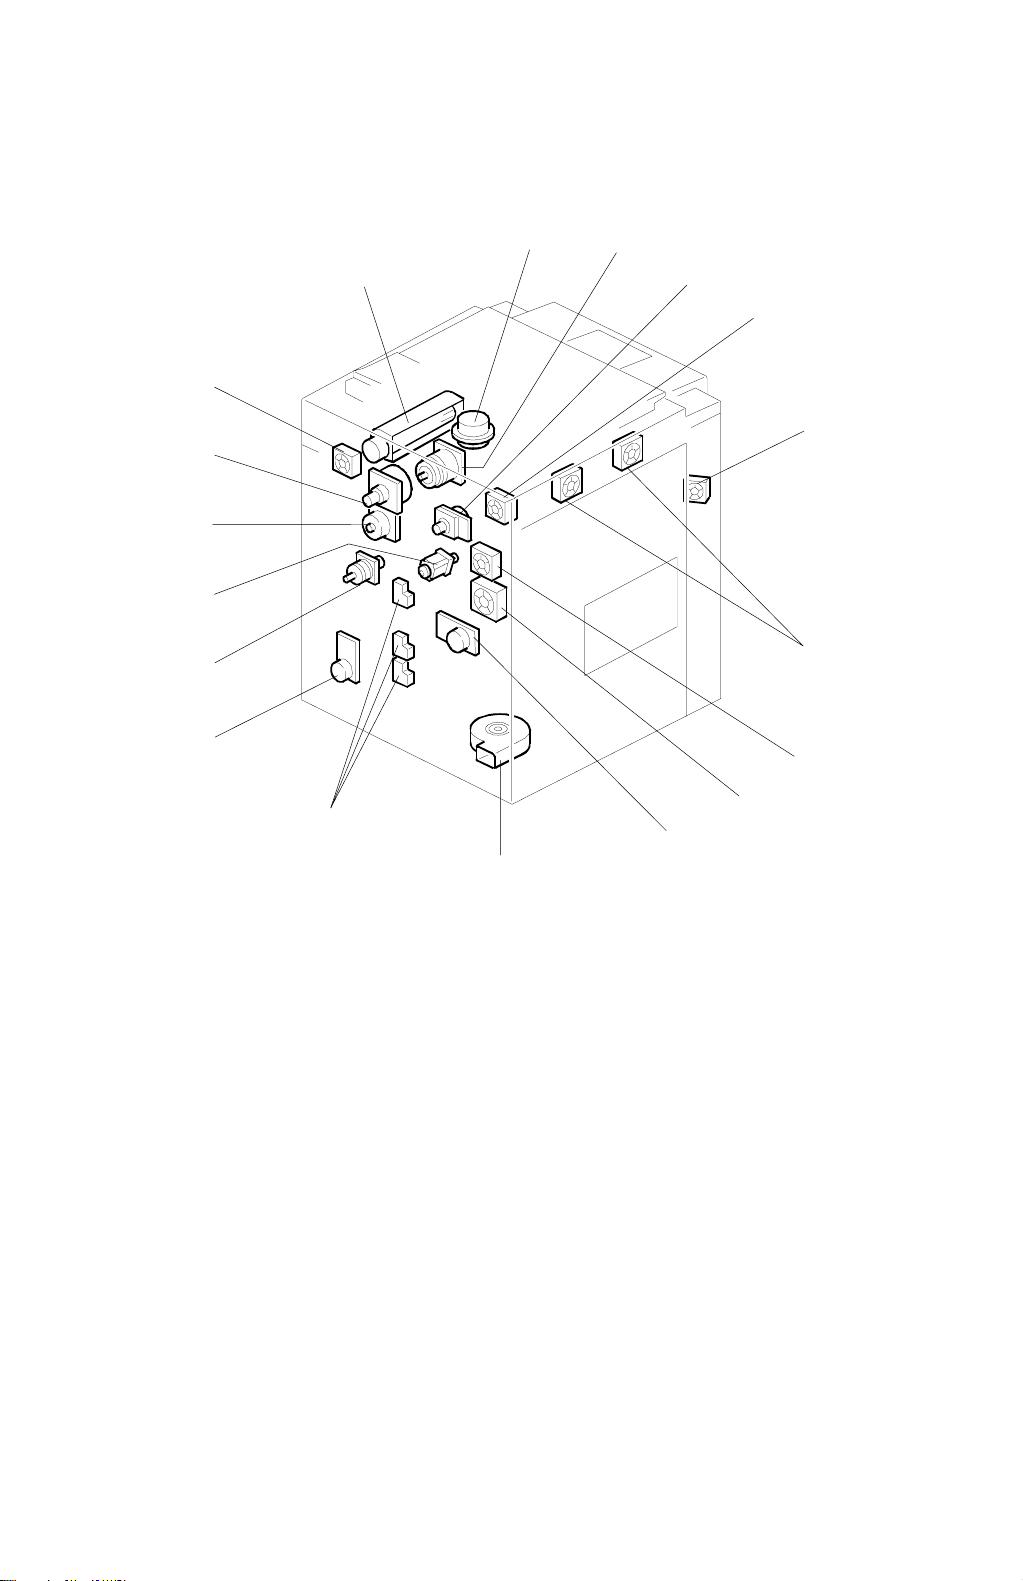
ELECTRICAL PARTS LAYOUT 30 March 1999
1.6.4 ELECTRICAL PARTS LAYOUT 4
17
16
15
14
13
12
11
18
1
2
3
4
5
6
7
8
9
1. Polygon motor
2. Scanner motor
3. Drum motor
4. IPU cooling fan
5. Development cooling fan
6. Optics cooling fan
7. Fusing fan (upper)
8. Fusing fan (bottom)
9. Fusing motor
10
A269V107.WMF
10. Exhaust fan
11. Tray lift motor
12. Paper feed motor
13. Registration motor
14. Revolver motor
15. Image transfer belt motor
16. Drum peripheral component motor
17. ID sensor fan
18. Charge fan
1-20
Page 37
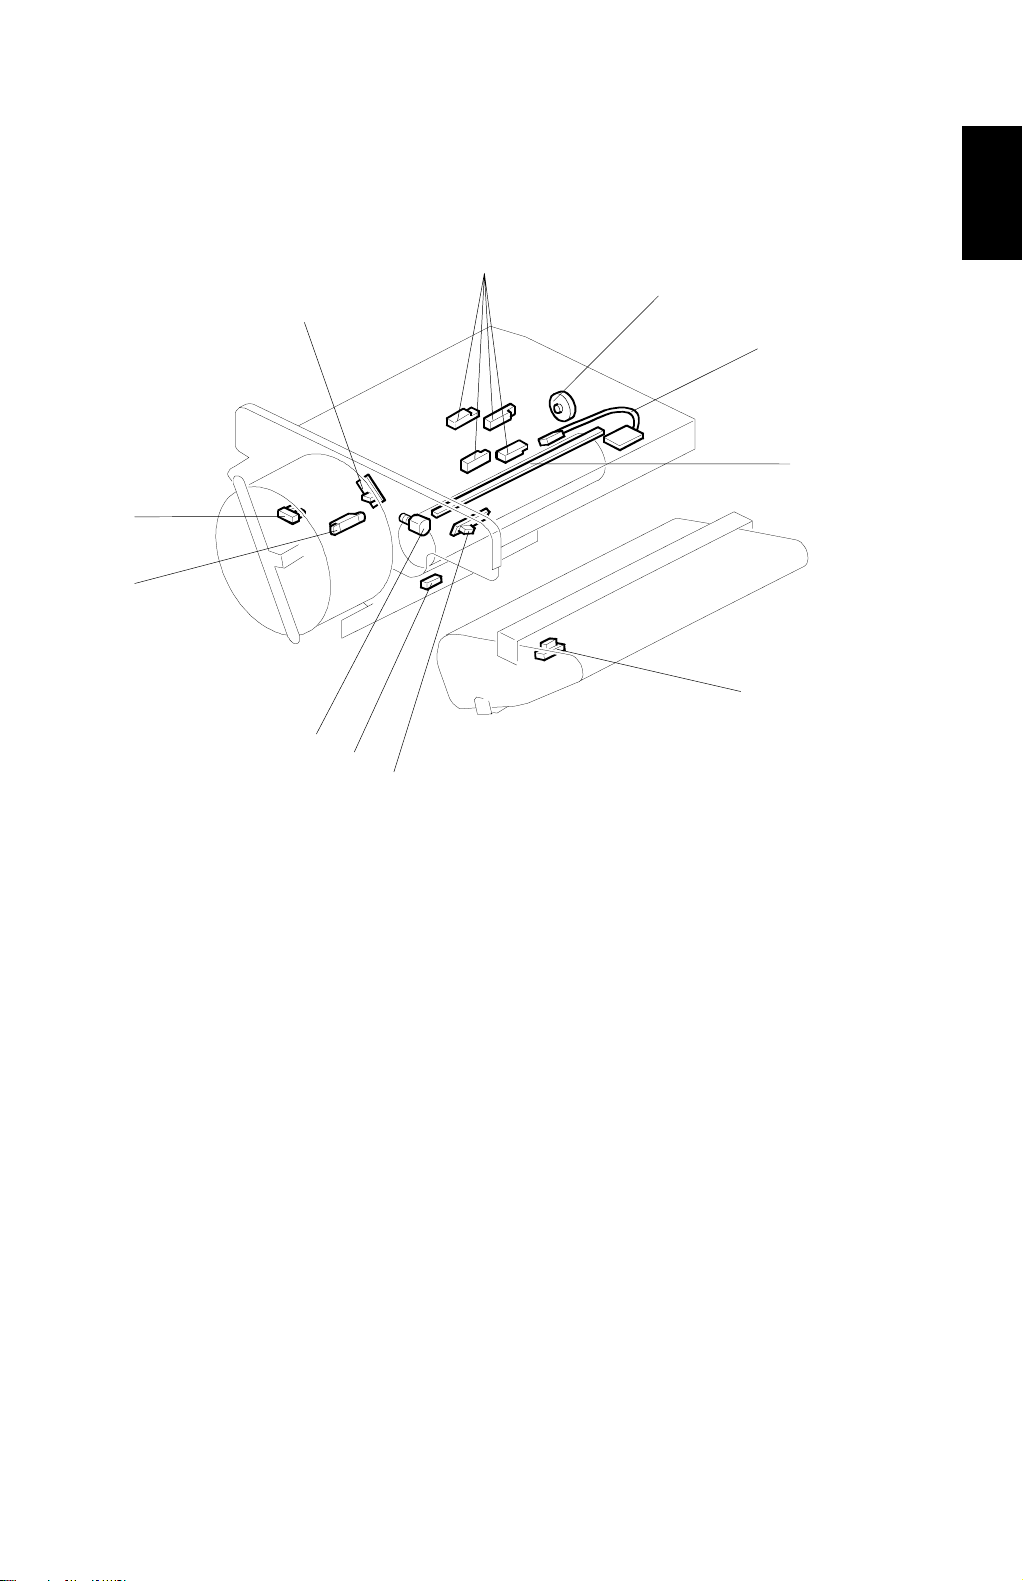
30 March 1999 ELECTRICAL PARTS LAYOUT
1.6.5 ELECTRICAL PARTS LAYOUT 5
2
3
1
4
5
11
10
Overall
Information
9
8
7
1. Toner cartridge set sensor
2. TD sensor
3. TD sensor interface board 2
4. Drum potential sensor/board
5. Quenching lamp
6. Belt mark detection sensor
6
A269V108.WMF
7. ID sensor
8. Paper separation sensor
9. Wire cleaner motor
10. Toner end sensor
11. Revolver H.P. sensor
1-21
Page 38
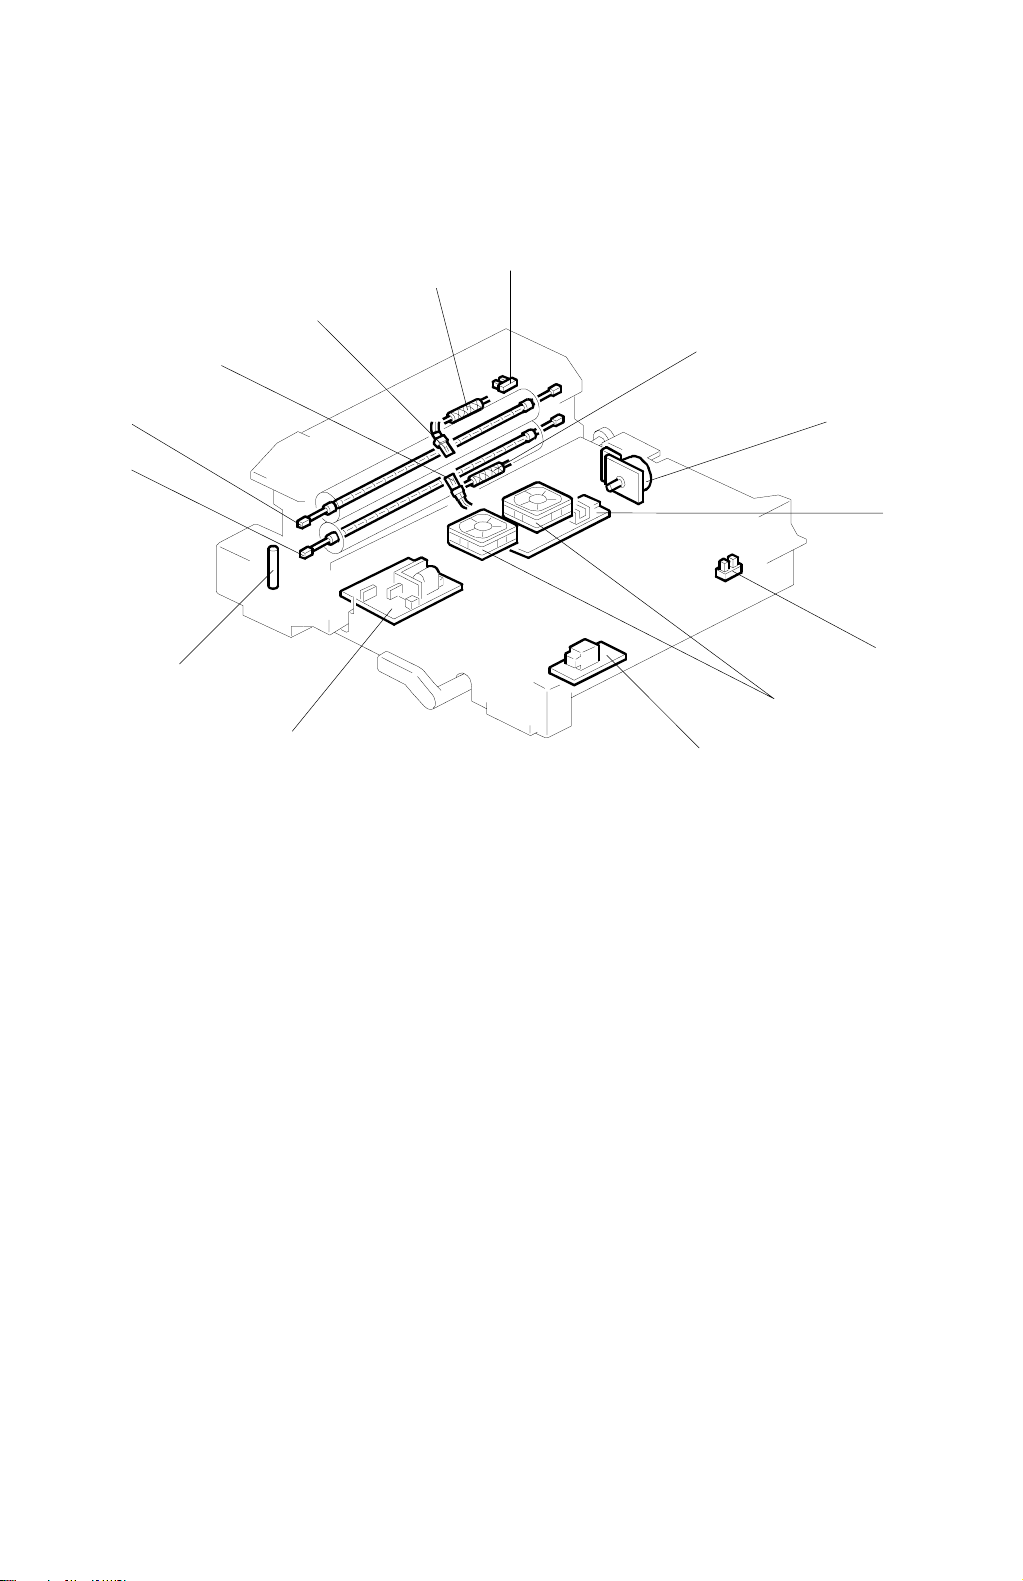
ELECTRICAL PARTS LAYOUT 30 March 1999
1.6.6 ELECTRICAL PARTS LAYOUT 6
5
6
4
3
2
7
8
1
9
10
14
11
13
12
A269V109.WMF
1. Pressure roller fusing lamp
2. Hot roller fusing lamp
3. Pressure roller thermistor
4. Hot roller thermistor
5. Hot roller thermofuse
6. Paper Exit sensor
7. Pressure roller the rmofuse
8. Paper transfer belt motor
9. Paper transfer belt motor drive
board
10. Paper transfer belt unit H.P. sensor
11. Transport fan
12. High voltage supply board T2
13. High voltage supply board Q2
14. Oil end sensor
1-22
Page 39
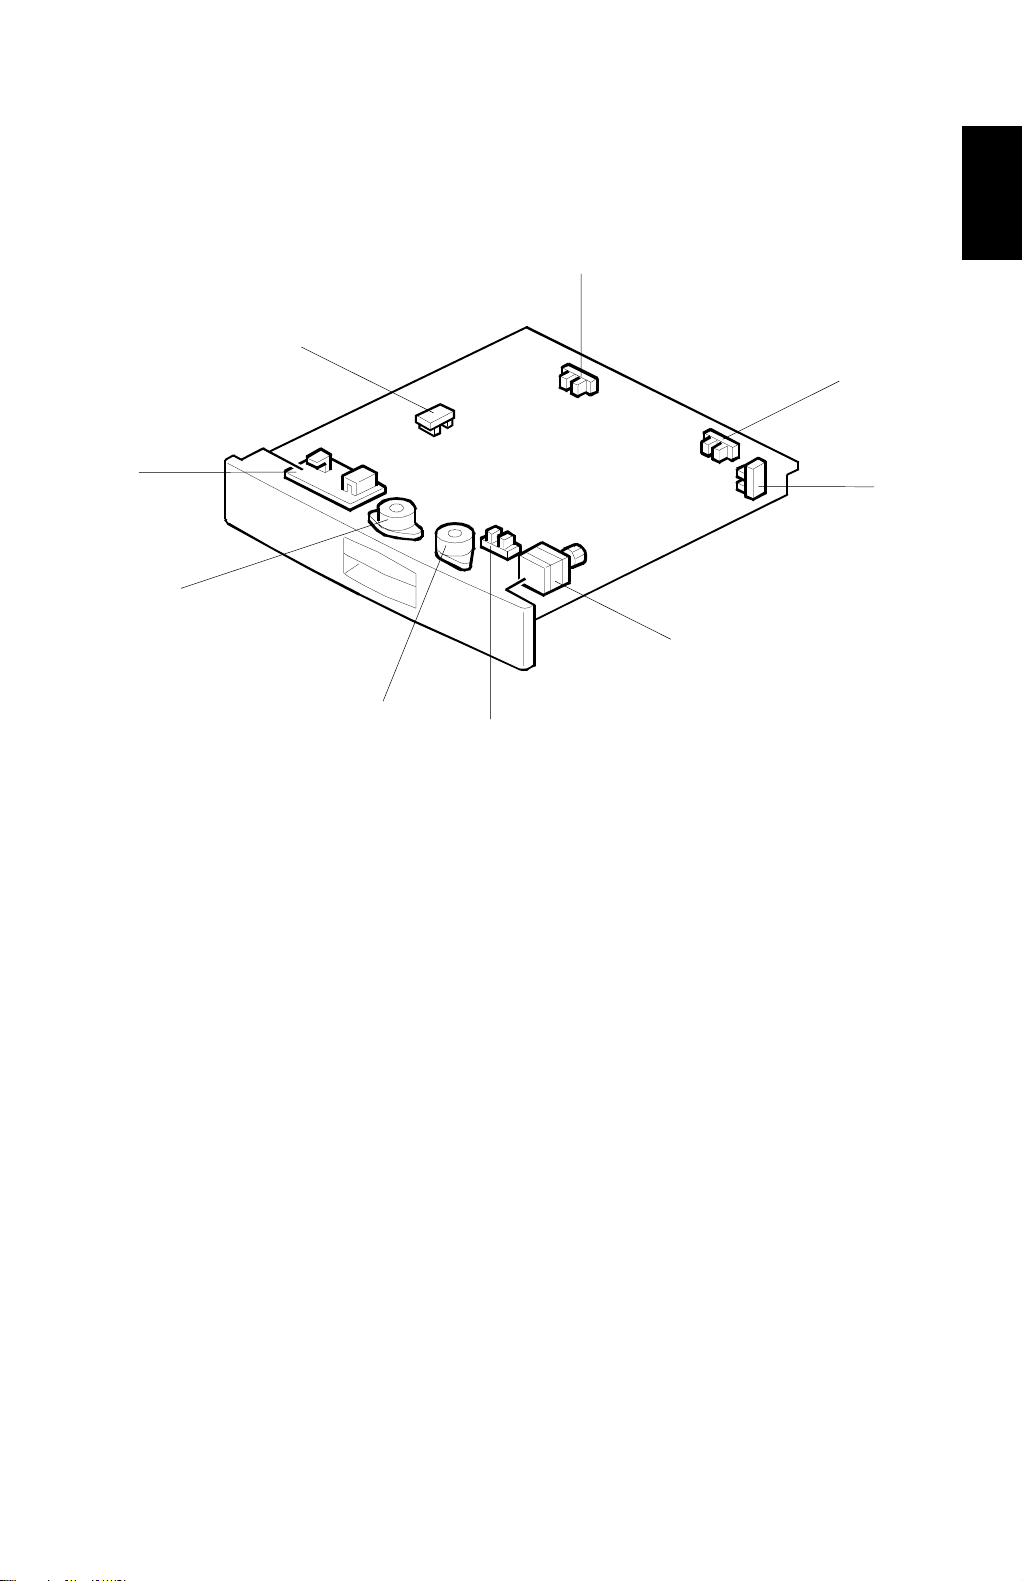
30 March 1999 ELECTRICAL PARTS LAYOUT
1.6.7 ELECTRICAL PARTS LAYOUT 7
1
9
2
Overall
Information
8
7
6
1. Duplex entrance sensor
2. Duplex turn sensor
3. Duplex paper end sensor
4. Duplex feed motor
5. Duplex side fence H.P. sensor
4
5
A269V154.WMF
6. Side fence jogger motor
7. End fence jogger motor
8. Duplex control board
9. Duplex end fence H.P. sensor
3
1-23
Page 40

ELECTRICAL PARTS DESCRIPTIONS 30 March 1999
1.7 ELECTRICAL PARTS DESCRIPTIONS
Symbol Name Function
SENSORS
Platen Cover Position Sensor Detects if the platen cover is opened or
S1
S2 Scanner H.P. Sensor Detects the scanner home position. 1/2 G5-H5 1-36
S3 Original Length Sensor 1 Detects the length of originals. 1/2 H7-H8 1-6
S4 Original Length Sensor 2 Detects the length of small size original. 1/2 G7-G8 1-4
S5 Original Width Sensor Detects the width of originals. 1/2 H7-H8 1-33
S6 Revolver H.P. Sensor Detects the revolver home position. 2/2 A3 5-11
Toner Cartridge Set Sensor
S7
Toner End Sensor
S8
S9 Toner Density Sensor - Y 1/2 B11-C11 5-2
S10 Toner Density Sensor - K 1/2 B11-C11 5-2
S11 Toner Density Sensor - M 1/2 B11-C11 5-2
S12 Toner Density Sensor - C
S13 Drum Potential Sensor/Board Detects the drum surface potential. 2/2 A4 5-4
ID Sensor
S14
Humidity Sensor Detects the humidity and temperature to
S15
Belt Mark Detection Sensor Detects the belt mark on the image transfer
S16
Image Transfer Belt Cleaning
S17
H.P. Sensor
Paper Transfer Belt Unit H.P.
S18
Sensor
By-pass Table Sensor
S19
By-pass Paper Length Sensor
S20
By-pass Paper End Sensor
S21
S22 1st Upper Limit Sensor 2/2 D11 1-21
S23 Not used
S24 2nd Upper Limit Sensor 2/2 F11 1-21
S25 3rd Upper Limit Sensor
S26 1st Paper Height Sensor 2/2 A10 2-15
S27 Not used
S28 2nd Paper Height Sensor 2/2 A10-A11 2-13
S29 3rd Paper Height Sensor
S30 1st Paper End Sensor 2/2 D11 1-22
S31 Not used
S32 2nd Paper End Sensor 2/2 F11 1-22
S33 3rd Paper End Sensor
S34 1st Paper Feed Sensor 2/2 D2 1-16
S35 Duplex Paper Feed Sensor 2/2 D2 1-16
S36 2nd Paper Feed Sensor 2/2 F2 1-18
3rd Paper Feed Sensor
S37
closed.
Detects the presence of the toner
cartridges.
Detects the presence of toner in the
cartridge.
Detects the toner density in the
development unit.
Detects the density of the sensor pattern
developed on the drum surface.
calculate absolute humidity.
belt for synchronizing the image of each
color.
Detects the ITB cleaning unit home position.
Detects the home position.
Detects if the by-pass table is opened or
closed.
Detects whether or not paper on the by-
pass tray is longer than A4 (Letter).
Detects whether or not there is paper on the
by-pass tray.
Detects the upper limit (paper feed position).
Detects when the tray is nearly out of paper.
Detects whether or not there is paper in the
tray.
1. Detects the paper to control the feed
timing of next sheet of paper.
2. Detects paper jams at the paper feed
section.
3. When a copy is made, it also controls
the stop timing of feed clutch and
solenoid.
P-to-P
Location
1/2 H5 1-3
2/2 A3 5-1
2/2 A2-A3 5-10
1/2 B11-C11 5-2
2/2 A3 5-7
2/2 A7 1-24
2/2 G2 5-5
2/2 A4-A5 2-4
2/2 E4 6-10
2/2 A4 1-14
2/2 E2 1-8
2/2 D2 1-7
2/2 G11 1-21
2/2 A11 2-14
2/2 F11-G11 1-22
2/2 F2 1-18
Index
No.
1-24
Page 41

30 March 1999 ELECTRICAL PARTS DESCRIPTIONS
Symbol Name Function
Registration Sensor
S38
Paper Separation Sensor
S39
S40 Paper Exit Sensor Detects paper jams at the exit section. 1/2 A1-B1 6-6
Duplex Turn Guide Sensor
S41
Duplex Entrance Sensor
S42
Duplex Turn Sensor Detects the trailing edge of paper to activate
S43
S44 Duplex Paper End Sensor Detects if there is paper in the duplex unit. 2/2 E10 7-3
Duplex Side Fence H.P.
S45
Sensor
Duplex End Fence H.P.
S46
Sensor
Oil End Sensor Detects whether or not the oil tank is nearly
S47
Toner Overflow Sensor Detects whether or not the toner collection
S48
SWITCHES
SW1 Main Switch Turns the power to the copier on or off. 1/2 F1 1-29
SW2 Front Door Switch 1 2/2 A6 1-32
SW3 Front Door Switch 2 2/2 A7 1-32
SW4 Front Door Switch 3
SW5 Front Door Switch 4 1/2 G11 1-32
SW6 Front Door Switch 5
SW7
SW8
SW9 1st Tray Set Switch 2/2 A8-A9 2-7
SW10 Not used
SW11 2nd Tray Paper Size Switch 2/2 A9 2-10
SW12 3rd Tray Paper Size Switch
SW13
SW14 Paper Exit Door Switch 2 Detects if the exit door is opened or closed. 2/2 A6 1-30
By-pass Feed Unit Switch Detects if the by-pass feed unit is opened or
Vertical Transport Door Switch Detects if the vertical transport door is
Paper Exit Door Switch 1 Detects if the exit door is opened or closed
Detects the leading edge of paper to control
start timing of the registration rollers. Also,
detects paper jams in the registration area.
Detects whether or not paper properly
separates from the paper transfer belt.
Detects paper jams at the turn guide
section.
Detects a paper jams at the entrance of the
duplex tray.
the jogger motor for jogging.
Detects the side fence home position.
Detects the end fence home position.
empty.
bottle is full.
Cuts the DC power to the I/O control board
when the door is opened.
Cuts the DC power to the LD control board
when the door is opened.
not.
opened or not.
Detects if the paper tray is set or not.
Detects the size of paper in the paper tray.
and cuts the DC power when the exit door is
opened.
P-to-P
Location
2/2 A5 1-13
2/2 A3 5-8
2/2 A10 2-8
2/2 E10 7-1
2/2 E10 7-2
2/2 E9 7-5
2/2 E9 7-9
1/2 B1 6-14
2/2 A10 1-28
2/2 A7 1-32
1/2 G11 1-32
2/2 A6 1-10
2/2 E2-F2 1-17
2/2 A9 2-11
2/2 A6 1-31
Index
No.
Overall
Information
PCBs
PCB1 PSU Provides AC and DC power. 1/2 C3-F2 3-16
PCB2
PCB3 Lamp Regulator Provides AC power to the exposure lamp. 1/2 H5 3-22
PCB4 Scanner Motor Drive Board Controls the scanner motor. 1/2 F5-G5 3-2
PCB5
PCB6 Main Scanner IPU Board 1/2 D6-G8 3-8
PCB7
PCB8 Main Control Board Controls the printer sequence. 1/2 B8-D11 3-9
AC Drive Board Provides AC power to fusing lamps and
heaters.
CCD
Sub Scanner IPU Board
Converts the light reflected from the original
into analog signals for the three basic colors
(RGB).
Converts RGB image signal from the CCD
to a CMYK signal data and sends the signal
to the LD control board.
1/2 C3-F2 3-15
1/2 D7-D8 1-34
1/2 E6-G9 3-10
1-25
Page 42

ELECTRICAL PARTS DESCRIPTIONS 30 March 1999
Symbol Name Function
I/O Control Board
PCB9
PCB10 LD Control Board Controls laser synchronization. 1/2 F9-F11 3-1
PCB11 LD Drive Board Controls the LD output. 1/2 D10 3-3
PCB12 Polygon Motor Drive Board Controls the polygon mirror motor. 1/2 G11 3-5
PCB13
PCB14 IDU (Image Detection Unit) Analyzes images for anti-counterfeiting. 1/2 G8 3-4
PCB15
PCB16 TD Sensor Interface Board 1 1/2 B11 3-20
PCB17
PCB18 Revolver Motor Drive Board Controls the revolver motor. 2/2 D3-E3 3-12
PCB19
PCB20
PCB21
PCB22
PCB23 High Voltage Supply Board Q1 Provides power to the lubricant brush. 2/2 E6-E7 3-13
PCB24
PCB25
PCB26 Operation Panel Board Used to operate the copier. 1/2 C11-D11 3-6
PCB27
PCB28
PCB29 Duplex Control Board Controls the duplex unit. 2/2 D8-E10 7-9
Laser Synchronizing Detector
Board
High Voltage Supply Board
C/G/B
TD Sensor Interface Board 2
Image Transfer Belt Motor
Drive Board
High Voltage Supply Board
T1/PCC/BR
Paper Transfer Belt Motor
Drive Board
High Voltage Supply Board T2 Provides power to the paper transfer belt
High Voltage Supply Board Q2
High Voltage Supply Board D
Interface Board RDS/LCT Interfaces the sensors, clutches, solenoids,
By-pass Paper Width
Detection Board
Interfaces the sensors, clutches, solenoids,
and motors in the printer module with the
main control board.
Detects the laser beam to control the start
timing of main scan writing.
Provides power to the charge corona unit
and development rollers.
Provides power to the TD sensors and
transmits the output data from the sensors
to the main control board.
Controls the image transfer belt motor.
Provides power to the image transfer belt
bias roller, PCC unit, and drum cleaning
bias roller.
Controls the paper transfer belt motor.
bias roller.
Provides power to the paper transfer belt
discharge corona unit.
Provides power to the paper separation
corona unit.
and motors in the LCT with the main control
board.
Detects the width of paper.
P-to-P
Location
1/2
A2-A11
2/2
C11-H1
1/2 G11 3-7
2/2 B1-B2 3-11
1/2 B11 5-3
2/2 F1-G2 3-21
2/2 B1 3-17
2/2 D5-E5 6-9
2/2 E4 6-12
2/2 E4 6-13
2/2 A9-A10 3-14
1/2 B6-C7 3-17
2/2 E2 1-9
Index
No.
3-18
MOTORS
M1 Polygon Motor Drives the polygon mirror. 1/2 G11 4-1
M2 Wire Cleaner Motor Drives the charge wire cleaner. 2/2 A4 5-9
M3 Drum Motor Drives the drum. 2/2 D5-E6 4-3
Drum peripheral component
M4
Motor
M5 Image Transfer Belt Motor Drives the image transfer belt. 2/2 F2 4-15
M6 Paper Transfer Belt Motor Drives the paper transfer belt. 2/2 E5 6-8
M7 1st Tray Lift Motor 2/2 D10-D11 4-11
M8 Not used
M9 2nd Tray Lift Motor 2/2 F10-F11 4-11
M10 3rd Tray Lift Motor
M11
M12
STM1 Scanner Motor Drives the scanner. 1/2 G4 4-2
STM2 Revolver Motor Drives the revolver unit. 2/2 E3 4-14
STM3 Registration Motor Drives the registration roller. 2/2 A6 4-13
Paper Feed Motor
Fusing Motor
Drives the drum cleaning unit, toner supply
unit, development unit, and image transfer
belt cleaning unit.
Lifts the tray bottom plate up.
Drives the paper feed mechanism for all
trays.
Drives the paper transport belts and fusing
rollers.
2/2 H2 4-16
2/2 G10-G11 4-11
2/2 A8 4-12
2/2 A11 4-9
1-26
Page 43

30 March 1999 ELECTRICAL PARTS DESCRIPTIONS
Symbol Name Function
STM4
STM5
STM6
CLUTCHES
CL10
CL11
Duplex Feed Motor
Side Fence Jogger Motor
(Duplex)
End Fence Jogger Motor
(Duplex)
Toner Supply Clutch Transmits the drive to the toner supply
CL1
Development Clutch Transmits the drive to the development
CL2
Image Transfer Belt Cleaning
CL3
Drive Clutch
Image Transfer Belt Cleaning
CL4
Shift Clutch
Paper transfer Belt Shift Clutch Shifts/releases the paper transfer belt
CL5
CL6 1st Feed Clutch 2/2 D10-D11 2-19
CL7 Not used
CL8 2nd Feed Clutch 2/2 F10-F11 2-18
CL9 3rd Feed Clutch
By-pass Feed Clutch Transmits drive to the by-pass feed
Paper Feed Drive Clutch Transmits drive to the paper feed
Drives the paper feed rollers in the duplex
unit.
Drives the duplex side jogger fences.
Drives the duplex end jogger fence.
mechanism.
mechanism.
Transmits the drive to the image transfer
belt cleaning unit.
Shifts/releases the cleaning brush, cleaning
blade, and entrance seal against/from the
image transfer belt.
against/from the image transfer belt.
Transmits drive to the paper feed
mechanism.
mechanism.
mechanism.
P-to-P
Location
2/2 E8 7-4
2/2 E9 7-6
2/2 E9 7-7
2/2 A5 2-6
2/2 A5 2-5
2/2 A5 2-2
2/2 A5 2-3
2/2 H2 2-1
2/2 G10-G11 2-16
2/2 E2 1-11
2/2 A8 2-17
Index
No.
Overall
Information
SOLENOIDS
SOL1 1st Pick-up Solenoid 2/2 D10-D11 1-19
SOL2 Not used
SOL3 2nd Pick-up Solenoid 2/2 F10-F11 1-19
SOL4 3rd Pick-up Solenoid
SOL5 1st Reverse Roller Solenoid 2/2 D10-D11 1-20
SOL6 Not used
SOL7 2nd Reverse Roller Solenoid 2/2 F10-F11 1-20
SOL8 3rd Reverse Roller Solenoid
SOL9
SOL10
SOL11
SOL12
FAN MOTORS
FAN1 IPU Cooling Fan Cools the scanner IPU board. 1/2 G5 4-4
FAN2 Optics Cooling Fan (Front) 1/2 G5 4-6
FAN3 Optics Cooling Fan (Rear)
FAN4 Charge Fan Provides air flow to the charge corona unit. 2/2 A4 4-18
FAN5 Development Cooling Fan Cools the development section. 2/2 E6 4-5
FAN6 ID Sensor Fan Provides air flow to the ID sensor. 2/2 A4 4-17
FAN7 Transport Fan (Rear) 2/2 E4 6-11
FAN8 Transport Fan (Front)
Main By-pass Pick-up
Solenoid
Sub By-pass Pick-up Solenoid
By-pass Reverse Roller
Solenoid
Junction Gate Solenoid Raises the junction gate to feed paper into
Lowers the pick-up roller onto paper.
Positions the reverse roller against the
paper feed roller.
Lowers the pick-up roller onto paper.
Increases the pick-up roller pressure
depending on the copy mode selected to
avoid paper misfeed.
Increases the pressure of the reverse roller
against the feed roller depending on the
copy mode selected to avoid paper misfeed.
the duplex unit.
Cools the scanner unit.
Holds copy paper against the transport
belts.
2/2 G10-G11 1-19
2/2 G10-G11 1-20
2/2 D2 1-12
2/2 D2 1-23
2/2 E2 1-15
2/2 D3-E3 2-9
1/2 G5 4-6
2/2 E4 6-11
1-27
Page 44

ELECTRICAL PARTS DESCRIPTIONS 30 July, 1999 (Revised)
Symbol Name Function
FAN9 Fusing Fan (Upper) 2/2 E6 4-7
FAN10 Fusing Fan (Bottom)
FAN11 Exhaust fan Blows air out of the copier. 2/2 A11 4-10
LAMPS
Exposure Lamp Applies high intensity light to the original for
L1
Quenching Lamp (QL) Neutralizes any charge remaining on the
L2
L3 Hot Roller Fusing Lamp Heats to the hot roller. 1/2 C1 6-2
L4 Pressure Roller Fusing Lamp Heats to the pressure roller. 1/2 C1 6-1
HEATERS
Optics Anti-condensation
H1
Heater
Paper Transfer Heater Prevents moisture from forming around the
H2
H3 Paper Tray Heater 1 (Option) 1/2 D1 1-27
H4 Paper Tray Heater 2 (Option)
THERMISTORS
TH1 Hot Roller Thermistor Monitors the temperature of the hot roller. 1/2 B1 6-4
Pressure Roller Thermistor Monitors the temperature of the pressure
TH2
Cools the fusing unit area.
exposure.
drum prior to the start of the copy cycle.
Prevents moisture from forming on the
optics.
paper transfer belt.
Keeps paper dry on the paper feed trays.
roller.
P-to-P
Location
2/2 E6 4-8
1/2 H4 1-2
2/2 A4 5-5
1/2 E1 1-5
1/2 D1 1-26
1/2 D1 1-27
1/2 B1 6-3
Index
No.
THERMOFUSES
TF1 Hot Roller Thermofuse Protects against hot roller overheating. 1/2 B1 6-5
TF2 Pressure Roller Thermofuse Protects against pressure roller overheating. 1/2 C1 6-7
THERMOSTAT
TS1 Thermostat Prevents the scanner unit from overheating. 1/2 H4 1-35
COUNTERS
CO1
CO2
CO3
Total Counter 1 (Upper)
Total Counter 2 (Bottom)
Key Counter (Option)
Indicates the total number of developments
made by C, M, and Y.
Indicates the total number of developments
made by K.
Indicates the total number of developments
of any color.
2/2 A7 1-25
2/2 A7 1-25
2/2 A7 —
1-28
Page 45
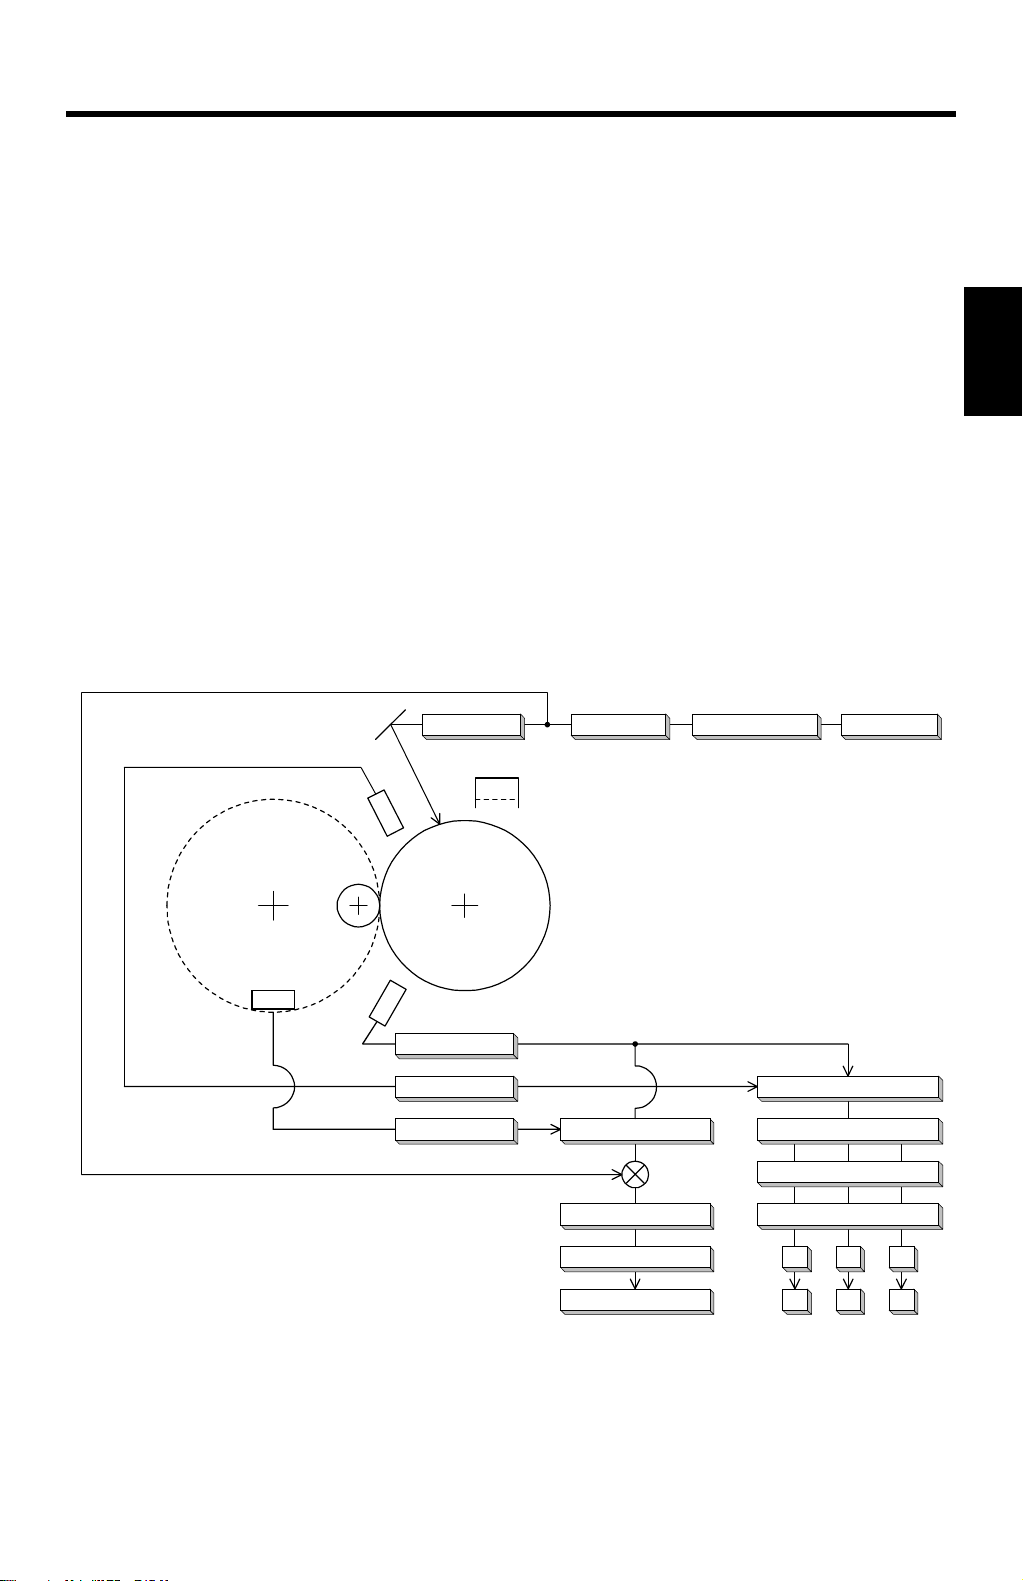
30 March, 1999 PROCESS CONTROL
2. DETAILED SECTION DESCRIPTIONS
2.1 PROCESS CONTROL
2.1.1 OVERVIEW
This copier provides the following three forms of process control:
•
Potential control (done every process control self check)
•
Toner supply control (done every copy)
•
Process control gamma calibration (done after every process control self
check)
The process control facilities of this copier have the following fe atures:
•
Use of a feedback measurement type drum potential sensor.
•
ID sensor (a new type of sensor is used, known as a ‘diffused reflection ID
sensor’). The ID sensor detects the amount of toner on the drum.
•
Use of a toner density (TD) sensor (non-contact communication with the
copier)
Detailed
Descriptions
Revolver
LD Pixel counting Write ASIC
V
G
V
B
Photoconductive drum
ID sensor
Potential sensor
TD sensor
Fuzzy logic
Toner supply calculation
Motor rotation time
Toner supply motor
Process control
γ
Potential calculation
Development characteristics
Individual potential calculation
Pointer table
V
V
D
V
G
V
B
L
V
LD
B
2-1
A269D051.WMF
Page 46

PROCESS CONTROL 30 July, 1999 (Revised)
2.1.2 POTENTIAL CONTROL
Overview
Potential control is the process of controlling the development potential to maintain
the density of the toner image on the drum. It does this by compensating for
variations in drum chargeability and toner chargeability.
The machine uses the image density (ID) sensor to measure drum reflectivity and
the density of a standard sensor pattern. It uses the drum potential sensor to detect
the potential on the standard sensor pattern (before the pattern is developed).
These tests are done during the process control self check, which is done at
specific times (such as after replacing the developer).
The ID and drum potential sensor outputs are used to calculate the development
potential. This is the difference between the development bias voltage and the
voltage of areas of the drum that have been discharged by laser exposure at full
power. If changes in this potential are not accounted for, the color balance will be
poor.
Depending on the development potential that is calculated, the machine uses a
look-up table in memory (called a pointer table) to adjust the following:
•
VD: Drum potential without exposure - to adjust this, the machine adjusts the
charge corona grid voltage (V
•
VL: Drum potential with the strongest exposure - to adjust this, the machine
G)
adjusts the laser diode input current (ILD)
•
VB: Development bias
Potential control controls the development potential so that the maximum amount
of toner applied to the drum is kept constant. However, the medium (greyscale)
range is ignored. To improve this situation, a new process called ‘process control
gamma correction’ is done after potential control. This process defines LD output
for all 256 grades of the greyscale (development bias and charge corona grid
potential are not affected).
Potential Control Timing
The machine carries out potential control using a procedure called the ‘process
control self check’. Process control gamma correction (covered in section 2.1.3) is
then done immediately after the process control self check. There are five types of
process control self check, categorized according to their execution times. Process
control takes approximately 3 minutes.
(1) Forced Process Control Self Check
After replacing the developer or drum, the technician must do the forced process
control procedure (SP3-126).
2-2
Page 47

30 March, 1999 PROCESS CONTROL
(2) Initial Process Control Self Check
The initial process control starts automatically when the power is turned on (or
when the machine returns to standby mode from sleep mode), but only if the hot
roller in the fusing unit is less than 100 degrees centigrade. This process control is
done only when SP3-125 (Set Potential Control Method) is set to "0 (Auto)."
(3) Interval Process Control Self Check
The copy interval process control starts automatically at the end of a copy job
during which the total number of copies exceeds a preset value.
The preset value can be defined using SP3-973 (Set Process Control Self Check
Interval). The factory setting is 150 sheets. The maximum possible interval is 500
sheets. Using a shorter interval reduces the machine’s average copying speed.
Setting the process control interval to 0 disables the interval process control.
(4) Timed Process Control Self Check
This process control self check is activated at a predetermined time interval
(hours). This check is identical to the interval process control self check. This self
check is initiated by entering a value (defaulting to 6 hours) in SP3-972-00. The
settable range is 0 to 240. Entering a value of 0 suppresses the execution of this
self check.
Detailed
Descriptions
The timer is reset by the following conditions:
•
At the finish of any other process control self-check
•
At the finish of image processing (copying or printing)
•
When the main switch or the operation switch is turned OFF/ON.
•
W hen any door or cover is opened and closed.
•
At the end of toner end recovery.
NOTE:
Just pressing operation panel keys does not reset the timer.
(5) ACC-Run-Time Process Control Self Check
A process control self check that is activated before the execution of ACC (auto
color calibration). This check is identical to the interval process control self check.
This process control self check is done when SP4-507 (ACC process control
ON/OFF) is set to “3” (Both Copy/Printer ACC). If a value of 0 is entered, this
process control self check is not done.
2-3
Page 48
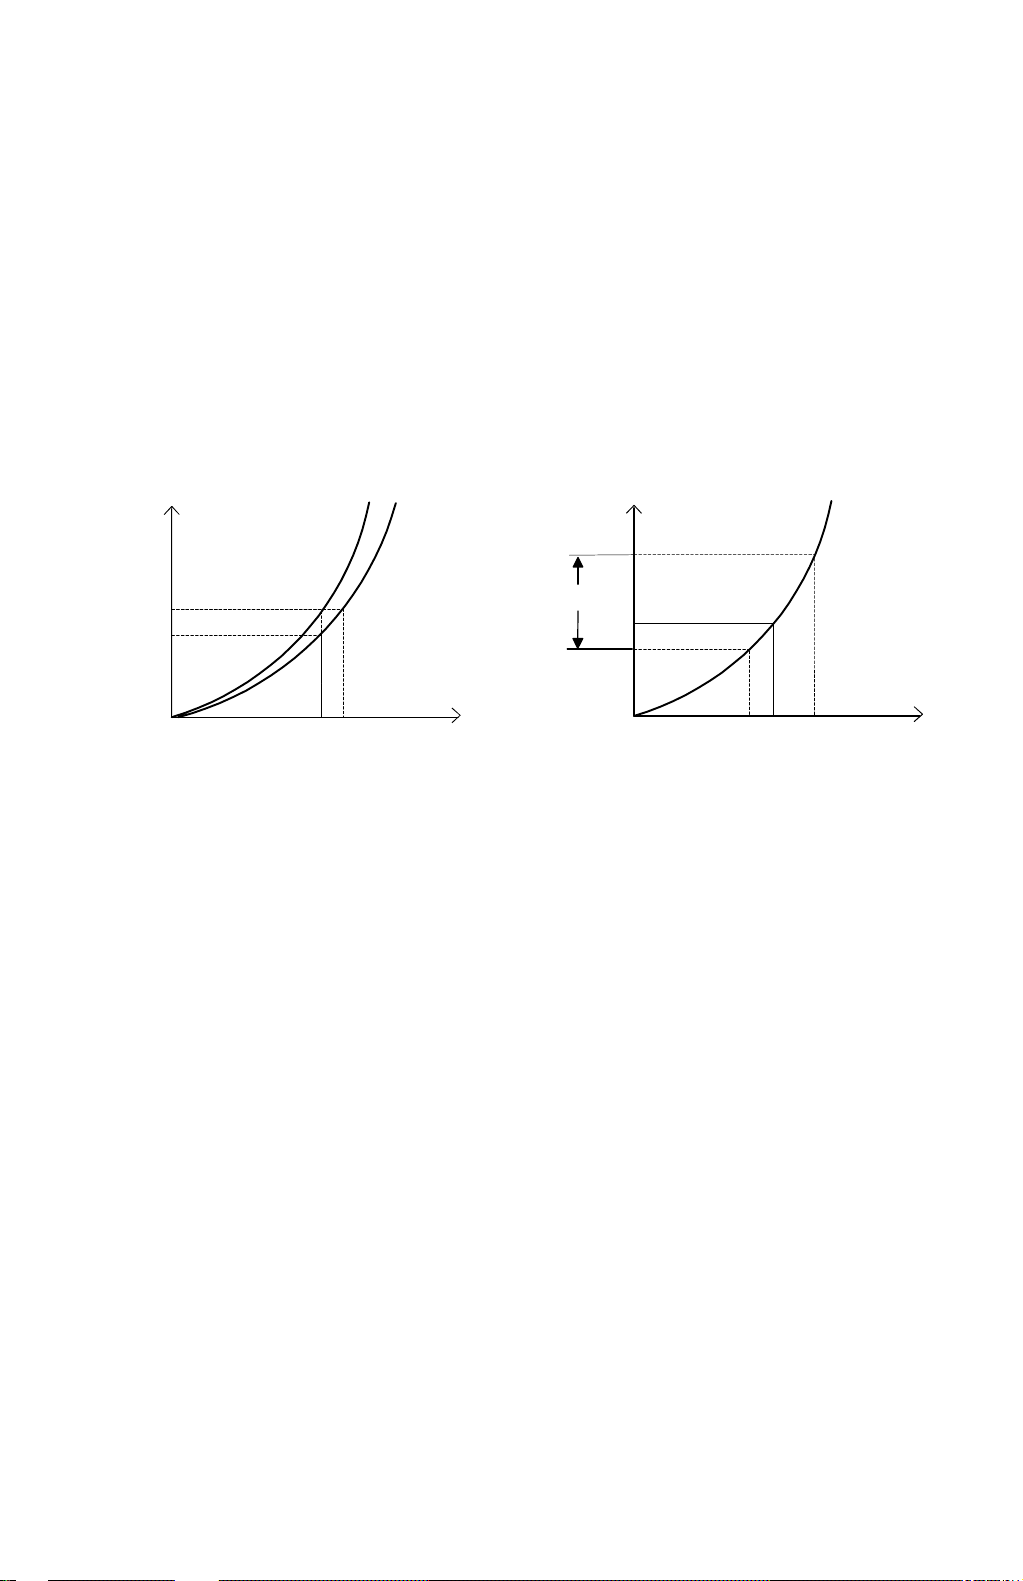
PROCESS CONTROL 30 March, 1999
2.1.3 PROCESS CONTROL
What is process control
γγγγ
?
γγγγ
CORRECTION
After the process control, the proper values for VD, VB, VL have been defined for
the maximum laser power. However, the medium (greyscale) range is ignored. To
improve this situation, a new process called ‘process control gamma correction’ is
done after potential control. This process defines a suitable LD output for all 256
grades of the greyscale.
Process control gamma correction takes about 30 seconds.
How is it done?
ID sensor
output
Target
B
C
Actual
Actual LD
value
VSP range
D
D
A
Input LD value
A
Target LD value
A269D556.WMF
Based on the maximum laser power just defined during the process control self
check, the machine writes another 16-grade sensor pattern on the drum.
NOTE:
The 16-grade pattern for process control gamma is made by varying laser
intensity based on the ILD value just determined during the process control
self check. This is different from the 16-grade pattern made earlier, which
is made using 16 fixed laser power levels.
The ID sensor detects the density developed on these patterns and compares
them with the target densities in ROM. The target densities and the actual densities
can be plotted as shown in the diagram above left.
NOTE:
To make the curve of actual densities, the machine draws a curve
(interpolates values) through the density points read from the 16-grade
pattern made for process control gamma.
From this, the machine determines how much to correct the LD power when
attempting to write a certain density on the drum.
In the example in the diagram, for a laser power of A, the machine expected an ID
of B. However, the actual result was C. To get an ID of B, the machine has to use a
laser power of D. The expected ID can be plotted against the actual ID as shown in
the diagram above right; this is the process control gamma curve.
2-4
Page 49

30 March, 1999 PROCESS CONTROL
Process control γ target is stored in the NV-RAM on the main control board. The
CPU calculates the process control γ on the main board. The results of process
control γ calculation go to the LD main control board to compensate the LD input
data.
The process control gamma obtained cannot be adjusted in SP mode.
Process Control
γγγγ
Correction Timing
The machine automatically does process control gamma correction at the end of
every process control self check.
Relationship Between Process Control
γγγγ
Correction, ACC, and Other
γγγγ
Corrections
Process control γ correction is executed so that the amount of toner attached to the
drum against the LD write value has the intended characteristic within the process
range between LD write and development section. However, the ACC correction
encompasses the process range from scanning to image generation (including the
scope of process control γ correction).
Potential control and process control γ correction have different goals. The ultimate
purpose of potential control is to adjust the maximum amount of toner attached to
the drum against the development potential to a certain target value. Process
control γ correction, however, adjusts the amount of toner at all levels of the 16
gradation patterns to the target characteristics and interpolates between the 16
adjusted levels to make all 256 grayscale grades. This correction is used to make
the image characteristics in low ID sections closer to the target value.
Detailed
Descriptions
2-5
Page 50
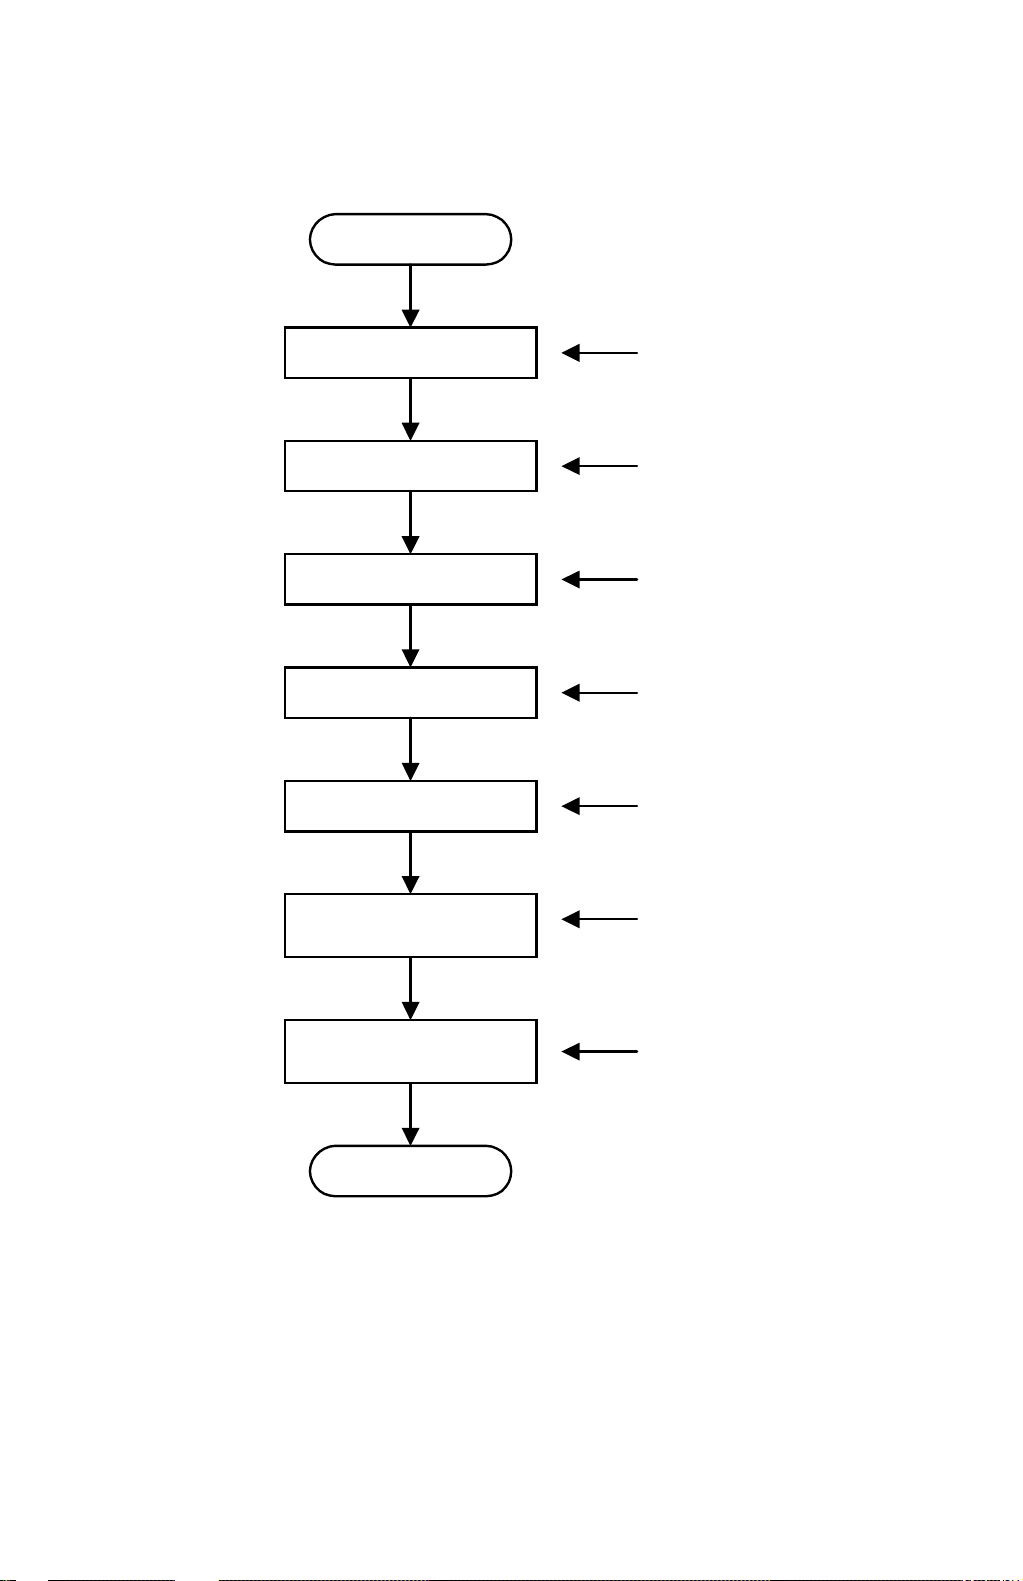
PROCESS CONTROL 30 March, 1999
2.1.4 PROCESS CONTROL SELF CHECK OPERATION FLOW
Start
Adjust ID sensor V
Generate patch patterns
Sense with potential sensor
Sense with ID sensor
Calculate amount of toner
Calculate development
characteristics
SG
Step 1
Step 2
Step 3
Step 4
Step 5
Step 6
Determine optimum VD, VB, and
VL from potential table
End
2-6
Step 7
A269D052.WMF
Page 51
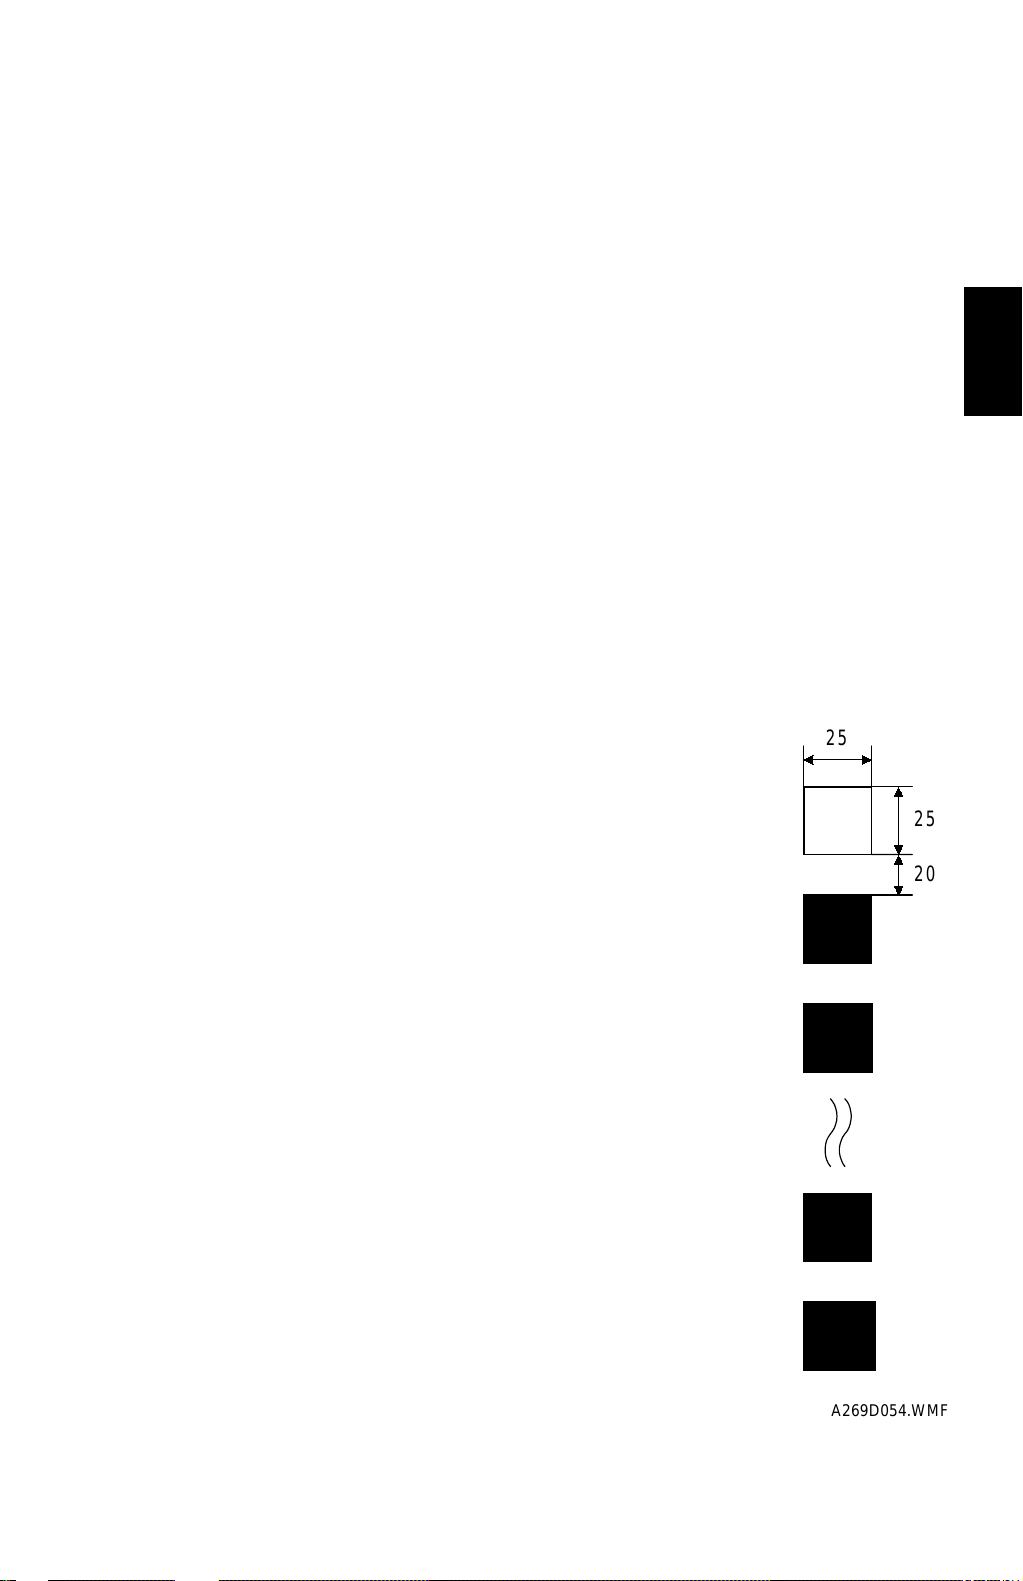
30 March, 1999 PROCESS CONTROL
Step 1: VSG Adjustment
The type of ID sensor used in this machine responds differently for black and color,
so there are two V
The type of ID sensor used in this machine is very sensitive, and outputs some
voltage even if there is no light being reflected off the drum. This output is known
as the ‘offset’. It is about 1 V for black and about 0.2 V for color. For more details
on this sensor (known as a ‘diffused reflection ID sensor’), see ‘Step 4: Sensor
Pattern Density Detection’.
The ID sensor checks the bare drum’s reflectivity and the machine calibrates the
output of the ID sensor as follows. This voltage is known as VSG:
•
(1.8 + offset) ± 0.05 V
This calibration compensates for the drum’s condition (due to ageing) and the ID
sensor condition, such as dirt on the surface of the drum or ID sensor.
Note that VSG for black is less than half of that in previous models. This is due to
the new type of ID sensor, which is described in a later section.
values, one for black toner and one for CMY toner.
SG
Detailed
Descriptions
Step 2: Generating ID Sensor Patch Patterns
The machine makes a 16-grade pattern on the drum for each
toner color. Each grade of the pattern is made by changing the
LD power. At this stage, the patterns are not developed; they
remain as latent images.
25
25
20
A269D054.WMF
2-7
Page 52
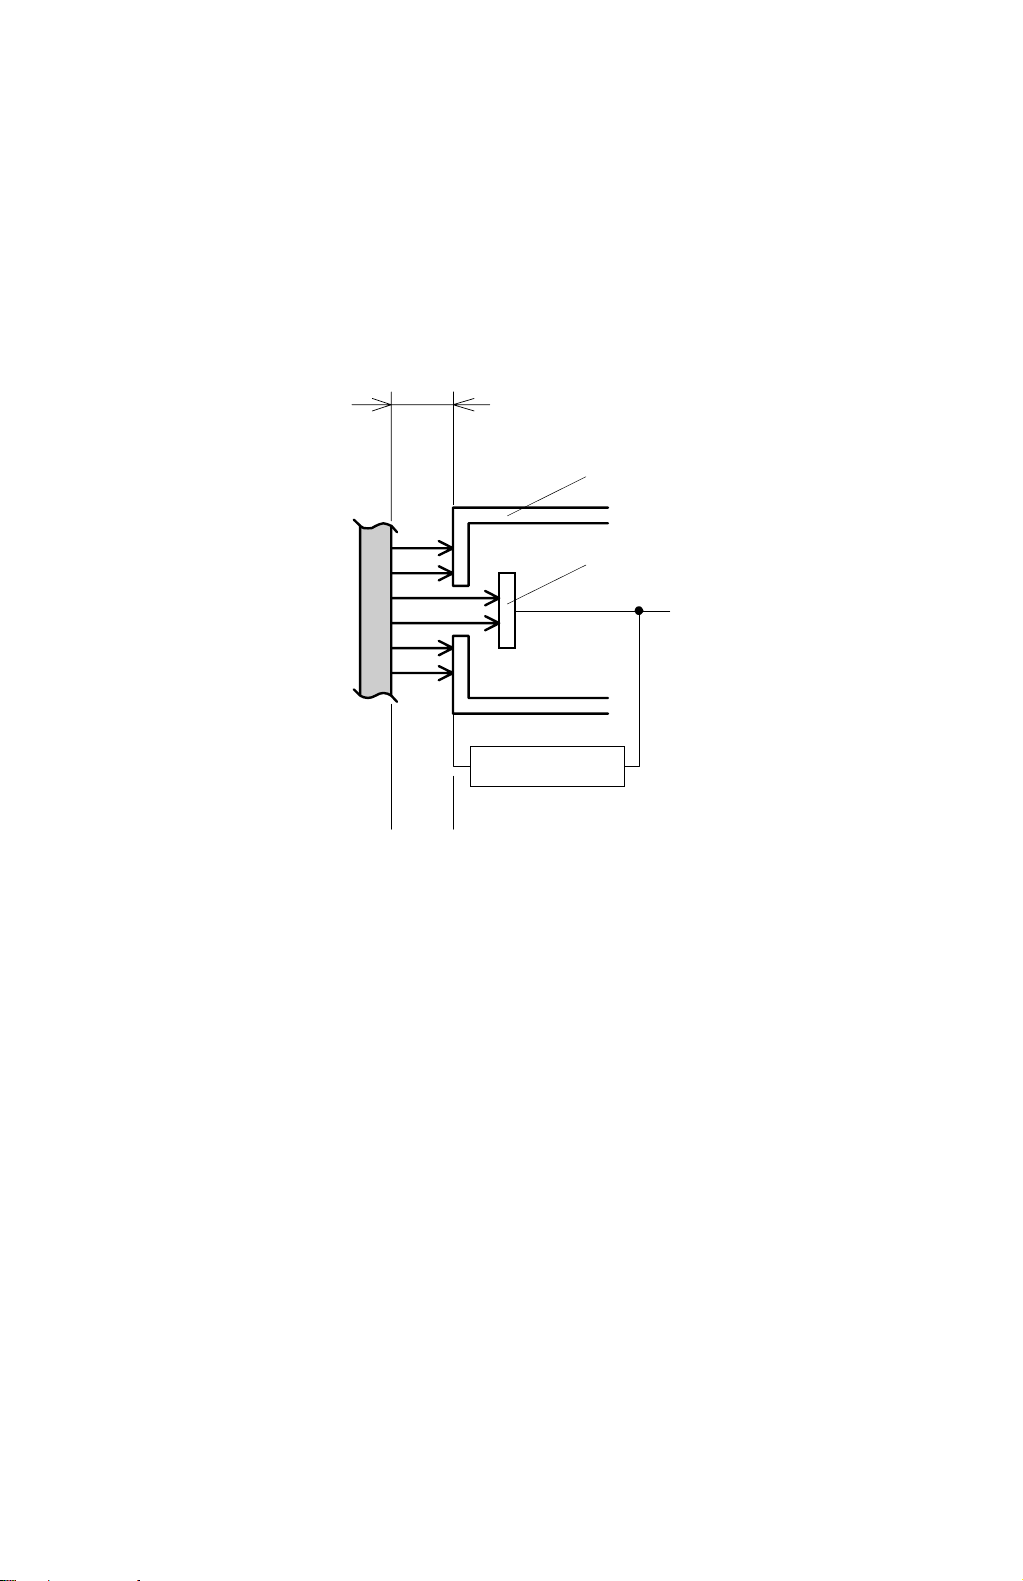
PROCESS CONTROL 30 March, 1999
Step 3: Sensor Pattern Potential Detection
Process
The drum potential sensor det ects the potential on each grade of the 16-grade
sensor pattern latent image, for each color, and the output is stored in memory.
Feedback Type Drum potential Sensor
d
[B]
[A]
V
Feedback circuit
dc
A269D053.WMF
This copier uses a feedback drum potential sensor.
The detector [A] detects the strength of electric fields emitted from the drum
surface, which depend on the surface potential of the drum. The feedback circuit
applies voltage to the probe [B] until the electric field strength is offset at the
detector. The level of this voltage determines the magnitude of the potential on the
drum surface and is presented as output.
The major features of this measurement method are:
•
Even if the distance [d] between the drum (1) and the drum potential sensor (2)
fluctuates, the measurement of the drum surface potential is still accurate.
•
The drum potential sensor does not have to be calibrated before the process
control self check, so the calibration step required for previous models can be
skipped.
•
Residual voltage affected the calibration for the older type of sensor, so before
process control self checks, the machine had to wait 10 minutes in standby mode
for the residual voltage to disappear. For this new sensor, calibration is not
needed, so the influence of residual voltage on the drum can be ignored.
2-8
Page 53
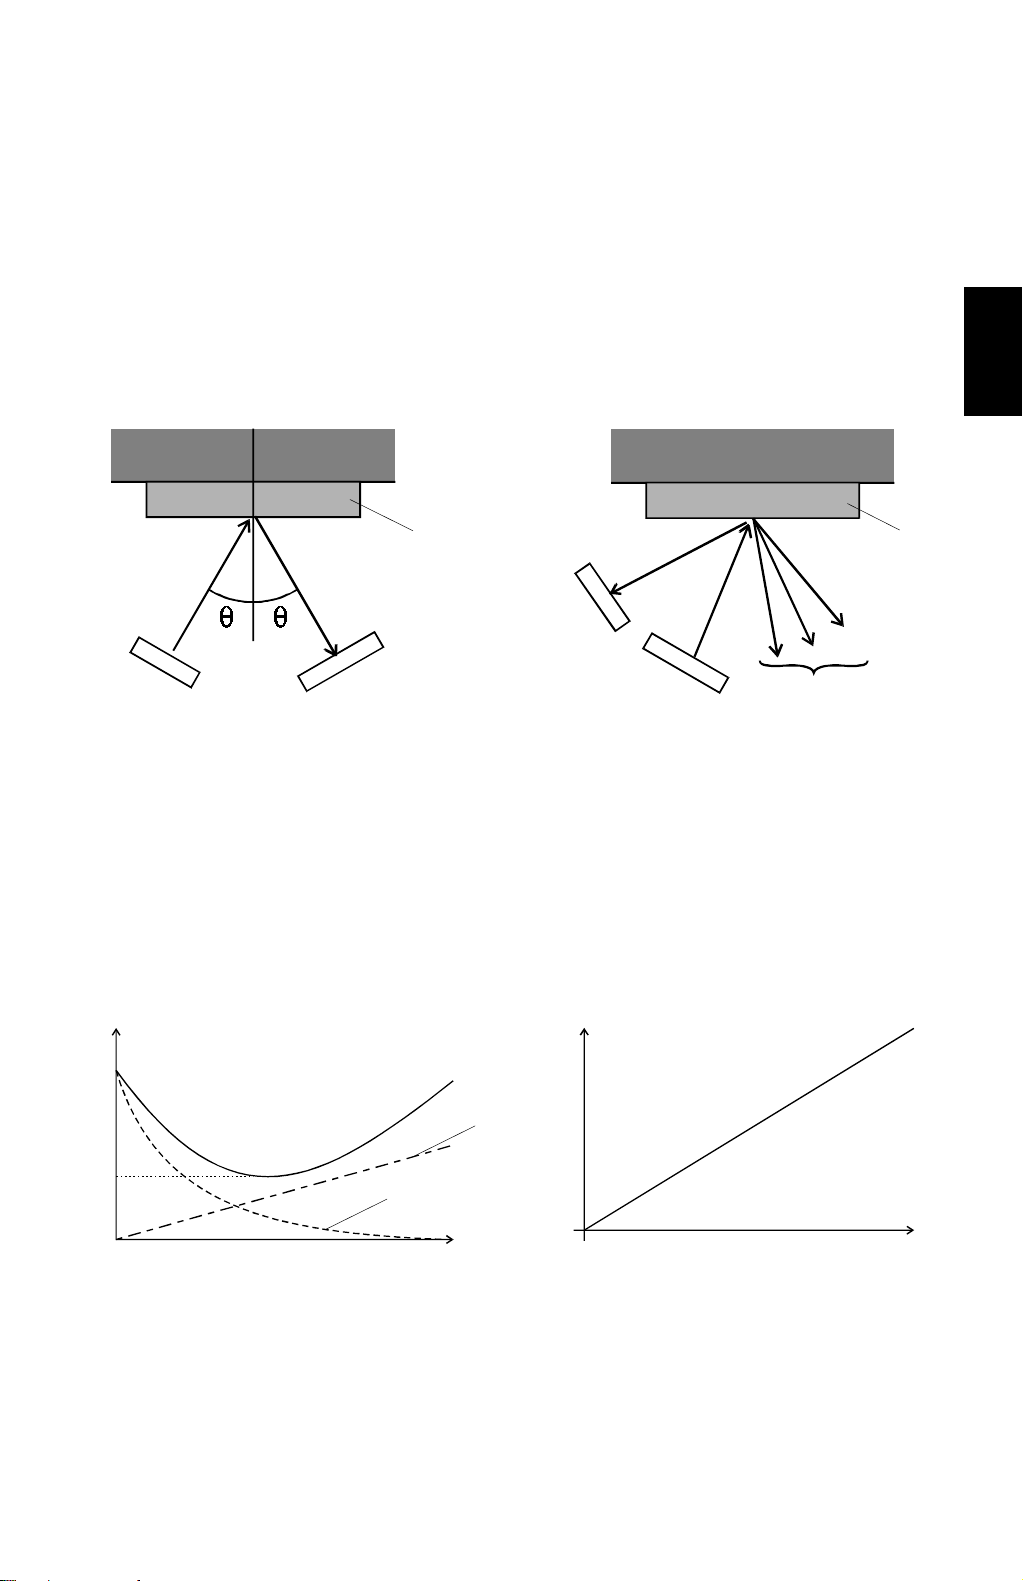
30 March, 1999 PROCESS CONTROL
Step 4: Sensor Pattern Density Detection
Process
The development rollers of the respective colors develop the sensor pattern latent
images for K, Y, C, and M generated in Step (2). In Step (4), the ID sensor detects
the densities of the 16 patch patterns for each color. This data goes to memory.
Diffused Reflection ID Sensor
Direct Reflection Type ID Sensor
Drum
Toner
Detector
LED Detector
A269D056.WMF
Diffuse Reflection Type ID Sensor
Drum
LED
Diffuse Beams
A269D057.WMF
Toner
This copier uses a diffused reflection ID sensor. In addition to the ray directly
reflected from the drum, there are diffuse beams reflected at all angles from the
toner on the drum. This sensor detects image density by receiving some of these
diffuse beams, not by receiving the beam directly reflected from the toner.
Using this type of sensor improves the measurement accuracy of the sensor
pattern densities particularly for Y, C, and M toners.
Detailed
Descriptions
Color (Y, C, M) toners
Direct Reflection Type ID Sensor Diffuse Reflection Type ID Sensor
SP
V
min
V
A269D058.WMF
(1): Component of light reflected from the drum
(2): Component of light reflected from C, M, or Y toner
[Figure A]
Relationship between the output of the
normal reflection type ID sensor and the
amount of toner on the drum for C, M, and
Y toners
SP
V
= (1) +(2)
(1)
(2)
M/A
2-9
SP
V
A269D059.WMF
[Figure B]
Relationship between the output of the
diffused reflection ID sensor and the
amount of toner on the drum for C, M, and
Y toners
M/A
Page 54

PROCESS CONTROL 30 March, 1999
Figure A shows the relationship between the output of the normal reflection ID
sensor and the amount of Y, C, or M toner attached to the drum. This shows that
the ID sensor output (Vsp) results from not only the light reflected from the toner
but also the component of light reflected from the drum.
Therefore, high densities of colored toner (i.e., to the right of the minimum point in
the VSP curve at Vmin) cannot be measured.
The diffused reflection ID sensor, on the other hand, picks up little light that is
reflected from the drum. Therefore, the relationship between the diffused reflection
ID sensor output and the amount of toner attached to the drum is linear, as shown
in Figure B. This means that high densities of colored toner can be measured
accurately.
K Toner:
SP
V
[Figure C]
Relationship between the output of the
diffused reflection ID sensor and the amount
of toner on the drum for K toner
M/A
A269D060.WMF
The ID sensor output for K toner tends to decrease as the density of toner on the
drum increases. Therefore, the relationship between the ID sensor output and the
amount of K toner on the drum is as shown in Figure C.
2-10
Page 55
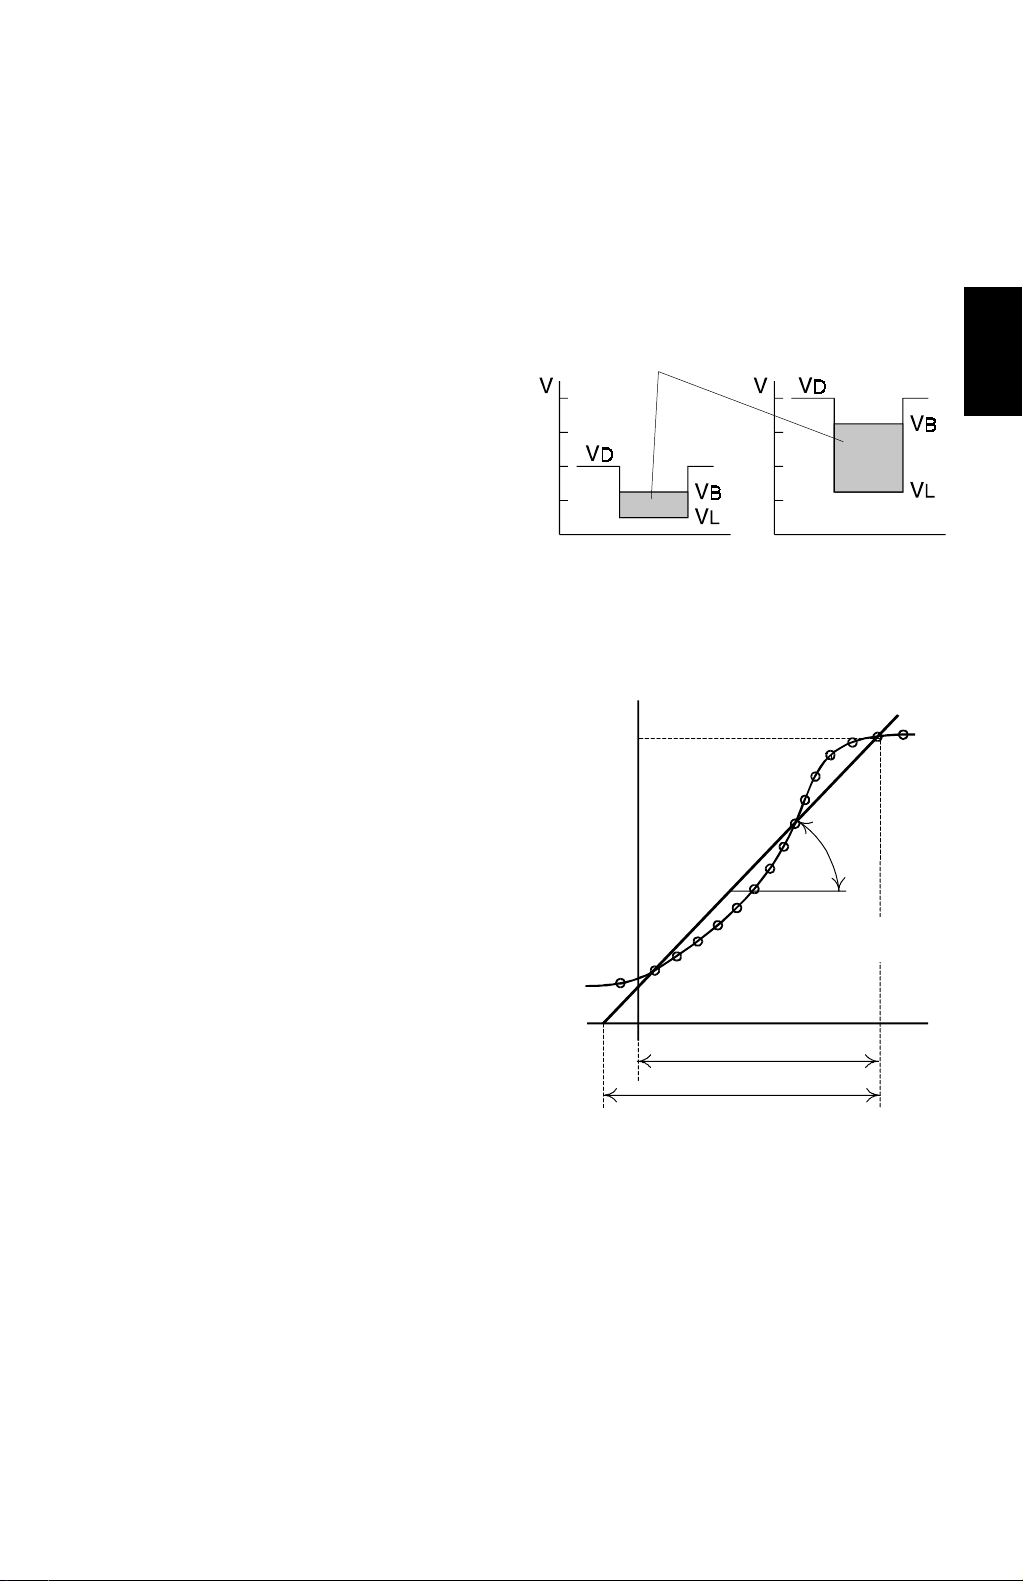
30 July, 1999 (Revised) PROCESS CONTROL
2
Step 5: Toner Amount Calculation
The amount of toner on the drum (M/A, mass per unit area, mg/cm2) is calculated
for each of the 16 grades of the sensor pattern from the ID sensor output value
(Vsp) from each grade of the pattern.
Step 6: Development Potential Calculation
The development potential (VDP) is the
capability to attract toner to the drum and
can be shown as: V
•
VB: Development bias
•
VL: Drum potential after full laser
B
- V
L
exposure
See the figure on the right for two
examples.
The machine determines the
relationship between the drum potential
(measured in step 3) and the amount of
toner on the drum (calculated in step 5)
for each of the 16 grades. If plotted,
these values would form a curve as
shown in the illustration to the right.
The CPU then calculates a straight line
curve through these points. The angle
formed by this line is known as the
development gamma factor, or γ M/A.
The CPU then uses the gamma factor
to calculate the development potential
) that would be required to obtain
(V
DP
the ideal toner density on an area of the
drum exposed with full laser power
under the machine's present conditions.
Amount of toner on the drum
When the development
potential is smaller
MAmax
Amount of
toner
Vk
Development potential
When the development
potential is larger
A269D061.WMF
γ
MA
MAmax = 0.7 mg/cm
for each color
Vdp
Vkp
Detailed
Descriptions
A269D062.WMF
For Y, C, and M toners, the new type of ID sensor allows higher densities of toner
to be measured accurately (refer to the descriptions in Step 4, Sensor Pattern
density Detection). This permits the calculation of γ M/A at a higher accuracy than
a normal reflection ID sensor, because the measurements at higher densities (M/A
values) are more reliable.
2-11
Page 56

PROCESS CONTROL 30 March, 1999
Step 7: Selecting the Optimum VD, VB, V
L
The machine now adjusts VD, VB, and VL to try to bring the development potential
VDP to the ideal value. To do this, it uses a pointer table. This is a look-up table in
ROM of VDP against VD, VB, and V
L.
The machine takes the value of VDP calculated in the previous section, and looks
for the value of VDP in the pointer table that is closest to this. The machine reads
the values of VD, VB, and VL that are in this row of the pointer table.
The machine will then use these values of VD, VB, and VL during copying until the
next process control self check. These values are designed to bring the actual V
DP
to the optimum value for the machine’s current condition.
•
VD: Drum potential without exposure—to adjust this, the machine adjusts the
charge corona grid voltage (VG)
•
VL: Drum potential with the strongest exposure—to adjust this, the machine
adjusts the laser diode input current (ILD)
•
VB: Development bias
2-12
Page 57

30 March, 1999 PROCESS CONTROL
2.1.5 TONER SUPPLY CONTROL
This machine uses fuzzy logic to control the amount of toner supplied to the
development unit so that the development capacity does not fluctuate due to toner
consumption, toner supply, agitation, or extended periods of nonuse. This control is
accomplished using the sense data from the drum potential sensor, toner end
sensor, ID sensor, and TD sensor. This copier starts toner supply control by
keeping the toner density in the developer constant using the TD sensor. It then
senses the amount of toner on the drum using the ID sensor pattern. The ID sensor
sends the pattern data back to the toner supply control mechanism and the amount
of toner on the drum surface (image density) then becomes the target. The TD
sensor provides a stable base point for toner supply and thus avoids runaway feedback of toner supply. The basic input/output parameters that this copier uses
during toner supply control are listed below.
1. Targets to be sensed
1) Density of the toner read by the TD sensor
2) Amount of toner attached to the drum sensed by the ID sensor
3) Pixel count
Detailed
Descriptions
2. Target to be controlled
Toner supply clutch on time
Toner Supply Control Modes
This copier controls the supply of toner in three modes.
1. Fuzzy logic Control Mode
Default toner supply control mode. The TD sensor, ID sensor, and pixel count
are used in this mode.
2. Proportional Control Mode
This mode is used when an ID sensor becomes faulty. Only the TD sensor is
used to control toner supply.
3. Fixed Supply Mode
This mode is used when both the TD sensor and ID sensor become faulty.
2-13
Page 58
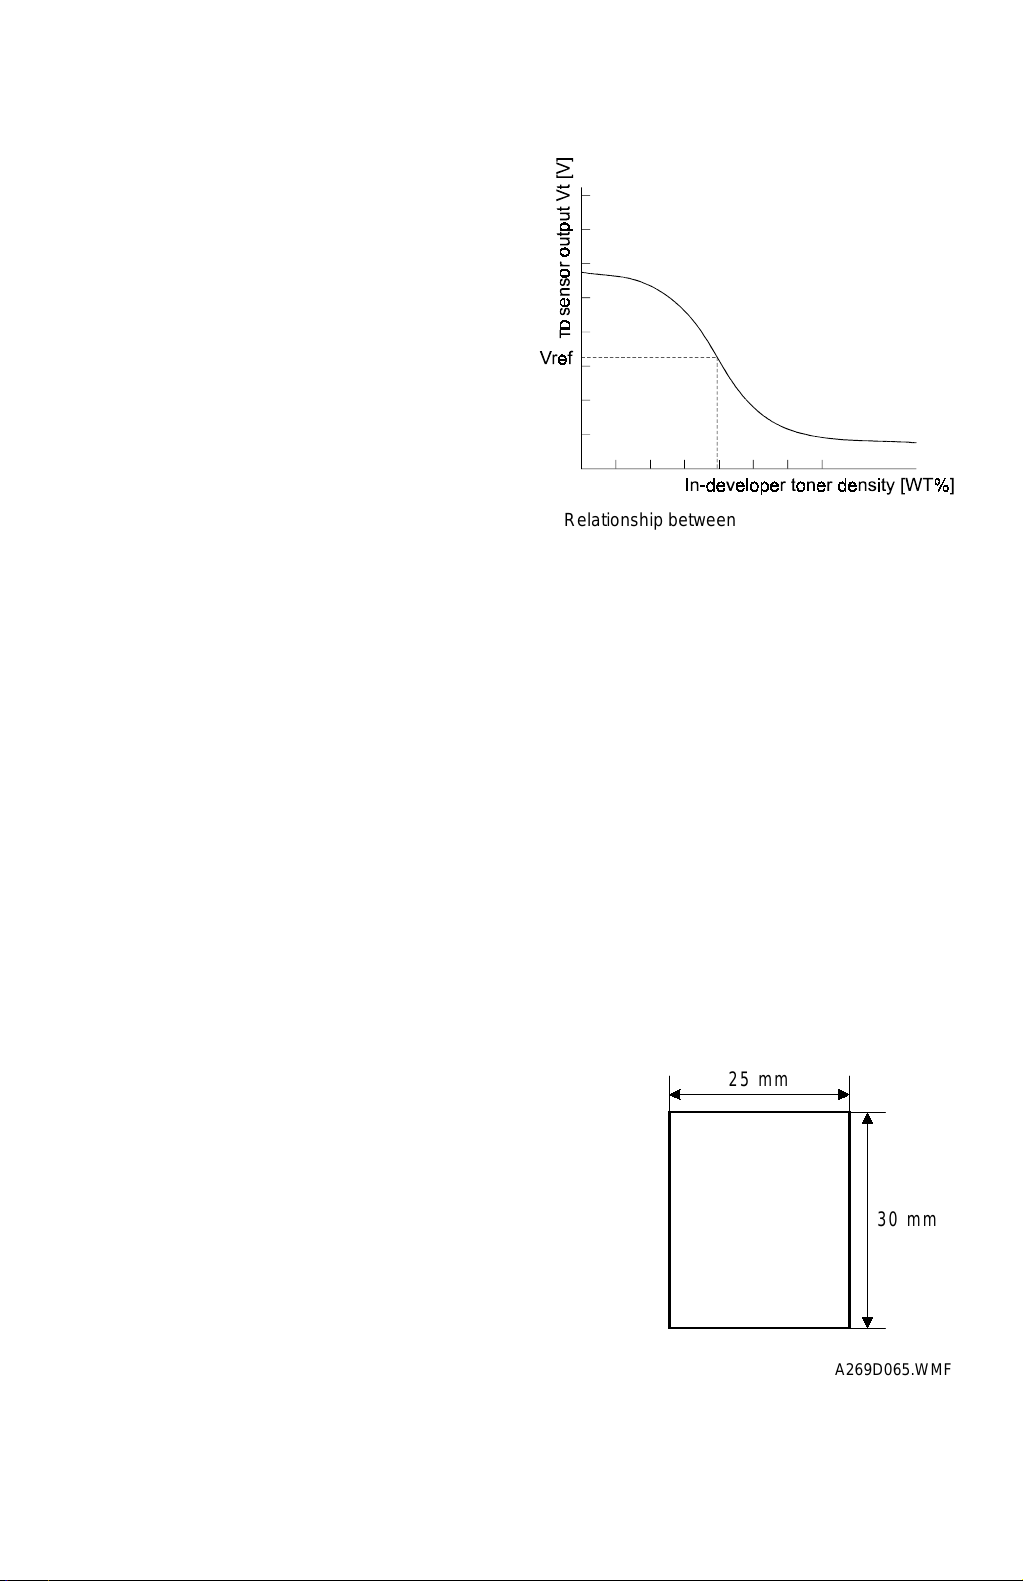
PROCESS CONTROL 30 March, 1999
TD Sensor Output
The relationship between the TD
sensor output Vt and the toner density
in the developer is shown in the figure
on the right. The target toner density of
this copier is 5 WT%. The TD sensor
output for this toner density is referred
to as Vref. Vref of this copier is
adjusted to 2.5 ± 0.1 volts for a toner
density of 5 WT% (brand-new
developer) for each of the C, M, Y, and
K toners. When developers are
replaced, since TD sensor fluctuations
can occur in such a case, it is
necessary to initialize the TD sensor
and adjust its gain using SP3-005-1
through SP3-005-5. Once the TD
sensor is initialized, the toner density
fluctuates according to toner supply
control.
Relationship between toner density and TD
sensor output
A269D063.WMF
Toner Supply Calculation
In the fuzzy logic control mode, the toner supply control mechanism of this copier
determines the amount of toner to be supplied based on the density of the toner in
the developer, as sensed through the TD sensor, and the pixel count. In this mode,
the image density is kept constant by keeping the density of toner in the developer
constant while accommodating to changes in the development conditions through
the potential control mechanism. The amount of toner supplied is determined by
the ON time of the toner supply clutch.
Detecting VSP for Toner Supply Control
The copier generates a VSP ID sensor pattern
(right illustration) using a standard laser diode
power. The copier generates this pattern between
the K, C, M, and Y images, and then detects the
density using the ID sensor. The result is known
as ‘VSP for toner supply control’, or ‘VSP (toner)’ to
distinguish it from the othe r VSP, measured during
potential control.
This process is done every ten copies.
25 mm
30 mm
2-14
A269D065.WMF
Page 59

30 March, 1999 PROCESS CONTROL
Calculating the Amount of Toner on the Drum
The target for the ID sensor pattern is 0.7 mg/cm2 for the C, M, and Y toners and
0.3 mg/cm2 for the K toner. For the procedure to calculate the amount of toner on
the drum, see Step 4, “Sensor Pattern Density Detection,” and Step 5, “Toner
Amount Calculation” in the section about potential control.
Toner Near End/Toner End Detection
Introduction
This copier uses the toner end sensor located in the toner hopper to detect toner
near end conditions for the K, Y, C, and M toners. A toner end condition, for each
color, is detected following a toner near end condition by counting the number of
pixels. (See “Toner End Detection” on the next page.)
Toner Near End Detection
This copier uses an optical reflection type toner end sensor to detect two
conditions—the high condition (5 V: no reflection/toner present) and the low
condition (0 V: reflection detected/no toner). The copier samples the output from
the toner end sensor at the development position for each toner color, for 160
samples at 4 ms intervals. A “toner absent condition” is flagged when more than 20
low sensor output conditions are detected out of 160 sampled conditions. The
copier flags a “toner near end condition” when three consecutive “toner absent
conditions” are detected for a toner color.
Example 1: 3 full color copies, rep eat mo de
•
20 sensor low conditions detected out of 160 sampled conditions while
developing the first copy sheet for K
•
25 sensor low conditions detected out of 160 sampled conditions while
developing the second copy sheet for K
•
24 sensor low conditions detected out of 160 sampled conditions while
developing the third copy sheet for K
Detailed
Descriptions
↓
The K toner near end LED is lit.
2-15
Page 60

PROCESS CONTROL 30 July, 1999 (Revised)
Example 2: 4 full color copies, repeat mode
•
20 sensor low conditions detected out of 160 sampled conditions while
developing the first copy sheet for Y
•
19 sensor low conditions detected out of 160 sampled conditions while
developing the second copy sheet for Y
•
21 sensor low conditions detected out of 160 sampled conditions while
developing the third copy sheet for Y
•
25 sensor low conditions detected out of 160 sampled conditions while
developing the fourth copy sheet for Y
•
21 sensor low conditions detected out of 160 sampled conditions while
developing the fifth copy sheet for Y
↓
The Y toner near end LED is lit.
Toner End Detection
After a toner near end is indicated, the toner end condition is reached when the
IPU pixel counter counts up the equivalent of 10 A4 sheets of pixels (100%
coverage) for that color.
The machine can copy/print at least 10 sheets after the toner near end condition is
signaled. There are two possible cases as follows:
1. The toner end condition occurs before 10 sheets are printed: In this case
copying stops after 10 sheets are printed. This is true regardless of paper size.
2. Ten sheets (of any size) are printed before toner end occurs: In this case
copying stops when the toner end condition occurs.
Toner End Recovery
The copier enters the recovery process in the following cases:
1. The front door is opened and a toner cartridge is removed or inserted.
This is regarded as an ordinary replacement procedure for the toner cartridge.
•
When the door is closed, the copier moves the next to-be-replaced color
toner cartridge to the replacement position.
↓↓↓↓
•
Replace the toner cartridge.
↓↓↓↓
•
The copier starts toner end recovery processing after the toner cartridge is
replaced and the front door is closed.
NOTE:
If recovery is needed for two colors, the copier proceeds with the next
color if the door is opened or if the user specifies at the operation panel
that the first color should be skipped.
2. If the copier is turned off and on, it assumes that toner cartridges for all colors
have been replaced and starts toner end recovery processing for all colors.
2-16
Page 61

30 March, 1999 DRUM UNIT
2.2 DRUM UNIT
2.2.1 MAJOR COMPONENTS
12
11
10
1
2
3
4
5
Detailed
Descriptions
6
7
8
9
A269D201.WMF
1. Charge corona unit
2. Quenching lamp
3. Cleaning blade
4. Lubricant bar
5. Bias roller blade
6. Bias roller
7. Cleaning brush
8. Pre-cleaning corona (PCC)
9. Carrier catcher
10. ID sensor
11. OPC drum
12. Drum potential sensor
This drum unit of this copier is located on the right of the revolver/drum drawer. It
can easily be removed by pulling out the drawer.
The drum unit consists of the OPC drum, charge corona unit, quenching lamp,
drum potential sensor, and cleaning unit.
The cleaning unit is integrated in the drum unit because, since the cleaning unit is
located in the top portion of the copier, toner would spill out of the opening if the
drum unit were removed or installed by itself.
The cleaning unit contains the cleaning blade, lubricant bar, and cleaning brush.
2-17
Page 62
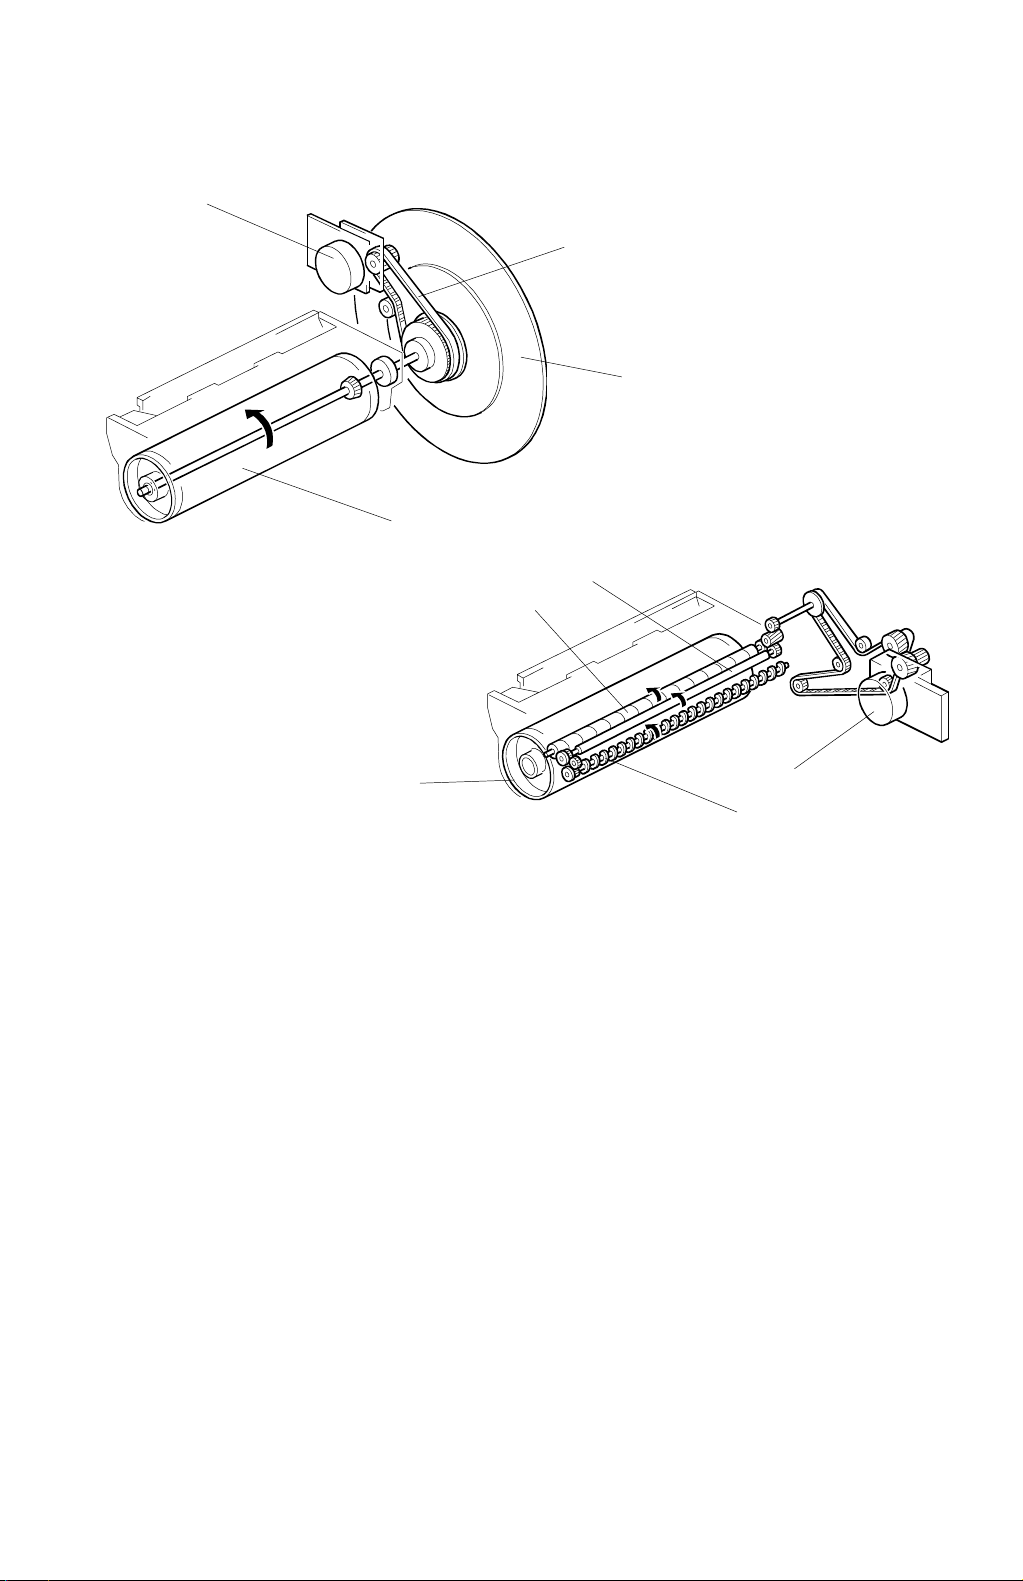
DRUM UNIT 30 March, 1999
2.2.2 DRUM UNIT DRIVE
[A]
[C]
[D]
[B]
A269D202.WMF
[G]
[F]
[B]
[E]
[H]
A269D203.WMF
Drum Drive
The drum motor [A] turns the OPC drum [B] via a timing belt [C]. Use of the timing
belt reduces rotational fluctuations, thus stabilizing image quality (reduce uneven
image).
The motor has a built-in rotational speed control circuit. When the rated rotational
speed is not achieved, the rotational speed control circuit generates a motor clock
signal, which turns on SC440 (Drum Motor Error) and stops the copier.
The drum is rotated in the reverse direction for 0.05 second (approx. 10 mm) to
remove the toner at the tip of the drum cleaning blade at the end of the initial auto
process control self check.
The drum shaft is fitted with a flywheel [D] to smooth the rotation and prevent
banding of the image.
Cleaning Drive
The drum peripheral component motor [E] drives the cleaning unit (cleaning brush
[F], bias roller [G], and toner collection coil [H]).
2-18
Page 63
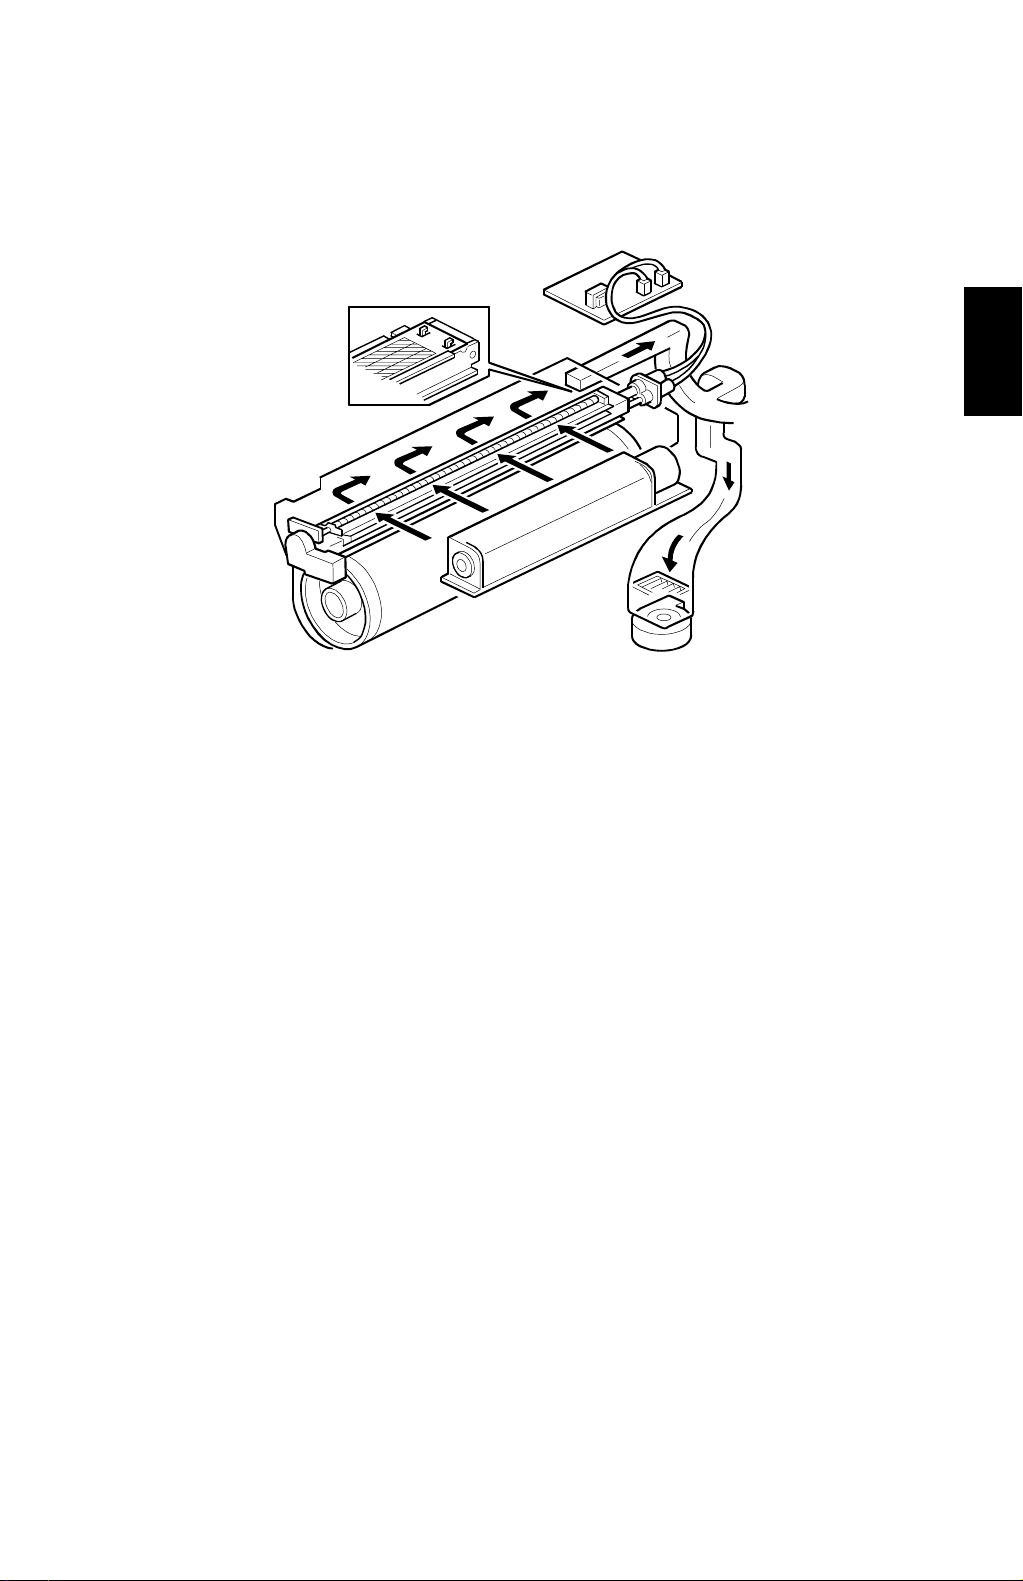
30 March, 1999 DRUM UNIT
2.2.3 CHARGE CORONA UNIT
Detailed
Descriptions
A269D204.WMF
This copier uses a single wire scorotron system to charge the drum. The output of
the charge high voltage power supply is -6 kV.
A grid keeps the surface potential of the drum at –670 V (standard value).
The grid bias voltage is corrected so that the surface potential remains constant by
sensing the surface potential of the drum with the drum potential sensor.
The exhaust fan at the rear of the copier, causes air to flow into the charge corona
unit from front to rear sides. This helps prevent uneven charging.
2-19
Page 64
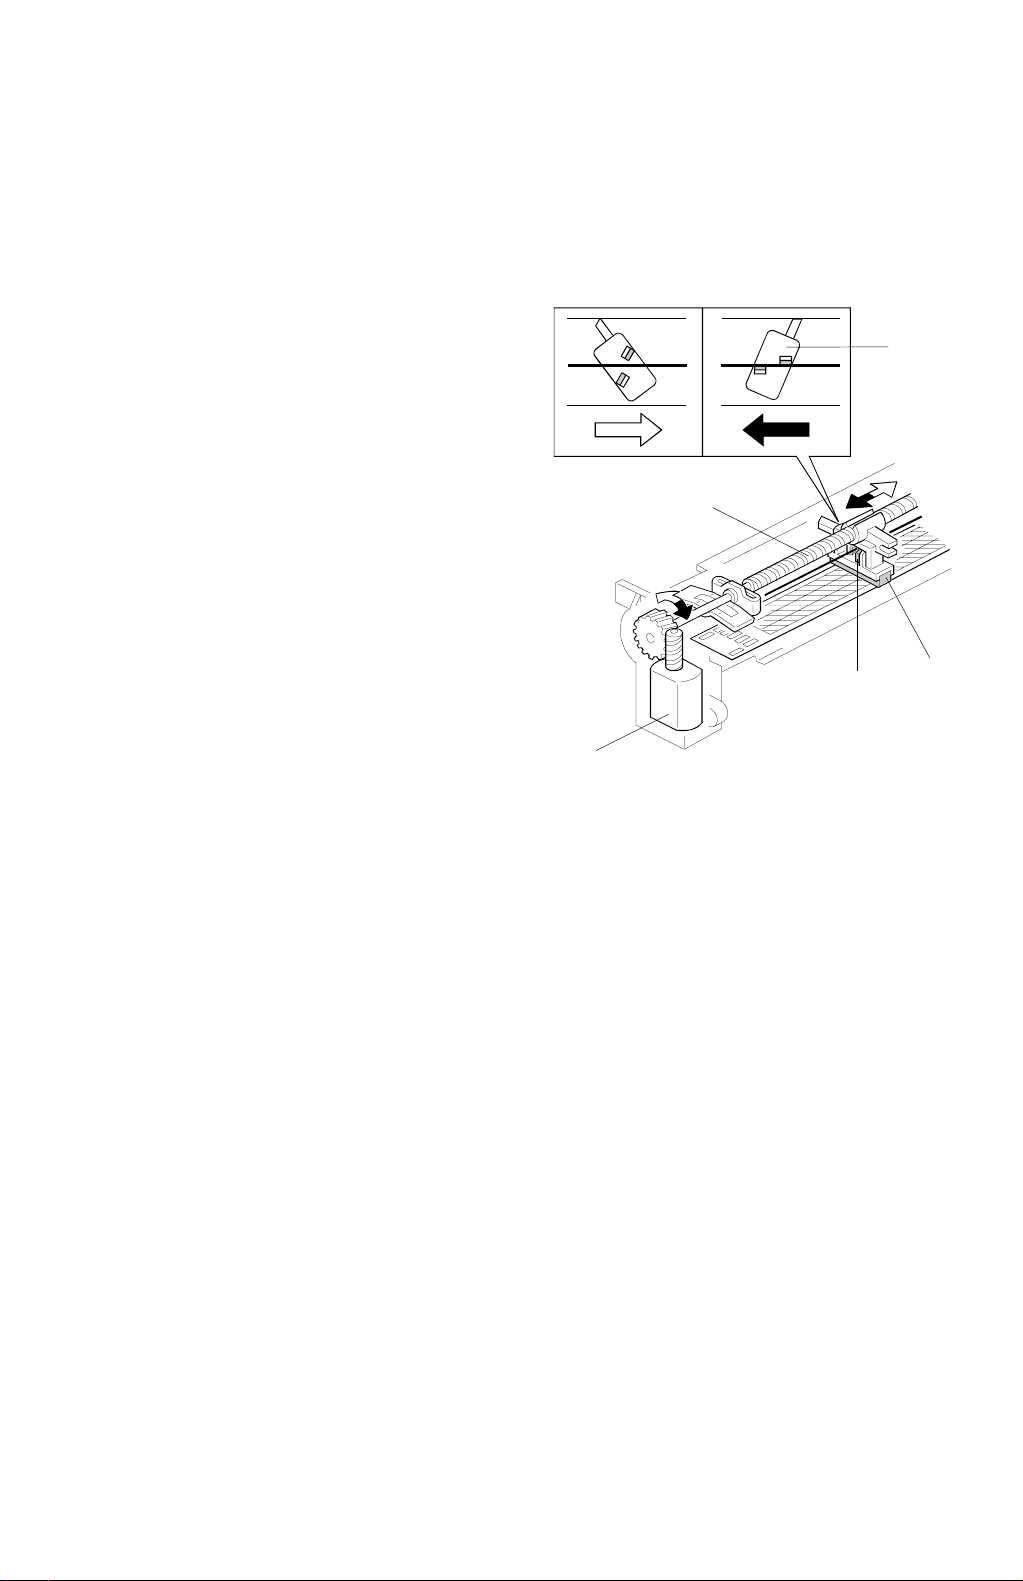
DRUM UNIT 30 March, 1999
2.2.4 CHARGE CORONA UNIT CLEANER
The copier is provided with a charge corona unit cleaner to prevent the charge
corona wire and grid from becoming contaminated by toner and paper dust near
the charge corona unit.
•
Drive:
Dc motor [A] located on the copier
front, via screw rod [B].
•
Cleaning conditions:
1) When th e main power switch is on
and the surface temperature of the
hot roller is less than 100°C.
2) When forced using SP mode (SP2-
802).
•
Related SP mode s:
1) SP2-02: Forced cleaning
2) SP2-803-001:Enable cleaning
when main power switch/operation
switch is turned on (default is ON)
3) SP2-803-002:Enable cleaning at
specified development cycle count
(default is ON)
4) SP2-803-003: Enable cleaning at a
specified time interval (hours). (Default is OFF)
[B]
[A]
A269D251.WMF
[D]
[C]
[C]
•
Cleaner pad:
Dual-grid cleaner pad [C] and wire cleaner pads [D].
•
Home position:
Copier front
•
Cleaning path:
Copier front → Rear end point → Copier front
Only the charge corona grid is cleaned during the traverse from copier front to
rear end (white arrow).
Both the charge corona grid and wire are cleaned during the traverse from rear
end point to copier front (black arrow).
•
Position detection:
No sensor is used. The I/O control board detects the current that is being
supplied to the motor. It senses the sudden change in the current value which
occurs when the cleaner reaches the end point.
At the turnaround point, the motor is reversed. If no current rise is observed in 60
seconds after motor rotation starts, the I/O control board an open circuit or
disconnected condition, stops the motor, and displays SC303.
2-20
Page 65
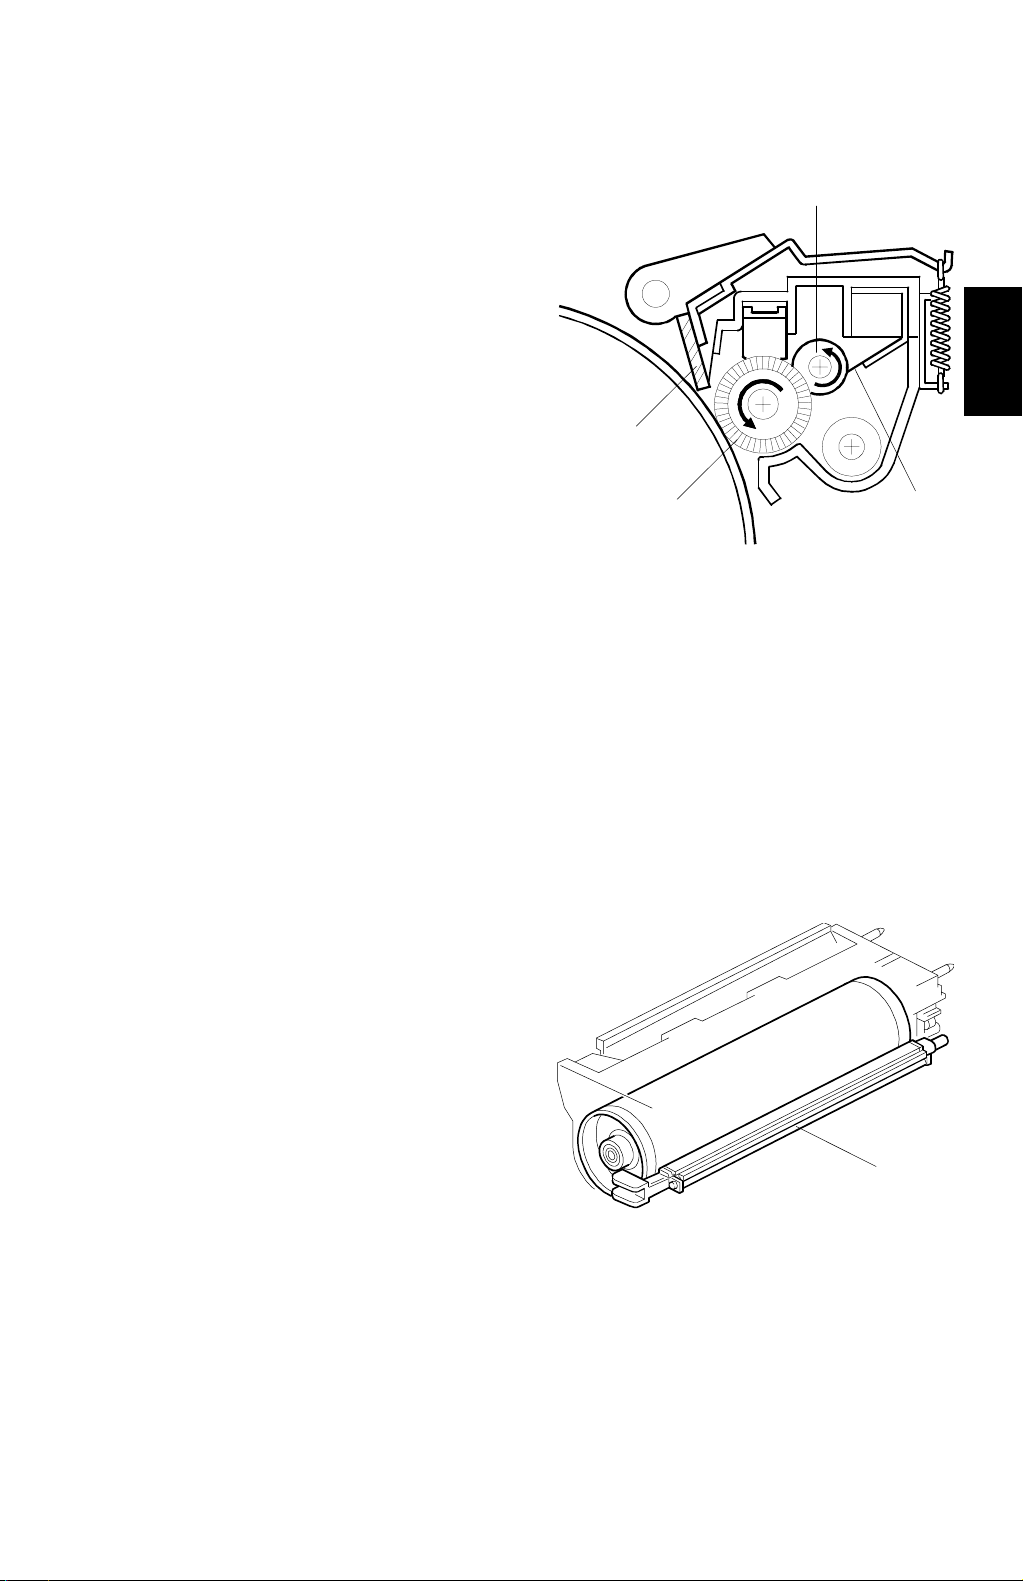
30 July, 1999 (Revised) DRUM UNIT
2.2.5 CLEANING MECHANISM
Cleaning
[C]
After toner is transferred to the OPC drum
in the transfer process, the residual toner is
removed from the drum by the drum
cleaning brush [A] and blade [B]. The
cleaning brush is a straight fiber brush (not
looped) type. The cleaning bias system
uses a rotating bias roller [C] and scraper
blade [D]. The bias roller and the brush
[B]
rotate opposite to each other at the point of
contact. The cleaning blade is of the
counter type. It is constantly held against
[A]
[D]
the drum by a spring.
A269D205.WMF
Lubricant Application
Lubricant (Zinc stearate) is applied to the OPC drum via the cleaning brush. The
lubricant bar is held against the brush by the weight of the drum lubricant bar plus
spring pressure. Lubricant is applied is to improve the efficiency of cleaning and of
image transfer.
Detailed
Descriptions
2.2.6 PRE-CLEANING CORONA (PCC)
The PCC discharges the photoconductor
drum and applies AC and negative DC
discharges to reduce the charge holding
the residual toner to the drum, thereby
improving the efficiency of cleaning.
[A]
A269D206.WMF
2-21
Page 66
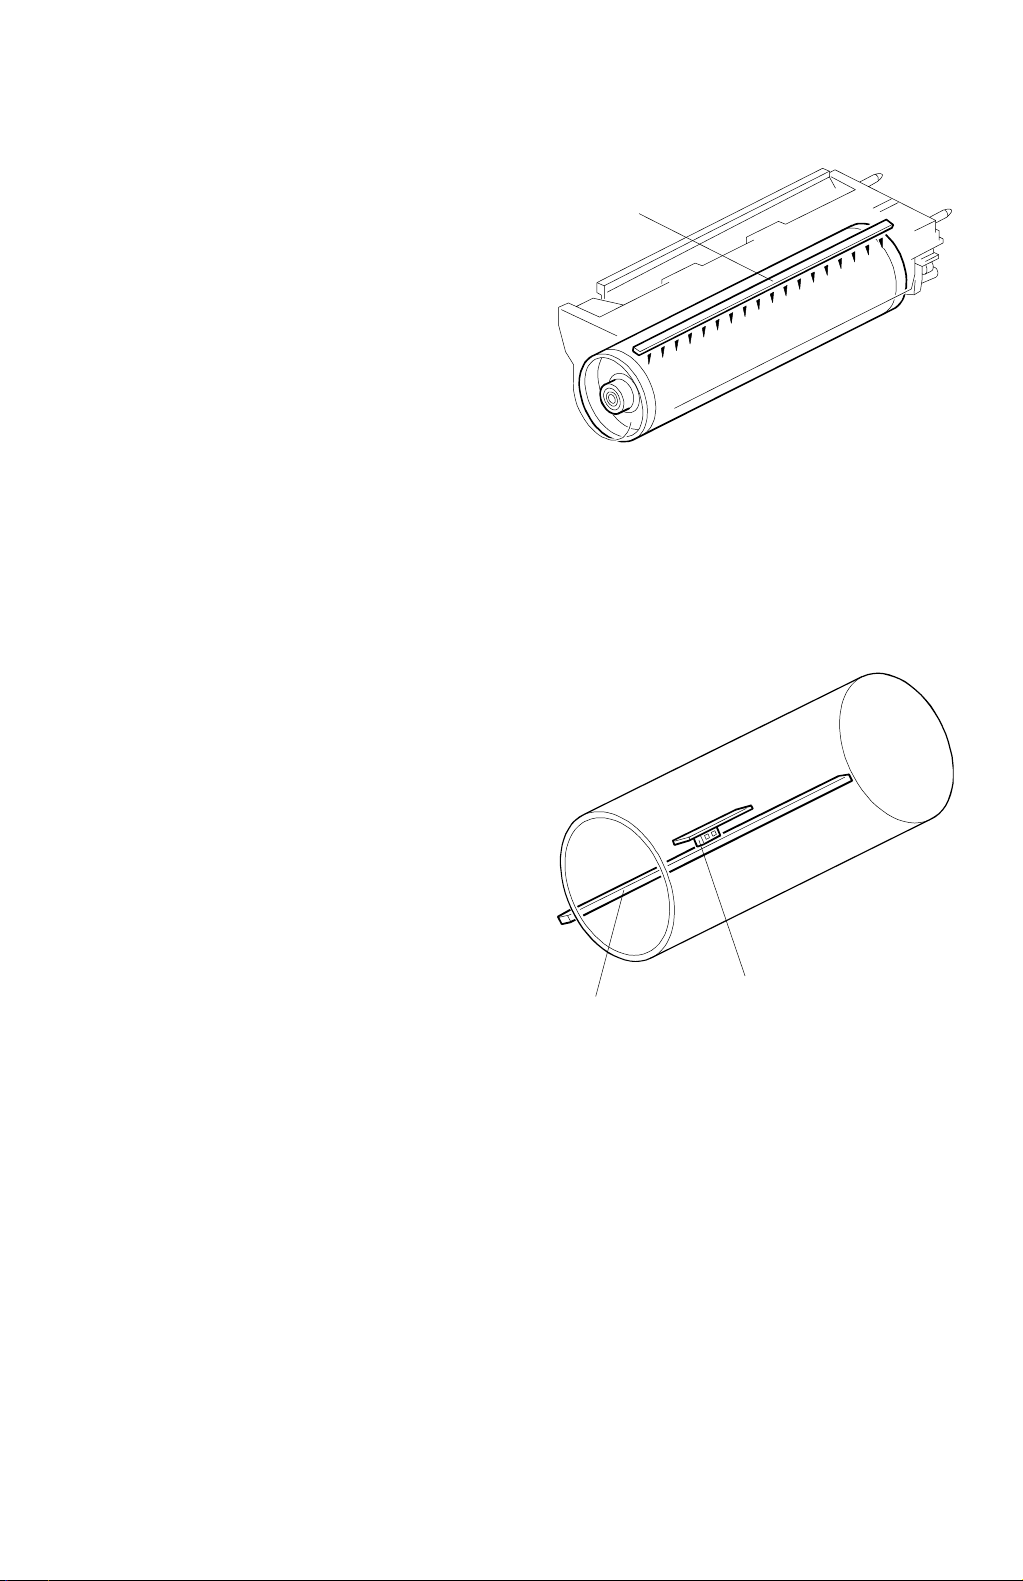
DRUM UNIT 30 March, 1999
2.2.7 QUENCHING
This copier employs optical quenching
using LEDs. The quenching lamp [A] turns
[A]
on immediately when the Start key is
pressed. The quenching lamp light is in the
red range to protect the drum from optical
fatigue.
A269D207.WMF
2.2.8 CARRIER CATCHER
This copier has a magnet [A] installed
below the ID sensor [B]. This magnet
attracts carrier from the drum.
[A]
[B]
A269D208.WMF
2-22
Page 67

30 March, 1999 SCANNER UNIT
2.3 SCANNER UNIT
2.3.1 OVERVIEW
[A] [C] [F] [D]
[D][B]
A269D001.WMF
Detailed
Descriptions
An image of the original illuminated by the exposure lamp [A] (a halogen lamp) is
reflected onto a color CCD [B] (Charge Couple d Device) via the 1st [C], 2nd [D],
and 3rd [E] mirrors, filter, and lens [F]. The filter removes infra-red from the light
reflected off the original; this is particularly important for glossy photos with black
areas, which can appear reddish in copies.
For all copy modes except the “Auto Original Type” mode machine makes a single
scan. The CCD is a one-chip color CCD with RGB color filters. The scanning
resolution is 400 dpi (5,000 pixels).
2-23
Page 68

SCANNER UNIT 30 March, 1999
2.3.2 SCANNER
[B]
[C]
[D]
[E][A]
A269D001.WMF
The 1st scanner consists of the exposure lamp [A], main and sub reflectors [B], and
1st mirror [C]. This model uses a halogen lamp with ten elements. The frosted
surface of the exposure lamp ensures even exposure in the main scan direction.
The exposure lamp is energized by a dc supply to avoid uneven light intensity
caused by power fluctuations while the 1st scanner moves in the sub-scan
direction. The sub reflector is shaped so that light will expose the original evenly.
This reduces shadows on pasted originals.
The 1st, 2nd [D], and 3rd [E] mirrors have glass on the reverse sides to increase
their weight. This prevents the mirrors from vibrating.
A thermoswitch in the 1st scanner protects against overheating. It will open at
around 140°C and cannot be reset.
2-24
Page 69
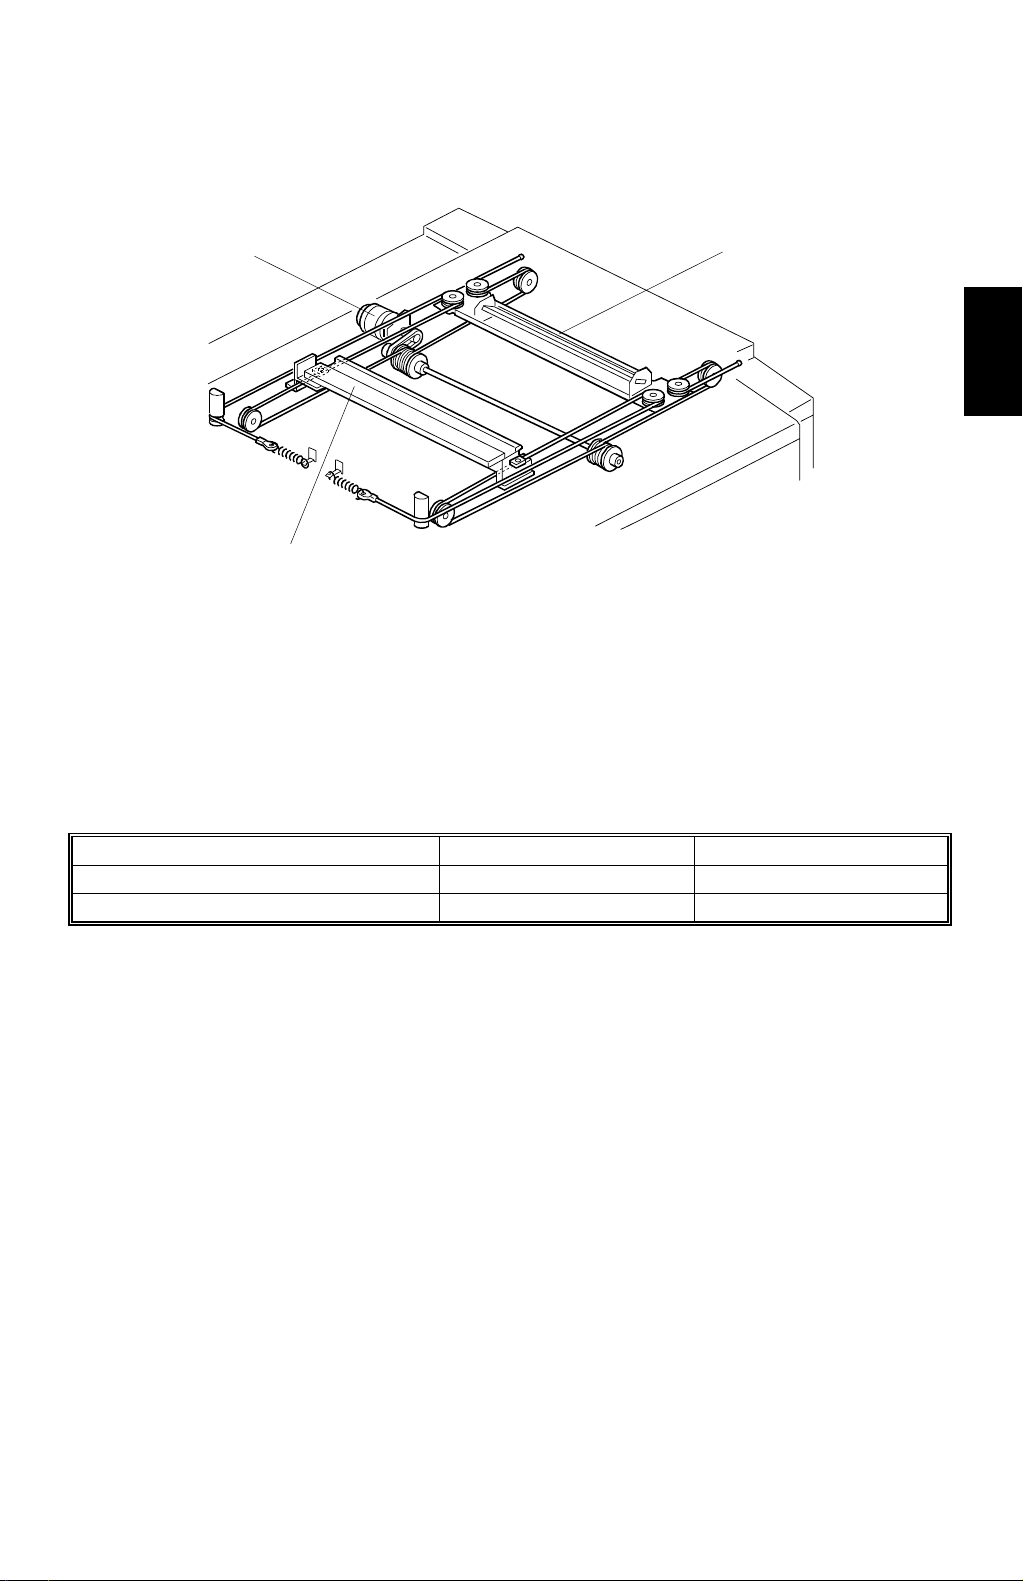
30 March, 1999 SCANNER UNIT
2.3.3 SCANNER DRIVE
[A]
[B]
[C]
A269D002.WMF
A five-phase stepper motor [A] drives the scanner. This motor drives the 1st [B]
and 2nd [C] scanners via two scanner wires. The wires at the front side and the
rear side are the same.
In full size mode, the 1st scanner speed is 200 mm/s during scanning, and 1,200
mm/s when the scanner returns. The 2nd scanner speed is half that of the 1st
scanner.
Detailed
Descriptions
Forwarding Speed Returning Speed
Full Size Mode 200 (mm/s) 1,200 (mm/s)
Reduction or Enlargement Mode 200/M (mm/s) 1,200 (mm/s)
In reduction or enlargement mode, the scanning speed depends on the
magnification ratio “M”, which can vary from 0.25 to 4.0 (i.e., 200/M mm/s). The
returning speed is always the same (1,200 mm/s). The image length is changed in
the sub-scan direction by changing the scanner speed, and in the main scan
direction by image processing on the scanner IPU board.
For all copy modes except the Auto Original Type mode the machine makes a
single scan.
2-25
Page 70

SCANNER UNIT 30 March, 1999
2.3.4 COLOR CCD
1
R
G
5
2 31
5000
9
B
A269D150.WMF
The color CCD converts light reflected from the original into three analog signals,
one for each of the three basic colors Red, Green, and Blue. The signals are called
the R, G, and B signals. A single scan generates a separate set of three signals
(RGB).
The CCD consists of three lines of 5000 elements at a resolution of 400 dpi (15.7
dots/mm). To make the R, G, and B signals, each line has a color separation filter
(R, G, or B). The lines are spaced 4 pixels apart for full size magnification. To
correct for the spacing, the R, G, and B signals must be synchronized. This is done
by delaying the signals in memory buffers on the scanner IPU board (the Image
Processing section contains more details).
The CCD is mounted on the board with the lens block (the assembly is known as
the SBU or Sensor Board Unit). Therefore, to replace the CCD, re place the SBU.
2-26
Page 71

30 March, 1999 SCANNER UNIT
2.3.5 WHITE PLATE SCANNING
[A]
[B]
A269D851.WMF
There is a white plate [A] for auto shading, stuck on the exposure glass [B]
underneath the left scale. When this white plate is scanned, the output from all the
CCD elements in a line should in theory be equal, but actually it is no t, for the
following reasons:
Detailed
Descriptions
•
Variations in sensitivity between elements of the CCD
•
Variations in characteristics of lens and mirror reflectivity
•
Loss of brightness toward the ends of the exposure lamp
To correct for this uneven output from the CCD elements, the light reflected from
the white reference plate is scanned. This is known as auto shading.
Auto shading is done every copy cycle at the scanner home position before starting
the first scan.
2.3.6 SCANNER IPU
The scanner IPU processes the RGB signal received from the CCD board and has
the following functions under the control of the main control board.
1. Controls exposure lamp on/off switching and voltage
2. Controls the speed of the scanner drive motor
3. Detects the original paper size
4. Controls on/off switching for the IPU cooling fan and optics cooling fans
5. Supplies the clock signals for the CCD board
6. Detects when the scanner is at home position
2-27
Page 72
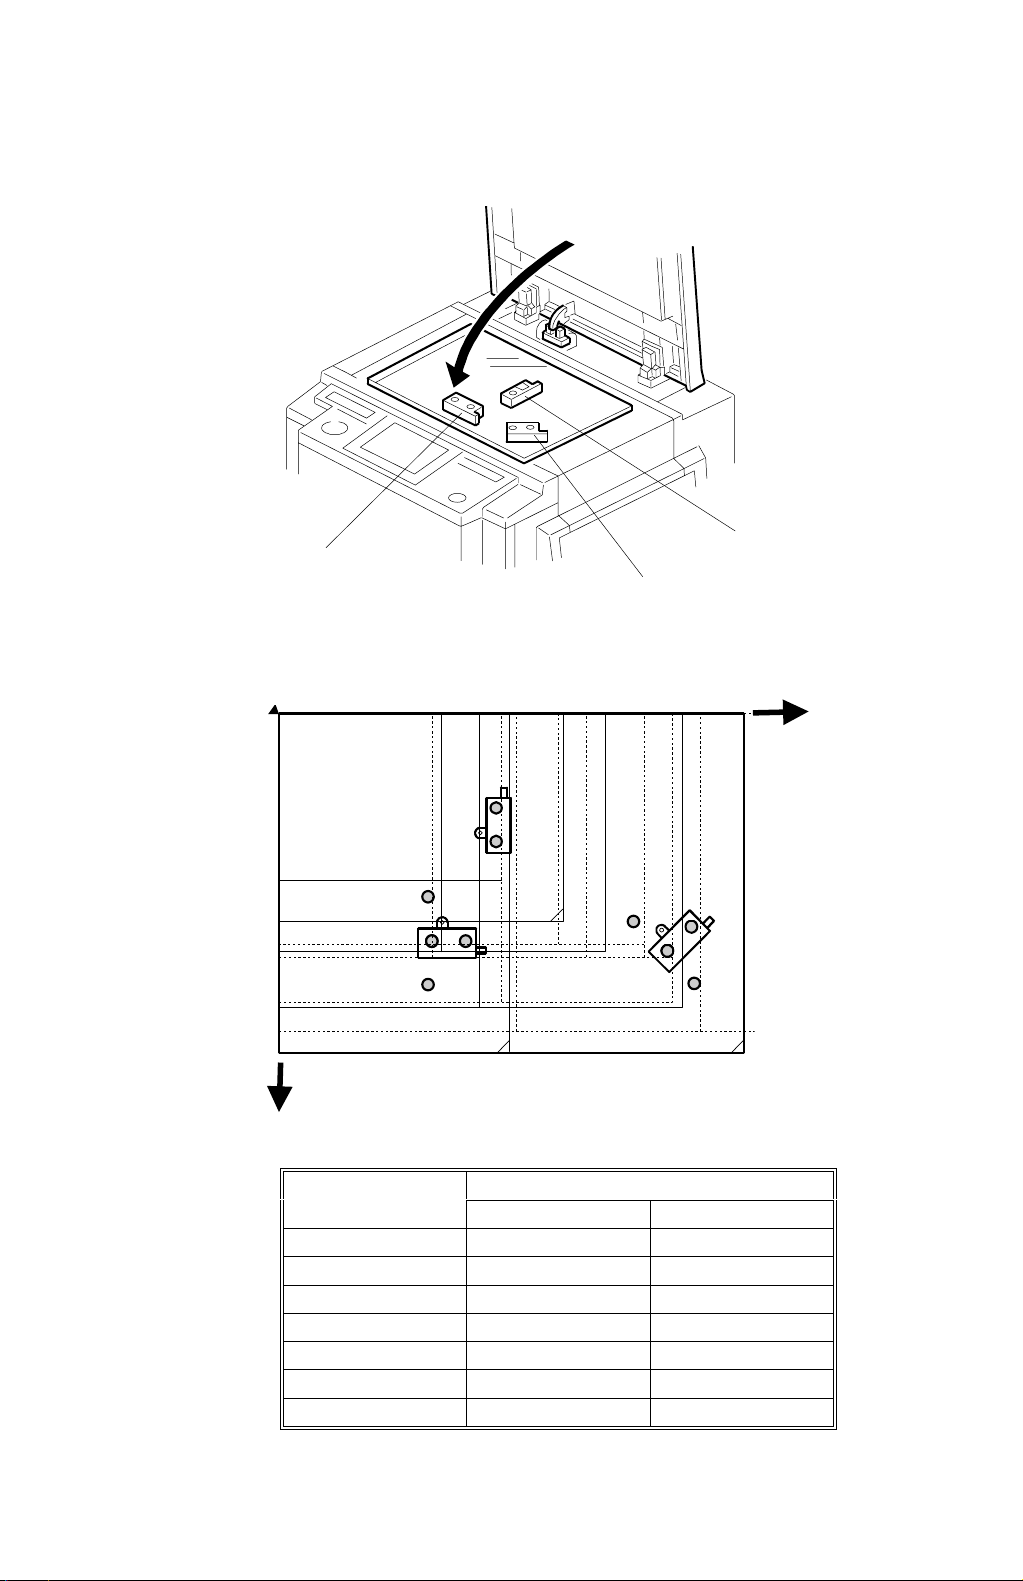
SCANNER UNIT 30 March, 1999
2.3.7 ORIGINAL SIZE DETECTION
[A]
“
”
•
[C]
[B]
A269D003.WMF
X
’
‘
•
•
A269D005.WMF
Y
Sensing Point
••••
••••
‘‘‘‘
’’’’
““““
””””
••••
From rear left corner
XY
376.23 276.23
351.83 206.68
321.78 182.28
198.00 113.00
136.00 161.50
140.00 200.00
136.00 238.50
2-28
Page 73

30 March, 1999 SCANNER UNIT
Original Size Setting Point
A4/A3
Version
(metric)
A3 11" x 17"
B410" x 14"0 1 ———— 1 141
—8
F4
A4-S 11" x 8
A4-L 8
B5-S — 0000——1 14
B5-L — 0001100 142
A5-S 8
A5-L 5
LT/DLT
Version
(inch)
(11" x 15")
1/2
" x 14"0 1 ———— 0 164
1/2
" x 13"
8
(8" x 13")
1/2
1/2
" x 11"
(8" x 10")
1/2
1/2" x 81/2
" x 5
1/2
•••••
1 —————— 132
0 0 1 ———— 165
"00011—1 5
0001110 133
"00001—0 6
"00010——134
•‘
••
‘’
‘‘
’“
’’
“”
““
”•
””
L: Lengthwise S: Sideways
0: OFF, 1: ON —: Don’t care
•
••
Display
Detailed
Descriptions
There are three APS sensors (reflective photosensors) in the optics cavity for
original size detection. The original width sensor [A] detects the original width,
while the original length sensors [B] and [C] detect the original length.
The original width sensor [A] and the original length sensor [B] have three internal
beams. Each beam scans a different point of the exposure glass. The other original
length sensor [C] uses only one beam.
If the original or platen cover is present over the scanning point for a particular
sensor, the beam is reflected, and each reflected beam activates a photoelectric
device. Following diagram shows where the sensing points are.
2-29
Page 74

SCANNER UNIT 30 March, 1999
2.3.8 OTHERS
[C]
[B]
[A]
A269D004.WMF
Anti-condensation Heater
There is an anti-condensation heater [A] on the right side of the SBU. It turns on
when the main switch or operation switch is off, to prevent moisture from forming
on the optics.
Fans
1. Optics Cooling Fans
The optics cooling fans [B] are on the left side of the optics cavity. There fans
draw air into the optics cavity to prevent the exposure lamp and optics cavity
from overheating during copy cycles. They turn on at the same time as the
exposure lamp, and they turn off 10 seconds after the exposure lamp turns off.
2. IPU Cooling
The IPU cooling fan [C] is on the left rear side of the optics cavity. This fan
moves air out of the optics cavity to keep the IPU from overheating. This fan is
always on when the operation switch is on. Normally it turns at half-speed.
However, it goes to full-speed when the exposure lamp turns on, and it returns
to half speed 10 seconds after the exposure lamp turns off.
2-30
Page 75
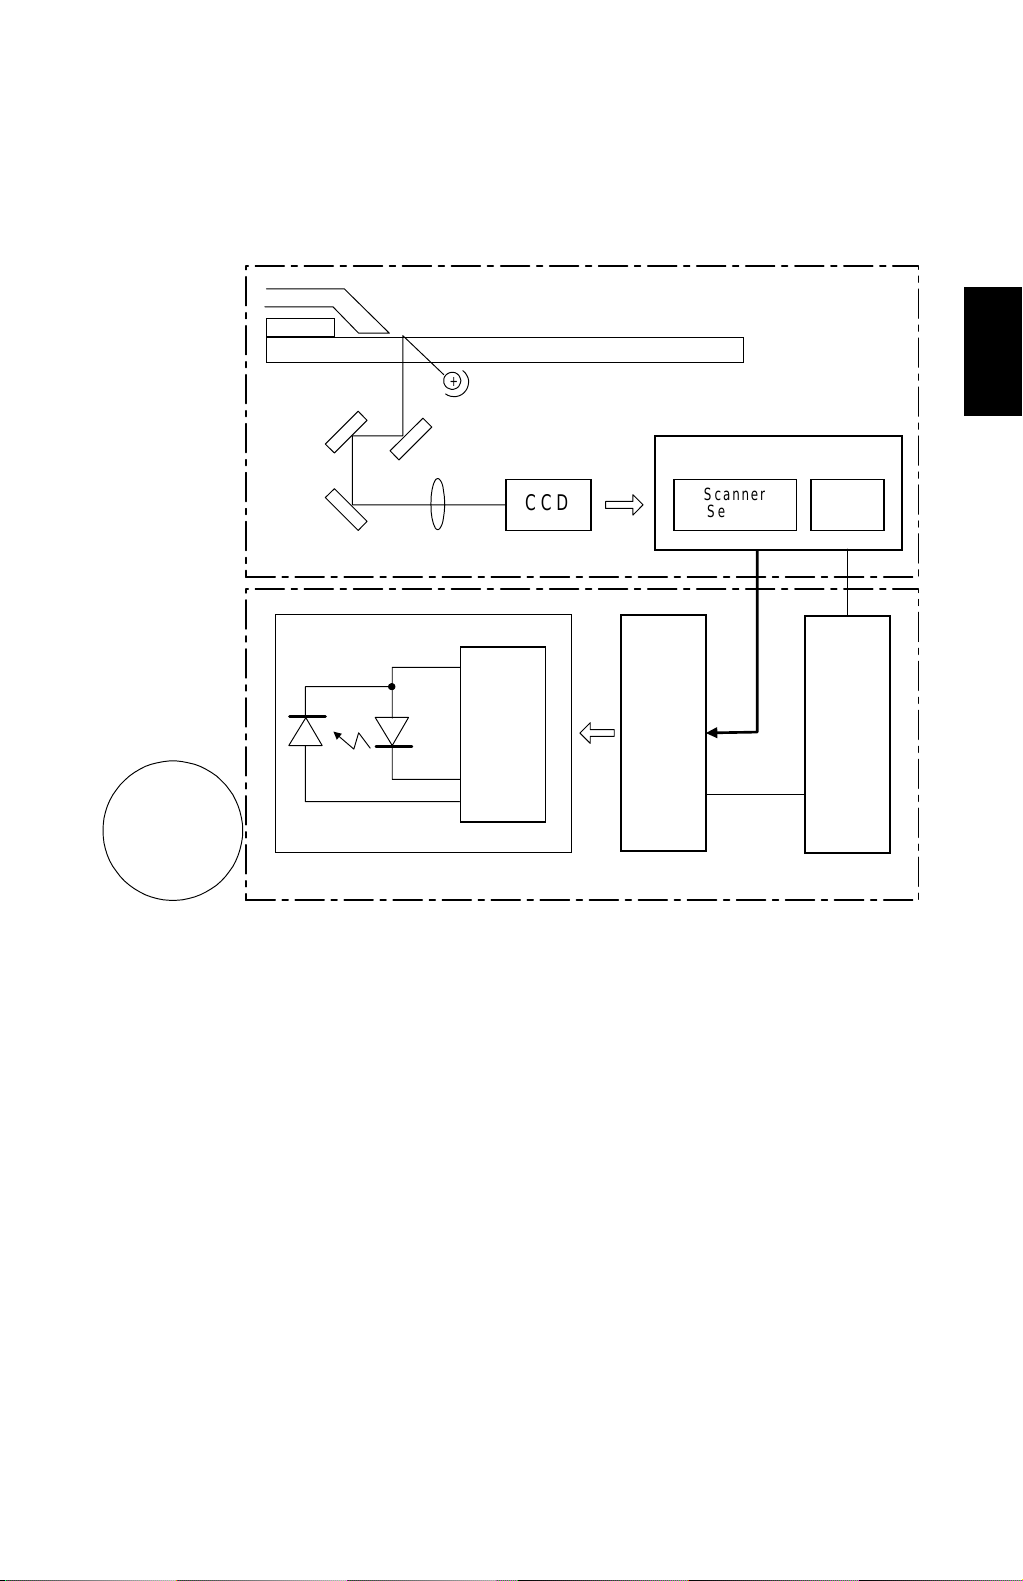
30 March, 1999 IMAGE PROCESSING
2.4 IMAGE PROCESSING
2.4.1 OVERVIEW
+
Scanner IPU Board
CCD
Scanner
Section
IPU
Section
Detailed
Descriptions
Scanner
PD
+
LD Unit
LD
LD
Drive
Board
LD
Main
Control
Board
Image
Data
Main
Control
Board
Printer
A269D066.WMF
The reflected light from the original enters the CCD via the mirrors and lens. The
CCD board has a CCD chip that is provided with a filter for each of the R, G, and B
colors. The reflected signal is converted to analog signals (photoelectric
conversion) and sent to the scanner IPU board as image data.
The scanner IPU board performs signal processing, A-to-D conversion, shading
compensation, D-to-A conversion, line correction, and image processing on the
image data. The image data is finally supplied to the printer section as digital
signals (8 bits per pixel).
2-31
Page 76
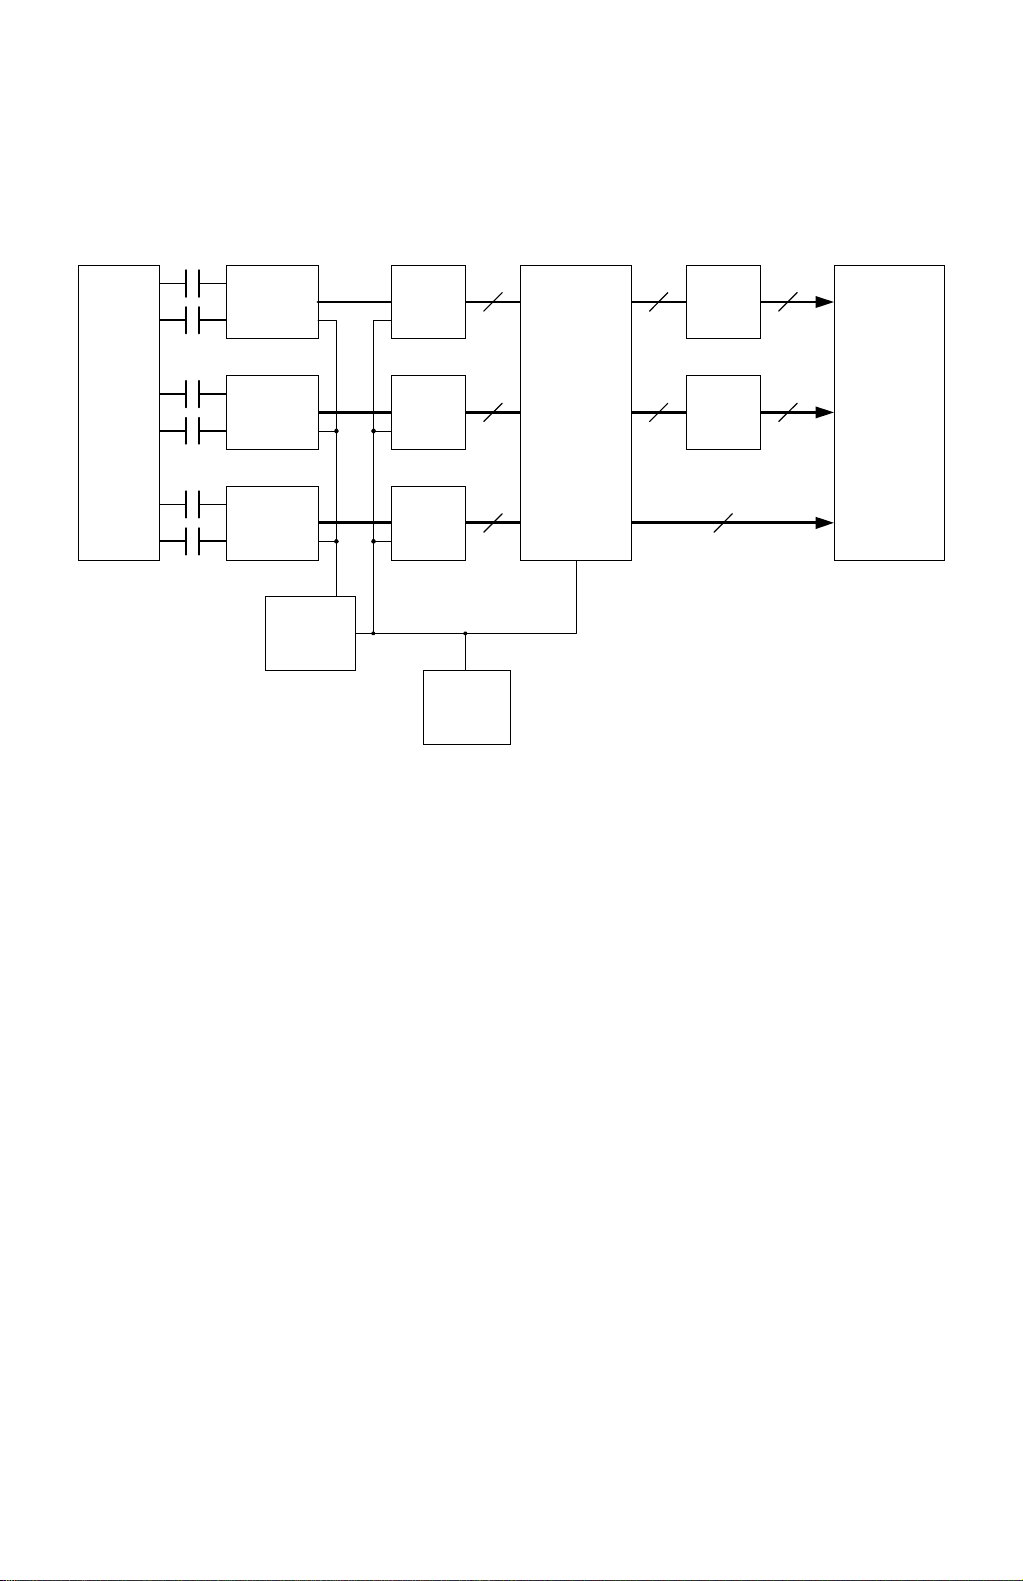
IMAGE PROCESSING 30 July, 1999 (Revised)
2.4.2 SCANNER SECTION BLOCK DIAGRAM
R
Analog
ASIC
AD
Converter
10bit
10bit
Field
Memory
10bit
4 Mbit
Field
Memory
10bit10bit
IPU
Section
C
C
CCD
G
AGC
Analog
ASIC
Ref
AD
Converter
10bit
Shading
Circuit
D
B
AGC
Analog
ASIC
AGC
D/A
Converter
Ref
AD
Converter
Ref
CPU
2 Mbit
10bit10bit
A269D067.WMF
The RGB analog image signals from the CCD are combined and amplified by
analog ASIC chips and converted to 10-bit digital signals by A/D converters. The
digital signals undergo shading compensation and line correction before being sent
to the IPU section.
2-32
Page 77

30 March, 1999 IMAGE PROCESSING
2.4.3 SCANNER FUNCTIONS
Photoelectric Conversion
The color CCD converts the light reflected fro m the original into RGB analog
signals (6.615 MHz for each signal: even-pixel and odd-pixel). Each CCD line has
5,000 pixels and the resolution is 400 dpi (15.7 pixels/mm).
Signal Processing (Analog ASIC)
This analog ASIC provides the following three analog signal processing functions:
(1) Signal Amplification
Odd-pixel and even-pixel RGB analog signals from the CCD are amplifie d by
operational amplifi ers .
(2) Signal Composition
The amplified signals (even-pixel and odd-pixel for each RGB color) are combined
by the MPX before A/D conversion.
Detailed
Descriptions
(3) Feedback
The CPU on the scanner IPU board receives the feedback data for white level and
black level from the shading circuits and feeds it to the ASICs through the D/A
converter. The feedback data from the CPU are updated every time the
main
switch is turned on.
A/D Conversion
The A/D conversion block converts the analog signals (CCD output) to 10-bit (1024
gradations) digital signals.
2-33
Page 78
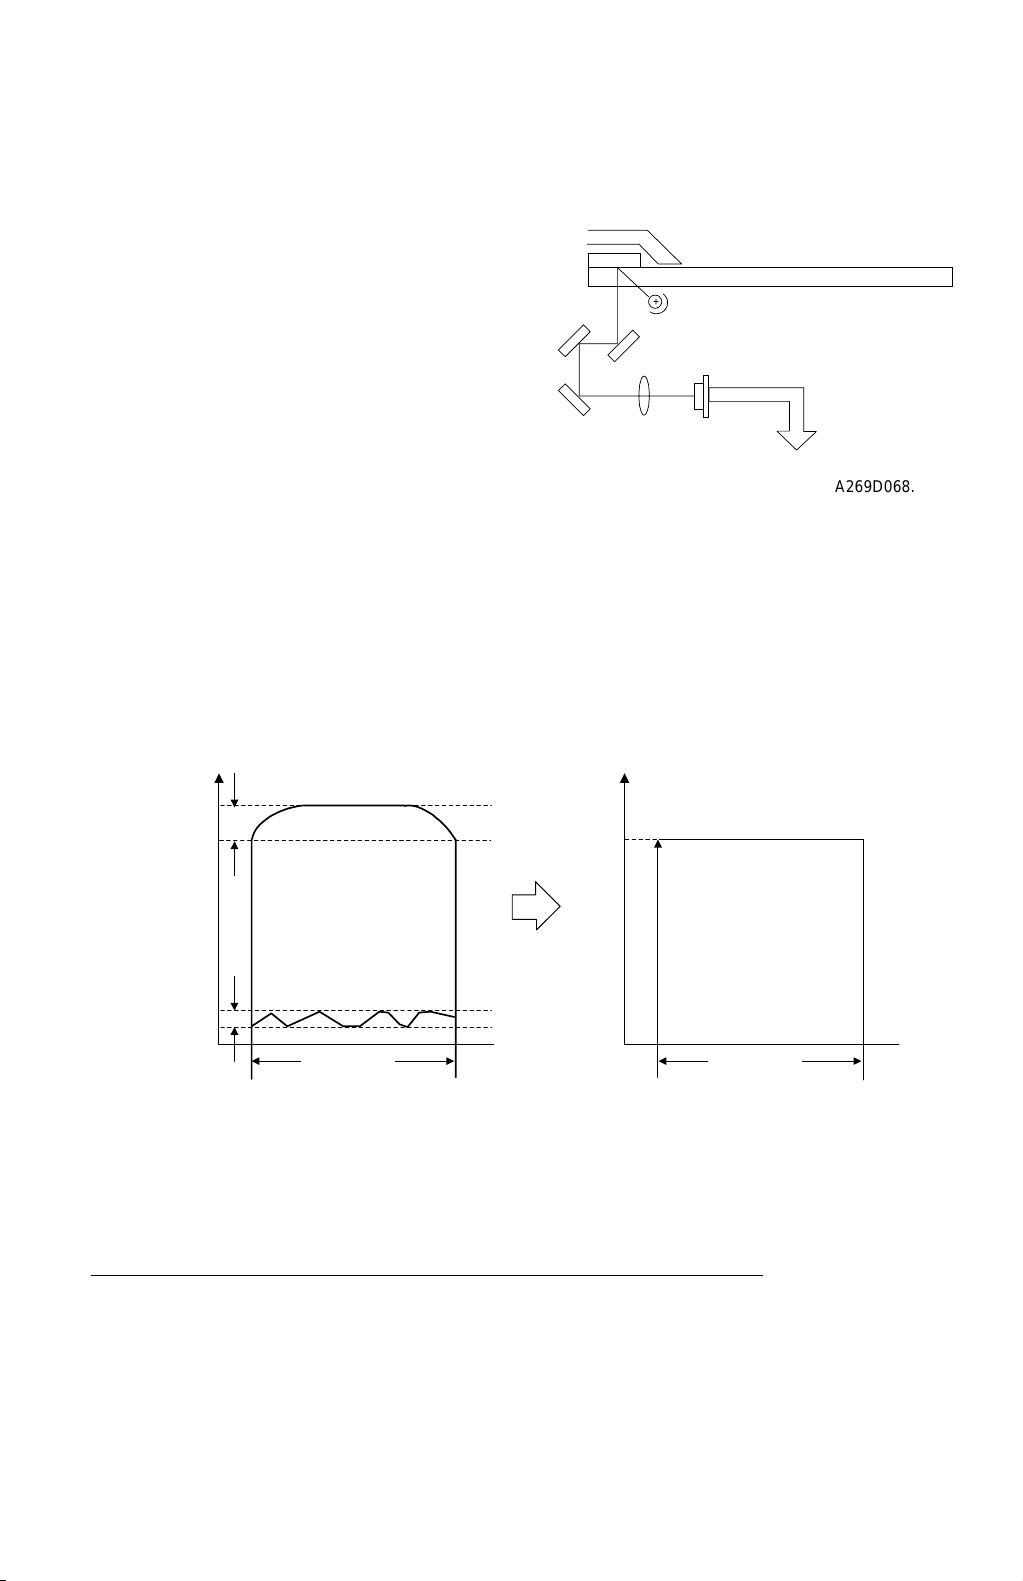
IMAGE PROCESSING 30 March, 1999
Shading Compensation Circuit
(1) Shading compensation
Before scanning each original, the
machine generates a reference white
waveform (also known as "white shading
data") by scanning 5 mm of the white
+
reference plate [A] in the sub-scan
direction (this equals 79 lines at 100%
magnification).
The white shading data is calculated for
each pixel across the main scan. To do
this for a particular pixel, it takes the white
A269D068.WMF
levels for that pixel on each of the main scan lines taken from the white reference
plate, and calculates a value from these. The white waveform is made by repeating
this process for each pixel across the main scan.
To improve image reproduction for high density areas, the machine also measures
the black shading data. It does this by reading the black video level at the first 4
pixels of the CCD, which should be black because these pixels are masked off.
The average of the 4 pixels is represented as the black shading data for one CCD
scan line.
White
Correction
Black
Correction
1 line
1023
0
1 line
A269D069.WMF
The video signal for each pixel obtained during image scanning is corrected by the
shading circuit as follows:
(Data scanned for each pixel) - (Black correction data)
x 1023
(White correction data for each pixel) - (Black correction data)
The white shading data are updated before every scanning. The black shading
data are updated every scan line. The white shading data corrects the image data
for irregularities in the CCD an d th e optics across the main scan. The black
2-34
Page 79
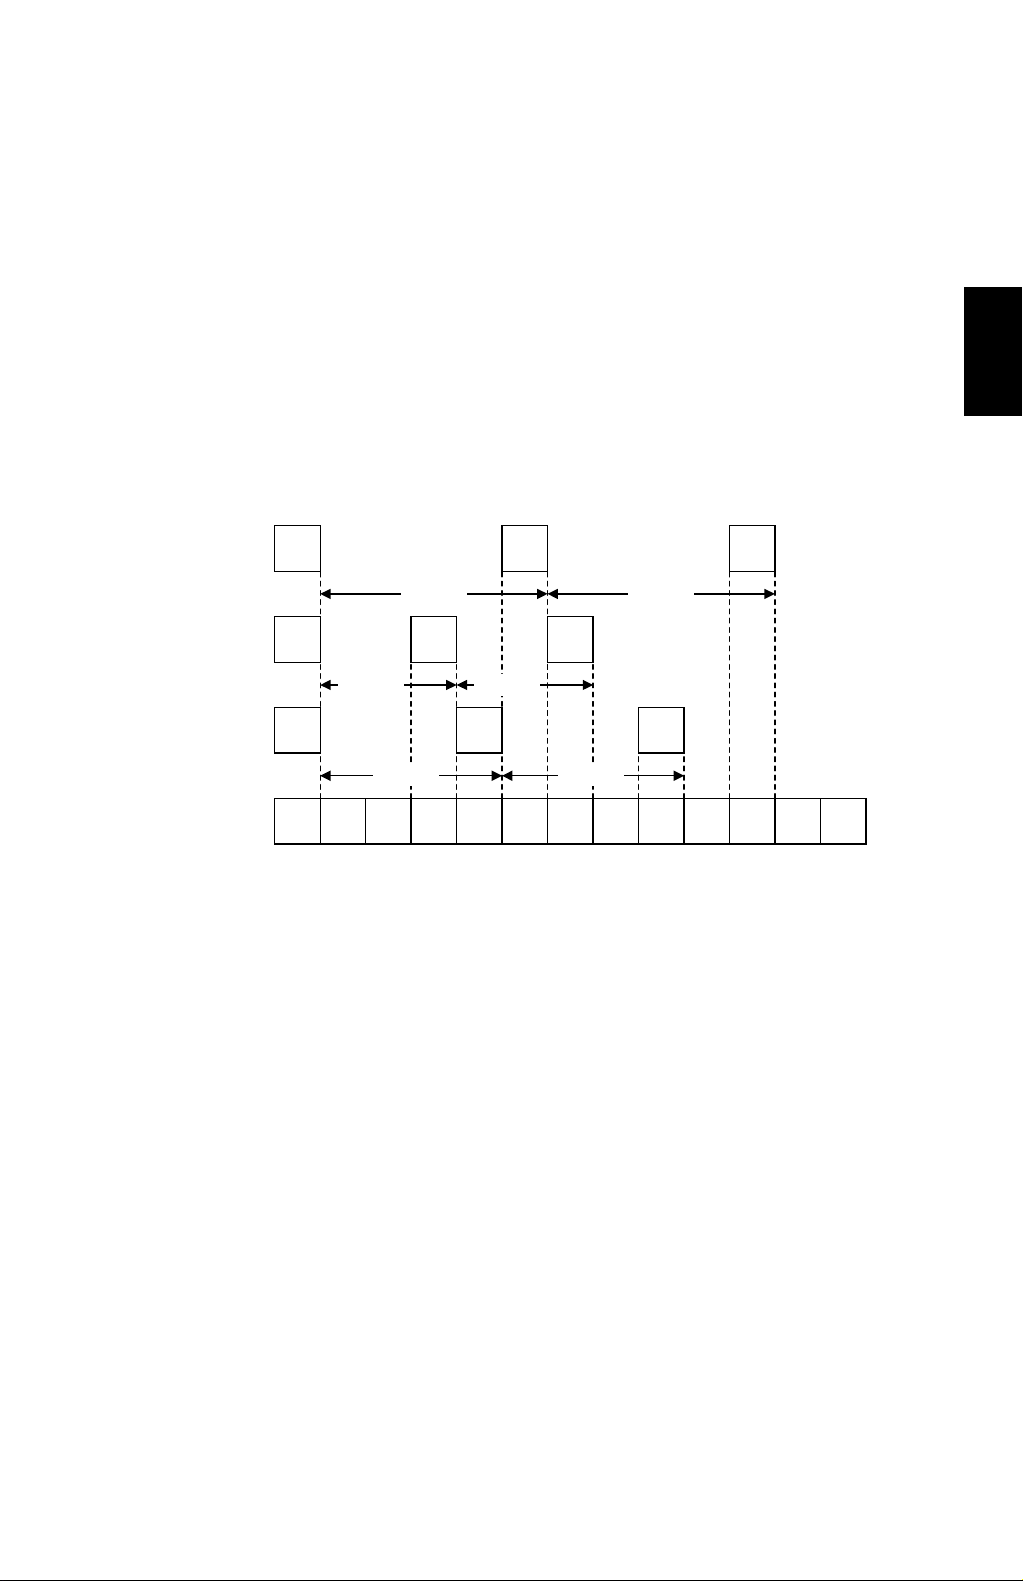
30 March, 1999 IMAGE PROCESSING
shading data corrects the image data for any changes in black level with time, as
the machine scans down the page.
D/A Conversion
The CPU monitors the digital feedback signals from the shading circuits and
calculates correction factors. Then the D/A circuit converts the signals from the
CPU into analog signals and feeds them back to the analog ASIC chips.
The CPU feeds black shading data back to the AD converters as the reference
black level. This is for done every CCD pixel to calibrate the black level, to avoid
drifts in the signal with time.
Scan Line Correction Circuit
Detailed
Descriptions
Enlargement
Reduction
Full Size
B
5 lines 5 lines
B
3 lines
B
1 2 3 4 5 6 7 8 9 10 11 12 13
G R
4 lines 4 lines
G R
3 lines
G R
A269D070.WMF
The three CCD lines providing the RGB signals are spaced 4 line s apart (8 lines
total) when full size magnification is used. To compensate for this discrepancy, the
line correction circuits synchronize the output timing of the RGB signals to the IPU
section by storing the scan data for each line in memory. The discrepancy between
RGB video signals changes depending on the magnification ratio. The correction
data for different magnifications is calculated as follows:
•
B: Standard (No correction)
•
G: (4 lines) x (Magnification ratio)
•
R: (8 lines) x (Magnification ratio)
If this calculation does not result in an integer, the correction data is set to the
closest integer, but further correction is needed (refer to “Picture Element
Correction”).
2-35
Page 80
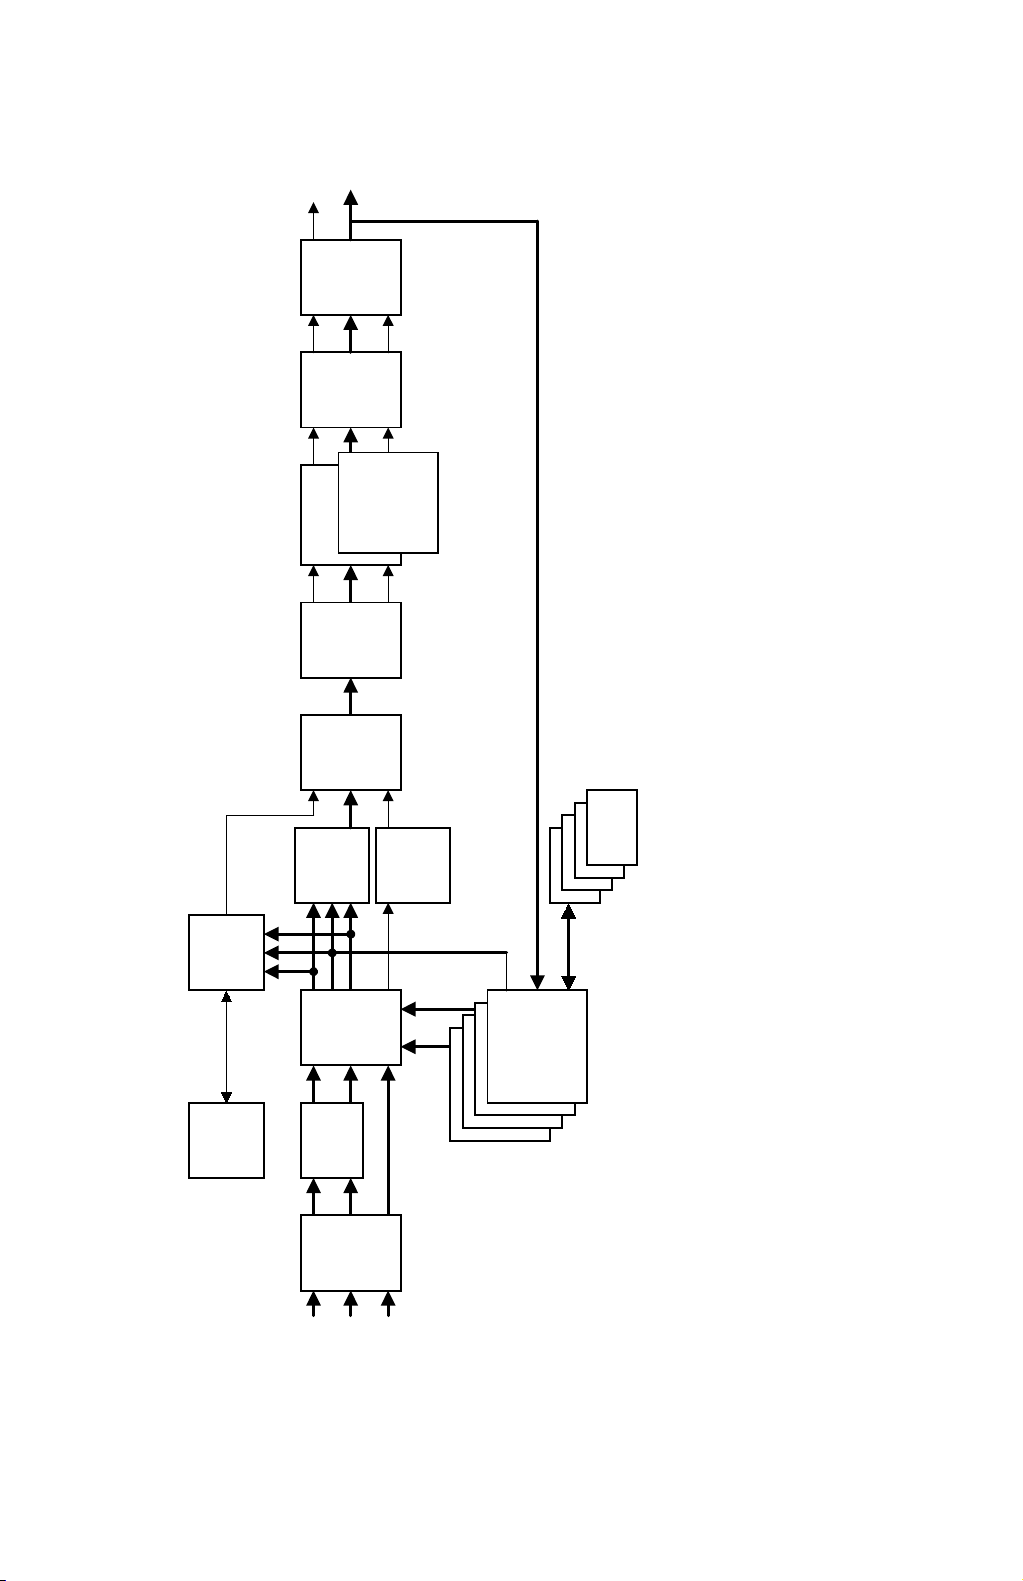
IMAGE PROCESSING 30 March, 1999
2.4.4 IPU SECTION BLOCK DIAGRAM
Gradation
processing
Image
Creation
Magnification
Magnification
2
Color
calibration
&
ACS
Separation
DRAM
Filter
Field
Field
R
&
Color
Memory
Picture
Element
Correction
Memory
Shading
G
calibration
Field
Memory
B
Area processing
Area processing
Area processing
Area processing
DRAM
DRAM
DRAM
DRAM
This copier holds RGB color image data in 96 MB of DRAM memory so that a full-color copy can be generated in a single scan. The image in this
memory is also used in the continuous copy mode.
In single color mode, this memory can be used to enable image rotation.
2-36
A269D071.WMF
Page 81
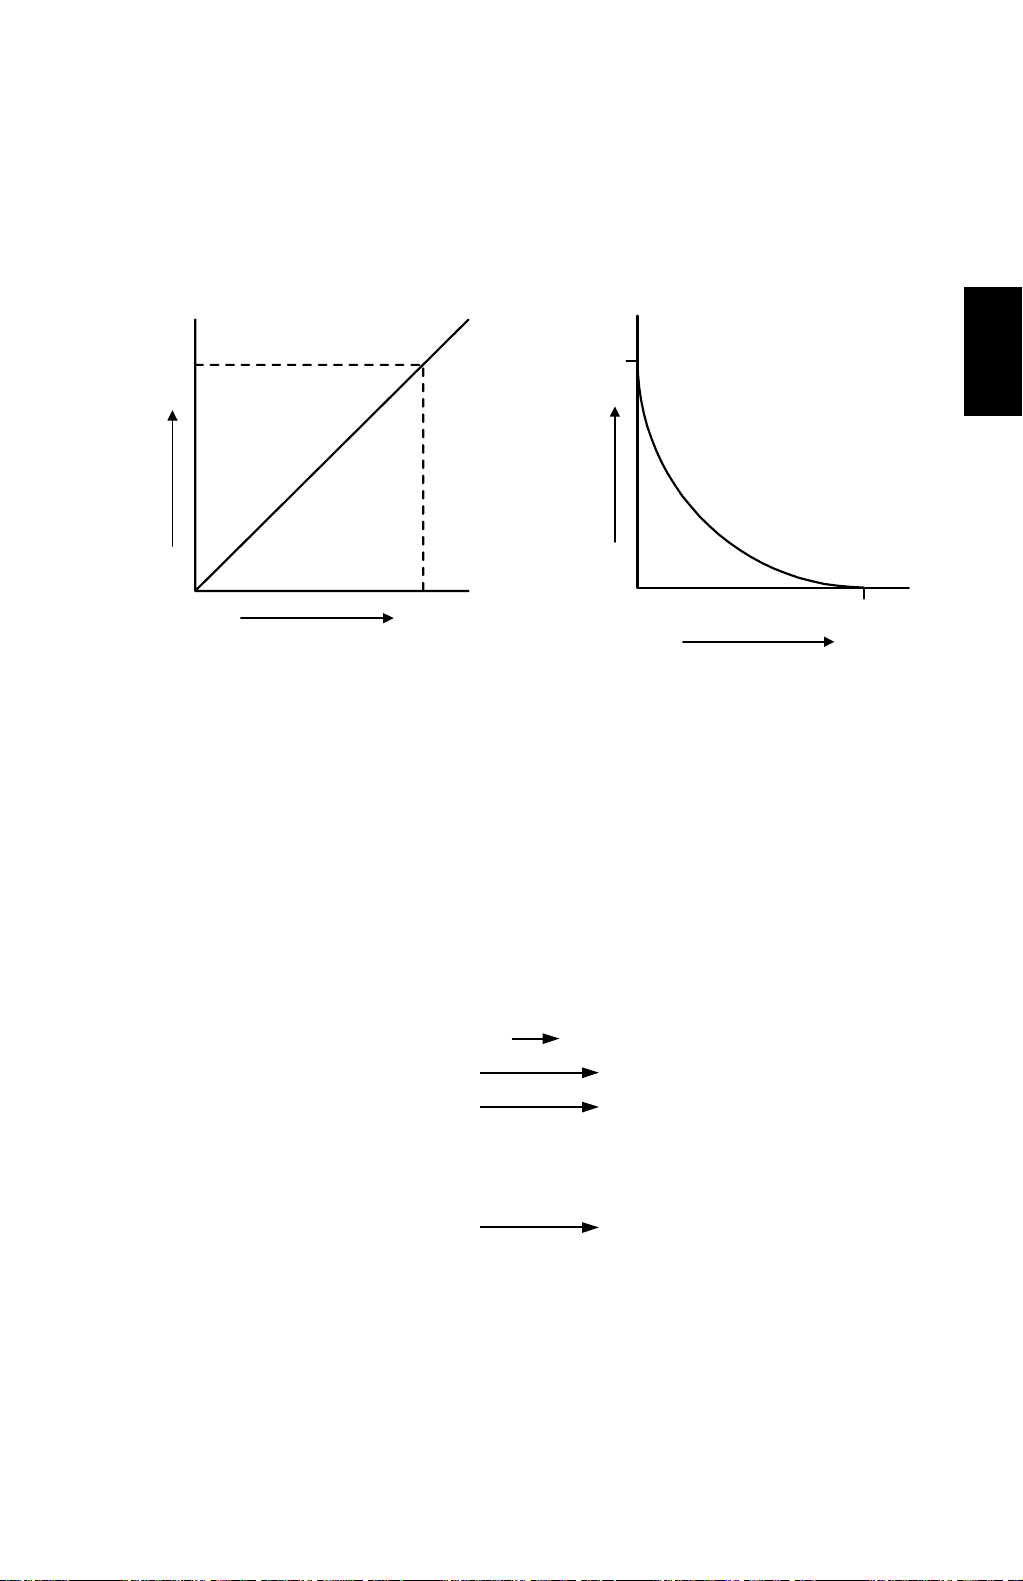
30 March, 1999 IMAGE PROCESSING
2.4.5 IPU FUNCTIONS
Scanner
Scanner
γγγγ
Conversion and Picture Element Correction
γγγγ
Conversion (RGB
1023
0
Dark Light
A269D072.WMF
γγγγ
Conversion)
255
0
1023
LightDark
A269D073.WMF
The RGB video signals from the CCD (10-bit signal) are sen t to the IPU section .
These signals are proportional to the intensity of light reflected from the original
image (Fig. 1). However, the IPU section converts the signal levels as shown in
figure 2 by us ing a gamma (γ) correction table in order to improve the accuracy of
RGB to CMY color conversion, which is done later in the image process. The same
table is used for R, G, and B signals.
Detailed
Descriptions
The scanner gamma (γ) correction inverts the video signals and converts the signal
from 10-bit to 8-bit as outlined in the following table:
Dark (Black) Light (White)
Scanner Input (RBG) 0 1023
After γ Correction (RGB)
↓
Color Conversion
↓
Printer Output (CMYK) 255 0
255 0
2-37
Page 82

IMAGE PROCESSING 30 March, 1999
Picture Element Correction
The Picture Element Correction circuit does two things.
1. Completion of the Scan Line Correction process
The discrepancy in the spacing of the RGB
signals from the CCD in the sub -scan direction
R
is corrected by the line correction circuit in the
scanner section (refer to Scanner Section –
G
Scan Line Correction). However, if the
correction data corresponding to the
B
magnification ratio is not an integer, then
further correction is needed to synchronize the
RGB signals.
Picture Element Correction
A269D074.WMF
2. Correction if the CCD is not perpendicular to the light
If the CCD board is not perpendicular to the light axis, the position of each pixel is
different from the original image position. This difference becomes larger towards
the ends. Under this condition, vertical black lines (in the sub-scan direction) at the
left and right edges of the original are colored because the Y, M, and C toner dots
are not properly positioned. (This can be checked by looking at the vertical lines at
the right and left edges of a copy of the C4 color chart.)
Therefore, the CCD line spacing is also corrected here. The target areas for this
correction are shown above. The green CCD line is taken as a standard, and the
ends of the red and blue lines are corrected.
Adjust SP modes 4-932-001 to 4-932-004 to chang e the v erti cal line correction
level. (See 6.7.2 Main Scan Position Dot Correction)
2-38
Page 83
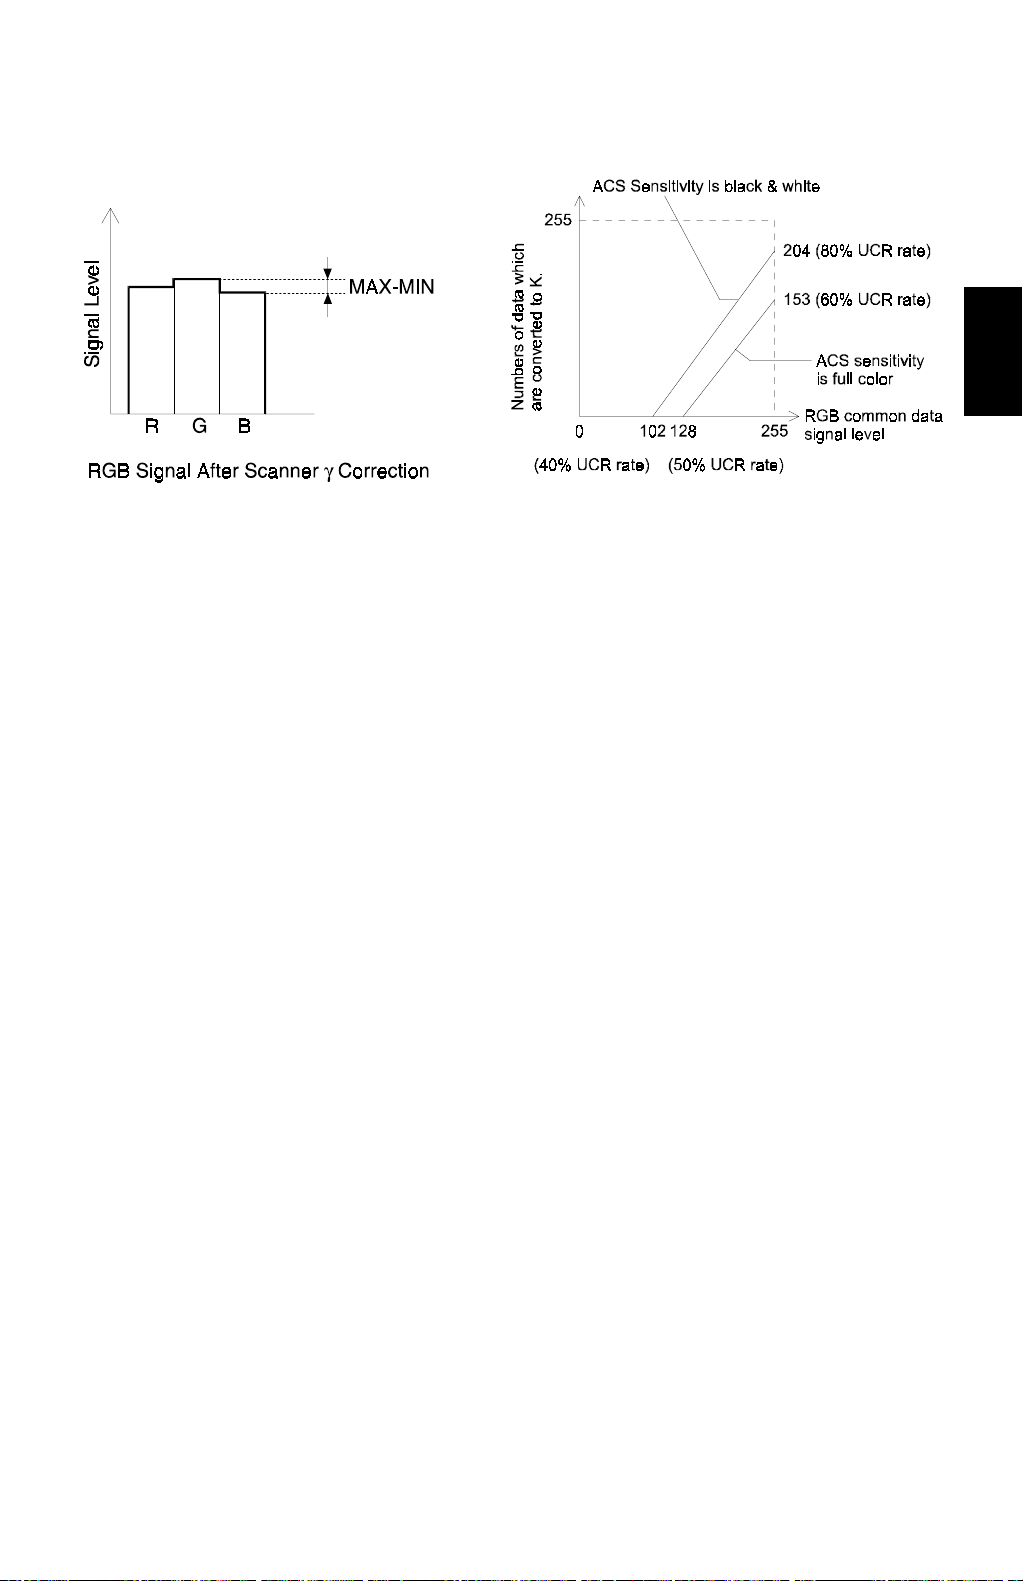
30 March, 1999 IMAGE PROCESSING
ACS (Auto Color Selection)
A269D076.WMF
A269D075.WMF
The auto color selection function determines if an original is black/white or color.
Then black copy mode or full color mode is automatically selected to match the
original.
Detailed
Descriptions
To recognize if the original has a color area or not, the RGB video signals are
compared. If the maximum difference among RGB signal levels (MAX-MIN in the
above diagram) is within a certain range, the original is considered black and white.
During the 1st scanning cycle, the latent image is developed with the amount of
black toner specified by the gamma (γ) corrected RGB video signals. If the original
does not have any color areas, the 2nd scanning is aborted and the developed
image is transferred from the transfer belt to the copy paper. Then the black &
white copy comes out. If the original has a color area, copying resumes in the full
color copy mode (4 scans).
Users can maximize the quality of their output by selecting priority for black and
white or full color original in ACS mode, using the User Tools (ACS Priority). (The
above right figure shows the effect of this setting.) The K setting prevents the UCR
process from reducing the image density too much in low image density photo
areas. This is explained in more detail in the section on UCR.
2-39
Page 84

IMAGE PROCESSING 30 March, 1999
Automatic Original Type Selection
If this function is selected, the copier starts a pre-scan when the Start key is
pressed. During the pre-scan, the copier detects two or more image features and
identifies the type of original.
Since the copier selects the mode that is most suited to the original, the selected
mode does not always match the specified mode. For example, the copier may not
copy text originals in the text mode.
The copier automatically selects the following 9 original modes:
Automatically selected original modes
1) Text mode
2) Printed text/photo
3) Glossy text/photo
4) Copied text/photo
5) Printed photo
6) Glossy photo
7) Copied photo
8) Marker pen
9) Ink jet
NOTE:
Mixed-type originals are disallowed because the copier cannot select an
appropriate mode for such originals (they may be copied, however).
2-40
Page 85
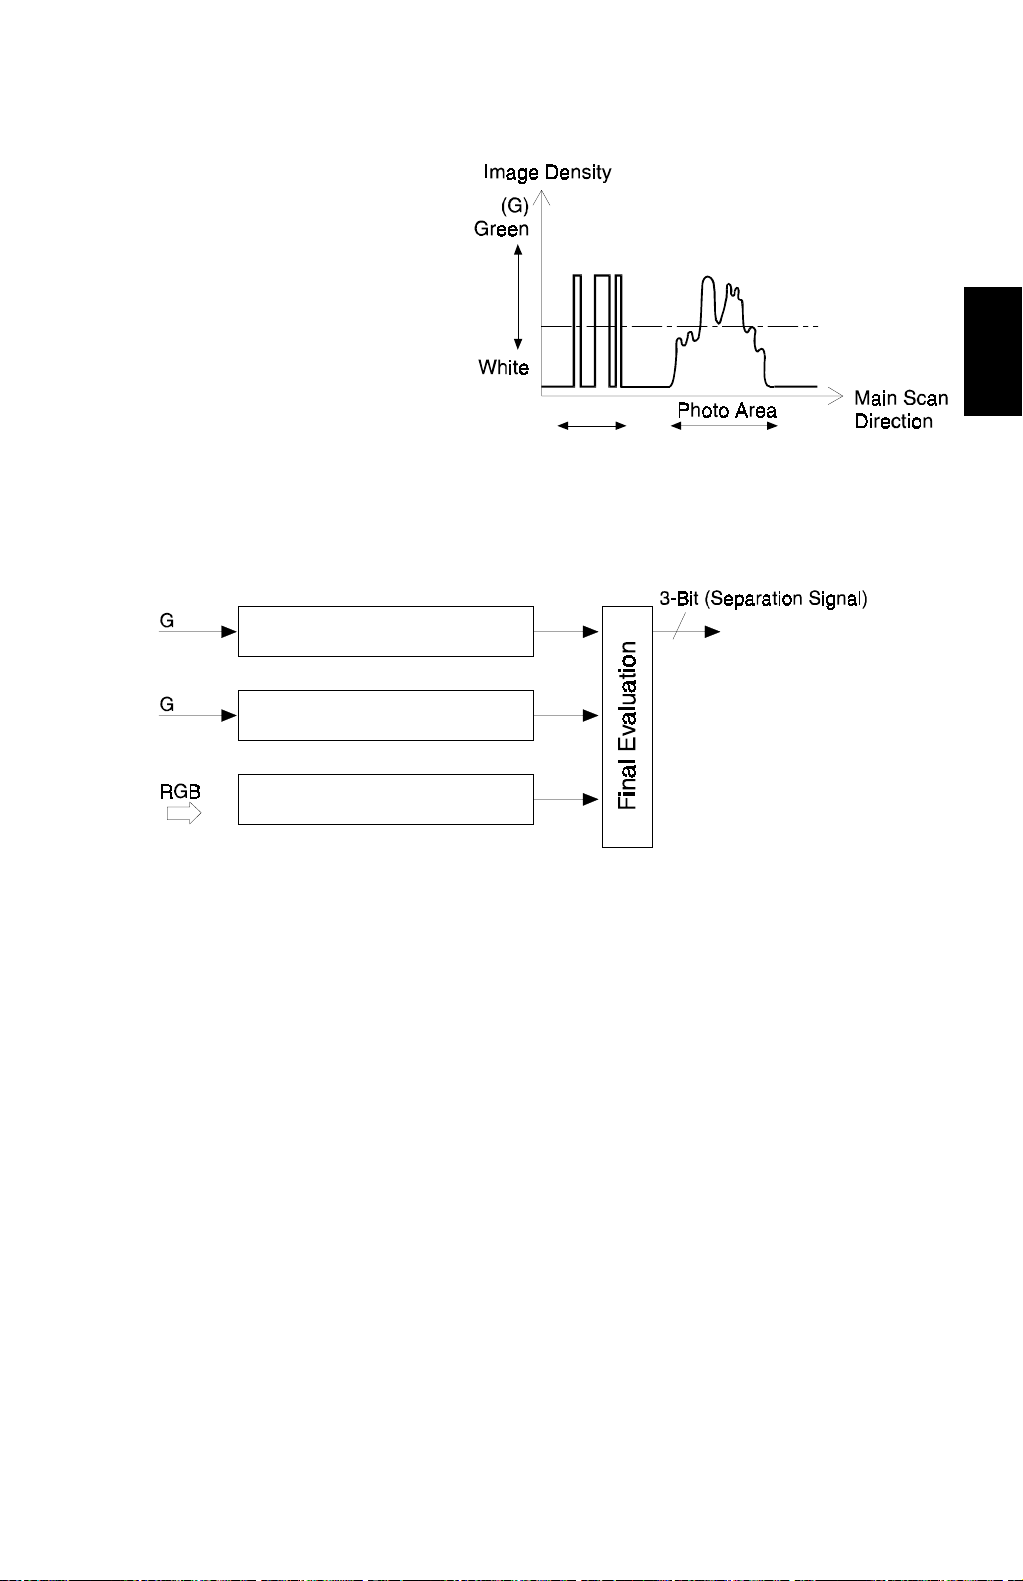
30 March, 1999 IMAGE PROCESSING
Image Separation
The copier senses and separates
the original image into text and
photo (dot screen) areas.
Generally, The text areas feature
an appreciable difference in
contrast between the background
and image parts. The photo (dot
screen) areas feature many
intermediate levels of gradation.
The copier senses these features
and separates the image into
black text, colored text, and photo
areas.
Edge Separation
Text Area
A269D077.WMF
Detailed
Descriptions
•
Black Text
•
Colored Text
•
Dot Screen Separation
Photo
Colored Text Separation
A269D078.WMF
(1) Edge separation
The edges of text and line diagram elements are identified by using the
characteristics of strong contrast, continuity of black or color pixels, and continuity
of white pixels around the black or color pixels.
The machine does this by only referring to the green signal.
(2) Dot screen separation
Dot screen areas are separated from non-dot screen areas (mainly text). The
machine determines that if white pixels are not detected around the non-white
pixels, it is a dot screen area.
The machine does this by only referring to the green signal.
(3) Colored text separation
Black pixels and color pixels in text areas are identified by determining the
difference among the RGB maximum signal levels and the output levels of the
RGB video signals.
2-41
Page 86
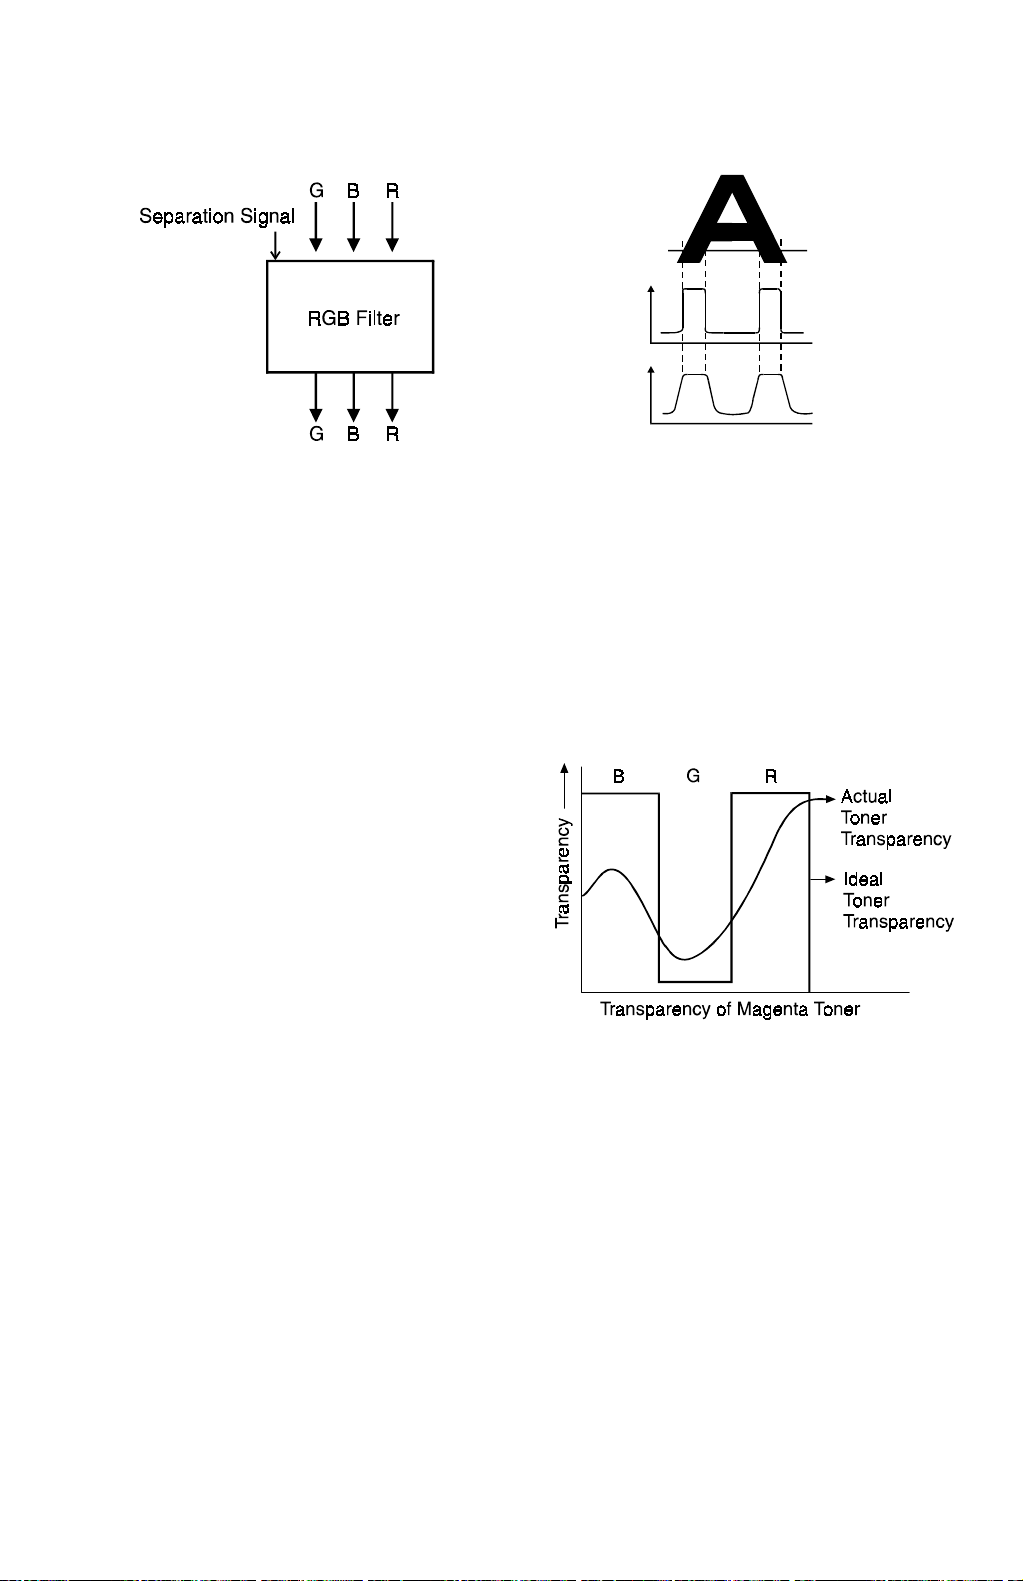
IMAGE PROCESSING 30 March, 1999
Filtering and Color Conversion
A269D079.WMF
A269D080.WMF
RGB Smoothing Filter
Depending on the results of auto text/photo separation (or depending on the
selected original mode), the appropriate software filters are applied to the RGB
video signals. The RGB smoothing filter is applied to photo areas; an edge
emphasis filter is applied to text areas.
Color Conversion
A matrix converts the RGB video signals
from each scanning cycle into YMCK video
signals. The content of the matrix depends
on the selected mode. The transparency
for each color toner is not ideal, as shown
above. Color conversion compensates for
the difference between ideal and actual
characteristics.
The following modes affect the matrix:
color conversion mode (this is a user
mode, not to be confused with the color
A269D081.WMF
conversion process described in this
section), pastel mode, color balance mode, original mode (press print glossy photo,
2nd generation), RGB toner correction mode
The following color conversion table is an example of the results from the matrix
operation, for simple color copying without any special modes applied. For
example, to represent green, the yellow and cyan toners are used in a proportion
of 1:1.
2-42
Page 87

30 March, 1999 IMAGE PROCESSING
Original Color
Toner
Y 11110000
M 11000110
C 10011100
K 10000000
KRYGCBMW
Color Conversion Table
If the user selects a special mode some of the values in this table may be between
0 and 1. The following page briefly explains the effects of some modes.
Color Conversion mode
Color conversion mode is a user feature, not to be confused with color conversion
(RGB to CMYK) described above. In color conversion mode, a selected color
(C/M/Y/R/G/B/K/W) on an original that falls within the recognized thresholds for that
color is converted into a different color on the copy. Up to 4 colors can be
converted at one time. (Please refer to the operator's manual for details.)
For example, when changing Yellow to Black, the coefficients for the Yellow video
signal in the color conversion table become: Y: 1, M: 1, C: 1, K: 1
Pastel mode
In pastel mode, the matrix parameters change, and the output of the combined
YMCK data shifts to a value between 100 % and 25 %. There are 9 steps, and the
value used depends on the user's selection.
Detailed
Descriptions
Color balance mode
In color balance mode, the data output for each color (YMCK) can be changed
independently by changing the matrix parameters. Three are nine possible values
for each color.
Original mode
There are three modes within photo mode (Press Print, Glossy Photo, and 2nd
Generation) and three types of special original mode (Marker Pen, Inkjet, Map).
The machine selects the most suitable matrix for the original type that is selected
by the user at the operation panel.
For inkjet mode, the user can select one of three different inkjet gamma (γ) tables
to emulate the output of three different types of inkjet printer. (This is done with the
User Tools.)
RGB toner correction mode
Two color toners are used on R, G, and B output in the single color mode. The
toner mixing ratios for R, G, and B are adjustable (SP 5-611-001 to 5-611-006).
The adjustments are valid for two-toner single-color (R, G, or B) copy modes only.
Twin color mode
Twin color mode separates black part area and colored areas. The machine then
converts black to one color (that was selected by the user) and all the color areas
another color (the output has only two colors). (Refer to the operator's manual for
details.)
2-43
Page 88
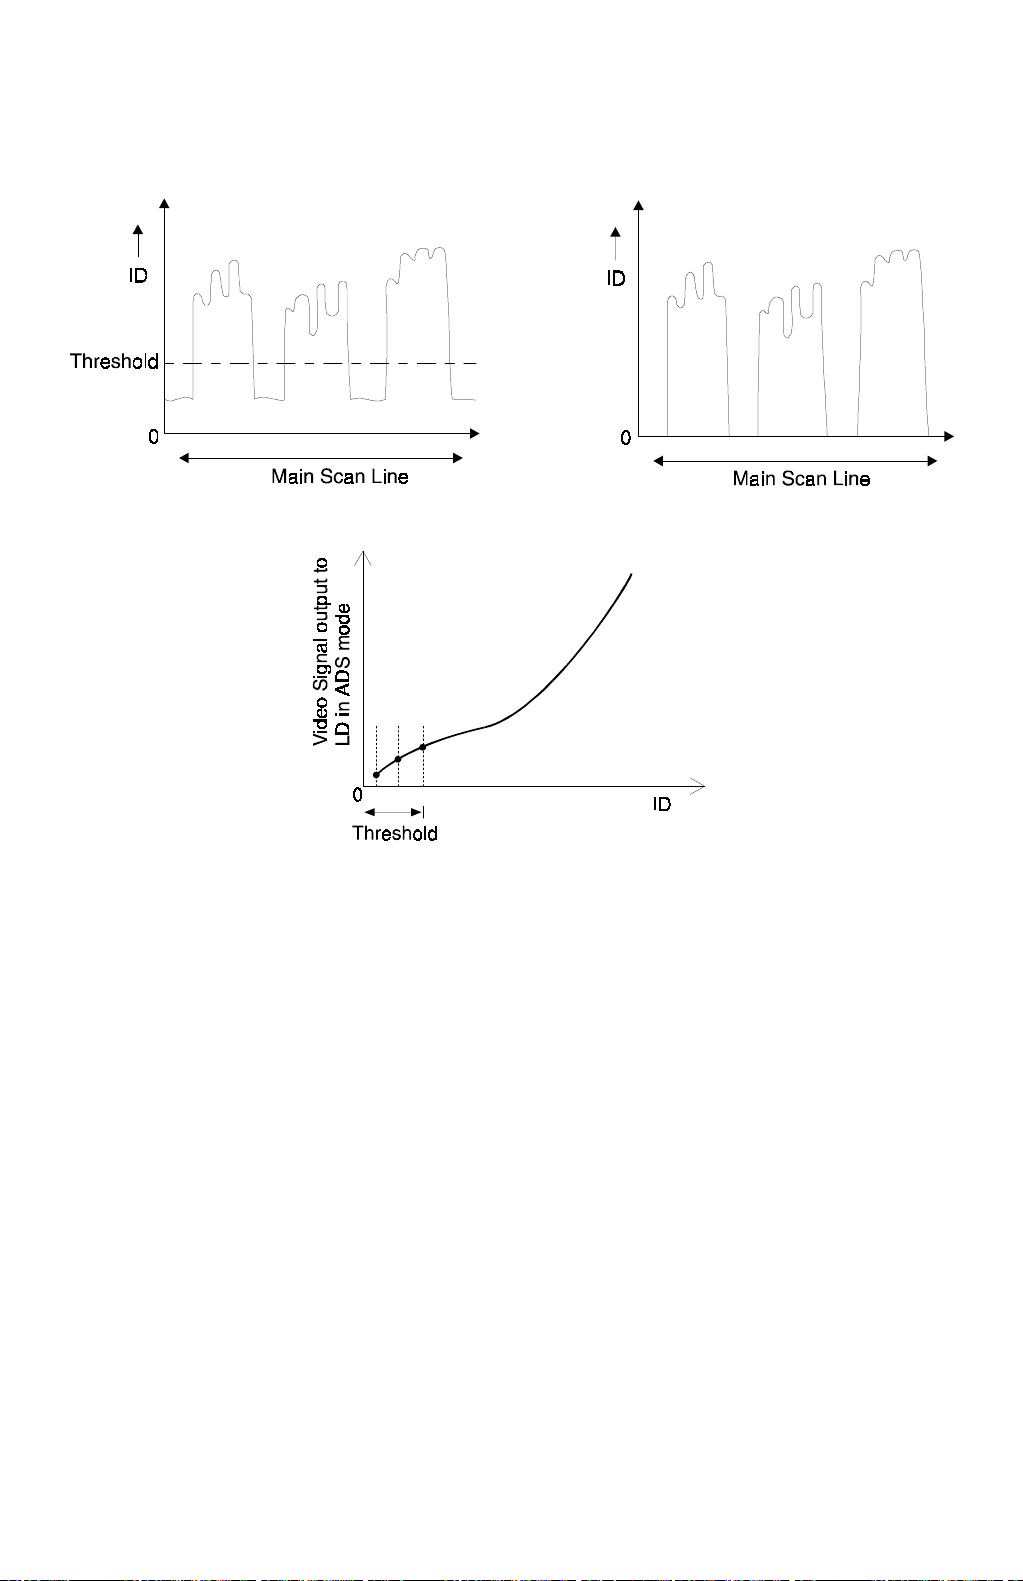
IMAGE PROCESSING 30 March, 1999
Background Density Control and ADS
A269D084.WMF
A269D083.WMF
A269D085.WMF
Background density control
This function removes low ID image signals (background) that are less than a
certain threshold. The threshold that is applied depends on the color mode (single
color or full color). For each of these modes, the user can select a different
threshold.
ADS (Auto Image Density Selection)
In ADS, the user does not set the threshold; the machine calculates it, guided by
input from the user for F/C and 2C mode.
In full color mode, after scanning the machine calculates the threshold for removing
background by referring to the RGB data taken from the entire original.
In black and white mode, the machine detects the background level for the original,
also known as the peak white level, and removes this from the image, to make a
white background. Peak level data is taken for each scan line to correct for
changes in background density down the page. From the peak white level, the
machine determines the white reference value for A/D conversion. Therefore, in
black and white mode the background density is controlled before data is input to
the A/D converter.
2-44
Page 89
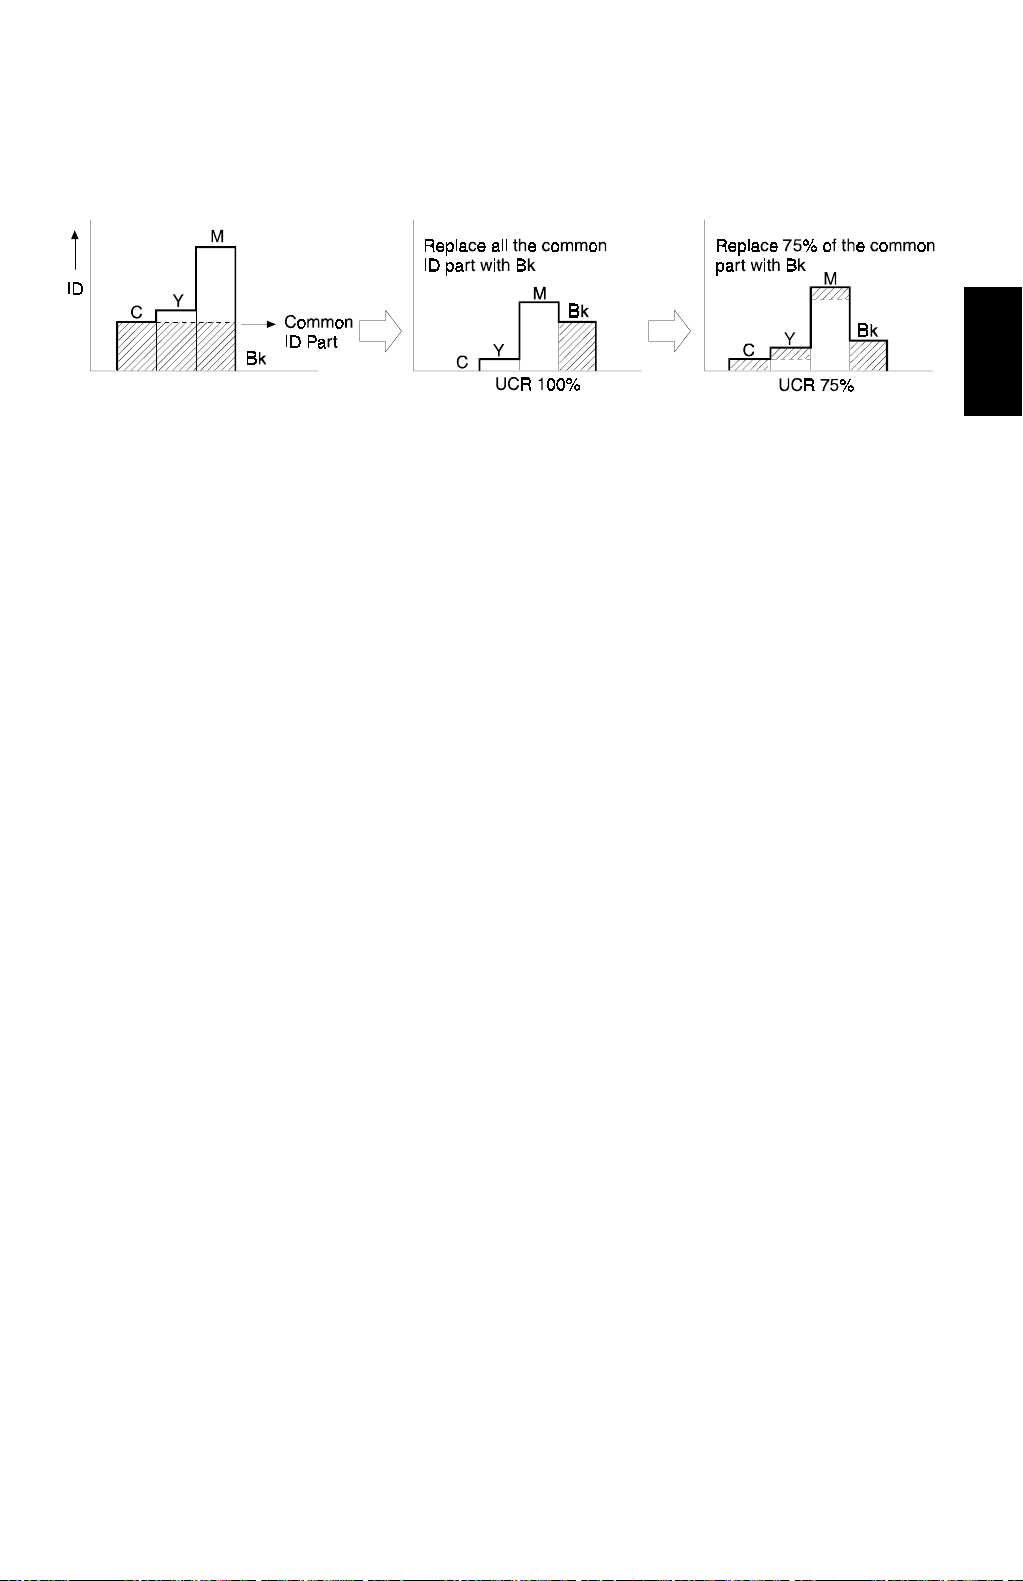
30 March, 1999 IMAGE PROCESSING
UCR (Under Color Removal)
A269D086.WMF
Obtaining the right colors using YMC toner addition does not always work perfectly.
For example, if the same quantity of toner for each color (YMC) is put on the paper,
ideally the image should become black, but in reality it becomes a dark color, such
as dark blue.
To compensate for this, an equal portion of the common ID value for each color is
subtracted. This reduces the amount of color toner on the paper, and a
proportional amount of black toner is added. This process is known as UCR.
Detailed
Descriptions
The UCR ratio is the percentage of the common ID value for YMC that is
subtracted and converted to black. In the above example, where the UCR ratio is
100%; the entire common ID value is subtracted from Y, M, and C, and converted
to K.
In actual use, the UCR ratio depends on the color mode and the image density. For
example, when the UCR ratio is 95%, 95% of the entire common ID value is
subtracted from Y, M, and C, and converted to K.
The UCR ratio can be adjusted by the user during initial setup.
2-45
Page 90

IMAGE PROCESSING 30 March, 1999
Magnification Processing
Main Scan Magnification
A269D088.WMF
The machine changes the scanner speed to reduce or enlarge the original in the
sub-scan direction. However, an LSI on the IPU Board handles reduction and
enlargement in the main scan direction.
Scanning and laser writing are done at a fixed pitch (the CCD elements cannot be
squeezed or expanded). So, to reduce or enlarge an image, imaginary points are
calculated that would correspond to a physical enlargement or reduction of the
image. The correct image density is then calculated for each of the imaginary
points based on the image data for the nearest two true points. The calculated
image data then becomes the new (reduced or enlarged) image data.
NOTE:
The actual calculations for main scan magnification use the polynomial
convolution method. This mathematical process is beyond the scope of a
service manual and will not be covered here.
400 dpi to 600 dpi Conversion
The copier converts image data that is scanned at 400 dpi to 600 dpi by performing
the same processing that is explained above in “Main Scan Magnification” by
applying 150% magnification processing on the image data for both main and sub
scans.
2-46
Page 91
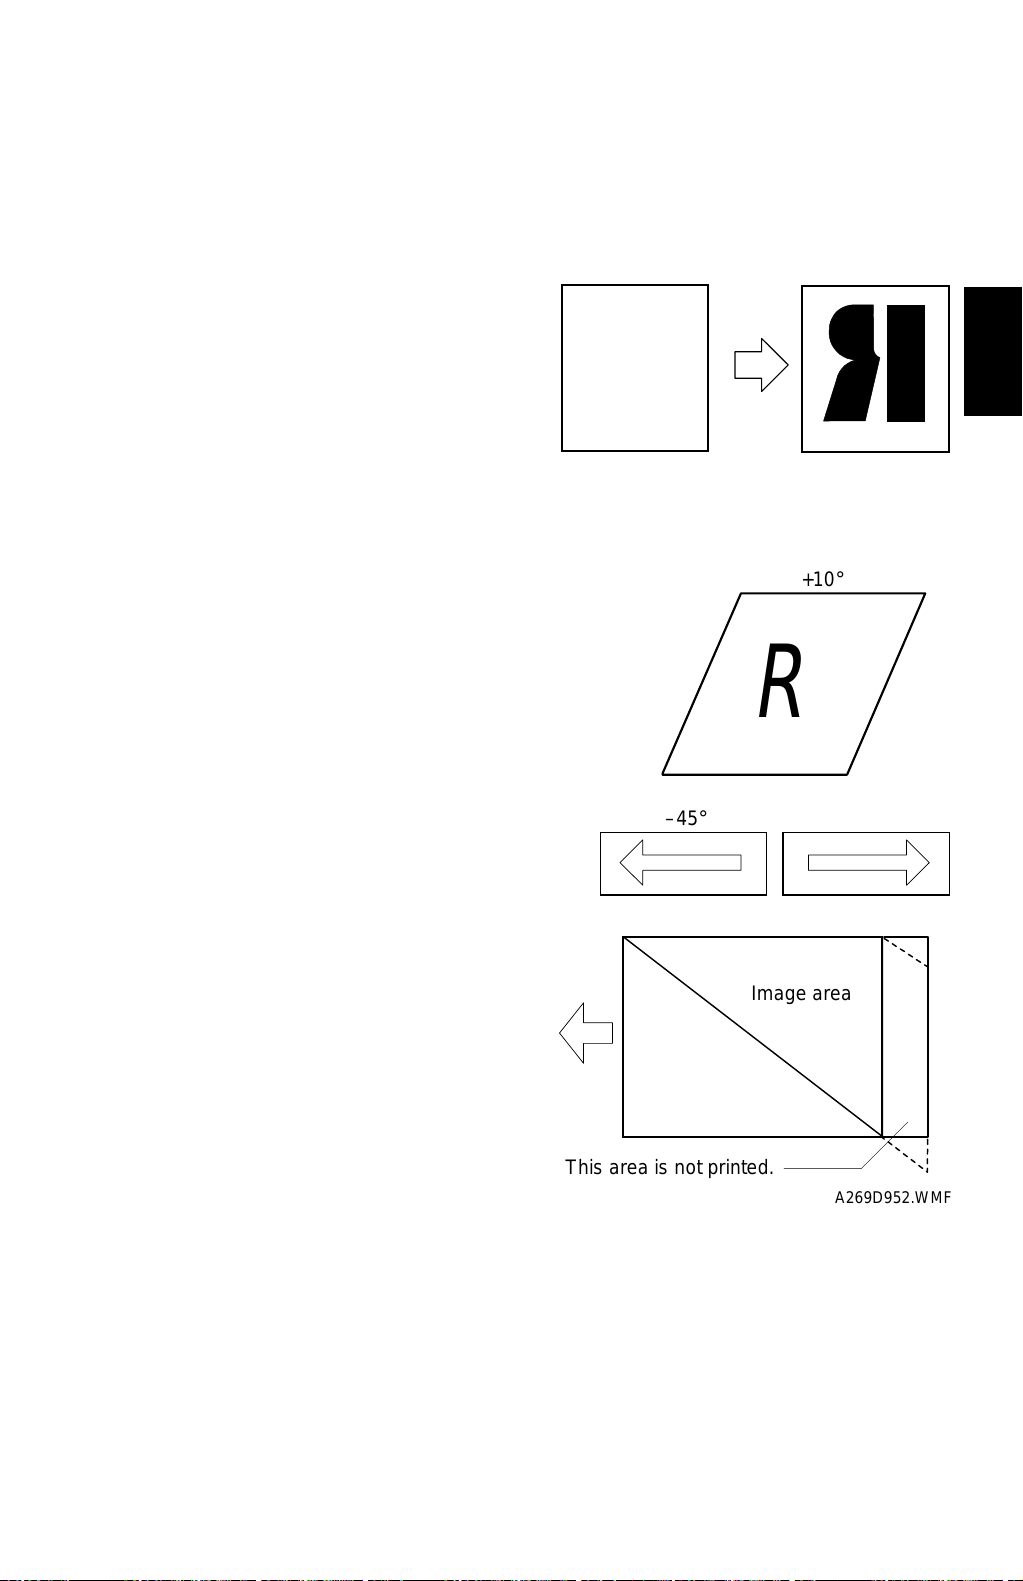
30 March, 1999 IMAGE PROCESSING
Image Creation
These are some of the user selectable image processing functions.
Mirror Image
This function generates a mirror image of
the original by inverting the original image
in the main scan direction.
û
A269D951.WMF
Slanted Image
°
This function generates a slanted image of
the original by shifting the original image in
the main scan direction by a specified
angle. The maximum allowable angle is
±45°
.
+10
R
Detailed
Descriptions
°
–45
Image area
This area is not printed.
Repeat Image
The copier can copy a specified area of the original repeatedly over the entire
page. There are three ways of specifying the copy area. (Refer to the operator's
manual for details.)
1) Entering length.
2) Entering the number of images
3) Entering via an editor
°
+45
A269D952.WMF
2-47
Page 92
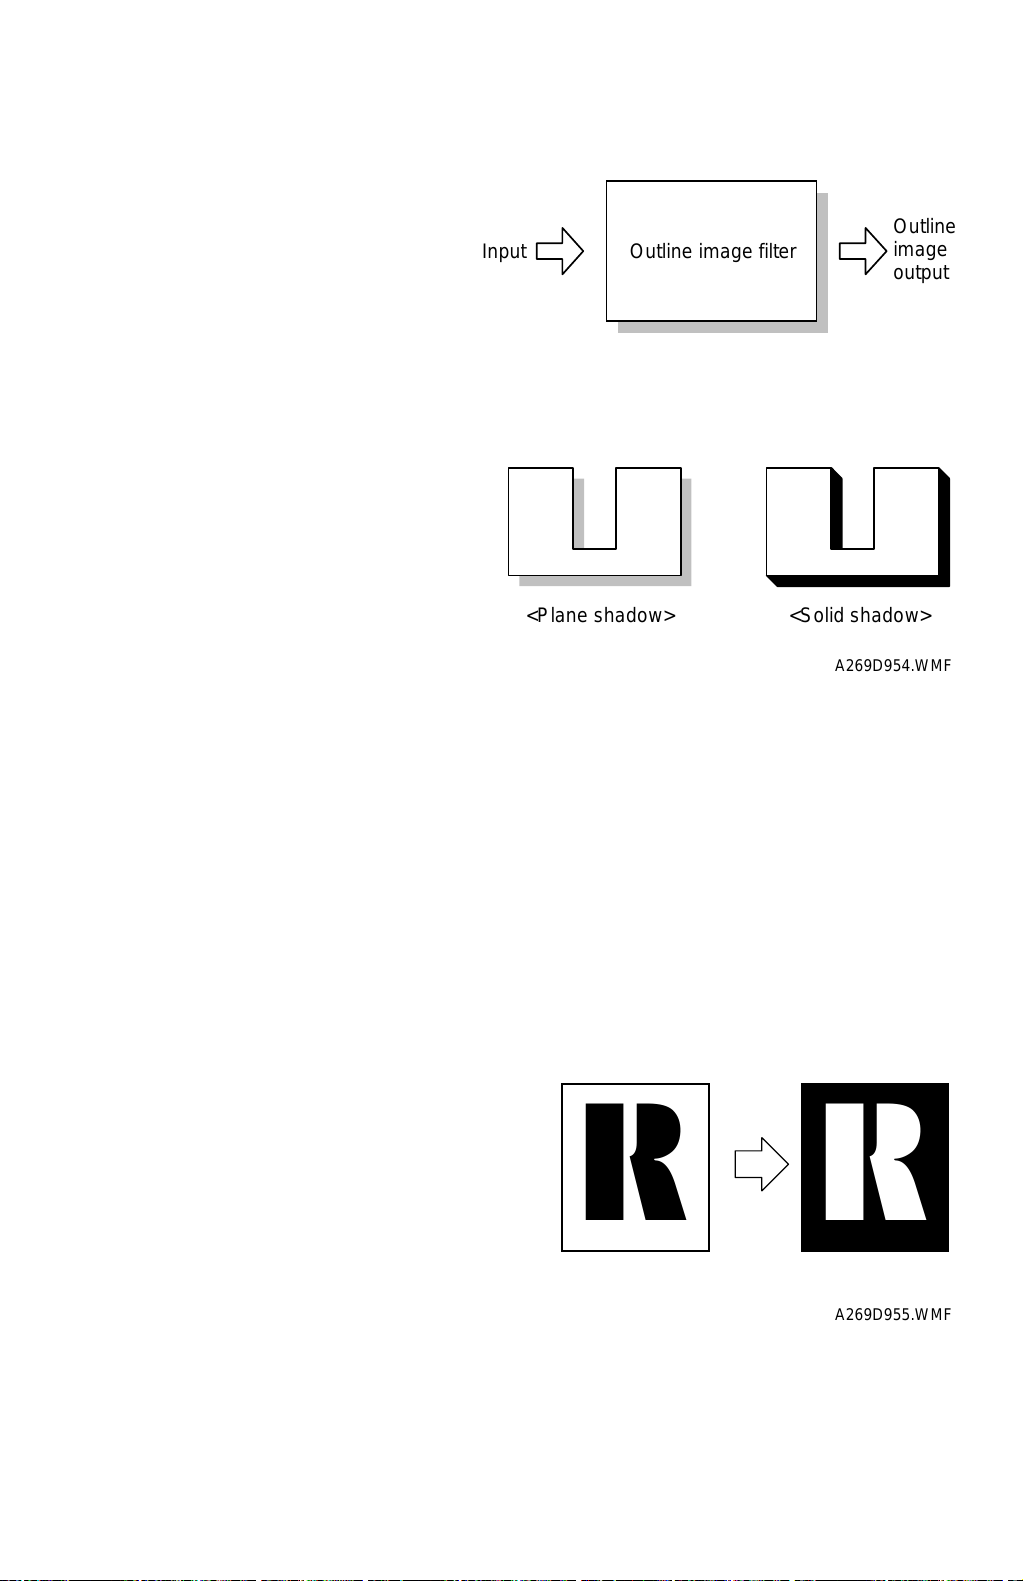
IMAGE PROCESSING 30 March, 1999
Outline Image
The copier converts the image data
into binary-value data and submits
the converted data into an outline
image filter. The frame width may
be set to 0.25, 0.5, or 0.75 mm.
Shadow Image
The shadow is cast in the lower right
direction from the original at an
angle of 45 degrees. The shadow
may be plane or solid and the
shadow color may be the same color
or specified color.
Input
<Plane shad ow> <Solid shadow>
Outline image filter
A269D953.WMF
Outline
image
output
To produce a half tone of the same
color, the copier identifies the color
of the original and uses that color for
shading.
The color may be specified from the
editor (K, C, M, Y). The width of the
shadow can be specified between 1
mm and 4 mm in 1 mm units. The
copier does not allow the user to
specify the color of the shadow
when performing both outline
imaging and shadowing.
Positive-Negative (Image Inversion)
The copier converts the colors of the
full-color original to their
complementary colors in the inversion
mode.
W to K
B to Y
G to M
R to C
A269D954.WMF
û û
The user may specify the area and
magnification ra tio.
A269D955.WMF
2-48
Page 93
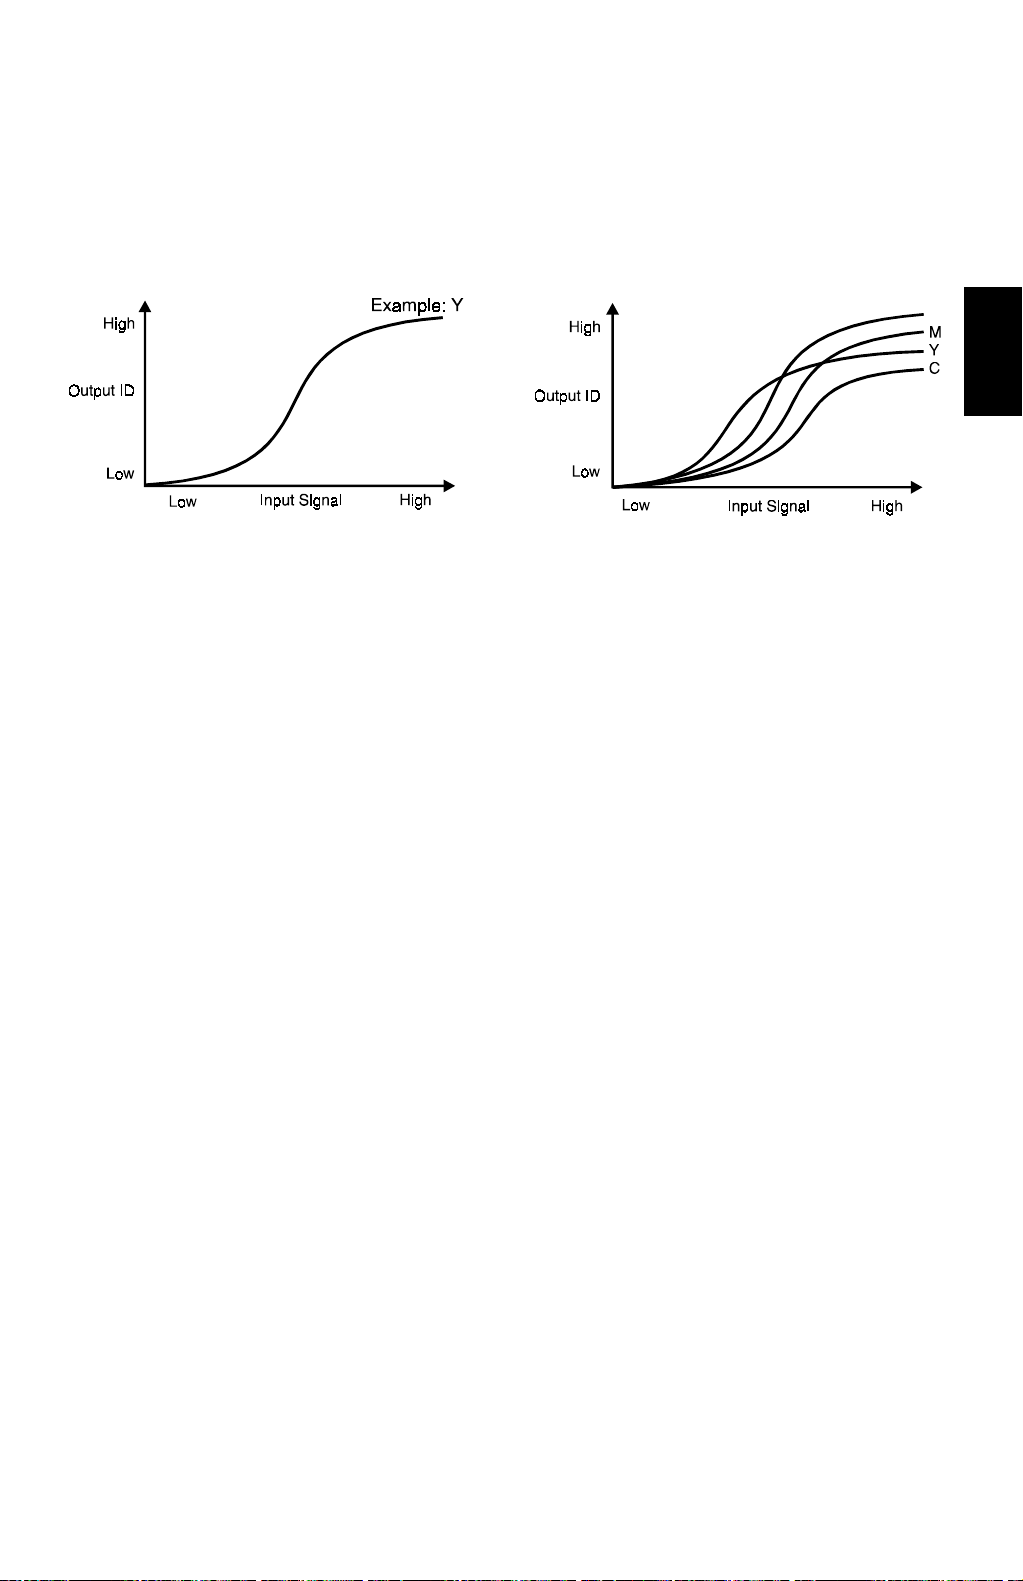
30 March, 1999 IMAGE PROCESSING
Gradation Processing
Gamma (
A269D089.WMF
KCMY
γγγγ
γγγγ
) Correction (Printer
[Fig. 1]
γγγγ
)
[Fig. 2]
A269D090.WMF
Ideally, the gamma curves for Yellow, Magenta, Cyan, and Black are identical, as
shown in figure 1. However, they are not because electrical components always
vary slightly, resulting in varying gamma curves, as shown in figure 2.
K
Detailed
Descriptions
The Auto Color Calibration (ACC) procedure can compensate for any
discrepancies in color reproduction. ACC makes new gamma curves for each color
in each mode (text, photo, black text). After ACC, the gamma curve for each color
can be adjusted with service programs (SP4-910 to SP4-926).
Using these programs, each gamma curve can be adjusted for 4 different modes:
ID max., High ID, Middle ID, and Low ID, as shown on the following page. If the
previous gamma curve was better, it can be recalled. Alternatively, the factory
settings can be loaded using SP 5-610-004. In addition, the factory settings can be
overwritten by the current gamma settings using SP5-610-005. SP7-904 prints the
current manual γ settings.
2-49
Page 94
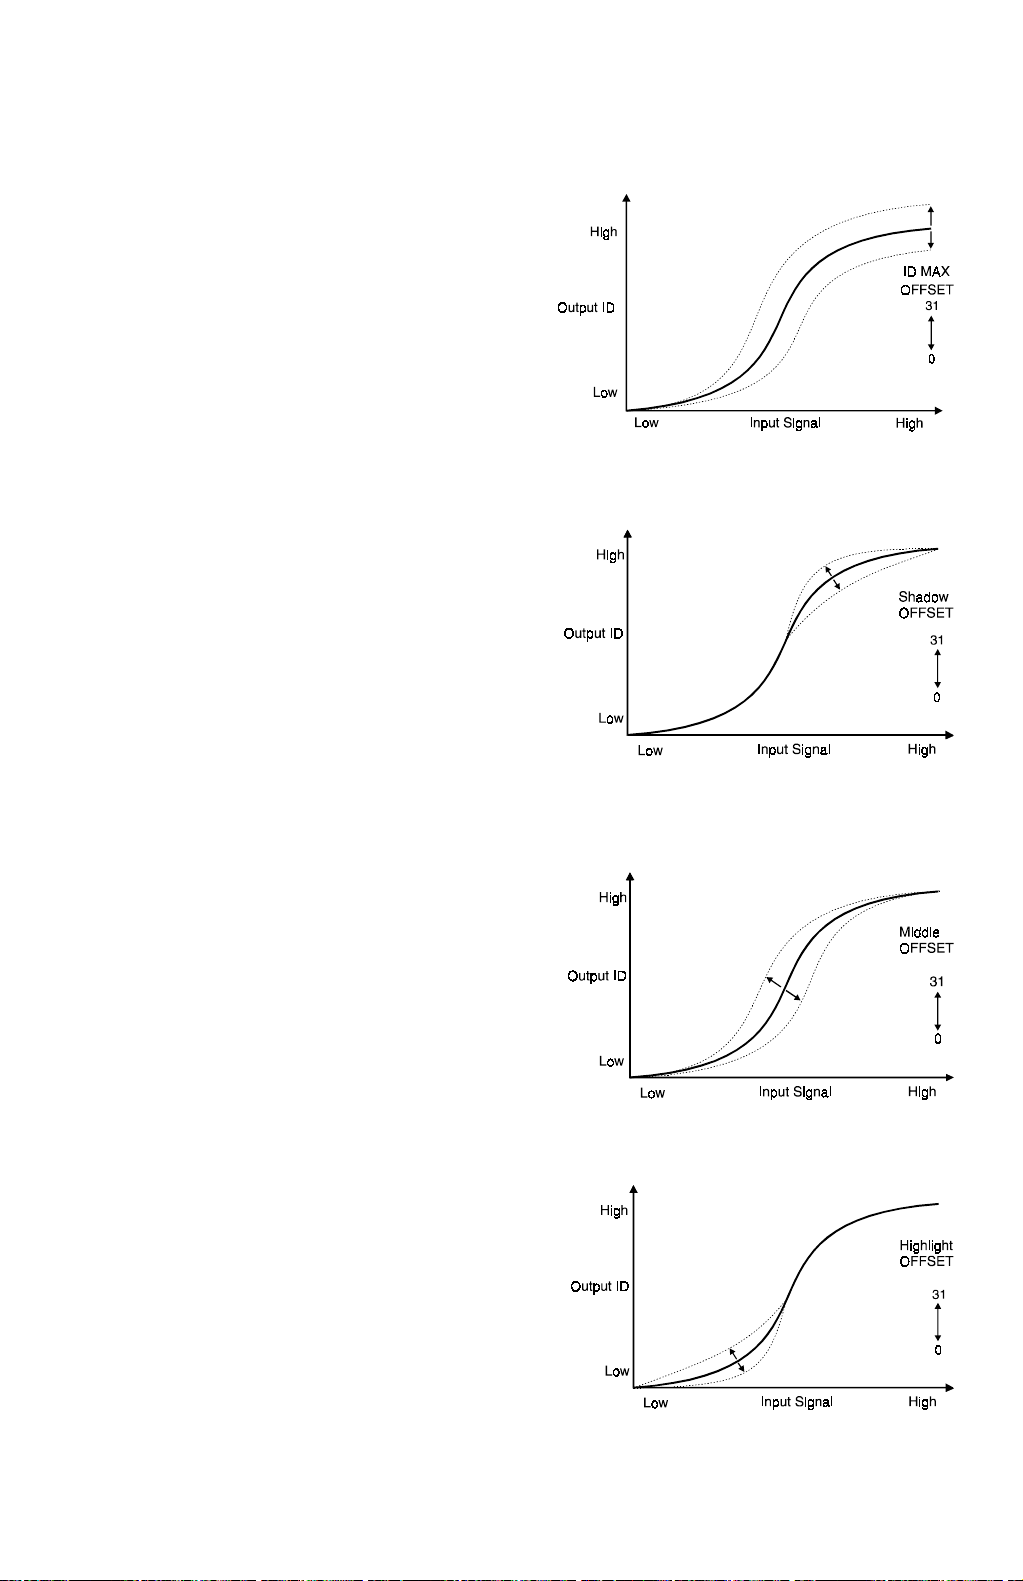
IMAGE PROCESSING 30 March, 1999
ID max.
This mode adjusts the total image density
level as shown in figure 3.
Shadow (High ID)
The High ID mode adjusts the image
density between Level 6 and Level 9 of the
color gradation scale on the C-4 test chart
(figure 4).
Middle (Middle ID)
The Middle ID mode adjusts the image
density between Level 3 and Level 7 of the
color gradation scale on the C-4 test chart
(figure 5).
[Fig. 3]
[Fig. 4]
A269D091.WMF
A269D092.WMF
Highlight (Low ID)
The Low ID mode adjusts the image density
between Level 2 and Level 5 of the color
gradation scale on the C-4 test chart (figure
6).
2-50
[Fig. 5]
[Fig. 6]
A269D093.WMF
A269D094.WMF
Page 95
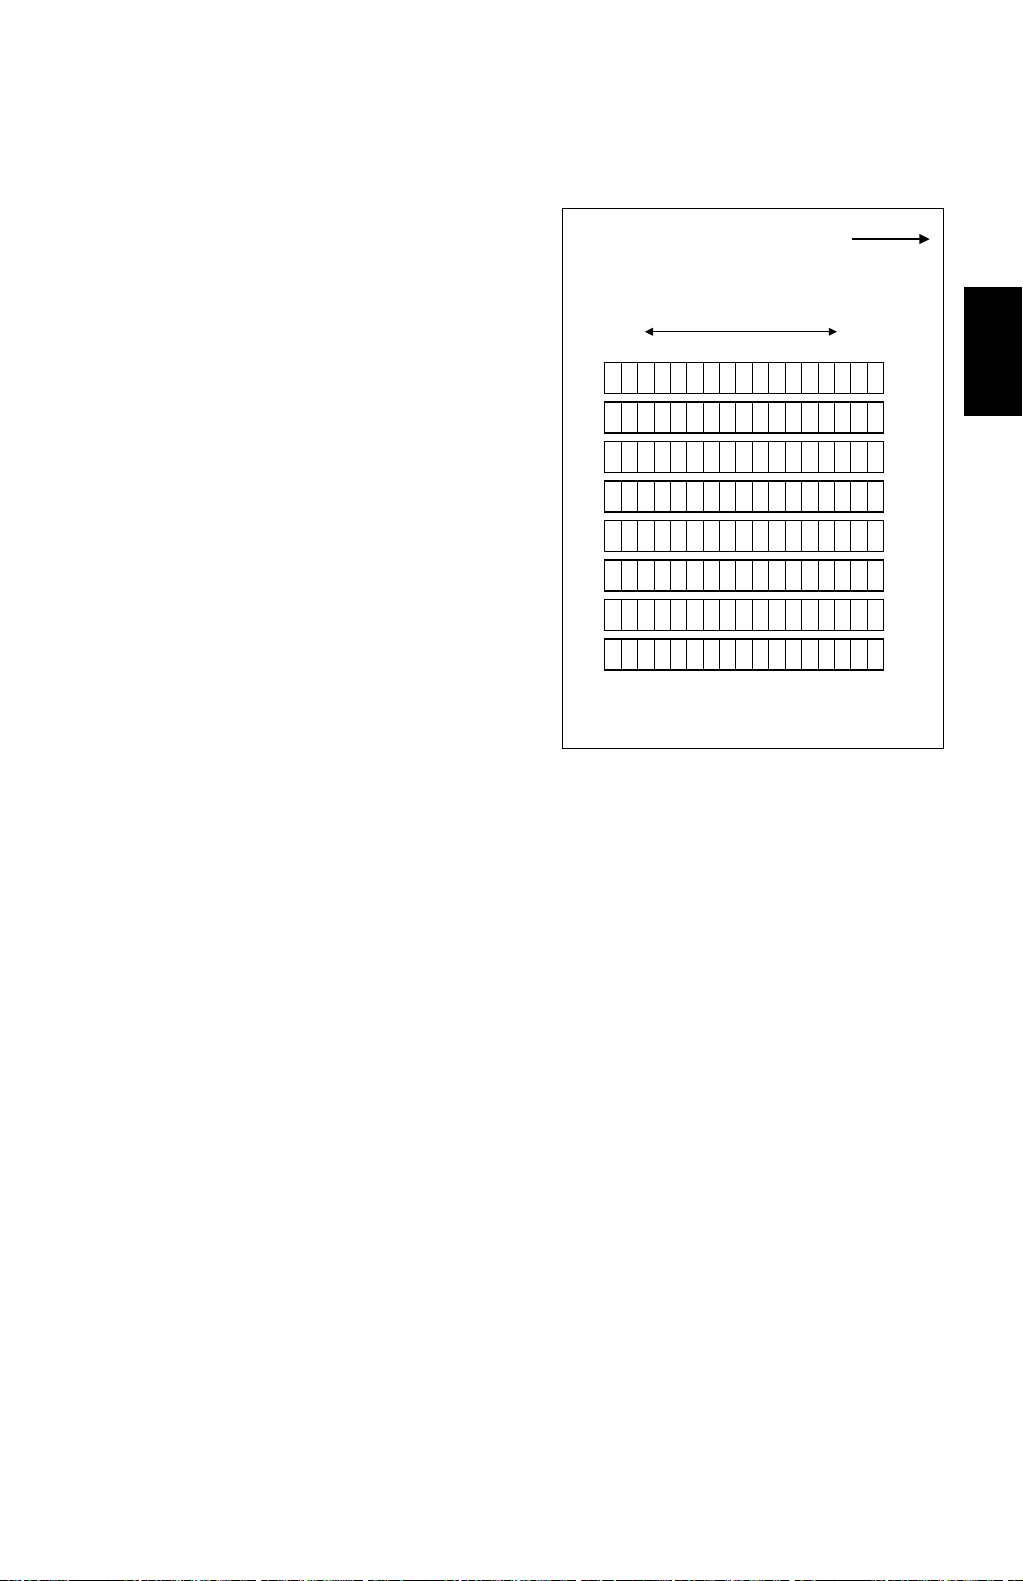
30 March, 1999 IMAGE PROCESSING
Auto Color Calibration Test Pattern
The copier firmware has a test patt ern
that has eight 17-step gradation scales
for each color (KCMY), including
background white, for Text and Photo
modes.
Dark Light
Auto color calibration
This machine automatically calib rates
the printer gamma (γ) curve when the
K
C
user selects ACC.
M
When ACC is activated, the m achine
prints out an ACC Test Pattern. The
user puts the test pattern on the
exposure glass, then the machine scans
the test pattern. The machine scans
eight lines, one for each color (KCMY) in
text mode, and one for each color in
Y
K
C
M
Y
photo mode.
Detailed
Descriptions
The machine corrects the printer gamma
by comparing the ideal settings with the
current image density. Then the
machine combines the corrected
A269D095.WMF
gamma curve with the High, Middle, and
Low ID values currently in memory
(these are not reset to the defaults first,
as in some earlier models)
The machine the calculates the ID max (amplitude of the gamma curve) based on
data from the ACC scan.
The corrected printer gamma curves can be adjusted further using SP modes
(SP4-910 to SP4-926).
ACC tar g et:
This copier allows adjustments in 10 steps on the target base γ to be used during
auto color correction.
(SP4-501-001 through SP4-501-008: For the copier)
(SP4-502-001 through SP4-502-008: For the printer)
Default: 5
Adjustable range: 0 to 10
NOTE:
The adjustable range is 0 to 50. However, the effective range is 0 to 10.
Even when it is set to 50, it is the same level for 10.
2-51
Page 96

IMAGE PROCESSING 30 March, 1999
Dither Processing
This copier provides 256 gradations by using 1 dot by 1 dot and 2 dots by 2 dots
dither patterns in each of the text and photo modes, whereby ensuring high image
quality. In the printer mode, the copier uses a different table for photo mode
dithering from that for the copier.
A269D096.WMF
A269D097.WMF
Area Manipulation Functions
In an edit model, the image data in the areas that are specified from the operation
panel and that are subject to pre-scanning are encoded in the area processor
section and sent to the image processor section together with the main scan image
data. The data in each area (20 areas maximum) is subject to color correction in
the "color calibration 2" step of the IPU board.
The edit version of the copiers is also equipped with a composition capability.
CPU
The copier incorporates a 32-bit CPU to process and control the timing of the data
in the scanner and IPU sections.
IPU Board Test
The IPU consists of some LSI chips, DRAM, SRAM, and a controller block that
controls these chips and RAM. They are interconnected in a way that allows IPU
board tests to be run from SP mode (SP4-904-001 and SP4-094-002) and check
for IPU malfunctions (ASIC diagnostics on the shading and subsequent stages).
2-52
Page 97
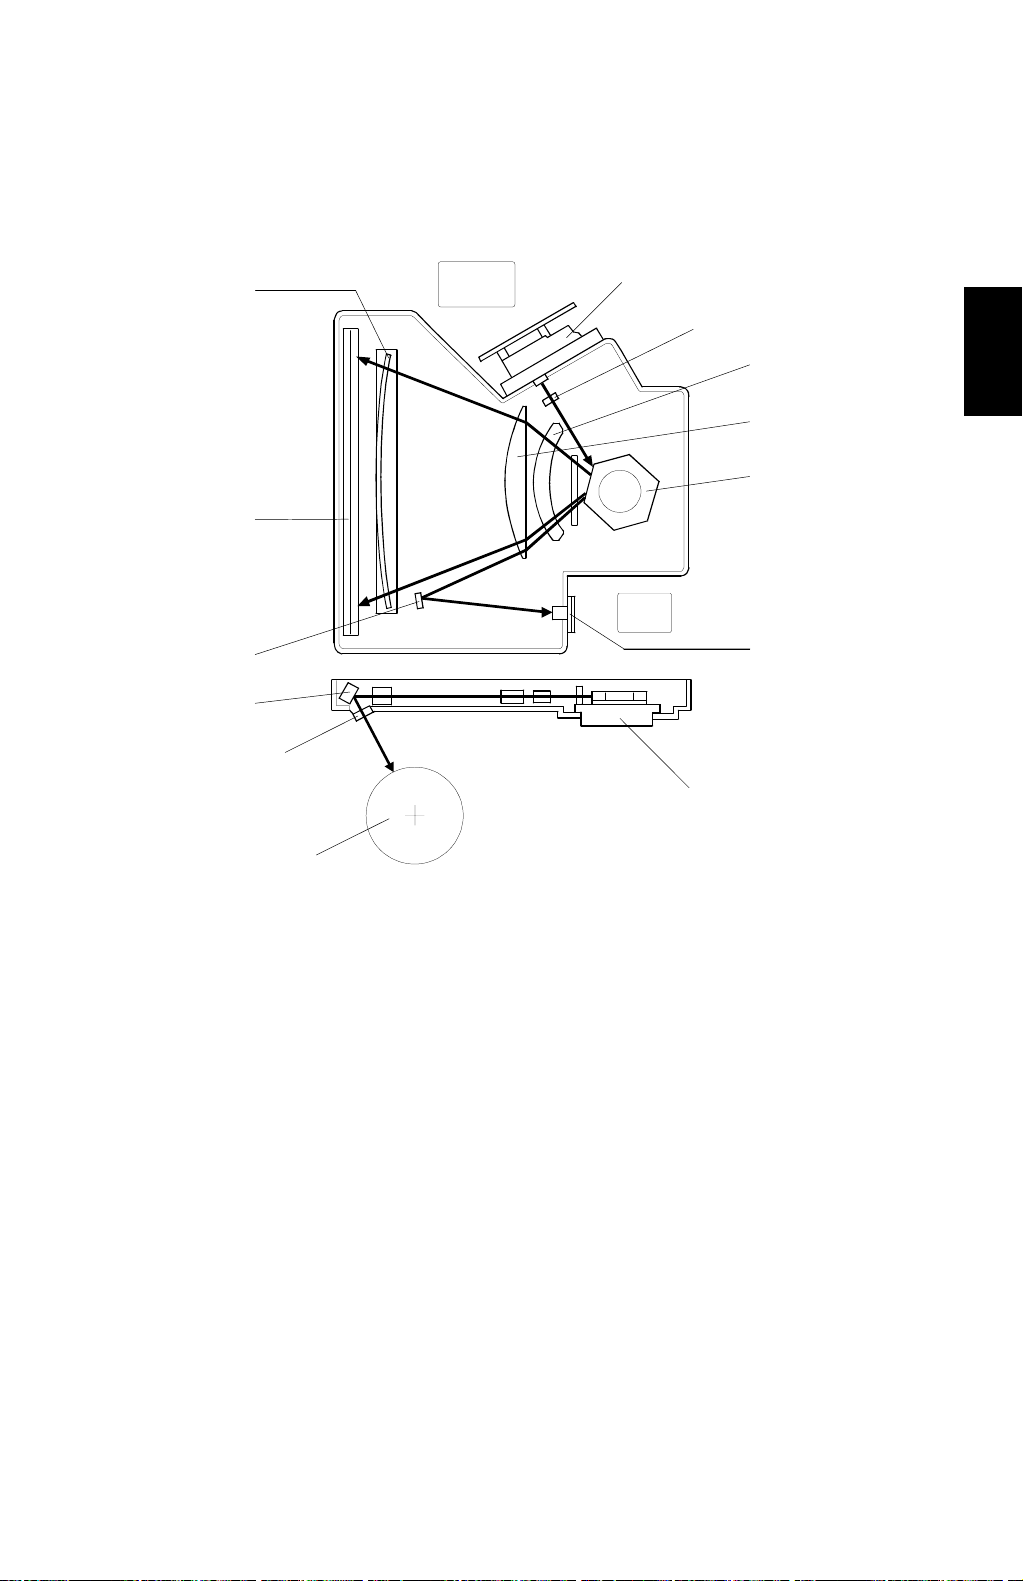
30 March, 1999 LASER EXPOSURE
2.5 LASER EXPOSURE
2.5.1 OVERVIEW
14
12
13
12
11
1
2
3
4
Detailed
Descriptions
5
6
7
8
9
10
A269D102.WMF
1. LD control board
2. LD unit
3. Cylindrical lens
4. 1st fθ lens
5. 2nd fθ lens
6. Polygon mirror
7. Polygon motor drive board
8. Laser synchronization detector
9. Polygon mirror motor
10. OPC drum
11. Toner shield glass
12. Drum mirror
13. Laser synchronization detector mirror
14. BTL
This machine uses laser diodes to produc e elec trostatic images on an OPC drum.
The laser diode unit converts image data from the LD main control board into laser
pulses, and the optical components direct these pulses to the drum.
For main scanning, this copier uses a polygon mirror that rotates at 23,622 rpm.
The drum rotation (with a peripheral velocity of 200 mm/s) controls sub-scanning.
The copier achieves 256 gradations using a combination of laser power modulation
(PM) and pulse width modulation (PWM). The laser diode unit is a multi-beam type
with two laser diodes and supports laser exposure at 600 dpi.
2-53
Page 98
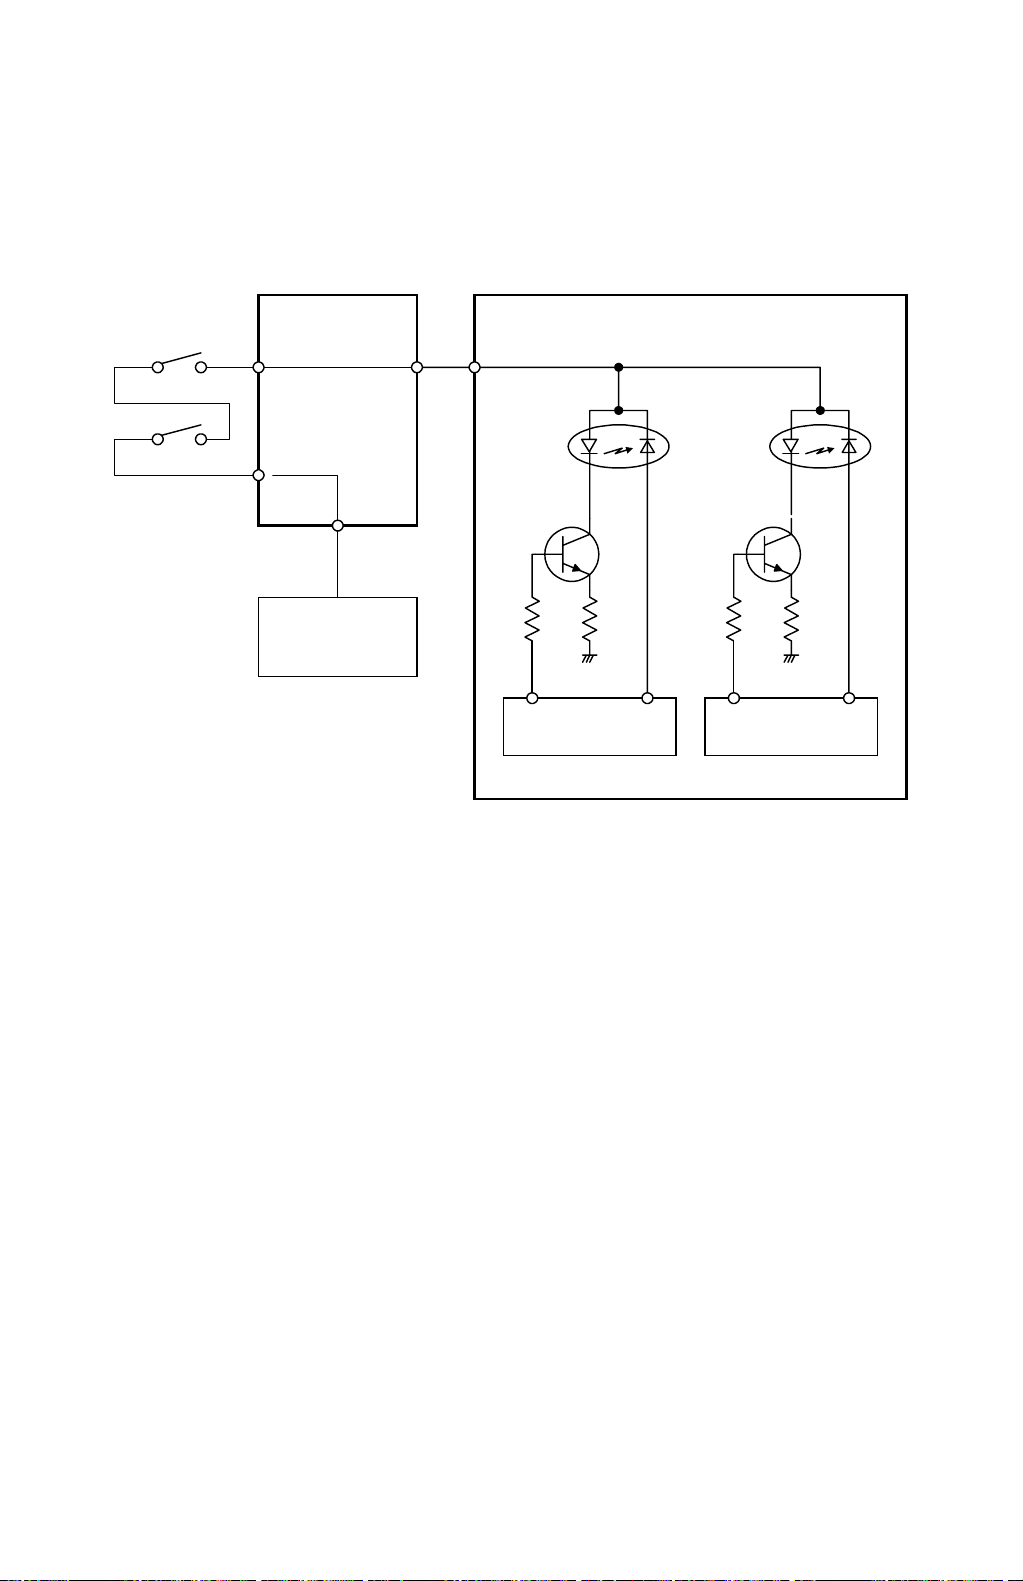
LASER EXPOSURE 30 March, 1999
2.5.2 LD UNIT
LD Safety Switch
Front Door
Safety SW
Video Control Board
CN601-4
CN603-23 ~ 27
CN601-3
CN600-1
+5V
PSU
LDDR
CN650-24 ~ 28
LD2 LD1
LD LDPD PD
LD Drive ICLD Drive IC
A269D250.WMF
The front door has two safety switches that ensure that the laser beam does not
accidentally switch on during servicing, while the front door is open. These safety
switches are installed in series on the 5V line between the PSU and the LD unit.
When the front door is opened, the door switches cut off the 5V line to the LD unit.
2-54
Page 99
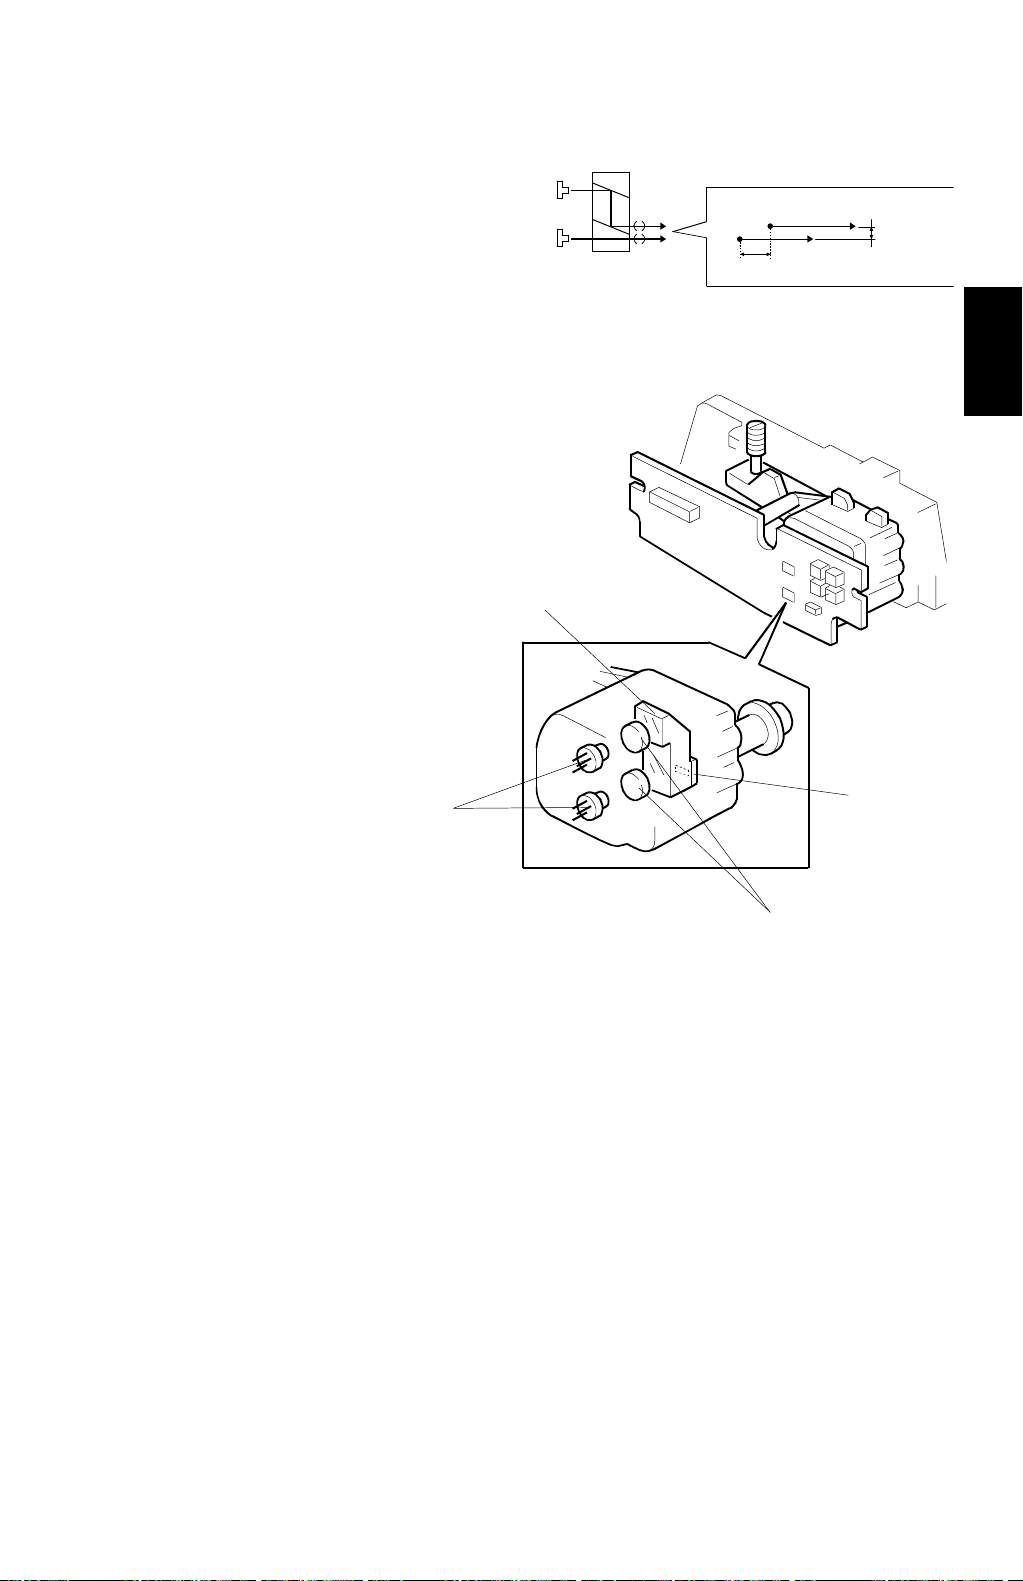
30 March, 1999 LASER EXPOSURE
LD Unit Configuration
The LD unit is a 2LD multi-beam
type. It consists of two laser diodes
[A], two collimate lenses [B], two
apertures [C], a composite prism [D],
and an LD control board [E]. The
beams from the laser diodes are
converted to parallel beams by the
collimate lenses. The apertures then
form the laser beams to the diameter
necessary for writing on the drum. The
two laser beams are output in parallel
42.3 µm apart through the composite
prism. Two lines are written
simultaneously on the drum. This
provides printing at 600 dpi (sub-scan).
The wavelength of the semiconductor
laser diodes is 780 nm and the
maximum output power is 15 mW.
LD2
LD1
[D]
LD1
LD2
2 mm
42.3 µm
A269D103.WMF
Detailed
Descriptions
[A]
[C]
A269D512.WMF
[B]
2-55
Page 100
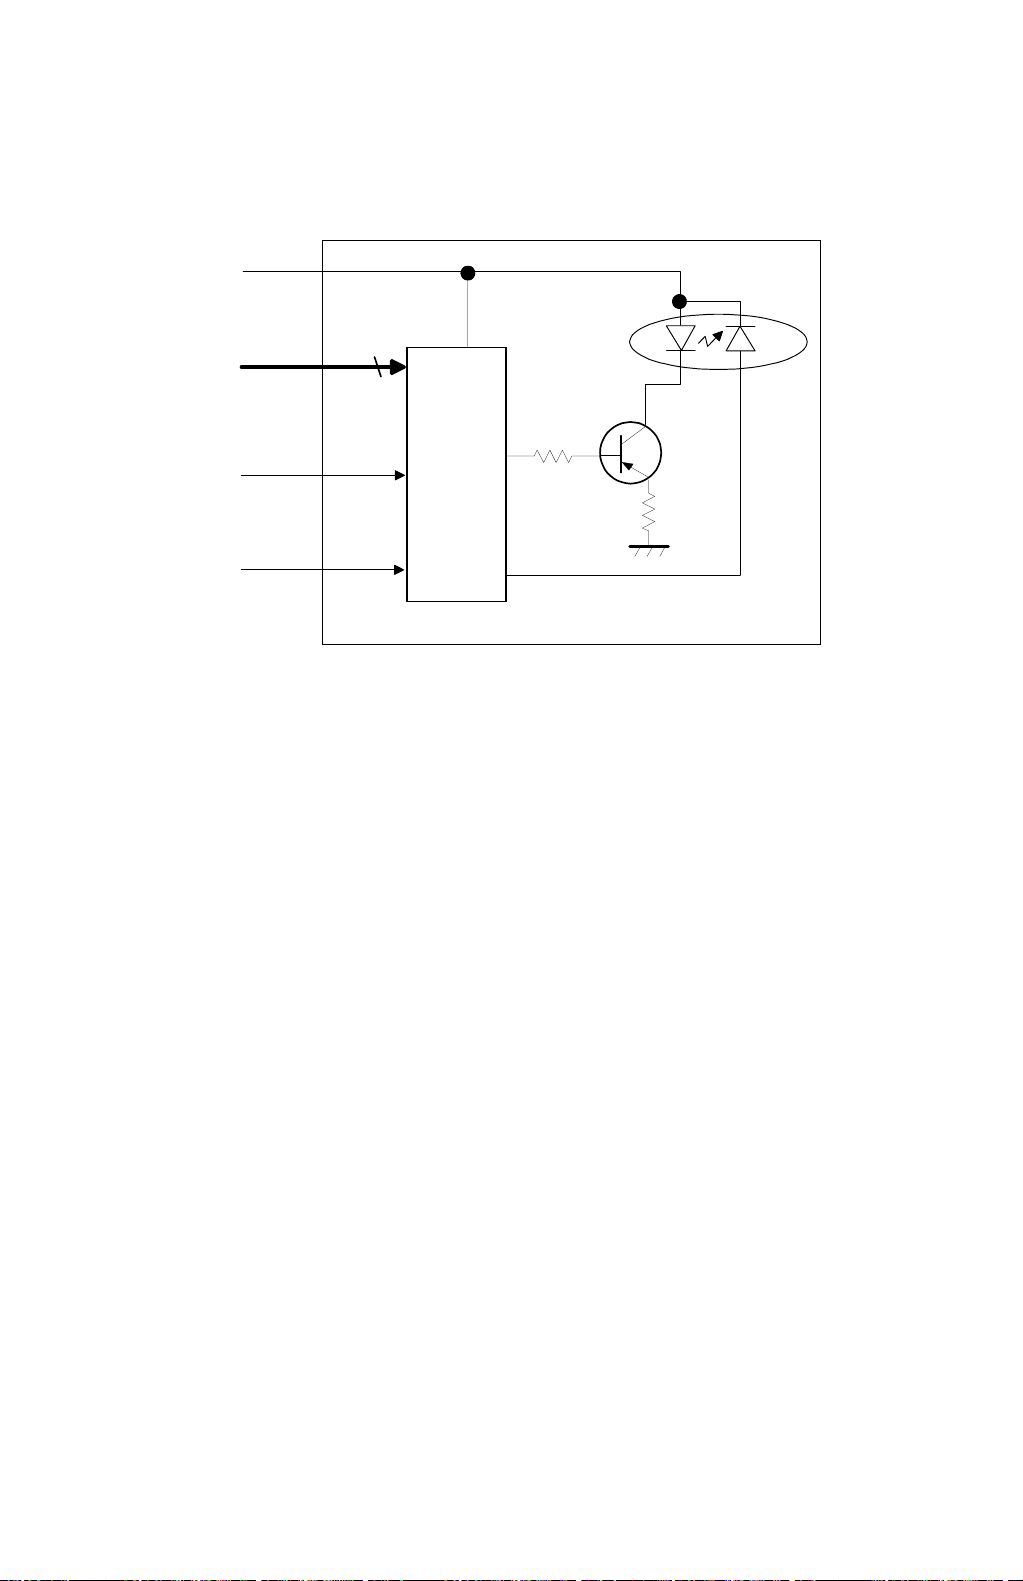
LASER EXPOSURE 30 March, 1999
Auto Power Control (APC)
LD5V
VIDEO
LEVEL
LD OFF
LD
Current
Control
IC
PD
LD Drive Board
A259D501.WMF
Even if a constant electric current is applied to the laser diode, the intensity of the
output light changes with the temperature. The intensity of the output decreases as
the temperature increases.
In order to keep the output level constant, the output light intensity is monitored
through a photodiode (PD) enclosed in the laser diode. The photodiode passes an
electrical current that is proportional to the light intensity. The output is not affected
by temperature, so it faithfully reflects the changes in the LD output, without adding
anything itself.
Just after the main switch is turned on, the current control IC on the LD drive board
excites the laser diode at full power (power level 32) and stores the output of the
photodiode as a reference. The current control IC monitors the current passing
through the photodiode. Then it increases or decreases the current to the laser
diode as necessary, comparing it with the reference level. Such auto power control
is done during printing while the laser diode is active.
The laser power level is adjusted on the production line. Do NOT touch the variable
resistors on the LD unit in the field.
2-56
 Loading...