

Page 1

TARGAS-1
Portable Photosynthesis S ystem
Operation Manual
Version 1.02
2018 PP Systems. All Rights Reserved
110 Haverhill Road, Suite 301
Amesbury, MA 01913 U.S.A.
Tel: +1 978-834-0505 Fax : +1 978-834-0545
Email: [email protected] URL: www.ppsystems.com
th
21
February 2018
PP Systems
Page 2

Contents
Welcome ....................................................................................................................................................... 9
User Registration ..................................................................................................................................... 10
Service & Warranty .................................................................................................................................. 10
Contact Information ................................................................................................................................. 10
Unpacking and Storage of Your Equipment ............................................................................................ 11
Storage – Transport Case ................................................................................................................ 11
Powering up the TARGAS-1 for the First Time ....................................................................................... 11
Data Storage ........................................................................................................................................... 12
Technical Specification ............................................................................................................................... 12
TARGAS-1 CO2/H2O Gas Analyzer (Main Console) ............................................................................... 12
PLC5 Leaf Cuvette .................................................................................................................................. 13
Light Unit (Optional) ................................................................................................................................. 14
Summary of System Design ........................................................................................................................ 14
Overview and Theory .............................................................................................................................. 14
System Components for Measurement of Leaf Gas Exchange.................................................................. 16
TARGAS-1 CO2/H2O Gas Analyzer ........................................................................................................ 16
PLC5 Leaf Cuvette .................................................................................................................................. 17
Light Unit (Optional) .......................................................................................................................... 17
External Sensors/Chambers for Use with TARGAS-1 ............................................................................ 17
Quantum Sensor ............................................................................................................................... 17
TRP-3 Temperature/PAR Probe ....................................................................................................... 18
SRC-2 Soil Respiration Ch amber ..................................................................................................... 18
CPY-5 Canopy Assimilation Chamber .............................................................................................. 19
STP-2 Soil Temperature Probe ........................................................................................................ 19
Getting Familiar with the TARGAS-1 Portable Photosynthesis System ..................................................... 20
TARGAS-1 Portable CO2/H2O Gas Analyzer (Main Console) ................................................................ 20
Back of TARGAS-1 .................................................................................................................................. 22
PLC5 Leaf Cuvette .................................................................................................................................. 23
Light Unit (Optional) .......................................................................................................................... 23
Quick Start................................................................................................................................................... 24
Leaf Gas Exchange Measurements – Recom m ended Set-up ................................................................... 26
When should I record a measurement? .................................................................................................. 26
Schematic of TARGAS-1 Portable Photosynthesis System Air Supply System ..................................... 27
Routine System Checks Before Starting ..................................................................................................... 28
Page 3

System Power ............................................................................................................................................. 29
Battery Specification ................................................................................................................................ 29
Power Su pp l y/AC Ad apter R ati ng: .......................................................................................................... 29
TARGAS-1 Main Console Components ...................................................................................................... 30
Touch Display .......................................................................................................................................... 30
Navigation using the Touch Display ................................................................................................. 30
Power S w it ch ........................................................................................................................................... 30
Ext Power Jack ........................................................................................................................................ 31
Ext Power LED ........................................................................................................................................ 31
Probe Ports .............................................................................................................................................. 31
PLC Gas Ports ......................................................................................................................................... 31
Gas Ports ................................................................................................................................................. 32
Flow Rate .......................................................................................................................................... 32
USB Flash Drive Port .............................................................................................................................. 32
USB PC Port ............................................................................................................................................ 32
Absorber Columns ................................................................................................................................... 33
Auto-Zero Column ............................................................................................................................ 33
Molecular Sieve ................................................................................................................................ 33
Molecular Sieve Repackaging .......................................................................................................... 34
CO2 & H2O Control Columns ............................................................................................................ 34
Soda Lime ......................................................................................................................................... 34
Drierite .............................................................................................................................................. 35
Foam Filters ...................................................................................................................................... 36
Absorber Filters ................................................................................................................................ 36
“O” Rings .......................................................................................................................................... 36
TARGAS-1 Menu Overview (Flow Chart) ................................................................................................... 37
Splash Screen ............................................................................................................................................. 37
General Screen Info .................................................................................................................................... 39
Measure Screen Info ............................................................................................................................... 39
Parameters in Parenthesis ...................................................................................................................... 39
Heartbeat and Display Update Rate: ....................................................................................................... 40
Data Entry Screen ................................................................................................................................... 40
Measurement Mode .................................................................................................................................... 41
Measure Screen 1 ................................................................................................................................... 41
Measure Screen 2 ................................................................................................................................... 43
Page 4

Graphic Display Screen ........................................................................................................................... 43
Alternative Measurement Screens .............................................................................................................. 45
Diff Mode ................................................................................................................................................. 45
Measure Screen 1 ............................................................................................................................ 45
Measure Screen 2 ............................................................................................................................ 45
Graphic Display Screen .................................................................................................................... 46
Closed or Absolute Mode ........................................................................................................................ 47
Measure Screen 1 ............................................................................................................................ 47
Measure Screen 2 ............................................................................................................................ 47
Graphic Display Screen .................................................................................................................... 48
Direct Link Settings ..................................................................................................................................... 49
CO2r Setting ............................................................................................................................................ 49
H2Or Setting ............................................................................................................................................ 49
PARi Setting ............................................................................................................................................ 50
Flow Setting ............................................................................................................................................. 50
TLeaf Setting ........................................................................................................................................... 51
Area Setting ............................................................................................................................................. 51
Main Menu................................................................................................................................................... 52
Settings .................................................................................................................................................... 52
Settings 1 Menu ....................................................................................................................................... 52
Device Mode Settings ....................................................................................................................... 53
RB Setting ......................................................................................................................................... 54
RS Factor Setting ............................................................................................................................. 55
Zero Settings .................................................................................................................................... 55
Graph Setting .................................................................................................................................... 57
Reset Zero Absorber ........................................................................................................................ 57
Settings 2 Menu ....................................................................................................................................... 58
Alarm Sound Setting ......................................................................................................................... 58
Averaging Setting ............................................................................................................................. 59
Interval Settings ................................................................................................................................ 59
TARGAS ID Setting .......................................................................................................................... 60
Settings 3 Menu ....................................................................................................................................... 60
Probe Port Settings ........................................................................................................................... 61
Ref On Time Setting ......................................................................................................................... 62
An On Time Setting .......................................................................................................................... 62
Page 5

Alarm Settings .................................................................................................................................. 63
Sample Flow Setting ......................................................................................................................... 63
Settings 4 Menu ....................................................................................................................................... 64
Host Port Setting ............................................................................................................................... 64
Reset WiFi Settings .......................................................................................................................... 65
WiFi Power Setting ........................................................................................................................... 65
Set Clock Settings ............................................................................................................................ 66
Default Settings ................................................................................................................................ 66
Ship Mode Settings ........................................................................................................................... 67
Processes.................................................................................................................................................... 69
SRC (Soil Respiration Chamber) Process .............................................................................................. 69
Connecting the SRC-2 Soil Respiration Chamber to the TARGAS-1 .............................................. 69
SRC – Start Process (Step 1) ........................................................................................................... 70
SRC – Volume and Area Settings (Step 2) ...................................................................................... 70
SRC – Termination Settings (Step 3) ............................................................................................... 71
SRC – Other Settings (Step 4) ......................................................................................................... 71
SRC Flushing (Step 5) ...................................................................................................................... 72
SRC – Start Measuring (Step 6) ....................................................................................................... 72
Data Plot Screen (Step 7) ................................................................................................................. 73
For more information on the theory and calculation of soil respiration/canopy assimilation, please
refer to Mass Flow ............................................................................................................................ 74
Transpiration ..................................................................................................................................... 74
Leaf Temperature ............................................................................................................................. 75
Saturation Vapor Pressure ............................................................................................................... 76
Stomatal Conductance ..................................................................................................................... 76
Net Photosynthesis ........................................................................................................................... 77
Intercellular CO2 Concentration ........................................................................................................ 77
Definition of Symbols and Physical Constants Used in Equations ................................................... 78
References ....................................................................................................................................... 79
CPY (Canopy Assimilation Chamber) Process ....................................................................................... 80
Connecting the CPY-5 Canopy Assimilation Chamber to the TARGAS-1 ....................................... 80
CPY – Start Process (Step 1) ........................................................................................................... 80
CPY – Volume and Area Settings (Step 2)....................................................................................... 81
CPY – Termination Sett ing s (Step 3) ............................................................................................... 82
CPY – Other Settings (Step 4) ......................................................................................................... 82
CPY – Prepare Chamber (Step 5) .................................................................................................... 83
Page 6

CPY – Start Measuring (Step 6) ....................................................................................................... 83
CPY Data Plot Screen (Step 7) ........................................................................................................ 84
For more information on the theory and calculation of soil respiration/canopy assimilation, please
refer to Mass Flow ............................................................................................................................ 85
Transpiration ..................................................................................................................................... 85
Leaf Temperature ............................................................................................................................. 86
Saturation Vapor Pressure ............................................................................................................... 87
Stomatal Conductance ..................................................................................................................... 87
Net Photosynthesis ........................................................................................................................... 88
Intercellular CO2 Concentration ........................................................................................................ 88
Definition of Symbols and Physical Constants Used in Equations ................................................... 89
References ....................................................................................................................................... 90
Custom Process ...................................................................................................................................... 91
Custom – Start Process (Step 1) ...................................................................................................... 91
Custom – Volume and Area Settings (Step 2).................................................................................. 92
Custom – Termination Settings (Step 3) .......................................................................................... 92
Custom – Other Settings (Step 4) .................................................................................................... 93
Custom – Prepare Cham ber (Step 5) ............................................................................................... 94
Custom – Start Measuring (Step 6) .................................................................................................. 94
Custom Data Plot Screen (Step 7) ................................................................................................... 95
Injection Process ..................................................................................................................................... 96
Measurement Principle ..................................................................................................................... 96
Sample Injection Kit (Part No. ACS037) ........................................................................................... 97
Injection – Start Process (Step 1) ..................................................................................................... 98
Injection – Settings (Step 2) ............................................................................................................. 98
Injection – Sample Setting (Step 3) .................................................................................................. 99
Injection - Zero (Step 4) .................................................................................................................... 99
Injection – Baseline Phase ( Step 5) ............................................................................................... 100
Injection – Injection Phas e (Step 6) ................................................................................................ 101
Information Menu ...................................................................................................................................... 102
About ..................................................................................................................................................... 103
Contact .................................................................................................................................................. 103
Calibration ................................................................................................................................................. 104
CO2 Calibration ...................................................................................................................................... 104
Connecting Calibration Gas to the TARGAS-1 .............................................................................. 105
H2O Calibration ...................................................................................................................................... 107
Page 7

Connecting Dew Point Generator to the TARGAS-1 ...................................................................... 108
Touch Calibration .................................................................................................................................. 110
PAR ....................................................................................................................................................... 110
Light Unit Calibration ............................................................................................................................. 112
Diagnostics ................................................................................................................................................ 114
CO2 IRGA Diagnostics .......................................................................................................................... 115
H2O IRGA Diagnostics .......................................................................................................................... 116
Battery Diagnostics ................................................................................................................................ 117
CO2 Zeros Diagnostics ......................................................................................................................... 117
H2O Zeros Diagnostics ......................................................................................................................... 118
Advanced Diagnostics ........................................................................................................................... 118
Data Storage ............................................................................................................................................. 119
USB Flash Drive (Memory Stick) ........................................................................................................... 119
Data Storage Format ............................................................................................................................. 120
Data Storage/Measure Format Table ....................................................................................................... 121
Measure Extension Code Format Tables .............................................................................................. 121
Digital Connection Methods ...................................................................................................................... 125
USB ....................................................................................................................................................... 125
Wireless ................................................................................................................................................. 125
Digital Communication Protocols and Software .................................................................................... 125
TARGAS-1 Command Set ........................................................................................................................ 125
TARGAS-1 Auto Strings ........................................................................................................................ 127
TARGAS-1 Command Set Table .......................................................................................................... 128
Get/Set Parameter Values Table .......................................................................................................... 132
GAS (Gas Analysis Software) ................................................................................................................... 136
Error Messages ......................................................................................................................................... 138
Maintenance .............................................................................................................................................. 140
External Air Filter ................................................................................................................................... 140
Absorber Columns and Desiccants ....................................................................................................... 141
Gray Foam Filters ........................................................................................................................... 141
Absorber Filters .............................................................................................................................. 141
End Cap “O” Rings ......................................................................................................................... 141
Soda Lime ....................................................................................................................................... 141
Drierite ............................................................................................................................................ 142
Molecular Sieve .............................................................................................................................. 142
Page 8

Molecular Sieve Repackaging ........................................................................................................ 143
Foam Filters .................................................................................................................................... 144
Absorber Filters .............................................................................................................................. 144
“O” Rings ........................................................................................................................................ 144
Access to Internal Components ............................................................................................................ 144
Hydrophobic Filters ......................................................................................................................... 145
Battery............................................................................................................................................. 146
Pumps ............................................................................................................................................. 146
Infrared Source ............................................................................................................................... 146
PLC5 Leaf Cuvette ................................................................................................................................ 147
Replacement of leaf gaskets .......................................................................................................... 147
Checking for Leaks Associated with the PLC5 ............................................................................... 148
PLC5 Gas Connector ...................................................................................................................... 149
PAR Sensor .................................................................................................................................... 149
Light Unit ......................................................................................................................................... 149
Appendix 1. Photosynthesis Equations Used in TARGAS-1 .................................................................... 150
Mass Flow ....................................................................................................................................... 150
Transpiration ................................................................................................................................... 150
Leaf Temperature ........................................................................................................................... 151
Saturation Vapor Pressure ............................................................................................................. 152
Stomatal Conductance ................................................................................................................... 152
Net Photosynthesis ......................................................................................................................... 152
Intercellular CO2 Concentration ...................................................................................................... 153
Definition of Symbols and Physical Constants Used in Equations ................................................. 154
References ..................................................................................................................................... 155
Appendix 2. Soil CO2 Efflux and Net Canopy CO2 Flux ........................................................................... 156
Theory .................................................................................................................................................... 156
Correction for water vapor increase on CO2 efflux ......................................................................... 158
FCO2 Units for measurement of Soil CO2 Efflux ............................................................................ 158
References ..................................................................................................................................... 159
Page 9

Welcome
Thank you very much for purchasing our TARGAS-1 Portable Photosynthesis System. Although the
majority of customers will be using this system for measurement of leaf gas exchange using our PLC5
Leaf Cuvette, it can also be used with a number of additional chambers and accessories for
measurement of soil respiration, net canopy flux, PAR, soil temperature, soil moisture and soil
temperature and temperature/PAR. The TARGAS-1 can also be used as a stand-alone CO
analyzer in both absolute and differential mode. We greatly appreciate your business and we look
forward to working with you and your research team for many years to come.
This manual and the information contained within are copyrighted to PP Systems. No part of the
manual may be copied, stored, transmitted or reproduced in any way or by any means including,
but not limited to, photocopying, pho to gra p hy, magnetic or other mechanical or electronic means,
without the prior written consent of PP Systems, Inc.
2/H2
O gas
For applications where failure of this equipment to function correctly would lead to consequential damage,
the equipment must be checked for correct operation and calibration at intervals appropriate to the
Page 10

circumstances. The PP Systems' equipment warranty is limited to replacement of defective components,
and does not cover injury to persons or property or other consequential damage.
This manual is provided to help you install and operate the equipment. Every effort has been made to
ensure that the information it contains is accurate and complete. PP Systems does not accept any liability
for losses or damages resulting from the use of this information.
It is the operator’s responsibility to review this information prior to installation and operation of the
equipment. Otherwise, damage may be caused which is not covered under our normal warranty policy.
PP Systems is a registered trademark of PP Systems, Inc. All brand names are trademarks or registered
trademarks of their respective owners.
User Registration
It is very important that ALL new customers register themselves with us to ensure that our user’s list is
kept up-to-date. If you are a PP Systems’ user, please go to www.ppsystems.com
Registration in the upper left hand corner.
Only REGISTERED users will be allowed access to the protected “Users” section of our web site. This
section will contain important product information including hardware/software updates, application notes,
newsletters, etc.
and click on Customer
Thank you in advance for your cooperation.
Service & Warranty
PP Systems' equipment warranty is limited to replacement of defective components, and does not cover
injury to persons or property or other consequential damage.
The equipment is covered under warranty for one complete year, parts and labor included. This, of
course, is provided that the equipment is properly installed, operated and maintained in accordance with
written instructions (i.e. Operator's Guide).
The warranty excludes all defects in equipment caused by incorrect installation, operation or
maintenance, misuse, alteration, and/or accident.
If for some reason, a fault is covered under warranty, it is the responsibility of the customer to return the
goods to PP Systems or an authorized agent for repair or replacement of the defective part(s).
Prior to returning equipment to PP Systems for service, you must first get in contact with our Service
Manager ([email protected]
) to request a case number for reference and tracking purposes.
Contact Information
PP Systems, Inc.
Page 11
110 Haverhill Rd, Suite 301
Amesbury, MA 01913 USA
Tel: 978-834-0505 Fax: 978-834-0545
Sales: [email protected]
Support: [email protected]
Service: [email protected]
URL: www.ppsystems.com
Unpacking and Storage of Your Equipment
It is extremely important that you check the contents of your equipment immediately upon receipt to
ensure that your order is complete and that it has arrived safely. Please refer to the packing list to show
all items that are included with your order. DO NOT DISCARD ANY OF THE PACKAGING MATERIAL
UNTIL ALL OF THE ITEMS LISTED ARE ACCOUNTED FOR. WE RECOMMEND THAT YOU RETAIN
THE ORIGINAL PACKING FOR FUTURE USE. If you suspect that any of the items listed on the packing
list are not included or damaged, you must contact PP Systems or your authorized distributor
immediately.
Storage – Transport Case
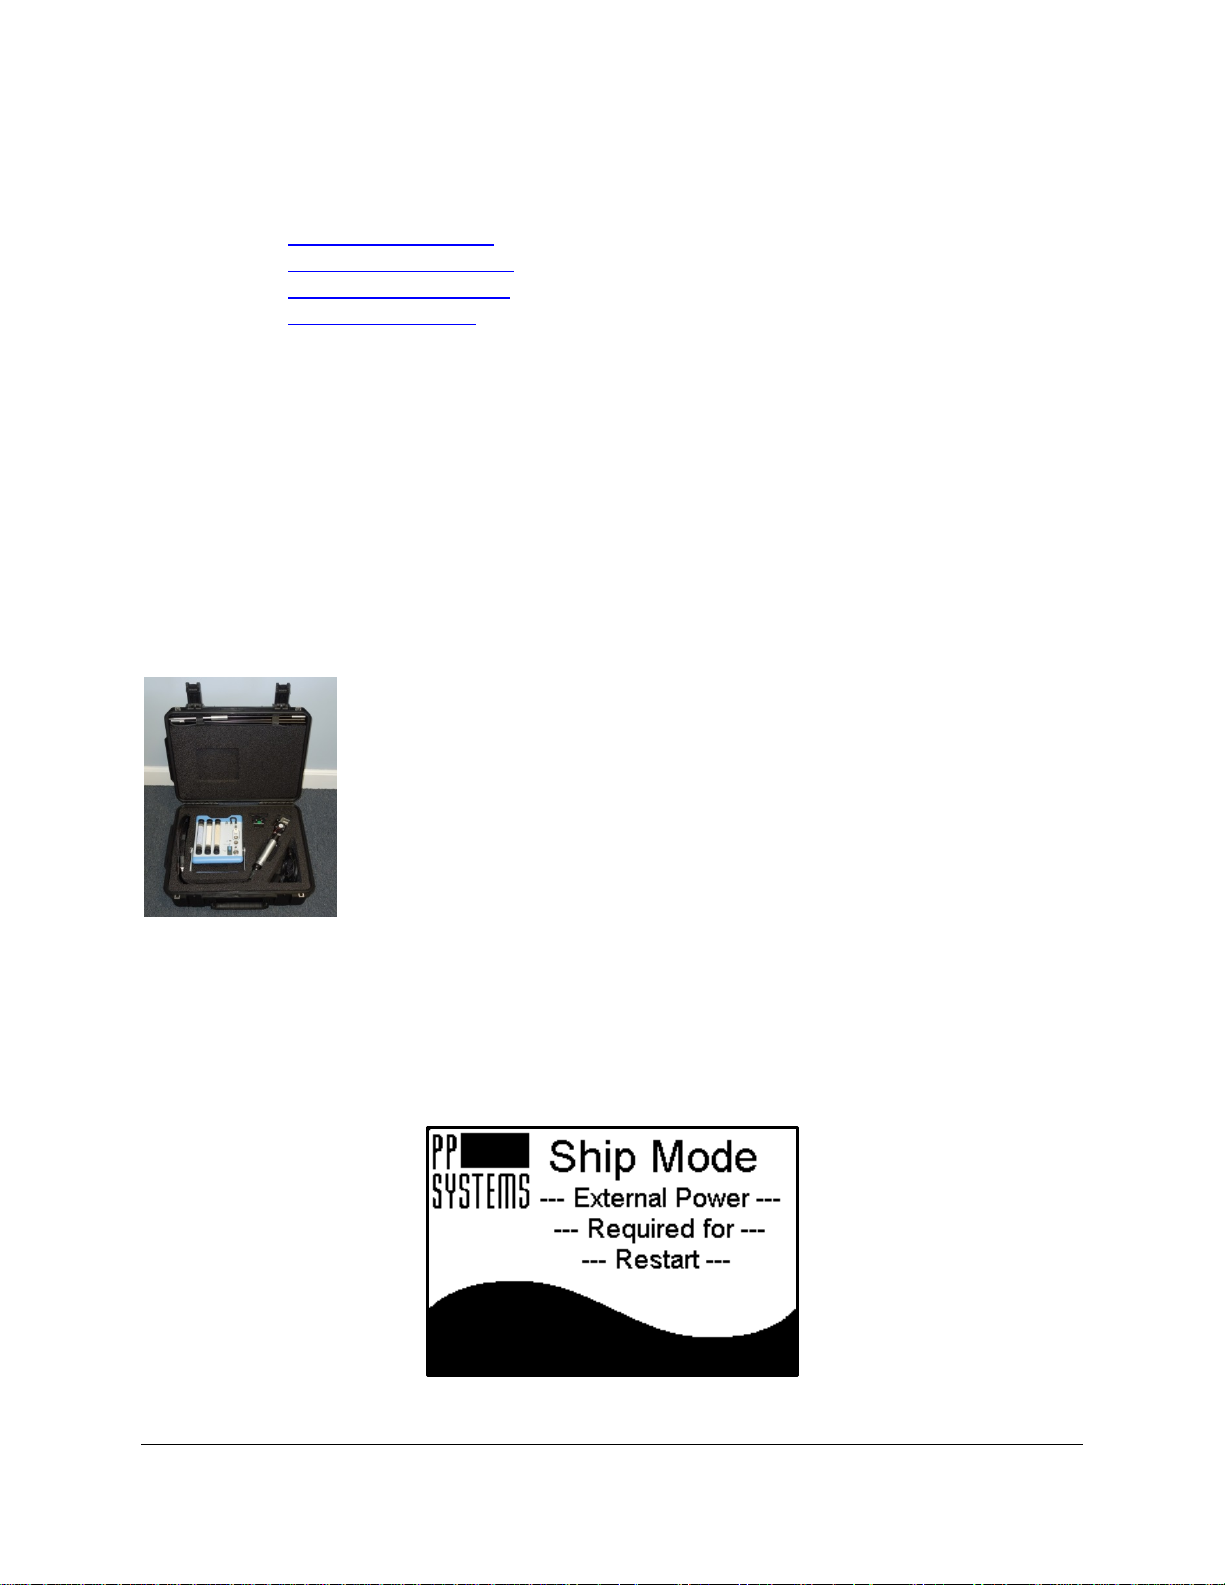
We highly recommend storing your equipment in a safe, dry location. Every
system is supplied with a custom designed transport case which is ideal for both
transporting and storage of your system. The transport case allows for storage
of:
• TARGAS-1 Console
• PLC5 Leaf Cuvette and Light Unit
• Air Supply Intake Unit
• Extra compartment for spares
Powering up the TARGAS-1 for the First Time
When you first receive your new TARGAS-1 from PP Systems you will need to first connect it up to the
external power supply/charger prior to powering up the instrument. To avoid accidental power up during
shipment we put the instrument into “Ship Mode” (see Ship Mode Settings on page 67 for more
information).
Therefore, when you are ready to begin:
Page 12

1. Locate the power supply/charger and power cord inside the packing box.
Analysis Method
Two non-dispersive infrared, configured as an absolute absorptiometer
gas broadening.
CO2 Measurement
Ranges
0 ‐ 10000 μmol mol
‐
1
Precision: 1 μmol mol
‐
H2O Range
0‐75 mb
Precision: 0.1 mb
Pressure
Compensation Range
80-115 kPa
Absolute Accuracy
< 1% of span concentration over the calibrated range but limited by the
accuracy of the calibration mixture.
Differential Accuracy
± 1 μmol mol
‐
1
for CO2 differential up to 50 μmol mol
‐
1
2. Connect the AC power cord to the mains and the barrel connector into the EXT Power socket on
the back of the TARGAS-1.
3. Press the ON/OFF switch to power up the instrument. The power switch should now have an
illuminating blue ring indicating power is on.
4. Allow 10 -15 minutes to achieve warm-up.
You are ready to go!
Data Storage
For convenience and ease it is very important to note that all TARGAS-1 system data is recorded and
saved directly to a USB flash drive (i.e. memory stick or thumb drive). A USB flash drive is included in the
spares kit (Part No. 43034-1) with every new system. Most commercially available flash drives are
compatible with the TARGAS-1.
THEREFORE IT IS IMPERATIVE THAT YOU HAVE A USB FLASH DRIVE WITH YOU AT ALL TIMES
IF YOU WANT TO RECORD DATA WITH YOUR TARGAS-1. OTHERWISE DATA WILL HAVE TO BE
RECORDED MANUALLY.
Technical Specifica ti o n
TARGAS-1 CO2/H2O Gas Analyzer (Main Console)
with microprocessor control of linearization for both CO2 and H2O. All
readings are automatically corrected for temperature, pressure and foreign
1
Page 13

Linearity
< 1% throughout the range
Stability
Auto-zero at regular intervals corrects for sample cell contamination,
source and detector ageing and changes in electronics.
Calibration
User programmable calibration (if required)
Warm-up Time
Approximately 15 minutes
Sampling Rate
10 Hz. Sample data is averaged and output every 1.0 seconds.
Sample Flow Rate
50-200 cc/min. An internal, electronic flow sensor monitors flow rate.
Air Supply Unit
Integral pump for supply of reference air to the leaf cuvette
Range: 200-500 cc/min
CO2 and H2O Control
User adjustable from 0-100% of ambient.
Sampling Pump
Integral pump for sample (analysis) air
Range: 50-200 cc/min
An internal electronic flow sensor monitors flow rate.
Sampling Rate
10 Hz. Sample data is averaged and output ever y 1.0 second.
Digital Output
USB
Gas Flow Rate
200-500 cc/min (280-340 cc/min is optimal). An electronic flow sensor
monitors flow rate.
Terminal Block
10 pin terminal block for system inputs and outputs
Analog Output
0-2.5V (CO2 range selectable)
Digital Output
One mini USB for connection to external PC
Environmental Sensor
Inputs
2 inputs available for use with external chambers and environmental
sensors
Alarm
Visual and audible alarm/warnings
Data Storage (USB)
USB flash drive port for data storage
Mini USB
For connection to external PC
Touch Display
2.7” electronic paper touch display with 264 x 176 pixel resolution
Power
Internal, rechargeable 7.2 V, 8.7Ah Li-Ion battery providing up to 10 hours
continuous operation.
Power Consumption
Warm up: 15W (12V @ 1.2A)
Normal operation: 7.2W (12V @ 0.6A)
Enclosure
Rugged, ergonomic, lightweight aluminum with
polyurethane base.
Gas Connections
Four quick disconnect style fittings for use with 1/8” (.125”) ID tubing
Operating Temperature
0-50 oC, non-condensing. External filtration may be required in dirty
environments.
Dimensions
20 cm (L) x 23 cm (H) 10 cm (W) (Enclosure only)
Weight
2.1 kg
• PP Systems is a registered trademark of PP Systems, Inc.
• All brand names are trademarks or registered trademarks of their respective owners.
Cuvette Materials
The materials of construction are carefully selected to ensure maximum
accuracy and repeatability of gas exchange measurements.
• PP Systems is continuously updating its products and reserves the right to amend product
specifications without notice.
PLC5 Leaf Cuvette
Page 14

Stirring Fan
High speed fan provides efficient mixing of the air inside the leaf chamber
for rapid measurement and minimal boundary layer resistance.
Cuvette Window
18 mm x 25 mm (4.5 cm2)
Air Temperature
Sensor
Precision Thermistor
• Accuracy: ± 0.3 oC at 25 oC
PAR Sensor
Cosine corrected
‐
• Accuracy: 10 μmol m
‐
s
‐
Dimensions
30 cm (L) x 3 cm (Handle Diameter)
Weight
0.7 kg
• PP Systems is a registered trademark of PP Systems, Inc.
• All brand names are trademarks or registered trademarks of their respective owners.
Type
Low power LED light unit (White LEDs) easily mounts to the PLC5 Broad
Leaf Cuvette.
Control Range
0‐2500 μmol m
‐
2
s
‐
1
Dimensions
6 cm (L) x 6 cm (H) x 5 cm (W)
Weight
0.1 kg
• PP Systems is a registered trademark of PP Systems, Inc.
• All brand names are trademarks or registered trademarks of their respective owners.
• Range: 0‐50 oC
(External)
• Response: 400‐700 nm
• Range: 0
3000 μmol m
2
2
1
‐
‐
s
1
• PP Systems is continuously updating its products and reserves the right to amend product
specifications without notice.
Light Unit (Optional)
• PP Systems is continuously updating its products and reserves the right to amend product
specifications without notice.
Summary of System Desi g n
Overview and Theory
The CO2/H2O gas analyzer is a major part of any portable photosynthesis system. The TARGAS-1
Portable Photosynthesis System features a very accurate, precise and robust CO
can be used as part of a powerful leaf gas exchange system (with leaf cuvette) or as a self-contained
instrument for continuous measurement of CO
continuous, unattended air sampling, as the pump introduces fresh sample gas to the essential
component, the IRGA (infrared gas analyzer). It can also be used as an absolute gas analyzer in
“closed” mode for measurement of soil CO
PP Systems as well as for use with commercially available sensors for environmental monitoring
applications (PAR, soil temperature, etc.).
The IRGAs form the core of the TARGAS-1 Portable Photosynthesis System for measurement of both
CO
and H2O. Non-dispersive infra-red (NDIR) refers to the transmission of a broad-band infra-red
2
wavelength from the IRGA source lamps. A single IRGA consists of four basic components:
and H2O in air. Its open-path design allows for
2
efflux and net canopy CO2 flux using chambers supplied by
2
O Gas Analyzer that
2/H2
Page 15
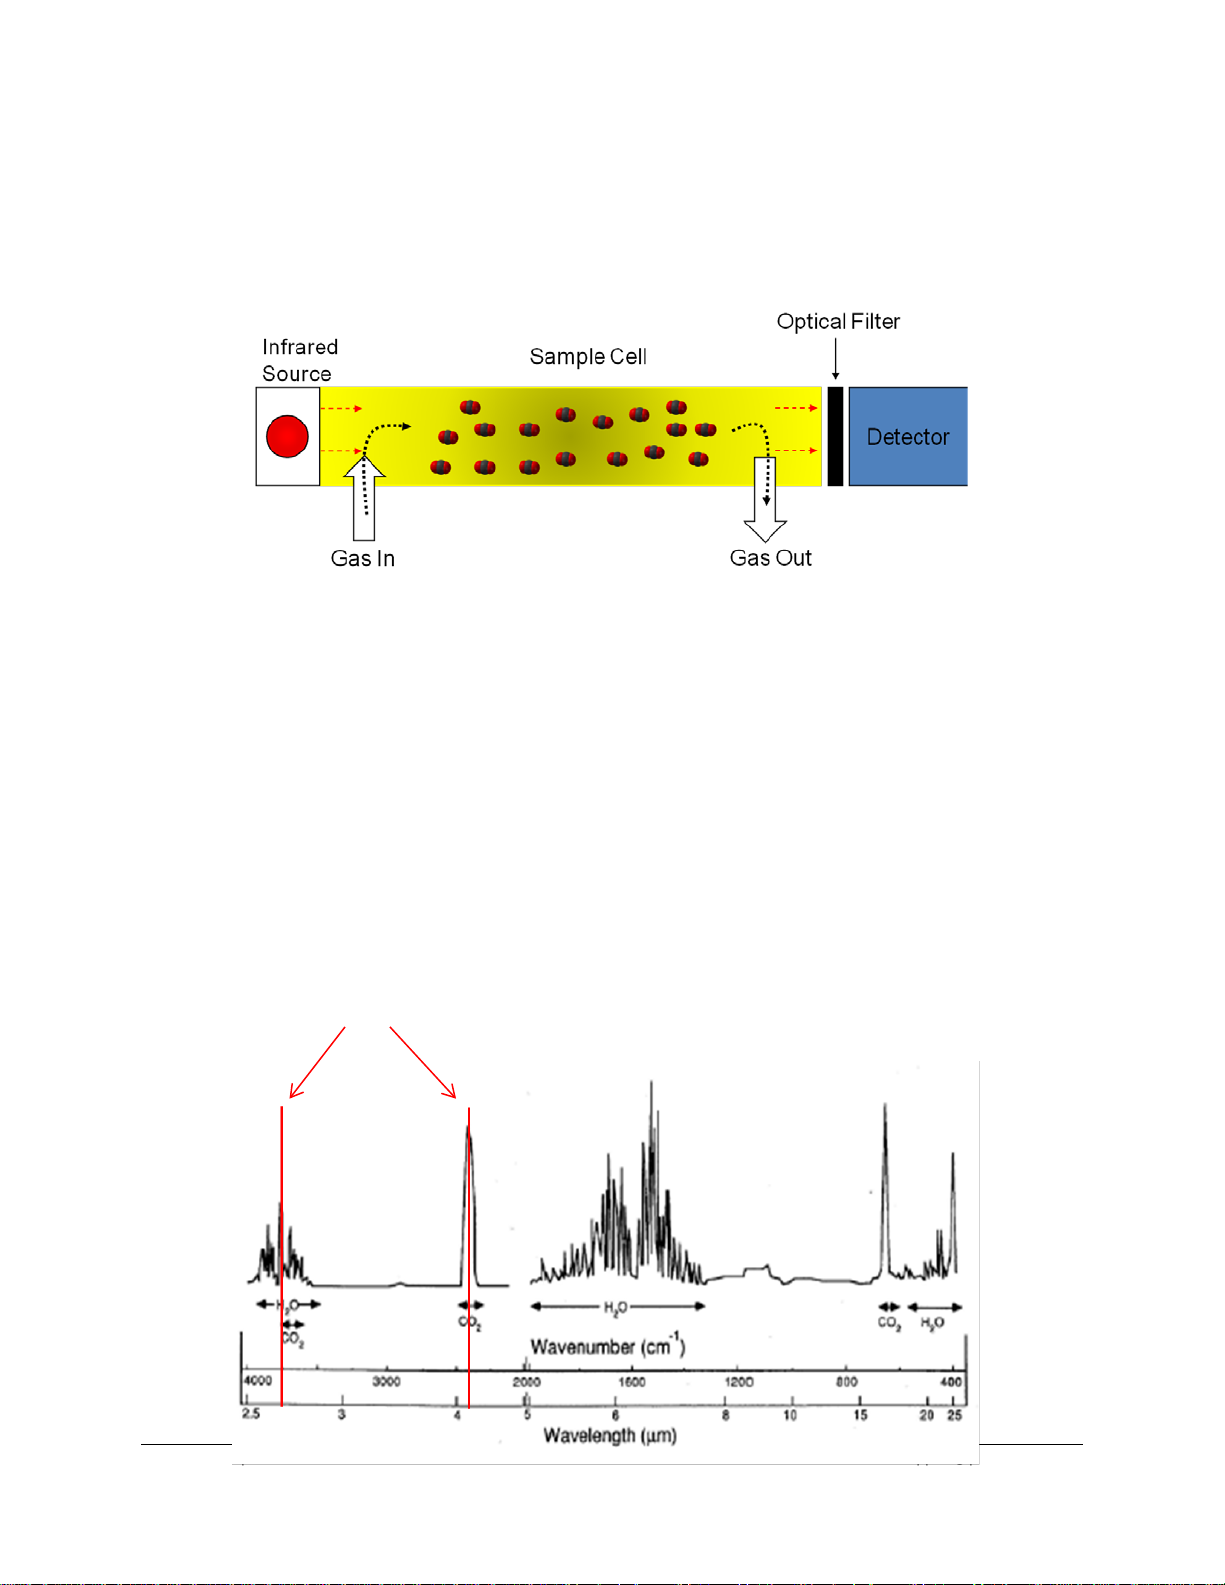
• Infra-red source
The TARGAS-1 detectors are optimized for these
• Sample cell of known path length and volume
• Optical interference filter
• Infra-red detector
The theory itself is quite simple – light from mid-infra-red wavelengths is produced by the source and
pulsed through a gold plated cell. The interference filter narrows the bandwidth of the IR source received
by the detector to the signature wavelength absorbed by the target gas molecule, e.g. CO
H
O cells each employ a unique optical filter. As the sample gas fills the cell, it absorbs IR, and the
2
reduction in IR source strength is measured instantaneously by the detector. The higher the target gas
concentration, the lower the infra-red signal received at the detector, as defined by the Lambert-Beer Law
of Attenuation.
. The CO2 and
2
Both H
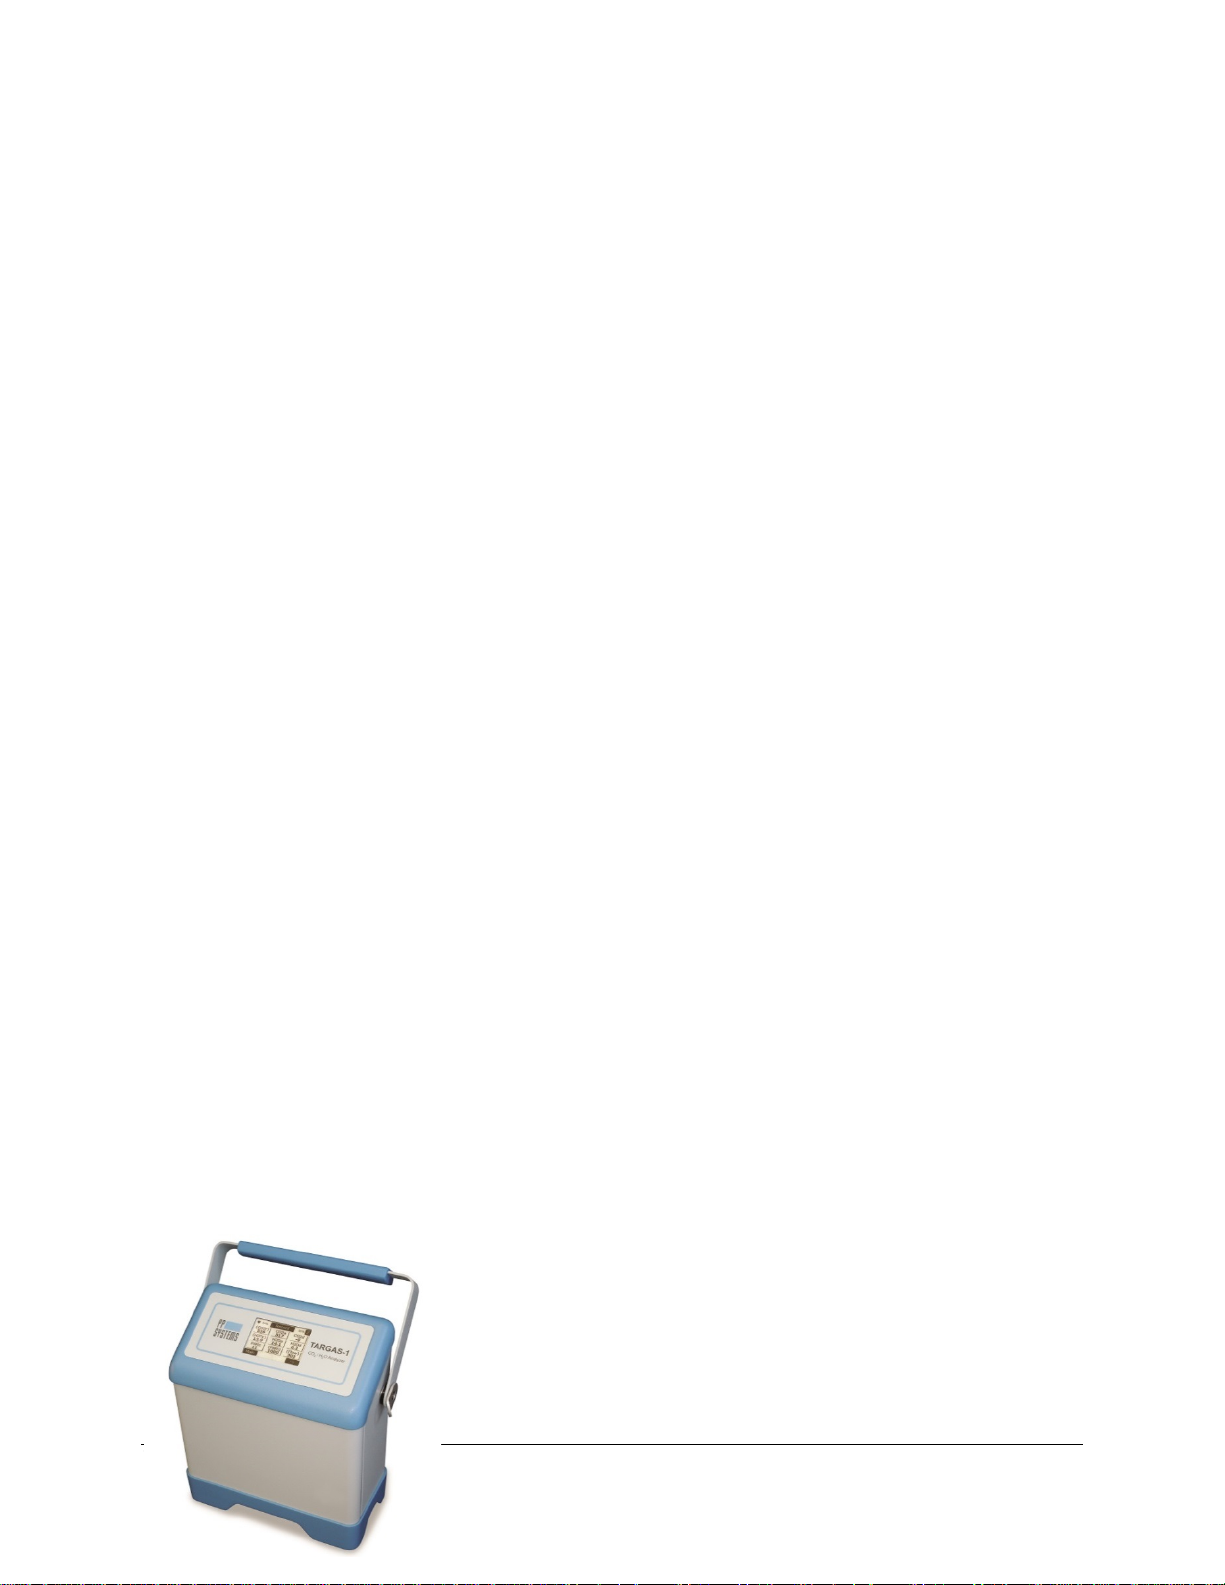
O and CO2 molecules have diverse absorption spectra, so we use two prominent absorption
2
peaks, seen below at 2.60 and 4.26 µm, respectively. The TARGAS-1 electronics could be considered
the fifth component, which processes raw analog-to-digital (A/D) information from the IRGAs detectors,
accurately translating this information into gas concentrations.
wavebands for H2O (2.60 µm) and CO2 (4.26 µm)
TARGAS-1 Operation Manual V. 1.02 15 support@ppsystems.com
Page 16
The gas sample is of course a mixture of gas molecules, and this can present problems in terms of
accurate detection of concentrations of a specific gas, such carbon dioxide. This effect, foreign gas
broadening (FGB), must be corrected to ensure accurate measurement of gas concentrations. With FGB,
the CO
This effect is about 0.1 µmol mol
in infra-red absorption, which is detected as an apparent increase in [CO
but opposite to the dilution effect, and TARGAS-1 automatically corrects these FGB effects.
The TARGAS-1 IRGAs are quite stable owing to their construction, calibration and thermal environment,
but various circumstances can cause apparent changes over time. Some changes may require
recalibration, although one of the strengths of TARGAS-1 is that recalibration is not a routine (annual)
maintenance task. The factory calibration ranges of 0-2000 µmol mol
ideally suited for most typical applications.
The TARGAS-1 features an Auto-Zero function that corrects for nearly all changes that result in
calibration drifts. Auto-Zero minimizes effects on span (gas sensitivity), of sample cell contamination,
lamp ageing, changes in detector sensitivity, amplifier gains and reference voltages. Measurements are
ratioed to the Zero reading before IR absorbance is determined. From the relationship bet ween
absorbance and concentration determined in the factory for each instrument, and the current calibration
factor, the sample concentration is determined.
gas in the IRGA cell is somewhat diluted by the increased air volume induced by water vapor.
2
-1
CO2 mb-1 H2O. The presence of water vapor also causes an increase
]. This is of a similar magnitude,
2
-1
CO2 and 0-75 mb water vapor are
System Components for Measu rement of Leaf Gas Exchange
There are 3 main components that make up the TARGAS-1 Portable Photosynthesis System as follows:
TARGAS-1 CO2/H2O Gas Analyzer
The TARGAS-1 console (2.1 kg) features two, non-dispersive infrared
gas analyzers for CO
aluminum with polyurethane, shock absorbing base making it
extremely robust and reliable for use in harsh environmental
conditions. An internal air supply unit provides accurately controlled
reference air to the leaf cuvette and another pump draws the sample
air (analysis) air to the analyzer. Both pumps are user controlled and
accuracy is ensured by two internal electronic flow sensors. It is
and H2O. It is constructed out of rugged
2
Page 17
powered by a powerful, internal rechargeable Li-Ion battery providing up to 10 hour continuous operation
in the field.
The gas analyzers should not require frequent calibration, although we do recommend frequent checks to
confirm system integrity.
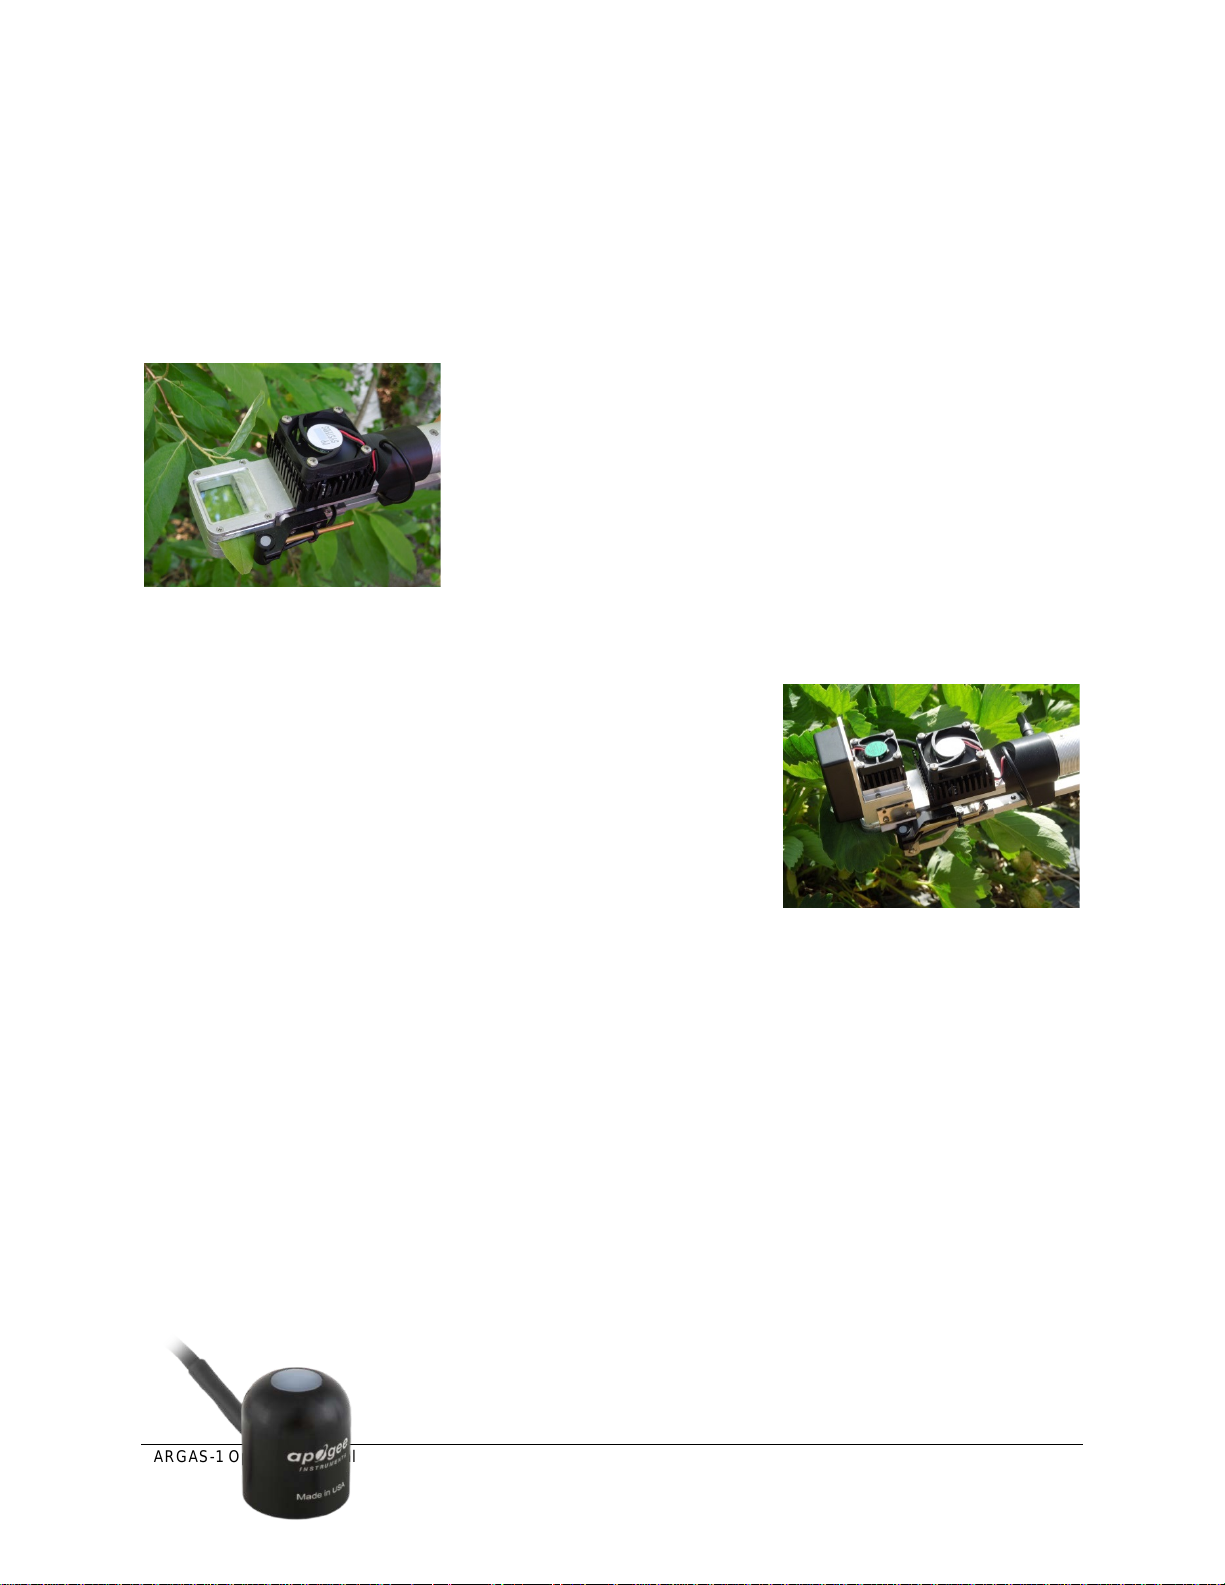
PLC5 Leaf Cuvette
The PLC5 Leaf Cuvette is extremely versatile and light weight (0.7 kg)
making it ideal for measurement on a wide variety of vegetation
including broad leaves, narrow leaves, grasses and small needle
conifers. It includes sensors for measurement of air temperature and
PAR. All cuvette materials are carefully selected to minimize
influences such as infrared radiation, water sorption, CO
leaks. The leaf gaskets provide an air-tight seal without causing
damage to vegetation.
Light Unit (Optional)
The light unit is a low power LED based source for light control (light
response curves) or for use on cloudy days. The light unit clips onto
the PLC5 Leaf Cuvette head and can easily be removed for
measurement under ambient conditions.
effects and
2
• Type: LED (white)
• Measurement Range: 0-2500 µmol m
-2 s-1
External Sensors/Chambers for Use with TARGAS-1
The following sensors/chambers are external to the TARGAS-1 and electrical connection is made to the
Probe Ports (Probe 1 and/or Probe 2) located on the back of the TARGAS-1. See Probe Port Settings on
page 61 for more information for proper connection. Gas connections are made to the “Gas In” and “Gas
Out” ports on the back of the TARGAS-1 as described for each chamber and sensor below.
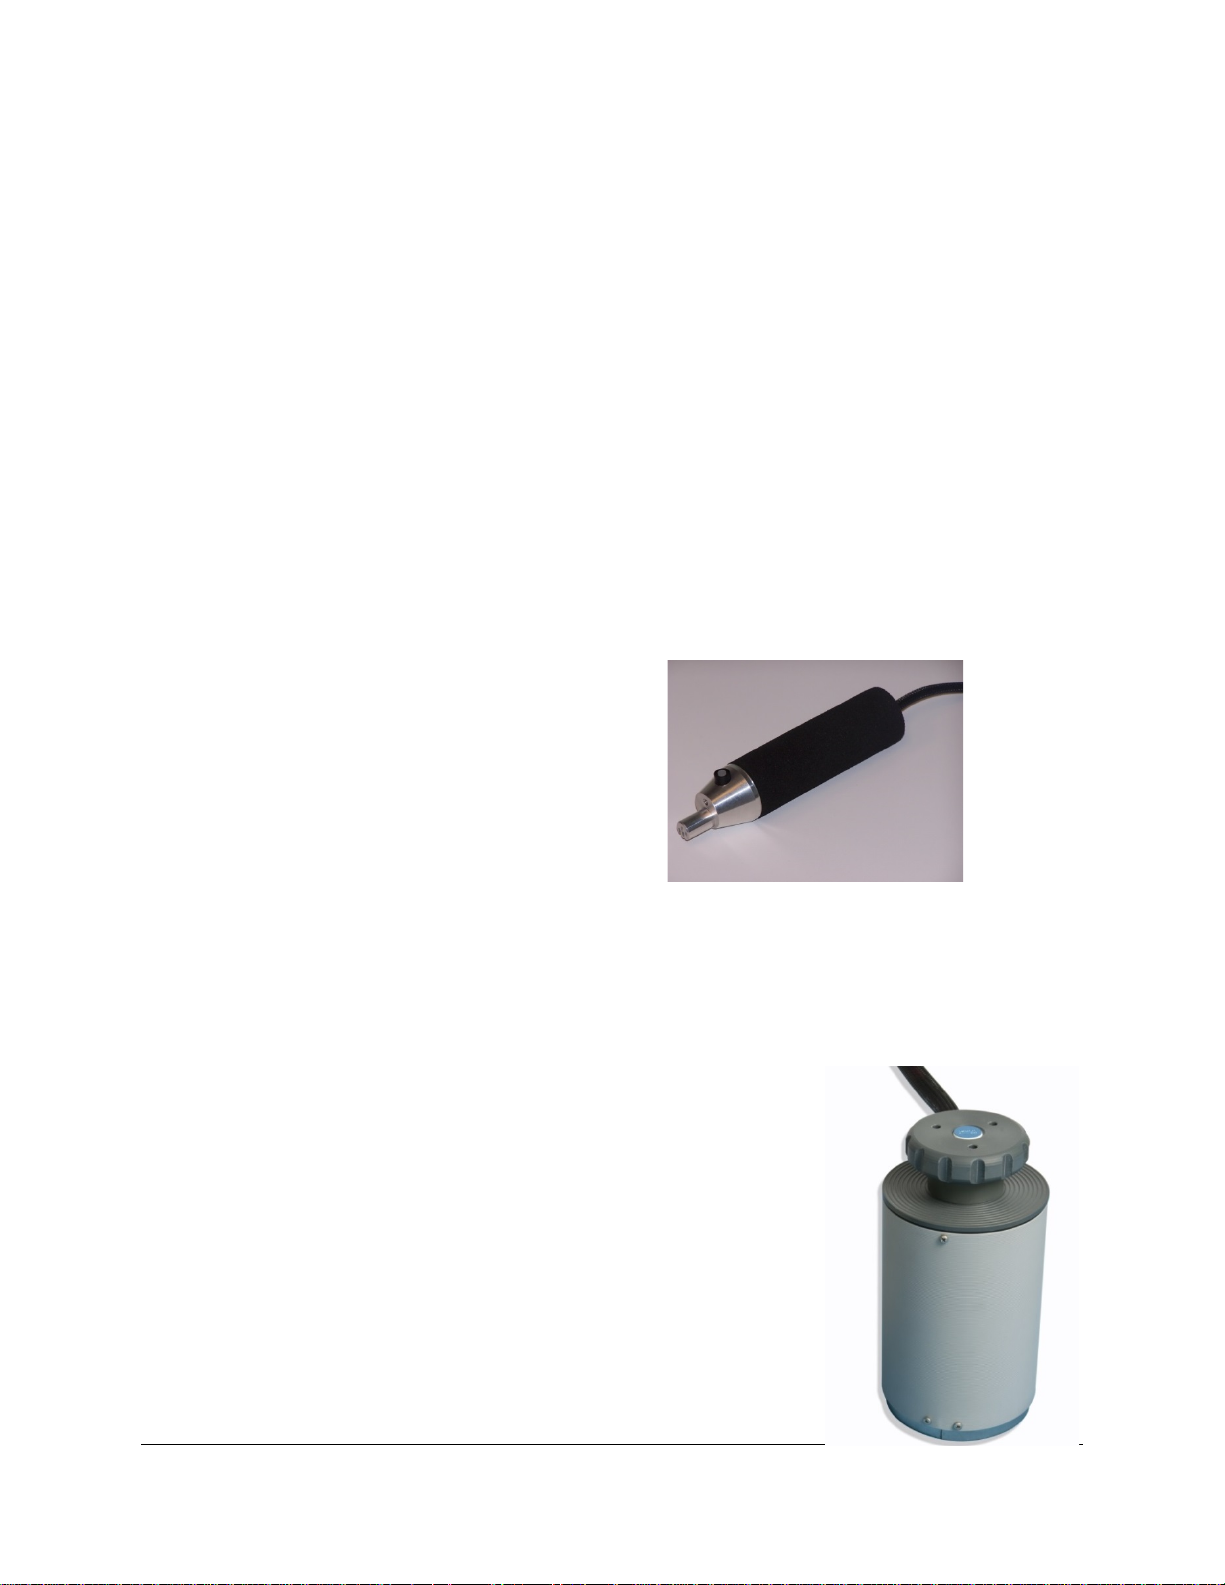
Quantum Sensor
An optional quantum sensor (Apogee Instruments) is available for use with the TARGAS-1 for accurate
measurement of PAR (Photosynthetically Active Radiation) and it is specifically calibrated for use in
sunlight conditions. The sensor housing features a fully potted, dome-shaped head, making the sensor
fully weatherproof for self-cleaning. Never use an abrasive material or cleaner on the diffuser.
• Range: 0-3000 µmol m
• Calibration Uncertainty: ± 5%
-2 s-1
Page 18
• Measurement Repeatability < 1%
• Long Term Drift: < 2% per year
• Cable Length: 5 meters
An optional leveling unit (ACS039) is also available for use with the quantum sensor. We highly
recommend that you mount the sensor on a horizontal surface and that it is level for best results. To
minimize azimuth error, the sensor should be mounted with the cable pointing toward true north in the
northern hemisphere or true south in the southern hemisphere. Azimuth error is typically less than 1%,
but is easy to minimize by proper cable orientation. This sensor connects to Probe Port 1 only.
We recommend recalibration of the quantum sensor every 2 years.
TRP-3 Temperature/PAR Probe
An optional probe can be used with the TARGAS-1 for measurement of temperature and PAR. It consists
of a rugged, aluminum housing with black foam cover. It also includes a standard tripod thread mount for
use with commercially available tripods. The single gas connection for this probe is made to the “Gas In”
port on the TARGAS-1. This sensor can be used on Probe Port 1 or 2.
Temperature Sensor (Precision Thermistor)
• Range: 0-50
• Accuracy: ± 0.3
o
C
o
C at 25 oC
PAR Sensor
• Fully cosine corrected
-2 s-1
-2 s-1
• Range: 0-3000 µmol m
• Accuracy: ± 10 µmol m
Cable Length: 1.5 meters
We recommend recalibration of the PAR sensor every 2 years. The temperature sensor should
not require recalibration.
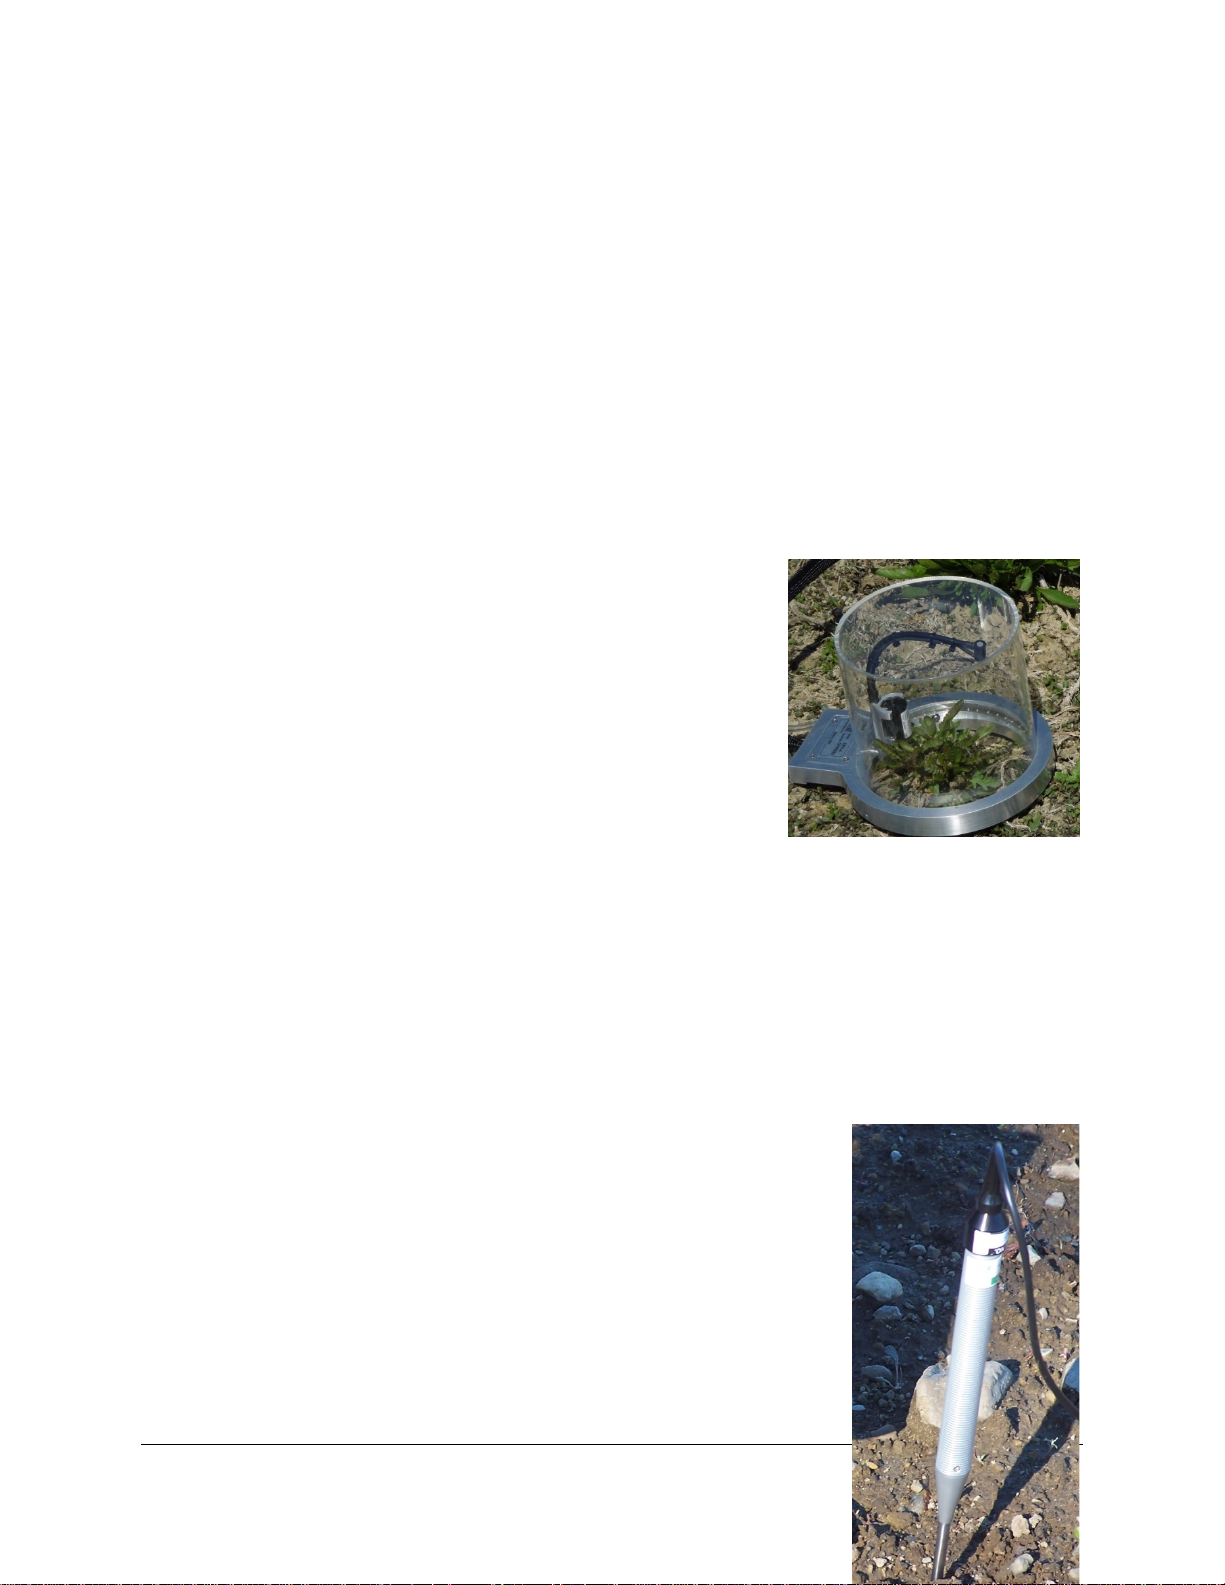
SRC-2 Soil Respiration Chamber
Our SRC-2 Soil Respiration Chamber is available for use with the
TARGAS-1 for measurement of closed system, soil CO
two gas connections required, one to the GAS IN port, and the other to the
GAS OUT port on the TARGAS-1. It is constructed out of rugged PVC
with a convenient handle for placement on the soil surface. An aluminum
ring provides a good seal on the soil surface or on collars.
• Dimensions: 150 mm (Height) x 100 mm (Diameter)
• Volume: 1171 ml
• Area: 78 cm
2
• Cable Length: 1.5 meters
efflux. There are
2
Page 19
It includes a temperature sensor for measurement of air temperature near the soil surface. This chamber
can be used on Probe Port 1 or 2
Temperature Sensor (Precision Thermistor)
• Range: 0-50
• Accuracy: ± 0.3
o
C
o
C at 25 oC
CPY-5 Canopy Assimilation Chamber
Our CPY-5 Canopy Assimilation Chamber is available for use with the TARGAS-1 for measurement of
closed system, net canopy CO
aluminum ring, which provides a good seal on the soil surface or on collars. It also includes sensors for
measurement of air temperature and PAR within the chamber. There are two gas connections required,
one to the GAS IN port and the other to the GAS OUT port on the TARGAS-1. This sensor can be used
on Probe Port 1 or 2.
• Dimensions: 145 mm (Height) x 146 mm (Diameter)
• Area: 167 cm
2
• Cable Length: 1.5 meters
Temperature Sensor (Precision Thermistor)
o
• Range: 0-50
• Accuracy: ± 0.3
C
o
PAR Sensor
• Fully cosine corrected
• Range: 0-3000 µmol m
• Accuracy: ± 10 µmol m
flux. It is transparent and constructed out of rugged polycarbonate with an
2
C at 25 oC
-2
s-1
-2
s-1
We recommend recalibration of the PAR sensor every 2 years. The temperature sensor should
not require recalibration.
STP-2 Soil Temperature Probe
An optional soil temperature sensor can be used with the TARGAS-1 for
measurement of soil temperature. It is commonly used with the SRC-2 Soil
Respiration Chamber and CPY-5 Canopy Assimilation Chamber. This sensor
connects to Probe Port 1 only.
It is a rugged sensor with electronics housed in an anodized aluminum
enclosure with stainless steel tip.
• Dimensions: Handle: 200 mm (Length) x 18.7 mm (Diameter)
TARGAS-1 Operation Manual V. 1.02 19 support@ppsystems.com
Page 20

Tip: 125mm Length
• Cable Length: 1.5 meters
Temperature Sensor (Precision Thermistor)
o
• Range: 0-50
• Accuracy: ± 0.3
The soil temperature sensor should no t re qu ire recalibration.
C
o
C at 25 oC
Getting Familiar with the TARGAS-1 Portable Photosynthesis System
TARGAS-1 Portable CO2/H2O Gas Analyzer (Main Console)
Page 21
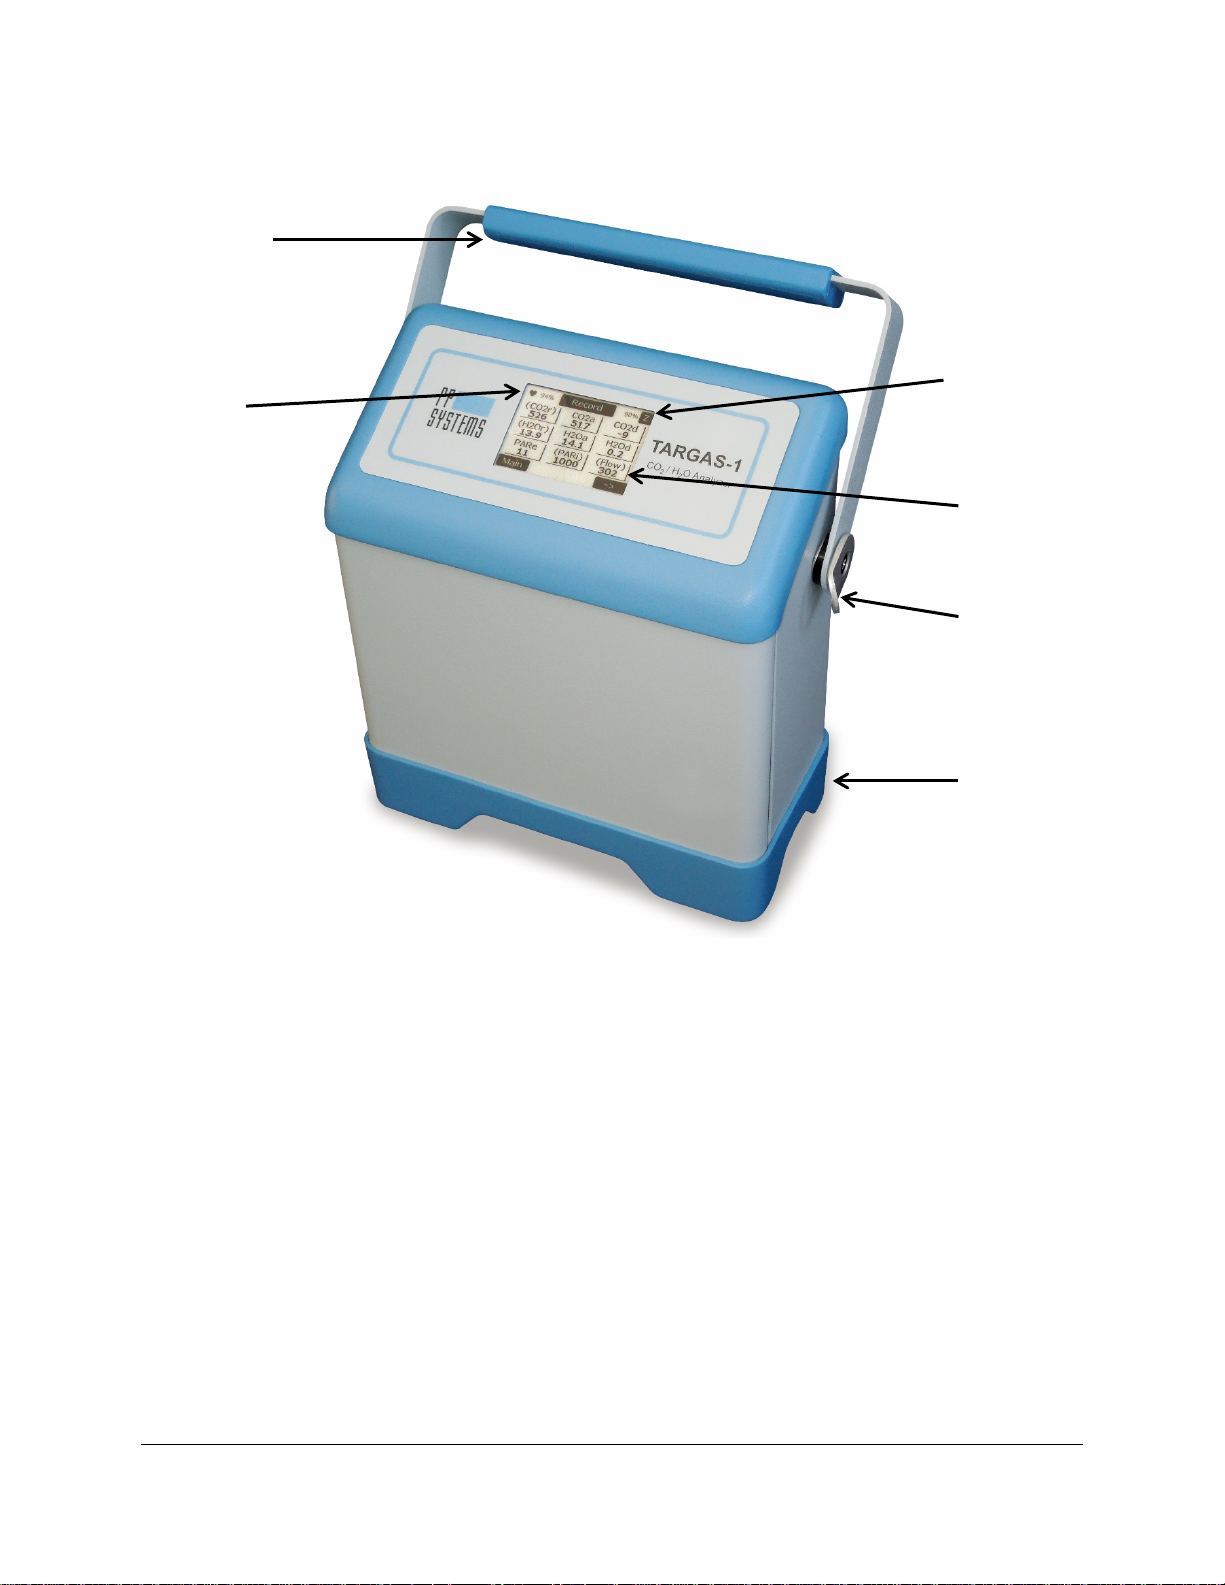
CO2 / H2O
Adjustable Carry
Handle
Flashing Heart
(Power Status)
and battery
capacity
scrubber status
and manual
Zero button
Touch display
Shoulder strap
fixture (one on
each side of
console)
Polyurethane
shock-absorbing
base and battery
compartment
Page 22
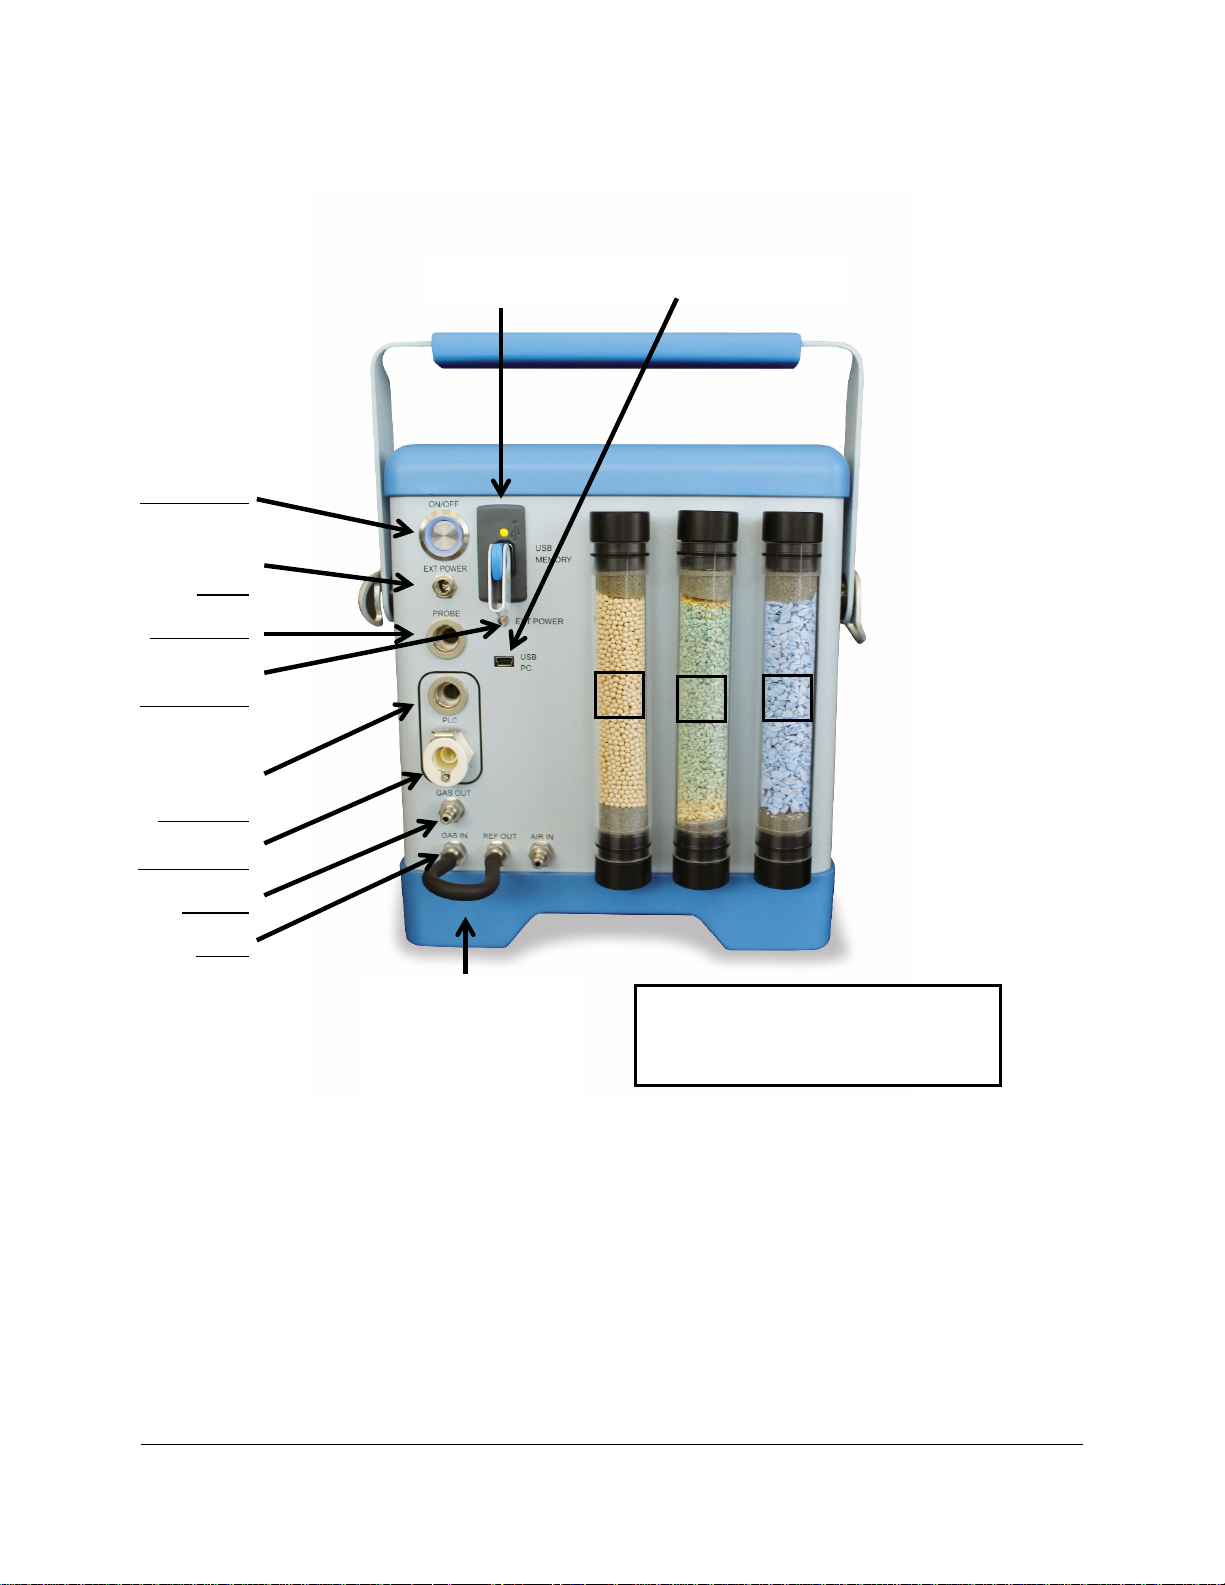
Power Switch
External
USB Flash Drive USB Mini-B
Link Tube
A. Auto-Zero (Molecular Sieve)
A B C
Power/Charger
socket
Probe port 1
External Power
LED Indicator
PLC Electrical
(Probe port 2)
Connection
PLC Gas Port
Back of TARGAS-1
Gas Out
Gas In
External Air Filter
An air filter is included with each system and we recommend fitting it to the AIR IN port to keep dirt and
dust from entering the analyzer. See External Air Filter on page 140 for more information.
Must be in place for
use with leaf cuvette
B. CO2 Scrubber (Sofnolime)
C. H
O Scrubber( Drierite)
2
Page 23
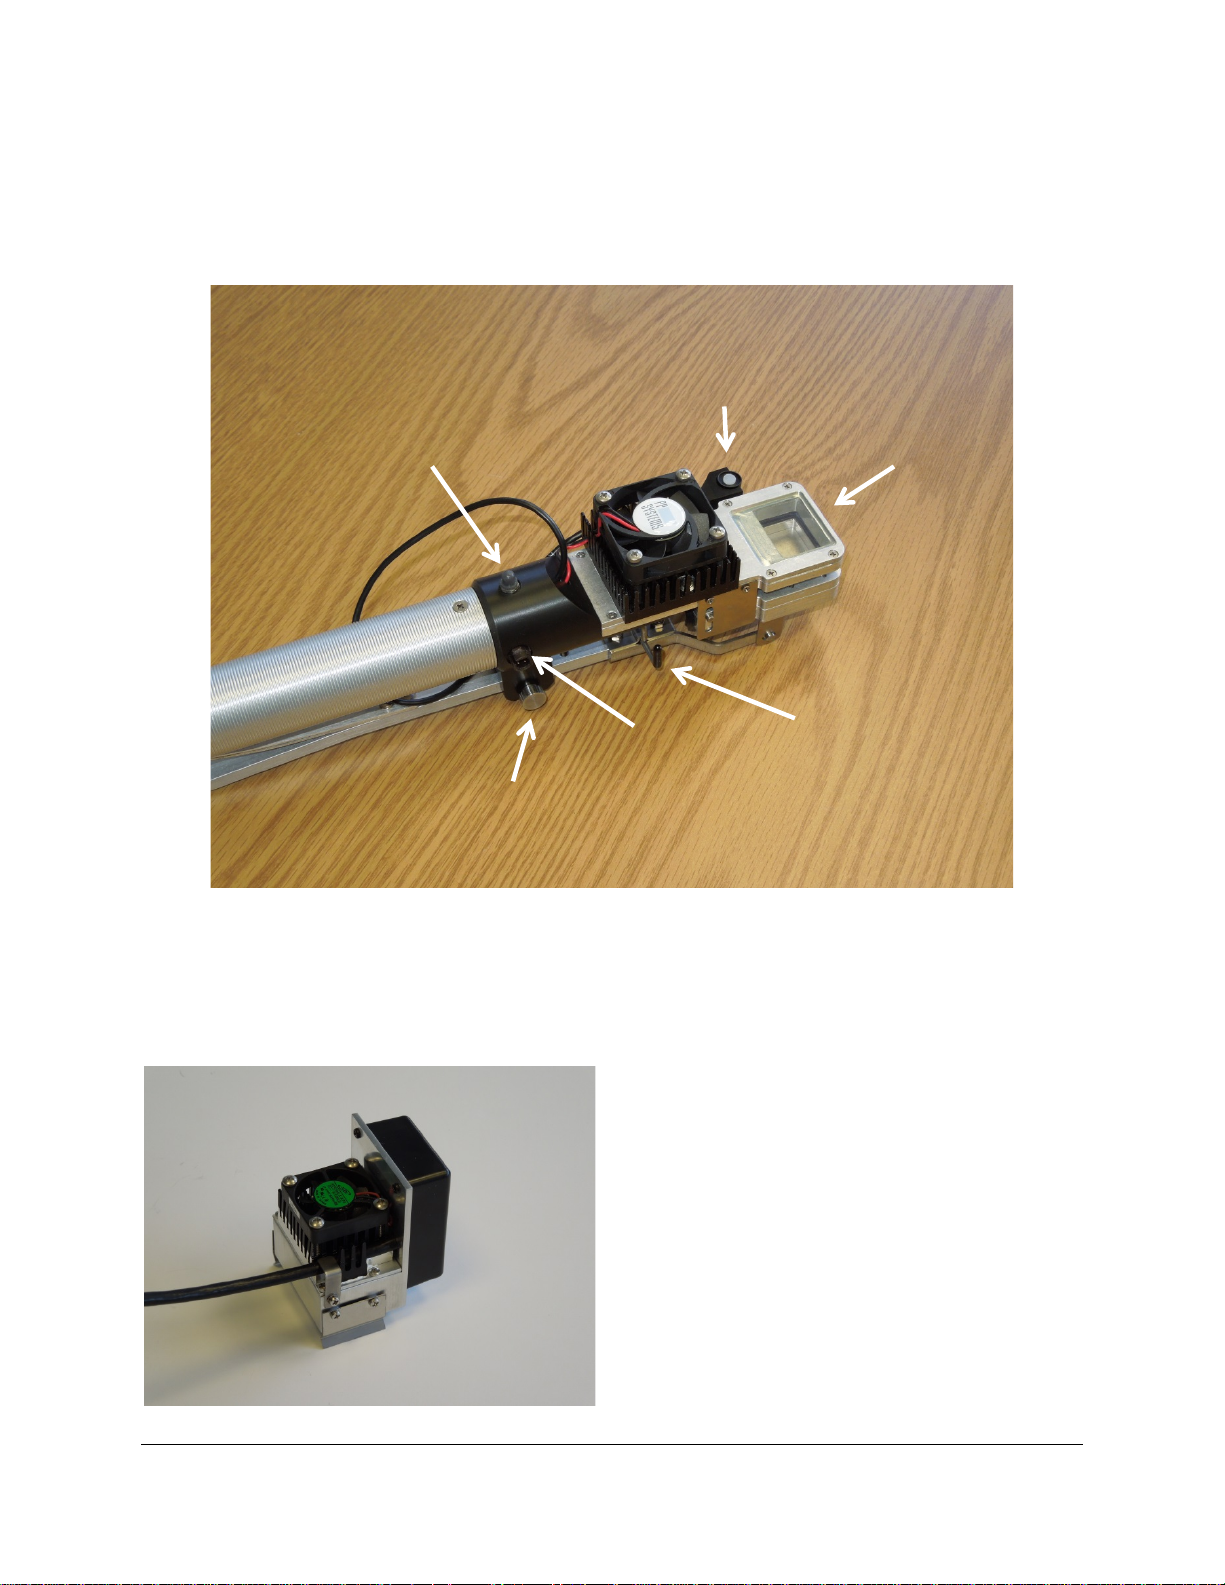
PLC5 Leaf Cuvette
PAR Sensor
Chamber
Cuvette Head
Open/Close
Head Latch
Light Unit
Connector
Record
The PLC5 Leaf Cuvette is designed to work with the TARGAS-1 Portable CO2/H2O Analyzer for
measurement of leaf gas exchange on a wide vari ety of plants including broad leaves, narro w leaves,
grasses and small needle conifers.
Switch
Electrical
Release Screw
Head
2
When the PLC5 Leaf Cuvette is not in use or being stored away make sure that the Open/Close Head
Latch is secure in place to keep the cuvette head open to avoid problems associated with compressed
leaf gaskets which is a common source for leaks.
Light Unit (Optional)
The optional light unit can be used with the PLC5
Leaf Cuvette for use on cloudy days or for light
response curves. It easily clips onto the PLC5 Leaf
Cuvette head and provides control of light intens ity
up to 2500 µmol m
on the side of cuvette handle as shown above.
• Type: LED (white)
• Measurement Range: 0-2500 µmol m
-2 s-1.
The electrical connection is
-2 s-1
Page 24
Quick Start
Electrical Connection
For measurement of leaf gas exchange using the PLC5 Leaf Cuvette.
We highly recommend that you take a few moments to run this simple test to familiarize yourself with the
basic TARGAS-1 set-up and to ensure that the system is performing perfectly before starting a
measurement campaign.
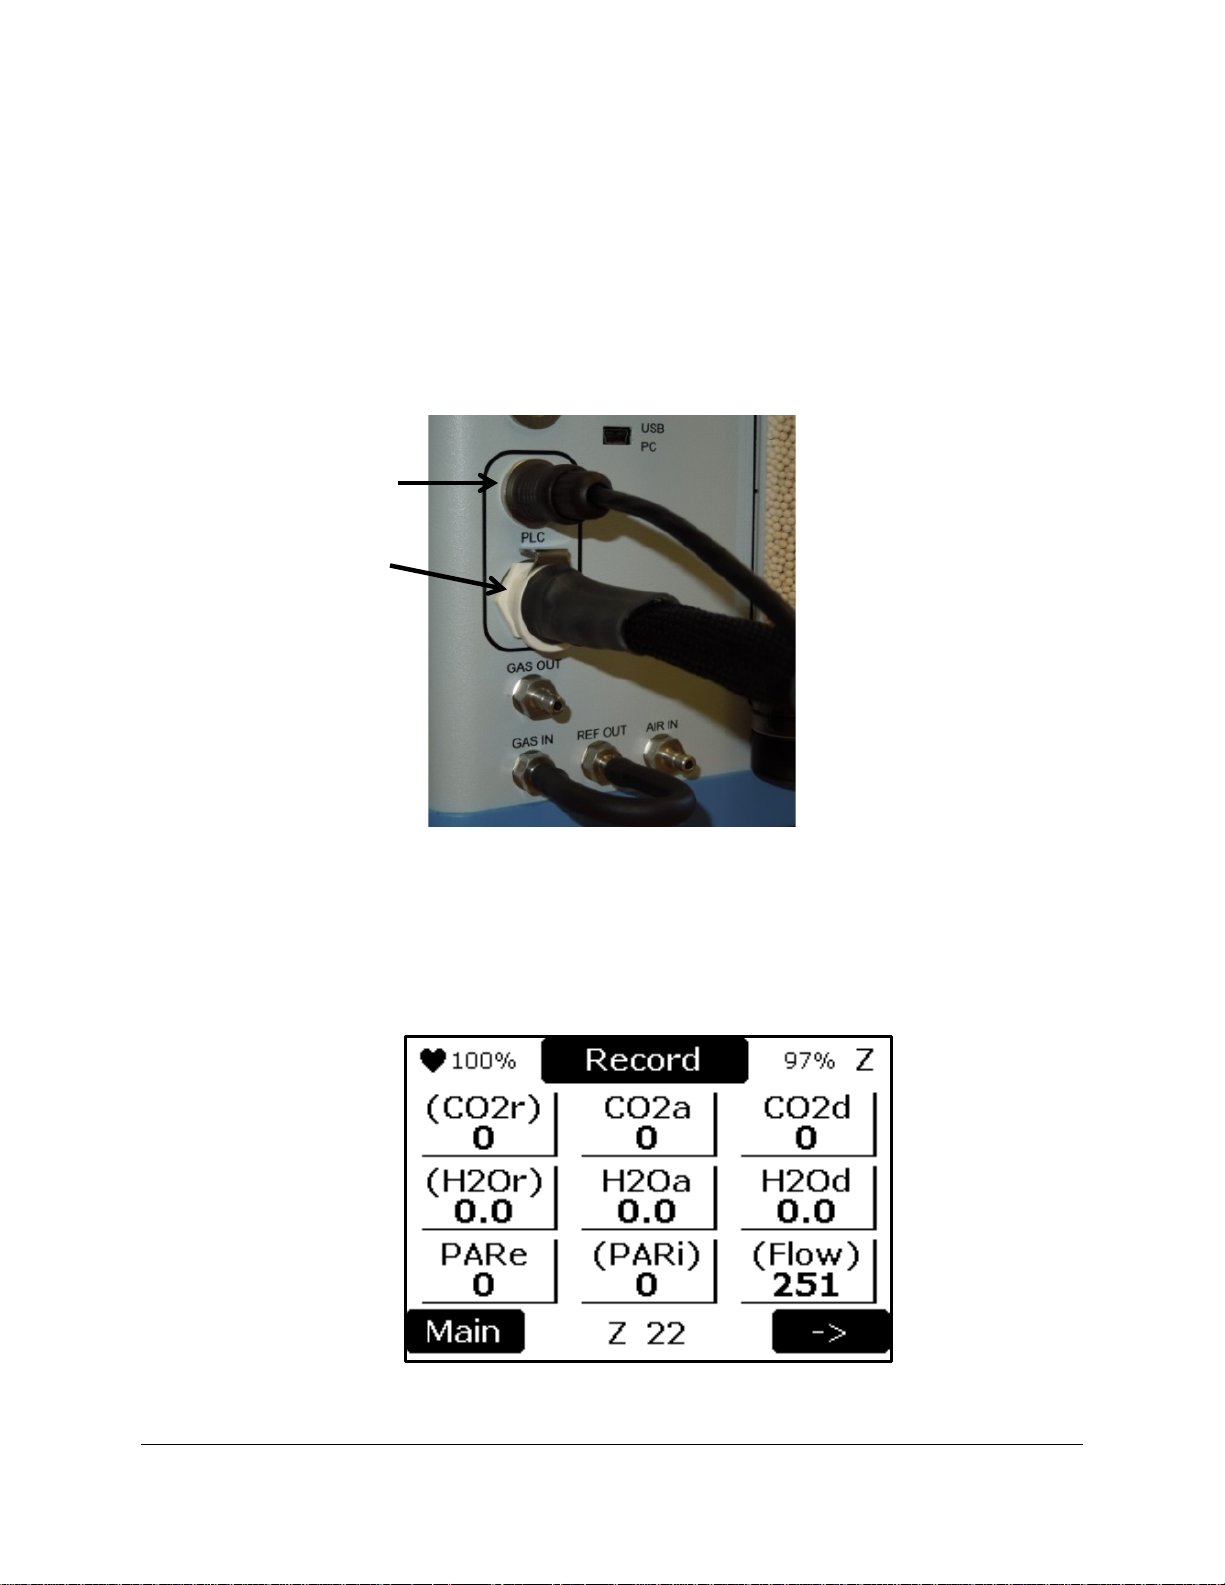
1. Connect the PLC5 Leaf Cuvette gas and signal connectors to the TARGAS-1 console as shown
below and close the cuvette head.
Gas Connection
2. Connect the TARGAS-1 to the power supply provided by PP Systems (to conserve power) and
power up the TARGAS-1 console and allow it to warm-up. Prior to performing actual
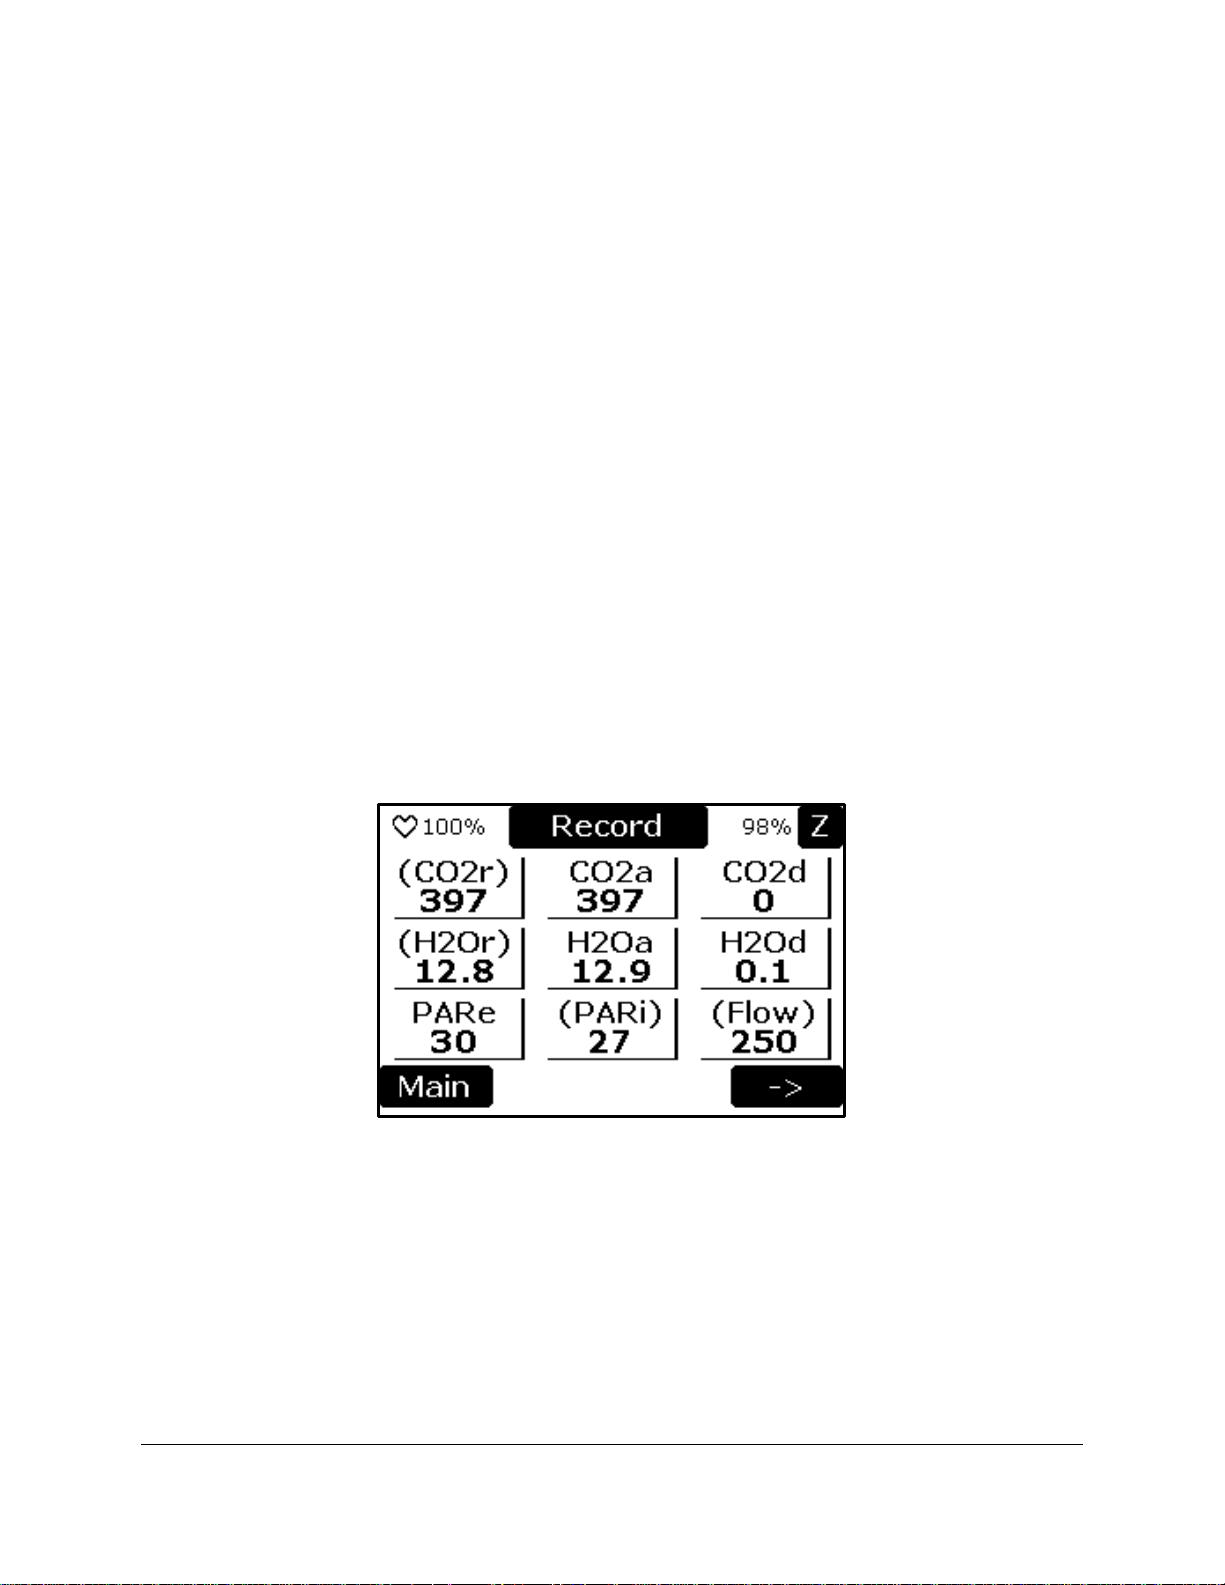
photosynthesis measurements, it is recommended to wait an additional 15 minutes. This will
allow the system to achieve stabilization of the IRGAs and perform system ZEROs. During
warm-up, the main measurement screen will show 0 readings for most measured parameters
similar to this:
Page 25
3. Connect the sampling tubing to the AIR IN port on the back of the TARGAS-1 console.
Remember to make sure the external air filter is fitted to the AIR IN port (see External Air Filter on
page 140). This will be your reference air. We strongly recommend that your reference air is as
far away from any local CO
disturbances such as people breathing, ventilation, automobiles,
2
parking lots, etc. This can be as easy as running a long piece of tubing outside the window in
your lab or away from where you are taking measurements in the field. If in the field you could
also use the “fresh air intake unit” supplied with the system which will help to provide steady
reference air. It is very important that you establish a very steady reference air supply to ensure
that your system is working properly and to make measurements easier and quicker.
4. Make sure you set the rb value (boundary layer resistance) and RS factor for your cuvette
correctly. Settings associated with rb and RS Factor are located in the Settings 1 menu (press
Main, Settings, RB or RS Fact). The rb value is measured at the factory and is programmed into
your TARGAS-1 console when supplied as a new instrument. This value is also written on the
“Tested” label on your leaf cuvette for additional reference purposes (See RB Setting on page 54
for more information). The RS Factor is set to 0.50 as default on the assumption that you have
50% stomata on the upper and lower side of your leaf. You should enter the value associated
with your leaf (See RS Factor Setting on page 55 for more information).
5. Make sure the cuvette flow rate (Flow) located in the bottom right hand corner of the main
measure display is set to our recommended rate of 250 cc/min. If not, press the (Flow) button
and set it to 250. Also make sure that the sample flow rate is set to 150 cc/min (see Sample Flow
Setting on page 63). Settings associated with sample flow are located in the Settings 3 menu
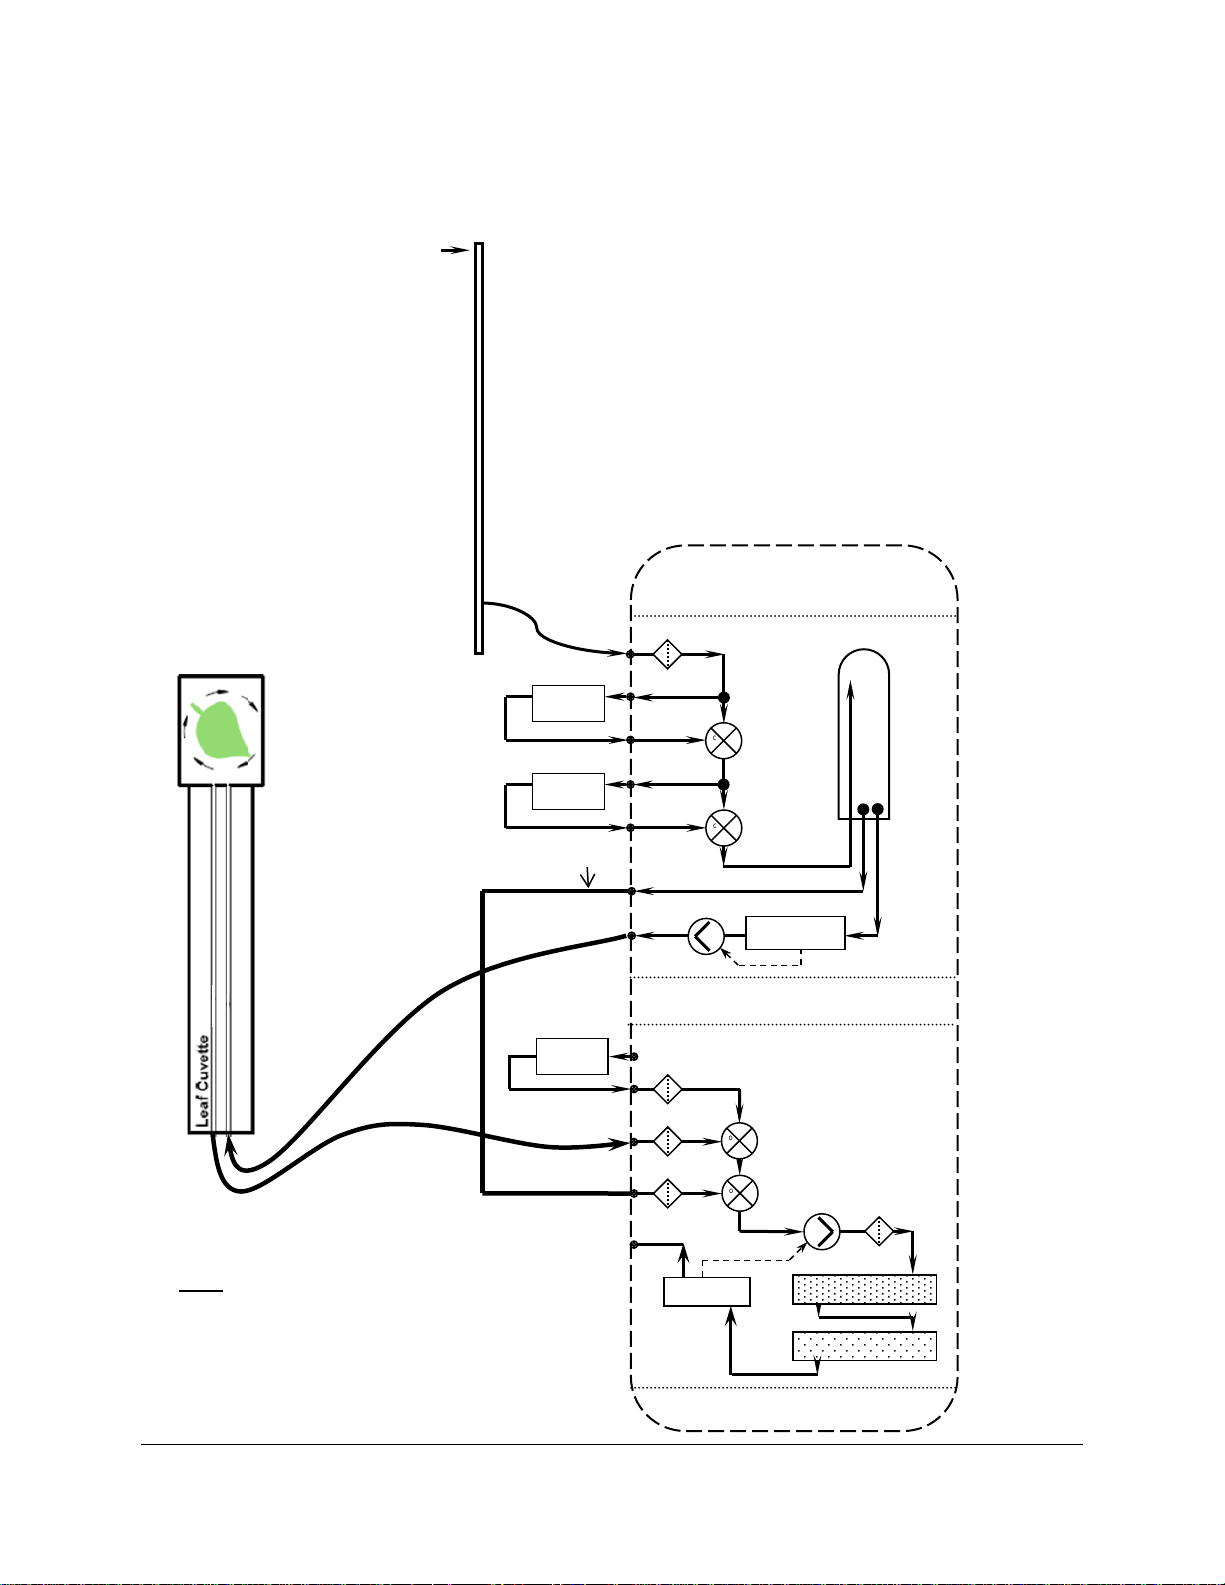
(press Main, Settings, right arrow, right arrow, Flow). With the leaf cuvette head closed, all
readings should be stable and you should see something similar to this displayed:
• Stable CO2r and CO2a at ambient levels (~ 400 ppm)
• Stable H2Or and H2Oa at ambient levels
• CO2d should be stable and near 0 (± 1 ppm) and H2Od should also be stable and near 0 (± 0.5
mb)
• PARe and PARi should be at ambient light levels (Typically less than 50 µmol m
-2
s-1 indoors)
• Flow rate should be approximately 250 cc/min
If everything looks similar to the above you should be good to go. Good luck!
Page 26

Leaf Gas Exchange Mea su rements – Recommended Set-up
When performing leaf gas exchange measurements in the lab or field, calculations are based on the
changes in CO
The reference air source is normally outside air (ambient) which contains both CO
that is supplied to the leaf cuvette. The analysis air is the air containing the sample CO
coming from the leaf cuvette.
and H2O gas concentrations between the reference and analysis (sample) air streams.
2
and H2O and is the air
2
and H2O gas
2
For healthy plants you would expect that the analysis CO
reference CO
concentration (CO2r) as the plant will be taking up CO2. Initially the CO2 analysis
2
concentration (CO2a) will be less than the
2
concentration (CO2a) may increase when the cuvette head is open to enclose the leaf (normally due to
local breathing by the user) but it will fairly rapidl y begi n to decreas e and s lowly drop after closing the
head on the leaf. On the H
reference H
O concentration (H2Or) as the leaf will be adding moisture to the air and commonly referred
2
O side, the analysis H2O concentration (H2Oa) should be higher than the
2
to as “transpiration”. For best results you want to make sure that your reference air is as stable as
possible especially when working on plants that have low rates of assimilation. Therefore we strongly
recommend that your source of reference air is drawn from a stable source away from any CO
influences
2
or disturbances such as people breathing, ventilation systems, parking lots or highways, automobiles, etc.
This can be achieved by using a homemade buffer volume (i.e. 20 liter bucket, large water container, etc.)
or using the air supply intake unit provided by PP Systems. The air supply intake unit draws ambient air
from about 2.3 meters above the ground and should help to smooth the reference air allowing for rapid
and accurate measurement of leaf gas exchange. On windy days additional smoothing may be required
but for most conditions the air supply intake unit should work well.
When should I record a measurement?
This is a very good question. Generally speaking it really depends on the biological state of the plant and
local environmental conditions. For many healthy plants under sunny conditions you could expect the
plant to reach equilibrium in approximately 60 seconds. For plants that are not as healthy and
experiencing stress conditions (i.e. drought, heat, salinity, etc.) it may take longer up to several minutes.
After placement of the leaf inside the chamber we recommend monitoring either the CO2d value
(Measure Screen 1) or A value (Measure Screen 2) and when it stabilizes then it is time to record the
measurement. Measurements can be recorded by pressing the RECORD button on the console display
or by pressing the record switch located on the PLC handle.
Important Note. It is not unusual to see fluctuating or unrealistic “calculated” parameters (i.e. A, gs, Ci,
etc.) with an empty chamber and the head closed. Do not be concerned by this. What is important is that
your measured data is stable and CO2d and H2Od values close to 0 as described on the previous page.
The calculated parameters become relevant only after enclosing a leaf in the chamber and during actual
leaf gas exchange measurements.
For more information related to photosynthesis measurements and equations see Appendix 1.
Photosynthesis Equations Used in TARGAS-1 on page 150.
Page 27
Schematic of TARGAS-1 Portable Photosynthesis System Air
Air Supply
Air in
no C nc
H2O IRGA
Pump
GAS IN
Zero CO2 H2O
GAS OUT
AN / Zero Valve
REF Valve
CO2 IRGA
Molecular
Sieve
Filter
Filter
Filter
Filter
PLC AN IN
Gas Measuring System
Flow Sensor
no
C
nc
Air Control System
nc C no
AIR IN
PLC Air Out
REF OUT
H2O
Control
Filter
CO2
Control
nc C no
CO2
Absorber
H2O
Absorber
Smoothing
Pump
Flow Sensor
TARGAS-1 CO2/H2O Gas
PLC5 Leaf
Link to connect
REF OUT to GAS IN
Note
Supply System
Intake Unit
Analyzer
Cuvette
PLC AirOut and PLC An In are
both located within the white, dual
PLC port connector.
Volume
Page 28

Routine System Checks Befo re S tarting
The TARGAS-1 is designed to operate with minimal maintenance. The basic routine system checks are
as follows:
• Absorber Columns - Check the absorber columns on the back and make sure that they are
properly seated in the correct location (See Back of TARGAS-1 on page 22). You should
periodically lubricate all O-rings associated with the columns (black end caps) with silicone
grease to ensure good seal and to avoid problems associated with cracks and leaks. Also ensure
that the gray foam filters are in good shape and replace when worn.
• Desiccants - Check the condition of each desiccant to ensure that they are fresh. Pay special
attention to the soda lime and molecular sieve which visually do not change color like the Drierite.
If you are unsure then you should replace all desiccants to ensure stability and calibration.
• Zero -. If the Zero reading in the upper right hand corner of display is 20% or lower you should
change it. Pay special attention to the Molecular Sieve desiccant as this is non-indicating and if
unsure change it out with fresh Molecular Sieve. Reset the absorber column life after replacing
the Molecular Sieve. See Reset Zero Absorber on page 57.
• rb (boundary layer resistance) and RS Factor – Make sure both are set properly for your
leaf cuvette and vegetation type.
• Cuvette Flow rate and Sample rate – For most plant types and when the chamber head is filled
with vegetation we recommend a cuvette flow rate of 250 cc/min and sample flow rate of 150
cc/min. Cuvette flow rate and sample flow rate can be adjusted by the user as required and
usually based on leaf area and biological state of the plant.
• System Power - Make sure that the heart symbol is flashing in the upper left hand corner after
the instrument is powered on. Also check the battery capacity next to the heart to ensure that you
have plenty of power to get you through your measurements. We recommend that you keep the
charger connected to the TARGAS-1 during warm-up to save on battery life.
• USB Flash Drive – You must make sure that you have a USB flash drive (also commonly
referred to as a memory stick or thumb drive) plugged into the USB Memory port on the
TARGAS-1 console for data storage. If you do not have this you will be unable to save data
and it will have to be recorded manually.
• Status – Inspect periodically for error messages/warnings AND DO NOT IGNORE THEM. They
are appearing for a reason.
Page 29

System Power
Re-Order Information
Part Number
Description
STD561
Mains Charger/Power Supply
The TARGAS-1 has an internal, rechargeable lithium ion battery pack capable of providing continuous
power to the instrument for up to 10 hours. The TARGAS-1 is supplied with an external AC power adapter
to charge and/or power the TARGAS-1.
Battery Specification
• Type: Rechargeable Smar t Lithium Ion Battery Pack
• Power: 7.2V, 8.7Ahr, 63Whr
Note, if the TARGAS-1 is used with external sensors/chambers it will reduce the battery life depending on
the probe connected.
A discharged battery (0% capacity) can be fully recharged in appr ox imately 4-5 hours using the power
supply/charger supplied b y PP S ystems.
To check the battery status, simply power up the instrument and observe the battery capacity next to the
flashing heartbeat in the upper left hand corner of the display (see below).
Power Supply/AC Adapter Rating:
• Input: 100-240 VAC, 50-60 Hz, 1.0A
• Output: 12 VDC, 3.3A
Page 30

TARGAS-1 Main Console Compone nts
Touch Display
The TARGAS-1 features a 2.7” a-Si, active matrix TFT, Electronic Paper Display (EPD) touch panel. The
panel has such high resolution (117 dpi) that it is able to easily display fine patterns with excellent
readability under sunlight conditions. Due to its bi-stable nature, the EPD panel requires very little power
to update and needs no power to maintain an image.
Features
• a-Si TFT active matrix Electronic Paper Display(EPD)
• Resolution: 264 x 176 pixel
• Ultra-low power consumption
• Super Wide Viewing Angle - near 180°
• Slim & lightweight enclosure
• SPI interfac e
• RoHS compliant
Navigation using the Touch Display
Navigating through the system is simple and easy by pressing black buttons where applicable. Whenever
you see white text inside a black box we refer to this as a button (i.e. Main). Pressing on these buttons
will allow you to set up, navigate and operate the TARGAS-1. Whenever a numeric value is required, a
keypad will appear allowing you to enter the desired values.
Power Switch
The power switch is located in the upper left hand corner of the back panel. To power on the TARGAS-1
simply push in the switch. When power is on the illumination ring around the switch will turn blue. To turn
off, simply press the switch again bringing it back to the flush position. When powered off, the Splash
Screen will be displayed as follows:
When the TARGAS-1 is turned off you must wait at
instrument. If you do not wait long enough the system will not power up properly.
Please note that a warning message is displayed when the battery capacity is less than 10%. When the
battery capacity of the TARGAS-1 reaches 0% it will turn off. If this happens we recommend connecting
up to the charger to recharge the internal battery
least 5 seconds before powering on the
Page 31

If the TARGAS-1 was put into ship mode, it will not power on until external power is applied. To bring
the TARGAS-1 out of ship mode, first connect external power to the instrument, and then turn it on by
pressing the “ON/OFF” button. See Ship Mo de Sett ing s on page 67 for more information.
Ext Power Jack
When external power is present, the system will charge the internal battery. A power supply/charger is
supplied with the TARGAS-1 as standard. When the power supply/charger is connected to the TARGAS1 it will both operate the instrument continuously and recharge the internal battery when the TARGAS-1 is
powered on. If connected to the TARGAS-1 with power off it will recharge the internal battery faster.
Ext Power LED
The amber LED is illuminated whenever the power supply/charger is connected to the EXT POWER jack
on the back panel.
Probe Ports
There are 2 digital PROBE PORTS available for powering chambers and sensors.
Probe port 1 supported probes/sensors include:
• Quantum Sensor (Apogee Instruments)
• TRP-3 Temperature & PAR Probe
• STP-2 Soil Temperature Probe
• SRC-2 Soil Respirati on Ch amber
• CPY-5 Canopy Assimilation Chamber
Probe Port 2 (PLC) supported probes:
• PLC5 Leaf Cuvette
• PLC3 Leaf Cuvette
• TRP-3 Temperature & PAR Probe
• SRC-2 Soil Respirati on Ch amber
• CPY-5 Canopy Assimilation Chamber
Up to two different probes can be used at the same time, for example, the SRC-2 Soil Respiration
Chamber and the STP-2 Soil Temperature Probe. Note that some combinations of the above probes will
not be possible, for example, the PLC5 and the PLC3 will not work with other probes.
PLC Gas Ports
This port connection is for the PLC5 or a PLC3 leaf cuvette for measurement of leaf gas exchange. The
port provides both the supply air (reference) and the analysis (sample) air through this single gas
connection.
Page 32

Gas Ports
There are 4 gas ports on the TARGAS-1. Each port is designed for use with 1/8” (.125”) ID tubing or a
mating quick disconnect.
• GAS OUT: Exhaust air from the IRGAs
• GAS IN: Reference air entering the IRGAs (when PLC5 is used) or sample air when in absolute
or closed modes
• REF OUT: The (conditioned) air from the TARGAS-1 (when PLC5 is used) or exhaust air when in
absolute or closed modes
• AIR IN: The air that is drawn in from the ambient and used by the TARGAS-1 for the PLC sample
air (Reference)
NOTE: the REF OUT must be linked to the GAS IN when using a PLC5 or PLC3 leaf cuvettes for
measurement of leaf gas exchange. See Back of TARGAS-1 on page 22. The link pipe must be
removed when using the SRC-2 Soil Respiration Chamber or the CPY-5 Canopy Assimilation Chamber.
When using these accessories both the GAS IN and GAS OUT ports are used and the link pipe is not
required.
When using the TARGAS-1 as a stand-alone CO
GAS IN port and the GAS OUT port should be left open to atmosphere to allow the sample air to exhaust
without restriction. This does not apply when using some optional accessories (e.g., the SRC-2 Soil
Respiration Chamber or the CPY-5 Canopy Assimilation Chamber).
O analyzer, the sampling line should be fitted to the
2/H2
Flow Rate
The TARGAS-1 features an internal electronic flow sensor for controlling flow rates.
Important Note
If the flow rate cannot be maintained, a “low flow" error message will be displayed in the status box.
Typically this is the result of flow restriction caused by either the external air filter (if applicable) or a
blocked internal hydrophobic filter located inside the TARGAS-1 enclosure. First, replace the external air
filter (if applicable) connected to the GAS IN port to see if this corrects the problem. If it doesn’t then the
likely problem is a blocked internal hydrophobic filter See Hydrophobic Filter on page 145 for information
related to changing this filter.
USB Flash Drive Port
A USB Flash Drive Port is available on the back panel to allow users to save data directly to a USB flash
drive (also commonly referred to as a “thumb drive” or “memory stick”). When a USB flash drive is
inserted into the USB port, the LED indicator will first turn red in recognition of the USB flash drive and
then it will flash green indicating that data is being saved to it automatically. If the indicating LED is a
steady green then data is not being saved because the “Interval (sec)” is likely set to 0 under Interval
Settings.
USB PC Port
The USB PC Port (USB Mini-B) can be used to connect the TARGAS-1 to a PC. Measured data is
continuously sent through this port. The PP Systems’ GAS software or a terminal emulation program (i.e.
HyperTerminal) can then monitor the measured data. GAS software is supplied on the USB flash drive
supplied with the TARGAS-1 and it is also available for free download from our website. See GAS (Gas
Page 33
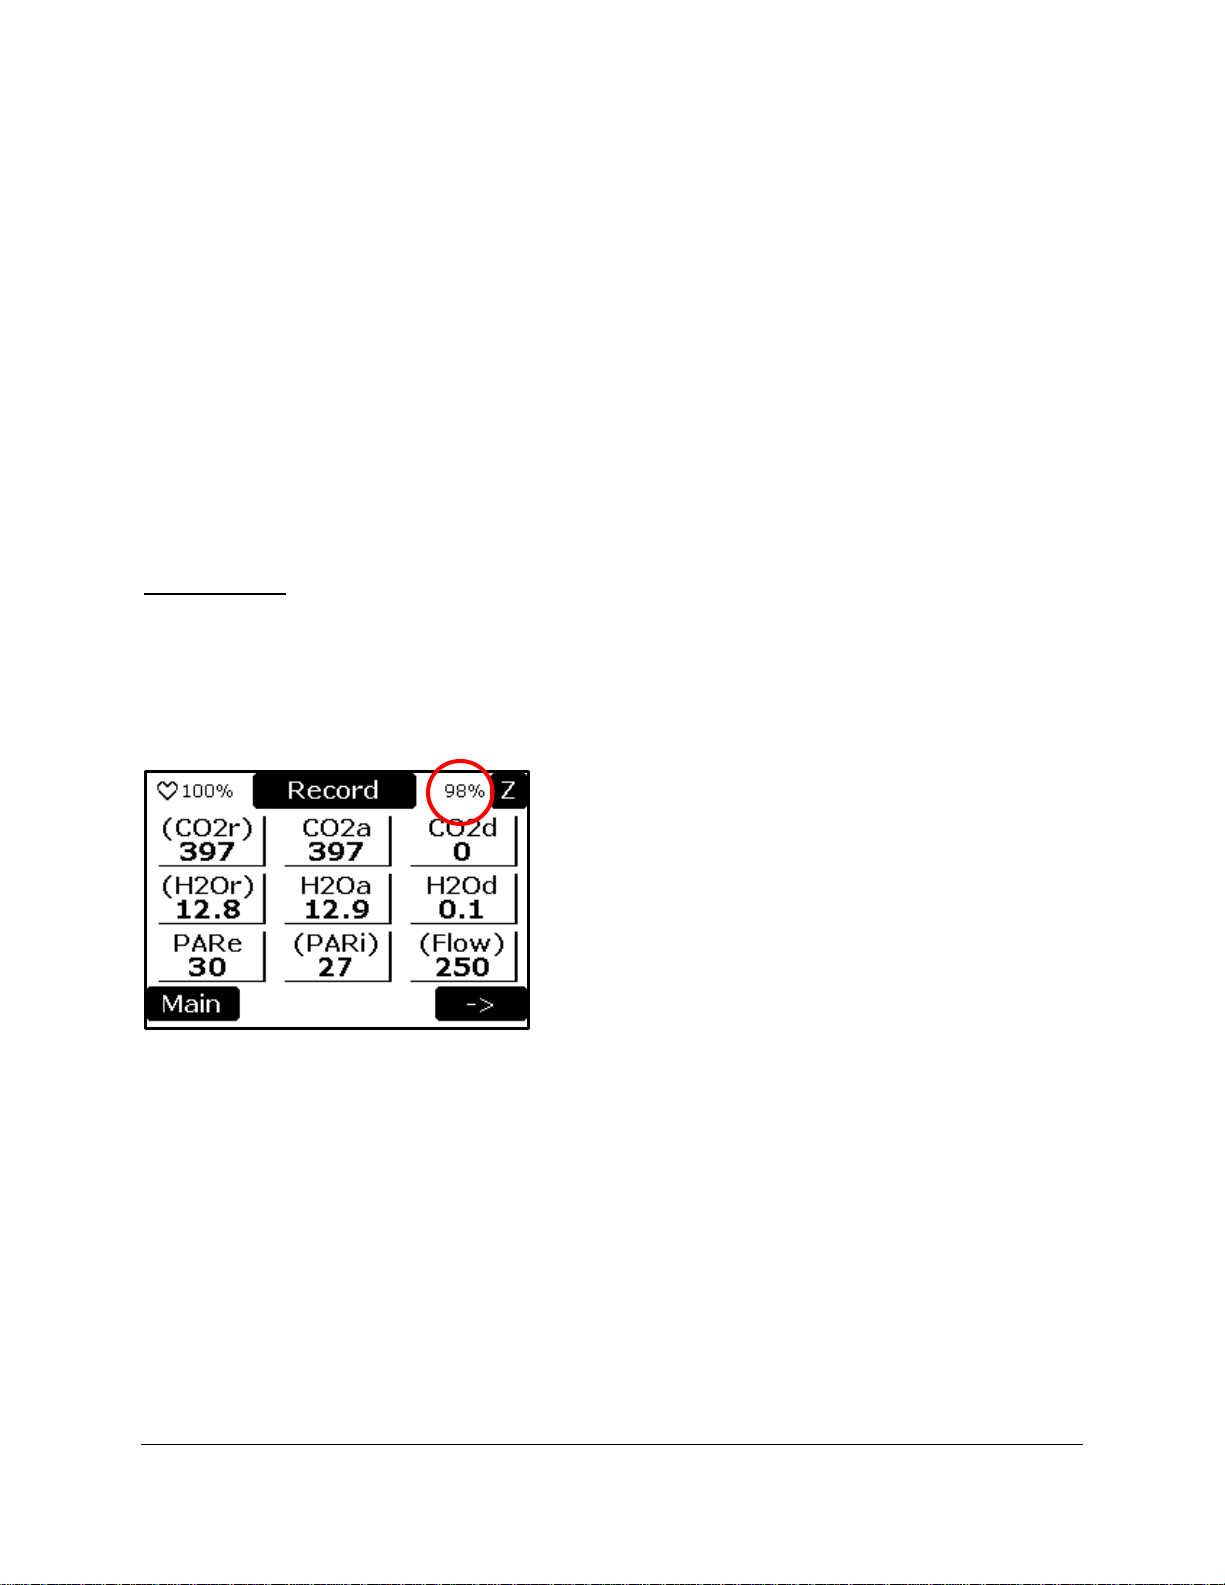
Analysis Software) on page 136 for more information. When using a terminal emulator, the COM por t
settings to communicate with the EGM-5 are: 19200 baud, 8 bit, 1 stop, no parity, no flow control.
Absorber Columns
There are 3 absorber columns used with the TARGAS-1. One column is for Auto-Zero and the other two
columns are for CO
Auto-Zero Column
The Auto-Zero column contains a CO2 and H2O scrubbing desiccant called “Molecular Sieve”. When air
passes through this column, it removes all of the CO
function built into the TARGAS-1 periodically switches the flow of gas from the analyzer through this
column to check the analyzer zero. This routine ensures long term stability and accuracy of the CO
H
O gas analyzers. It automatically corrects for such things as sample cell contamination, source aging,
2
detector sensitivity and changes in electronics. The default Auto-Zero interval is 20 minutes, but this can
be changed if required. See Zero Settings on page 55.
Important Note
It is critical that the Molecular Sieve is fresh to ensure that the TARGAS-1 receives a good zero for long
term calibration and stability of the CO
Molecular Sieve Desiccant at least once per week or when the scrubber value in the upper right hand
corner of the display is at 20% or lower (see below). When the display is less than 10% a warning is
displayed.
and H2O control.
2
and H2O from the air stream. The “Auto-Zero”
2
and H2O gas analyzers. We recommend changing out the
2
and
2
See Reset Zero Absorber on page 57 for information on resetting the scrubber after refreshing the
desiccant.
Molecular Sieve
Molecular Sieve is used to remove CO2 and H2O from the air supply during analyzer Auto-Zero to ensure
system stability and accuracy for CO
there is no obvious way to see that it is exhausted. It is therefore best to always change the Molecular
Sieve at least once per week regardless of use.
Molecular Sieve can easily become contaminated through absorption of CO
air. It is therefore strongly recommended and advised that when you open the Molecul ar Sie ve
container for the very first time you decant it into small air-tight, glass containers sealed by electrical tape
to minimize any exposure to air (See Molecular Sieve Repackaging on page 34).
and H2O. Unfortunately, Molecular Sieve is not self-indicating and
2
and H2O from atmospheric
2
Page 34
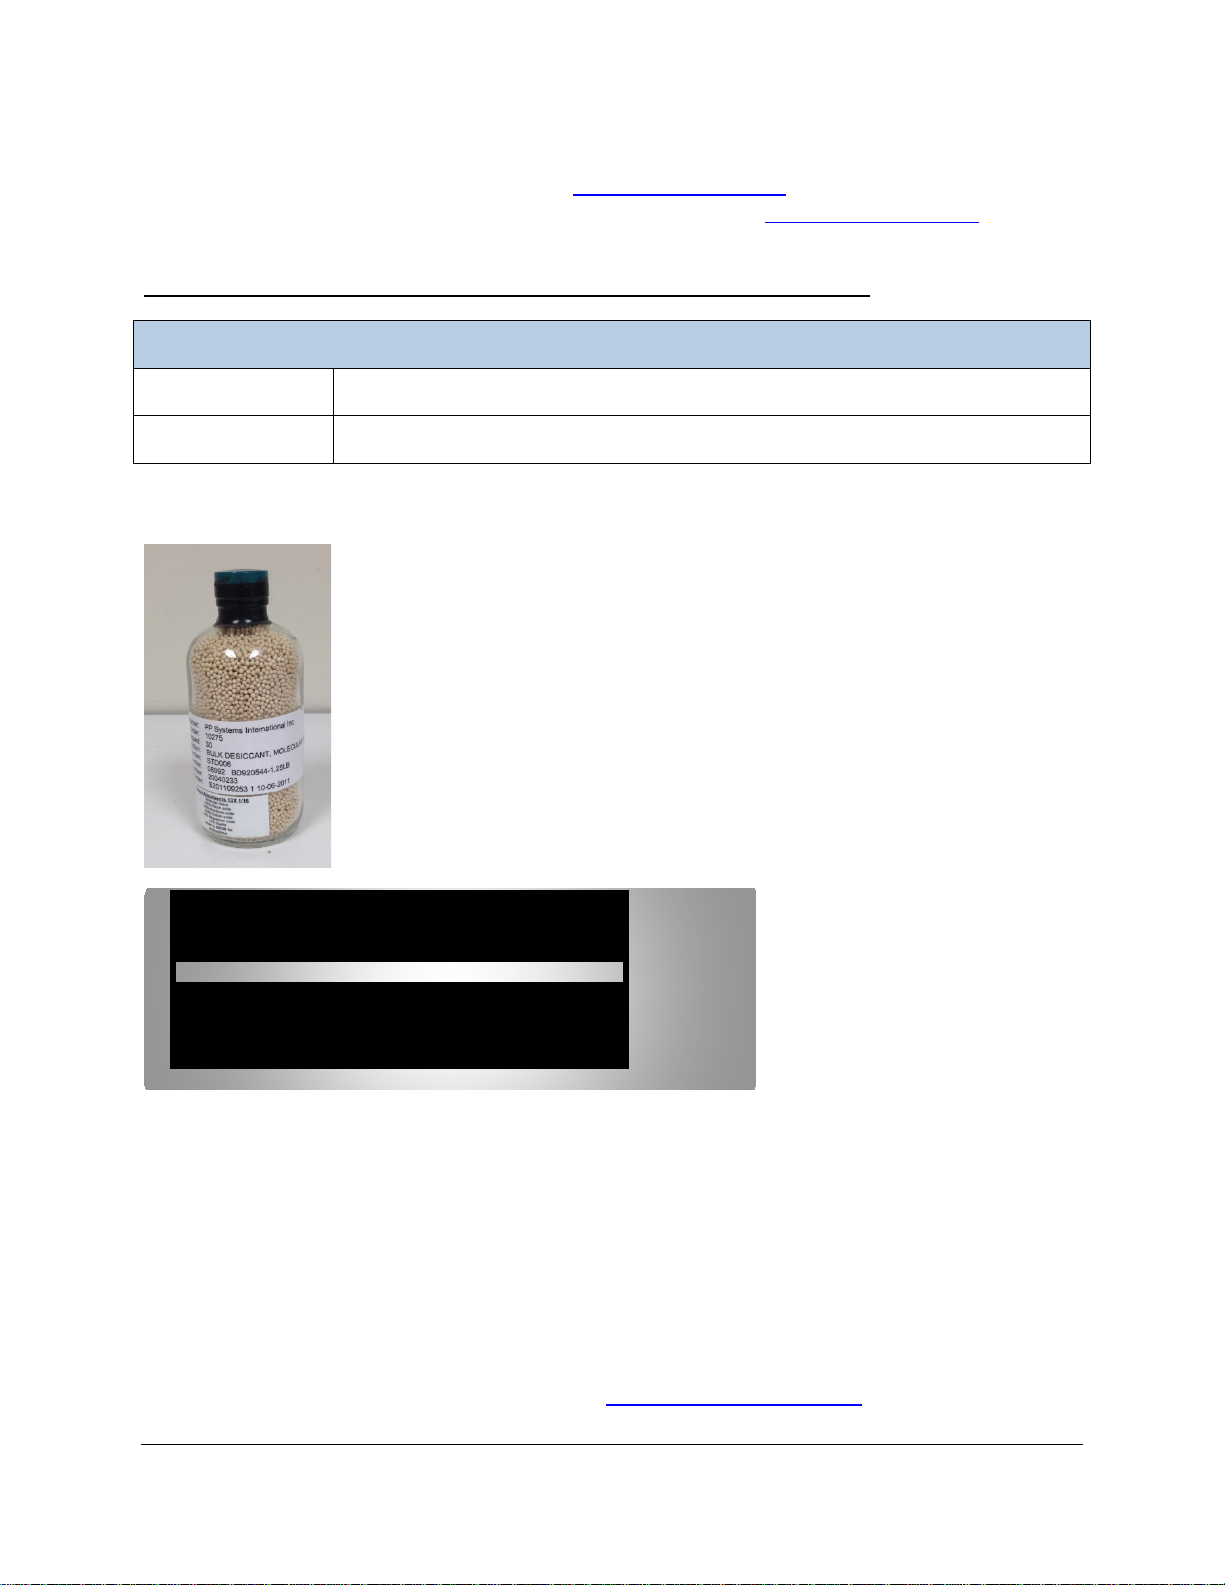
• Type: Molecular Sieve, 13X 1/16, 1.25 lb. container
Re-Order Information
Part Number
Description
STD006
Molecular Sieve, 1.25 lb.
• Manufacturer: AGM Container. (www.agmcontainer.com
• For the latest Material Safe t y Data Sheet, ple as e visi t www.agmcontainer.com and
request the latest MSDS or contact PP S ystems.
Take caution to wash your hands completely after handling Molecular Sieve.
)
Molecular Sieve Repackaging
The Molecular Sieve is originally supplied by PP Systems in tin packaging. After
initial opening, we strongly urge all users to repackage the Molecular Sieve in
small glass containers with a screw top to seal the desiccant from room air. This
desiccant saturates very quickly in room air and if not properly stored it will cause
it to go bad and subsequently affect CO
To ensure a good seal, we also recommend putting some electrical tape around
the screw top as shown here. If you have any questions, get in contact with PP
Systems.
readings and calibration.
2
Tip
Always change the molecular sieve at least
once per week when the TARGAS-1 is in use
regardless of operation time.
CO2 & H2O Control Columns
There are two columns used for CO2 and H2O control. One column contains soda lime (CO2 scrubber)
and the other contains Drierite (H
Soda Lime
Soda lime (calcium hydroxide, sodium hydroxide, water) is used to remove CO2 from air entering the
TARGAS-1. Both self-indicting (white to violet) and non-indic at ing Sod a Lime can be can be used with the
TARGAS-1. Soda Lime cannot be regenerated and should be discarded after exhaustion.
• Type: Sofnolime, 1.0-2.5 mm, self-indicating white to violet), 1 kg
• Manufacturer: Molecular Products. (www.molecularproducts.com
O scrubber).
2
)
Page 35
• For the latest Material Safety Data Sheet, please visit www.molecularproducts.com and
Re-Order Information
Part Number
Description
STD007W
Sofnolime, white to violet (1 kg)
Re-Order Information
Part Number
Description
STD008
Drierite, 1 Lb Jar
request the latest MSDS or contact PP S ystems.
For the latest MSDS on alternative types of soda lime, please contact the manufacturer directly or contact
PP Systems.
Take caution to wash your hands completely a fter handling soda lime.
Important Note
The Soda Lime provided by PP Systems is self-indicating and this desiccant changes from white to violet
during operation. However it will revert back to white when the instrument is powered off and not in use.
Therefore it is best practice to replace this desiccant regularly (at least once per week) for best results
and controlling capability.
Drierite
Drierite (anhydrous 97% calcium sulfate (CaSO4) and 3% cobalt chloride) is an excellent H2O absorber
making it an ideal choice for analyzer ZERO and for controlling H
non-indicating Drierite can be can be used with the T A RG AS-1. It can be regenerated easily by simply
spreading out the granules one layer deep and placed in a preheated oven for 90 minutes at 230 °C or
425 °F. The regenerated material should be returned to the original glass container and sealed while hot.
The color of the self-indicating Drierite may become less distinct on successive regenerations due to the
migration of the indicator into the interior of the granule and sublimation of the indicator.
O. Both self-indicting (blue to pink) and
2
• Type: 8 mesh, self-indicating (blue to pink) or non-indicating, 1 lb. Jar
• Manufacturer: W.A. Hammond Drierite Company Ltd. (www.DRIERITE.com
)
• For the latest Material Safety Data Sheet, pleas e visi t www.DRIERITE.com and request
the latest MSDS or contact PP Systems .
For the latest MSDS on alternative types of Drierite, please contact the manufacturer directly or contact
PP Systems.
Take caution to wash your hands completely after handling D rierite.
Page 36
When changing out all desiccants, the user must take care to ensure that the columns are properly
Re-Order Information
Part Number
Description
30118-1
Filter Foam
Re-Order Information
Part Number
Description
30013-1
O-ring 4.76 x 1.78
30013-19
O-ring 20.8 x 2.4
seated in the correct manifolds, the proper desiccant is used in appropriate columns which are clearly
marked and that all “O” rings are in place and slightly lubricated with silicone grease. Any leakage of
ambient air into the gas circuit generally results in error messages during ZERO or fluctuating CO2r
values during measurement.
Each absorber column includes the following items which should be checked periodically and replaced
when necessary:
Foam Filters
The gray foam filters used inside the absorber columns become worn over time and should be inspected
regularly and replaced when torn or reduced in size. The foam must be of an open celled type, such as
packing foam. The foam filters at the bottom of each column will likely require more frequent changes
versus the upper foam filters.
Absorber Filters
Each absorber column end cap contains a white plastic filter disk. Generally these do not need to be
replaced but should be checked periodically. However, they must be present to prevent any of the column
contents being drawn with the gas stream causing damage to the instrument.
“O” Rings
All “O” Rings on the absorber columns should periodically (every couple of weeks) receive a slight smear
of silicone grease to aid ease of fitting, improve the seal and extend the life of the “O” rings and to keep
them from cracking or breaking. Once sealed, end fittings should be checked to ensure that the O-rings
are seated correctly in their groove and that they are not trapped or pinched resulting in system leaks.
Page 37

TARGAS-1 Menu Overv iew (Flow Chart)
The flowchart on the next page describes an overview of the touch display for the TARGAS-1. When the
instrument is first powered up, there is a brief period where the Splash screen is shown. After this time,
the instrument goes into the warm -up period which is approximately 10-15 minutes and the Measure
screen is displayed. During and after the warm-up period, the user has the ability to navigate through the
menus as shown in the flowchart below. The following sections describe each screen and its functionality.
Splash Screen
The Splash screen is always shown on the display when the TARGAS-1 is off. When the instrument is
first powered up, the Splash screen is refreshed and displayed momentarily followed by the Measure
screen.
Page 38
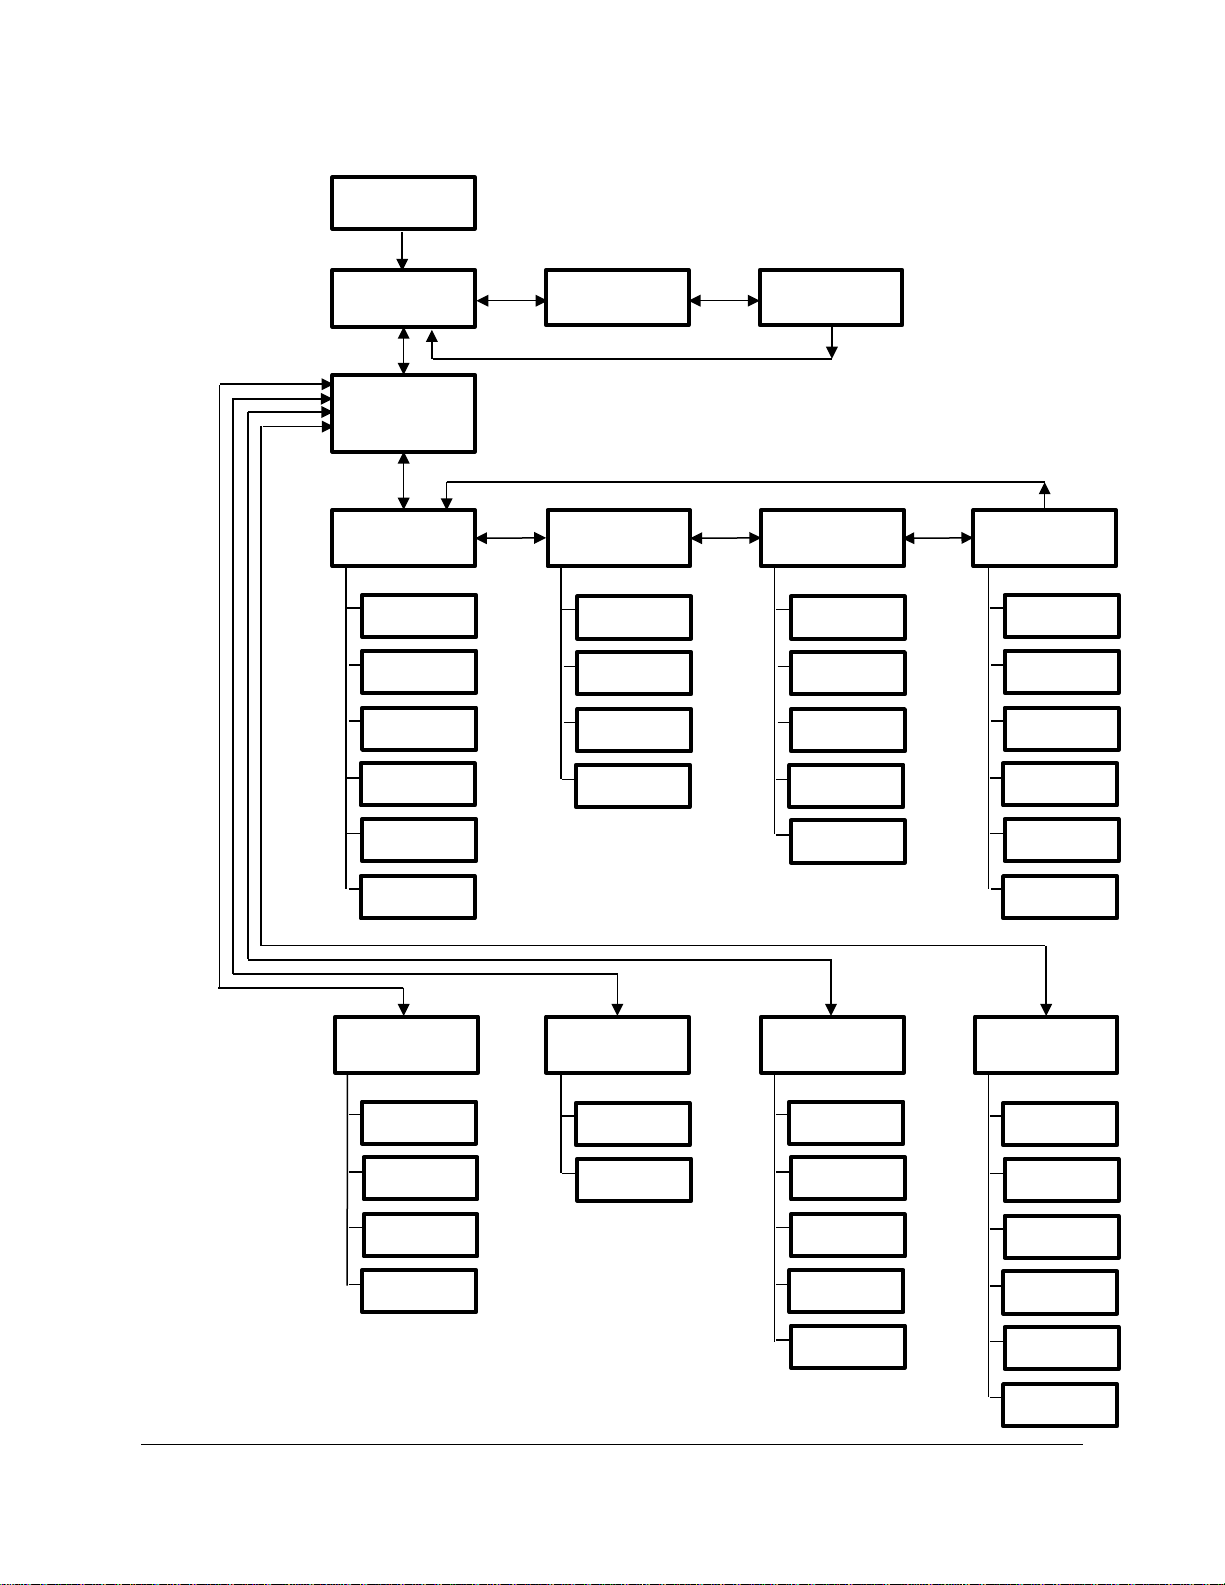
Splash Screen
Measure
Screen 1
Measure
Screen 2
Graphic
Display Screen
Main Menu
Settings 1
Menu
Settings 2
Menu
Settings 3
Menu
Settings 4
Menu
Device Mode
RB
RS Fac t
Zero
Graph
Reset Abs
Alarm Sound
Averaging
Intervals
TARGAS ID
Probe Port
Ref On Time
An On Time
Alarms
Flow
Host Port
Reset WiFi
WiFi Power
Set Clock
Defaults
Ship Mode
Calibration
Menu
Diagnostics
Menu
Processes
Menu
Info
Menu
SRC
CPY
Injection
Custom
About
Contact
CO2
H2O
Touch Cal
PAR
Light Unit
CO2 IRGA
H2O IRGA
Battery
CO2 Zeros
H2O Zeros
Advanced
Page 39
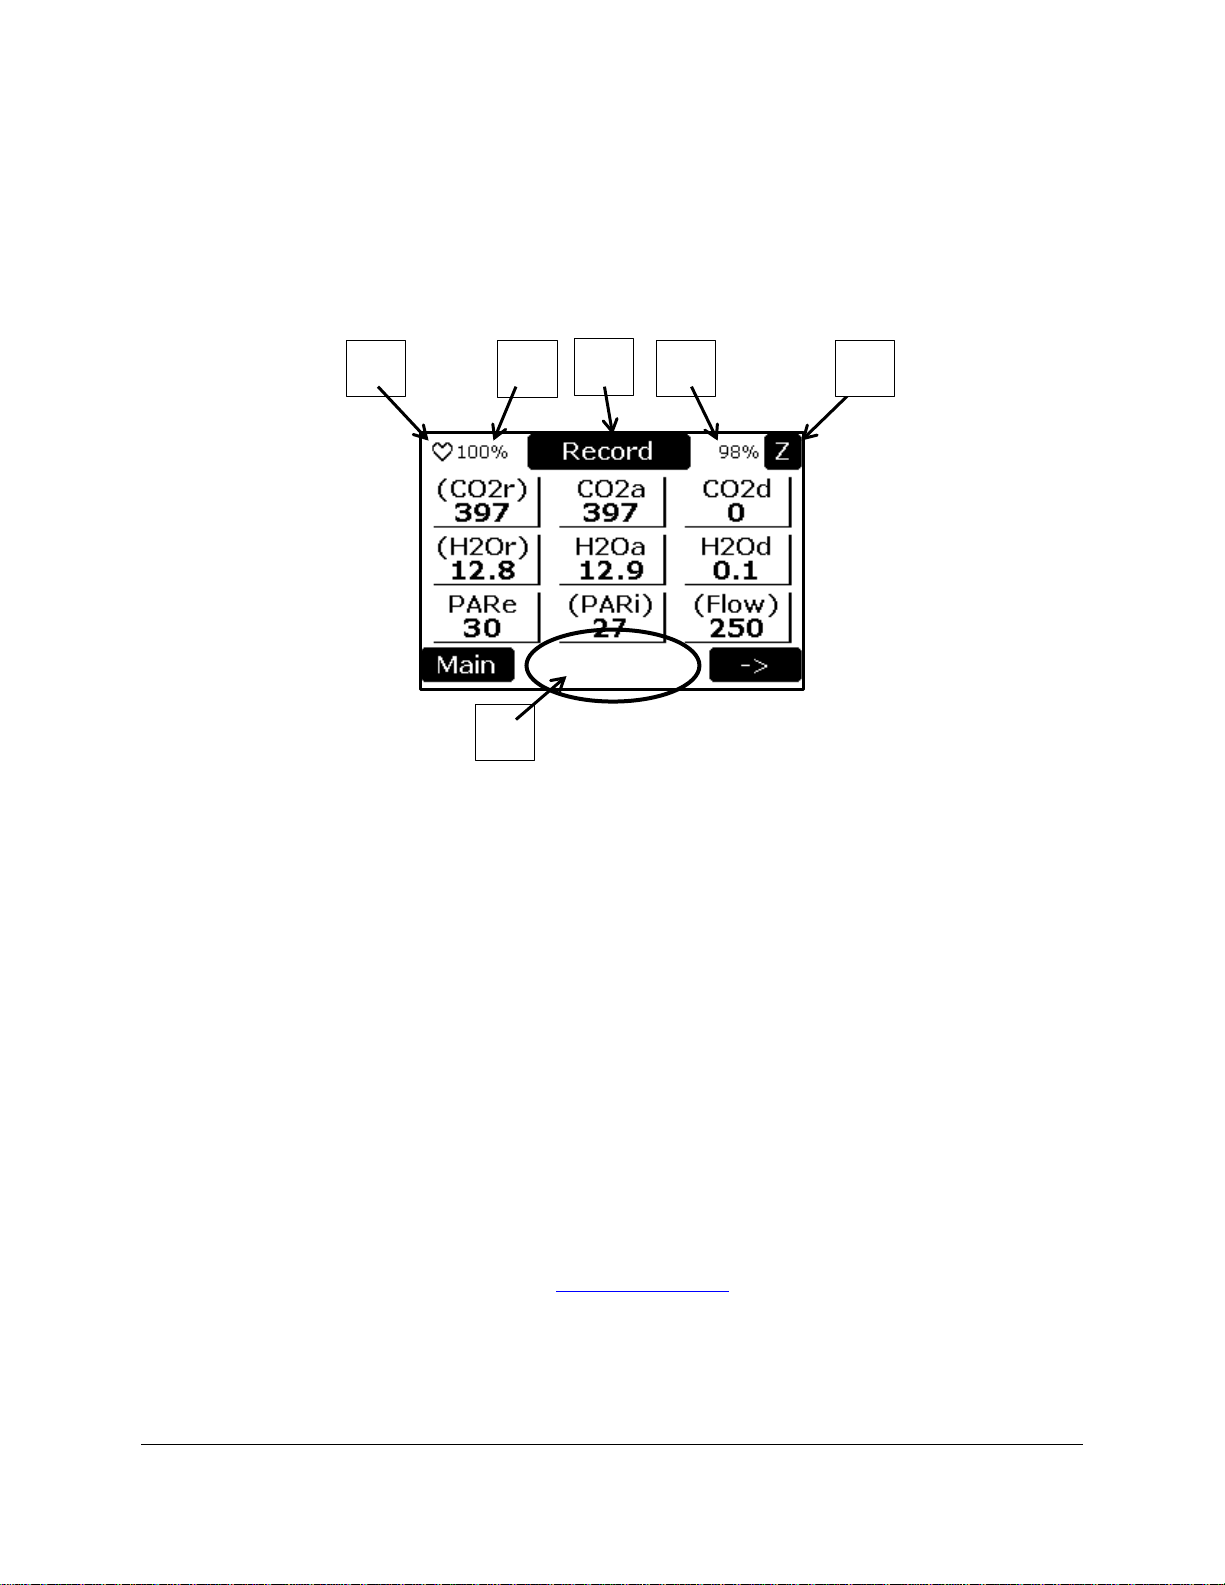
General Screen Info
1
2
4
5
6
3
New screens are displayed by the user selecting either the lower left or the lower right buttons. Generally
speaking, the left button brings you back to the previous screen and the right button to the next available
screen.
Measure Screen Info
Each screen contains common features.
1. There is a pulsing
return to normal 1 second display updates when the display has changed to extended mode with
5 second updates.
2. The percentage value in the top left corner is the percentage of battery charge remaining. If
proceeded by a ‘+‘, it means the battery is being charged.
3. The Record button saves data as a marked record in the USB memory stick, and also sends the
record to the host and WiFi ports. Data can also be recorded by pressing the recording switch on
the PLC leaf cuvette handle.
4. The percentage value in the top right corner is the estimated percentage of Auto-zer o absor ber
column capacity remaining based on the number of zeros performed since the last time the
counter was reset by the user (See Reset Zero Absorber on page 57).
5. The ‘Z’ button is used to initiate a manual zero.
6. A status or error message can be displayed in the Status Area.
♥ icon to confirm that the TARGAS-1 display is actively on. Press this icon to
Parameters in Parenthesis
Any parameter (i.e. Flow) that has a parenthesis is an active button that gives a direct link to a user
adjustable setting that can be changed. On completion of the setting, it returns to the measurement
screen from where it started. These are called Direct Link Settings
.
Page 40
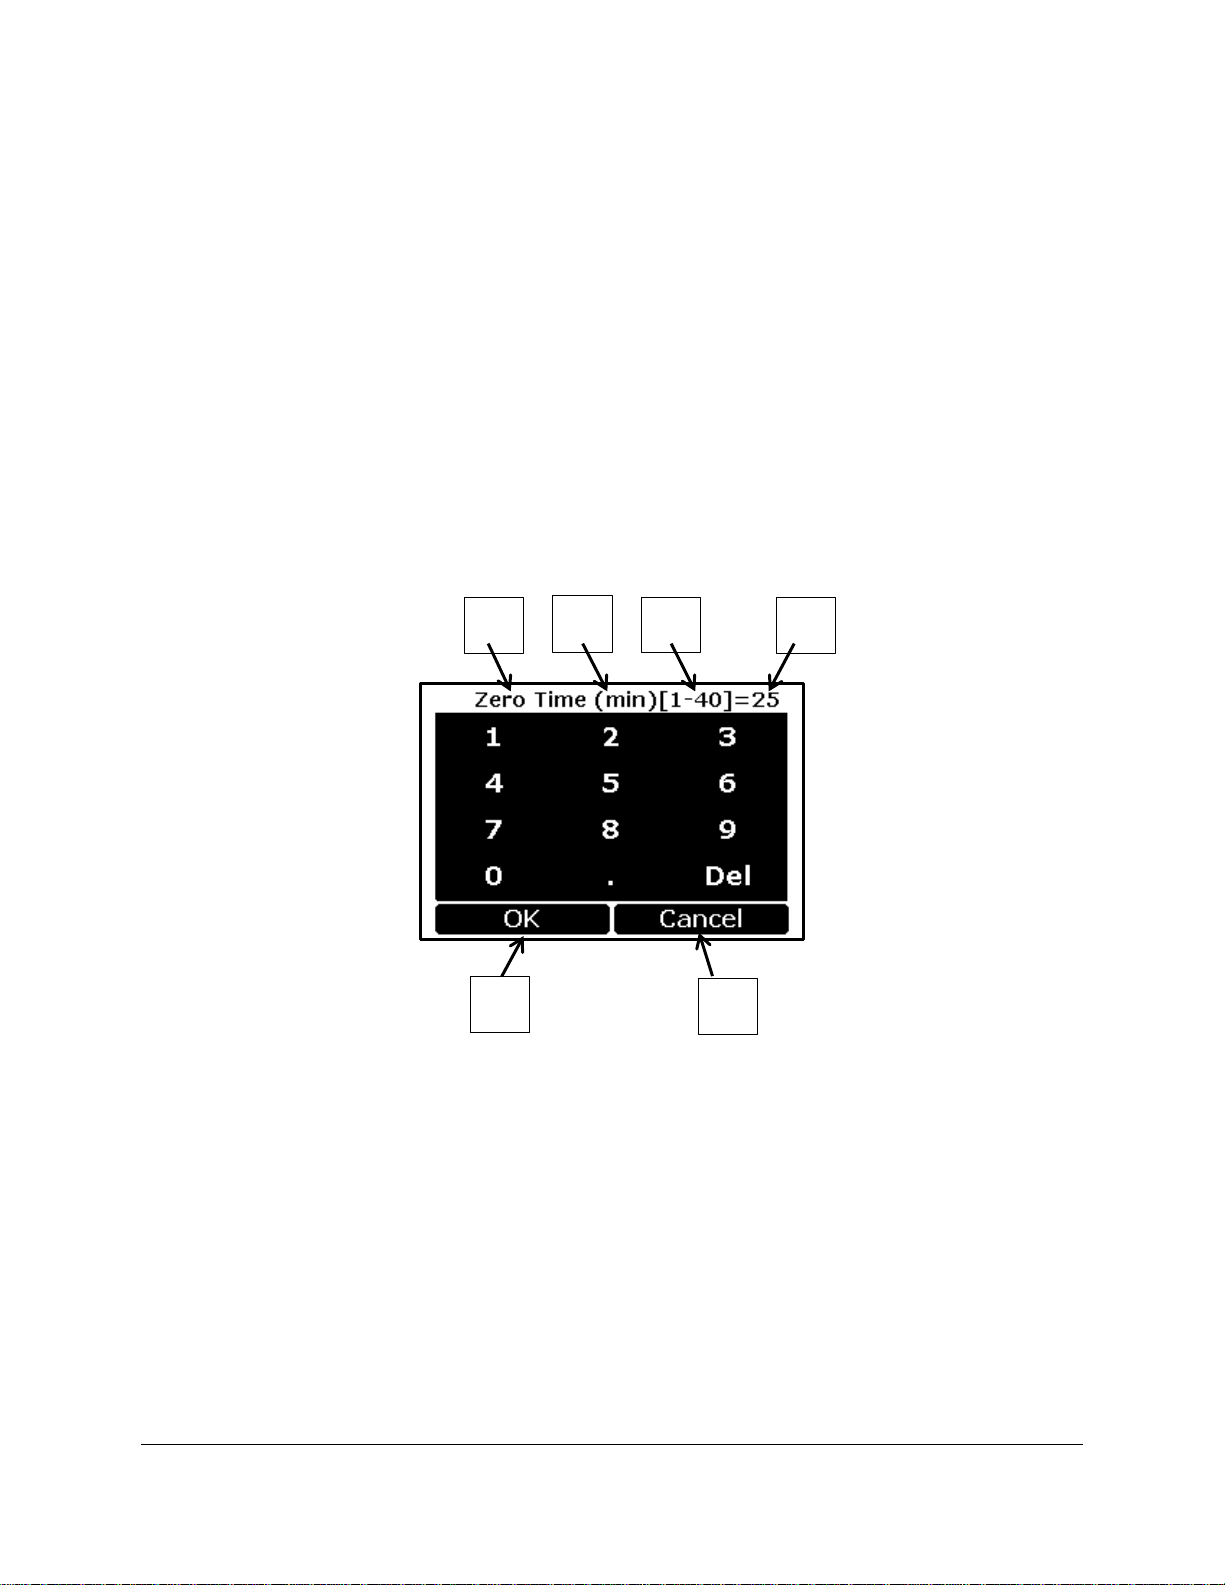
Heartbeat and Display Update Rate:
6
1
3
4
5
2
The flashing heartbeat ♥ icon is updated each time the display is upd ated (whether the CO2 or other
values change or not). Normally the display is updated every 1 second. However, in extended mode the
display is updated every 5 seconds (even though data is still being output and recorded every 1 second).
The extended mode saves power and prevents display ghosting. Extended mode begins approximately
30 seconds after the last keypress is made on any measurement screen. Return to normal 1 second
update rate will occur when:
• Any screen button is pressed
• The heartbeat icon is pressed
• Any new CO2 reading is more than 10% changed from the previous CO2 reading.
Data Entry Screen
The Data Entry Screen is used to enter new numerical values. The screen is displayed whenever a new
value is required.
1. The name of the parameter.
2. The units associated with the parameter.
3. The acceptable range of values.
4. The value being entered.
5. The OK button selects the entered value. If the entered value is out of range, it is set to the
minimum or maximum value. It then returns to the previous screen.
6. The Cancel button returns to previous screen without changing the initial value.
Page 41
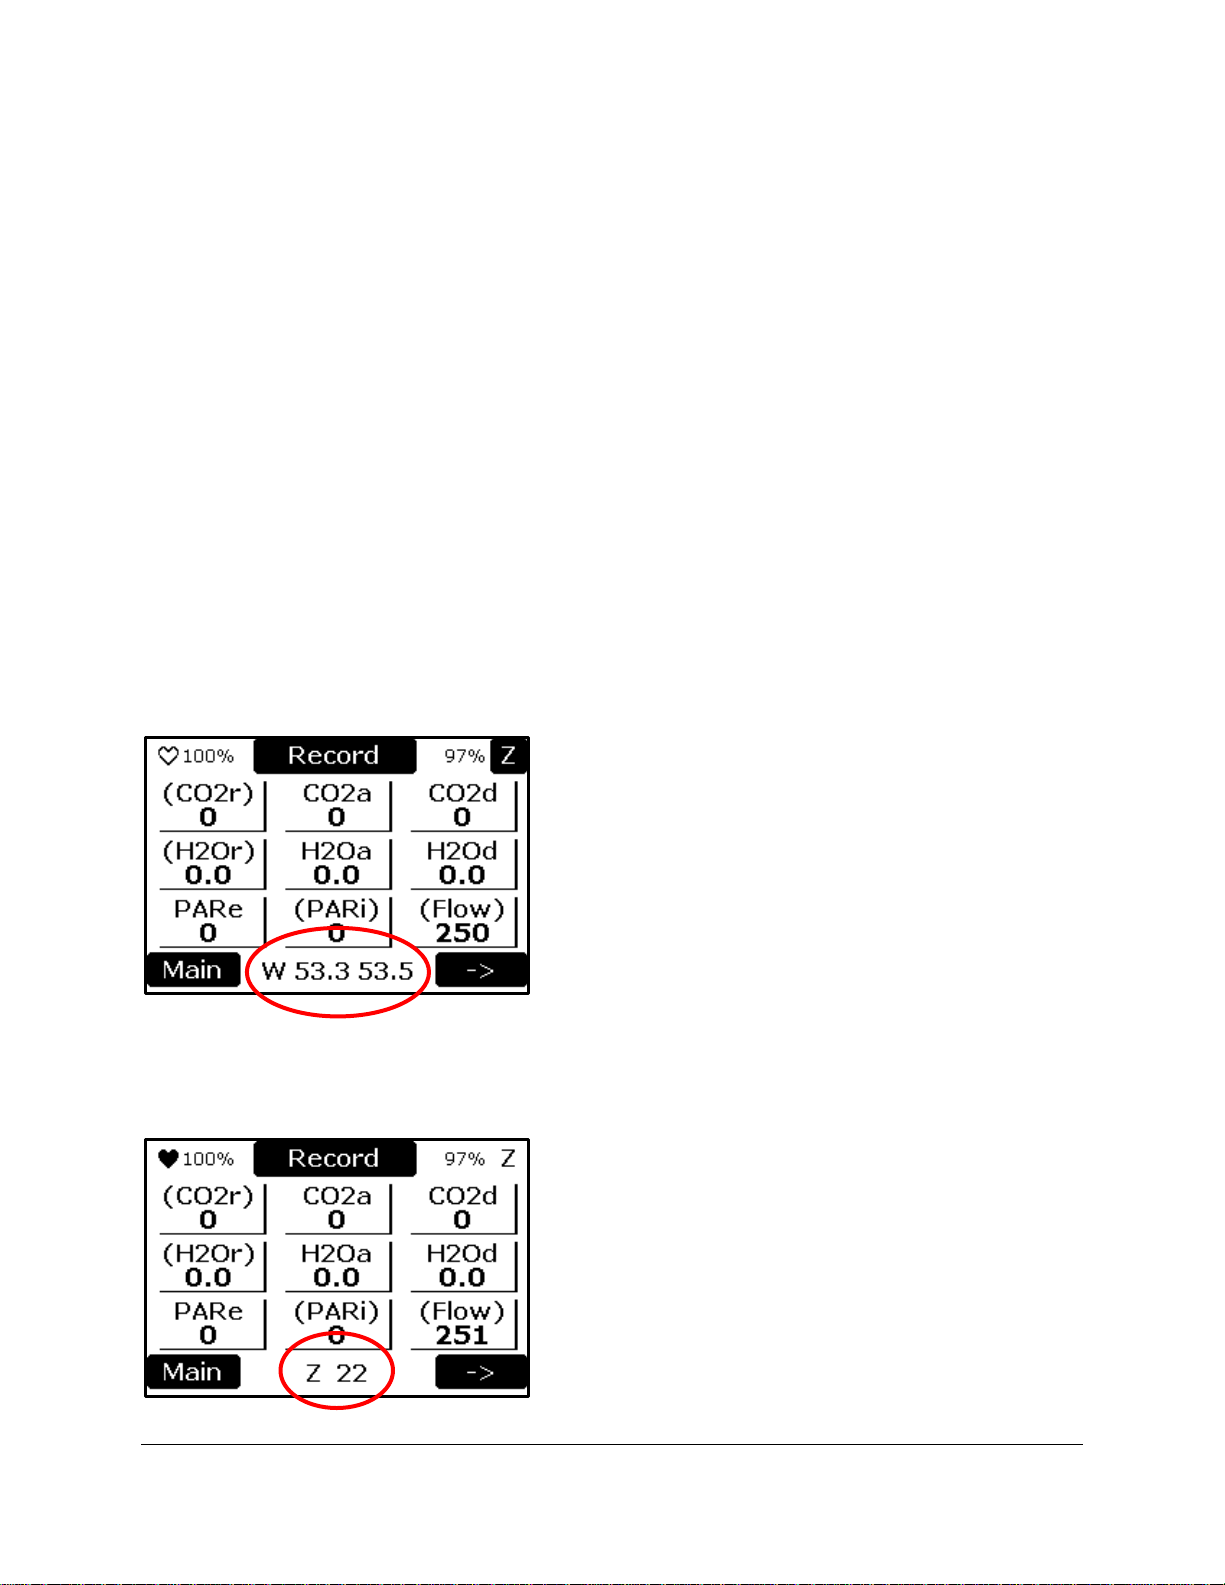
Measurement Mode
The Measurement Mode is comprised of three screens:
1. Measure Screen 1 - The initial screen is the Measure Screen 1 which displays the values of CO
and H
0 concentrations.
2
2. Measure Screen 2 - The next screen is the Measure Screen 2 which displays device relevant
data.
3. Graphic Display Screen – The third screen is the Graphic Display Screen which displays
graphical information over time.
Measure Screen 1
The Measure Screen 1 is displayed after the Splash screen once the TARGAS-1 is powered up. For the
first 10-15 minutes, the TARGAS-1 goes into a warm-up period until it achieves its final temperature of
55°C and an Auto-Zero is performed. During this time, messages are displayed in the Status Area that
indicate that the instrument is in the warm-up stage. We recommend that you have the TARGAS-1
connected to the charger to preserve the internal battery during the initial warm-up period. The buttons
are operational during the warm-up period.
Warming Up
2
The status of ‘W 53.3 53.5’ means the TARGAS-1 is warming and the CO
and the H
Performing a Zero
O IRGA temperature is 53.5°C. During warm-up, the CO2 and H2O values are displayed as 0.
2
IRGA temperature is 53.3°C
2
Page 42
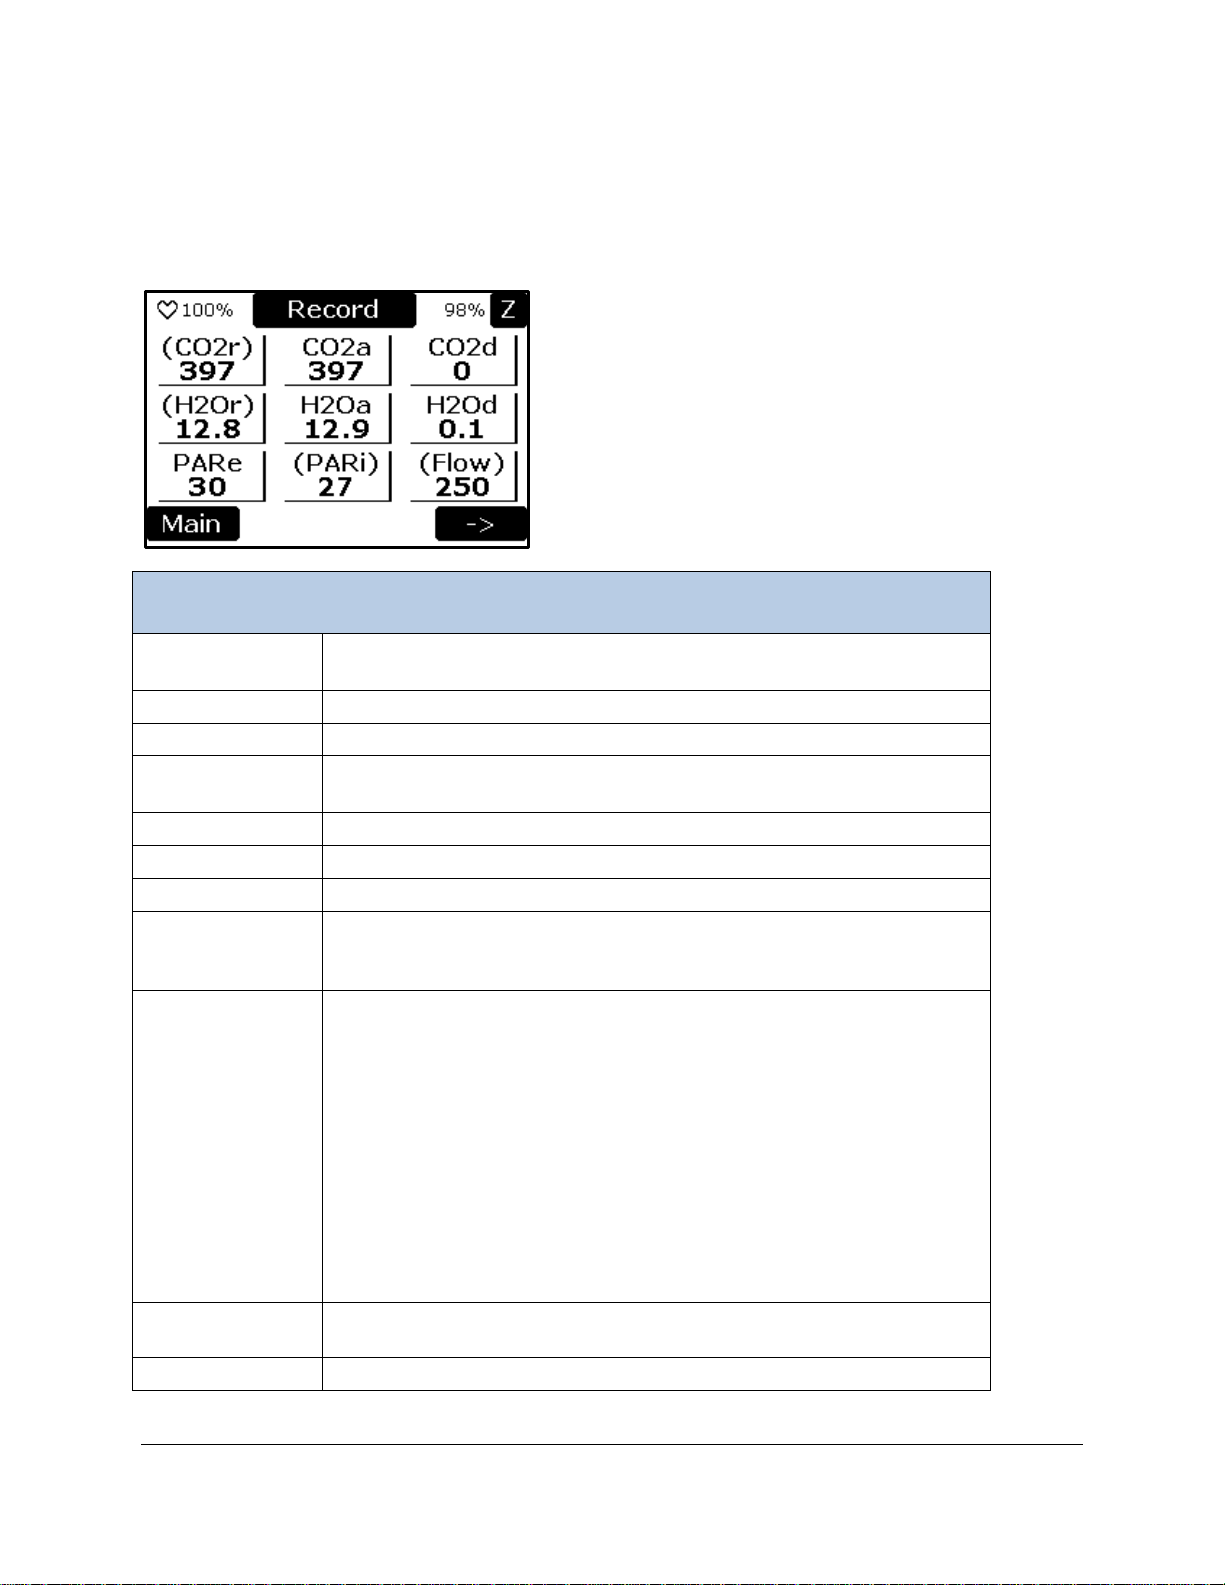
The status of ‘Z 22’ means the TARGAS-1 is performing a zero. The number is how many seconds it will
Measure Screen 1
CO2r
CO2 Reference (ppm)
• This parameter is user adjustable from 0 to ambient
CO2a
CO2 Analysis or sample (ppm)
CO2d
CO2 Differential (ppm)
H2Or
H2O Reference (mb)
• This parameter is user adjustable from 0 to ambient
H2Oa
H2O Analysis or sample (mb)
H2Od
H2O Differential (mb)
PARe
PAR External (μmol m-2 s-1)
PARi
PAR Internal (μmol m-2 s-1)
light unit is used
Flow
Cuvette Flow Rate (cc/min)
before recording a measurement.
Main Button
The Main screen is displayed when this button is selected. See Direct
Link Settings on 49.
Right Arrow
Selects the next measurement screen (Measure Screen 2).
take to complete the sequence. A normal zero starts at 35 seconds. During a Zero, the CO
and H2O
2
values are displayed as 0 as the readings are not valid during the Zero sequence.
At the completion of the warm-up and the first Zero, valid readings are displayed.
• This parameter is user adjustable up to 2500 μmol m-2 s-1 if a
• This parameter is user adjustable from 200-500 cc/min and it is
associated with the flow of air to the leaf cuvette. The cuvette
flow rate should always be at least 100 cc/min higher than the
sample flow rate (see Sample Flow Setting on page 63).
• The recommended flow rate is 250 cc/min. However, the
cuvette flow rate can be increased if you are working with
healthy plants and expecting higher rates of photosynthesis. It
can be reduced if you are expecting lower rates of
photosynthesis or if the leaf sample is small and not filling the
entire chamber window. Note that lower cuvette flow rates will
result in longer equilibration times so be a bit more patient
Page 43
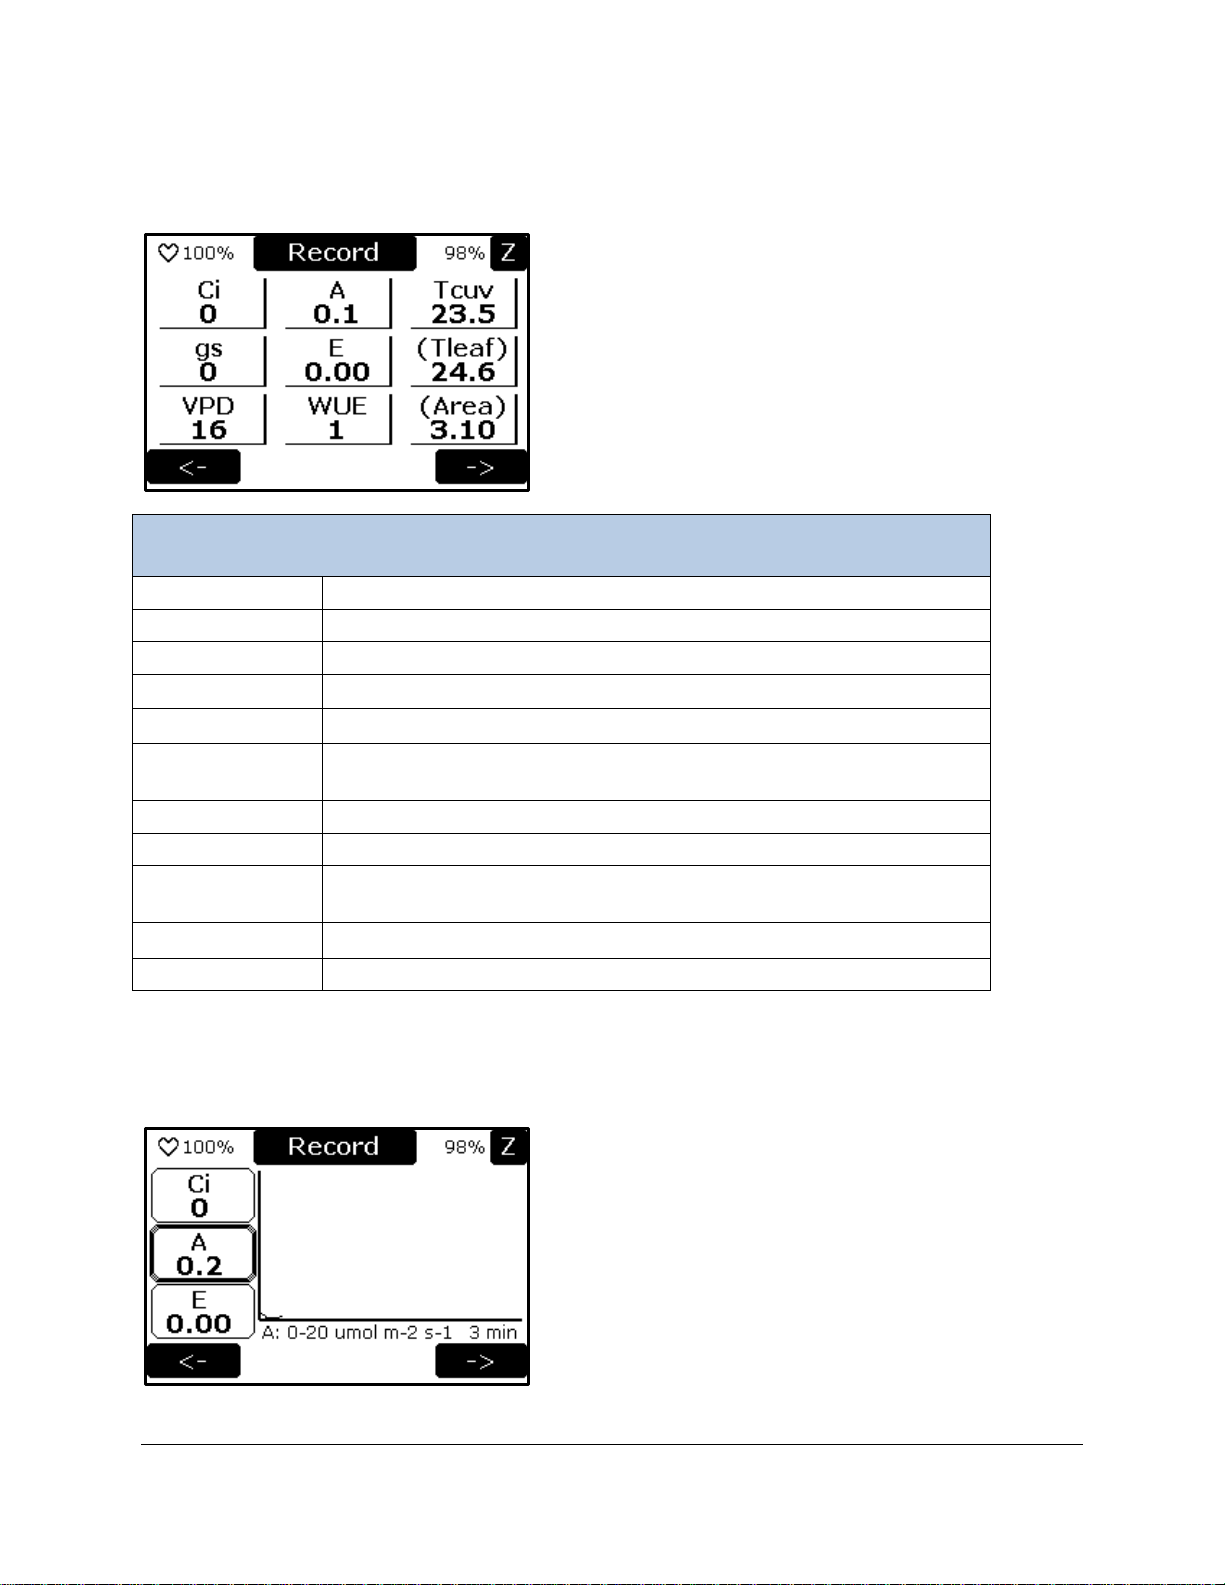
Measure Screen 2
Measure Screen 2
Ci
Leaf internal CO2 concentration (μmol mol-1)
A
Assimilation (μmol (CO2) m-2 S-1)
Tcuv
Cuvette air temperature (oC)
gs
Stomatal Conductance (mmol (H2O) m-2 S-1)
E
Transpiration, (mmol (H2O) m-2 S-1)
Tleaf
Leaf surface temperature (oC)
• This parameter is user adjustable
VPD
Vapor Pressure Deficit
WUE
Water Use Efficiency( A/E)
Area
Exposed area of the leaf (cm2)
• This parameter is user adjustable
Left Arrow
Goes back the previous screen (Measure Screen 1).
Right Arrow
Selects the next measurement screen (Graph Screen).
The Measure Screen 2 displays the values of nine parameters in real time.
Graphic Display Screen
The Graphic display screen shows a real-time display of the calculated parameters Ci, A or E.
Page 44
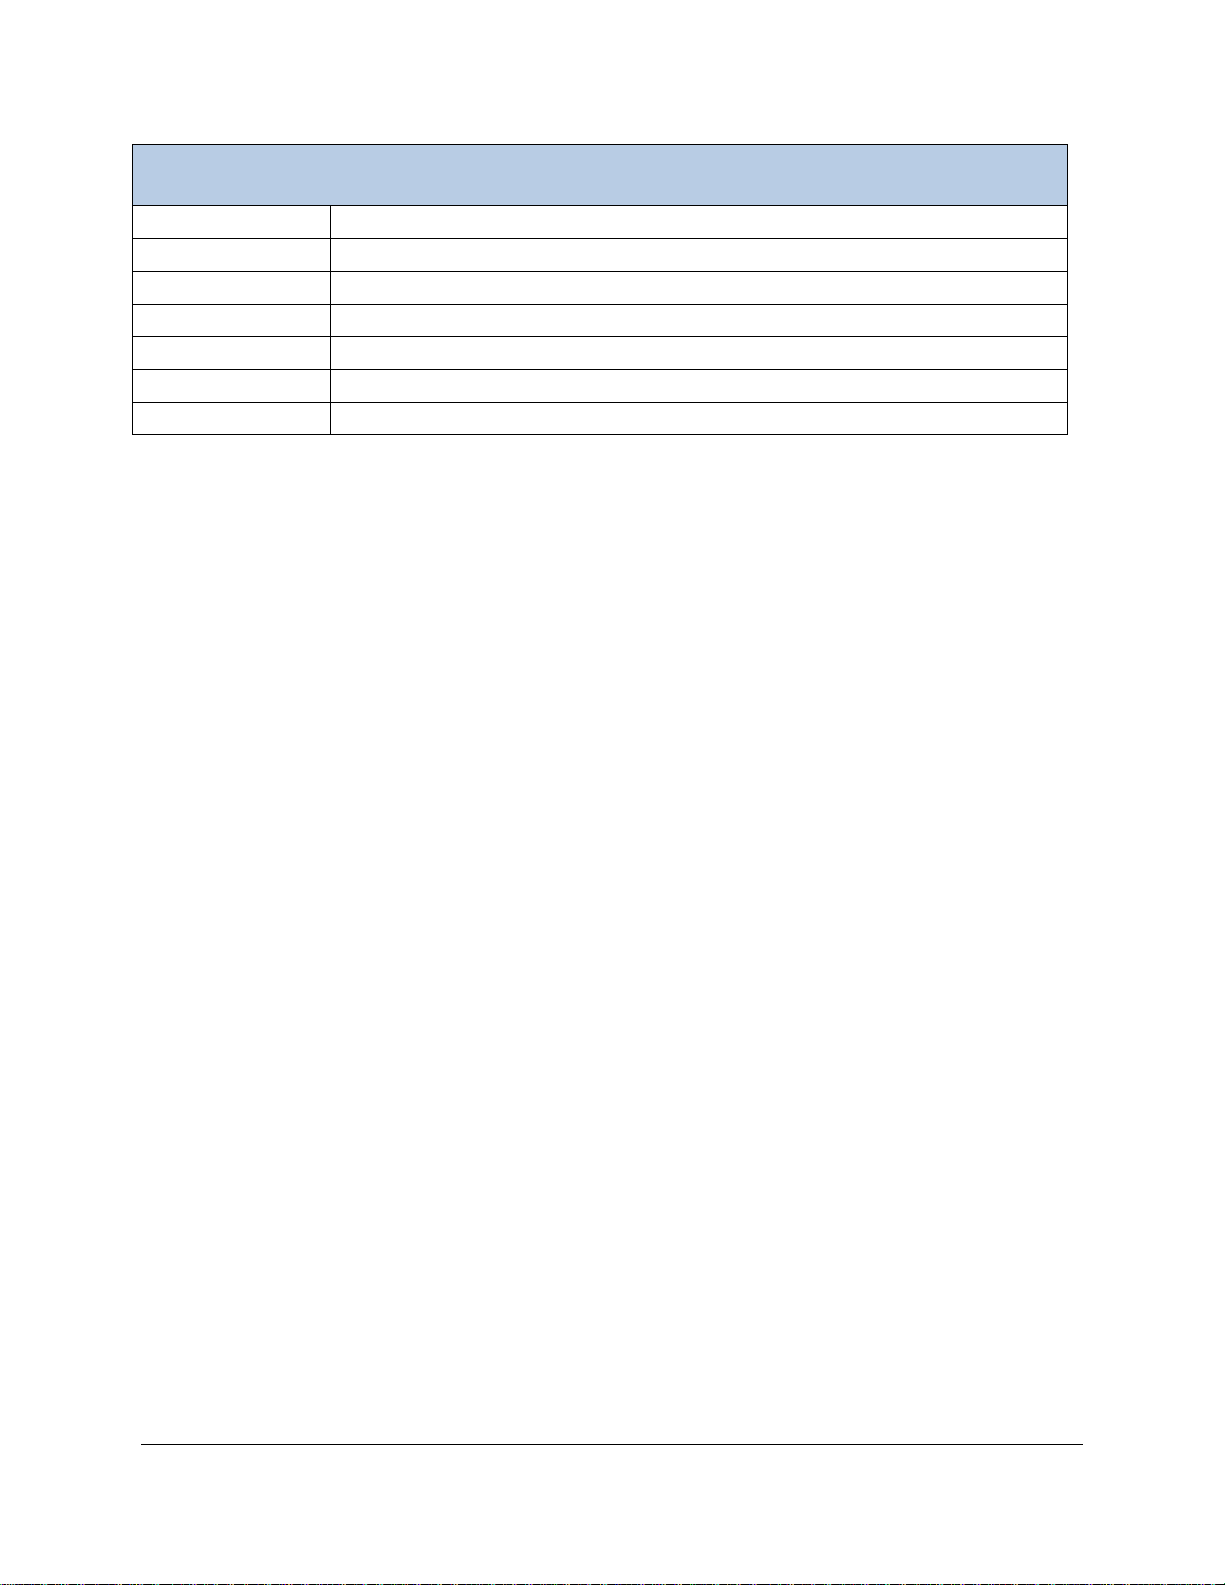
Graphical Display Screen
Ci Button
Internal or substomatal CO2 concentration. Fixed range: 0 – 1000 ppm
A Button
Assimilation. Fixed range: 0 - 20 μmol (CO2) m-2 s-1
E Button
Transpiration (Evaporation). Fixed range: 0 - 10 mmols (H2O) m-2 s-1
Y-axis
Range and units are located under the graph on left side
X-axis
X-axis time; fixed value of 3 minutes.
Left Arrow
Goes back the previous screen (Measure Screen 2).
Right Arrow
Selects the next measurement screen (Measure Screen 1).
To display one of the 3 calculated parameters simply press the corresponding button. Only one
parameter can be displayed at a time. When selected it will be have a dark border around it.
Page 45
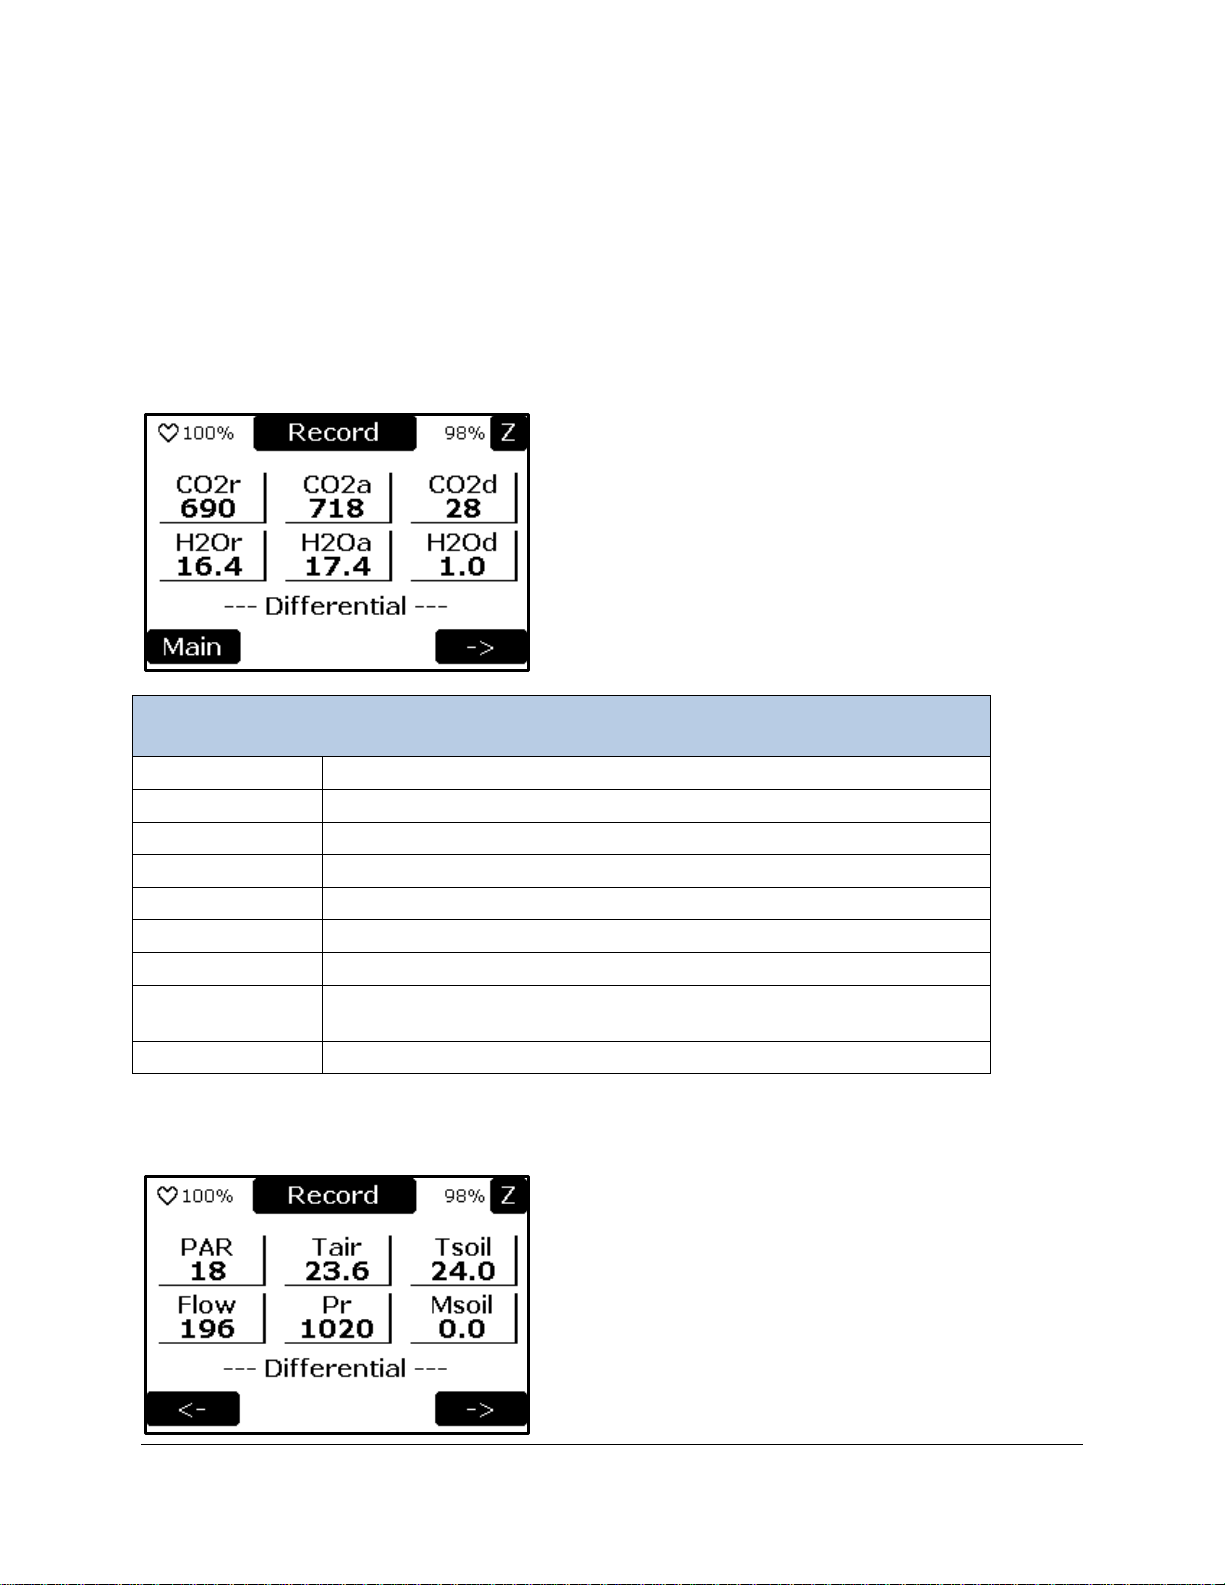
Alternative Measurement Screens
Measure Screen 1
CO2r
CO2 Reference reading ( ppm)
CO2a
CO2 Analysis reading ( ppm)
CO2d
CO2 Differential ( ppm)
H2Or
H2O Reference reading (mb)
H2Oa
H2O Analysis reading (mb)
H2Od
H2O Differential (mb)
--- Differential ---
Indicates the machine is in Differential mode
Main Button
The Main screen is displayed when this button is selected. See Direct
Link Settings on 49.
Right Arrow
Selects the next measurement screen (Measure Screen 2).
Depending on the Device Mode selection of the TARGAS-1, the Measurement screens may be different.
To learn more, see Device Mode Settings on page 53 for more information.
Diff Mode
Measure Screen 1
The Measure Screen 1 displays the values of six parameters in real time.
Measure Screen 2
The Measure Screen 2 displays the values of six parameters in real time.
Page 46
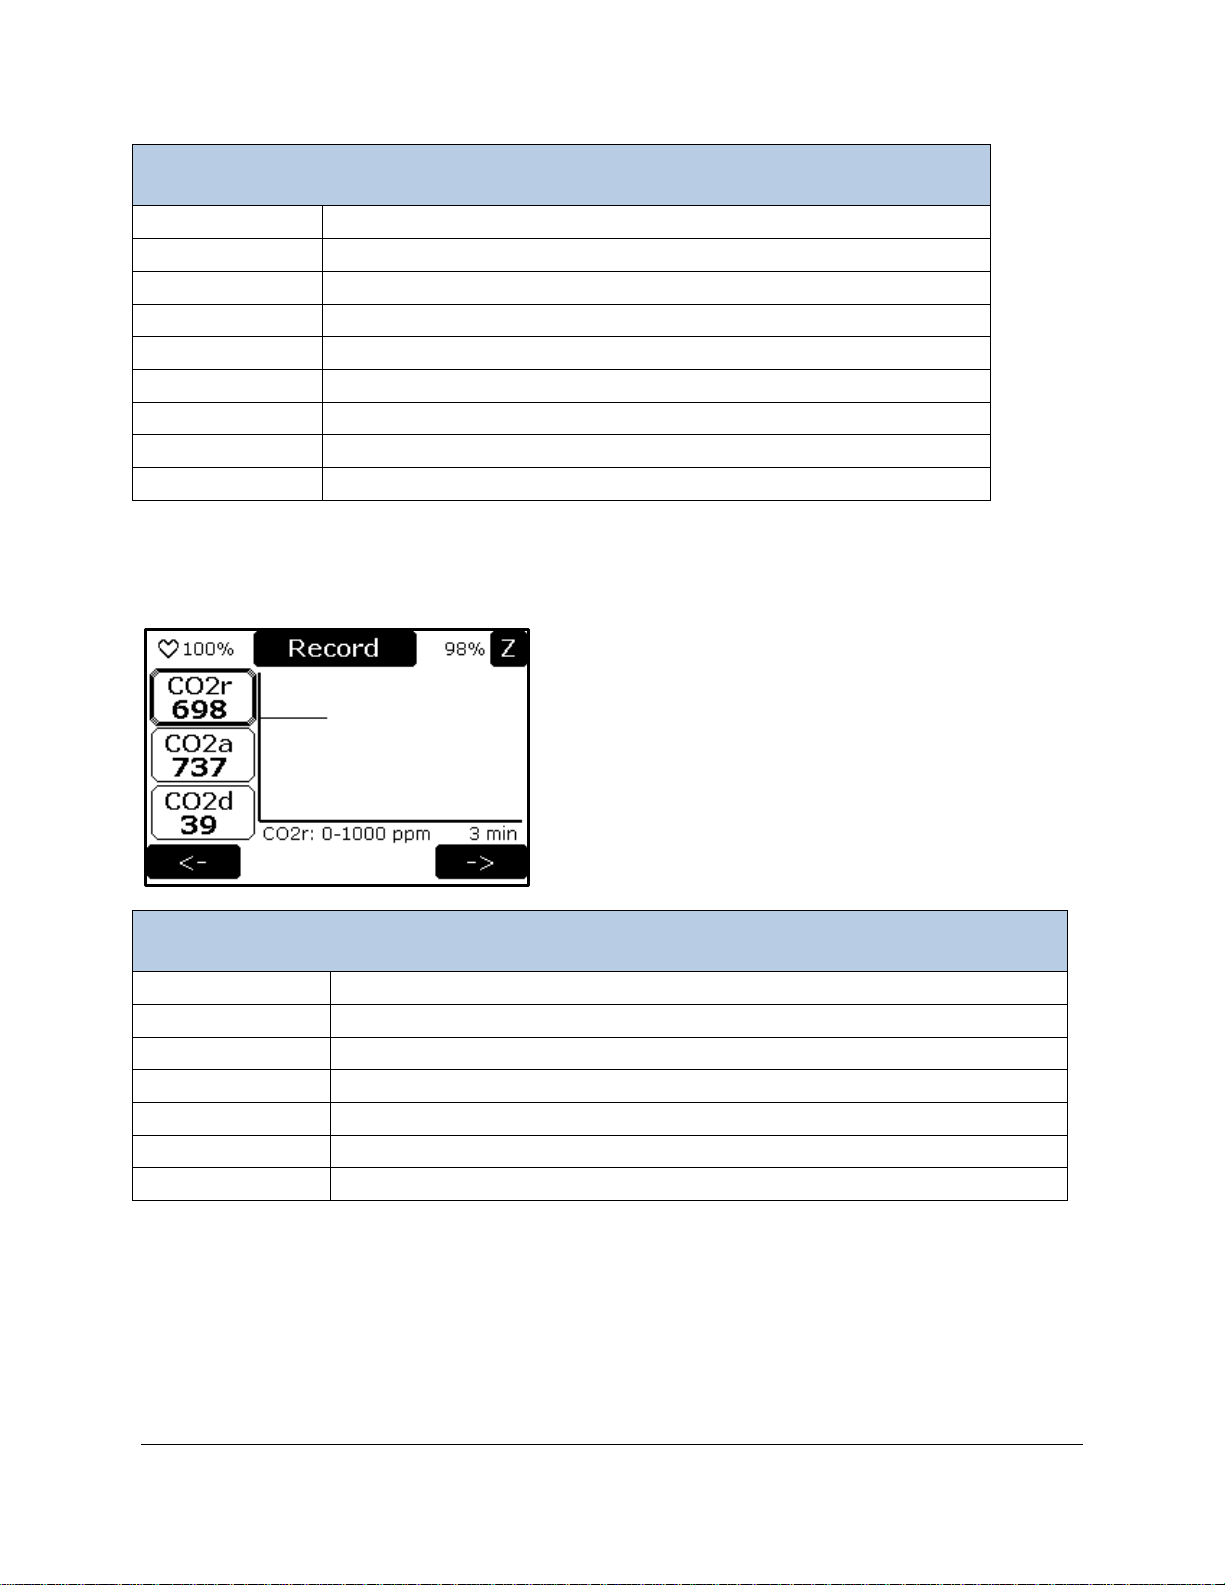
Measure Screen 2
PARi
PAR reading from sensor (μmol m-2 s-1)
Tair
Air temperature (oC)
Tsoil
Soil temperature (oC)
Flow
Sample gas flow ( cc/min)
Pr
Air pressure in IRGAs (mb)
Msoil
Soil moisture content (%)
--- Differential ---
Indicates the machine is in Differential mode
Left Arrow
Goes back the previous screen (Measure Screen 1).
Right Arrow
Selects the next measurement screen (Graph Screen).
Graphical Display Screen
CO2r Button
CO2 Reference. Fixed range: 0 – 1000 ppm
CO2a Button
CO2 Analysis. Fixed range: 0 – 1000 ppm
CO2d Button
CO2 Differential. Fixed range: -50 – +50 ppm
Y-axis
Range and units
X-axis
X-axis time (range 3 minutes)
Left Arrow
Goes back the previous screen (Measure Screen 2).
Right Arrow
Selects the next measurement screen (Measure Screen 1).
Graphic Display Screen
The Graphic display screen shows a real-time display of CO2r, CO2a or CO2d.
To display one of the 3 parameters simply press the corresponding button. Only one parameter can be
displayed at a time. When selected it will be have a dark border around it.
Page 47
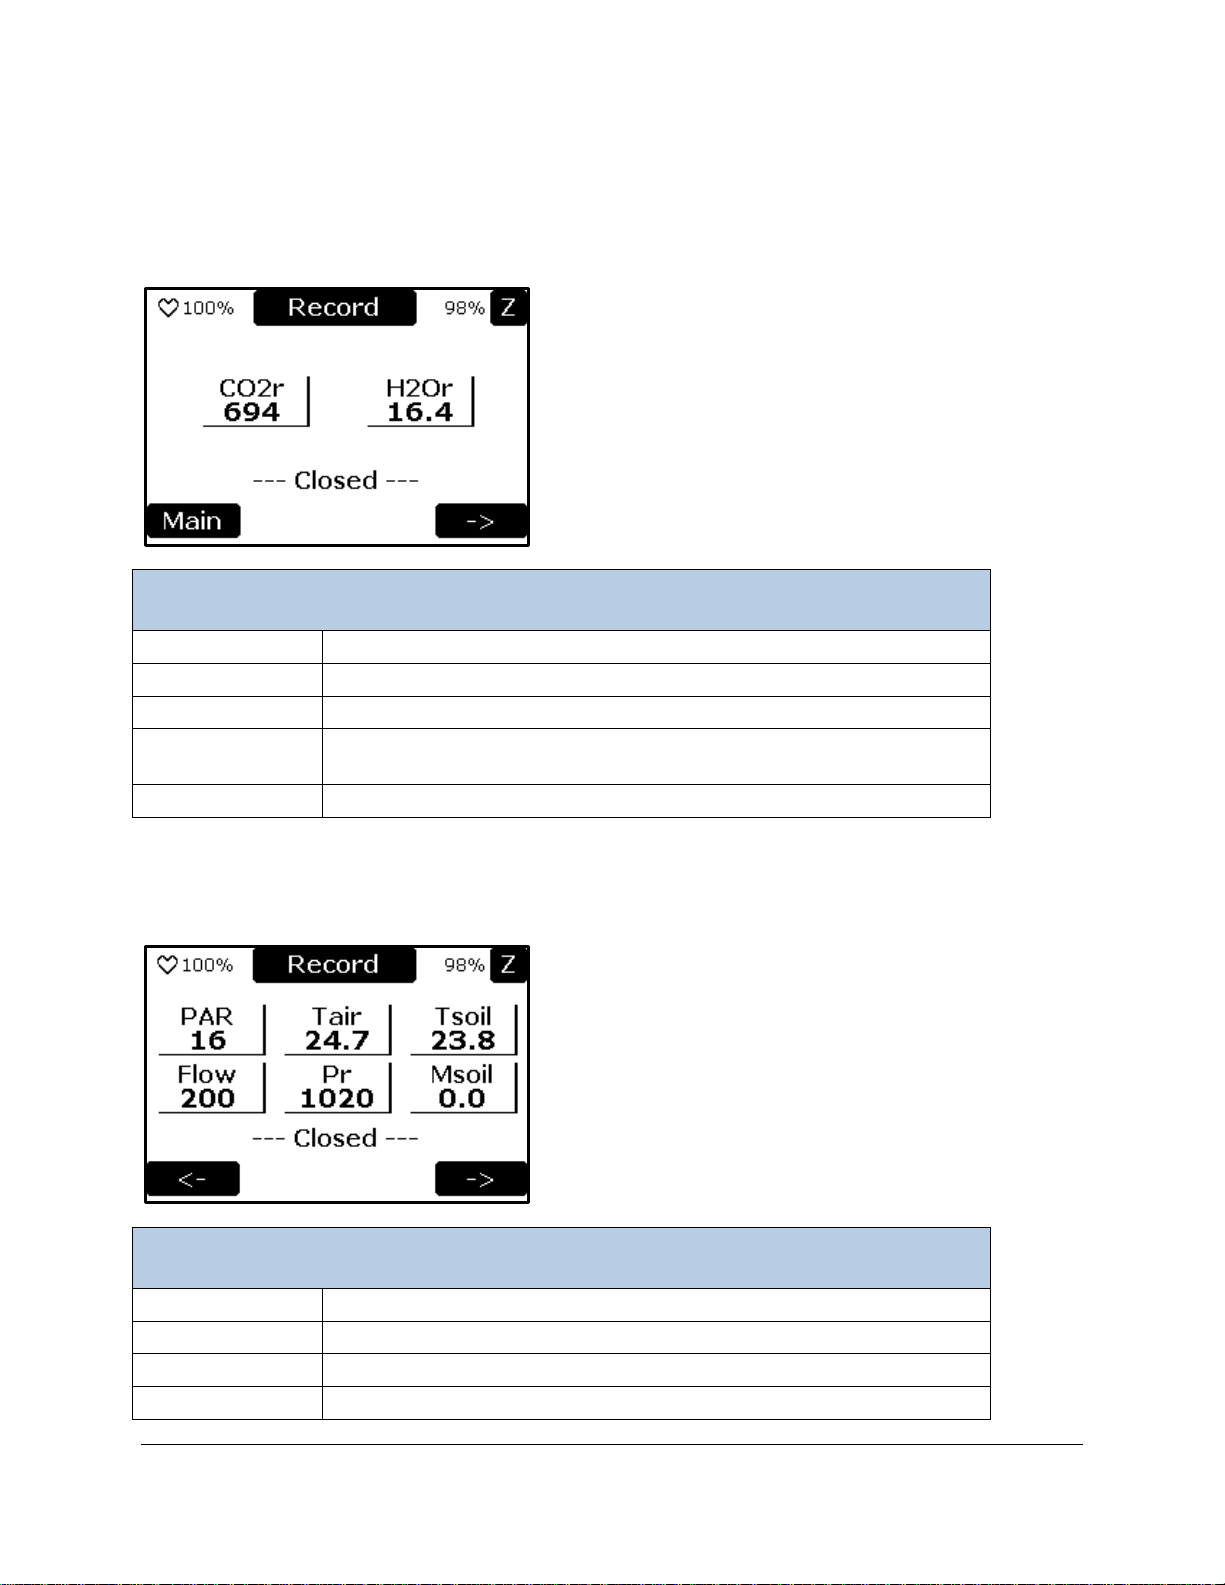
Closed or Absolute Mode
Measure Screen 1
CO2r
CO2 Reference (ppm)
H2Or
H2O Reference (mb)
--- Closed ---
Indicates the machine is in Closed mode
Main Button
The Main screen is displayed when this button is selected. See Direct
Link Settings on page 49.
Right Arrow
Selects the next measurement screen (Measure Screen 2).
Measure Screen 2
PARi
PAR reading from sensor (μmol m-2 s-1)
Tair
Air temperature (oC)
Tsoil
Soil temperature (oC)
Flow
Sample gas flow ( cc/min)
Measure Screen 1
The Measure Screen 1 displays the values of 2 parameters in real time.
Measure Screen 2
The Measure Screen 2 displays the values of six parameters in real time.
Page 48
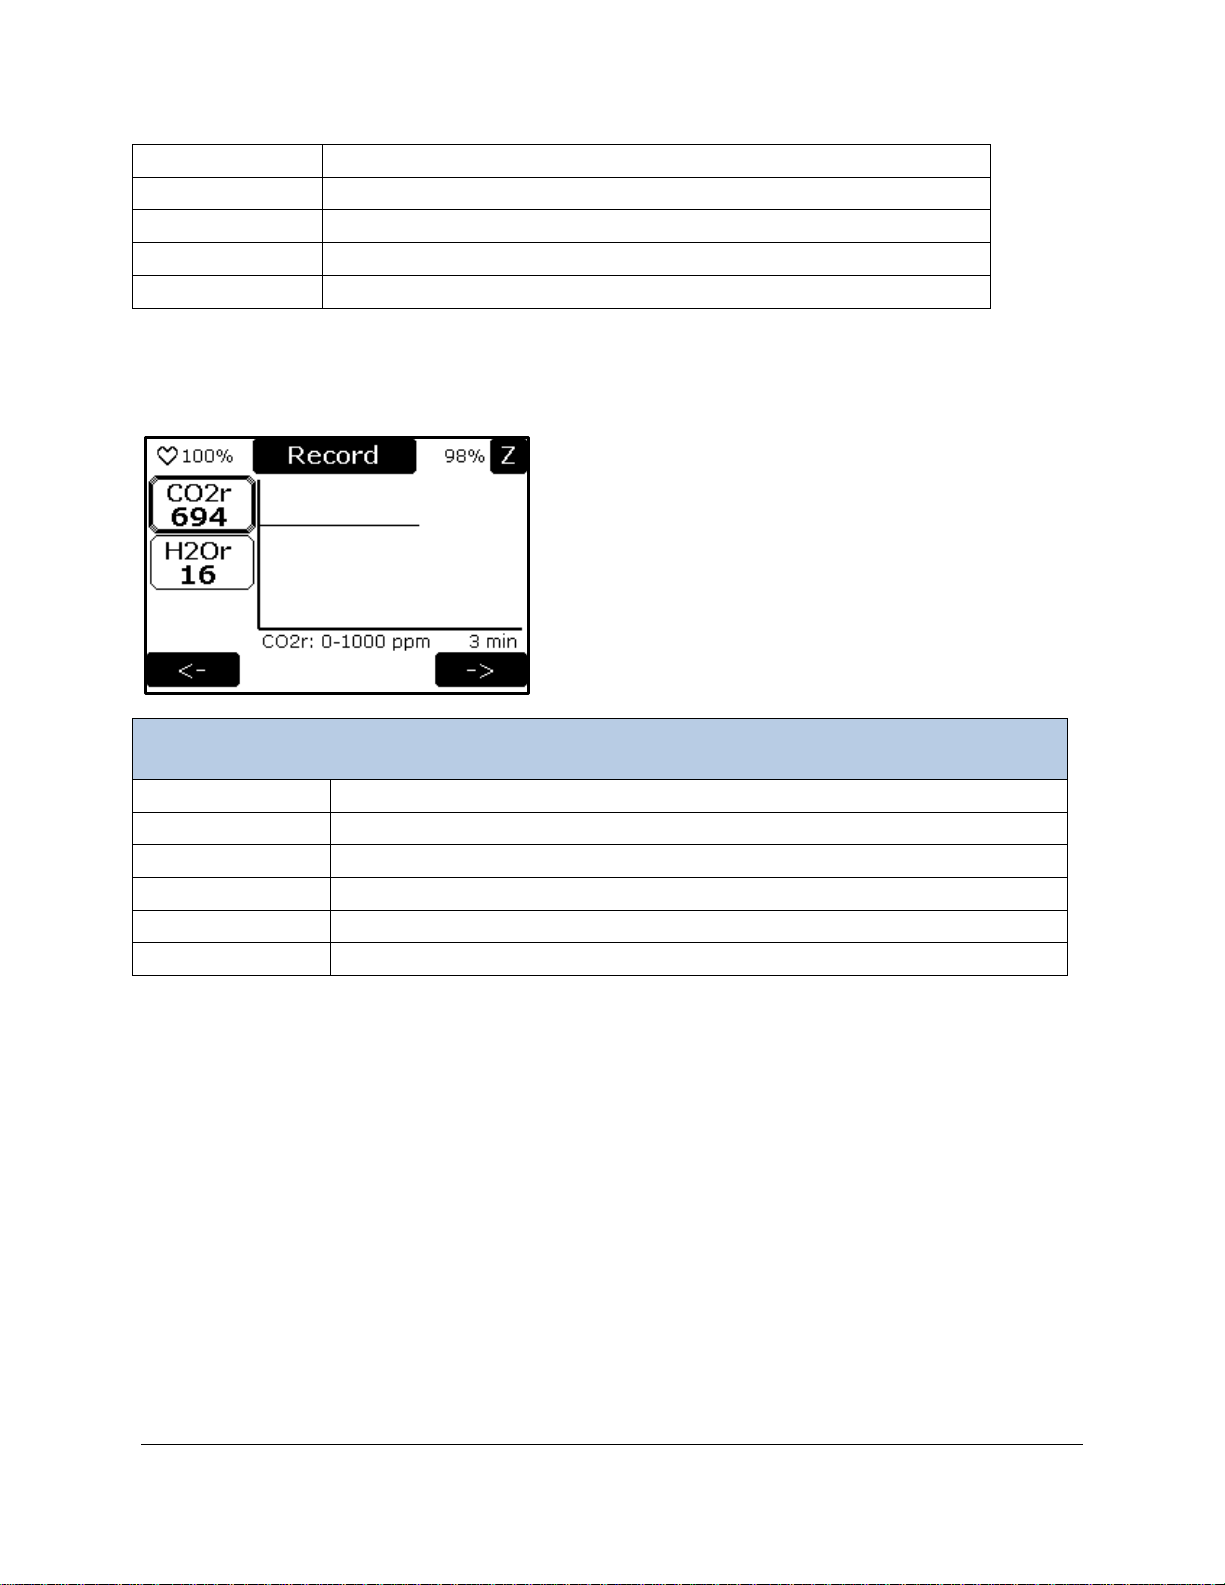
Pr
Air pressure in IRGAs (mb)
Msoil
Soil moisture content (%)
--- Closed ---
Indicates the machine is in Closed mode
Left Arrow
Goes back the previous screen (Measure Screen 1).
Right Arrow
Selects the next measurement screen (Graph Screen).
Graphical Display Screen
CO2r Button
CO2 Reference: Fixed range: 0 – 1000 ppm
H2Or Button
H2O Reference: Fixed range: 0 – 30 mb
Y-axis
Range and units
X-axis
X-axis time (range 3 minutes)
Left Arrow
Goes back the previous screen (Measure Screen 2).
Right Arrow
Selects the next measurement screen (Measure Screen 1).
Graphic Display Screen
The Graphic display screen shows a real-time display of CO2r or H2Or.
To display one of the 2 parameters simply press the corresponding button. Only one parameter can be
displayed at a time. When selected it will be have a dark border around it.
Page 49
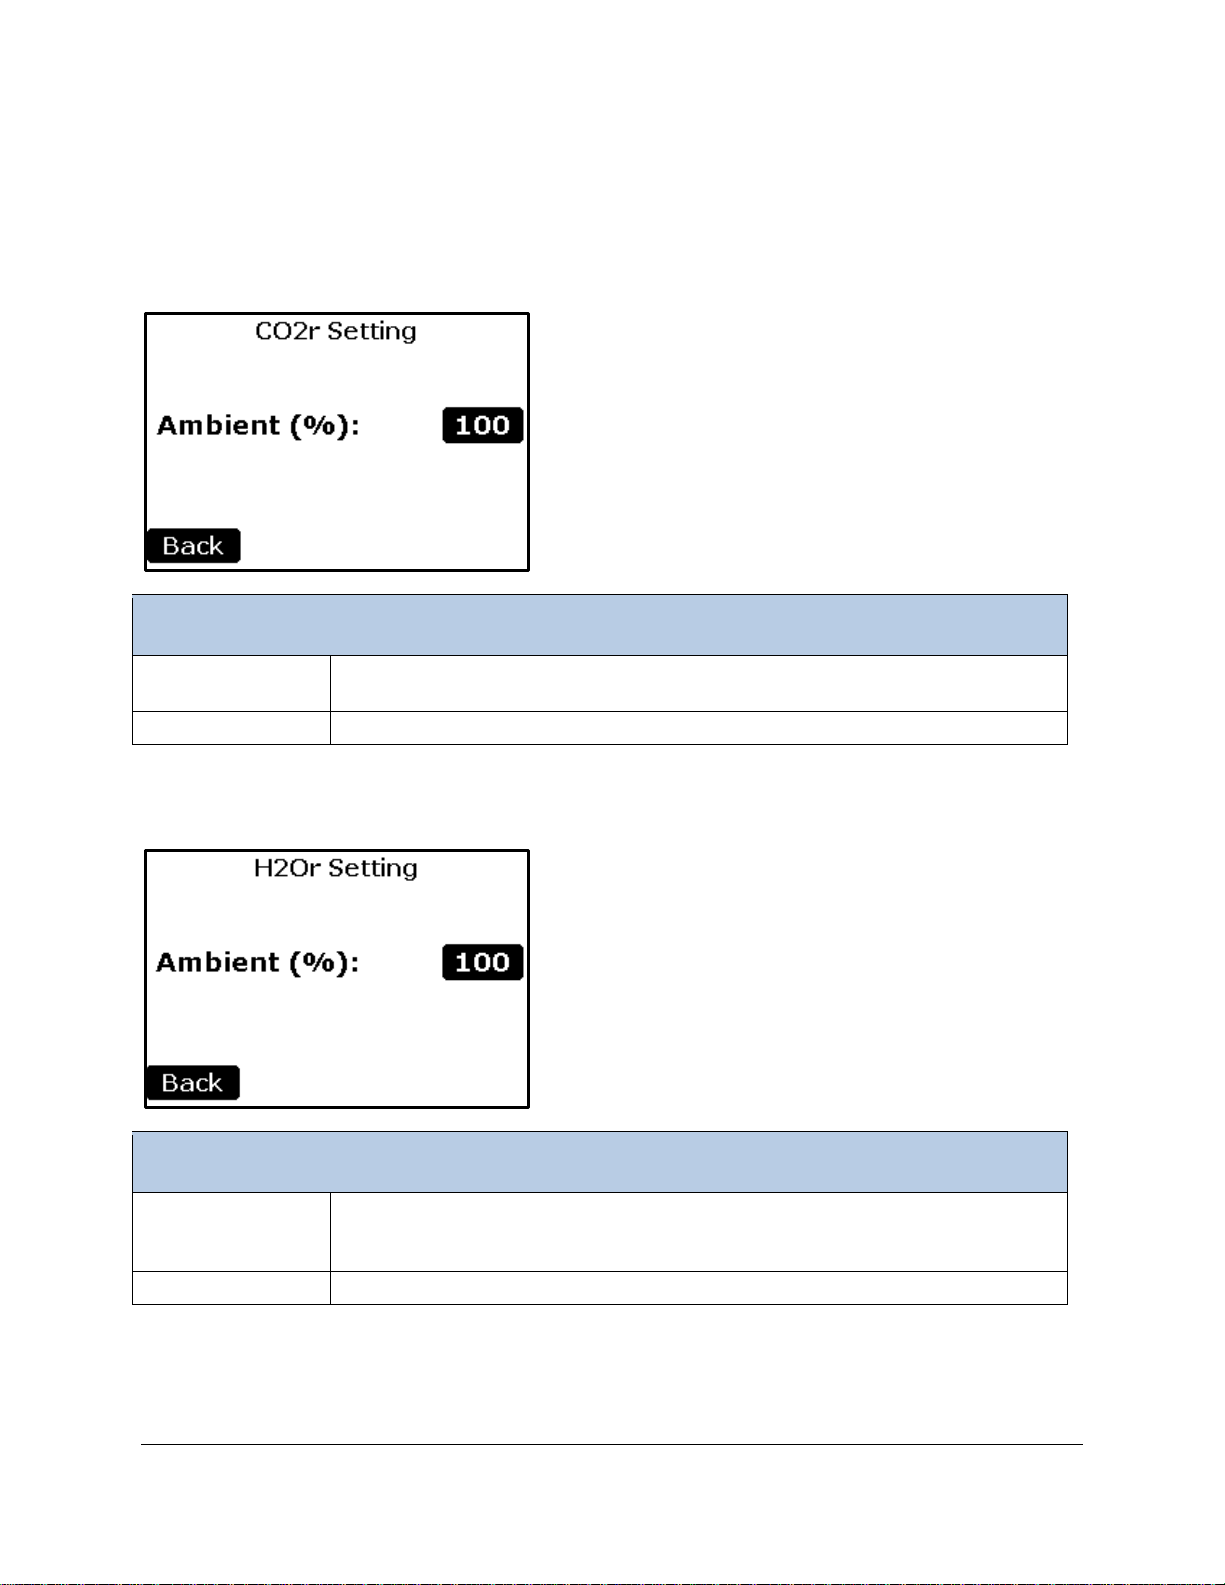
Direct Link Settings
CO2r Setting
Ambient Button
Controls the amount of CO2 based on current ambient level. The range is from 0
to 100% of Ambient. (Default is 100%)
Back Button
Goes back to Measure Screen 1
H2Or Setting
Ambient Button
Controls the amount of H2O based on current ambient level. The range is from 0
Note: when Reducing CO2 it increases the H2O due to the absorption process.
Back Button
Goes back to Measure Screen 1
These are settings that are associated with any parameter with parenthesis around them on the 3
Measure Screens. They directly link to fields within the Measurement Screens and are user adjustable.
CO2r Setting
H2Or Setting
to 100% of ambient. (Default is 100%)
Page 50
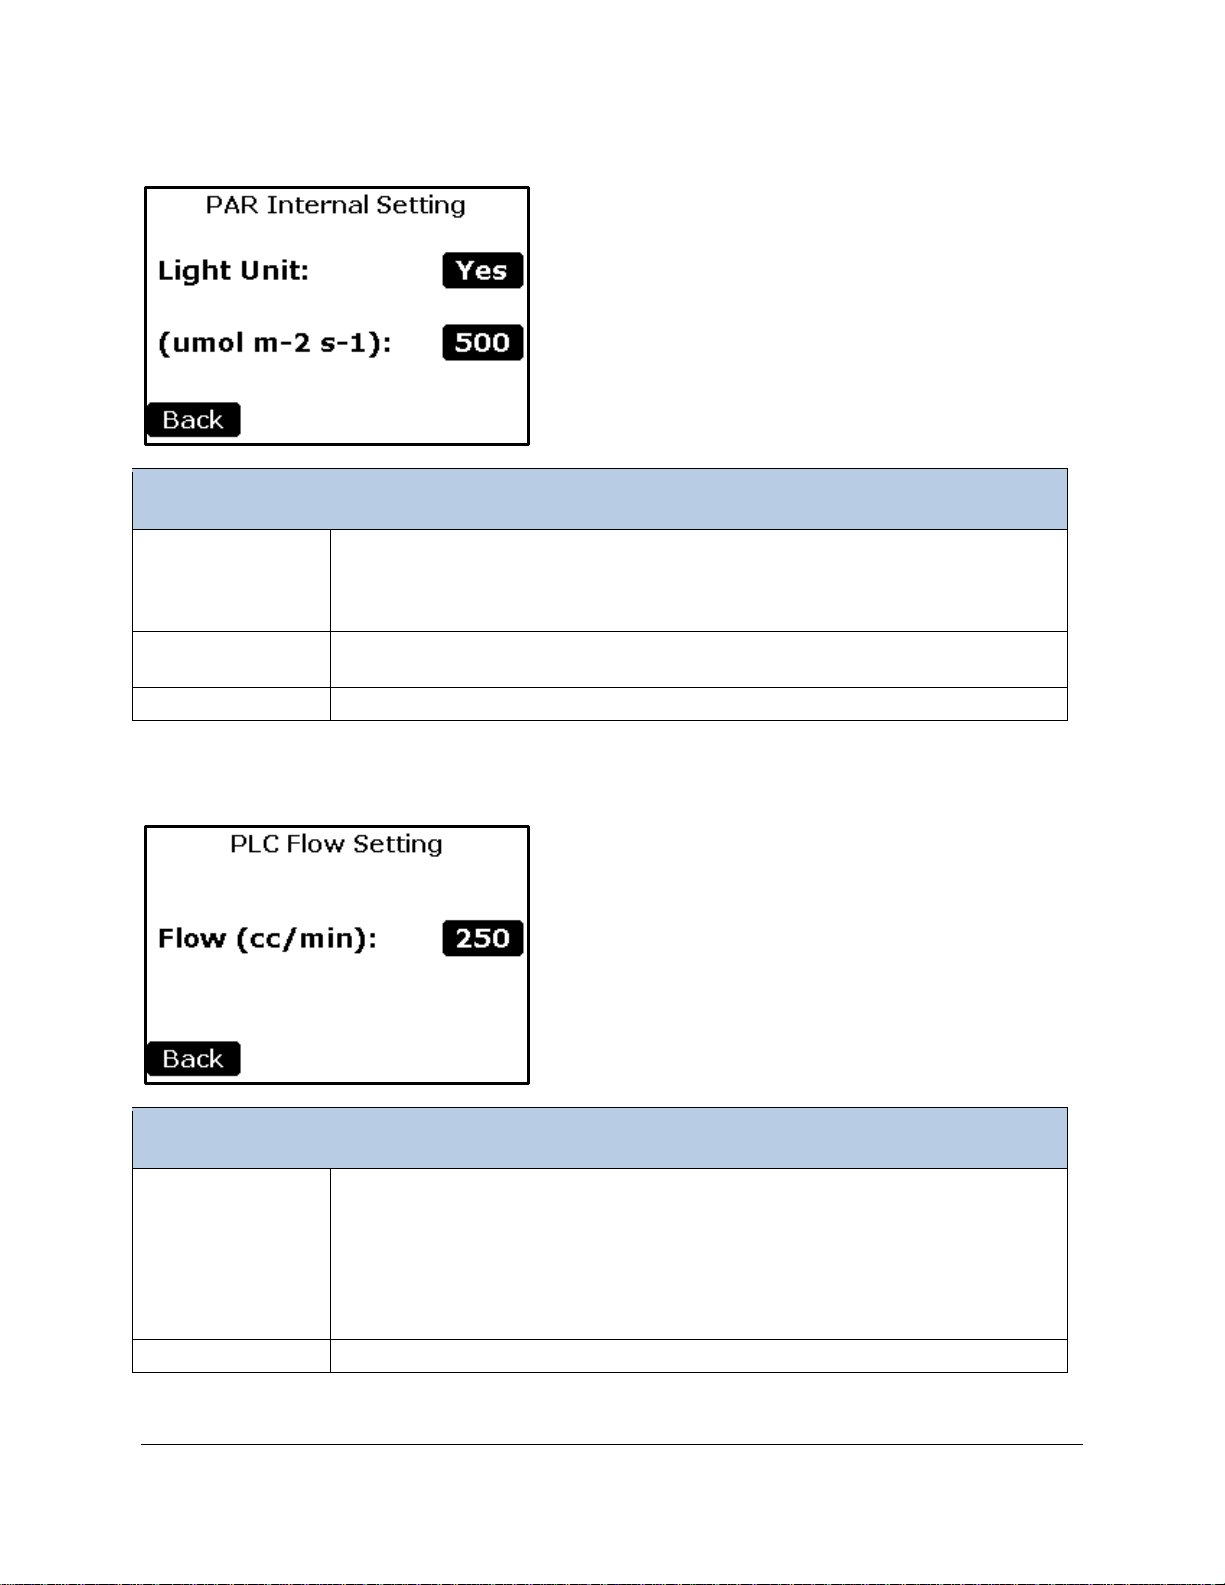
PARi Setting
PARi Setting
Light Unit Button
The Selection is Yes/ No
PARe sensor is used to determine ambient PAR.
(μmol m-2 s-1)
Button
If a light unit is being used, this value then appears and is used to control the
light unit. (Range is 0 - 2500 μmol m-2 s-1)
Back Button
Goes back to Measure Screen 1
Flow Setting
Flow Button
Sets the flow rate (cc/min) to the PLC (Range 200 - 500). The default and
times so be a bit more patient before recording a measurement.
Back Button
Goes back to Measure Screen 1
Yes – Indicates that a light unit is being used.
No – Indicates no light unit is being used and ambient light is your source. The
Flow Setting
recommended value is 250 cc/min. However, the cuvette flow rate can be
increased if you are working with healthy plants and expecting higher rates of
photosynthesis. It can be reduced if you are expecting lower rates of
photosynthesis or if the leaf sample is small and not filling the entire chamber
window. Note that lower cuvette flow rates will result in longer equilibration
Page 51
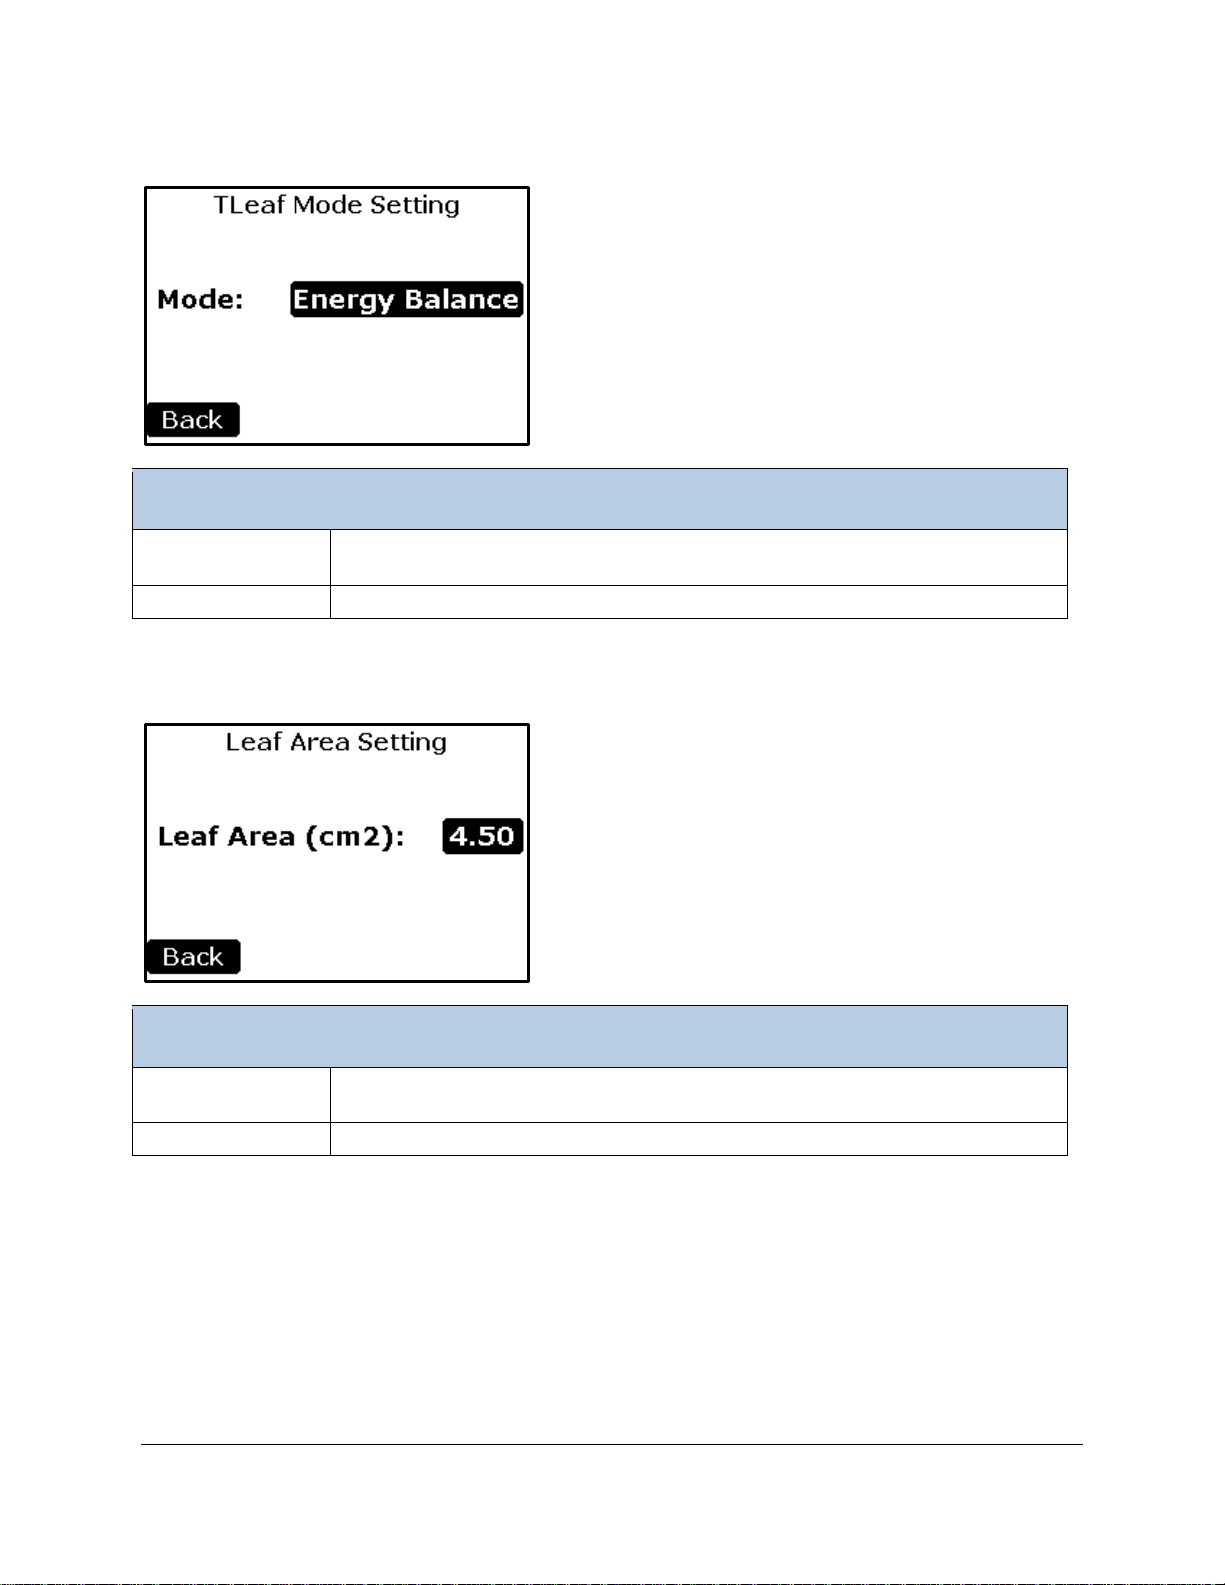
TLeaf Setting
TLeaf Setting
Mode Button
Select the leaf temperature measurement method (Energy Balance or Chamber
Temperature)
Back Button
Goes back to Measure Screen 2
Area Setting
Leaf Area Button
Sets the Leaf Area (cm2) used in the photosynthesis calculations. (Range 0.5 –
4.50). If the leaf cuvette is filled completely then 4.50 is the proper value.
Back Button
Goes back to Measure Screen 2
Area Setting
Page 52
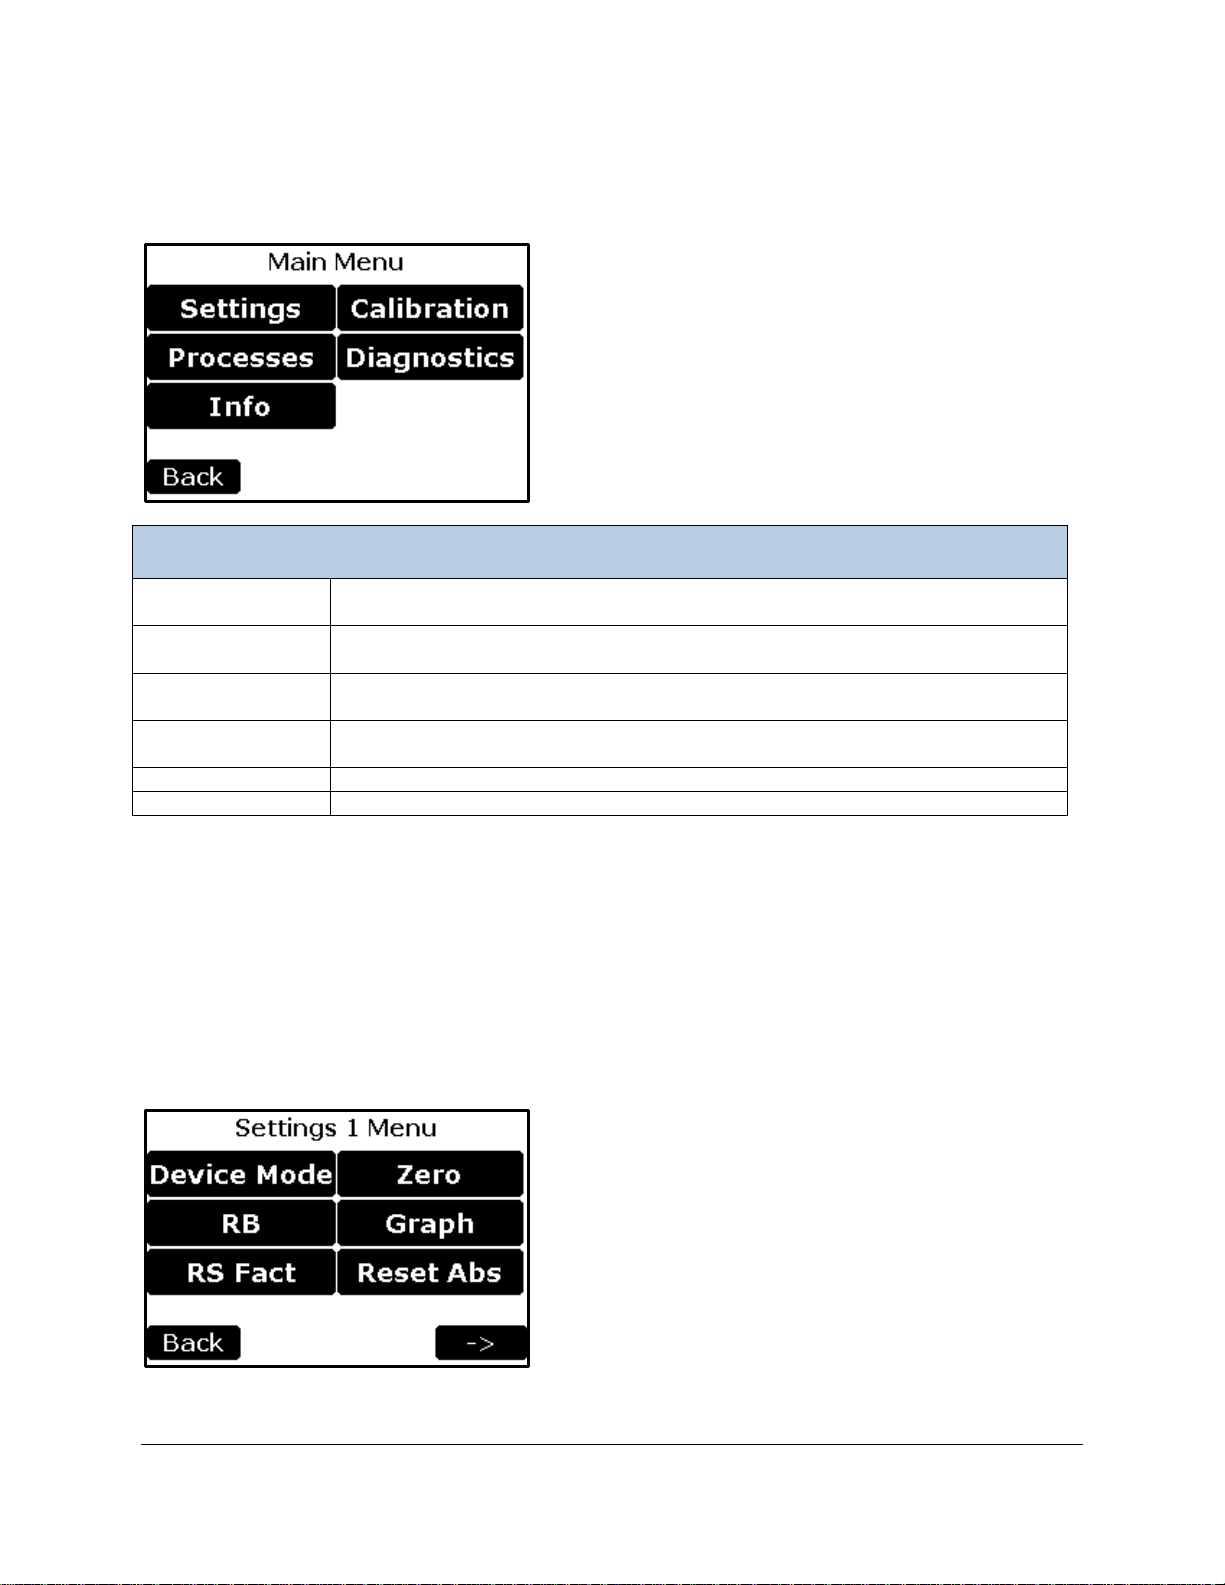
Main Menu
Main Menu
Settings
Controls major settings of the TARGAS-1. There are four sub menus under
Settings. See Settings on page 52.
Processes
Performs the TARGAS-1 Processes available depending on probe/sensor used
with the TARGAS-1. See Processes on page 69 for more details.
Calibration
Used to calibrate the CO2 gas analyzer, H2O gas analyzer, PLC PAR Sensor,
PLC light Unit, and the Touch Screen. See Calibration on page 104.
Diagnostics
Performs system diagnostics for troubleshooting purposes. See Diagnostics on
page 114 for more details.
Info
To obtain version information and contact info
Back Button
Goes back to Measure screen 1
This Main Menu screen is the top level menu for all settings and user functionality of the system.
Settings
There are four settings menus; Settings 1-4. Generally, the settings have been grouped related to their
frequency of change and common functionality.
Settings 1 Menu
This menu contains the first tier and most common settings for the TARGAS-1 including the Device Mode,
Zero, RB value of PLC, Graph settings, RS factor to use, and Reset Abs (Reset Absorber Column).
Page 53
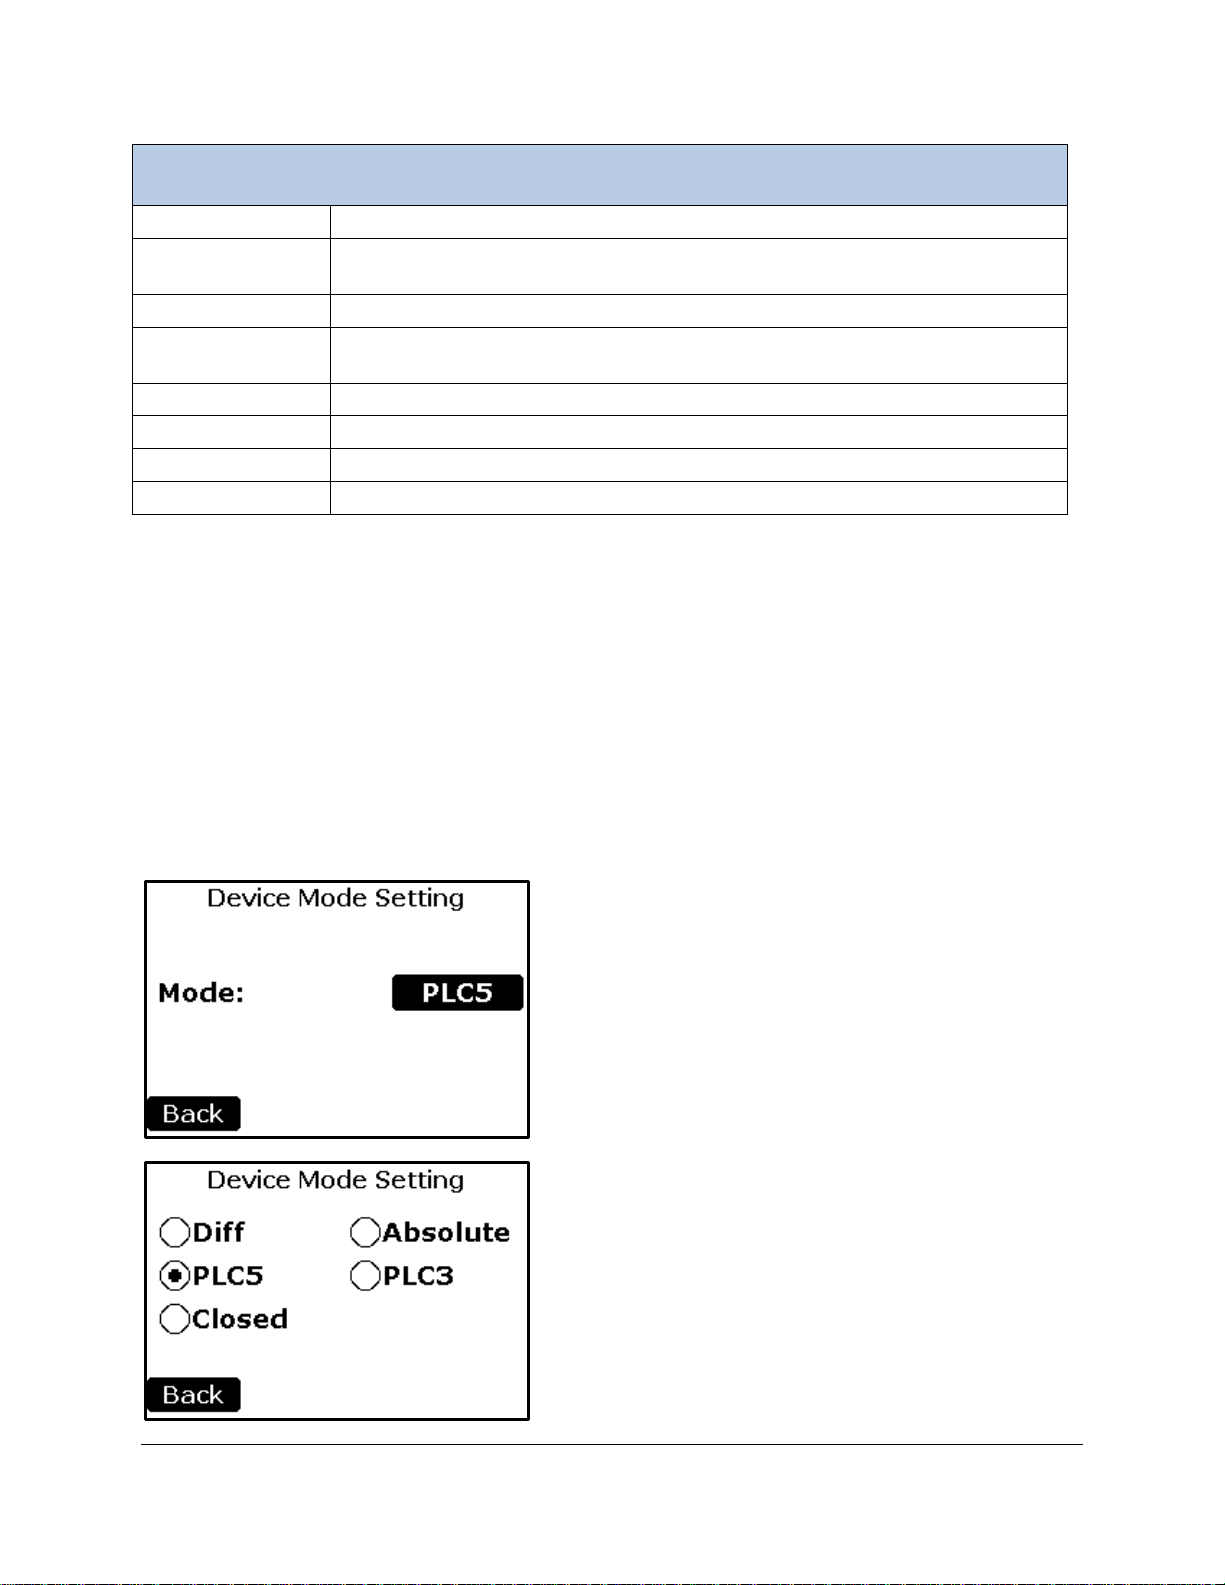
Settings 1 Menu
Device Mode
To select the operational mode of the TARGAS-1
RB
To set the rb factor for cuvette. The initial value recorded at the PP Systems’
factory is written on the “Tested” label affixed to the PLC handle.
RS Fact
To set the RS factor for leaf photosynthesis
Zero
Change/view the settings associated with the zero (zero type and time interval
for performing zeros).
Graph
To set the range Y Axis for the graph in the Injection Process.
Reset Abs
To indicate that absorber material has been replaced and reset.
Back Button
Returns to the Main Menu.
Right Arrow
Continues to the Settings 2 Menu screen.
Device Mode Settings
This function allows the user to change/view the Device Mode used by the TARGAS-1. The TARGAS-1
has one CO
continuously from the GAS IN port and CO
Differential mode and the PLC modes, gas is sampled alternately from the GAS IN port which represents
the reference gas, and the PLC port which represents the analysis gas. At the default gas switching
frequency of 5 seconds, the reference readings CO2r and H2Or will be updated every 10 seconds; the
analysis readings CO2a and H2Oa will also be updated every 10 seconds, but at 5 seconds after the
reference values are updated. Other values such as temperature, flow and calculations are always
updated every 1.0 second. The switching frequency can be adjusted in the Settings 3 menu as Ref On
Time and An On Time.
IRGA and one H2O IRGA. In Absolute mode and Closed mode, gas is sampled
2
and H2O concentration is updated every 1.0 second. In the
2
Page 54
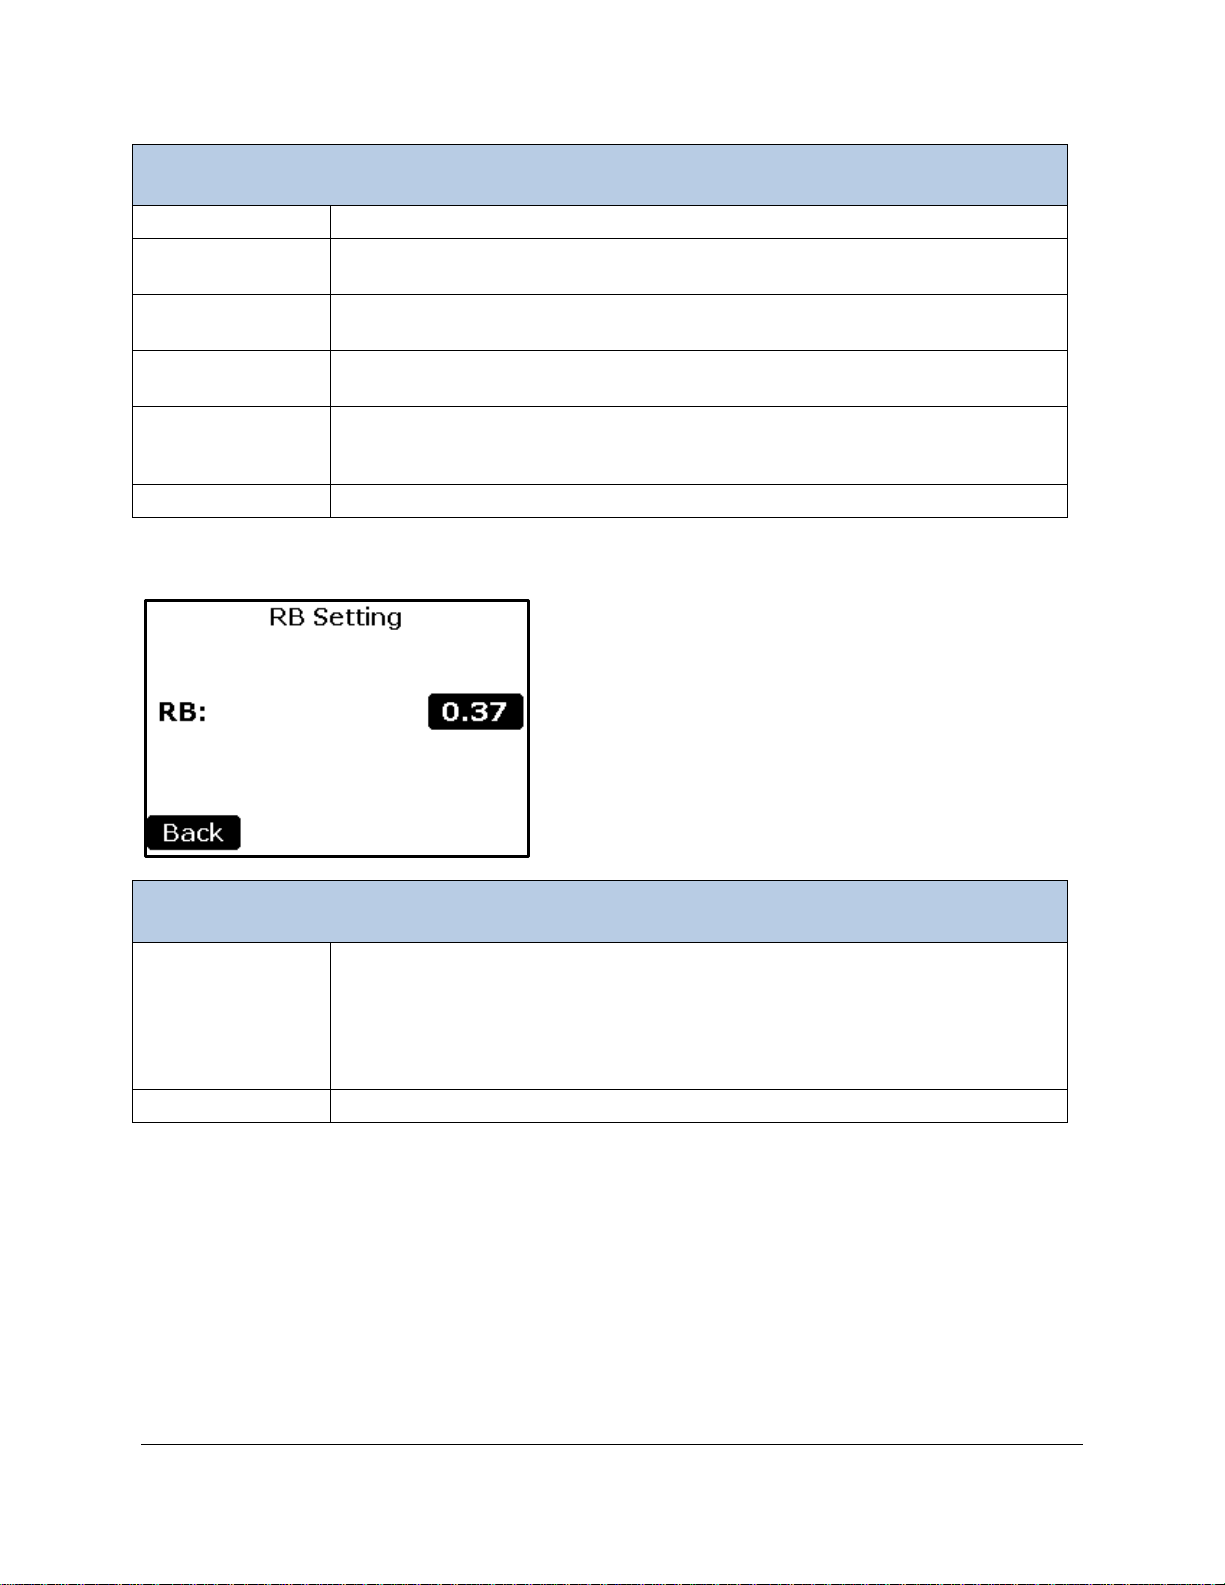
Device Mode Settings
Diff Button
Sets the TARGAS-1 to operate as a Differential Analyzer
Absolute Button
Sets the TARGAS-1 to operate as an Absolute Analyzer (recommended for
using the TARGAS-1 as a stand-alone CO2/H2O gas analyzer)
PLC5 Button
Sets the TARGAS-1 to operate as a photosynthesis system with a PLC5 style
leaf cuvette
PLC3 Button
Sets the TARGAS-1 to operate as a photosynthesis system with a PLC3 style
leaf cuvette
Closed Button
Sets the TARGAS-1 to operate as an Absolute Analyzer for closed system
CPY-5 Canopy Assimilation Chamber)
Back Button
Returns to the Settings 1 Menu.
RB Setting
RB Value Button
To set the rb factor (boundary layer resistance) for the PLC5 or PLC3 leaf
please contact PP Systems for more information.
Back Button
Returns to the Settings 1 Menu.
RB Setting
measurements (normally for use with the SRC-2 Soil Respiration Chamber and
cuvette. The initial value recorded at the PP Systems’ factory is stored in your
TARGAS-1 console when supplied as a new instrument and it is also written on
2
the “Tested” label affixed to the PLC handle (m
s mol-1). The factory set value
should remain consistent during normal use. If you have any questions about r
b
Page 55
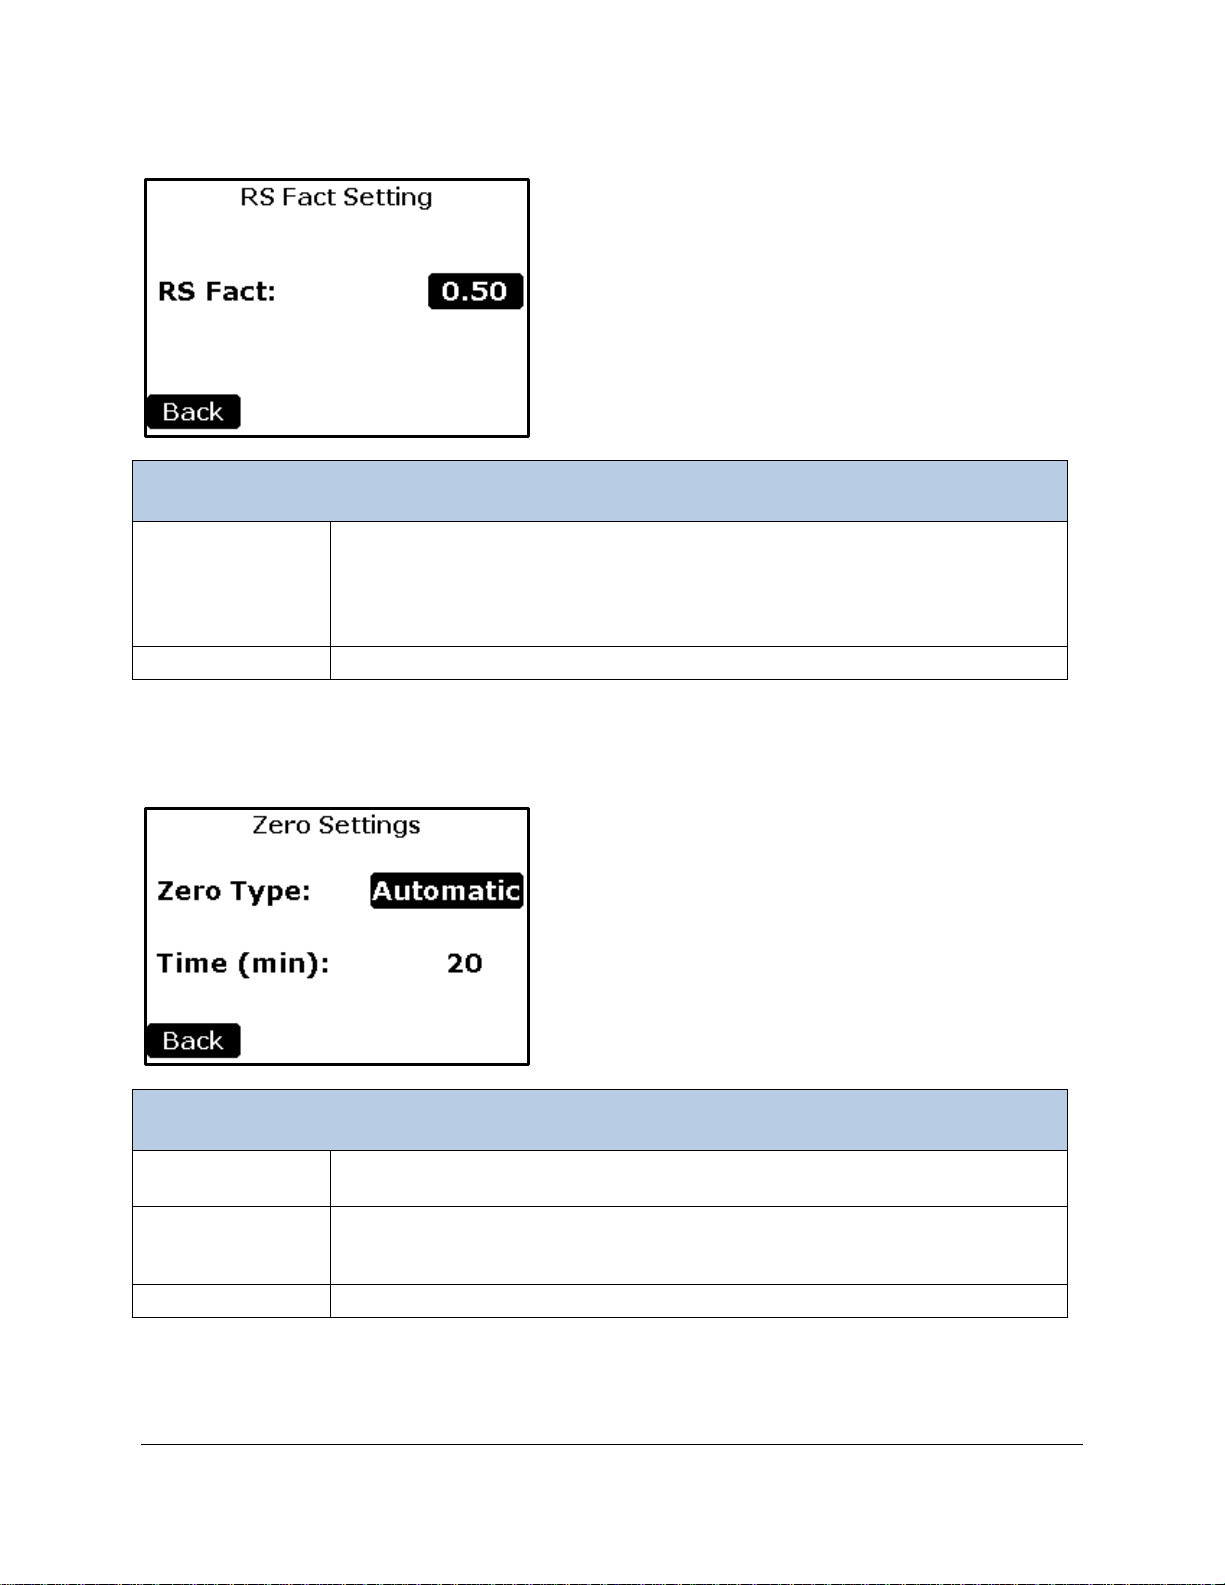
RS Factor Setting
RS Factor Setting
RS Factor Value
To set the RS factor (stomata ratio) for your plant type. Enter a known or
surface only.
Back Button
Returns to the Settings 1 Menu.
Zero Settings
Zero Type Button
There are three types of zeros that can be performed; Automatic, Manual and
User Set. WE RECOMMEND AUTOMATIC.
Time Button
Zero time is the interval between zeros in minutes.
the time can be selected and set.
Back Button
Returns to the Settings 1 Menu.
Button
estimated fraction of upper leaf surface stomata for your leaf sample. 0.50
represents equal stomata on upper and lower leaf surfaces, 0.0 represents
stomata on the lower leaf surface only, 1.0 represents stomata on the upper leaf
Zero Settings
This function allows the user to change/view the zero parameters used by the TARGAS-1.
Time is always 20 minutes for Automatic. When Zero Type is set to User Set,
Page 56
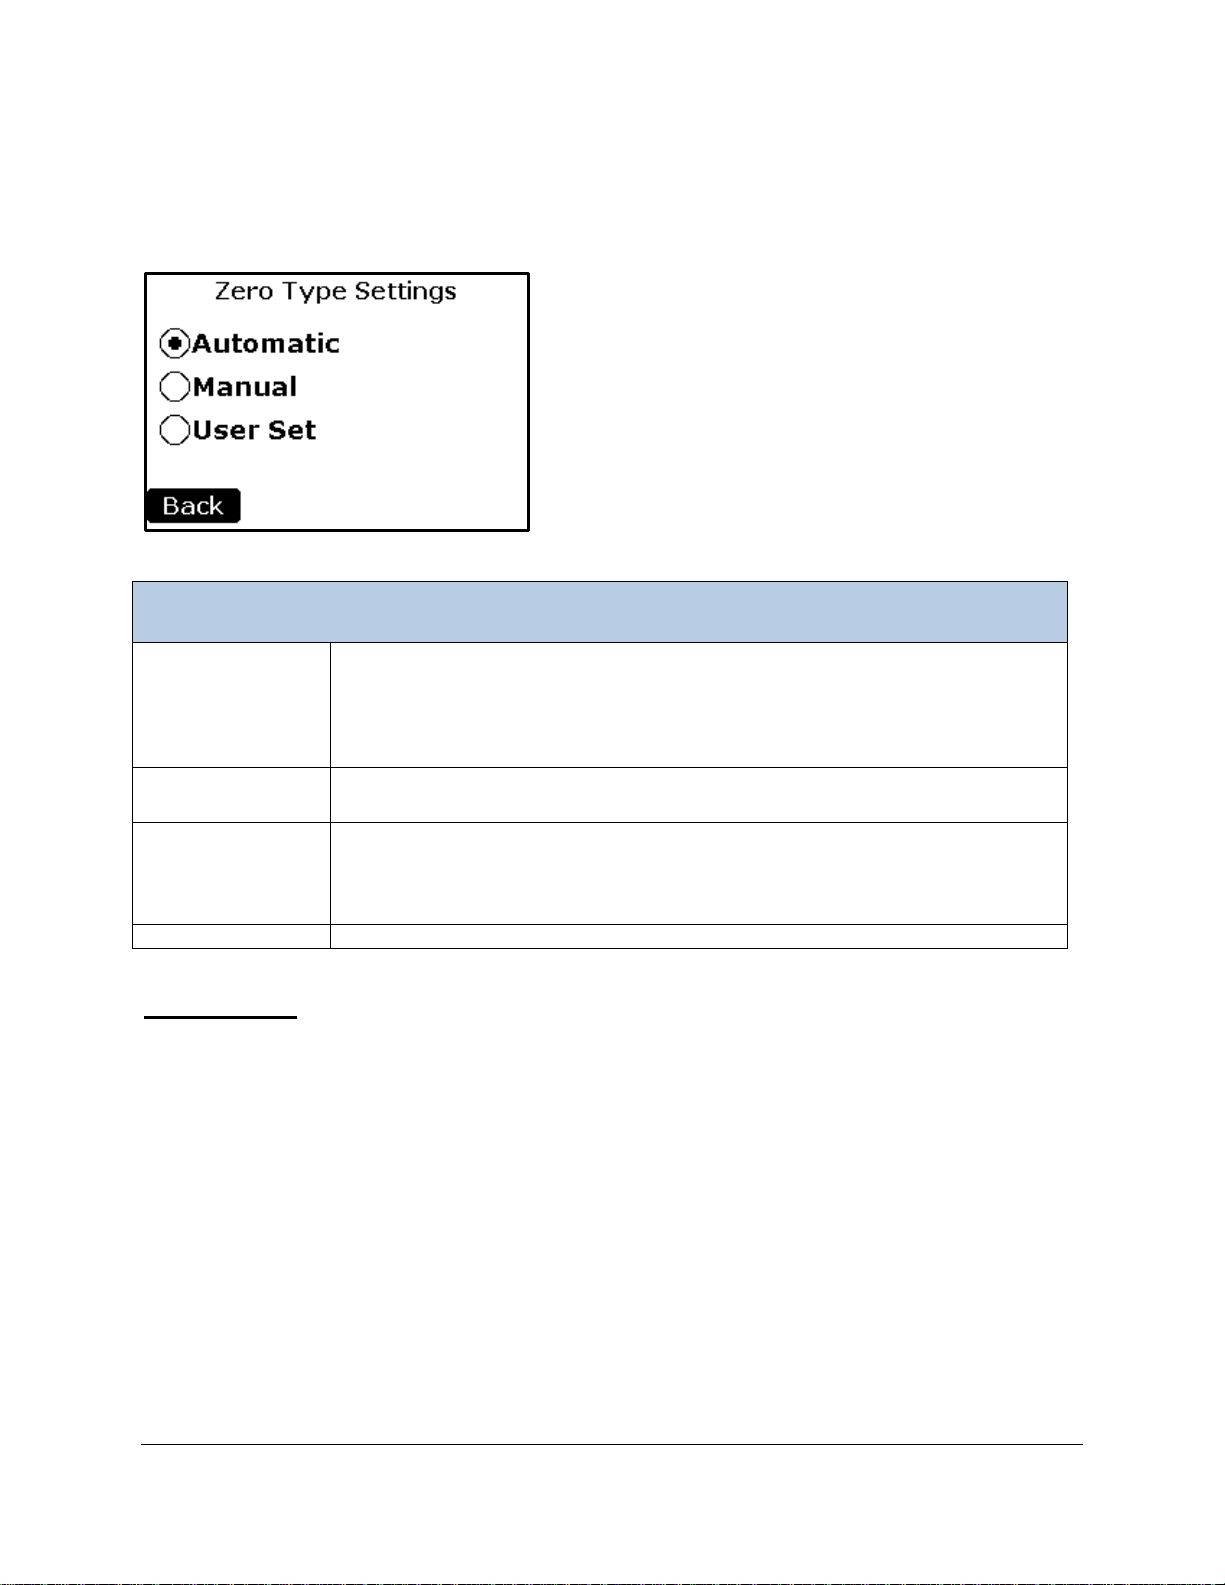
Zero Type Settings
Zero Type Settings
Automatic
This is the default and recommended Zero Type. The TARGAS-1 performs a
minutes thereafter. The Zero Time interval is fixed at 20 minutes.
Manual
A zero can be initiated at any time and regardless of the Zero Type Setting by
pressing the Z button in the upper right hand corner of the display.
User Set
When selected, the TARGAS-1 performs a zero on start up, then again after 3
set from 1 to 40 minutes.
Back Button
Returns to the Zero Settings screen.
Press the desired setting either directly on the radio button or on the text to the right of the radio button.
Then select the Back button to return to the Zero Settings screen. The Zero Settings screen will return
with the updated Zero Type value in the but t on box.
zero more frequently initially after achieving the IRGA warm-up temperature (55
o
C). At completion of warm-up it will perform an initial zero, then again after 3
minutes, then again after 6 more minutes, then after 12 minutes, then every 20
minutes, then again after 6 more minutes, then after 12 minutes, then finally
after 20 minutes. It then performs zeros at the user-specified interval. It can be
Important Notes
A Zero can be performed at any time either automatically or using the “Z" button in the Measure Screens.
In this case, the timer resets back to zero and will perform another zero when the Zero Time interval has
elapsed.
Page 57
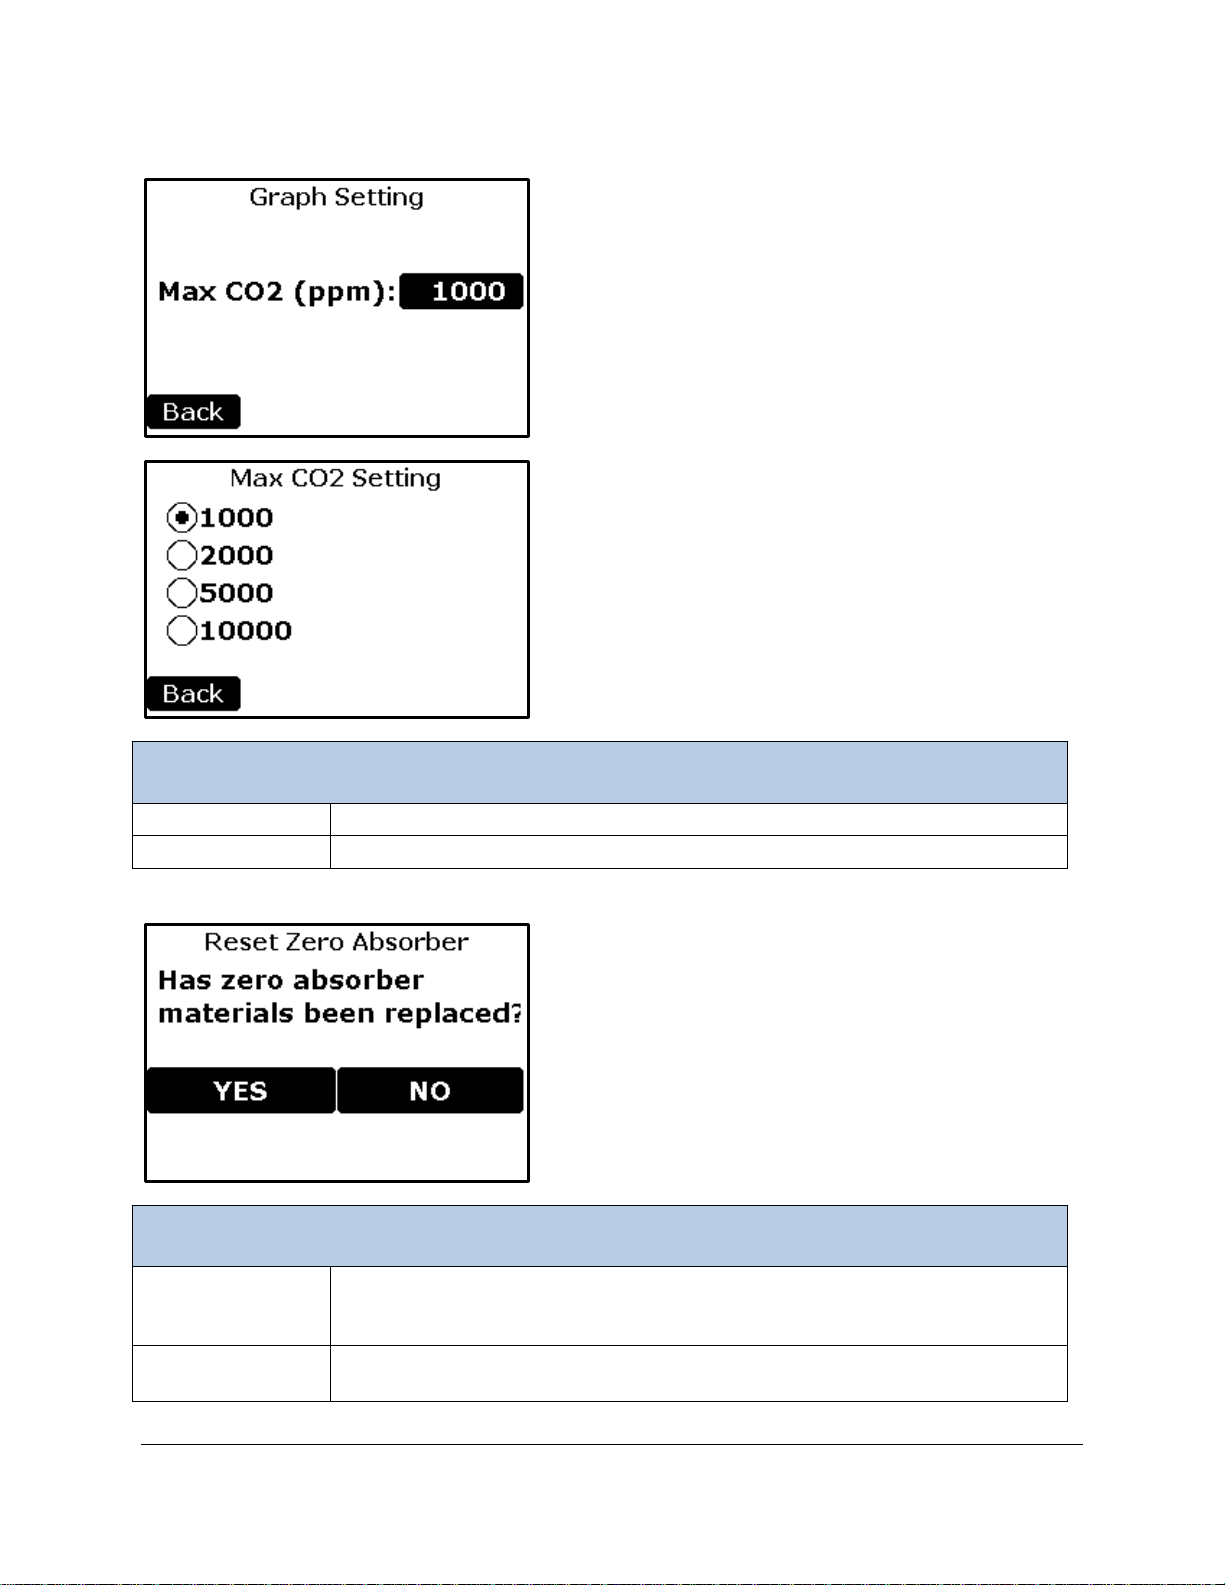
Graph Setting
Max CO2 Setting
Radio Buttons
To set the Y-axis range for any Graphical Display Screen that displays CO2.
Back Button
Returns to the Graph Settings screen.
Reset Zero Absorber
Yes Button
Reset the Zero Absorber capacity gauge to 100%. This should be set every time
accuracy.
No Button
Returns to the Settings 1 Menu without resetting the Zero Absorber capacity
gauge.
Reset Zero Absorber
the molecular sieve is changed in the Auto-Zero column to ensure reporting
Page 58
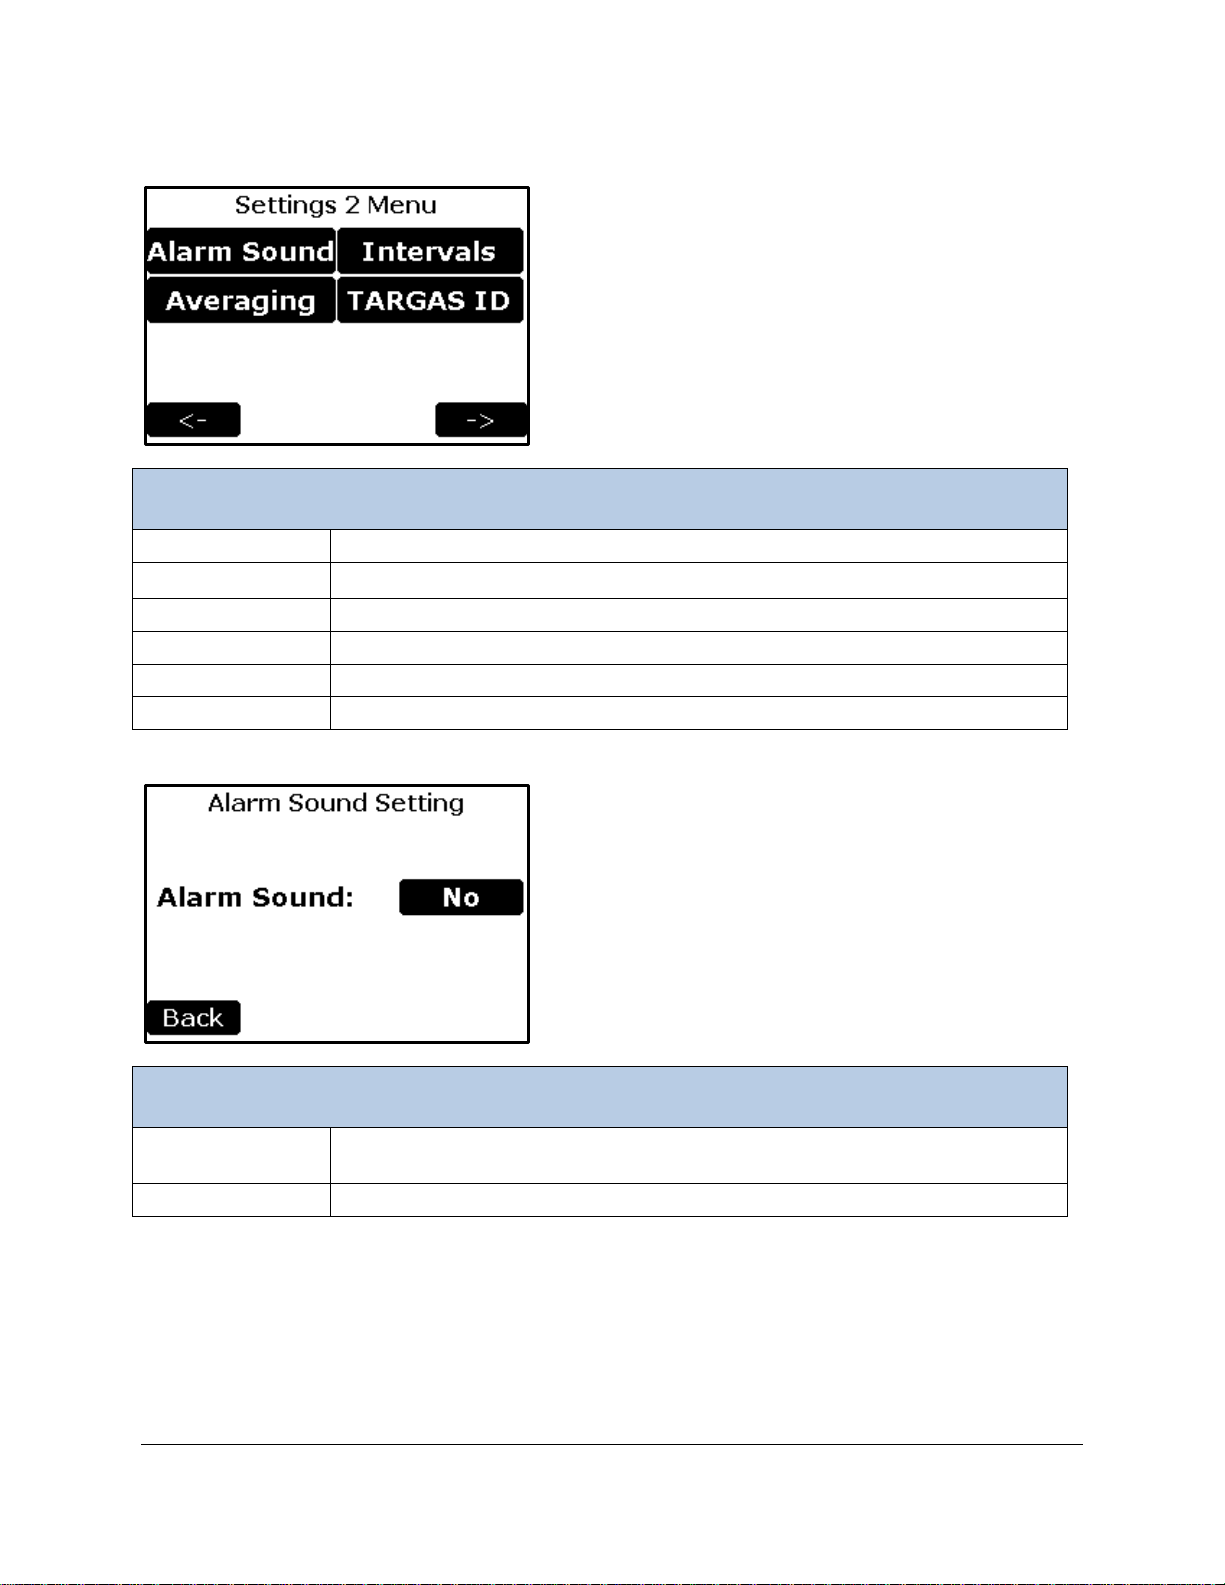
Settings 2 Menu
Settings 2 Menu
Alarm Sound
To enable or disable the alarm sounds
Averaging
Sets the CO2 averaging value range
Intervals
To control the frequency that data is sent
TARGAS ID
To select an ID number of the TARGAS-1
Back Button
Returns to the Settings 1 Menu screen.
Right Arrow
Continues to the Settings 3 Menu screen.
Zero Settings
Alarm Sound
Button
To Select Yes or No ( enable or disable the Alarm Sound)
Back Button
Returns to the Settings 2 Menu.
Alarm Sound Setting
Page 59
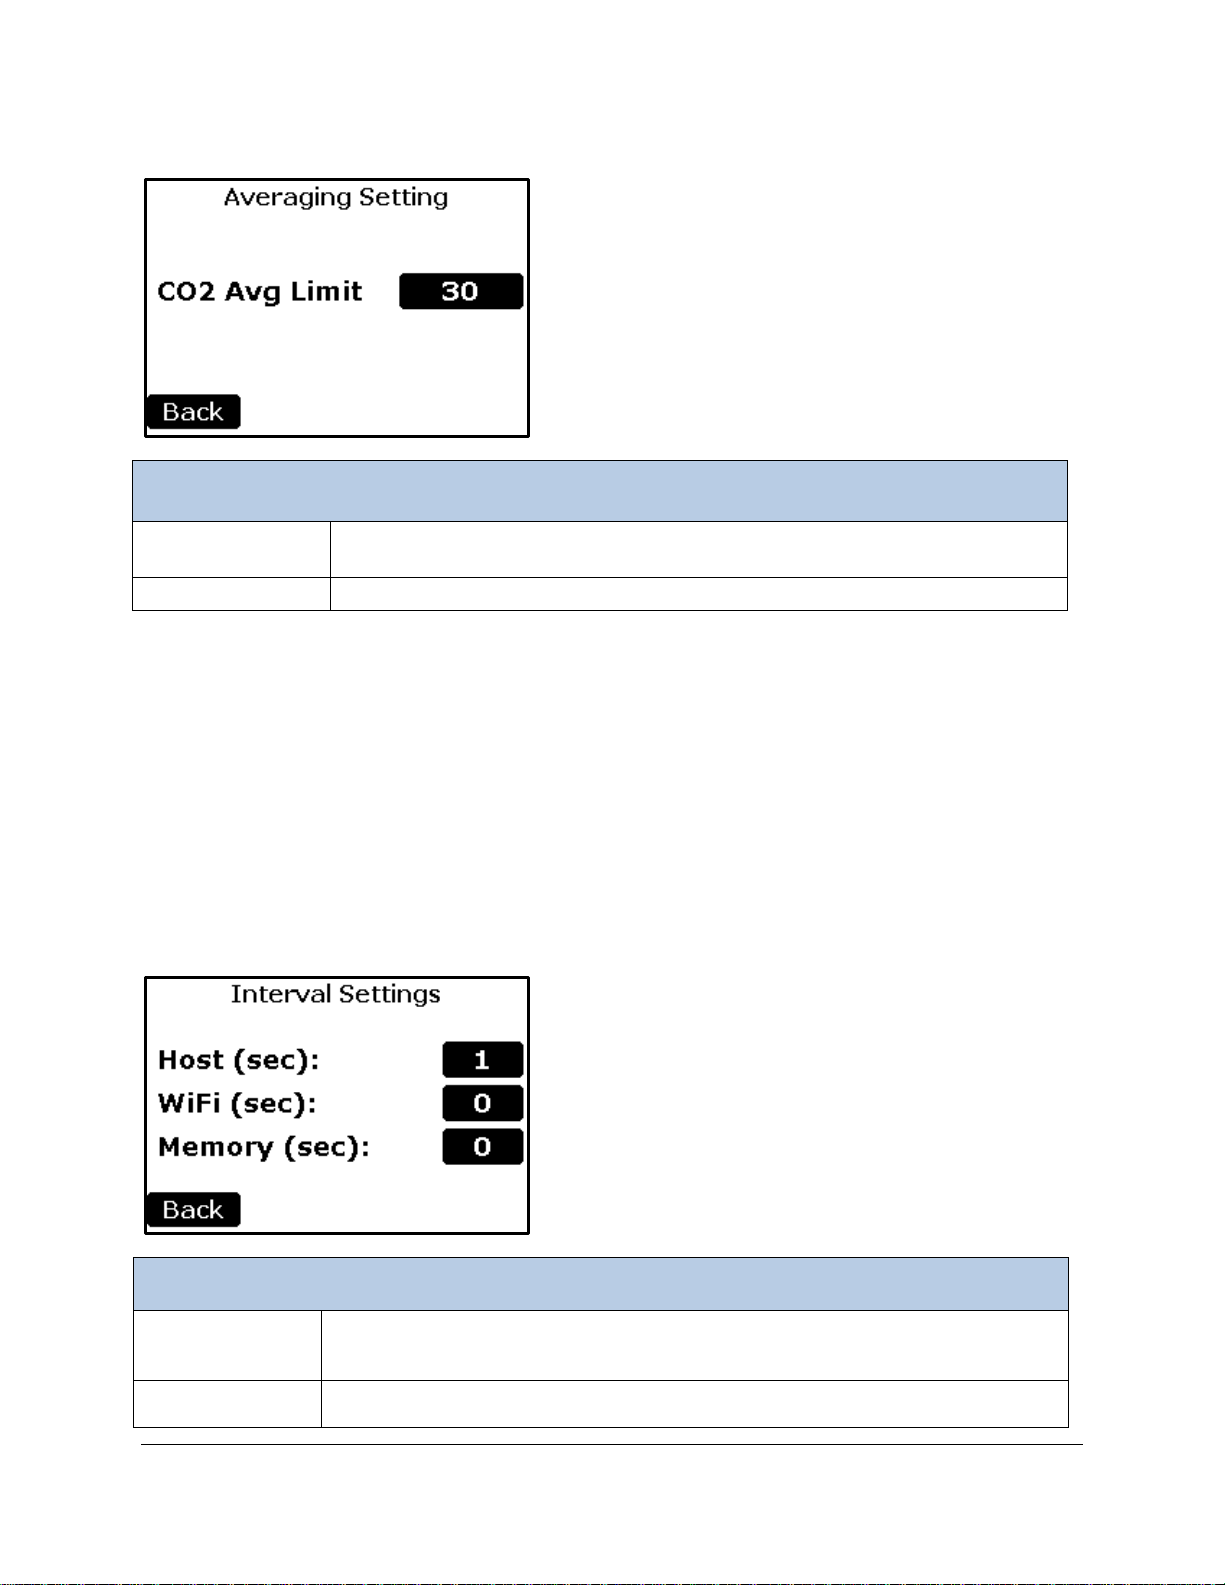
Averaging Setting
Averaging Setting
CO2 Avg Limit
Value Button
To select the CO2 limit in which the CO2 is being averaged. This only applies to
Absolute Mode.
Back Button
Returns to the Settings 2 Menu.
Interval Settings
Host Button
To set the time interval between data writes to the Host Port (normally the USB
writes. The default is 1.
Wifi Button
To set the time interval between data writes to the Wifi Port. Time is in Seconds
and the value 0 turns off data writes. The default is 0.
Running Average: When in absolute mode only, an exponential running average filter can be applied to
smooth out small fluctuations while remaining sensitive to larger differences by using an Average Limit
value. Whenever a new reading differs from the current running average by more than the CO
value, a new running average begins. Thus, when the CO
2 concentration is changing rapidly, averaging is
suspended and the instrument can track changes at the basic instrument data rate of 1 second. When the
CO
2 Avg Limit is set to 0, no running average is performed. The running average filter response time is
3.5 seconds to reach 66% of a new value, and 16 seconds to reach 99%. In other words, if Avg Limit is
set above 100 ppm and the inlet sample gas concentration instantaneously changed by 100 ppm, it would
take 4 seconds for the CO
2 reading to change by 66 ppm; then after 16 seconds, the measured value
would change by 99 ppm.
2 Avg Limit
Interval Settings
connection to an external PC). Time is in Seconds and the value 0 turns off data
Page 60
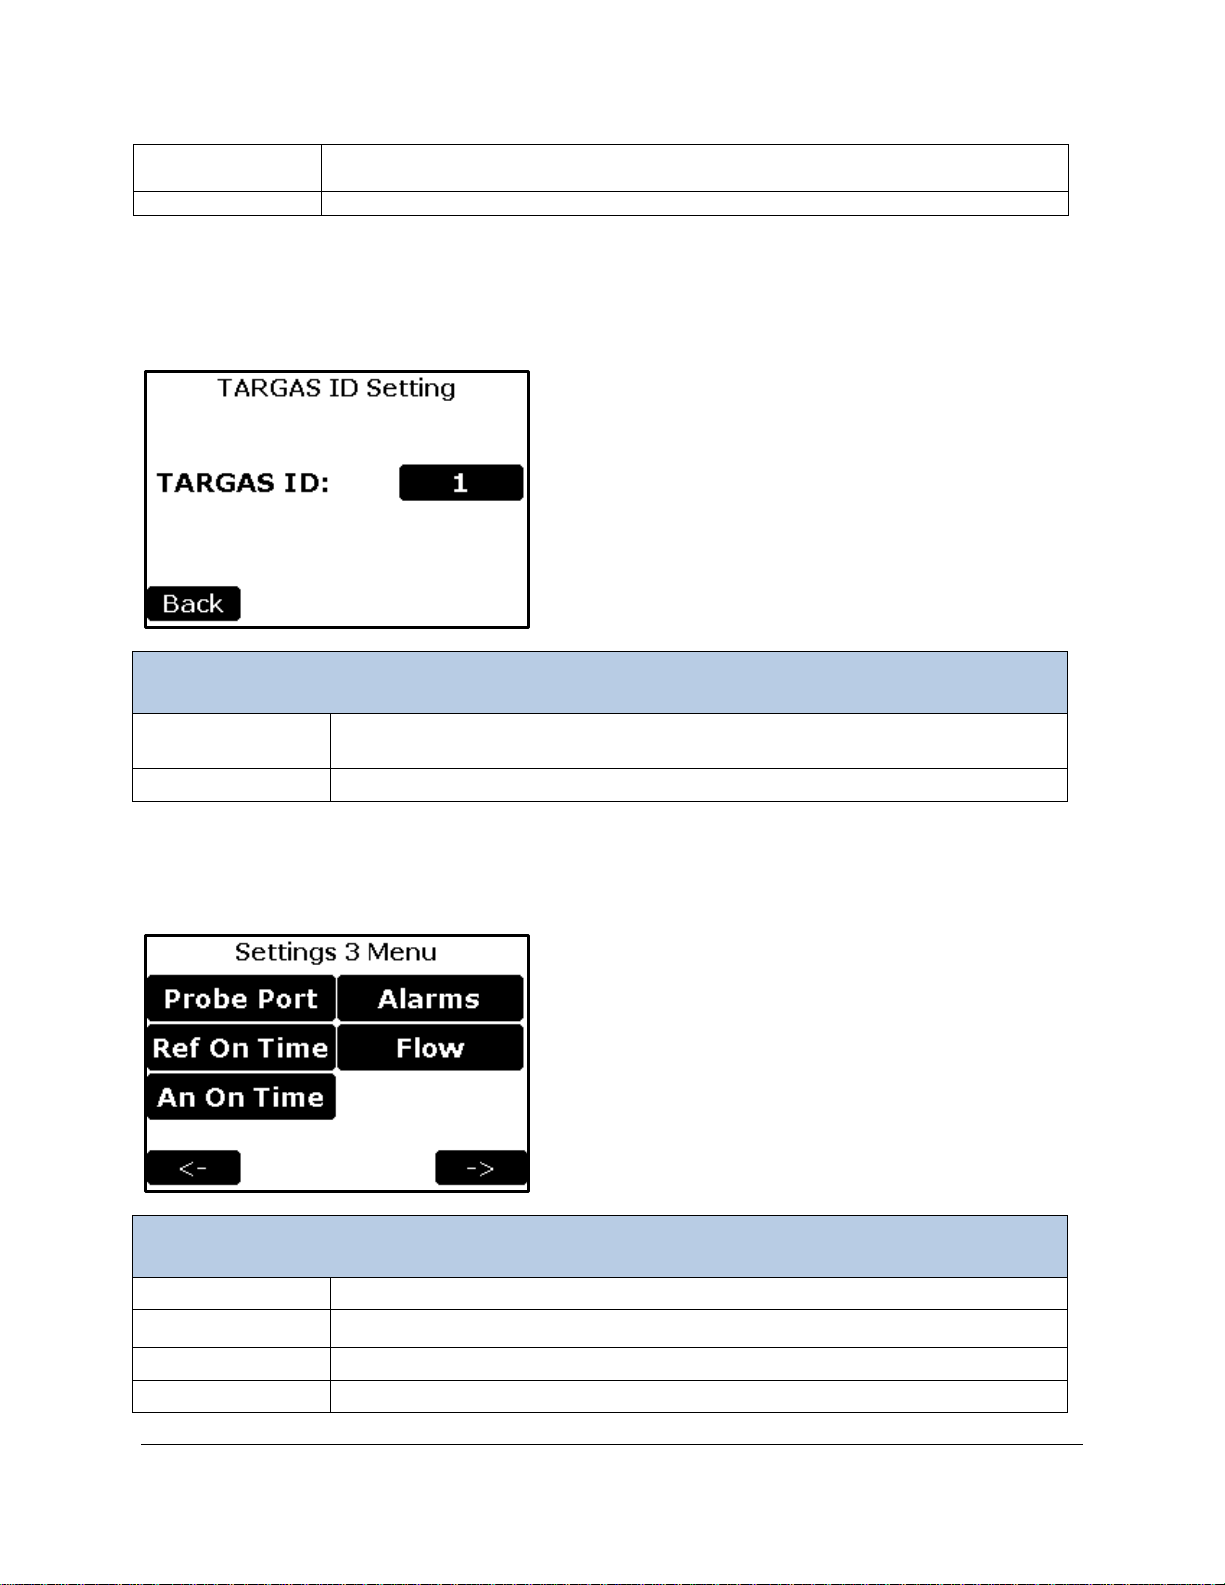
Memory Button
To set the time interval between data writes to the USB Memory Stick. Time is in
Seconds and the value 0 turns off data writes. The default is 0.
Back Button
Returns to the Settings 2 Menu.
Averaging Setting
TARGAS ID
Button
To Select device ID Range 0-9 (the Default is 1)
Back Button
Returns to the Settings 2 Menu.
Settings 3 Menu
Probe Port
To select the probe type being used in Port 1
Ref On Time
To set the time duration of the Reference sample time (seconds)
An On Time
To set the time duration of the Analysis sample time (seconds)
Alarm
To set the CO2 limits low and high which will cause an alarm
Note: A manual record initiated by hitting RECORD on the touchscreen always sends data to the
devices.
TARGAS ID Setting
Settings 3 Menu
Page 61
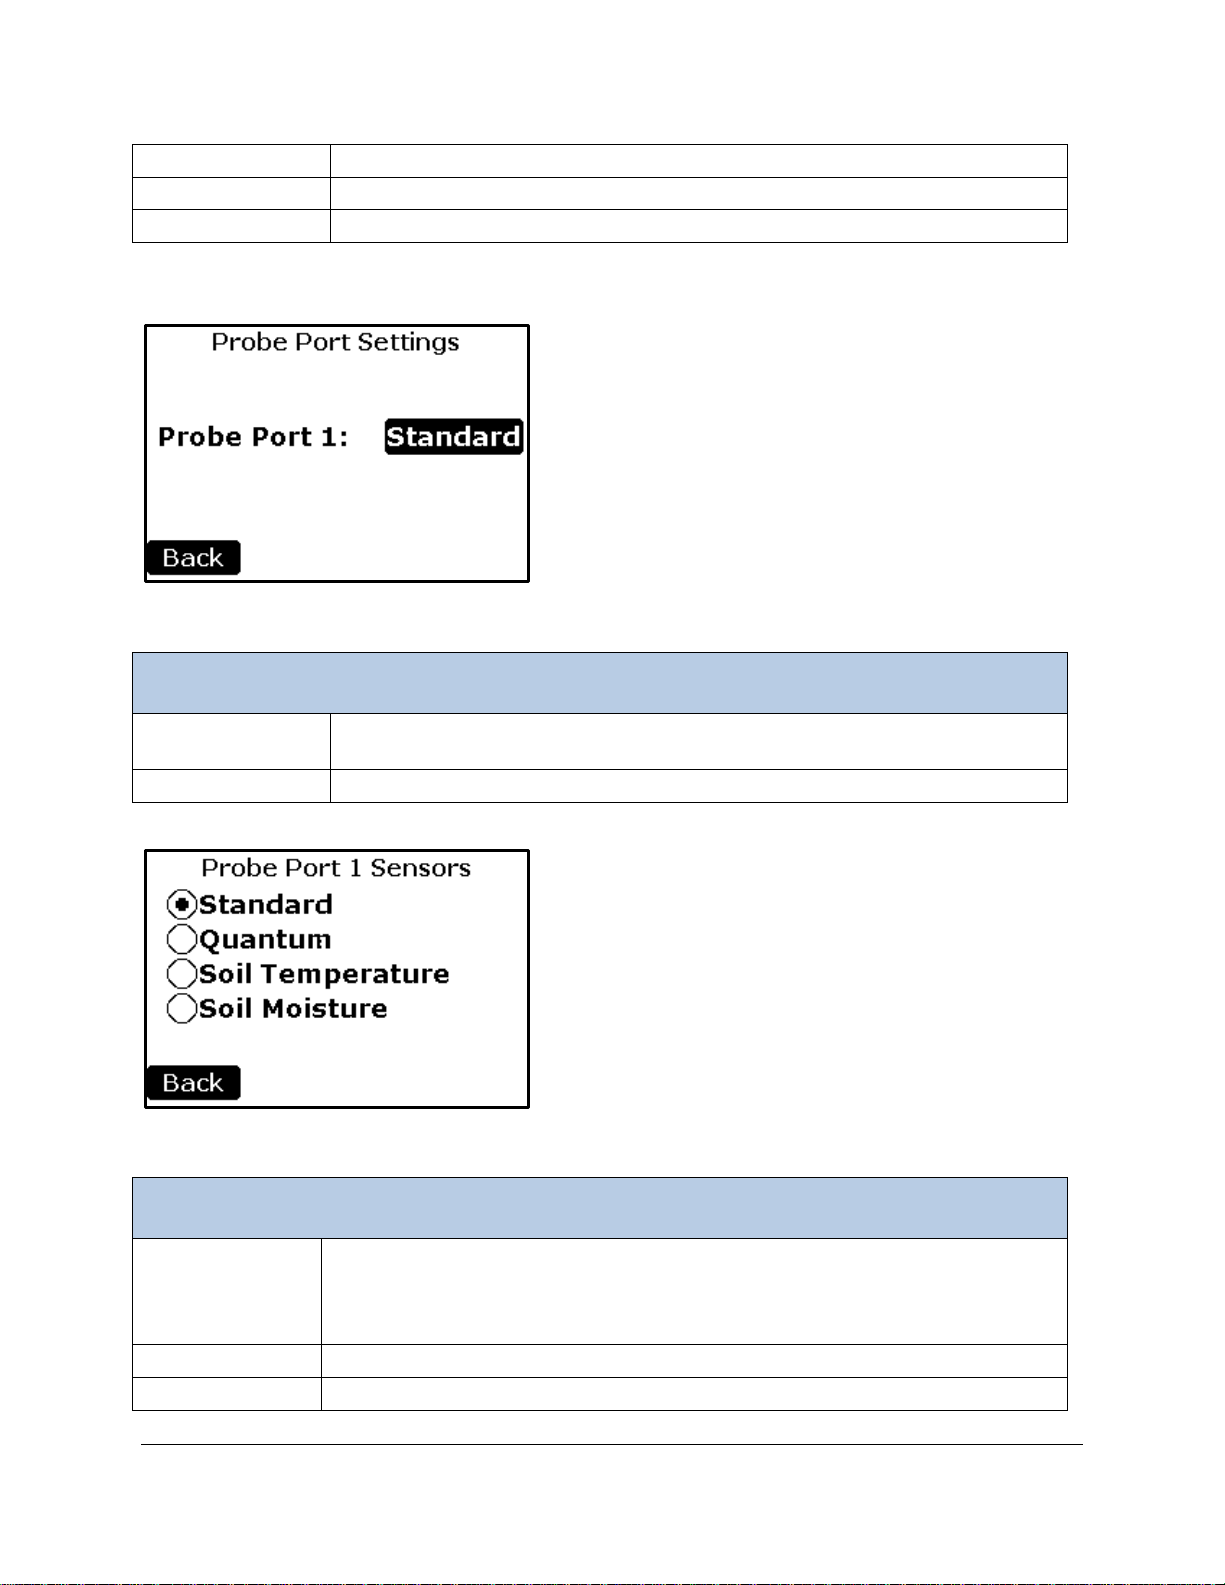
Flow
To set sample flow
Left Arrow
Returns to the Settings 2 Menu screen.
Right Arrow
Continues to the Settings 4 Menu screen.
Probe Port Settings
Probe Port 1
Button
To Select Probe Type
Back Button
Returns to the Settings 3 Menu.
Interval Setting
Standard
For use with the following probes manufactured by PP Systems:
• TRP-3 Temperature/PAR Probe
Quantum
For use with the Apogee Quantum Sensor.
Soil Temperature
For use with the STP-2 Soil Temperature Probe.
Probe Port Settings
• SRC-2 Soil Respirati on Ch amber
• CPY-5 Canopy Assimilation Chamber
Page 62
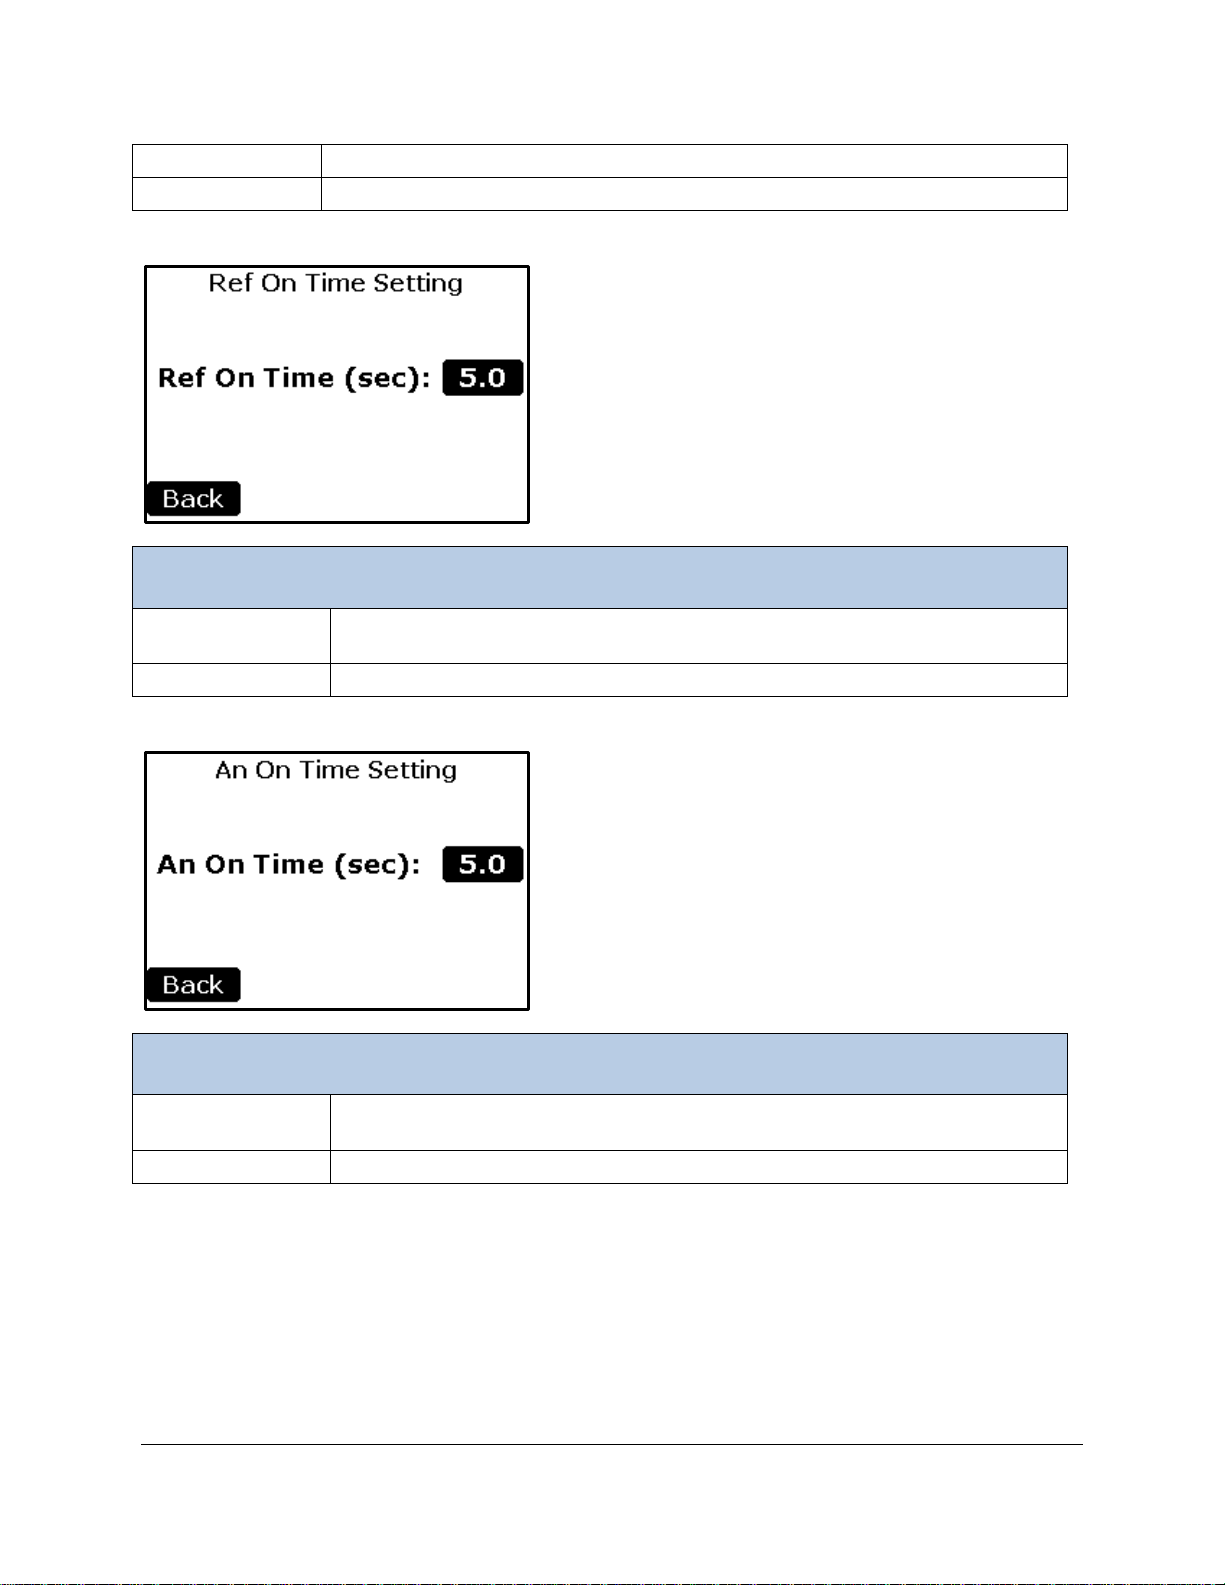
Soil Moisture
For use with the Stevens Soil Moisture Sensor.
Back Button
Returns to the Probe Port Settings screen.
Ref On Time Setting
Ref On Time Settings
Ref On Time
Button
To set the duration of the Reference time in seconds (range 3-15). This is used
in Differential and Photosynthesis Modes (default is 5)
Back Button
Returns to the Settings 3 Menu.
An On Time Settings
AN On Time
Button
To set the duration of the Analysis time in Seconds (range 3-15). This is used in
Differential and Photosynthesis Modes (default is 5)
Back Button
Returns to the Settings 3 Menu.
An On Time Setting
Page 63
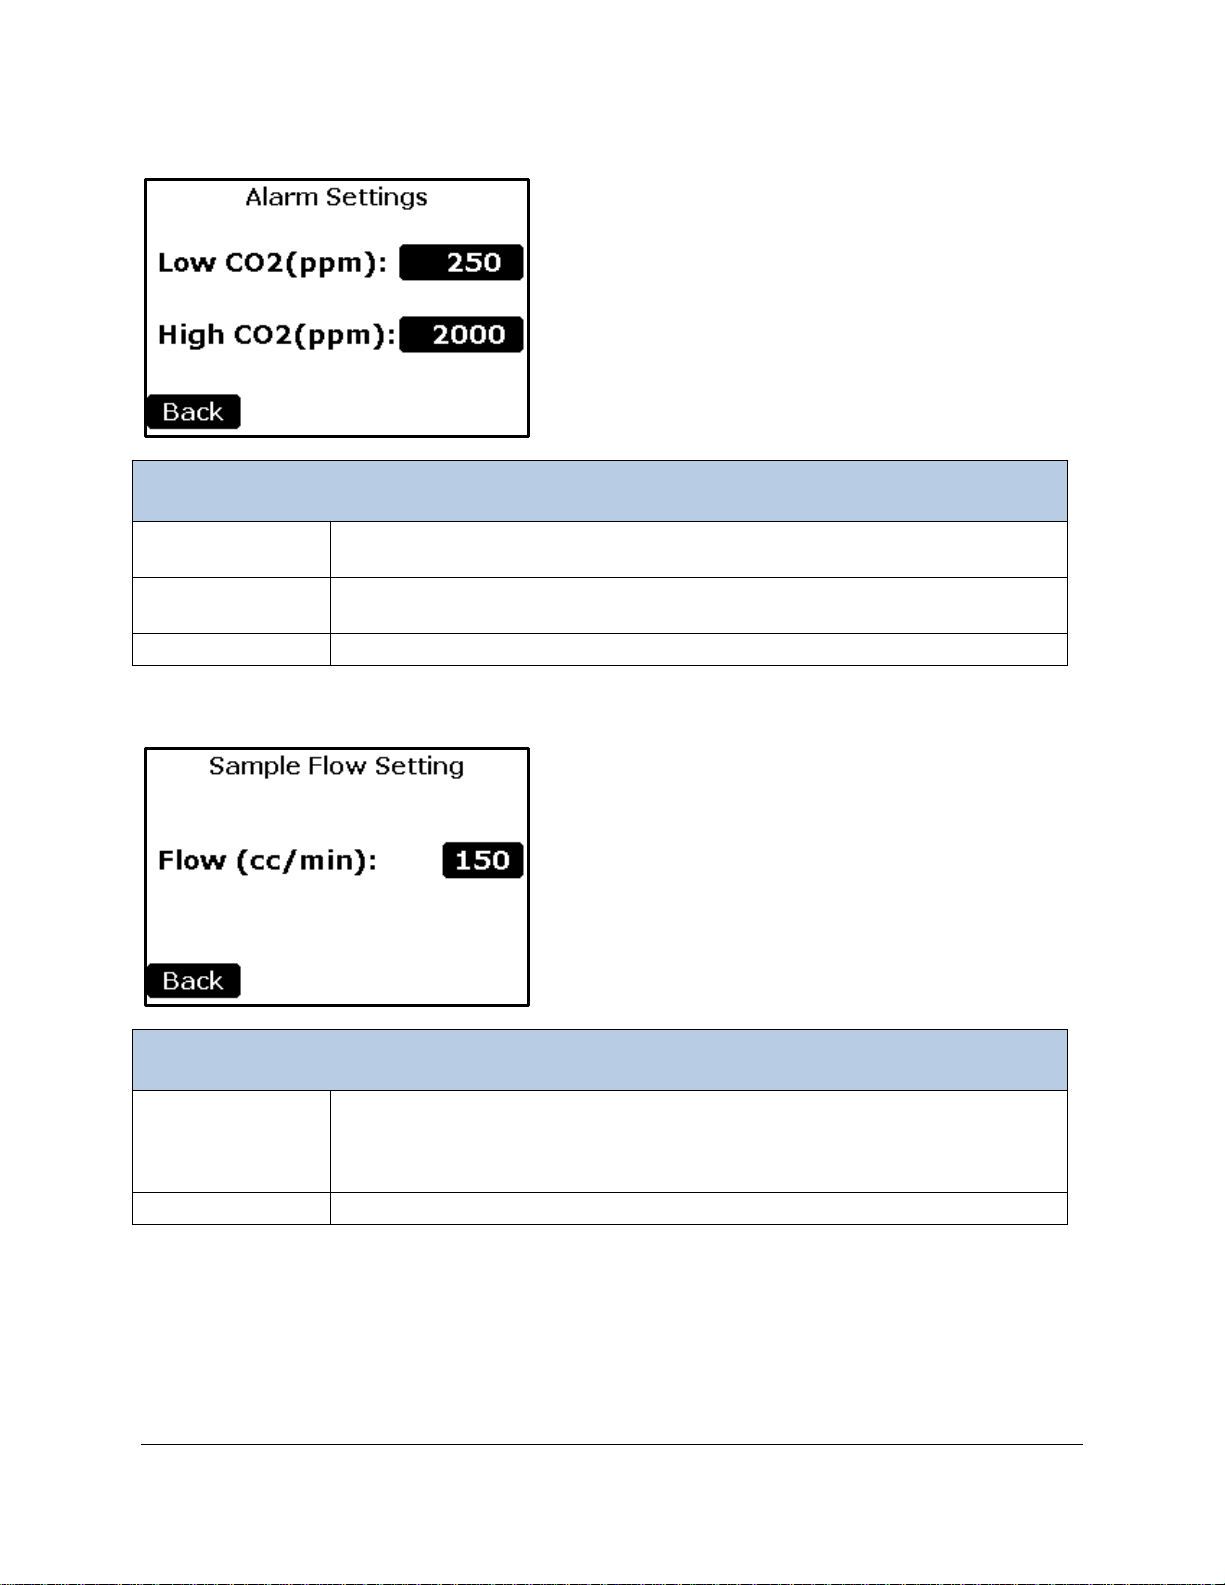
Alarm Settings
Alarm Settings
Low CO2 (ppm)
Button
To set the low CO2 limit value at which an error is generated.
High CO2 (ppm)
Button
To set the high CO2 limit value at which an error is generated.
Back Button
Returns to the Settings 3 Menu.
Sample Flow Settings
Flow (cc/min)
To set the sample flow rate (cc/min). Range: 50 -200 cc/min. It is user
Note: when selecting Device Mode, it sets the sample flow to the correct values.
Back Button
Returns to the Settings 3 Menu.
Sample Flow Setting
Button
adjustable but the default value and recommended value is 150 cc/min. This
parameter represents the flow rate of the sample air by the analyzer.
Page 64
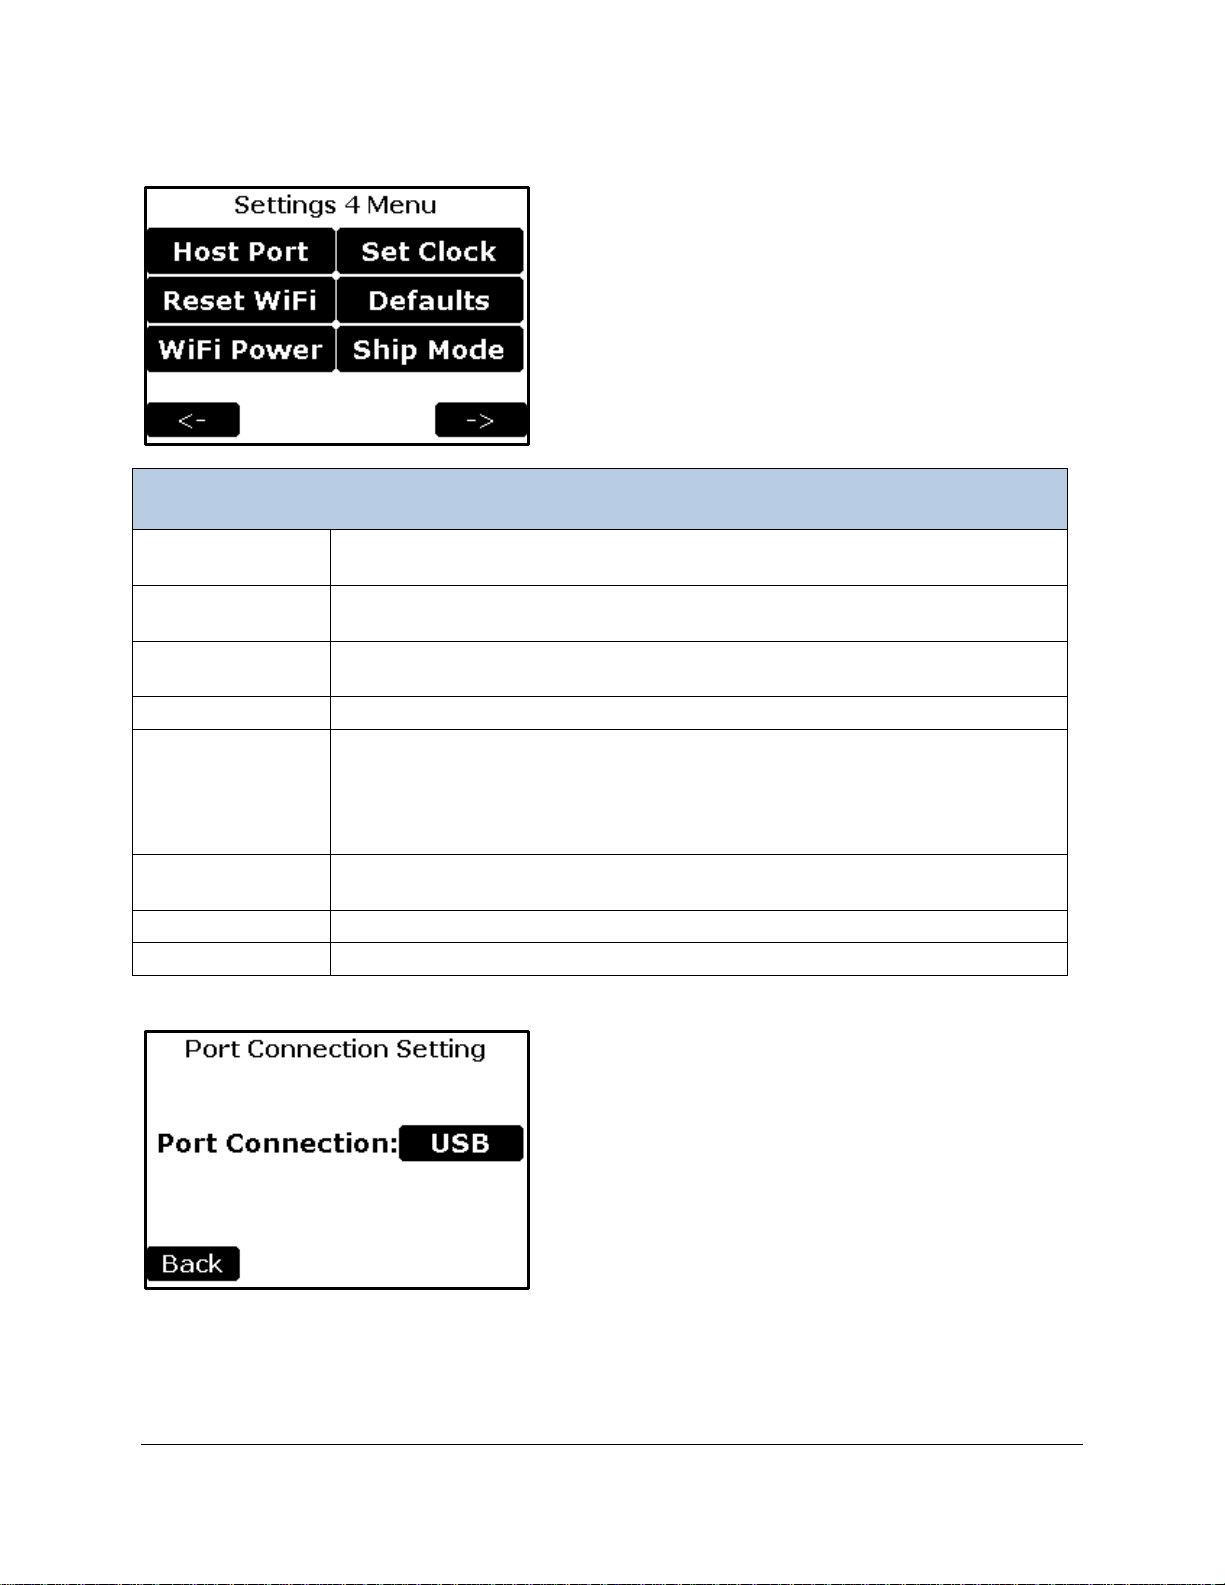
Settings 4 Menu
Settings 4 Menu
Host Port
Not implemented and available for potential future use. To select which Port
to connect Host.
Reset WiFi
Not implemented and available for potential future use. To reset Wi-Fi to
Factory Settings (if installed)
WiFi Power
Not implemented and available for potential future use. To Enable Wi-Fi (if
installed)
Set Clock
To set the time and date of the TARGAS-1
Defaults
To reset all parameters to factory defaults
Ship Mode
To Put the TARGAS-1 into a state to prevent the batteries from being used. This
is used when shipping the machine.
Left Arrow
Returns to the Settings 3 Menu screen.
Right Arrow
Continues to the Settings 1 Menu screen.
This function allows the user to initialize the TARGAS-1 to its factory default
values. This feature may be needed to correct an erroneous calibration, or to
simply undo undesirable configuration changes.
Host Port Setting
Page 65
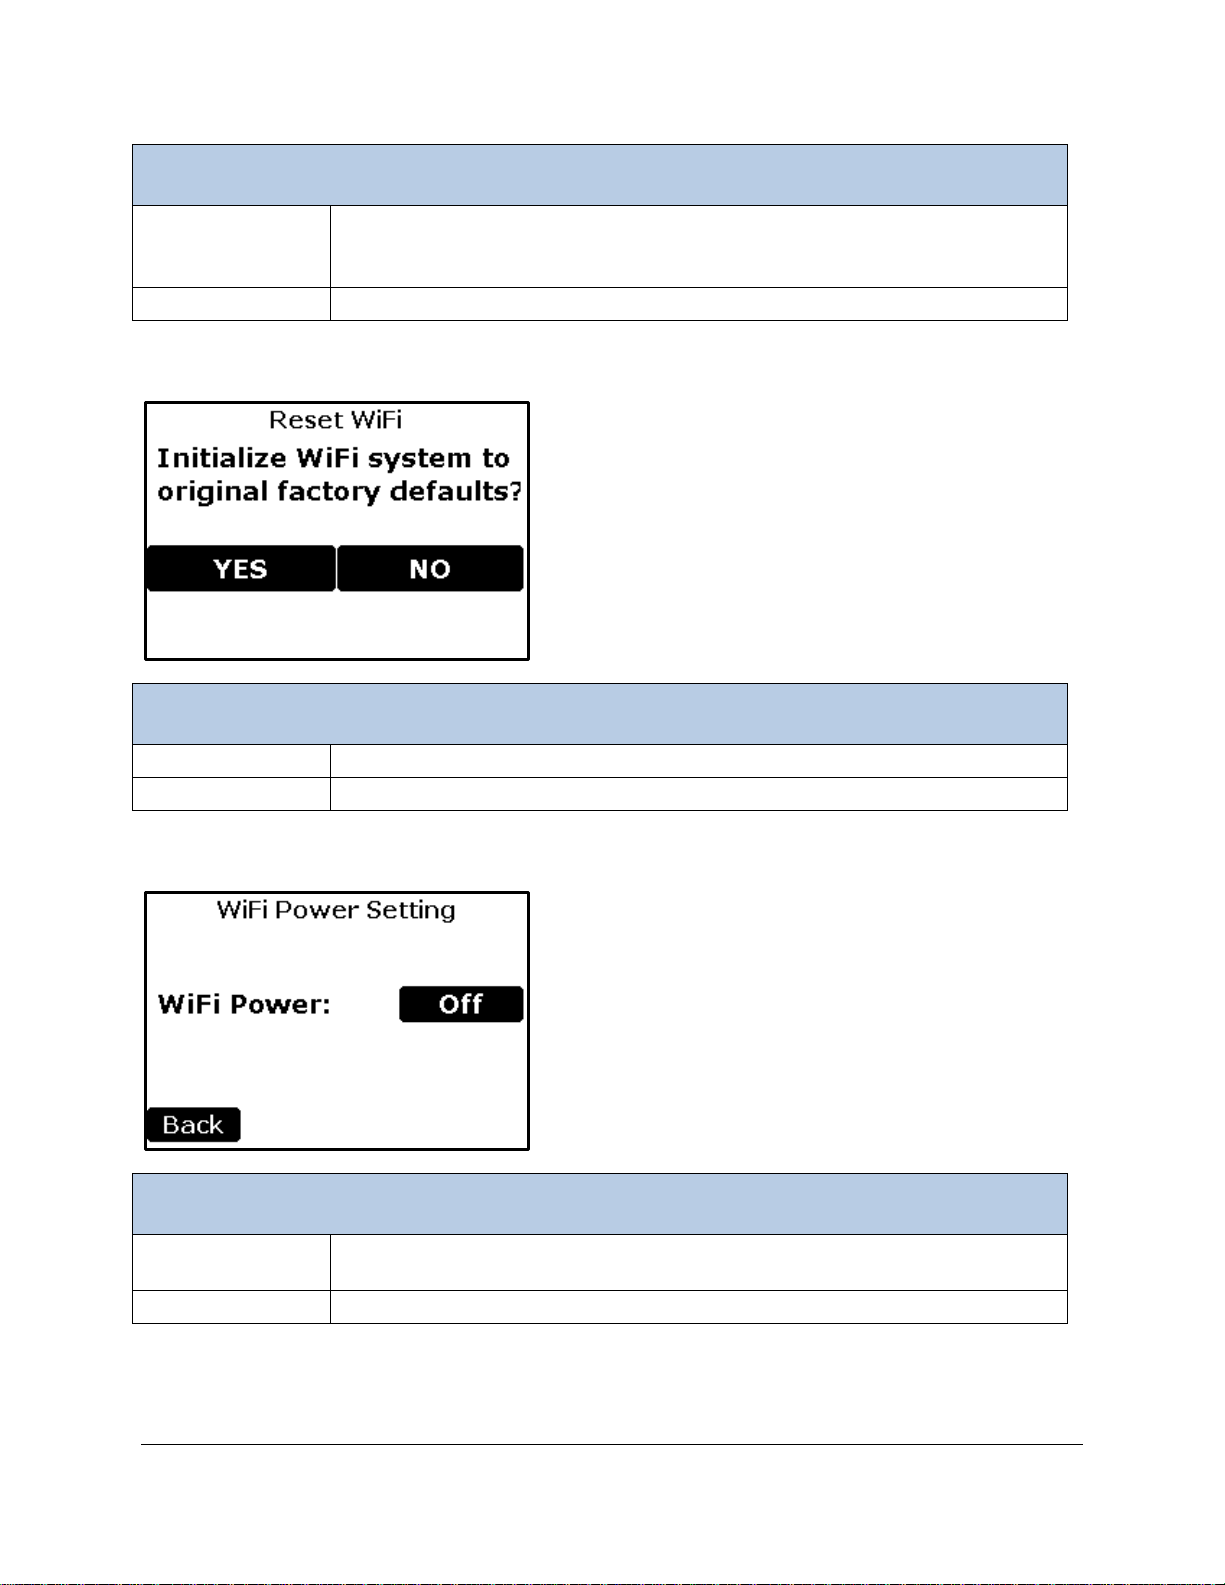
Host Port Setting
Port Connection
Button
To select which Port to connect Host.
• Wi-Fi
Back Button
Returns to the Settings 4 Menu.
Reset WiFi Settings
Yes
Reset Wi-Fi to original Factory Settings then returns to Settings 4 Menu
No
Returns to the Settings 4 Menu without resetting Wi-Fi
WiFi Power Settings
WiFi Power
Button
To enable or disable the Wi-Fi (if installed)
Back Button
Returns to the Settings 4 Menu.
Reset WiFi Settings
• USB
WiFi Power Setting
Page 66
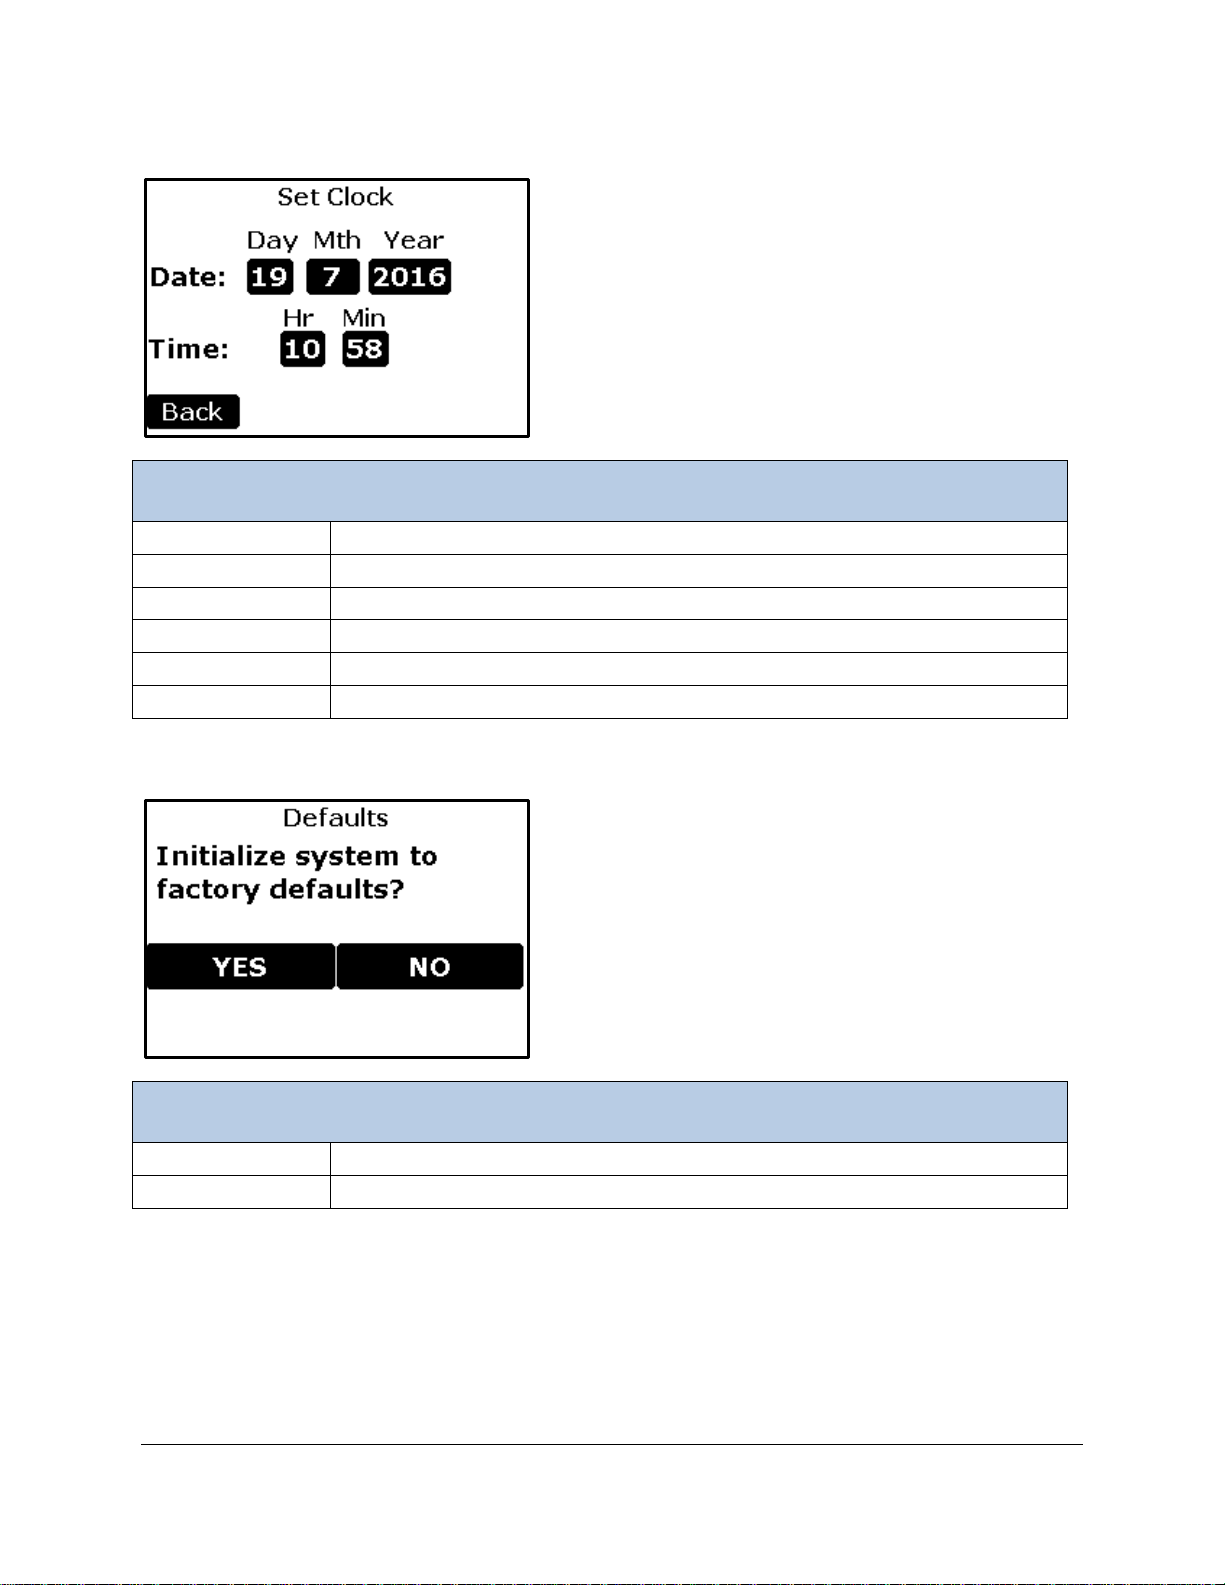
Set Clock Settings
Set Clock Settings
Day Button
To set the day (1 – 31)
Mth Button
To set the month (1 -12)
Year Button
To set the year (20XX)
Hr Button
To set the hour ( 0 – 23) (24 hour format)
Min Button
To set the minutes (0 – 59)
Back Button
Returns to the Settings 4 Menu.
Default Settings
Yes
Resets TARGAS-1 to original factory settings then returns to Settings 4 Menu
No
Returns to the Settings 4 Menu with no changes.
Default Settings
Page 67
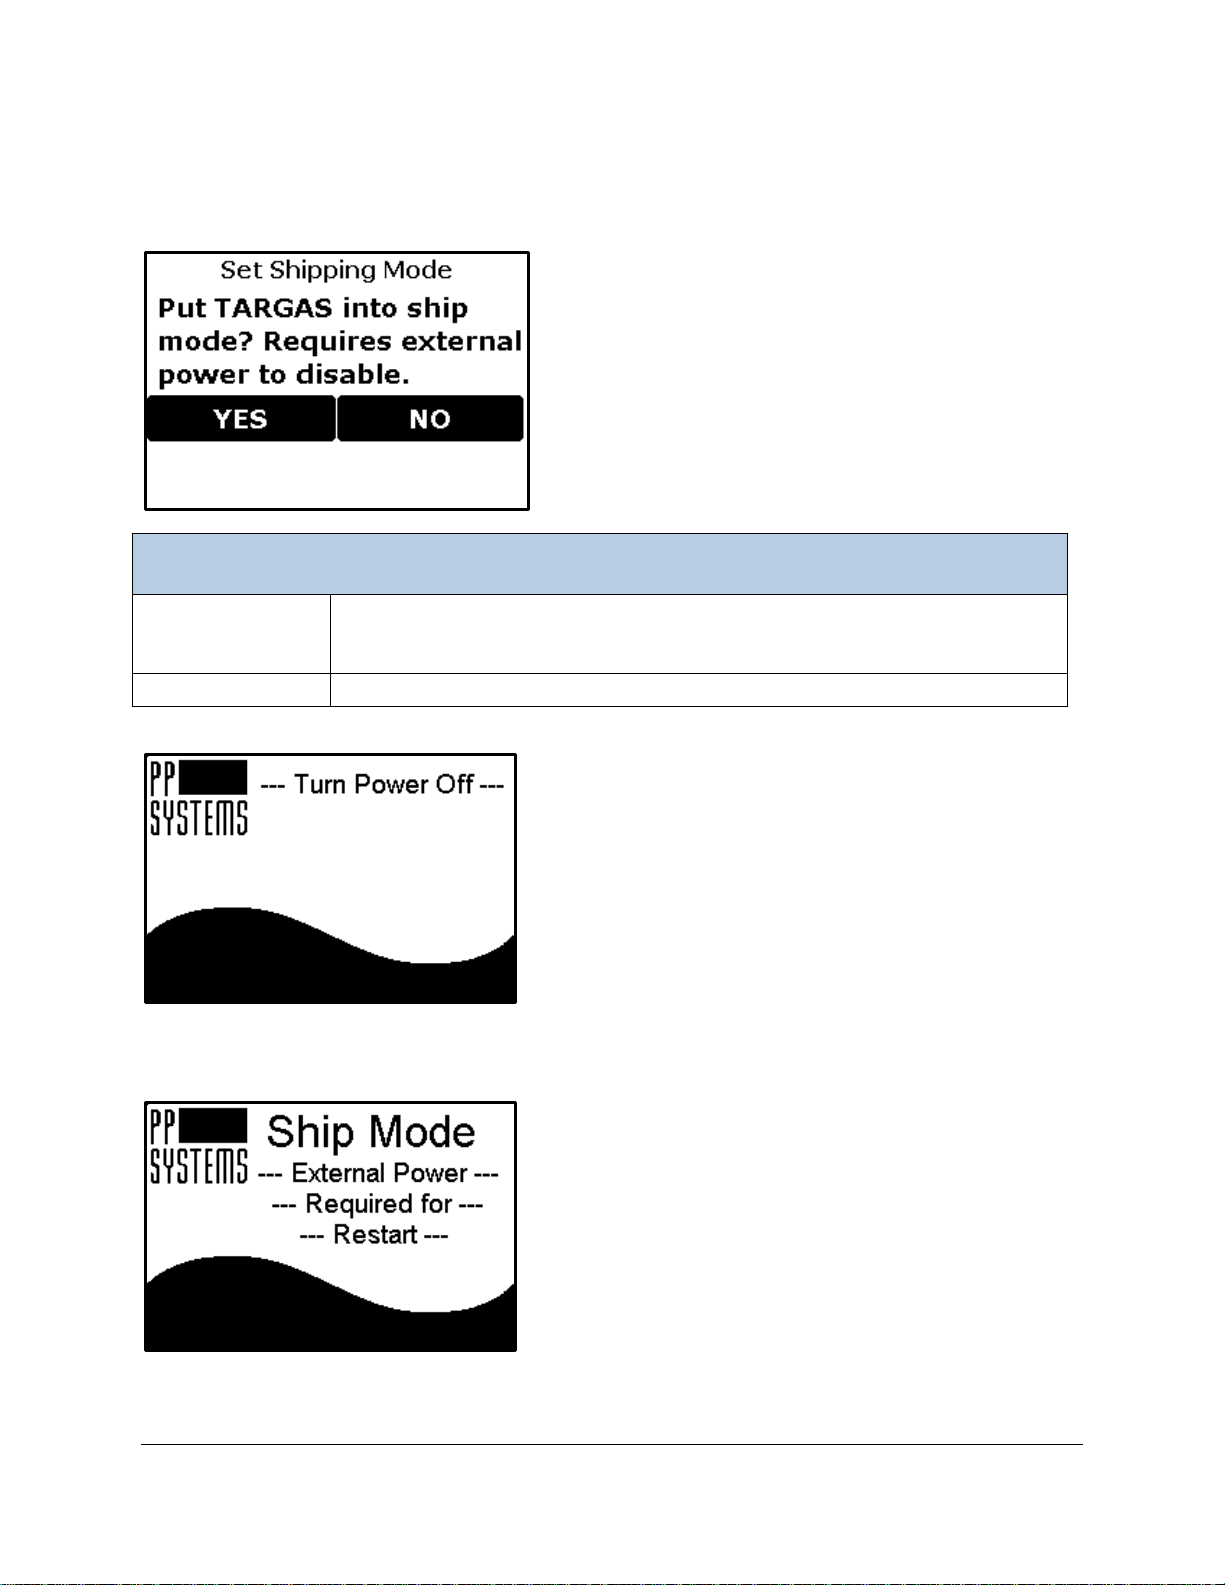
Ship Mode Settings
Ship Mode Settings
Yes
To put the TARGAS-1 into a state to prevent the batteries from being used.
action. A new Splash Screen will appear.
No
Returns to the Settings 4 Menu with no changes.
We recommend that you put the instrument into Ship Mode any time you are transporting the instrument
in order to keep the instrument from accidental power up.
Note: After selecting Yes the power switch must be turned off to complete the
Turn the power switch to the off position. Once the power is off it advances to the next screen, which will
remain until the system is powered up using the external power supply/charger supplied by PP Systems.
Page 68

Important Note
In order to get the TARGAS-1 out of “Ship Mode” you must first connect the power supply/charger to the
EXT POWER jack before turning the instrument on. If you do not have the power supply/charger
connected, you will not be able to power up the instrument.
Page 69
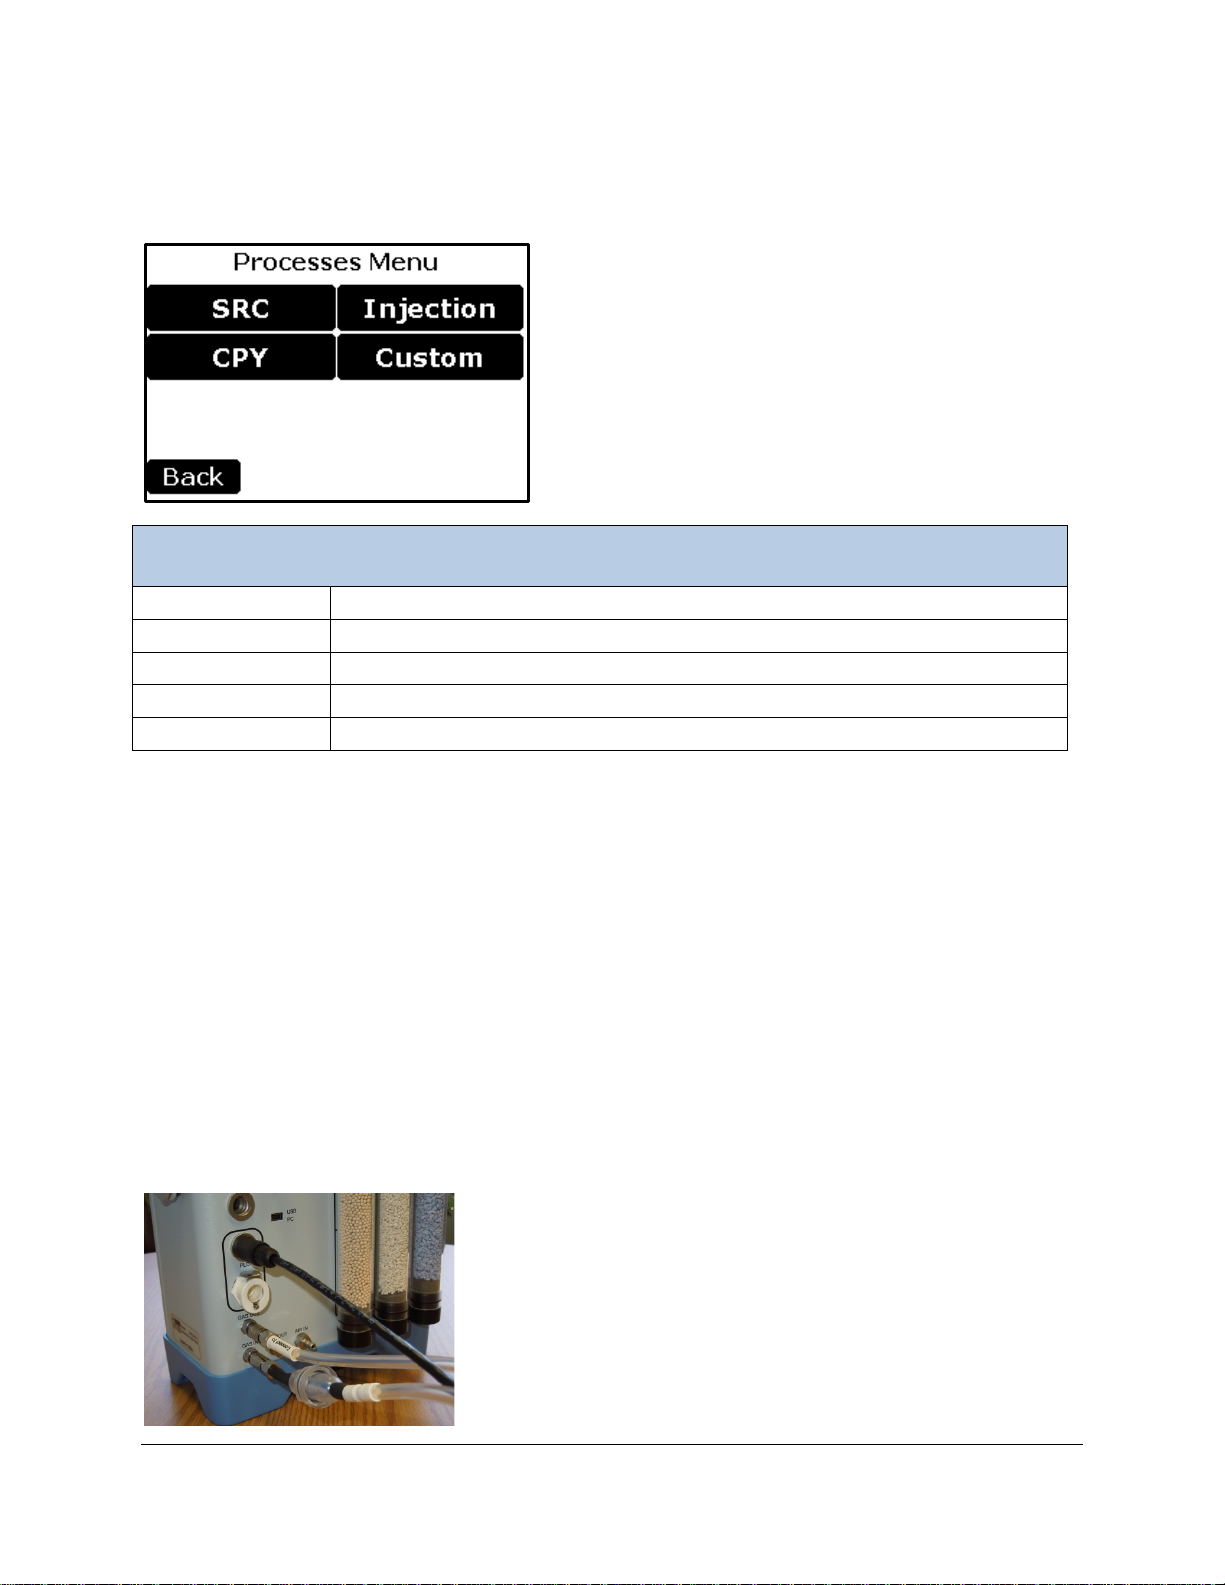
Processes
Information Menu
SRC Button
Starts the Soil Respiration Chamber (SRC) process.
CPY Button
Starts the Canopy Assimilation Chamber (CPY) process.
Injection Button
Starts the Injection process using the “Sample Injection Kit” from PP Systems.
Custom Button
Starts the Custom process (for use with customer’s own chambers).
Back Button
Returns to the Main Menu.
This menu handles the various processes of the TARGAS-1.
SRC (Soil Respiration Chamber) Process
This process is used in conjunction with our SRC-2 Soil Respiration Chamber for measurement of closed
system soil CO
rate of change (increase) in the chamber CO
calculates both a linear fit and a quadratic fit to the measured data. The data is checked in the quadratic
fit to determine if the data is linear.
While the TARGAS-1 is in the SRC measuring mode, additional data is added to the output data string:
change in CO
Once the SRC Mode is entered, it correctly configures the TARGAS-1 settings for the process.
Connecting the SRC-2 Soil Respiration Chamber to the TARGAS-1
efflux. In the SRC process, the respiration rate (g m-2 hr-1) is calculated by measuring the
2
concentration over a period of time. The TARGAS-1
2
(dC), process time (dT), Linear respiration rate (L), and Quadratic respiration rate (Q).
2
The SRC-2 Soil Respiration Chamber has one electrical connection
and two pneumatic connections. The electrical connection is made
to the socket labeled PLC on the TARGAS-1 and the pneumatic
connections are to the GAS IN and GAS OUT connectors as shown
here. The tubing on the SRC-2 is labeled accordingly for gas
connections. An air filter is also included on the GAS IN line on the
SRC-2.
Page 70
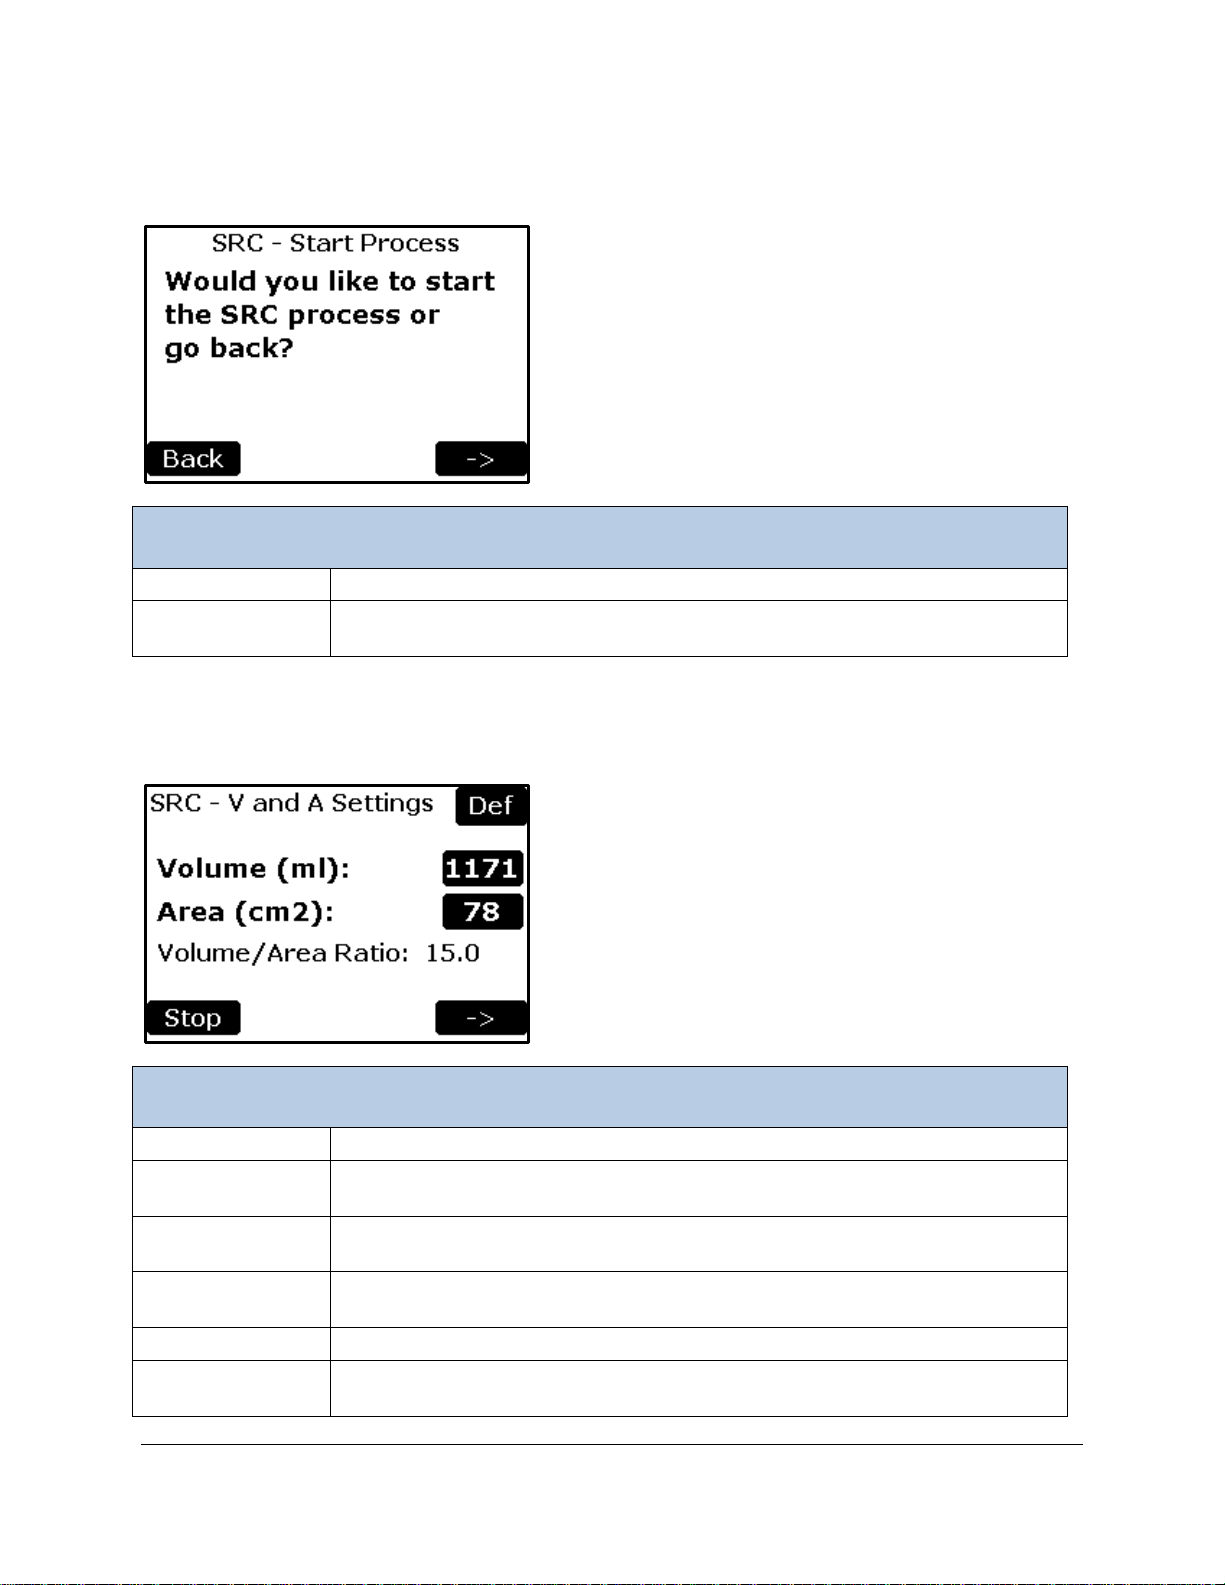
SRC – Start Process (Step 1)
SRC – Start Process
Back Button
Returns to the Processes Menu.
Right Arrow
Button
Confirms and starts the SRC process by displaying the SRC – Volume and Area
Settings screen (Step 2).
SRC – V and A Settings
Def Button
Sets the volume and area values back to the defaults.
Volume Button
Sets the volume of the system. Entries between 1,000 and 2,000 ml are
permitted. Default is 1171 ml.
Area Button
Sets the surface area of the chamber. Entries between 50 and 100 cm2 are
permitted. The default value is 78 cm2.
Volume/Area
Ratio
This value is automatically updated when there is a change to either the Volume
or Area values.
Stop Button
Stops the SRC process and returns to the Processes Menu.
Right Arrow
Button
Continues to SRC – Termination Settings screen (Step 3).
The first screen asks the user to confirm that they would like to start the SRC process.
SRC – Volume and Area Settings (Step 2)
The volume and area settings are defined in this screen.
Page 71
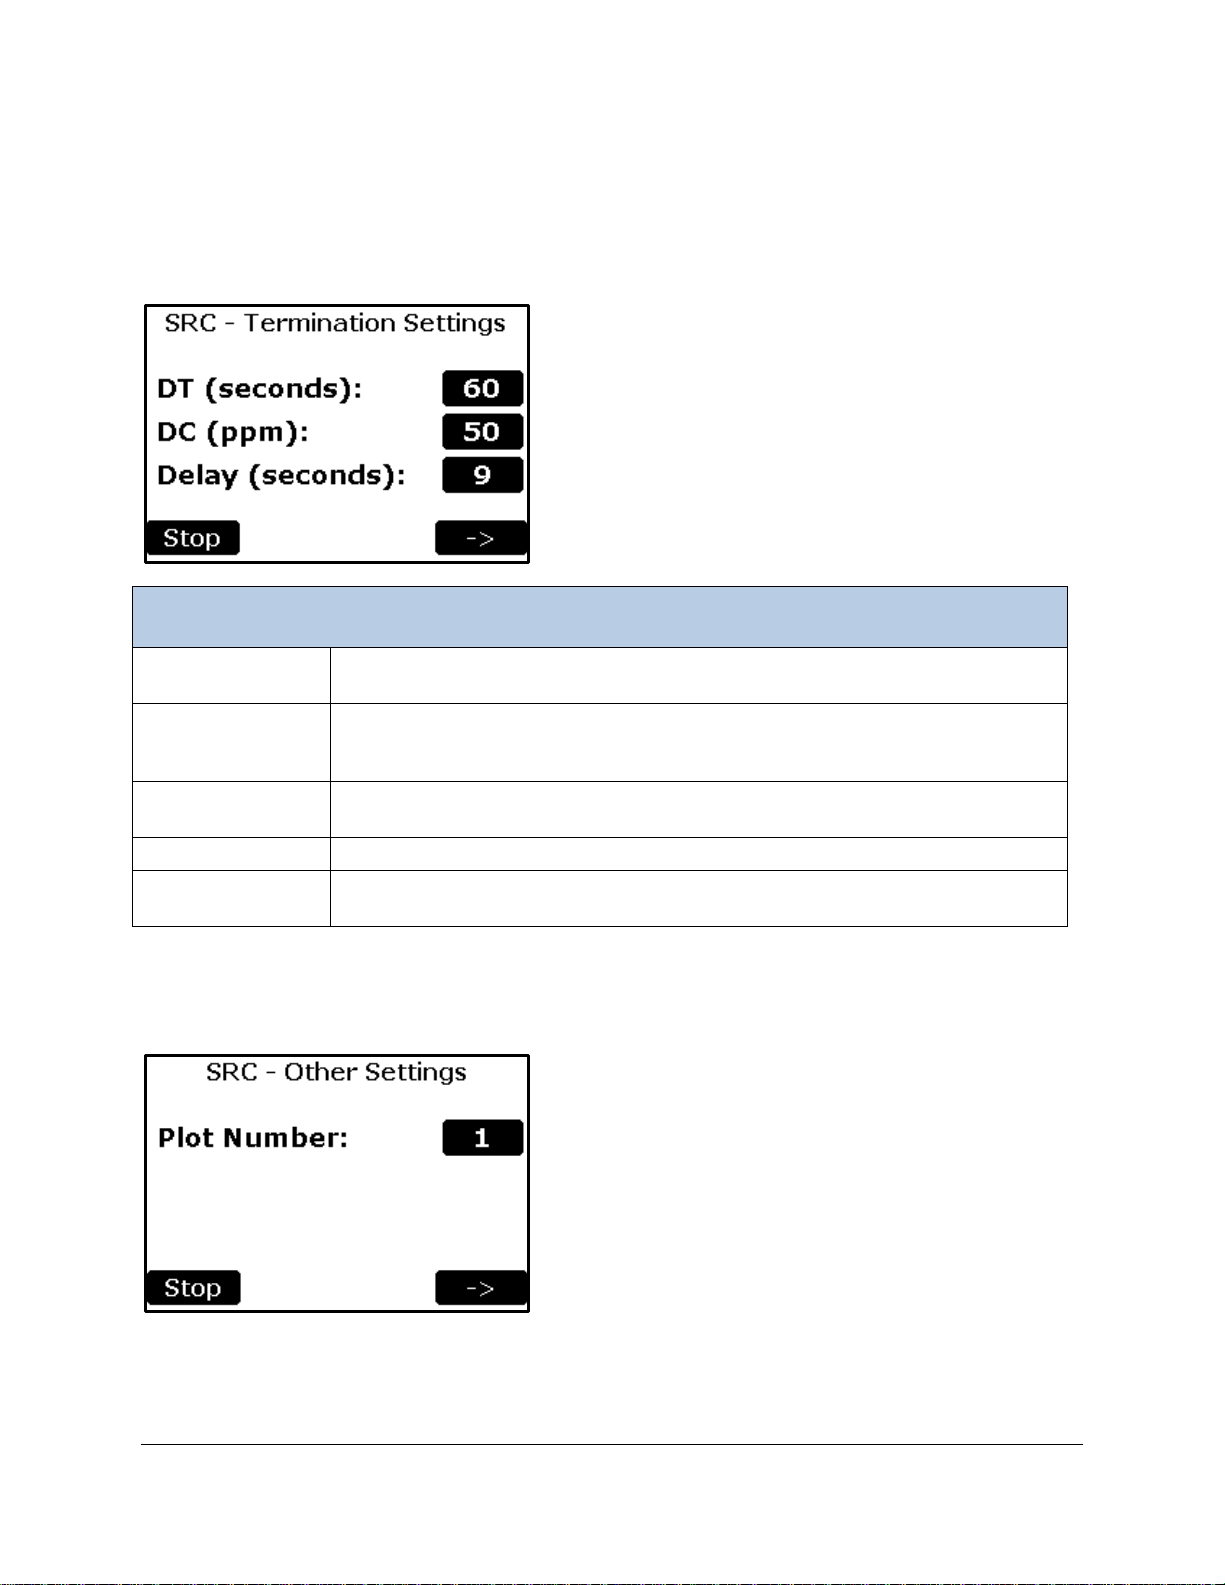
SRC – Termination Settings (Step 3)
SRC – Termination Settings
DT Button
Maximum time for which changes in the chamber CO
concentration are
monitored in a given session. Valid entries range between 10 - 300 seconds.
DC Button
Maximum positive change in CO2 concentration (ppm) allowed in a given
are between 1 - 1000 ppm.
Delay Button
The amount of time the instrument waits at the start of each session before it
starts calculating respiration. Valid entries are between 5 – 150 seconds.
Stop Button
Stops the SRC process and returns to the Processes Menu.
Right Arrow
Button
Continues to SRC – Other Settings screen (Step 4).
The Termination settings (DT, DC) as well as delay are defined in this screen. These settings define the
end conditions for the SRC process. Each new measurement session will begin after the specified Delay,
and will terminate when either the elapsed time reaches the DT value, or when the total change in CO
exceeds a specified threshold (DC), whichever occurs first.
2
session. If total change exceeds this value, the session will end. Valid entries
2
SRC – Other Settings (Step 4)
The plot number is defined in this screen to allow the user to identify different sampling plots.
Page 72
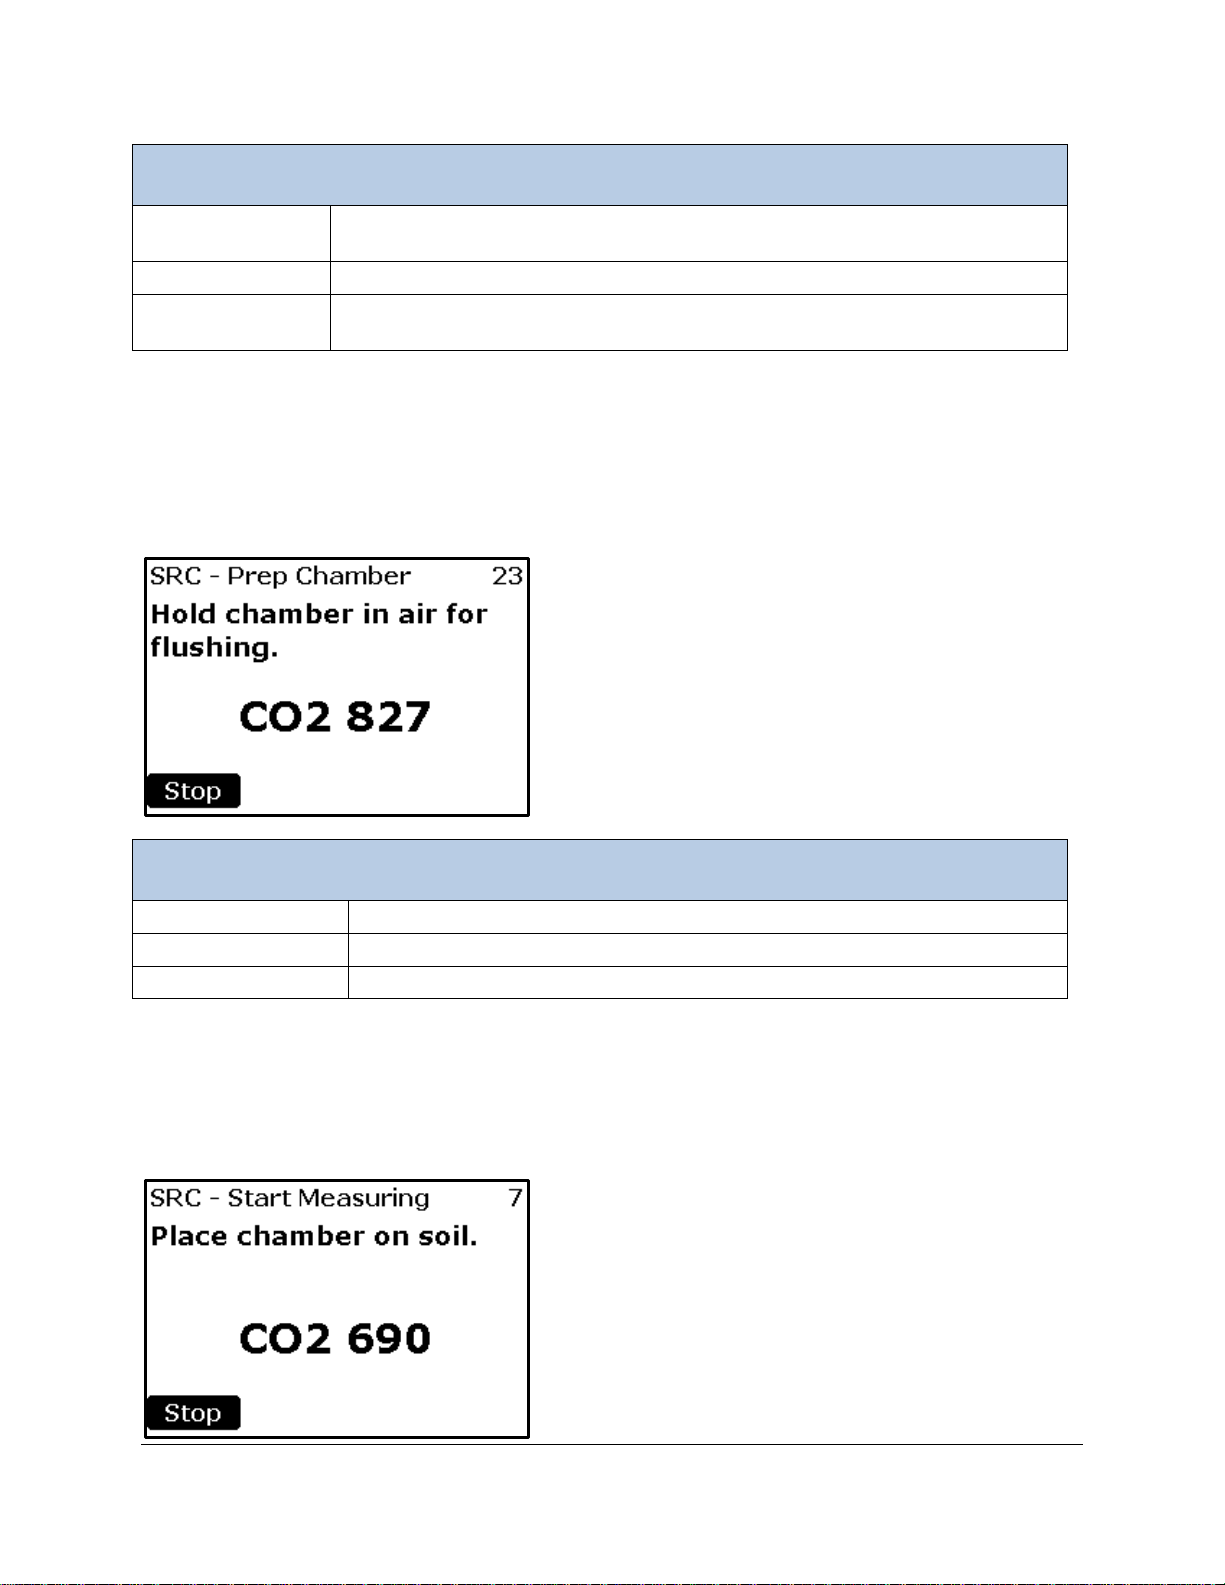
SRC - Other Settings
Plot Number
Button
Change/View plot number. Range: 0–1000.
Stop Button
Stops the SRC process and returns to the Processes Menu.
Right Arrow
Button
Continues to SRC Flushing screen (Step 5).
SRC – Prepare Chamber Menu (Step 5)
CO2
Current CO2 concentration (ppm).
23
Countdown in seconds (from 25 to 0).
Stop
Stops the SRC process and returns to SRC – Other Settings menu (Step 4).
SRC Flushing (Step 5)
At this stage, the SRC chamber should be held in the air to allow it to flush out prior to placing it on the
soil. During the flushing, the internal fan of the SRC is sped up to help flush. The number at the top right
of the screen (23 in this case) is the countdown. CO
completed, SRC Step 6 will be displayed.
concentration is disp la yed dur ing this ste p. When
2
SRC – Start Measuring (Step 6)
At this stage, the SRC chamber should be placed on the soil. The internal fan is set to a low speed to
provide an even concentration of CO
countdown. CO
concentration is displayed during this s tep. When completed, the Data Plot Screen will
2
be displayed.
. The number at the top right of the screen (7 in this case) is the
2
Page 73
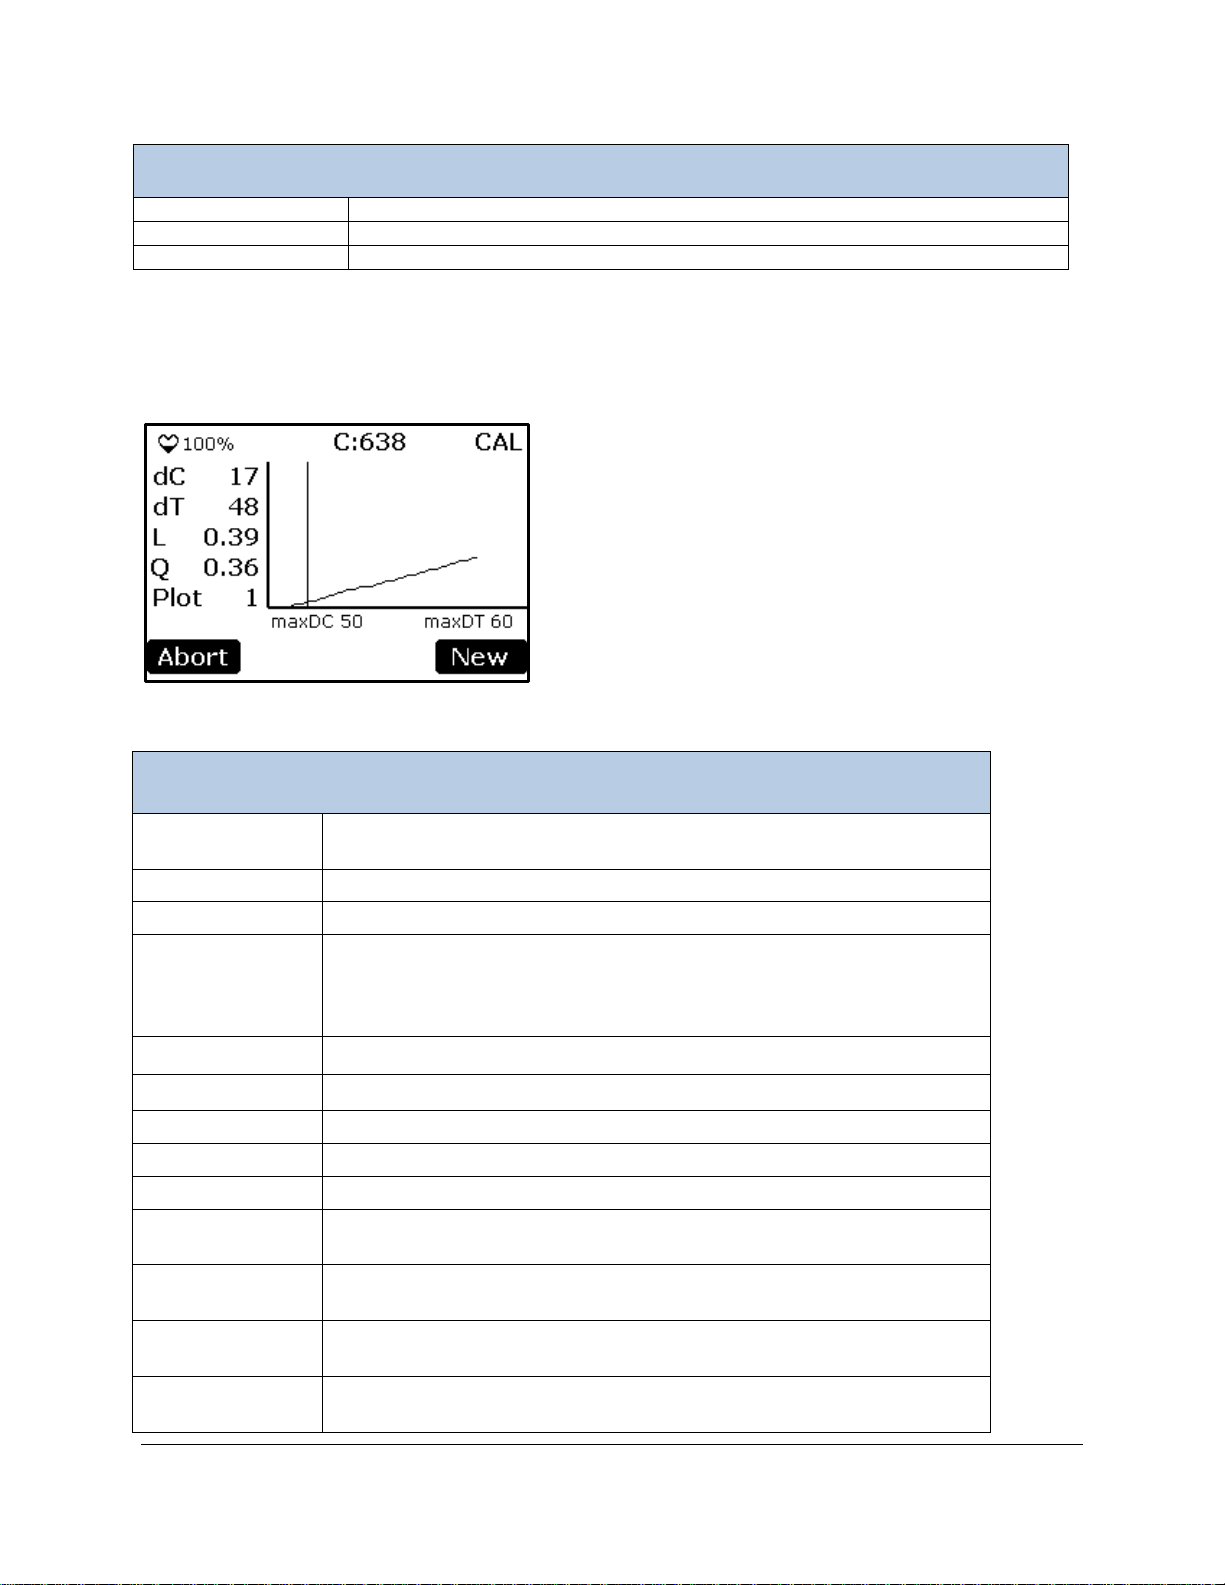
SRC – Start Measuring Menu
CO2
Current CO2 concentration (ppm).
7
Countdown in seconds (from 10 to 0)
Stop
Stops the SRC process and returns to SRC – Other Settings menu (Step 4).
SRC Data Plot Screen
♥ (Heartbeat)
Pulses on and off to indicate that the system is powered and operating.
Press to return to normal 1 second display updates.
100%
Percentage of battery life remaining (%).
C: 638
Current CO2 concentration (ppm).
Delay/CAL/END
Delay is the countdown in seconds from x to 0, where x is the delay
been terminated.
dC
The difference in CO2 concentration (ppm) from time = 0 seconds.
dT
Elapsed time (seconds) for the current session (i.e., change in time).
L
Linear respiration rate (g m-2 hr-1).
Q
Quadratic respiration rate (g m-2 hr-1).
Plot
Plot number defined by user in SRC – Other Settings (Step 4).
X-axis
Time (0 to maxDT seconds). Vertical line represents start of
calculations.
Y-axis
dC (change in CO2 concentration from start of measurement. 0 to
maxDC (ppm)
maxDC
Maximum positive change in CO2 concentration (ppm) allowed in a given
session. This value is defined in SRC – Termination Settings (Step 3).
maxDT
Maximum time for which changes in the chamber CO
concentration are
monitored in a given session. This value is defined in SRC – Termination
Data Plot Screen (Step 7)
This screen displays present values and a graphical representation of the data gathered during the
current session.
value specified in SRC – Termination Settings (Step 3). CAL is the active
concentration calculating phase. END indicates calculations have
CO
2
2
Page 74

Settings (Step 3).
Abort
Stops the SRC process and returns to SRC – Other Settings (Step 4).
Only the individual CO2 measurements are saved to the USB flash drive.
Process data is discarded.
New
Stops the SRC process and returns to SRC – Other Settings (Step 4).
Results are saved to the USB flash drive.
The measurement sequence will terminate when the maxDC or maxDT is reached. If maxDT is reached
first, the message “Time limit” will appear in the status box. If maxDC is reached first, the message “CO2
limit” will appear in the status box.
For more information on the theory and calculation of soil respiration/canopy assimilation, please refer to Mass Flow
Calculate the mass flow of air (W) entering the cuvette per unit leaf area
(A.1) The TARGAS-1 mass flowmeter is calibrated to read the volume flow (V
(STP). The Ideal Gas molar volume is 22.414 L mol
‐
)
W(mol m‐s
=
-1
V
60 × 10
at STP. Therefore:
×
1
22.414
×
) at 0 °C and 1013.25 mb
10
a
where:
2
a = projected leaf area (measured in cm
= volume flow (measured in cc min-1 converted above to L sec-1)
V
converted above to m2)
Note that W and all subsequent equations are presented as quantities per unit leaf area. The projected
leaf area is an input to the TARGAS-1 software to correctly compute gas exchange results. The PLC5
window area is 4.5 cm
2
, and this is the default leaf area used in calculations. However, if measurements
are made with leaves that don't completely fill the window, the actual Leaf Area should be entered in
Measure Screen 2 prior to making measurements. Alternately, if the Leaf Area is not known at the time of
measurements, PP Systems provides a simple TARGAS-1 Excel
®
spreadsheet program that allows
recalculation of all gas exchange results with different Leaf Area.
Transpiration
Calculate transpiration rate (E) from the partial pressures of water vapor of the air entering (e) and
exiting (e
) the cuvette
(A.2) The molar flow of water vapor (mol m
2 s-1
) into the cuvette is:
W ×
(A.3) The molar flow of air out of the cuvette (with the addition of transpired water vapor) is (W + E).
Therefore, the molar flow of water vapor out of the cuvette is:
(
W + E
)
×
e
P
e
P
Page 75

(A.4) However, the difference between the molar flows into and out of the cuvette must equal the
transpiration, so:
E =
(
W + E
)
×
e
‐ W ×
P
e
P
(A.5) Therefore:
)
=
W ×(e
(
P‐e
E(mmol m
e
is defined as the partial pressure of water vapor of reference air supplied to the cuvette, but not yet
‐ s‐
inside the cuvette, and therefore uninfluenced by the cuvette stirring fans or the leaf itself. e
pressure is determined by the H
e
is defined as the partial pressure of water vapor in the air inside the cuvette, surrounding the leaf.
O IRGA during Reference phase.
2
‐e
)
)
× 10
mmol
partial
This air is both highly mixed by the stirring fans and influenced by transpiration water vapor from the leaf.
e
partial pressure is determined by the H2O IRGA during Analysis phase. As related to the calculated
values in the TARGAS-1 display:
e
= H2Or
e
= H2Oa
Leaf Temperature
Calculate leaf temperature (T
The Energy Balance technique estimates leaf temperature by equating energy flux into the leaf with
energy flux out of the leaf. The model includes incident solar radiation, leaf re-radiation, convective heat
transfer, and transpiration. (Note: the energy balance estimate for leaf temperature is one option on
TARGAS-1, the other option is to use chamber temperature.)
) from the energy balance
(A.6) From Parkinson, 1983, the energy balance technique gives the difference between air and leaf
temperature as:
H‐× E
t =
.××
+[× (
(
T+ 273)
where:
H = incident radiation absorbed by the leaf
= latent heat of vaporization of water
E = transpiration rate
M
= molecular weight of air
C
= specific heat at constant pressure
]
)
Page 76

r
= boundary layer resistance to water vapor transfer, empirically determined for each cuvette by
the pseudo-leaf (filter paper) method. 0.93 converts it to that for heat transfer.
= Stefan Boltzmann constant
T
= cuvette air temperature
H is calculated from the photon flux incident on the cuvette (Q), taking into account the ratio of infra-red to
visible radiation and typical reflection/absorption factors by the leaf:
H = Q × Trans
Where Trans = 0.14 the ratio of infrared to visible radiation, and converting photon flux to energy units
To simply computatio n, the f ollo wing approximation is made:
×
((
T+ 273)
)
4.639 +(0.5834 × T
)
(A.7) Then, the leaf temperature is:
T
=(T
+ t
)
Saturation Vapor Pressure
Derive saturation vapor pressure at leaf temperature (e
(A.8) From Buck, 1981 (using e
and fw1) we calculate:
w1
) from T
Where e
T
e
= 6.1365 × exp
= saturated water vapor pressure inside leaf at T
T
×(17.502
+ 240.97
)
Stomatal Conductance
Calculate stomatal conductance (gs)
(A.9) From von Caemmerer & Farquhar, 1981 (Eq B14), total leaf conductance to H
calculated as:
g
E × (P‐(e
=
(A.10) Since 1/g
(A.11) stomatal resistance can be calculated as:
total
= rs+ r
(
r
m
,
b
s mol
‐
)
=
(
(
e
‐e
(
e
E × (P‐(e
+ e
)
‐e
+ e
)/2
)
)
)/2)
)
‐r
O transfer is
2
(A.12) Stomatal conductance is the inverse of stomatal resistance:
Page 77

(
g
mmol m
‐ s‐
1
)
=
r
× 10
mmol
mol
Net Photosynthesis
Determine the rate of net photosynthesis (A) from the difference between CO2 concentrations entering
) and exiting (C
(C
in
) the cuvette
out
(A.13) IRGA CO
addition of transpirational water vapor dilutes the air leaving the cuvette (
readings are corrected for water vapor, temperature, and atmospheric pressure. The
2
C
), and this is compensated
for in the calculation:
]
A =(C× W)‐[C
(A.14) To calculate net CO
TARGAS-1 calculates and displays the CO
assimilation we rearrange equation (A.13) to:
2
(
A = ‐
C
‐C
difference (C
2
)
×(W + E
× W+(C
‐C
)
)
× E
). As related to the calculated values in
the TARGAS-1 display:
C
= CO2a
C
‐C
= CO2d
Intercellular CO2 Concentration
Calculate CO2 concentration in the sub-stomatal cavity (C) using the equation derived by von
Caemmerer & Farquhar, 1981
(A.15) The sub-stomatal CO2 concentration,
(
C
mol mol
C
, is given by:
g
‐
)
=
‐
g
× C
+
‐A
(A.16) Where g
is the total conductance to CO2 transfer:
g
(
mmol m
‐ s‐
)
=
(
1.585 × r
)+(
1
1.37 × r
× 10
)
(1.585 is the diffusion ratio of CO2 and water in air, and 1.37 is the diffusion ratio of CO2 and water in the
boundary layer).
Note: These calculations are based on the following assumptions:
• the leaf is exposed on both upper and lower leaf surfaces
• the upper and lower boundary layer resistances are similar
• stomata are evenly distributed on both upper and lower leaf surfaces.
Page 78
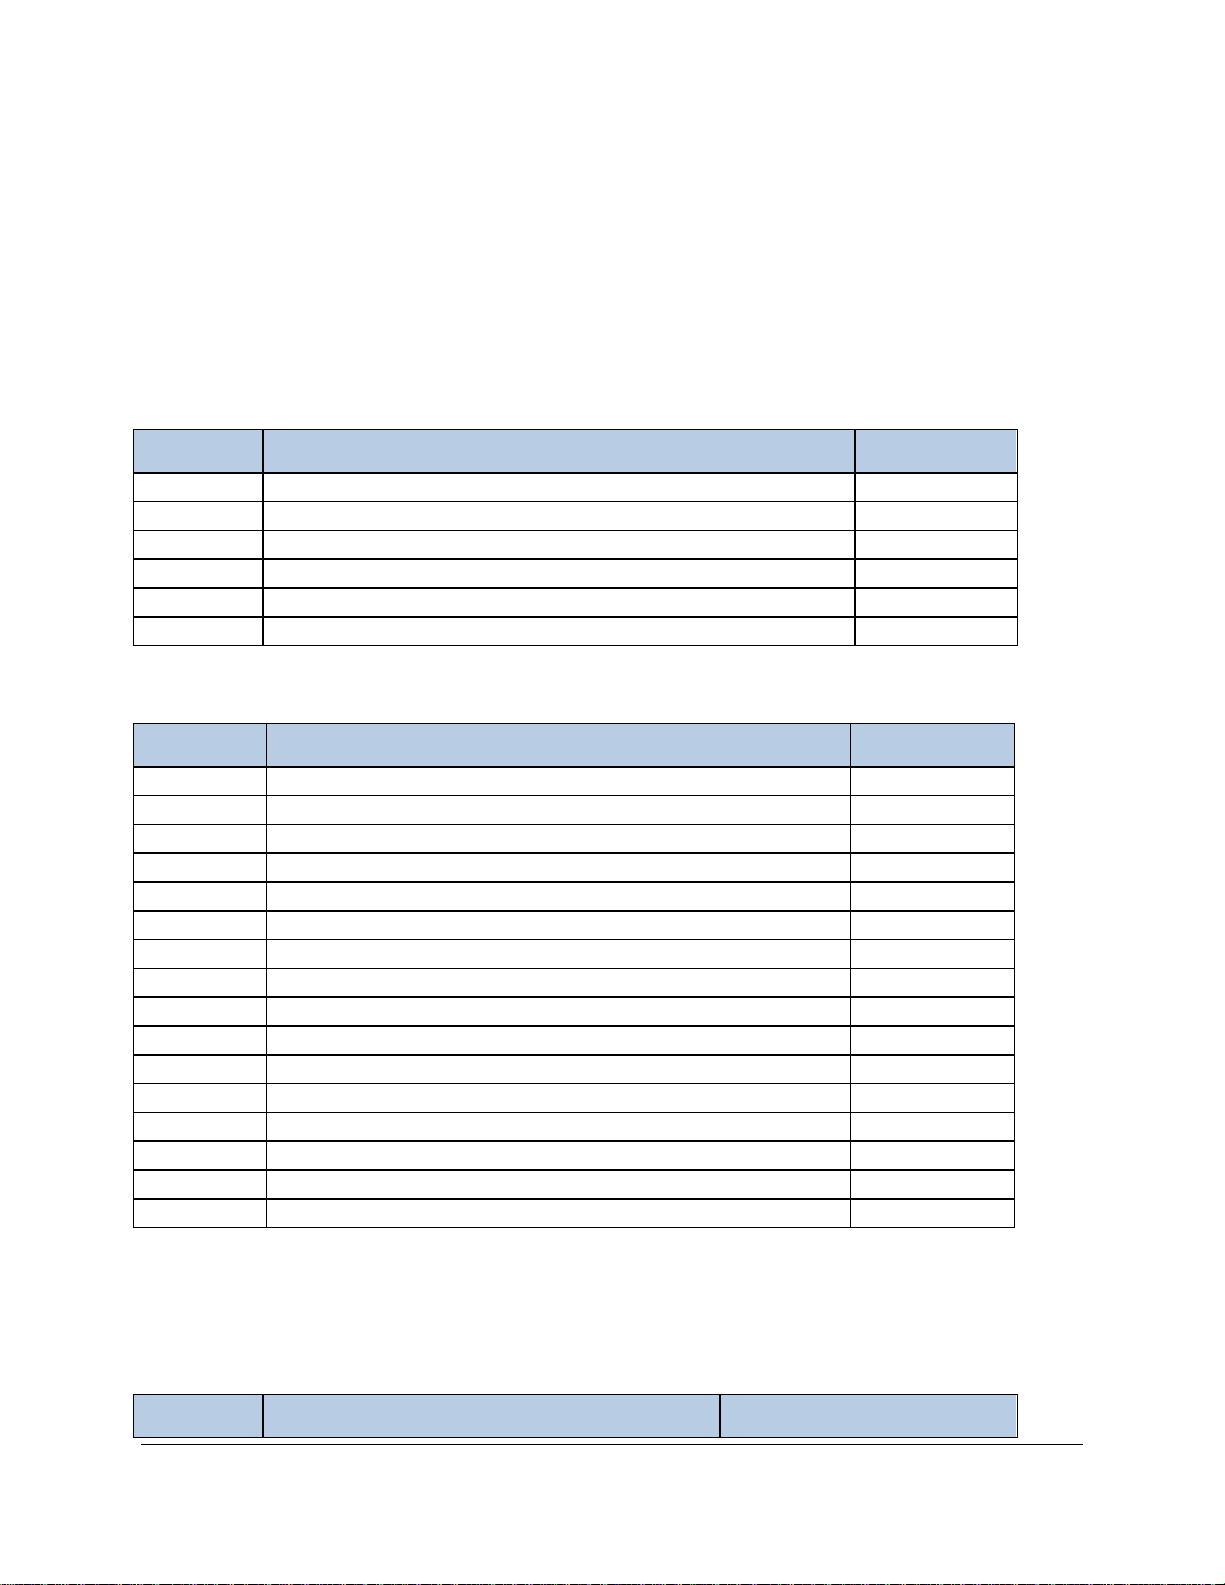
Symbol
Parameter
Unit
V
Flow rate of dry air into cuvette at STP
cc min
-1
a
Projected leaf area
cm2
r
Boundary layer resistance to water vapor
m2 s mol-1
P
Atmospheric pressure
mb Q Photon flux density incident on cuvette
µmol m-2 s-1
T
Cuvette air temperature
°C
Symbol
Parameter
Unit
W
Mass flow of air per unit leaf area into cuvette
mol m-2 s-1
e
Partial pressure of water vapor of air entering cuvette = H2Or
mb *
e
Partial pressure of water vapor of stirred cuvette air = H2Oa
mb *
E
Transpiration rate
mmol m-2 s-1
e
Saturated vapor pressure (inside the leaf) at leaf temperature
mb
T
Leaf temperature
°C
t
Temperature differenc e between the air and the leaf
°C
H
Radiation absorbed by the leaf
W m-2
r
Stomatal resistance to water vapor
m2 s mol-1
g
Stomatal conductance to water vapor
mmol m-2 s-1
C
CO2 concentration of air entering cuvette = CO2r
µmol mol
-1
*
C
CO2 concentration of air inside and exiting the cuvette = CO2a
µmol mol-1 *
A
CO2 Assimilation rate (net photosynthesis)
µmol m-2 s-1
g
Total conductance to CO2 transfer
mmol m-2 s-1
g
Total conductance to H2O transfer
mmol m-2 s-1
C
CO2 concentration of sub-stomatal cavity
µmol mol-1
Symbol
Parameter
Value
Definition of Symbols and Physical Constants Used in Equations
Measured Parameters
Calculated Parameters
* Detected by IRGAs, temperature and pressure corrected, effects of foreign gas broadening (water vapor
effects) on measurement corrected.
Physical Constants
Page 79

Symbol
Parameter
Value
Latent heat of vaporization of water
45064.3 - (Tc x 42.9) J mol
-1
M
Molecular mass of air
28.97
C
Specific heat at constant pressure
1.012 kJ kg-1 K-1
Stefan Boltzmann constant
5.6704 x 10⁻⁸ W m-2 K-4
References
Parkinson, K.J. 1983. Porometry in S.E.B. Symposium of Instrumentation for Environmental Physiology.
Cambridge University Press.
Buck, A.L. 1981. New equations for computing vapour pressure and enhancement factor. J. Appl.
Meteorol., Vol. 20:1527-1532.
von Caemmerer, S. and G.D. Farquhar 1981. Some relationships between the biochemistry of
photosynthesis and the gas exchange of leaves. Planta, Vol. 153:376-387.
Page 80
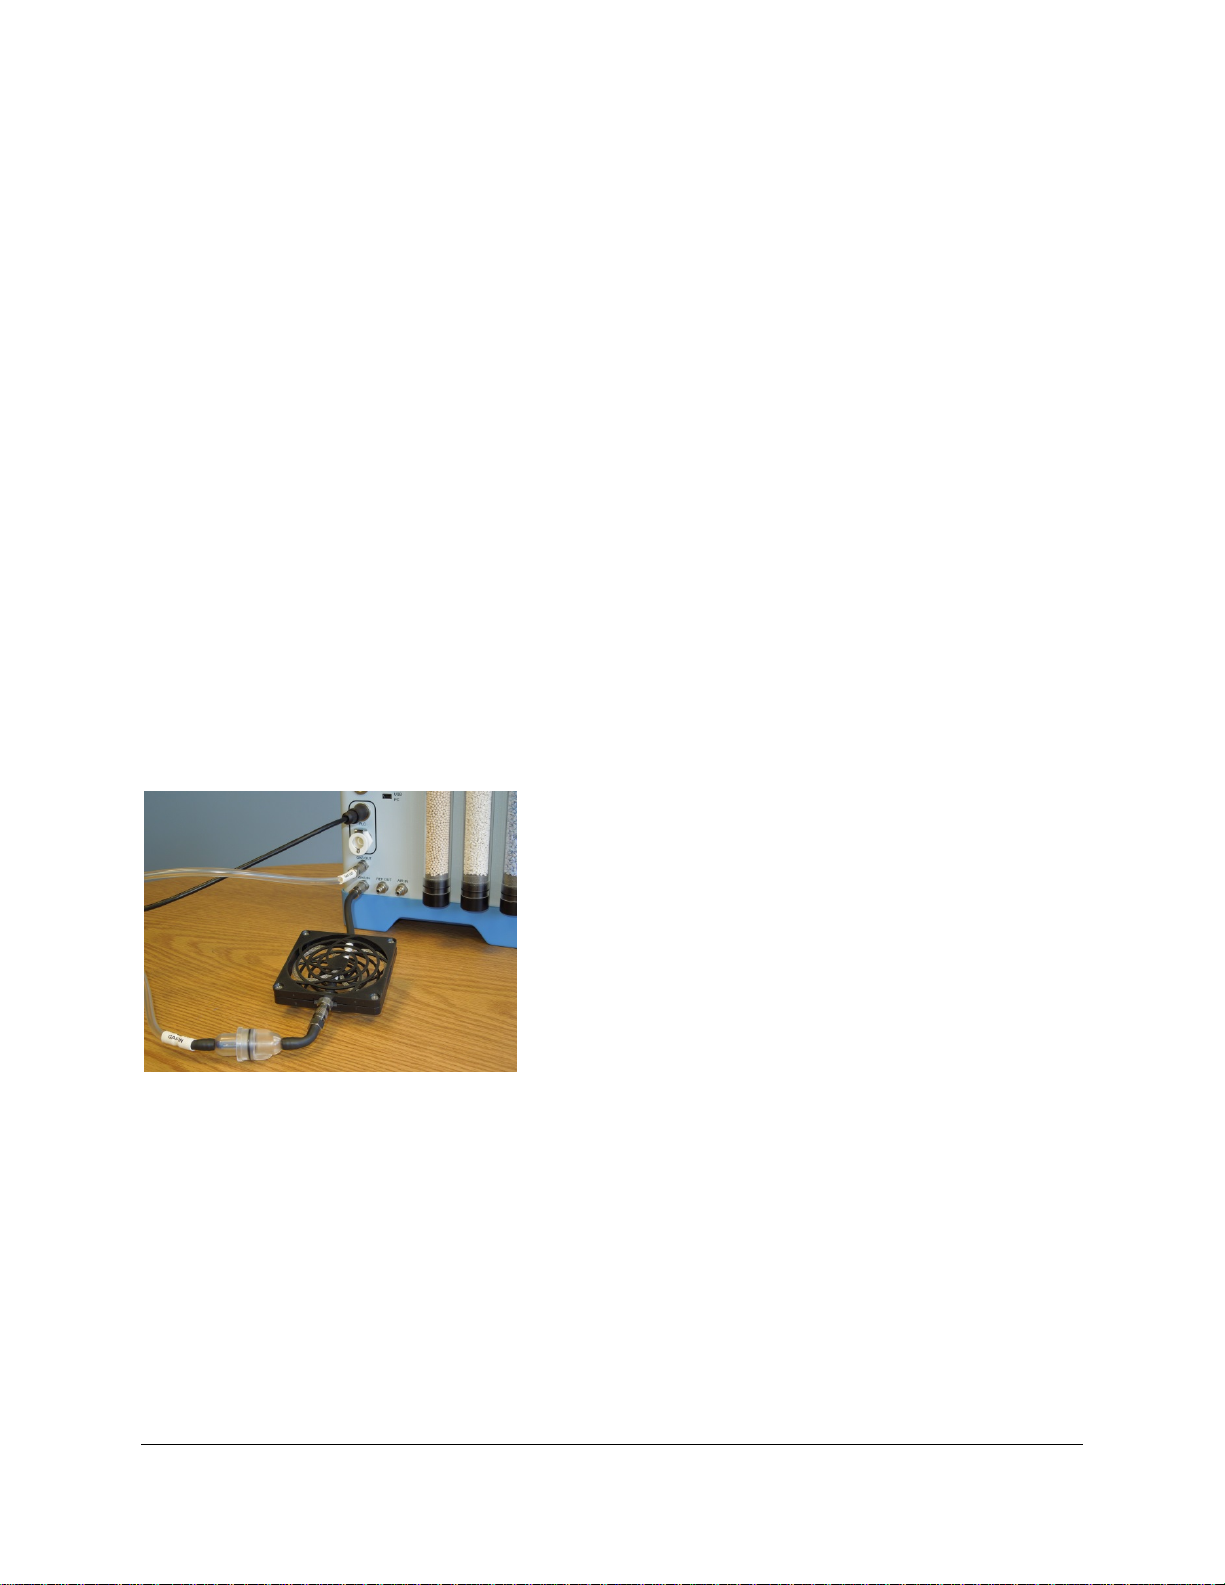
Appendix 2. Soil CO2 Efflux and Net Canopy CO2 Flux on page 150.
CPY (Canopy Assimilation Chamber) Process
This process is used in conjunction with our CPY-5 Canopy Assimilation Chamber for measurement of
closed-system net canopy CO
by measuring the rate of change (decrease) in the chamber CO
calculates both a linear fit and a quadratic fit to the measured data. The data is checked in the quadratic
fit to determine if the data is linear.
While the TARGAS-1 is in the CPY measurement mode, additional data is added to the output data
string: change in CO
(dC), process time (dT), Linear respiration rate (L), and Quadratic respiration rate
2
(Q).
Connecting the CPY-5 Canopy Assimilation Chamber to the TARGAS-1
flux. In the CPY process, the assimilation rate (μmol m-2 s-1) is calculated
2
concentration. The TARGAS-1
2
The CPY-5 Canopy Assimilation Chamber has one electrical
connection and two pneumatic con nect ions . The electrical
connection is made to the socket labeled PLC on the
TARGAS-1 and the pneumatic connections are to the GAS
IN and GAS OUT connectors as shown here. The tubing on
the CPY-5 is labeled accordingly for gas connections. An air
filter is also included on the GAS IN line on the CPY-5. For
best results we also recommend using the H
(Part No. 10049-2) on the GAS IN line as shown to assist
with reducing the build-up of humidity in the gas stream.
CPY – Start Process (Step 1)
The first screen asks the user to confirm that they would like to start the CPY process.
O equilibrator
2
Page 81
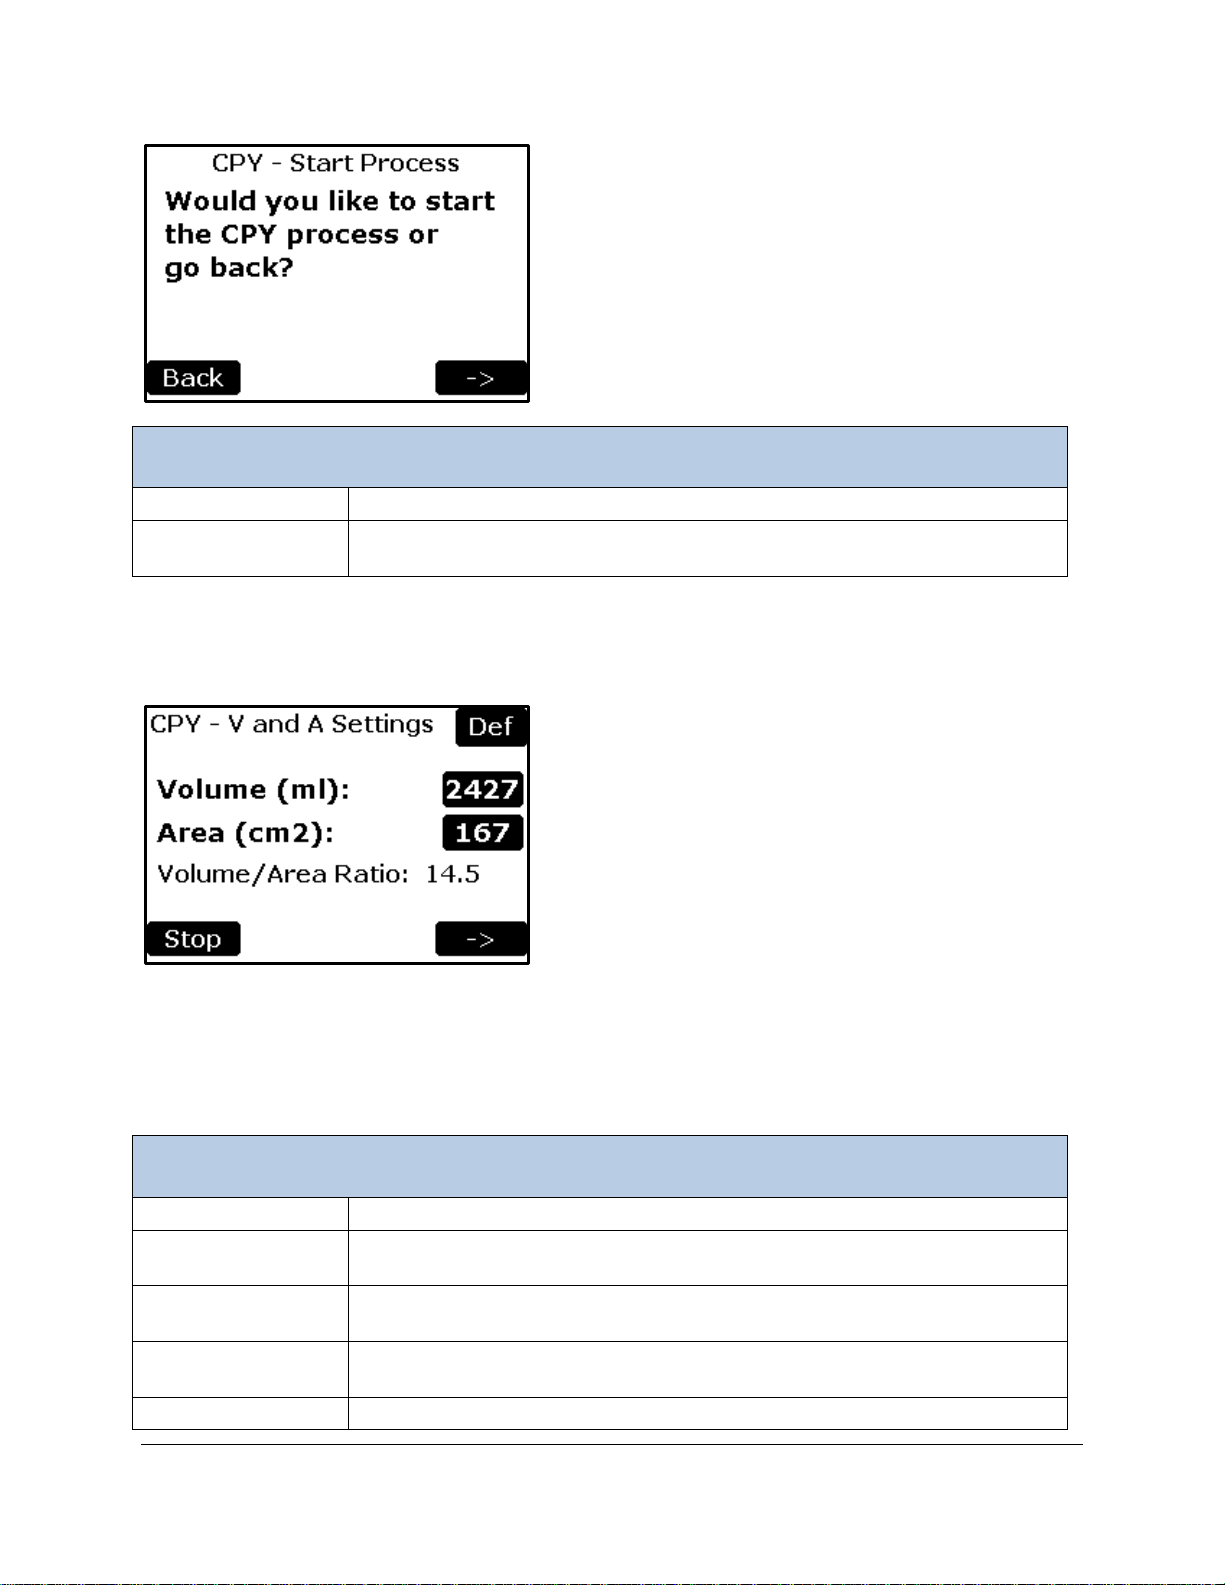
CPY – Start Process Menu
Back Button
Returns to the Processes Menu.
Right Arrow Button
Confirms and starts the CPY process by displaying the CPY – Volume and
Area Settings menu (Step 2).
CPY – Volume and Area Settings Menu
Def Button
Sets the volume and area values back to the defaults.
Volume Button
Sets the volume of the system. Entries between 1,000 and 5,000 ml are
permitted. Default is 2427 ml.
Area Button
Sets the surface area of the chamber in cm2. Entries between 150 and 200
cm2 are permitted. The default value is 167 cm2.
Volume/Area Ratio
This value is automatically updated when there is a change to either the
Volume or Area values.
Stop Button
Stops the CPY process and returns to the Processes Menu.
CPY – Volume and Area Settings (Step 2)
The volume and area settings are defined in this screen.
Important Note. The above values are based on the default volume for the CPY-5 Canopy Assimilation
Chamber only. You must remember to account for any volume changes in order for the instrument to
properly calculate assimilation rates. If using collars, please make sure that you adjust the volume
accordingly.
Page 82
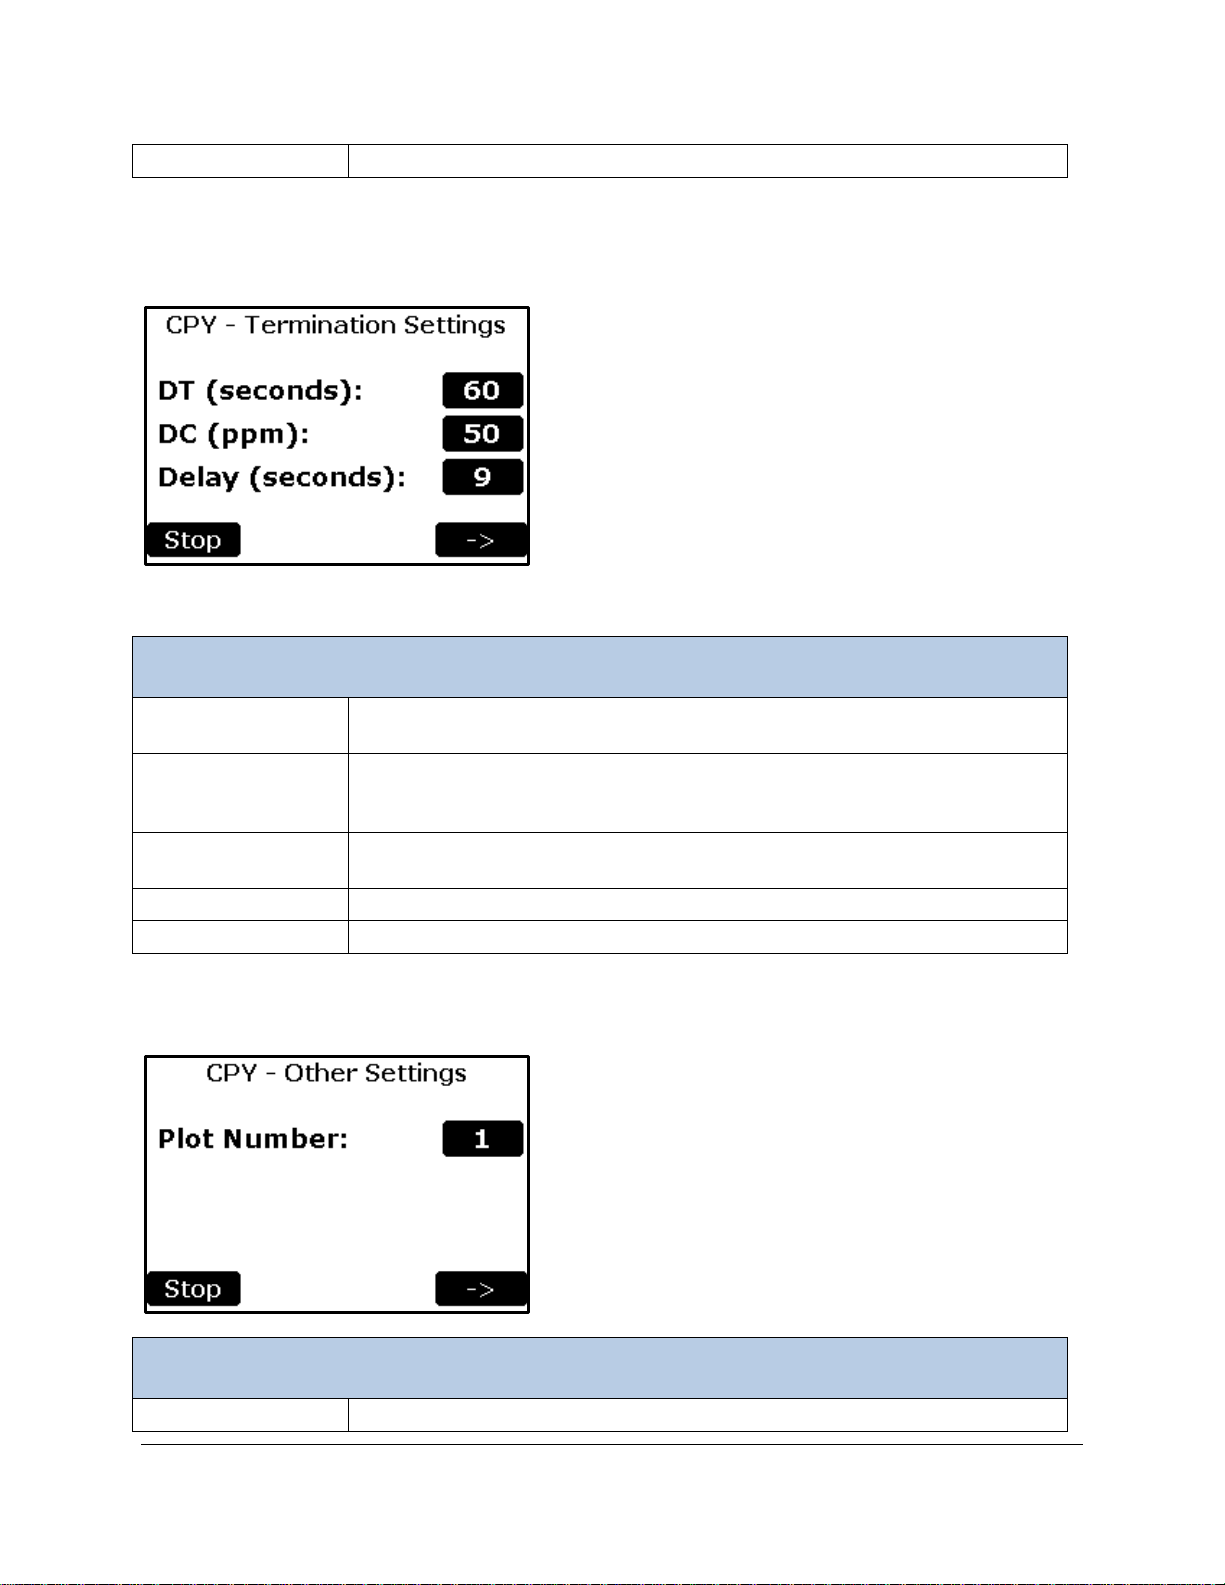
Right Arrow Button
Continues to CPY – Termination Settings menu (Step 3).
CPY – Termination Settings Menu
DT Button
Maximum time for which changes in the chamber CO
concentration are
monitored in a given session. Valid entries range between 10 - 300 seconds.
DC Button
Maximum negative change in CO2 concentration (ppm) allowed in a given
are between 1 - 1,000 ppm.
Delay Button
The amount of time the instrument waits at the start of each session before it
starts calculating assimilation. Valid entries are between 5 – 150 seconds.
Stop Button
Stops the CPY process and returns to the Proc es ses Menu .
Right Arrow Button
Continues to CPY – Oth er Sett ings Menu (Step 4).
CPY – Other Settings Menu
Plot Number Button
Change/View plot number. Range: 0–1000.
CPY – Termination Settings (Step 3)
The Termination Settings (DT, DC) as well as Delay are defined in this screen.
2
session. If total change exceeds this value the session will end. Valid entries
CPY – Other Settings (Step 4)
The plot number is defined in this screen.
Page 83
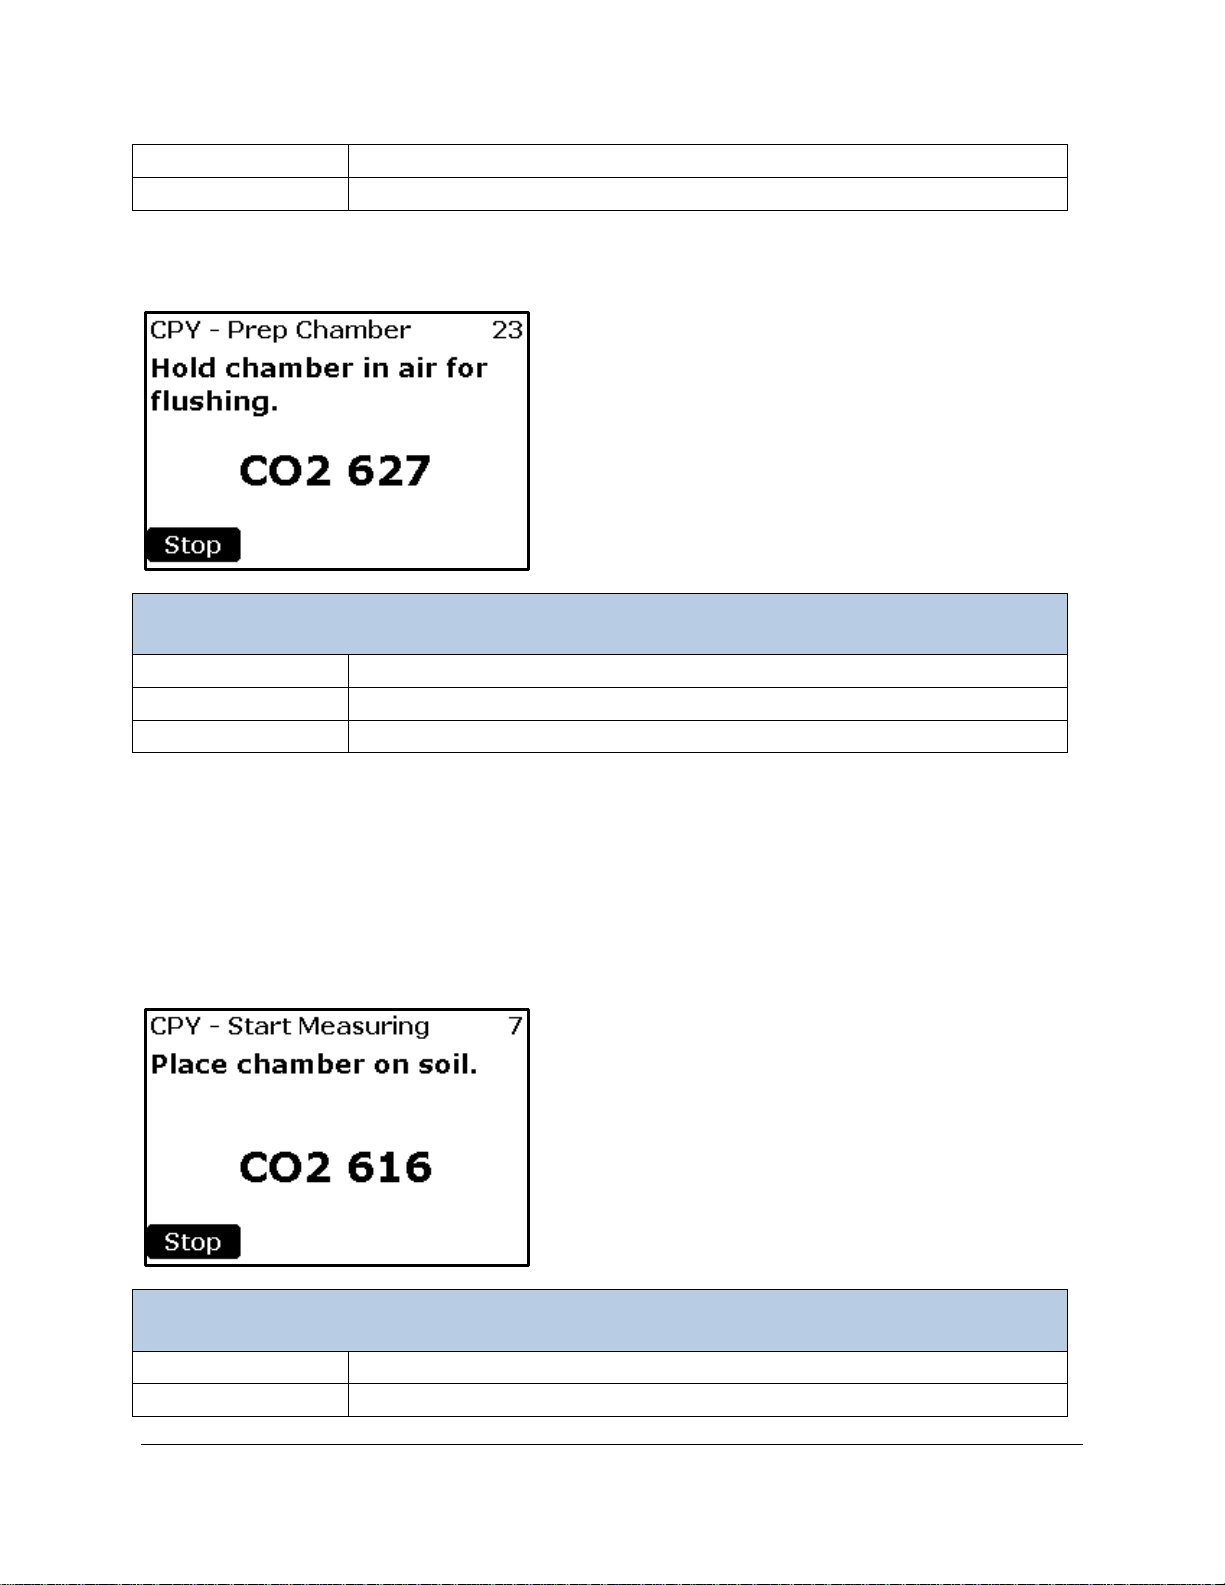
Stop Button
Stops the CPY process and returns to the Processes Menu.
Right Arrow Button
Continues to CPY – Prepare Chamber menu (Step 5).
CPY – Prepare Chamber (Step 5)
CPY – Prepare Chamber Menu
CO2 (ppm)
Current measurement of CO2 concentration (ppm).
23
Countdown in seconds (from 25 to 0)
Stop Button
Stops the CPY process and returns to CPY– O ther Se ttin gs (Step 4).
CPY – Start Measuring Menu
CO2 (ppm)
Current measurement of CO2 concentration (ppm).
7
Countdown in seconds (from 10 to 0)
This screen instructs the user to prepare the chamber.
At this stage, the CPY chamber should be held in the air to allow it to flush out prior to placing it on the
soil. During this step, the internal fan of the CPY is sped up to help flush the chamber. The number at the
top right of the screen (23 in this case) is the countdown. CO
When completed, the process will proceed to the CPY – Start Measuring screen (Step 6).
concentration is displayed during this step.
2
CPY – Start Measuring (Step 6)
This screen instructs the user to place the chamber on the soil to commence measuring.
Page 84
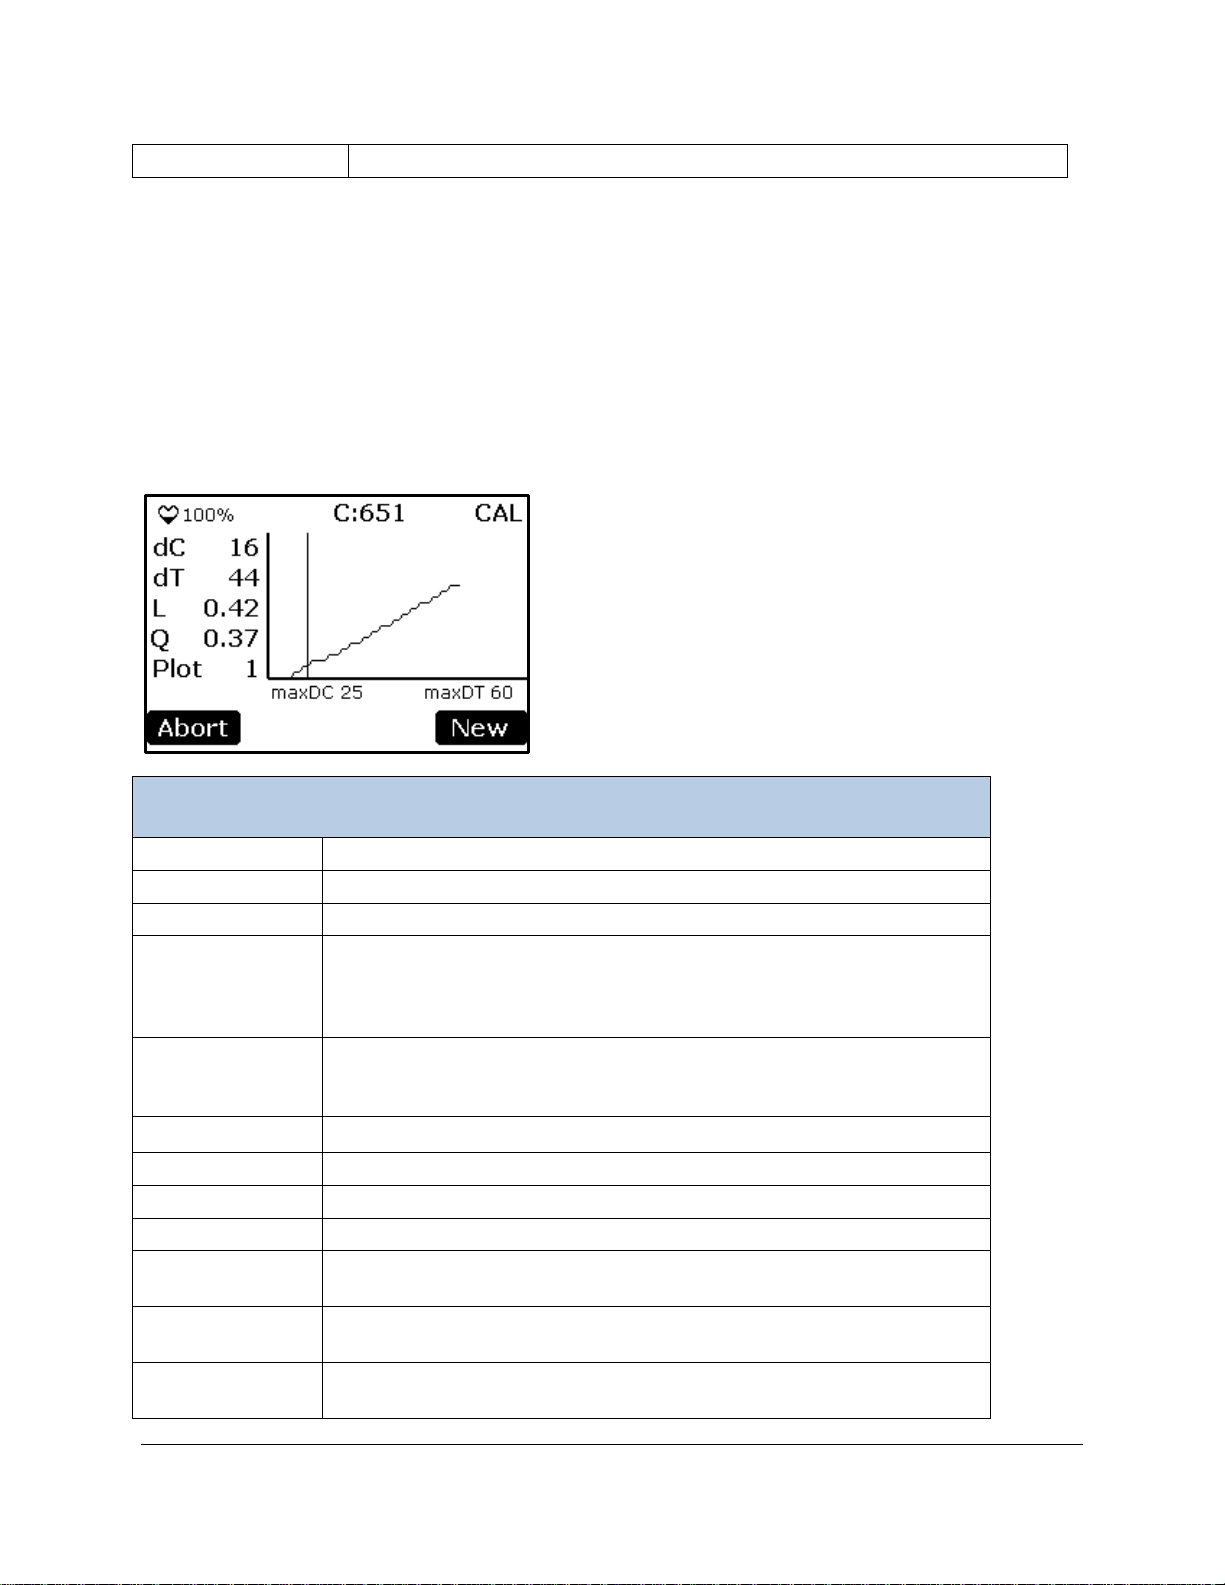
Stop Button
Stops the CPY process and returns to CPY – Other Settings (Step 4).
CPY Data Plot Screen
♥ (Heartbeat)
Pulses to indicate that the system is powered on (power status).
100%
Percentage of battery life remaining.
C: 651
Current measurement of CO2 Concentration (ppm).
Delay/CAL/END
Delay is the countdown in seconds from x to 0, where x is the delay
been terminated.
dC
The current difference in CO2 concentration (ppm) from time = 0
for display purposes the negative values are inverted.
dT
Elapsed time (seconds) for the current session (i.e., change in time).
L
Linear assimilation rate (μmol m
-2 s-1
).
Q
Quadratic assimilation rate (μmol m-2 s-1).
Plot
Plot number defined by user in CPY – Other Settings (Step 4).
X-axis
Time (0 to maxDT seconds). Vertical line represents start of
calculations.
Y-axis
dC (change in CO2 concentration from start of measurement. 0 to
maxDC (ppm)
maxDC
Maximum negative change in CO2 concentration (ppm) allowed in a
given session. This value is defined in CPY – Termination Settings (Step
At this stage, the CPY chamber should be placed on the soil. The internal fan is set to a low speed to
provide an even concentration of CO
countdown. CO
concentration is displayed during this step. When completed, CPY Data Plot Screen
2
. The number at the top right of the screen (7 in this case) is the
2
(Step 7) will be displayed.
CPY Data Plot Screen (Step 7)
This screen displays present values and a graphical representation of the data gathered during the
current session.
value specified in CPY – Termination Settings (Step 3). CAL is the active
concentration calculating phase. END indicates calculations have
CO
2
seconds. Normally in assimilation, CO2 concentration is decreasing, but
Page 85

3).
maxDT
Maximum time for which changes in the chamber CO
concentration are
Settings (Step 3).
Abort Button
Stops the CPY process and returns to CPY – Other Settings (Step 4).
drive. Process data is discarded.
New Button
Stops the CPY process and returns to CPY – Other Settings (Step 4).
Results are saved to the USB flash drive.
2
monitored in a given session. This value is defined in CPY – Termination
Only the individual CO2 measurements are saved to the USB flash
The measurement sequence will terminate when the maxDC or maxDT is reached. If maxDT is reached
first, the message “Time limit” will appear in the status box. If maxDC is reached first, the message “CO2
limit” will appear in the status box.
For more information on the theory and calculation of soil respiration/canopy assimilation, please refer to Mass Flow
Calculate the mass flow of air (W) entering the cuvette per unit leaf area
(A.1) The TARGAS-1 mass flowmeter is calibrated to read the volume flow (V
(STP). The Ideal Gas molar volume is 22.414 L mol
‐
)
W(mol m‐s
=
-1
V
60 × 10
at STP. Therefore:
×
1
22.414
×
) at 0 °C and 1013.25 mb
10
a
where:
2
a = projected leaf area (measured in cm
= volume flow (measured in cc min-1 converted above to L sec-1)
V
converted above to m2)
Note that W and all subsequent equations are presented as quantities per unit leaf area. The projected
leaf area is an input to the TARGAS-1 software to correctly compute gas exchange results. The PLC5
window area is 4.5 cm
2
, and this is the default leaf area used in calculations. However, if measurements
are made with leaves that don't completely fill the window, the actual Leaf Area should be entered in
Measure Screen 2 prior to making measurements. Alternately, if the Leaf Area is not known at the time of
measurements, PP Systems provides a simple TARGAS-1 Excel
®
spreadsheet program that allows
recalculation of all gas exchange results with different Leaf Area.
Transpiration
Calculate transpiration rate (E) from the partial pressures of water vapor of the air entering (e) and
exiting (e
) the cuvette
(A.2) The molar flow of water vapor (mol m
2 s-1
) into the cuvette is:
W ×
(A.3) The molar flow of air out of the cuvette (with the addition of transpired water vapor) is (W + E).
Therefore, the molar flow of water vapor out of the cuvette is:
e
P
Page 86

e
(
W + E
)
×
P
(A.4) However, the difference between the molar flows into and out of the cuvette must equal the
transpiration, so:
E =
(
W + E
)
×
e
‐ W ×
P
e
P
(A.5) Therefore:
)
=
W ×(e
(
P‐e
E(mmol m
e
is defined as the partial pressure of water vapor of reference air supplied to the cuvette, but not yet
‐ s‐
inside the cuvette, and therefore uninfluenced by the cuvette stirring fans or the leaf itself. e
pressure is determined by the H
e
is defined as the partial pressure of water vapor in the air inside the cuvette, surrounding the leaf.
O IRGA during Reference phase.
2
‐e
)
)
× 10
mmol
partial
This air is both highly mixed by the stirring fans and influenced by transpiration water vapor from the leaf.
e
partial pressure is determ ined by the H2O IRGA during Analysis phase. As related to the calculated
values in the TARGAS-1 display:
e
= H2Or
e
= H2Oa
Leaf Temperature
Calculate leaf temperature (T
The Energy Balance technique estimates leaf temperature by equating energy flux into the leaf with
energy flux out of the leaf. The model includes incident solar radiation, leaf re-radiation, convective heat
transfer, and transpiration. (Note: the energy balance estimate for leaf temperature is one option on
TARGAS-1, the other option is to use chamber temperature.)
) from the energy balance
(A.6) From Parkinson, 1983, the energy balance technique gives the difference between air and leaf
temperature as:
H‐× E
t =
.××
+[× (
(
T+ 273)
where:
H = incident radiation absorbed by the leaf
= latent heat of vaporization of water
E = transpiration rate
]
)
Page 87

M
= molecular weight of air
C
= specific heat at constant pressure
r
= boundary layer resistance to water vapor transfer, empirically determined for each cuvette by
the pseudo-leaf (filter paper) method. 0.93 converts it to that for heat transfer.
= Stefan Boltzmann constant
T
= cuvette air temperature
H is calculated from the photon flux incident on the cuvette (Q), taking into account the ratio of infra-red to
visible radiation and typical reflection/absorption factors by the leaf:
H = Q × Trans
Where Trans = 0.14 the ratio of infrared to visible radiation, and converting photon flux to energy units
To simply computation, the following approximation is made:
T
)
4.639 +(0.5834 × T
+ t
)
=(T
)
((
×
(A.7) Then, the leaf temperature is:
T+ 273)
Saturation Vapor Pressure
Derive saturation vapor pressure at leaf temperature (e
(A.8) From Buck, 1981 (using e
Where e
= saturated water vapor pressure inside leaf at T
and fw1) we calculate:
w1
e
= 6.1365 × exp
T
T
) from T
×(17.502
+ 240.97
)
Stomatal Conductance
Calculate stomatal conductance (gs)
(A.9) From von Caemmerer & Farquhar, 1981 (Eq B14), total leaf conductance to H
calculated as:
)/2
)
(A.10) Since 1/g
total
= rs+ r
g
E × (P‐(e
=
,
b
(
e
‐e
+ e
)
O transfer is
2
(A.11) stomatal resistance can be calculated as:
Page 88

+ e
)
(
e
(
r
m
(A.12) Stomatal conductance is the inverse of stomatal resistance:
s mol
‐
)
=
(
E × (P‐(e
‐e
)/2)
)
‐r
(
g
mmol m
‐ s‐
1
)
=
r
× 10
mmol
mol
Net Photosynthesis
Determine the rate of net photosynthesis (A) from the difference between CO2 concentrations entering
(C
) and exiting (C
in
(A.13) IRGA CO
addition of transpirational water vapor dilutes the air leaving the cuvette (
for in the calculation:
(A.14) To calculate net CO
TARGAS-1 calculates and displays the CO
the TARGAS-1 display:
) the cuvette
out
readings are corrected for water vapor, temperature, and atmospheric pressure. The
2
C
), and this is compensated
]
A =(C× W)‐[C
assimilation we rearrange equation (A.13) to:
2
C
C
‐C
)
A = ‐
(
C
‐C
difference (C
2
×(W + E
× W+(C
‐C
= CO2a
= CO2d
)
)
× E
). As related to the calculated values in
Intercellular CO2 Concentration
Calculate CO2 concentration in the sub-stomatal cavity (C) using the equation derived by von
Caemmerer & Farquhar, 1981
(A.15) The sub-stomatal CO2 concentration,
(
C
mol mol
(A.16) Where g
(1.585 is the diffusion ratio of CO2 and water in air, and 1.37 is the diffusion ratio of CO2 and water in the
boundary layer).
Note: These calculations are based on the following assumptions:
is the total conductance to CO2 transfer:
g
(
mmol m
‐ s‐
C
‐
)
=
(
, is given by:
‐
g
)
1.585 × r
=
× C
g
1
)+(
+
1.37 × r
‐A
× 10
)
Page 89

• the leaf is exposed on both upper and lower leaf surfaces
Symbol
Parameter
Unit
V
Flow rate of dry air into cuvette at STP
cc min
-1
a
Projected leaf area
cm2
r
Boundary layer resistance to water vapor
m2 s mol-1
P
Atmospheric pressure
mb Q Photon flux density incident on cuvette
µmol m-2 s-1
T
Cuvette air temperature
°C
Symbol
Parameter
Unit
W
Mass flow of air per unit leaf area into cuvette
mol m-2 s-1
e
Partial pressure of water vapor of air entering cuvette = H2Or
mb *
e
Partial pressure of water vapor of stirred cuvette air = H2Oa
mb *
E
Transpiration rate
mmol m-2 s-1
e
Saturated vapor pressure (inside the leaf) at leaf temperature
mb
T
Leaf temperature
°C
t
Temperature differenc e between the air and the leaf
°C
H
Radiation absorbed by the leaf
W m-2
r
Stomatal resistance to water vapor
m2 s mol-1
g
Stomatal conductance to water vapor
mmol m-2 s-1
C
CO2 concentration of air entering cuvette = CO2r
µmol mol
-1
*
C
CO2 concentration of air inside and exiting the cuvette = CO2a
µmol mol-1 *
A
CO2 Assimilation rate (net photosynthesis)
µmol m-2 s-1
g
Total conductance to CO2 transfer
mmol m-2 s-1
g
Total conductance to H2O transfer
mmol m-2 s-1
C
CO2 concentration of sub-stomatal cavity
µmol mol-1
• the upper and lower boundary layer resistances are similar
• stomata are evenly distributed on both upper and lower leaf surfaces.
Definition of Symbols and Physical Constants Used in Equations
Measured Parameters
Calculated Parameters
Page 90
* Detected by IRGAs, temperature and pressure corrected, effects of foreign gas broadening (water vapor
Symbol
Parameter
Value
Latent heat of vaporization of water
45064.3 - (Tc x 42.9) J mol
-1
M
Molecular mass of air
28.97
C
Specific heat at constant pressure
1.012 kJ kg-1 K-1
Stefan Boltzmann constant
5.6704 x 10⁻⁸ W m-2 K-4
effects) on measurement corrected.
Physical Constants
References
Parkinson, K.J. 1983. Porometry in S.E.B. Symposium of Instrumentation for Environmental Physiology.
Cambridge University Press.
Buck, A.L. 1981. New equations for computing vapour pressure and enhancement factor. J. Appl.
Meteorol., Vol. 20:1527-1532.
von Caemmerer, S. and G.D. Farquhar 1981. Some relationships between the biochemistry of
photosynthesis and the gas exchange of leaves. Planta, Vol. 153:376-387.
Page 91

Appendix 2. Soil CO2 Efflux and Net Canopy CO2 Flux on page 150.
Custom Process
This process is available for users that want to use their own custom chambers with the TARGAS-1.
Since it is assumed that you are using your own chambers, there are no “defaults” built into the system. It
is your responsibility to make sure that you enter the appropriate values where required in order to ensure
proper calculations.
Custom – Start Process (Step 1)
The first screen asks the user to confirm that they would like to start the Custom process.
Page 92
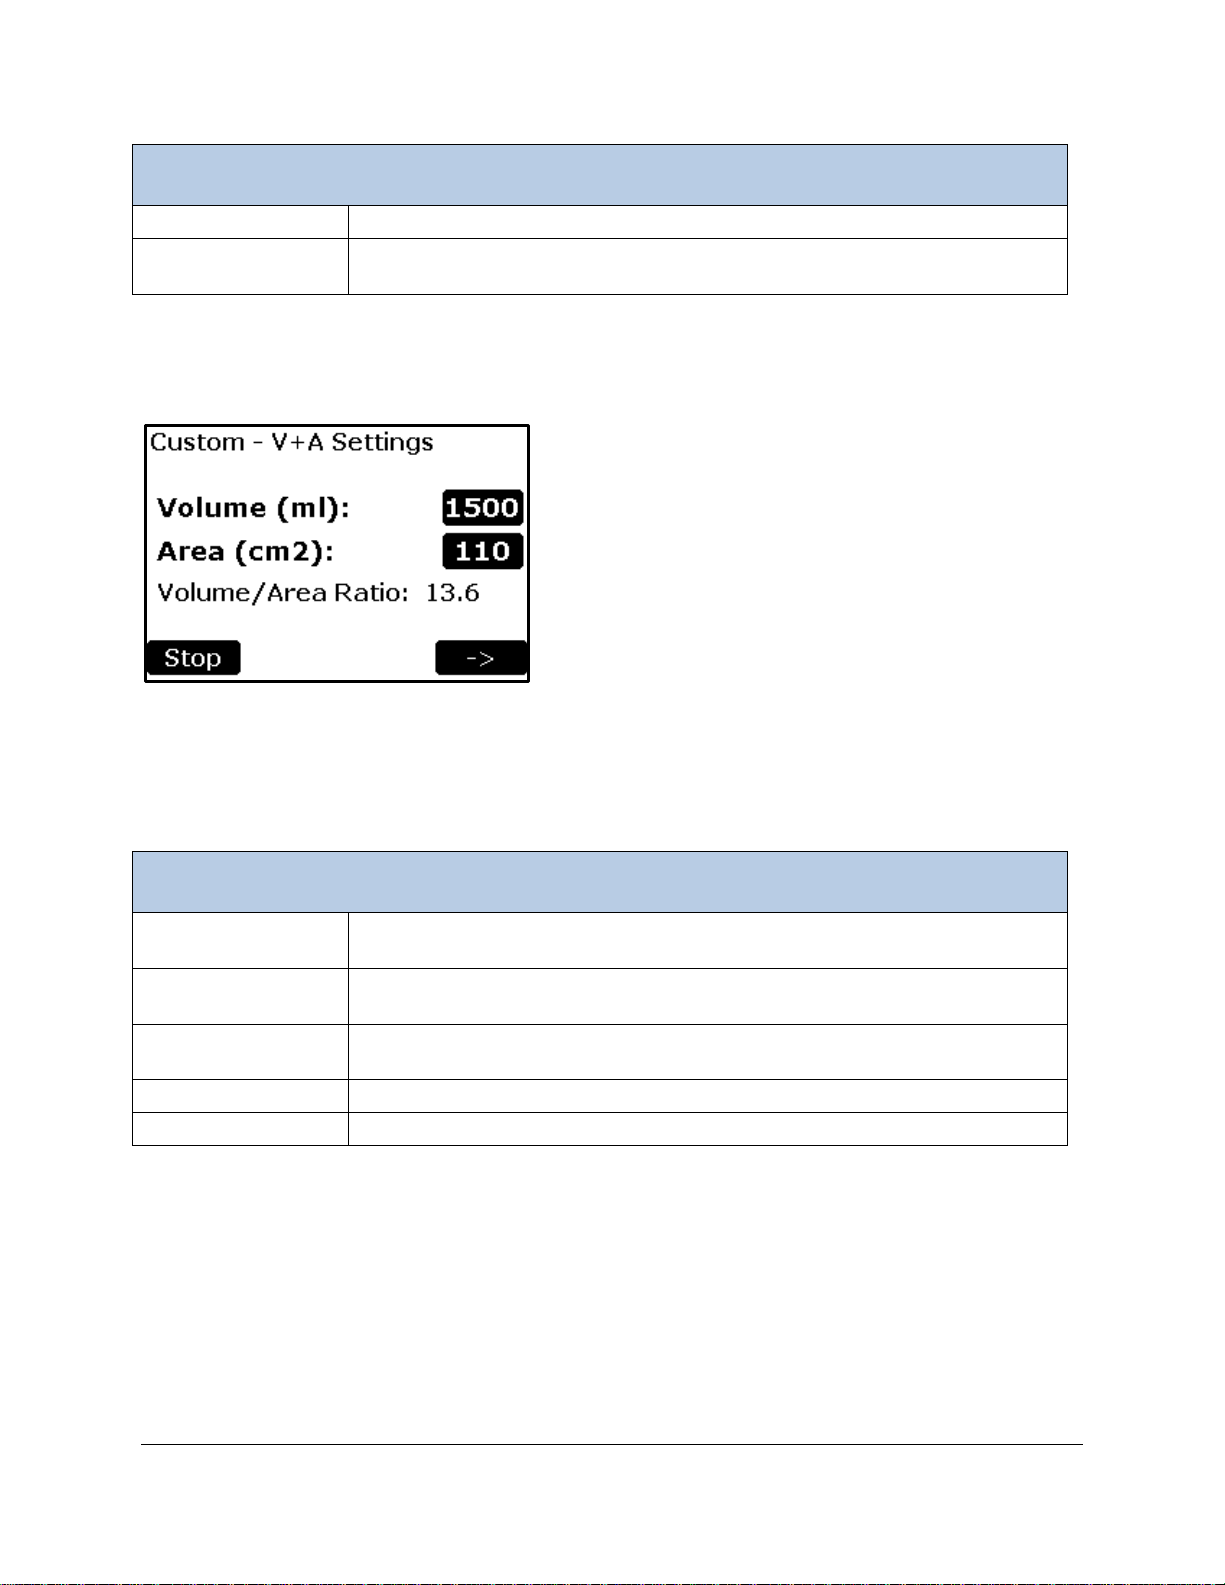
Custom – Start Process Menu
Back Button
Returns to the Processes Menu.
Right Arrow Button
Confirms and starts the Custom process by displaying the Custom – Volume
and Area Settings menu (Step 2).
Custom Step 2 Menu
Volume Button
Sets the volume of the system. Entries between 10 and 100,000 ml are
permitted.
Area Button
Sets the surface area of the chamber in cm2. Entries between 1 and 10,000
cm2 are permitted.
Volume/Area Ratio
This value is automatically updated when there is a change to either the
Volume or Area values.
Stop Button
Stops the Custom process and returns to the Processes Menu.
Right Arrow Button
Continues to the Custom – Termination Settings menu (Step 3).
Custom – Volume and Area Settings (Step 2)
The volume and area settings are defined in this screen.
Important Note. You must remember to account for any volume changes in order for the instrument to
properly calculate assimilation rates. If using collars, please make sure that you adjust the volume
accordingly.
Custom – Termination Settings (Step 3)
The Termination settings (DT, DC) and Delay are defined in this screen.
Page 93
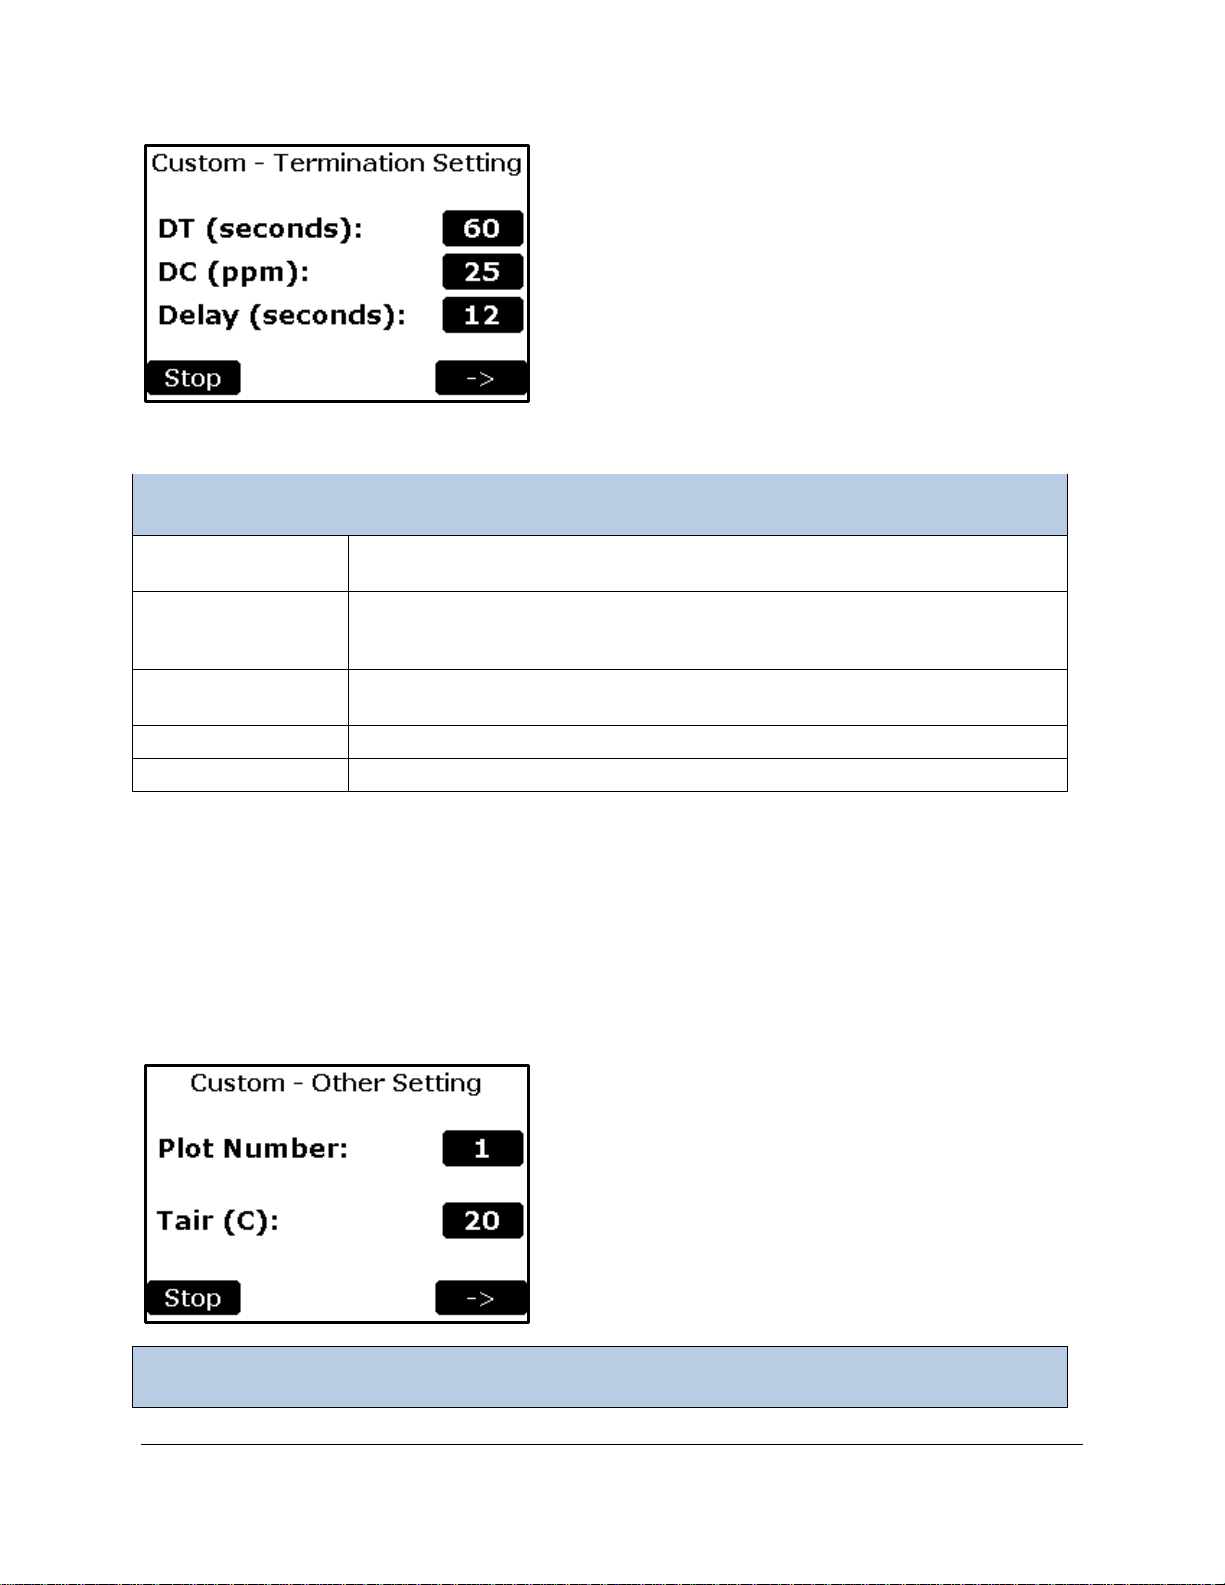
Custom – Termination Settings Menu
DT Button
Maximum time for which changes in the chamber CO
concentration are
monitored in a given session. Valid entries range between 10 - 300 seconds.
DC Button
Maximum change in CO2 concentration (ppm) allowed in a given session. If
1 - 1,000 ppm.
Delay Button
The amount of time the instrument waits at the start of each session before it
starts calculating respiration. Valid entries are between 5 – 150 seconds.
Stop Button
Stops the Custom process and returns to the Processes Menu.
Right Arrow Button
Continues to the Custom – Other Settings menu (Step 4).
Custom – Other Settings Me n u
2
total change exceeds this value the session will end. Valid entries are between
Custom – Other Settings (Step 4)
The plot number is defined and the Air Temperature is entered in this screen.
Page 94
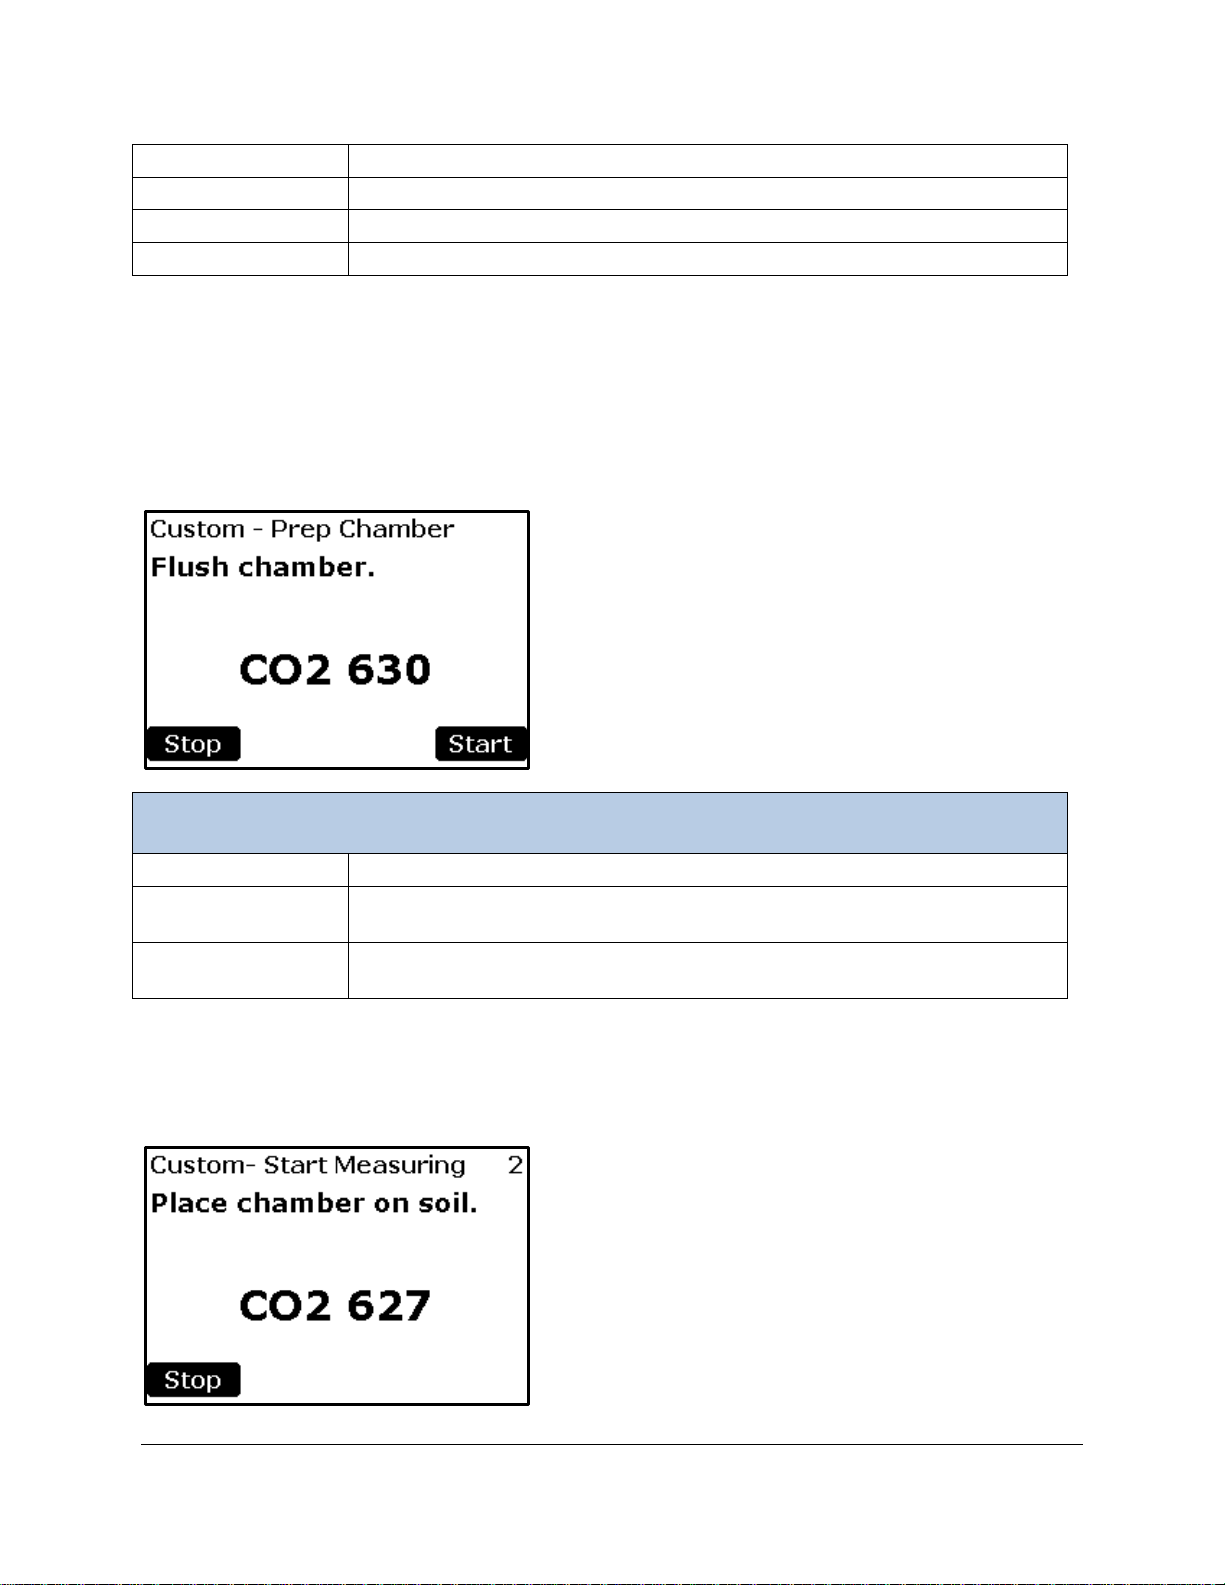
Plot Number Button
Change/View plot number. Range: 0–1000.
Tair Button
Air temperature inside chamber (oC).
Stop Button
Stops the Custom process and returns to the Processes Menu.
Right Arrow Button
Continues to the Custom – Prepare Chamber screen (Step 5).
Custom – Prepare Chamber Menu
CO2 (ppm)
CO2 concentration.
Stop Button
Stops the Custom process and returns to the Custom – Other Settings menu
(Step 4).
Start Button
Continues to the Custom – Start Measuring screen (Step 6). Note: It is up to
the user to determine the amount of time required to flush a custom chamber.
Custom – Prepare Chamber (Step 5)
At this stage, the Custom probe should be held in the air to allow it to flush out prior to placing it on the
soil. CO
countdown for flushing the chamber; it is up to the user to determine the amount of time required to flush
a custom chamber. Once the chamber has been adequately flushed, pressing the Start button will allow
the process to continue to the Custom – Start Measuring screen (Step 6)
concentration is displayed during this step. Unlike the SRC and CPY Processes, there is no
2
Custom – Start Measuring (Step 6)
At this stage, the Custom probe should be placed on the soil. The number at the top right of the screen (2
concentration is displayed during this step. When
in this case) is the count down from 5-0 seconds. CO
completed, the Custom Data Plot screen (Step 7) will be displayed.
2
Page 95
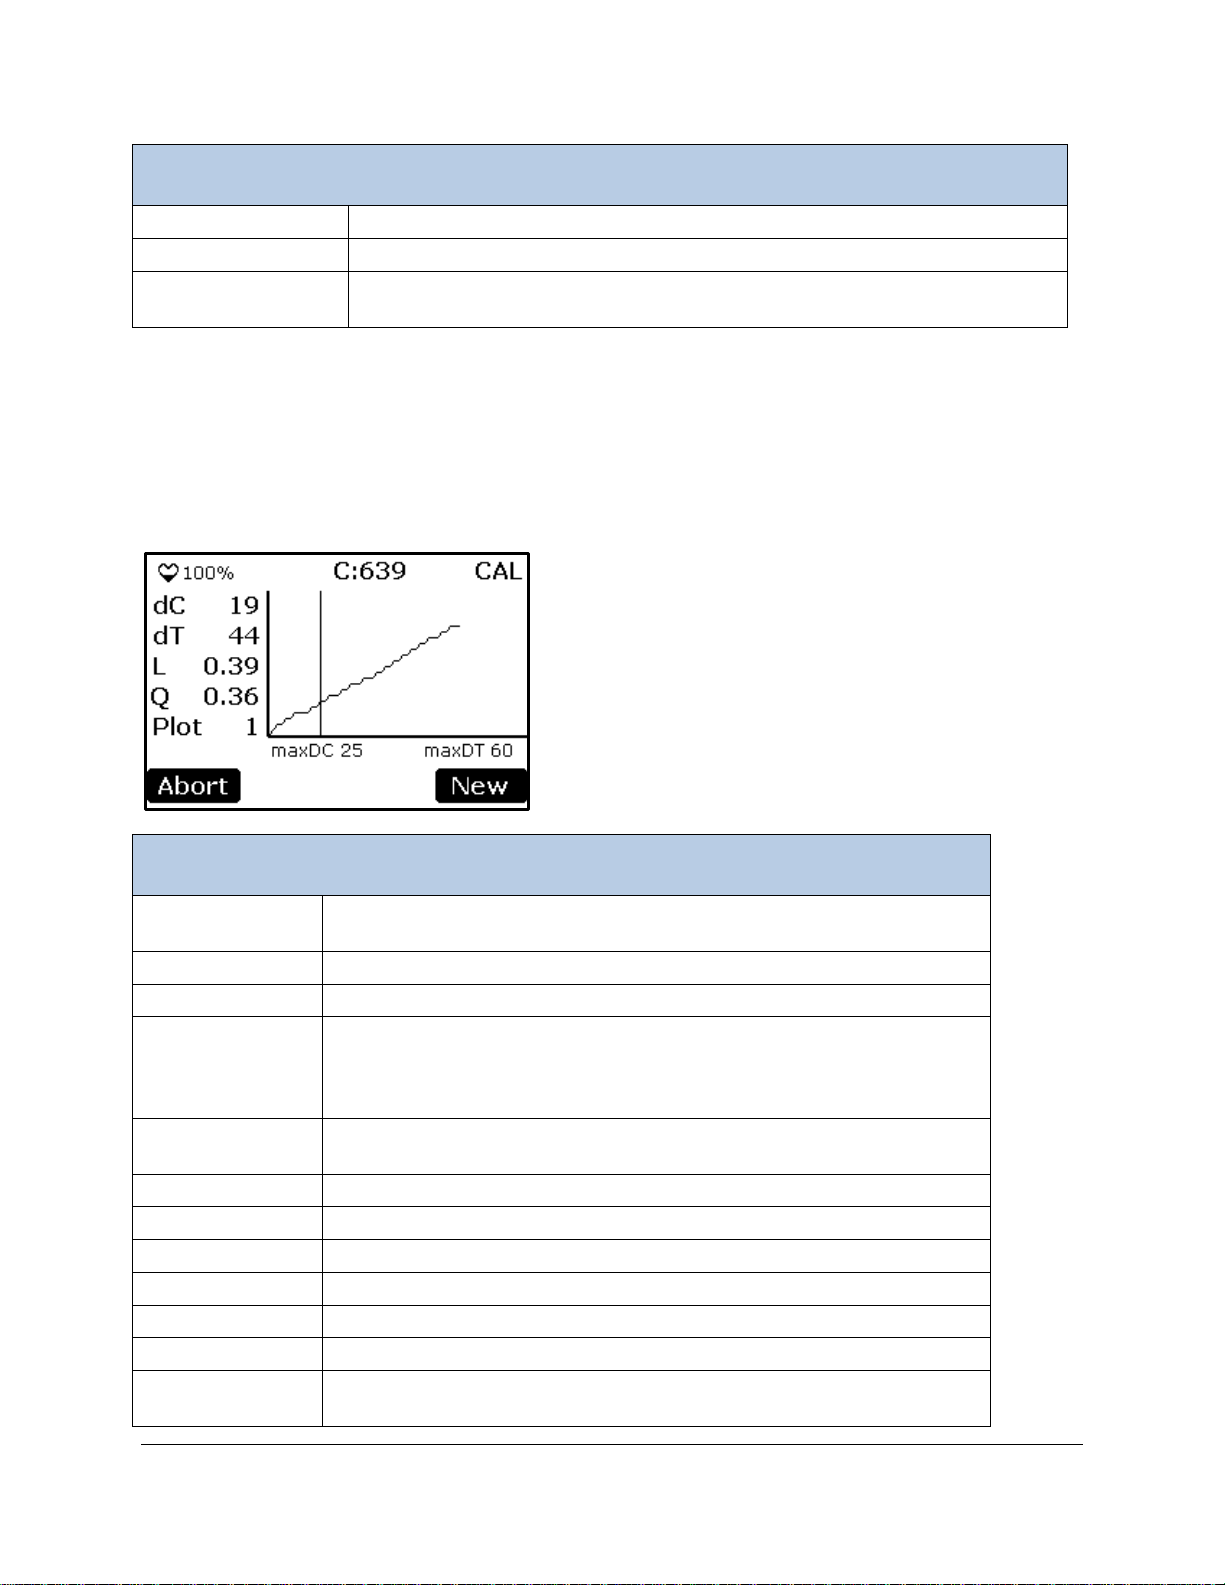
Custom – Start Measuring Menu
CO2 (ppm)
CO2 concentration.
2
Countdown in seconds, from 5 to 0.
Stop Button
Stops the Custom process and returns to the Custom – Other Settings menu
(Step 4).
Custom Data Plot Menu
♥ (Heartbeat)
Pulses on and off to indicate that the system is powered on (power
status).
100%
Percentage of battery life remaining (%).
C: 639
Current measurement of CO2 Concentration (ppm).
Delay/CAL/END
Delay is the countdown in seconds from x to 0, where x is the Delay
have been terminated.
dC
The current difference in CO2 concentration (ppm) from time = 0
seconds.
dT
Elapsed time (seconds) for the current session (i.e., change in time).
L
Linear respiration rate (g m-2 hour-1).
Q
Quadratic respiration rate (g m-2 hour-1).
Plot
Plot number defined by user in Custom – Other Settings (Step 4).
X-axis
Time (1 second interval)
Y-axis
dC (change in CO2 concentration)(ppm)
maxDC
Maximum negative change in CO2 concentration (ppm) allowed in a
given session. This value is defined in Custom – Termination Settings
Custom Data Plot Screen (Step 7)
This screen displays present values and a graphical representation of the data gathered during the
current session.
value specified in Custom – Termination Settings (Step 3). CAL is the
active CO
concentration calculating phase. END indicates calculations
2
Page 96

(Step 3).
maxDT
Maximum time for which changes in the chamber CO
concentration are
Termination Settings (Step 3) .
Abort Button
Stops the Custom process and returns to Custom – Other Settings (Step
drive. Process data is discarded.
New Button
Stops the Custom process and returns to Custom – Other Settings (Step
4). Results are saved to the USB flash drive.
2
monitored in a given session. This value is defined in Custom –
4). Only the individual CO2 measurements are saved to the USB flash
Injection Process
The injection process is a technique used to measure the concentrations of small samples of gas, usually
collected in sampling jars and transferred to the TARGAS-1 with a syringe. The injection process is an
improvement over static sampling and yields more reliable and consistent results.
Measurement Principle
The concentration of CO2 in a gas sample is calculated by injecting the sample into a fixed flow of gas
with a known CO
until they return to baseline. This is similar to the Pulse Tracer Gas Technique used for HVAC duct flow to
infer the unknown flow rate by measuring the concentration of a known mass of tracer gas injected into
the duct over time. In our case, the gas flow rate F is known, the syringe volume V is known, but the
sample (or tracer gas) concentration is unknown.
The concentration in the syringe is calculated as:
concentration (the baseline CO2 level) and integrating the resulting CO2 measurements
2
= ()
=
_
_
60
Page 97
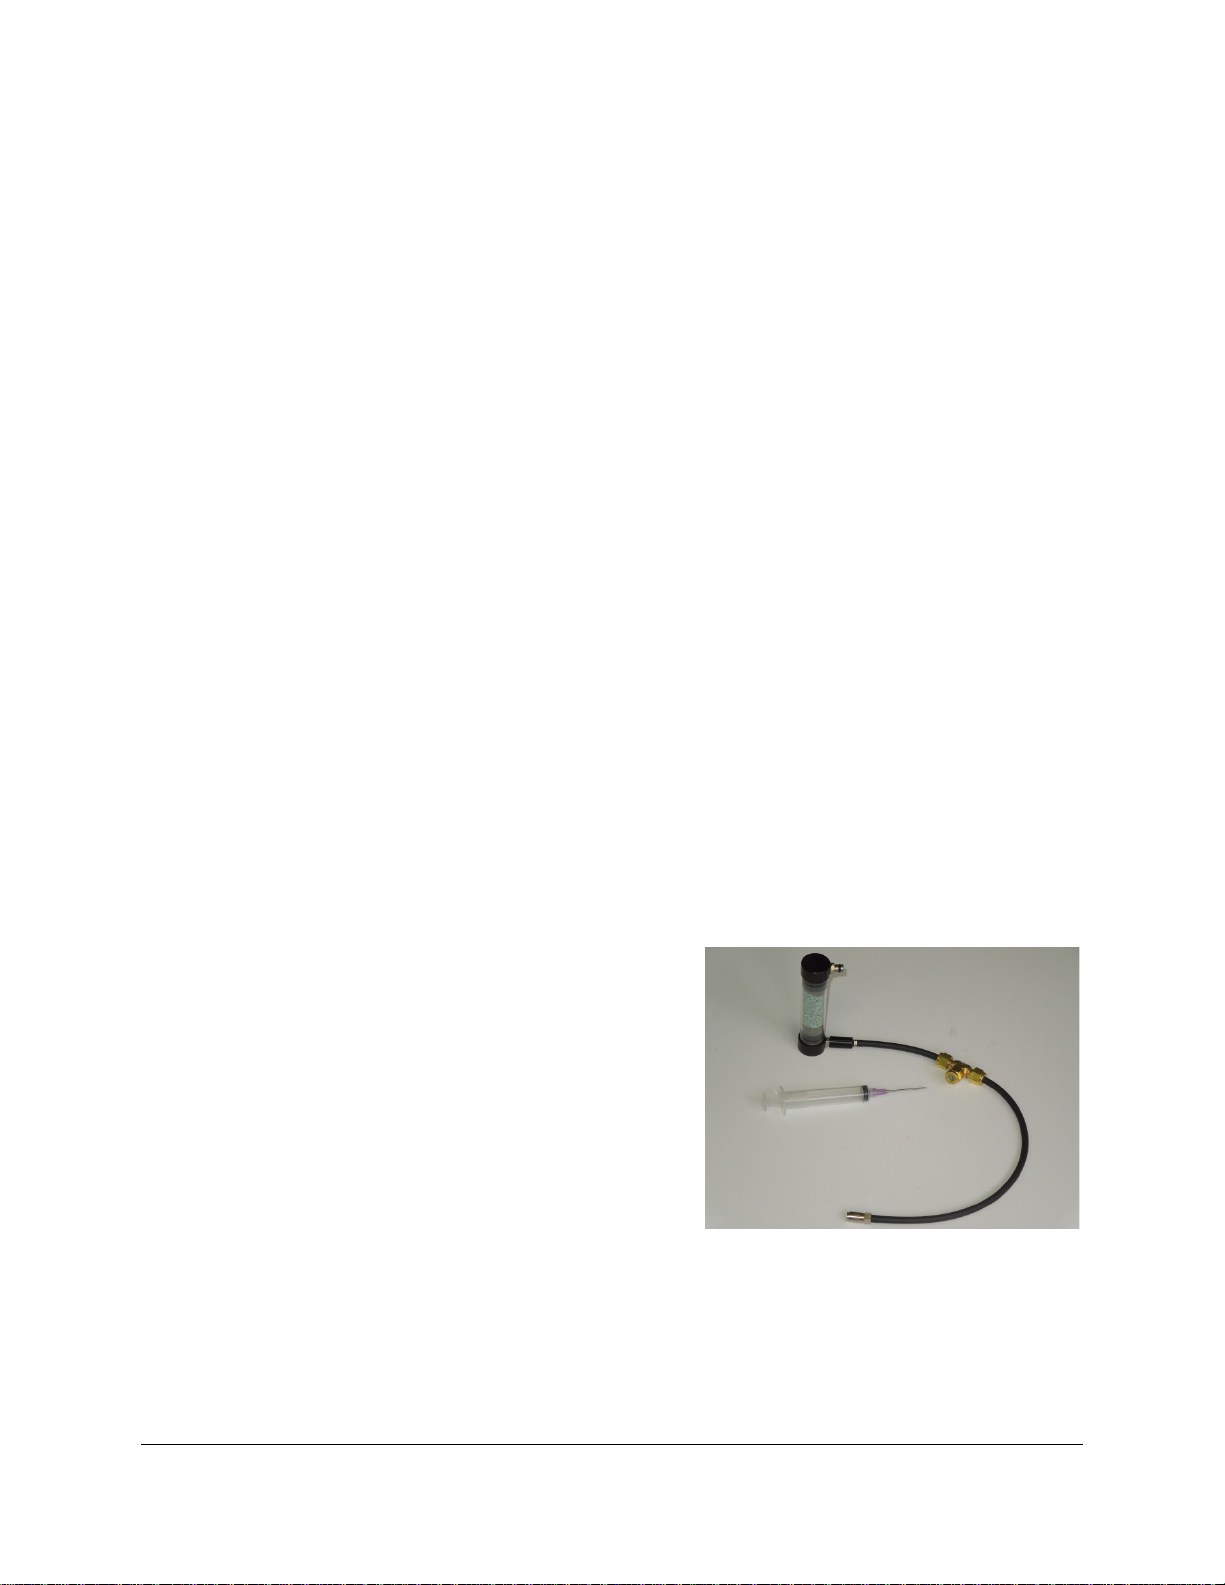
Where
CO
CO
(ppm) = calculated CO2 concentration inside syringe (“integrated” CO2)
2 INT
(ppm) = baseline CO2 readings before the measurement phase (averaged over 10
2_ b
readings)
CO
(ppm) = CO2 readings during the measurement phase
2_m
Δt (s) = sample interval, typically 1 second
F (ml min
-1
) = flow rate
V (ml) = syringe volume
The process consists of two phases: Basel ine Ph ase and Meas ur ement Phase. The Baseline Phase
establishes a baseline measurement of CO
concentration by passing CO2-free gas through the
2
TARGAS-1 and calculating the average concentration over 10 measurements at a 1-second interval.
Upon completion of the Baseline Phase, the instrument will enter the Measurement Phase. In this phase
the sample is slowly injected, and the measured CO
the Measurement Phase. Any gas with a known, constant CO
but a gas with zero CO
concentration can be readily produced with an absorber column filled with soda
2
concentrations are integrated over the duration of
2
concentration can be used as a baseline,
2
lime.
Sample Injection Kit (Part No. ACS037)
PP Systems offers a Sample Injection Kit (Part No. ACS037),
which includes a fully assembled and leak-tested injection
port with 4 spare septa, as well as an absorber column to
establish a zero baseline.
The syringe is user supplied (not included with the kit) and
the soda lime is not included with this part but it is included
with the TARGAS-1 as standard.
The injection port includes a 9mm low-bleed septum that can withstand up to 50 injections (per the
manufacturer’s specification). For best results, we recommend changing the septum every 25 injections.
The septum has a guide hole and accommodates syringes up to 22 gauge. We recommend 18 gauge for
best results. The syringe is not included in the kit and must be provided by the user. The injection
Page 98
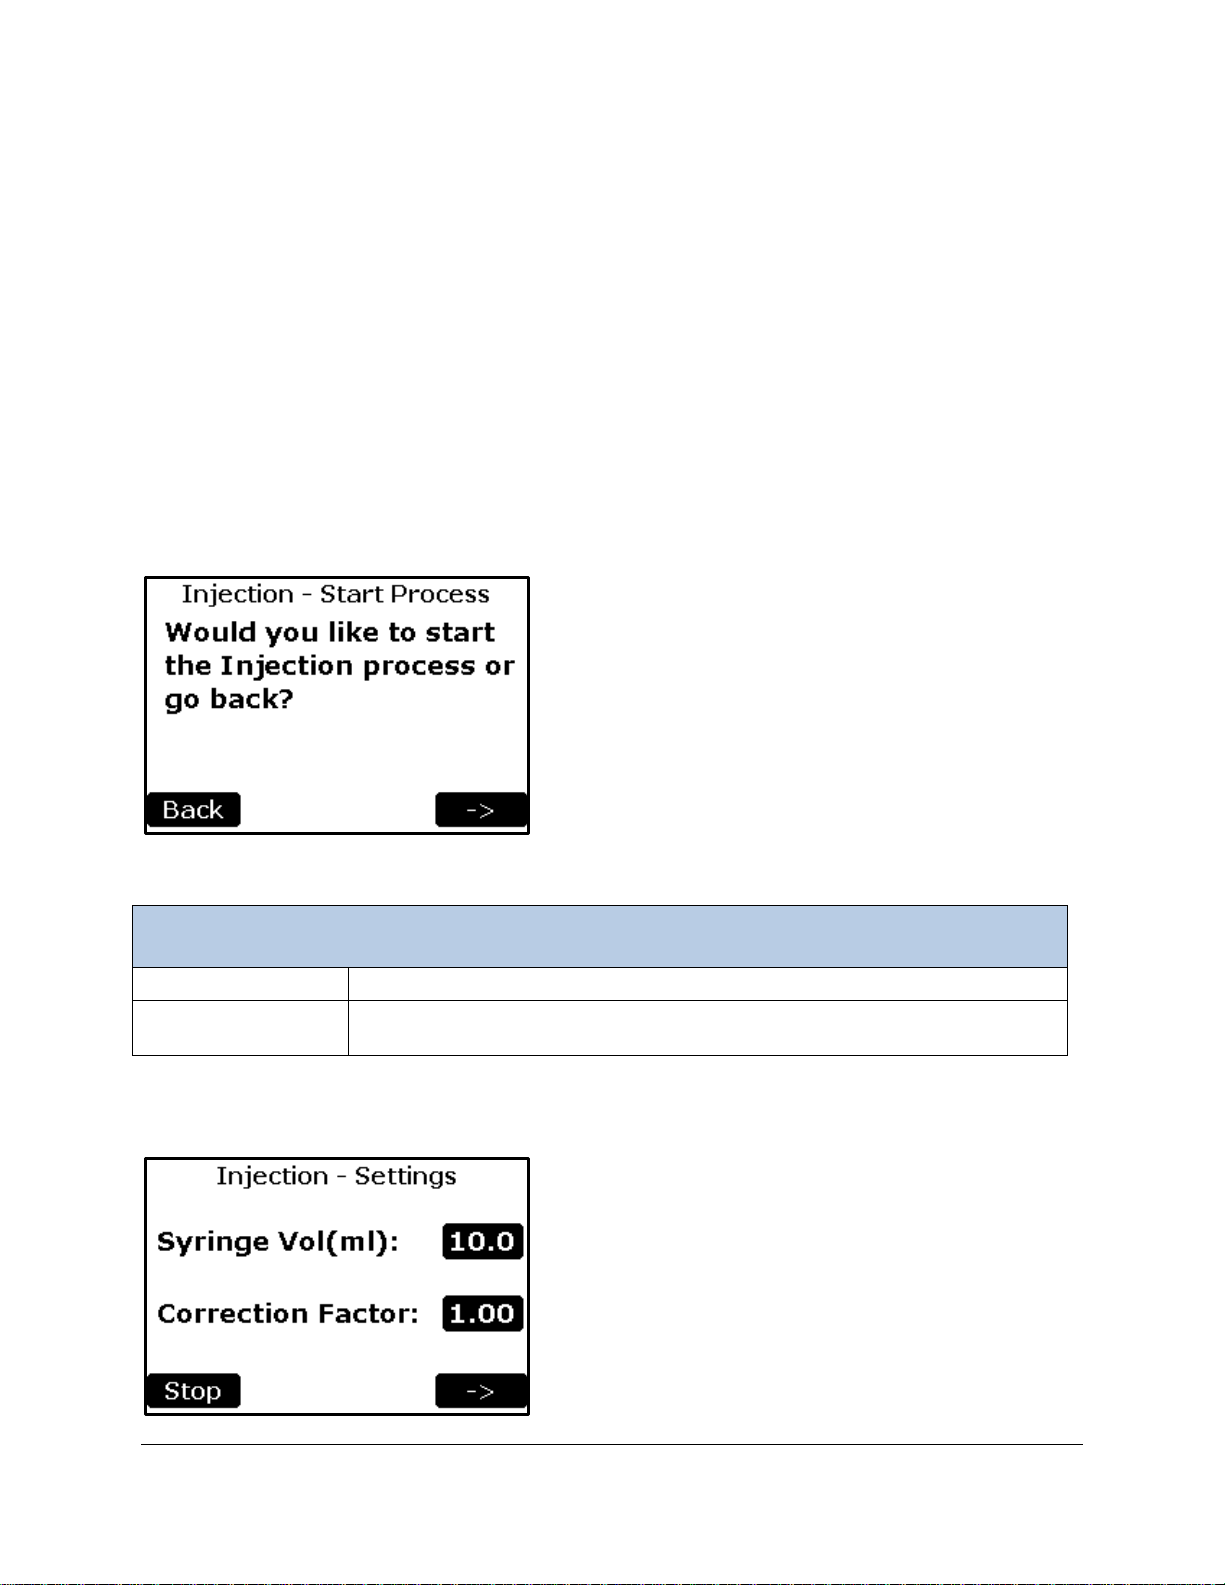
technique is relatively insensitive to the volume of the syringe, but it should be at least a size where you
Injection – Start Process Menu
Back Button
Returns to the Processes Menu.
Right Arrow Button
Confirms and starts the Injection process by displaying the Injection – Settings
screen (Step 2).
could comfortably inject gas for at least 3 seconds continuously. For this reason alone, syringes with a
volume of at least 10 ml (e.g. 10- and 25-ml syringes) are recommended. The injection rate should not
exceed 3 ml/s, due to the risk of over-pressurizing the IRGA and causing damage to the instrument. We
recommend glass syringes if available (e.g. typical GC syringes), but plastic (polypropylene) syringes will
work as well.
The injection process works best for samples with concentrations greater than 100 ppm. The process will
work at lower concentrations, but percent error will be significantly larger.
Injection – Start Process (Step 1)
The first screen asks the user to confirm that they would like to start the Injection p roc es s.
To begin a sample injection measurement, first fill the absorber column of the Sample Injection Kit with
fresh soda lime and ensure it is oriented vertically throughout the process. Connect the open end of the
kit to the GAS IN port on the back of the TARGAS-1.
Injection – Settings (Step 2)
The syringe volume and correction factor settings are defined in this screen.
Page 99
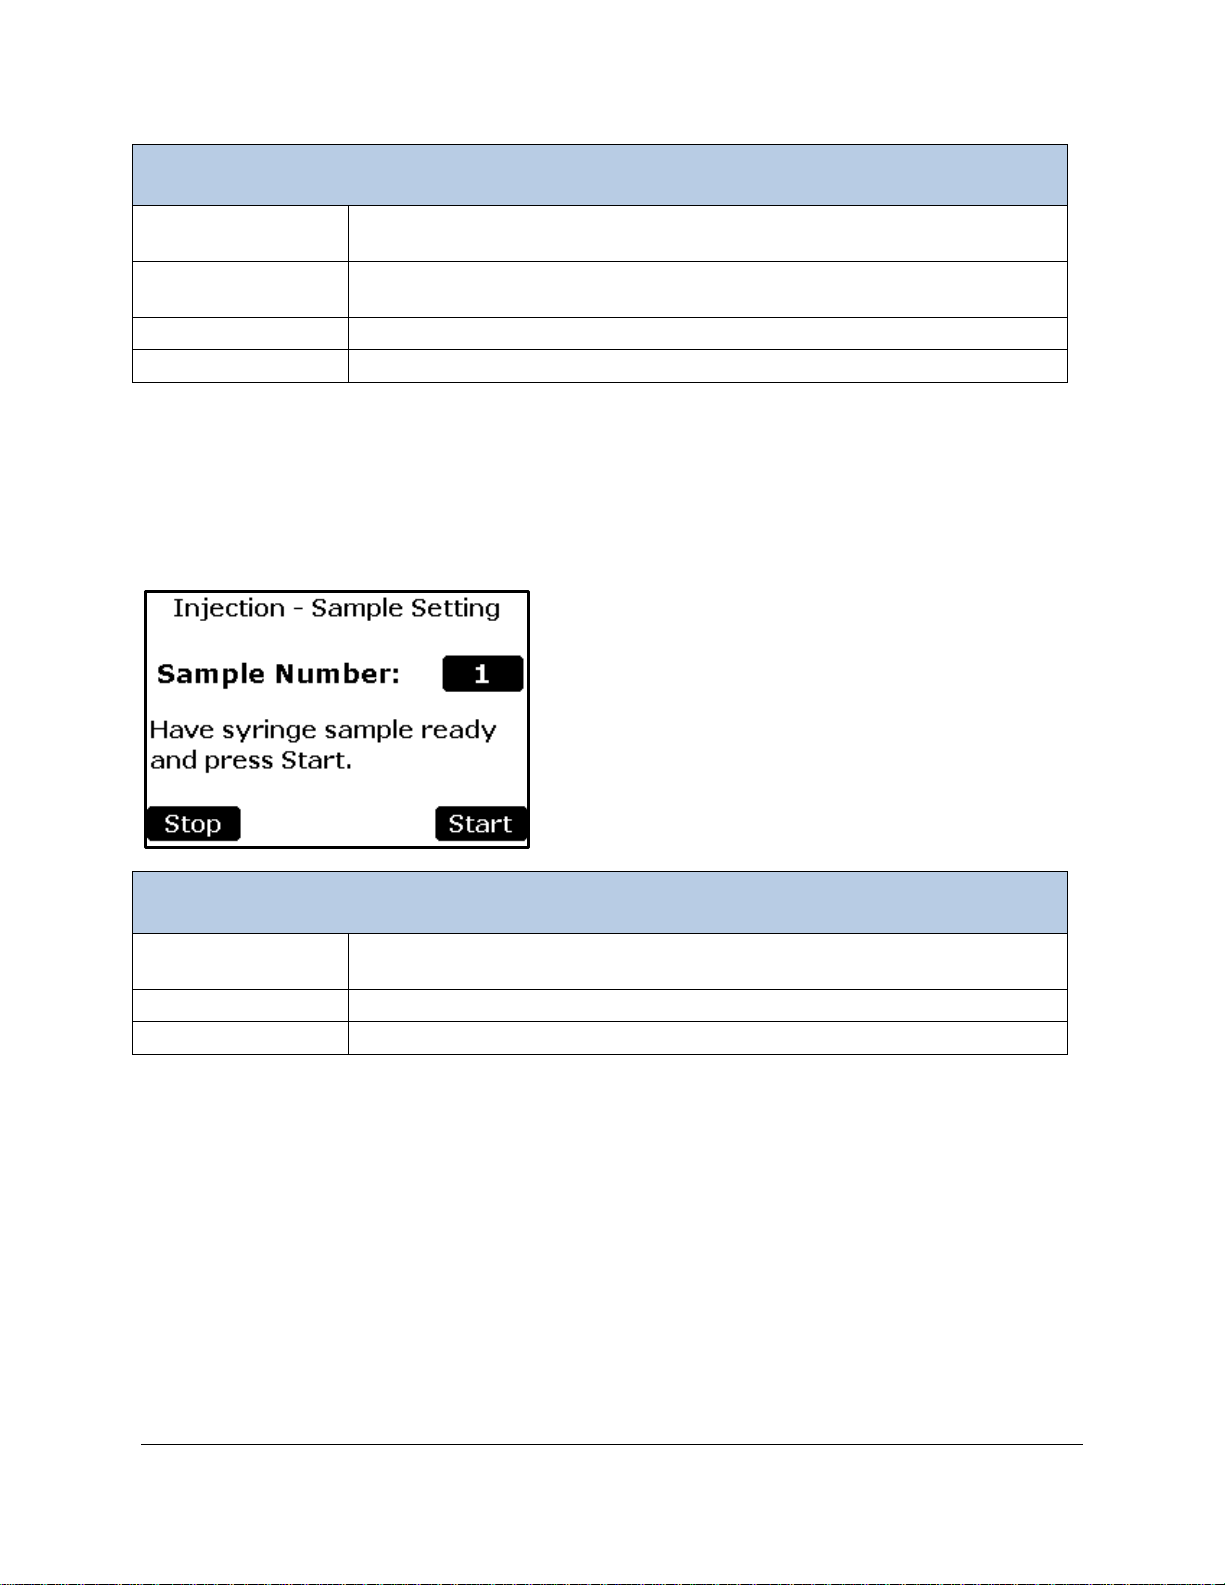
Injection – Settings Menu
Syringe Volume
Button
Volume of injection syringe. Valid entry range is between 1.0 – 1,000.0 ml.
Correction Factor
Button
This user defined factor can be used to scale calculated gas concentrations to
make them match a known reference gas standard. Range: 0.50 – 2.00.
Stop Button
Stops the Custom process and returns to the Processes Menu.
Right Arrow Button
Continues the Injection process to Injection – Sample Setting screen (Step 3).
Injection – Sample Setting (Step 3)
Injection – Sample Setting Menu
Sample Number
Button
Sample number of measurement.
Stop Button
Stops the Custom process and returns to the Processes Menu.
Start Button
Starts the Injection Process and displays the Injection Zero screen (Step 4).
The sample number is defined in this screen. Once the Start button is pressed, the Injection process will
begin. Before you press Start, take your syringe sample (e.g., from a chamber or airbag) if you have not
done so already. We recommend that you draw more gas from your sample source than required, and
then squeeze out excess. For example, for a 10 ml sample you should draw at least 11 ml into your
syringe, and then slowly push the plunger to the 10 ml mark.
Injection - Zero (Step 4)
This allow the opportunity to do a zero prior to measuring sample
Page 100
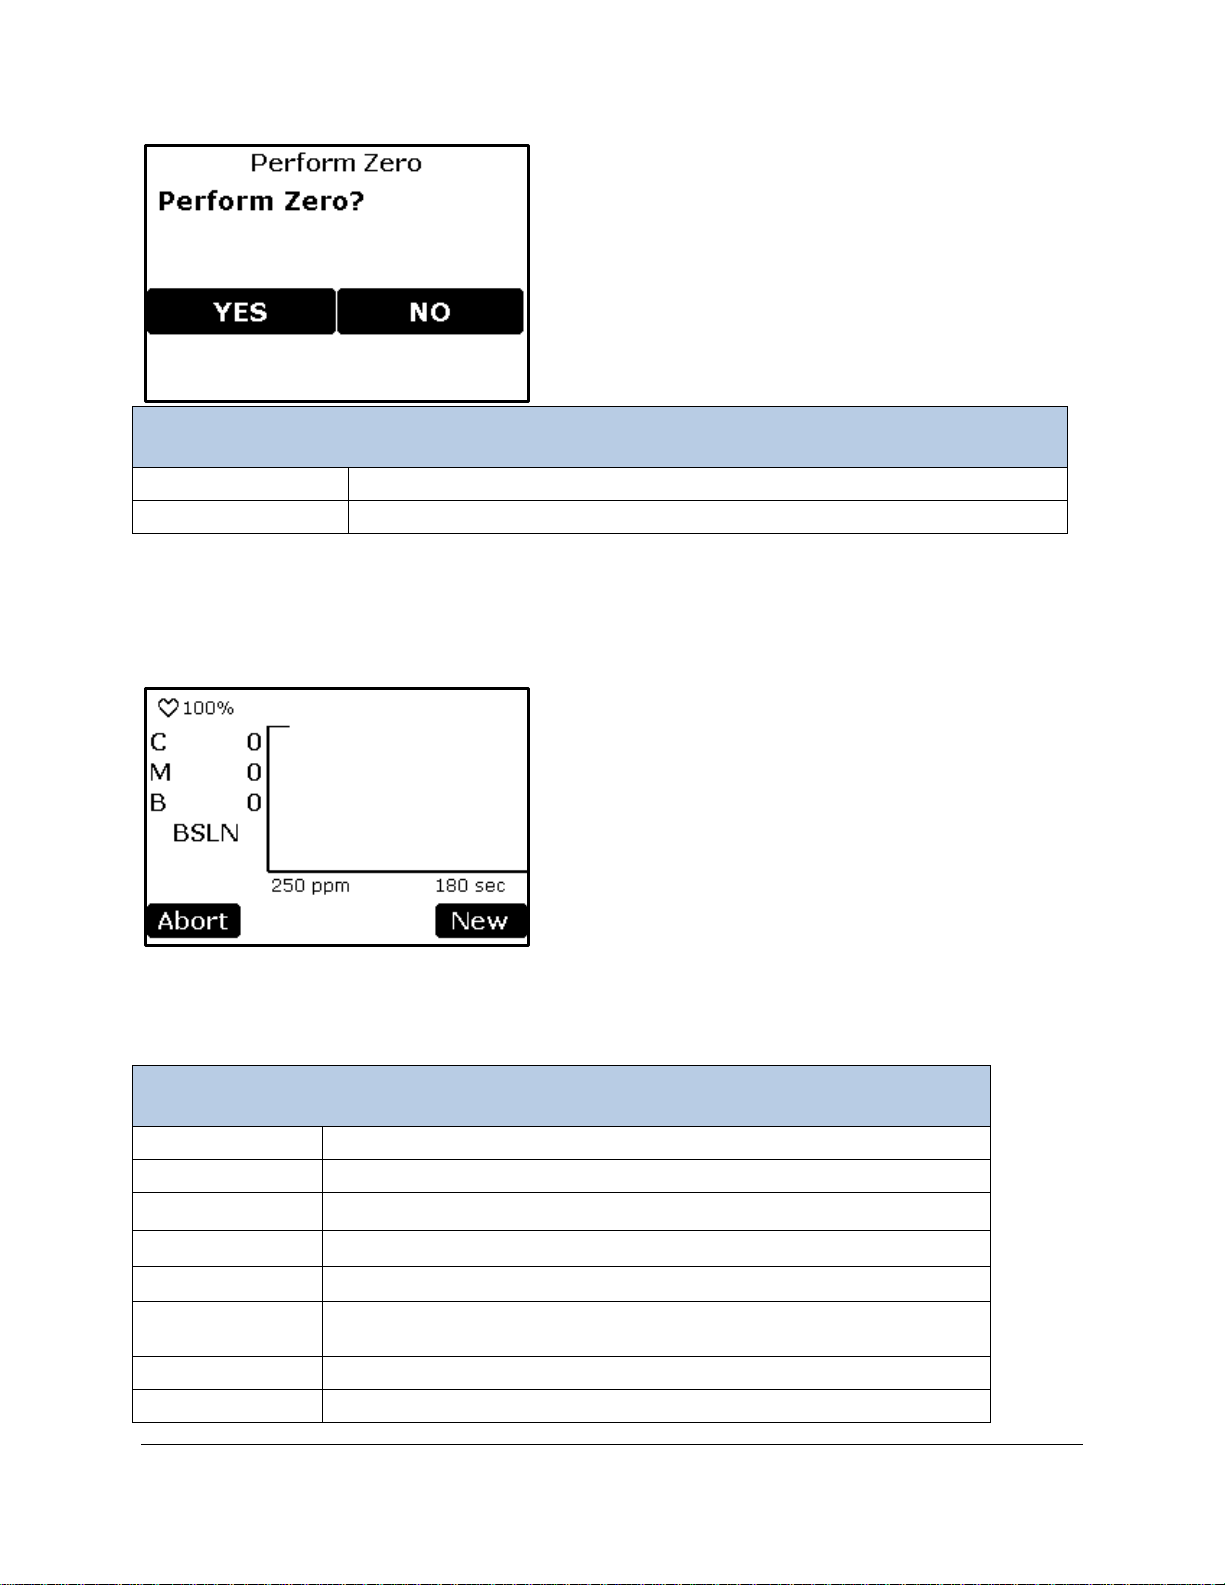
Perform Zero
Yes Button
Does a Zero then proceeds to Measuring screen (Step 5).
No Button
Proceeds to Measuring screen (Step 5).
Injection Baseline Phase Menu
♥ (Heartbeat)
Pulses to indicate that the system is powered on (power status).
100%
Percentage of battery life remaining (%).
C
Current CO
concentration in tubing (ppm).
M
Calculated CO2 concentration inside syringe (ppm).
B
Average baseline of CO
concentration (ppm).
BSLN
Indicates that the process is in the Baseline phase for the first 10
readings.
X-axis
Time (seconds). It is fixed at 180 seconds.
Y-axis
CO
2
concentration in tubing (ppm).
Injection – Baseline Phase (Step 5)
This is the Baseline Phase. For the first 10 seconds, the TARGAS-1 will record the baseline reading,
which is the CO
the Injection Phase begins.
concentration of the air before the sample is injected (typically 0 ppm). After 10 seconds
2
2
2
 Loading...