

Page 1

CIRAS-3
Portable Phot osynthesis System
Operation Manual
Version 1.09
2017 PP Systems. All Rights Reserved
th
August 2017
7
PP Systems
110 Haverhill Road, Suite 301
Amesbury, MA 01913 U.S.A.
Tel: +1 978-834-0505 Fax: +1 978-834-0545
Email: [email protected] URL: www.ppsystems.com
Page 2

Contents
Welcome ..................................................................................................................................................... 10
User Registration ........................................................................................................................................ 11
Service & Warranty ..................................................................................................................................... 12
Returning equipment to PP Systems ...................................................................................................... 12
Contact Information ..................................................................................................................................... 13
Unpacking and Storage of Your Equipment ............................................................................................ 14
Unpacking ............................................................................................................................................ 14
Storage ................................................................................................................................................ 14
CIRAS-3 Tutorial & Basic Operation ........................................................................................................... 15
Let’s Get Started ...................................................................................................................................... 16
Charge internal battery packs .............................................................................................................. 16
Inspect desiccants ............................................................................................................................... 16
Insert a fresh CO2 cartridge ................................................................................................................. 17
Connect the PLC3 Universal Leaf Cuvette to the CIRAS-3 console ................................................... 18
Connect light unit to PLC3 Universal Leaf Cuvette ............................................................................. 18
Power up the CIRAS-3 System ........................................................................................................... 19
System Warm up ................................................................................................................................. 19
Setting up the CIRAS-3 System .......................................................................................................... 20
Setting up the graphical display for data plots ..................................................................................... 21
Let’s check out both the numerical and graphical display ................................................................... 21
Let’s have a look at the environmental controls .................................................................................. 23
It’s about time we start taking some data on a real plant .................................................................... 25
Placing the leaf inside the cuvette ....................................................................................................... 27
What should I be looking for at this point? ........................................................................................... 27
Quick Start................................................................................................................................................... 31
Section 1. Technical Specification ............................................................................................................. 33
Section 2. What’s new with CIRAS-3? ....................................................................................................... 36
General Changes to CIRAS-3 Hardware ............................................................................................. 36
Page 3

Changes to CIRAS-3 Sof t war e ............................................................................................................ 38
Section 3. Summary of System Design ..................................................................................................... 40
Overview and Theory .............................................................................................................................. 40
Section 4. System Components and Assembly ......................................................................................... 44
CIRAS-3 Main Console ........................................................................................................................ 44
System Power ......................................................................................................................................... 44
Power Supply Adapter ......................................................................................................................... 44
Battery P a ck ......................................................................................................................................... 45
Battery Pack Installation ...................................................................................................................... 46
Charging Batteries inside the CIRAS-3 Console ................................................................................. 47
CIRAS-3 Rear Console ........................................................................................................................... 48
USB Flash Drive Ports ......................................................................................................................... 48
Battery Charging Socket (EXT PWR) and LED ................................................................................... 49
Power ................................................................................................................................................... 49
Mini-USB (PC) ..................................................................................................................................... 49
PLC Connections ................................................................................................................................. 49
CO2 Cartridge Holder ........................................................................................................................... 49
CO2 Cartridges ..................................................................................................................................... 50
How do I determine the state of the CO2 cartridge? ............................................................................ 50
Gas Ports and Link Pipe ...................................................................................................................... 51
Auxiliary Connector .............................................................................................................................. 51
Zero Column ........................................................................................................................................ 51
CO2/H2O Control Columns and H2O Equilibrator ................................................................................. 52
PLC3 Series Leaf Cuvettes ..................................................................................................................... 53
PLC3 Universal Leaf Cuvette .............................................................................................................. 53
PLC3 Narrow Leaf Cuvette .................................................................................................................. 53
PLC3 Conifer Leaf Cuvette .................................................................................................................. 53
PLC3 Temperature Control ..................................................................................................................... 54
Temperature Measurement ................................................................................................................. 54
Page 4

Temperature Control Type ................................................................................................................... 54
LCD on Leaf Cuvette ........................................................................................................................... 55
PAR Measurement .................................................................................................................................. 56
Light Control (Optional) ........................................................................................................................... 57
PLC3 Universal LED Light Unit (RGBW) ............................................................................................. 57
PLC3 Narrow and Conifer LED Light Unit ........................................................................................... 58
CFM-3 Chlorophyll Fluorescence Module ........................................................................................... 59
Section 5. CIRAS-3 Console Software ...................................................................................................... 60
Overview .................................................................................................................................................. 60
Basics of Navigating Console Screens and Menus ............................................................................. 61
Numeric View of Data and Control Variables ...................................................................................... 62
Section 6. Startup Routine and System Stability Checks .......................................................................... 66
Before You Power Up CIRAS-3 .............................................................................................................. 66
Startup and Warm up ........................................................................................................................... 67
CO2 Cartridge Status ............................................................................................................................... 68
Changing a CO2 Cartridge ....................................................................................................................... 70
Checking Stability - Before You Place a Leaf in the Chamber ............................................................ 70
Survey Measurements – Some Tips .................................................................................................... 71
Additional Filtering in Dirty/Dusty Environments .................................................................................. 72
Section 7. Basic Functions - Viewing and Controlling CIRAS-3 ................................................................ 73
Settings (F2) ............................................................................................................................................ 73
Settings Graph Set (F5) ....................................................................................................................... 78
Controls (F3) ............................................................................................................................................ 79
Controls Graph Set (F5)....................................................................................................................... 80
Toggle View (F4) .................................................................................................................................. 80
Reviewing and Transferring Data Files ................................................................................................... 82
Transfer Data (F6) ............................................................................................................................... 82
Section 8. Operations ................................................................................................................................. 84
Operations (F1) ....................................................................................................................................... 84
Page 5

Recording Options ................................................................................................................................... 84
Manual Recording ................................................................................................................................ 84
Timed Recording .................................................................................................................................. 86
Response Curves ................................................................................................................................ 87
Z-Diff Bal (F7) ...................................................................................................................................... 94
Set Clock ................................................................................................................................................. 95
View Saved (F4) ...................................................................................................................................... 96
Calibration................................................................................................................................................ 98
Recalibrate ........................................................................................................................................... 98
Calibration Setup ................................................................................................................................. 99
CO2 Calibration .................................................................................................................................... 99
H2O Calibration .................................................................................................................................. 100
Find Max C ............................................................................................................................................ 101
Store Diff Bal ......................................................................................................................................... 102
LED Calibrate ..................................................................................................................................... 105
PAR Calibrate .................................................................................................................................... 106
Diagnostics ........................................................................................................................................ 107
IRGA (F2) ........................................................................................................................................... 107
PLC (F3) ............................................................................................................................................ 108
Flow (F4) ............................................................................................................................................ 110
Power (F5) ......................................................................................................................................... 111
APA (F6) ............................................................................................................................................ 112
Report (F7) ......................................................................................................................................... 113
Firmware Upgrade ................................................................................................................................. 114
Section 9. CIRAS-3 Console and PC Utility Software ............................................................................. 116
CIRAS-3 Console Software ................................................................................................................... 116
Installation Instructions for Main CIRAS-3 Console ........................................................................... 116
Uninstall Instructions .......................................................................................................................... 116
PC Utility Software ................................................................................................................................. 117
Page 6

Installation Instructions for PC Utility ................................................................................................. 117
Uninstall Instructions .......................................................................................................................... 117
PC Utility Operation ........................................................................................................................... 118
Create/Edit Response Scripts ............................................................................................................ 119
Create/Edit Settings Files .................................................................................................................. 121
Remote Display .................................................................................................................................. 123
Section 10. Measuring Chlorophyll Fluorescence with CFM-3 ................................................................ 127
Overview of Chlorophyll Fluorescence .................................................................................................. 127
The Basics ......................................................................................................................................... 127
Calculations Used for Chlorophyll Fluorescence Parameters ........................................................... 129
Chlorophyll Fluoresc enc e Measur ements – Setup and Operation ........................................................ 130
CFM-3 Set Up ........................................................................................................................................ 131
CFM-3 Settings .................................................................................................................................. 132
CFM-3 Controls .................................................................................................................................. 135
Measurement of Fm’ with CIRAS-3 ....................................................................................................... 137
Section 11. Closed System Measurements ............................................................................................. 140
Soil CO2 Efflux and Net Canopy CO2 Flux ............................................................................................ 140
Theory .................................................................................................................................................... 140
FCO2 Units for measurement of Soil CO2 Efflux ................................................................................ 141
References ......................................................................................................................................... 142
Electrical and Pneumatic Connection between the CIRAS-3 and SRC-1 / CPY-4 ........................... 142
Electrical and Pneumatic Connection between the CIRAS-3 and SRC-2 / CPY-5 ........................... 144
Configuring the CIRAS-3 console for measurement of Soil Respiration or Canopy Assimilation ..... 144
Settings (F2) ...................................................................................................................................... 145
Do I Use Linear versus Quadratic ...................................................................................................... 147
Closed System Operation...................................................................................................................... 147
Measurement Sequence ....................................................................................................................... 150
Initial Test Measurement Sequence .................................................................................................. 151
Recording Measurements ..................................................................................................................... 151
Page 7

Section 12. Data Output ........................................................................................................................... 153
Photosynthesis Data .............................................................................................................................. 153
Photosynthesis and Chlorophyll Fluorescence Data ............................................................................. 155
Closed System Operation Data ............................................................................................................. 158
Summary of the Gas Exchange Equations Used in CIRAS-3 ............................................................... 159
Mass Flow Equation ........................................................................................................................... 159
Transpiration ...................................................................................................................................... 159
Leaf Temperature .............................................................................................................................. 160
Saturation Vapor Pressure ................................................................................................................ 161
Stomatal Conductance....................................................................................................................... 161
Net Photosynthesis ............................................................................................................................ 161
Intercellular CO2 Concentration ......................................................................................................... 162
Physical Constants Used in Equations .............................................................................................. 163
Definition of Symbols ......................................................................................................................... 163
Section 13. Troubleshooting & Diagnosis ................................................................................................ 165
System Power ....................................................................................................................................... 165
CO2 Measurement and Control ............................................................................................................. 166
H2O Measurement and Control ............................................................................................................. 168
Temperature Measurement and Control ............................................................................................... 169
PAR Measurement and Control ............................................................................................................ 170
Flow Control ....................................................................................................................................... 171
Data Management ................................................................................................................................. 172
Status Codes Displayed on the CIRAS-3 LCD .................................................................................. 173
Other Status Codes/Messages .......................................................................................................... 177
Section 14. Routine Maintenance ............................................................................................................ 178
CIRAS-3 Main Console ......................................................................................................................... 178
Battery Pack (Li-ion Bat ter y) .............................................................................................................. 178
Battery Removal ................................................................................................................................ 179
Battery Storage .................................................................................................................................. 179
Page 8

Battery Disposal ................................................................................................................................. 179
External Battery Pack (For extended operation in the field) .............................................................. 180
Air Sampling Pumps (Reference and Analysis) ................................................................................. 180
Replacement of Reference and Analysis Pump ................................................................................ 181
Servicing the Air Sampling Pump (Reference & Analysis) ................................................................ 181
Air Supply Pump ................................................................................................................................ 182
Air Filters ............................................................................................................................................ 183
External Air Inlet Filter Assembly (Part Number STD558) ................................................................. 184
Desiccants and Absorber Columns ................................................................................................... 184
Zero Column Assembly...................................................................................................................... 185
CO2 & H2O Control Column ............................................................................................................... 186
Soda Lime .......................................................................................................................................... 187
Drierite ............................................................................................................................................... 187
Molecular Sieve ................................................................................................................................. 188
Molecular Sieve Repackaging ........................................................................................................... 189
Foam Filters ....................................................................................................................................... 189
Absorber Filters .................................................................................................................................. 190
“O” Rings ............................................................................................................................................ 190
CO2 Regulator .................................................................................................................................... 190
CO2 Calibration ...................................................................................................................................... 192
H2O Calibration ...................................................................................................................................... 193
PLC3 Leaf Cuvettes .............................................................................................................................. 193
Cuvette Gaskets ................................................................................................................................ 193
Checking For Leaks Associated With the PLC3 ................................................................................ 194
PLC3 Leaf Cuvette Head Adjustment ................................................................................................ 195
PLC3 Pneumatic Connector .............................................................................................................. 196
Environmental Sensors ......................................................................................................................... 196
Temperature ...................................................................................................................................... 196
PAR .................................................................................................................................................... 196
Page 9

Boundary Layer Determination (rb) ........................................................................................................ 197
Changing PLC3 Universal Head Plat es ............................................................................................. 200
Replacement of PLC3 Glass Window (For Use with CFM-3) ............................................................ 201
Section 15. Consumables/Spares ............................................................................................................ 202
Desiccants and Absorber Columns ....................................................................................................... 202
Pumps & Air Filters ................................................................................................................................ 202
CO2/H2O Control .................................................................................................................................... 203
Batteries & Power Supplies ................................................................................................................... 203
Cables/Data Storage ............................................................................................................................. 203
Leaf Cuvette Accessories ...................................................................................................................... 203
Page 10
Welcome
This product is manufactured in accordance with CE
Thank you very much for purchasing our CIRAS-3 Portable Photosynthesis System. We greatly
appreciate your business and we look forward to working with you and your research team for many
years to come.
requirements. For more information on system
conformity please get in contact with PP S ystem.
This operation manual is based on our software Version 1.09 and above along with the following system
firmware and above:
• FW Version: V. 1.04 and above
• Air Version: V. 3.02 and above
• IRGA Version: V. 3.06 and above
• PLC Version: V 3.14 and above
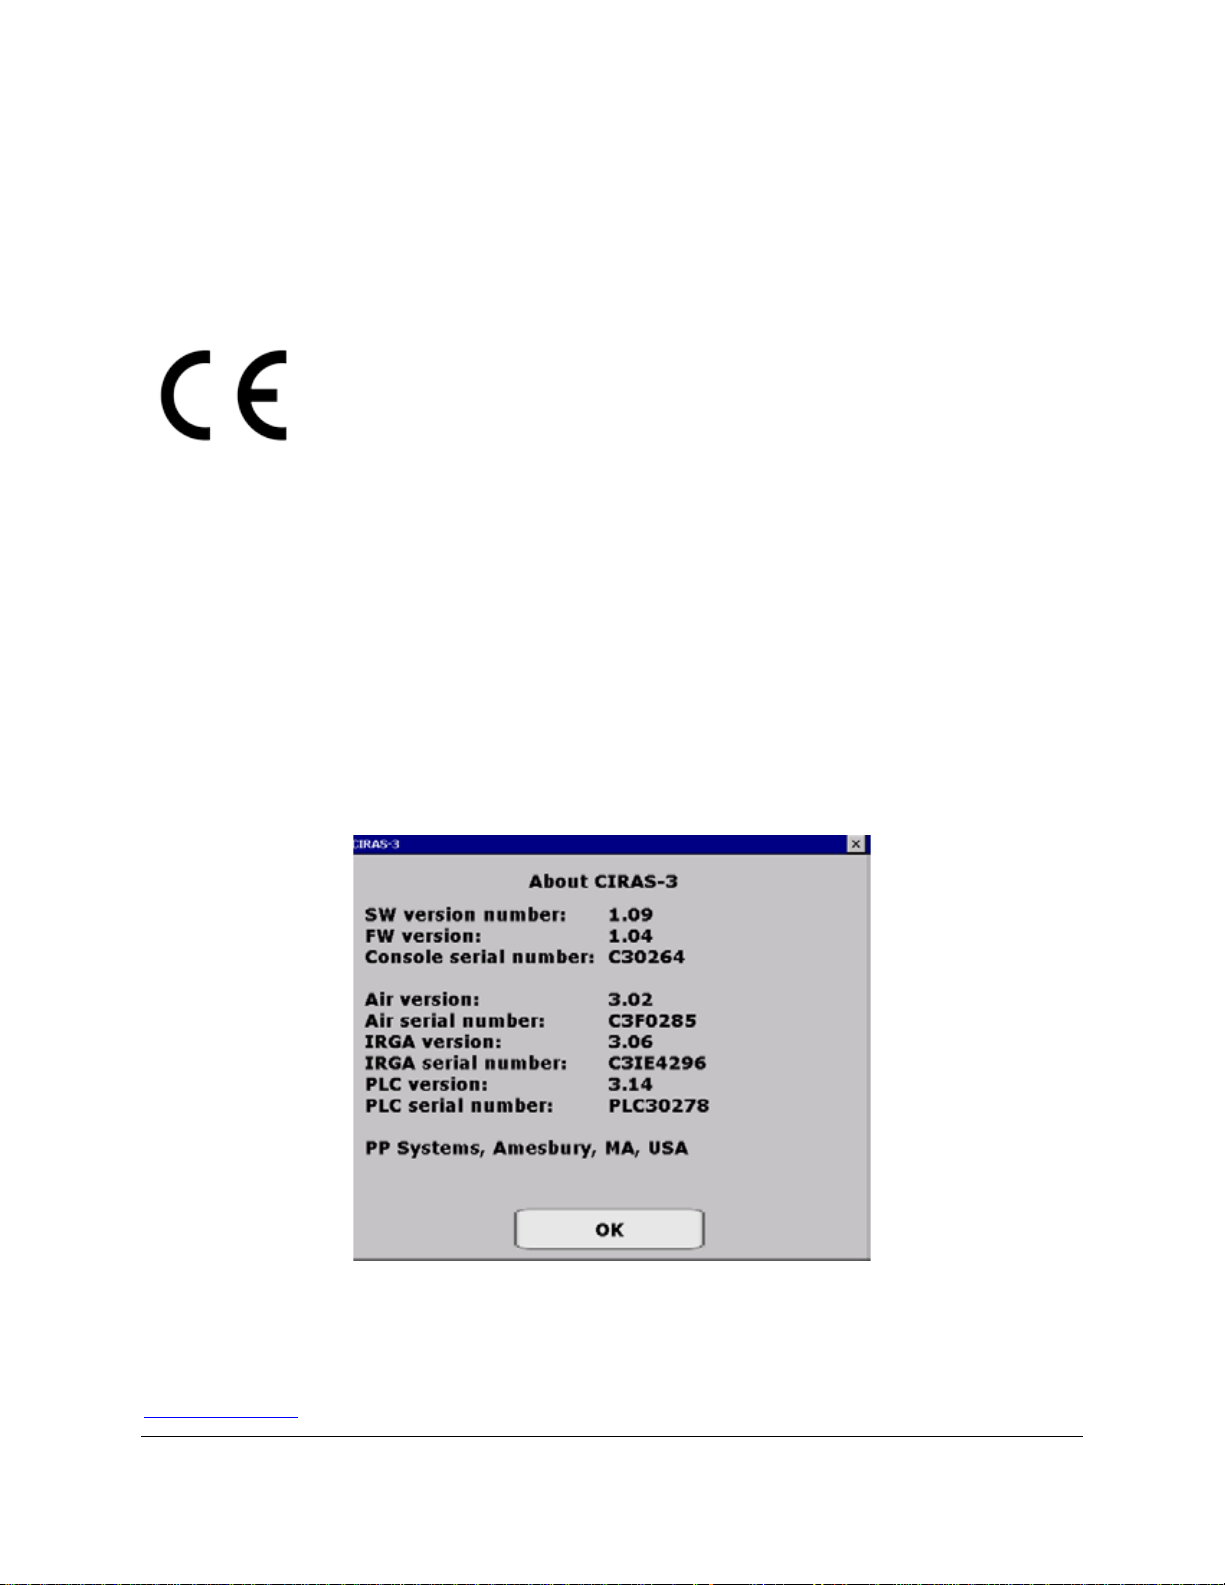
To check which software and firmware versions are currently installed on your CIRAS-3 go to Help (F8) >
About (F2):
For users running V. 1.09 console software along with latest firmware, future software and firmware
updates can be made locally without the need to return the system to our factory. Our latest software and
documentation can be downloaded free of charge from our website if you are registered with us (See
User Registration on page 11
). For users running older software and firmware versions, the CIRAS-3,
Page 11

PLC3 and Light unit (if applicable) may need to be returned to PP Systems for a factory update which will
bring your system up to date and allow you to perform future updates locally without having to return the
instruments to our factory. Please contact PP Systems for more information.
Information contained in this operation manual is subject to change without notice. Registered users of
PP Systems products and instruments may obtain updated documentation and software by visiting the
Users Area of our website.
This manual and the information contained within are copyrighted to PP Systems. No part of the
manual may be copied, stored, transmitted or reproduced in any way or by any means including,
but not limited to, photocopying, photography, magnetic or other mechanical or electronic means,
without the prior written consent of PP Systems, Inc.
For applications where failure of this equipment to function corr ec tl y would lead to c ons eque nti al dam age,
the equipment must be checked for correct operation and calibration at intervals appropriate to the
circumstances. The PP Systems' equipment warranty is limited to replacement of defective components,
and does not cover injury to persons or property or other consequential damage.
This manual is provided to help you install and operate the equipment. Every effort has been made to
ensure that the information it contains is accurate and complete. PP Systems does not accept any
liability for losses or damages resulting from the use of this information.
It is the operator’s responsibility to review this information prior to installation and operation of the
equipment. Otherwise, damage may be caused which is not covered under our normal warranty policy.
User Registration
It is very important that ALL new users register with us. If you are a PP Systems’ user, please go to
www.ppsystems.com
Only REGISTERED users will be allowed access to the protected “Users” section of our web site. This
section will contain important product information including hardware/software updates, application notes,
newsletters, etc.
Thank you in advance for your cooperation.
and click on Customer Registration in the upper left hand corner.
Page 12

Service & Warranty
PP Systems' equipment warranty is limited to replacement of defective components, and does not cover
injury to persons or property or other consequential damage.
The equipment is covered under warranty for one complete year, parts and labor included. This, of
course, is provided that the equipment is properly installed, operated and maintained in accordance with
written instructions (i.e. Operator's Guide).
The warranty excludes all defects in equipment caused by incorrect installation, operation or
maintenance, misuse, alteration, and/or accident.
If for some reason, a fault is covered under warranty, it is the responsibility of the customer to return the
goods to PP Systems or an authorized agent for repair or replacement of the defective part(s).
Prior to returning equipment to PP Systems for service, you must first get in contact with our Service
Manager ([email protected]
) to request a case number for reference and tracking purposes.
Returning equipment to PP Systems
Before returning equipment to PP Systems it is very important that you pay close attention to the following
procedure:
1. Contact PP Systems directly by email ([email protected]
0505) to obtain a Case Number for tracking and reference purposes. You will receive a “Service
Return Form” that must be completed and included with the return of your equipment.
2. If you have any stored data on your instrument that is important to you please retrieve it prior to
packing up your equipment. PP Systems is not responsible for any loss of data.
3. Safely pack your equipment in a rugged carton/case with suitable packing materials (bubble pack,
etc.). Remember to include the “Service Return Form”. PP Systems is not responsible for any
) or by telephone (+1 978-834-
shipping related charges for equipment being returned to PP Systems (Amesbury, MA)
regardless of whether or not it is covered under warranty.
4. Notify the PP Systems’ Service Department when the equipment is packed and ready to be
shipped.
Page 13

Please also note the following:
• We strongly recommend using UPS “door to door” service for all returns. PP Systems is not
responsible for any unnecessary shipping related charges caused by incorrect preparation of
shipment documentation. If you have any questions regarding the return of your equipment
please consult with PP Systems.
• Remove all batteries contained in the equipment. We don’t need them and this will el iminate any
problems associated with shipments containing Li-ion batteries. There is also no need to return
the power supply adapter or any cables.
• Remove the CO
• To save on weight and shipping costs you can remove the desiccants from all absorber columns.
• Make sure that the PLC3 cuvette head is open so that the gaskets are not compressed or
damaged when received.
• Prior to performing any service on your equipment we must have an acceptable purchase order
or credit card information on file (Visa or MasterCard).
cartridge from the CO2 cartridge holder.
2
Contact Information
PP Systems, Inc.
110 Haverhill Rd, Suite 301
Amesbury, MA 01913 USA
Tel: 978-834-0505 Fax: 978-834-0545
Sales: [email protected]
Support: [email protected]
Service: [email protected]
URL: www.ppsystems.com
Page 14
Unpacking and Storage of Your Equipment
Unpacking
It is extremely important that you check the contents of your equipment immediately upon receipt to
ensure that your order is complete and that it has arrived safely. Please refer to the checklist supplied (if
applicable) for a detailed list of spares and accessories that are included with your order. DO NOT
DISCARD ANY OF THE PACKAGING MATERIAL UNTIL ALL OF THE ITEMS LISTED ARE
ACCOUNTED FOR. WE RECOMMEND THAT YOU RETAIN THE ORIGINAL PACKING FOR FUTURE
USE. If you suspect that any of the items listed on the packing list or checklist are not included or
damaged, you must contact PP Systems or your authorized distributor immediately.
Storage
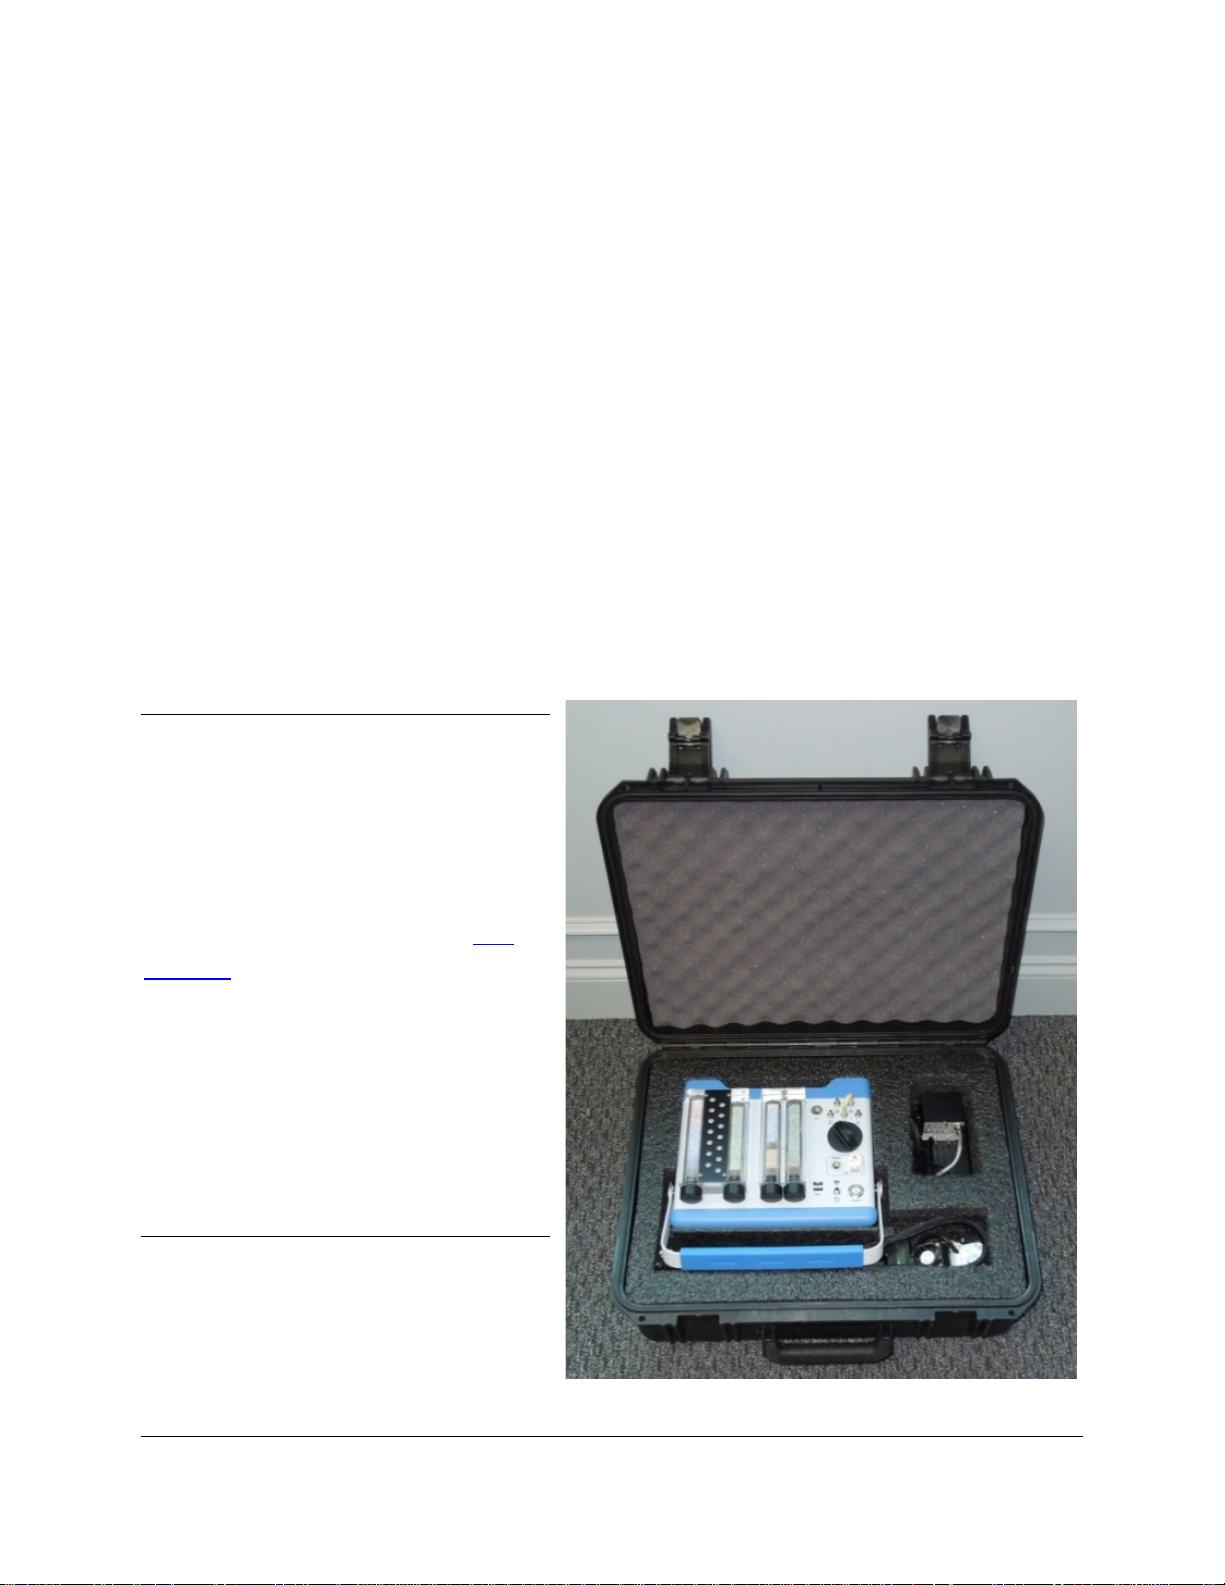
We highly recommend storing your equipment in a safe, dry location. If you store your system in the
black transport case supplied with your system, please refer to the very important tip below.
Tip
If the CO2 cartridge is pressurized we
STRONGLY suggest removing the entire
cartridge holder and regulator from the
CO
2
console and store it separately. See
Regulator on page 190. Otherwise CO2 will
slowly accumulate overnight inside the case
resulting in absorption into the PLC tubing as
well as the internal case foam material
affecting CO
day. The system should only be stored in the
case when a CO
exhausted.
measurements the following
2
cartridge is empty and fully
2
CO2
Page 15
CIRAS-3 Tutorial & Basi c Operation
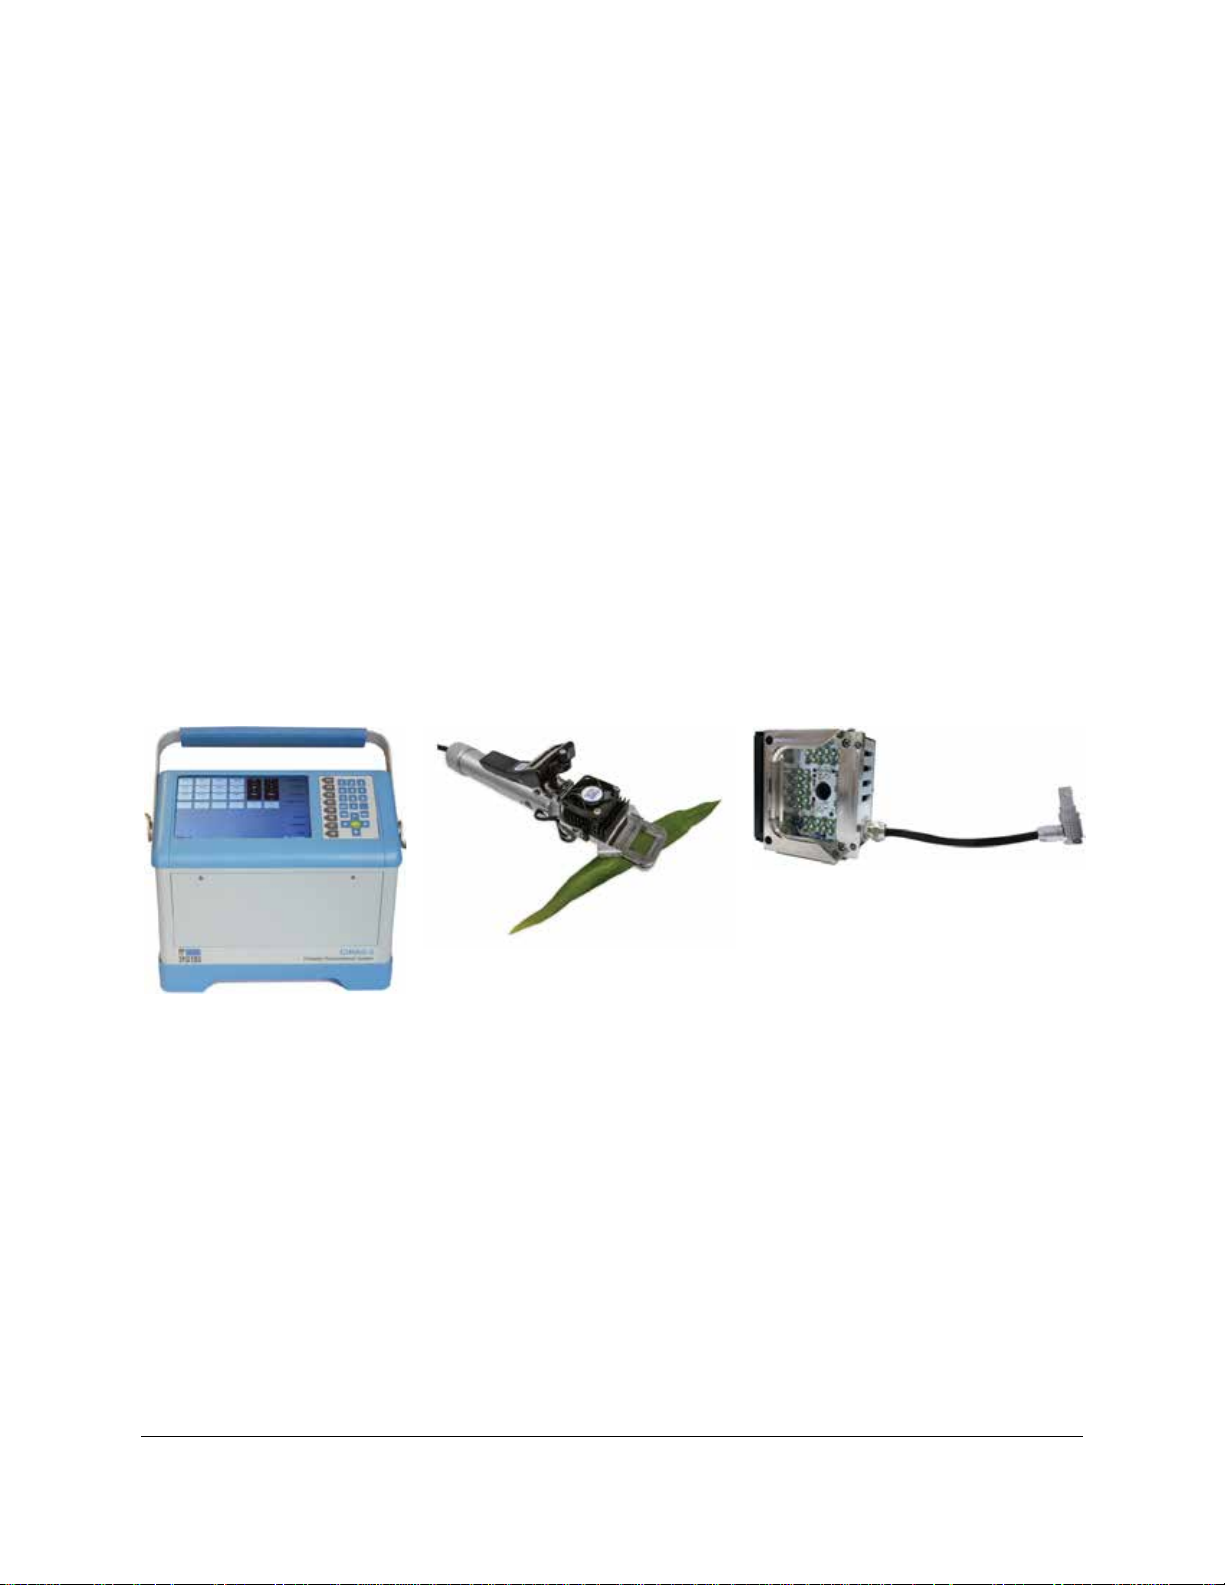
CIRAS-3 Main Console
PLC3 Universal Leaf Cuvette
PLC3 Universal Light Unit (LED)
After being in business for over 30 years we have learned that one thing is for certain. Very few people
have the time to read operation manuals from cover to cover. With that in mind we strongly encourage
you to take the time to step through this quick and easy tutorial to learn about the general operation of the
system. In less than 2 hours you will have learned how to:
• Prepare the system for leaf gas exchange measurements
• Set up and modify all environmental controls (CO
• Navigate and become more familiar with the user interface
• Store and retrieve data from memory
This tutorial is based on the following system configuration. If you have our CFM-3 Chlorophyll
Fluorescence Module you can use it much like the PLC3 Universal Light Unit:
Part Number CRS300
Part Number CRS301
, H2O, temperature and light)
2
Part Number CRS304
In addition, we recommend that you have the following items available for this tutorial:
• CIRAS-3 power supply adapter
• One CO
• USB flash drive
• Small tabletop tripod to hold PLC3 Universal Leaf Cuvette
• PC or laptop computer
• A well-watered, healthy plant for actual measurements. We recommend a plant that likes high
light (i.e. tomato, sunflower, etc.) and is typically found growing outdoors for best results.
cartridge
2
Page 16
Please Note
The measured and calculated data that is shown in this tutorial should be similar but not 100% identical to
what you will witness. Actual results will be based on the biological state and type of plant that you use
and its response to the environmental conditions presented. However, what is most important is that you
should observe stable and comparable results.
Let’s Get Started
Charge internal battery packs
Before taking your system to the field for measurements it is critical that the internal batteries are fully
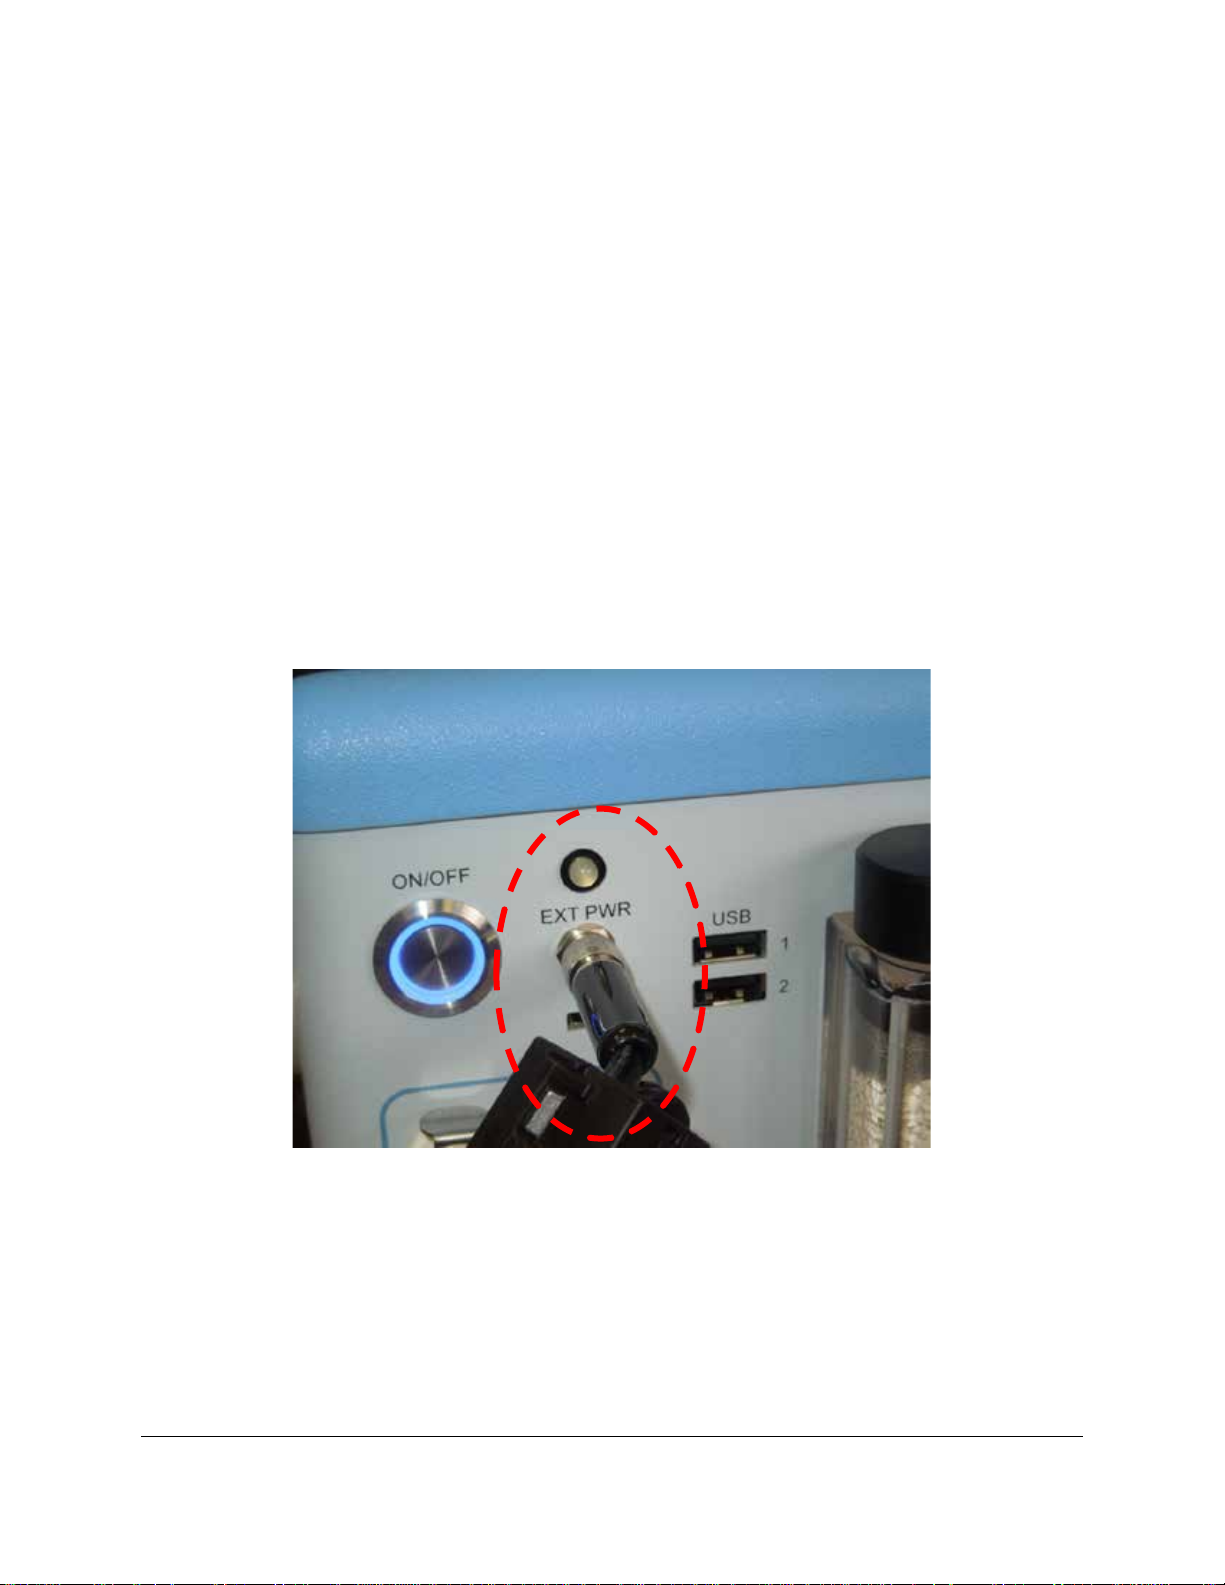
charged. We recommend charging the batteries the night prior to use. Connect the power supply
adapter supplied with the system to the EXT PWR socket on the CIRAS-3 console to charge the internal
batteries. Make sure that the connection is secure. The indicating LED should be steady green in color
indicating secure connection and that the internal batteries are being charged.
Inspect desiccants
Make sure that all desiccants are fresh before beginning measurements and that all columns are properly
seated in their respective manifolds. The soda lime can be either self-indicating or non-indicating. If
using non-indicating soda lime we recommend changing out more regularly to play it safe. The Drierite
will be blue in color when fresh. It turns from blue to pink as it becomes exhausted. The Molecular Sieve
is white and non-indicating. The Molecular Sieve should always be discarded when changing out the
Drierite. For this tutorial we recommend that you change out all desiccants to ensure that they are fresh.
Page 17
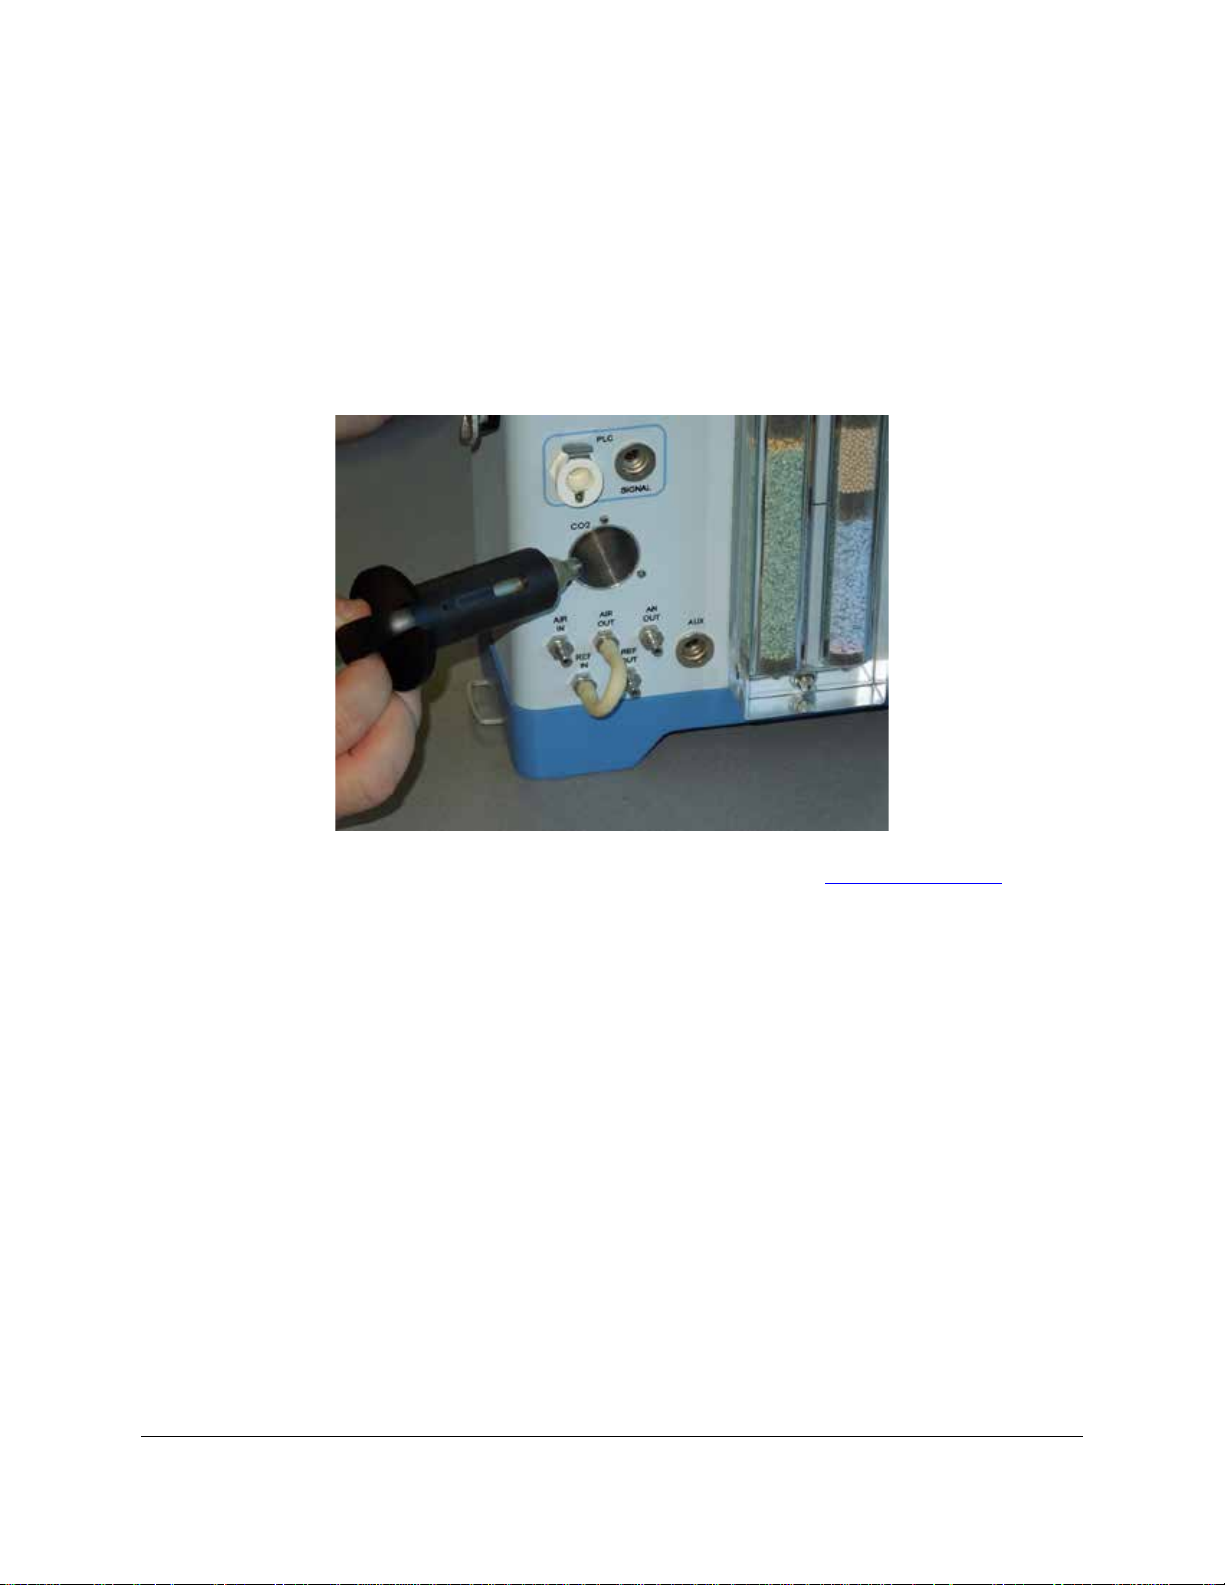
Insert a fresh CO2 cartridge
CO2 cartridges allow for accurate and precise control of CO2 and we highly recommend using them for
best results. Unscrew the CO
screw the holder into the CO
cartridge holder and insert a new CO2 cartridge as shown below. Next,
2
regulator turning clockwise until snug. If you hear a small hiss (indicating
2
the cartridge is being pierced) continue to turn the holder until snug to ensure that the cartridge is both
pierced and sealed properly into the regu lat or assembly. Each CO
cartridge will last at least 24 hours
2
from the time it is installed.
We use 8g CO
cartridges which are manufactured by a company called ISI (https://www.isi.com/). They
2
can easily be sourced from many different suppliers around the world. If you have any questions or
problems related to these CO
cartridges please contact PP Systems.
2
Is it possible to perform measurements under ambient conditions without using a
CO2 cartridge?
Yes and it is very easy. To do so make sure that the CO2 cartridge holder is empty and that the soda lime
is removed from the CO
ensure that ambient air is used for your reference air and the column will simply act as a smoothing
volume. Go to Settings (F2) and select “Ambient (remove chemicals)” for CO2 Reference. We just
wanted to bring this to your attention for future use but for this tutorial we will be using a CO
controlling CO
.
2
O control column on the CIRAS-3 console. The empty soda lime column will
2/H2
cartridge for
2
Page 18
Is it possible to perform measurements under ambient H2O conditions in addition
to ambient CO2?
Yes and again this is quite easy. To do so make sure that the CO2 cartridge holder is empty and that
both the soda lime and Drierite is removed from the CO
O control column on the CIRAS-3 console.
2/H2
The empty columns will ensure that ambient air is used for your reference air and the columns will act as
smoothing volumes. Go to Settings (F2) and select “Ambient (remove chemicals)” for CO2 Reference
and “Ambient (remove chemicals)” for H
future use but for this tutorial we will be controlling H
O Reference. We just wanted to bring this to your attention for
2
O using the Drierite.
2
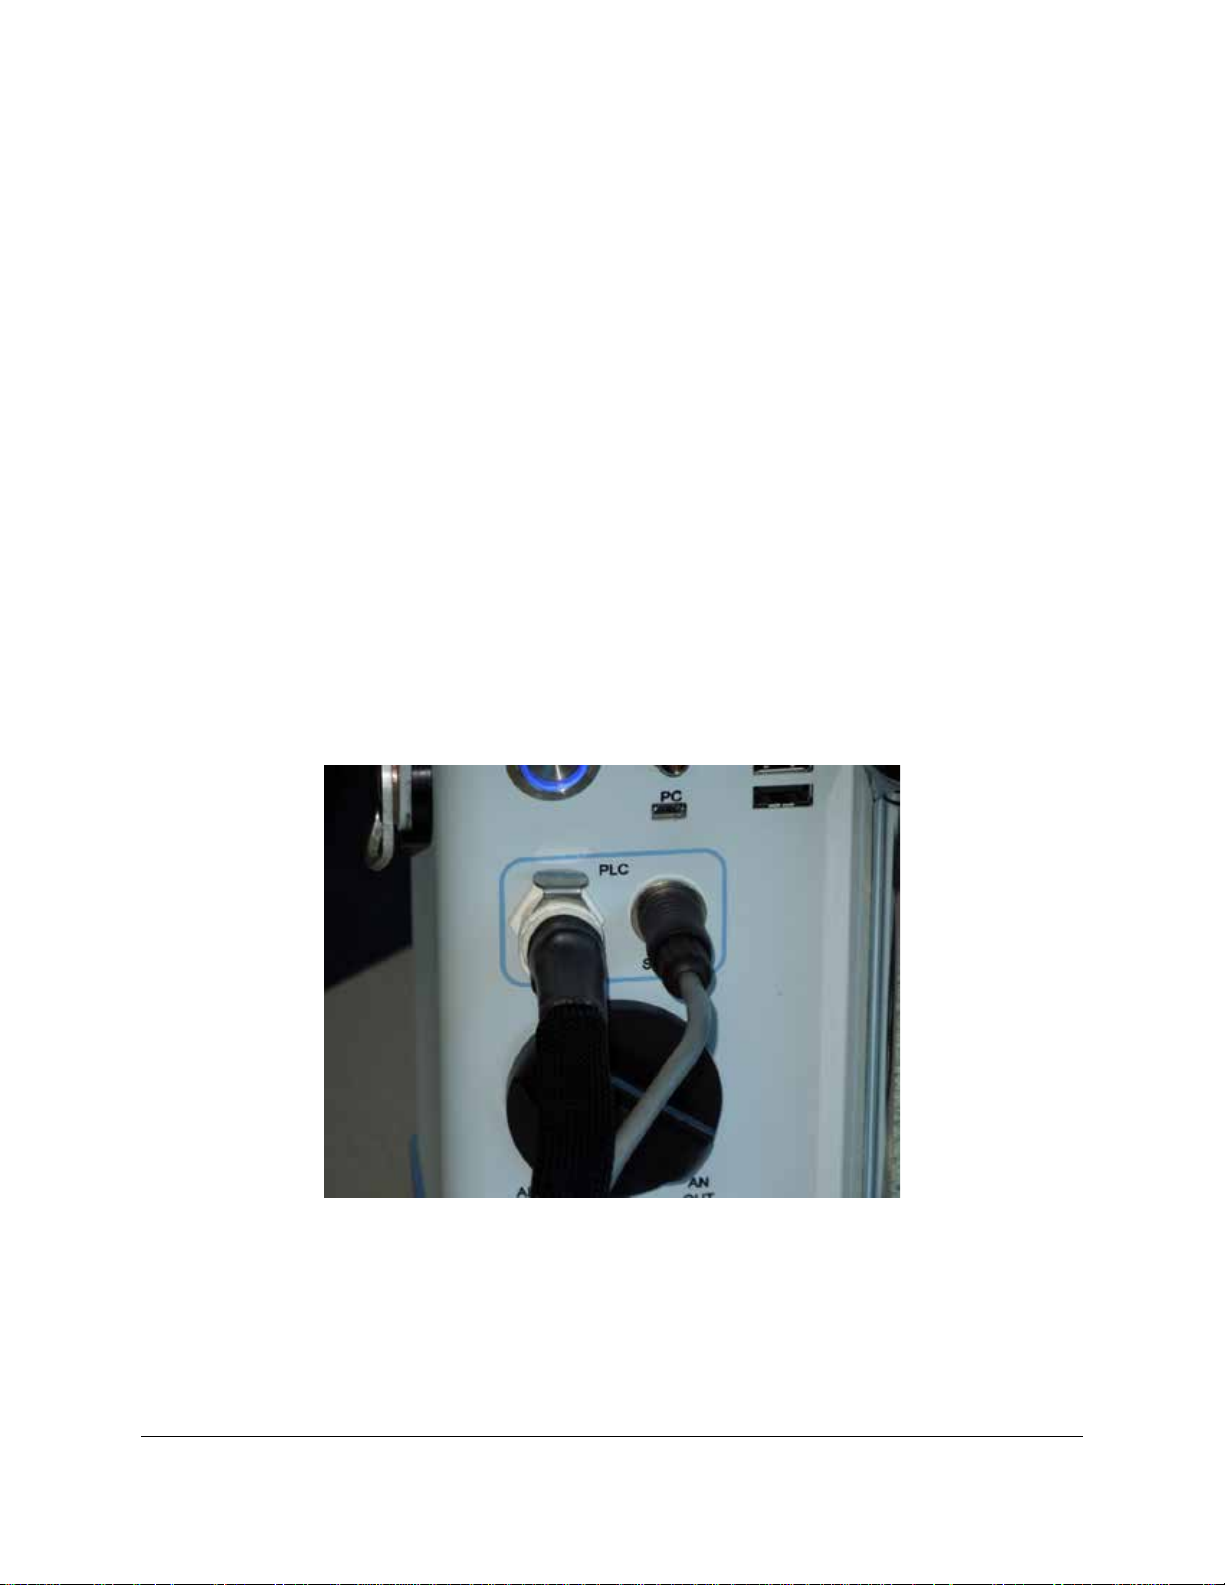
Connect the PLC3 Universal Leaf Cuvette to the CIRAS-3 console
Connect the black, 4 pin electrical plug from the PLC3 to the “Signal” socket on the CIRAS-3 console. Be
careful to align the arrow on the black signal plug with the top center console socket on the CIRAS-3
console. Next connect the white pneumatic connector to the “Gas” port on the CIRAS-3. It will snap into
place. Close the cuvette head. The black link pipe should already be in place connecting the “REF IN”
and “AIR OUT” gas ports below the CO
source.
2
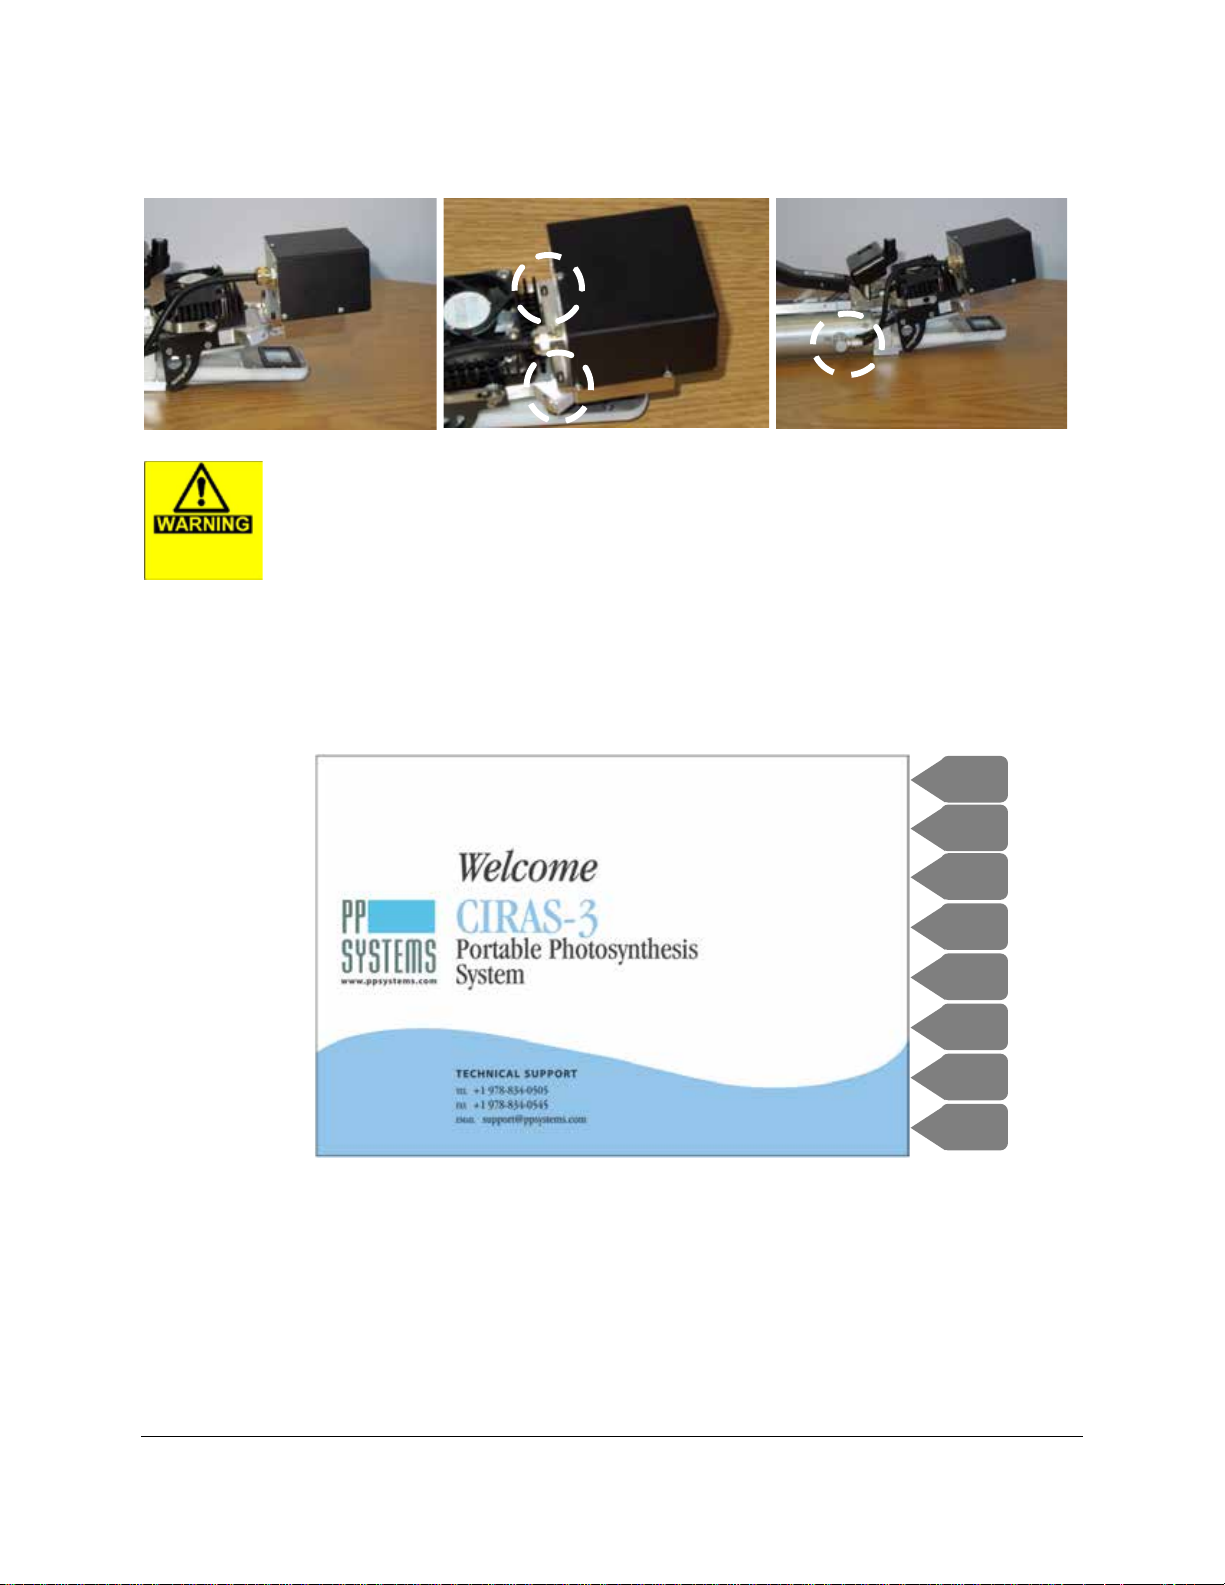
Connect light unit to PLC3 Universal Leaf Cuvette
Mount the light unit by aligning it to the front of the cuvette upper jaw (Step 1). Slide the light unit towards
the heat sink and fan on the top of the leaf cuvette. It should secure in place by two lock-in set screws as
shown below (Step 2). Connect electrically (Step 3).
Page 19
Step 1 Step 2 Step 3
F1
F3
F2
F4
F6
F5
F7
F8
Never stare directly at LEDs
Power up the CIRAS-3 System
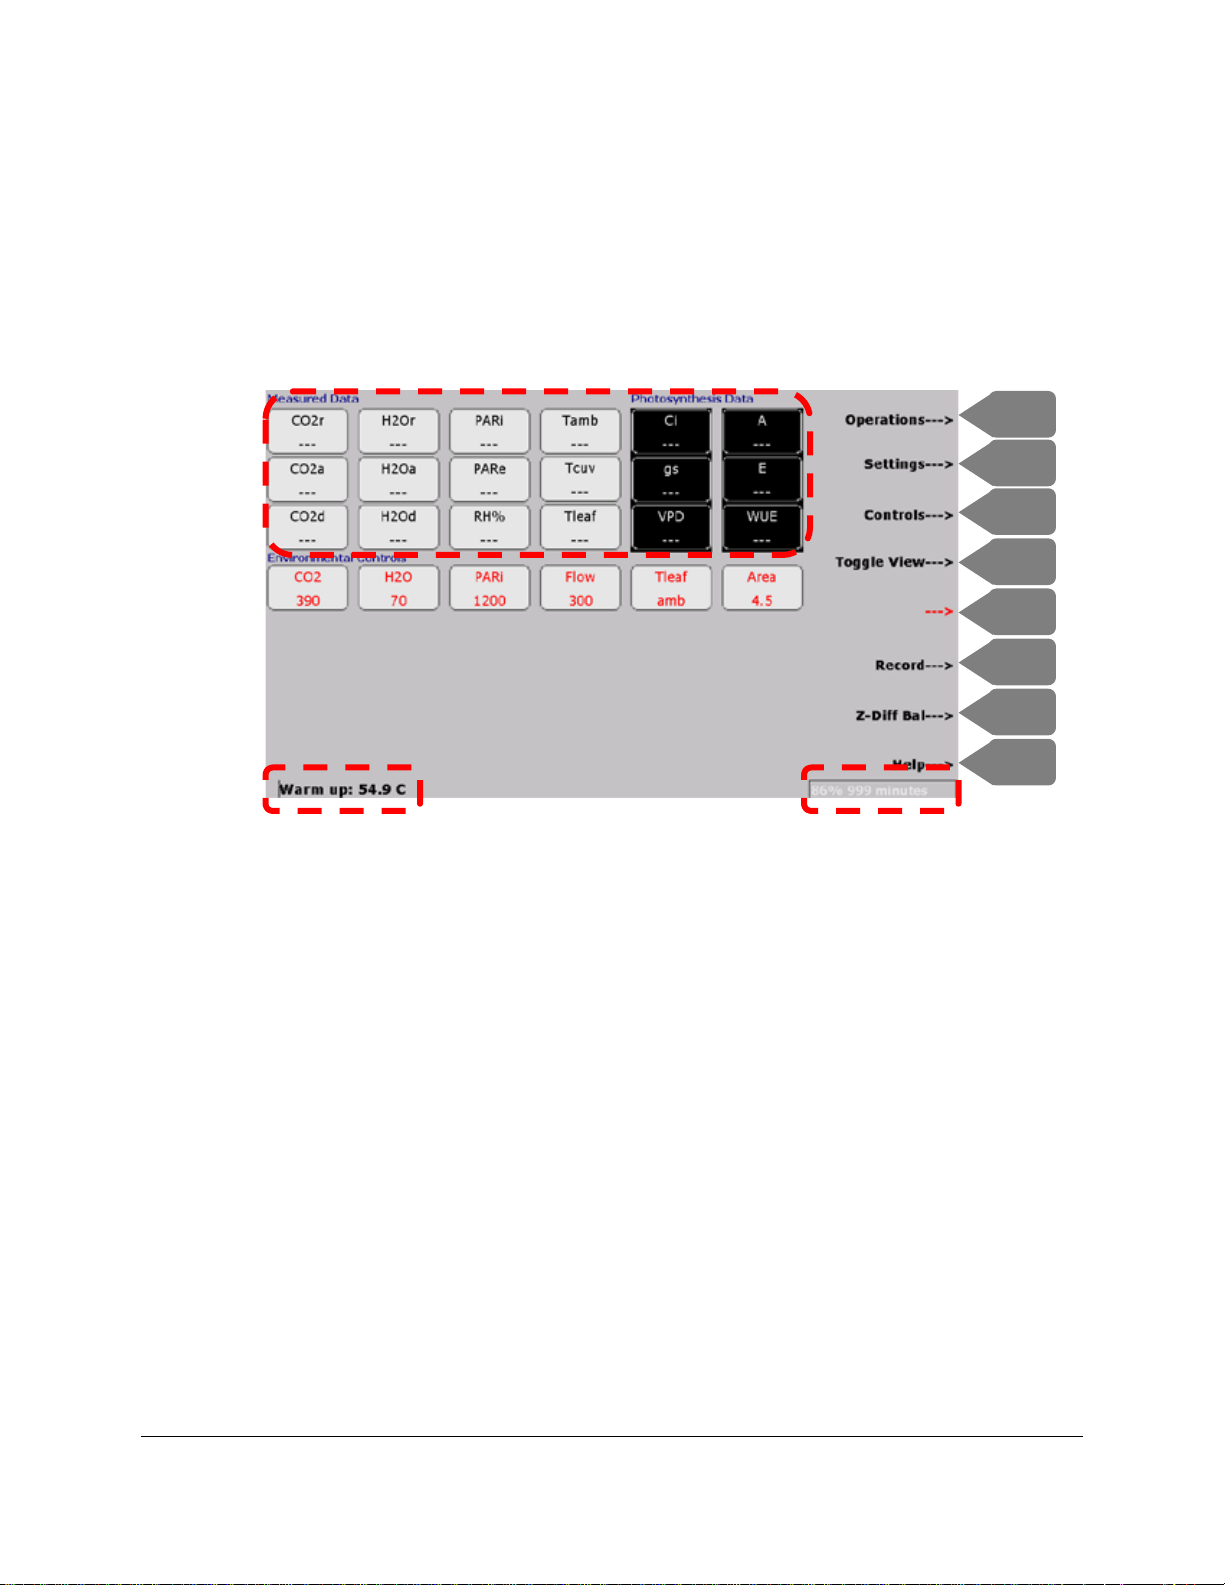
Press the ON/OFF switch in the upper left hand corner on the back of the console. A blue ring around the
switch should illuminate. After approximately 30 seconds the “Welcome screen” will appear on the LCD.
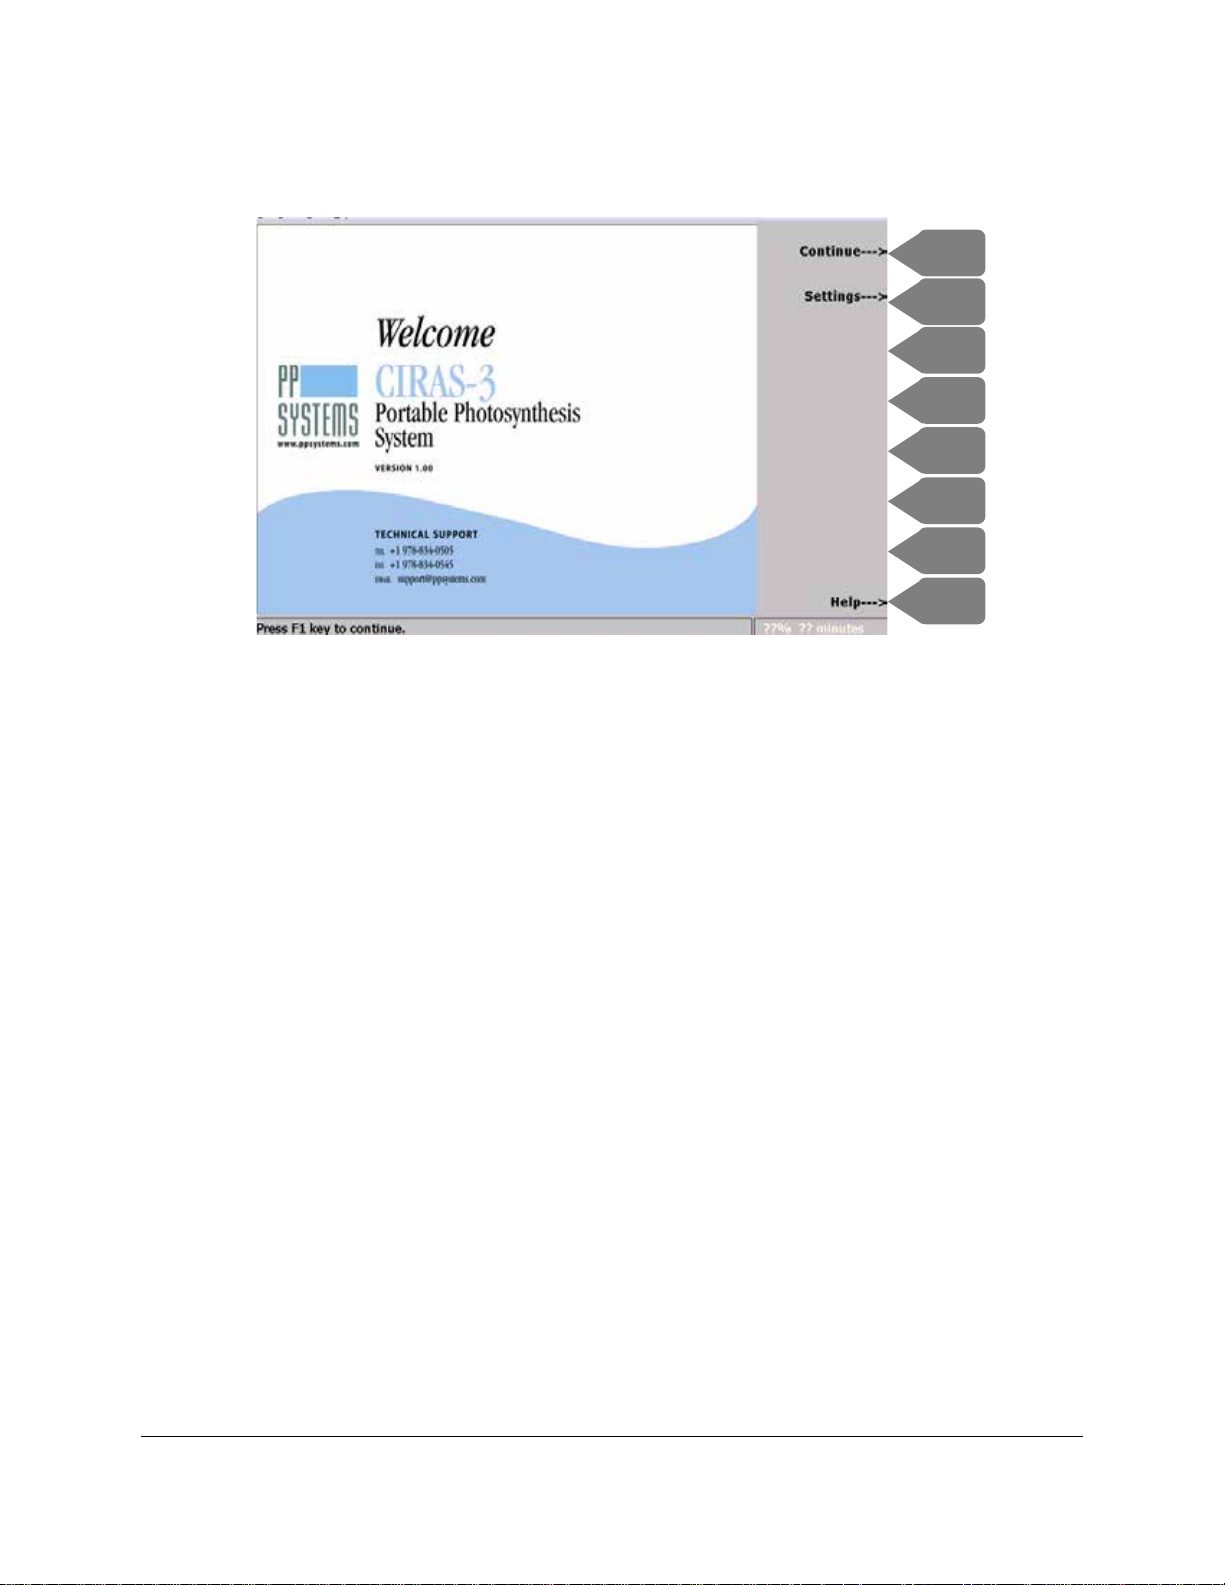
Press Continue (F1) to start the CIRAS-3 software.
System Warm up
We recommend allowing the system to warm up for at least 15-30 minutes. It normally takes the system
o
approximately 10 minutes for the IRGAs to reach the required operating temperature of 55
during this period the system will perform several Zero and Diff Bal cycles to ensure that everything is
working perfectly. The system performs more frequent Zero and Diff Bal cycles during the first 30
C and also
Page 20
minutes and then after that they will be performed much less frequently (depending on Settings) or when
F1
F3
F2
F4
F6
F5
F7
F8
there is a large change in CO
(100 µmol mol-1) and/or H2O (5 mb) concentration.
2
During warm up note the dashes for Measured Data and Photosynthesis Data. This occurs during
system warm up, Zero and Diff Bal cycles. The numbers don’t mean anything during this period so don’t
be alarmed. Also note the IRGA warm up message in the lower left hand corner and the battery status in
the lower right hand corner of the display.
Setting up the CIRAS-3 System
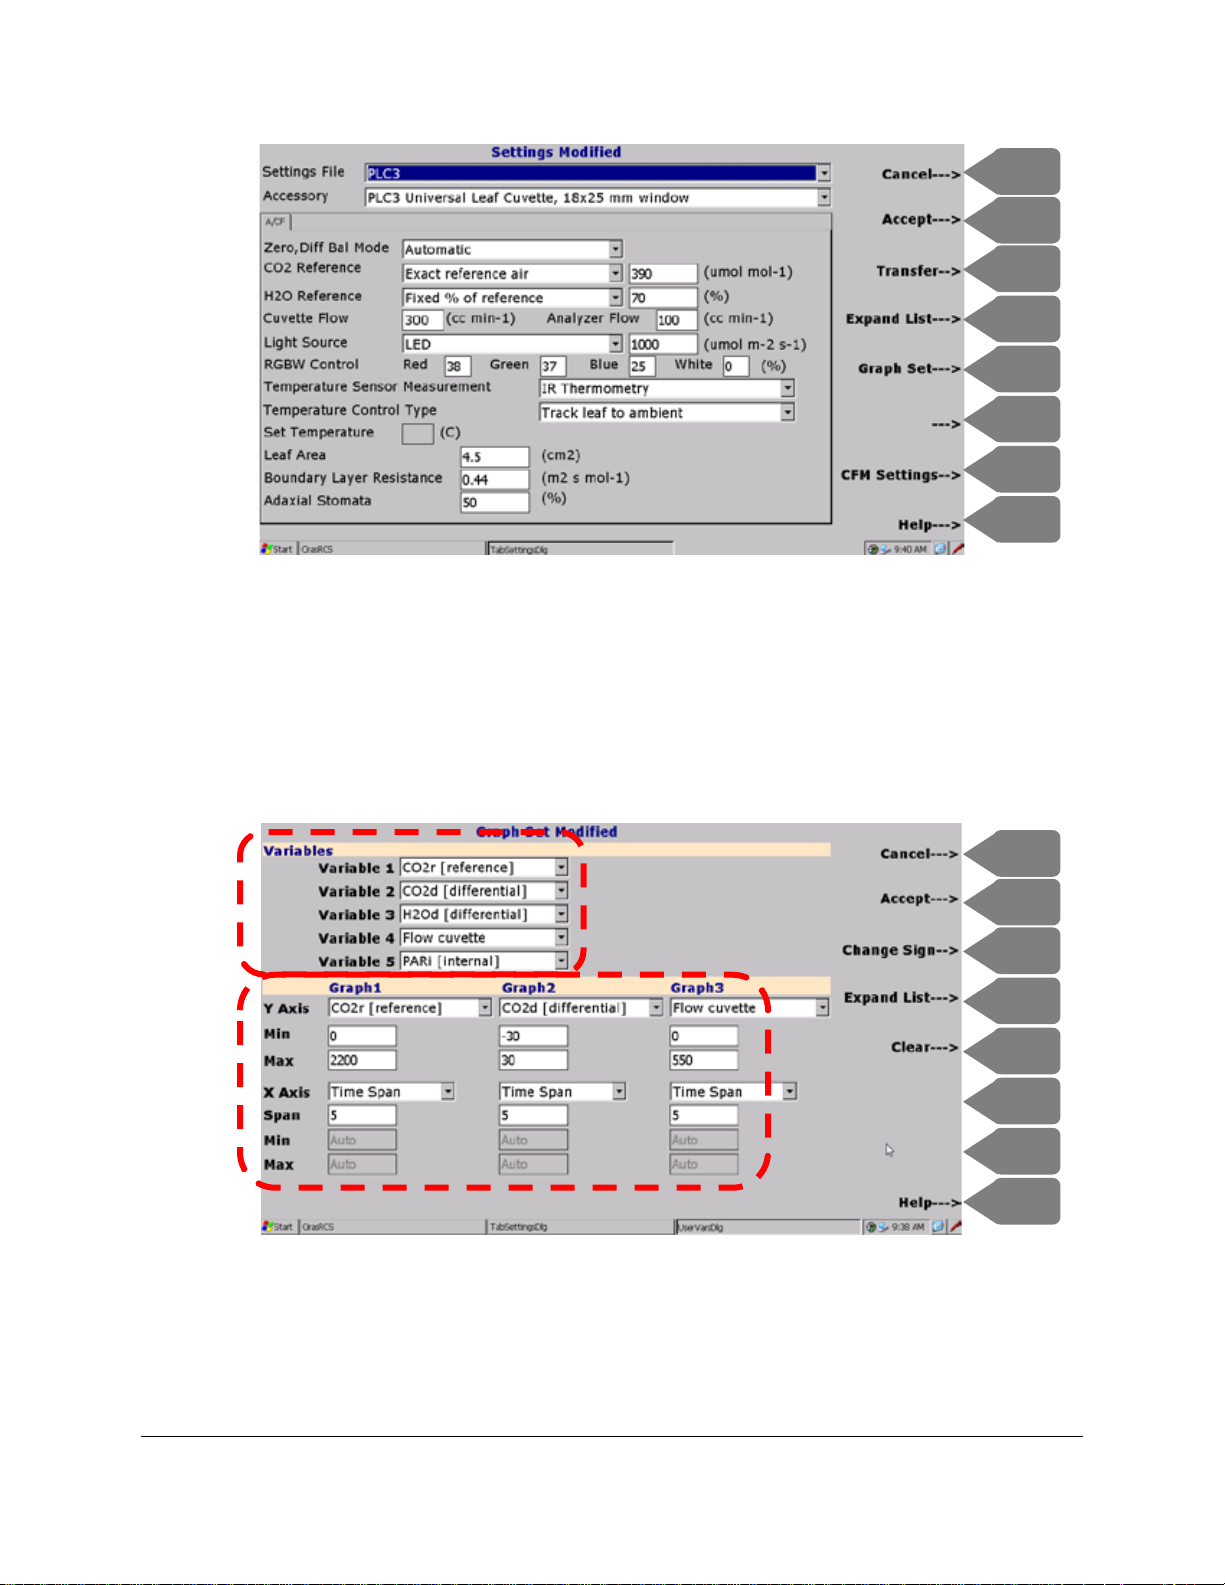
Press Settings (F2). This is where you select the accessory being used with the CIRAS-3 (in this case
PLC3 Universal Leaf Cuvette, 18x25mm window) and all associated settings, options and environmental
controls for that accessory. Pressing the Tab key allows you to navigate through the fields. At this time,
press Tab to navigate from field to field and create a Settings file exactly as you see below. When in any
field you can press the Expand List (F4) to see all available options for that field. For Boundary Layer
Resistance enter the value for your PLC3. You can locate this value on the green “Tested” label on your
PLC3 handle.
Page 21
F1
F3
F2
F4
F6
F5
F7
F8
F1
F3
F2
F4
F6
F5
F7
F8
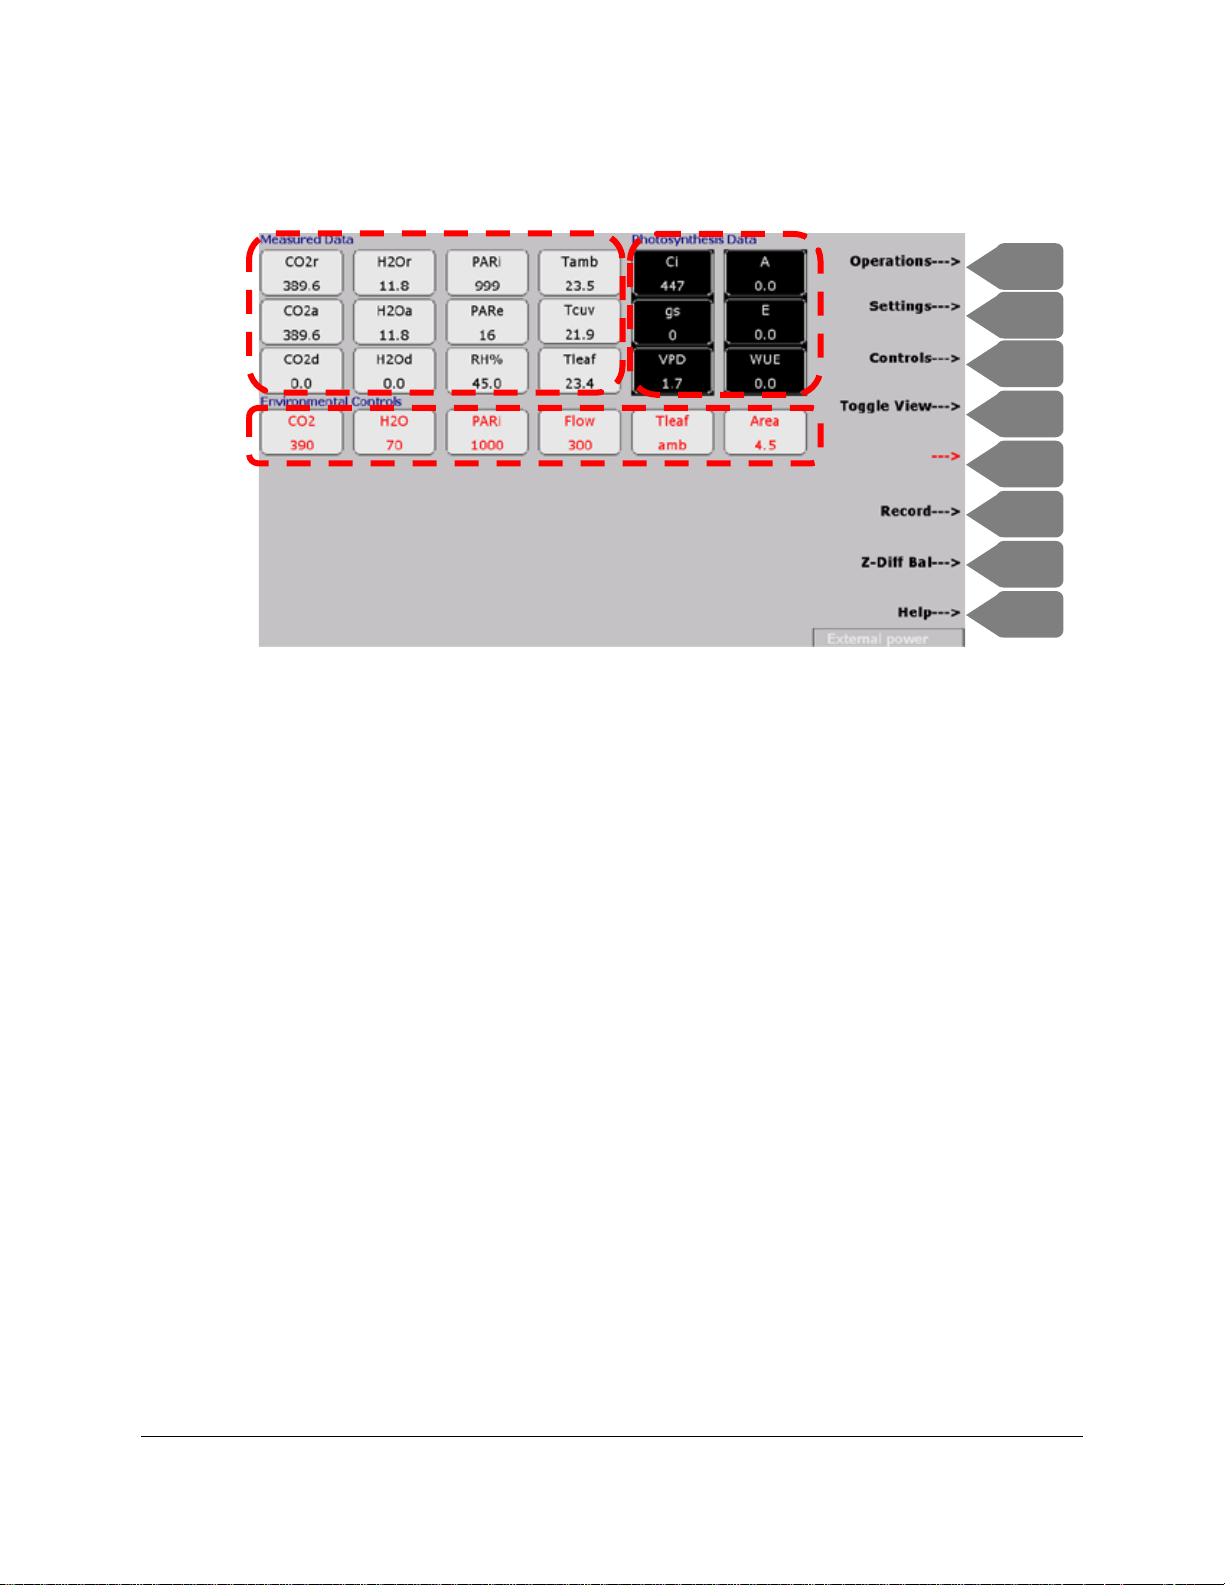
Setting up the graphical display for data plots
You have complete flexibility to plot any parameter against time or any parameter against another
parameter. You can also set up to 3 different graph plots along with up to 5 variables. Press Graph Set
(F5) to begin setting up your graphical preferences. Tab from field to field and set your graph settings
exactly as shown below. Press Clear (F5) > OK > Accept (F2) > Accept (F2). Again, when you are in
any field you can press the Expand List (F4) to see all available options for the accessory selected.
Let’s check out both the numerical and graphical display
So by this time you will have everything up and running with the proper system settin gs and will now be in
a great position to establish a baseline to determine that everything is good to go. After about 3-4
Page 22
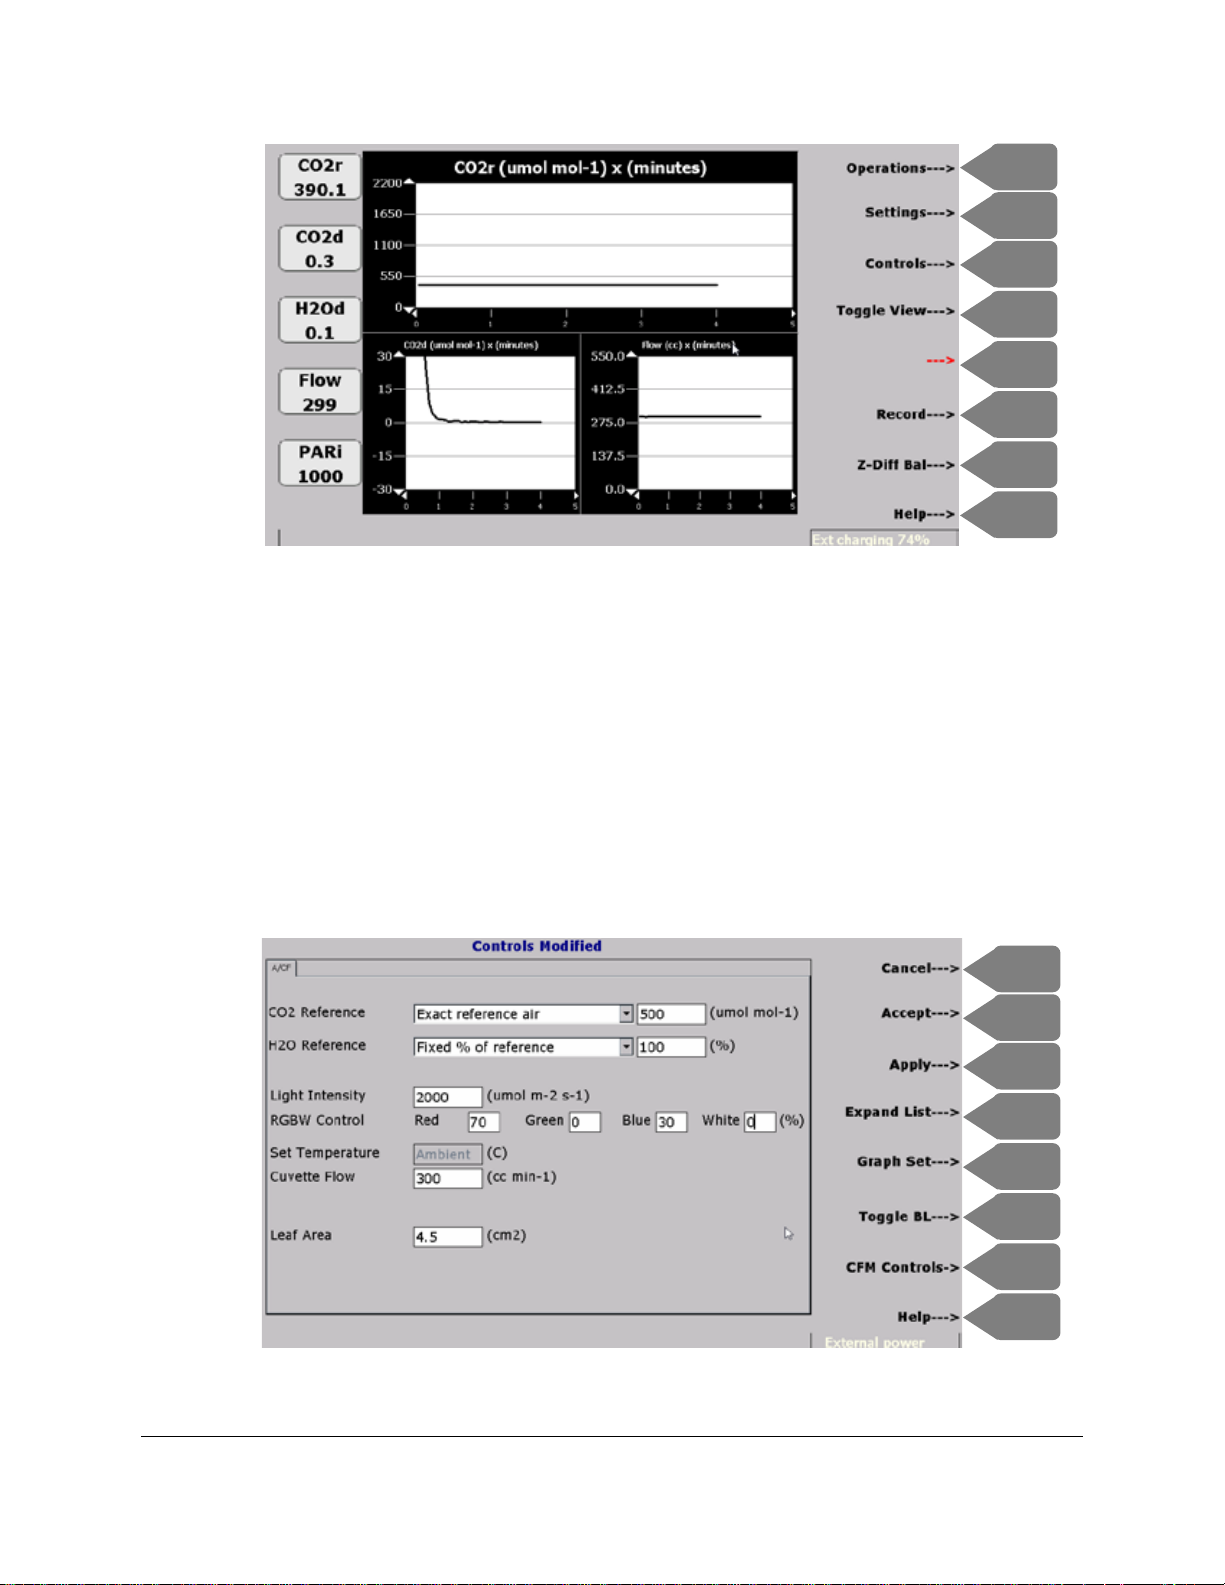
minutes your display should look similar to this one below. Please note that the H2O concentrations and
F1
F3
F2
F4
F6
F5
F7
F8
temperatures will be based on your local conditions.
Please observe the following:
• CO2r, CO2a, H2Or and H2Oa are stable
• CO2d and H2Od should be at or very close to 0 (± 0.5) and stable. If not and at any time perform
a manual Diff Bal (Z-Diff Bal (F7) > Right Arrow to select Diff Bal and then OK)
• Tamb and Tleaf should be the same (± 0.2
o
C)
• The environmental controls (in red) are based on your Settings file
Do not worry about the Photosynthesis Data at this point. These calculated values do not matter at
all because there is no leaf in the chamber so do not be alarmed when you see these values jumping
around. These values can change quite dramatically when there is no leaf present so this is normal.
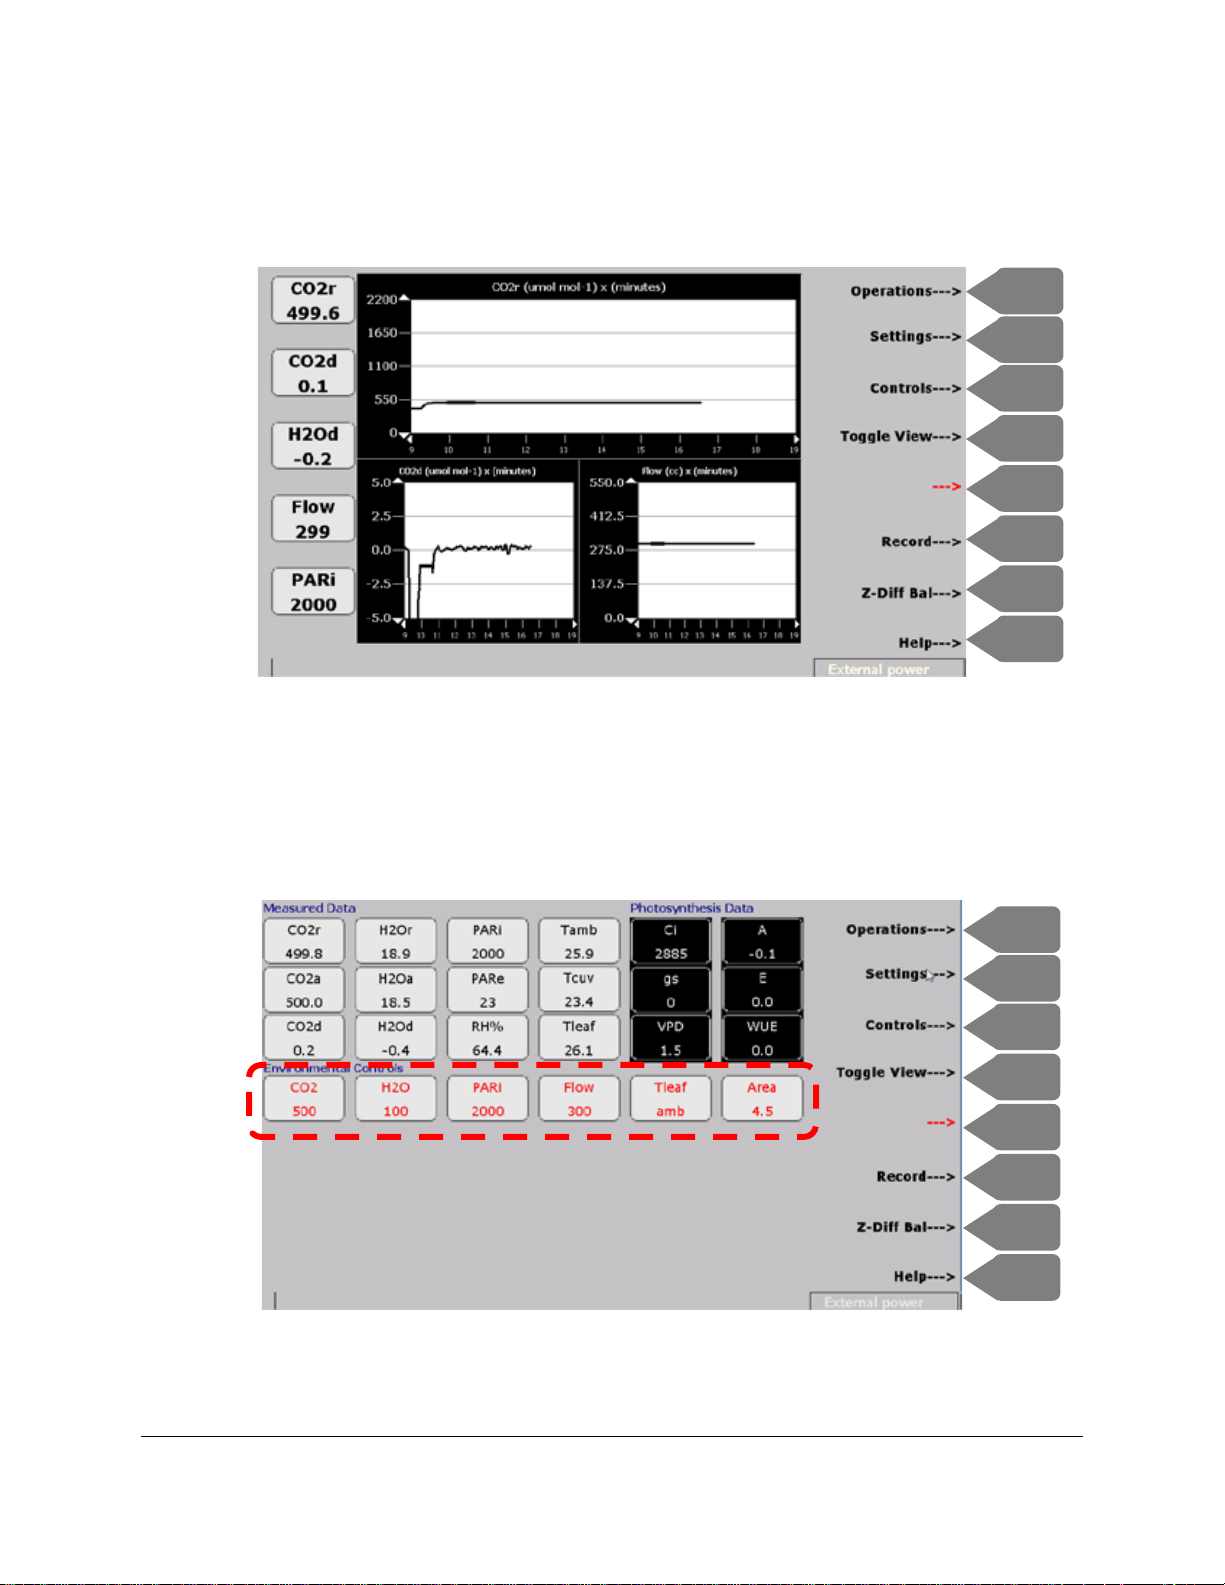
Press Toggle View (F4) to view the graphical display which should look like this below after several
minutes. Note the stability of the CO2r, CO2d and Flow. This display will be based on the settings you
created in Graph Set (F5).
Page 23
F1
F3
F2
F4
F6
F5
F7
F8
F1
F3
F2
F4
F6
F5
F7
F8
If you would like to reset the graph go to Settings (F2) > Graph Set (F5) > Clear (F5). After selection
press OK > Accept (F2) and Accept (F2) again. All plots will reset to time 0. You can also
change/update graph settings in Controls (F3).
Let’s have a look at the environmental controls
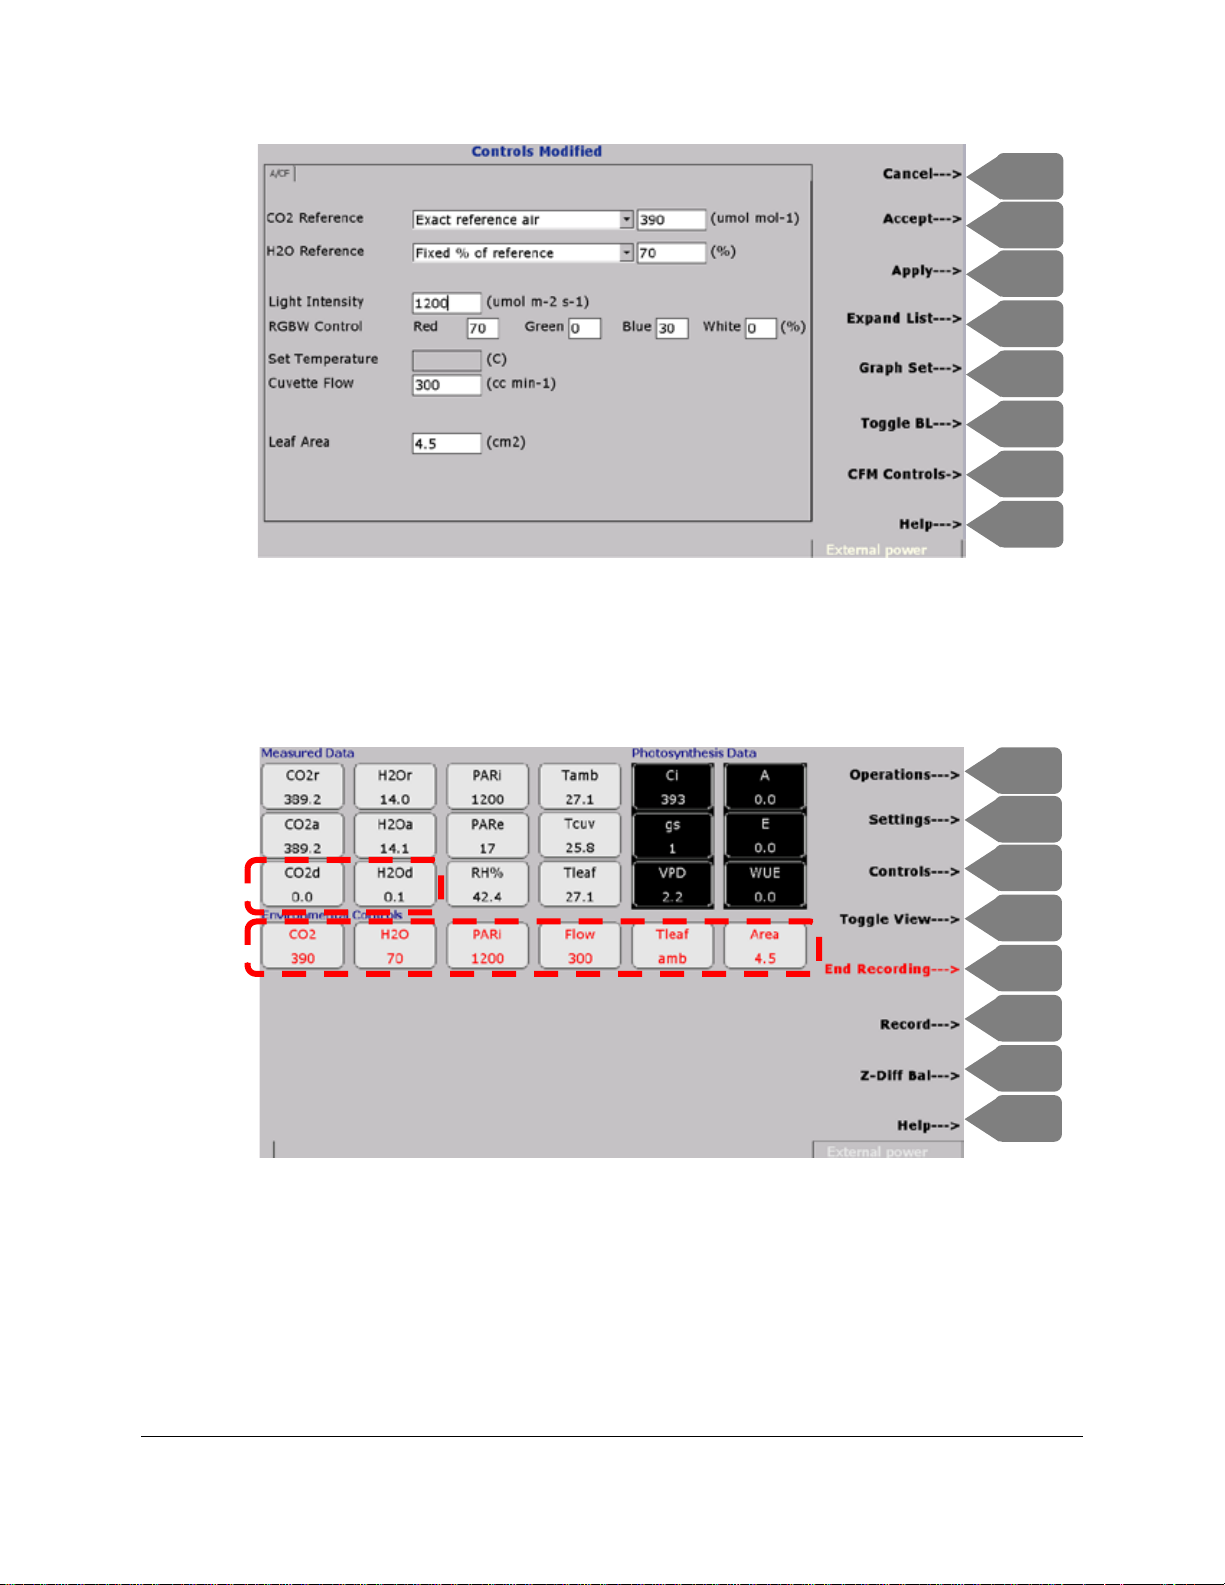
You will be amazed at how easy it is to dynamicall y contr ol all environmental parameters with your
CIRAS-3 system. Press Controls (F3). In addition to controlling the environment you can also set the
flow rate and leaf area from this screen. This is ideal when you want to change any of the values quickly
and easily for rapid measurements without having to go back to Settings. Press the Tab key and tab from
field to field updating the environmental controls as shown below.
Page 24
For simplicity and to save on time we are going to use “Track leaf to ambient” for temperature control
F1
F3
F2
F4
F6
F5
F7
F8
F1
F3
F2
F4
F6
F5
F7
F8
type. Press Accept (F2). Next you should see your new control settings take effect and after about 2-3
minutes the values should stabilize and your graphical display should look similar to the display below.
You should observe the system perform an automatic Diff Bal as the CO2r approaches its target value of
500 followed by very stable results for CO2r and CO2d over several minutes as shown above. If not
perform a manual Diff Bal by pressing Z-Diff Bal (F7) > Right Arrow and then OK. The flow rate should
also be very stable. Press Toggle View (F4) and observe the updated “Environmental Controls” based
on changes in Controls (F3) as shown below.
Let’s try this again making some additional changes to the environmental controls. Press Controls (F3)
and tab from field to field making changes exactly as shown below.
Page 25
F1
F3
F2
F4
F6
F5
F7
F8
F1
F3
F2
F4
F6
F5
F7
F8
When finished press Accept (F2). Again, the system will perform an automatic Diff Bal as the CO2r
approaches its target value of 390. After approximately 2-3 minutes the system should stabilize and as
discussed earlier should look similar to the screen below. Again, note the new Environmental Control
settings and stable CO2d and H2Od readings.
It’s about time we start taking some data on a real plant
Now that we’ve established that everything is working well and you are a bit more comfortable with the
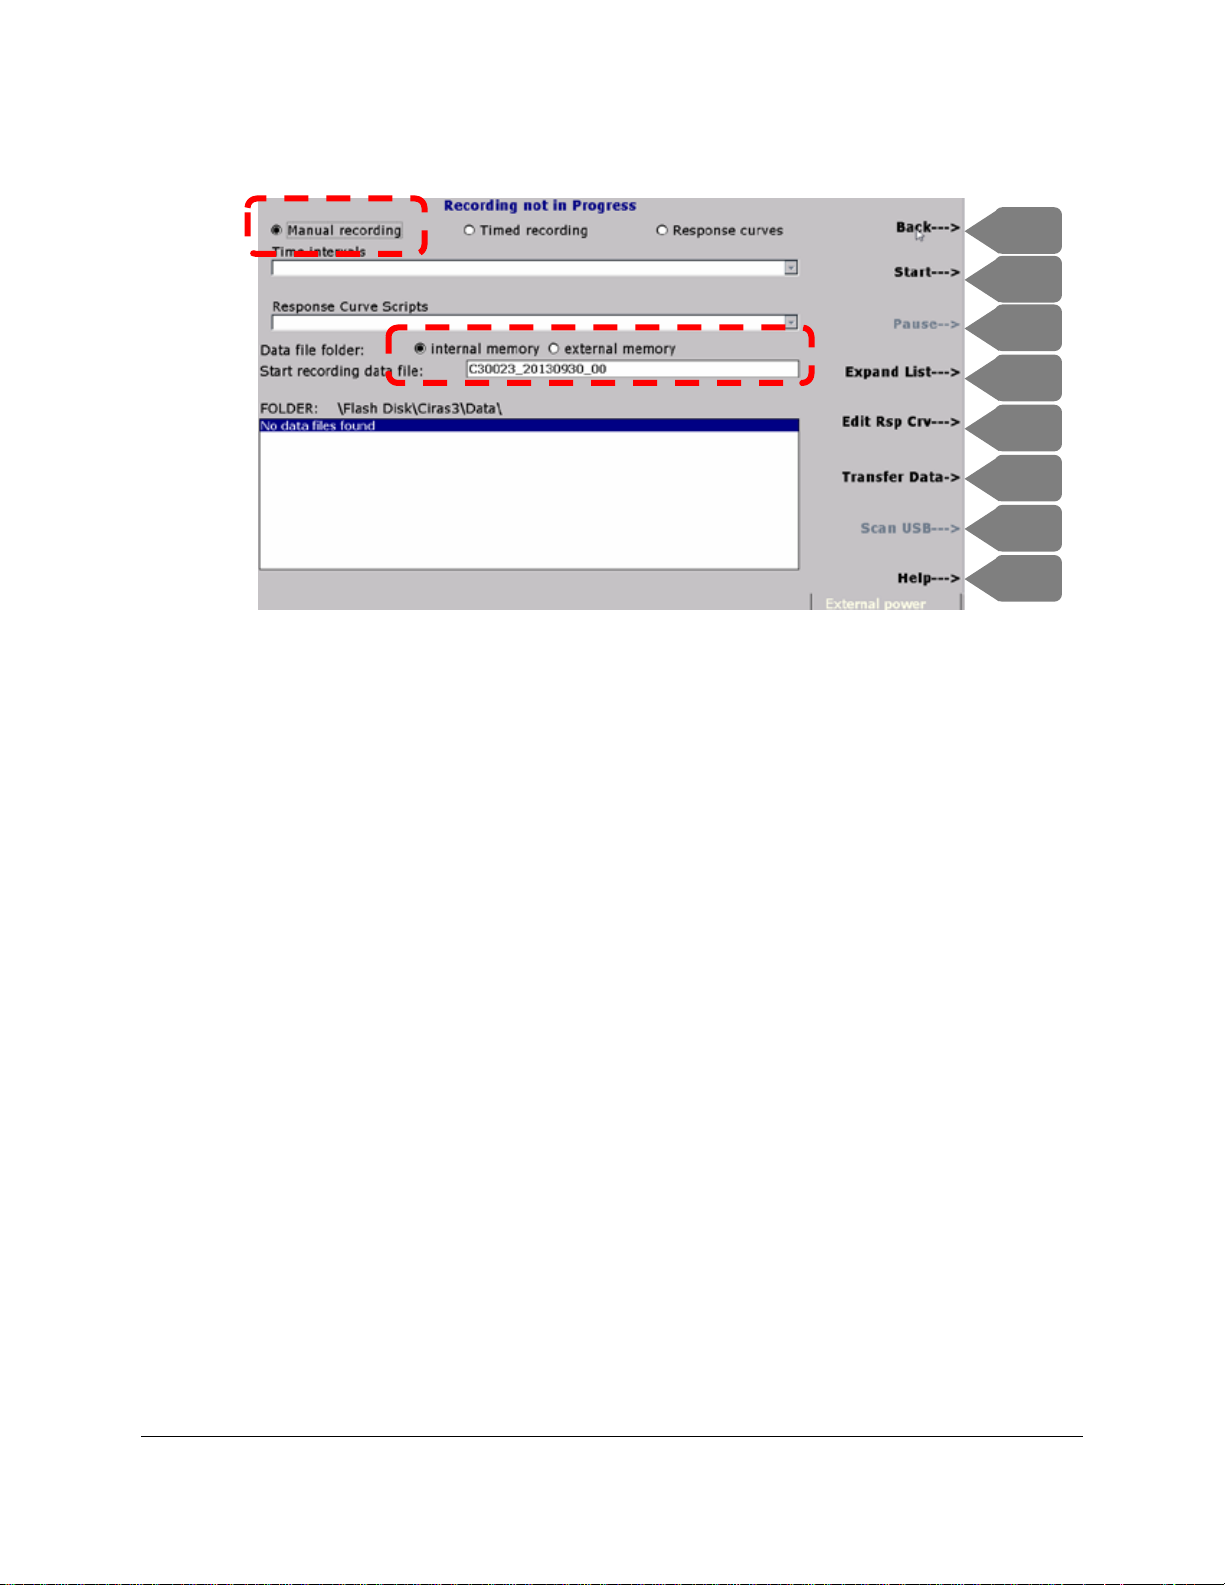
CIRAS-3 it is time to get set up to begin taking measurements on a real plant. Press Operations (F1) >
Rec Options (F2) to create a data file where all readings will be saved to. Data can be recorded
manually (by default), timed or as part of a response curve. For this tutorial we are going to keep things
simple and perform manual measurements with the data saved to internal memory as shown below.
Make sure that you have Manual recording selected and “Data file folder” is set to internal memory.
Page 26
F1
F3
F2
F4
F6
F5
F7
F8
Observe the following:
• Manual recording is selected as indicated by the black highlighted radio button.
• The data file will be saved to internal memory (as indicated by the black highlighted radio button)
and the data file is provided by default. Note that the default data file always starts with
C3XXXX_YYYYMMDD_0 0 w here:
C3XXXX – The serial number of your CIRAS-3 console
YYYYMMDD – Year/Month/Day
00 – All data files start at 00 and count up from there (i.e. 01, 02, 03, etc.) unless changed by the
user.
To begin a recording session press Start (F2) > Back (F1).
Please note that you can change the name of the data file if you prefer to use something different
than the default name.
Page 27
Placing the leaf inside the cuvette
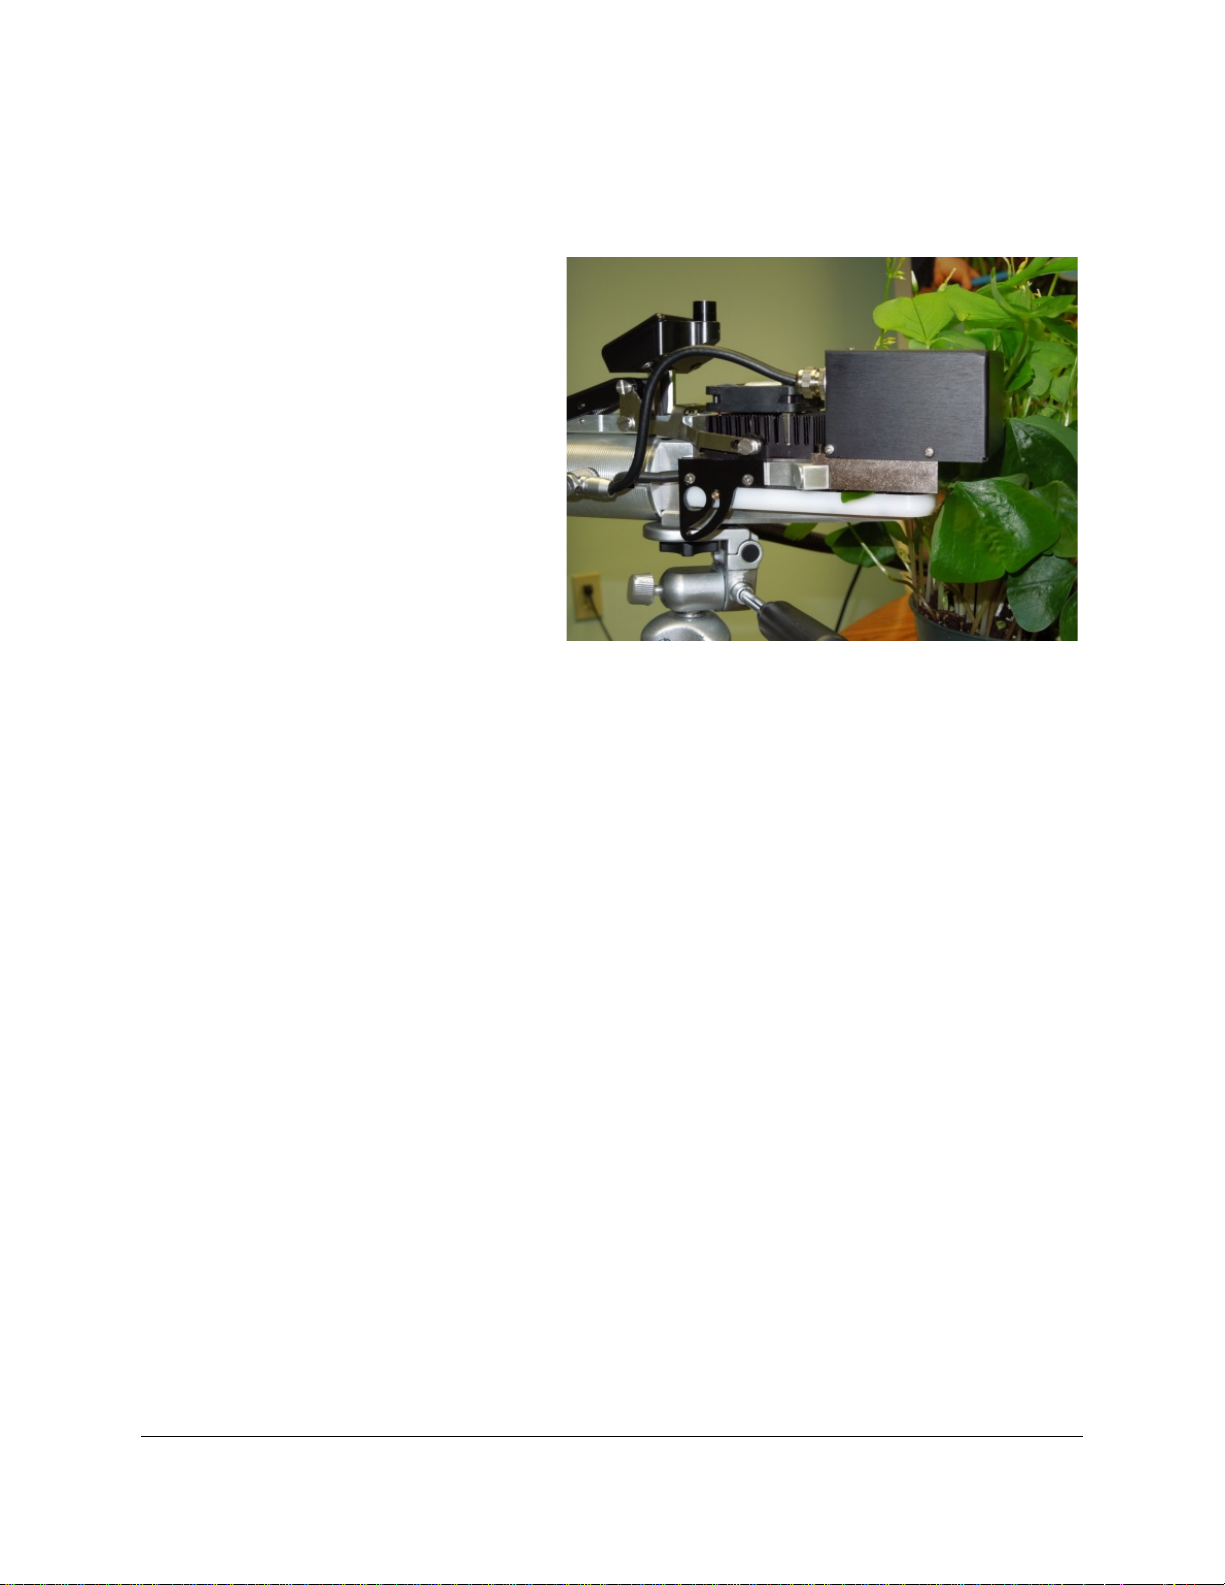
Now would be a good time to get that small
tabletop tripod unless you prefer to hold the
leaf cuvette for upcoming measurements.
You will find a standard tripod thread on the
bottom of the leaf cuvette. Secure the
cuvette to the tripod and open the leaf
cuvette head and carefully place the leaf
inside the cuvette and close the cuvette as
shown here. Don’t be alarmed when you see
the CO2a and H2Oa values change causing
large fluctuations in CO2d and H2Od. This is
to be expected as you are temporarily
sampling ambient air which will likely be higher than your reference air for a brief moment. This will flush
through the system fairly quickly once you close the chamber head.
If possible it is best to fill the entire chamber window with your leaf to eliminate time consuming post-leaf
area analysis and recalculation of results. If the leaf fills the window completely then leaf area is clearly
defined and there will be no need to recalculate data based on leaf area.
What should I be looking for at this point?
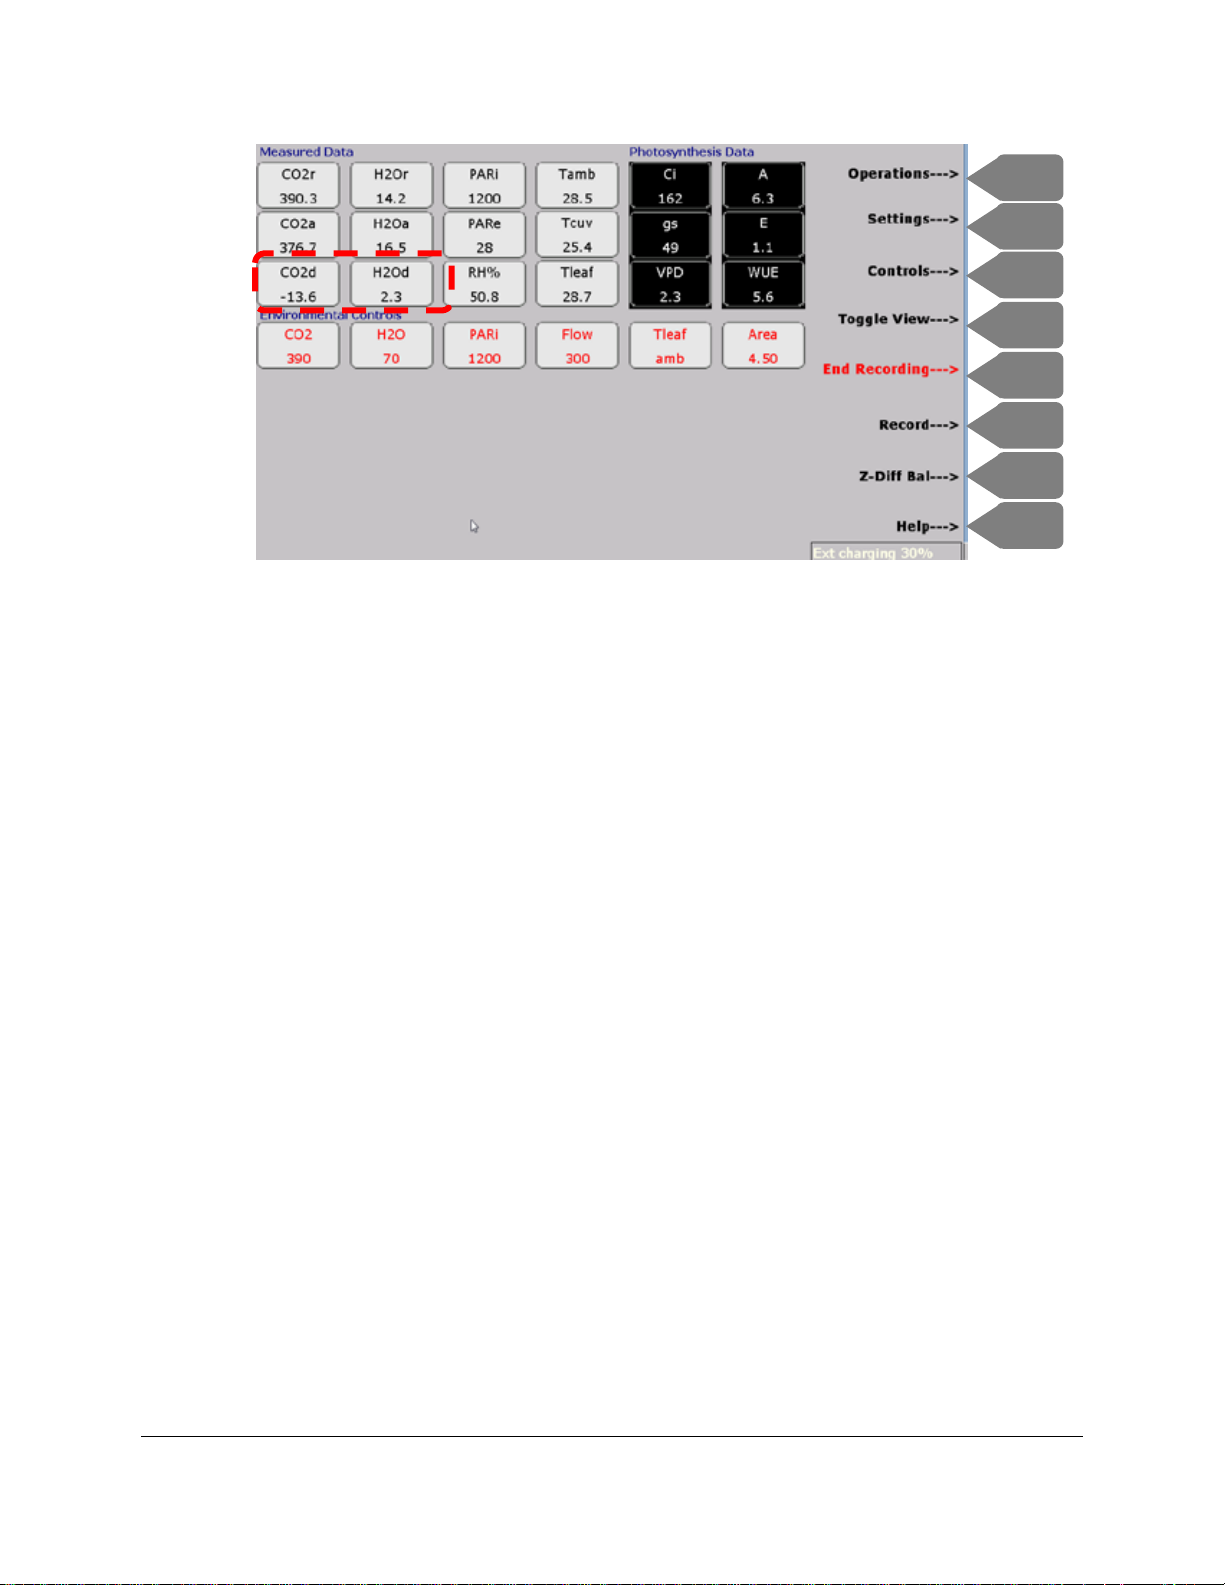
With the leaf cuvette head closed on your leaf you should observe the following after about 5 seconds:
• The CO2a and H2Oa will slowly return to previous levels and the CO2d will slowly approach 0
before going negative indicating CO
• The H2Od value may also change quite dramatically but will also slowly approach 0 before going
positive indicating an increase in H
in stomatal conductance (gs) and evaporation or transpiration (E)
After approximately 45-60 seconds you should start to see the CO2d and H2Od values stabilize indicating
that the leaf has reached equilibrium. At this stage the Photosynthesis Data should also be very stable
as shown below.
uptake resulting in positive Assimilation (A)
2
O due to leaf transpiration which should r es ult in an increase
2
Page 28
F1
F3
F2
F4
F6
F5
F7
F8
Assuming that you are seeing the same thing then now would be a good time to record a measurement.
Press Record (F6) on the CIRAS-3 console or the “R” key on the PLC3 to record data and then proceed
th
to record 5 more measurements on the same leaf. After the 5
record press End Recording F5. In the
example above there was a reasonable amount CO
on a very healthy, well-watered plant you may see higher differentials for both CO
uptake (CO2d) and small H2Od. If you are testing
2
(CO2d) and H2O
2
(H2Od) resulting in higher rates of photosynthesis (A).
How do I know when it is time to record a measurement?
Good question. Generally speaking, the usual rule of thumb is that a healthy leaf reaches equilibrium
when CO
seconds). Normally, this is a good time to record a measurement. The actual equilibration time varies
based on the state of the plant at time of measurement and environmental controls. Having said that,
normal healthy leaves tend to equilibrate and stabilize in approximately 45-60 seconds. In the field and
when working under ambient sunlight conditions it is very important to try and keep the cuvette head in a
steady position throughout the course of measurement to minimize changes in light intensity. Changes in
light intensity will definitely have an impact on photosynthesis. With that being said it is also a good rule
of thumb to maintain the same CO
change to environmental conditions and flow rate will have an effect on the plant’s equilibration and
subsequent results.
differential (CO2d) stabilizes (changing back and forth at same concentration for 5-10
2
and H2O controls and flow rate during each measurement as any
2
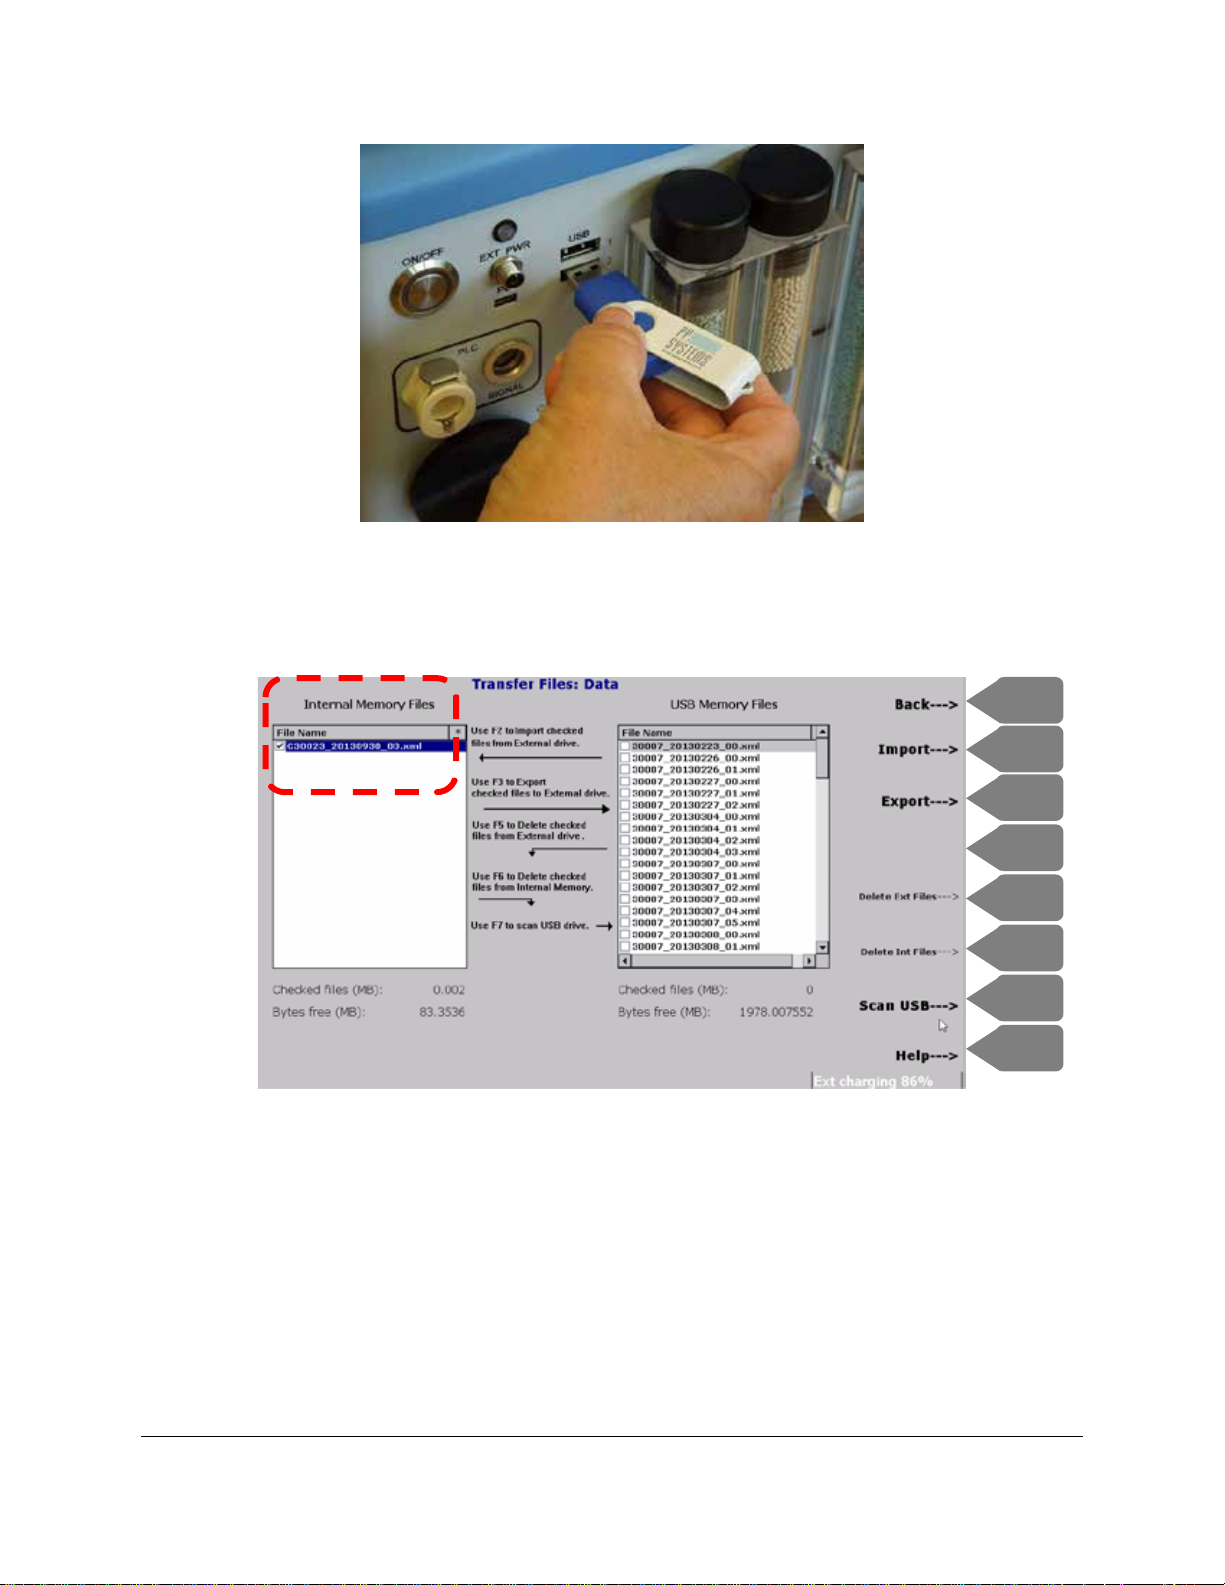
As mentioned earlier the data was saved to internal memory as an .x ml file so that is where we need to
go to retrieve the data. Insert your USB flash drive (supplied by PP Systems) into the USB 2 port as
shown below (actually both USB ports will work just the same).
Page 29
F1
F3
F2
F4
F6
F5
F7
F8
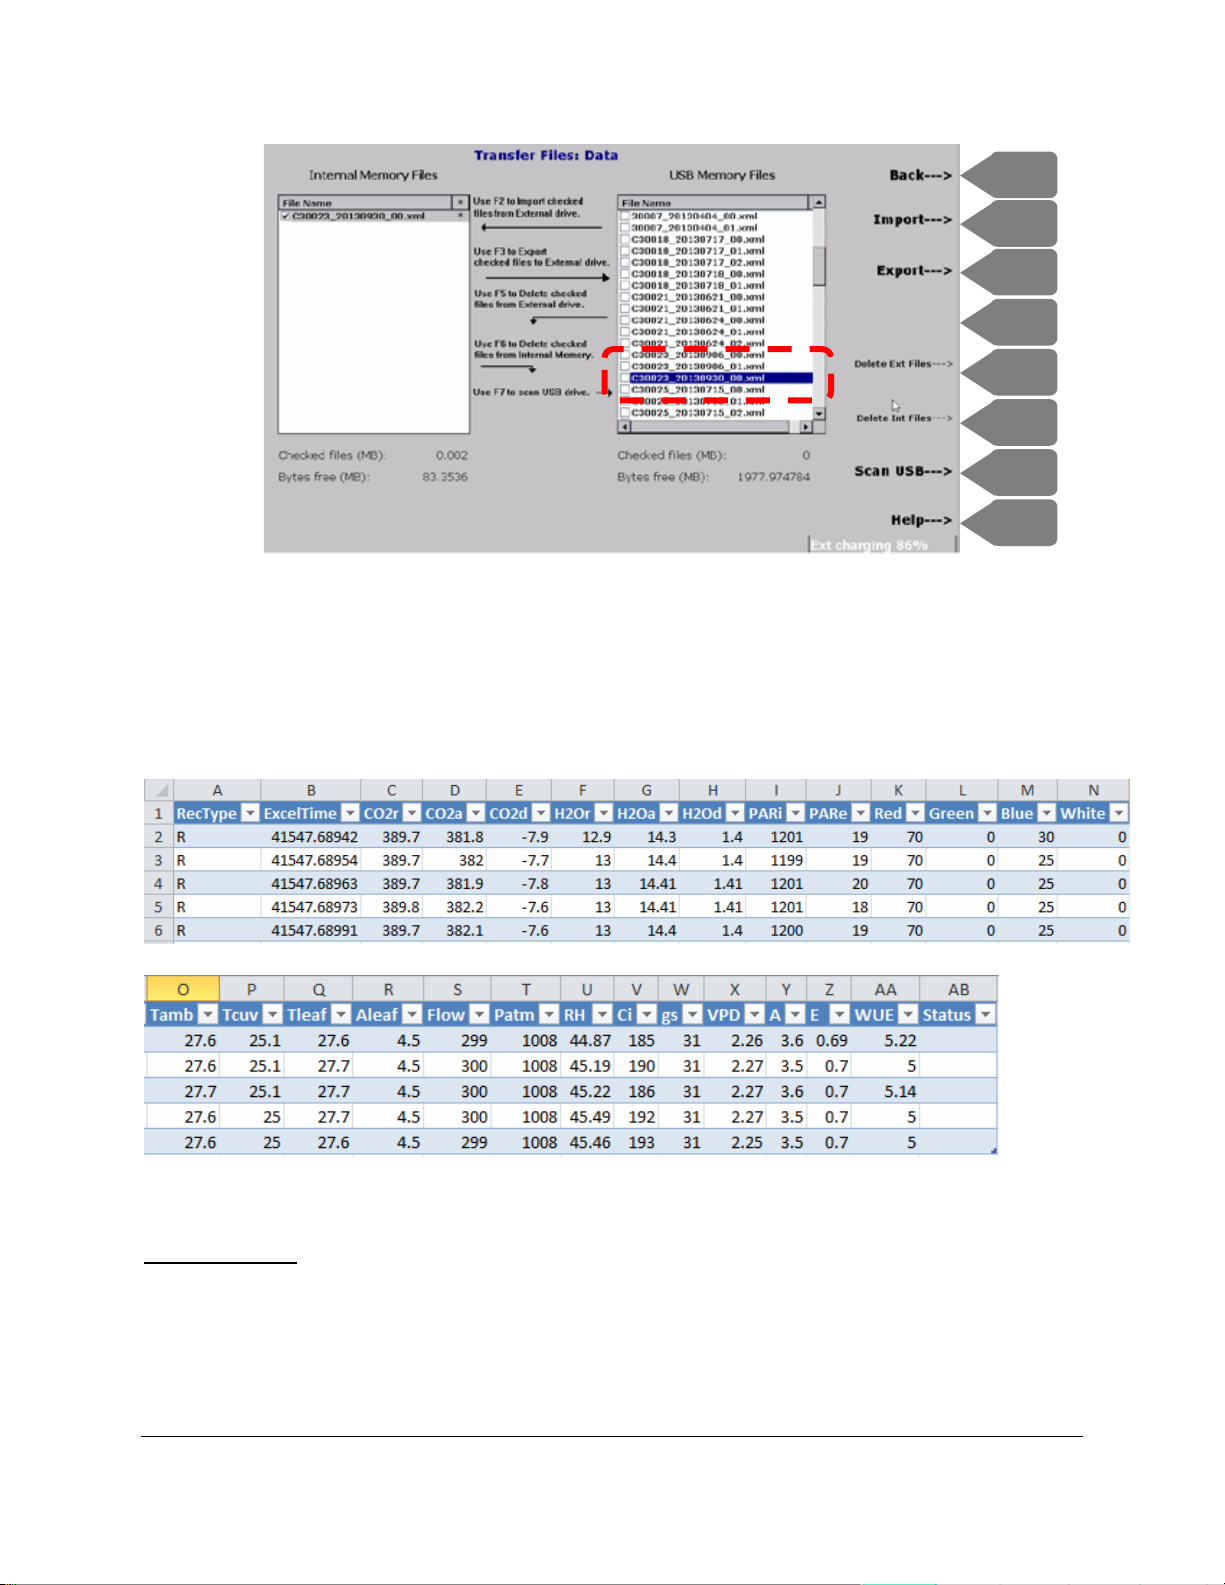
On the CIRAS-3 console press Operations (F1) > Rec Options (F2) > Transfer Data (F6). Under
“Internal Memory” arrow down to your data file and press OK to select the file. Note the check box next to
the file.
Press Export (F3) to transfer the file to your USB Flash Drive. You should now see the data file on your
USB flash drive as shown below.
Page 30
F1
F3
F2
F4
F6
F5
F7
F8
It is now safe to remove the USB flash drive from the CIRAS-3. Most customers like to use Microsoft
®
to import and review data. We will do the same here. Insert your USB flash drive into a USB port
Excel
on your PC. Open Excel and go to File > Open and navigate to the USB flash drive and locate your data
file in the Ciras-3\Data folder. Follow the instructions to open the file in Excel. Once retrieved your data
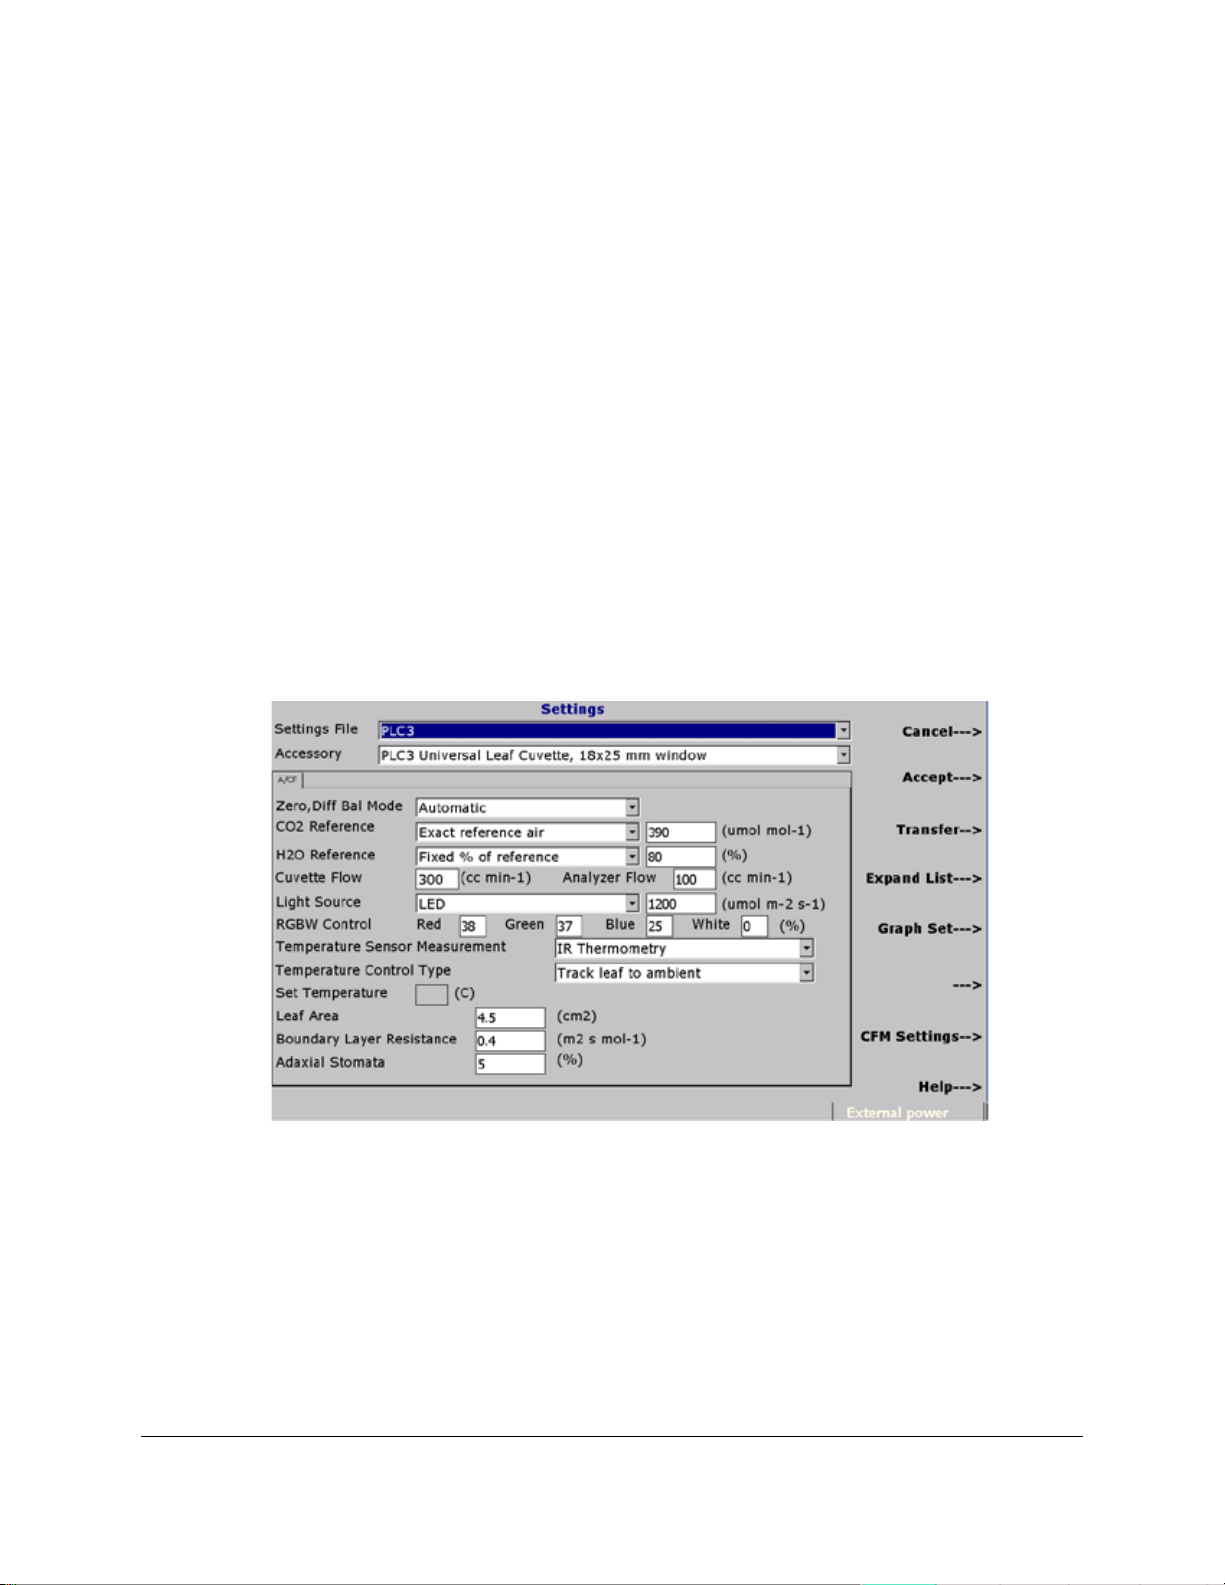
should look similar to the following:
Some variation may apply depending on the Excel software version that you are running.
Congratulations! You have now completed this relatively short tutorial and you should feel much more
comfortable with the overall operation of your CIRAS-3 system. If you have any questions whatsoever
please feel free to get in contact with one of our technical staff for further assistance. Good luck!
Page 31
Quick Start
We highly recommend that you take a few moments to run this simple test to A) familiarize
yourself with the basic CIRAS-3 set-up and operational functions and B) ensure that the system is
performing perfectly before starting any measurement campaign. The tutorial on the previous
pages is also highly recommended before your first measurement campaign.
1. Insert a new CO
the CIRAS-3 main console (this will help to preserve the battery).
2. Connect the PLC3 Leaf Cuvette gas and signal connectors to the CIRAS-3 main console, close
the cuvette (with no leaf present) and press the CIRAS-3 On/Off switch to power up the system
and then Continue (F1).
3. Allow system to warm up for approximately 30 minutes. Press Settings (F2) and make sure that
that your Settings File and Accessory displayed are correct (change if necessary). Assuming that
you are using the PLC3 Universal Leaf Cuvette and PLC3 Universal LED Light Unit, set up as
follows and press Accept (F2):
cartridge, ensure all chemicals are fresh and connect the CIRAS-3 charger to
2
To best simulate sunlight we recommend the following RGBW Control settings:
• Red: 38%
• Green: 37%
• Blue: 25%
• White: 0%
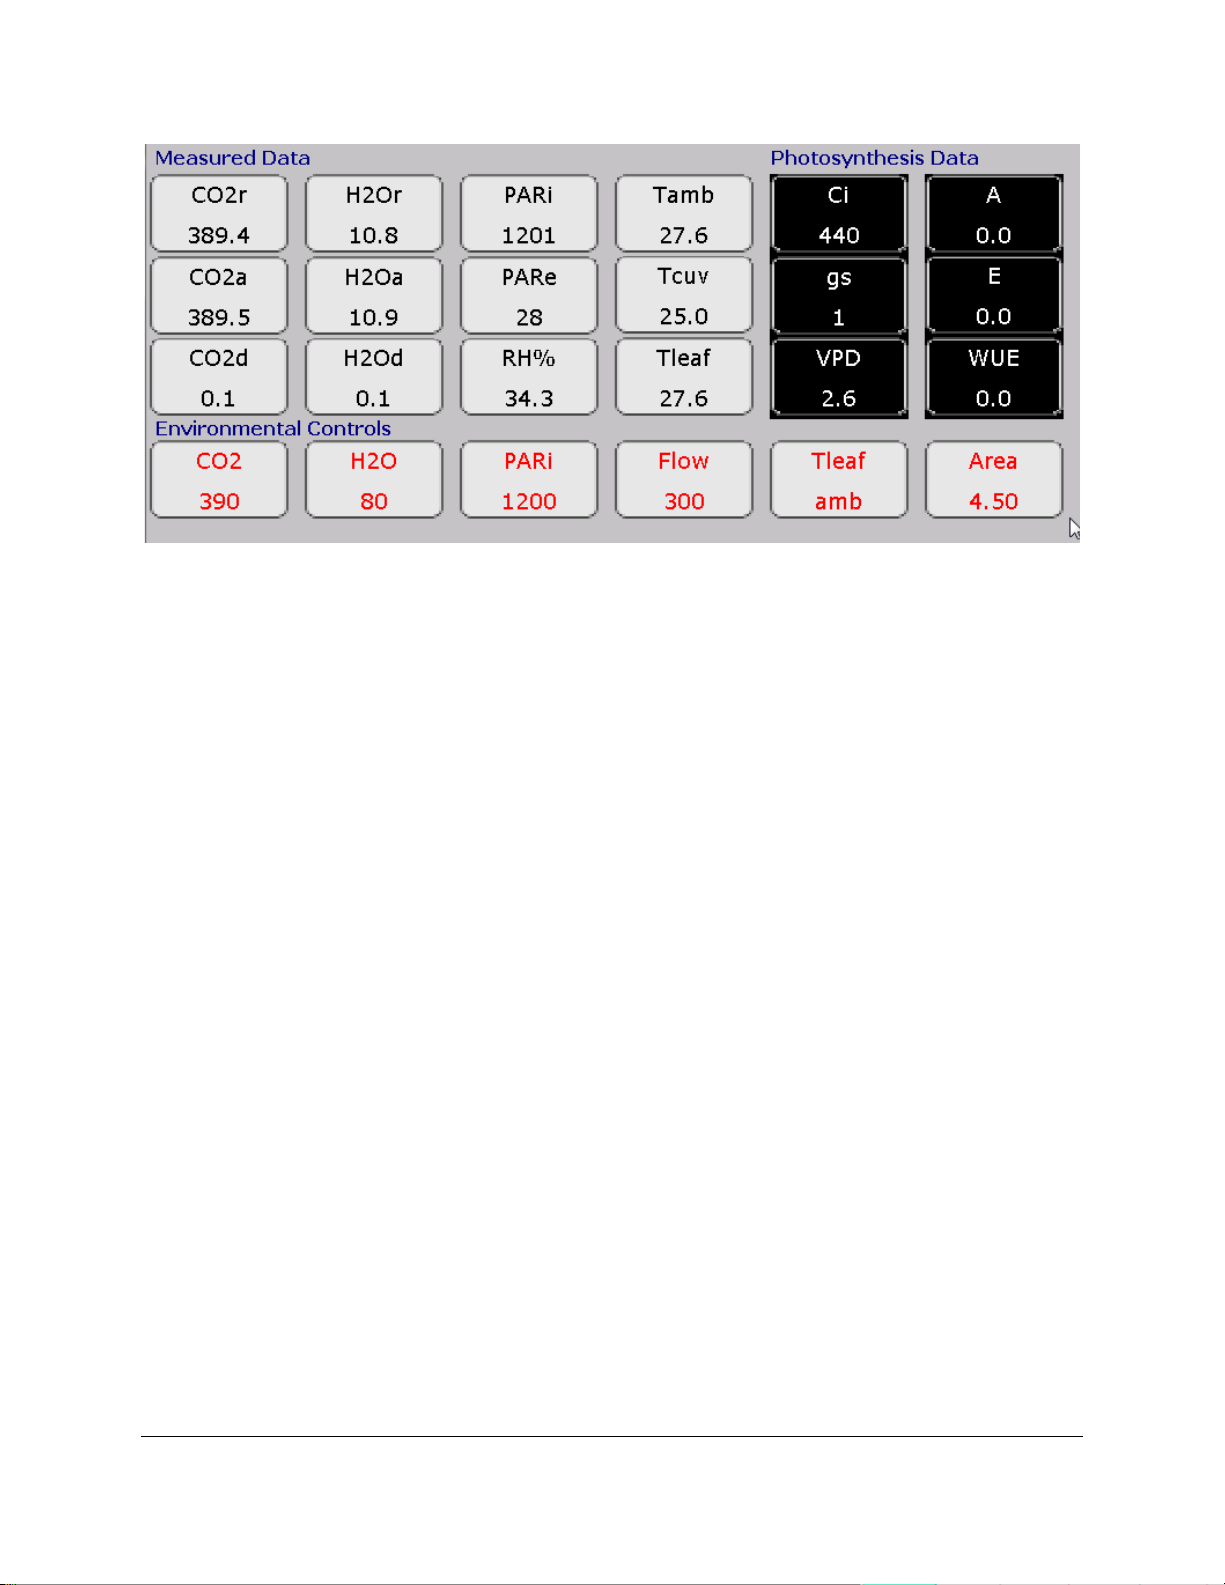
Give your system a couple of minutes to stabilize at the values that were set under Settings (F2). Once
stabilized, your display should look something similar to this.
Page 32
Observe the following:
• All measured data match up well with the environmental controls and they are stable
• The CO2d is close to 0 (± 0.5 ppm) and H2Od is also close to 0 (± 0.5 mb).
• Tamb and Tleaf is reading similarly (± 0.2
o
C)
If everything looks like this y o u should be good to go. Good luck!
Page 33

Section 1. Technical Speci fication
CIRAS-3 Main Console
Analysis Method
Non-dispersive infrared, configured as an absolute absorptiometer with
CO2 Measurement Range
0-10000 µmol mol-1
CO2 Precision
• 0.2 µmol mol-1 at 300 µmol mol-1
CO2 Control Range
0-2000 µmol mol-1
H2O Measurement Range
0-75 mb
H2O Precision
• 0.015 mb at 0 mb
H2O Control Range
0-Dewpoint or 0-100% Ambient
Pressure Range
65-115 kPa
Air Sampling
User adjustable from 50-100 cc min-1 using integral DC pumps. Both
Cuvette Air Supply Unit
0-500 cc min-1 measured and controlled by a mass flow meter.
Auxiliary Port
For connection to external devices (i.e. SRC-1 Soil Respiration
Digital Output
• USB-Mini b (Host)
Data Storage
512 MB flash memory for programming and data storage. Unlimited
Microprocessor Speed
800 MHz
Display
7.0” WSVGA transflective, color LCD
User Input
27 tactile keys
microprocessor control of linearization. Four independent gas
analyzers simultaneously measure absolute CO
reference and analysis gas streams. All measurements corrected for
temperature and pressure.
and H2O for both the
2
(Integral)
• 0.5 µmol mol-1 at 1750 µmol mol-1
• 3.0 µmol mol
• 0.020 mb at 10 mb
• 0.030 mb at 50 mb
analysis and reference pumps fitted with mass flow controllers.
Chamber, CPY-4 Canopy Assimilation Chamber).
-1
at 10000 µmol mol-1
• 2 Ea. USB for use with external devices (Memory stick, USB
Mouse, etc.).
data storage using USB thumb drives (memory sticks).
Page 34

CIRAS-3 Main Console (Continue d)
Power Supply
Two internal, rechargeable 7.2V Li-ion battery pack providing up to 12
Operating Temperature
0-50 oC, non-condensing. In dirty environments, external air filtration
Enclosure
Rugged, ergonomic, lightweight aluminum with polyurethane base.
Dimensions
28 cm (W) x 14.5 cm (D) x 24 cm (H)
Weight
4.3 kg (including 1 battery pack).
PLC3 Leaf Cuvettes
Construction
• Handle - Aluminum
Window
PLC3 Universal – Glass IR interference filter (Calflex)
LCD Display
2 x 16 character LCD for display of user defined parameters
Keypad
Two tactile feel keys for recording and LCD selection
PAR Sensor (Internal)
PLC3 Universal – 2 miniature, silicon photodiode sensors
hours continuous use. Power supply/charger included. Please note
that the system is capable of being powered by one battery pack for up
to 6 hours continuous use.
Range
may be required.
4.5 kg (including 2 battery packs)
• Leaf Gasket - Closed cell foam
• Impeller – Aluminum fan blade
• 25 mm x 7 mm (1.75 cm2)
• 18 mm diameter (2.5 cm
• 25 x 18 mm (4.5 cm
2
)
2
)
PLC3 Narrow – Glass IR interference filter (Calflex)
PLC3 Conifer – Scratch resistant glass
PLC3 Narrow and Conifer – 1 miniature, silicon photodiode sensor
• Response: 400-700 nm
• Range – 0-3000 µmol m
• Precision – 10 µmol m
-2 s-1
-2 s-1
Page 35

PLC3 Leaf Cuvettes (Continued)
PAR Sensor (External)
Filtered, silicon cell (cosine corrected)
Air Temperature Sensor
• Range: -10 oC to 50 oC
Temperature Control
Approximately 10 oC below ambient to +15 oC above ambient.
Leaf Temperature Sensor
PLC3 Universal – Radiation sensor for non-contact measurement
Dimensions (General)
32 cm (L) x 3.8 cm (Handle diameter)
Weight
PLC3 Universal – 0.750 kg
CFM-3 Chlorophyll Fluorescence Module
Modulating Beam
625 nm ± 5 nm (Red)
Saturation Light
0-10000 µmol m-2 s-1
Far Red Light
2 x 750 nm LEDs
Detector
PIN Photodiode with > 700 nm filter
Detector Method
Rapid pulse peak tracking
Leaf Area
1.75 cm2, 2.5 cm2 and 4.5 cm2
• PP Systems is a registered trademark of PP Systems, Inc.
• Response: 400-700 nm
• Range – 0-3000 µmol m
• Precision – 10 µmol m
-2 s-1
-2 s-1
• Precision Thermistor
• Accuracy - ± 0.5
o
C at 25 oC
• Temperature control limits – 0 oC to 45 oC
• Accuracy - ± 0.5 oC at 25 oC
PLC3 Narrow and Conifer – Precision thermistor
o
• Accuracy - ± 0.5
C at 25 oC
PLC3 Narrow and Conifer – 1 kg
• PP Systems is continuously updating its products and reserves the right to amend product
specifications without notice.
• All brand names are trademarks of their respective owners.
Page 36
Section 2. What’s new with CIRAS-3?
F1
F3
F2
F4
F6
F5
F7
F8
Much has changed since we introduced the CIRAS-1 Portable Photosynthesis System back in 1992.
What you will find in CIRAS-3 is not only a simple repackaging of existing designs and concepts, but in
many cases a complete rethinking of both the form and function available through CIRAS-3’s hardware
and software. Below you can read a summary of those changes, many of which are based on direct
feedback from our customers. Many more details will emerge throughout this manual.
General Changes to CIRAS-3 Hardware
Main Console
• The CIRAS-3 main console has been significantly redesigned – it is now exceptionally light at 4.5
kg (including 2 battery packs), with new, more compact dimensions of 28 cm (Width) x 15.5 cm
(Depth) x 24 cm (Height) footprint.
• The sealed console has a transflective color display with a practical 30° ergonomic design.
• The console has greater processing speed and larger data storage capability than previously.
• Reference and Analysis gas connections are through a single, integrated connector/port.
• New gas tubing with better absorption characteristics has replaced older tubing associated with
the console and cuvette.
• The CO
• The console handle is adjustable by continuous tension over 180°, eliminating fixed positions that
required both hands to set.
regulator assembly is improved, eliminating the need for the internal “O” ring.
2
Page 37

• The adjustable carrying harness is more comfortable with CIRAS-3, allowing convenient hands -
free operation whether in the field or greenhouse.
• Inside the console the CO
mixer has been completely redesigned, allowing replacement of the
2
dual-pump design with a single diaphragm-type air supply pump.
• CIRAS-3 now has a Li-ion one-battery system (potential field operation time up to 12 hours),
replacing the two NiMH batteries.
PLC3 Series Leaf Cuvettes
The new PLC3 Universal cuvette has several new improvements and features:
• The cuvette is smaller and lighter than its predecessor.
• Mounted to the cuvette is a practical, 2 x 16 character, black & white external LCD allowing you to
view parameters. You can also toggle between displays for additional parameters.
• Manual recording and scrolling through parameters on the external display are accomplished with
two new keys embedded in the cuvette’s open/close lever.
• A new external cosine-corrected PAR sensor (PARe) i s availabl e with al l PLC3 leaf cuvettes.
This is in addition to the 2 silicon photodiode sensors beneath the cuvette window (PLC3
Universal) and 1 silicon photodiode sensor beneath the cuvette window (PLC3 Narrow and
Conifer).
LED Light Unit (RGBW)
Outwardly the LED light unit looks nearly the same as previous versions, but it is clearly much different:
• The light unit inner shroud and outer housing ha ve be en red esig ned to eliminate potential light
leakage from reflecting ambient and external light sources.
• Attachment of the light unit has been improved – now the light unit mounts to the cuvette slides.
• The PLC3 Universal has an enhanced upper light intensity range up to 0-2500 µmol m
-2 s-1
allowing replication of extreme light environments, such as high elevation and desert. Maximum
light intensity will be slightly different with the PLC3 Conifer and Narrow Leaf Cuvettes depending
on selection of LEDs at the high range.
• Resolution and stability over the entire range of light intensity has been greatly improved with
newer electronics.
• There are 48 individual LEDs representing RGBW (red-green-blue-white) color distribution for
PLC3 Universal Leaf Cuvette and 96 individual LEDs for the PLC3 Conifer and Narrow Leaf
Cuvettes. Any one of these colors may be set from 0-100% of the light source, or mixed to
produce light of a specific spectral distribution.
Page 38

CFM-3 Chlorophyll Fluorescence Module (For use with the PLC3 Universal only)
The chlorophyll fluorescence module (CFM-3) has the following improvements:
• CFM-3 electronics have been streamlined and miniaturized, while keeping the CFM-3 and light
unit in a single multi-functional package, i.e. for combined photosynthesis measurements.
• 10000 µmol m
-2 s-1
maximum saturating pulse intensity
• A flash saturating pulse (Multi-Pulse) was incor pora ted for estimation of apparent Fm’.
Changes to CIRAS-3 Software
The new user-friendly and intuitive software is easy to navigate, involving no programming or complicated
software language. Basically, navigating CIRAS-3 menus is performed by way of clearly labeled function
keys to move between menus and screens, then a TAB key moves you among entry fields, where
selections are entered or selected from dropdown lists. Menu overviews are much improved, categorical
menus are displayed with all options visible. There are clear, menu-driven controls for setup, operation,
recording and data recall. For example, you can make changes to dynamic Controls, e.g. CO
, H2O,
2
light, temperature with as few as three key presses.
Below are several new software highlights:
• Toggle to view either the full suite of numeric Measured, Control and Gas Exchange data or your
choice of 0-5 numeric parameters and as many as 3 line graphs or scatter plots
• Customize the screen to see your preferred combination of information available from the system
and the leaf
• View absolute and differential IRGA values associated with either gas, e.g. CO2r, CO2a, CO2d
• The standard calculated photosynthesis parameters are now A, Ci, E, gs, WUE, VPD
• Data collection – set up Manual, Timed interval, or designed Response Curves with a few key
presses, write/edit your own response curve scripts in simple .xml format
• Data review – on-screen view of numeric records (entire data set) or view graphical time-course
trends and two-variable scatter relationships immediately
• Data transfer – download/upload scripts and data files via USB2 memory devices
Environmental Control
• CO
has simplified control options, approximate concentrations (ideal for response curves), fixed
2
concentrations or ambient operat io n
• H
O has simplified control options, fixed concentrations, constant VPD, ambient operation
2
Page 39

• Temperature control range is ~10 oC below ambient to 15 oC above ambient within the control
o
range of 0-45
• Light intensity has up to a 0-2500 µmol m
C, precision improved to ±0.5 oC
-2 s-1
control range with ±3 µmol m-2 s
-1
precision. 0-
100% RGBW LED color distribution
• Cuvette flow rate can be controlled between 150-500 cc min
-1
with ±1 cc min
-1
precision
CFM-3 Chlorophyll Fluorescence Module
• You now have the option to run and record complete fluorescence measurement sequences on
their own (with or without combining pho tosynthesis measurements )
• Calculated fluorescence parameters, representing both lake and puddle models of PSII reaction
centers, e.g. ΦPSII NPQ-K (Kramer), ФNPQ-G (Genty)
Accessories
SRC-1/SRC-2 Soil Respiration Chamber– soil collar volume/area input is a new Settings input, display
and graph ∆CO2, FCO2, evaporation, Tsoil
CPY-4/CPY-5 Canop y Assimilation Chamber– collar volume/area input is a new Settings input, display
and graph ∆CO2, canopy Assimilation/Respiration, transpiration rate, Tchamber, PAR
Page 40
Section 3. Summary o f System Design
Overview and Theory
CIRAS-3 is designed to function as a self-contained open-system gas analyzer, manufactured and
calibrated for high-precision detection of CO
and H2O gasses. CIRAS stands for Combined Infra-Red
2
Analysis System. Its open-path design allows for continuous, unattended air sampling, as the pumps
introduce fresh sample gas to the essential components, the IRGAs. CIRAS-3, like previous generations
of CIRAS, has four non-dispersive IRGAs (Infra-red Gas Analyzers) – CO
Reference, H
O Analysis, a true differential analyzer.
2
The IRGAs form the core of gas analysis systems that measure CO
photosynthesis system, eddy covariance, soil CO
efflux, etc.). Non-dispersive infra-red (NDIR) refers to
2
Reference, CO2 Analysis, H2O
2
and water vapor (i.e. portable
2
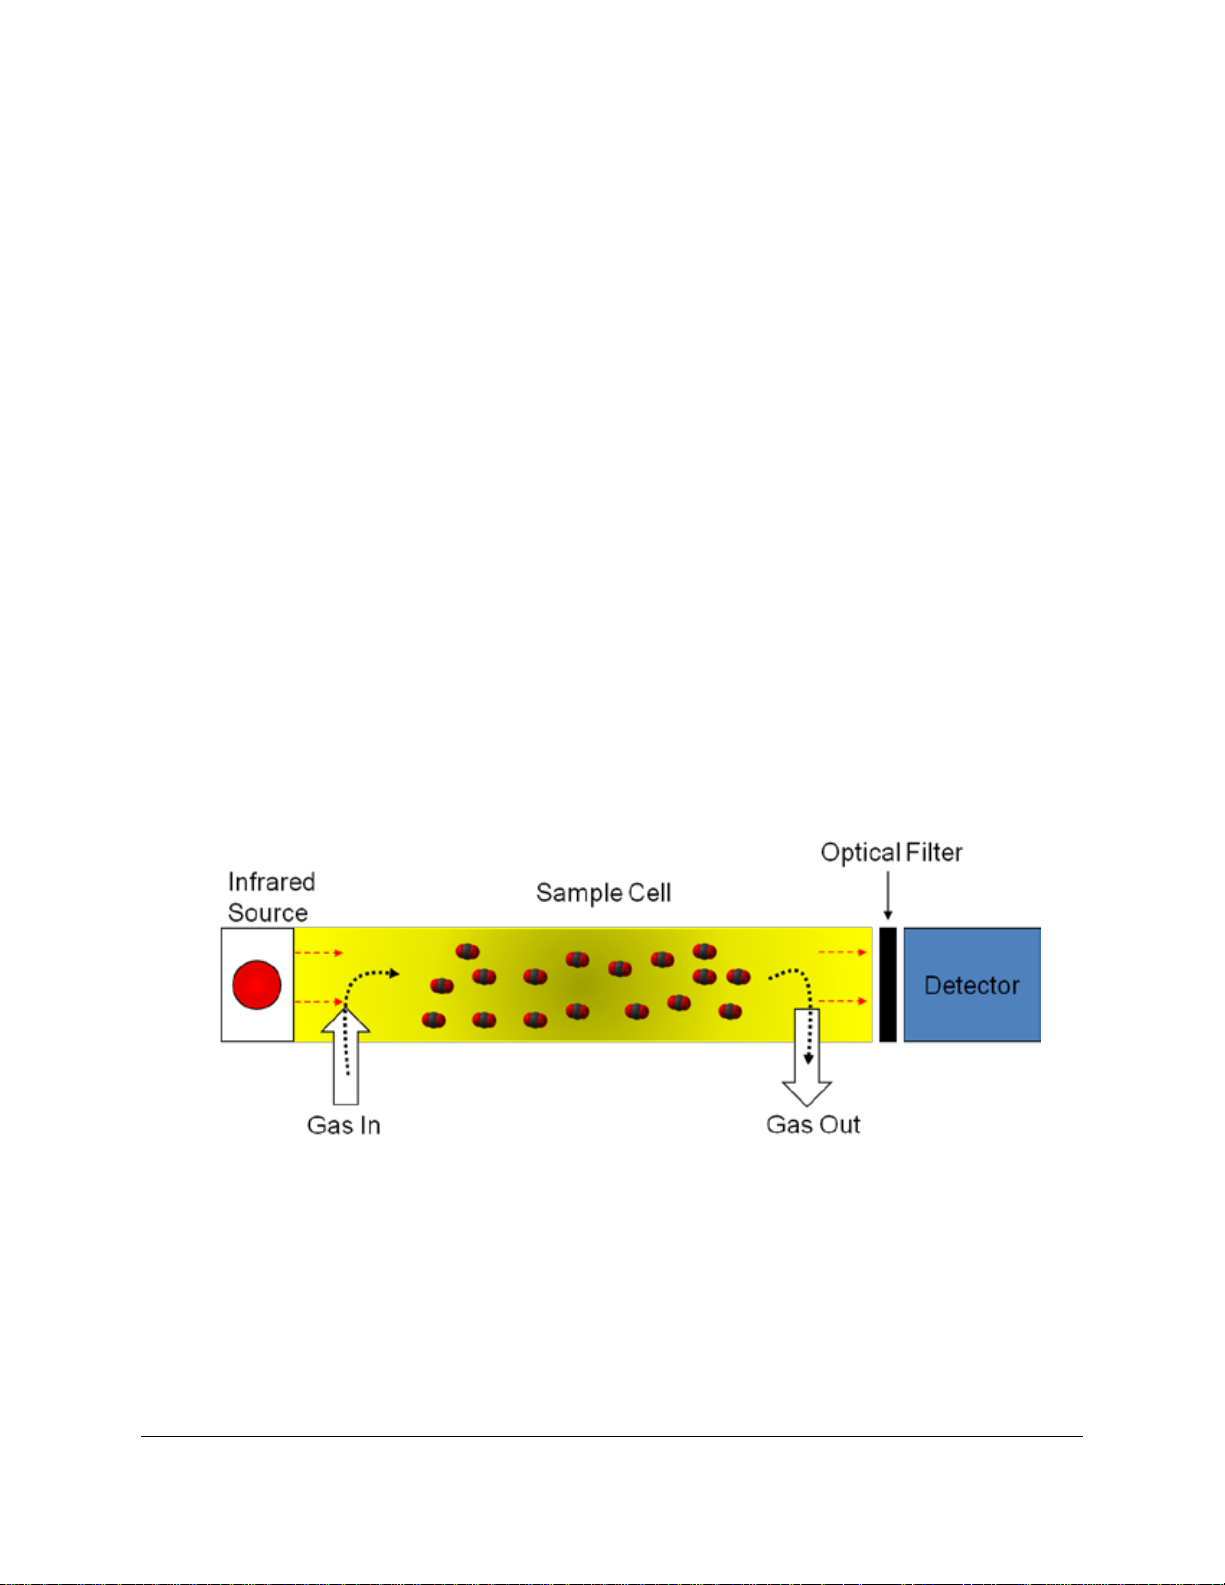
the transmission of broad-band infra-red wavelengths from the IRGAs source lamps. A single IRGA
consists of four basic components:
• Infra-red source
• Sample cell of known path length and volume
• Optical interference filter
• Infra-red detector
The theory itself is quite simple – light from mid-infra-red wavelengths is produced by the source and
pulsed through a gold plated cell. The interference filter narrows the bandwidth of the IR source received
by the detector to the signature wavelength absorbed by the target gas molecule, e.g. CO
O cells each employ a unique optical filter. As the sample gas fills the cell, it absorbs IR, and the
H
2
. The CO2 and
2
reduction in IR source strength is measured instantaneously by the detector. The higher the target gas
concentration, the lower the infra-red signal received at the detector, as defined by the Lambert-Beer Law
of Attenuation.
Page 41
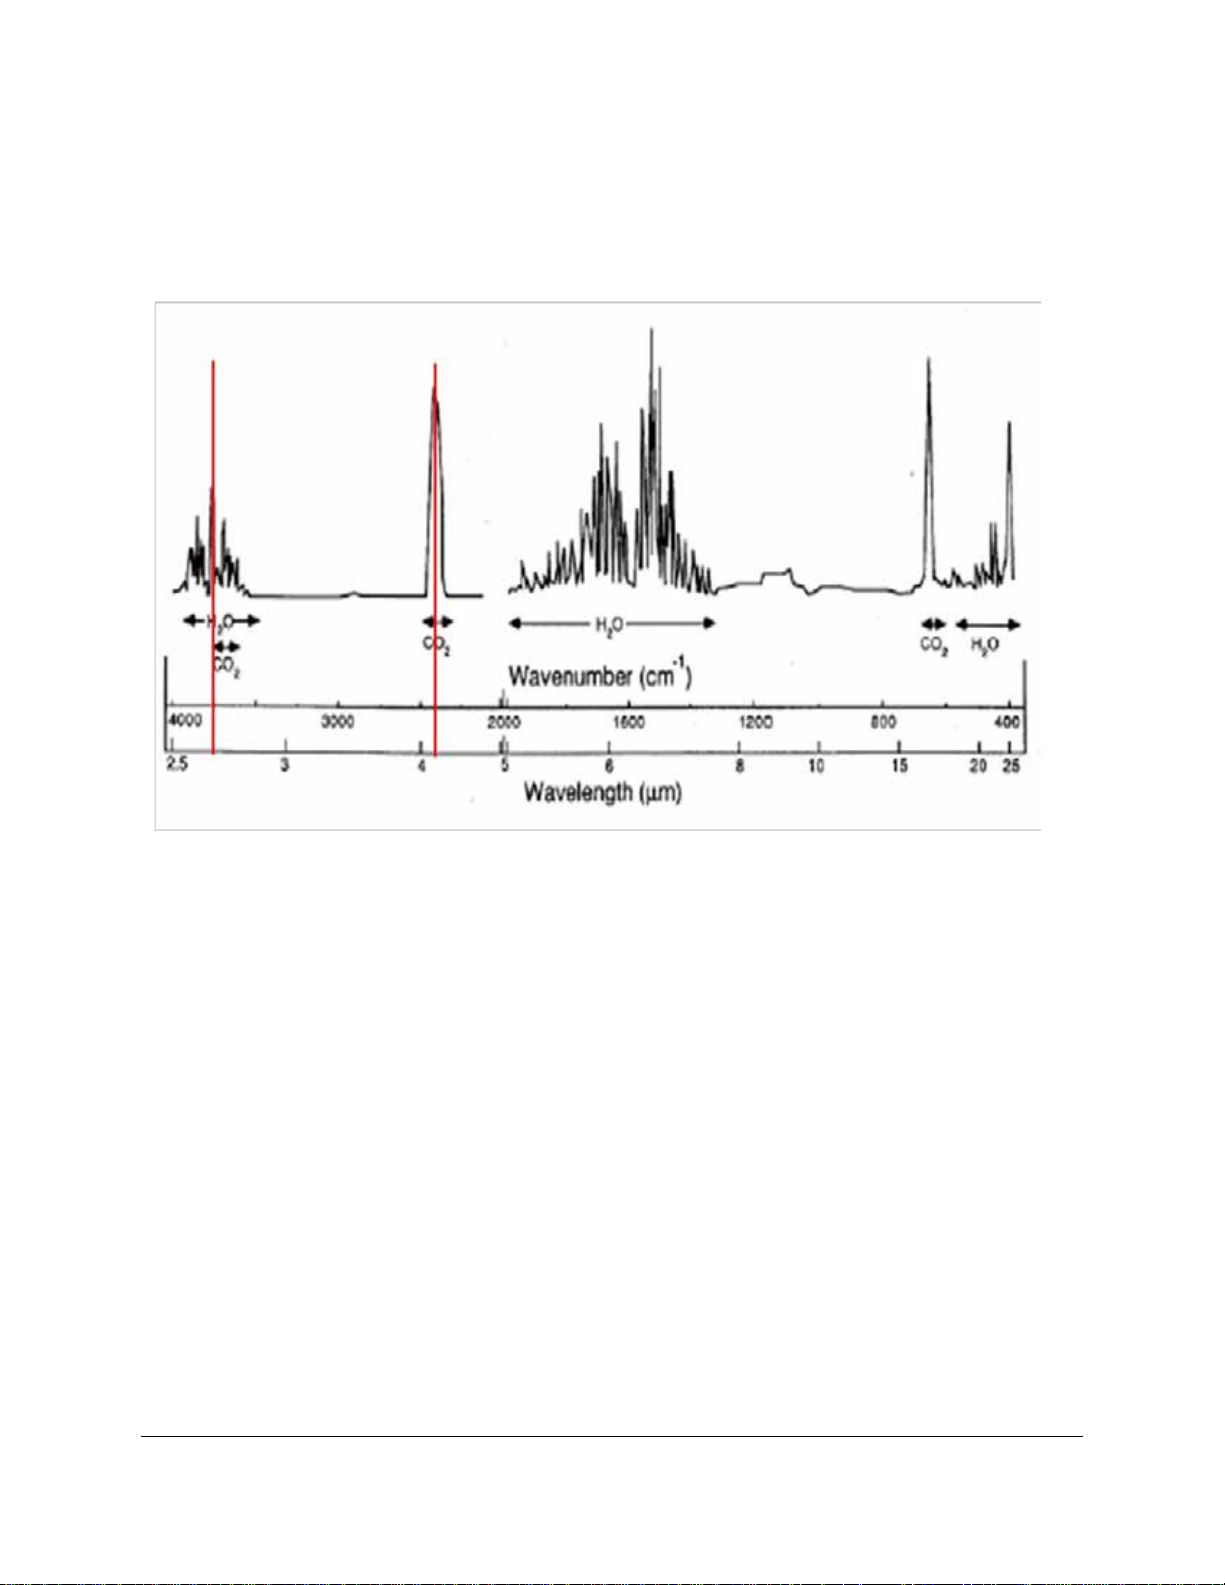
Both H2O and CO2 molecules have diverse absorption spectra, so we use two prominent absorption
peaks, seen below at 2.6 and 4.26 µm, respectively. CIRAS-3’s electronics could be considered the fifth
component, which processes raw analog-to-digital (A/D) information from the IRGAs detectors, accurately
translating this information into gas concentrations.
The gas sample is of course a mixture of gas molecules, and this can present problems in terms of
accurate detection of concentrations of a specific gas, such carbon dioxide. This effect, foreign gas
broadening (FGB), must be corrected to ensure accurate measurement of gas concentrations. With FGB,
the CO
This effect is about 0.1 µmol mol
in infra-red absorption, which is detected as an apparent increase in [CO
gas in the IRGA cell is somewhat diluted by the increased air volume induced by water vapor.
2
-1
CO2 mb-1 H2O. The presence of water vapor also causes an increase
]. This is of a similar magnitude,
2
but opposite to the dilution effect, and CIRAS-3 automatically corrects these FGB effects.
CIRAS-3’s IRGAs are quite stable owing to their construction, calibration and thermal environment, but
various circumstances can cause apparent changes over time. Some changes may require recalibration,
although one of the strengths of CIRAS-3 is that recalibration is not a routine (annual) maintenance task.
-1
The factory calibration ranges of 0-2000 µmol mol
CO2 and 0-75 mb water vapor are ideally suited for
most typical applications.
Factory linearization of the IRGA cells is standard, but slight differences between IRGAs are inherent due
to the uniqueness of optical filters and reflection characteristics of the cells - this is common to all
differential analyzers. Still, the Reference and Analysis cells should be made to match a standard such
as Zero air, and CIRAS-3’s Auto Zero function corrects for nearly all changes that result in calibration
Page 42

drifts. Auto Zero minimizes effects on span (gas sensitivity), of sample cell contamination, lamp ageing,
changes in detector sensitivity, amplifier gains and reference voltages. Measurements are ratioed to the
Zero reading before IR absorbance is determined. From the relationship between absorbance and
concentration determined in the factory for each instrument, and the current calibration factor, the sample
concentration is determined.
We overcome short-term drifts by use of a second mode, called Differential Balancing or Diff Bal. Using
Diff Bal temporarily diverts only Reference air through all cells (Reference and Analysis). If existing
offsets are detected between the Reference and Analysis cells while measuring the same Reference gas
sample, appropriate correction factors are calculated to equalize the readings of each cell pair. This way,
you can have confidence that a reported differential between the Reference and Analysis cell pair is real
and not artificial.
An overview of the gas circuit design of CIRAS-3 configured for leaf-level photosynthesis is shown in the
schematic on the following page. Sample air, denoted as AIR IN, entering the console and is first
pumped and its flow rate metered, then directly “conditioned” by passing through CO
absorbent chemicals. At this point CO
can be added to the gas stream in a precise mixture from the CO2
2
and water vapor
2
source cartridge, while existing water vapor can be removed from the gas stream or allowed to remain at
its current partial pressure, measured in mb. One portion of the mixed air (AIR OUT) is then passed
along downstream to be measured at the Reference IRGAs. The other portion is sent to the leaf chamber
before returning to the Analysis IRGAs. REF (Reference) and AN (Analysis) air are drawn into the IRGAs
at precisely controlled flow rates by respective REF and AN pumps. The IRGAs are contained in a
rugged, sealed case and taken together form the thermally-stable optical bench.
Page 43
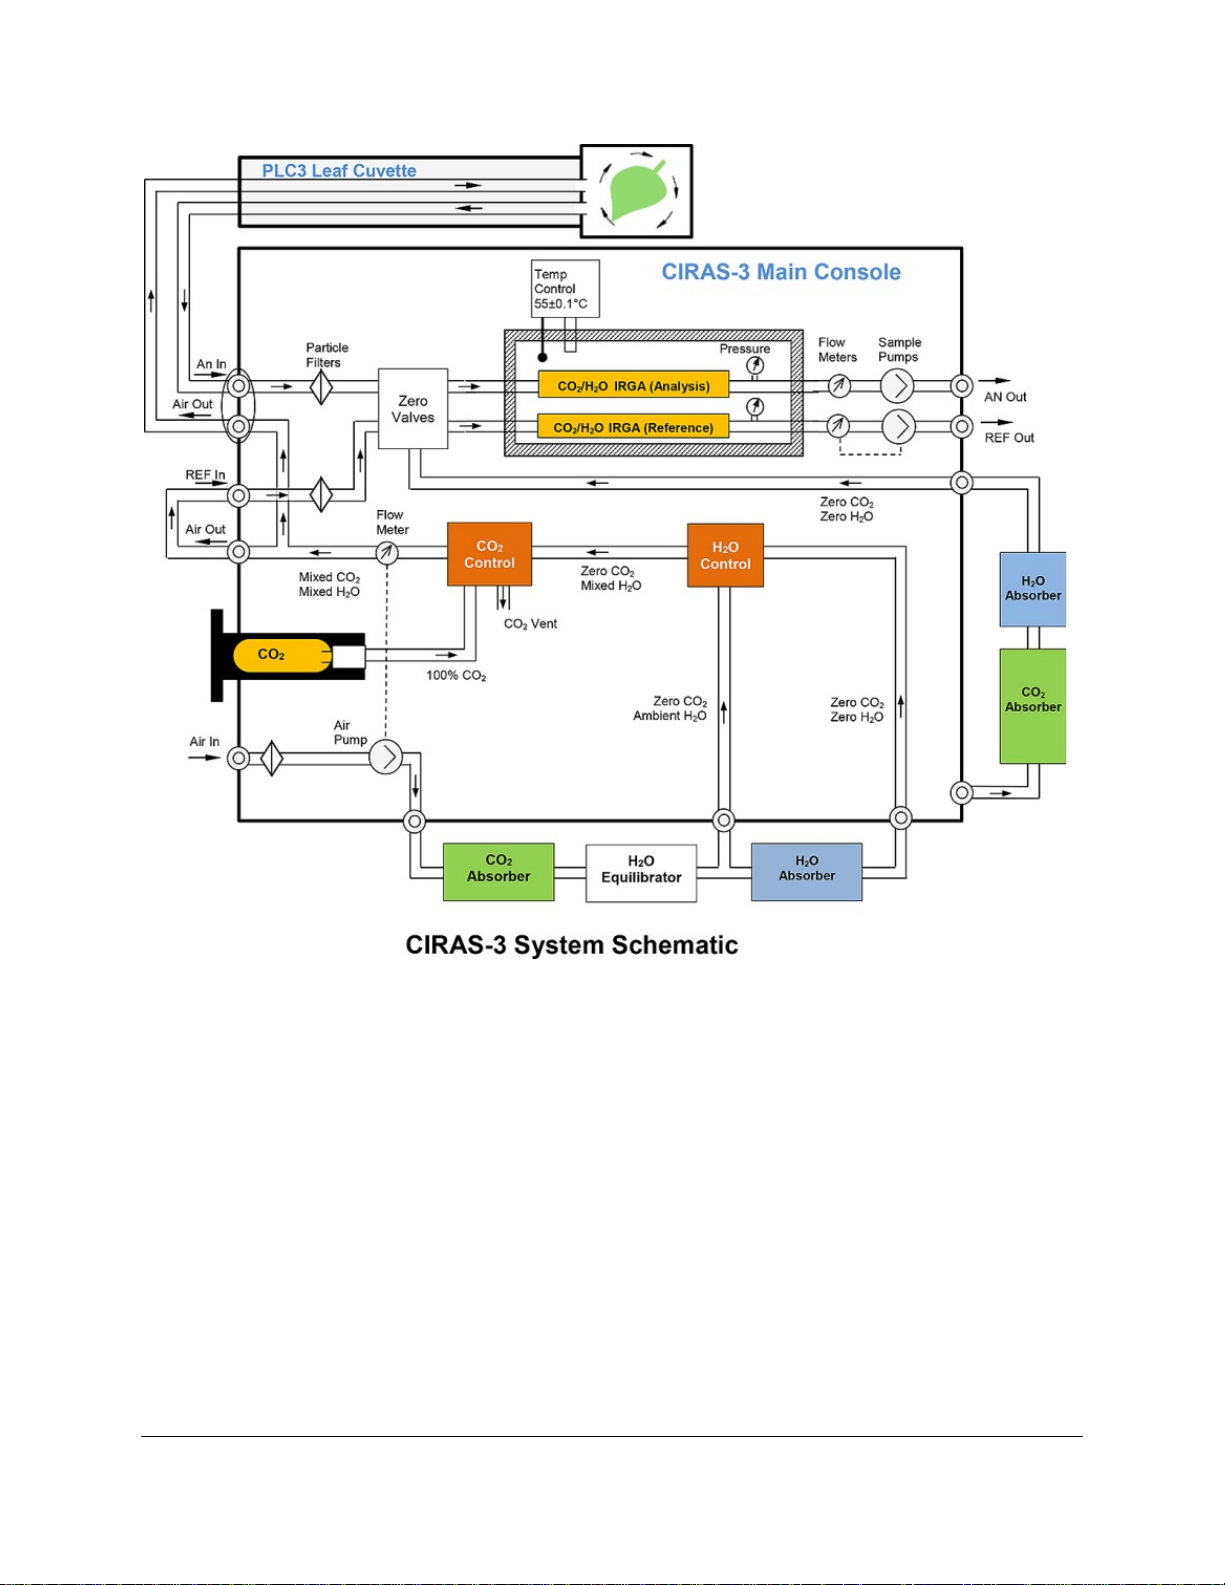
As you can see, the delivery and measurement of the gas depends on a system of three pumps working
together. For the main air supply pump we use a diaphragm type pump, and for the Reference and
Analysis cells we use rotary vane pumps. All pumps are under user control, allowing you to determine
and set an optimal flow rate of air to the cuvette and leaf (air supply pump) as well as the sampling rate
by the IRGAs (reference and analysis pumps). We also ensured that the different path lengths of the
REF and AN gases from source to IRGA are accounted for, and with only a very small delay in response
time, the displayed console REF and AN readings are nearly instantaneous. In addition, Zero valves are
periodically activated for Zero or Diff Bal functions, diverting the gas streams from their normal paths.
Page 44
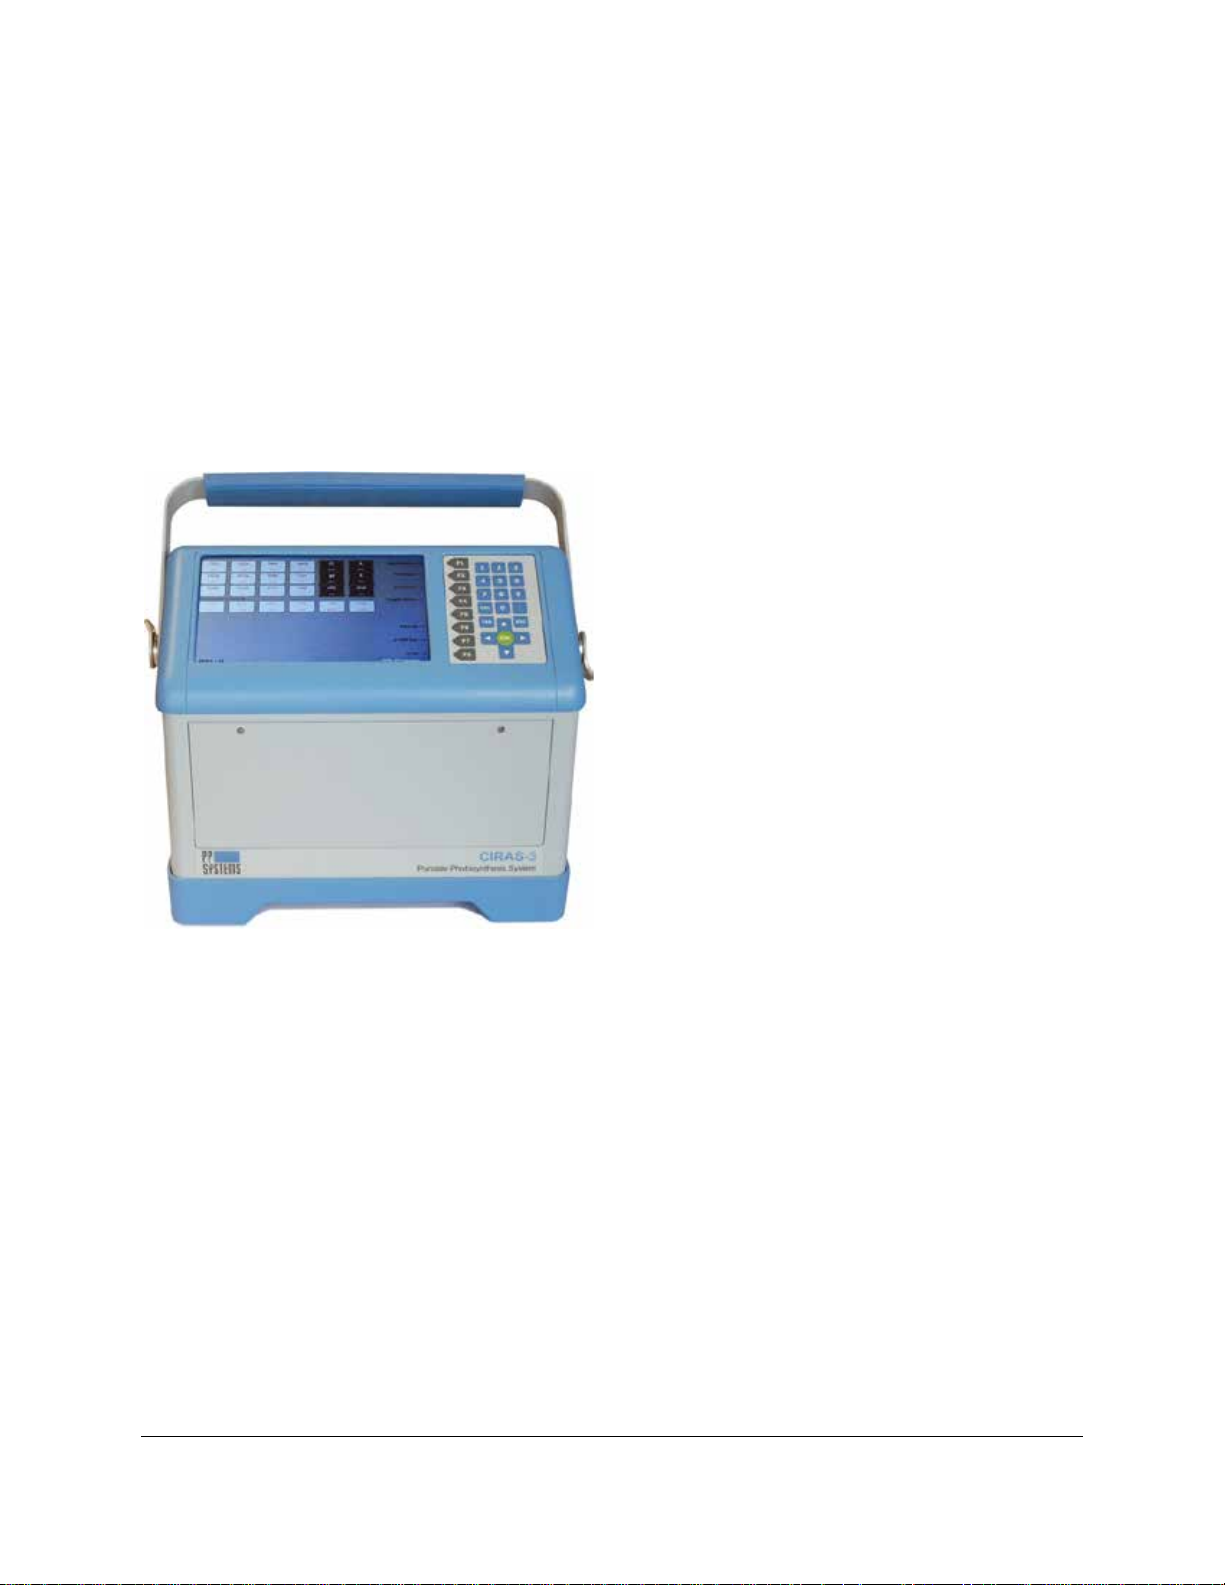
Section 4. System Components and Assembly
A. Large, full color,
internal components.
A
B
C
CIRAS-3 Main Console
The CIRAS-3 console houses the IRGAs, gas circuit including absorber columns with chemicals, gas and
electrical connections, on-board computer, color display and keypad. The console is the base instrument
for several different possible configurations of use. The range of applications includes leaf gas exchange,
chlorophyll fluorescence, canopy assimilation, soil respiration, analyzer platform for custom-built
chambers (both closed- and open-system), and direct measurement of gaseous CO
transflective LCD
On the front side of the console you find the user interface with its 30° display and keypad group used to
navigate the CIRAS-3 console menus. Access to the Li-ion battery pack(s) and internal mechanical and
optimized for field use
.
B. Tactile feel keypad and
function keys for
navigation
C. Battery compartment
and main access to
and H2O.
2
electrical components is achieved by loosening the two captive screws (turn counter-clockwise to release)
and gently lowering the door.
System Power
Power Supply Adapter
An AC power supply adapter (120/240 VAC / 50/60 Hz) is included with the CIRAS-3. If mains power is
available the system can be operated continuously using the power supply adapter. This same adapter is
also used to charge the internal battery packs. You must use the power supply adapter supplied by
PP Systems as other types may cause damage to the instrument.
Page 45
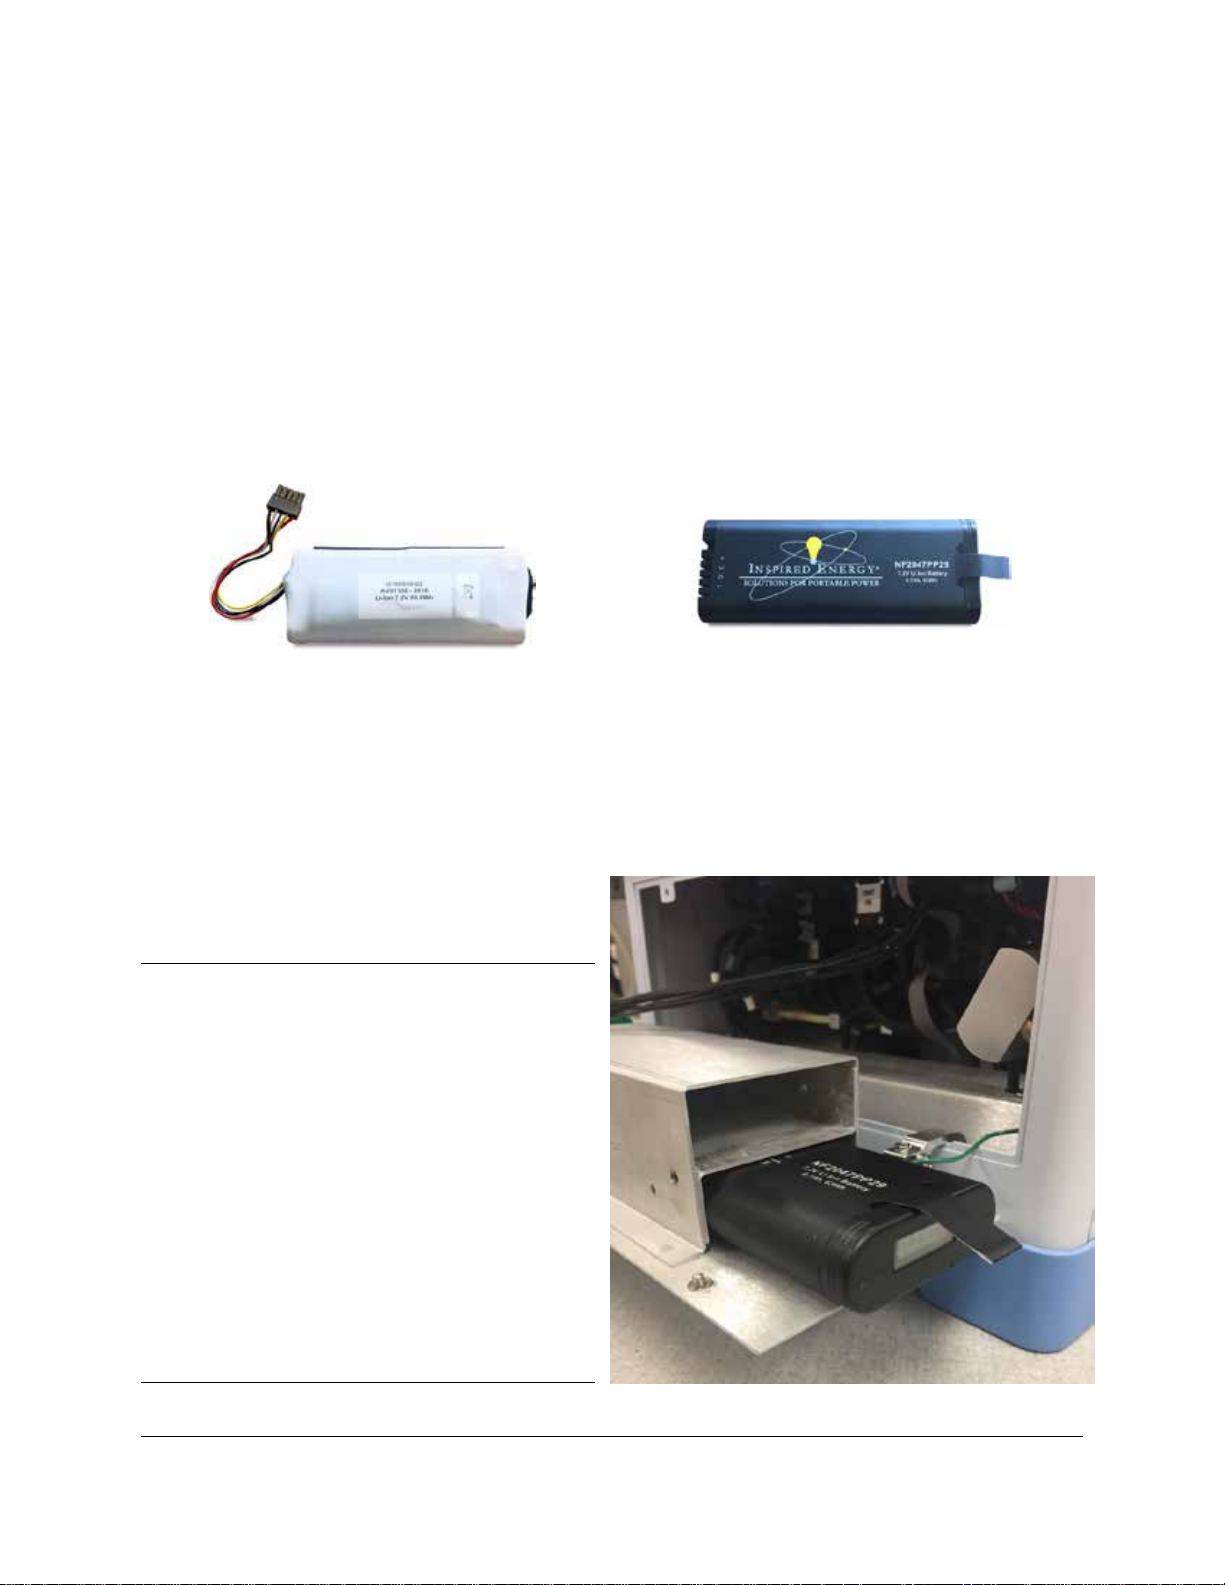
Battery Pack
Battery Pack (Aved)
Battery Pack (Inspired Energ y)
For field use the system is powered by internal, rechargeable battery packs. Up until June 2017 the
CIRAS-3 was powered by a single, internal rechar gea ble 7.2V Li-ion battery pack (Aved) providing
system operation up to 8 hours. Starting in July 2017 we began supplying instruments with two 7.2V (8.7
Ah, 63 Wh) Li-ion battery packs (Inspired Energy) improving system operation for up to 12 hours (actual
operation time will vary depending on environmental control settings).
Part Number 41526-1
ALWAYS MAKE SURE THE BATTERY PACKS ARE FULLY CHARGED THE NIGHT BEFORE USE.
Please note that batteries are shipped only partially charged due to shipping regulations. We highly
recommend that you charge them to full capacity upon receipt to avoid any potential damage or loss of
battery life.
Part Number 41535-1
TIP
To reduce the weight of the CIRAS-3 console
approximately 0.2 kg you can remove one of the
battery packs providing up to 6 hours of
continuous use (depending on settings and
controls) in the field. We recommend 2 battery
packs for normal use but if one battery pack is
used it must be placed in the lower battery
compartment which is the one that is flush with the
inside battery compartment door as shown here.
Page 46
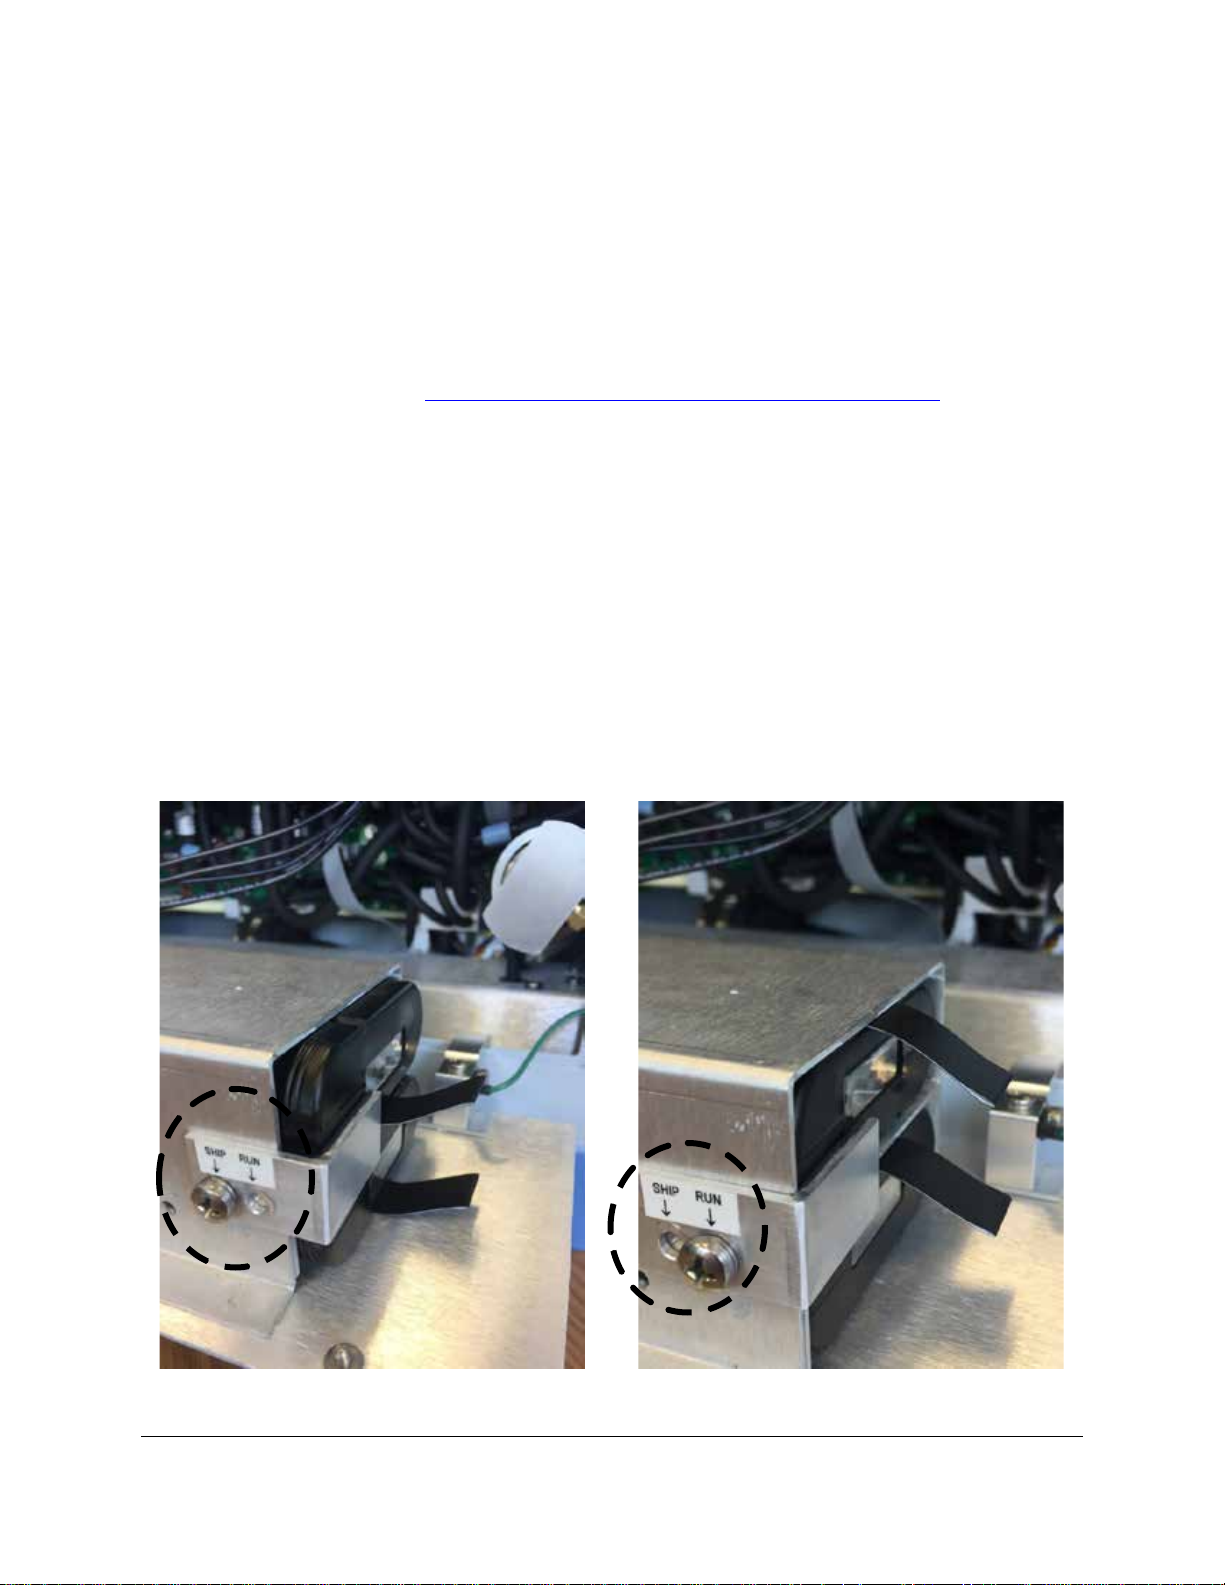
There are two major factors influencing battery capacity:
Ship Mode
Run Mode
• Environmental control
• CFM-3 Chlorophyll Fluorescence Module
For field use, it is extremely important to make sure that the internal battery(s) are fully charged.
We also offer a nice, lightweight external battery pack that can clip easily to your belt for extended
operation time in the field. See External Battery Pack (For extended operation in the field) on page 180
for more details.
If you have an older CIRAS-3 system using the old battery pack (Aved type) and are interested in
updating your system to the latest battery technology (Inspired Energy) please get in contact with PP
Systems.
Battery Pack Installation
When systems are first supplied the batteries are packed inside the CIRAS-3 console in “Ship Mode”.
Upon receipt of your new instrument you must remove the packs from each compartment to put them into
“Run Mode” as shown below.
Page 47
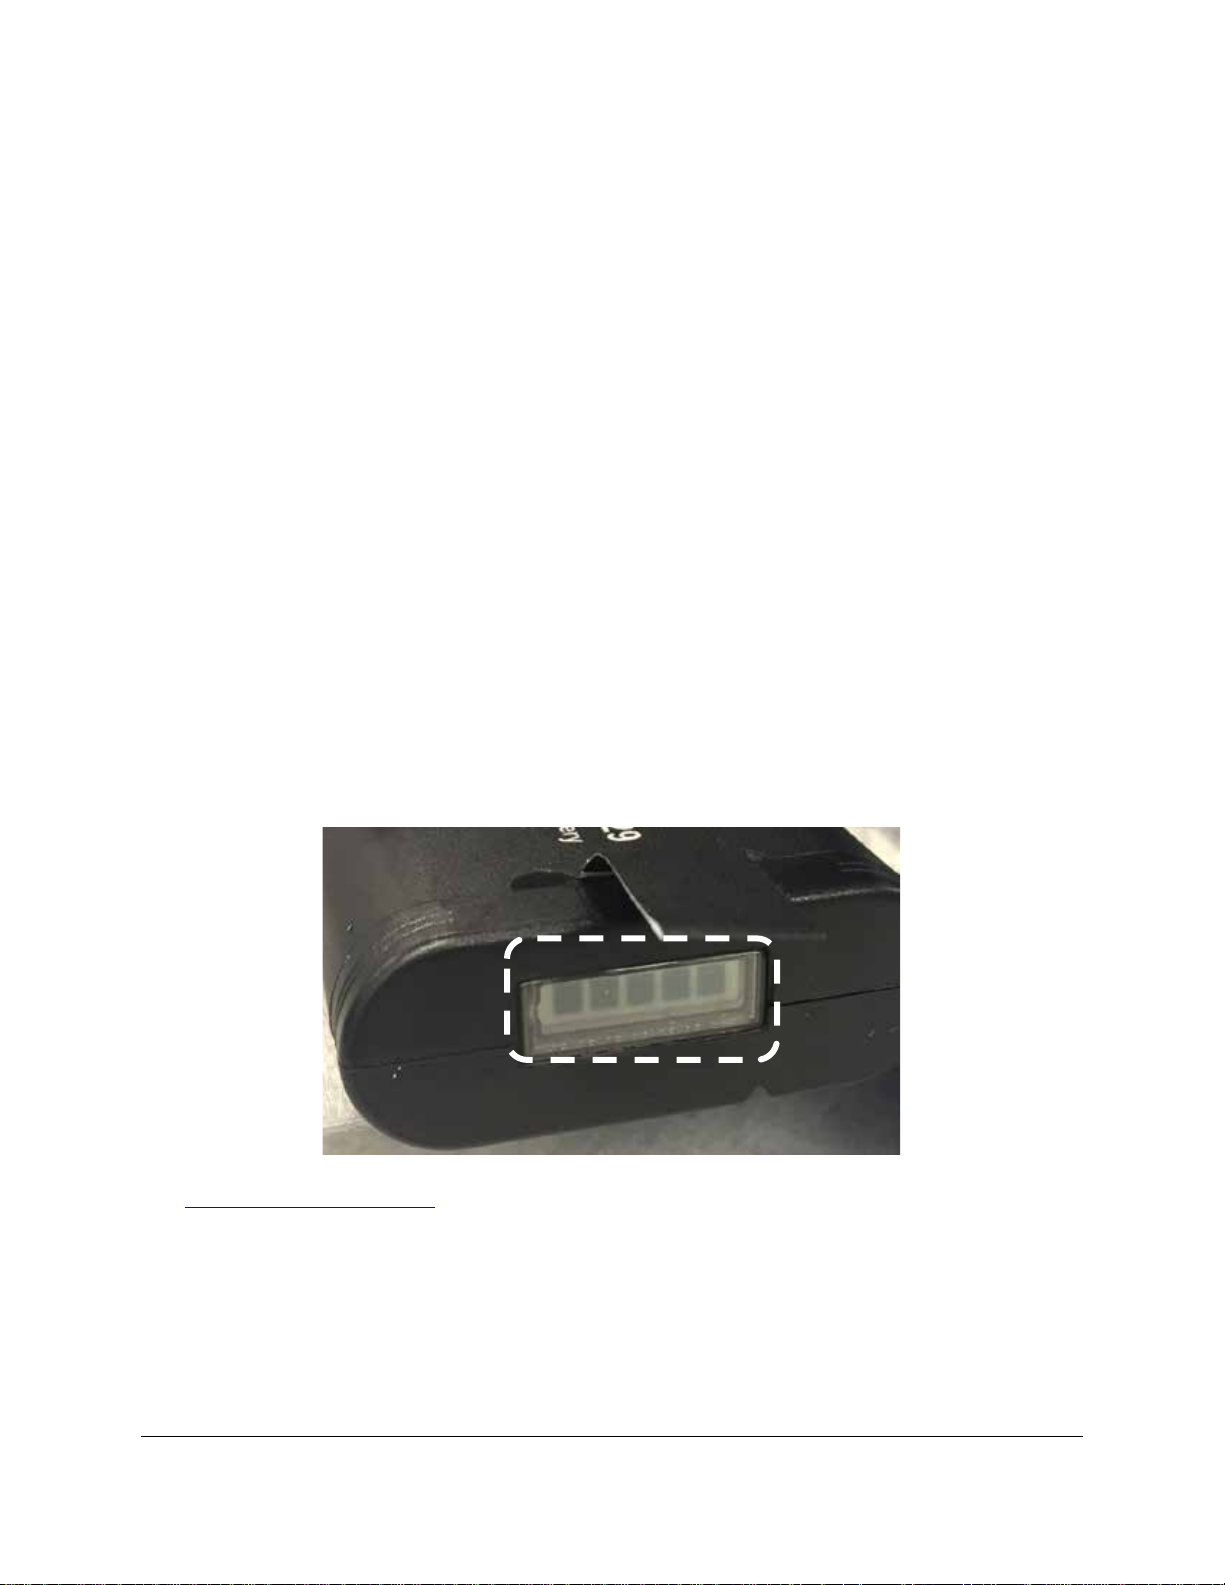
Instructions:
1. Open battery compartment door on the front of the CIRAS-3 console (2 smalls screws) to a ccess
the internal battery packs and gent ly drop down the door.
2. Remove battery retaining bracket which is currently in the “Ship” position.
3. Remove both battery packs from each compartment by pulling on the black tab.
4. Flip each battery pack over and re-insert into each compartment to snap into place with the
groove facing downwards towards the battery compartment door. The battery gauge should be
facing outwards and the battery removal black tab should be on the top of the battery pack.
5. Secure in place with the retaining bracket in the “Run” position.
6. Close battery compartment.
Charging Batteries inside the CIRAS-3 Console
An AC power supply adapter (120/240 VAC / 50/60 Hz) is supplied with the CIRAS-3 for charging the
internal battery packs. Each battery pack (Inspired Energy type) has a charge indicator gauge on the
side to show the level of charge. When all 5 bars are dark it indicates that the pack is fully charged (see
below). Please note that the CIRAS-3 also reports the state of the battery packs in the lower right hand
corner of the display when the instrument is powered on.
See Battery Pack (Li-ion Battery) on page 178
for instructions on battery removal, storage and disposal.
Page 48
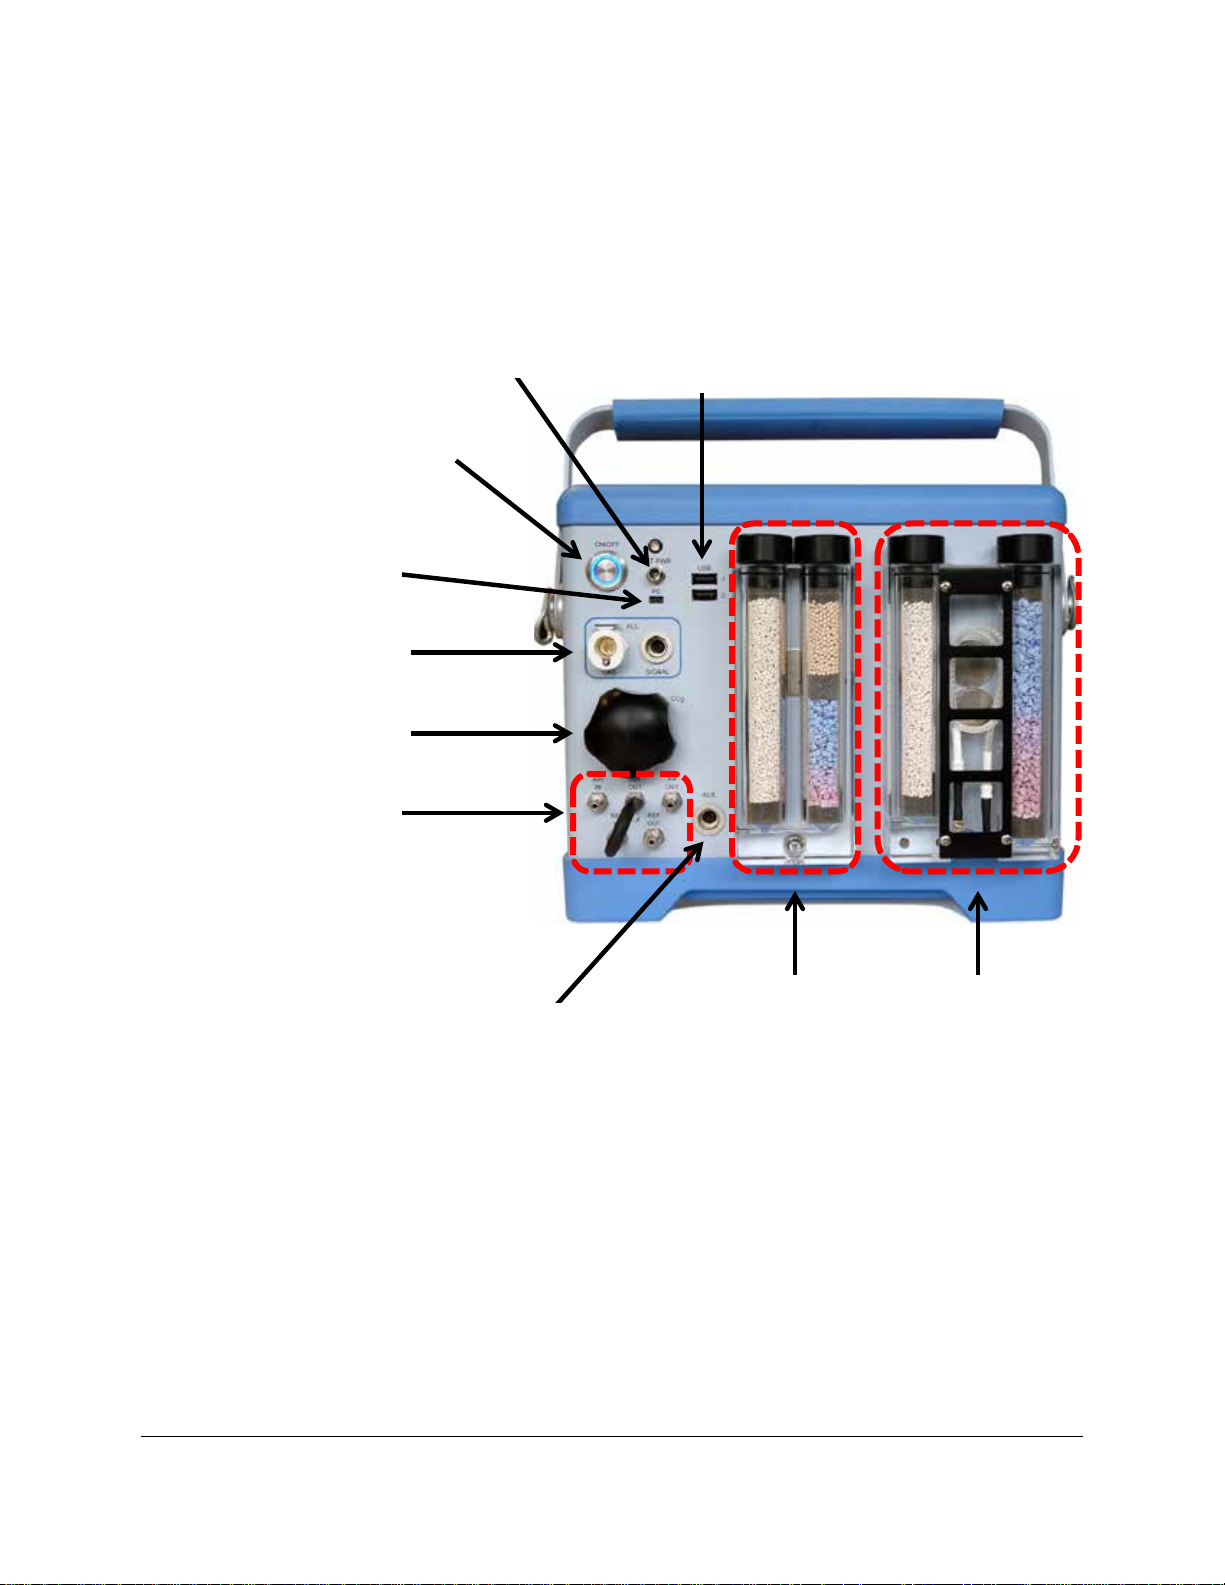
CIRAS-3 Rear Console
Zero
CO2/H2O control
USB flash
Battery charging
Mini USB
Power
Gas ports and link
pipe
PLC connections
CO2 cartridge holder
Auxiliary connector for
The CIRAS-3 rear console contains all of the essential components including power, gas and electrical
connections, USB ports, charger socket, desiccants and CO
socket and LED
drive ports
cartridge holder.
2
USB Flash Drive Ports
There are two USB flash drive ports labeled USB1 and USB2. These are used for
downloading/uploading stored data files and for transfer of settings and response script files.
use with SRC-1/2 and
CPY-4/5
columns
columns and
O equilibrator
H
2
Page 49
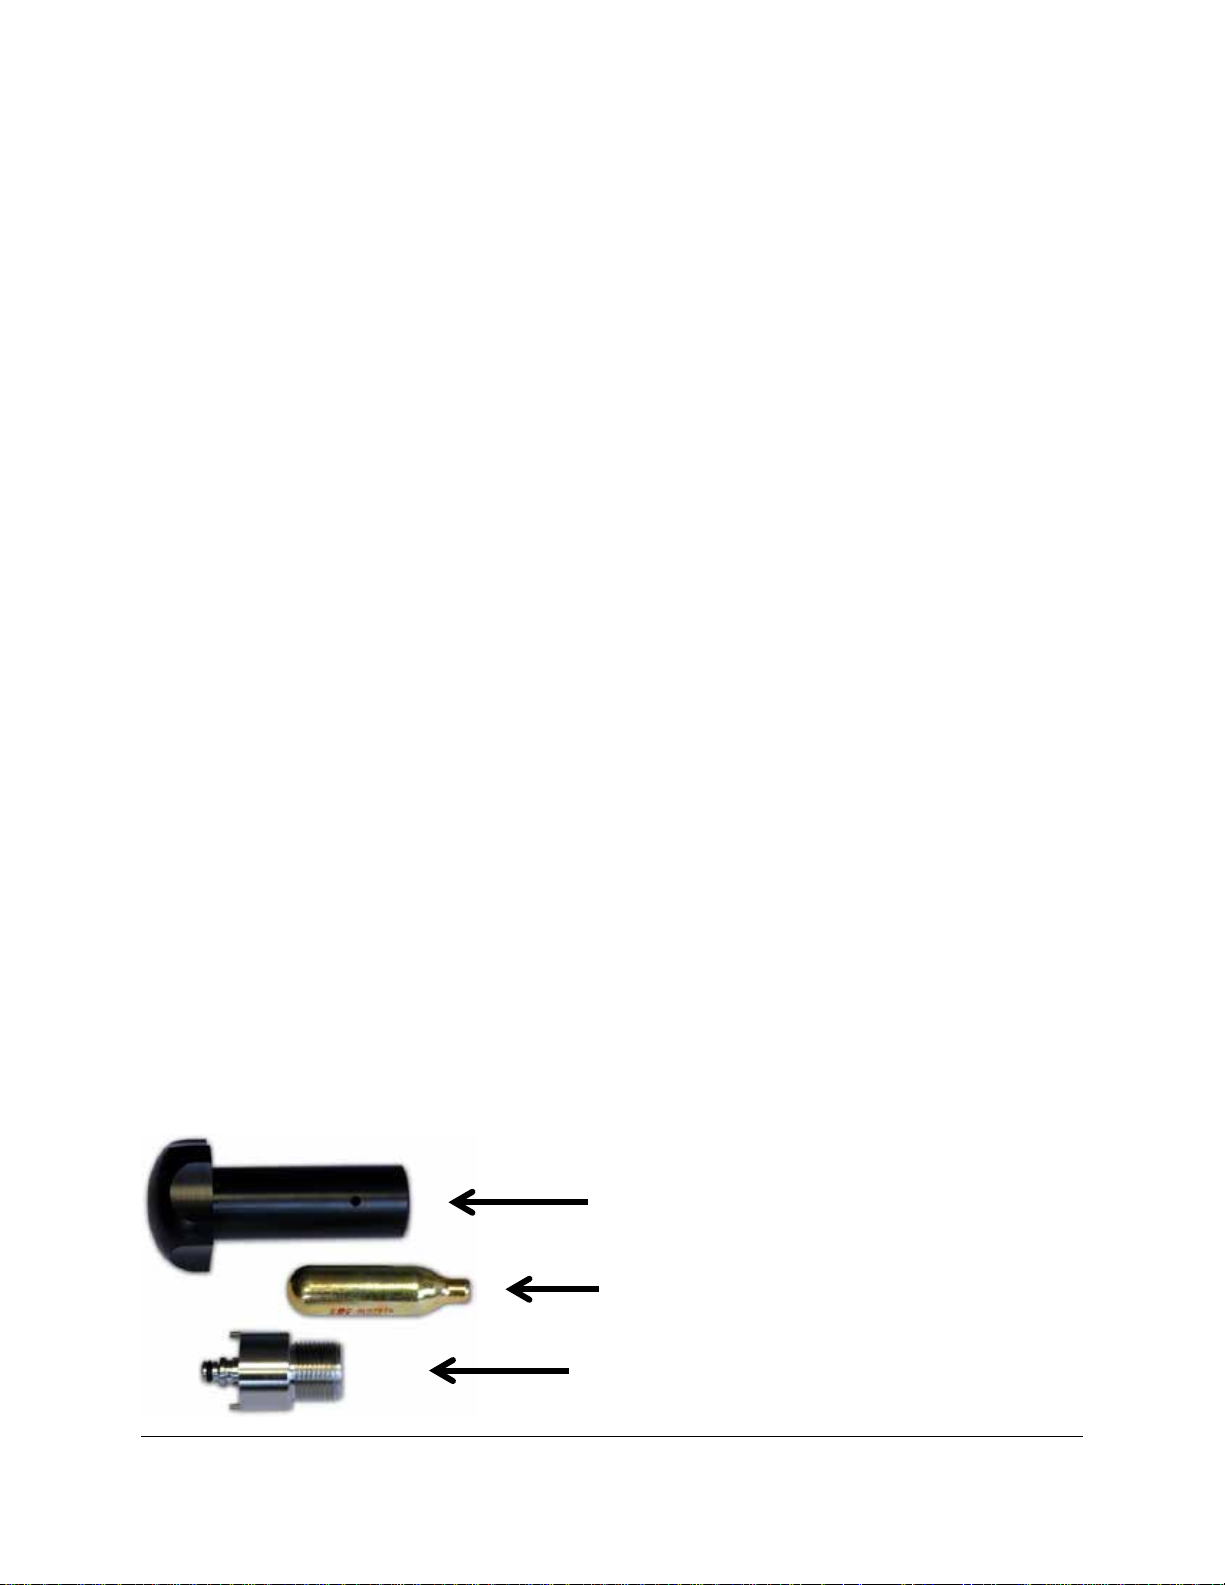
Battery Charging Socket (EXT PWR) and LED
CO2 Cartridge Holder
CO2 Regulator
CO2 Cartridge
The power supply adapter connects to the EXT PWR socket to charge the internal batteries and to power
the system continuously. The LED should be steady green indicating secure connection and that the
internal batteries are getting charged.
Power
The ON/OFF power button is a push-and-release type switch that will illuminate blue when the instrument
is turned on.
Mini-USB (PC)
The Mini-PCB socket (PC) is a communication port for connection to a laptop or desktop computer and is
commonly used with the PC Utility program for CIRAS-3 remote operation and display. A suitable USB
cable is included with the CIRAS-3.
PLC Connections
The white plastic connector on the PLC3 connects to the port labeled “GAS” and the 4 pin black electrical
connector connects to the socket labeled “SIGNAL”. Both the reference and analysis gas lines are built
into the single pneumatic connector which is secured by a locking connector. Push firmly in until you hear
a click and to release press down on the silver tab at the top of the connector and pull the connector out.
DO NOT USE EXCESSIVE FORCE WHEN CONNECTING OR DISCONNECTING THE PNEUMATIC
CONNECTOR AS IT MAY RESULT IN DAMAGE TO THE CONNECTOR. The black electrical signal
connector has a small black arrow used to align the connector with the SIGNAL socket. Align the arrow
to the top center position and push in until it locks. Pull gently on the connector’s sliding lock barrel to
remove.
CO2 Cartridge Holder
The CO2 cartridge fits inside the cartridge holder which threads into the regulator body in the opening
labeled CO
.
2
Page 50
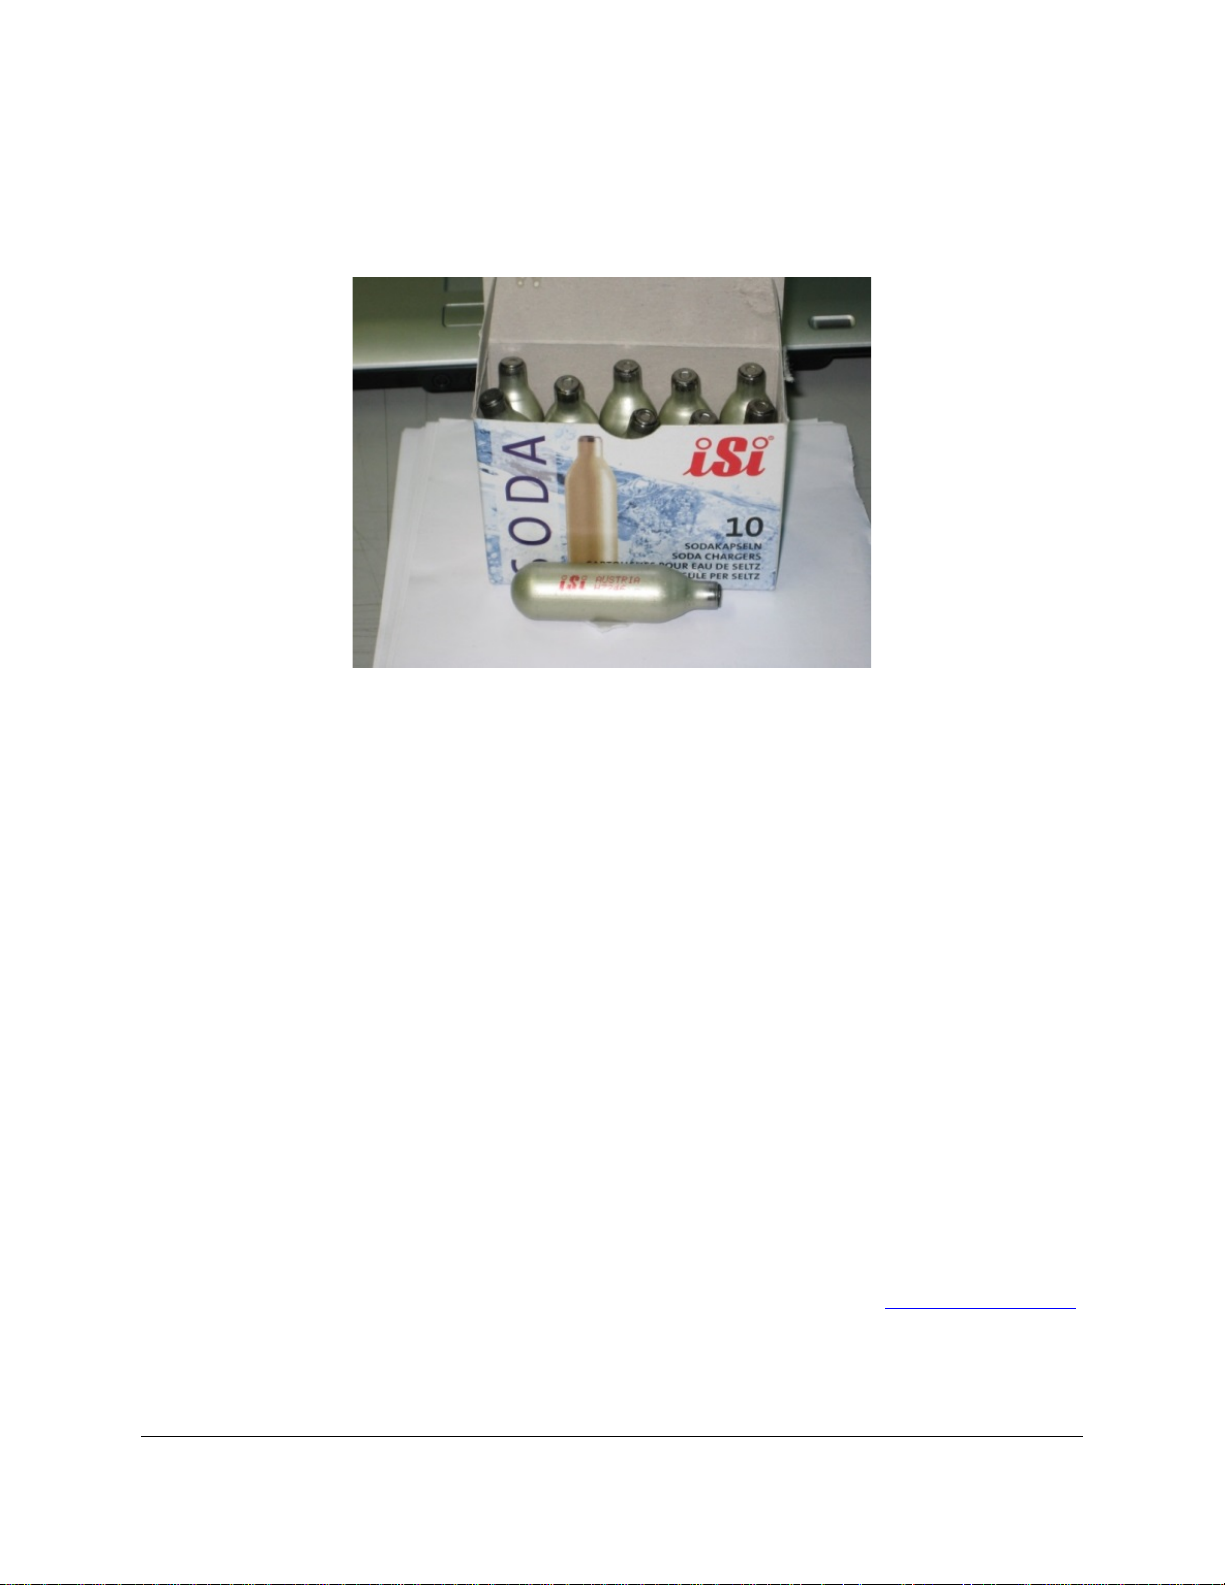
CO2 Cartridges
We supply and recommend the CO2 cartridges that are manufactured by a company called ISI. The
cartridges are 8g and are normally supplied in boxes of 10 as shown below.
A fresh CO
cartridge has a very high pressure when it is first introduced into the CIRAS-3 console. We
2
do not recommend changing the cartridge for at least 24 hours from the time it is inserted due to this high
pressure. Use precaution when changing the CO
pressurized CO
cartridge you will observe a very rapid escape (and loud pop) of gas from the cartridge
2
cartridge. If you attempt to change a highly
2
when you slowly unscrew the cartridge holder from the CIRAS-3. You will also observe that the cartridge
will be quite cold.
How do I determine the state of the CO2 cartridge?
It is very easy to deter mine if you have a highly pressurized CO2 cartridge or even an empty one. If you
have any questions about the state of charge of the CO
the cartridge holder perform this simple test with the system up and running and after the warm up period.
1. Go to Controls (F3) and set the “CO2 Reference” to 2000 µmol mol
2. Hit Accept (F2)
3. Observe CO2r
If the CO2r reaches or gets near 2000 then you have a pressurized cartridge and there should be no
need to change it. If the CO2r does not get near 2000 then the cartridge is not fully pressurized. The
cartridge or you want to check if a cartridge is in
2
-1
lower the CO2r the less pressurized the cartridge will be. For more information see CO2 Cartridge Status
on page 68.
Page 51

The CO2 cartridge manufacturer (iSi) has distributors throughout the world so it should be very easy for all
customers to source this item locally. Due to the classification of these CO
cartridges, PP Systems can
2
only ship them by ground service in the United States and Canada. To locate a distributor in your territory
https://www.isi.com/ or click on https://www.isi.com/en/culinary/meta/about-isi/contact-isi-sales-partners-
go to
worldwide/ for the latest list of worldwide distributors.
Manufacturer Contact Informati o n
ISI
Kürschnergasse 4
A-1217 Vienna, Austria
Tel: +43 1 25099 0 Fax: +43 1 25099 555
Email: [email protected] URL: https://www.isi.com/
NOT ALL CO
CARTRIDGES ARE THE SAME AND SOME MAY EVEN CAUSE DAMAGE IF USED
2
WITH THE CIRAS-3. They come in all different sizes, shapes and contents (some even have oil) and are
commonly used for things like pellet guns, soda siphons, etc. If you have any questions whatsoever
regarding the CO
cartridges you are urged to get in contact directly with PP Systems.
2
Gas Ports and Link Pipe
AIR IN is the entry port for ambient air or introduced air from an external gas cylinder (i.e. experimental air
containing 2% oxygen). A short link pipe connects AIR OUT with REF IN. This is actually the reference
air supply air for both the reference IRGAs and the leaf cuvette. For leaf gas exchange measurements
using any of our PLC3 leaf cuvettes, this link pipe must be connected between the REF IN and AIR OUT.
The AN OUT and REF OUT ports allow already analyzed air samples to exhaust to atmosphere.
Auxiliary Connector
The 4 pin AUX socket is reserved for use with the SRC-1 and SRC-2 Soil Respiration Chambers and the
CPY-4 and CPY-5 Canopy Assimilation Chambers.
Please note that the SRC-1 Soil Respiration Chamber and CPY-4 Canopy Assimilation Chamber also
require another piece of hardware called the Auxiliary Probe Adapter (APA) to work with the CIRAS-3.
Zero Column
The Zero column contains 3 clearly marked desiccants labeled CO2 Absorber (soda lime), H2O Absorber
(Drierite) and MS (Molecular Sieve) which are used for the analyzer Zero ensuring long term stability and
accuracy of the CO
more information related to this column and management of desiccants.
and H2O gas analyzers. See Desiccants and Absorber Columns on page 184 for
2
Page 52

CO2/H2O Control Columns and H2O Equilibrator
The CO2/H2O control columns contain 2 clearly marked desiccants labeled CO2 Absorber (soda lime) and
H2O Absorber (Drierite) which are used to control CO
on page 184 for more information related to this column and management of desiccants.
and H2O. See Desiccants and Abs orb er Columns
2
TIP
Always change the Molecular Sieve weekly during use. See Desiccants and Absorber Columns on page
184. We also strongly recommend performing a leak test every time you change the desiccants. To do
so insert a fresh CO
close the cuvette head. Go to Settings (F2) and set the CO2 reference to 0. The CO2r and CO2a
values should drop close to 0 (± 2 ppm) after a few minutes with a 0 CO2d (± 0.5 ppm).
cartridge, connect the PLC3 Leaf Cuvette electronically and pneumatically and
2
Page 53
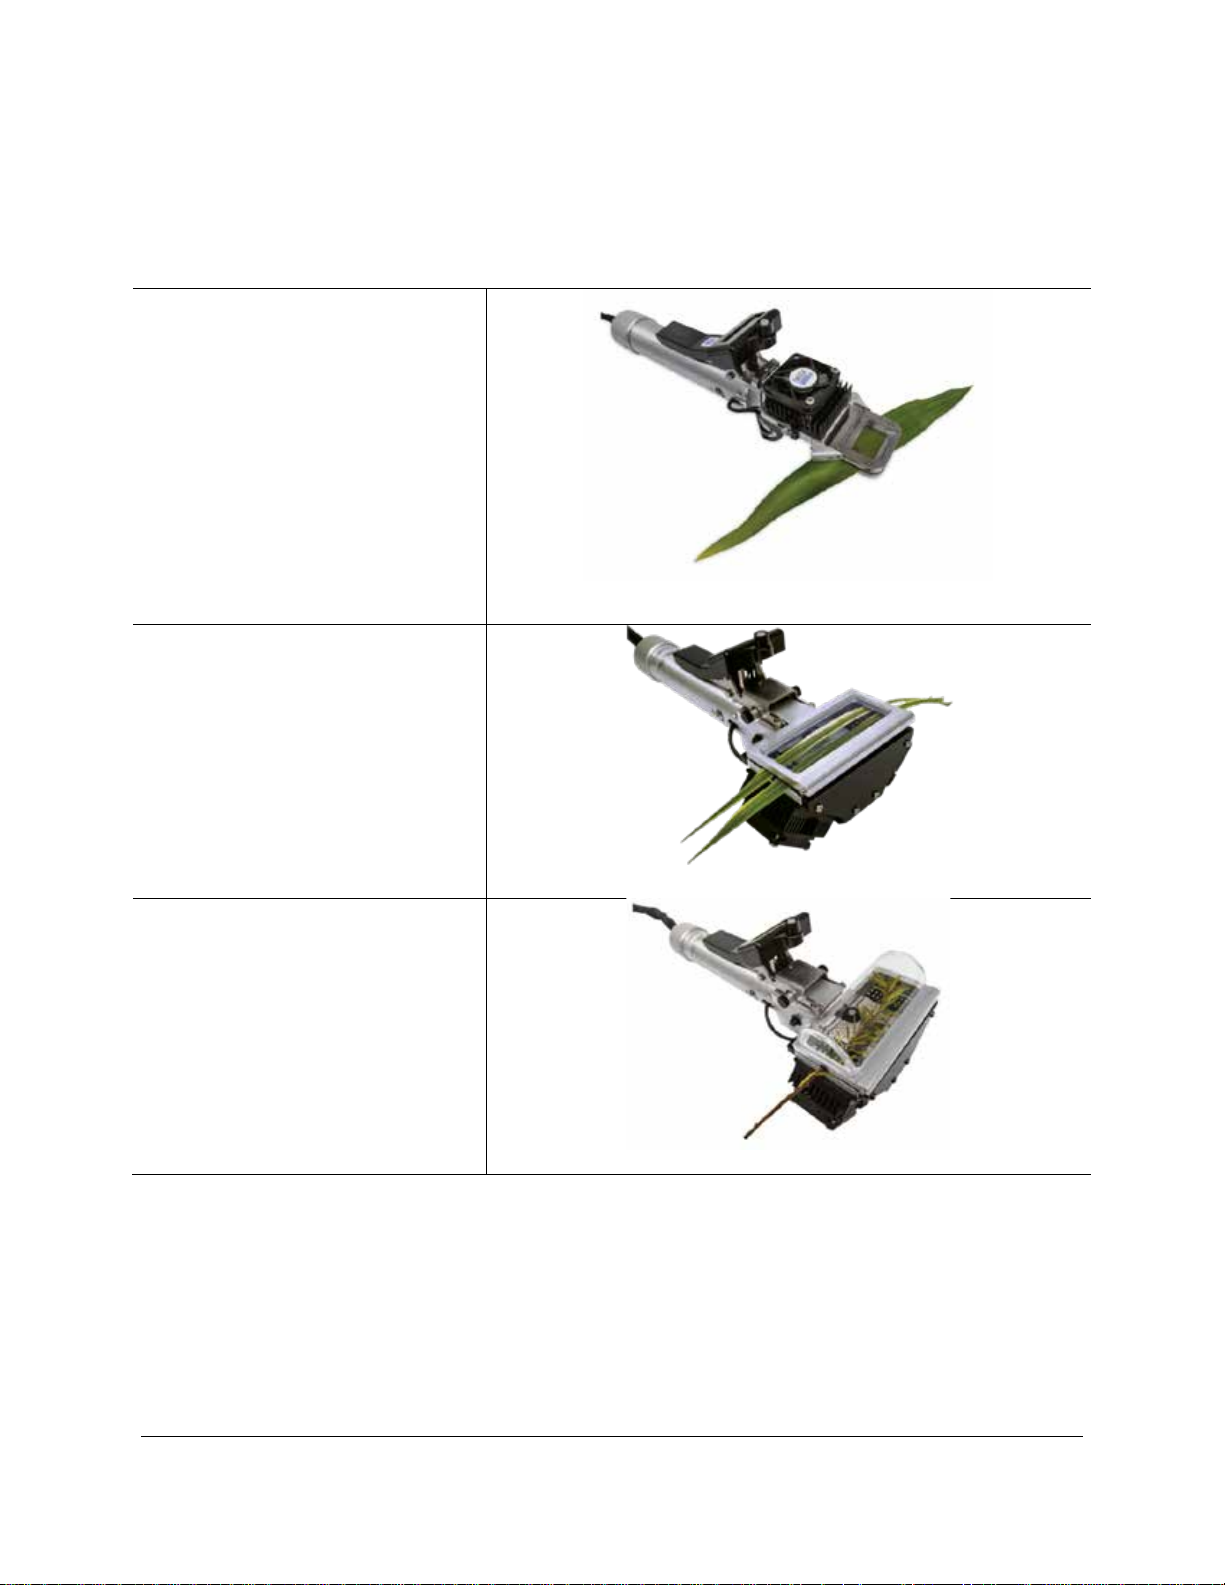
PLC3 Series Leaf Cuvettes
There are 3 standard leaf cuvettes commonly used with the CIRAS-3 for measurement of leaf gas
exchange:
PLC3 Universal Leaf
Cuvette
For measurement on flat, broad
leaves. It is supplied as standard
with 3 windows measuring 25 x 7
mm, 25 x 18 mm and 18 mm
diameter.
PLC3 Narrow Leaf Cuvette
For measurement on grasses, long
needles and narrow leaves.
PLC3 Conifer Leaf Cuvette
For measurement on conifers and
short needle vegetation.
All 3 PLC3s connect to the PLC “Gas” and “Signal” connectors on the CIRAS-3 console. Prior to use,
make sure that the gas and signal connections are made and that the appropriate PLC is selected under
Accessory in the Settings dialog. When selected, the default values for that leaf cuvette will be used.
This is very important as there are some differences between the PLC3s. All 3 leaf cuvettes have a
similar handle, electronics, sensors, LCD, record (R) and switch (S) keys on the open/close lever,
ambient temperature sensor, temperature control range and external PAR sensor. Measurements can be
Page 54

recorded from all PLCs by pressing the R key and parameters can be toggled on the LCD by pressing the
S key.
PLC3 Temperature Control
All PLC3s include temperature control as standard. Each PLC includes a built-in Peltier hea tin g/coo li ng
module which allows a wide range of temperature control. Optimal control depends on the ambient air
temperature due to power requirements to heat or cool the cuvette or leaf to temperatures that are much
different than ambient. With full power available you can usually control cuvette temperature (Tcuv) from
approximately 10 °C be low ambient to 15 °C above ambient, but within the absolute temperature range of
0 to 45 °C. Note that slight differences are expected between sensor-based and calculation-based
methods. Automatic control of “leaf temperature” is heavily influenced by the following 3 variables:
1. Leaf transpiration in the cuvette
2. Light (incident radiation)
3. Size and construction of the PLC window
At lower light intensities, leaf temperature control is wider and at high light intensities it is much tighter.
We recommend that when using “Set leaf temperature” as the Temperature Control Type under Settings
(F2) that you do so maintaining leaf temperature (Tleaf) at or near ambient levels especially at high light
intensities and transpiration rates. Although all PLC3s include temperature control as standard, there are
some key differences between each type as follows:
Temperature Measurement
PLC3 Universal – Includes an IR sensor for accurate, non-contact measurement of leaf temperature and
energy balance for calculation of leaf temperature. We recommend IR thermometry as long as the entire
cuvette window is covered with leaf material. If the cuvette windo w is not covere d 100% w ith leaf
material, you must select energy balance.
PLC3 Narrow and Conifer – Includes a leaf thermistor for direct measurement of leaf temperature and
energy balance for calculation of leaf temperature. We recommend the energy balance method.
Temperature Control Type
PLC3 Universal – Five control options are available:
• Set leaf temperature
• Track leaf to ambient
• Cuvette temperature
• Track cuvette to ambient
• Disable temperature control
Page 55
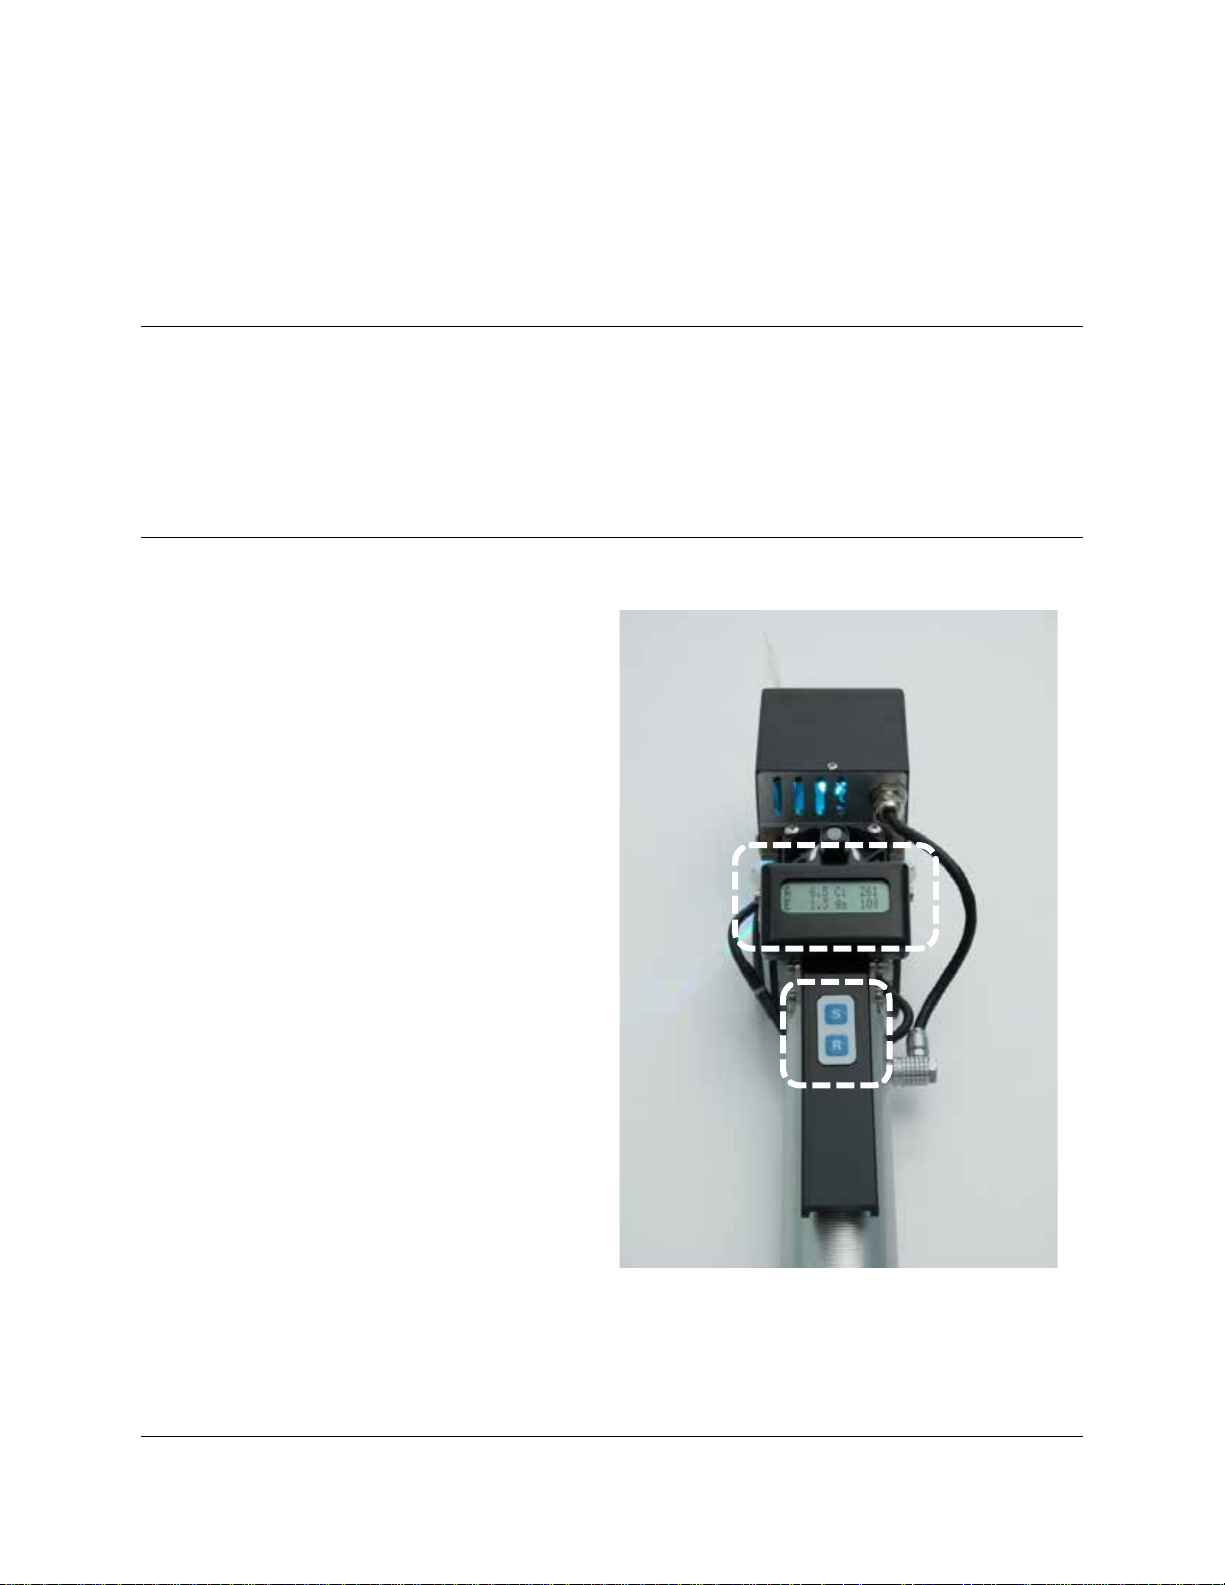
PLC3 Narrow and Conifer – Three control options are available:
• Cuvette temperature
• Track cuvette to ambient
• Disable temperature control
TIP
The PLC3 ambient temperature sensor will represent an approximate temperature to ambient for
o
reference purposes only. Tamb may vary 1-3
orientation of the cuvette.
LCD on Leaf Cuvette
All PLCs include an LCD for display of parameters.
Press the S button located on the cuvette
C from actual ambient depending on local conditions and
open/close lever to toggle between displays to view
additional parameters. Press R to record a
measurement if in record mode.
Page 56
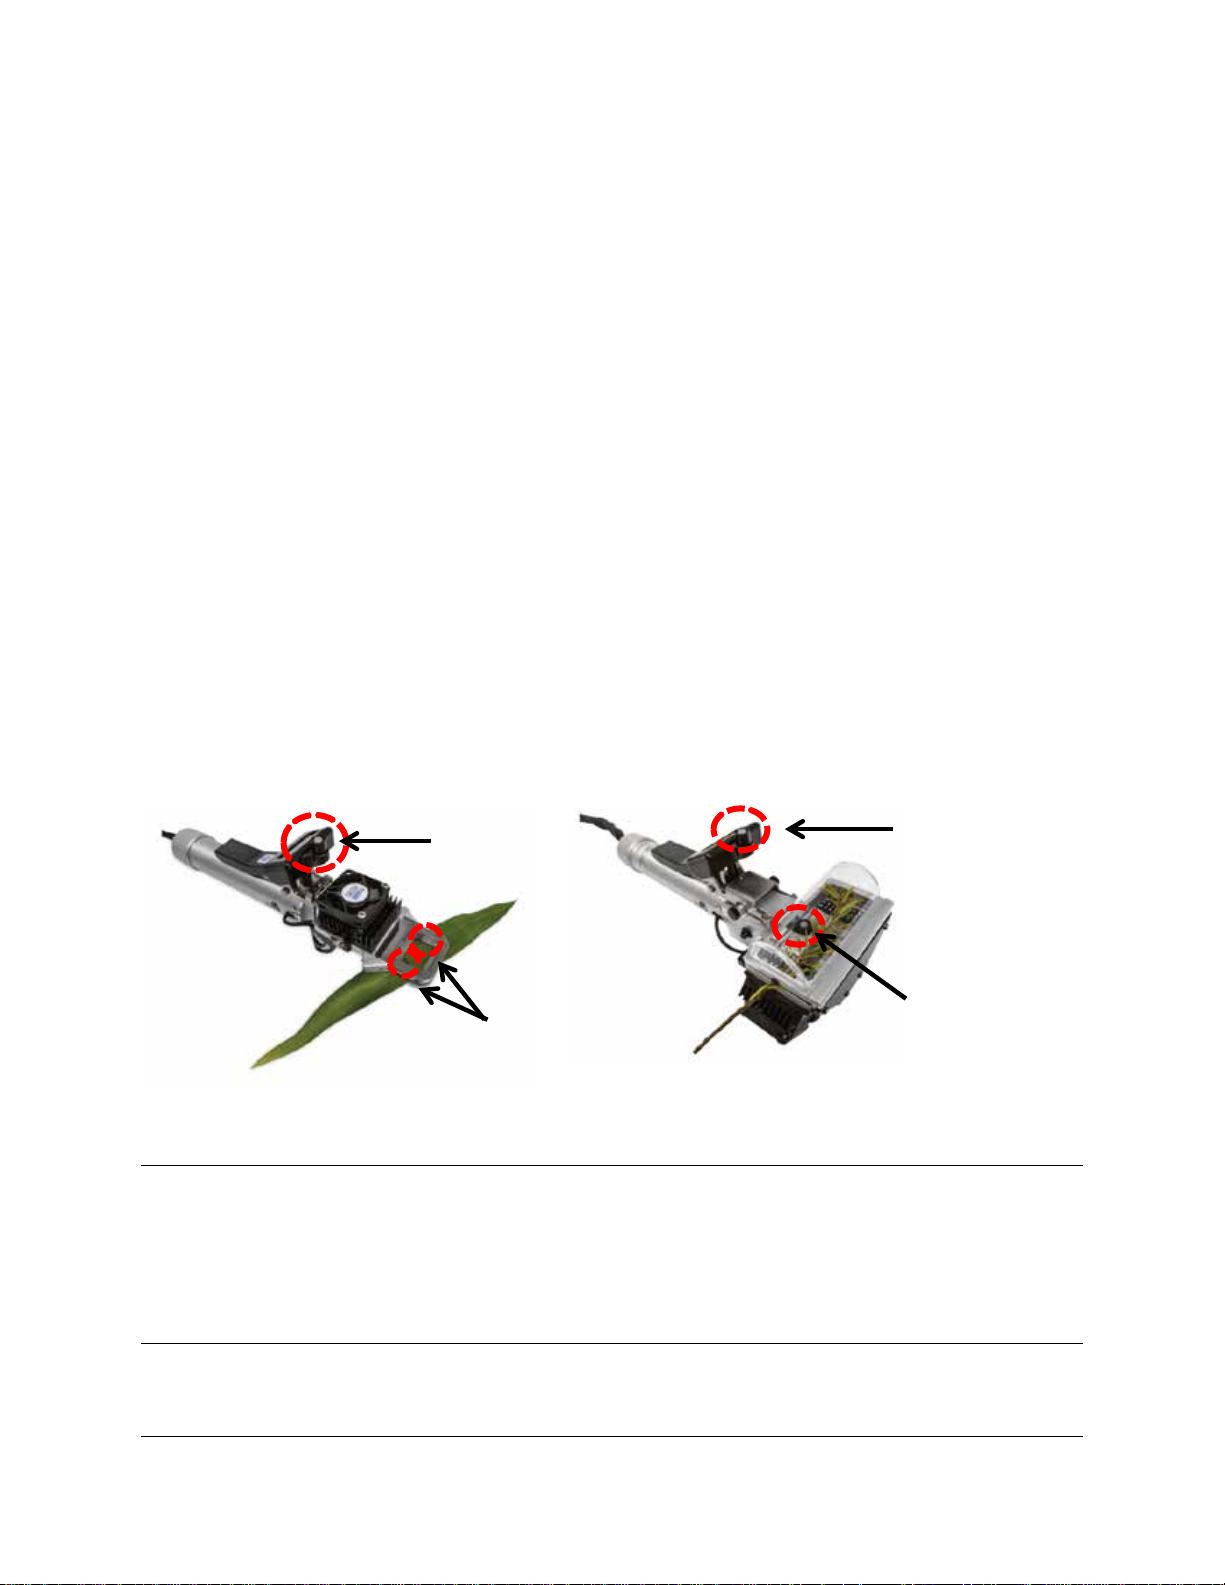
PAR Measurement
PLC3 Universal Leaf Cuvette
PLC3 Conifer and Narrow Leaf Cuvette
PARe
PARi
PARe
PARi
The PLC3 leaf cuvettes also features two ways of measuring light in the 400-700 nm wavelengths. All
PLC3s include a cosine-corrected external PAR sensor (PARe) for measurement of ambient PAR
(Photosynthetically Active Radiation). This reading will be most reliable with the cuvette held on a
horizontal plane relative to the ground.
PLC3 Universal - includes two mini-silicon photodiode sensors beneath the cuvette window (PARi). The
silicon photodiode sensors are close to the leaf plane and used to average the irradiance beneath the
cuvette window. Irradiance is somewhat attenuated (approx. 10% attenuation) by the window. This
affects the amount of light reaching the leaf if the light source is ambient sunlight, but not if our LED light
unit is the source. This is because the internal PAR sensors are on an electronic feedback loop with the
light unit, so the desired light intensity entered by the user is always achieved.
PLC3 Conifer and Narrow – includes a single, cosine corrected PAR sensor beneath the cuvette window
(PARi). It is used to give an indication of the PAR inside the leaf cuvette and as an electronic feedback
loop to control light intensity when our light unit is used.
TIP
The PARi sensor will normally read about 10% lower than the PARe sensor due to attenuation of the
cuvette window.
Page 57
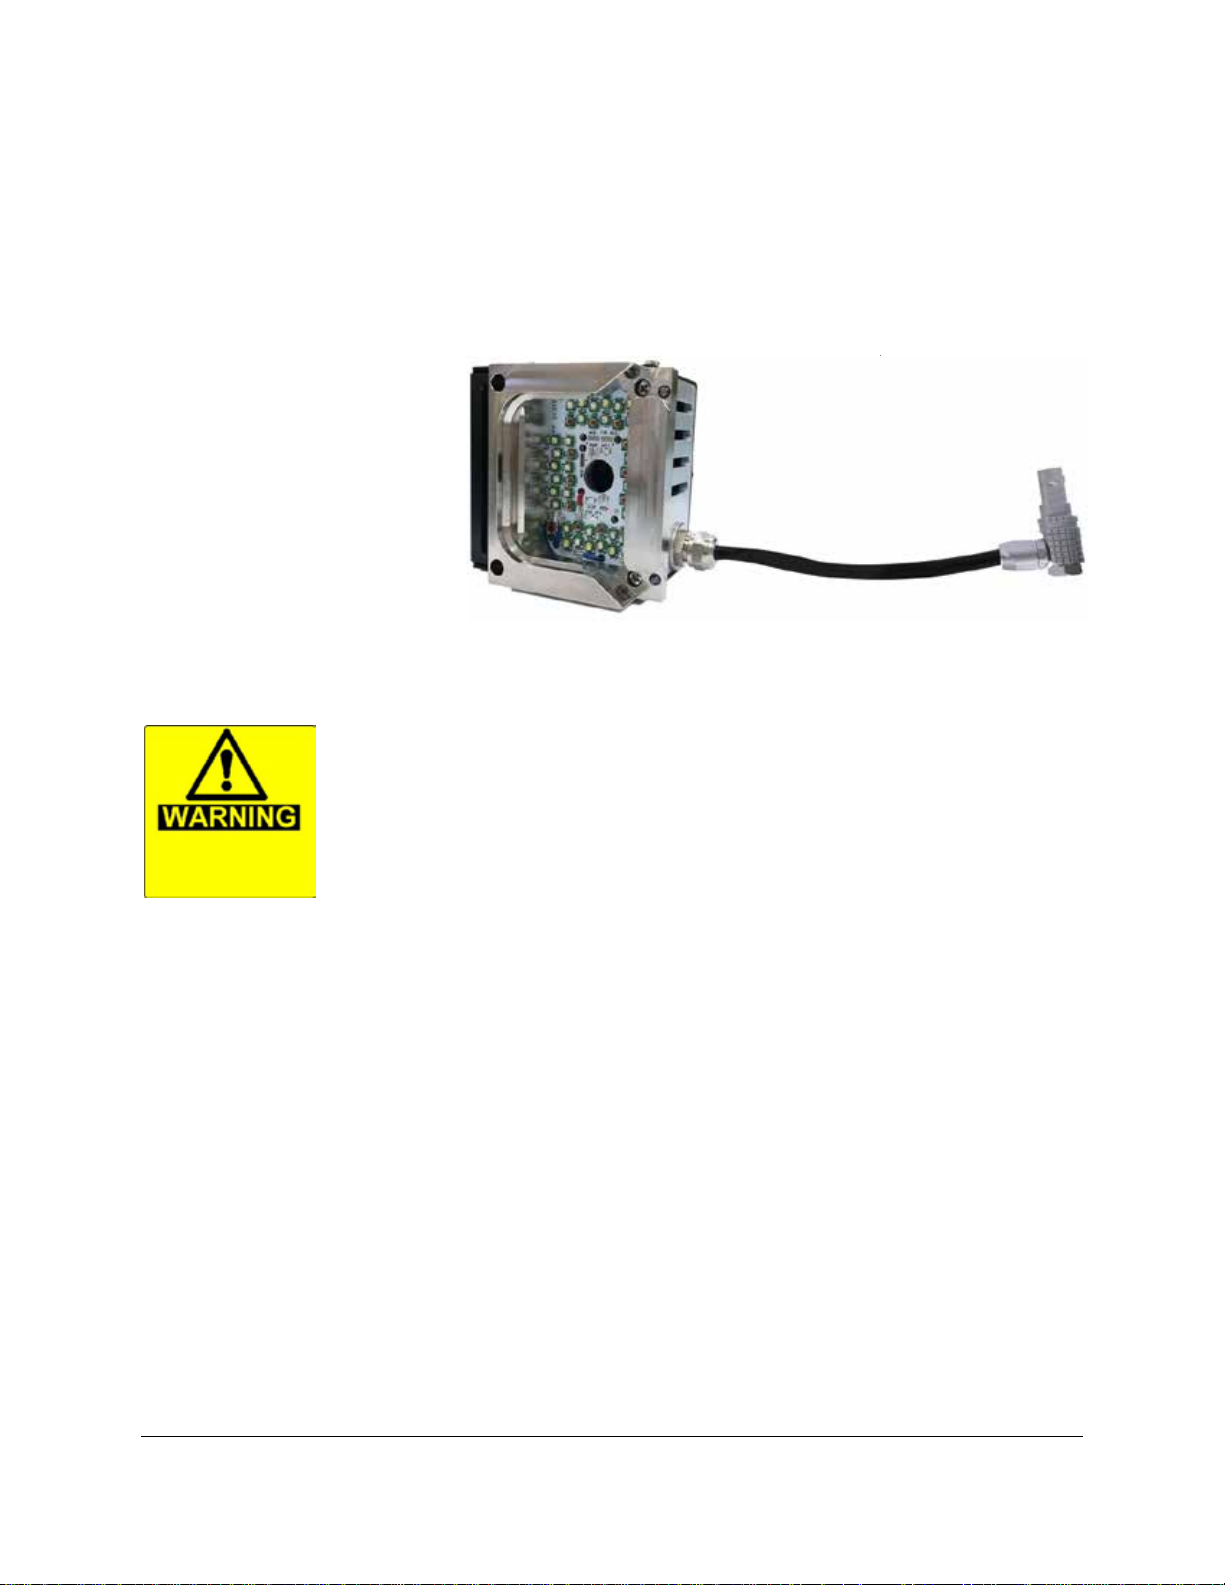
Light Control (Optional)
An optional LED Light Unit is available for all PLC3s.
PLC3 Universal LED Light Unit (RGBW)
This LED light unit features 48
LEDs, 12 each of RGBW (redgreen-blue-white) color. You are
able to set any single color from
0-100% using the light source, or
you can combine colors in any
proportion to recreate the spectral
distribution of a specific natural or
artificial light source. With full power available to the cuvette the normal intensity output range will be
-2 s-1
0-2500 µmol m
.
Caution: do not look directly at illuminated LEDs, even with the light unit set
to lower intensity control levels.
Please note. Maximum light intensity an d ra n g e of temperature control is
dependent on RGBW settings.
The PLC3 Universal LED light unit is designed to mate quickly and easily with the PLC3 Universal leaf
cuvette.
Page 58
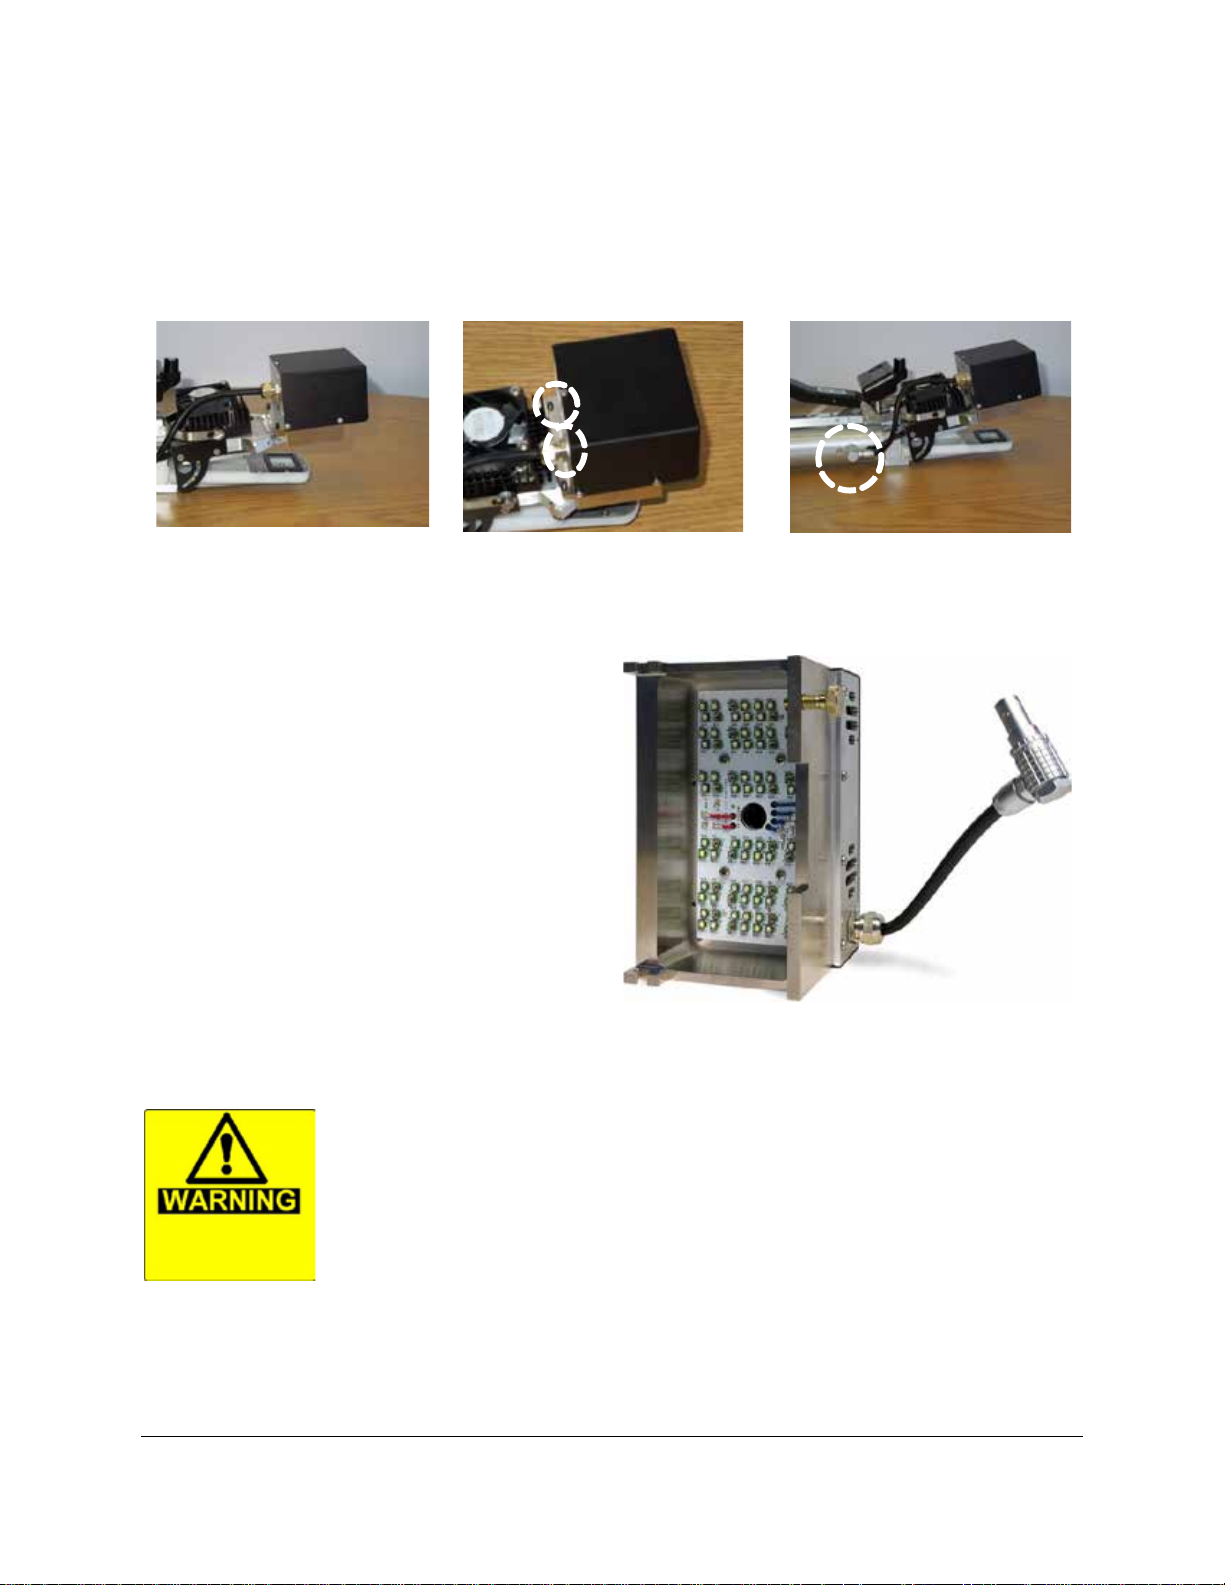
Step 1
First, mount the light unit by
Step 2
Step 3
aligning it to the front of the
cuvette upper jaw as shown
below.
Slide the light unit back towards
the heat sink and fan on the leaf
cuvette locking it in place using
the two set screws shown below.
Connect electrically.
PLC3 Narrow and Conifer LED Light Unit
This LED light unit for the PLC3 Narrow and Conifer
leaf cuvettes feature 96 LEDs, 24 each of RGBW
(red-green-blue-white) color. You are able to set
any single color from 0-100% of the light source, or
you can combine colors in any proportion to
recreate the spectral distribution of a specific
natural or artificial light source. With full power
available to the cuvette the normal intensity output
-2 s-1
range will be 0-2000 µmol m
dependent on selection of red-green-blue-white
LEDs).
(ranges are
Caution: do not look directly at illuminated LEDs, even with the light unit set
to lower intensity control levels.
Page 59
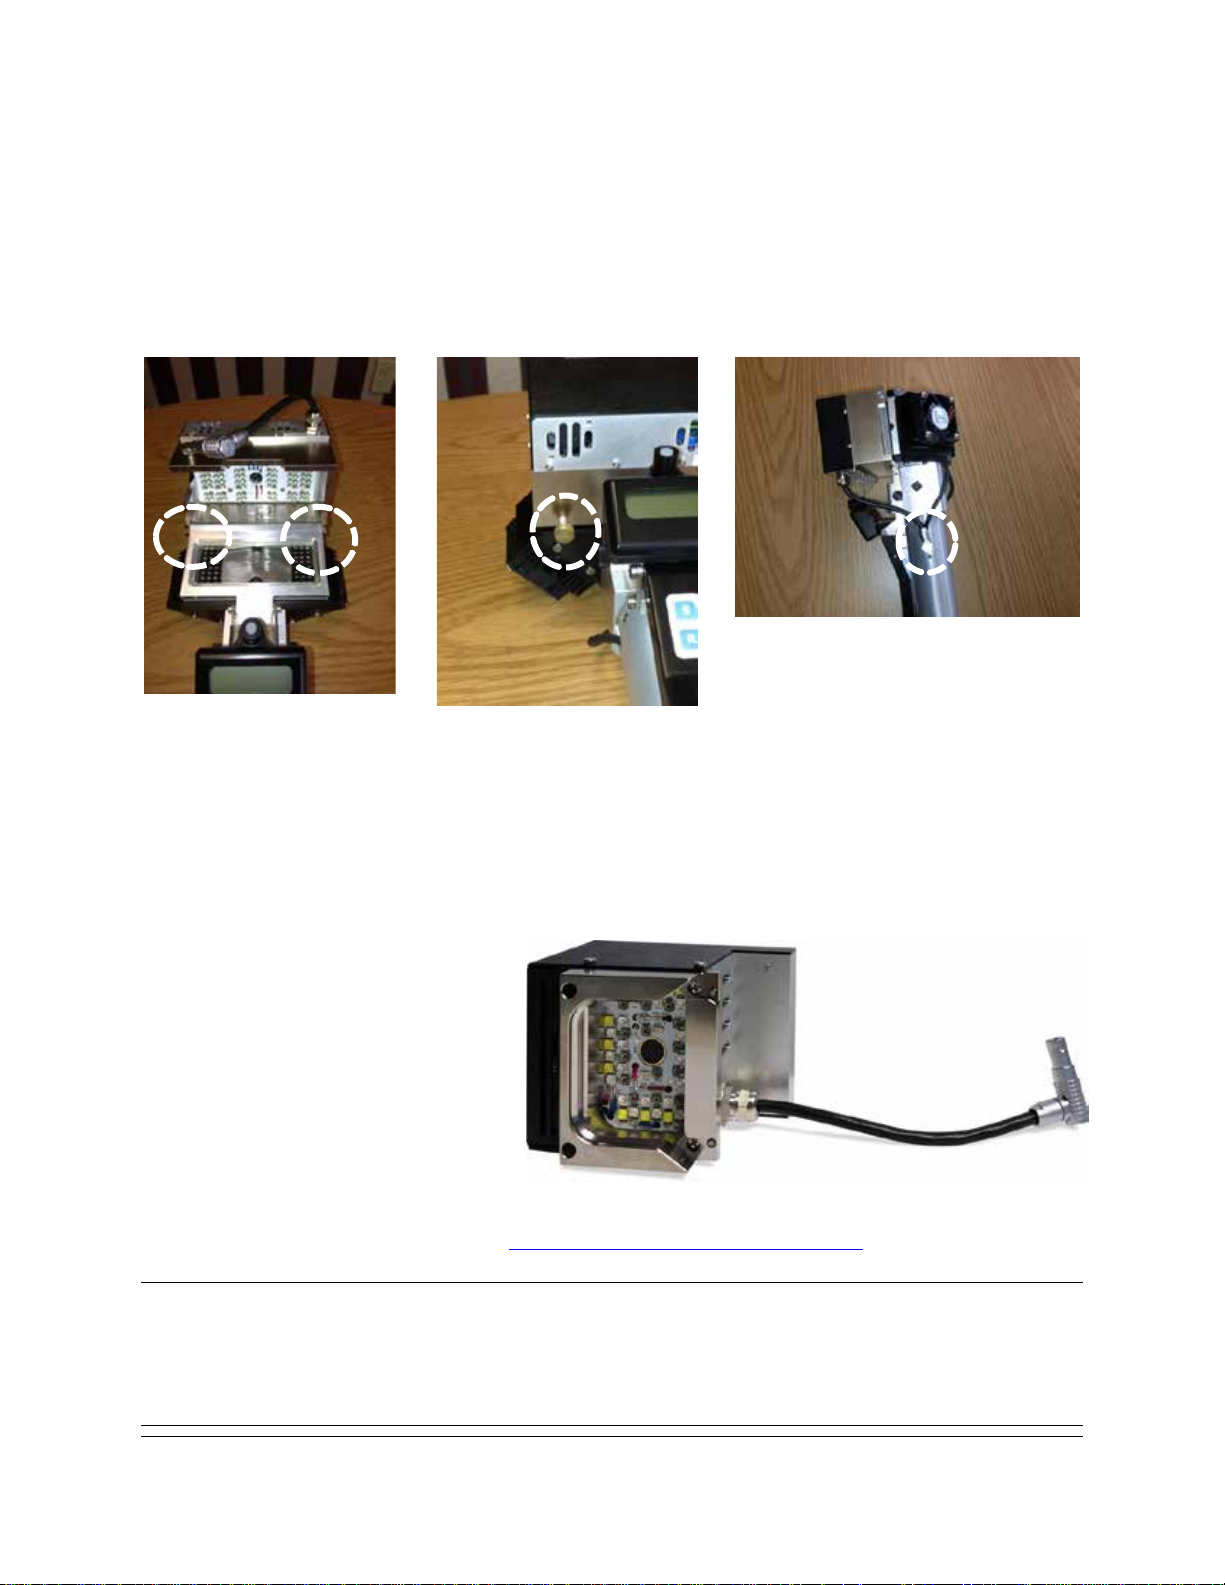
The PLC3 Narrow and Conifer LED light unit is designed to mate quickly and easily with the PLC3 Conifer
Step 1
Step 2
Step 3
or Narrow leaf cuvette.
Secure light unit to notches on
cuvette head.
Please note. Maximum light intensity and ra n g e of temperature control is dependent on RGBW
settings. Also, due to the distance between the LEDs in the light unit and the PLC3 Narrow and Conifer
internal PAR sensor, maximum light intensity may be lower than 2000 µmol m
of red, green, blue and white LEDs.
Pull Light Unit over cuvette
and secure locking screw.
Connect electrically.
-2 s-1
depending on mixture
CFM-3 Chlorophyll Fluorescence Module
The CFM-3 Chlorophyll Fluorescence
Module looks very similar to the PLC3
Universal LED Light Unit. The major
difference being the inclusion of all
fluorescence associated light sources
and detection capability that is built
directly into the light unit.
Attachment and connection to the PLC3 Universal Leaf Cuvette is identical to that described above with
the PLC3 Universal LED Light Unit. See PLC3 Universal LED Light Unit (RGBW) on page 57
.
TIP
The CFM-3 can also be used as an actinic light source for gas exchange measurements if required.
Page 60
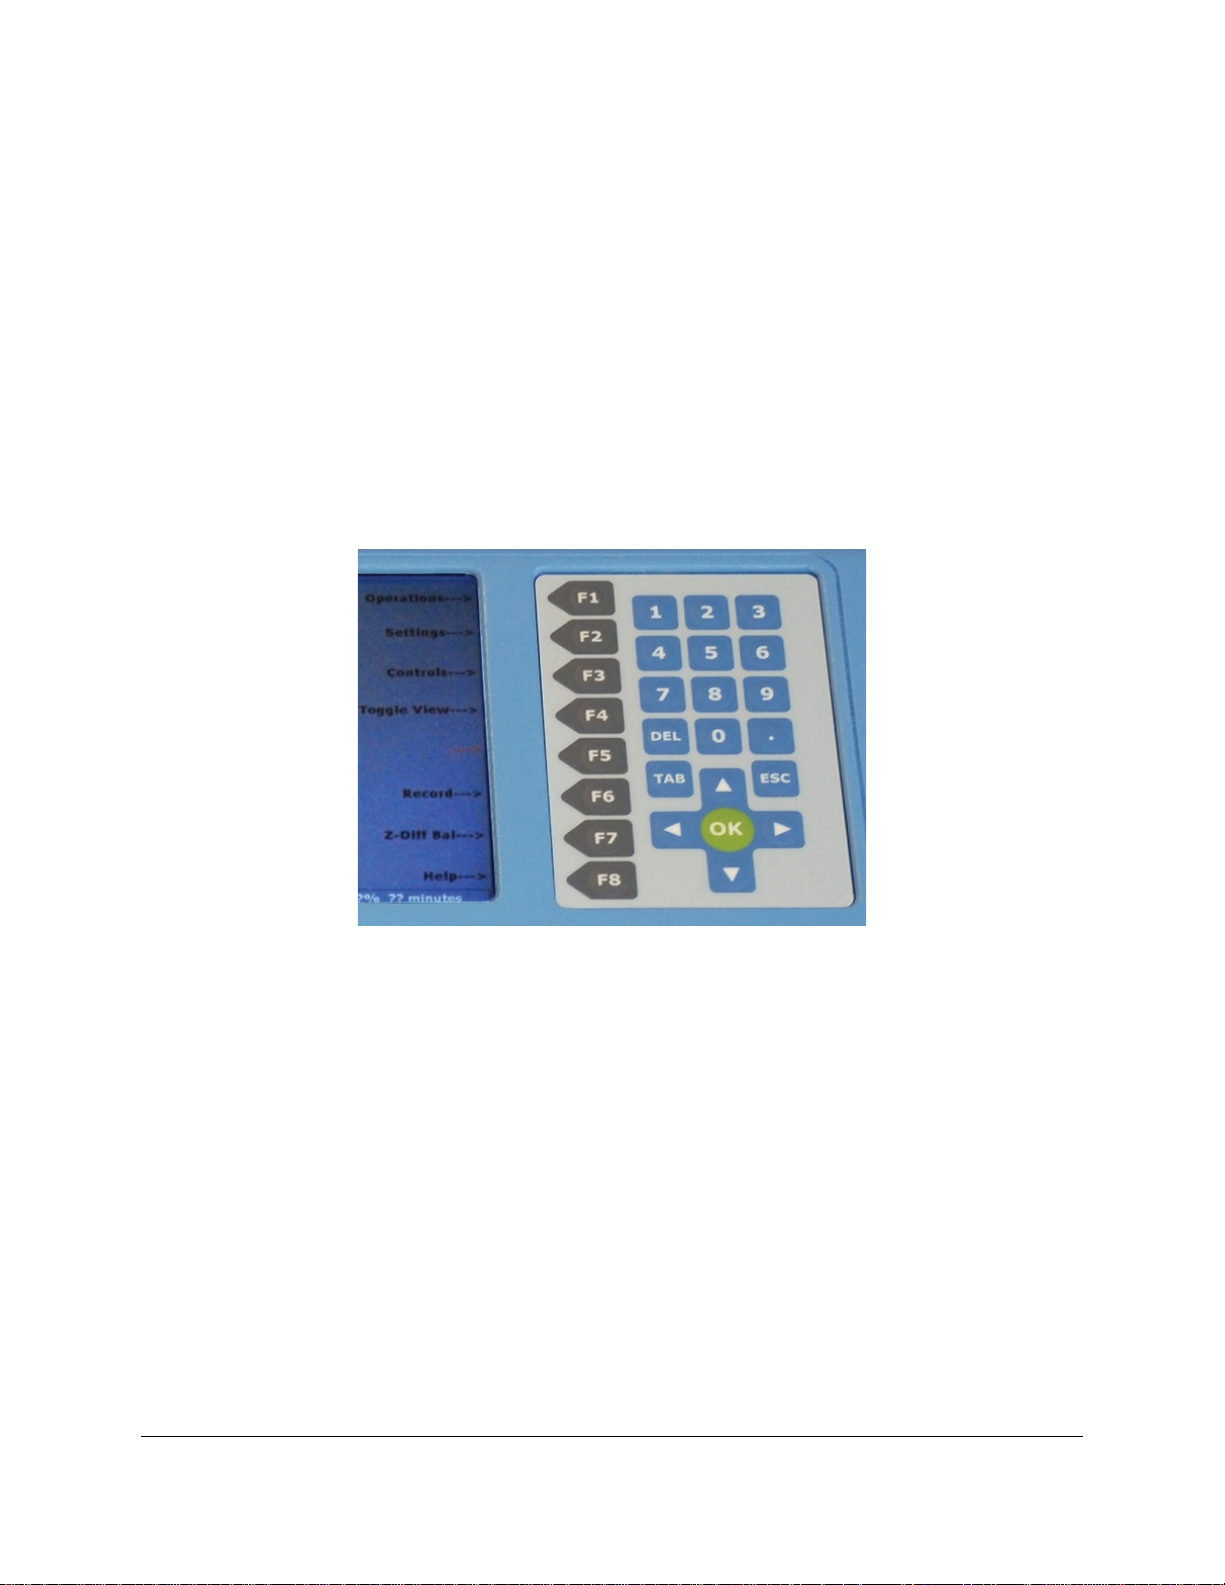
Section 5. CIRAS-3 Console Software
Overview
The CIRAS-3 console software is the most user-friendly and intuitive software we have designed to date.
All CIRAS-3 functions are accessed and implemented by the same easy-to-understand software structure
– Settings, Controls, Recording, Data Transfer, Diagnostics, Calibrations and other useful functions. The
CIRAS-3 Console software is the system’s command interface, based on function keys linked to first level
menus. Once you become familiar with how the menus are organized, navigation through menus
becomes simple – decide what you want to do and with a few key presses select your options from the
dialogs that you open.
The 8 function keys form the top level for menu selections. Function keys are context-sensitive, so as
you go deeper into a menu their assigned functions may change. Once a dialog is opened you typically
use the TAB key to quickly move through fields contained within the dialog. In the fields you enter values
with the numeric keypad or open a dropdown list and select an option from the list. DEL functions within
a field as a backspace key. OK confirms your selection from a dropdown list, while ESC closes the
dropdown list. Arrow keys are used to move up and down one item at a time within a list, or to move
horizontally to make selections from buttons that may be displayed. Select Accept and your dialog
changes are implemented by the hardware. Often you will be able to make customized changes or
perform essential functions with as few as three key presses.
Page 61
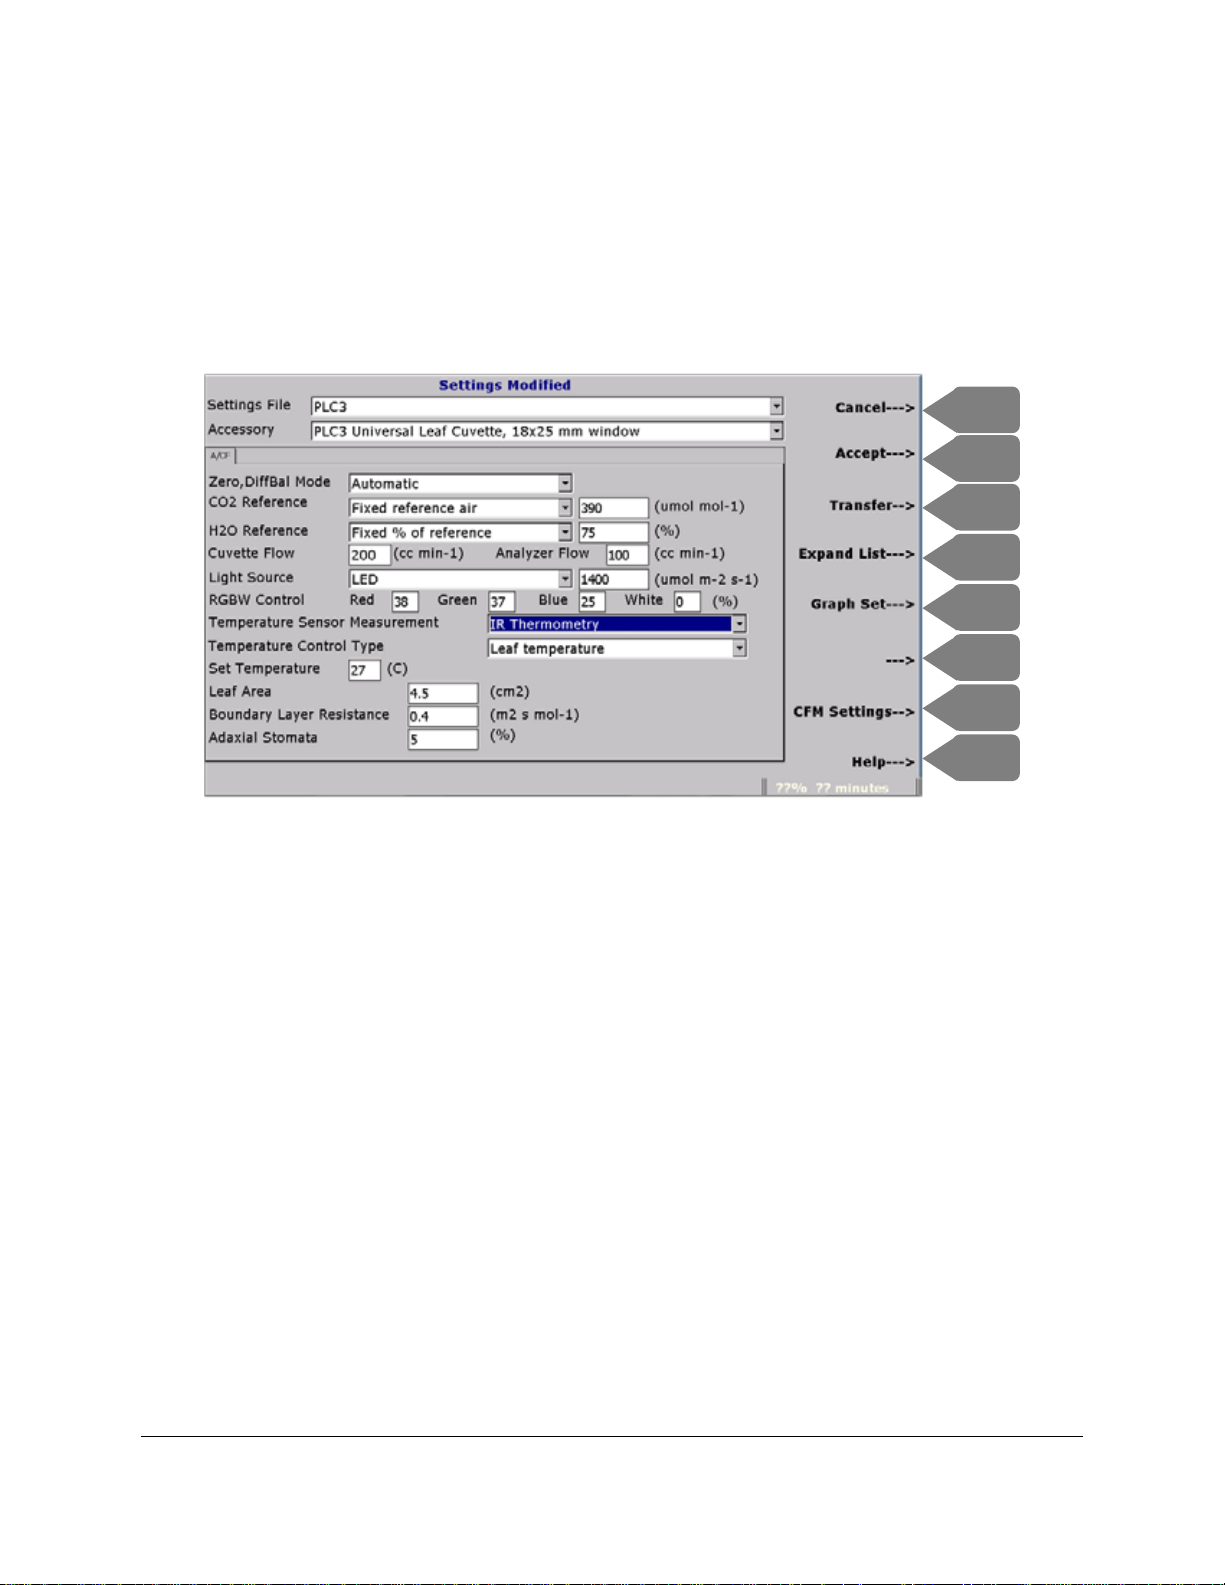
Basics of Navigating Console Screens and Menus
F1
F3
F2
F4
F6
F5
F7
F8
Let’s begin with a quick example of an action you are likely to perform – establishing the repeatable
baseline settings features that will appear each time you power on your system. We refer to these
settings as global, that is they define the operational environment of CIRAS-3 prior to making
measurements and collecting data. Power on the system and press Settings (F2) to open the Settings
dialog.
Several default setting files are included, representing the standard applications that can be run with
CIRAS-3. Use the Arrow keys or Expand List (F4) to select PLC3 from the Settings File list. Press the
TAB key to move to the next field, Accessory, and choose the appropriate cuvette window size, such as
18 x 25 mm shown above. Move down through the fields to make other changes to CO
, water vapor,
2
light, temperature control, etc. Holding down the TAB key will move the cursor very quickly through the
various fields, so don’t worry if you onl y need to change the last field in a dialog. Accept (F2) the
changes and continue to the data screens. Now, each time you power on the system these settings will
be loaded, unless you choose a different Settings File. Later you can define the default global settings for
other CIRAS-3 applications, such as soil respiration.
Controls functions are different from Settings in that they are used to update settings and make
necessary adjustments dynamically while operating CIRAS-3. During normal operation you will use
Controls (F3) almost exclusively to make alterations to the leaf chamber environment and to customize
how data is presented on the screen.
Page 62
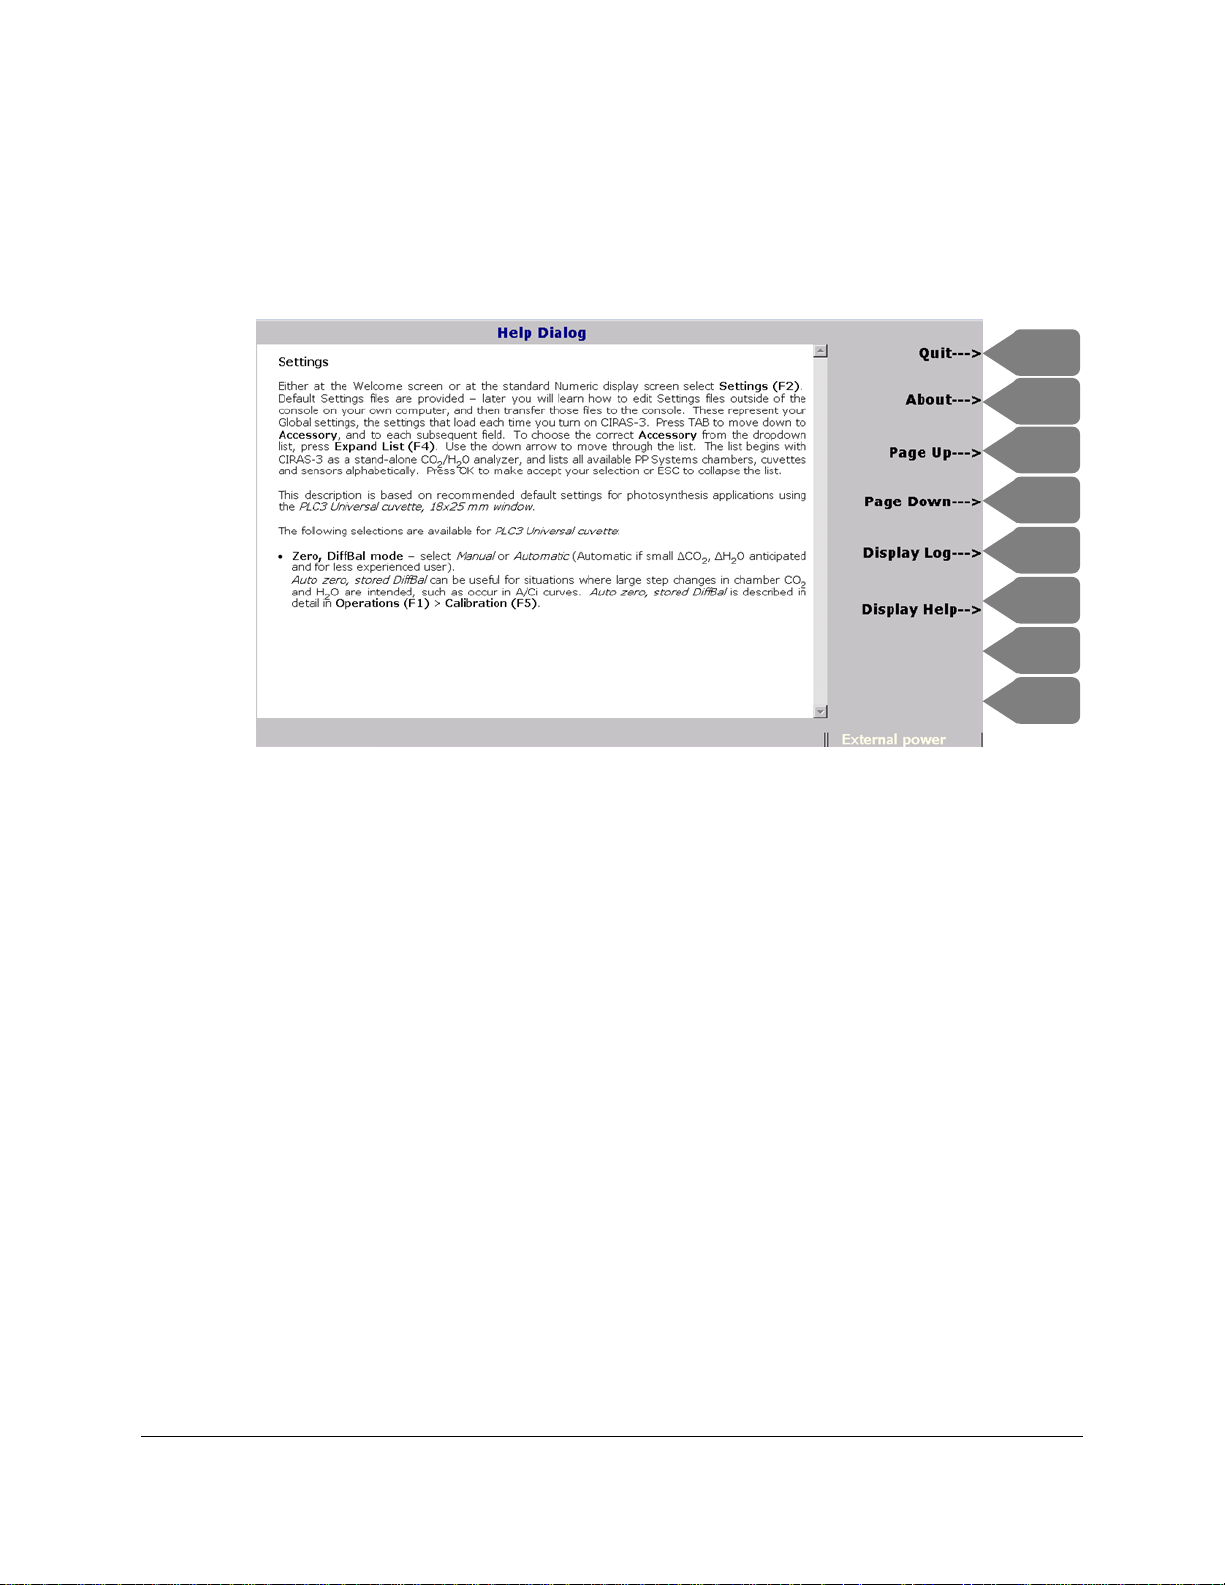
Help (F8) is available on every screen and is context-sensitive to the functions being performed. For
F1
F3
F2
F4
F6
F5
F7
F8
example, if you select Help while in the Settings screen you can view text directly related to the content of
the screen. Within the Help screen press Page Up (F3) or Page Down (F4) to read more content. Press
Display Log (F5) to see a running log of your session that saves calibration functions, warnings and error
messages with time stamps. Press Display Help (F6) to return to the Help file.
Numeric View of Data and Control Variables
As you familiarize yourself with CIRAS-3 you will begin to establish your own preferences of how and
what you would like to see on the console for differing circumstances of data collection and various
applications. Numeric View, as its name implies, provides an overview in numeric form of what is being
measured, calculated and controlled at any point in your CIRAS-3 session. The categor ize d inf or mation
is clearly placed in groupings on the screen: Measured Data, Photosynthesis Data, Fluorescence Data
and Environmental Controls.
Page 63
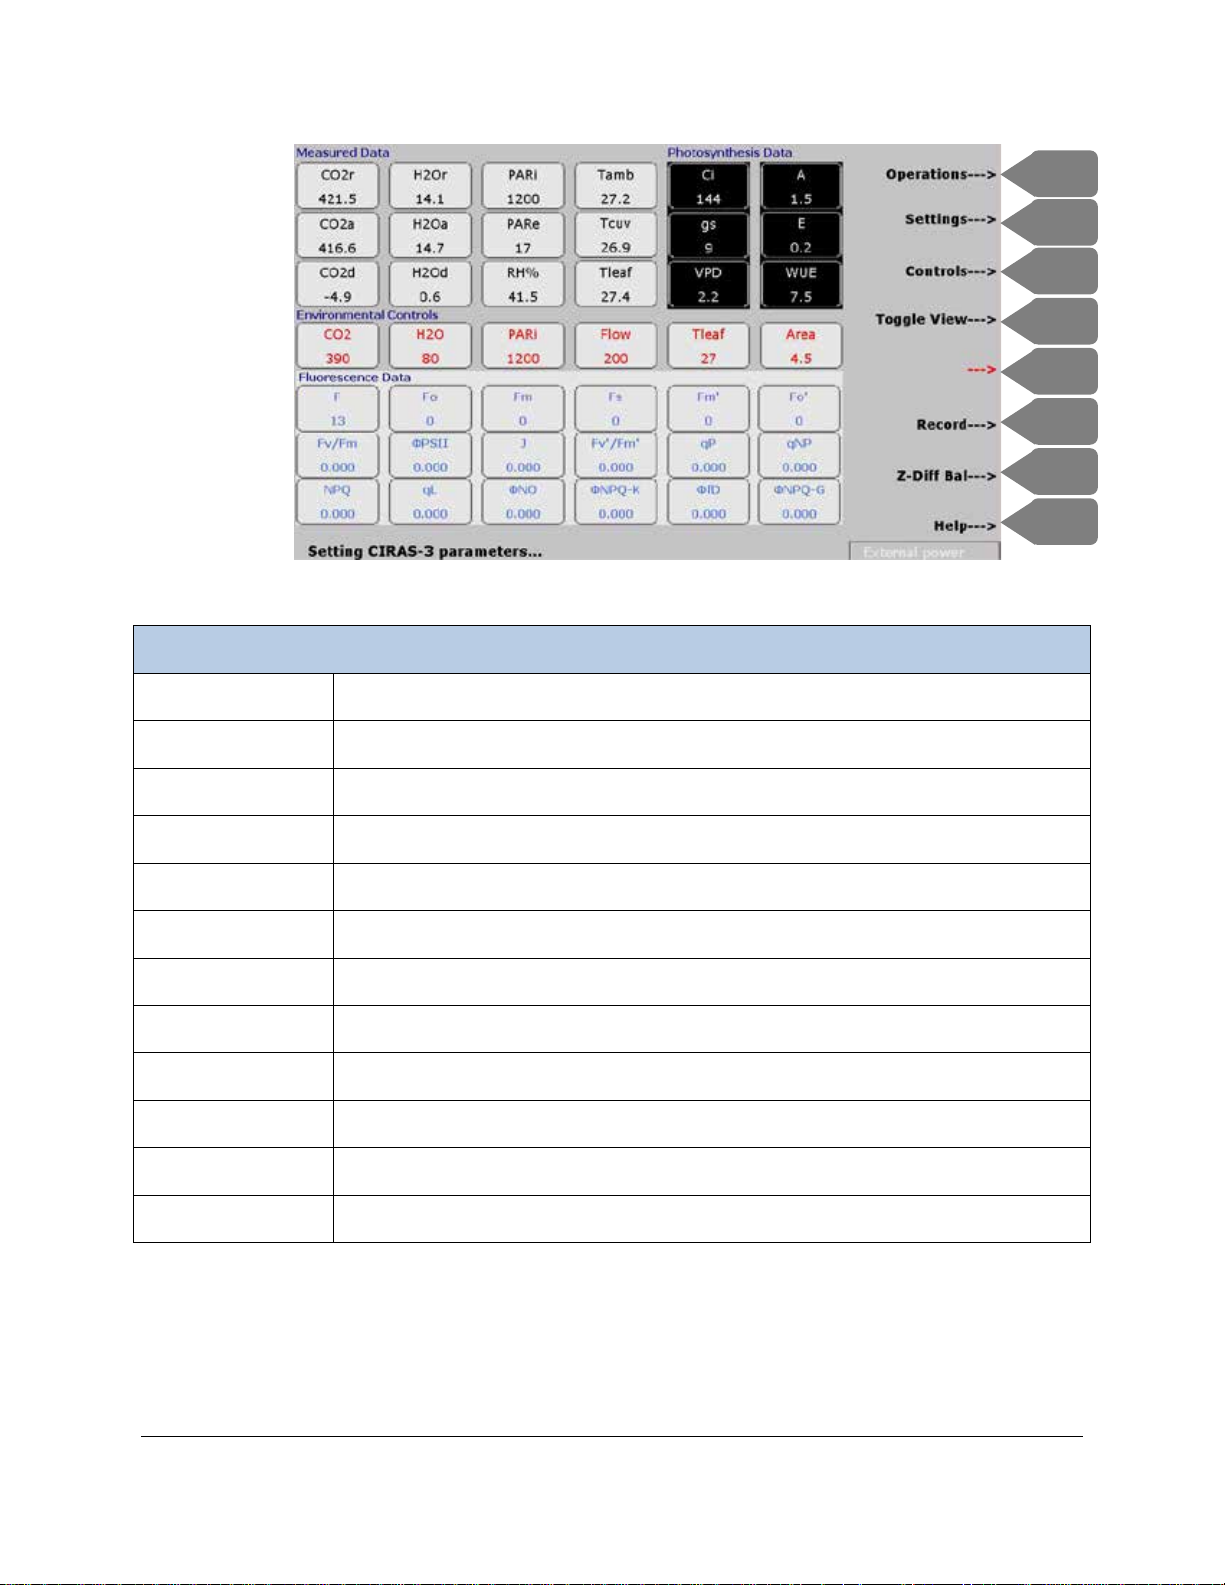
Measured Data
CO2r
CO2 Reference (µmol mol-1)
CO2a
CO2 Analysis (µmol mol-1)
CO2d
CO2 Differential (µmol mol-1)
H2Or
H2O Reference (mb)
H2Oa
H2O Analysis (mb)
H2Od
H2O Differential (mb)
PARi
PAR internal (µmol m-2 s-1)
PARe
PAR external (µmol m-2 s-1)
RH%
Relative Humidity inside leaf chamber (%)
Tamb
Temperature ambient (oC)
Tcuv
Temperature in cuvette (oC)
Tleaf
Leaf temperature (oC)
F1
F3
F2
F4
F6
F5
F7
F8
Page 64
Photosynthesis Data
Ci
Sub-stomatal CO2 concentration (µmol mol-1)
A
Assimilation/Respiration (µmol CO2 m-2 s-1)
gs
Stomatal conductance (mmol H2O m-2 s-1)
E
Transpiration (mmol H2O m-2 s-1)
VPD
Leaf to air vapor pressure deficit (kPa)
WUE
Photosynthetic water use efficiency (mmol CO2 mol-1 H2O)
Environmental Controls
CO2
CO2 Reference (µmol mol-1)
H2O
H2O Reference (mb)
PARi
PAR internal (µmol m-2 s-1)
Flow
Cuvette flow rate (cc min-1)
Tleaf
Temperature control method
Area
Leaf Area (cm2)
Page 65

Chlorophyll Fluorescence Data
F
Fluorescence signal (current)
Fo
Fluorescence origin
Fm
Fluorescence maximum
Fs
Fluorescence steady state
Fm’
Fluorescence maximum prime
Fo’
Fluorescence origin prim e
Fv/Fm
Maximal yield of photochemical efficiency
ϕPSII
PSII operating efficiency
J
Thylakoid electron transport rate (µmol e- m-2 s-1)
Fv’/Fm’
PSII operating efficiency, far-red
qP
Photochemical quenching
qNP
Non-photochemical quenching
NPQ
Non-photochemical quenching
qL
Photochemical quenching, lake antenna model (Kramer)
ϕNO
Non-photochemical quenching, non-regulatory (Kramer)
ϕNPQ-K
Non-photochemical quenching, down-regulatory (Kramer)
ϕfD
Non-photochemical quenching, non-regulatory, lake or puddle models (Genty,
Hendrickson)
ϕNPQ-G
non-photochemical quenching, down-regulatory lake or puddle models
(Genty,Hendrickson)
Page 66

Section 6. Startup Routine and System Stabili ty Checks
Before You Power Up CIRAS-3
The time required to be up and running from when you power on CIRAS-3 to when you make your first
measurement is reasonably short. Much of the pre-operation phase depends on the how well you
maintain chemicals. But there are a few other important considerations. The most basic pre-operational
checklist can be summarized by these items:
• Be sure that the chemicals are fresh and not exhausted.
• Check that the leaf chamber gaskets are in good condition and replace them if they are
compressed, damaged, or dirty.
• Be sure there is sufficient battery power for field operation. For optimal performance, we
recommend charging the internal CIRAS-3 Li-ion battery(s) the night prior to field
measurements using the power supply adapter provided. The indicating LED on the
CIRAS-3 console will be a steady green when connected to the charger/power supply.
The actual state of the battery can be viewed in the lower right hand corner of the display
when powered on.
• Make all necessary electrical connections of cuvettes, accessories and other components
• If working at high ambient temperatures (>35-40
to prevent overheating.
• Keep the CIRAS-3 on its power supply adapter during warm up to preserve the battery.
• If using a CO
through your measurements. See CO2 Cartridge Status on page 68
cartridge, make sure that one is in place with enough capacity to get you
2
o
C), we recommend shading the console
.
Page 67
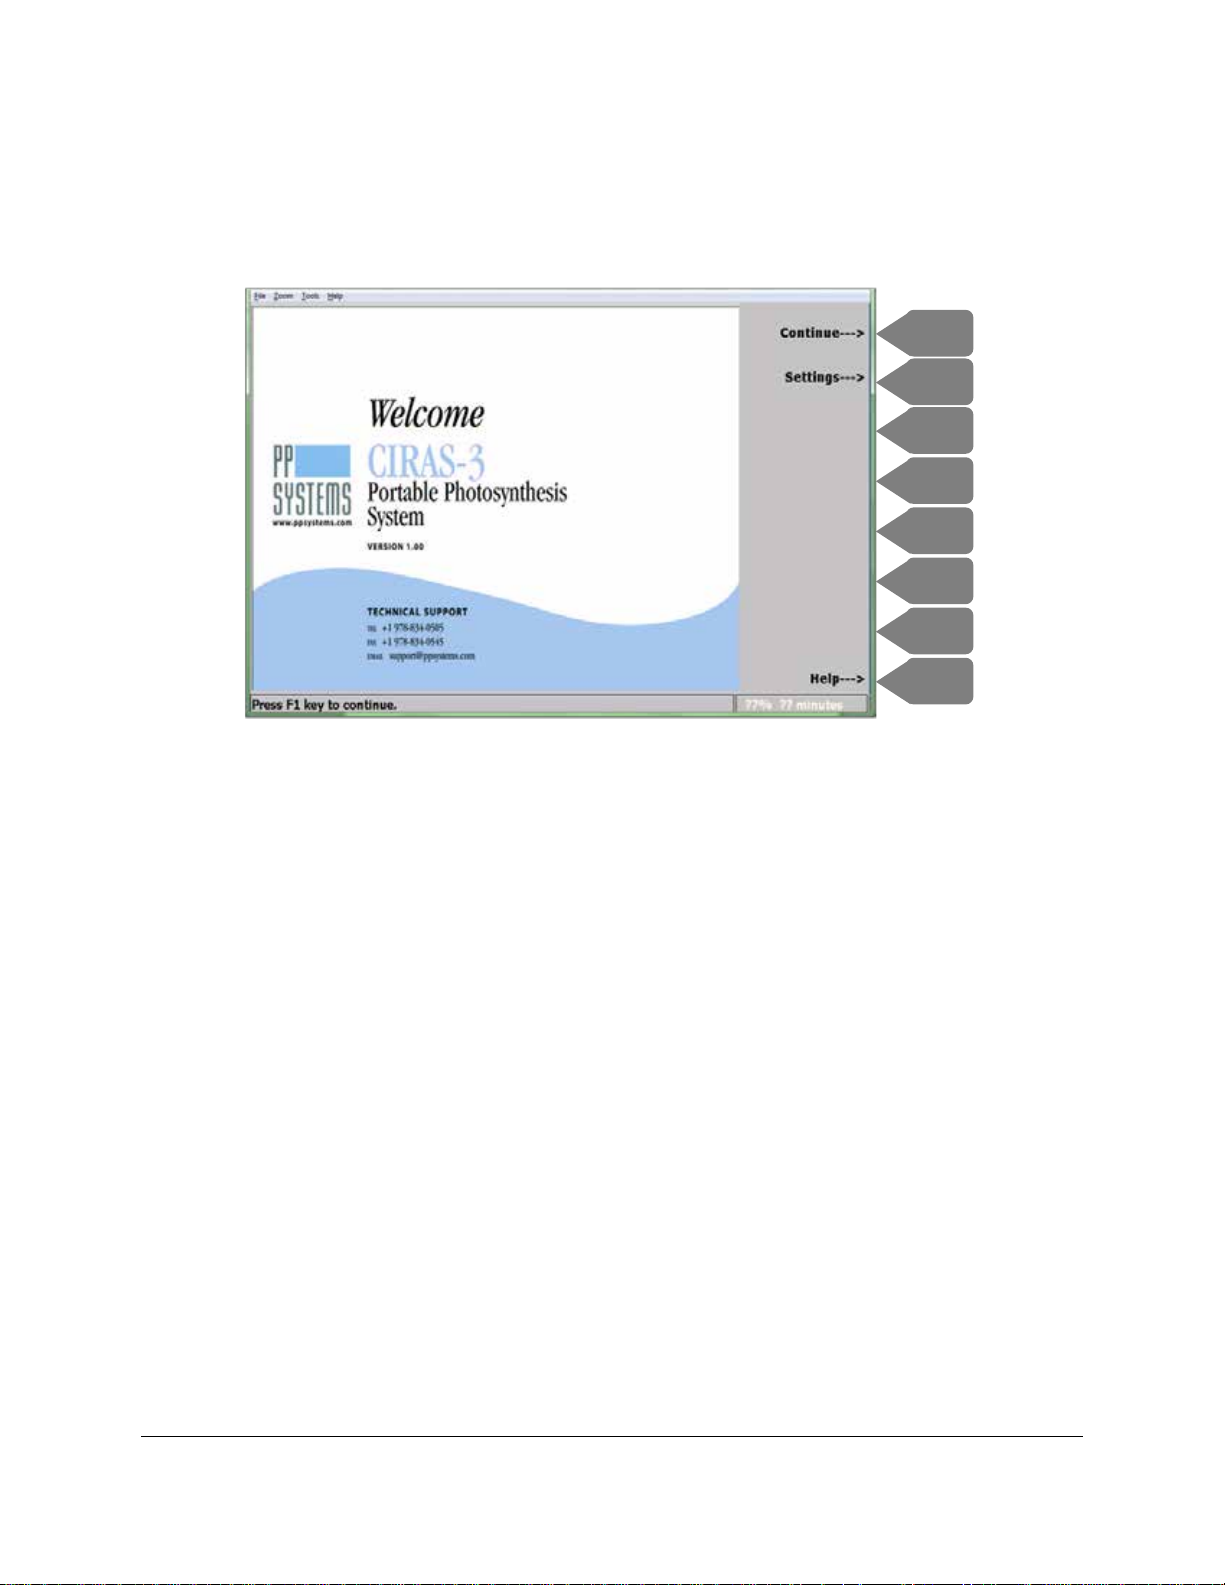
Startup and Warm up
F1
F3
F2
F4
F6
F5
F7
F8
Press and release the ON/OFF button, it should illuminate blue. It takes approximately 30 seconds for
the first Welcome display to appear on the console screen.
Press either Continue (F1) or Settings (F2) – at this point this is not important since the system is not
quite ready to operate. “Warm up (temp) C…” appears in the status bar at the bottom of the screen,
where initial (temp) should be close to ambient temperature °C. Note that the initial temperature depends
on the ambient temperature where CIRAS-3 is located. Warm up time to the required 55 °C IRGA
temperature can vary based on ambient temperature. The warm up period can be only several minutes
in a mild or warm environment (in the laboratory) and longer if it has been stored in a colder environment.
Automatic Zero and Differential Balance (Diff Bal) cycles will run during warm up, in each case counting
downward from a fixed number of cycles. Zero counts down 30 cycles while Diff Bal counts down 25
cycles. Each cycle takes less than one minute.
Once the IRGA achieves its target temperature of 55 °C, it will then perform both a Zero and Diff Bal cycle
at time 0, 6, 12, 23, 39 and 59 minutes. After this, it will perform a Zero only once every 31 minutes
followed by a Diff Bal. A Diff Bal cycle will also take place when there is a large change in CO
-1
(100 µmol mol
) or H2O (5 mb) concentration.
2
Page 68
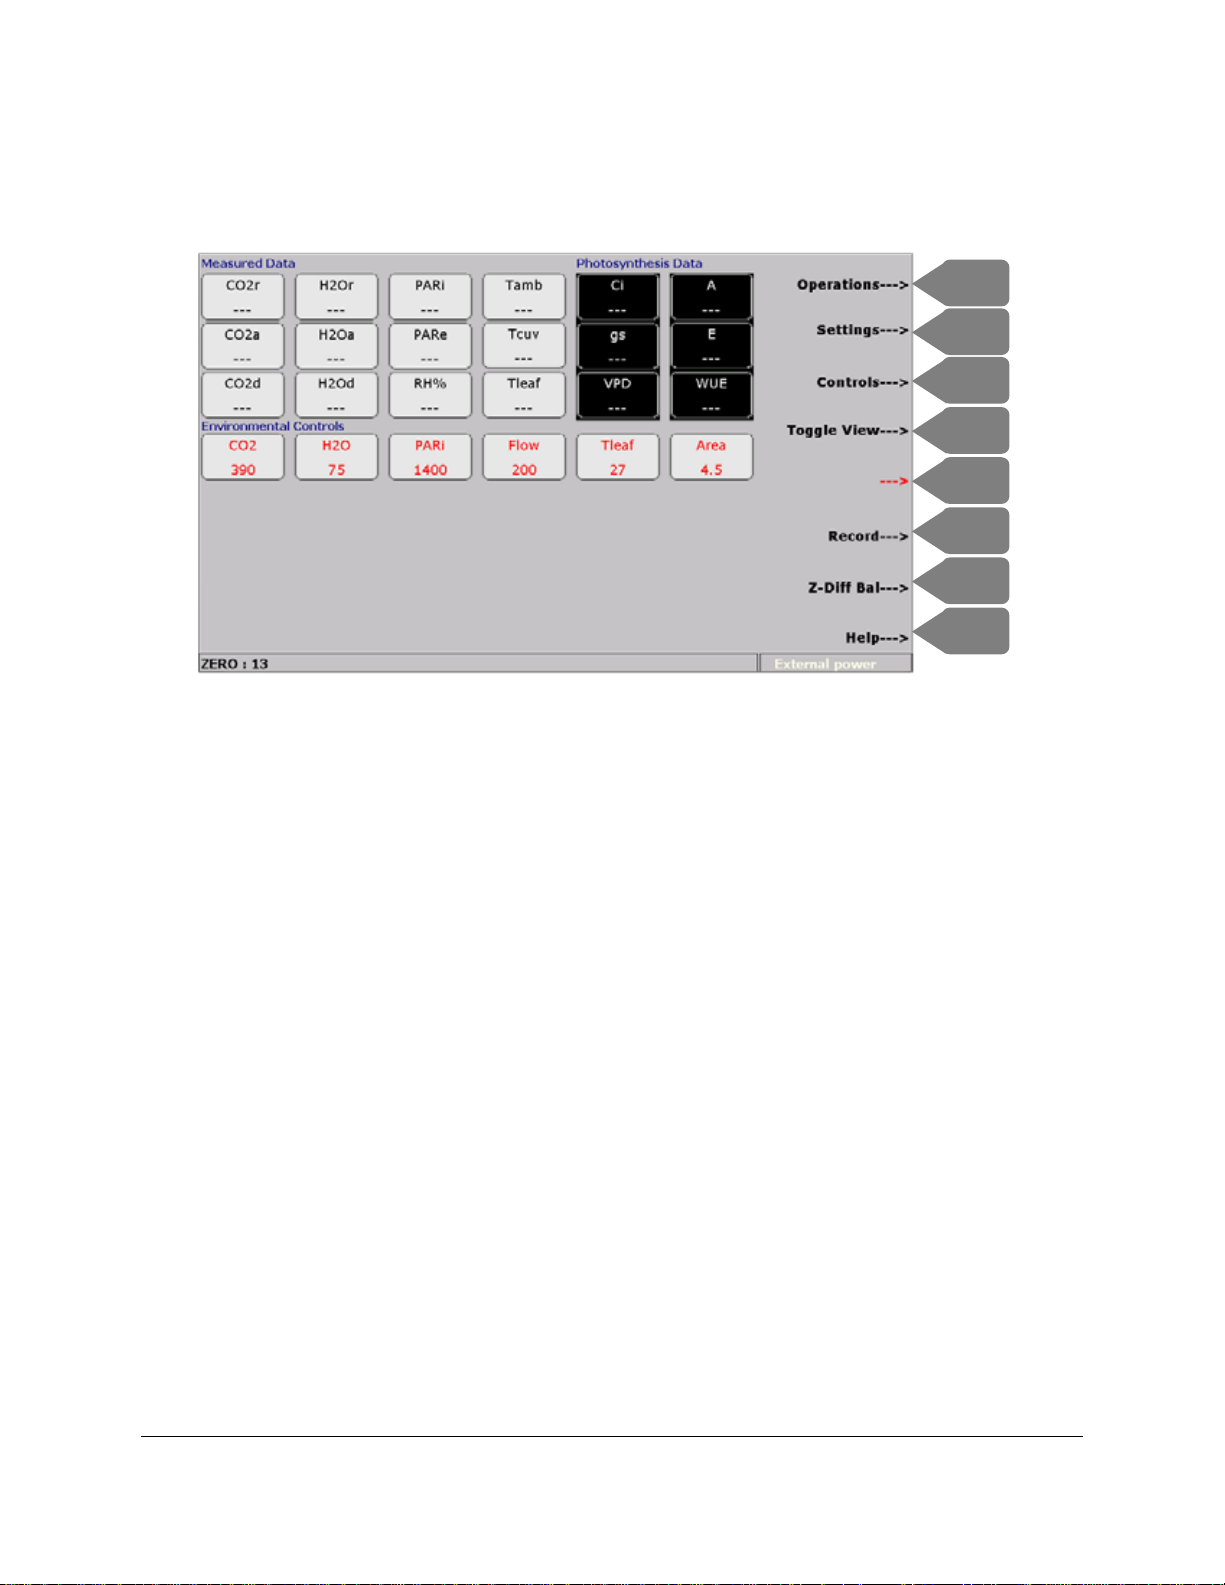
Assume that we want to enter the Numer ic View screen, press Continue (F1). The Numeric View
F1
F3
F2
F4
F6
F5
F7
F8
screen will appear as below (at this point CIRAS-3 is in its warm up phase, so live data is not displayed):
When the warm up phase is completed you will begin to hear a clicking sound from the CO
mixer valves,
2
switching at a rate of 4 Hz. The amount of time the valve is on (the duty cycle) varies to generate the
correct CO
O control is silent (completely on or off) at settings of 0 and 100%, but any other setting produces a
H
2
mix ratio. Just after the system warms up the mixer starts to generate the requested ratios.
2
noticeable clicking sound. You will also notice that the data fields in the Numeric View screen are now
updating with live data approximately every 2 seconds. Data will update and be displayed in the fields
except when the system is performing a Zero or Diff Bal.
CO2 Cartridge Status
How do I know when to change the CO2 cartridge? This is a common question that is asked especially
when several different people ar e using the CIR A S-3 and it is unkno wn as to when a new cartr idg e was
inserted into the CIRAS-3. We can’t meter the cartridge precisely so it’s impossible to know exactly how
much gas remains after operating the system. The high concentration gas slowly diffuses through the
regulator nozzle even when you are not operating CIRAS-3. The rule of thumb is that a newly inserted
cartridge will last at least one full days operation. The actual life of an individual CO2 cartridge is
CO
2
dependent on:
1. Hours of operation
2. CO
control range
2
Page 69
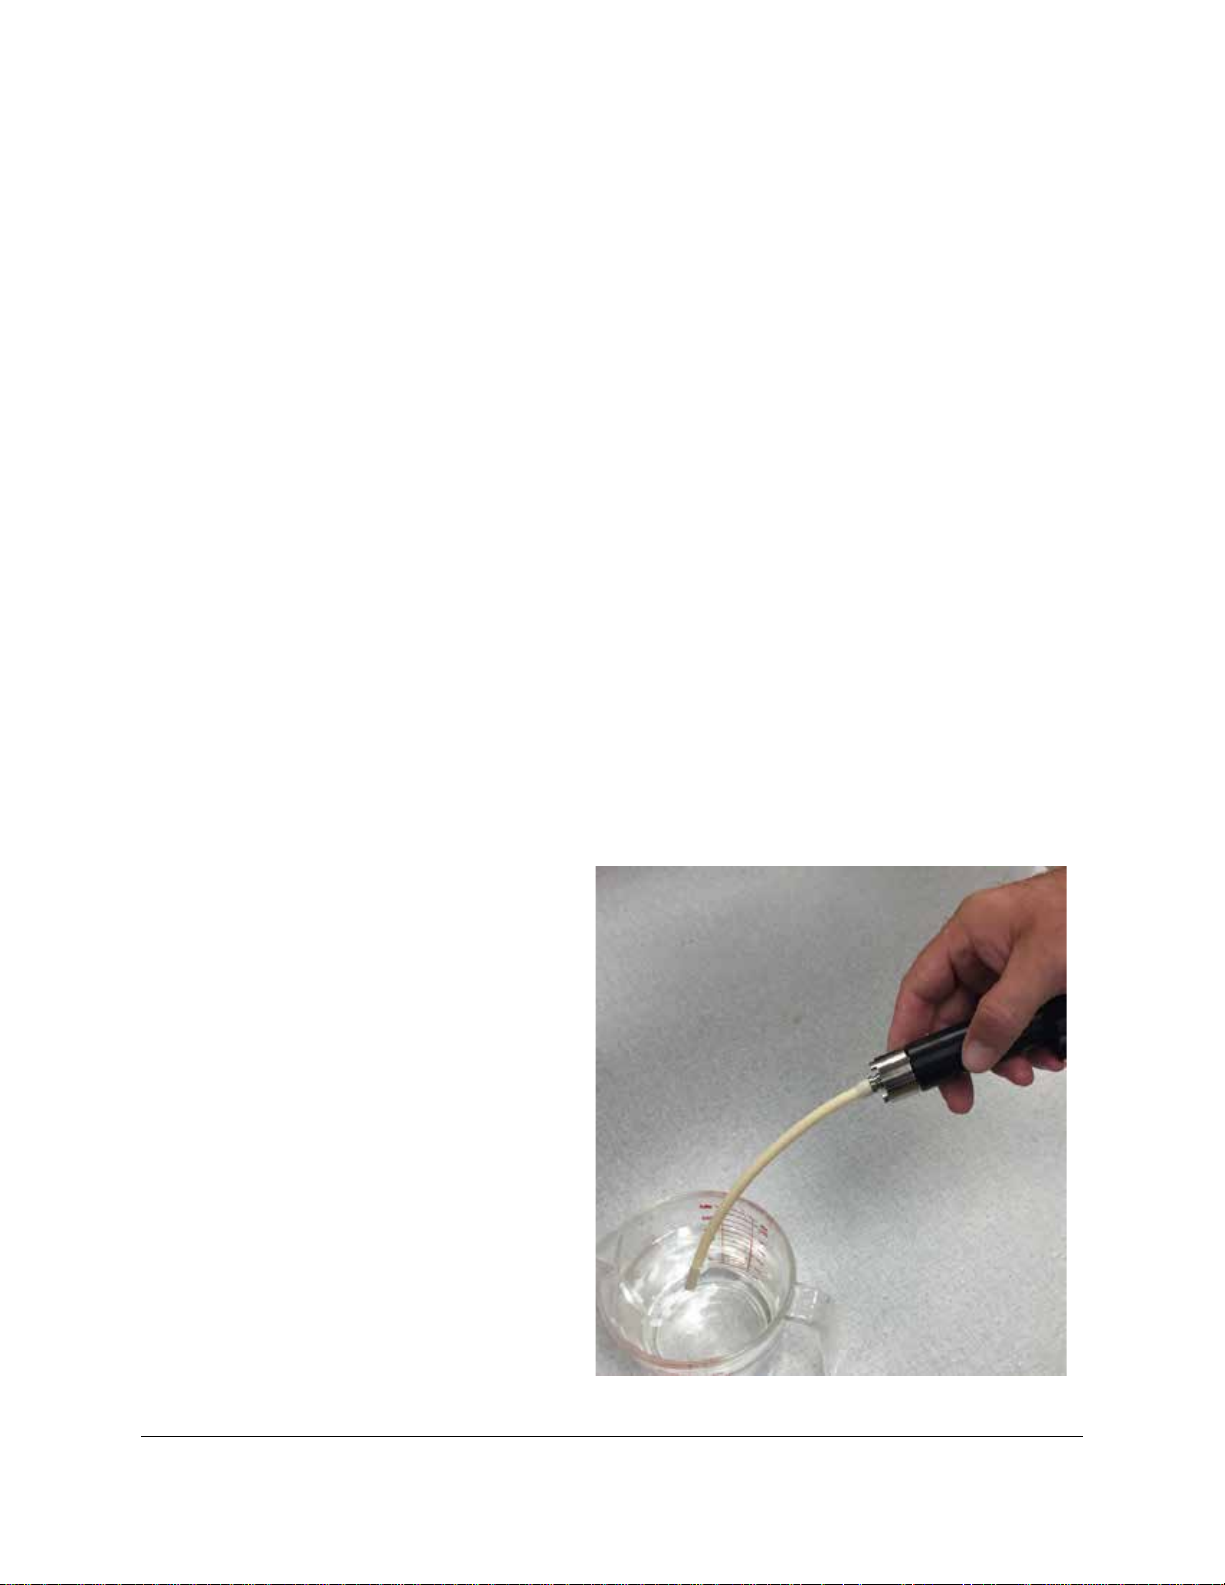
For instance, if the CIRAS-3 is operating for long periods throughout the day and at high CO2
concentrations, we would expect that when you turn on the system the following day the CO
cartridge
2
will be low and it is safe to change out. If the CIRAS-3 is operating for just a short period of time
throughout the day (i.e. less than 4 hours in total) and at approximate ambient CO
-1
µmol mol
), you will likely have enough CO2 to get you several more hours of use the day after a CO2
concentration (i.e. 390
2
cartridge is installed.
If unsure of how much CO
is still available from the cartridge, we recommend the following simple test:
2
1. Power up the CIRAS-3 system as described above.
2. After warm up and with the numeric or graphical display on the console LCD, press Controls
(F3).
3. Set the “CO2 Reference” to 2000 and hit Accept (F2).
Monitor the CO2r (CO
2000 you can proceed with measurements without having to change out the CO
Reference) value. After a minute or so, it should reach 2000. If the CO2r reaches
2
cartridge. Note, keep
2
an eye on the CO2r during your measurements and if you observe the CO2r starting to drop slowly this is
a good indication that the cartridge is exhausting and we recommend changing it. If it does not reach
2000, this is a good indication that the CO
is low or starting to get low and it is safe to change out the
2
cartridge as the CO2r will likely become unstable within a short period of time.
Another quick and simple check to see i f you
have a pressurized CO
the entire CO
cartridge holder and regulator
2
cartridge is to remove
2
assembly from the CIRAS-3 console. To do so,
turn the cartridge holder a quarter-turn counterclockwise and pull the entire assembly out from
the console. Next put a small piece of flexible
tubing on the end as shown here and place the
tip of the tubing in the water. If a CO
cartridge
2
is pressurized you should see a steady bubble at
approximately 1 second intervals. If the CO
2
cartridge is not pressurized you will not see any
bubbling indicating that it is safe to change out.
Page 70

We do not recommend removing a CO2 cartridge for at least 24 hours after it was inserted and
with the CO
regulator assembly fitted to the CIRAS-3 console. If you do, the pressurized
2
cartridge will make a loud popping noise and the pressure may cause the internal tubing
associated with the gas blender to be re m o ved from the back of the CO
regulator or gas mixing
2
diverter valve.
Changing a CO2 Cartridge
This is very easy to do. With the CO2 cartridge holder still inserted into the CIRAS-3 console, turn the
cartridge holder slowly to the left (counter-clockwise) until you start to hear the gas release (unless it is
already empty). The cartridge will then release from the piercing pin and you can safely remove the
holder from the regulator by continuing to turn the holder counter-clockwise until it is removed. It is also
possible to remove the entire CO
as described above.
Insert a new CO
cartridge into the holder and screw it into the regulator turning the holder clockwise until
2
snug. We recommend doing this with the CO
entire assembly removed from the console, place a new CO
the console and turn the holder a quarter-turn clockwise to lock it in place and then continue until snug.
You might hear a small hiss sound as the pressurized CO
small amount of gas. This is normal. Continue tightening the holder until snug and do not overtighten.
cartridge holder and regulator from the CIRAS-3 console if you prefer
2
regulator fitted to the CIRAS-3 console. If you have the
2
cartridge in the holder and put it back into
2
cartridge is getting pierced releasing a very
2
Checking Stability - Before You Place a Leaf in the Chamber
Now that you can observe live readings you can check the system for stability and leaks. This is usually
done with the leaf chamber empty. This way you can isolate the cuvette gaskets for leaks. Press
Controls (F3) and enter the CO
For now, use the default H
change to return to the Numeric View screen. These tests are mainly concerned with stability of CO
O. You can quickly check temperature and light later. Close the leaf chamber at this point.
H
2
Under the Measured Data group observe the values in the first two columns, CO2r, CO2a, CO2d, H2Or,
H2Oa, H2Od. Allow CO2r (Reference CO
see the Analysis CO
(CO2a) equal to or nearly equal to CO2r. If this is the case there will be a Zero
2
differential, CO2d=0.0. Look for the same relationships in the water vapor data, H2Or, H2Oa, H2Od.
concentration that you might be working with, let’s say 390 µmol mol-1.
2
O Reference control option “Fixed % of reference” and 100%. Accept the
2
) to become stable. With no leaf in the chamber we expect to
2
and
2
Page 71
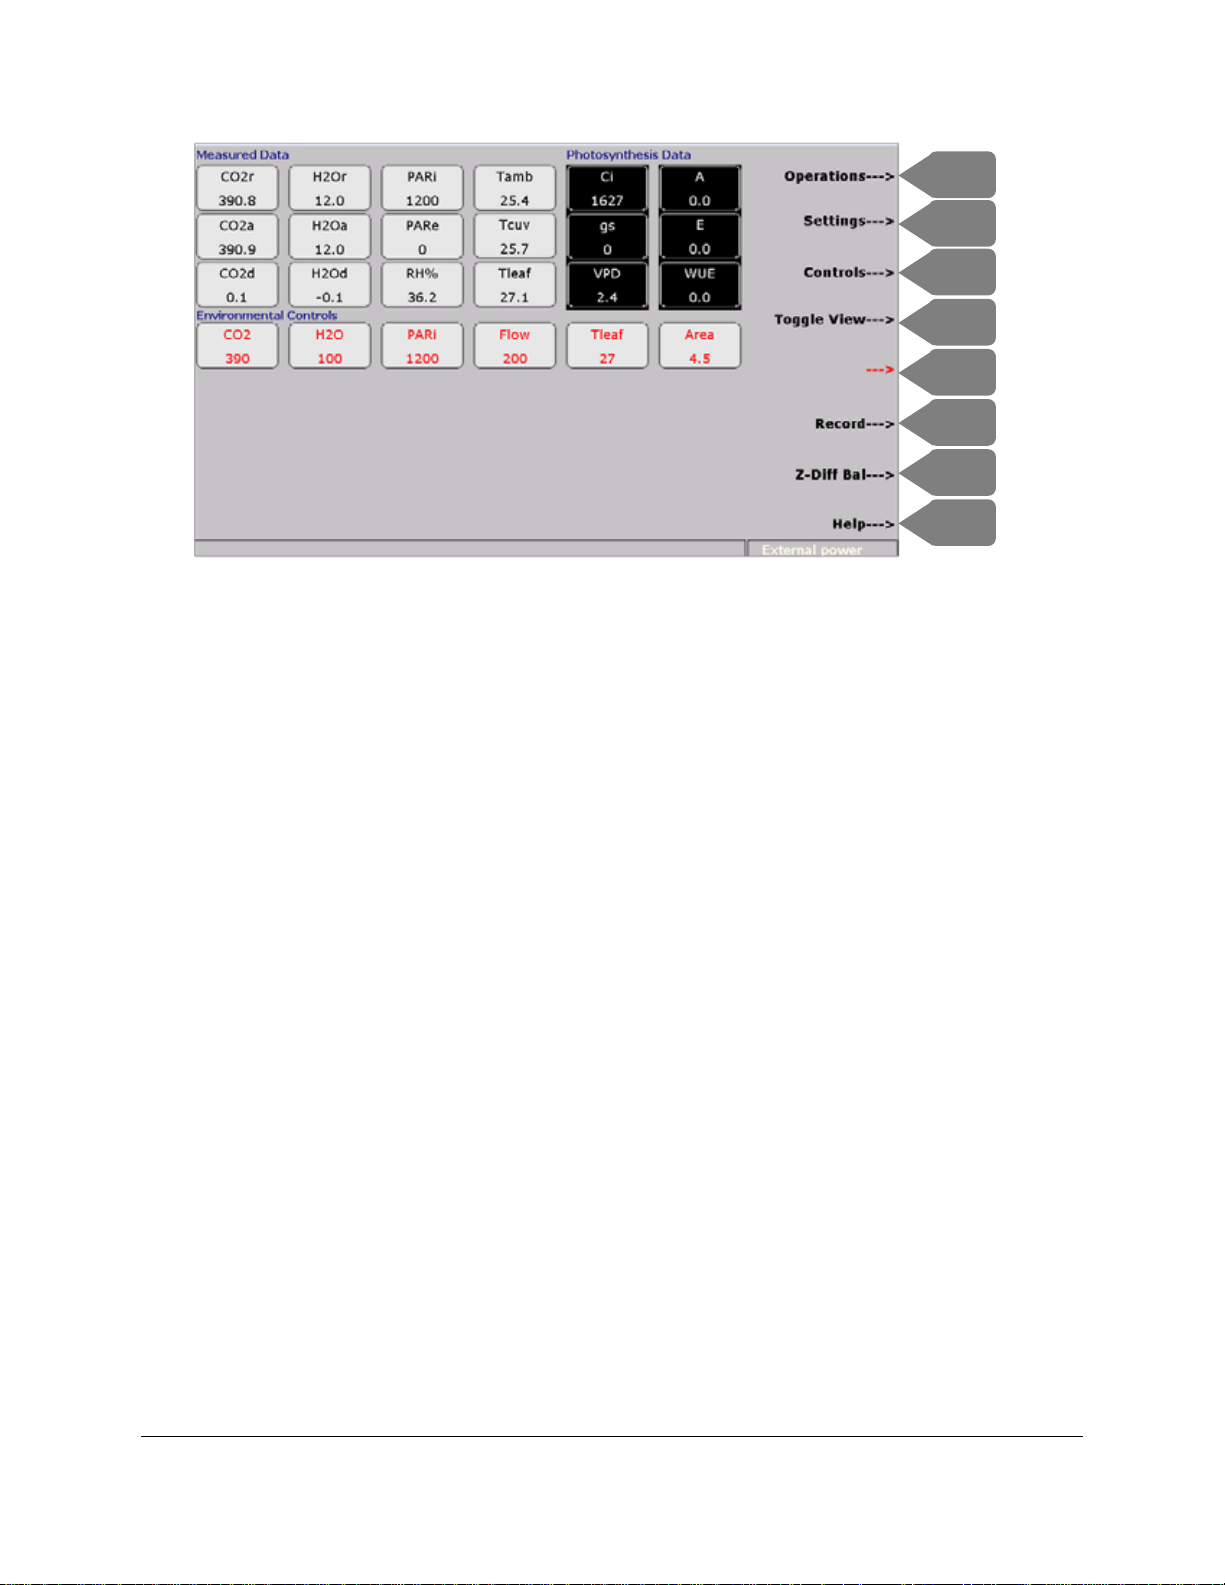
F1
F3
F2
F4
F6
F5
F7
F8
While CO2d and/or H2Od=0.0 is ideal, it is common to see a small differential even under the best of
circumstances. With experienc e, you will be in the bes t posit ion to deci de what is or is not an accepta bl e
differential, and to take action to try to correct it. Whether an empty-chamber differential is acceptable or
not is often dependent on the scale of gas exchange rates expected over the course of your
measurements. A small differential will hardly be noticed when it occurs along with high photosynthetic
rates, but could present a significant problem if the focus of your data is miniscule rates of gas exchange,
such as occur near light compensation points and with dark respiration. If during this test CO2d >0.5 you
can try waiting a little longer in case this is being caused by small fluctuations in CO
-1
CO2r fluctuation of even 0.1 µmol mol
will result in a small transient differentia l. If CO2d remains >0.5
control. In theory, a
2
and stable, try running Diff Bal (F7). Other causes could be imperfect gaskets or improper tension
adjustment of the cuvette. Keep in mind also that CO
enter the Analysis gas stream if strong gradients exist. For example, suppose your CO
-1
390 µmol mol
and the test location is indoors where the CO2 concentration is 600-800 µmol mol-1. CO
in air surrounding the cuvette is more likely to
2
control value is
2
2
in the surrounding air can enter the chamber through any existing leak. Cuvette flow rate is another
factor that influences the magnitude of detectable leaks. Higher flow rates create a slight chamber
overpressure that can slow or prevent CO
this you might deduce that the most rigorous leak test involves creating a large gradient of CO
in surrounding air from diffusing through the gaskets. From
2
between
2
the air inside and outside of the leaf chamber, while supplying the lowest flow rate to the chamber.
Survey Measurements – Some Tips
There are a few basic points to consider before you begin recording data. In many instances, the leaf
blade/vegetation may extend beyond the foam gasket surrounding the leaf area opening. Try
approaching the leaf from the side with the cuvette head open to avoid accidental injury to the leaf.
Approach the leaf from its side margin, not the leaf tip, to avoid crushing it in the rear section of the leaf
chamber. Try to orient the cuvette to the leaf and do not severely twist the petiole. Use a tripod if
Page 72
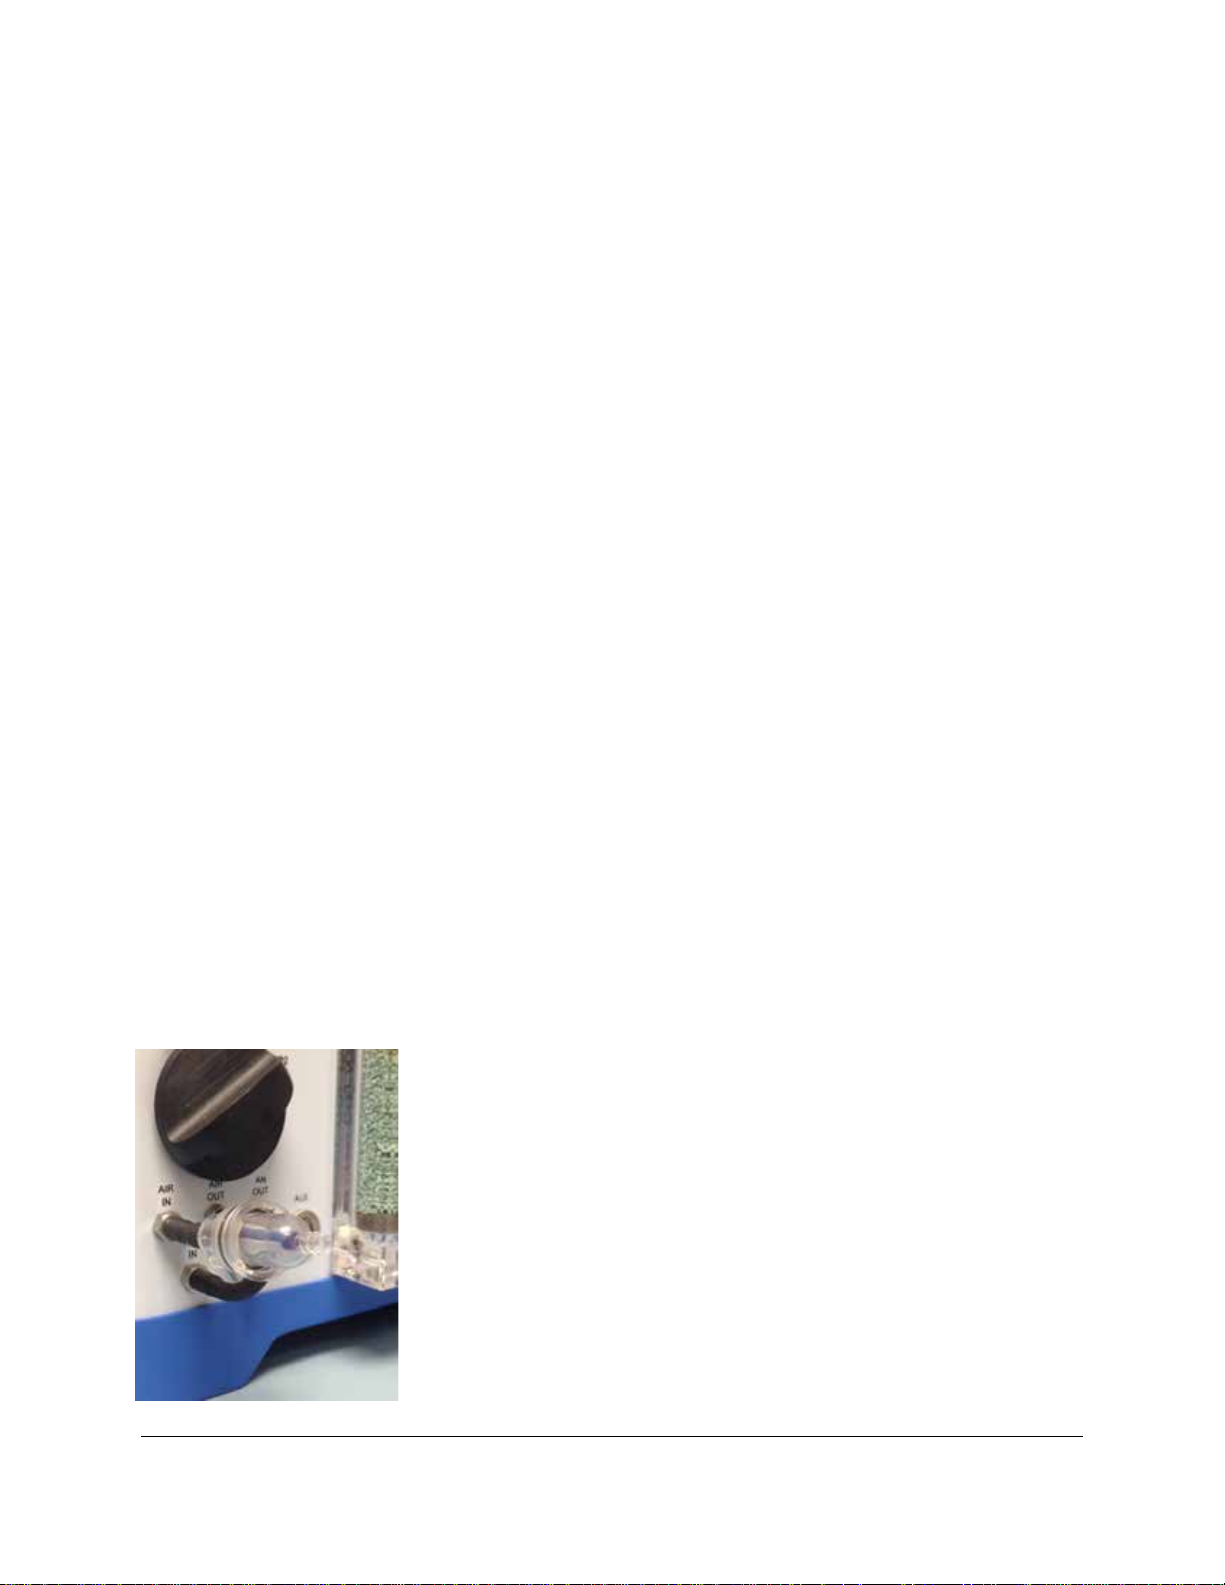
practical – this way you will have both hands free and avoid unnecessary changes to natural leaf
orientation, and you can position all leaves in a uniform orientation to the sun when the LED light unit is
not in use.
With the leaf enclosed in the cuvette you should quickly notice a series of dynamic leaf responses,
assuming ideal physiological conditions. Sub-stomatal CO
being initially equal to or higher than the reference CO
concentration (Ci) will begin to fall, after
2
concentration (CO2r). When Ci<CO2r there is an
2
instantaneous change in calculated net photosynthesis (A), from a negative rate (respiration) to a positive
rate. Simultaneously, the differential CO
concentration (CO2d) will go into negative values while
2
differential humidity (H2Od) becomes positive – the leaf is both fixing carbon dioxide and transpiring
water vapor. Be aware of the leaf’s light history and consider how that affects the chamber acclimation
phase – a highly-shade tolerant plant or shade leaf will require different acclimation in the leaf chamber
than a shade-intolerant or sun leaf. Consider also seasonal affects and leaf ontogeny – reduced rates of
metabolism can often be expected despite year-round plant culture in artificial (indoor) environments.
Note that some physiological variables, especially A, gs (stomatal conductance) and CO2d will continue
changing as the leaf acclimates and approaches a stable state. This can require several seconds and as
long as several minutes. This depends largely on the preconditioned state of the plant relative to the
environmental conditions inside the cuvette. A useful illustration of this can be seen with a highly shadeadapted plant that is suddenly exposed to strong light intensities in the leaf chamber. In this case,
delayed gas exchange responses can be expected compared to a plant (or leaf) accustomed to more
intense light conditions. If your goal is to collect a large quantity of relatively short duration
measurements from a large sample group of plants/leaves, especially when allowing ambient light and/or
temperature conditions to prevail, you will probably use the Manual Recording option. This allows you
maximum flexibility as to when to capture a reading and when to wait.
Additional Filtering in Dirty/Dusty Environments
If working in extreme dirty/dusty environments, we strongly recommend
using the external air in filter (included in your CIRAS-3 spares kit). It
easily connects to the CIRAS-3 “AIR IN” port as shown here.
Page 73
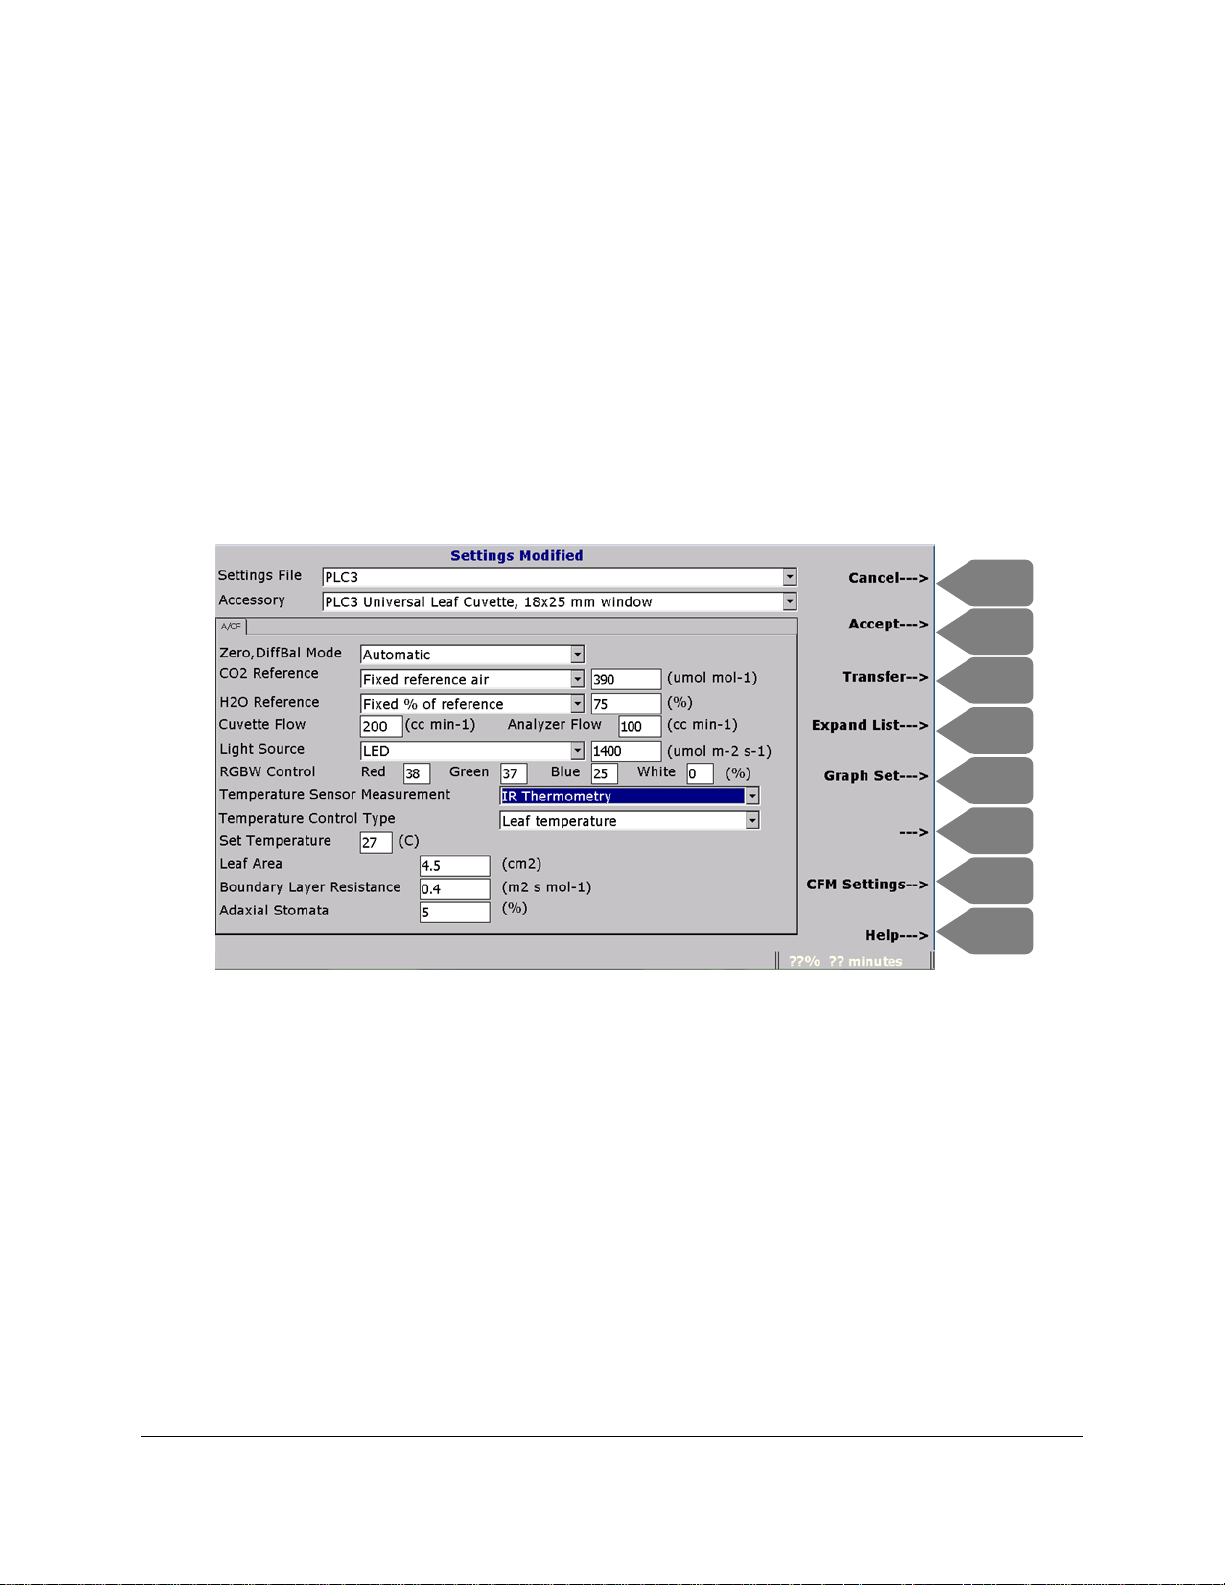
Section 7. Basic Func ti ons - Viewing and
F1
F3
F2
F4
F6
F5
F7
F8
Controlling CIRAS-3
Settings (F2)
Settings are essentially defined as operational environments that are recreated each time that CIRAS-3 is
powered on. The options that you choose here could be your typical working options in many cases, but
it is also likely that you will need to change and adapt for different leaf samples, species and
environmental conditions, as well as for imposing experimental conditions on the leaf.
Either at the Welcome screen or at the standard Numeric View screen, select Settings (F2). Default
Settings files are provided based on the Accessory selected (later you will learn how to edit Settings files
outside of the console on your own computer, and then transfer those files to the console). Press TAB to
move down to Accessory and to each subsequent field. To choose the correct Accessory from the
dropdown list, press Expand List (F4). Use the down arrow to move through the list. The list begins with
CIRAS-3 as a stand-alone CO
chambers, cuvettes and sensors alphabetically. Press OK to make your selection or ESC to collapse the
list. The above description is based on recommended settings for photosynthesis applications using the
“PLC3 Universal cuvette, 18x25 mm window”. The default Settings File is named PLC3.
O analyzer (AnalyzerOnly) followed by a list of all available PP Systems
2/H2
Page 74
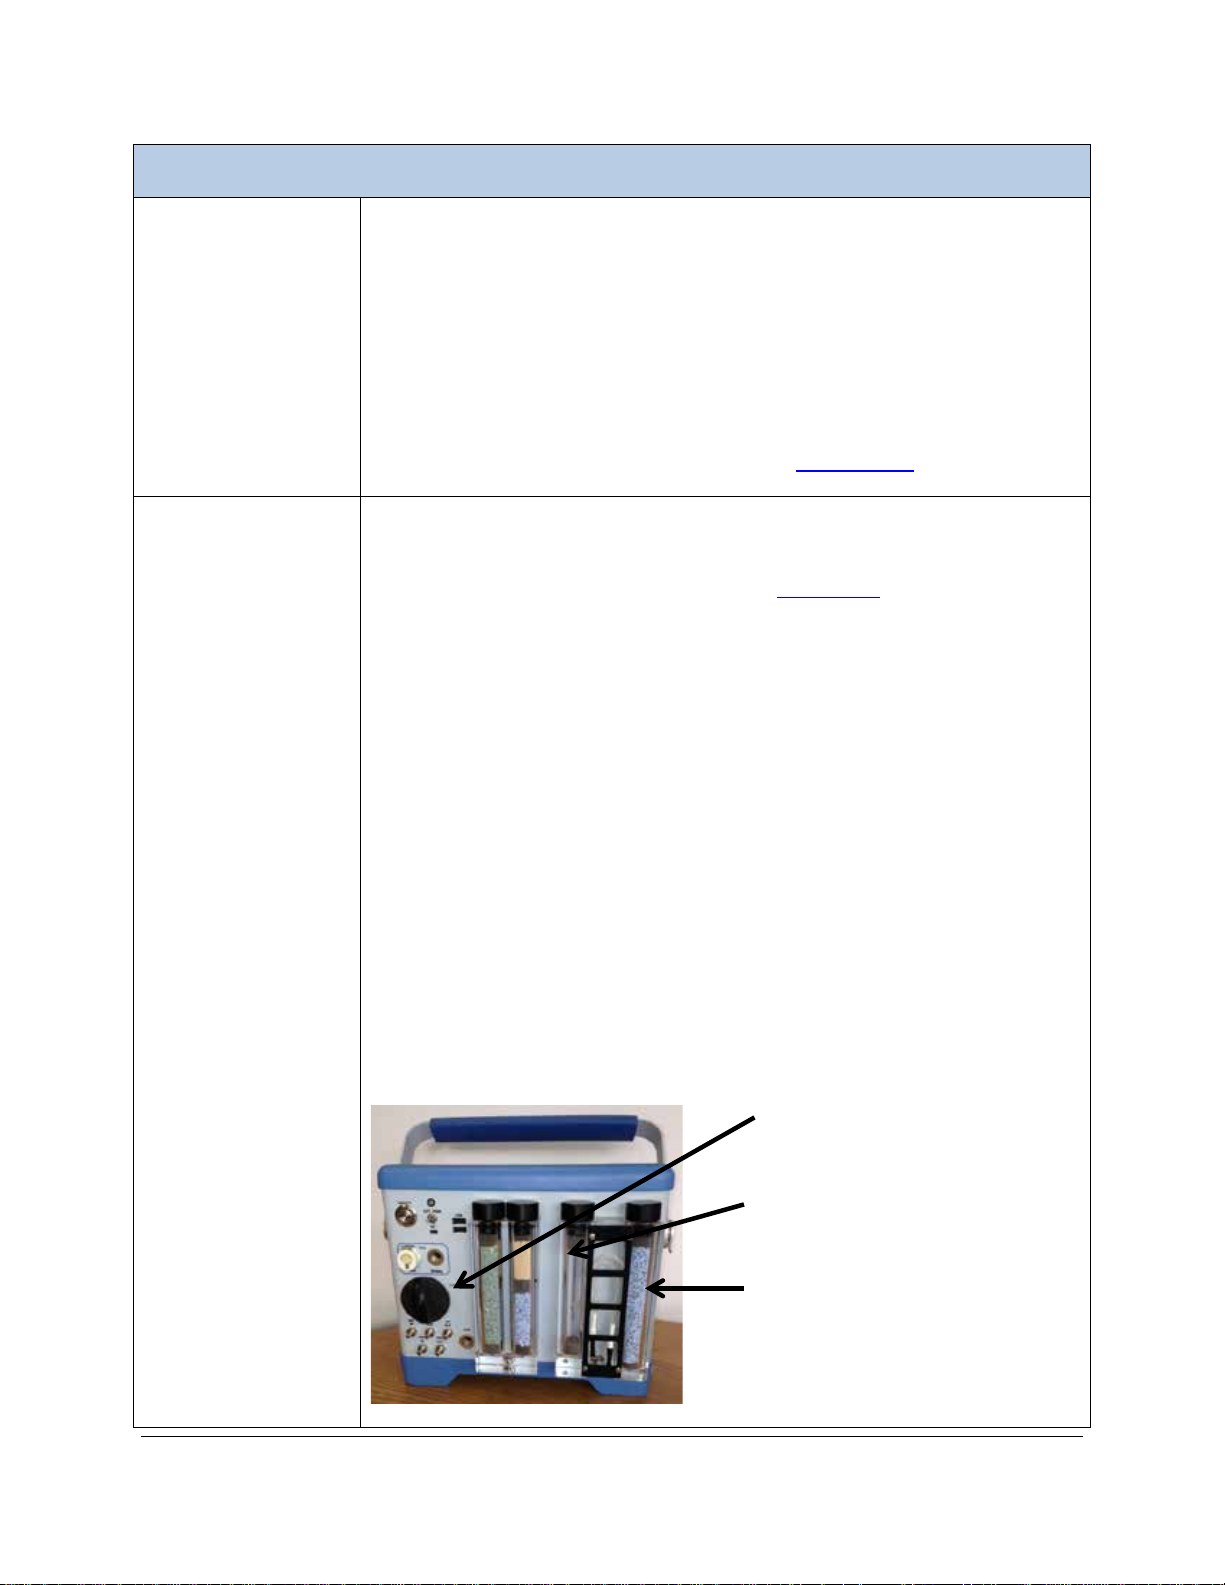
Settings
Zero, Diff Bal mode
Manual. You will be prompted when to perform a Zero or Diff Bal.
Automatic. Zeros and Diff Bals will be perform ed automatically every 31
CO2 Reference
Approximate reference air. The CO2 supplied to the leaf chamber from
CO2 regulator in place (with no
minutes. We recommend this mode if small ∆CO
and ∆H2O is anticipated and
2
for less experienced users. A Diff Bal cycle will also take place when there is a
large change in CO
(100 µmol mol-1) or H2O (5 mb) concentration.
2
Auto Zero, stored Diff Bal. This option can be useful and is highly
recommended for situations where large step changes in chamber CO
H
O are intended, such as occurs with CO2 in A/Ci curves. Prior to using this
2
option, you must perform a Stored Diff Bal (See Store Diff Bal on page 102
and
2
).
CIRAS-3’s internal CO2 source will generally be within 30 µmol mol-1 from the
actual set value within the control range of 0-2000 µmol mol
this option, you should perform a Max C (See
optimal accuracy and control. For response curves or in situations that require
frequent, large changes in CO
settles near the set value very quickly (within 1-2 minutes).
levels, this option is recommended because it
2
Exact reference air. The CO2 supplied to the leaf chamber from CIRAS-3’s
internal CO
source will be within 2 µmol mol-1 from the actual set value within
2
the control range of 0-2000 µmol mol
throughout a measurement sequence or for long periods, this option is ideal.
Fixed analysis air. Allows CO
leaf) as it is measured by the Analysis side IRGA.
Ambient (remove chemicals). This option is frequently used to supply the
natural outdoor CO
to the leaf chamber. Several considerations are involved
2
whenever the stable internal CO
option is selected, the CO
regulator should be empty but in place and the soda
2
lime must be removed from the CO
Humidity control can still be available if the H
Drierite.
-1
. Prior to using
Find Max C on page 100) for
-1
. If working at the same CO2 level
control on the analysis gas (feedback from the
2
source (CO2 cartridge) is not used. If this
2
O control column as shown below.
2/H2
O Absorber column is filled with
2
CO2 cartridge inserted)
Empt y CO2 absorber column for
ambient measurement of CO
2
Note, H2O control is still
available with Drierite in this
absorber column
Page 75
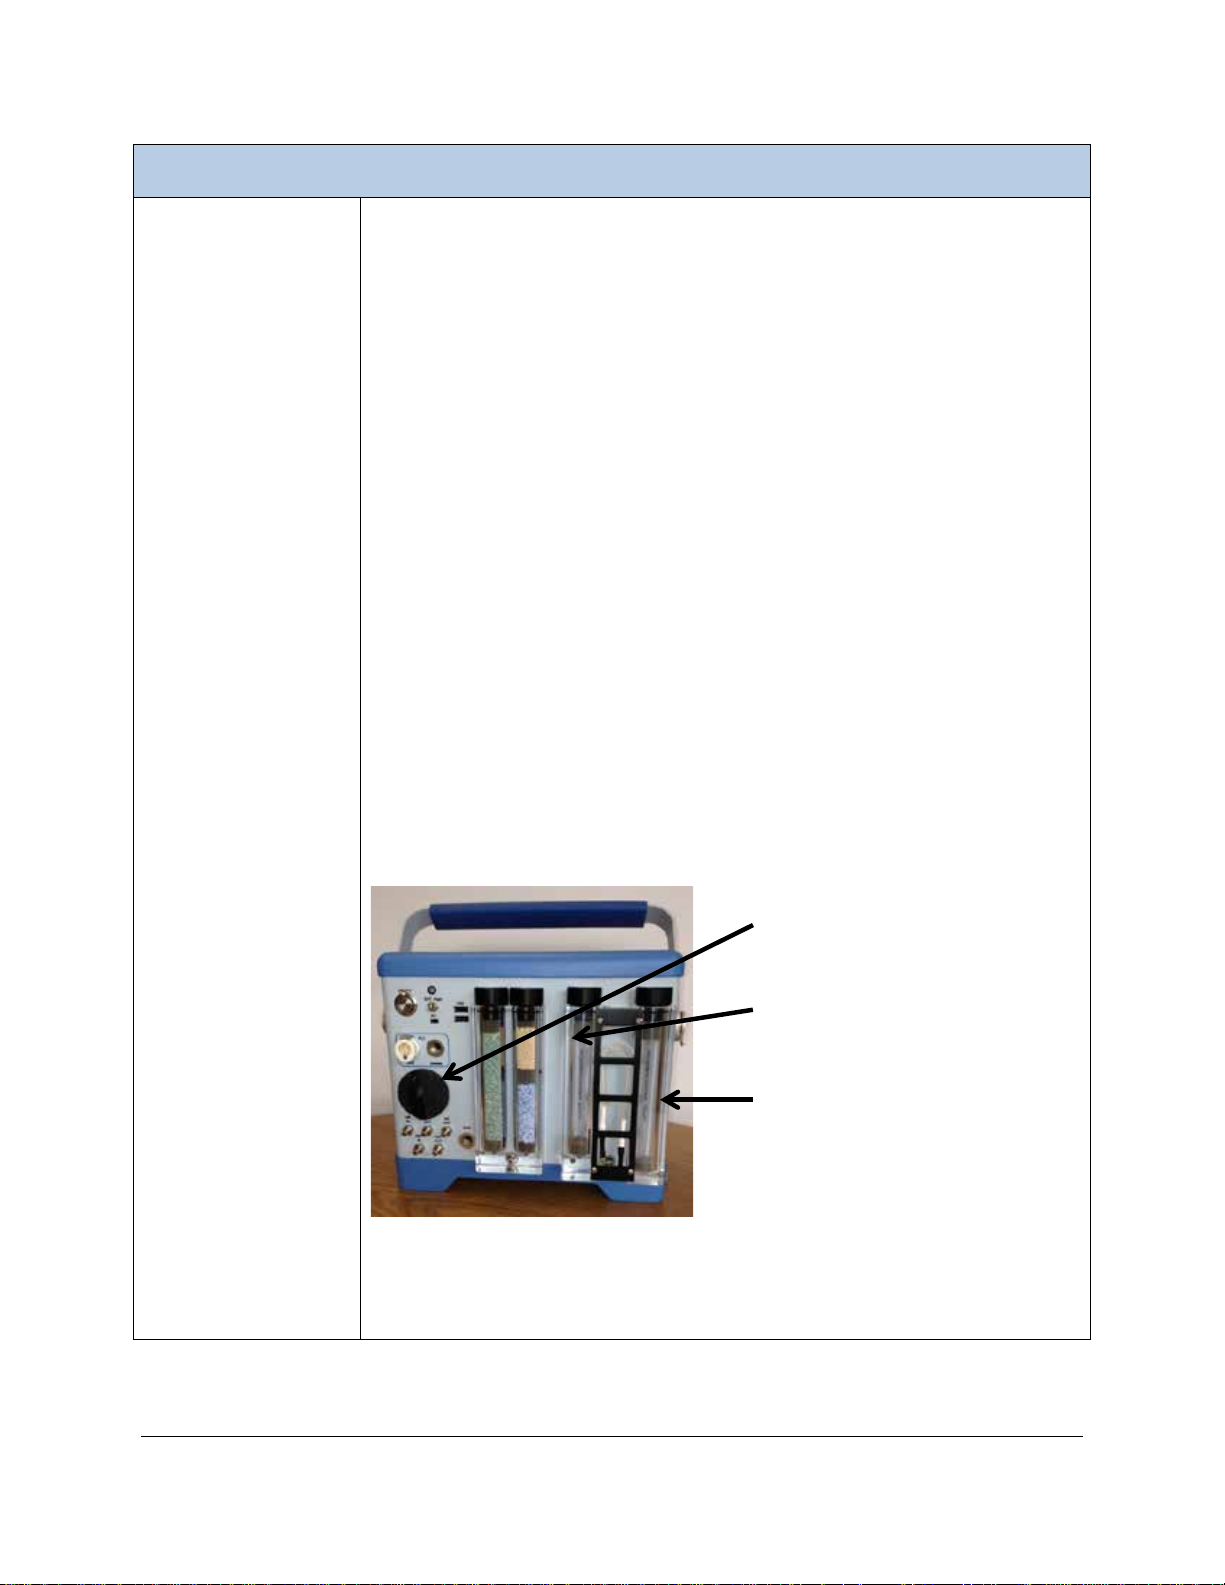
Settings (Continued)
H2O Reference
(chamber humidity)
Fixed % of reference. This option is most common. Typically, we recommend
CO2 regulator in place (with no
setting this to 75% of reference (you can change this at any time). If ambient
conditions where you work are typically humid (60+ %RH) set Fixed % of
reference to produce a chamber humidity less than ambient. The %RH in the
leaf chamber is calculated and displayed so you can make necessary
adjustments based on that. If ambient air in your surroundings is typically dry,
set to 100% of reference (the system’s reference air is usually slightly more
humid than ambient because of the soda lime reaction). Anticipate that
transpiration water vapor from the leaf will increase chamber humidity, and
maintain chamber RH <70%. At times you may see a warning in the instrument
status bar (lower left) that leaf chamber humidity >70%. If this message does
not go away, you should reduce the incoming %RH until you get below 70%.
Fixed reference mb. Allows you to choose a specific saturation partial
pressure value of chamber air, from 0 mb to dewpoint, depending on the state
of saturation of the ambient air.
Constant VPD . Automatically adjusts chamber humidity to maintain a
consistent leaf-to-air vapor pressure deficit between the absolute range 0-100
mb (0-10 kPa). The target VPD that can be achieved will be dependent on
dynamic leaf physiological factors and not only on how dry you make the
incoming reference air.
Ambient (remove chemicals). To supply water vapor unaltered from the
surrounding environment to the leaf chamber. Several considerations are
involved whenever stable, internally generated water is not used.
CO2 cartridge inserted)
Empt y CO2 absorber column for
ambient measurement of CO
Empt y H
O absorber column for
2
ambient measurement of H
2
O
2
Please Note. It is very easy to increase the humidity of the air above ambient if
required. Please contact PP Systems for the application note that was
prepared for this feature.
Page 76

Settings (Continued)
Cuvette Flow
Reference gas flow rate entering the cuvette within the range of 150 to 500 cc
min-1. Changing flow rate during an experiment is not recommended. Instead,
Analyzer Flow
Constant flow rate of sample gas introduced to IRGAs. The default value is
Light Source
LED. Select this if using one of our standard LED light units. Select your
RGBW Control
Allows you to set your desired LED color distribution. An individual color can be
Temperature Sensor
IR Thermometry to use the PLC3 Universal cuvette’s internal infrared sensor
determine an optimal flow rate before beginning important measurements and
then maintain that flow rate throughout the experiment. Remember that the
CIRAS-3 controls water vapor, chamber humidity and VPD through the
desiccants and not by increasing or decreasing flow rate.
100 cc min-1 and this is normally the value for most gas exchange applications
using a cuvette and should not need to be changed.
desired Light Intensity from 0-2500 µmol m-2 s-1. Maximum light intensit y wi ll
be dependent on type of light unit.
Ambient. For measurements under natural light conditions (No light unit).
set to 100%, or any color combination may be selected with a combined
distribution of red-green-blue-white to equal 100%. Here you can mimic the
spectral quality of sunlight, LED light banks, and other light sources, or create
experimental irradiance (i.e. stomatal physiology work). The best settings to
use to simulate sunlight is 38% Red, 37% Green, 25% Blue and 0% White
which are also the default values.
Measurement
(Available options are
dependent on PLC3
type)
(but only if the leaf covers the entire window opening). Do not select IR
Thermometry and instead select Energy Balance if, for example, you are
trying to place narrow leaf blades in parallel (such as grass leaves) or a leaf that
does not fill the entire window .
Energy Balance must be selected when the cuvette window does not have
complete coverage by the leaf. Energy Balance can be used at any time.
Thermistor if using the thin wire temperature sensor supplied with the PLC3
Conifer or Narrow cuvettes, otherwise select Energy Balance.
Page 77

Settings (Continued)
Temperature Sensor
Control Type
Leaf Temperature. There are several options by which to control the
Set Temperature
Available if Temperature Sensor Control Type is set to control Leaf
Leaf Area
The default value will be based on your Accessory selection in the Settings
Boundary Layer
This value is determined at the factory prior to shipment and the value noted on
(Available options are
dependent on PLC3
type)
temperature in the leaf chamber, temperature can be held fixed or allowed to
vary with ambient depending on experimental objectives. Leaf temperatures
allow fixed inputs in 1 °C increments. Select Leaf temperature to hold the leaf
at a fixed temperature that you enter under “Set Temperature” (see below).
Track leaf to ambient allows the leaf temperature to follow ambient
temperature, as measured by the cuvette’s handle-mounted thermistor sensor.
Cuvette temperature is used to control the air in the cuvette at a fixed
temperature that you enter under “Set Temperature” (see below).
Track cuvette to ambient allows the cuvette temperature to follow air
temperature, as measured by the cuvette’s handle-mounted sensor.
Disable temperature control is intended mainly for diagnostic purposes but
can also be used for field measurements if required. This option is not
recommended for conditions that include high ambient temperature and/or high
light intensities as it will cause the cuvette to heat up.
(Available options are
dependent on PLC3
type)
between ~10 °C belo w am bient to 15 °C above ambient. The absolute control
range is between 0-45 °C. Ability to control at a stable temperature will dep end
on whether you are operating the system from AC power or battery, the charge
state of the internal battery(s) and the following:
1. Leaf transpiration in the cuvette
2. Light (incident radiation)
3. Size and construction of the PLC window
dialog. Enter known measured leaf areas if your leaf sample completely fills the
PLC3 Universal cuvette window or if you and you have pre-determined the leaf
area exposed in the chamber. Enter a lower estimate (as compared to the
Temperature or Cuvette Temperature. Enter a temperature value that is
window size) if you don’t know the true leaf area of your sample. All
calculations are based on leaf area so if you don’t know the actual leaf area at
time of measurement, you will need to perform leaf area analysis at the
conclusion of measurements and have the data recalculated. PP Systems can
supply a simple CIRAS-3 Excel
®
spreadsheet program for recalculation of
results.
Resistance
the PLC3 “Tested” label on your leaf cuvette. In future this will also be available
in software. Users should measure the boundary layer when changing out the
PLC3 Universal win do w as this value will vary from window to window. See
Boundary Layer Determination (rb) on page 197.
Page 78

Settings (Continued)
Adaxial Stomata
Enter a known or estimated value of % upper leaf surface stomata for your leaf
sample. If you are unsure, it will help if you can determine if your leaf sample is
representative of a hypostomatous or amphistomatous plant species before
entering an estimate.
Settings Graph Set (F5)
The alternative to Numeric View is called Graph View. Configure Graph View in Settings (F2) > Graph
Set (F5). In Graph View you can view up to 5 numeric variables and 3 graphs, using any combination of
measured and calculated data in the graphs. Select your desired set of variables from the Variable list,
Variable 1 through Variable 5. With the dropdown box highlighted, press Expand List (F4) to see a
section of the total list, or use the Up or Down arrows to move quickly through the list. The first variable in
the list is None. Choose None if you do not want numeric variables displayed or make a selection and
press OK. The graph or graphs that you choose to display can be customized in two basic ways: the
variables that will be shown and the numeric min-max scaling or time scale. Press the TAB key to move
down to Graph1. Y Axi s is the first dropdown list containing all available variables. Again, with the
dropdown box highlighted, make your selection. Press TAB again to enter a value in the Min field, then
do the same for the Max field. Press Change Sign (F3) to enter a negative value after you make your
entry, usually in the Min field. Note that if you clear the field by pressing the DEL (delete) key the
selection defaults to Auto, which will auto-scale that entry.
X Axi s is the next dropdown list. The first variable that it contains is Time Span – choose this if you want
a single-variable plot, displayed over a period of between 2 and 60 minutes. Enter the time in the next
field, Span. Min and Max will be grayed out. Enter any variable except Time Span if you prefer a twovariable scatter plot, then enter the Min and Max scales for that variable. The Span field will be grayed
out.
The first variable in the Y Axis list is None. Choose None if you do not want the graph displayed. For
example, if you set up Graph1 as described above and select None for both Graph2 and Graph3, you will
see a single large graph. Select None for Graph3 to display two graphs only, etc.
Page 79
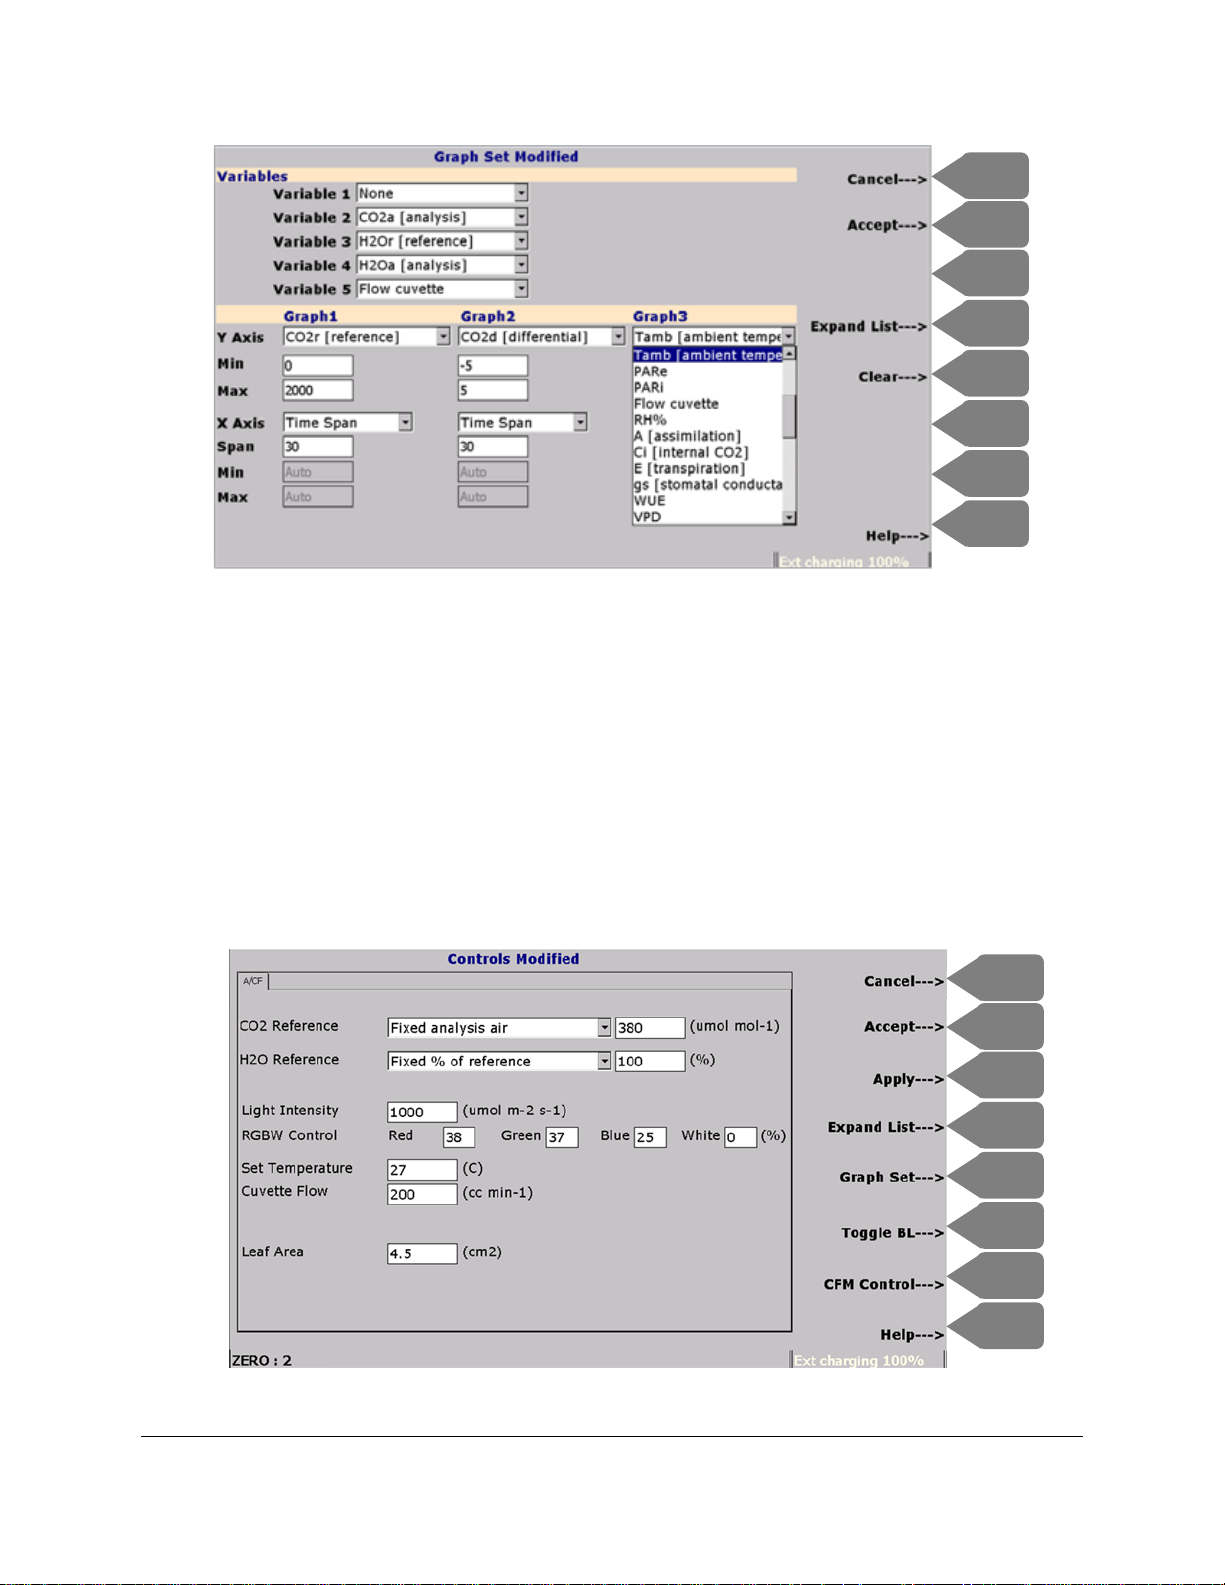
F1
F3
F2
F4
F6
F5
F7
F8
F1
F3
F2
F4
F6
F5
F7
F8
Controls (F3)
Controls allow you to dynamically change many of the default options you have made previously under
Settings without reverting the system back to its initial set of values in the Settings dialog. Use Controls
to establish system stability (empty leaf chamber) by altering CO
rate and leaf area. Press Controls (F3) to enter control mode and make changes then press Accept
(F2). The status bar in the lower left corner will display the message “Updating Environmental Control
values…” and the plot data displayed in Graph Vi e w will refr es h.
, H2O, light factors, temperature, flow
2
Page 80
Controls
CO2 Reference
Options are identical to those described in Settings (See Settings (F2)
on page 73.
H2O Reference (chamber
Options are identical to those described in Settings (See Settings (F2)
Light Intensity
Options are identical to those described in Settings (See Settings (F2)
RGBW Control
Options are identical to those described in Settings (See Settings (F2)
Set Temperature
Options are identical to those described in Settings (See Settings (F2)
Cuvette Flow
Alteration to an existing flow rate causes transient disruption of CO2
Leaf Area
Options are identical to those described in Settings (See Settings (F2)
humidity
on page 73.
on page 73.
on page 73.
on page 73.
control which in turn affects calculated assimilation rate and Ci so wait a
minute or so for the system to readjust before collecting data. If the
new Control value is ± 20% of the old value a brief message will appear
in the status bar: “cuvette flow 20% out from set value”. This is simply a
transient that will disappear as the new target flow is approached.
on page 73.
Controls Graph Set (F5)
Press Controls (F3) > Graph Se t (F 5) to change your Graph View options. You will find this especially
useful after completing system stability checks when a leaf is in the chamber. Then, your focus will likely
be on calculated parameters more than measured parameters. Because the dynamic range of a leaf
sample’s physiology may be unknown to you, it could be difficult to set the correct Y-axis scale, for
example, to keep constant oversight of rapid changes and trends over time. Here, Graph Set will allow
you to make quick corrections to Y-axis scales. The options are identical to those described in Settings
(F2)> Graph Set (F5). Press Controls (F 3) > Graph Set (F5) > Clear (F5) at any time to refresh plotted
data in the graphs.
Toggle View (F4)
Toggle View (F4) is a simple function key used to switch between Numeric and Graph View. For
example, use Toggle View if there is a variable that you would like to monitor, but it is not currently
displayed in Graph View. One of many possible configurations of Graph View can be seen below with the
control steps of an A/Ci curve displayed in the upper graph.
CO
2
Page 81
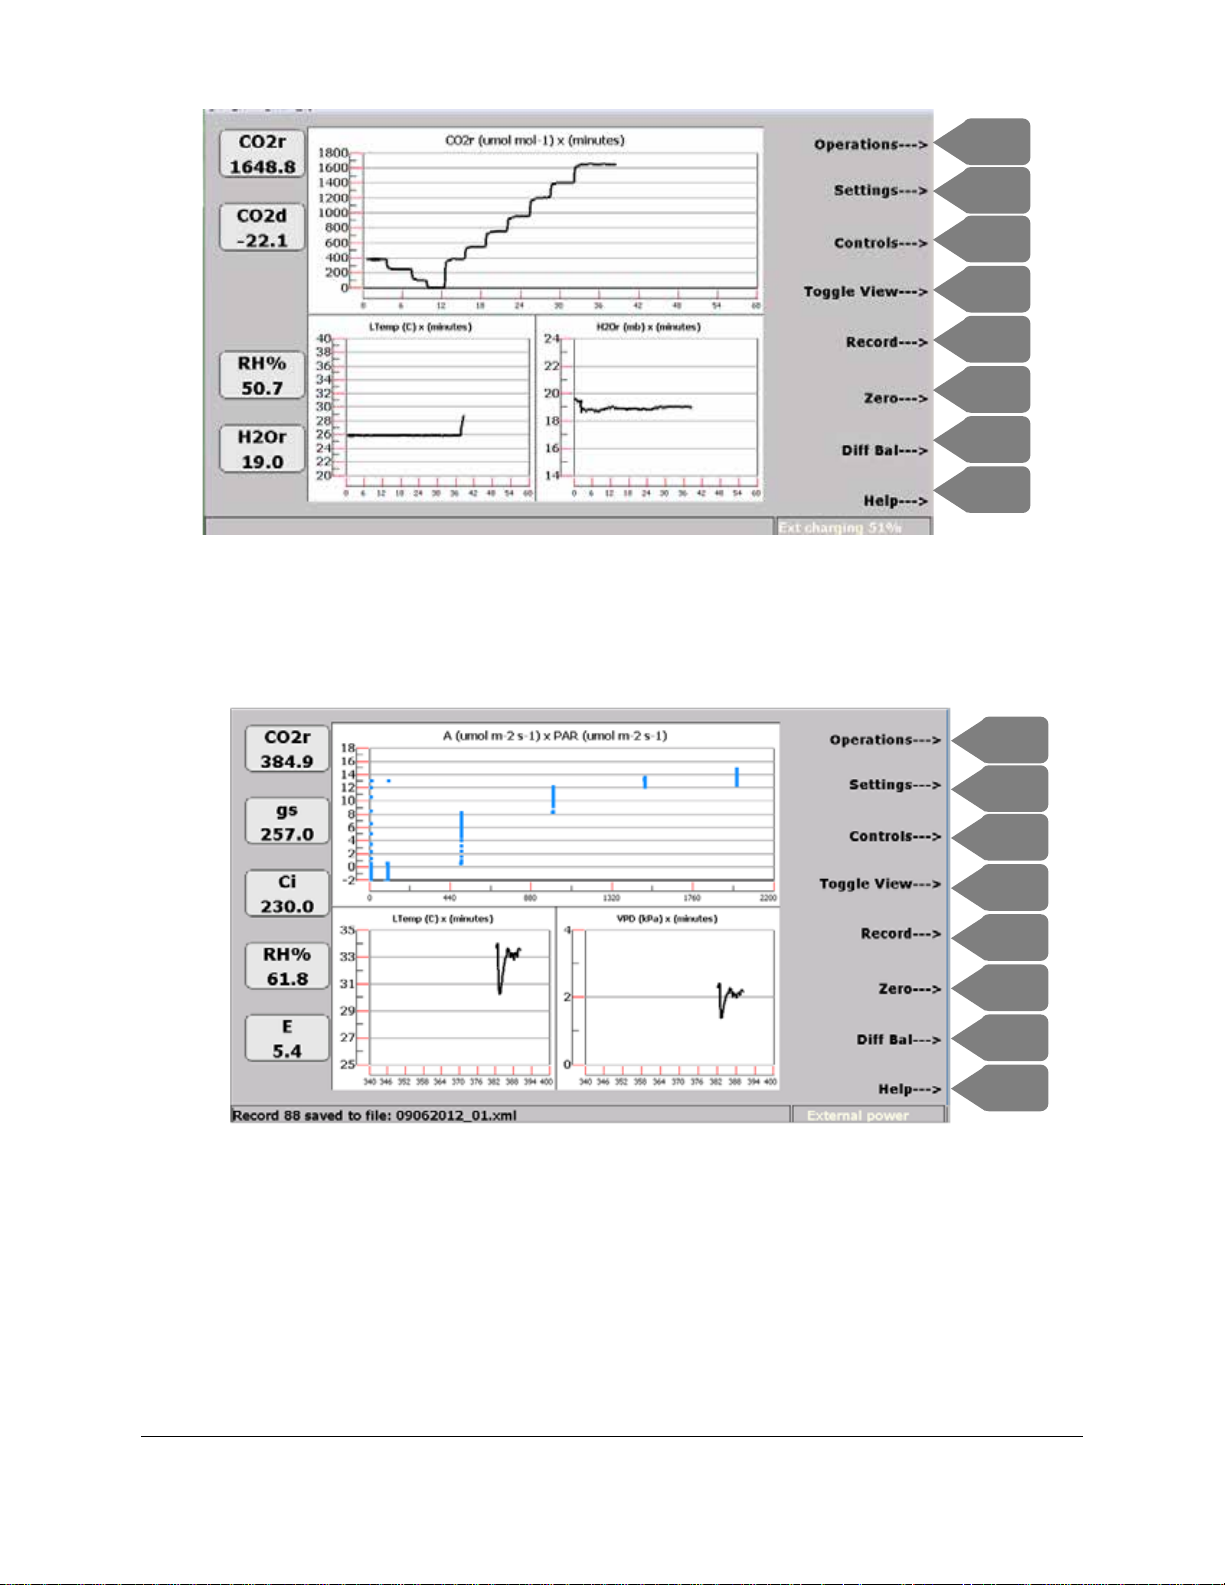
F1
F3
F2
F4
F6
F5
F7
F8
F1
F3
F2
F4
F6
F5
F7
F8
The second example (below) features a two-variable scatter plot of A x PAR. This graph captures a light
curve, with each vertical group of blue markers representing photosynthetic accl i mation at subsequent
-2 s-1
increasing light levels (X axis) between 0 and 2000 µmol m
.
Page 82
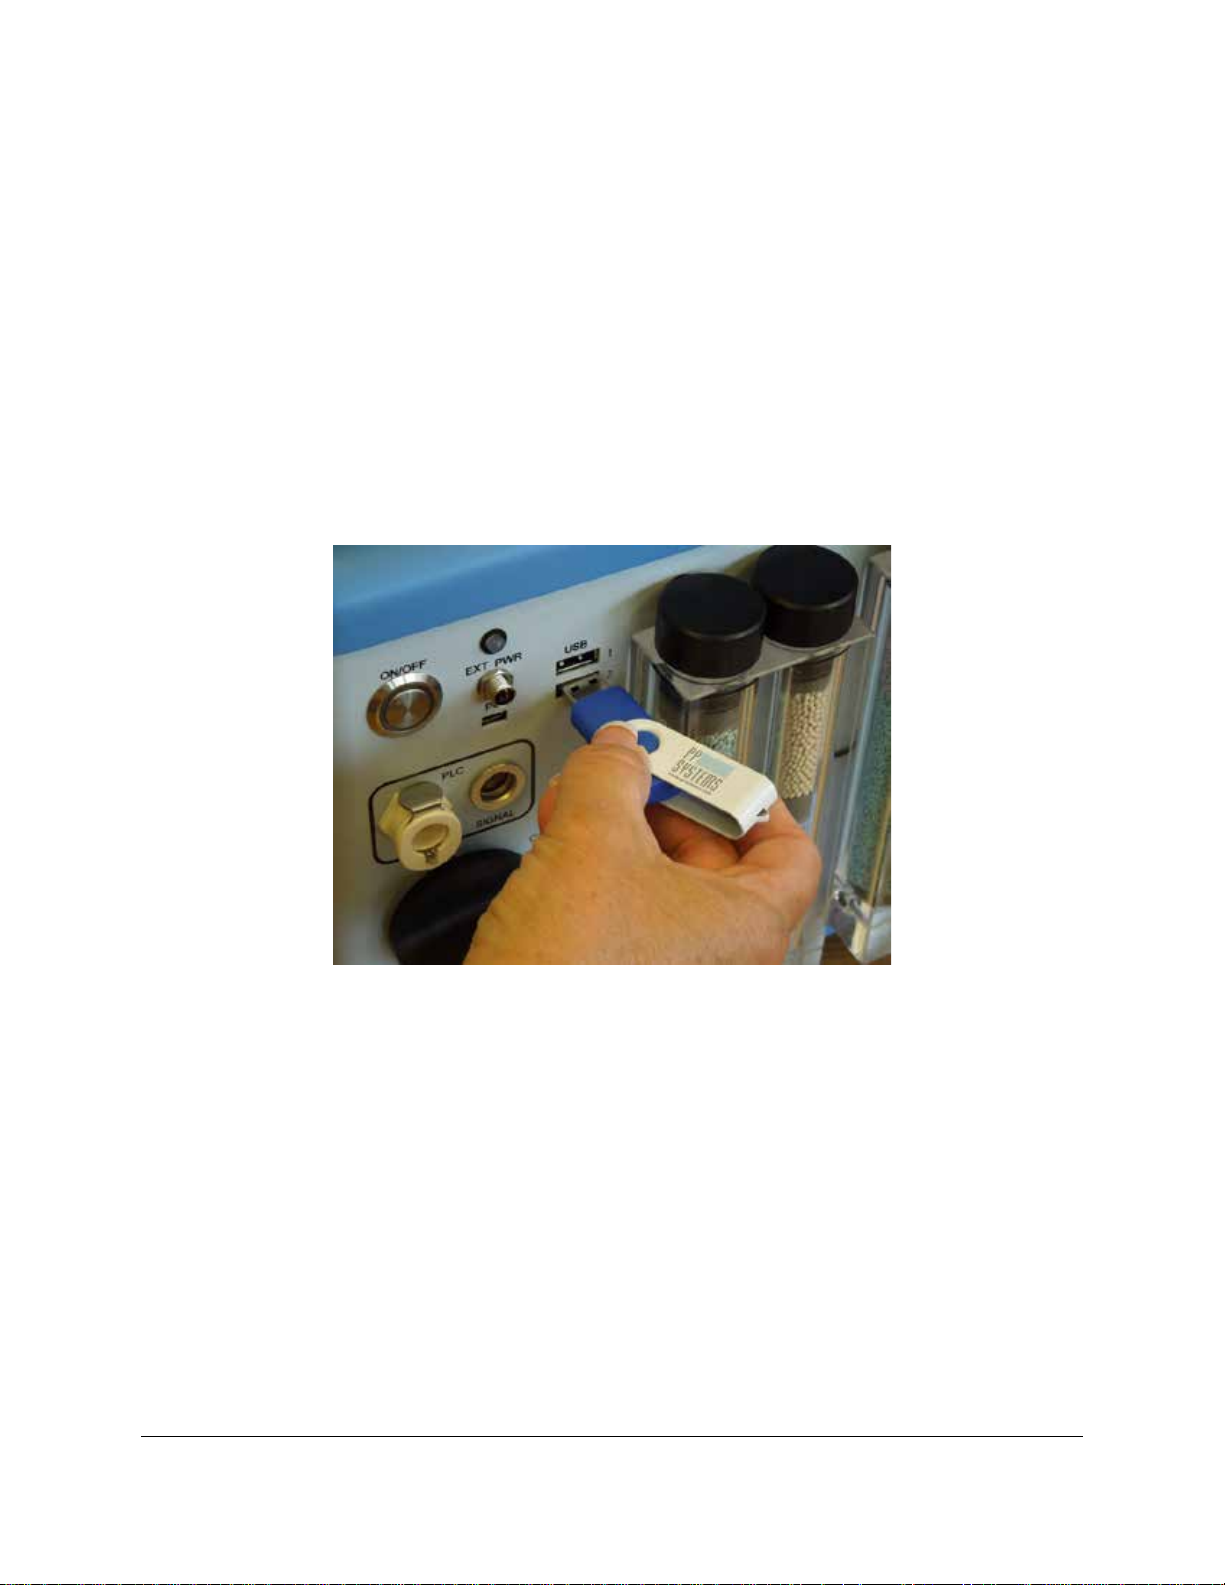
Reviewing and Transferring Data Files
Transfer Data (F6)
Retrieving your .xml data files from CIRAS-3 internal memory is a routine operation that is accomplished
with a few easy steps. Importantly, we allow two-way transfer of three file types: data, settings and
scripts. The example below describes transferring data files. Press Operations (F1) > Rec Options (F2)
and Transfer Data (F6).
Insert a USB2 or newer device (alternatively referred to as “memory stick” or “thumb drive”) into the USB
port located at the back of the console. Press Scan USB (F7) to see the contents stored on the USB
device – only compatible .xml files will appear.
The Transfer Files screen is dominated by two large fields: Internal Memory Files is on the left, and USB
Memory Files on the right side. Use the TAB key to move back and forth between the two file locations.
Within a location field, use the Up and Down arrow keys to highlight files, one at a time, and press OK to
select the file you want to move. You know the file has been selected when it has a check mark in the
small box to its left.
Page 83
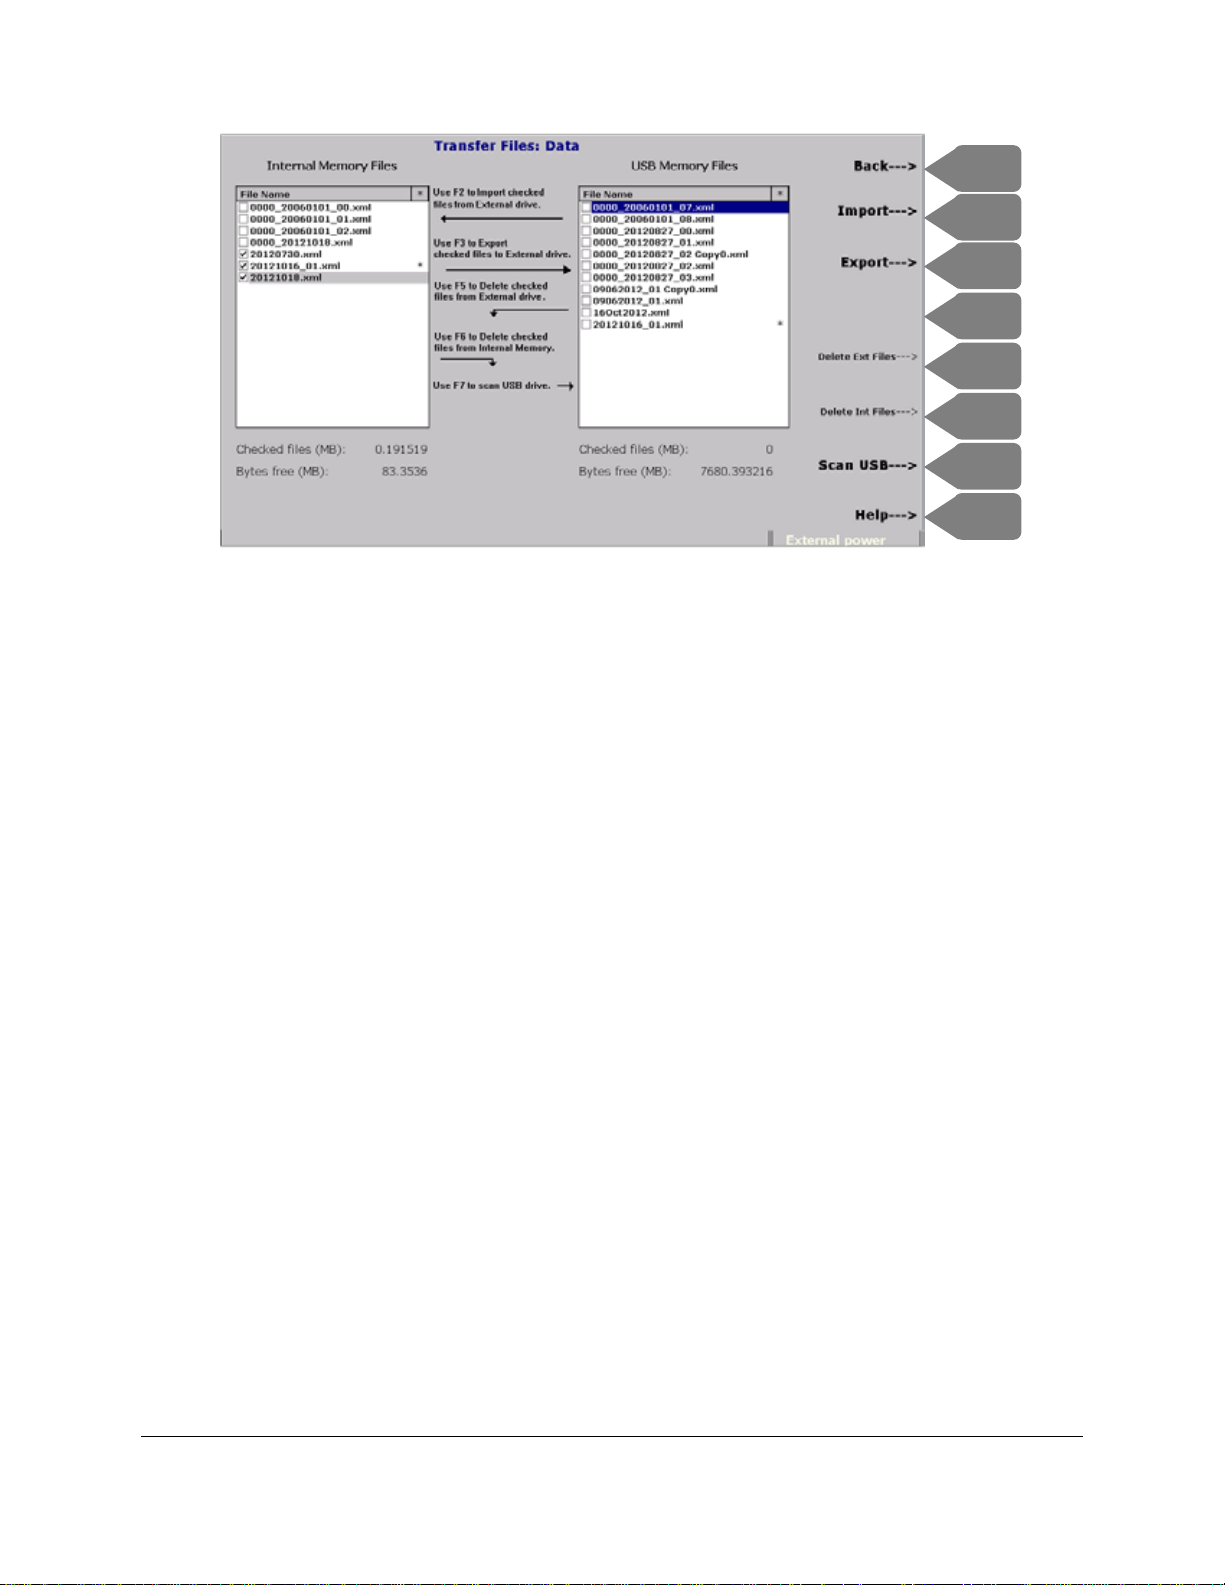
F1
F3
F2
F4
F6
F5
F7
F8
To move a copy of the data file from the Internal Memory to the USB Memory, locate the file and when
highlighted press OK. A check mark should appear next to the file. Next press Export (F3). A file that
has been transferred is indicated by an asterisk symbol (*) on the right side of the location field, next to
the file name. Note that the file remains in its original location – files can be deleted from Internal Memory
by pressing Delete Int Files (F6).
You can also import data files back to Internal Memory, for example, to quickly review the data using
Operations (F1) > View Saved (F4). To move a copy of a data file from the USB Memory to Internal
Memory, select the file and press Import (F2). Again, the file remains in its original location – files can be
deleted from USB Memory by pressing Delete Ext Files (F5).
To transfer CIRAS-3 settings files, from the Numeric or Graph View screens select Settings (F2) >
Transfer (F3), then follow the instructions above. To transfer CIRAS-3 response curve scripts, press
Operations (F1) > Rec Options (F2) > Edit Rsp Crv (F5) > Transfer (F5), then follow the instructions
above.
Page 84

Section 8. Operations
Operations (F1)
From the numeric or graph display, press Operations (F1) to access numerous system functions
including:
• Recording Options (Rec Options – F2)
• Set Clock (F3)
• View saved data (View Saved – F4)
• Calibration (F5)
• Diagnostics (F6)
• Firmware Upgrade (FW Upgrade-F7)
• Help (F8)
Recording Options
Press Operations (F1) > Rec Optio n s (F2) to set up a recording session. There are 3 options available
• Manual recording – Normally used for individual leaf level gas exchange measurements.
• Timed recording
• Response curves – For automated, pre-programmed scripts for A/Ci curves, light
response, etc.
Manual Recording
Select the desired recording option at the top of the screen by using the Left or Right arrow keys – the
first option is Manual recording. For most leaf gas exchange measurements in the field, this method of
recording is most common.
Page 85
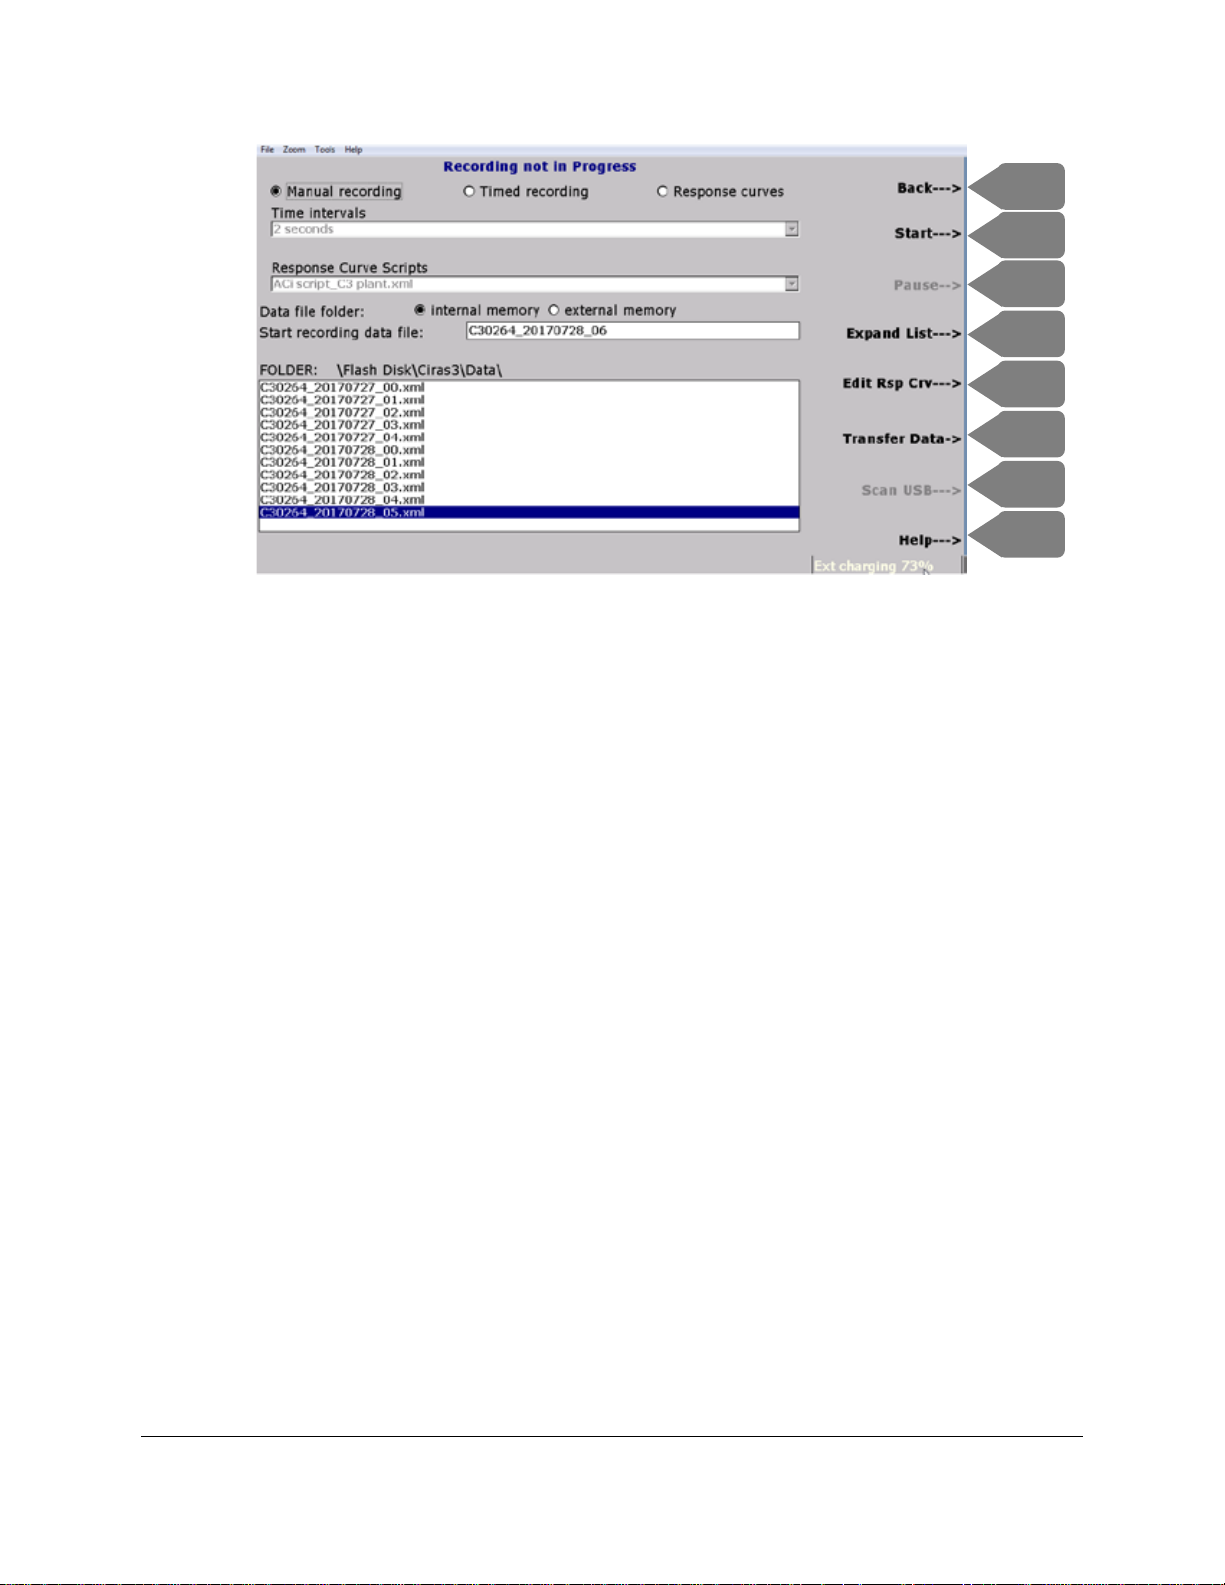
F1
F3
F2
F4
F6
F5
F7
F8
Data file folder: indicates the location to save the data file, internal memory or external (USB) memory.
The next field is Start recording data file: where a default filename using the serial number of the
CIRAS-3 and current date appears, e.g. 0000_20130131_00. The date format is yyyymmdd. Each new
data file you create will be sequentiall y num bered, beginning with that day’s date, such as
0000_20130131_00. 0000_20130131_01, 0000_20130131_02. You can the change the filename by
pressing the TAB key to highlight the field, and the DEL key to backspace and delete characters, then
use number keys to enter your own numeric filename. You cannot overwrite an existing data file. Later,
you can export the file and rename it using alpha characters. FOLDER: \Fl ash D isk\CIRAS3\Data\
indicates the internal memory location, and the field beneath it lists all currently stored data files.
Press Start (F2) to begin recording data – you are automatically returned to the Operations screen, The
status bar indicates that you are now in Recording mode, press Back (F1). At this point you can use
Graph Set to enter your preferred combination of numeric data, graphics and x-y scaling, if you haven’t
done so already.
When you are ready to record data, press and release the thumb key labeled R on the cuvette’s
open/close lever to record a single data point and the mini-LCD briefly displays “Recording”.
Alternatively, press Record (F6) on the console. Press and release the thumb key labeled S to switch
between the cuvette’s mini-LCD displays. Again, the mini-LCD displays two abbreviated variable sets: (A,
Ci, E, gs) and (CO2r, CO2d, H2Or, H2Od). All recorded data points are indicated in the console status
bar, i.e. “record 1 saved to file: 0000_20130131_01.xml”. Red triangle markers clearly indicate recorded
data points in Graph View, if displayed. Press End Recording (F5) to end the recording session. The
status bar will display “Recording stopped. Safe to power off system”. Alternatively, press Operations
(F1) > Rec Options (F2) > Stop (F2) to end the recording session.
Page 86
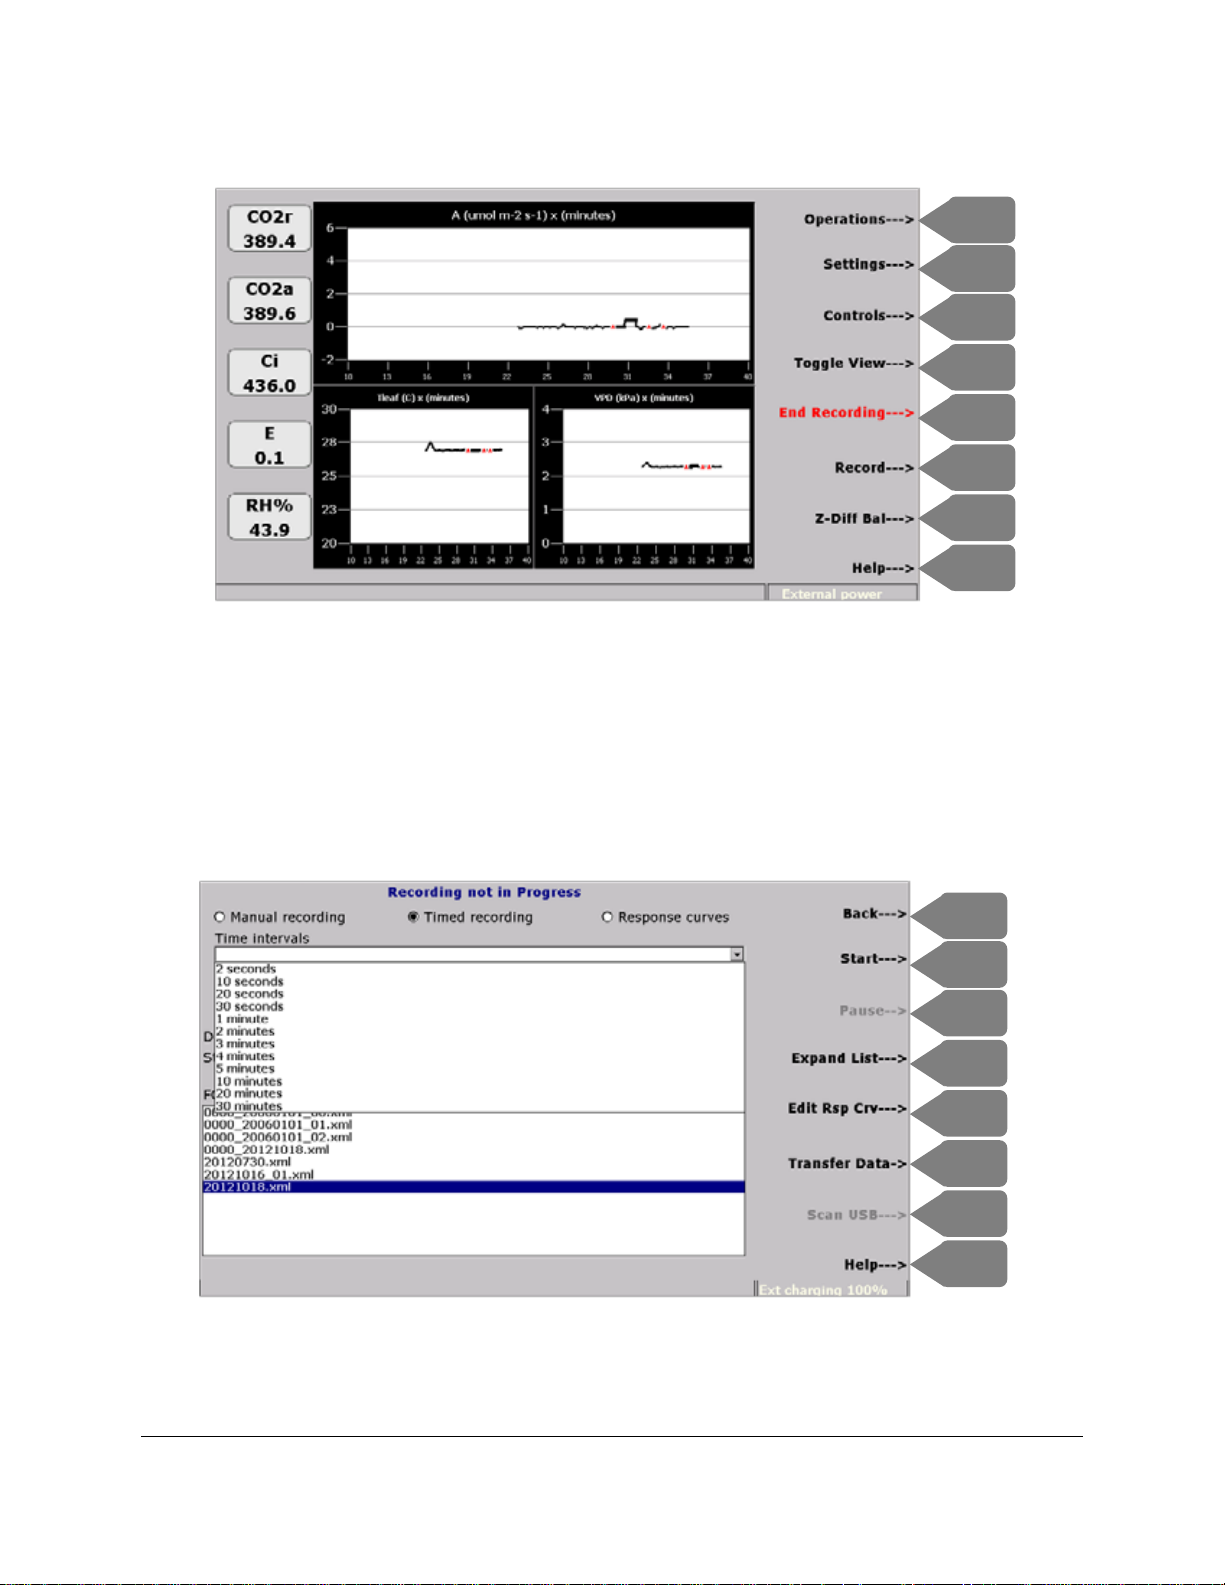
F1
F3
F2
F4
F6
F5
F7
F8
F1
F3
F2
F4
F6
F5
F7
F8
Timed Recording
Using the arrow keys select Timed recording and use the TAB key to highlight the Time intervals field,
then press Expand List (F4) to drop down the available selections in the list. Data can be recorded
automatically at intervals from 2 seconds to 30 minutes. Use the Up or Down arrows to make the
selection and press OK. Accept the default filename or rename it, and proceed back to Numeric or Graph
Views screens as described above.
The status bar at the bottom of the screen will indicate Next record in mm:ss , counting down to the next
automatic recording interval. Timed recording continues indefinitely at the selected recording interval
unless paused. This can introduce unnecessary and irrelevant data into your data file. To suspend
Page 87

recording temporarily, for example, to change the leaf sample or run a manual Zero or Diff Bal, press
Operations (F1), Rec Options (F2), Pause (F3). Press Resume (F3) to continue automatic recording.
Response Curves
The third recording option is recording data automatically using a response curve that you have created.
Using the arrow keys select Response curves. Press the TAB key to highlight the Response Curve
Scripts field, the Up or Down arrow keys or Expand List (F4) to view and select available scripts. The
CIRAS-3 is supplied with several simple default protocols (we call them scripts) stored on the console.
TIP
When performing automatic response curves involving chlorophyll fluorescence measurements, all CFM3 settings (Settings (F2) > CFM Settings (F7)) must be set up and saved prior to starting the response in
order to take effect.
There are multiple options available to create and edit your own response curve protocols to
automatically run response curves. This can be done on the CIRAS-3 Console, on a computer using the
PC Utility Software supplied with the system and also with any external xml editor. You can also find Help
on how to edit these files outside of the console on your own computer, and then transfer the files to the
console. This section describes the CIRAS-3 Console editing option.
Press Edit Rsp Crv (F5) (Edit Response Curve) to display the Response Curve Scripts editor screen.
The screen has two parts: above are fields where you select the desired response script and enter the
values that define the script, below the fields the tabular structure of your script is displayed and updated
as you make entries. This sample description is based on a simplified A/Ci curve.
Page 88
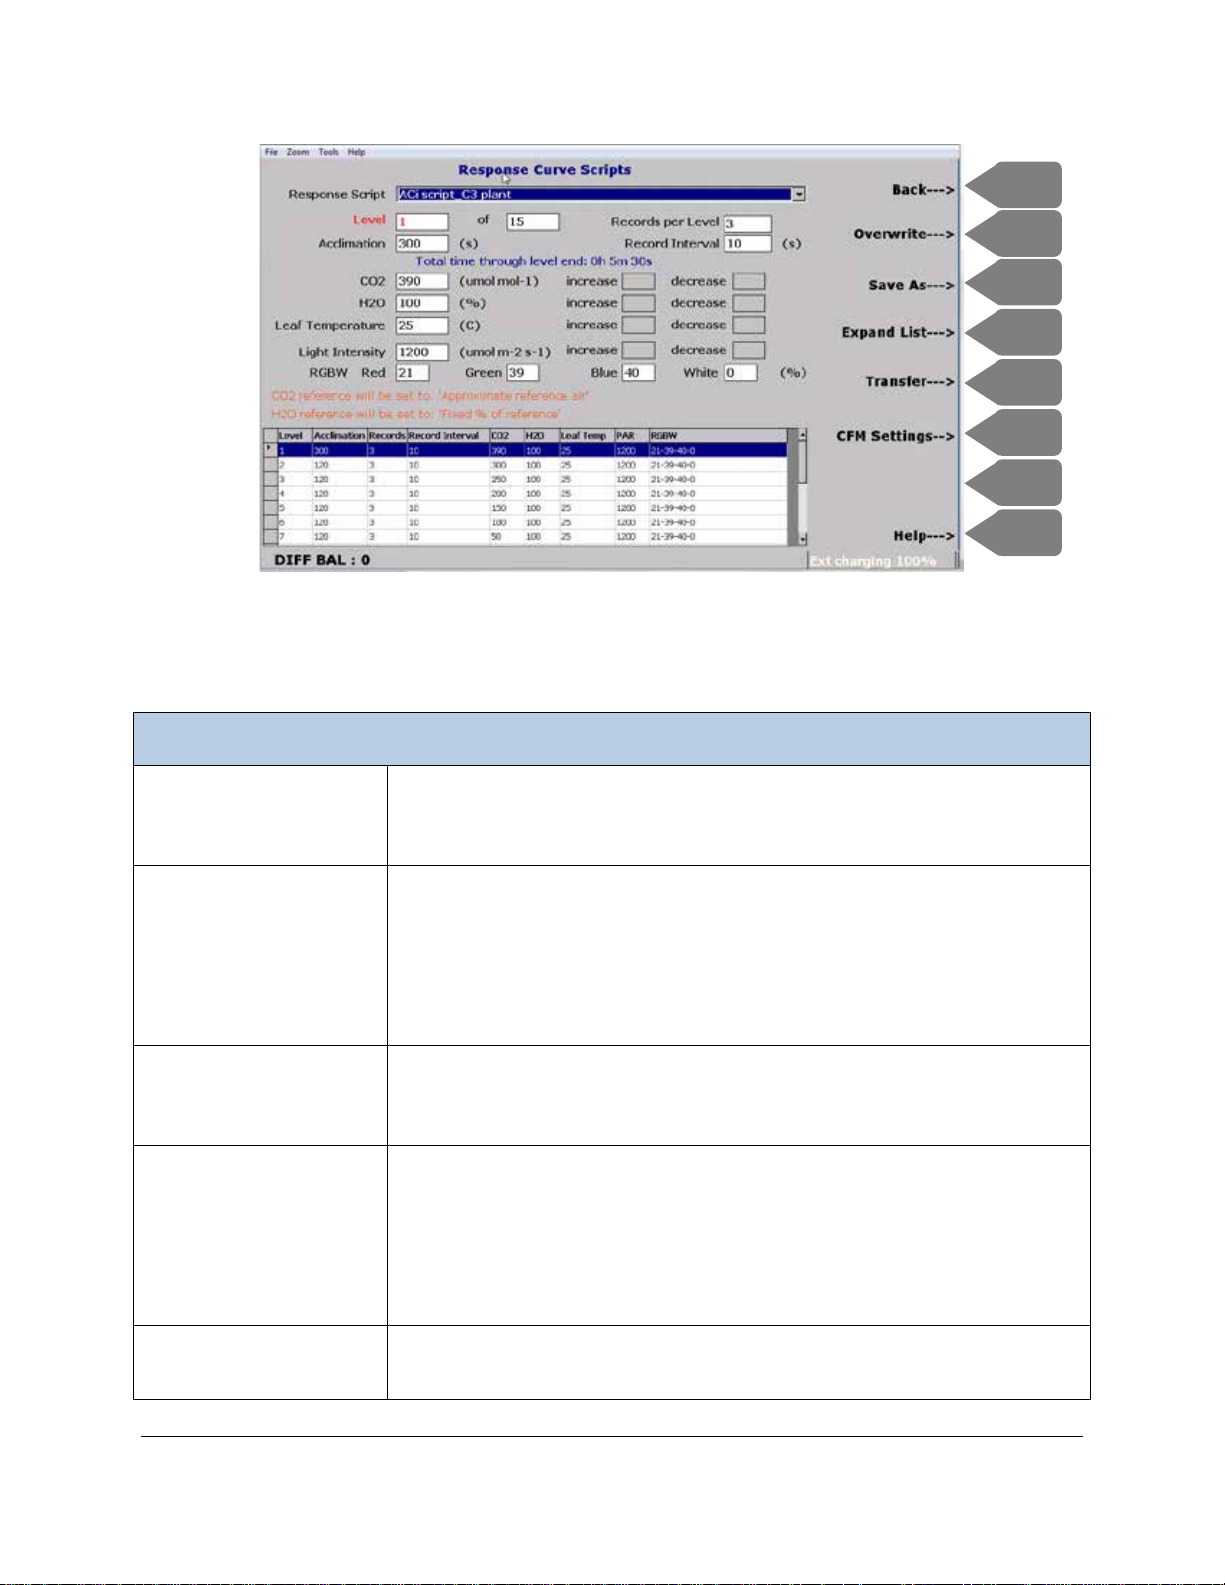
Response Curve Scripts Editor
Response Script
Several scripts are included with CIRAS-3 by default. You can use them as
Level
These fields are the starting and ending points of your response curve,
Records per Level
Decide how many data points you want to record at each Level. Entering
Acclimation
Enter the time in seconds that the leaf must acclimate to the conditions you
Record Interval
Enter the time in seconds between recorded data points, assuming Records
F1
F3
F2
F4
F6
F5
F7
F8
The following selections are available:
templates to edit on the console, or export them for external editing and
renaming.
representing the total number of steps. If your response curve has 15 steps
enter 1 of 15 in the fields. Each entry from this point forward will apply
uniformly to the entire response curve, through all Levels. By doing this you
create the basic structure of the curve, before you enter the specific changes
you want to introduce (independent variable) at each successive Level.
more than 1 will allow for averaging and other summary statistics, but will
extend the total time of the response curve.
create in the leaf chamber. This is not as easy as it may seem as it is
dependent on the initial physiological state of the plant, the response curve
parameter being changed, and the magnitude of that change. Determining
suitable acclimation times often requires one or more test runs of the
response curve.
per Level n>1.
Page 89

CO2
Select your desired (starting) CO2 concentration. Remember that this
example describes an A/Ci curve, so we will return to this parameter once
increase/decrease
Allows you to apply uniform step changes through the curve’s progression.
H2O
Select your desired H2O control value as a percent of the reference air, held
Leaf Temperature
Select your desired temperature control value, held constant throughout the
Light Intensity
Enter a saturating light intensity held constant throughout the A/Ci curve.
RGBW
Enter your desired LED color distribution, summing to 100%.
you finish setting up the basic structure of curve.
Example, enter 100 in the decrease field and CO2 will automatically change
from a starting concentration of e.g. 400 µmol mol
-1
to 300, 200, 100, 0
through Levels 1-5. Of course, it cannot continue lower than 0, although the
table will indicate -100, -200, etc. for successive Levels.
constant throughout the A/Ci curve.
A/Ci curve. Recall that you can effectively control leaf temperature from ~10
°C below ambient to ~15 °C above ambient, within the absolute temperature
range of 0-45 °C. Remember that the temperature control is highly
dependent on ambient temperature and light intensity.
Press TAB to enter the table, and use the Up, Down, Left, Right arrows to scroll vertically and horizontally
within the table. Press TAB again to return to Level. Enter any number to edit that Level. For example,
in the case of the CO2 parameter, enter Level 6 to correct the negative CO2 entries. Enter 400 for CO2
-1
at Level 6, and increase by 200 so that Levels will increase to a max. 2000 µmol m ol
at Level 14. TAB
once again through the fields and back to Level – enter 14 to complete a simple 14-step A/Ci curve.
Again, this is a simplified example of the “architecture” of an A/Ci curve.
Press Save As (F3) to create a new response curve script, or Overwrite (F2) to overwrite an existing
script that you have edited. Save As (F3) will preserve the original file and call the new file “filename
copy0.xml”, “filename copy1.xml”, etc.
Press CFM Settings (F6) to access settings associated with chlorophyll fluorescence measurements
(only if you have purchased the CFM-3 Chlorophyll Fluorescence Module). Also make sure that you have
this accessory properly selected under “Settings File” and “Accessory” in Settings. See Settings (F2)
page 73.
on
Page 90
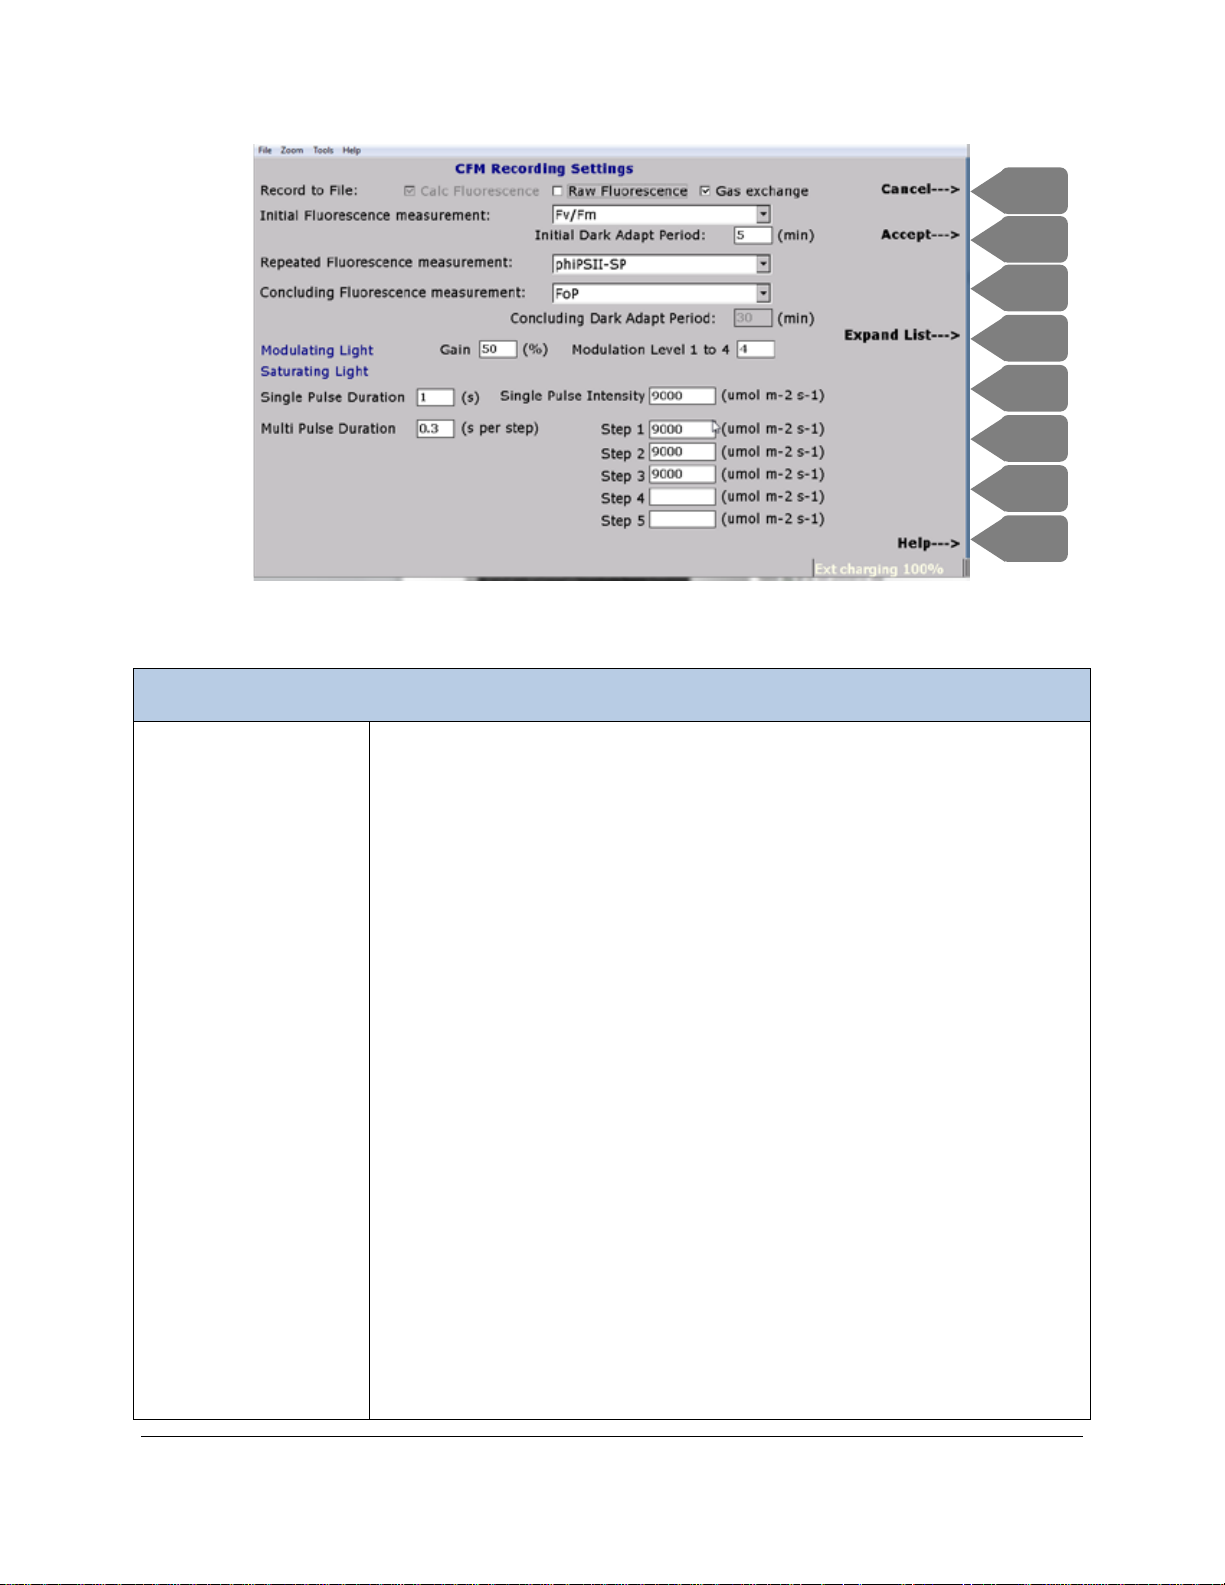
The following selections are available.
CFM-3 Script Settings Editor
Record to File
Calc Fluorescence, Raw Fluorescence, Gas exchange. Depending on your
F1
F3
F2
F4
F6
F5
F7
F8
selection of Accessory in Settings, some of these may be grayed out.
Calc Fluorescence refers directly to the entire or partial list of parameters
provided above.
Raw Fluorescence refers to the instantaneous fluorescence counts that can
be written to the data file, from 3 seconds before to 3 seconds after the
fluorescence measurement.
Gas exchange refers to gas exchange data that can be included, as part of
each fluorescence measurement. If you previously selected CFM-3, PL C3
18x25 mm window (or any combination of CFM-3 and PLC3 cuvette wi ndo w),
the Calc Fluorescence box will be checked and Gas exchange will be checked
(combined fluorescence/gas exchange enabled).
Calc Fluorescence will be grayed out, indicating that fluorescence data must
be written to the data file. If you previously selected CFM-3, Chlorophyll
Fluorescence Module, the Calc Fluorescence box will be checked (enabled)
and Photosynthesis will be unchecked (disabled). Both will be gra yed out,
indicating that only fluorescence data will be written to the data file.
Page 91
Initial Fluorescence
phiPSII-SP (ϕPSII-Single-Pulse). If selected, there is no need to dark adapt
the leaf and measurements can begin right away and a single, saturating pulse
DA period
5
10
15
20
25
30
Fv/Fm
0.63
0.71
0.78
0.81
0.80
0.81
Repeated
Only one valid selection can be made and the measurement recorded at
applied to the light-adapted leaf sample. The single pulse duration and
intensity can be set in the lower part of the screen under “Saturating Light”.
phiPSII-MP (ϕPSII-Multi-Pulse). If selected, there is no need to dark adapt
the leaf and a “Multi-Pulse sequence can begin right away with multiple,
saturating pulses applied to the light-adapted leaf sample. The Multi-Pulse
duration and intensity settings (up to 5 steps) can be set in the lower part of the
screen under “Saturating Light”.
Fv/Fm. If selected, you will need to allow the plant to dark acclimate prior to
measurement. Set the Initial Dark Adapt Period of your choosing. Longer
dark adapt period are required for plants that have been under high light and
shorter periods for plants that have been in the dark or low light.
To determine the effective dark adaptation period you will need to identify the
point at which F
does not increase with an associated increase of the dark
v/Fm
adaptation period. In the example below, the leaf sample is sufficiently darkadapted after 20 minutes, since longer dark adaptation periods did not result in
higher F
values. Note that prior light exposure (intensity, duration)
v/Fm
significantly affects the minimum effective dark adaptation period required to
fully re-oxidize (open) PSII photochemistry in the leaf sample.
(minutes)
Fluorescence
recording intervals of your choosing. This will be influenced by your choice of
Measurement
Recording mode (Manual, Timed, or Response Curve).
None. If selected, there will be no chlorophyll fluorescence measurements
performed after a photosynthesis measurement has been recorded.
Page 92

phiPSII-SP (ϕPSII-Single-Pulse). If selected, a single, saturating pulse will be
applied to the light-adapted leaf sample. The single pulse duration and
Concluding
This defines the final measurement to be recorded after the last
intensity can be set in the lower part of the screen under “Saturating Light”.
phiPSII-MP (ϕPSII-Multi-Pulse). If selected, multiple, saturating pulses will be
applied to the light-adapted leaf sample. The Multi-Pulse duration and
intensity settings (up to 5 steps) can be set in the lower part of the screen
under “Saturating Light”.
ϕPSII. If this is selected, a saturating pulse will be applied to the light-adapted
phiPSII-FoP (ϕPSII-Fo’). If this is selected, a saturating pulse will be applied
to the light-adapted leaf sample followed by illumination using the far-red light
for measurement of Fo’ after a photosynthesis measurement has been
recorded.
leaf sample after a photosynthesis measurement has been recorded.
Fs. If this is selected, the steady state fluorescence will be recorded after a
photosynthesis measurement is recorded.
Enter the estimated Total Manual or Timed Repeated Records for the
measurement session you will con duc t. For exam ple, if you will make
measurements in Manual recording mode, and you know that you will apply 5
different light levels for which you would like to record chlorophyll fluorescence
once with far-red light application immediately following each saturating pulse,
select ϕPSII-Fo’ after every 1 records, and Total Manual or Timed
Repeated Records=5. If using a Response Curve to measure fluorescence,
Repeated Fluorescence will be used in conjunction with Records per Level in
the response curve.
To make only a single Initial measurement (for example, to dark-adapt and
perform Fv/Fm on multiple leaf samples) set Total Manual or Timed
Repeated Records=0.
Fluorescence
Measurement
photosynthesis measurement.
None. If this is selected, there will be no concluding chlorophyll fluorescence
measurement and the sequence will terminate after the last photosynthesis
measurement.
Page 93

FoP (Fo’). If selected, far-red light will be applied to the leaf sample.
Modulating Light
Gain. Used to adjust the resolution of the fluorescence signal.
Saturating Light
Single Pulse Measurements
Fv/Fm. If selected, you must allow the leaf to dark adapt prior to making the
measurement. Enter the time (in minutes) at “Concluding Dark Adapt
Period” and we recommend at least 20-30 minutes for best results.
Modulation Level. Modulation Level (1-4) determines the frequency of
sample fluorescence counts. Higher levels have better signal to noise, while
lower levels have poor signal to noise but have no actinic effect. For example,
greater noise due to a lower modulating frequency can have a large effect on
measuring the lowest two values used to arrive at an average of Fo’ under farred light.
Single Pulse Duration. The time (in seconds) for the Single Pulse Duration
saturating light to be applied.
-2 s-1
Single Pulse Intensity. The saturation pulse intensity (0-10000 µmol m
).
Multi-Pulse Measurements
Multi-Pulse Duration. The time (in seconds) for each multiple pulse duration
saturating light to be applied. For Multi-Pulse measurements, you have up to 5
steps but you must set at least 3 steps. Based on our testing, we recommend
at least one step above 3000 µmol m
-2 s-1
1500 µmol m
at the lower end with an even distribution of light in between
the high and low light settings.
Press Accept (F2) to accept changes and return to the main Settings dialog.
TIP
We strongly recommend that prior to running a response script go to Settings (F2) and set Zero, Diff Bal
Mode to “Auto Zero, stored Diff Bal” (See Settings (F2) on page 73
( Store Diff Bal on page 102). This will allow you to execute faster response curves without Diff Bal
-2 s-1 at
the high end and one step below
and that you perform a stored Diff Bal
interruptions between levels.
Page 94
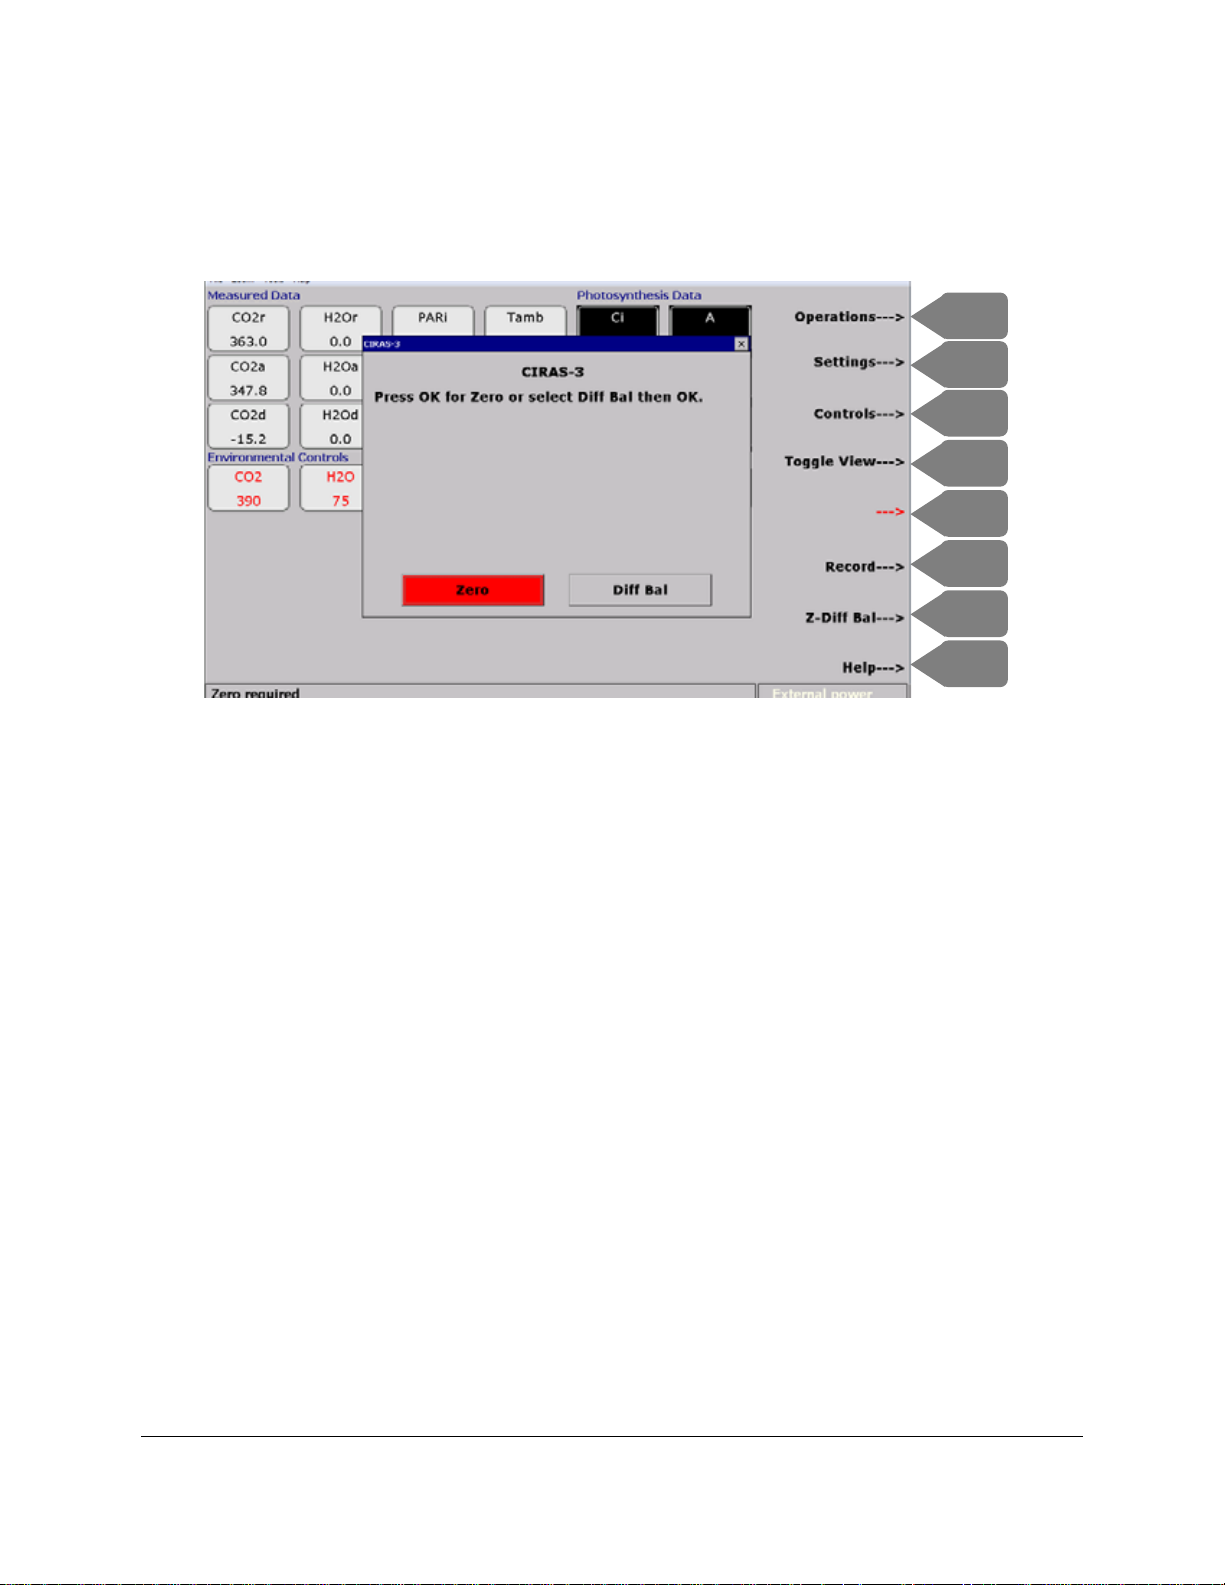
Z-Diff Bal (F7)
F1
F3
F2
F4
F6
F5
F7
F8
To manually access either Zero or Diff Bal functions at any time during measurements, press Z-Diff Bal
(F7). Press the arrow keys to select Zero or Diff Bal. Press ESC to cancel.
Use Diff Bal when you have selected Manual Zero/Diff Bal Mode and you are prompted to run Diff Bal
with a message in the status bar, “Diff Bal required, ensure CO2r is stable”. Otherwise, run Diff Bal as
often as is practical, for instance when sampling very small leaf areas or generally when your data
suggests very low gas exchange rates. Zero and Diff Bal will otherwise be performed automatically at
regular 31 minute intervals by CIRAS-3. Diff Bal will help ensure that detectable Analysis gas differentials
are real, and not simply artifacts of unbalanced IRGA cells.
Be sure that CO2r is not changing at the time that you run Diff Bal. Remember that Diff Bal diverts the
Reference gas stream through both Reference and Analysis cells and corrects for any small differences
between the Reference and Analysis cells measuring the same gas sample. If CO2r was changing
substantially during the Diff Bal process, the resulting difference and applied offset would be artificial, a bit
like trying to hit a moving target versus a stationary target. In this sense, it is possible to perform a “bad”
Diff Bal. Run Diff Bal more frequently if you are operating at very fine tolerances in your gas exchange
-2 s-1
data, for example, if it is important to detect differences in assimilation rate that are <1.0 µmol m
.
Page 95
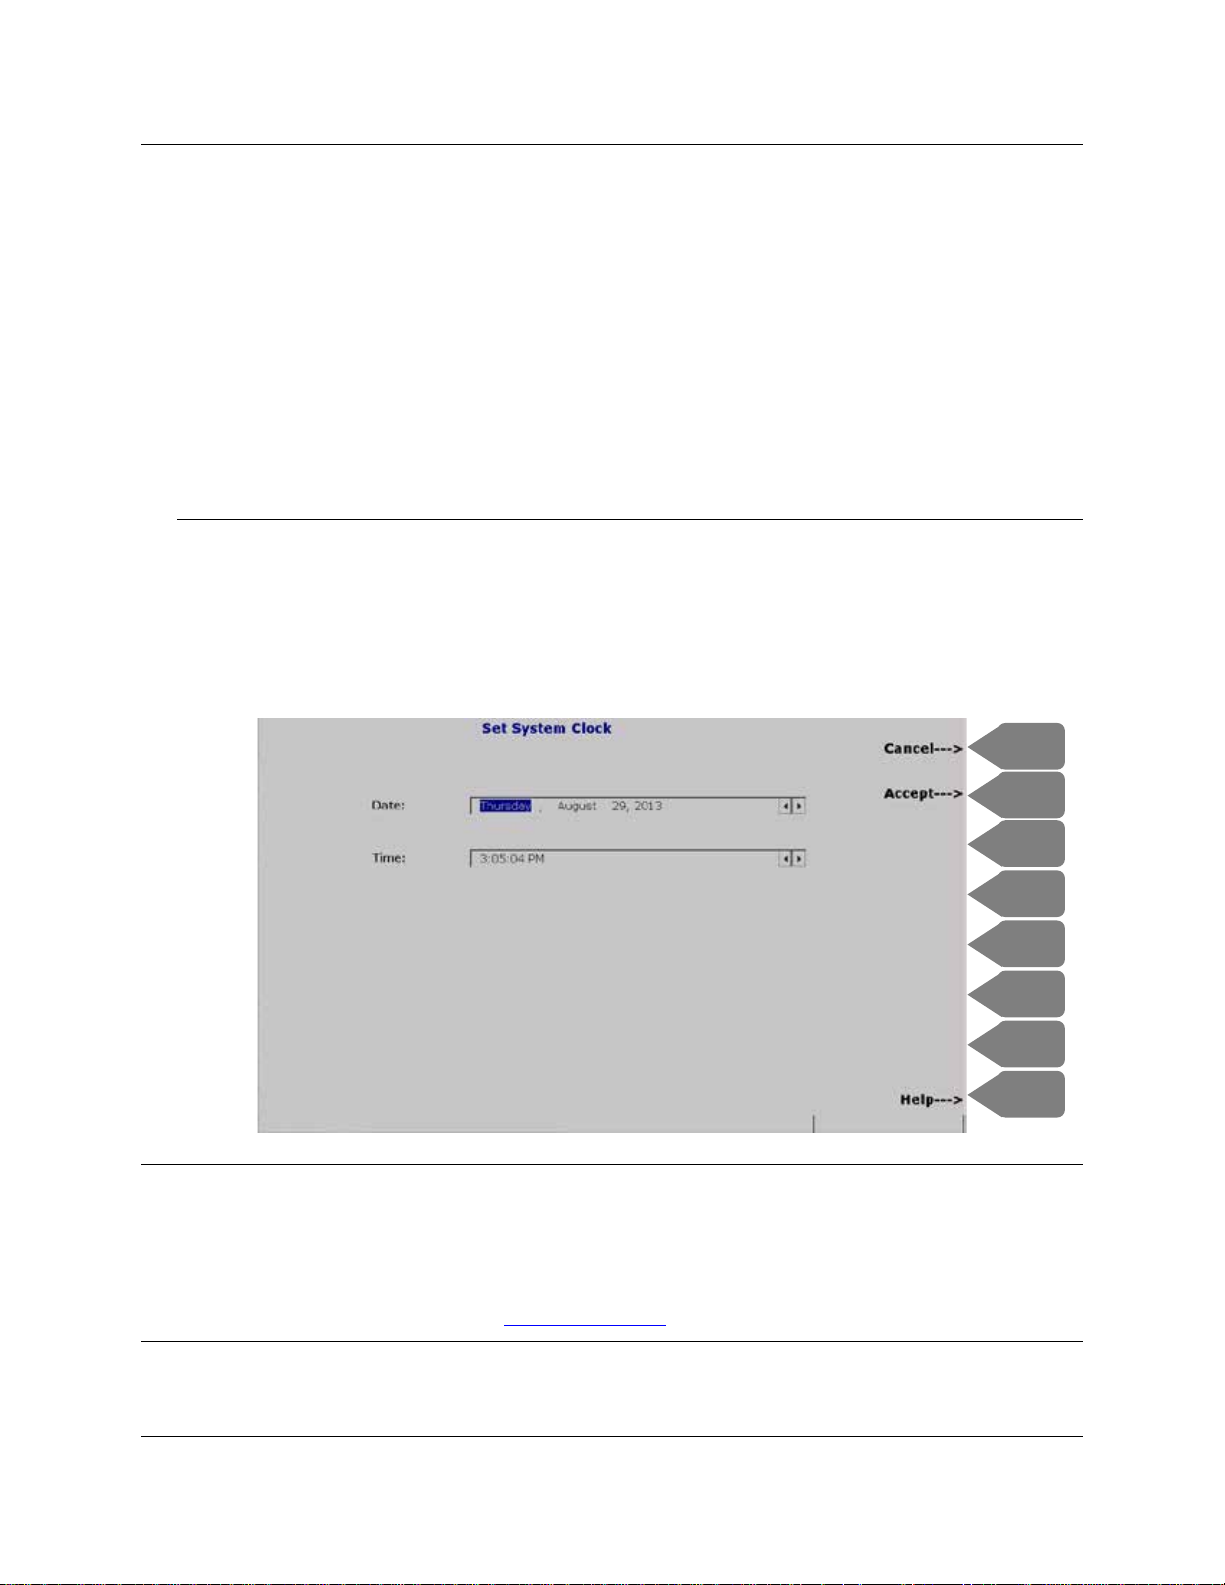
TIP
F1
F3
F2
F4
F6
F5
F7
F8
Prior to measurements on small leaf area or whenever you expect very low rates of photosynthesis and
-1
when CO2d is showing a small differential (± 1-2 µmol mol
), perform a manual Diff Bal (F7) to get closer
to a 0 CO2d. Typical sources for differentials in CO
• Instrument not at stable operating temperature
• Leak around leaf chamber gaskets
• Exhausted chemicals (particularly the molecular sieve)
• Fluctuating CO2r
and H2O are:
2
Set Clock
Press Operations (F1) > Set Clock (F3) to view the system clock. To change the date or time, highlight
the item needing to be changed and use the up and down arrows to set. Use the Tab key to move
through the selections and when finished press Accept F2.
TIP
It is very important to have the correct date and time set on the CIRAS-3 as the default data files use this
information as part of the file name. See Manual Recording on page 84
.
Page 96
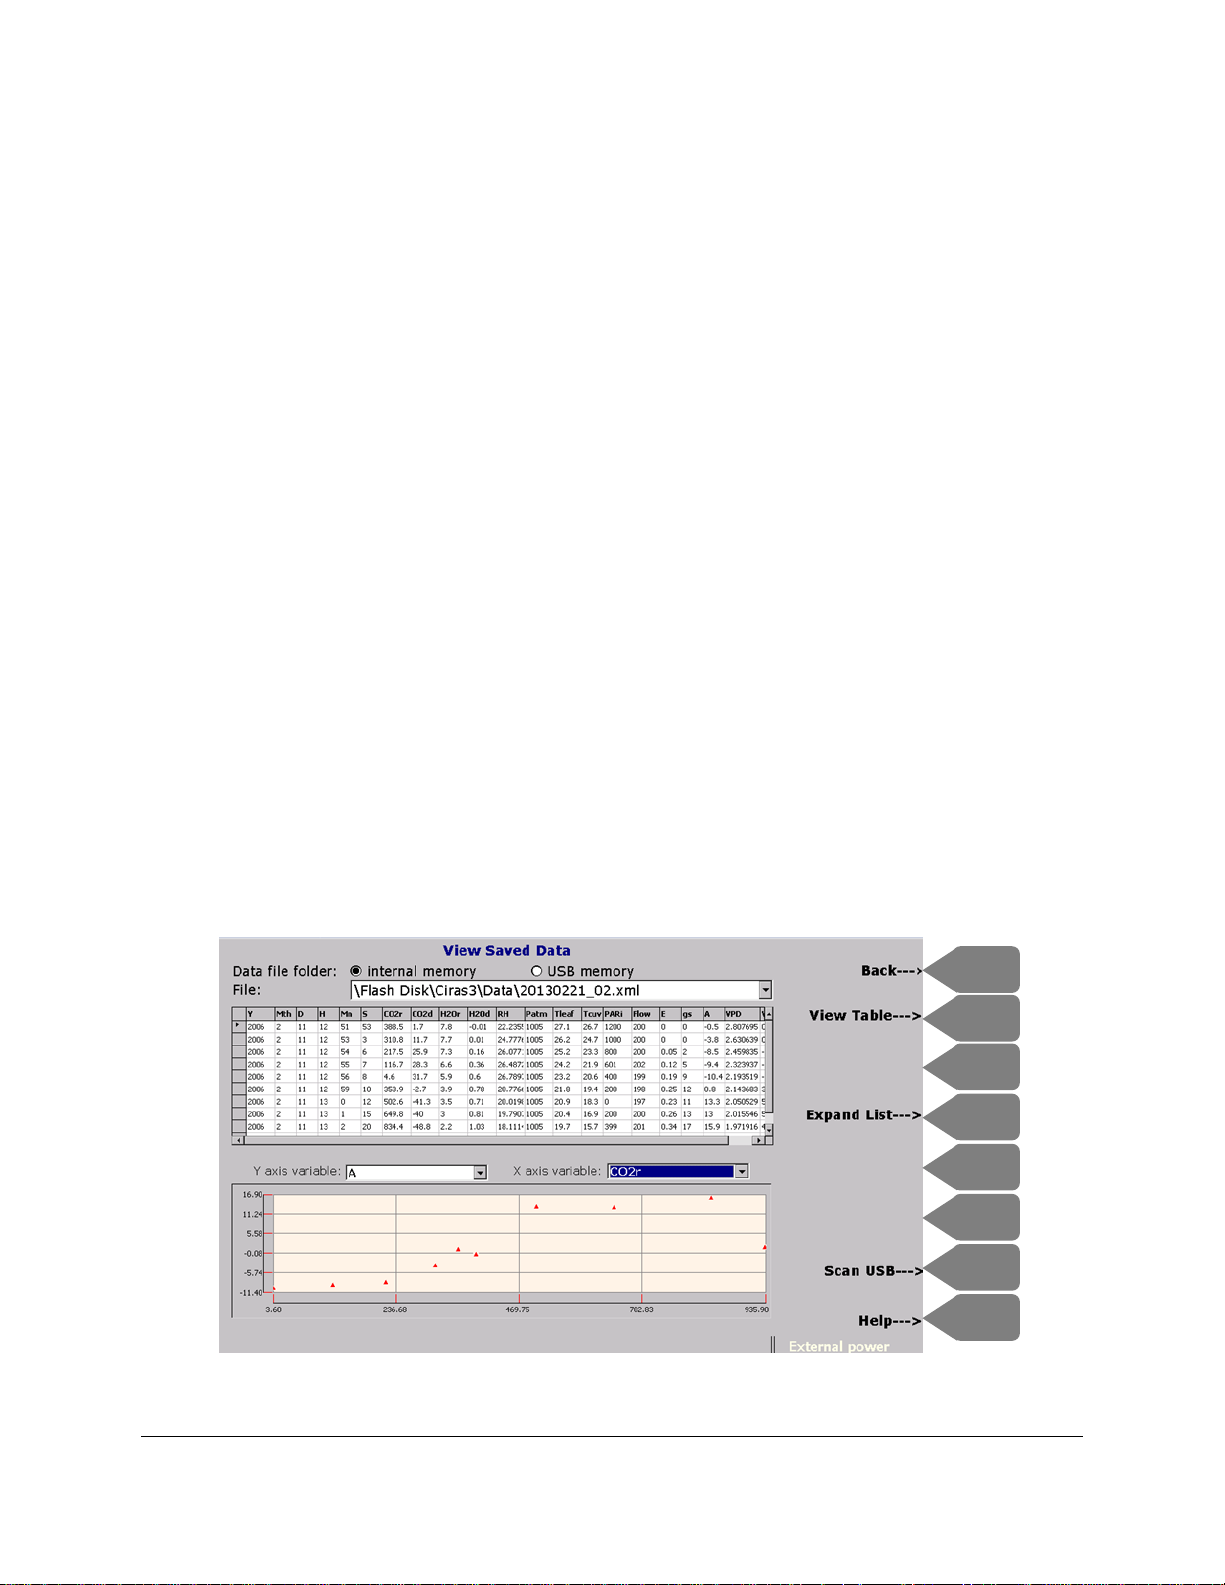
View Saved (F4)
F1
F3
F2
F4
F6
F5
F7
F8
Press Operations F1 > View Saved (F4) to view data stored on internal memory or on the USB. This
feature of CIRAS-3 allows almost immediate review of recorded data on the console, in both tabular and
graphical formats. To enter the View Saved Data screen press Operations (F1) and View Saved (F4).
The most recently saved .xml data file opens automatically. The location of the file is selected by using
the Left and Right arrow keys to move between Data file folder: internal memory or USB memory. The
next field shows the internal memory default location and the most recently created data file, e.g. File:
\Flash Disk\Ciras3\Data\0000_20130221_02.xml. With this field highlighted press Expand List (F4) and
scroll down to an earlier file if desired.
Press TAB to move to the data table, use the Down arrow to scroll through the table. The table column
headings indicate its content, which for practical reasons displays most, but not all of the full .xml data file.
Press TAB to move to the Y axis variable field. Here you can press Expand List (F4) to see available
variables, or press the Down arrow sequentially to display the variables one at time, as single-variable
graphs. The Y axis is auto-scaled and the default X axis is a time span. As in Recording, the data
points in the graph appear as red triangle markers. Press TAB to highlight the X axis variable field. The
default variable is time (HH:MM:SS), and can be changed to a measured or calculated variable to create
a two-variable scatter plot, in which case the X axis is also auto-scaled.
Press View Table (F2) to display only tabular data – press View Graph (F2) again to display only
graphical data. Press View Both (F2) to return to the default combined display. Press Back (F1) to exit
View Saved Data.
Page 97
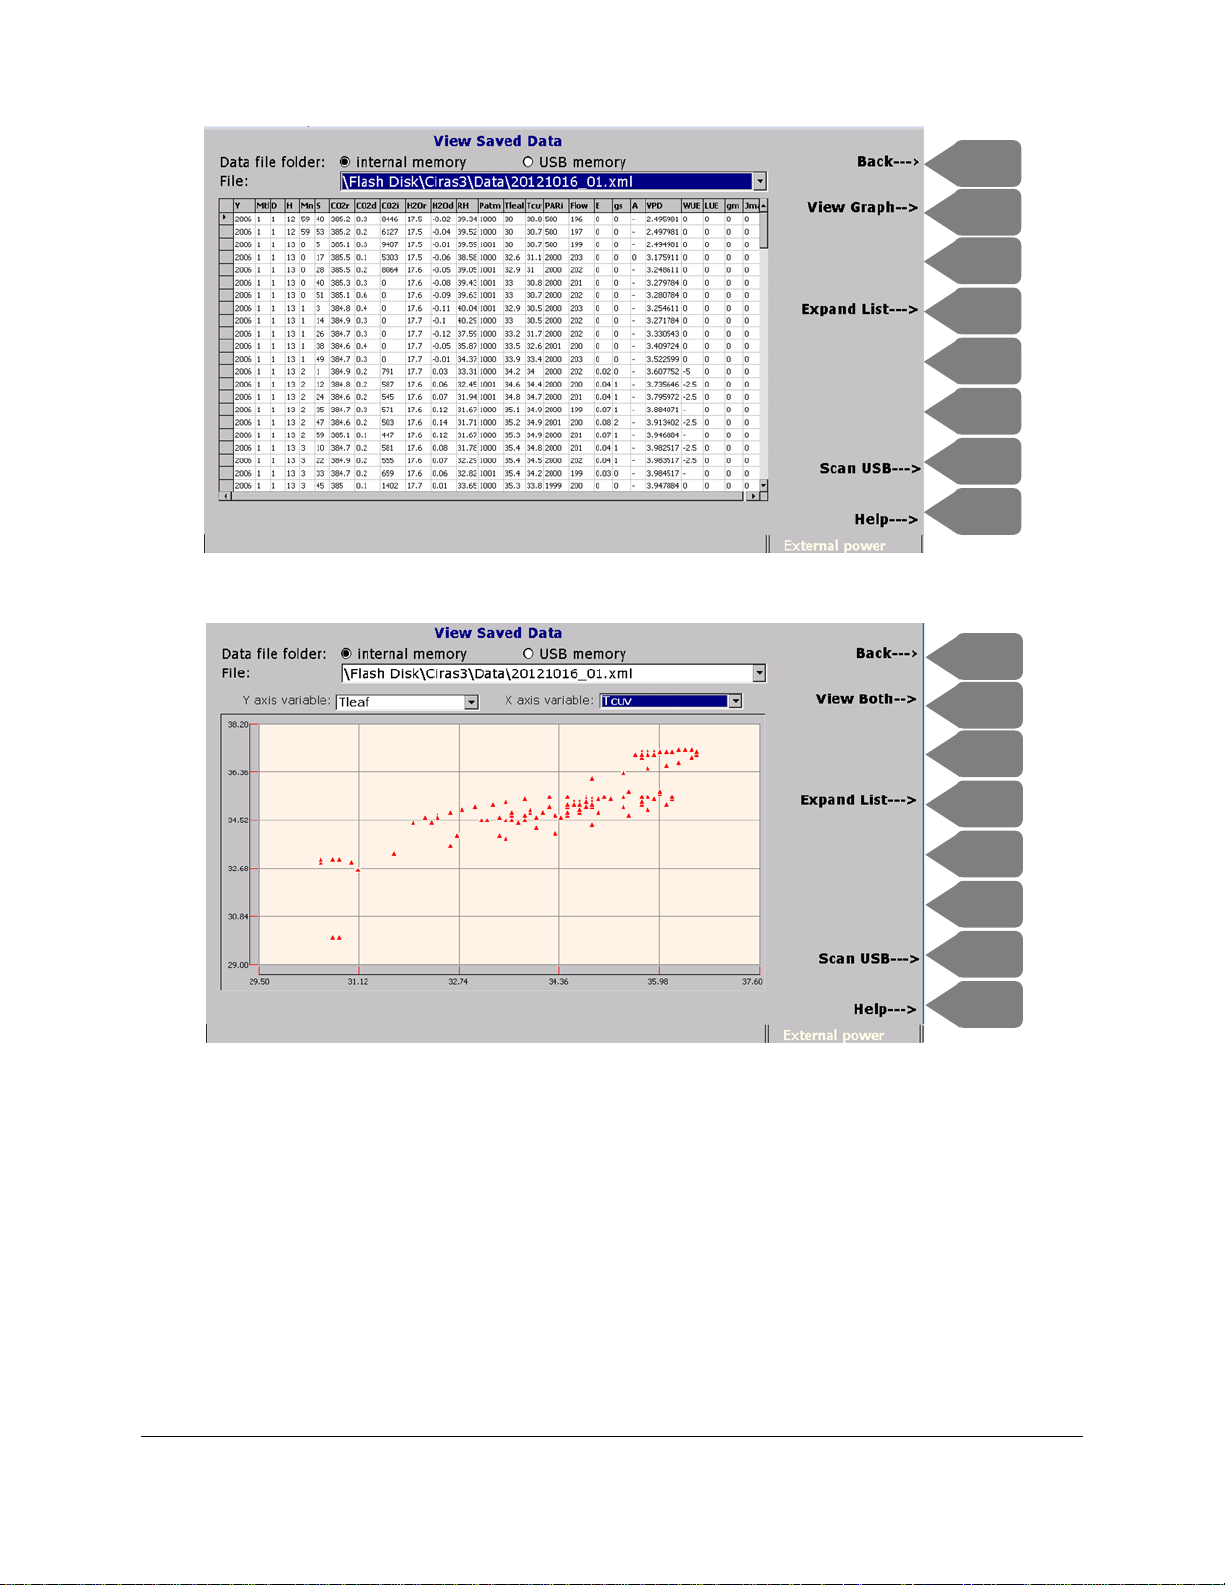
F1
F3
F2
F4
F6
F5
F7
F8
F1
F3
F2
F4
F6
F5
F7
F8
Page 98
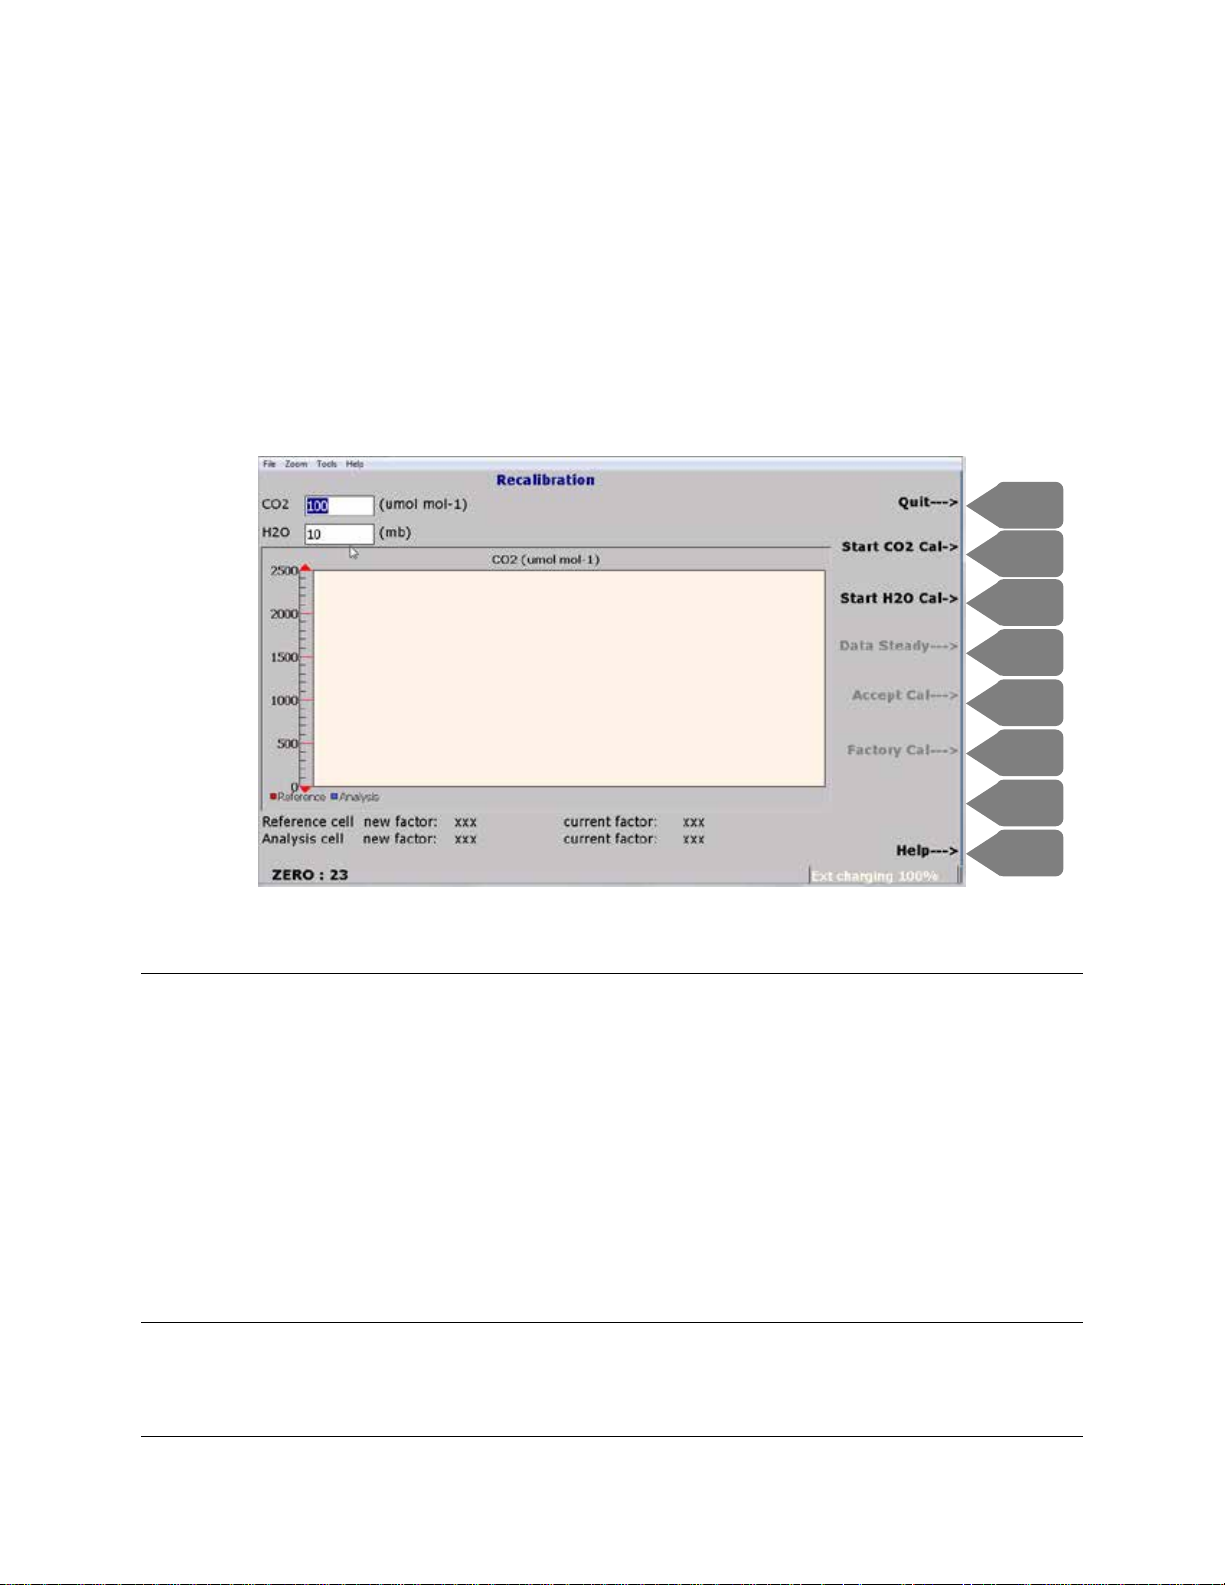
Calibration
F1
F3
F2
F4
F6
F5
F7
F8
Press Operations (F1) > Calibration (F5). This is where users can calibrate the CIRAS-3 CO2 and H2O
infrared gas analyzers, PAR sensors on the PLC3 and the LED light unit.
Recalibrate
To recalibrate the CO2 and H2O gas analyzers, press Recalibrate (F2). Also, the link pipe must be
removed from the REF IN gas port on the CIRAS-3 console to allow the CO
through the reference cell for calibration purposes.
and H2O gas to pass
2
TIP
All CIRAS-3 systems receive a thorough factory calibration before it is shipped and it features our
innovative “Auto-Zero” facility. What does this mean? You should never have to worry about
recalibration unless damage has occurred or if you simply want to check the calibration. The “Auto-Zero”
ensures that the system maintains IRGA calibration and long term stability for many, many years. It is
important that you properly maintain the desiccants to ensure that they are fresh in order for the CIRAS-3
to perform Auto-Zero. Simple, periodic checks of all CO
recommended.
and H2O gas analyzers calibration are
2
Page 99
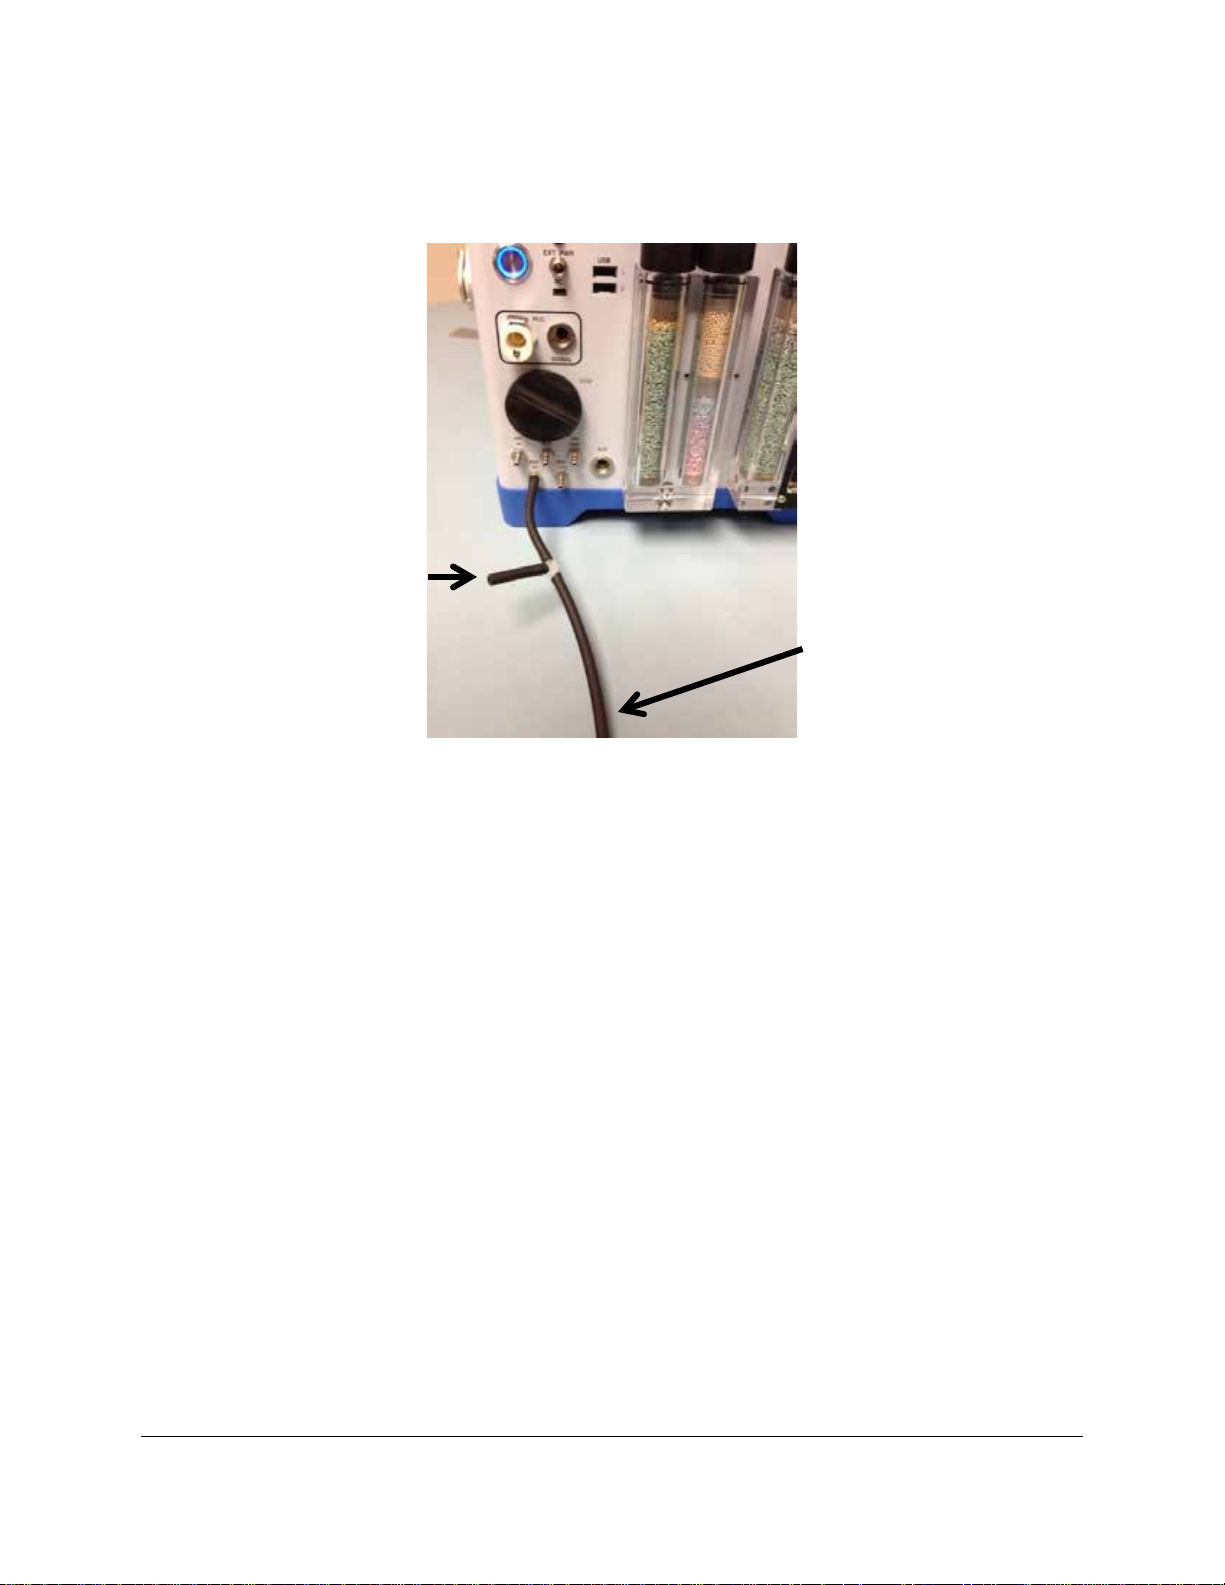
Calibration Setup
Incoming CO2 or H2O
Vent Pipe
calibration gas mixture
(250-300 cc/min)
CO2 Calibration
For CO2 recalibration we recommend a certified, accurate tank (< 1.0% accuracy) of compressed gas
containing CO
gas mixture contains a CO
if most of your measurements are made near CO
mixture of 500 µmol mol
1. Ensure that all chemicals are fresh.
2. Connect the CO
above. We recommend using flexible tubing to easily connect to the gas port and a flow rate of
250-300 cc/min. Be sure to include a vent pipe between your calibration gas mixture and CIRAS3 to avoid overpressure.
3. Enter the CO
Cal (F2).
4. Monitor the CO2r and CO2a values and when steady, press Data Steady (F4). New scaling
factors for both the Reference and Analysis CO
accept the new calibration, press Accept Cal (F5) or Quit (F1) to abort the calibration. If you
choose to Quit the calibration, you will be prom pted with “CIR AS-3 Reject new calibration”.
in air (not CO2 in nitrogen). Generally speaking, it is recommended that your calibration
2
concentration slightly above your normal measurement range. For instance,
2
levels in the range of 390-450 µmol mol-1, a calibration
2
-1
would be recommended.
calibration mixture to the “REF IN” gas port on the CIRAS-3 console as shown
2
gas concentration of your calibration mixture in the CO2 box and press Start CO2
2
IRGAs will be determined and displayed. To
2
Press OK.
Page 100

You always have the option to reset the CO2 IRGAs back to factory calibration by selecting Factory Cal
(F6).
H2O Calibration
For H2O recalibration we recommend using an accurate humidity generator or water vapor generator.
1. Ensure that all chemicals are fresh.
2. Connect the H
above. We recommend using flexible tubing to easily connect to the gas port and a flow rate of
250-300 cc/min. Be sure to include a vent pipe between your calibration gas mixture and CIRAS3 to avoid overpressure.
3. Enter the H
Cal (F3).
4. Monitor the H2Or and H2Oa values and when steady, press Data Steady (F4). New scaling
factors for both the Reference and Analysis H
accept the new calibration, press Accept Cal (F5) or Quit (F1) to abort the calibration. If you
choose to Quit the calibr at i on, you will be prompted with “CIRAS-3 Reject new calibration”.
Press OK.
You always have the option to reset the H
Cal (F6).
O calibration mixture to the “REF IN” gas port on the CIRAS-3 console as shown
2
O gas concentration of your calibration mixture in the H2O box and press Start H2O
2
O IRGAs will be determined and displayed. To
2
O IRGAs back to factory calibration by selecting Factory
2
TIP
Make sure that the flow rate from your CO2 or H2O calibration gas mixture is at least 250 cc/min.
Otherwise atmospheric air could be drawn into the vent pipe leading to errors in calibration.
 Loading...