

Page 1
g
R-500 Users Guide (V1.3) Feb 21, 2006
Users Guide: R-500 Wideband Computer
R-500 Wideband Computer Users Guide
R-500 Wideband Computer
Users Guide
(Firmware Version 1.11)
Thank you for purchasing the PLX Devices
R-500 wideband computer, the worlds
most advanced internal combustion en
tuning and diagnostic tool. Please read
through this document carefully to operate
the product correctly.
© PLX Devices 2005 All Rights Reserved
ine
Version 1.3 Feb 21, 2006
www.plxdevices.com
(408)745-7591
Page 2

Users Guide: R-500 Wideband Computer
WARNINGS
Oxygen sensor gets HOT during operation. Do not touch or expose to
combustible materials. Serious injury and damage to property may occur.
To prevent fire or shock hazard, do not expose this product to rain or moisture.
Do not operate this product under direct sunlight or in high temperatures.
Damage and malfunction may occur.
Unit gets warm during operation. Do not obstruct the ventilation holes on the
rear of the unit. This may cause overheat, fire or unit malfunction.
Do not operate this product while driving. This may interfere with driving
operations, resulting in an accident.
Do not use this product and its accessories in any way other than specified by
PLX Devices. PLX Devices is not liable for accidents or damage cause by misuse
of this product.
Do not tamper, disassemble, or modify this product. This may cause an
accident, fire, electric shock, or product malfunction.
Do not operate this product without a protective fuse. (5-10 Amps)
INTRODUCTION
Thank you for purchasing your PLX R-500 wideband computer, the worlds most advanced and feature
packed wideband air/fuel ratio (AFR) monitoring device. It is truly a must have tool for tuners.
Your PLX R-500 is not just a wideband controller, it is a wideband computer! Utilizing the latest computer
technologies, your R-500 is equipped with a powerful 32 bit microprocessor giving you the ability to
regularly update your operating system with new and exciting features.
KEY FEATURES
1. Measures Wideband AFR, EGT, Knock, Boost
2. 6 inputs for data logging (2 Speed, 4 Analog)
3. Listen to engine knock with your headphones / speakers
4. Over 80 minutes of datalogging
5. 5 analog outputs for 3rd party interface
Version 1.3 Feb 21, 2006
www.plxdevices.com
(408)745-7591
Page 3

Users Guide: R-500 Wideband Computer
6. Fully customizable warning light / shift light
7. High speed USB interface
8. Powerful PC analysis software included
9. Field firmware upgradeable (New features added regularly)
10. Powerful 32 bit integrated processor, RAM, and FLASH technologies
11. 4 analog outputs
12. Large dot matrix display with blue backlight
13. 100% backwards compatible with M-Series controllers
14. Compact dash mountable design (4.75 x 2.25 x 1 inch) (120 x 57 x 15 mm)
15. Sensor soft start circuitry, prolongs o2 sensor life
PACKAGE CONTENTS
• R-500 dash mountable compact wideband controller
• Bosch LSU 4.2 Wideband O2 Sensor
• 3ft Bosch O2 Sensor Harness (Controller side)
• 8ft Bosch O2 Sensor Harness (O2 sensor side)
• 3ft Main Harness (controller side)
• 3ft Main Harness (user side)
• 3ft Main Harness Power Wires (user side)
• 3ft K-Type thermal coupler wire (EGT probe sold separately)
• 6ft USB interface cable (R-500 -> PC connectivity)
• PLX parallel port firmware re-flash card
• Five 0.1uF 50V monolithic capacitors
• CD with USB device driver, operating manual in PDF, Latest version of PLX Logger, firmware re-
flash utility.
PLX LOGGER SYSTEM REQUIREMENTS
Recommended System Requirements:
Windows 95 or higher operating system
Pentium 4/III/II Celeron 1GHz+
Athlon/Duron 1GHz+
256MB Ram
Minimum System Requirements:
Windows 95 or higher operating system
Pentium 4/III/II Celeron 500MHz
Athlon/Duron 500MHz
128MB Ram
*A 1Ghz+ system will improve real-time data logging performance only. Slower systems may be used if
data is downloaded directly from the R-500.
Version 1.3 Feb 21, 2006
www.plxdevices.com
(408)745-7591
Page 4
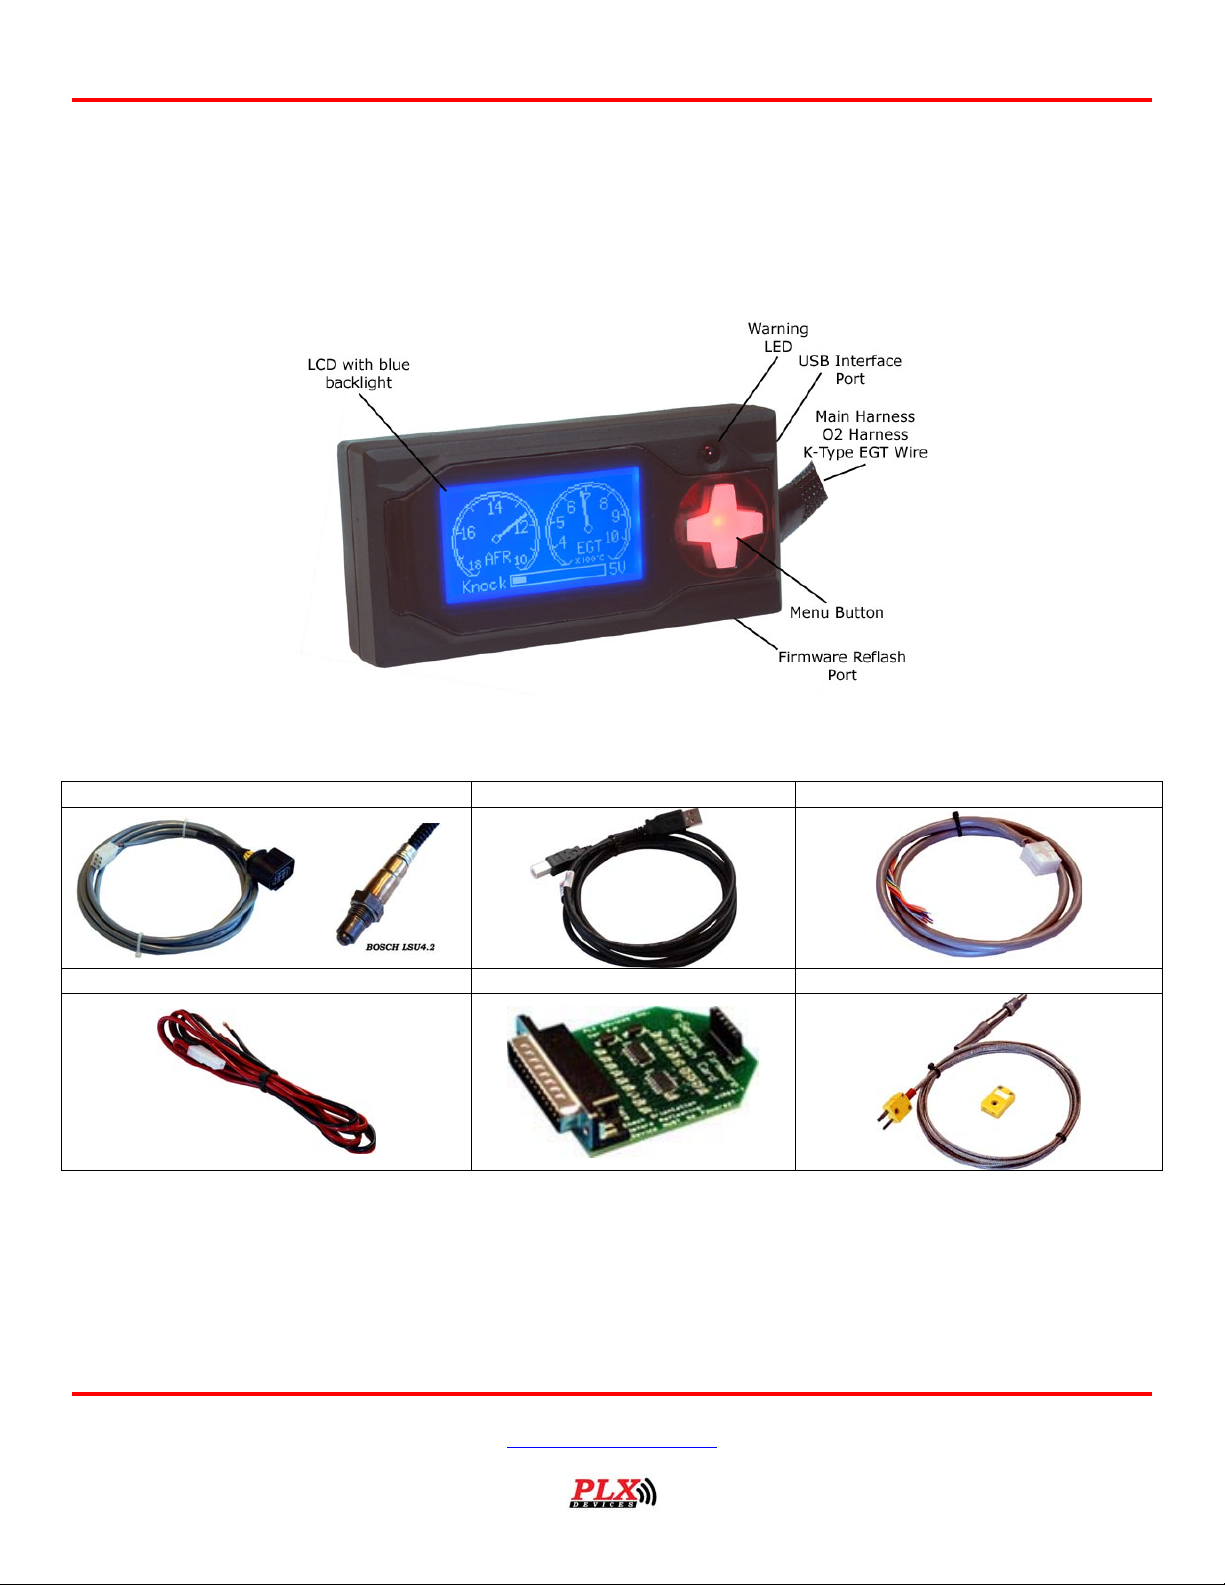
1.0 R-500 Unit
Users Guide: R-500 Wideband Computer
CHAPTER 1
BASICS
1.1 R-500 Cables/Accessories
O2 Sensor Harness/Bosch Sensor USB Cable User Harness
Power Harness Firmware Re-flash Card EGT Probe (Sold with EGT Kit)
Version 1.3 Feb 21, 2006
www.plxdevices.com
(408)745-7591
Page 5
Users Guide: R-500 Wideband Computer
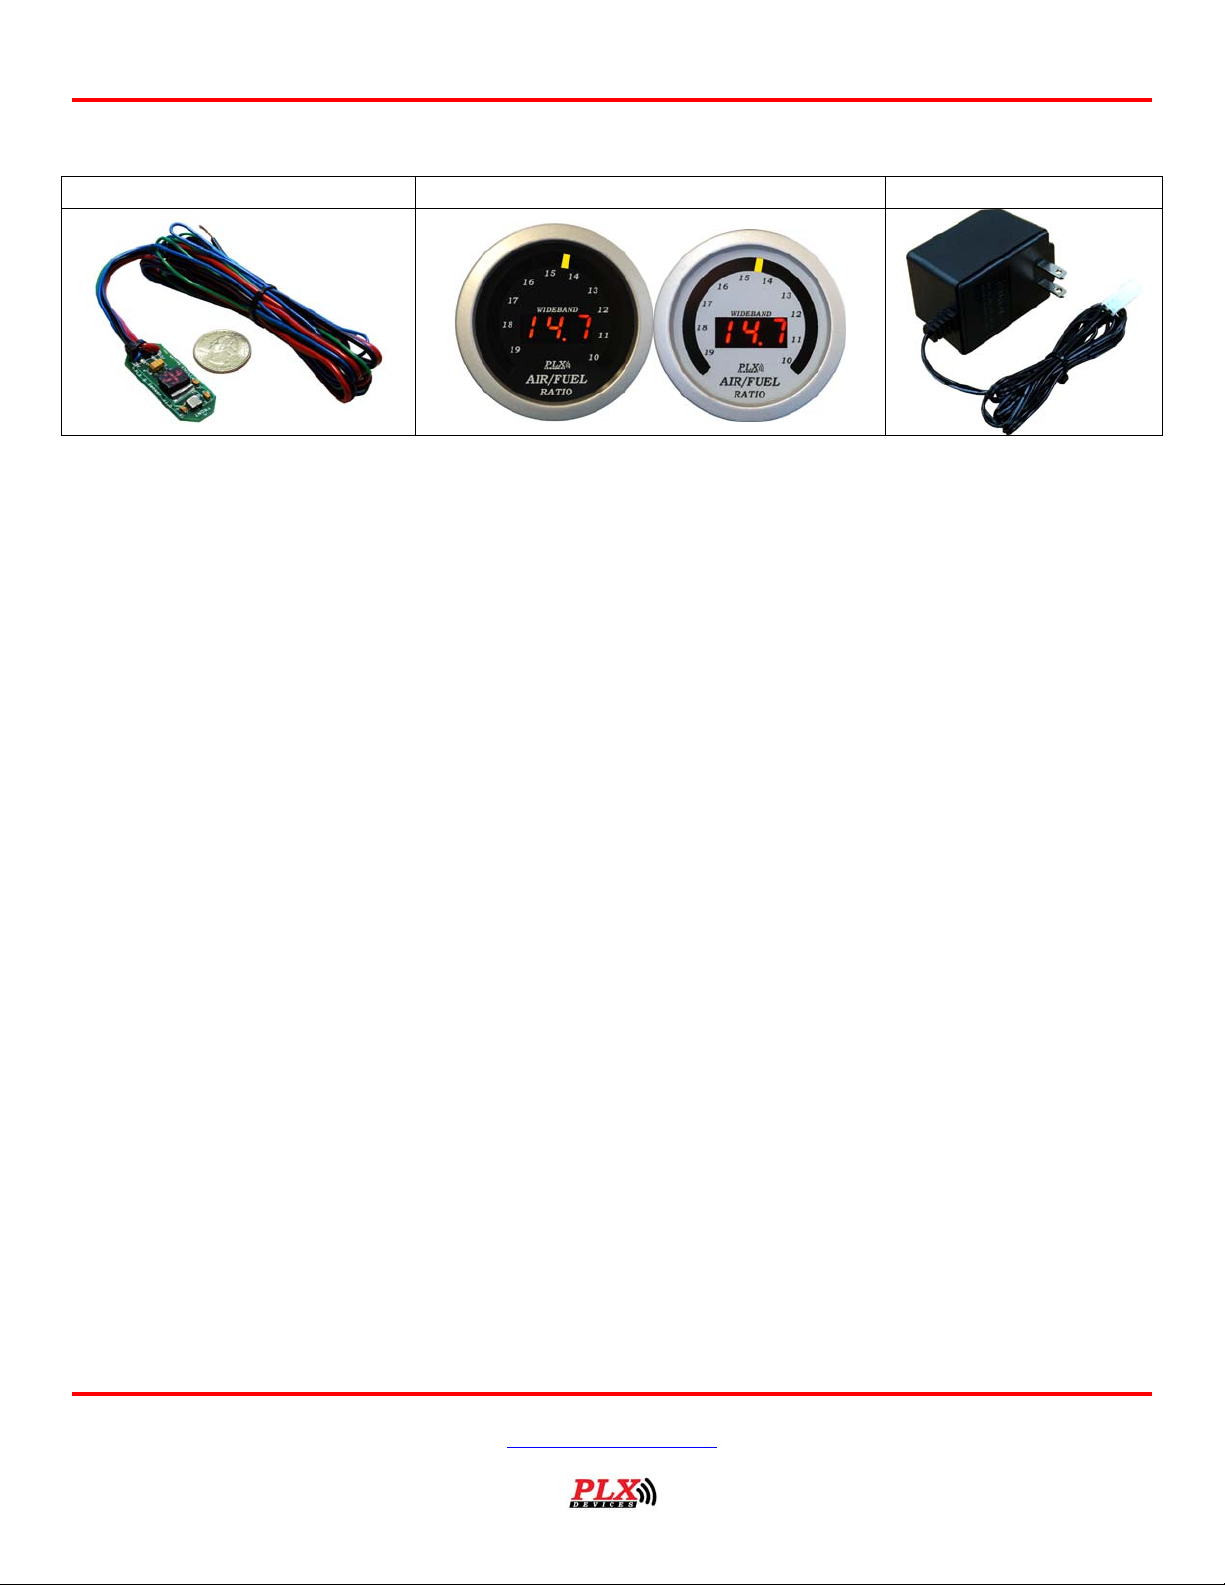
1.2 R-500 Cables/Accessories
G Sensor (For Real-time Dyno) 2 1/16” (52mm) AFR Gauge AC Adapter (12VDC)
Version 1.3 Feb 21, 2006
www.plxdevices.com
(408)745-7591
Page 6
Users Guide: R-500 Wideband Computer
CHAPTER 2
INSTALLATION
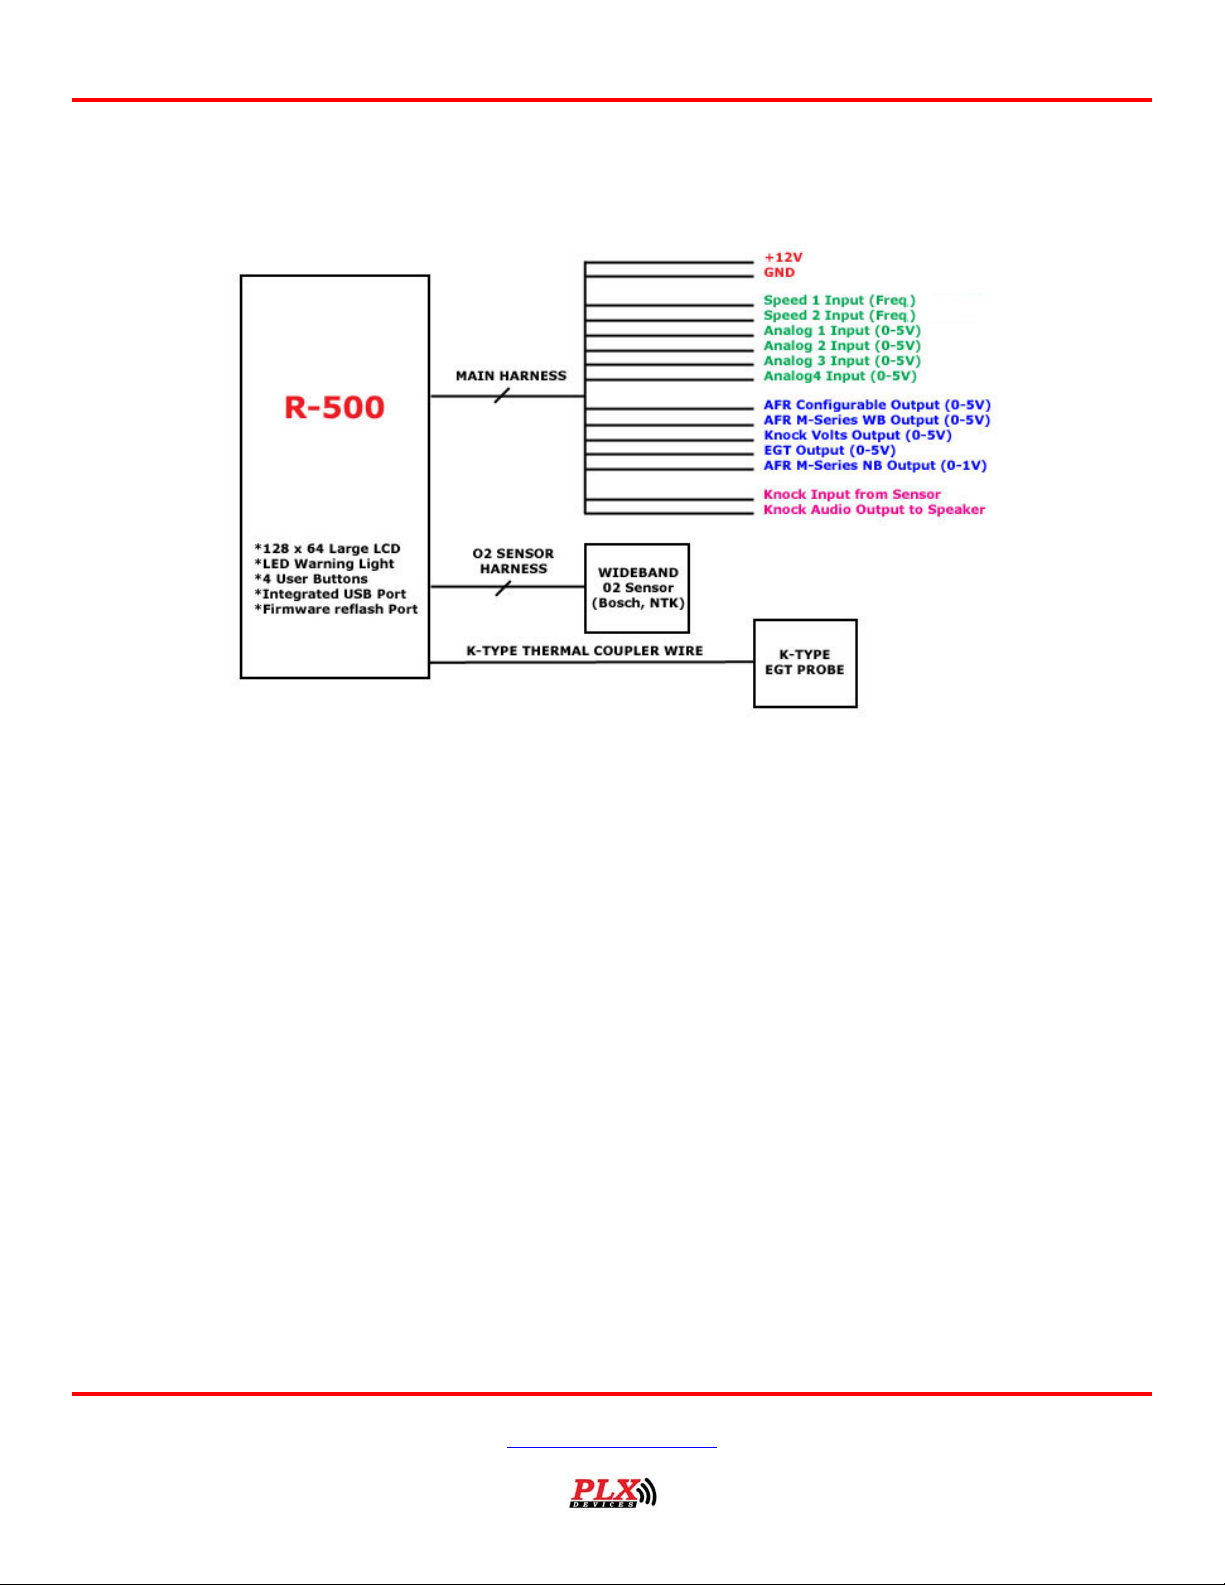
R-500 Connection Diagram
Main Harness Wire Colors
+12V – Red (18 gauge)
GND – Black (18 gauge)
Speed 1 – Brown/Black
Speed 2 – Orange
Analog 1 – Red/Black
Analog2 – Orange/Black
Analog3 – Purple
Analog 4 – Blue
AFR Configurable Output – Light Green
AFR M-Series Linear Wideband Output – White
Knock Raw Analog Output – Yellow
EGT Analog Output – Sky Blue
AFR M-Series Narrowband 0-1V - Gray
Knock Input – Pink
Audible Knock Output – Audio connector
Thermal Coupler Wire Colors
+CH - Yellow
-AL - Red/Yellow
Version 1.3 Feb 21, 2006
www.plxdevices.com
(408)745-7591
Page 7

Users Guide: R-500 Wideband Computer
2.0 Connecting Power and Ground
Connecting your R-500 wideband computer to a reliable power and ground is perhaps the most important
procedure to ensuring your unit functions at full potential. Your unit comes included with a 3ft, 18 gauge
red and black power cables. Connect the red wire to your vehicle’s ignition power (9V-18V). Ignition
power is only supplied when your key is turned passed a specific position and power should not be
supplied when your key is removed. Connect the black wire to your vehicle’s chassis ground.
If you plan to integrate the R-500 with stand alone engine management systems or aftermarket data
loggers, make sure that the black wire is connected physically as close as possible to your device’s ground
to ensure that the same reference ground is seen by both the R-500 and your application. A large voltage
offset may be seen if device is poorly grounded.
Mate the power cable with the R-500 main harness and turn on your ignition power. Verify that your R-
500 wideband computer properly powers up before proceeding with the remainder of the
installation. You should see the PLX Devices splash screen with firmware version number animate on the
LCD screen.
2.1 Mounting Your R-500
Your R-500 wideband computer gets warm during operation. Mount your unit in a location where the
ventilation holes in the rear are not obstructed and air can easily flow to and from the unit. In the case of
in-dash mounts where the area behind the unit is small, it is a good idea to install a small DC brushless
fan to circulate air out.
2.2 Installing the Wideband O2 Sensor
Install your wideband oxygen sensor in a Metric 18mm x 1.5mm pitch O2 sensor bung and torque to 45
N*m or 35 ft-lb. Your sensor should be mounted at least 24 inches (609.6mm) downstream from your
engine block or turbo for optimal performance. The sensor element will fail if it is exposed to temperatures
above 850 degrees Celsius (1,562 degrees Fahrenheit). Mate the provided O2 sensor harness with the
wideband sensor and the R-500. If you plan to replace your stock narrowband sensor by utilizing the
narrowband output, please read
PLXApp004 online for more detailed information.
2.3 Installing the EGT Probe (K-Type)
The R-500 is compatible with any K-Type thermal coupler probe for accurate temperature measurements.
The yellow wire which comes out of the R-500 is a special K-Type thermal coupler wire. DO NOT USE ANY
OTHER WIRING TO EXTEND OR CONNECT TO THIS WIRE OTHER THAN A K-TYPE WIRE. Strip the
insulation off and twist the bare wires together making reference to the polarity. Do not use solder as it
will alter the readings.
Version 1.3 Feb 21, 2006
www.plxdevices.com
(408)745-7591
Page 8

Users Guide: R-500 Wideband Computer
• Yellow = +CH
• Red/Yellow = -AL
If you are using a PLX EGT probe, use the provided plug to mate with the thermal coupler probe. The
probe taps into a standard ⅛ NPT. Be careful with handling the stainless steel wiring. Do not over twist or
kink the wire.
2.4 Connecting Knock Sensor
If your vehicle has a knock sensor, you may connect the R-500 to it. A knock sensor typically consists of 2
wires. One wire is already grounded to your engine block thus already being connected to your chassis
ground. The second wire is usually fed directly to your ECU. Locate this connection from your service
manual and connect the PINK wire from the data logger harness to it. To verify if your knock sensor is
properly connected power up the R-500 and turn on your engine. Connect a pair of headphones to the
audible knock output. You should hear “clicking” through your headphones. The R-500 works best with
resonance type knock sensors.
2.5 Data Logging Inputs
The R-500 is capable of 6 inputs for data logging, 2 speeds and 4 analog. The R-500 data logger is NOT
vehicle specific and was designed to be compatible with most, but not all, signals to and from your ECU. It
is up to the user to determine the viability and compatibility with the intended vehicle to be used based on
the descriptions below.
A compatible speed input is defined as an oscillating pulse which switches between a high voltage and a
low voltage. A valid high voltage is 2V-25V with respect to ground (black wire) and a valid low voltage is
0-0.8V with respect to ground (black wire).
A compatible analog input is defined as a voltage between 0-5V with respect to ground (black wire). Any
voltage between 5-25V will be capped to 5V and voltage above 25V will cause damage to the logger.
• Speed1 (Brown/Black)
•
Speed2 (Orange)
• Analog1 (Red/Black)
•
Analog2 (Orange/Black)
•
Analog3 (Purple)
•
Analog4 (Blue)
rd
2.6 Output for 3
The R-500 has 5 analog outputs. These outputs are low impedance and can drive a load up to 20mA.
Party Interface
Version 1.3 Feb 21, 2006
www.plxdevices.com
(408)745-7591
Page 9
Users Guide: R-500 Wideband Computer
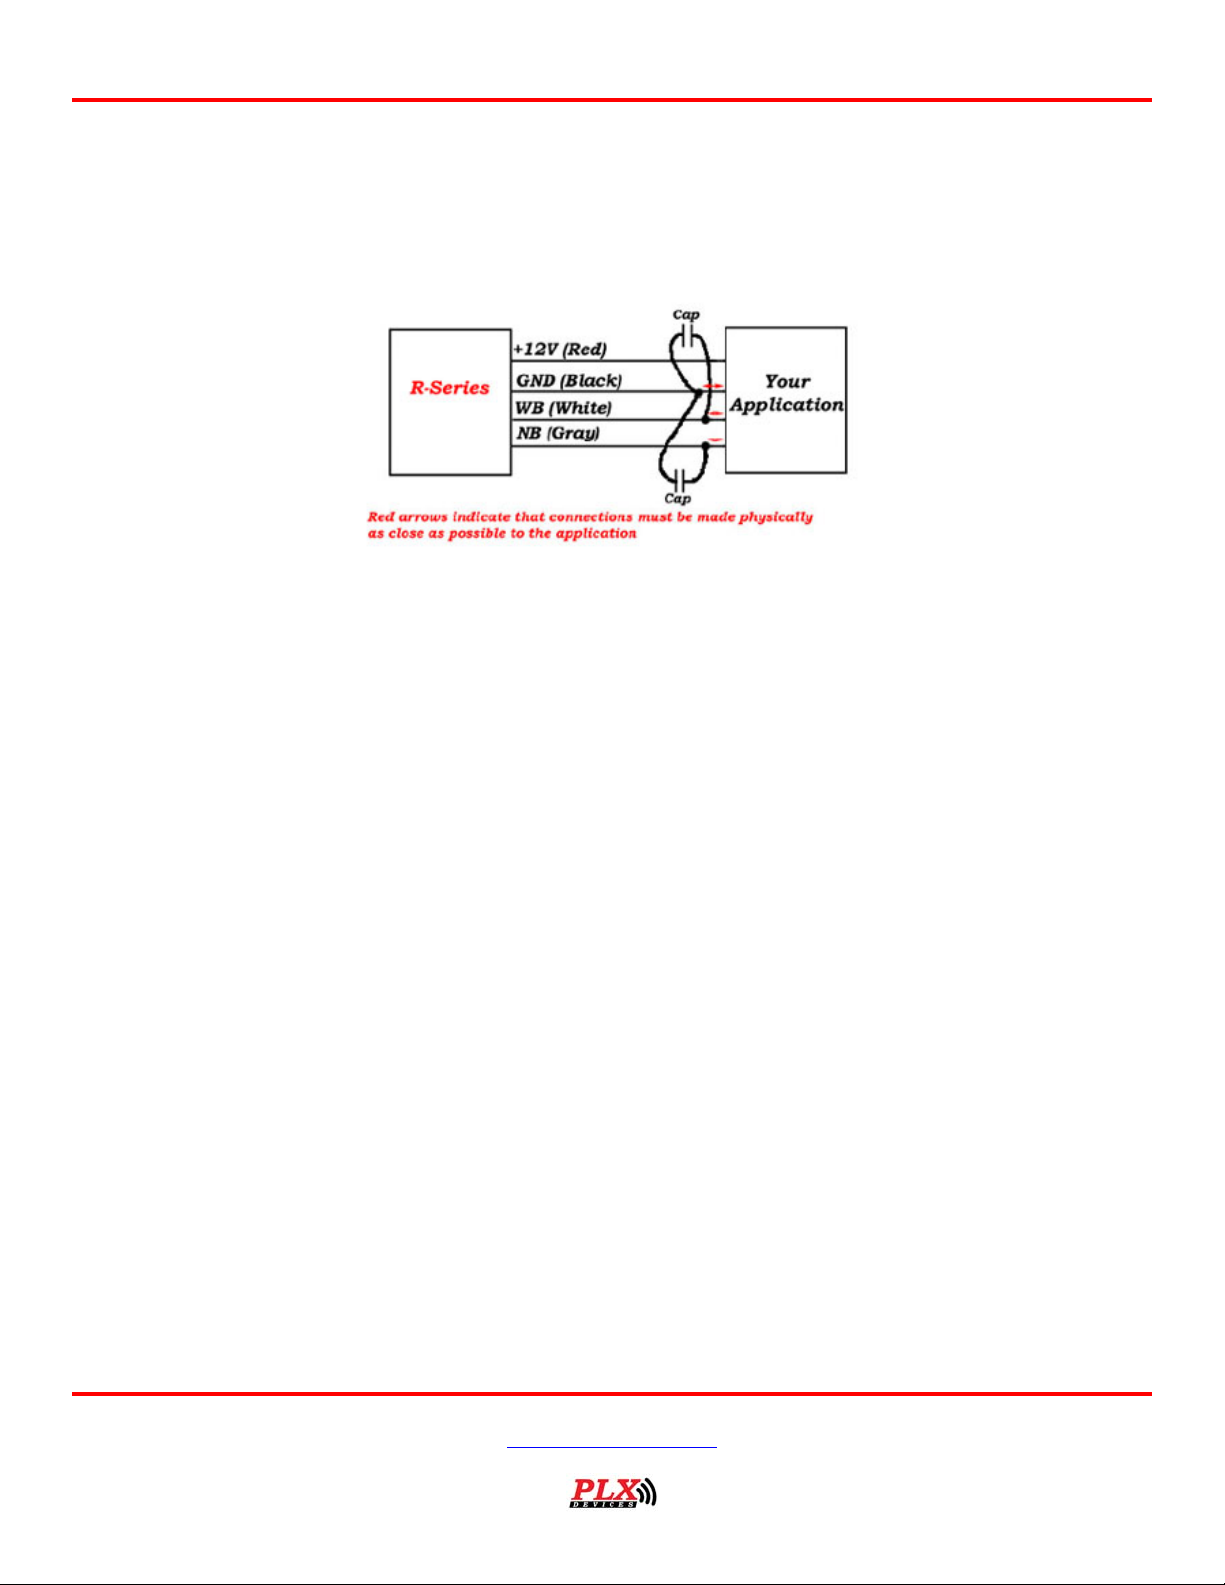
It is highly recommended that 0.1uF 50V capacitors (included) are installed with every analog output you
choose to use. These capacitors filter out unwanted electrical noise from your vehicle and provide you with
a reliable analog output to interface to your application. The capacitor should be installed physically as
close as possible to your application with one leg connected to the output signal and the other leg
connected to your device’s ground. If you only choose to use two output signals, 2 capacitors are used (1
for each output). Here is an example.
1. Configurable Wideband Output 0-5V (Light Green)
a. This output can be fully configured to correspond lambda to any desired 0-5V output. This
can be done though the user interface of the R-500.
b. Air/Fuel Ratio = Stoichiometric * Lambda
Stoichiometric Values for different fuels
Gasoline 14.7
Diesel 14.6
Methanol 16.4
Ethanol 9.0
LPG 15.5
CNG 17.2
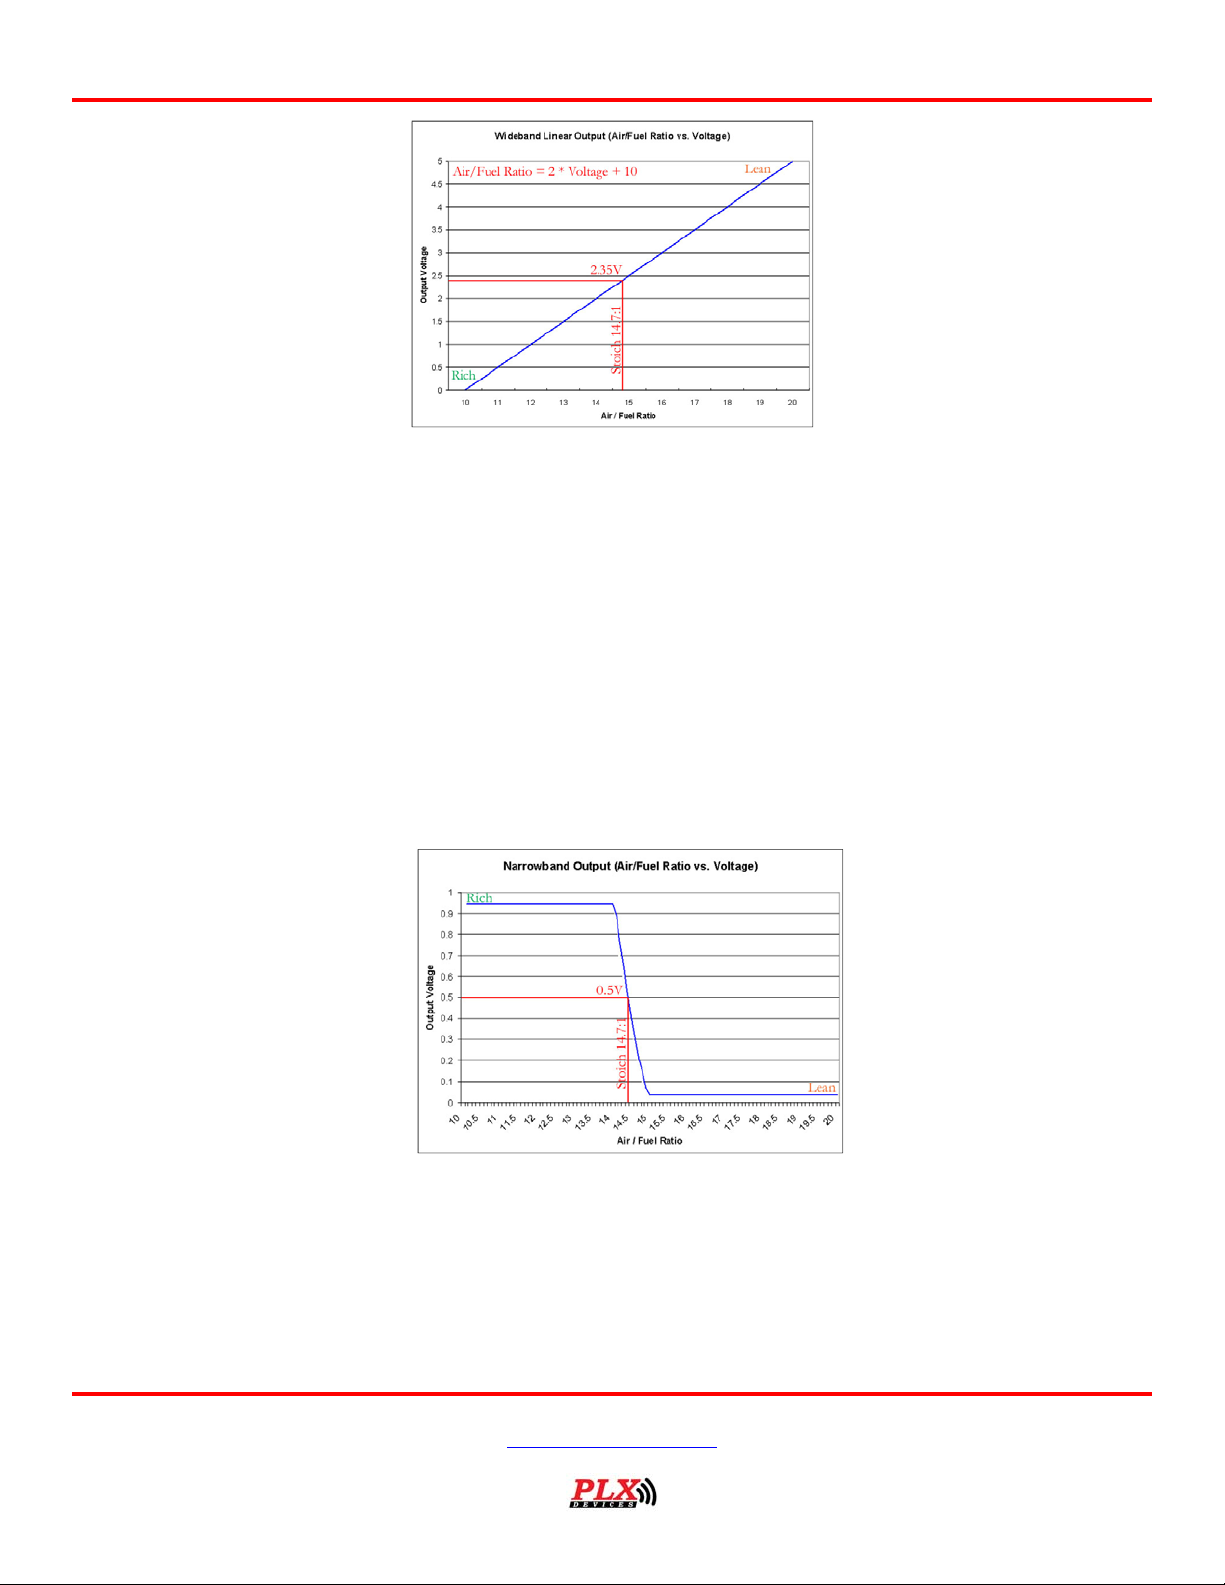
2. M-Series Wideband 0-5V Output (White)
Version 1.3 Feb 21, 2006
www.plxdevices.com
(408)745-7591
Page 10
Users Guide: R-500 Wideband Computer
(Gasoline 14.7)
3. Knock Volts Raw Output 0-5V (Yellow)
a. This output corresponds to the measured output voltage of the knock sensor. It can be
interpreted as the amplitude of the sum of all measured frequencies.
4. EGT Output 0-5V (Sky Blue)
a. Output voltage corresponds to 3.33mV/Deg Celsius. Voltage = 3.33mV * Deg C.
5. Narrowband 0-1V Output (Gray Wire)
(Gasoline 14.7)
2.7 Audible Knock Output
Standard stereo headphones can be connected to the audio jack on the main harness to listen to your
knock sensor. It is recommended that headphones with built-in volume control be used with the
R-500.
Version 1.3 Feb 21, 2006
www.plxdevices.com
(408)745-7591
Page 11

Users Guide: R-500 Wideband Computer
2.8 USB Port
Proper device drivers must be installed for windows to recognize the R-500 as a valid USB device. Insert
the USB cable into the R-500 and your PC’s USB port. Specify the location of your device driver when
Windows prompts. The device driver can be found on the CD included with the kit. Windows will recognize
this device as “USB Serial Port (Com3-8)” in your Device Manager -> Ports if everything is properly
installed. You will only need to install the device driver once.
*Always connect the USB cable 10 seconds before starting PLXLogger. This gives time for Windows to
properly detect the R-500 as a valid device. Always close PLXLogger and wait 10 seconds before the USB
cable is removed. This allows the software enough time to properly shutdown the PLXLogger USB
resources.
2.9 PLXLogger
Insert the included CD into your computer’s CD Rom drive. Open the PLXLogger folder and run setup.exe.
If you have an old version of PLXLogger installed, the installation wizard will automatically uninstall the
older version. After completing the installation, start PLXLogger. Set the USB Port# to match the assigned
com port number in step (2.8).
Version 1.3 Feb 21, 2006
www.plxdevices.com
(408)745-7591
Page 12
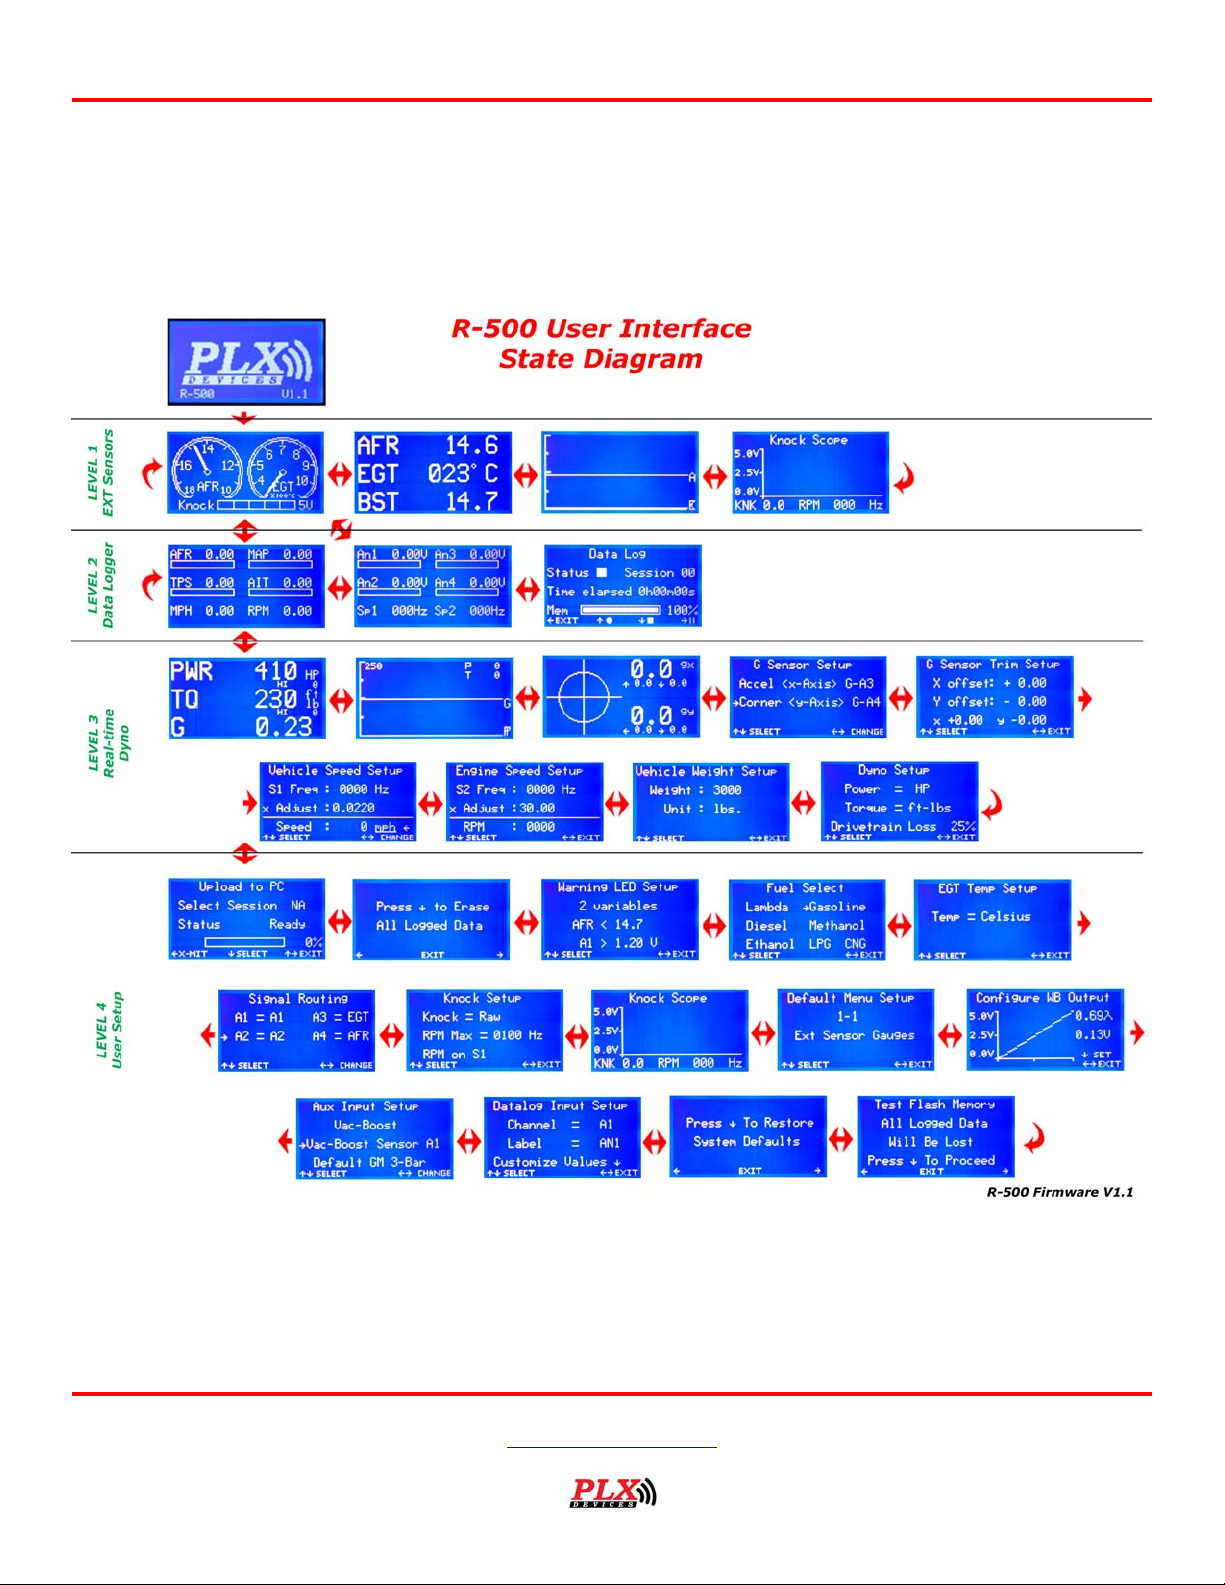
3.0 State Diagram
Users Guide: R-500 Wideband Computer
CHAPTER 3
USER INTERFACE
Version 1.3 Feb 21, 2006
Corresponds to Firmware Version 1.1
www.plxdevices.com
(408)745-7591
Page 13
Users Guide: R-500 Wideband Computer
3.1 Level 1: External Sensors Graphical Display (1-1)
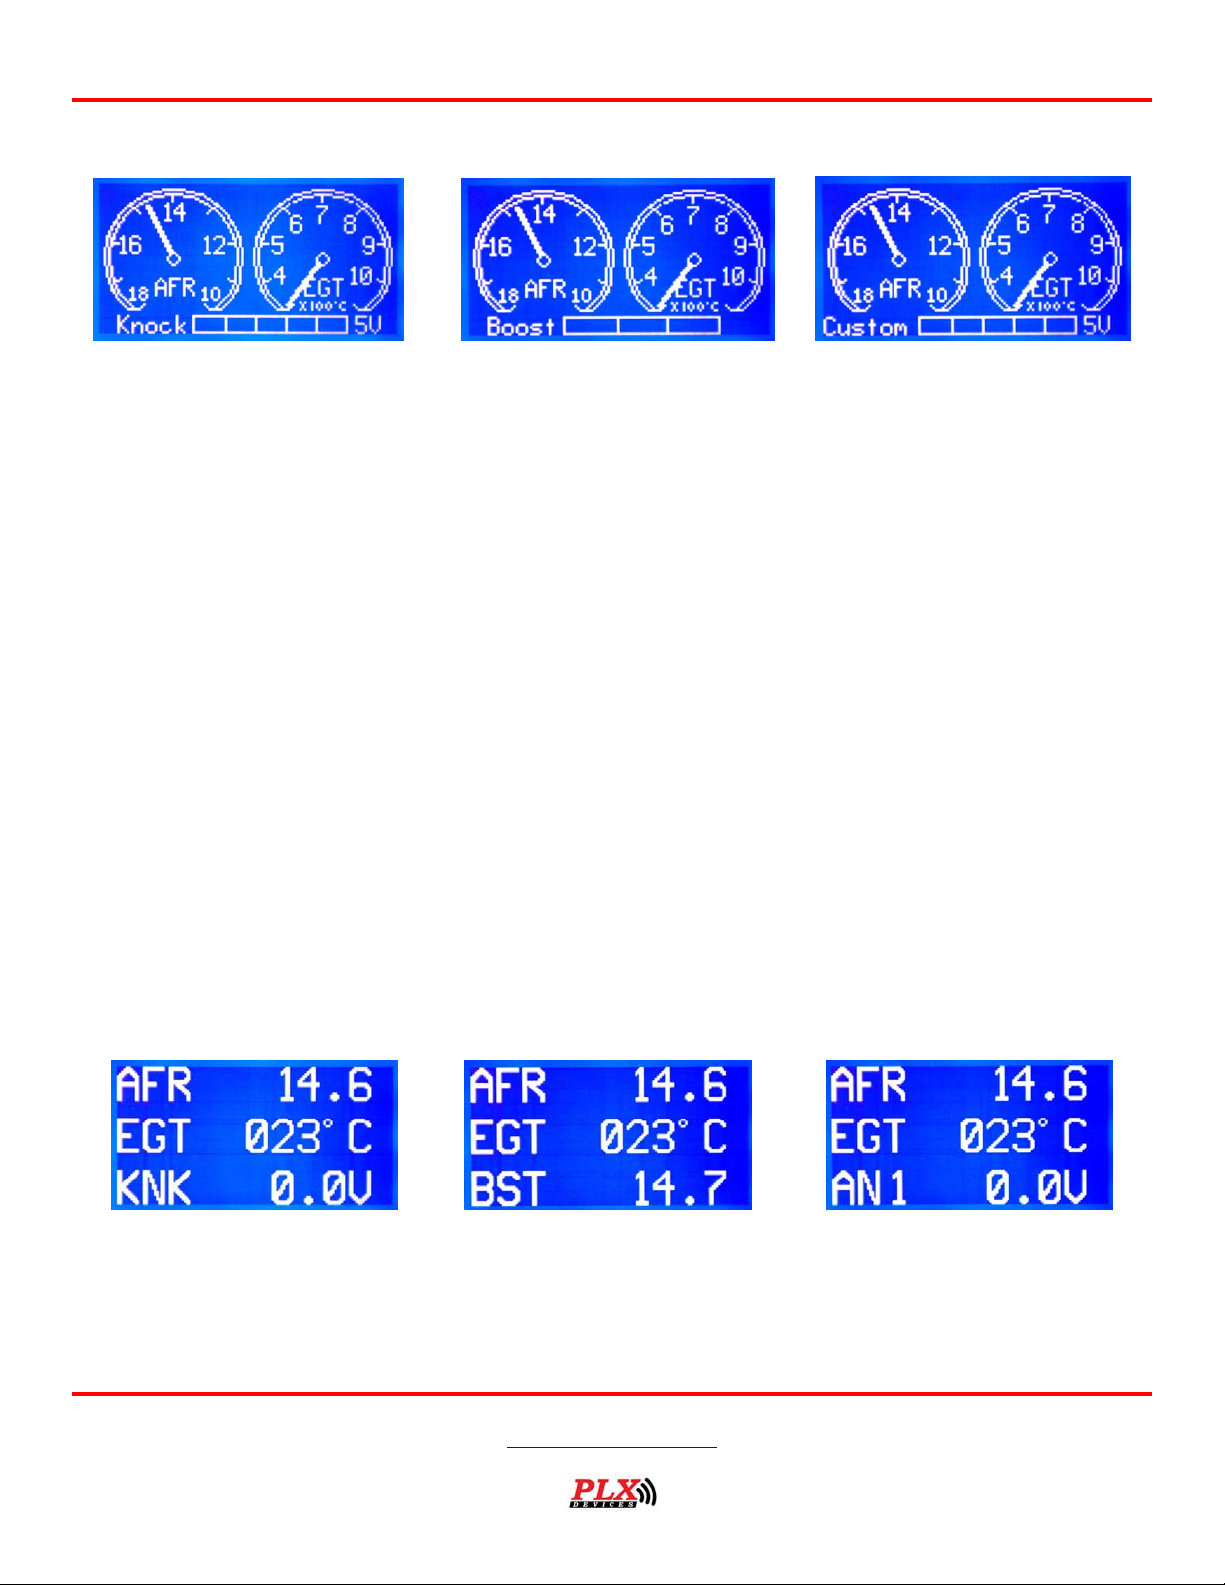
The R-500 defaults to this menu upon unit power up after the PLX logo splash screen if no changes are
made to menu (4-9). AFR, EGT, and the auxiliary signal are the three parameters displayed in this menu.
The AFR gauge will display a different range depending on the fuel setting selection found in menu (4-4).
EGT temperatures are displayed in degrees Celsius (300-1100C) or degrees Fahrenheit (800-2200F)
depending on the temperature units setting found in menu (4-5).
The sweeping bar at the bottom of this menu is by default set to display knock voltage. Knock voltage
can be adjusted to be displayed as raw knock or normalized knock voltage in menu (4-7). (Normalized
Knock=Measured Knock Voltage - Background Engine Knock Voltage). Each division inside the bar graph
represents one volt of knock voltage.
It is also possible to set the sweeping bar to display Manifold Absolute Pressure (MAP, Boost) or an analog
channel of your choice. These settings can be configured in menu (4-11). If this bar is set to display
Manifold Absolute Pressure, there will be only 3 divisions inside of the bar. A completely empty bar
corresponds to -14.7 psi (-1 bar), the first division corresponds to 0 psi (0 bar), the second division
corresponds to 14.7 psi (1 bar), and a completely filled bar corresponds to 29.4 psi (2 bar).
The final setting for the sweeping bar allows you to display the voltage of the analog input channel of your
choice. Each division inside the bar represents 1 volt. Once again, these settings can be configured in
menu (4-11).
Pressing the down button on the R-500 brings you to the Level 2 menus.
3.2 Level 1: External Sensors Numerical Display (1-2)
This menu displays the values of AFR, EGT and an auxiliary signal (knock, MAP (vac/boost), or an analog
input) in numeric form. The AFR numeric readout will display a different range depending on the fuel
setting selection found in state (4-4). EGT temperatures are displayed in degrees Celsius (300-1100C) or
degrees Fahrenheit (800-2200F) depending on the temperature units setting found in menu (4-5).
Version 1.3 Feb 21, 2006
www.plxdevices.com
(408)745-7591
Page 14
Users Guide: R-500 Wideband Computer
Knock voltage can be adjusted to be displayed as raw knock or normalized knock voltage in state (4-7).
(Normalized Knock=Measured Knock Voltage - Background Engine Knock Voltage).
It is also possible to replace the Knock voltage output with Manifold Absolute Pressure (MAP, Boost) or an
analog channel of your choice. These settings can be configured in menu (4-11). Please note that the
MAP output is displayed in pounds per square inch (psi). Pressing the down button on the R-500 brings
you to the Level 2 menus.
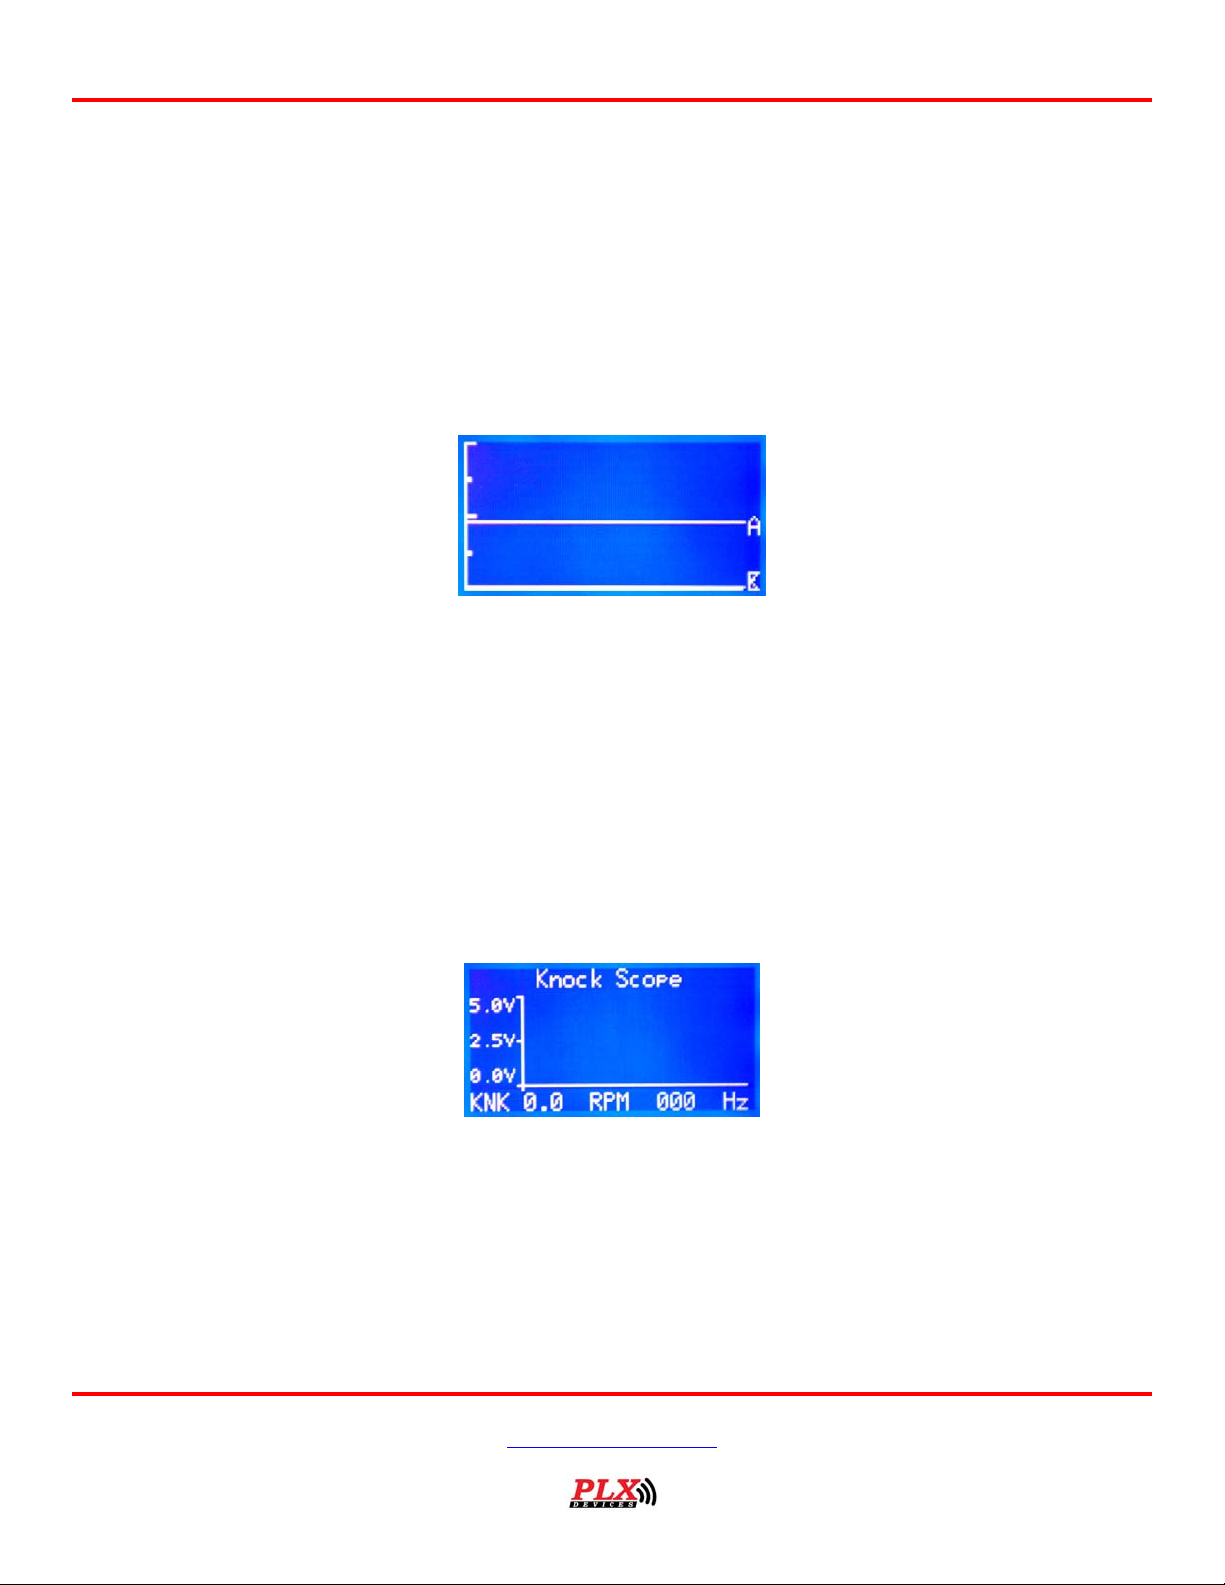
3.3 Level 1: External Sensors Graph (1-3)
This menu displays a graphical representation of your AFR EGT and auxiliary signal (Knock, MAP (boost),
or analog input voltage). This graph draws one pixel for each signal at the rate of about 6 Hz (6 pixels a
second). The scale for AFR is from .68 to 1.36 lambda (10-20 AFR in gasoline settings). The scale for
EGT is 0-1100 C. The scale for voltage is from 0-5 Volts. The scale for MAP (boost) is -14.7 psi to 29.4
psi (-1 to 2 bar) The Auxiliary signal can be configured in menu (4-11). The graph may be cleared by
pushing the up button on the R-500.
Pressing the down button on the R-500 brings you to the Level 2 menus.
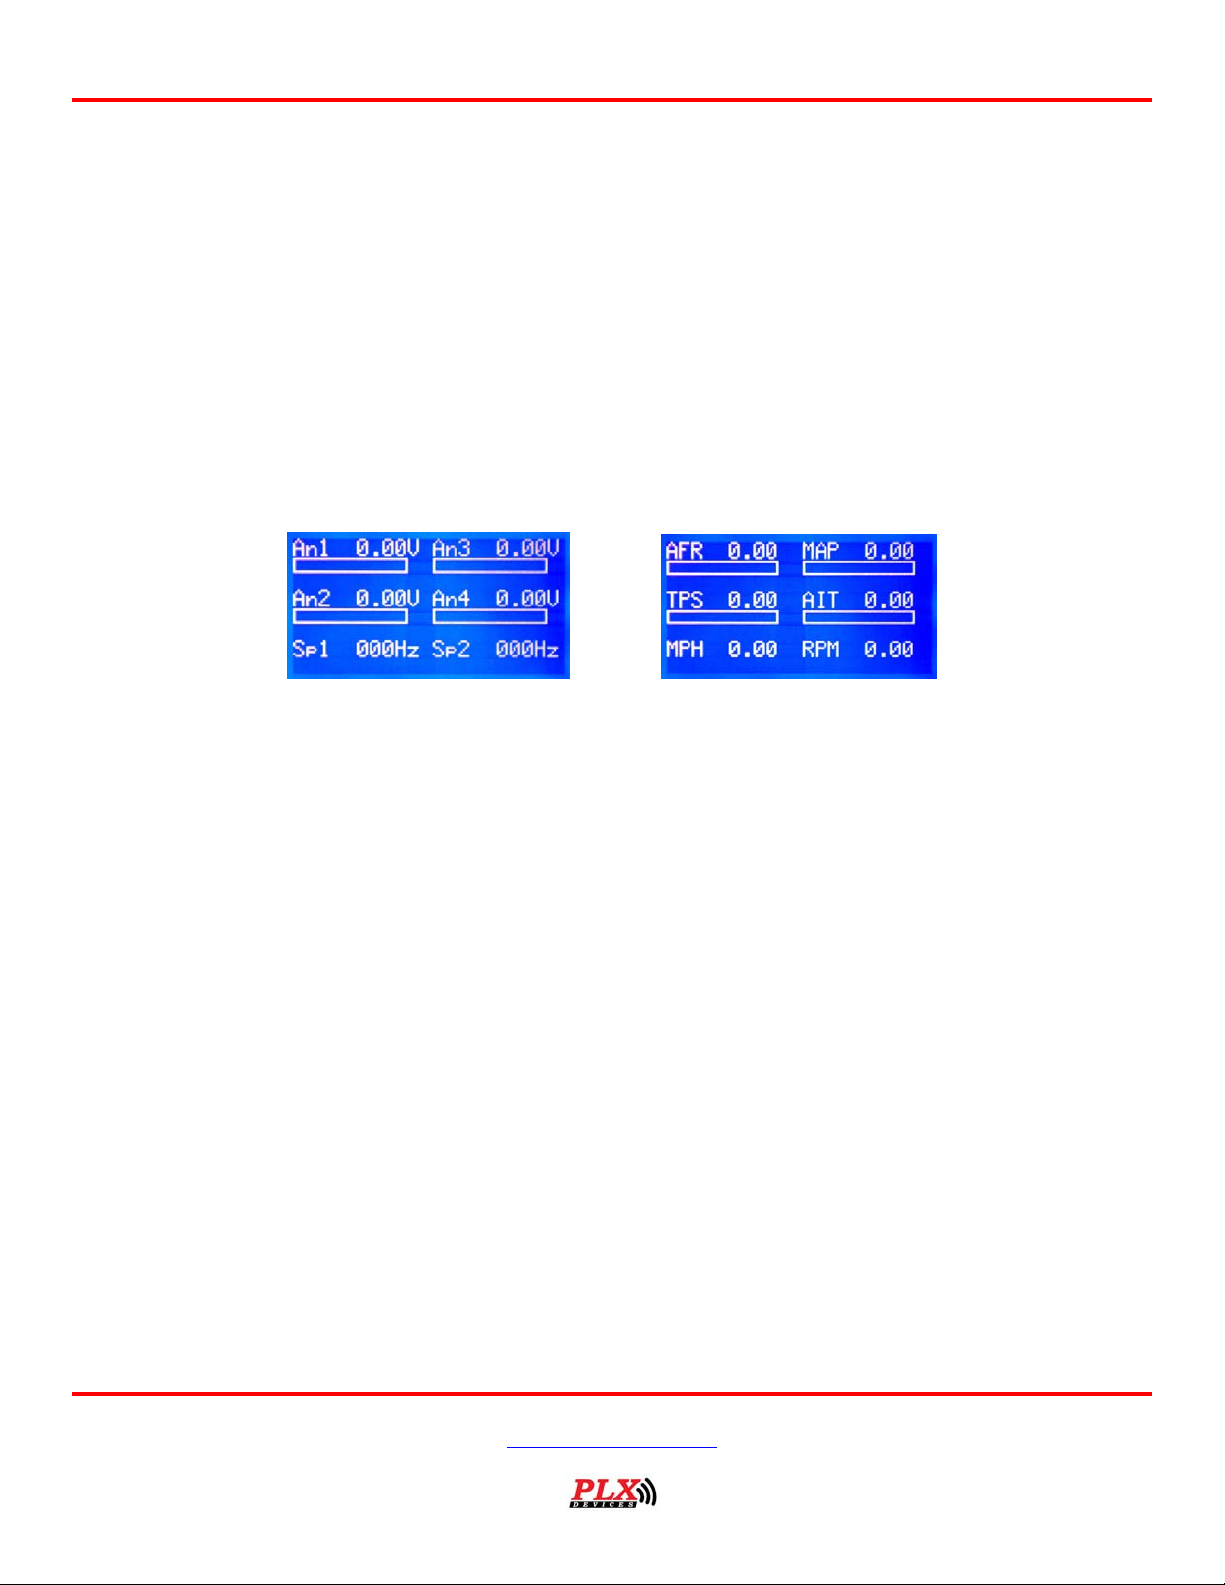
3.4 Level 1: RPM vs. Knock Voltage “Scope” (1-4)
This menu graphically displays the RPM signal (in Hertz obtained from either speed 1 or speed 2 on the
data logger harness) vs. the knock voltage on a 2-axis graph. The white areas of the graph symbolize the
normal background knock voltage of the engine. Background engine knock levels can be normalized in
state (4-8). Numeric values of the currently measured knock and tachometer (RPM) oscillation values
(Hz) are displayed on the bottom of the screen. The displayed knock value can be adjusted to raw knock
voltage or normalized knock voltage by changing the settings in menu (4-7). (Normalized
Knock=Measured Knock Voltage - Background Engine Knock Voltage).
Version 1.3 Feb 21, 2006
www.plxdevices.com
(408)745-7591
Page 15
Users Guide: R-500 Wideband Computer
FYI: The voltage levels of background engine noise depend on the knock sensor that you have installed.
For example it has been observed that many vehicles do not output any knock voltage until the engine is
on the threshold (at the point where it is just about to) of “knocking” (pre-detonation), this behavior has
been seen on the Nissan 240 SX and certain Maseratis. Other vehicles will output some knock voltage as
the RPMs go up. On the Mitsubishi Lancer Evolution VIII 0.5 V of knock noise has been observed at
redline. On the other hand on a 2004 Honda S2000 about 1.5 V of background engine noise was seen at
redline. If you wish to see greater knock values you may choose to install an amplifier on your knock
signal before the R-500 input. You will need to normalize your knock voltage if you observe a large
amount of background engine noise that isn’t truly “knock”. (see menu 4-7)
Pressing the down button on the R-500 brings you to the Level 2 menus.
3.5 Level 2: Data logger Input Signal Monitor (2-1)
There are two settings to the data logger input signal monitor menu:
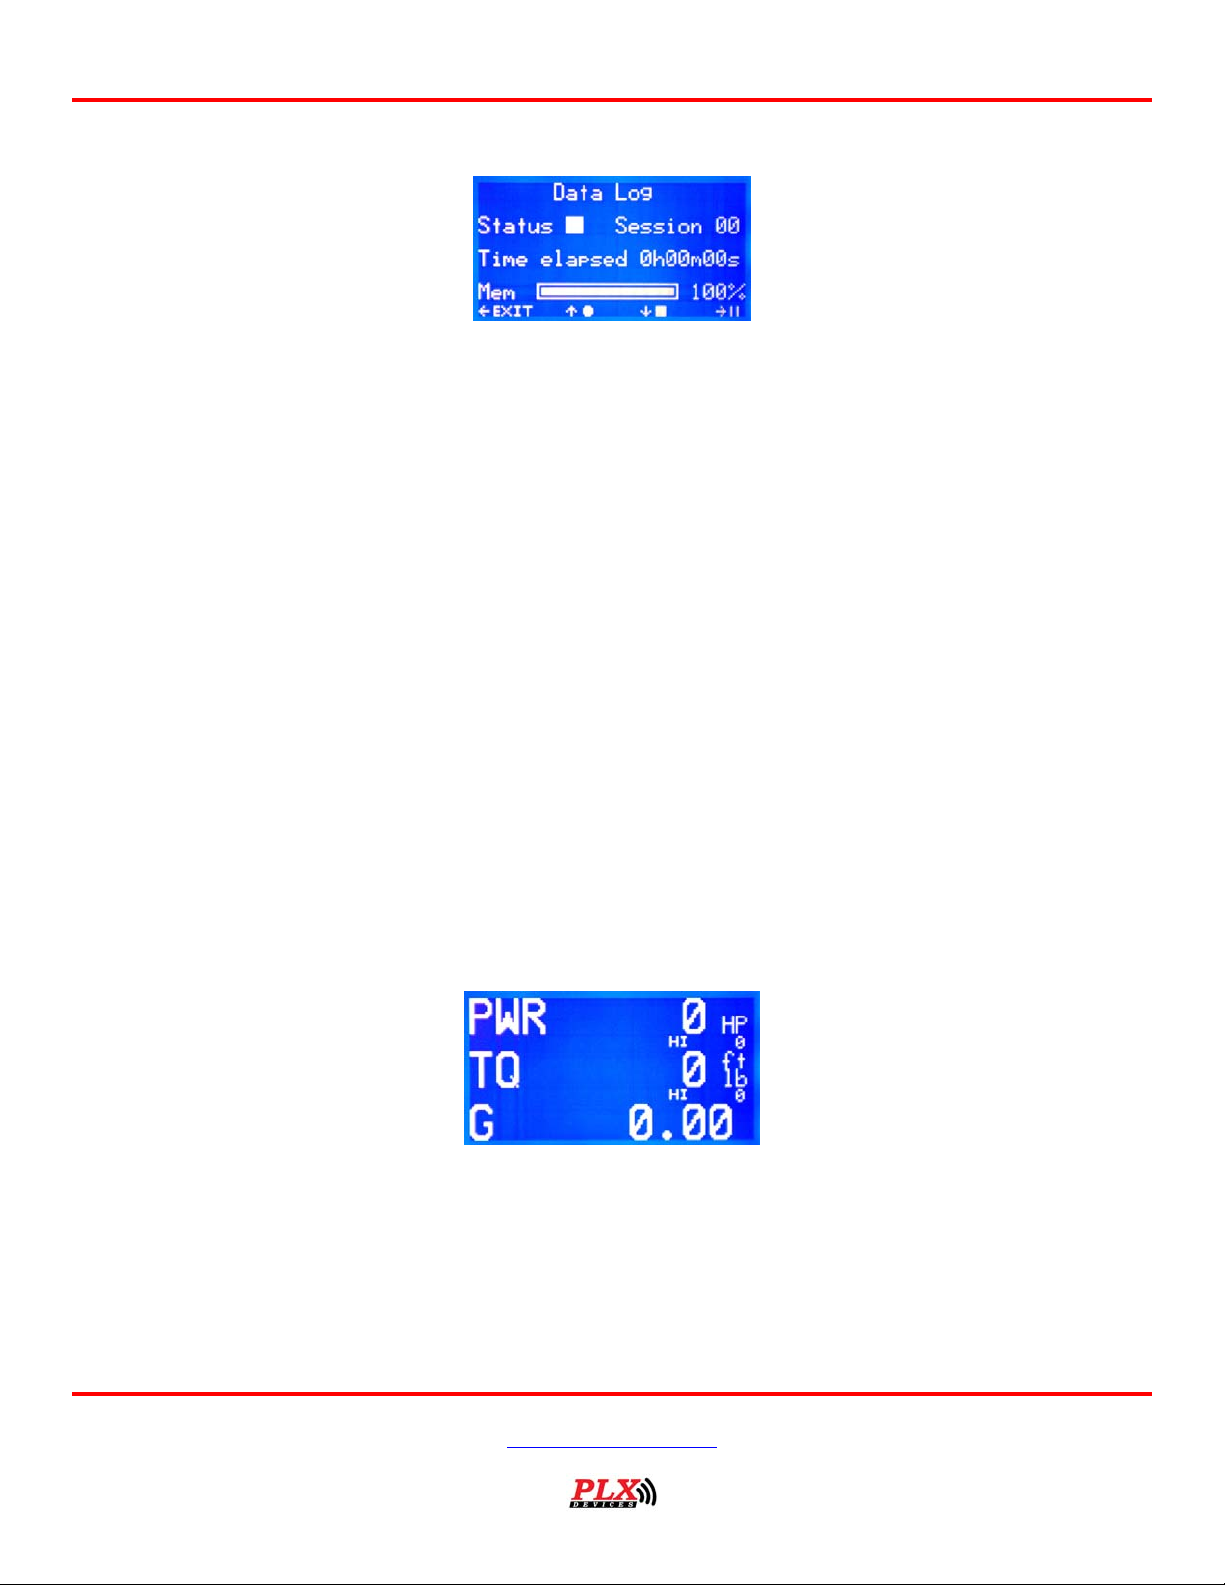
1. In its default state this menu graphically and numerically displays the voltage measurements from the
analog data logger inputs and also the numeric values from the speed inputs (in Hz).
The voltage representation bars correspond to the analog signal directly above them. If the bar is empty
the voltage =0 V, if the bar is full the voltage = 5 V
It is possible to route (assign) your AFR, EGT or Knock to An1-An4 for the purpose of using the analog
channels for data logging. These parameters can be adjusted in menu (4-6).
You may use this menu to verify that you have the data logger inputs properly set-up. To toggle to the
user configured data push the left button on the R-500.
2. The secondary state of this menu displays the customized labels for all the data logger inputs (3
characters) and also converts the signals into data that is easily readable. The labels and conversion
values for each signal can be configured in menu (4-12). To toggle to the raw data logger input data push
the left button on the R-500.
The R-500 will prompt you to save the settings of this state (raw or customized data) upon exit if you
have changed between the two settings.
Pressing the down button on the R-500 brings you to the Level 3 menus.
Version 1.3 Feb 21, 2006
www.plxdevices.com
(408)745-7591
Page 16
Users Guide: R-500 Wideband Computer
3.6 Level 2: Data logger Recorder (2-2)
This menu is used to control the data logger’s recording functions. Pushing the left button exits this menu
to return to menu (2-1). Pressing the up button will start the recording of the signals displayed
in menu (2-1) into the internal flash memory. Pressing the right button will pause/resume the data
recording without creating a new data log session. Pressing the down button will stop/terminate the data
logging session. Starting the data logger after pushing the stop button will create a new session.
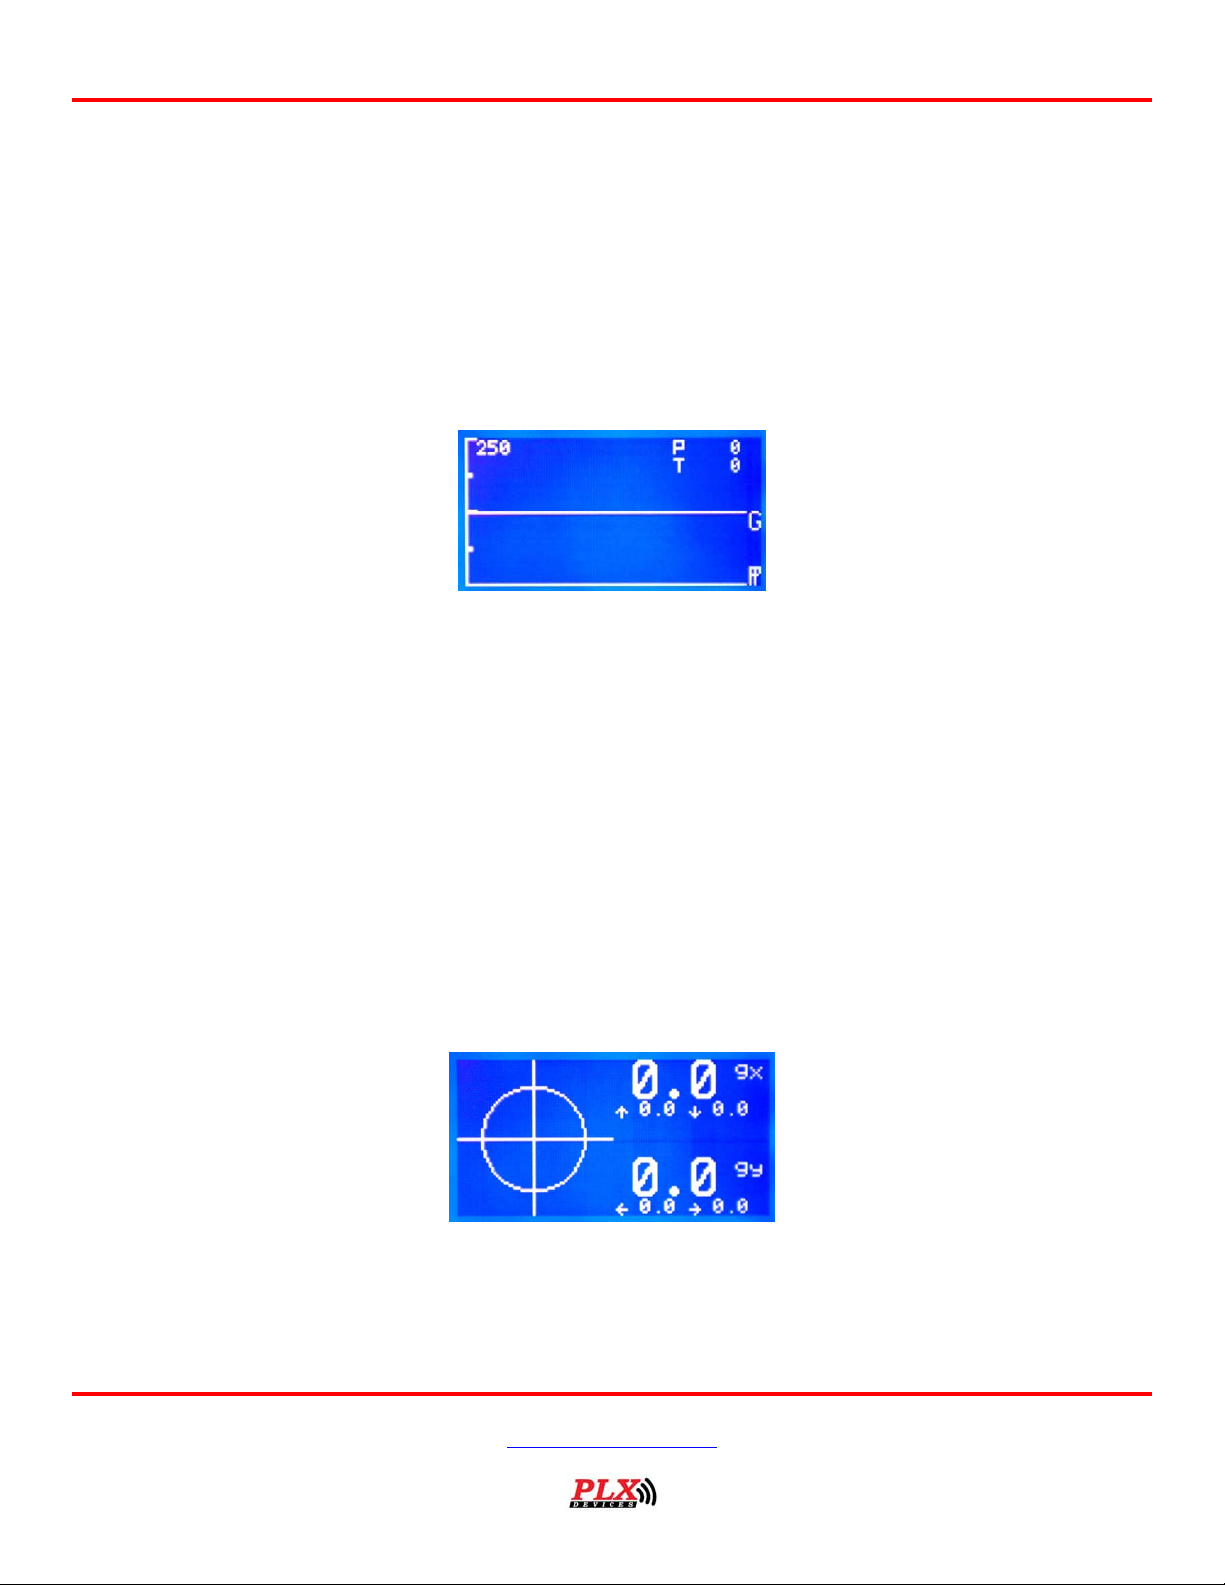
The shape to the right of the “Status” text displays a square if the data logger is not recording, a Circle if
the data logger is recording, and two parallel lines if the data log session is paused.
The number to the right of the “Session” text displays the current data logger session that is being
recorded to. The maximum number of sessions that can be recorded is 99.
The string of numbers next to the “Time elapsed” text states the length of the current data log session in
hours, minutes, and seconds.
The graphical bar and percentage number to the right of the “Mem” text displays a graphical and
numerical representation of the amount of memory left in the R-500s internal memory bank. The bar will
empty and the percentage number will decrement as memory is depleted. The R-500 is capable of
recording up to 80 minutes of data. Be aware that you are limited to 99 recording sessions regardless of
the amount of memory you have left.
3.7 Level 3: Dyno Numeric (3-1)
This state displays the real-time Power, Torque, and acceleration G of your vehicle. This function only
works if you have the PLX G-sensor installed, and have tapped into the RPM and vehicle speed signals of
your vehicle (typically obtained from your ECU). It is necessary to properly configure and trim the G
sensors (menus 3-4 and 3-5), configure your vehicle’s speed (menu 3-6), RPM (menu 3-7), and weight
(menu 3-8) to get proper readings in this state. You may select the units of measurement (Horsepower,
kW, PS, lbs-ft, Newton-meters) and drive-train loss (up to 50%) in menu (3-9).
Version 1.3 Feb 21, 2006
www.plxdevices.com
(408)745-7591
Page 17
Users Guide: R-500 Wideband Computer
The current (real-time) Power, Torque and Gs are displayed in large numbers next to their respective
labels. Peak Horsepower and Torque (positive torque only, not brake “torque”) is displayed next to the
“HI” characters underneath their respective real-time values. Pressing the left button on the R-500 resets
the stored peak (HI) power and torque values. Please note that the peak values show in this menu are
lost when you power down the R-500.
Pressing the down button on the R-500 brings you to the Level 4 menus.
3.8 Level 3: Dyno Graph (3-2)
This menu displays a graphical representation of the power, torque and Gs that the vehicle has sustained
over the previous 20 seconds. It refreshes at about 6 Hz (6 pixel draws a second). Peak power and
torque are displayed numerically in the upper right hand corner of this menu (P for power, T for torque).
The current range (max value) for power and torque is displayed on the upper left hand corner of the
menu (it can be either 250, 500, or 1000) Pushing the up button erases all graphed data and also clears
the peak power and torque numbers. Pushing the down button changes the range of the graph for power
and torque. The range can be set to 250, 500, or 1000. If the sustained power or torque exceeds the
range of the graph, the plotted point will be capped at the highest pixel on the screen. Each line is labeled
by a character on the far right side of the screen. “P” corresponds to power, “T” for torque, and “G” for
Gs. For G’s the range of G’s is between -2.5 Gs (bottom of graph) to 2.5 Gs (top of graph). You will be
prompted to save the changes on the range of the graph upon exit of this menu if the setting has been
modified.
3.9 Level 3: G-Circle/Display (3-3)
This menu displays the graphical and numeric information about the real-time linear (forwards-backwards)
and corner (right-left) acceleration sustained by the vehicle. It is necessary to have a PLX 2-axis G-sensor
to properly use this function. The G-sensor needs to be properly configured in menu (3-4).
Version 1.3 Feb 21, 2006
www.plxdevices.com
(408)745-7591
Page 18
Users Guide: R-500 Wideband Computer
A crosshair representation of resultant G is displayed on the left side of this menu. The max G shown on
the crosshair is 1.5 both linearly (forward-backward) and laterally (right-left). The circle in the center of
the graph is set at 1 G. If the crosshairs are outside of the circle, then your tires are bearing more than 1
G of force.
The right side of the menu displays the numeric value of the real-time sustained Gs. The numeric display
can show G values from -2.5 Gs to 2.5 Gs (your actual limits may vary depending on how much the Gsensor is trimmed). Linear acceleration (forwards-backwards) is displayed by the large numbers near the
top of the screen and is labeled by “gx”, corner acceleration (right-left) is displayed by the large numbers
near the bottom of the screen and is labeled by “gy”. Peak sustained Gs are displayed in small numbers
to the right of the small arrows that signify the vector (direction) of the G (the number next to the small
up arrow is the peak forward acceleration, the one next to the down arrow signifies the peak brake
deceleration, the one next to the left arrow signifies the peak left turn sustained G, and the one next to
the right arrow shows the peak right turn sustained G). These peak G values can be reset by pushing the
up button on the R-500.
If the crosshairs and G numeric readouts do not properly correspond to the sustained Gs you may need to
check the connection and/or configuration of the G-sensor in menu (3-4). If the crosshair is not centered
when the vehicle is resting immobile on flat ground your G-sensor may need to be physically adjusted
and/or digitally trimmed (see menu 3-5).
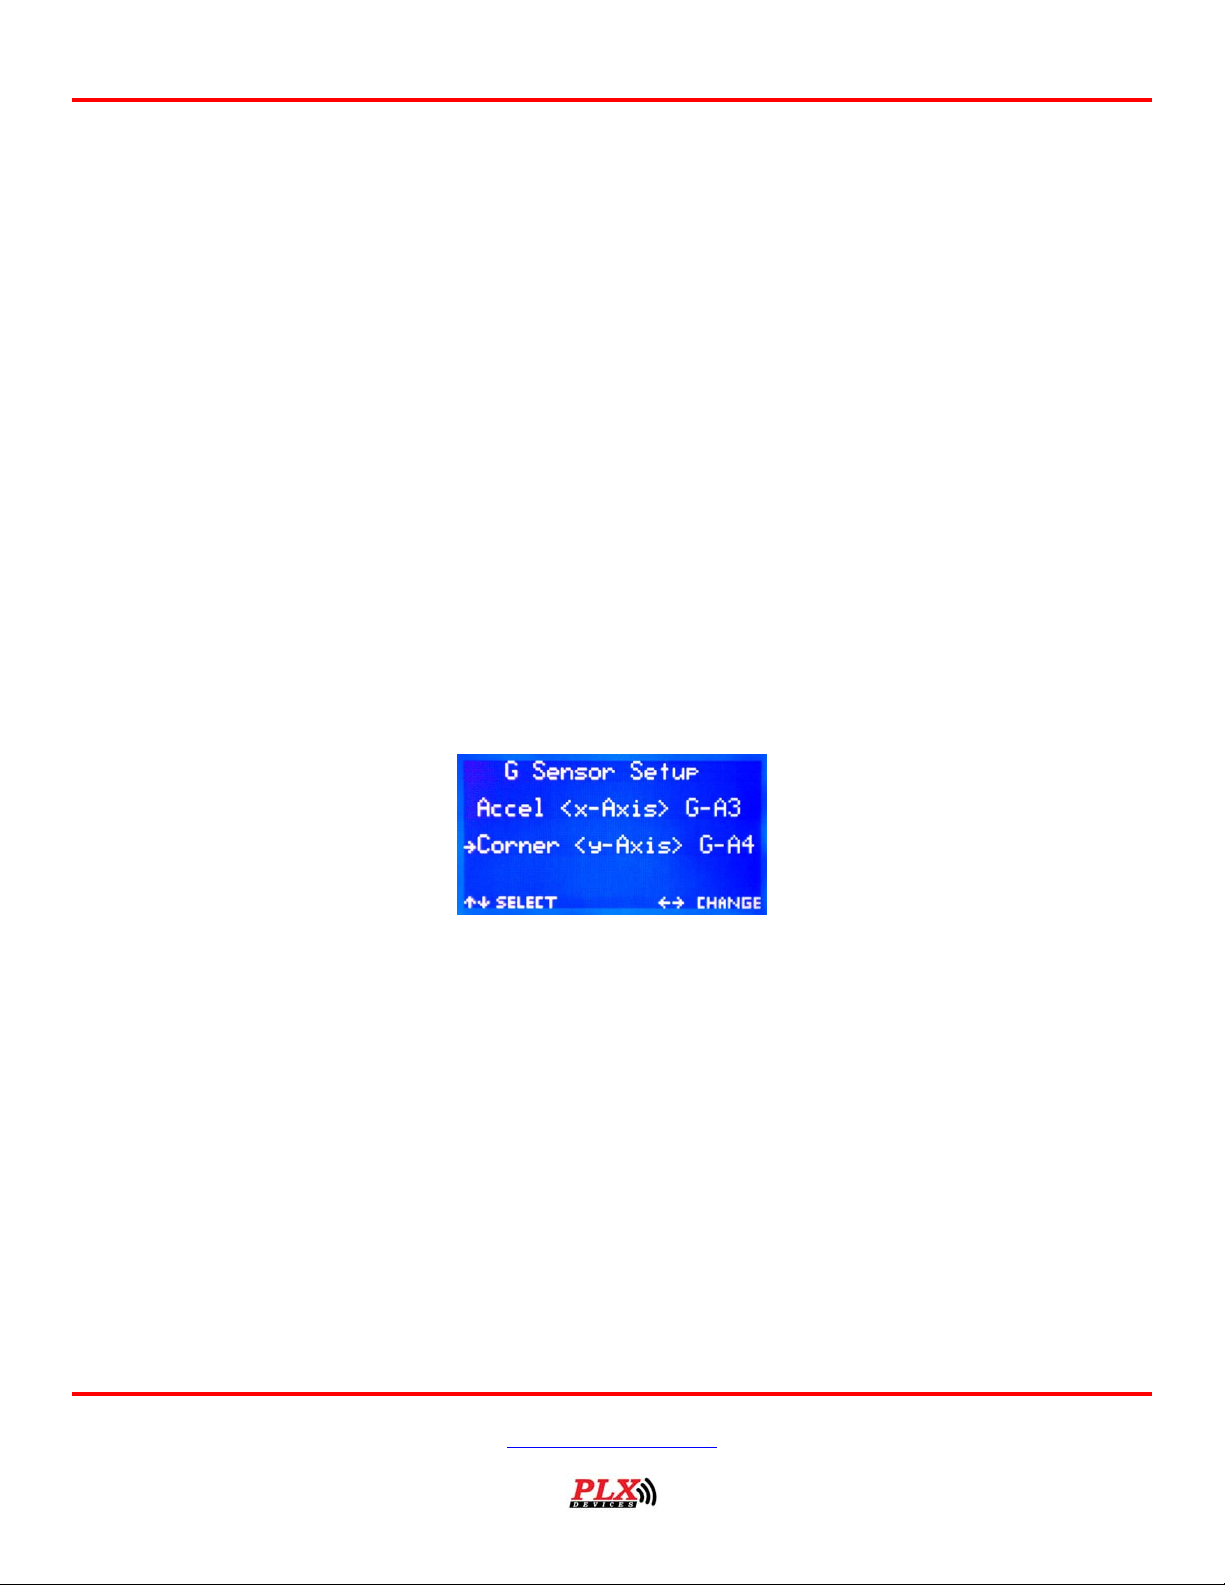
3.10 Level 3: G Sensor Setup (3-4)
This menu displays and allows you to configure the analog channels that are being polled (read from) to
obtain signals from your G-sensor.
Push the up/down buttons to select the axis that needs to be configured. With an axis selected push the
left/right buttons to choose the analog channel is connected to the G-sensor (A1-A4).
Here is the PLX 2-axis sensor’s color output setup: Green=X-axis, Blue=Y-axis.
Be sure that the ground for the G sensor on connect to the same ground as the R-500.
You will be prompted to save your settings before leaving this menu if changes were made.
Version 1.3 Feb 21, 2006
www.plxdevices.com
(408)745-7591
Page 19
Users Guide: R-500 Wideband Computer
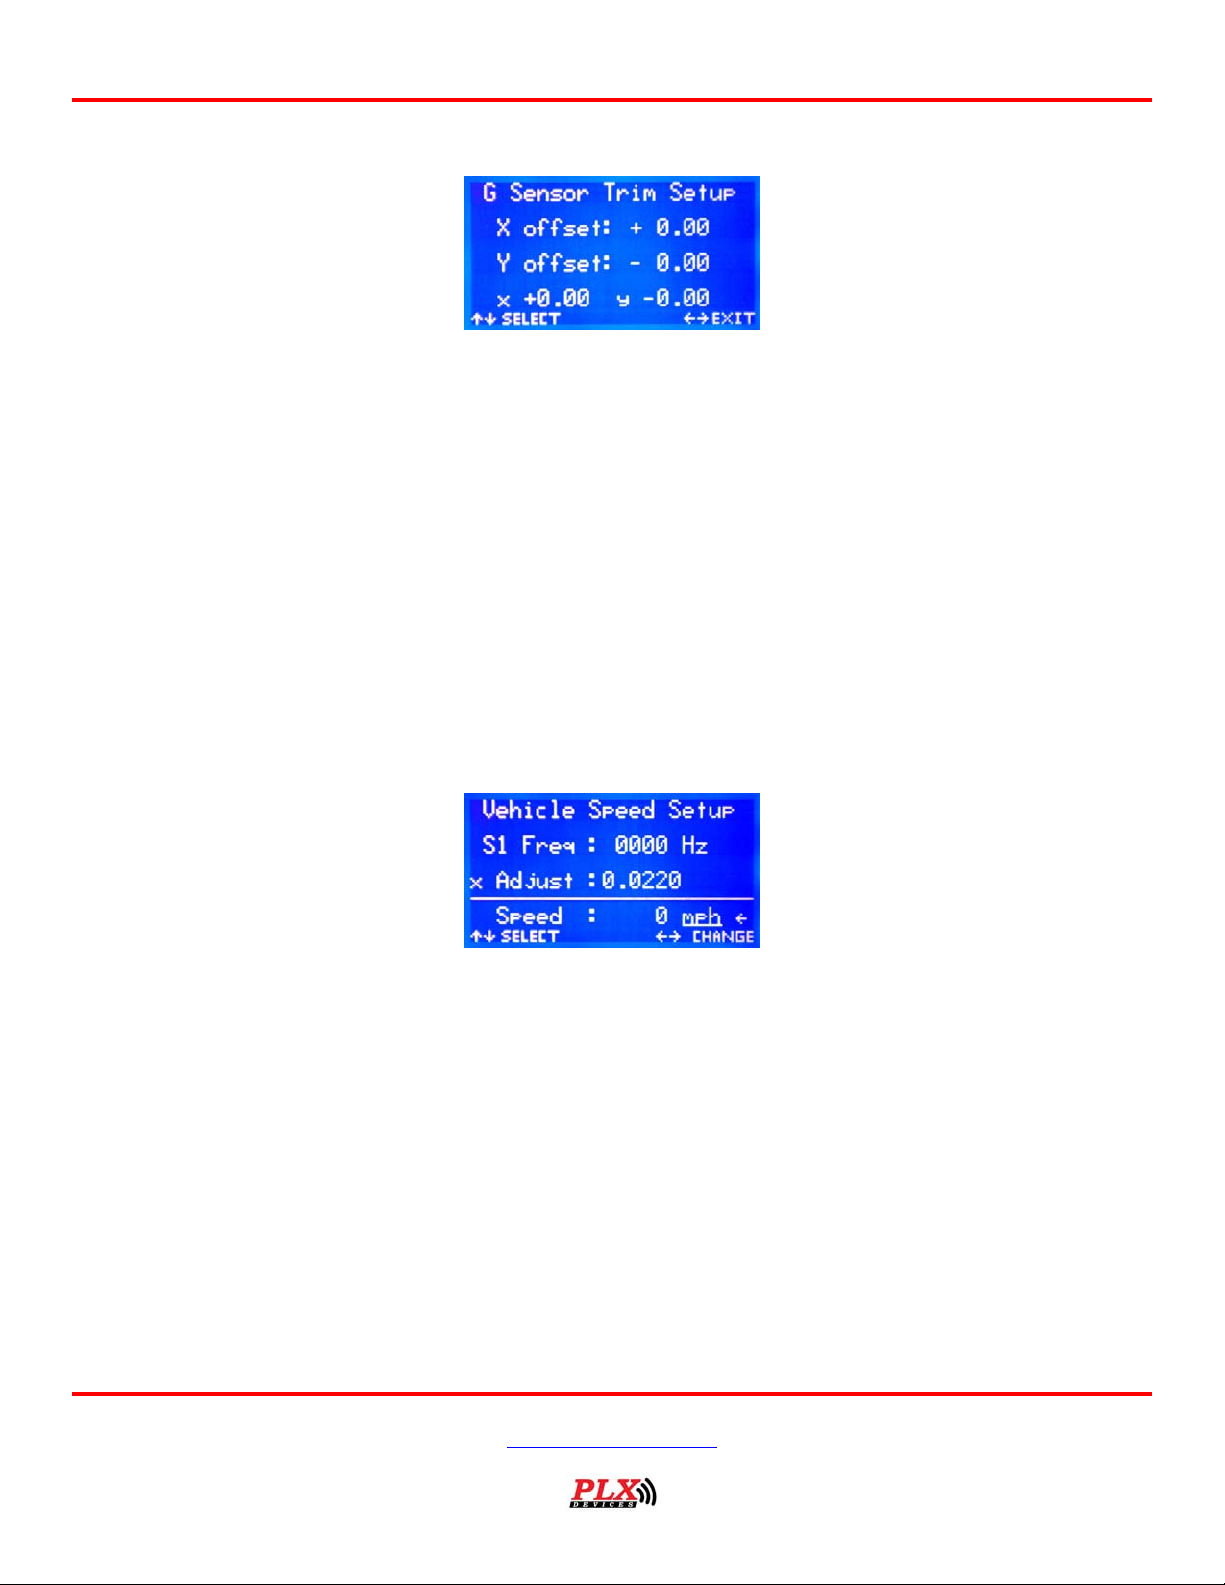
3.11 Level 3: G Sensor Trim Setup (3-5)
This menu allows you to trim (adjust) your G sensor to zero G’s on both axis. Park your vehicle on a flat
surface and mount your G sensor as level as possible.
Press the up/down button on the R-500 to select an axis (X or Y) to adjust. Press the right/left button to
move the cursor under the parameter you wish to adjust. Then press the up/down button to change the
value of the selected parameter. You can adjust the trim of your G-sensor to an offset between -0.3 Gs
to +0.3 Gs on both axis. The goal is to get the numbers next to the lower case “x” and “y” on the bottom
of the screen as close to “0.00” as possible. When these two numbers are “zeroed” your G sensor should
be properly trimmed (calibrated). Note: For best results make sure that your O2 Sensor is hooked up and
heated while trimming your G-sensor.
You will be prompted to save your settings before leaving this menu if changes were made.
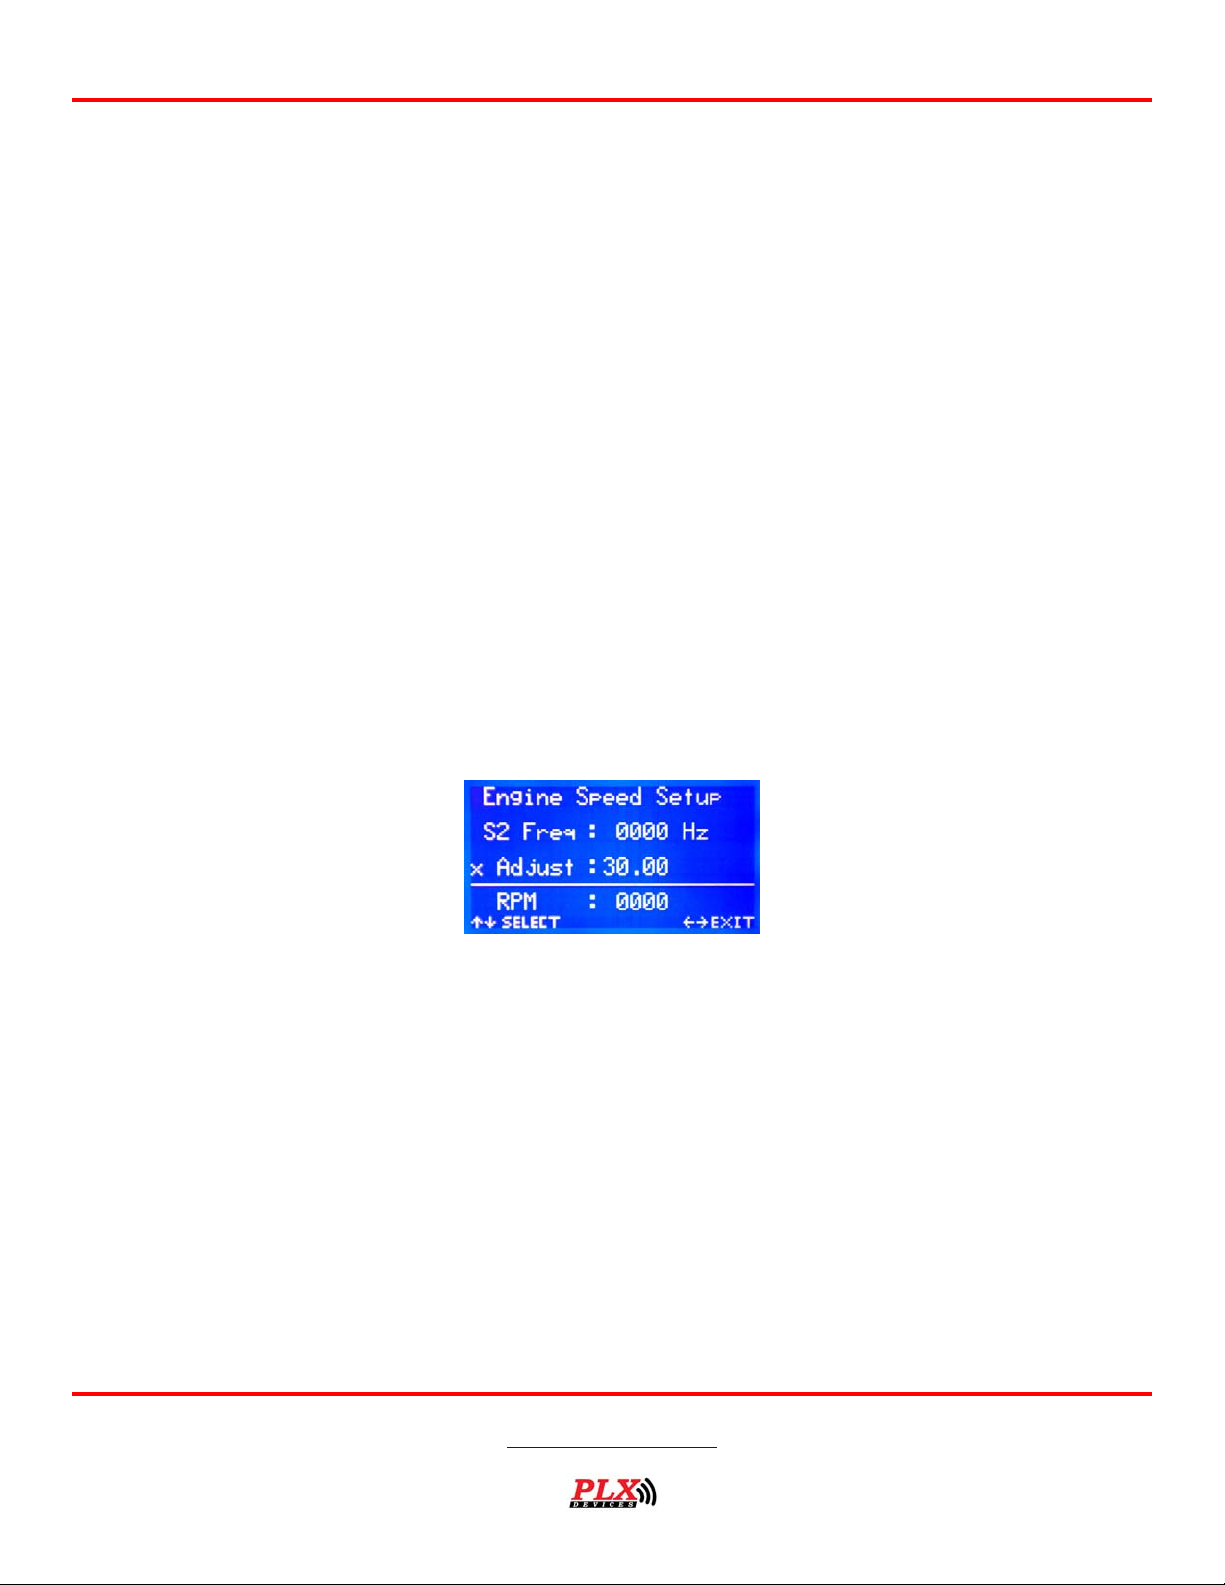
3.12 Level 3: Vehicle Speed Setup (3-6)
This menu is used to convert the pulses from your vehicle speed sensor (from one of the speed inputs)
into velocity values. Press the up/down button to move the arrow to the parameter that you wish to
adjust. Pressing the right/left button next to the “S1 (or S2) Freq” text will toggle the speed input
channel that you wish to poll (read) from. Pressing the right/left button next to the “Adjust:” text will
move a cursor under the numbers on that line. You can then choose which number you wish to modify.
Pushing the right/left button next to the arrow pointing at “mph” or “kph” will toggle between the two unit
settings. You must choose the right unit setting to get proper Power and Torque readings!
The objective of this menu is to match the Speed on the bottom of the screen to the speedometer on your
car.
The relationship between the input frequency and the Speed is: (Input Frequency * Adjust modifier
number) = Speed
Example:
Version 1.3 Feb 21, 2006
www.plxdevices.com
(408)745-7591
Page 20
Users Guide: R-500 Wideband Computer
If your vehicle speed sensor signal outputs 3000 Hz at 60 miles per hour, the adjust modifier would be
0.02.
Frequency*adjust=speed Æ 3000*0.02=60
On screen it would look something like this:
/*------------------------------------------*/
Vehicle Speed Setup
S1 Freq : 3000 Hz
X Adjust : 0.0200
---------------------------------------------
Speed : 60 mph
You will be prompted to save your settings upon leaving this menu if you have changed any values.
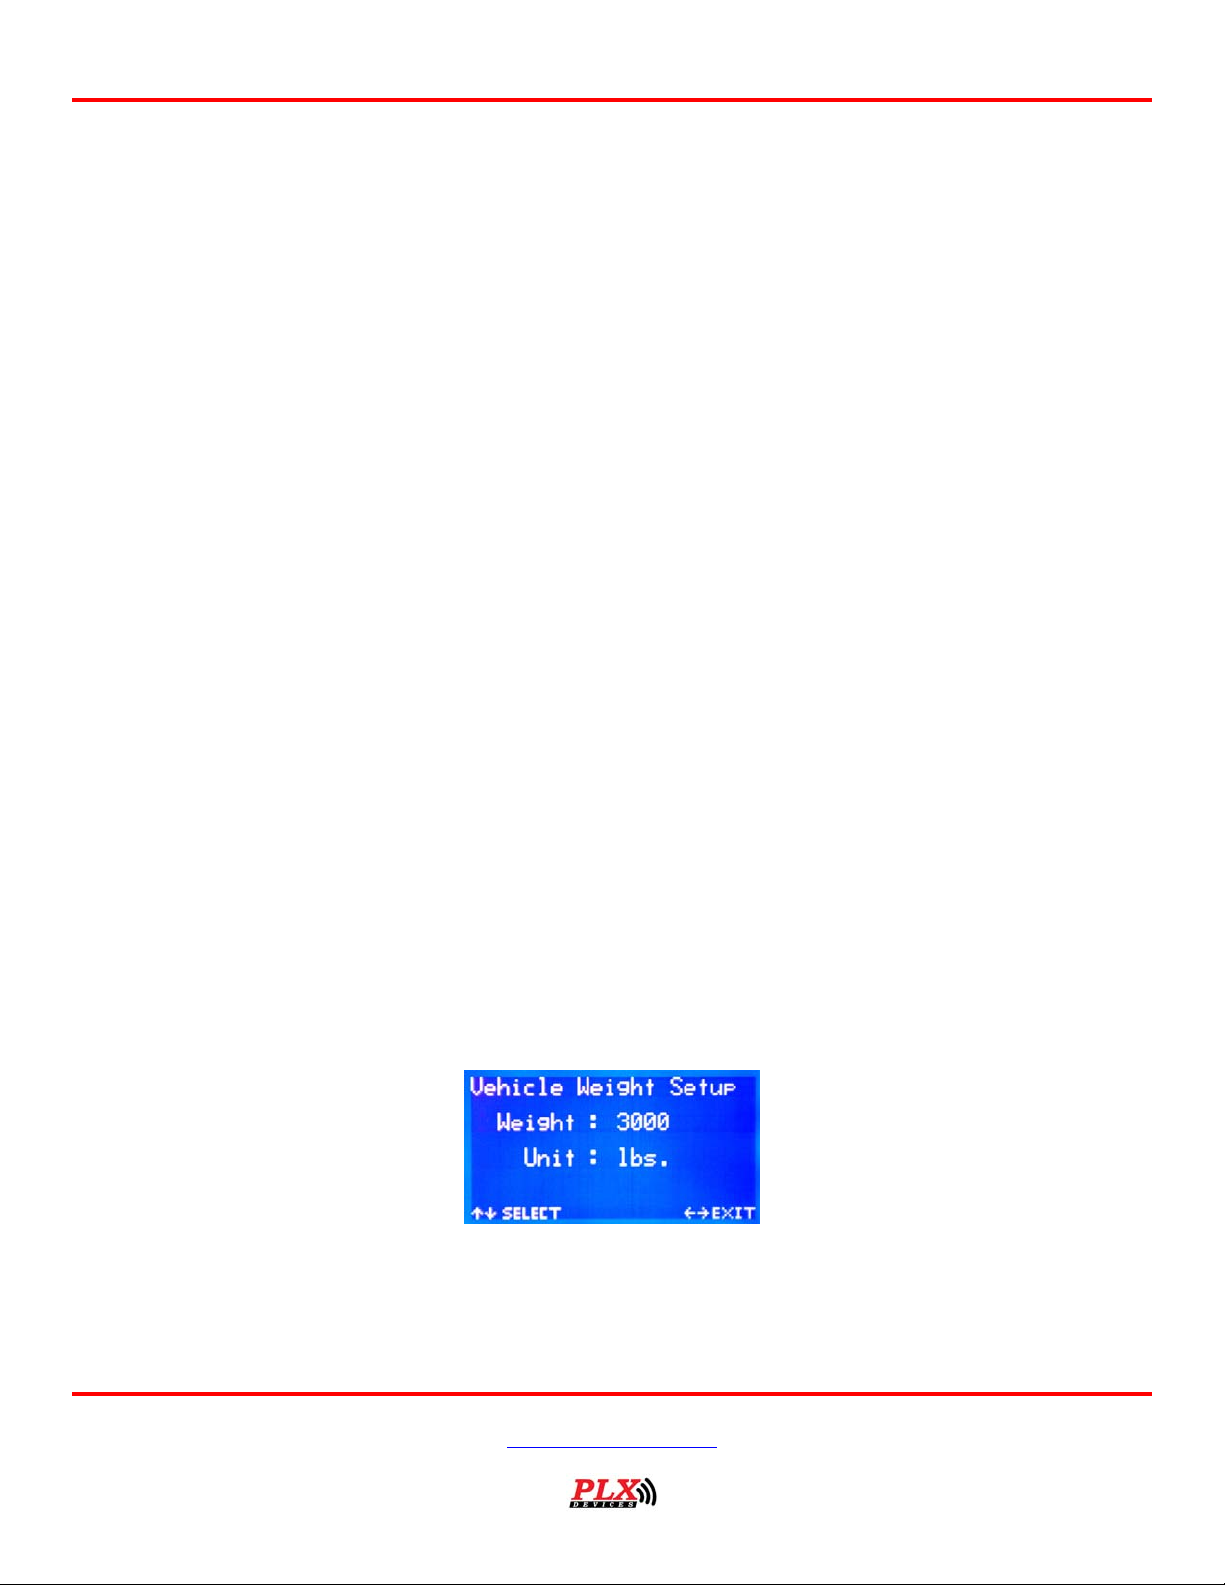
3.13 Level 3: Engine Speed Setup (3-7)
This menu is used to convert the pulses from your tach signal or fuel injector signal (from one of the
speed inputs) into RPM (tachometer) values. Press the up/down button to move the arrow to the
parameter that you wish to adjust. Pressing the right/left button next to the “S1 (or S2) Freq” text will
toggle the speed input channel that you wish to poll (read) from. Pressing the right/left button next to the
“Adjust:” text will move a cursor under the numbers on that line.
The objective of this menu is to match the Engine Speed on the bottom of the screen to the tachometer
on your car.
The relationship between the input frequency and the RPM is: (Input Frequency * Adjust modifier
number) = RPM (engine speed)
Example:
If the frequency out of the tach signal is 100 Hz at 3000 RPM, the Adjust conversion value should be:
30.00
Version 1.3 Feb 21, 2006
www.plxdevices.com
(408)745-7591
Page 21
RPM=Frequency*Adjust modifier Æ 3000=100*30.00
On Screen it would look something like this:
/*------------------------------------------*/
Engine Speed Setup
S1 Freq: 0100 Hz
X Adjust: 30.00
---------------------------------------------
RPM : 3000
FYI: Typical modifier numbers for different engines:
2 Cylinder = 60.00
4 Cylinder = 40.00
Users Guide: R-500 Wideband Computer
6 Cylinder = 20.00
8 Cylinder = 15.00
10 Cylinder = 12.00
12 Cylinder = 10.00
You will be prompted to save your settings upon leaving this menu if you have changed any values.
3.14 Level 3: Vehicle Weight Setup (3-8)
This menu allows you to set your vehicle weight for power/torque calculating purposes. Push the up/down
button to select the parameter to change.
Version 1.3 Feb 21, 2006
www.plxdevices.com
(408)745-7591
Page 22
Users Guide: R-500 Wideband Computer
Pressing the right/left button while the arrow is pointed to the “Unit” text will change the weight unit
setting between “lbs.” and “kg.” Pressing the right/left button while the arrow is pointing to the “Weight”
text will move the selection cursor under the numbers. You would then push the up/down button to
change the weight values.
Please take into account the weight all of the items that are typically in the car (including yourself) when
setting this parameter.
You will be prompted to save your settings upon leaving this menu if you have changed any values.
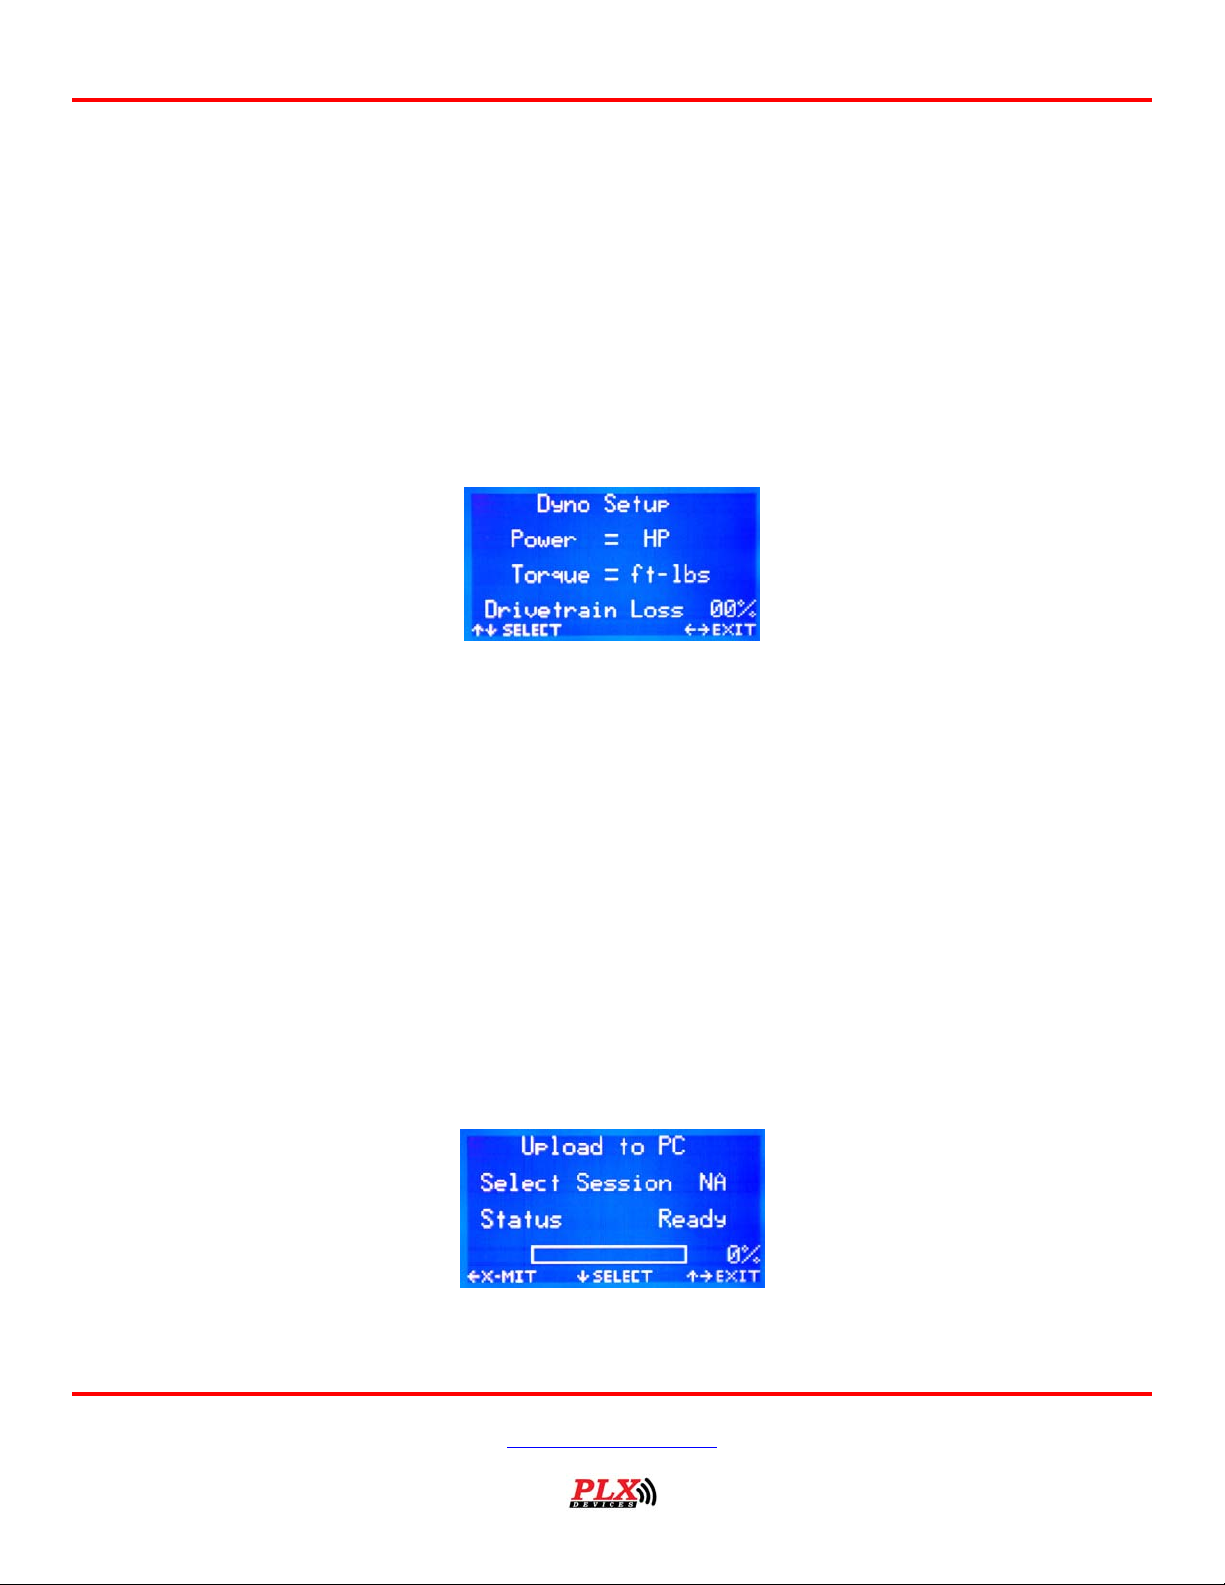
3.15 Level 3: Dyno Setup (3-9)
This menu allows you to select between power units (HP=Horsepower, kW=Kilowatt, PS = Pferdestärke),
Torque Units (ft-lbs and NM), and finally implement a modifier to account for drivetrain power loss (0-50%
loss).
Use the up/down button to move the arrow next to the unit that needs to be changed. If the arrow is
next to the “Power” or “Torque” text use the right/left button to toggle between the available units. If the
arrow is next to the “Drivetrain Loss” text, pressing the right/left button will move a cursor under the
numeric values which you can then change. Please keep in mind that the power and torque derived from
the R-500 is the effective power of your vehicle (from acceleration). There is always aerodynamic loss
and drive-train loss causing the measured power/torque values to fall short of the power/torque ratings
that auto manufacturer’s claim from the flywheel (crank).
You will be prompted to save your settings upon leaving this menu if you have changed any of the values.
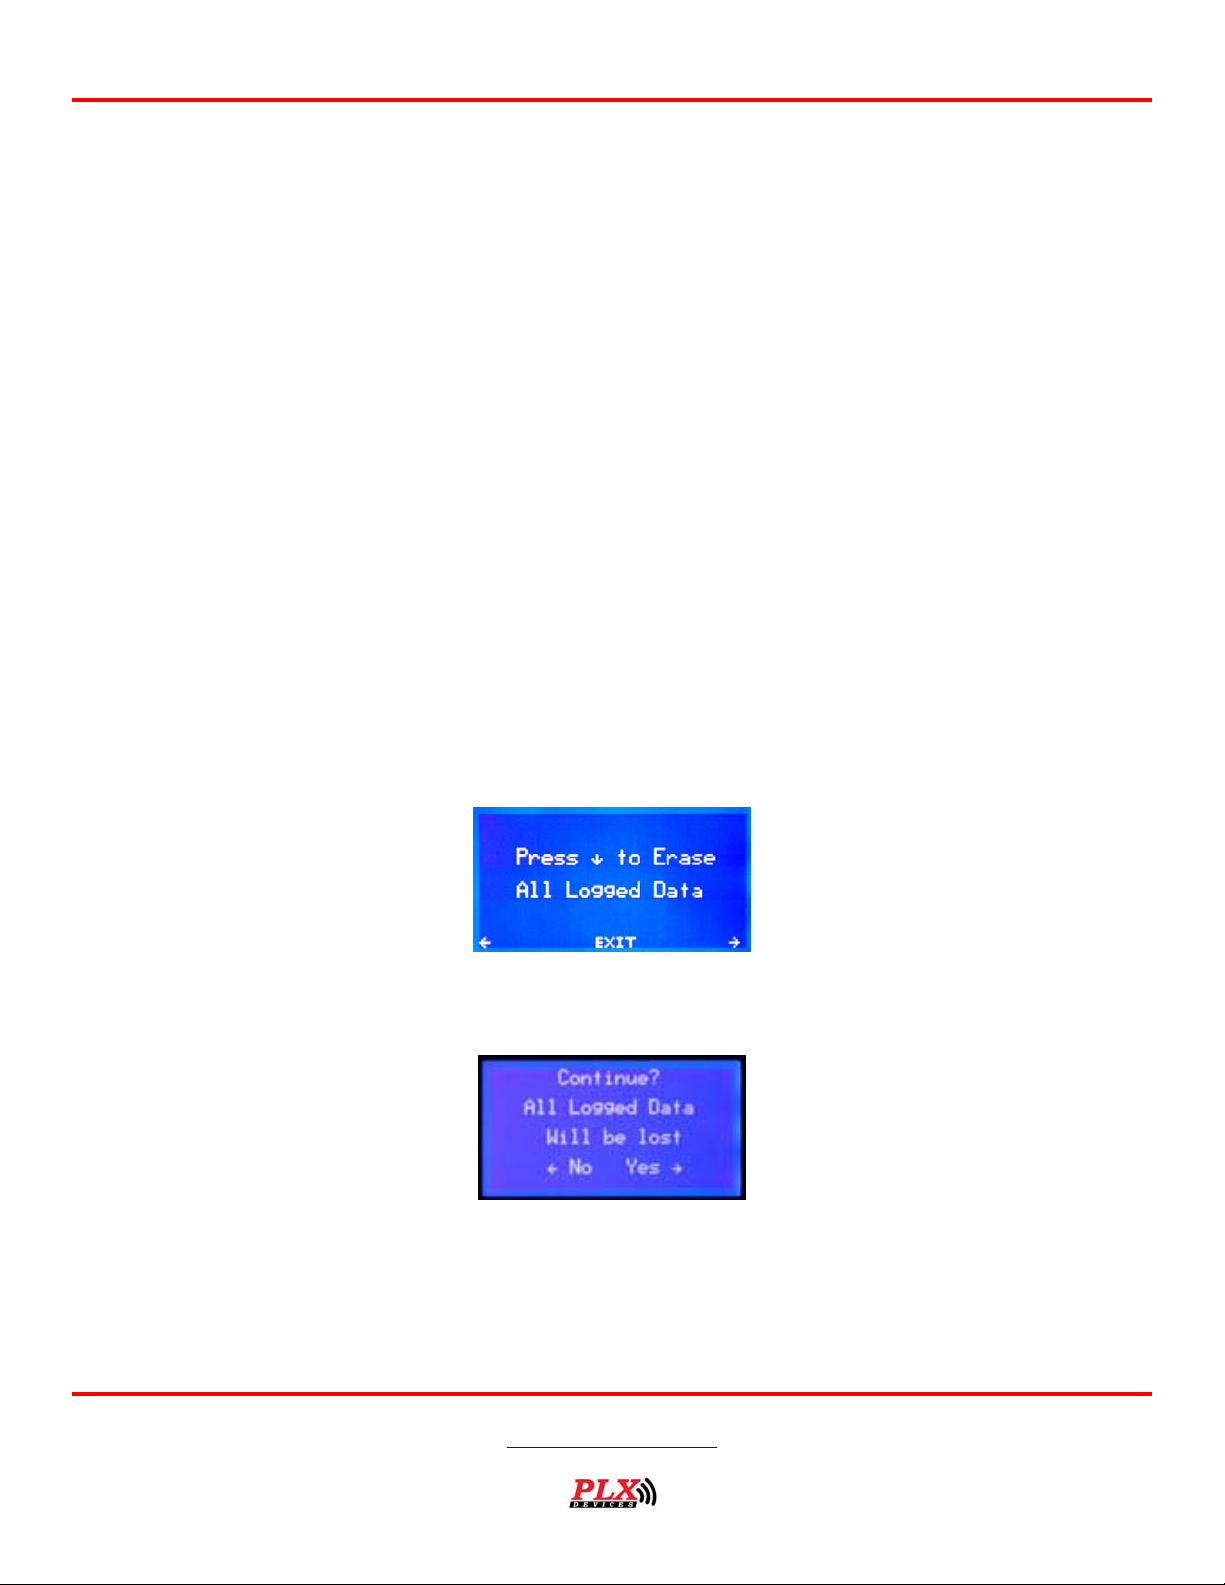
3.16 Level 4: PC Upload (4-1)
This menu is used to select a data log session to upload to the PC. Here are the procedures of how upload
sessions to the PC:
Version 1.3 Feb 21, 2006
www.plxdevices.com
(408)745-7591
Page 23
Users Guide: R-500 Wideband Computer
Before uploading to the PC, verify that your PLXLogger gauges display in real-time the correct information.
For example, if you have speed 1 connected to your RPM signal; make sure that the PLXLogger software
displays the correct RPM on your gauge.
Be aware: If you do not configure your gauges on the PLX Logger on the PC, your R-500 will then send
raw voltages and pulses to the PC that may be difficult to decipher. Another thing to remember is that
your AFR readings by default are NOT internally routed to any analog channel (see menu 4-6 for details).
You must route the AFR signal to an analog signal to properly data log it!
The R-500 will stream data continuously through the USB port in any state other than the PC Upload Menu
(4-1 this menu).
1. Push the down button to toggle through all the saved data logger sessions resident in the R-500s
memory.
2. Start the PLXLogger software on the PC.
3. On the toolbar for the PLX Digital Dash, select File Æ R-Series Flash Download and click it. A blue
window should pop up prompting you to upload the data logged state. Do not u pload sess ion
until this window is opened! Failure to do so will result in data corruption!
4. Press the left button on the R-500 to transmit the session to the PC.
5. Upon successful transmission, PLXLogger Software will prompt you to enter the file name of the
data logger session that was just uploaded. The file can now be analyzed using the 2D and 3D
logger on the PLXLogger software.
3.17 Level 4: Clear Data logged Sessions (4-2)
This menu is used to delete all data logged sessions stored in the R-500’s internal memory. Push the
down button to delete all logged sessions. You will be prompted to confirm your decision.
Press the right button then to confirm your intent to permanently delete all your logged data. Press the
left button to cancel the erasing process.
Version 1.3 Feb 21, 2006
www.plxdevices.com
(408)745-7591
Page 24
Users Guide: R-500 Wideband Computer
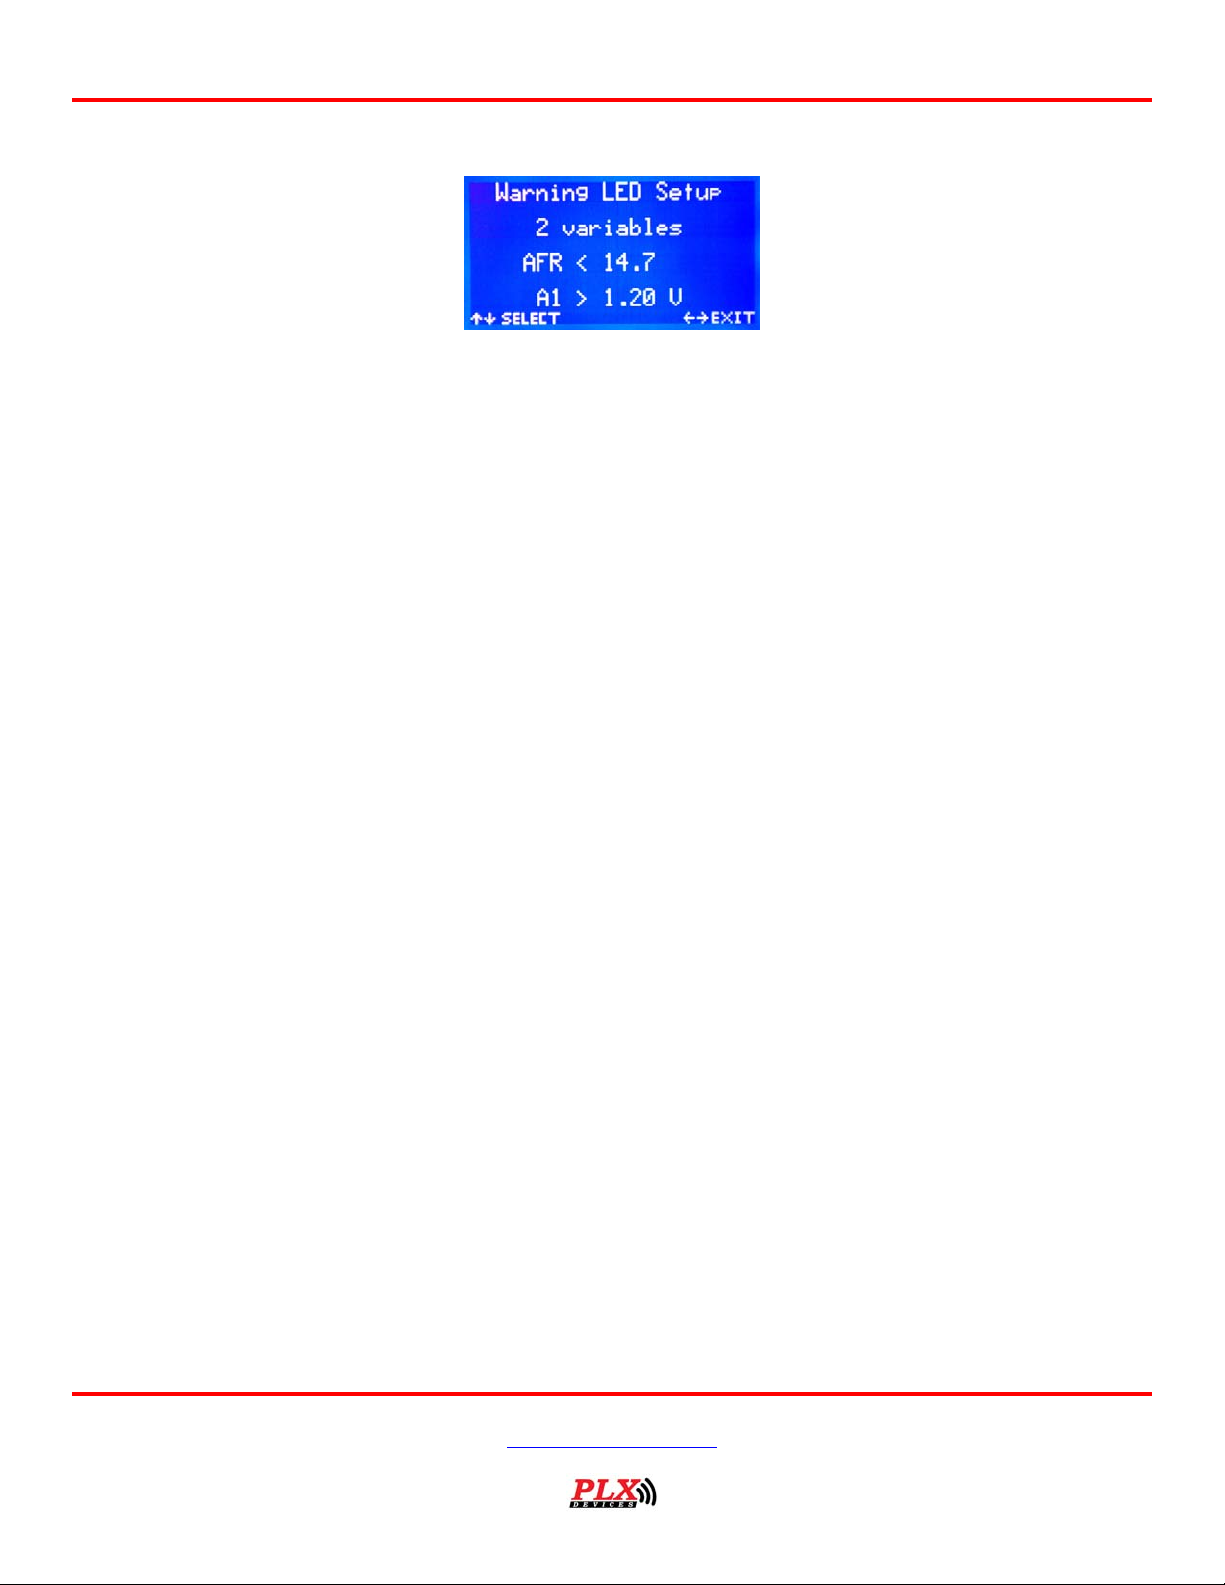
3.18 Level 4: Warning LED Setup (4-3)
This menu configures the Red Warning LED found on the top of the R-500. The second line of text
displays the current function of the warning LED. If no parameters are set, it will display “LED Offline”. If
one parameter is set for the warning LED, it will display “1 variable”. If two parameters are set, it will
display “2 variables”.
From the default entry position of this menu press the up or down button to gain access to the two
warning LED trigger parameters. Once you have chosen the variable that needs to be modified, use the
Left/Right button to navigate the cursor to the proper location of the parameter/number that needs to be
adjusted. To change the parameter directly over the cursor push the Up/Down button toggle the value.
The warning LED will illuminate if the statements of all active variables are “true”.
Here are two examples of how to use the warning light.
1. To configure the warning LED to trigger when the AFR is greater than 14.7 AFR and
when throttle position is greater than 50%:
Hook up the throttle position signal wire to one of the analog signal inputs on the data
logger. In this example the throttle position voltage is 0.15V for 0%, 0.5V for 50%, .85
V for 100% throttle, and the throttle position signal from the ECU is connected to A2. To
set this up, the variable 1 parameter would be set to “AFR > 14.7” and variable 2 would
be set to “A2 > 0.50 V”.
2. To use the warning LED as a shift light:
Hook up the tachometer signal to one of the speed inputs on the data logger. In this
example, the tachometer signal is attached to S1 (speed 1) and the redline/shift point is
at 200 Hz. To set this up, the variable 1 parameter would be set to “S1 > 0200 Hz”.
This setup would turn on the warning LED if the pulse signal from the tachometer signal
exceeds the entered value in the selected variable.
*FYI: To find the proper frequency for the shift point, rev the engine of the car to the
desired RPM and look to see the speed signal that the R-500 is receiving. Knowing the
conversion modifier for HzÆRPM may also be helpful in deriving this number.
You will be prompted to save your settings upon leaving this menu if you have changed any of the values.
Version 1.3 Feb 21, 2006
www.plxdevices.com
(408)745-7591
Page 25
Users Guide: R-500 Wideband Computer
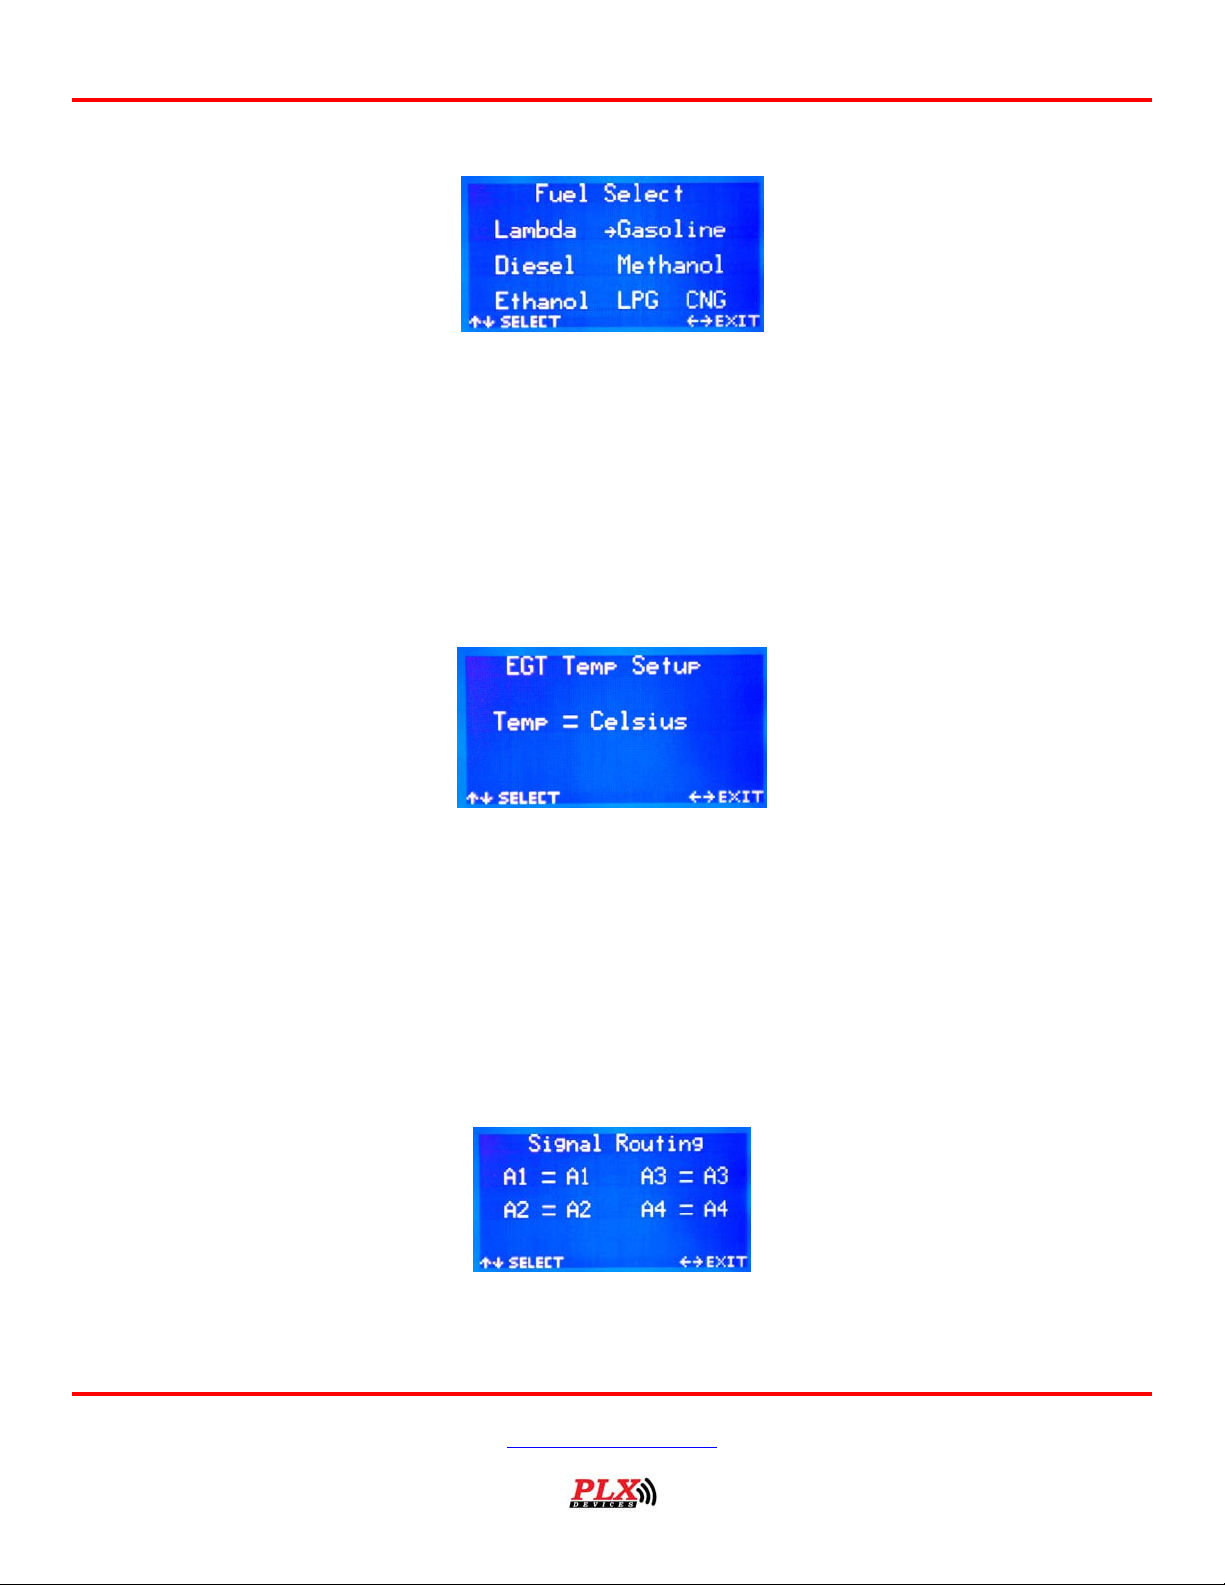
3.19 Level 4: Fuel Selection (4-4)
This menu is used to set the fuel type being used by the vehicle. Press the up/down button to select the
correct fuel type. Press the right/left button to exit this menu. The settings in this state affect the gauge
in menu (1-1) and also the numeric readout in menu (1-2). For your reference, here are the stoic values
for each type of fuel:
CNG 17.2. You will be prompted to save your settings upon leaving this menu if you have changed any of
the values.
3.20 Level 4: EGT Temp Setup (4-5)
Lambda 1.0, Gasoline 14.7, Diesel 14.6, Methanol 6.4, Ethanol 9.0, LPG 15.5, and
This menu is used to select the unit type for temperature. Press the up/down button to move the arrow
down to point at the “Temp” text. With the arrow shown, press the right/left button on the R-500 to
toggle between Celsius and Fahrenheit readouts. The settings in this state affect the gauge in menu (1-1)
and also the numeric readout in menu (1-2).
You will be prompted to save your settings upon leaving this menu if you have changed any of the values.
3.21 Level 4: Signal Routing (4-6)
This menu allows the four analog inputs be assigned to AFR, EGT or Knock. From the default entry
position of this menu, push the up/down button to toggle between the different analog channels. A right
Version 1.3 Feb 21, 2006
www.plxdevices.com
(408)745-7591
Page 26
Users Guide: R-500 Wideband Computer
arrow points at the channel that is presently being selected. Push the right/left button to change the
signal assignment between the default analog channels, AFR, EGT, and Knock. To exit this menu, push
the up/down button until there is no arrow showing and then press the left/right button to exit. You can
verify the results of the changes in menu (2-1).
You will be prompted to save your settings upon leaving this menu if you have changed any of the values.
3.22 Level 4: Knock Normalization Setup Menu (4-7)
This menu is used to setup the parameters used for knock normalization. Press the down button to
choose the parameter to modify the settings.
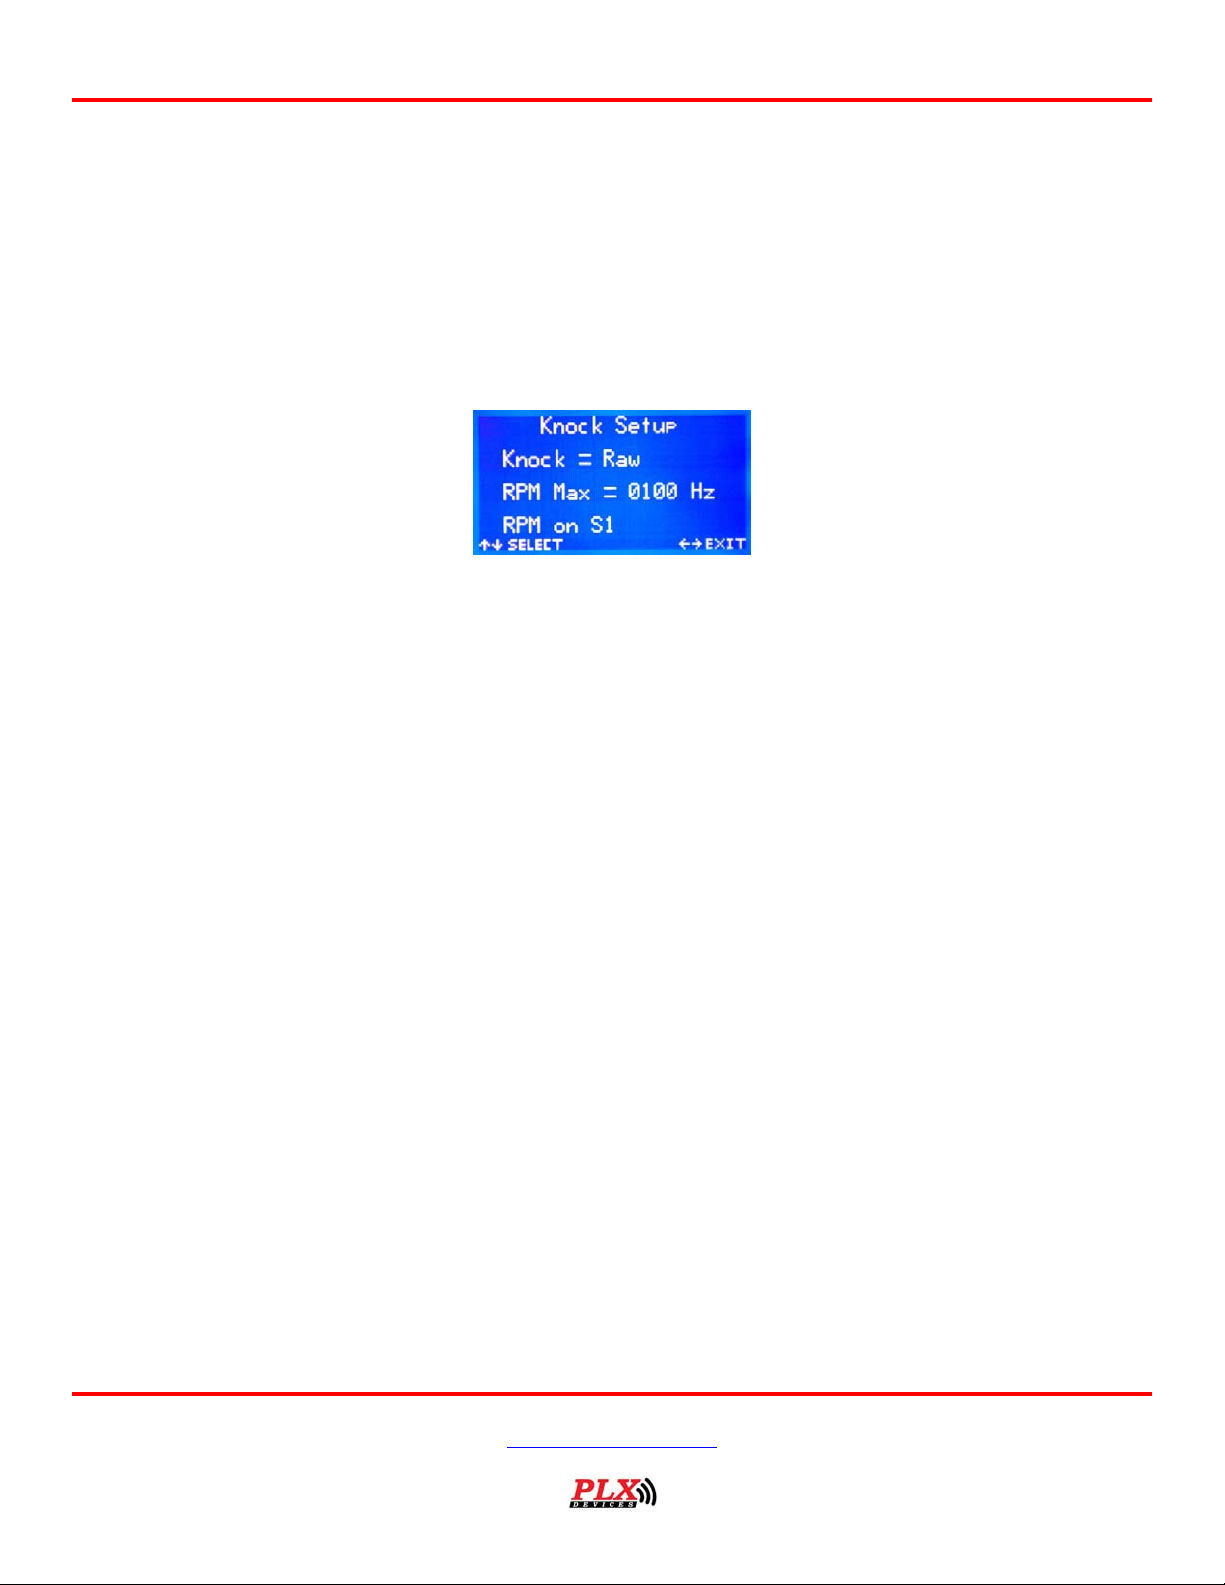
The first setting can be set to “Raw” or “Normalized”. Raw knock shows the true knock voltage value that
is being received from the vehicle’s knock signal. Normalized knock is equal to the difference between the
actual knock voltage and the engine’s normal background noise calibrated in menu (4-8).
The number next to the “RPM Max” can be adjusted from the range of 100 Hz – 1500 Hz. (FYI: To find
the RPM Max Value, attach the tachometer (or injector) signal to S1 or S2 (whichever one is selected in
this menu). Toggle to menu (2-1) and set the display to the raw data setting and then proceed to rev
your engine up to redline briefly. Use this menu to then find the Maximum Hz RPM value to enter in to
RPM Max. An alternative way to find you Maximum RPM frequency value is to figure out the conversion
value between Hz and RPM. So let’s say that a certain engine’s tachometer signal outputs 100 Hz at 3000
RPM (to find this, rev and hold the engine to 3000 RPM and observe the value coming into the speed input
that is connected the tachometer signal). By dividing 3000 by 100 we get 30 RPM/Hz (3000/100=30).
You would then use this conversion number to find the proper frequency for the engine’s redline. If
redline is at 9000 RPM, you would do the following: 9000 (RPM)/30 (RPM/Hz) = 300Hz. Thus, 300 Hz
from the tachometer signal corresponds to the engine’s redline at 9000 RPM.)
The final item that can be adjusted in this menu is the speed input channel selection. In order to properly
analyze knock voltage it is necessary to specify which speed input channel the tachometer signal is
connected to. Pushing the left/right button allows you to toggle between “S1” (Speed input one) and “S2”
(Speed input two).
3.23 Level 4: Knock Normalization Scope/Normalization Menu (4-8)
Version 1.3 Feb 21, 2006
www.plxdevices.com
(408)745-7591
Page 27
Users Guide: R-500 Wideband Computer
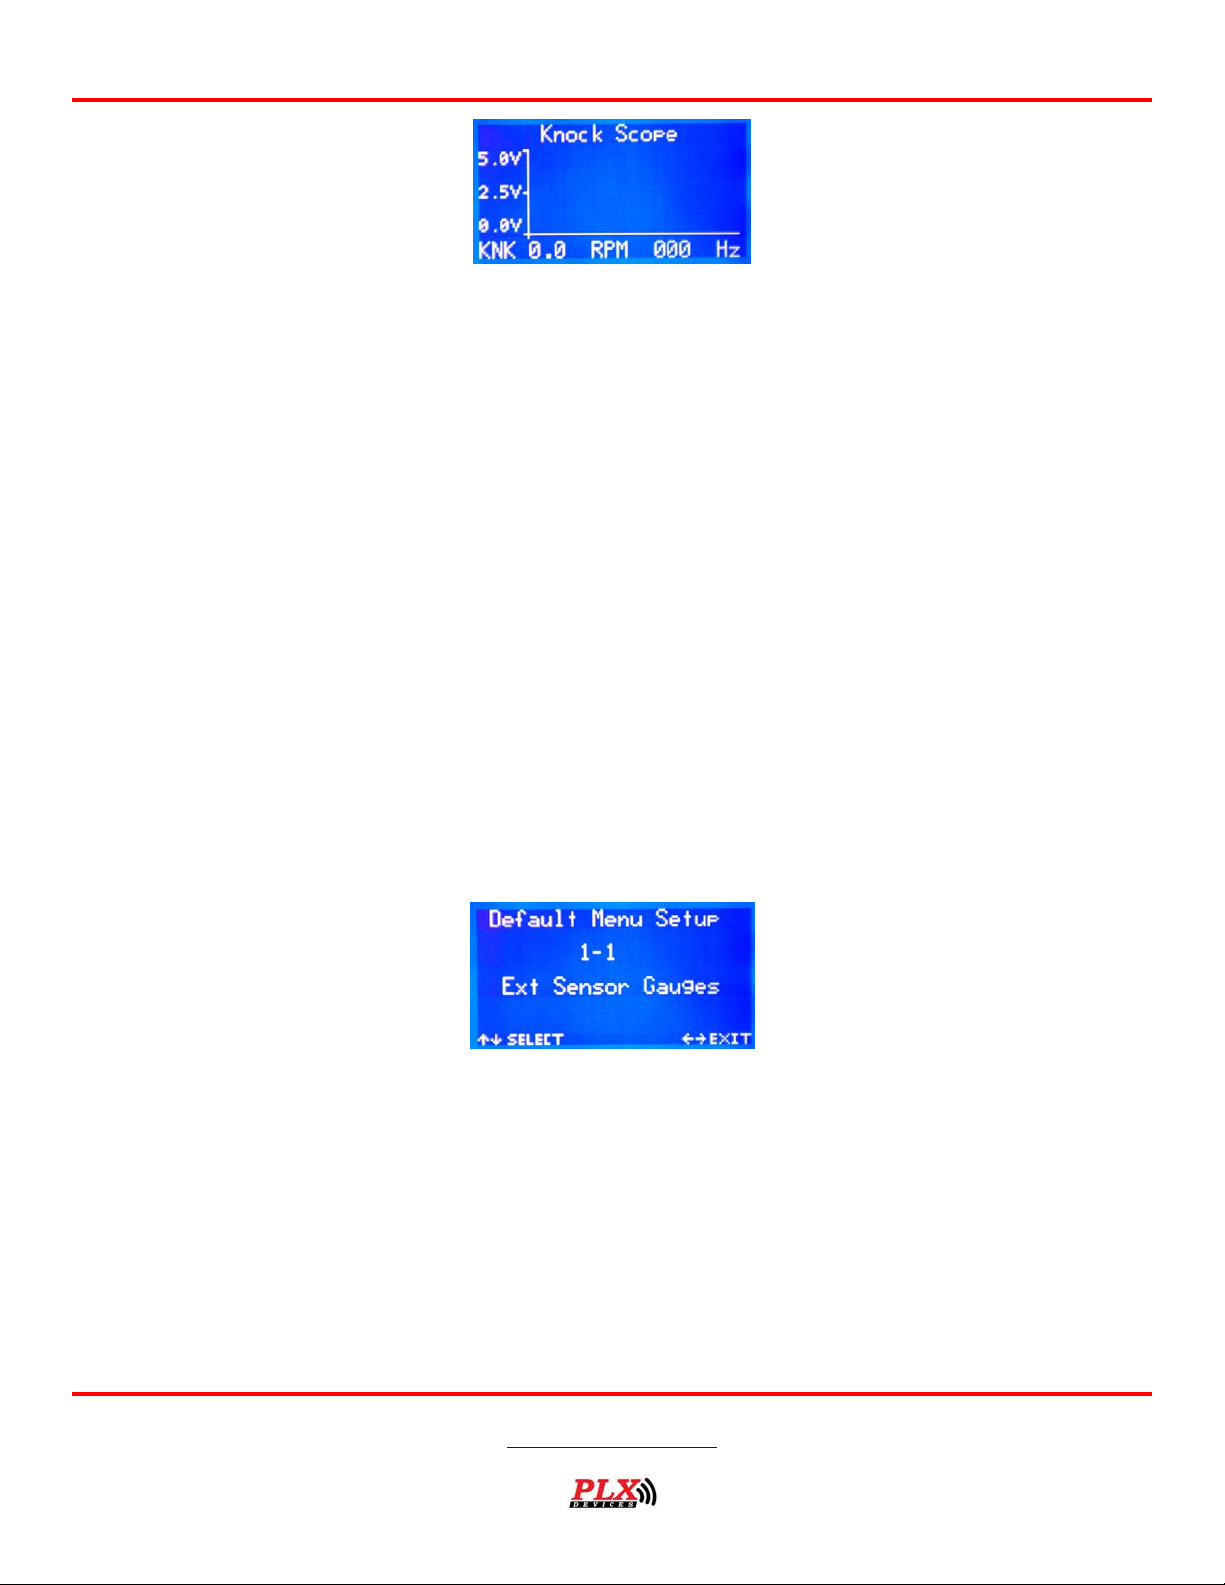
This menu graphically displays the RPM signal (in Hertz obtained from either speed 1 or speed 2 on the
data logger harness) vs. the knock voltage on a 2-axis graph. The white areas of the graph symbolize the
normal background knock voltage of the engine. Background engine knock levels can be normalized by
pushing the down button. Numeric values of the currently measured “raw” knock and tachometer (RPM)
oscillation values (Hz) are displayed on the bottom of the screen. The displayed knock value
corresponds to raw knock voltage only in the menu.
To normalize the background engine noise push the down button. The text on the top of the screen will
change to “Knock Normalizing”. Previously recorded background engine noise that may have been
present will then be cleared and the R-500 will start to record the normal background noise (Knock
Voltage) of the engine across the entire RPM range. For best results, slowly rev your engine from idle to
redline a couple of times. Two pixels are placed under the graph if there is no normalized knock data
within that RPM range on the graph. The two pixels will be removed when the R-500 obtains samples of
knock from that RPM range. When you are satisfied with the recording of the normalized background
engine noise, press the down button to finish the normalization procedure. The R-500 will automatically
extrapolate data for the missing portions of the rev range that have not been sampled.
The R-500 will then save the characteristics of your engine’s background noise to flash memory when you
exit.
3.24 Level 4: Default Menu Selection Menu (4-9)
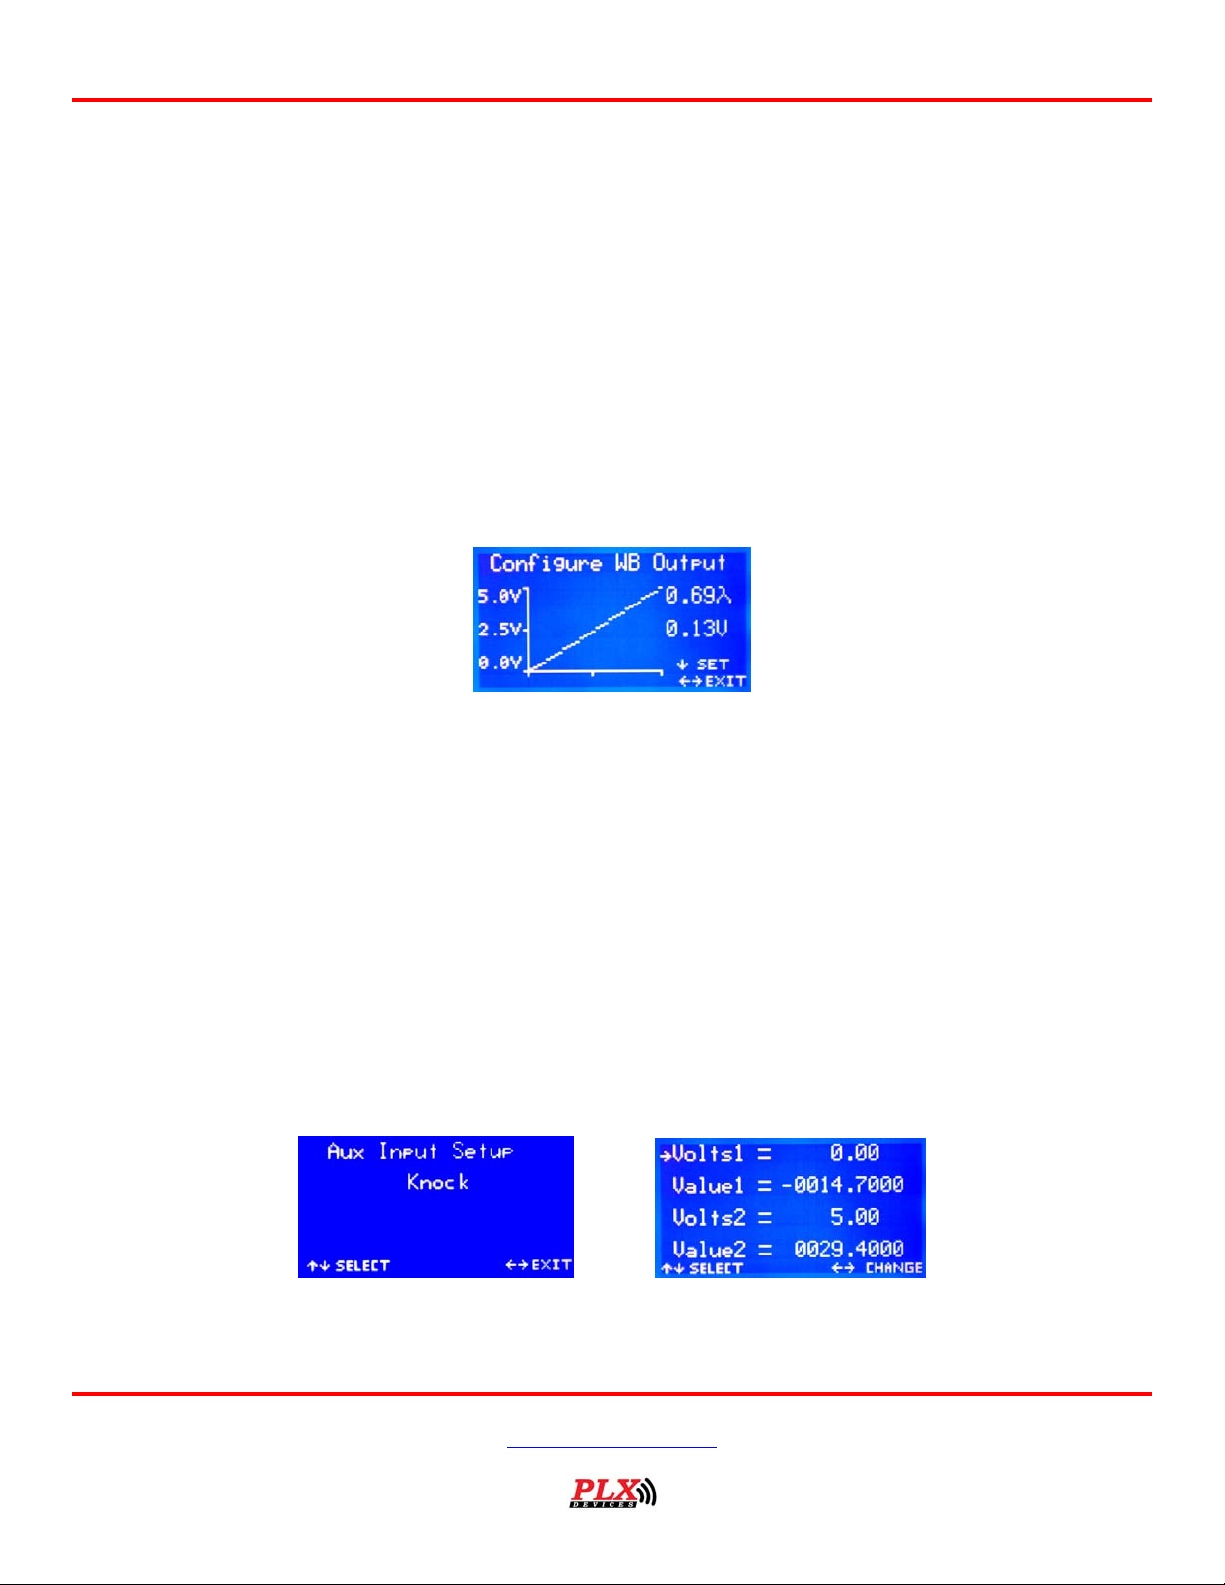
This menu is used to select the menu that the R-500 defaults to upon boot-up (power-on). Press the
up/down button to move the selection arrow down next to the 2
press the left/right button to select the menu that you wish to be vectored (directed) to upon boot-up.
These are the possible selections for starting menus:
1-1 External Sensors Gauges (Default)
1-2 External Sensors Numeric
nd
line with numbers. After doing so,
1-3 External Sensor Graph
Version 1.3 Feb 21, 2006
www.plxdevices.com
(408)745-7591
Page 28
Users Guide: R-500 Wideband Computer
1-4 Knock Scope
2-1 Datalogger Monitor
2-2 Data logger Recorder
3-1 Dyno Numeric
3-2 Dyno Graph
3-3 G – Circle/G crosshairs
3.25 Level 4: Configurable Wideband Output Menu (4-10)
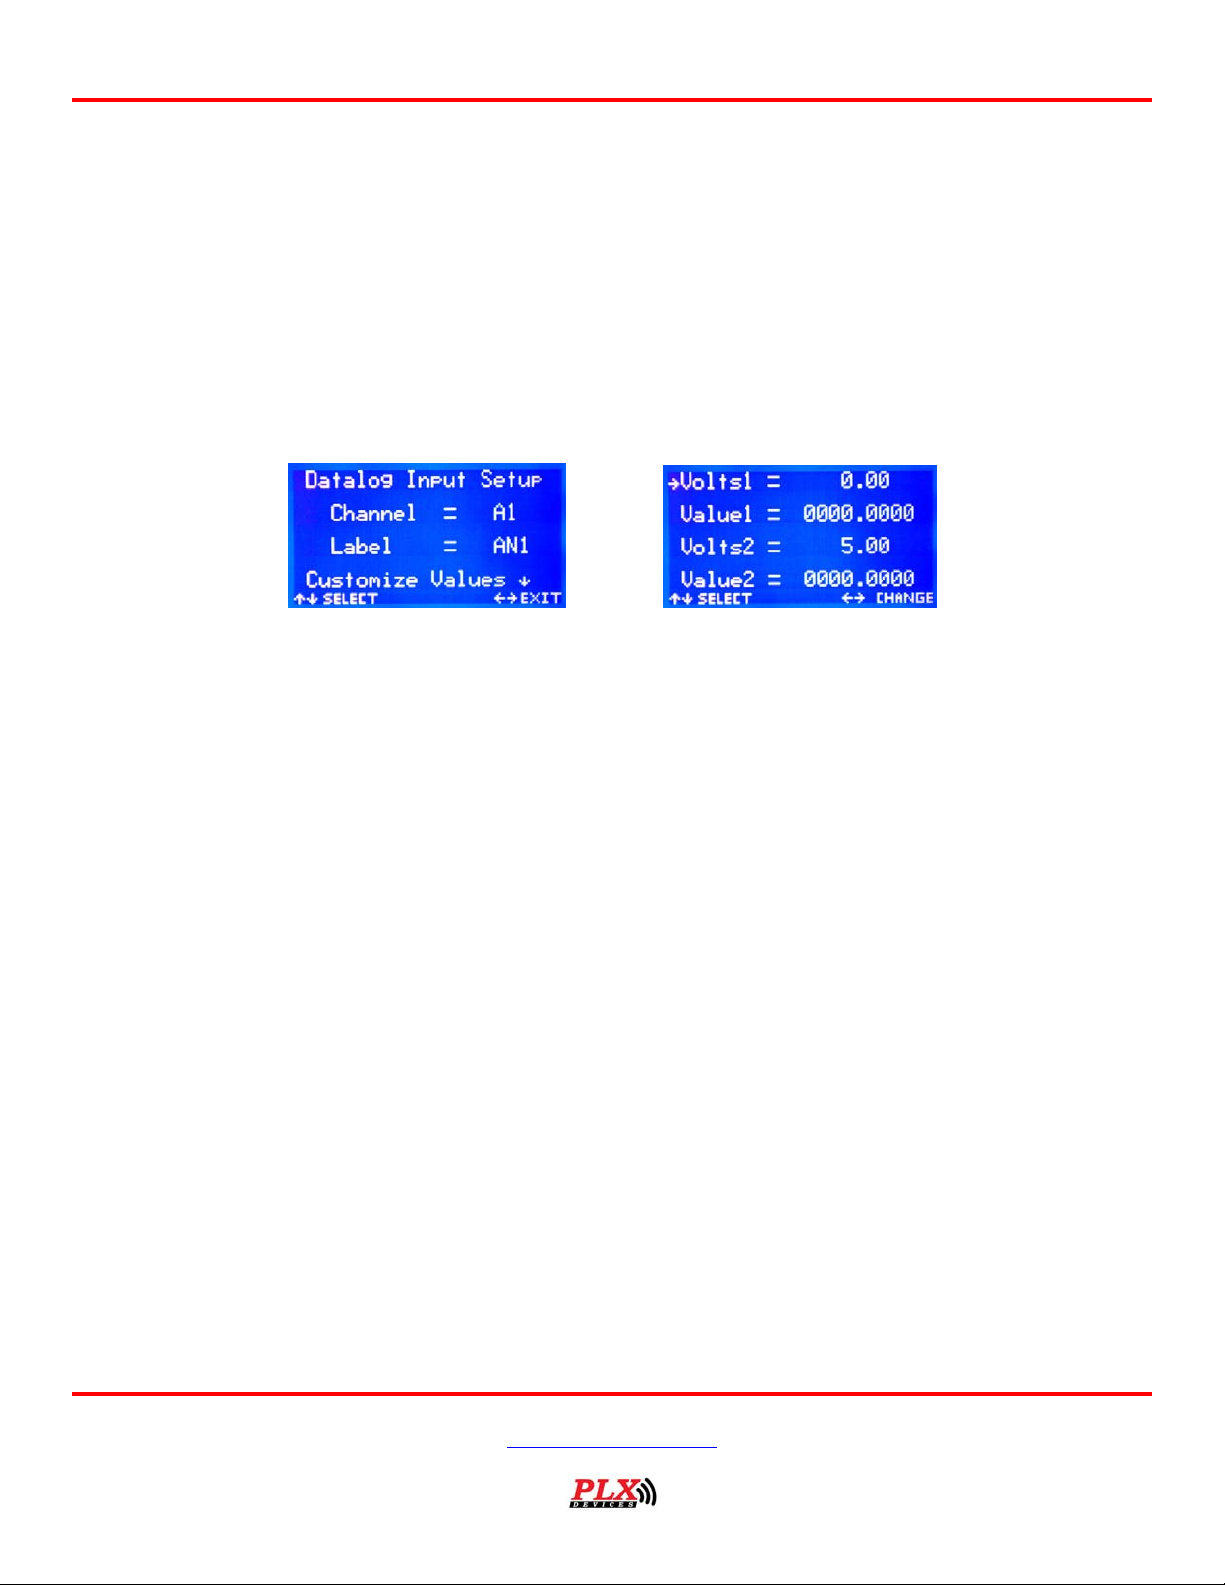
This menu allows you to configure the wideband output (the light green wire) that comes out of the main
harness of the R-500. Press the left/right button to exit the menu or the down button to set the
value/curve of the wideband output.
After pushing the down button to “set” the values, an arrow will appear under the graph. The current
lambda value being set and the corresponding voltage that maps to it is displayed on the right side of the
screen. Press the left/right button to scroll through the lambda values, press the up/down button to
adjust the voltage outputs that correspond to the selected lambda value.
If the arrow is cycled all the way to the left or right of the graph, the menu will revert back to the entry
state.
3.26 Level 4: Auxiliary Input Setup (4-11)
This menu allows you to configure the auxiliary bar found in menu (1-1 External Sensors Graphical) and
also selects what you want to display on the bottom row of menu (1-2 External Sensors Numeric). The
Version 1.3 Feb 21, 2006
www.plxdevices.com
(408)745-7591
Page 29

Users Guide: R-500 Wideband Computer
parameters that you can monitor are: 1. Knock Voltage (default) 2. Manifold Absolute Pressure (MAP,
Boost) and 3. An analog voltage of your choice.
Press the up/down button to move the pointer arrow next to the item that you wish to change. Pressing
the left/right button next to the text “Select channel” or “Voltage- in from” allows you to select the analog
channel that to read the auxiliary input from. You may choose from A1-A4, please keep in mind the effect
of the settings in menu (4-6 Signal Routing) when making the selection. If no analog channel is selected
the auxiliary parameter is set to monitor knock voltage from your knock sensor input.
With an analog channel selected you will be given the option to push up/down and modify the type of
signal being analyzed from your chosen channel. Pressing the left/right button on the bottom row of this
state (default text is “Custom MAP Sensor”) allows you to choose between the Custom MAP sensor (you
can even use the signal right off your stock ECU, any linear signal can be configured) or display the
voltage from the selected analog channel.
If you have selected “Custom MAP sensor” you will have the option of pushing the down button and
configuring your MAP sensor. Doing so will bring you to a different submenu where you will have the
opportunity to input two voltages and their respective pressure values (psi). Pressing the up/down button
to move the pointer arrow out of the menu will bring you to the Linear relationship display and prompt
you to save your changes.
Be advised that the “values” entries only have 6 significant digits of precision. If the event that you run
into any floating point glitches you may solve this problem by maxing out the value number to either
-9999 or 9999 (repeatedly increment or decrement the thousands unit. Once you max it out, this will
effectively clear the decimal point values) and then re-entering the value that you wish to input.
Here is an example of how to setup your custom MAP sensor:
On most Honda stock MAP sensors the minimum MAP is 0.32 V @ -13.9 psi, the maximum MAP is 4.84 V
@10.94 psi. To set this up on the R-500 you would enter the following:
Volts1 = 0.32
Value1 = -13.9
Volts2 = 4.84
Value2 = 10.94
Using the up/down buttons to leave this configuration menu will direct you to the linear relationship
display and show the following:
Linear Relationship
Vac-Boost = mV + b
m= 05.49
Version 1.3 Feb 21, 2006
www.plxdevices.com
(408)745-7591
Page 30
Users Guide: R-500 Wideband Computer
b= -15.6585
The R-500 automatically calculates the relationship between voltage and MAP for you. “m” is the linear
relationship between voltage and boost (it’s the multiplier), “b” is the offset value (basically the value at
zero volts). This is similar to the algebraic linear formula where y=mx+b. You may use this formula to
setup your PLX Logger PC software for boost.
You will be prompted to save your settings upon leaving this menu if you have changed any of values.
3.27 Level 4: Data logger Input Setup (4-12)
This menu allows you to convert the voltage and pulses coming in from the data logger harness into
values that are easily readable and understandable by the end user. Making changes in this state will
affect the labels and data on the secondary setting of the Data log Inputs Menu (Menu 2-1).
Press the up/down button to move the pointer arrow to the parameter that needs to be adjusted.
Pressing the left/right button next to the “Channel” text toggles through the R-500’s analog and speed
channels (A1-A4, S1, S2). Pressing the left/right button next to the “Label” button moves a cursor under
the 3 character label that you can customize. The valid characters that you can choose from are: capital
A-Z, 0-9, Å, Æ, and a blank space.
Pressing the down button while the pointer arrow is pointing to “Label” will bring you into the submenu
which allows you to configure the relationship between voltage (or frequency) and value by entering to
voltage (or frequencies) and two corresponding values.
Press the up/down button to move the cursor to the parameter to be modified, then press the right/left
button to move the cursor under the numeric value to be modified. To modify a number push the
up/down button while the cursor is under the number.
Be advised that the “values” entries only have 6 digits of precision. If the event that you run into any
floating point glitches you may solve this problem by maxing out the value number to either -9999 or
9999 (repeatedly increment or decrement the thousands unit. Once you max it out, this will effectively
clear the decimal point values) and then re-entering the value that you wish to input.
Attempting to leave this submenu will bring you to the linear relationship display and prompt you to save
your changes. You will be prompted to save your settings upon leaving this menu if you have changed
any of values.
Here are some examples on how to customize your signals:
Version 1.3 Feb 21, 2006
www.plxdevices.com
(408)745-7591
Page 31

Users Guide: R-500 Wideband Computer
1. Let us just say that you want to have AFR shown on A1, so first you would route A1 to AFR (menu
4-6) and then do the following:
Set the Channel to A1 and change the label to: “AFR”
Since AFR = (2*Voltage) +10 Thus 10 AFR= 0 Volts and 20 AFR= 5 Volts.
So enter these values:
/*--------------------------*/
Volts1 = 0.00
Value1 = 0010.0000
Volts2 = 5.00
Value2 = 0020.0000
/*--------------------------*/
Using the up/down buttons to leave this configuration menu will direct you to the linear relationship
display and show the following:
/*--------------------------*/
Linear Relationship
Value = mV + b
m= 02.00
b= 0010.0000
/*--------------------------*/
Press any button to exit. Be sure to save your settings (right button).
2. Let us just say that you want to have RPM shown on S1 (where tach signal is attached)
Set the Channel to S1 and change the label to: “RPM”
Let’s just say your tach signal pulses at 20 Hz at 600 RPM, and 150 Hz at 4500 RPM. Enter these values:
Version 1.3 Feb 21, 2006
www.plxdevices.com
(408)745-7591
Page 32
Users Guide: R-500 Wideband Computer
/*--------------------------*/
Freq.1 = 0020
Value1 = 0600.000
Freq.2 = 0150
Value2 = 4500.00
/*--------------------------*/
Using the up/down buttons to leave this configuration menu will direct you to the linear relationship
display and show the following:
/*--------------------------*/
Linear Relationship
Value = mV + b
m= 30.00
b= 0000.0000
/*--------------------------*/
Thus, (30*frequency)+0= RPM
Press any button to exit. Be sure to save your settings (right button).
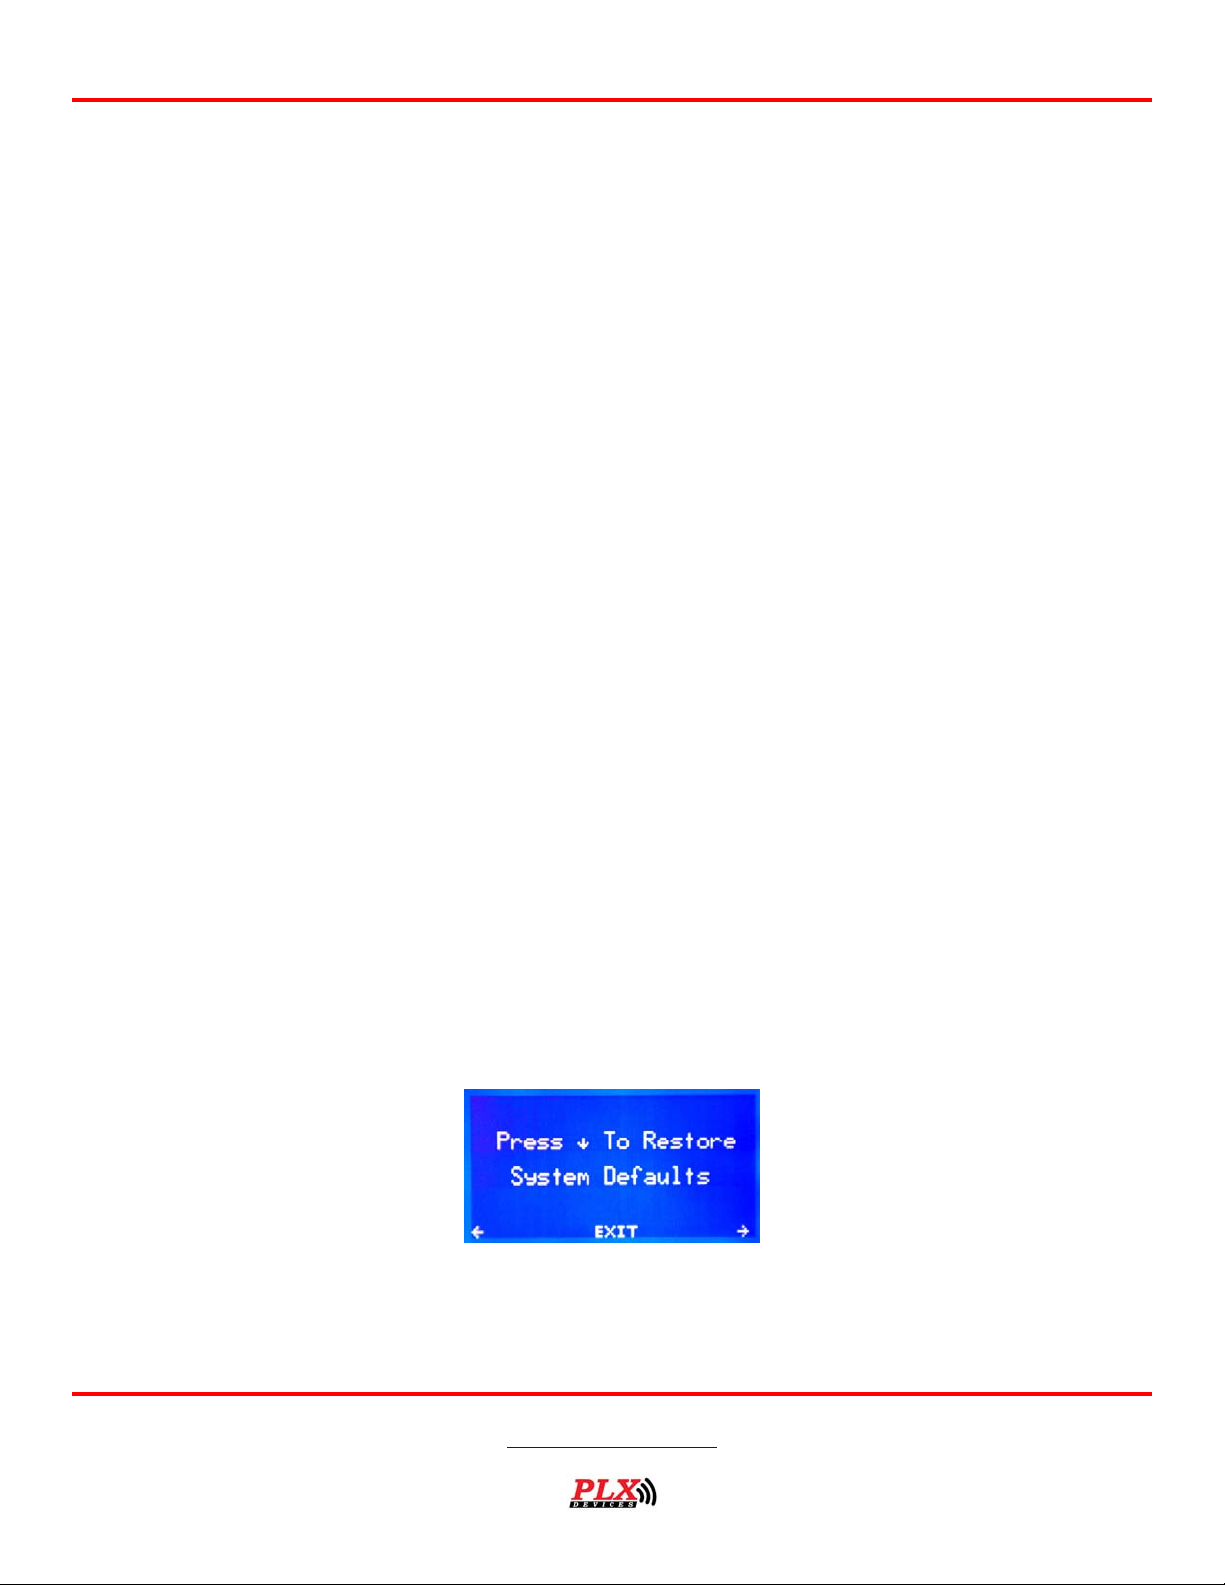
3.28 Level 4: Restore Defaults Menu (4-13)
This menu is used to restore all user settings to the system defaults. Press the down button to restore
system defaults.
Version 1.3 Feb 21, 2006
www.plxdevices.com
(408)745-7591
Page 33
Users Guide: R-500 Wideband Computer
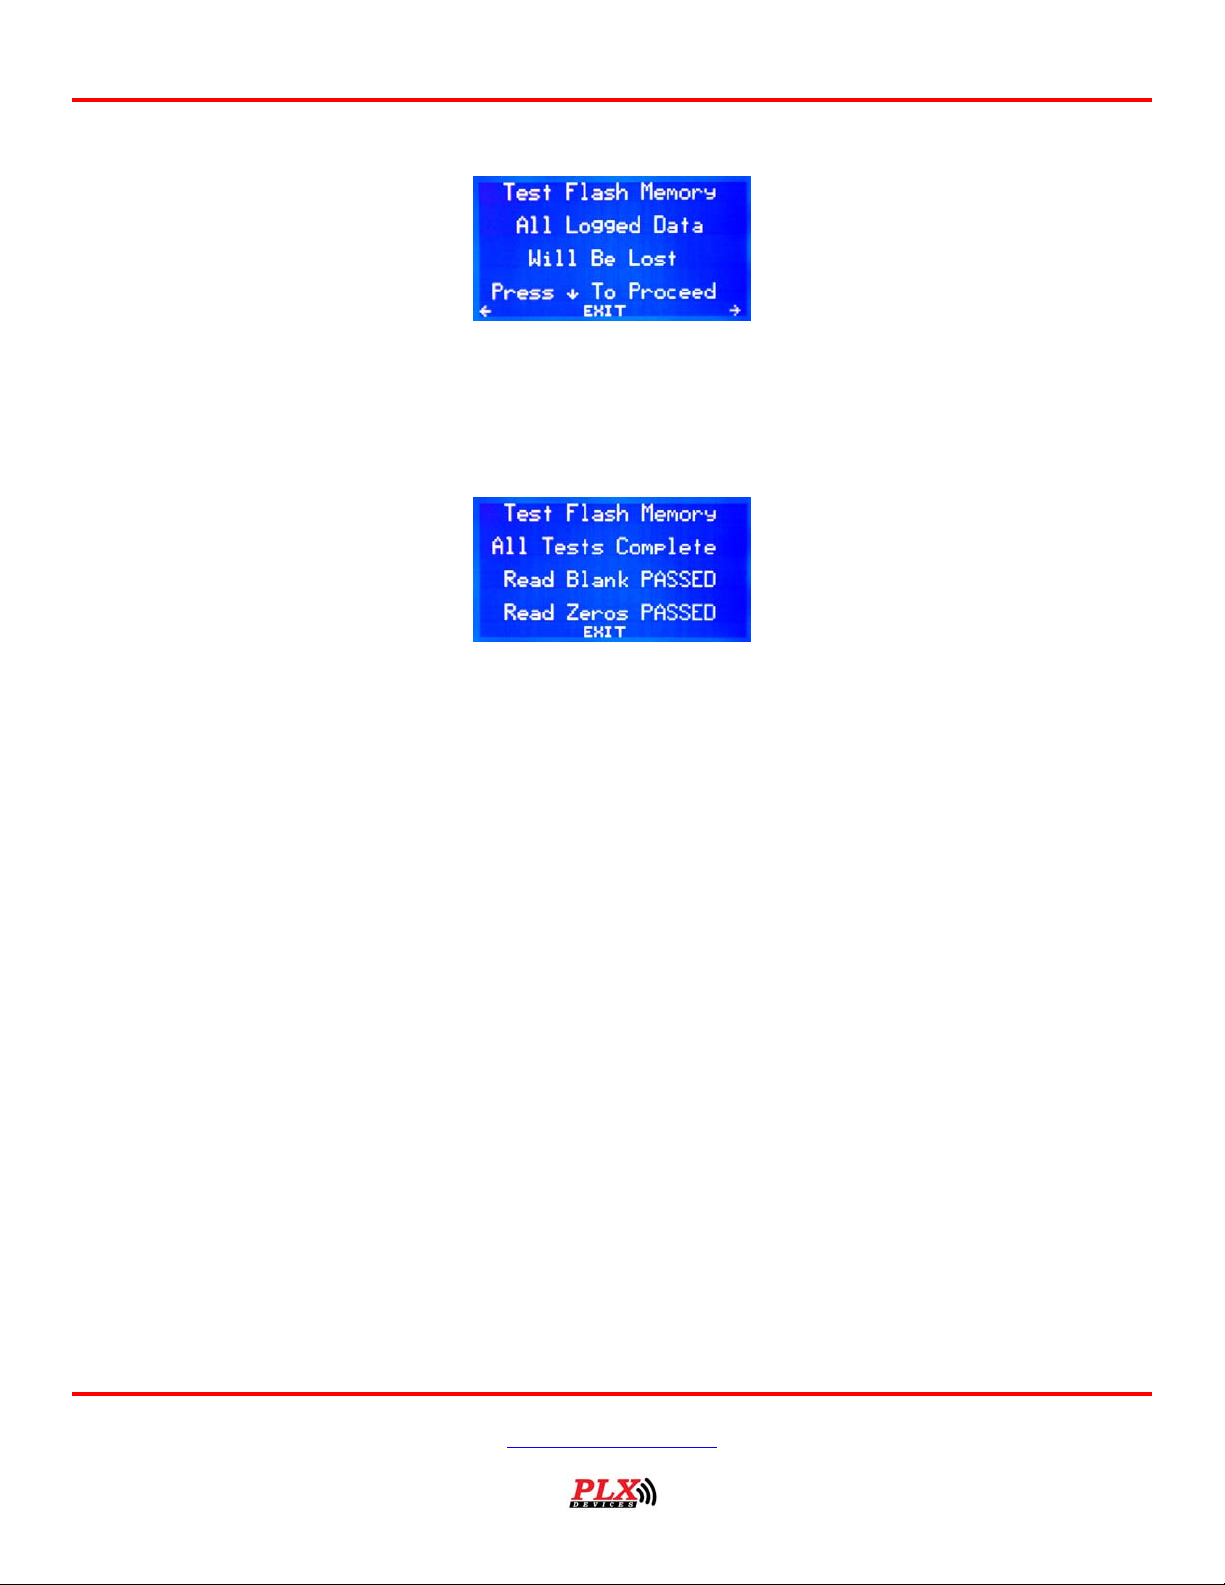
3.29 Level 4: Flash Memory Test Menu (4-14)
This menu is used to test the integrity of the flash memory in the R-500. Upon pressing the down button
the R-500 proceeds to test the erase, read, and write functions in each data cell of the R-500. The results
of the test are then posted for review. Press the left/right button to exit this menu. Be advised: all logged
data will be permanently deleted from flash memory when this test is executed! Test takes 6 minutes to
complete. Do not power the unit down during this operation.
Version 1.3 Feb 21, 2006
www.plxdevices.com
(408)745-7591
Page 34
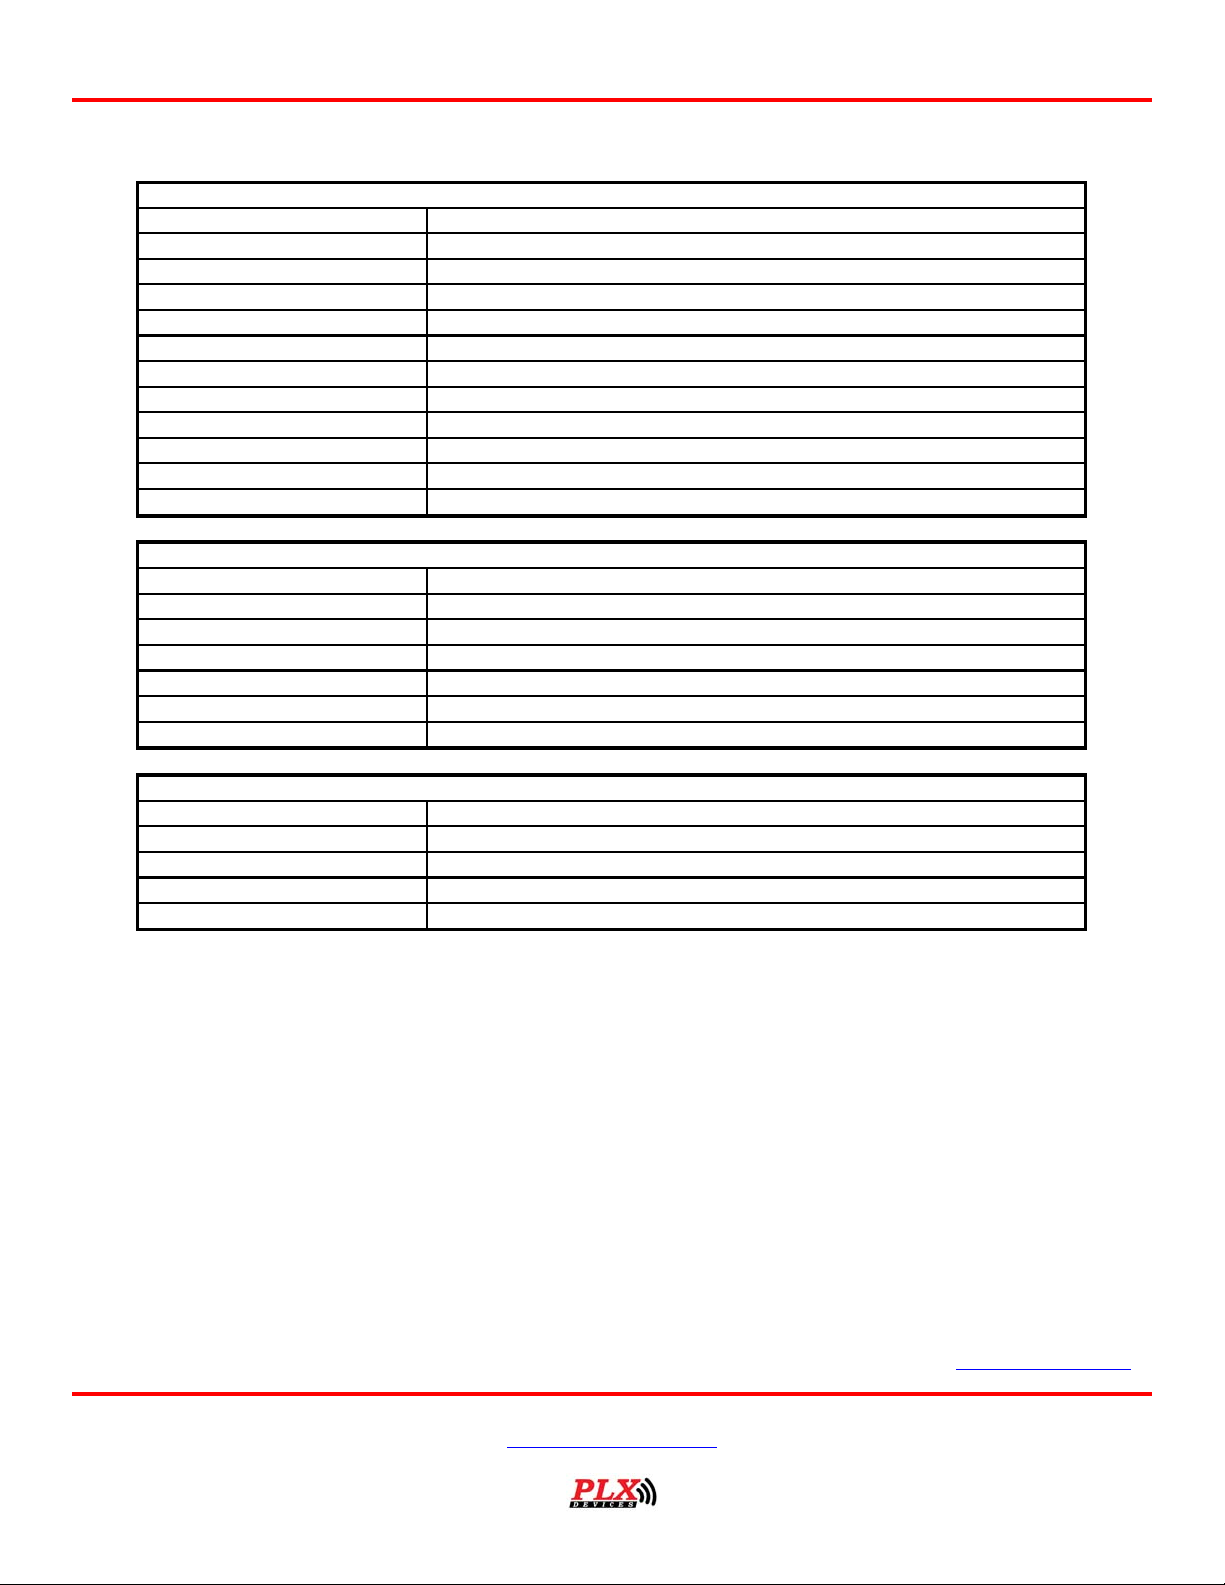
R-500 Technical Specifications
Operating Voltage 9V – 18V
Power Consumption 25 Watt Max, 15 Watt Typical
Power Supply Technology High Efficiency Switching
Operating Temperature 0 – 70 Degrees Celsius (0-158 Degrees Fahrenheit)
Physical Dimensions 4.75 x 2.25 x 1 inch (120.65 x 57.15 x 15.4 mm)
CPU Custom PLX 32 Bit Microprocessor
Clock 32 MHz
USB Interface High Speed USB 2.0
Display 128 x 64 Pixel Blue Backlit LCD
Warning Light High Intensity Red LED
Analog Outputs Configurable AFR, Linear AFR, Narrowband AFR, EGT, Knock
Firmware Upgradeable Yes
O2 Sensors Bosch LSU4.2, (NTK L1H1, L2H2 versions available)
Useful Lambda Range 0.68 Lambda - 1.36 Lambda
Wideband O2 Technology Digital PID (Fast response)
Wideband O2 Accuracy < 0.1AFR (Gasoline)
O2 Sensor Soft Start Yes (Prolongs O2 Sensor Life)
Knock Sensor 2 Wire (signal, ground)
EGT Sensor K-Type Thermo Coupler
Users Guide: R-500 Wideband Computer
Overview
External Sensors
Data Logger
Inputs 2 Speed, 4 Analog
Speed Input Range 4Hz - 10KHz
Analog Input Range 0-5V (25V Max Voltage Protection)
Flash Memory ~80 Minutes
Sampling Rate 10 Samples/Sec (10 Hz)
TERMS OF USE
PLX Devices Inc. does not guarantee the M-200/M-250/M-300’s functionality with any ECU, data logger or other devices that uses
the output signals. Implementation and integration of the M-200/M-250/M-300 with any other device(s) must be done at your own
risk. Improper installation and usage may lead to engine damage. Mount and install the M-200/M-250/M-300 in a location where it
does not obstruct the driver’s view and/or ability or safely control the vehicle.
LIMITED WARRANTY
PLX Devices Inc. warrants this product to be free from defects for 90 days from the date of purchase. If applicable, Oxygen sensors
and other non-serviceable items are excluded from stated warranty. Serviceable goods must be determined by PLX Devices to be
defective before any warranty or replacement is issued. PLX Devices’ obligation under warranty shall be limited to repairing or
replacing, under the discretion of PLX Devices, any part proven defective. This warranty is limited to the repair or replacement of
parts in the manufactured good and the necessary labor done to affect its repair or replacement.
SERVICE UNDER WARRANTY
In the unlikely event that your PLX Devices hardware should fail during the warranty period, a Return Material Authorization number
(RMA) must be first retrieved from PLX Devices Customer Support. Support can be contacted through email:
Version 1.3 Feb 21, 2006
www.plxdevices.com
(408)745-7591
Page 35
Users Guide: R-500 Wideband Computer
or by phone: 408-745-7591. All serviceable goods must be packaged securely with proof of purchase, RMA number, with all shipping
charges prepaid and shipped to PLX Devices Inc. Goods returned under warranty must be received by PLX Devices Inc. within ten
(10) business days after the RMA number has been issued. Goods received after this period is subject to fees for the service of repair
or replacement. All repaired or replaced items shall be warranted for the remainder of the original product warranty.
RETURNS AND RESTOCKING FEE
A 15% restocking fee will apply to applicable PLX Devices products for refund. All returns are to be packed in original condition
including packaging, documentation, manuals, and accessories. Returns that do not include all the accessories and components may
be returned to the customer or charged on a per item basis. The customer assumes responsibility for product until receipt at PLX
Devices Inc., shipping via an insurable carrier is recommended. Any unauthorized shipping charges will be billed to the customer or
shipment will be refused.
DISCLAIMER
PLX Devices Inc. shall not be liable for direct, special, incidental, or consequential damages resulting from any legal theory including,
but not limited to, lost profits, downtime, goodwill, damage, injury to persons, or replacement of equipment and property due to
improper installation, integration and/or misuse of any PLX Devices Inc.’s product(s). This warranty applies to the original purchaser
of product and is non-transferable. All implied warranties shall be limited in duration to the said 90 day warranty period.
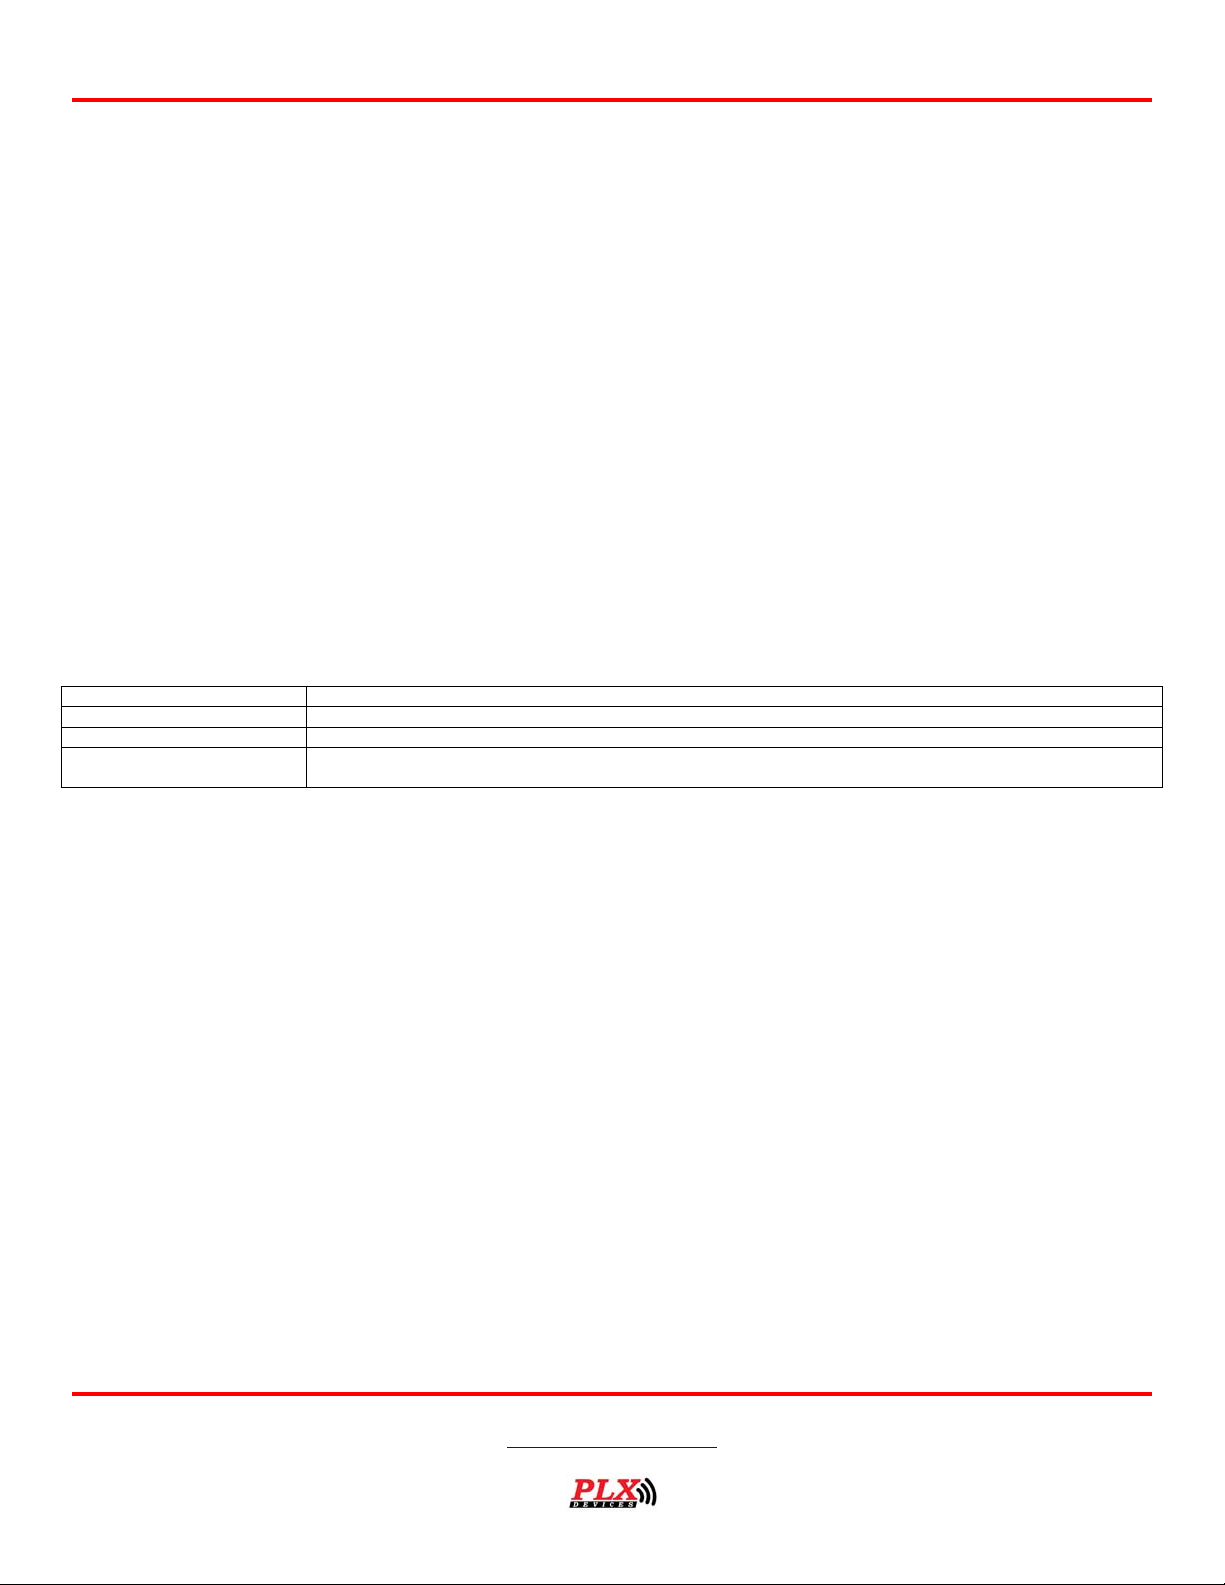
Revision History
Version 1.0 (4/11/05) Initial release
Version 1.1 (7/20/05) Revised format to PDF
Version 1.2 (9/15/05) Updated instructions for Firmware revision 1.1
Version 1.3 (2/21/05) Added detailed information for Warranty and returns
Updated instructions for Firmware revision 1.11
Version 1.3 Feb 21, 2006
www.plxdevices.com
(408)745-7591
 Loading...