

Page 1
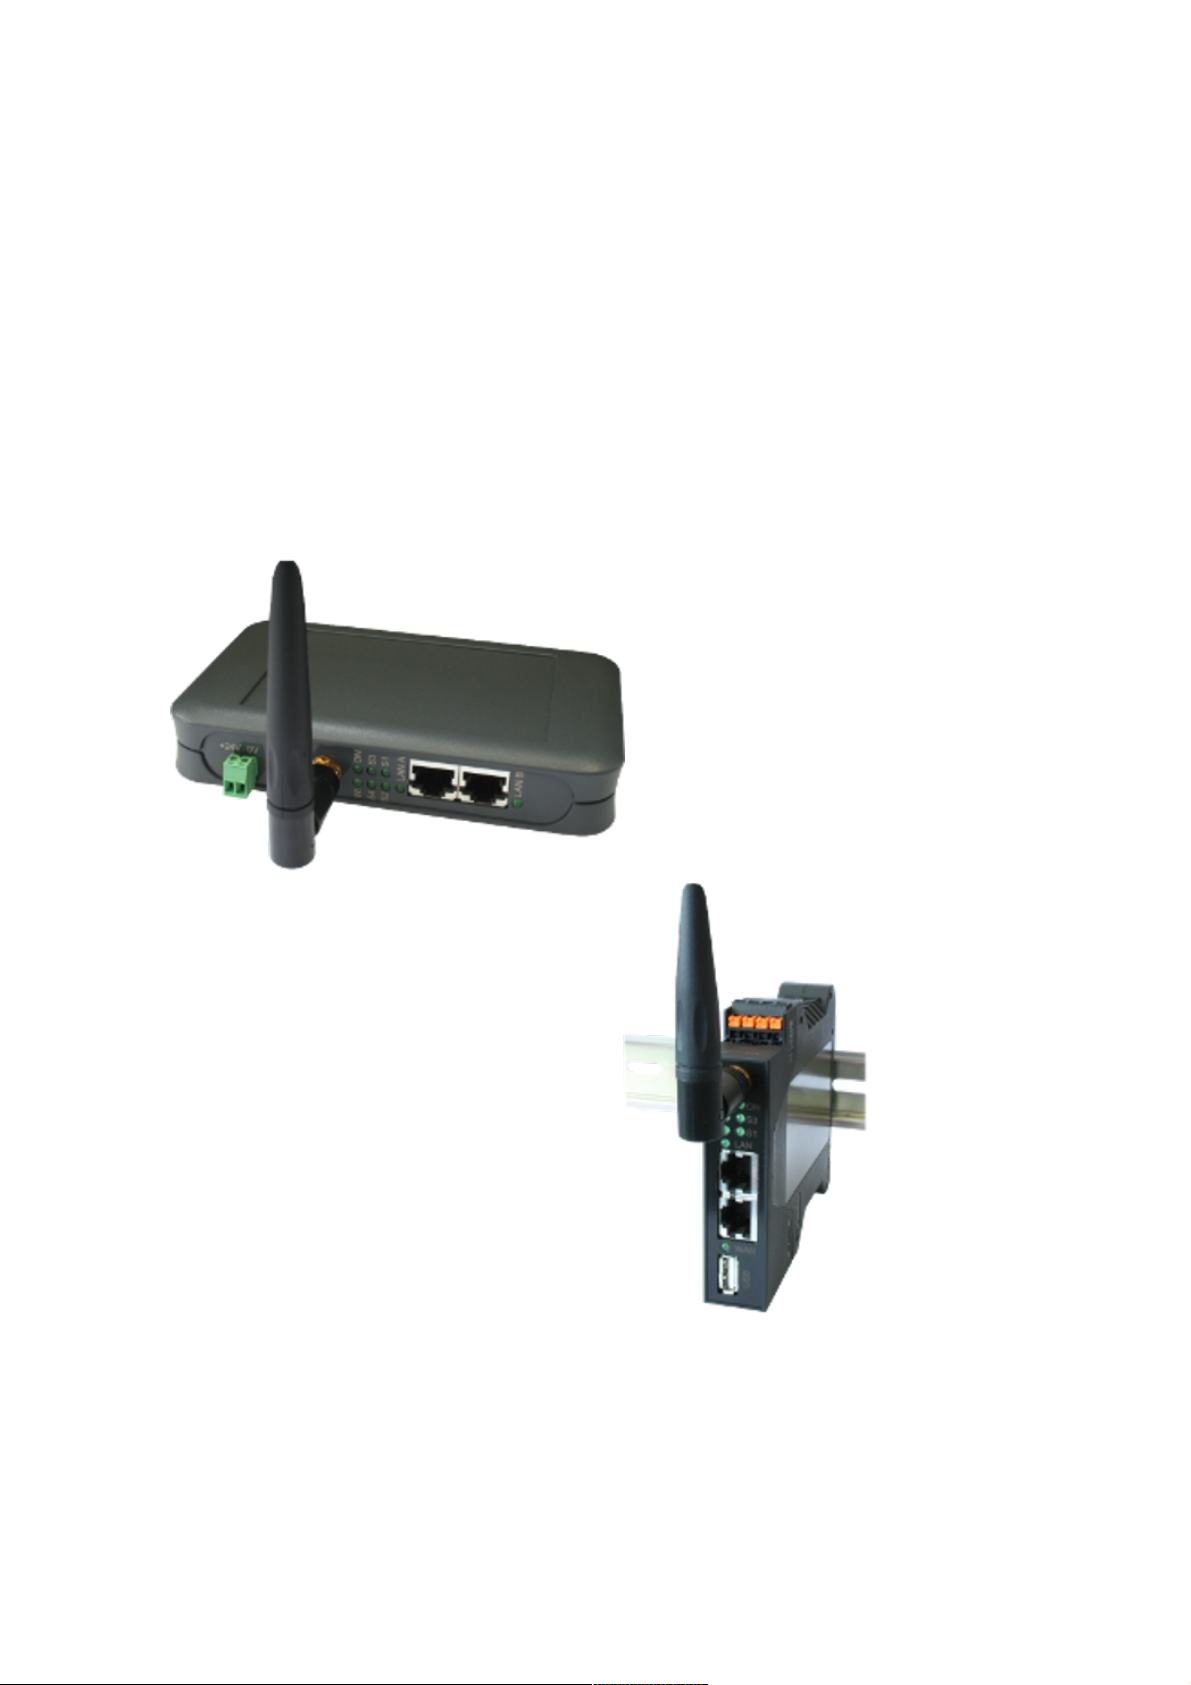
TINA / ProfiNet-WATCHDOG
user manual
V1.08
English
User manual compatible with firmware V1.09 or higher!
© Copyright by PI 2017-2019
Page 2

Content
1 General..................................................................................................5
1.1 About the manual.............................................................................5
1.2 Requirements to the user.................................................................6
1.3 Use for intended purpose.................................................................6
1.4 Particularities...................................................................................6
2 System requirements.............................................................................7
2.1 Software...........................................................................................7
2.2 Hardware.........................................................................................7
3 Commissioning......................................................................................8
3.1 Web server access..........................................................................8
3.1.1 Access via WLAN.......................................................................9
3.1.2 Access via LAN..........................................................................9
3.1.3 Access via USB-LAN...............................................................10
3.1.4 Web interface...........................................................................11
3.2 Bridge interfaces............................................................................12
3.3 User interaction..............................................................................13
3.3.1 factory defaults.........................................................................13
4 web server...........................................................................................14
4.1 access protection...........................................................................15
4.2 status view.....................................................................................17
4.3 page overview................................................................................18
4.3.1 detail view................................................................................20
4.3.2 frame information and settings.................................................21
4.3.3 view filter..................................................................................23
4.3.4 search......................................................................................55
4.3.5 protocol streams.......................................................................56
4.3.6 RTP streams............................................................................57
4.3.7 VoIP connections.....................................................................59
4.3.8 PROFINET-IO connections......................................................61
manual TINA / ProfiNet-WATCHDOG V1.08 page 2
Page 3

4.3.9 application protocols................................................................62
4.3.10 save recording........................................................................64
4.3.11 open recording.......................................................................64
4.3.12 IP changer..............................................................................66
4.3.13 network monitoring.................................................................68
4.4 page network scan.........................................................................78
4.5 page network tools.........................................................................81
4.5.1 resolve IP to MAC....................................................................82
4.5.2 ping..........................................................................................83
4.5.3 traceroute.................................................................................83
4.5.4 resolve NetBIOS name............................................................83
4.5.5 determine NetBIOS name........................................................83
4.5.6 resolve LLMNR name..............................................................83
4.5.7 determine LLMNR name..........................................................83
4.5.8 resolve DNS name...................................................................84
4.5.9 determine DNS name...............................................................84
4.5.10 Wake On LAN - MAC.............................................................84
4.5.11 Wake On LAN - IP..................................................................84
4.6 page DHCP clients.........................................................................85
4.7 page configuration.........................................................................89
4.7.1 system......................................................................................90
4.7.2 access protection.....................................................................91
4.7.3 general.....................................................................................93
4.7.4 LAN-A settings.........................................................................94
4.7.5 WLAN settings.........................................................................95
4.7.6 USB-LAN settings....................................................................98
4.7.7 FTP settings.............................................................................99
4.7.8 SMTP settings........................................................................100
4.7.9 Bridge settings.......................................................................102
4.8 page firmware update..................................................................105
page 3 manual TINA / ProfiNet-WATCHDOG V1.08
Page 4

5 Technical data...................................................................................107
5.1 TINA.............................................................................................107
5.2 ProfiNet-WATCHDOG..................................................................107
manual TINA / ProfiNet-WATCHDOG V1.08 page 4
Page 5

1 General
1.1 About the manual
This manual describes the devices TINA (shortcut for German version of
„mobile intelligent network-analyser“) and ProfiNet-WATCHDOG, named
as device or analyzer (device) in the following pages.
This documentation can be downloaded on the web page of the product
via downloads documentation.
The manual are aimed to the following user groups:
• planners
• operators
• commissioning staff
• service and maintenance staff
Before you use this device, you should read the manual.
If you have questions and / or problems you can contact the technical
support from your dealer.
page 5 manual TINA / ProfiNet-WATCHDOG V1.08
Page 6

1.2 Requirements to the user
The product / system which belongs to this manual should only be used
from qualified staff, which should respect this documentation and the in
this documentation included safety and warn notes.
Qualified staff has the possibilities due their education and experience to
detect risks and possible dangers. Further they have knowledge for the
correct connection of the device.
1.3 Use for intended purpose
The devices are constructed for the mounting and usage in
weatherproofed indoor places.
The operating conditions which are named in this documentation have to
be followed. The operation of the device outside its specification can
affect the safety which is given by the device from default.
Important:
The TINA devices are able to change the network traffic between the
interfaces. Please make sure that an enabled function on the device
doesn't affect the function of your network.
1.4 Particularities
Attention: Avoid condensation!
Sudden temperature fluctuations can cause an condensation. A
condensation can affect the function of the device. In such a case you
should store the device at least 2 hours at the usage place before you
use it.
manual TINA / ProfiNet-WATCHDOG V1.08 page 6
Page 7

2 System requirements
2.1 Software
For using and configuring the analyzer device you need the following
tools and software's:
• internet browser (e. g. Microsoft Internet Explorer, Mozilla Firefox
or Google Chrome)
Using the device is independent of your operating system and browser
from your computer, tablet or mobile phone.
Important:
For viewing the website correctly you should check that JavaScript
isn't disabled in your browser.
2.2 Hardware
For the commissioning and usage of the device you need the following
hardware components beside the analyzer itself:
• device with a WLAN interface (for accessing the device via WLAN)
• 24VDC power supply over detachable connector or USB power
supply from PC / Power-Pack
• 2 x Ethernet cables (LAN)
page 7 manual TINA / ProfiNet-WATCHDOG V1.08
Page 8

3 Commissioning
The device has one WLAN interface and two LAN interfaces. The WLAN
interface is used that you can connect your PC, tablet or mobile phone
with the device. The LAN interfaces are used for the network analyzing.
Hint:
On the TINA devices it is also possible to connect to the web server
via the LAN-A interface.
If you can't or don't want to use the WLAN interface you have the option
to expand your device with a third LAN interface by an “Ethernet over
USB” adapter. This interface then can by used to access the web server.
Please contact your dealer if you're interested.
Important:
This chapter describes the factory default of the device. Via the
configuration other configuration combinations (e. g. a bridge
between LAN to WLAN) are possible.
3.1 Web server access
The TINA device (and it's web server) can be accessed by either using
the WLAN or LAN-A interface.
The ProfiNet-WATCHDOG device (and it's web server) can be accessed
by using the WLAN interface only.
If you have the “Ethernet over USB” adapter you can also use that do
access the web server of the device. The adapter can be used on both
device types.
manual TINA / ProfiNet-WATCHDOG V1.08 page 8
Page 9

3.1.1 Access via WLAN
If you want to use the WLAN interface, please make sure the WLAN
interface on you PC, tablet or mobile phone is enabled and open the list
of available WLAN networks.
In the list of the available WLAN networks you should see a network with
the SSID “TINA WiFi” or “ProfiNet-WATCHDOG WiFi” (depending on the
device type). The network is not encrypted and so you can connect to it
without a password.
On the devices a DHCP server on the WLAN interface is running by
default. If the device from where you want to access the device is
configured as DHCP client you don't have to change any setting. If your
device has an fixed IP address you have to either change your setting to
DHCP client or change your IP address so it matches the subnet
192.168.1.0/24 (IP addresses from 192.168.1.1 to 192.168.1.254). The
IP address 192.168.1.1 can't be used, because it is the address used by
the analyzer itself.
3.1.2 Access via LAN
For using the LAN interface you have to connect the LAN-A interface of
the analyzer device with a LAN cable to the network socket of your
computer.
On the LAN-A interface no DHCP server is running by default. This
means that you have to open the network settings of the network card
from your PC and navigate to the IP settings. In the IP settings dialog
you have to configure a fixed IP address from the subnet 192.168.2.0/24
(addresses from 192.168.2.1 to 192.168.2.254). The IP address
192.168.2.1 is already in use by the analyzer and can't be used for your
computer.
Important:
Accessing the device by the LAN-A interface can be used for TINA
devices only.
page 9 manual TINA / ProfiNet-WATCHDOG V1.08
Page 10

3.1.3 Access via USB-LAN
If you have bought the “Ethernet over USB” adapter accessing the
device with this interface is also possible. First you have to connect the
adapter to your device. In the next step you need a network cable and
connect your PC or switch and the adapter with each other.
On factory default a DHCP server on the USB-LAN interface is enabled.
This DHCP server assigns IP addresses to devices which are requesting
an address. If your computer is configured in DHCP mode (default
setting) you don't have to do anything else. Otherwise open the settings
of your network card and enable DHCP mode or manually set an IP
address from the subnet 192.168.0.1/24 (addresses from 192.168.0.1 to
192.168.0.254). The address 192.168.0.1 is reserved because it's used
by the adapter itself.
manual TINA / ProfiNet-WATCHDOG V1.08 page 10
Page 11
3.1.4 Web interface
After you are connected to the device physically you can open a web
browser on your PC, tablet or mobile phone. There you have to enter the
IP address 192.168.1.1 (for access via WLAN), 192.168.2.1 (for access
via LAN-A) or 192.168.0.1 (for access via USB-LAN) in the address line.
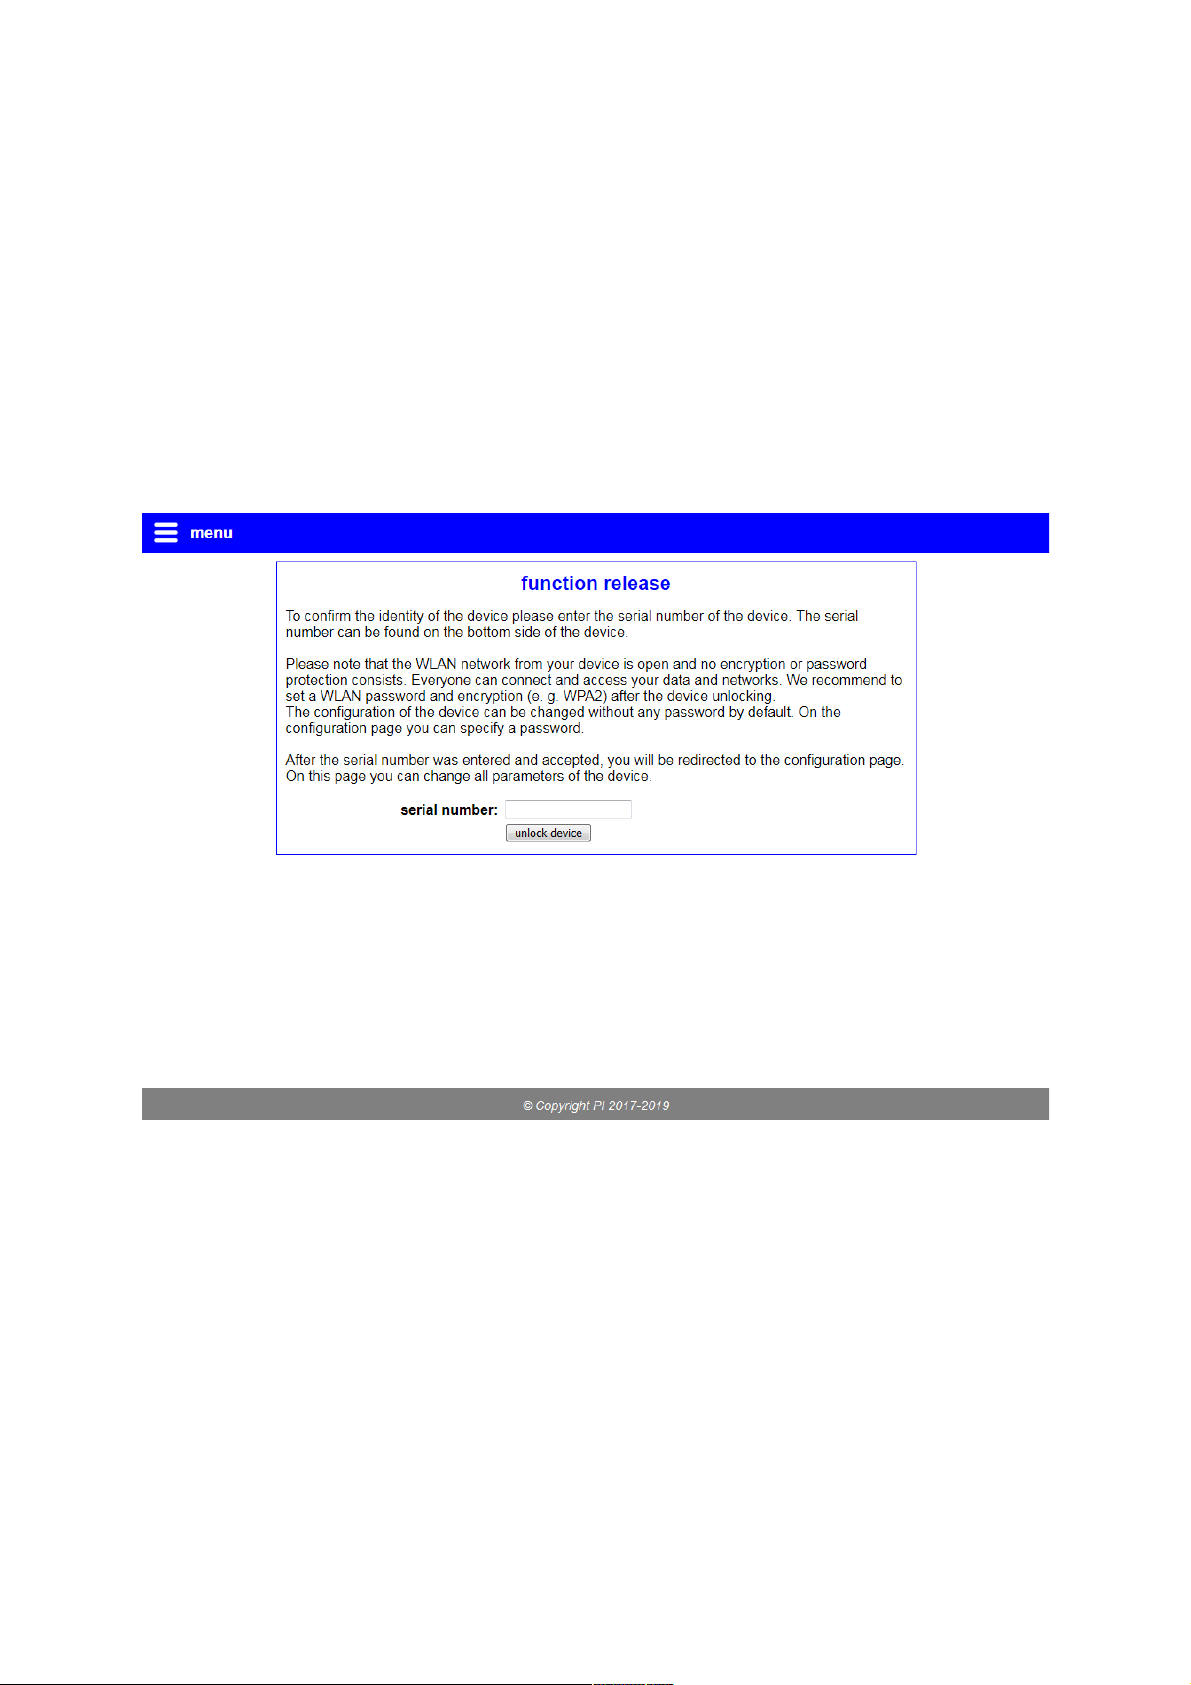
At the first use of the device you will see a dialog with some hints and an
input field for the serial number. In this field you have to enter the serial
number of the device (the number can be found on the bottom or right
side of the device) and click on the button “unlock device”:
If the input is correct the device is unlocked and can be used normally.
After the unlocking you will be redirected to the configuration page of the
device (see also web server → configuration). The function release have
to be done only once of course.
Important:
The function release is a security mechanism of the device to
protect your network data. The reason therefore is that everyone,
which is within the WLAN range of the device, can connect to it
without a password.
page 11 manual TINA / ProfiNet-WATCHDOG V1.08
Page 12

3.2 Bridge interfaces
The analyzer has the possibility to analyze the network traffic. Therefore
the device has two LAN interfaces which are operating similar to a
network bridge. This means all frames which are received on interface A
are sent out on interface B and the other way around. If settings are set
through which the device should change network frames the frame which
was received on the first interface is different from the frame which is
send on the second interface.
If you e. g. have problems with the communication between two
participants, just connect the first participant with a LAN cable to the first
interface and the second participant with another LAN cable to the
second interface of your analyzer. Thereby the complete communication
is lead through the device.
On the web server you can now analyze the communication between the
two (or more) devices and find the cause of the communication problem
easily.
Hint:
Both LAN interfaces are supporting the automatically switching of
the send and receive line pair (auto MDIX). Thus you can use a 1:1
occupied or a crossed network cable.
Important:
The ProfiNet-WACHTDOG can't change the network traffic between
the interfaces or actively sent data by itself. Thereby the RealTime
management isn't disturbed.
manual TINA / ProfiNet-WATCHDOG V1.08 page 12
Page 13

3.3 User interaction
The device has some status LEDs on the front size of the device. The
LEDs have the following meanings:
• ON: lights if the device is powered
• Wi: lights on active WLAN and blinks on data transfer
• S1: currently not in use
• S2: currently not in use
• S3: currently not in use
• S4: currently not in use
• LAN A: lights if the link state on interface A is active and blinks on
data transfer
• LAN B: lights if the link state on interface B is active and blinks on
data transfer
Furthermore the device has two buttons on the right side (for devices
with desktop cases) or bottom side (for devices with clamping cases).
The buttons are used as follows:
• FS: button for applying factory defaults
• T: currently not in use
3.3.1 factory defaults
If you want to restore your device to the factory defaults you have to
press the “FS” button for at least 3 seconds. For pressing the button you
can use a paperclip.
If you have pressed the button for at least 3 seconds and released it
again the factory defaults gets loaded into the device. Now your device
executes a restart and can be accessed after about 30 seconds via the
default settings as described in this chapter.
page 13 manual TINA / ProfiNet-WATCHDOG V1.08
Page 14
4 web server
The complete operation of the device (display and parameterization) can
be done via the integrated web server which is available over the WLAN
and / or LAN-A interface of the device as well as the optionally USB-LAN
interface (via adapter), depending on the configuration.
The surface of all web pages consists of a
header, a footer and a big content area. Thus
on all web pages are much space for the real
content. This is very helpful on devices with
small resolutions or monitor sizes (e. g. smart
phones).
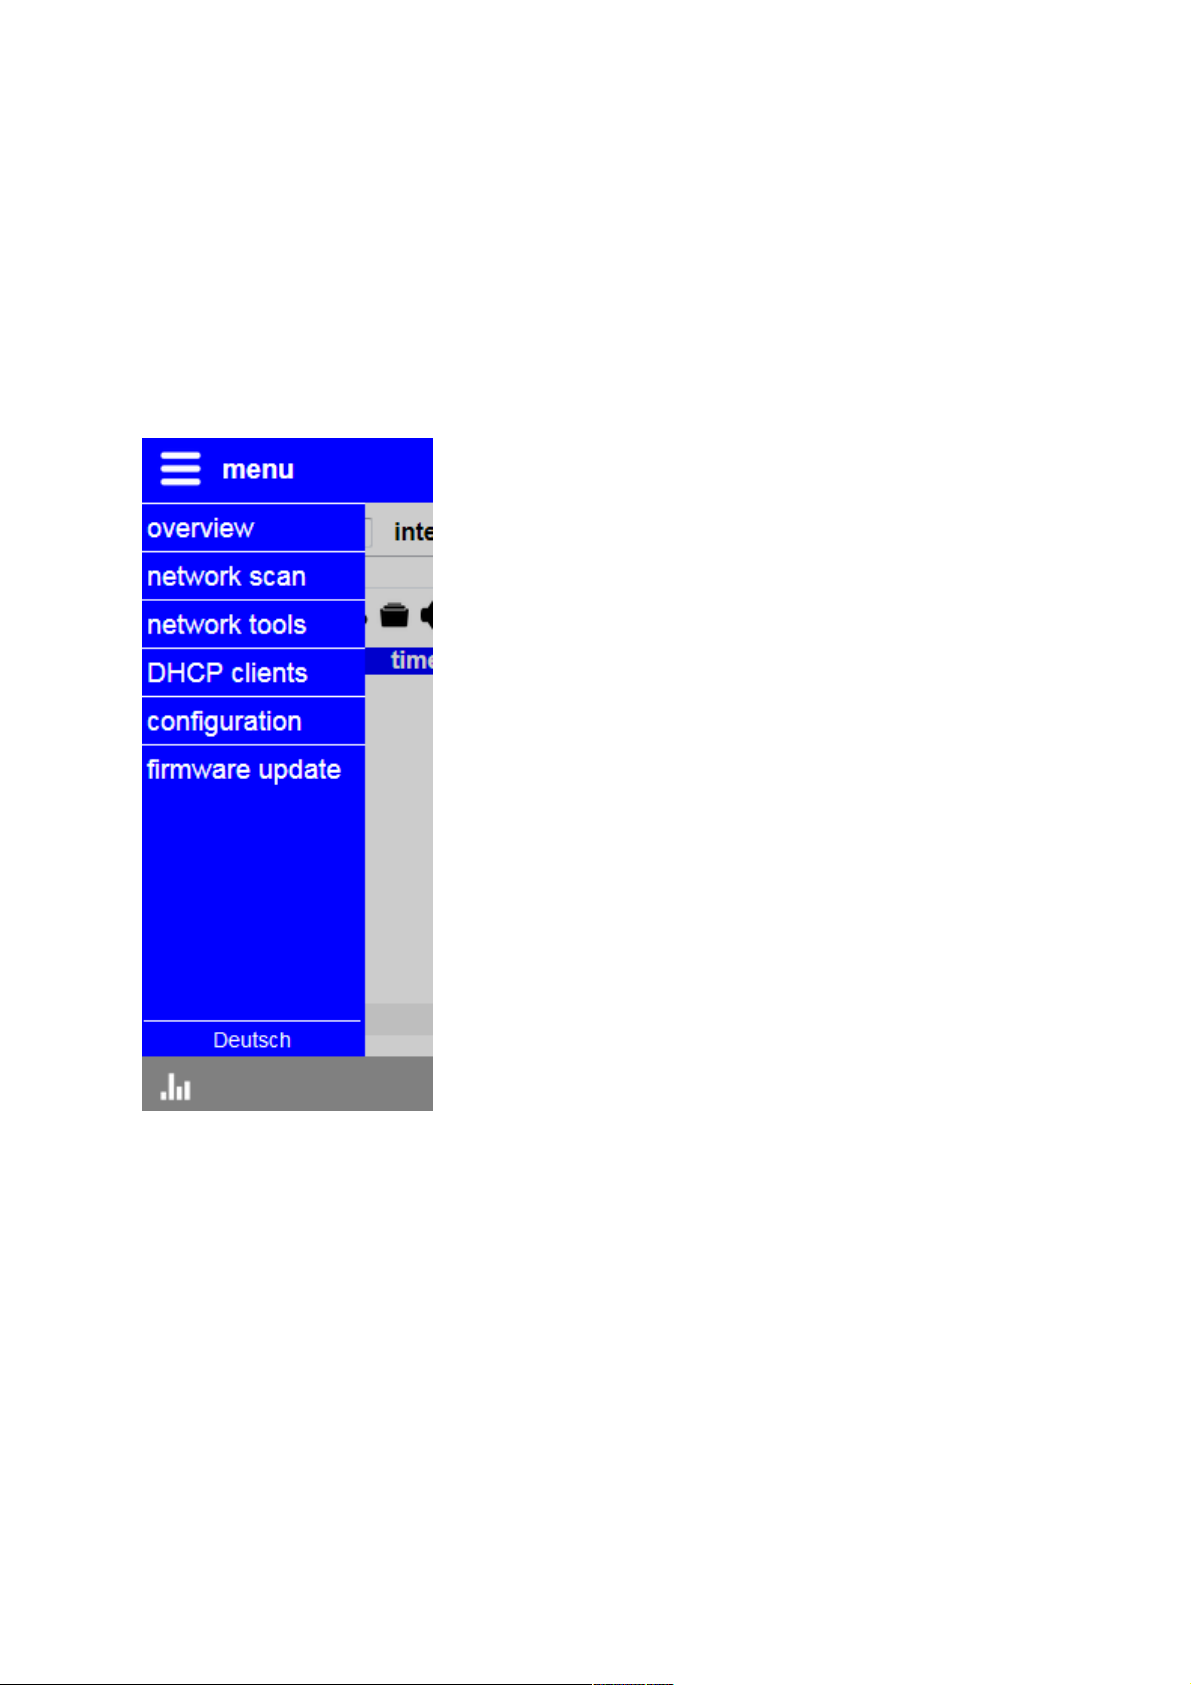
If you want to show the navigation bar you have
to click on the icon or the text “menu” on the top
left corner. With the same method you can hide
the menu. The single pages which belongs to
the menu entries will be described in this
chapter of the manual.
If a password is set in the configuration of the
device and if you are currently logged in, a
menu item with the name “log out” is shown as
last entry in the menu. This entry can be used to
log out of the device again.
The language of all surfaces can be changed
between German and English in the menu on the bottom of the
navigation.
manual TINA / ProfiNet-WATCHDOG V1.08 page 14
Page 15

4.1 access protection
Because the analyzer is able to analyze and change the network traffic
which is directed through the device whereby it has access to sensible
data and could affect the function of the network it is possible and
recommended to protect the device with a password. By configuring a
password you can prevent that unauthorized people can monitor or
disturb your network.
The following table shows which passwords can be configured and for
which pages they are needed:
page password description
overview view analyzing, monitoring and
controlling of the network traffic
network scan tool active analyzing and controlling
of the network and executing test
functions
network tools
DHCP clients
configuration config viewing and changing the
configuration (also passwords)
as well as updating the firmware
firmware update
The configuration of the passwords can be done on the page
“configuration”. If an empty password is specified, as it is the case on
factory defaults, a log in (and log out) isn't needed. The pages can then
be accessed directly.
If you access a page which is protected via a password you will see the
following log in page:
page 15 manual TINA / ProfiNet-WATCHDOG V1.08
Page 16
After you have entered the password and clicked on “log in” you will be
redirected to the page, which was requested before.
If you have e. g. successfully logged in for the page “overview” with the
view password and click on the menu entry “configuration” (which is also
password protected) you will see the log in page again. Now you should
enter the config password. Your log in to the page “overview” remains.
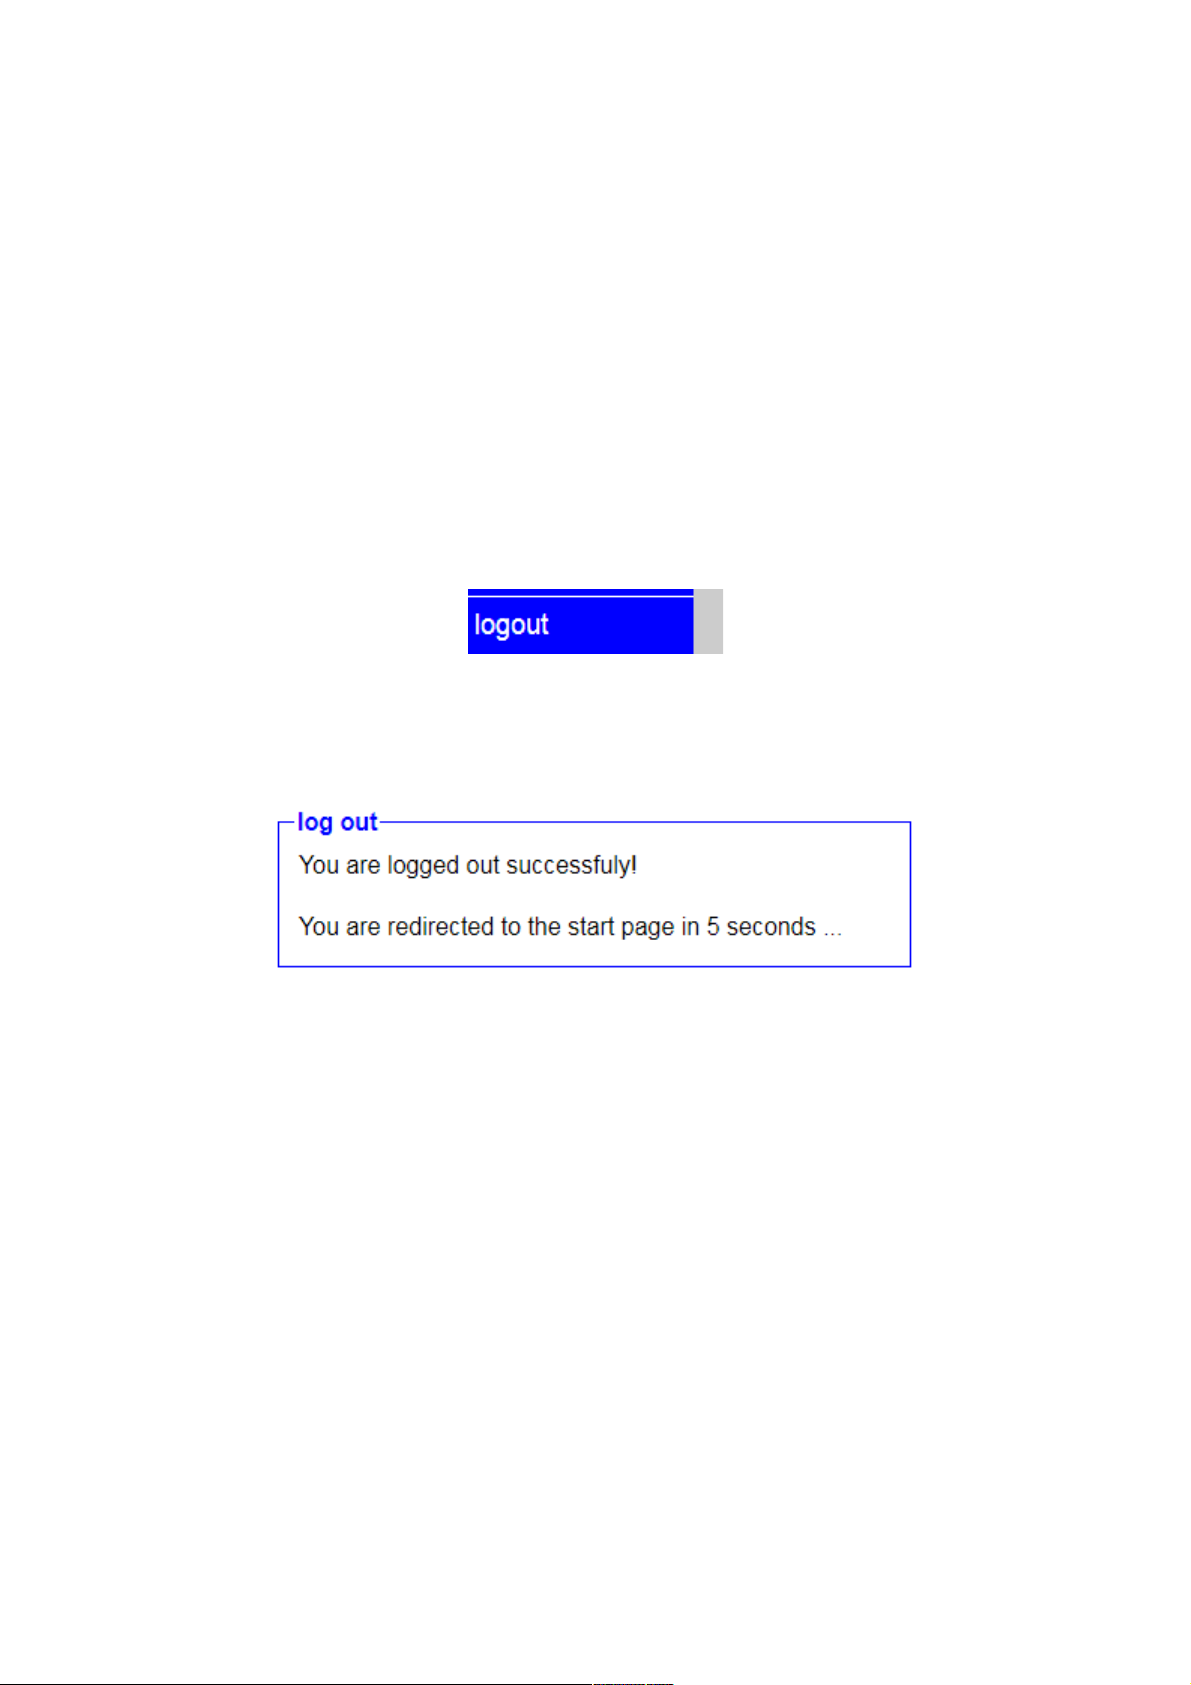
Because of security reasons we recommend to log out of the device after
you have finished your work. Therefore you will see the menu entry “log
out” on the menu:
After you have clicked on the menu entry you will see the following
message and will be redirected to the start page after 5 seconds:
Hint:
If you have done a firmware update or restart no log out can be
done, because through the restart all users are getting logged out
automatically.
Important:
In the factory defaults no passwords are specified. Thus everyone
who can connect to the device can analyze and change your
network data, execute tools and view and change the configuration
of the device.
manual TINA / ProfiNet-WATCHDOG V1.08 page 16
Page 17
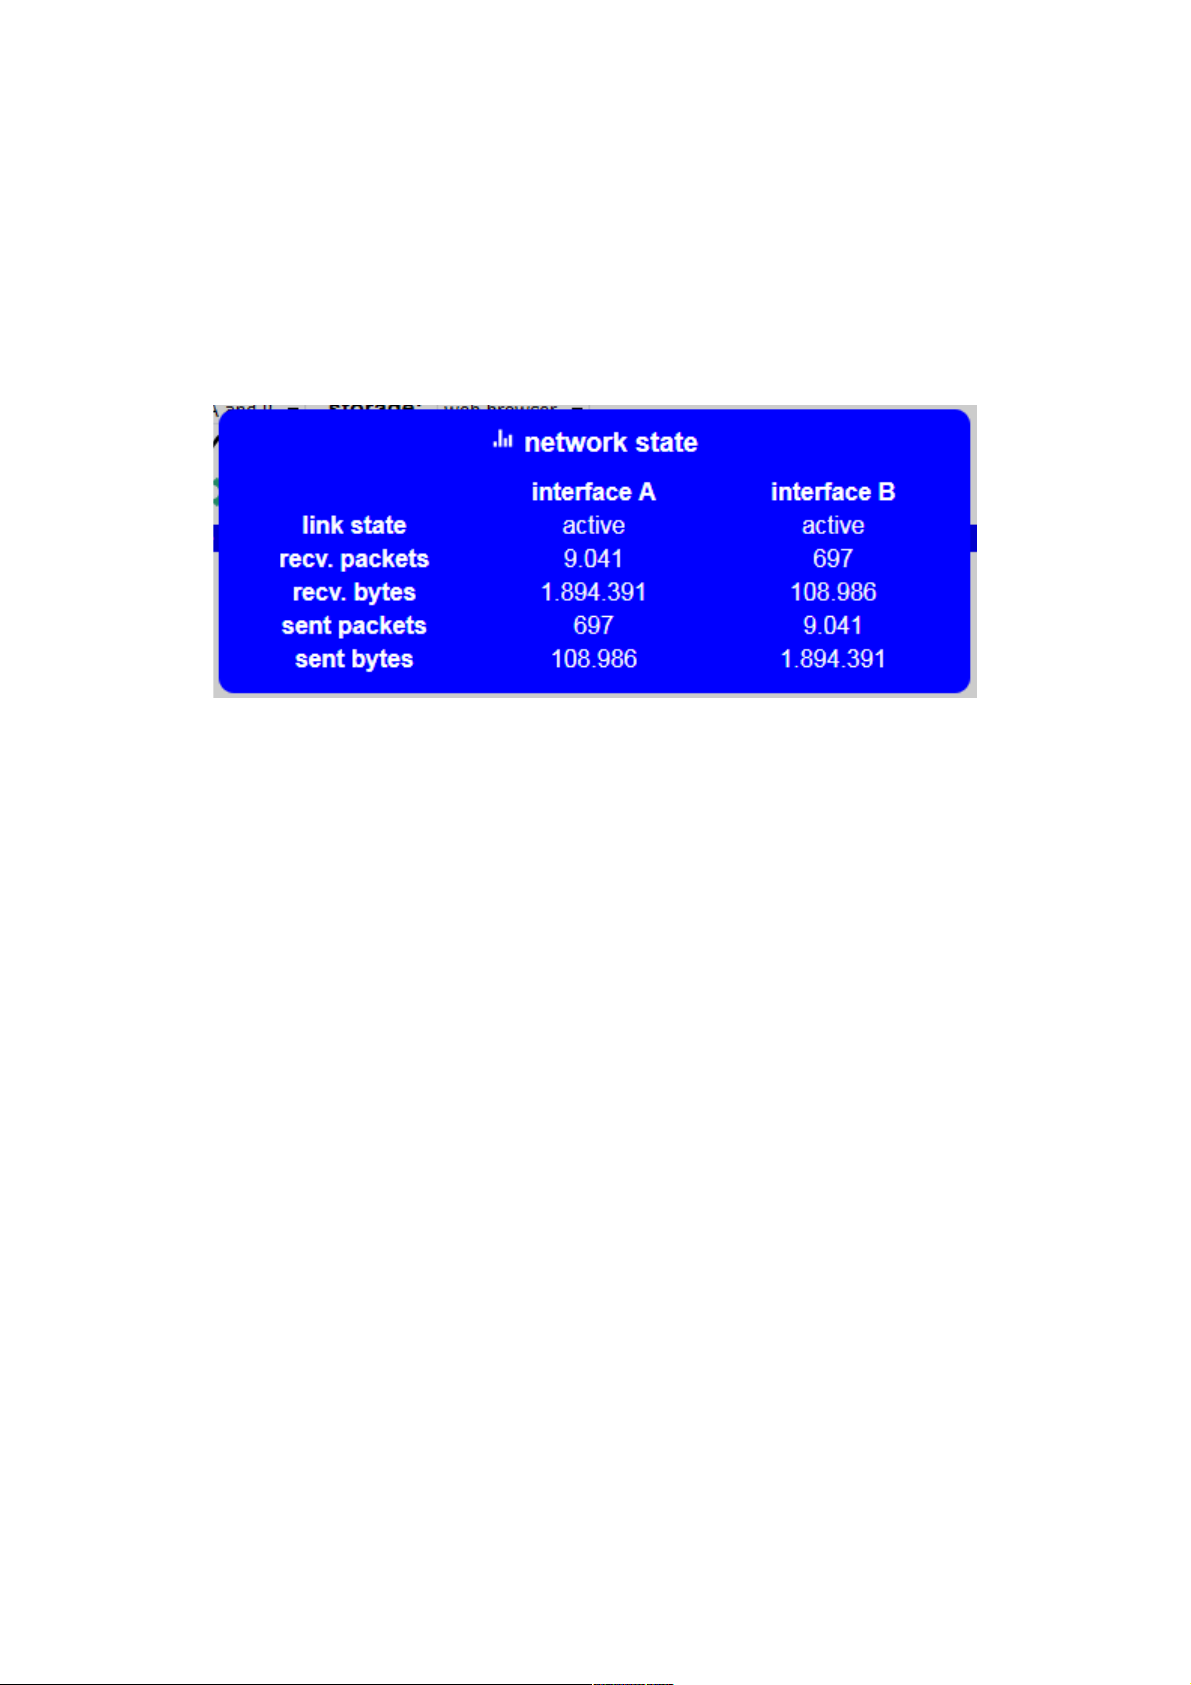
4.2 status view
On the footer of the web pages (on all pages which are used for
analyzing and controlling the network traffic) you will see a bar chart icon
on the bottom left corner which can be used to show the network state.
If you have clicked on the icon the following dialog appears who is
refreshed every 5 seconds:
The following information will be shown as table and thereby separated
for interface A and interface B:
• link state: Indicates if the link state is active or not.
• recv. packets: Number of received packets.
• recv. bytes: Amount of received bytes.
• sent packets: Number of sent packets.
• sent bytes: Amount of sent bytes.
If the device detects an error (e. g. error while sending an e-mail) or the
connection to the device is broken, a red warn symbol is shown on the
bottom right corner in the footer. By clicking on the symbol the occurred
error(s) will be shown.
page 17 manual TINA / ProfiNet-WATCHDOG V1.08
Page 18
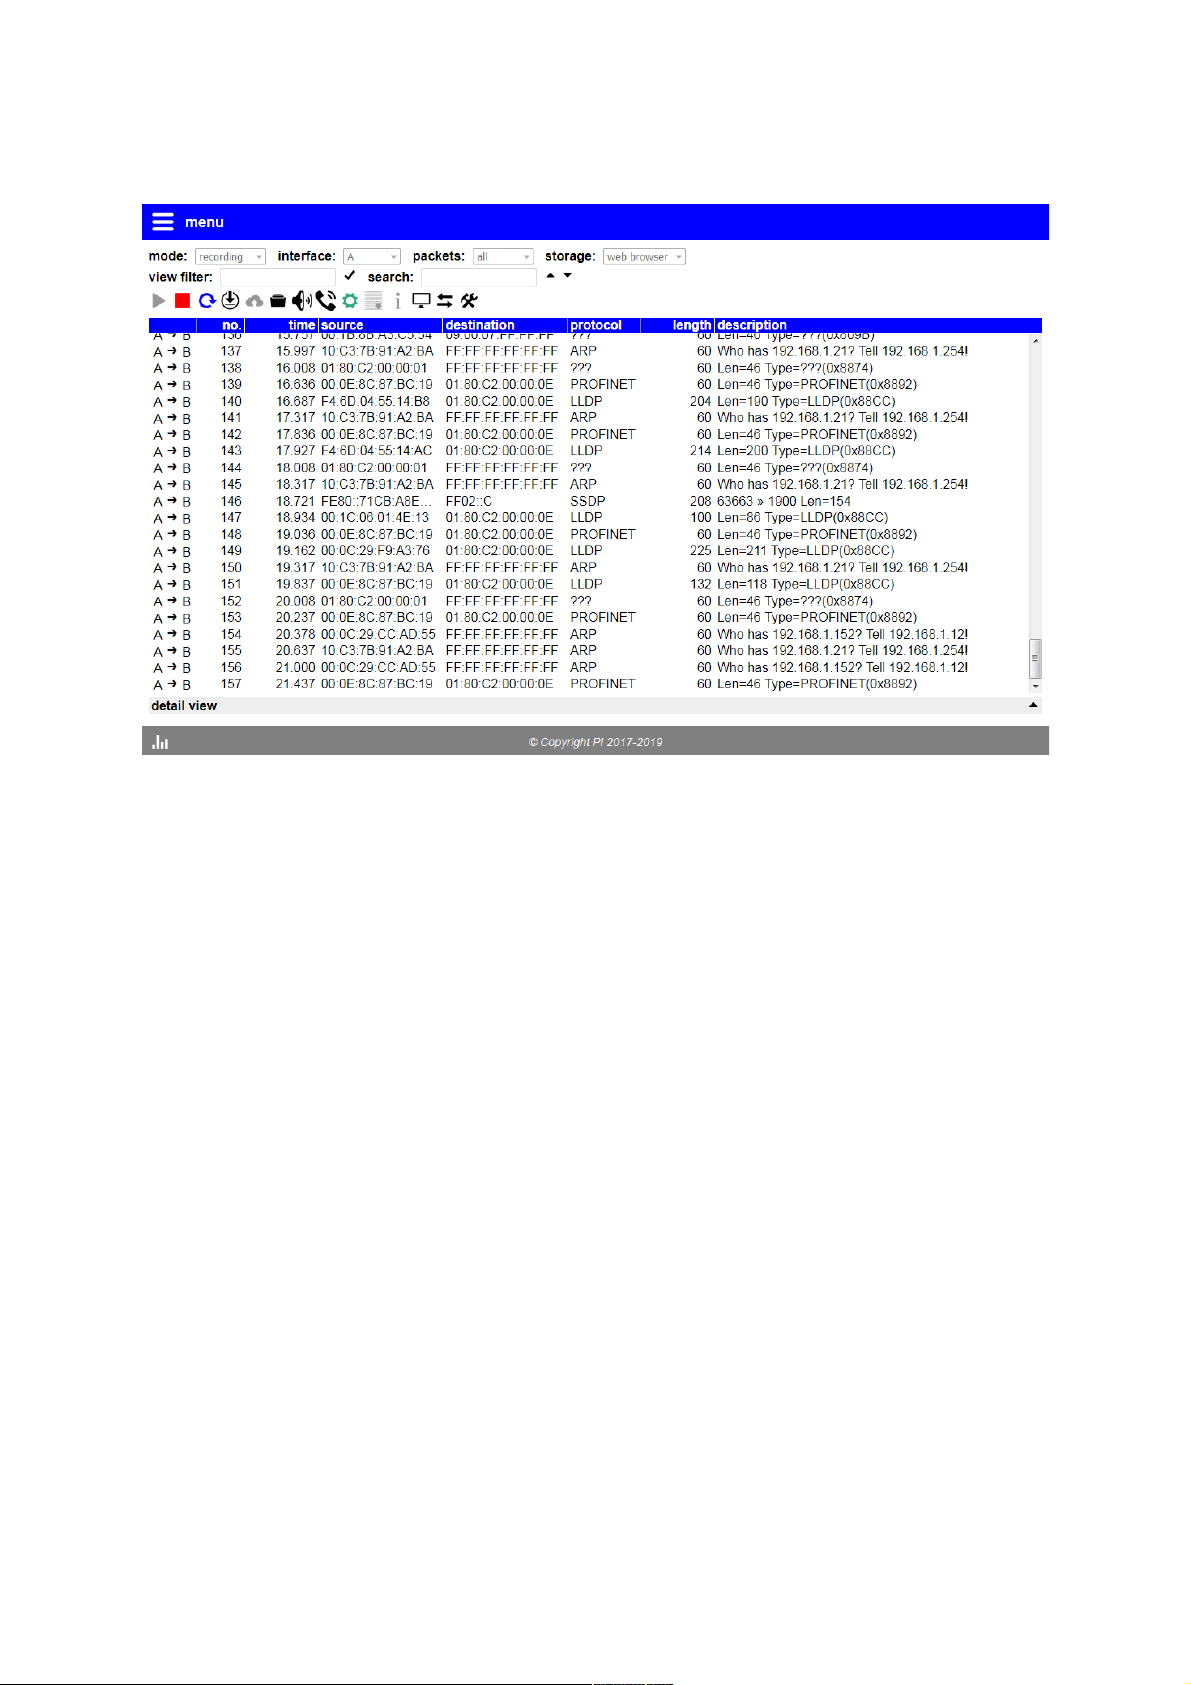
4.3 page overview
The page “overview” is the most important and powerful page of the
analyzer. Here you can analyze, monitor and control the network traffic.
The main function of the page is the recording of the network traffic,
which flows between the bridge interfaces. This data can then be
analyzed in the browser directly.
Before you can start a recording you have to set some settings.
Firstly you have to select the “mode” where you can select between
“recording” and “monitoring”. The mode “recording” can be used for
recording of the complete or of parts of the network traffic which flows
through the bridge and is the default option. The mode “monitoring” can
be used to record only frames who are evaluated as burglaries
(addresses which aren't learned in) of the network monitor.
On the next step you have to select the interface and the packet type
which should be recorded. With the option “A and B” both interfaces are
respected. The same applies to the packet type “all” which will record ingoing and out-going frames. With this two settings you can configure
your recording as you like. In the mode “monitoring” you should select
the interface “A and B”. Thereby burglaries of both interfaces get
respected.
manual TINA / ProfiNet-WATCHDOG V1.08 page 18
Page 19
As the last step it is necessary to specify where do you want to view or
store the recorded traffic”. You can select between “web browser”, “FTP
server” and “USB stick” with the help of the selection list “storage”. The
usage of the FTP server recording requires a completed configuration of
the FTP server on the configuration page (see also chapter web server
→ configuration → FTP server). If you want to record to a USB stick you
have to plug in the stick before you start the recording. After you have
finished your recording you can plug out the USB stick.
Hint:
The USB stick have to be formatted in a FAT file system to use it
with the device.
Important:
Don't plug out the USB stick while a recording is running.
Otherwise your file and file system could get corrupted.
If you want to start recording you just have to click on the symbol .
After a recording is started you can stop it with a click on the symbol.
Alternatively you can restart a recording / reset the view via clicking on
the symbol (only possible for web browser recordings).
A helpful feature is the automatically scrolling which can be enabled by
clicking on the icon . If the scrolling is enabled and a new frame arrives
the recording table will scroll down to the bottom of the table. The
scrolling function can be disabled by clicking on the icon .
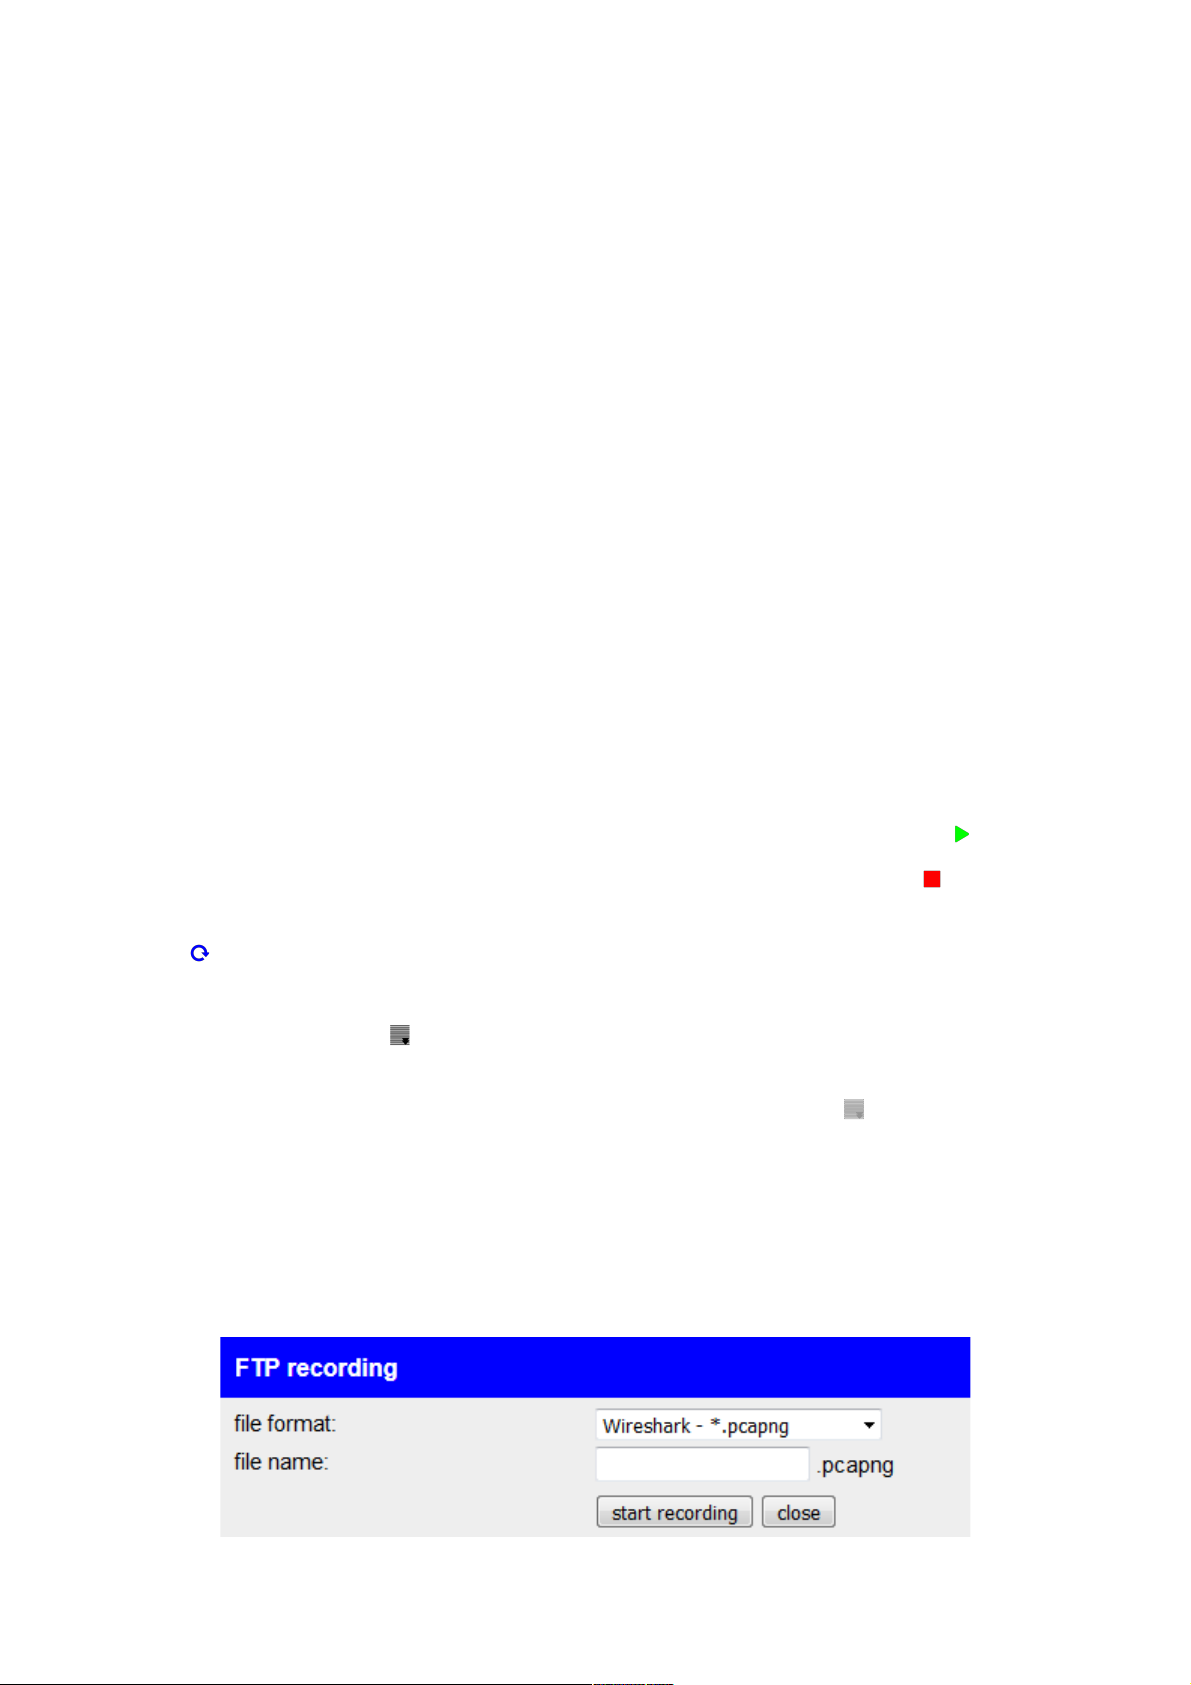
If you start a recording to the FTP server or USB stick you will get a popup window. In this window you have to specify the file format (currently
only the Wireshark file formats .pcapng and .pcap are available) and a
file name (without the extension):
page 19 manual TINA / ProfiNet-WATCHDOG V1.08
Page 20
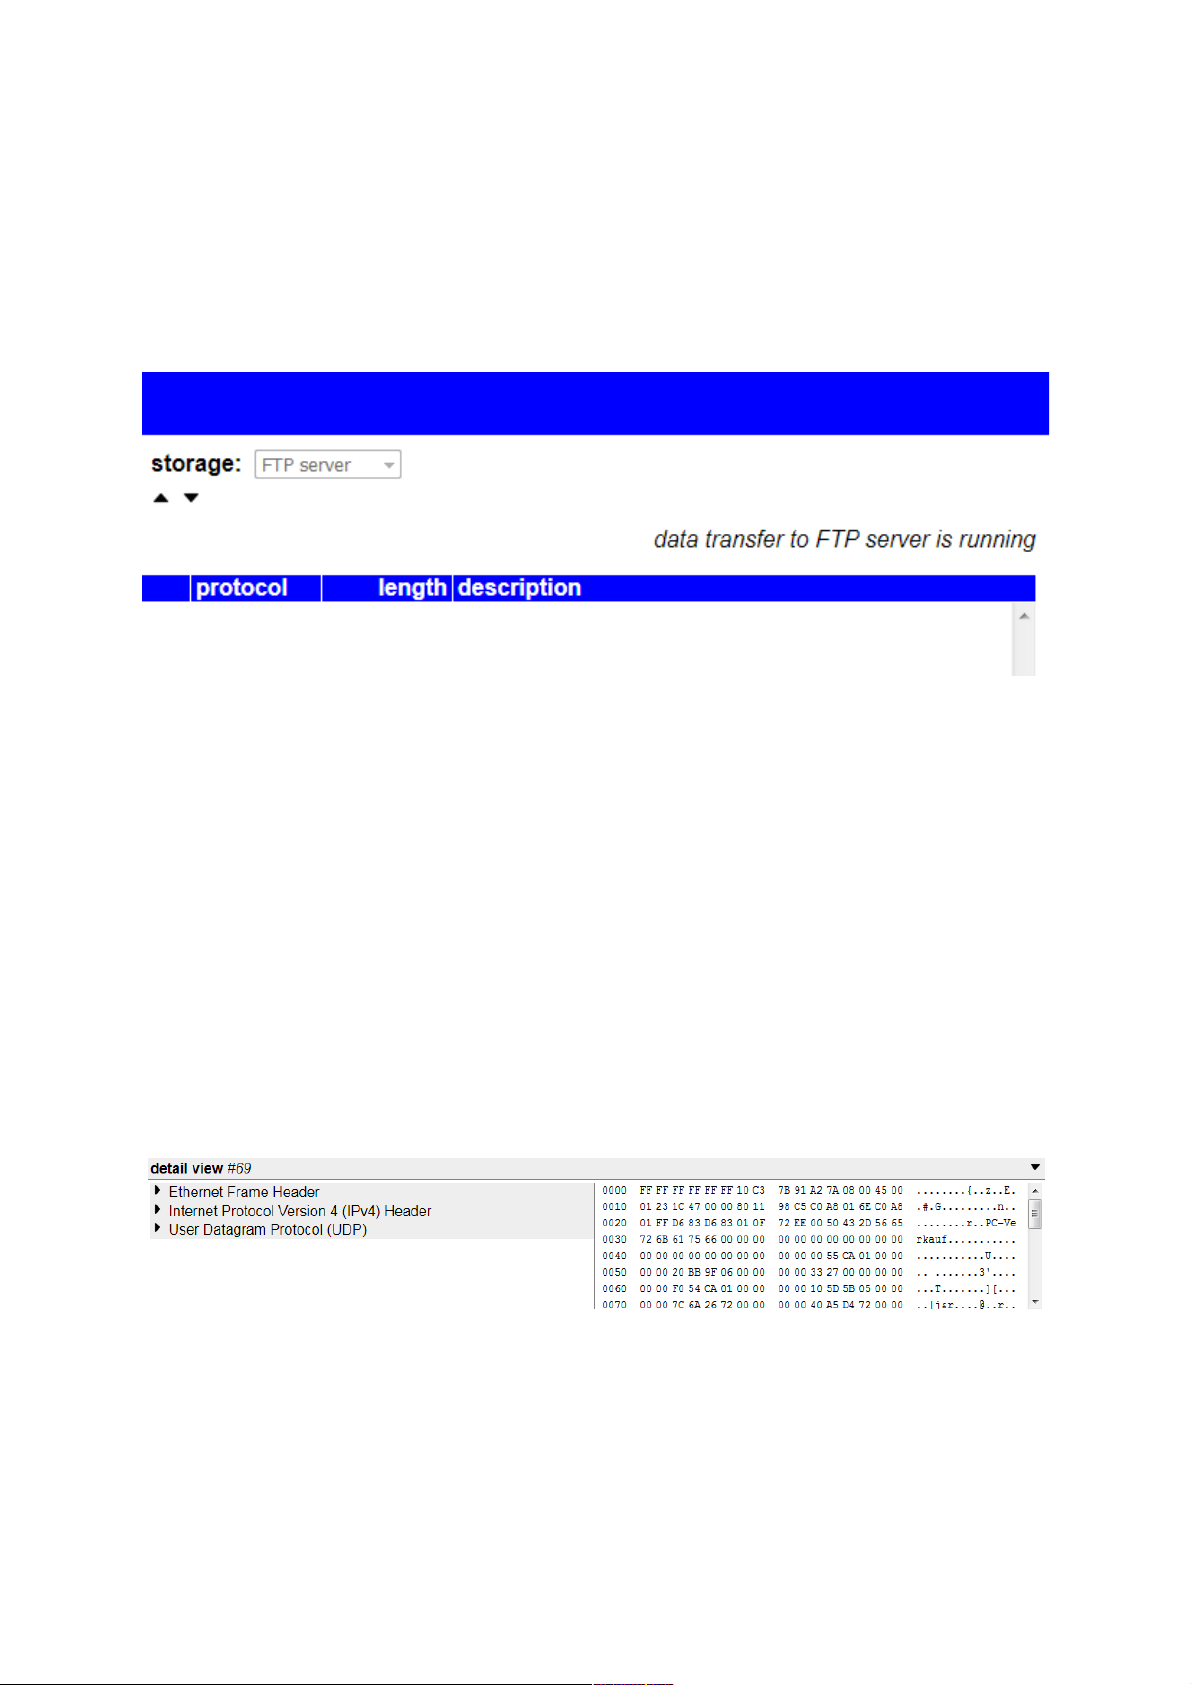
If a FTP server or USB stick recording is running the frames will not
appear in the frame table in the browser, because they are sent directly
to the server or written to the stick. To check if a FTP or USB recording is
running successfully or which error has occurred on the last transfer (if
applicable) you can look at the status view on the top right corner (same
height as the toolbar with the icons):
4.3.1 detail view
The recording table shows only the transfer direction, an ongoing
number, the time, the source address and the destination address of a
frame. If the window has enough width the protocol, the length and a
description is also shown.
For a detailed view or analyze this information is not enough. Thus the
recording page contains a detail view. The detail view of a frame can be
opened by clicking on a frame in the table. Now you should see
something similar to the following:
On the left side you can see the analyzed data of the frame in textual
form. The right side shows the raw data (bytes) of the frame. If your
monitor has a small width the two windows will be shown among
themselves.
manual TINA / ProfiNet-WATCHDOG V1.08 page 20
Page 21
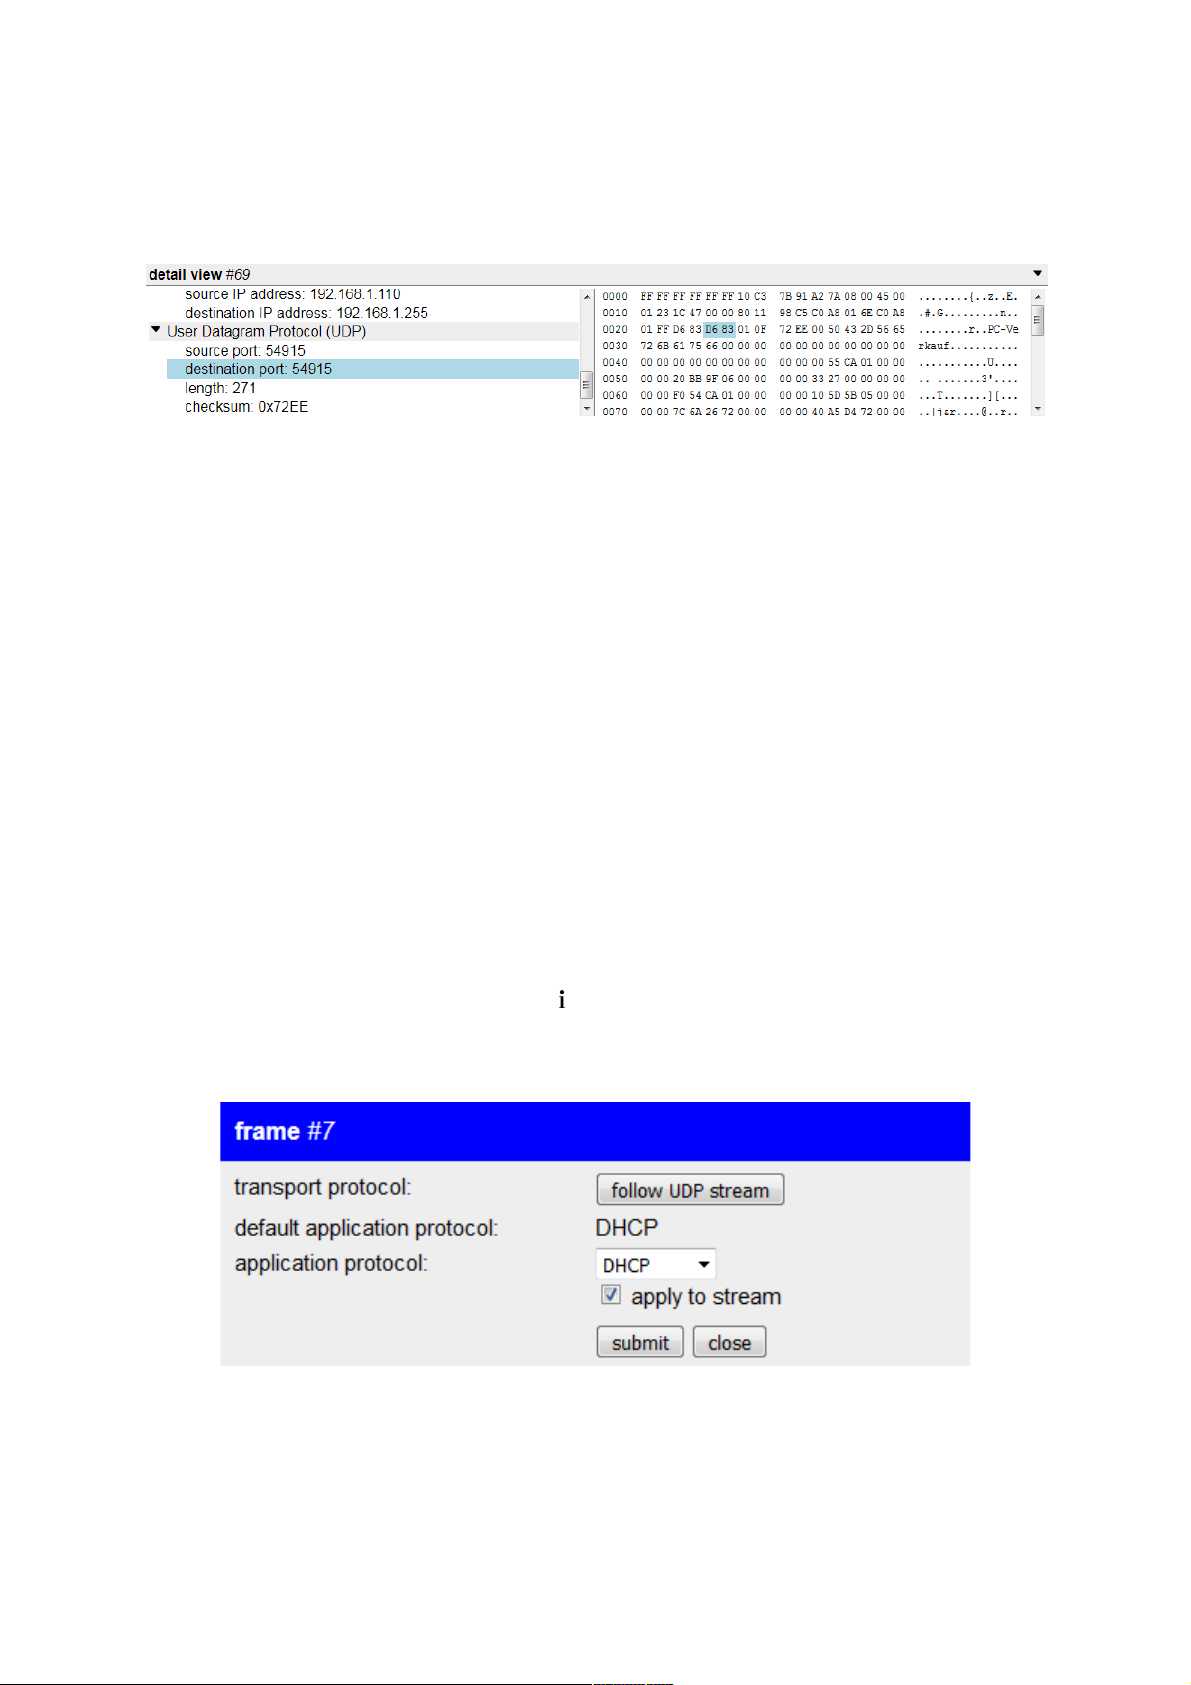
Both the entries in the text view and the bytes in the raw view can be
clicked. An selected entry and the corresponding raw data or entry in the
text view will be highlighted with a blue color automatically:
Hint:
Entries in the text view which have sub entries are getting
automatically unfolded if you click on them.
4.3.2 frame information and settings
Every frame has some additional information and settings which are not
shown within the frame table or the detail view, because they doesn't
belong to the data of the frame directly.
If you want to open the view for information and settings of a single
frame you have to click on the entry on the frame table. Thereby the
entry get's colored in light blue and maybe the detail view get's opened
too. Now you can click on the symbol, which can be found on the
toolbar which is located above the frame table. Next you should see a
dialog similar to the following:
Each line has it's own meaning:
transport protocol: If the frame is a TCP or UDP frame a button
will appear, which allows you to set a view
filter. This view filter will affect that only
page 21 manual TINA / ProfiNet-WATCHDOG V1.08
Page 22

frames which belong to the same TCP or
UDP stream will be shown.
default application protocol: The application protocol (if available) as
which the frame would be analyzed by
default.
application protocol: Here you can choose as which application
protocol the frame should be analyzed. If the
checkbox “apply to stream” is checked this
setting will also affect all frames which
belong to the same TCP or UDP stream.
If you have changed the application protocol of the frame you have to
click on the button “submit” to reanalyze the frame or maybe the
complete stream.
manual TINA / ProfiNet-WATCHDOG V1.08 page 22
Page 23
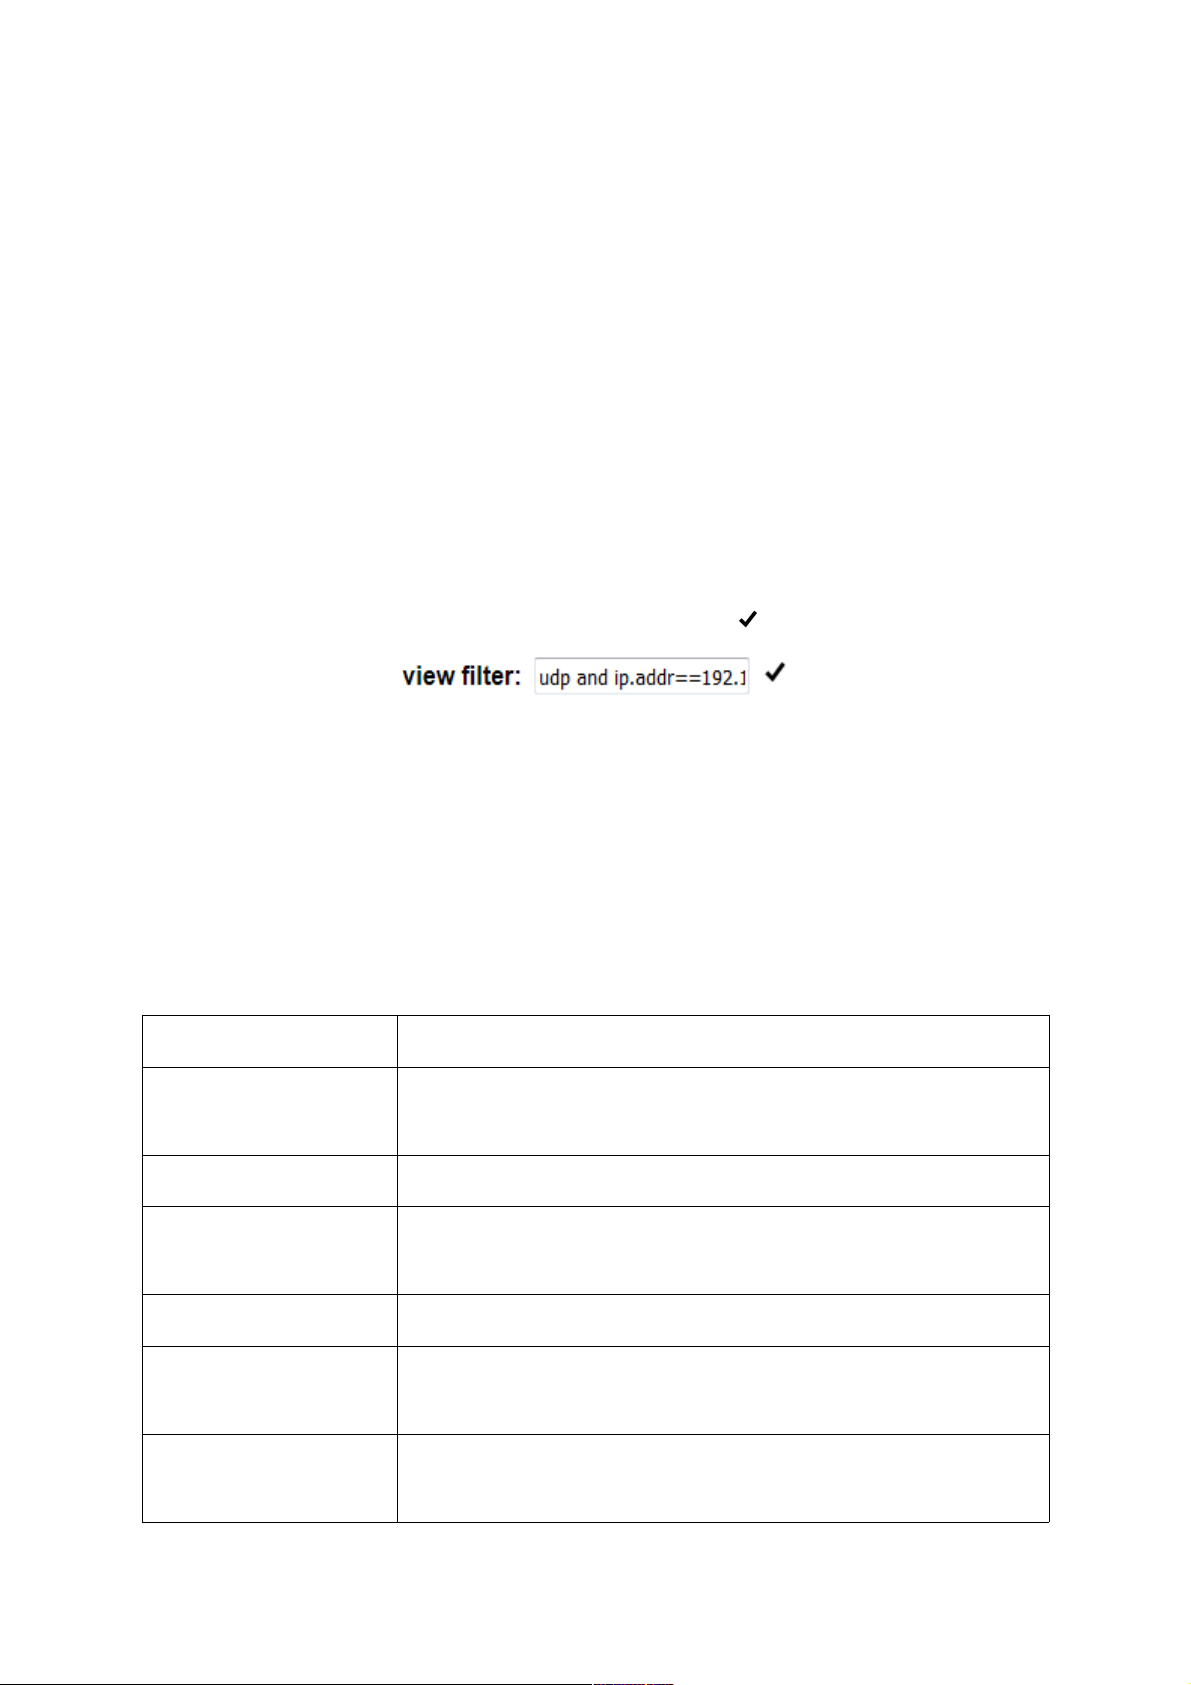
4.3.3 view filter
If you want to filter the viewed record data (e. g. to show only frames with
a specific IP address, port or protocol) you have the possibility to set a
view filter. The view filter is a string which consists of one or more
conditions.
Important:
The view filter only affects the view in the browser. The device
always records everything.
To submit the view filter you have to press the return key (only possible if
the focus is on the text field) or click on the icon behind the text field.
Hint:
The inputs and commands for the the view filter are largely
compatible with them from the program Wireshark.
For the data fields (see table on next page) between the following data
types a distinction is made:
name description
- fields without a data type can be checked for
existence only
truth value y for true; n for false
number numeric value (hexadecimal with 0x, octal with 0,
binary with 0b or decimal)
string a string; as well as DNS names or NBNS names
MAC address a MAC address; address blocks at the end can be
omitted
IPv4 address a IPv4 address; address blocks at the end can be
omitted
page 23 manual TINA / ProfiNet-WATCHDOG V1.08
Page 24

name description
IPv6 address a IPv6 address; shortened with :: allowed; address
blocks at the end can be omitted
The following fields can be checked via the view filter:
name data type description
eth - Ethernet header
eth.dst MAC address destination MAC address
eth.src MAC address source MAC address
eth.vlan.tpid number VLAN protocol ID
eth.vlan.prio number VLAN priority
eth.vlan.cfi truth value VLAN DEI-/CFI bit
eth.vlan.id number VLAN ID
eth.type number Ethernet type
eth.len number frame length
llc - LLC header
llc.dsap number destination SAP
llc.ssap number source SAP
llc.control number control value
llc.snap - SNAP extension header
llc.snap.oui number manufacturer ID
llc.snap.vlan.tpid number VLAN protocol ID
llc.snap.vlan.prio number VLAN priority
llc.snap.vlan.cfi truth value VLAN DEI-/CFI bit
llc.snap.vlan.id number VLAN ID
llc.snap.proto number protocol (Ethernet type)
ip - IPv4 Header
manual TINA / ProfiNet-WATCHDOG V1.08 page 24
Page 25

name data type description
ip.version number version
ip.hdr_len number header length
ip.tos number Type Of Service (QoS parameter)
ip.len number total length
ip.id number identification number
ip.flags number flags
ip.frag_offset number fragmentation offset
ip.ttl number Time To Live
ip.proto number IP protocol
ip.checksum number header checksum
ip.src IPv4 address source IPv4 address
ip.dst IPv4 address destination IPv4 address
ip.opt - IPv4 option
ip.opt.type number option type
ip.opt.len number option length
ip.opt.data - option data
ipv6 - IPv6 header
ipv6.version number version
ipv6.class number traffic class (QoS parameter)
ipv6.flow number flow label
ipv6.plen number payload length
ipv6.nxt number IP protocol or next header
ipv6.hlim number maximum count of hops
ipv6.src IPv6 address source IPv6 address
ipv6.dst IPv6 address destination IPv6 address
page 25 manual TINA / ProfiNet-WATCHDOG V1.08
Page 26

name data type description
arp - ARP protocol
arp.hw.type number type of hardware addresses
arp.proto.type number type of protocol addresses
arp.hw.size number size of hardware addresses
arp.proto.size number size of protocol addresses
arp.opcode number operation code
arp.src.hw MAC address source hardware address
arp.src.proto IPv4 address source protocol address
arp.dst.hw MAC address destination hardware address
arp.dst.proto IPv4 address destination protocol address
rarp - RARP protocol
rarp.hw.type number type of hardware addresses
rarp.proto.type number type of protocol addresses
rarp.hw.size number size of hardware addresses
rarp.proto.size number size of protocol addresses
rarp.opcode number operation code
rarp.src.hw MAC address source hardware address
rarp.src.proto IPv4 address source protocol address
rarp.dst.hw MAC address destination hardware address
rarp.dst.proto IPv4 address destination protocol address
lldp - LLDP protocol
lldp.tlv - Type-Length-Value (TLV)
lldp.tlv.type number TLV type
lldp.tlv.len number TLV length
lldp.tlv.data - TLV value
manual TINA / ProfiNet-WATCHDOG V1.08 page 26
Page 27

name data type description
mrp - MRP protocol
mrp.version number version
mrp.block - block
mrp.type number block type
mrp.length number block length
mrp.sequence_id number Sequence number
mrp.domain_uuid number domain UUID
mrp.prio number priority
mrp.sa MAC address sender MAC address
mrp.port_role number port state
mrp.ring_state number ring state
mrp.transition number transition
mrp.timestamp number time stamp
mrp.interval number interval
mrp.blocked number blocked number
mrp.oui number OID
mrp.data - payload
hopopts - Hop-By-Hop header (IPv6)
hopopts.nxt number IP protocol or next header
hopopts.len number header length
hopopts.opts - options
routing - routing header (IPv6)
routing.nxt number IP protocol or next header
routing.len number header length
routing.type number routing type
page 27 manual TINA / ProfiNet-WATCHDOG V1.08
Page 28

name data type description
routing.segleft number amount of left segments
routing.data - type depended data
fragment - fragmentation header (IPv6)
fragment.nxt number IP protocol or next header
fragment.reserved - -
fragment.offset number fragmentation offset
fragment.filler - -
fragment.more truth value indicates if more fragments are
following
fragment.id number identification
dstopts - destinations options header (IPv6)
dstopts.nxt number IP protocol or next header
dstopts.len number header length
dstopts.opts - options
icmp - ICMPv4 protocol
icmp.type number type identifier
icmp.code number code (depends on type)
icmp.checksum number checksum
icmp.data - payload
icmpv6 - ICMPv6 protocol
icmpv6.type number type identifier
icmpv6.code number code (depends on type)
icmpv6.checksum number checksum
icmpv6.data - payload
manual TINA / ProfiNet-WATCHDOG V1.08 page 28
Page 29

name data type description
igmp - IGMP protocol
igmp.type number type identifier
igmp.code number code (depends on type)
igmp.max_resp number maximum response time
igmp.reserved - -
igmp.resp_code number response code
igmp.checksum number checksum
igmp.id number identification
igmp.maddr IPv4 address group address
igmp.key number key
igmp.filler - -
igmp.s truth value suppress flag (router)
igmp.qrv number QRV value
igmp.qqic number QQIC value
igmp.num_src number number of sources
igmp.src IPv4 address source address
tcp - TCP header
tcp.srcport number source port
tcp.dstport number destination port
tcp.seq number sequence number
tcp.ack number acknowledge number
tcp.hdr_len number header length
tcp.reserved - -
tcp.flags number flags
tcp.window_size number window size
tcp.checksum number checksum
page 29 manual TINA / ProfiNet-WATCHDOG V1.08
Page 30

name data type description
tcp.urgent_pointer number urgent pointer
tcp.opt - TCP option
tcp.opt.type number option type
tcp.opt.len number option length
tcp.opt.data - option data
udp - UDP header
udp.srcport number source port
udp.dstport number destination port
udp.len number total length
udp.checksum number checksum
dhcp . DHCP protocol
dhcp.type number protocol type
dhcp.hw.type number physical address type
dhcp.hw.len number physical address length
dhcp.hops number count of relay agents
dhcp.id number identification
dhcp.seconds number seconds since the start of the client
dhcp.flags number flags
dhcp.ip.client IPv4 address client IP address
dhcp.ip.your IPv4 address own IP address
dhcp.ip.server IPv4 address server IP address
dhcp.ip.relay IPv4 address relay agent IP address
dhcp.hw.addr MAC address client MAC address
dhcp.hw.addr_pad - padding after the MAC address
dhcp.hostname string name of the server
manual TINA / ProfiNet-WATCHDOG V1.08 page 30
Page 31

name data type description
dhcp.file string file name of the boot file
dhcp.magic number magic number
dhcp.opt - DHCP option
dhcp.opt.type number option type
dhcp.opt.len number option length
dhcp.opt.data - option data
dns - DNS protocol
dns.id number identification
dns.type number type identifier
dns.opcode number operation code
dns.flags number flags
dns.rcode number response code
dns.count.queries number count of queries
dns.count.answers number count of answers
dns.count.auth_rr number count of name server entries
dns.count.add_rr number count of additional entries
dns.qry - query
dns.qry.name string DNS name
dns.qry.type number type identifier
dns.qry.class number class
dns.ans - response
dns.ans.name string DNS name
dns.ans.type number type identifier
dns.ans.class number class
dns.ans.ttl number Time To Live
dns.ans.dlen number data length
page 31 manual TINA / ProfiNet-WATCHDOG V1.08
Page 32

name data type description
dns.ans.data - data
dns.ans.ip IPv4 address IPv4 address
dns.ans.ipv6 IPv6 address IPv6 address
dns.ans.hostname string host name
dns.auth - name server entry
dns.auth.name string DNS name
dns.auth.type number type identifier
dns.auth.class number class
dns.auth.ttl number Time To Live
dns.auth.dlen number data length
dns.auth.data - data
dns.auth.ip IPv4 address IPv4 address
dns.auth.ipv6 IPv6 address IPv6 address
dns.auth.hostname string host name
dns.add - additional entry
dns.add.name string DNS name
dns.add.type number type identifier
dns.add.class number class
dns.add.ttl number Time To Live
dns.add.dlen number data length
dns.add.data - data
dns.add.ip IPv4 address IPv4 address
dns.add.ipv6 IPv6 address IPv6 address
dns.add.hostname string host name
nbns - NBNS protocol
nbns.id number identification
manual TINA / ProfiNet-WATCHDOG V1.08 page 32
Page 33

name data type description
nbns.type number type identifier
nbns.opcode number operation code
nbns.flags number flags
nbns.rcode number response code
nbns.count.queries number count of queries
nbns.count.
answers
number count of answers
nbns.count.auth_rr number count of name server entries
nbns.count.add_rr number count of additional entries
nbns.qry - query
nbns.qry.name string DNS name
nbns.qry.type number type identifier
nbns.qry.class number class
nbns.ans - response
nbns.ans.name string DNS name
nbns.ans.type number type identifier
nbns.ans.class number class
nbns.ans.ttl number Time To Live
nbns.ans.dlen number data length
nbns.ans.data - data
nbns.ans.flags number flags
nbns.ans.ip IPv4 address IPv4 address
nbns.auth - name server entry
nbns.auth.name string DNS name
nbns.auth.type number type identifier
nbns.auth.class number class
nbns.auth.ttl number Time To Live
page 33 manual TINA / ProfiNet-WATCHDOG V1.08
Page 34

name data type description
nbns.auth.dlen number data length
nbns.auth.data - data
nbns.auth.flags number flags
nbns.auth.ip IPv4 address IPv4 address
nbns.add - additional entry
nbns.add.name string DNS name
nbns.add.type number type identifier
nbns.add.class number class
nbns.add.ttl number Time To Live
nbns.add.dlen number data length
nbns.add.data - data
nbns.add.flags number flags
nbns.add.ip IPv4 address IPv4 address
ntp - NTP protocol
ntp.li number leap indicator
ntp.vn number version
ntp.mode number mode
ntp.stratum number stratum
ntp.poll number polling interval
ntp.precision number precision
ntp.delay number delay
ntp.dispersion number dispersion
ntp.refid number reference ID
ntp.reftime number reference time stamp
ntp.org number original time stamp
ntp.rec number receive time stamp
manual TINA / ProfiNet-WATCHDOG V1.08 page 34
Page 35

name data type description
ntp.xmt number transmit time stamp
tftp - TFTP protocol
tftp.opcode number operation code
tftp.file string file name
tftp.mode string mode
tftp.datablock number block number (for data)
tftp.data - -
tftp.ackblock number block number (for acknowledge)
tftp.error.code number error code
tftp.error.msg string error message
snmp - SNMP protocol
snmp.tlv - Type-Length-Value (TLV)
snmp.tlv.type number TLV type
snmp.tlv.length number TLV length
snmp.tlv.data - TLV value
snmp.value.int number TLV value as number
snmp.value.string string TLV value as string
snmp.value.
counter
number TLV value as counter
snmp.value.tticks number TLV value as time stamp
ftp - FTP protocol
ftp.line string line
ftp.req.command string request command
ftp.req.parameter string request parameter
ftp.rsp.code string response code
page 35 manual TINA / ProfiNet-WATCHDOG V1.08
Page 36

name data type description
ftp.rsp.arg string response arguments
http - HTTP protocol
http.req string request
http.req.method string method
http.req.uri string path
http.req.version string version
http.resp string response
http.resp.version string version
http.resp.code string response code
http.resp.desc string response text
http.field string HTTP property
http.field.name string field name
http.field.value string field value
smtp - SMTP protocol
smtp.line string line
smtp.req.command string request command
smtp.req.
parameter
string request parameter
smtp.rsp.code string response code
smtp.rsp.parameter string response parameter
pop - POP protocol
pop.line string line
pop.req.command string request command
pop.req.parameter string request parameter
pop.rsp.indicator string response indicator
manual TINA / ProfiNet-WATCHDOG V1.08 page 36
Page 37

name data type description
pop.rsp.desc string response description
imap - IMAP protocol
imap.line string line
imap.tag string tag
imap.data string data
sip - SIP protocol
sip.req string request
sip.req.method string method
sip.req.uri string URI
sip.req.version string version
sip.resp string response
sip.resp.version string version
sip.resp.code string response code
sip.resp.desc string response text
sip.field string SIP field
sip.field.name string field name
sip.field.value string field value
sdp - SDP protocol
sdp.version string version
sdp.owner string session owner
sdp.owner.
username
string user name
sdp.owner.id string session ID
sdp.owner.version string version
sdp.owner.ntype string network type
page 37 manual TINA / ProfiNet-WATCHDOG V1.08
Page 38

name data type description
sdp.owner.atype string address type
sdp.owner.address string address
sdp.session_name string session name
sdp.session_info string session info
sdp.uri string URI
sdp.email string e-mail address
sdp.phone string Telephone number
sdp.s_con_info string connection data of the session
sdp.s_con_info.
ntype
string network type
sdp.s_con_info.
atype
string address type
sdp.s_con_info.
address
string address
sdp.s_bandwidth string bandwidth of the session
sdp.time string time
sdp.time.start string start time
sdp.time.stop string end time
sdp.repeat_time string repeat time
sdp.timezone string time zone
sdp.s_enc_key string encryption key of the session
sdp.session_attr string session attribute
sdp.media string media description
sdp.media.media string media type
sdp.media.port string port
sdp.media.proto string protocol
sdp.media.format string format
manual TINA / ProfiNet-WATCHDOG V1.08 page 38
Page 39

name data type description
sdp.media.title string media title
sdp.m_con_info string connection data of the media
sdp.m_con_info.
ntype
string network type
sdp.m_con_info.
atype
string address type
sdp.m_con_info.
address
string address
sdp.m_bandwidth string bandwidth of the media
sdp.m_enc_key string encryption key of the media
sdp.media_attr string media attribute
rtp - RTP protocol
rtp.version number version
rtp.p truth value indicates, if padding is available
rtp.x truth value indicates, if a extension header is
available
rtp.cc number CSRC count
rtp.marker truth value marker flag
rtp.p_type number payload type
rtp.seq number sequence number
rtp.timestamp number timestamp
rtp.ssrc number SSRC
rtp.csrc number CSRC
rtp.ext - RTP extension header
rtp.ext.profile number profile type value
rtp.ext.len number length
rtp.ext.data - data
page 39 manual TINA / ProfiNet-WATCHDOG V1.08
Page 40

name data type description
rtp.payload - payload
rtp.padding - padding
rtcp - RTCP protocol
rtcp.version number version
rtcp.p truth value indicates, if padding is available
rtcp.rc number report count
rtcp.sc number CSRC count
rtcp.subtype number sub type
rtcp.pt number packet type
rtcp.length number length
rtcp.data - data
rtcp.padding - padding
tpkt - TPKT protocol
tpkt.version number version
tpkt.reserved - -
tpkt.length number length
q931 - Q.931 protocol
q931.disc number protocol discriminator
q931.call_ref_len number length of call reference
q931.call_ref number call reference
q931.
message_type
number message type
q931.ie - information element
q931.ie.id number identification
q931.ie.len number length
manual TINA / ProfiNet-WATCHDOG V1.08 page 40
Page 41

name data type description
q931.ie.data - data
pn_rt - PROFINET-RealTime protocol
pn_rt.frame_id number frame ID
pn_rt.cycle_
counter
number cycle counter
pn_rt.ds number data state
pn_rt.transfer_
status
number transfer state
pn_dcp - PROFINET-DCP protocol
pn_dcp.service_id number service ID
pn_dcp.service_
type
number service type
pn_dcp.xid number Identification
pn_dcp.response_
delay
number response delay
pn_dcp.data_
length
number data length
pn_dcp.block - block
pn_dcp.block.opt number block option
pn_dcp.block.
subopt
number block sub option
pn_dcp.block.
length
number block length
pn_dcp.block.
status
number state
pn_dcp.block.data - block data
pn_dcp.padding - padding
page 41 manual TINA / ProfiNet-WATCHDOG V1.08
Page 42

name data type description
pn_ptcp - PROFINET-PTCP protocol
pn_ptcp.header - header
pn_ptcp.pad1 - padding
pn_ptcp.res1 - reserved
pn_ptcp.res2 - reserved
pn_ptcp.delay10ns number 10ns delay
pn_ptcp.sequence
_id
number sequence number
pn_ptcp.delay1ns_
byte
number 1ns delay (byte)
pn_ptcp.pad2 - padding
pn_ptcp.delay1ns number 1ns delay
pn_ptcp.tlvheader - block
pn_ptcp.tl_type number block type
pn_ptcp.tl_length number block length
pn_ptcp.tl_data - block data
pn_mrrt - PROFINET-MRRT protocol
pn_mrrt.version number version
pn_mrrt.block - block
pn_mrrt.type number block type
pn_mrrt.length number block length
pn_mrrt.sequence_idnumber sequence number
pn_mrrt.domain_
uuid
number domain UUID
pn_mrrt.sa MAC address sender MAC address
pn_mrrt.data - data
manual TINA / ProfiNet-WATCHDOG V1.08 page 42
Page 43

name data type description
pn_mrrt.padding - padding
dcerpc - DCE/RPC protocol
dcerpc.ver number version
dcerpc.ver_minor number sub version
dcerpc.pkt_type number packet type
dcerpc.cn_flags number flags (CN only)
dcerpc.dg_flags1 number flags part 1 (DG only)
dcerpc.dg_flags2 number flags part 2 (DG only)
dcerpc.drep - data representation
dcerpc.drep.
byteorder
number byte order
dcerpc.drep.
character
number character set
dcerpc.drep.fp number floating point format
dcerpc.dg_serial_hi number serial number (higher)
dcerpc.dg_obj_id - object ID (DG only)
dcerpc.dg_if_id - Interface ID
dcerpc.dg_act_id - activity ID
dcerpc.dg_server_
boot
number server boot timestamp
dcerpc.dg_if_ver number interface version
dcerpc.dg_seqnum number sequence number
dcerpc.dg_opnum number operation number (DG only)
dcerpc.dg_if_hint number interface hint
dcerpc.dg_act_hint number activity hint
dcerpc.frag_len number fragmentation length
page 43 manual TINA / ProfiNet-WATCHDOG V1.08
Page 44

name data type description
dcerpc.dg_frag_
num
number fragment number
dcerpc.dg_auth_
proto
number authentication protocol
dcerpc.cn_auth_
len
number authentication length
dcerpc.dg_serial_lo number serial number (lower)
dcerpc.cn_call_id number communication ID
dcerpc.cn_alloc_
hint
number allocation hint
dcerpc.cn_ctx_id number context ID
dcerpc.cn_cancel_
cnt
number cancel count
dcerpc.cn_status number state (only CN)
dcerpc.cn_opnum number operation number (CN only)
dcerpc.cn_obj_id - object ID (CN only)
dcerpc.cn_reject_
res
number reject reason
dcerpc.cn_max_
xmit
number maximum transmit
dcerpc.cn_max_
recv
number maximum receive
dcerpc.cn_assoc_
group
number group
dcerpc.dg_status number state (DG only)
dcerpc.dg_cancel_
vers
number cancel version
dcerpc.dg_cancel_idnumber cancel ID
manual TINA / ProfiNet-WATCHDOG V1.08 page 44
Page 45

name data type description
dcerpc.dg_cancel_
acc
truth value cancel support
dcerpc.fack_vers number version
dcerpc.fack_win number window size
dcerpc.fack_tsdu number maximum TSDU
dcerpc.fack_frag number maximum fragment size
dcerpc.fack_serial number serial number
dcerpc.fack_selack
_len
number selective acknowledge length
dcerpc.fack_selack - selective acknowledge
pn_io - PROFINET-IO protocol
pn_io.alarm_dst_
ep
number destination endpoint
pn_io.alarm_src_
ep
number source endpoint
pn_io.pdu_version number PDU version
pn_io.pdu_type number PDU type
pn_io.tack number TACK
pn_io.window_size number window size
pn_io.send_seq_
num
number send sequence number
pn_io.ack_seq_
num
number acknowledge sequence number
pn_io.args_max number maximum arguments
pn_io.args_len number argument length
pn_io.var_part_len number data length
pn_io.var_part - data
pn_io.user_data - user data
page 45 manual TINA / ProfiNet-WATCHDOG V1.08
Page 46

name data type description
pn_io.status - state
pn_io.status.code number error code
pn_io.status.
decode
number error decode
pn_io.status.code1 number error code 1
pn_io.status.code2 number error code 2
pn_io.array - array
pn_io.array.max_
count
number maximum count
pn_io.array.offset number offset
pn_io.array.act_
count
number current count
pn_io.block - block
pn_io.block.type number block type
pn_io.block.length number block length
pn_io.block.
version_h
number version
pn_io.block.
version_l
number sub version
pn_io.block.data - data
wol - Wake-On-LAN protocol
wol.sync MAC address synchronization stream
wol.mac_block - MAC address block
wol.mac MAC address MAC address
wol.passwd_ip IP address password as IP address
wol.passwd_mac MAC address password as MAC address
llmnr - LLMNR protocol
manual TINA / ProfiNet-WATCHDOG V1.08 page 46
Page 47

name data type description
llmnr.id number identification
llmnr.type number type identifier
llmnr.opcode number operation code
llmnr.flags number flags
llmnr.rcode number response code
llmnr.count.queries number count of queries
llmnr.count.
answers
number count of answers
llmnr.count.auth_rr number count of name server entries
llmnr.count.add_rr number count of additional entries
llmnr.qry - query
llmnr.qry.name string LLMNR name
llmnr.qry.type number type identifier
llmnr.qry.class number class
llmnr.ans - response
llmnr.ans.name string LLMNR name
llmnr.ans.type number type identifier
llmnr.ans.class number class
llmnr.ans.ttl number Time To Live
llmnr.ans.dlen number data length
llmnr.ans.data - data
llmnr.ans.ip IPv4 address IPv4 address
llmnr.ans.ipv6 IPv6 address IPv6 address
llmnr.ans.
hostname
string host name
llmnr.auth - name server entry
llmnr.auth.name string LLMNR name
page 47 manual TINA / ProfiNet-WATCHDOG V1.08
Page 48

name data type description
llmnr.auth.type number type identifier
llmnr.auth.class number class
llmnr.auth.ttl number Time To Live
llmnr.auth.dlen number data length
llmnr.auth.data - data
llmnr.auth.ip IPv4 address IPv4 address
llmnr.auth.ipv6 IPv6 address IPv6 address
llmnr.auth.
hostname
string host name
llmnr.add - additional entry
llmnr.add.name string LLMNR name
llmnr.add.type number type identifier
llmnr.add.class number class
llmnr.add.ttl number Time To Live
llmnr.add.dlen number data length
llmnr.add.data - data
llmnr.add.ip IPv4 address IPv4 address
llmnr.add.ipv6 IPv6 address IPv6 address
llmnr.add.
hostname
string host name
ssdp - SSDP protocol
ssdp.req string request
ssdp.req.method string method
ssdp.req.uri string path
ssdp.req.version string version
ssdp.resp string response
manual TINA / ProfiNet-WATCHDOG V1.08 page 48
Page 49

name data type description
ssdp.resp.version string version
ssdp.resp.code string response code
ssdp.resp.desc string response text
ssdp.field string SSDP property
ssdp.field.name string field name
ssdp.field.value string field value
cotp - COTP protocol
cotp.li number length
cotp.type number type
cotp.destref number destination reference
cotp.srcref number source reference
cotp.class number classification
cotp.opts number options
cotp.reason number disconnect reason
cotp.eot truth value last TPDU
cotp.tpdu_number number TPDU number
cotp.sequence_
number
number sequence number
cotp.cause number error cause
cotp.parameter - parameter
cotp.parameter.
code
number parameter code
cotp.parameter.
length
number parameter length
cotp.parameter.
value
- parameter value
cotp.tpdu_size number TPDU size
page 49 manual TINA / ProfiNet-WATCHDOG V1.08
Page 50

name data type description
cotp.src_tsap number source TSAP
cotp.dst_tsap number destination TSAP
cotp.checksum number checksum
Furthermore there are some group fields, which belongs to multiple other
fields (logical OR):
name fields
eth.addr eth.dst; eth.src
ip.addr ip.src; ip.dst
ipv6.addr ipv6.src; ipv6.dst
arp.hw.addr arp.src.hw; arp.dst.hw
arp.proto.addr arp.src.proto; arp.dst.proto
rarp.hw.addr rarp.src.hw; rarp.dst.hw
rarp.proto.addr rarp.src.proto; rarp.dst.proto
tcp.port tcp.srcport; tcp.dstport
udp.port udp.srcport; udp.dstport
dns.resp dns.ans; dns.auth; dns.add
dns.resp.name dns.ans.name; dns.auth.name; dns.add.name
dns.resp.type dns.ans.type; dns.auth.type; dns.add.type
dns.resp.class dns.ans.class; dns.auth.class; dns.add.class
dns.resp.ttl dns.ans.ttl; dns.auth.ttl; dns.add.ttl
dns.resp.dlen dns.ans.dlen; dns.auth.dlen; dns.add.dlen
dns.resp.data dns.ans.data; dns.auth.data; dns.add.data
manual TINA / ProfiNet-WATCHDOG V1.08 page 50
Page 51

name fields
dns.resp.ip dns.ans.ip; dns.auth.ip; dns.add.ip
dns.resp.ipv6 dns.ans.ipv6; dns.auth.ipv6; dns.add.ipv6
dns.resp.hostname dns.ans.hostname; dns.auth.hostname; dns.add.
hostname
nbns.resp nbns.ans; nbns.auth; nbns.add
nbns.resp.name nbns.ans.name; nbns.auth.name; nbns.add.name
nbns.resp.type nbns.ans.type; nbns.auth.type; nbns.add.type
nbns.resp.class nbns.ans.class; nbns.auth.class; nbns.add.class
nbns.resp.ttl nbns.ans.ttl; nbns.auth.ttl; nbns.add.ttl
nbns.resp.dlen nbns.ans.dlen; nbns.auth.dlen; nbns.add.dlen
nbns.resp.data nbns.ans.data; nbns.auth.data; nbns.add.data
nbns.resp.flags nbns.ans.flags; nbns.auth.flags; nbns.add.flags
nbns.resp.ip nbns.ans.ip; nbns.auth.ip; nbns.add.ip
tftp.block tftp.datablock; tftp.ackblock
http.version http.req.version; http.resp.version
smtp.parameter smtp.req.parameter; smtp.rsp.parameter
sip.version sip.req.version; sip.resp.version
sdp.con_info sdp.s_con_info; sdp.m_con_info
sdp.con_info.ntype sdp.s_con_info.ntype; sdp.m_con_info.ntype
sdp.con_info.atype sdp.s_con_info.atype; sdp.m_con_info.atype
sdp.con_info.
address
sdp.s_con_info.address; sdp.m_con_info.address
sdp.bandwidth sdp.s_bandwidth; sdp.m_bandwidth
sdp.enc_key sdp.s_enc_key; sdp.m_enc_key
page 51 manual TINA / ProfiNet-WATCHDOG V1.08
Page 52

name fields
dcerpc.obj_id dcerpc.dg_obj_id; dcerpc.cn_obj_id
dcerpc.opnum dcerpc.dg_opnum; dcerpc.cn_opnum
wol.passwd wol.passwd_ip; wol.passwd_mac
llmnr.resp llmnr.ans; llmnr.auth; llmnr.add
llmnr.resp.name llmnr.ans.name; llmnr.auth.name; llmnr.add.name
llmnr.resp.type llmnr.ans.type; llmnr.auth.type; llmnr.add.type
llmnr.resp.class llmnr.ans.class; llmnr.auth.class; llmnr.add.class
llmnr.resp.ttl llmnr.ans.ttl; llmnr.auth.ttl; llmnr.add.ttl
llmnr.resp.dlen llmnr.ans.dlen; llmnr.auth.dlen; llmnr.add.dlen
llmnr.resp.data llmnr.ans.data; llmnr.auth.data; llmnr.add.data
llmnr.resp.ip llmnr.ans.ip; llmnr.auth.ip; llmnr.add.ip
llmnr.resp.ipv6 llmnr.ans.ipv6; llmnr.auth.ipv6; llmnr.add.ipv6
llmnr.resp.
hostname
llmnr.ans.hostname; llmnr.auth.hostname; llmnr.
add.hostname
ssdp.version ssdp.req.version; ssdp.resp.version
In addition to the fields which belongs to the data of the frame, there are
some further fields which belongs to the frame itself:
name data type description
frame.number number index of the frame
frame.rx truth value indicates, if the frame was an
incoming frame
frame.time number time stamp of the frame (in s)
tcp.stream number index of the TCP stream
udp.stream number index of the UDP stream
rtp.stream number index of the RTP stream
manual TINA / ProfiNet-WATCHDOG V1.08 page 52
Page 53

name data type description
voip.stream number index of the VoIP connection
pn_io.stream number index of the PROFINET IO
connection
If you want to compare a field with another field or a fixed value you need
a comparison operator. The following comparison operators are
available:
C syntax textual description
checks if the field is present (no comparison
operator and comparison value)
== eq checks if the two values are matching
!= ne checks if the two values are not matching
>= ge checks if the field value is greater than or
equal the comparison value
> gt checks if the field value is greater than the
comparison value
<= le checks if the field value is smaller than or
equal the comparison value
< lt checks if the field value is smaller than the
comparison value
& checks if a bitwise AND combination is not
equal to 0
contains checks if the filed contains the value
example: udp.srcport>=1024
page 53 manual TINA / ProfiNet-WATCHDOG V1.08
Page 54

Hint:
For the data types “truth value”, “MAC address”, “IPv4 address”
and “IPv6 address” as well as for comparison of two fields or field
groups the comparison operators ==/eq and !=/ne as well as
checking the field existence can be used only. The contains
operator can be only used for the data type “string”.
If you have multiple conditions you will need combination operators to
combine them. The following operators are available:
C syntax textual description
&& and logical AND, all conditions must be true
|| or logical OR, one condition must be true
^^ xor logical XOR, only one condition may be true
example: ip or ipv6
If you want to group conditions you can use the round brackets. (e. g.
ip.addr==192.168.1.10 and (udp or tcp))
Also you can negate a condition by putting an exclamation mark in front
of the field name or opening bracket (for a group). (e. g. !udp)
Hint:
If you want to remove the view filter you just have to remove the
entering from the text field and submit the empty entering.
manual TINA / ProfiNet-WATCHDOG V1.08 page 54
Page 55

4.3.4 search
In addition to the view filter you have the possibility to search for raw
data in the frames. This is especially useful if the frame can't be analyzed
furthermore automatically. The search depends on the view filter, this
means that the search occurs only on viewed frames (e. g. only UDP
datagramms, when using the filter udp).
For using the search you have a text field on the overview page. In this
text field you can enter either a string (have to be entered within double
quotes, e. g. "hello") or a hex value (have to start with the 0x suffix, e. g.
0x1A2B3C).
After entering the search value you can start the searching with the help
of the two symbols behind the text field. The symbol executes a
forward search and the symbol executes a backward search. If the
focus is set on the search text field you also have the possibility to press
the enter key. This executes a forward search. After the end of the frame
list is reached the search begins one the first frame again.
If the string or hex value was found, the detail view of the frame in which
the entering was found get's opened and the data get's highlighted in the
raw data view (and if applicable in the text view).
page 55 manual TINA / ProfiNet-WATCHDOG V1.08
Page 56
4.3.5 protocol streams
Often it is not possible that all data can be transmitted via one frame or
sometimes it just needs some frame transmitting e. g. before an IP
address can be assigned with DHCP. In such cases it is useful to show
only frames which belongs to the same stream (OSI layer 4).
While the frames are analyzed on the web page a stream list is build up
(currently the transport protocols TCP and UDP are supported). The
assignment of a frame to a stream occurs with the help of the IP
addresses and ports.
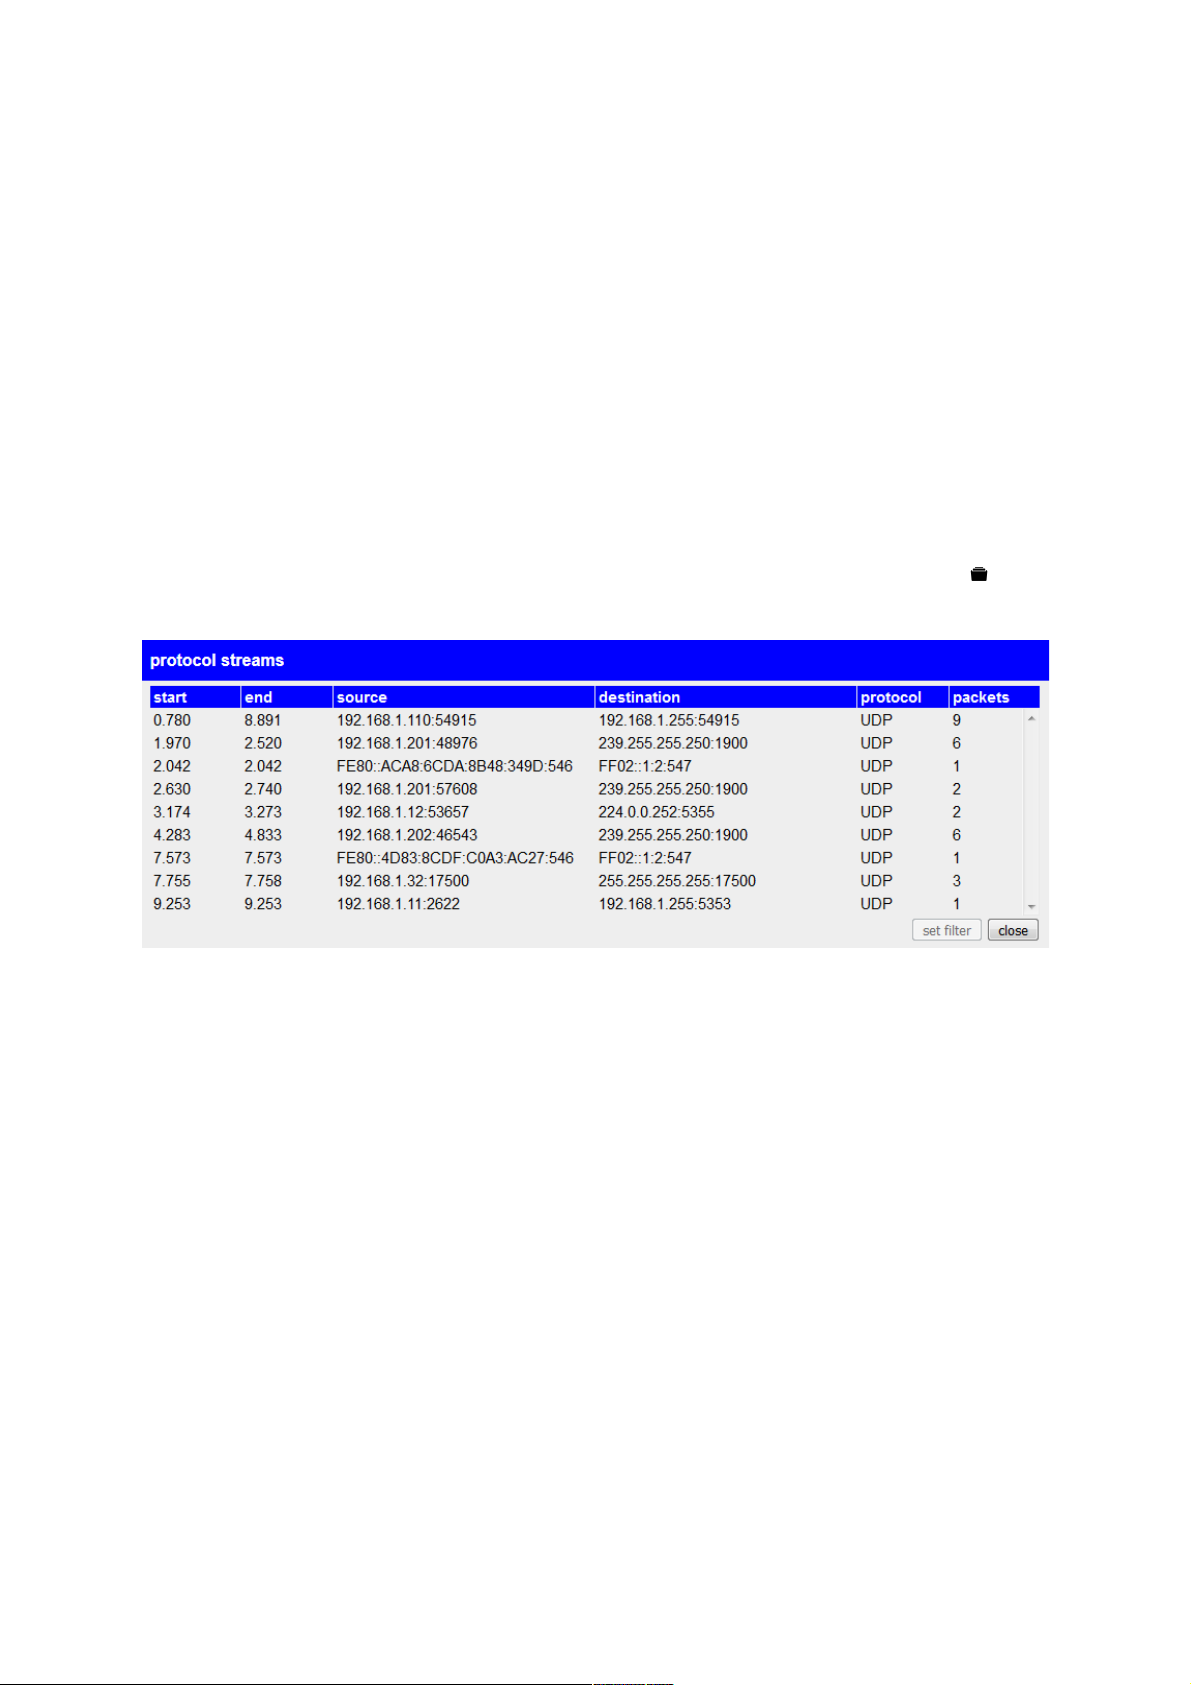
If you want to show a list with all streams you have to click on the icon
in the toolbar. Now you should see the following dialog:
In this dialog you can see the list of all TCP and UDP streams. The
single rows can be clicked. After clicking the row is colored with a light
blue color and the button “set filter” is enabled. If you click on the button
“set filter” a view filter get's set. The frame table should then show the
frames which belong to the selected stream only.
Furthermore it is also possible to follow a stream of a specific frame.
Therefore you have to open the dialog “frame information and settings”.
On this dialog you can click on the “follow TCP stream” or “follow UDP
stream”. After clicking on the button a view filter for the stream get's set.
manual TINA / ProfiNet-WATCHDOG V1.08 page 56
Page 57
4.3.6 RTP streams
RTP streams are data streams which are used for transmitting audio and
video content in real time. The detection and grouping of RTP streams
isn't possible with the IP addresses and ports only. Also the SSRC which
is located in the RTP frame is used for that.
The analyzing of RTP streams frame for frame isn't very comfortable.
Hence the web page offers you a simple list of RTP streams with all
necessary information. Depending on the type of the payload you have
the possibility to play the content of the RTP stream (see below).
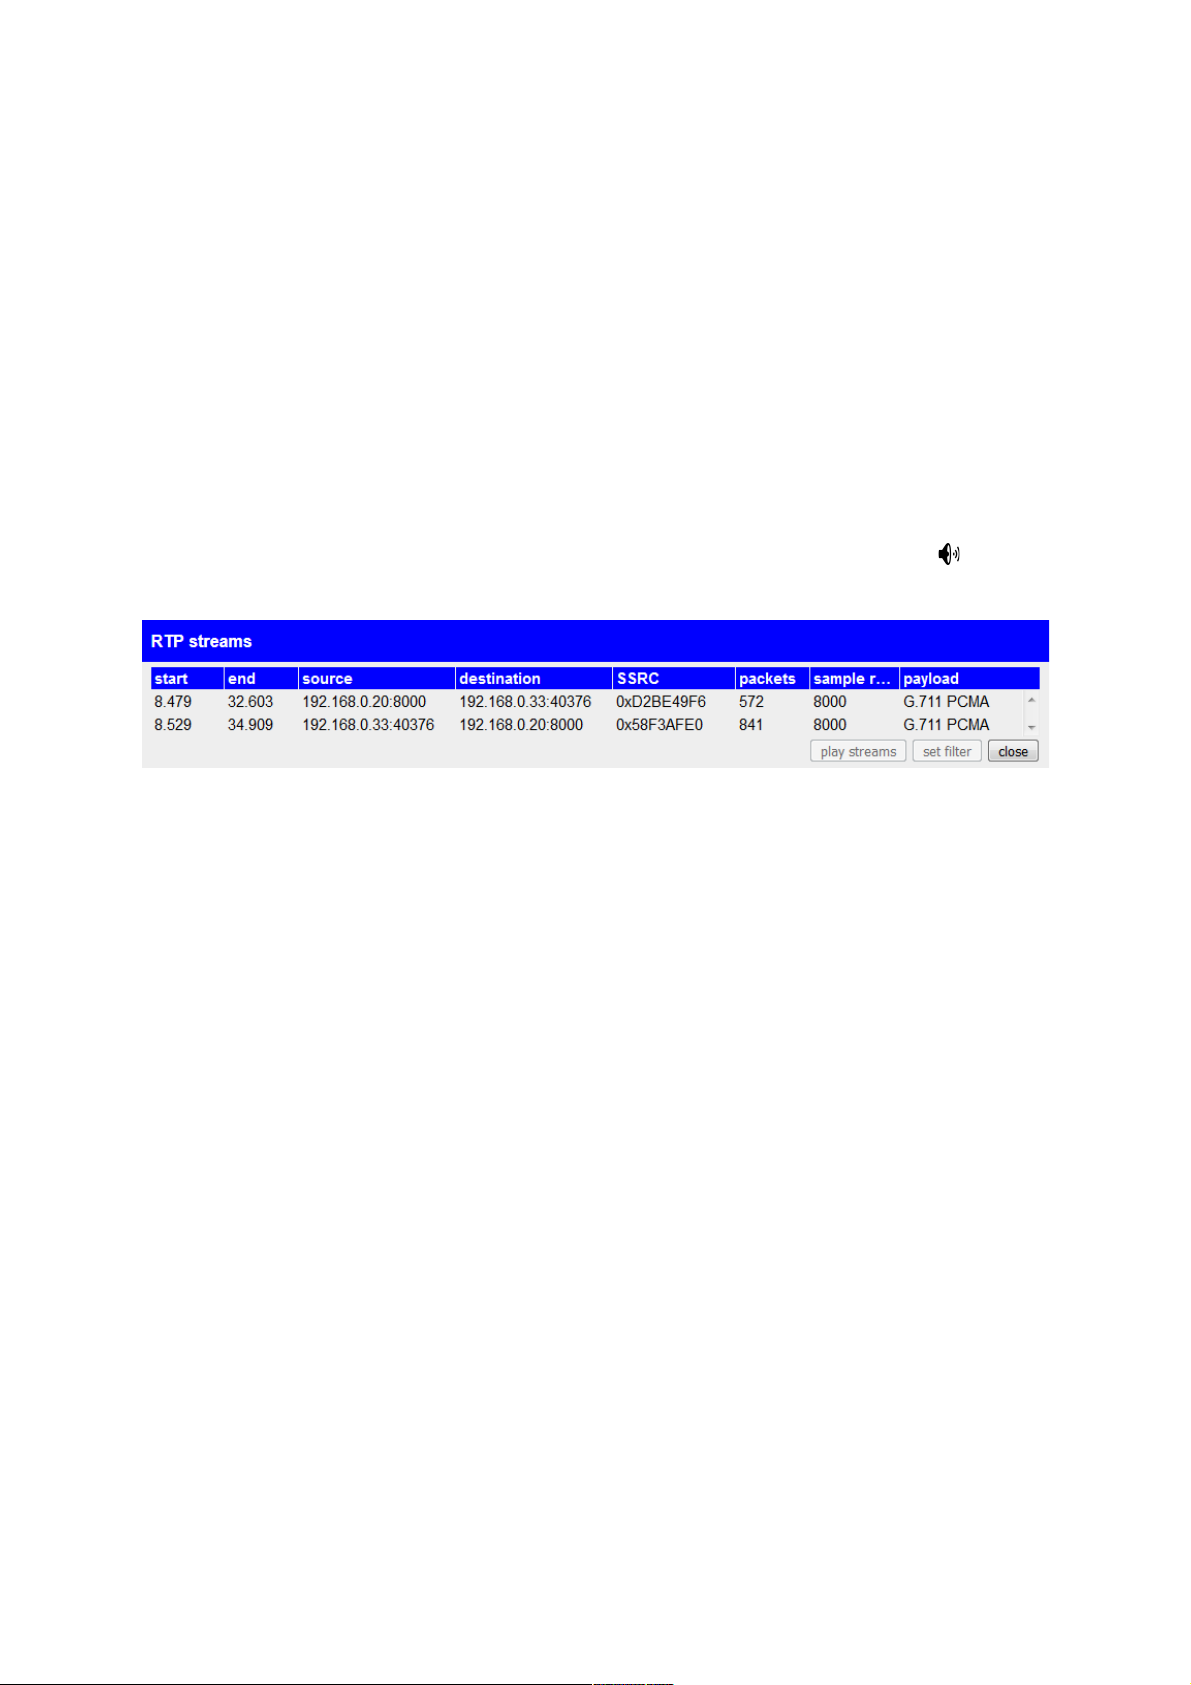
If you want to show the list of RTP streams you can click on the icon in
the toolbar. Now you should see a dialog similar to the following:
The dialog consists of a table and some buttons. Each row of the table
represents a RTP stream and shows information like the start and end
time as well as the source, the destination, the SSRC, the packet count,
the sample rate (only for supported audio formats) and the type of the
payload.
You can select a RTP stream in the table by clicking on one of the rows
in the table. If you have clicked on a row the streams get's highlighted
with a light blue color and the buttons “play streams” and “set filter” are
getting enabled. By clicking on the “set filter” button a view filter get's set
whereby frames which belong to this stream in the frame table are shown
only.
Additionally to selecting a single RTP stream you have the possibility to
select multiple RTP streams. Therefore you have to hold down the
Strg/Ctrl key while clicking on the stream in the table. With the same
method you can deselect a selected RTP stream. If you click on a RTP
stream without pressing the Strg/Ctrl key all selected RTP streams are
automatically getting deselected.
If you want to play the content of a single (or multiple) stream(s) you can
click on the button “play streams”. This function is currently limited to
page 57 manual TINA / ProfiNet-WATCHDOG V1.08
Page 58
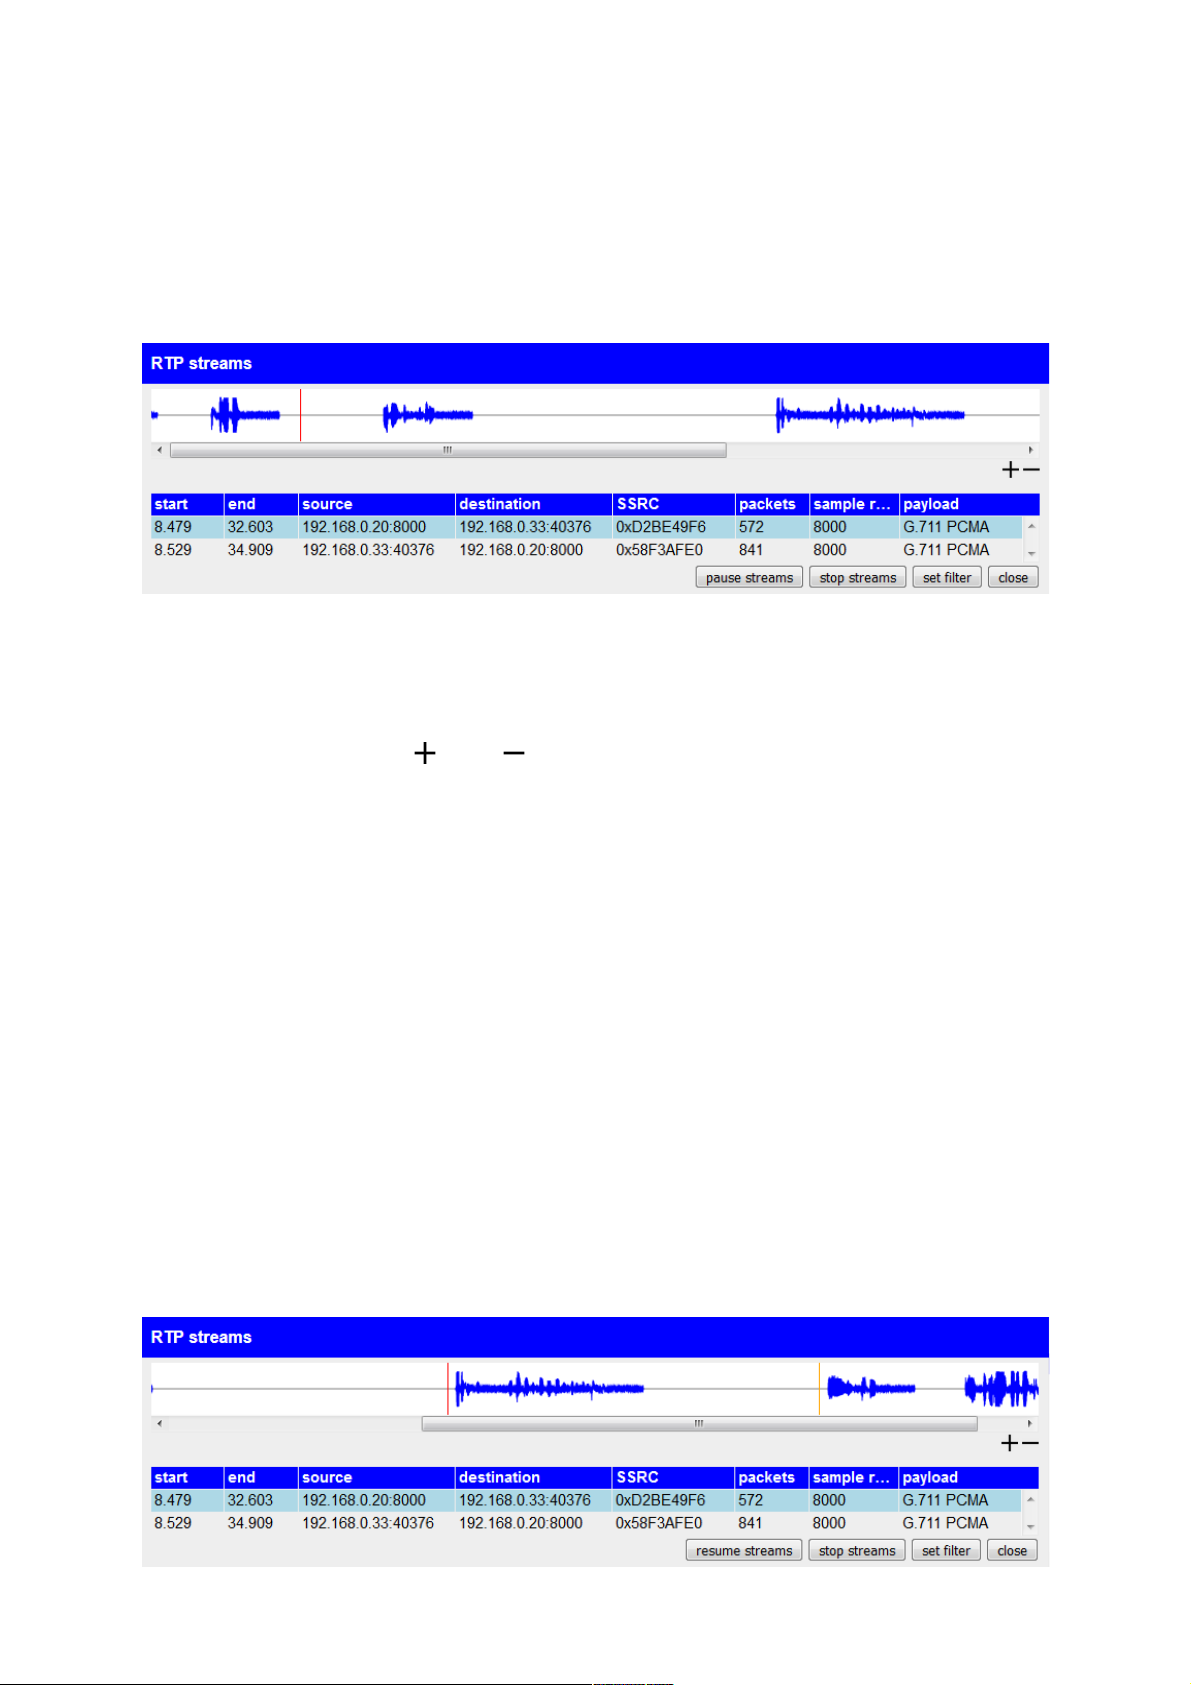
audio streams with the codecs “G.711 PCMA” and “G.711 PCMU”. Other
streams or codecs can not be played.
If you have selected at least one audio stream with a supported codec
you should see a waveform diagram above the stream table. Such
waveform diagrams are commonly used in software for audio editing.
The red line in the diagram indicates the current position of the audio
playing. The cursor is only shown if the stream is playing or paused. With
the help of the icons and you can zoom in or out of the waveform
diagram respectively the audio track.
If you have already started the stream playing (as in the image above),
you should now see the buttons “pause streams” and “stop streams”
instead of the button “play streams”. This buttons allows you to pause or
stop the playing of the streams. If the playing is paused the button
“resume streams” instead of “pause streams” is shown, which allows you
to resume the playing of the streams on the paused position.
If you would like to, you can set the position of the stream playing
manually. Therefore you just have to place your cursor on the desired
position within the waveform diagram. This “hand cursor” is marked with
a orange colored line. If your cursor is on the desired position within the
waveform diagram you have to click on the left mouse button. Now the
playing cursor (red line) is set to this position.
manual TINA / ProfiNet-WATCHDOG V1.08 page 58
Page 59
Hint:
The audio playing is using the “Web Audio API” from your browser.
Some internet browsers (e. g. the Microsoft Internet Explorer and
the Android Browser) unfortunately aren't supporting this feature.
4.3.7 VoIP connections
For establishing a VoIP connection or transmitting conversation data the
VoIP technology uses multiple protocols. Furthermore a few frames have
to be transmitted before a connection or a call can be established.
Because analyzing VoIP connections with single protocol dissectors isn't
very comfortable the VoIP protocols are automatically analyzed in more
detail. In this process the frame get's assigned to a list of VoIP
connections and calls. Currently only the signaling protocol SIP (Session
Initiation Protocol) together with SDP (Session Description Protocol) and
the data protocols RTP and RTCP are supported.
Furthermore you have the possibility to analyze and play the audio data
of the VoIP call, which are transmitted via the RTP protocol.
If you want to show all VoIP calls within a recording you can click on the
symbol. The symbol can be found in the toolbar above the frame table.
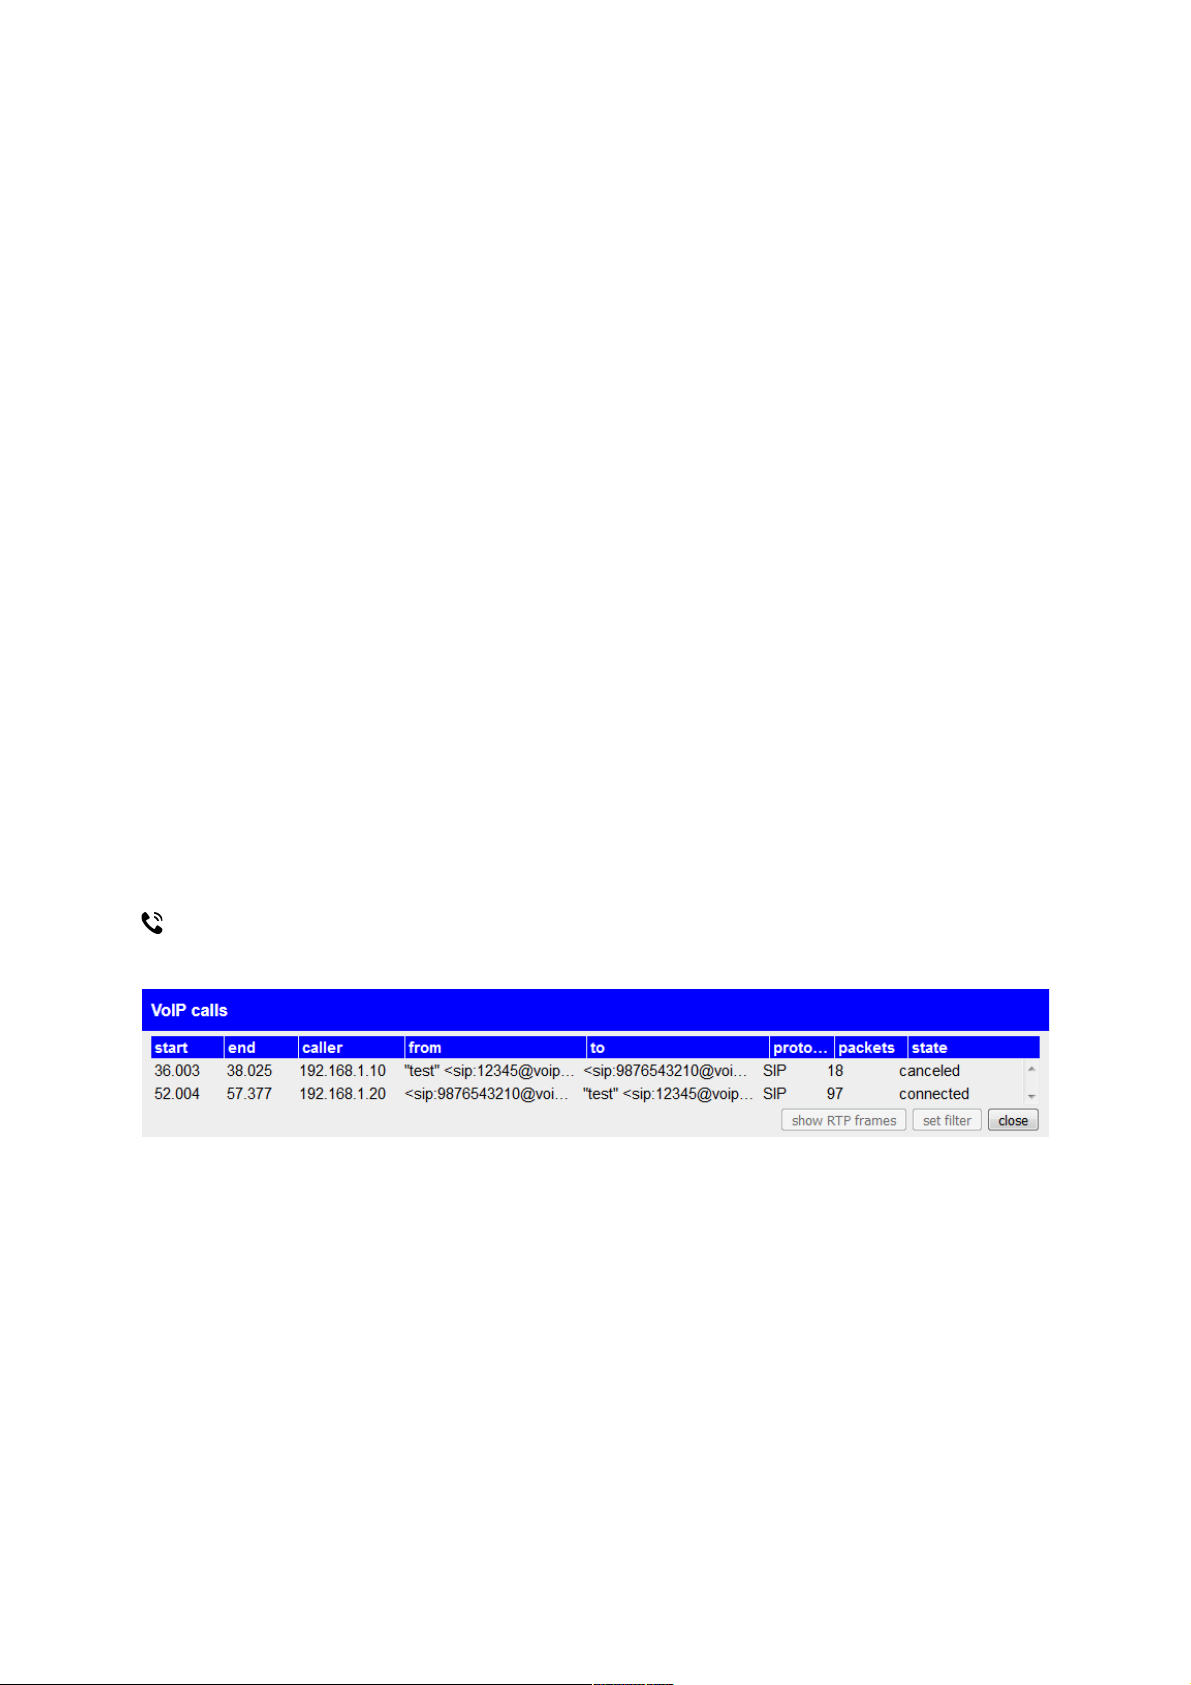
After clicking on the symbol you should see the following dialog:
In the dialog you can see a table. Each row in the table represents a
VoIP call. In the line you can see different information e. g. start and end
time, the number of the two subscribers and the state. If you click on a
line in the table the row get's highlighted with a light blue color and the
buttons “show RTP streams” and “set filter” are getting enabled. Clicking
on the “show RTP streams” button opens the RTP streams dialog. But
now this dialog only shows the RTP streams which belong to the
selected VoIP call. If you click on the “set filter” button a view filter for the
page 59 manual TINA / ProfiNet-WATCHDOG V1.08
Page 60

VoIP call get's set. This means that only frames which belong to the VoIP
call are shown in the frame table.
manual TINA / ProfiNet-WATCHDOG V1.08 page 60
Page 61
4.3.8 PROFINET-IO connections
If you want to analyze PROFINET-IO connections (short PN-IO) with the
help of the device it can be helpful to show only the PROFINET traffic
between a specific controller and device.
To offer a better way as manually entering the MAC addresses and other
filters the page can show you all PN-IO communications. For this list all
PN-IO protocols who are received or sent directly via Ethernet or via TCP
and UDP as well as PN-IO Context Manager protocols are respected.
If you want to see the list with all PN-IO connections you just have to
click on the symbol , which can be found in the toolbar above the frame
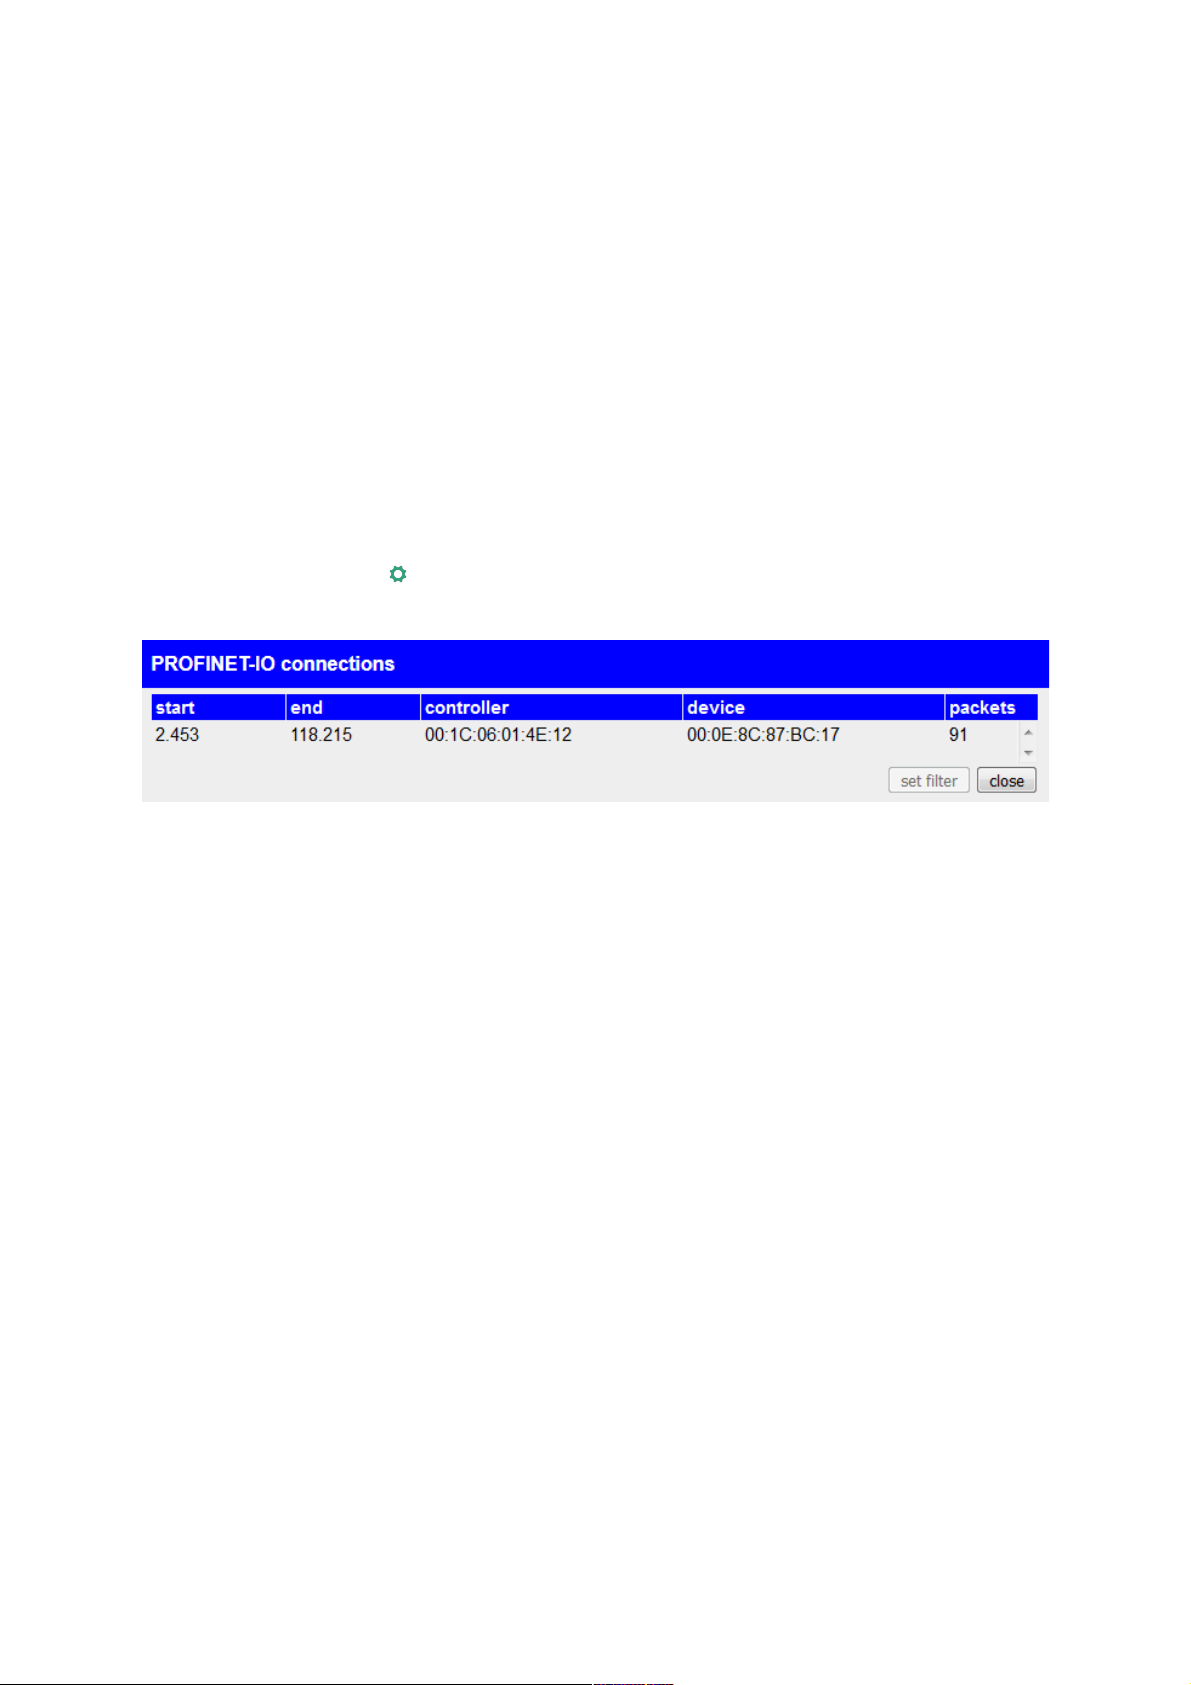
table. You should now see a dialog similar to this one:
In this dialog you can see a table with all connections. Each row
represents one connection and shows the time of the first and last frame,
the MAC addresses of the controller and the device and the amount of
frames. If you click on one row it gets highlighted with a light blue color
and the button “set filter” gets enabled. If you click on the “set filter”
button a view filter gets set, so that frames which belongs to the
connection are shown only.
page 61 manual TINA / ProfiNet-WATCHDOG V1.08
Page 62

4.3.9 application protocols
The selection of the application protocol (OSI layer 5 to 7) while the
frame analyzing process is running, isn't as easy as it is on the protocols
on OSI layer 2 to 4, because it isn't unique. This is because the
application layer uses the underlying protocol and ports to determine the
protocol. Although there are standard ports, they can be changed easily
(e. g. for port forwarding) and so they aren't unique anymore.
On the recording page of the device you have the possibility to change
the assignments of ports in combination with a transport protocol to an
application protocol. The assignments can be set without any restrictions.
The following table shows the default protocol assignments, which are
set on factory default:
ports transport protocol application protocol
67 UDP DHCP
53 TCP; UDP DNS
137 UDP NBNS
123 UDP NTP
69 UDP TFTP
161 UDP SNMP
21 TCP FTP
80 TCP HTTP
25 TCP SMTP
110 TCP POP
143 TCP IAMP
5060 TCP; UDP SIP
102 TCP TPKT
1720 TCP Q931
34962,
34963
TCP; UDP PN-RT
manual TINA / ProfiNet-WATCHDOG V1.08 page 62
Page 63
ports transport protocol application protocol
135 TCP DCE/RPC
34964 TCP; UDP PN-IO
(CM via DCE/RPC)
0, 7, 9 UDP WOL
5355 TCP; UDP LLMNR
1900 UDP SSDP
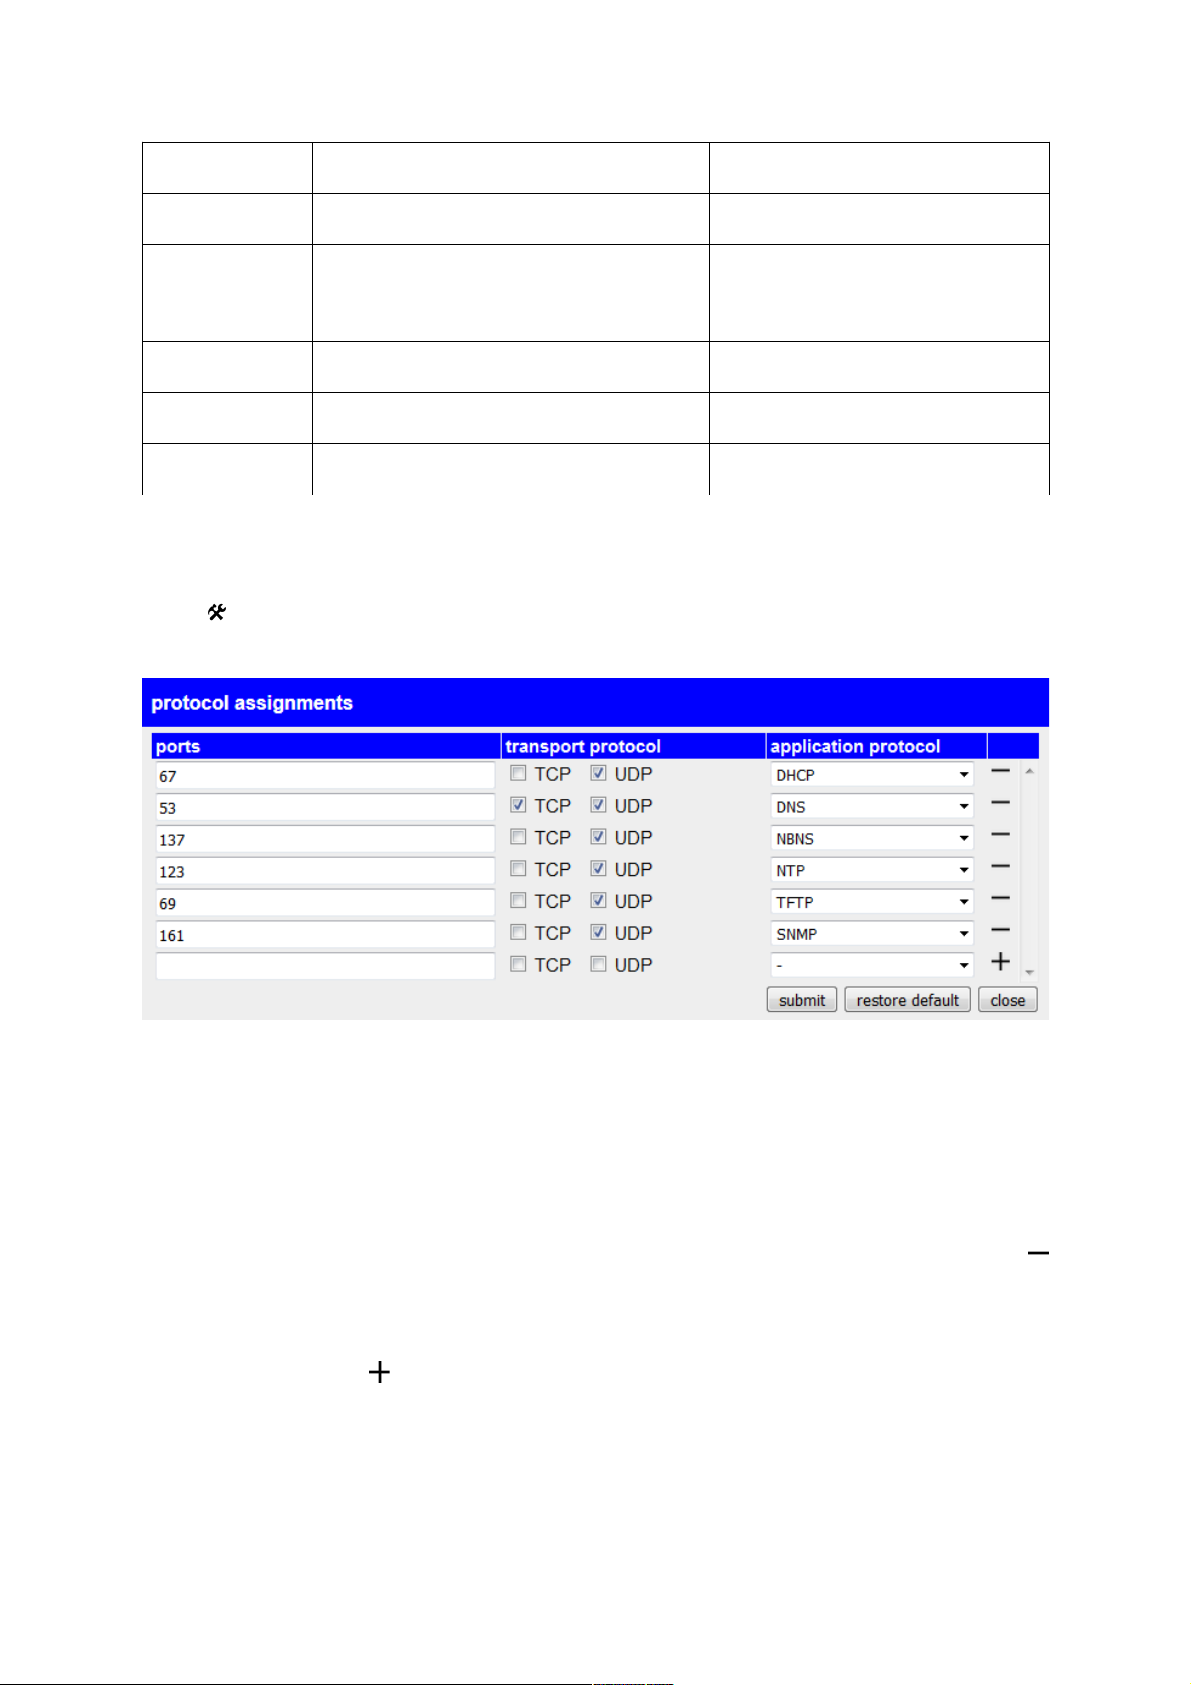
If you want to show or edit the protocol assignments you can click on the
icon , which can be found above the table in the toolbar. Now you
should see the following dialog:
Every row of the table represents an assignment. If you want to
associate multiple ports with a single assignment you can separate them
with a comma (e. g. 123,124). The check boxes on the column “transport
protocol” allows you to specify on which transport protocols the
assignment is valid. The last column specifies the application protocol.
If you want to delete an existing assignment you can click on the
symbol at the end of the row.
If you want to add a new assignment you have to fill out the last row and
finally click on the symbol.
After you have configured your assignments you can click on the
“submit” button to save the assignments. Through that all frames with a
application protocol are getting reanalyzed. Furthermore the assignment
page 63 manual TINA / ProfiNet-WATCHDOG V1.08
Page 64
get's saved on the device, so the assignments aren't lost after changing
the web page or rebooting the device. If you click on the “close” button or
somewhere outside the dialog the dialog get's closed and the
assignments are discarded.
If you want to restore to the default protocol assignments you can click
on the button “restore default”. After clicking on the button it is necessary
to click on the “submit” button to save and submit the assignments.
4.3.10 save recording
If you want to store the recording data (that means the frames which are
shown in your browser), you can export the recording which is shown in
your browser, in a file format, which is also used by the Wireshark
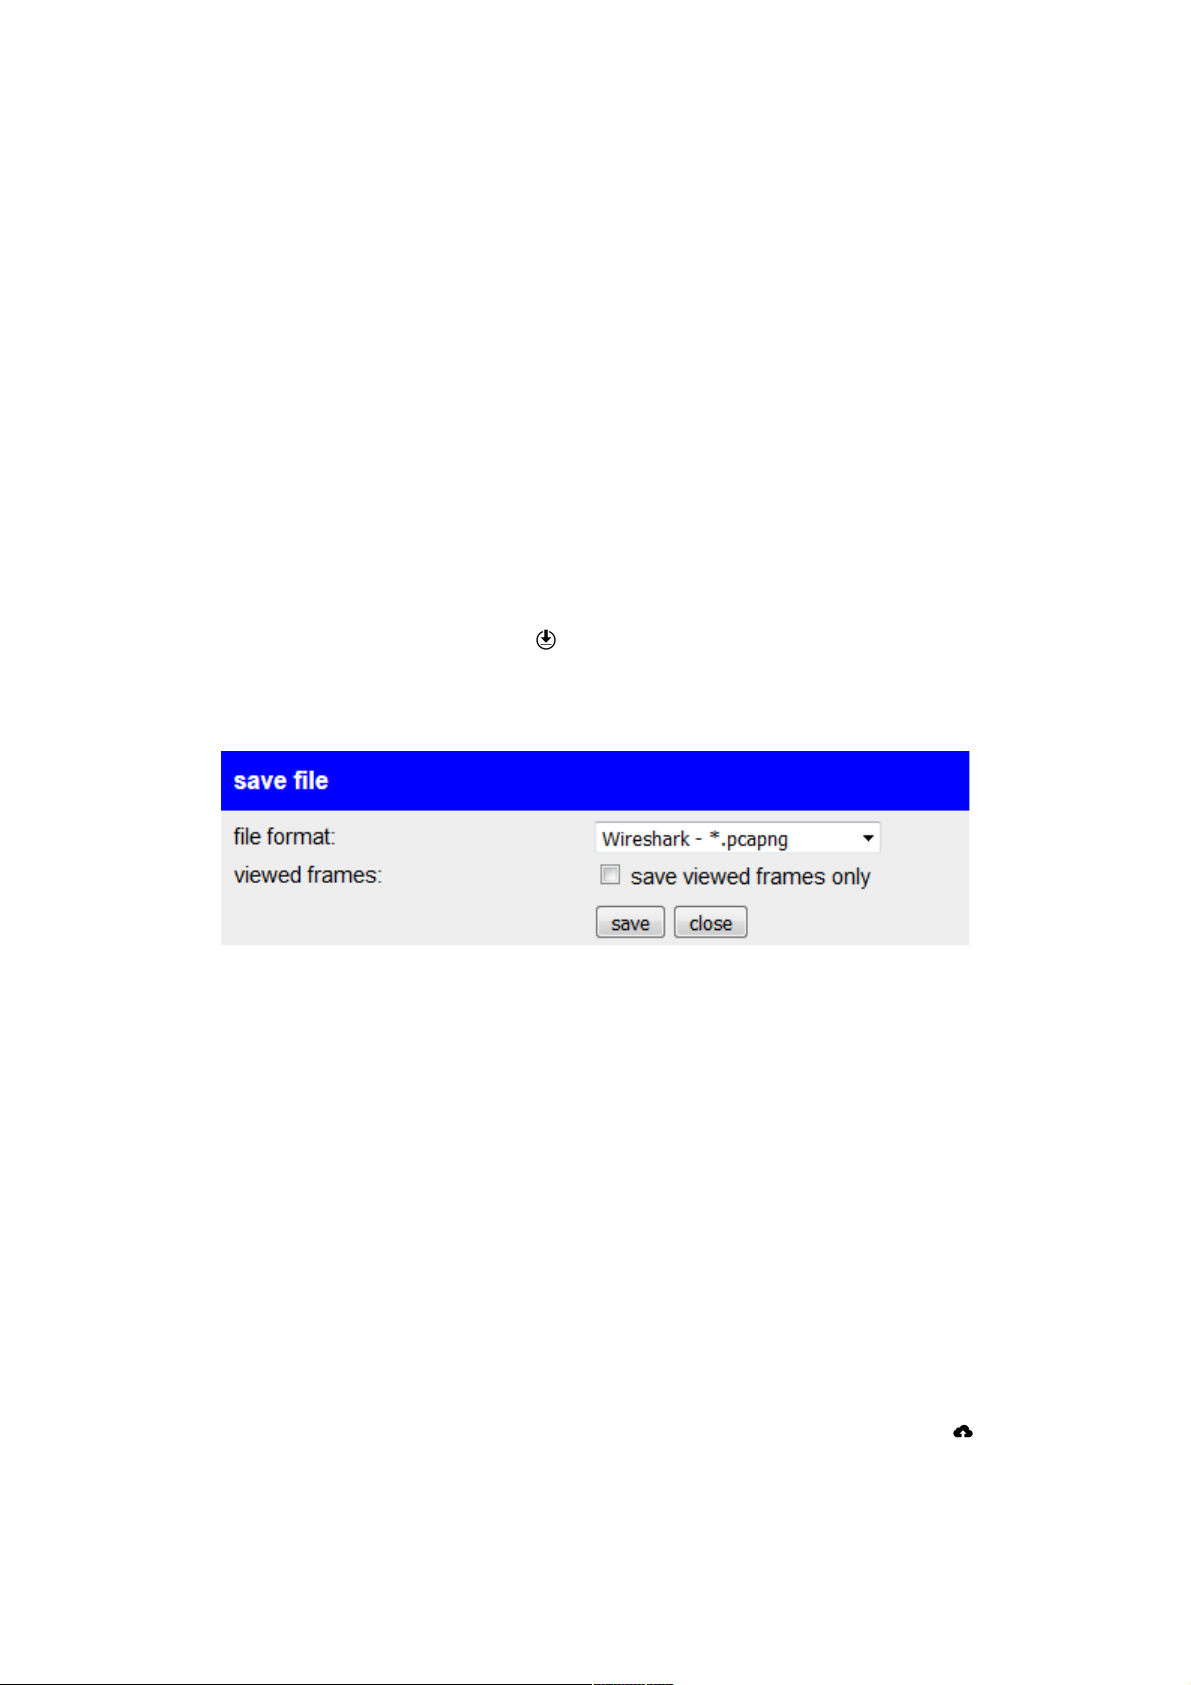
software. Therefore the symbol is available in the toolbar.
Now you should see a pop-up which looks similar to the following:
In the pop-up you can choose in which file format (.pcapng or .pcap) you
want to save the recording. Also it's possible to save only frames, which
are currently shown (depends on the view filter) in the browser.
With a click on the button “save” you will get (depending on your browser
settings) a download prompt. Some browsers are storing the file directly
to the download folder.
4.3.11 open recording
On the recording page you have also the possibility to open an existing
recording file (.pcapng or .pcap file format). In this process it does not
matter if the file was created by Wireshark or by one of your analyzer
devices. For opening a recording file you just have to click on the icon.
manual TINA / ProfiNet-WATCHDOG V1.08 page 64
Page 65
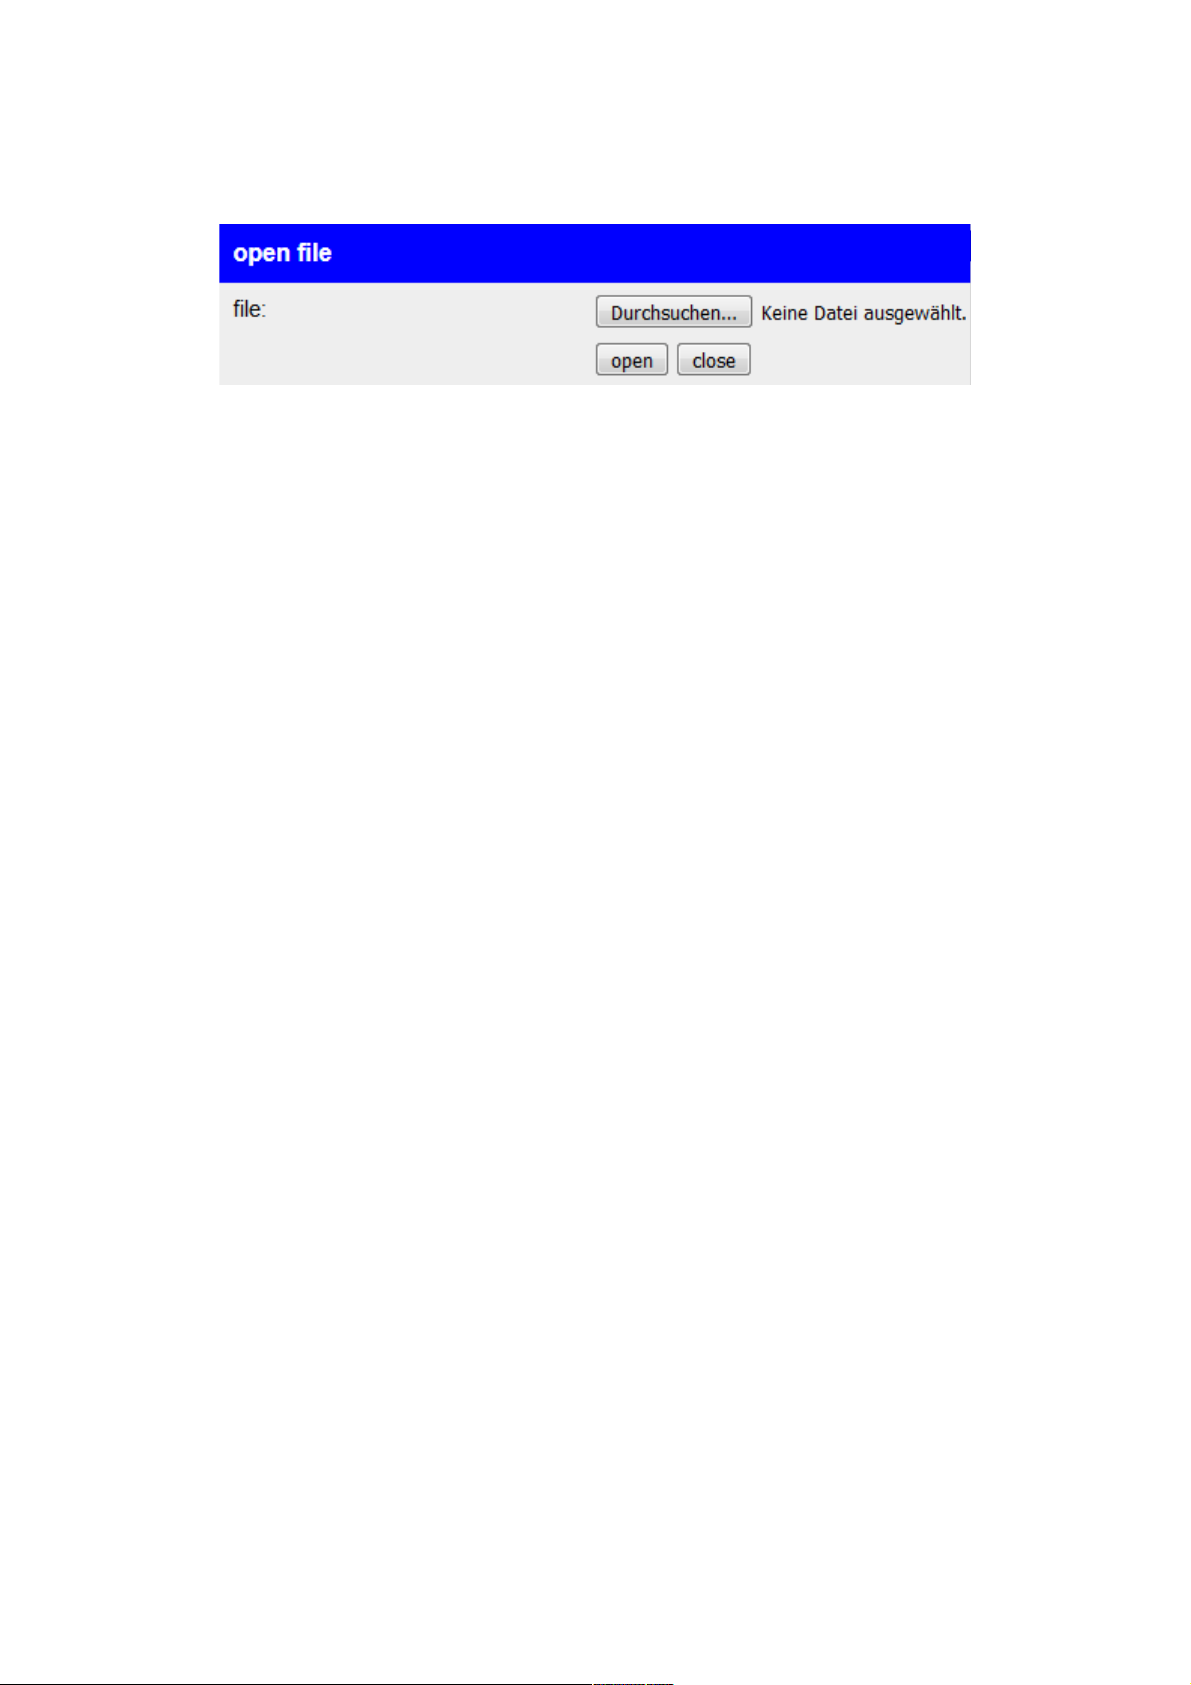
After you have clicked on the icon you will see a pop-up similar to the
following:
If you have selected a file you can click on the “open” button. Now the file
get's read in and the frames from the file are shown in your browser
window.
page 65 manual TINA / ProfiNet-WATCHDOG V1.08
Page 66
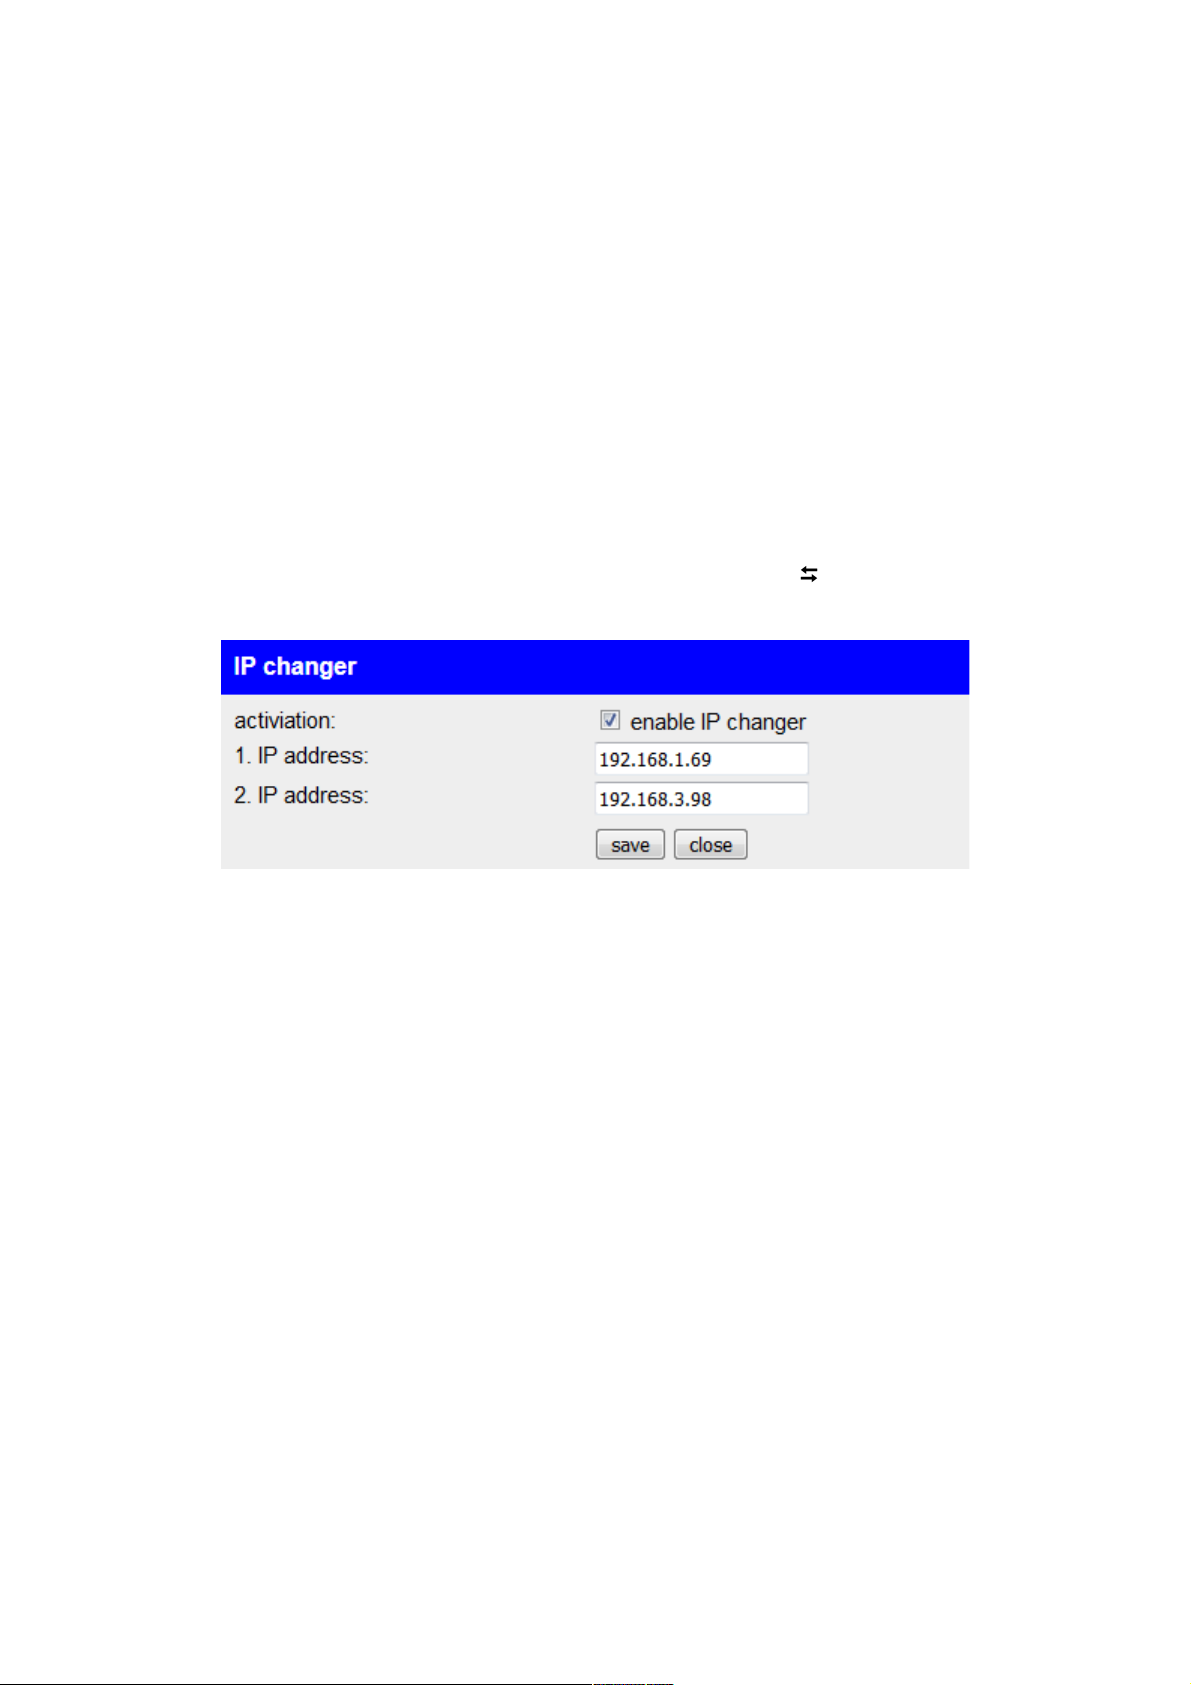
4.3.12 IP changer
The analyzer has a function to swap IPv4 addresses so two devices who
are in a different subnet can be brought in the same subnet and so they
can communicate with each other.
Therefore the IP changer have to be enabled and the two IPv4
addresses have to be configured. Furthermore the two devices have to
be connected on different interfaces. This is necessary because the
traffic has to flow trough the analyzer device. Otherwise the device can't
swap the IPv4 addresses.
To configure the IP changer you have to click on the symbol which can
be found in the toolbar. Now you should see the following dialog:
In the following example (see picture above) it's assumed that the device
with the IP address 192.168.1.69 is connected to the interface A and the
device with the IP address 192.168.3.98 is connected to the interface B.
As soon as the IP changer is configured and enabled the device with the
IP address 192.168.1.69 can communicate with the other device (original
IP address 192.168.3.98) with the help of the “virtual” IP address
192.168.1.98. The same procedures applies to the other way around.
Hint:
The IP changer changes only the first three bytes of the IP address.
The fourth and last byte remains preserved.
Important:
The device doesn't check if the virtual IP address is available in
your network. If the IP address is already in used and you enable
the IP changer an IP conflict occurs.
manual TINA / ProfiNet-WATCHDOG V1.08 page 66
Page 67
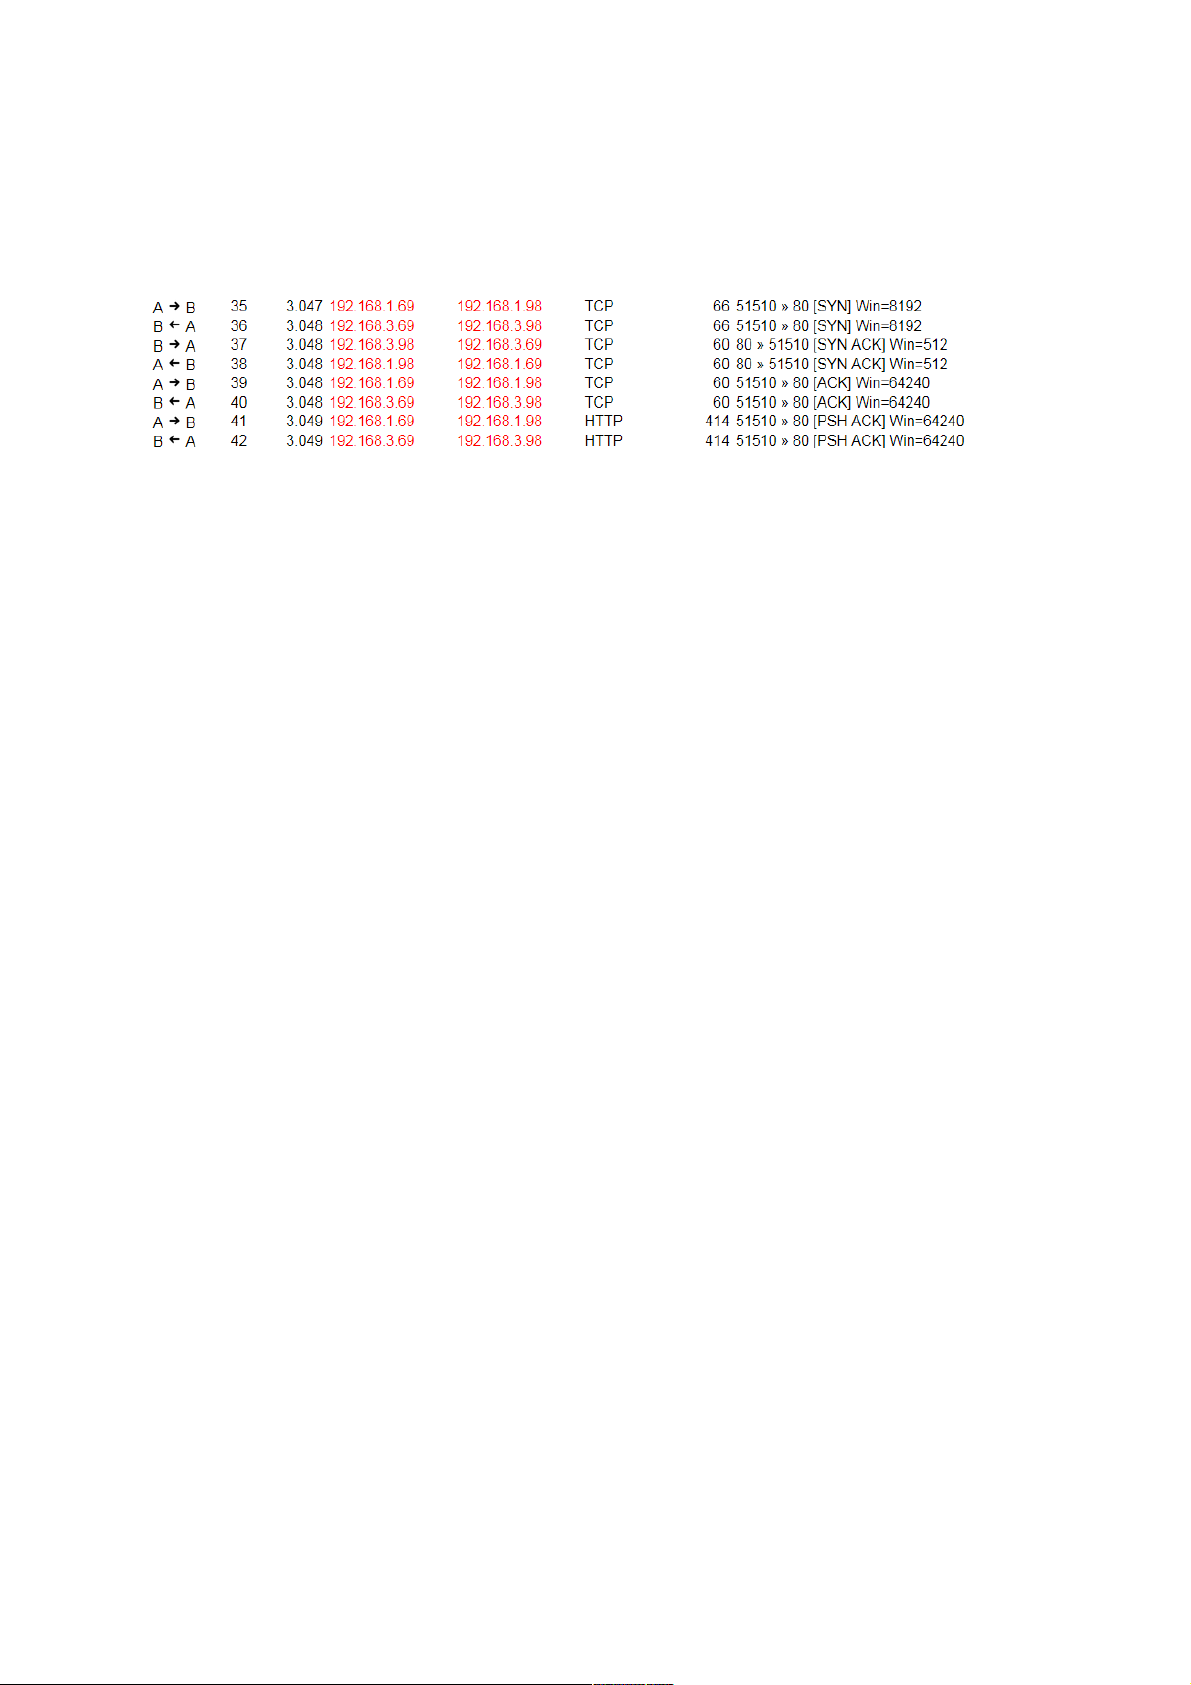
If you start a recording in your web browser (now it's useful to record on
the interface “A and B”) you can see how the IP addresses are changed.
The IP address fields of frames with an IP address which get's or already
was changed are colored in red:
Furthermore you can see a tool-tip with some information to the IP
changer if you position your cursor above the address fields.
Hint:
The IP changer hasn't any function on the ProfiNet-WATCHDOG.
page 67 manual TINA / ProfiNet-WATCHDOG V1.08
Page 68

4.3.13 network monitoring
Additionally to the views and tools for the analyzing of the network the
analyzer devices you have the possibility to configure and execute a
monitoring of your network.
The in-going frames separated by interface A and B are used as basis
for the network monitoring. The monitoring thereby can be freely
configured to monitor MAC and / or IP addresses for burglaries (unknown
addresses) and / or failures (addresses which aren't communicated for a
specific time).
Burglaries, this means occurrences of addresses which are not learned
in, can be viewed directly (with the complete frame) in the web browser
via the recording mode “monitoring”, sent to a FTP server or written to a
USB stick. Furthermore you can view a list with burglaries on the web
page as well as sending burglaries directly as an e-mail.
The monitoring of failures checks the communication times of addresses.
This means if an address doesn't communicate for the specified time the
address is considered as failed. The monitoring can be done on the
monitor dialog of the web page (viewing the first and last communication
time as well as a complete log of failures). If enabled, failures can also
be sent via e-mail.
manual TINA / ProfiNet-WATCHDOG V1.08 page 68
Page 69
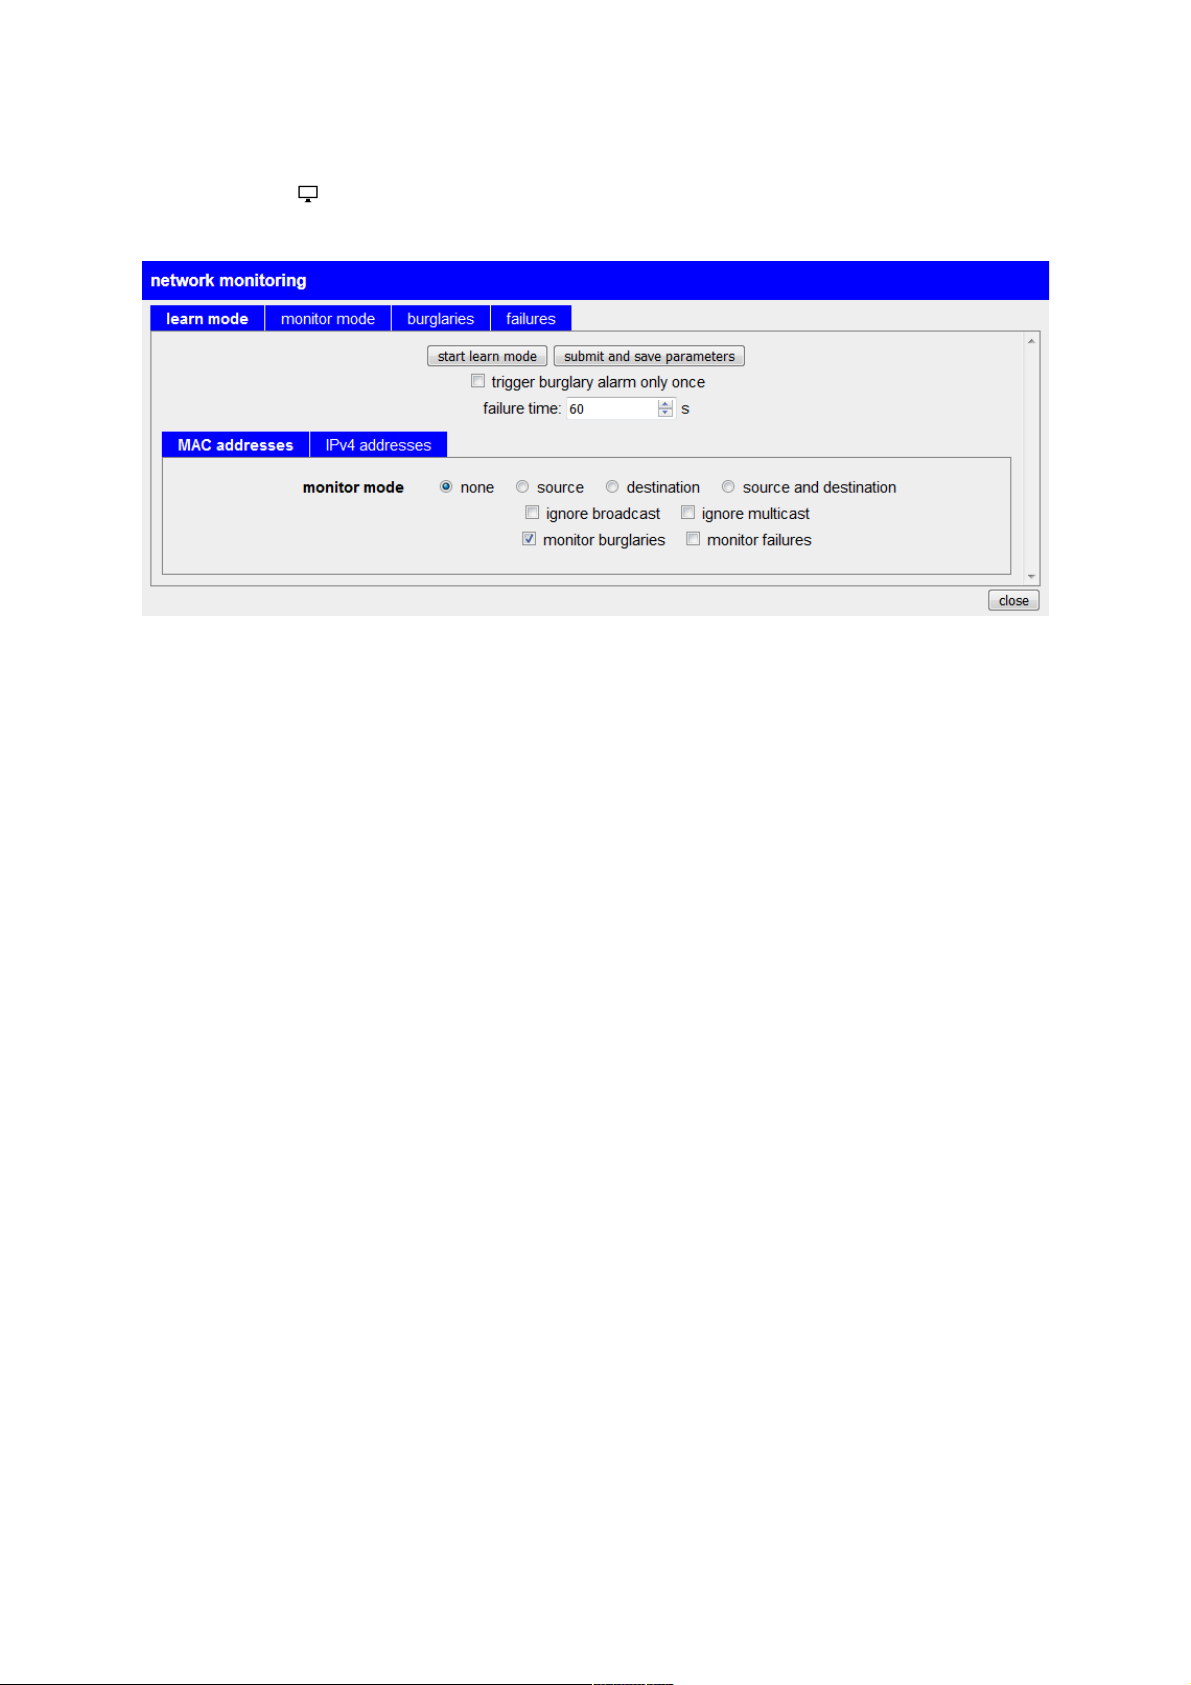
To setup the network monitor or view the current state you have to click
on the icon which is located in the toolbar. Now you should see the
following dialog:
The dialog has a bar with the following tabs:
• learn mode: Here you can set the parameters for the network
monitoring and (if desired) start the automatically learning of
addresses.
• monitor mode: Here you can view and adapt the current
parameters of the network monitoring and manage the addresses
of the monitoring.
• burglaries: Here you have the possibility to manage a list with
addresses who have triggered a burglary alarm.
• failures: Here you have the possibility to manage a list with
addresses who have failed for a specific time or still be considered
as failed.
Before you can begin the monitoring of your network you have the setup
some parameters.
Therefore the tab “learn mode” have to be selected. Now you should
configure the following general parameters:
• trigger burglary alarm only once: Determines if an alarm on a
burglary should be triggered only once for each address. Otherwise
an alarm is triggered on each frame with a burglary.
• failure time: The time in seconds within the address have to
communicate before it's considered as failed.
page 69 manual TINA / ProfiNet-WATCHDOG V1.08
Page 70

Below the general parameters you will find another bar with tabs.
Thereby each tab defines another address type which can be configured
with the following parameters:
• monitor mode: selection which addresses of the address type
should be monitored:
◦ none: The addresses aren't monitored.
◦ source: Only the source address is monitored.
◦ destination: Only the destination address is monitored.
◦ source and destination: Each combination of source and
destination addresses are monitored.
• ignore broadcast: Determines if broadcast addresses should be
ignored for the monitoring (only applicable for the modes
“destination” and “source and destination”).
• ignore multicast: Determines if multicast addresses should be
ignored for the monitoring (only applicable for the modes
“destination” and “source and destination”).
• monitor burglaries: Determines if burglaries (new addresses)
should be monitored.
• monitor failures: Determines if failures (addresses which haven't
communicate for the specified time) should be monitored.
If you have set all settings you can start the learn mode by clicking on
the button “start learn mode”. While the learn mode is running all
addresses which are currently occurring on the network are inserted to
the list.
The list with addresses should be expanding automatically depending on
the number of devices in your network. If you think all addresses are
learned in you can stop the learn mode with the button “stop learn
mode”.
manual TINA / ProfiNet-WATCHDOG V1.08 page 70
Page 71
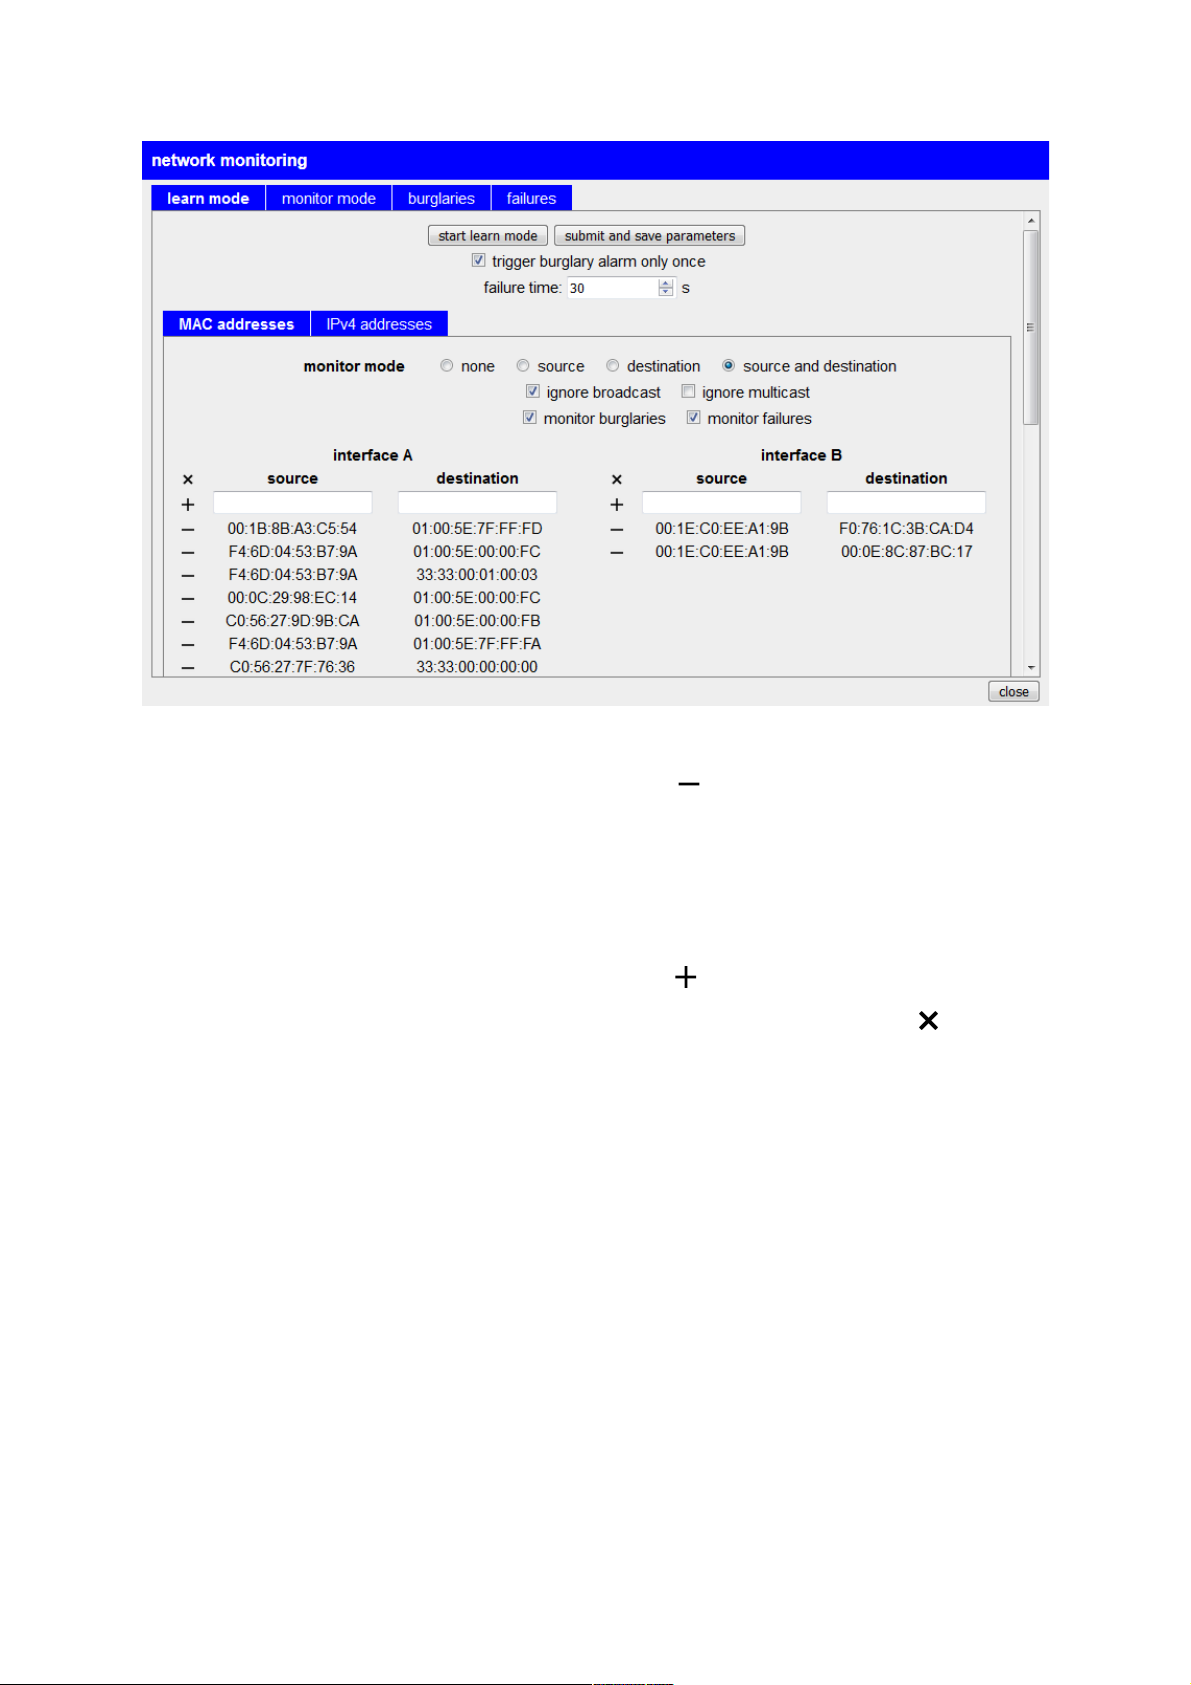
If needed you still can remove addresses from the list manually.
Therefore you just need to click on the icon of the corresponding
address entry.
In addition the removing of an address you also can add new addresses
to the list (e. g. if they haven't communicated during the learn mode). If
you want to add an address you have to enter the address(es) on the
first row of the table and finally click on the icon.
Furthermore you can clear a full address list by clicking on the icon.
If you want to see the first and last communication time of an address (if
available) you have to move your cursor to an address entry. The
information will be shown as tool-tip. This feature is available even if the
failure monitoring is disabled.
Hint:
The learn mode can be executed again at any time. A running
monitoring isn't affected by the learn mode.
page 71 manual TINA / ProfiNet-WATCHDOG V1.08
Page 72

When you aren't satisfied with the parameters you can still change the
parameters even if the automatically learn mode was run.
Alternatively you could also add all addresses manually after setting the
parameters. In this case an automatically learn mode isn't needed.
If you want to start the monitoring with the specified parameters and
addresses you have to click on the button “submit and save parameters”.
Now you will be redirected to the tab “monitor mode”.
On this tab you can still add missing addresses by using the symbol,
remove addresses by using the symbol and clear an address list by
using the symbol.
If an address is added or removed or an address list is cleared the
running monitoring is affected immediately. If the changes should be
available after a reboot of the analyzer you have to click on the “save
parameters” button, after you have finished the adding and removing of
addresses. Otherwise the changes will be lost after a reboot.
Furthermore you can change some parameters of the monitoring in the
“monitor mode” as well. If you have changed one or more parameters
you have to click on the button “save parameters”. Thereby the active
parameters and addresses are taken over for the monitoring and getting
saved in the device.
manual TINA / ProfiNet-WATCHDOG V1.08 page 72
Page 73
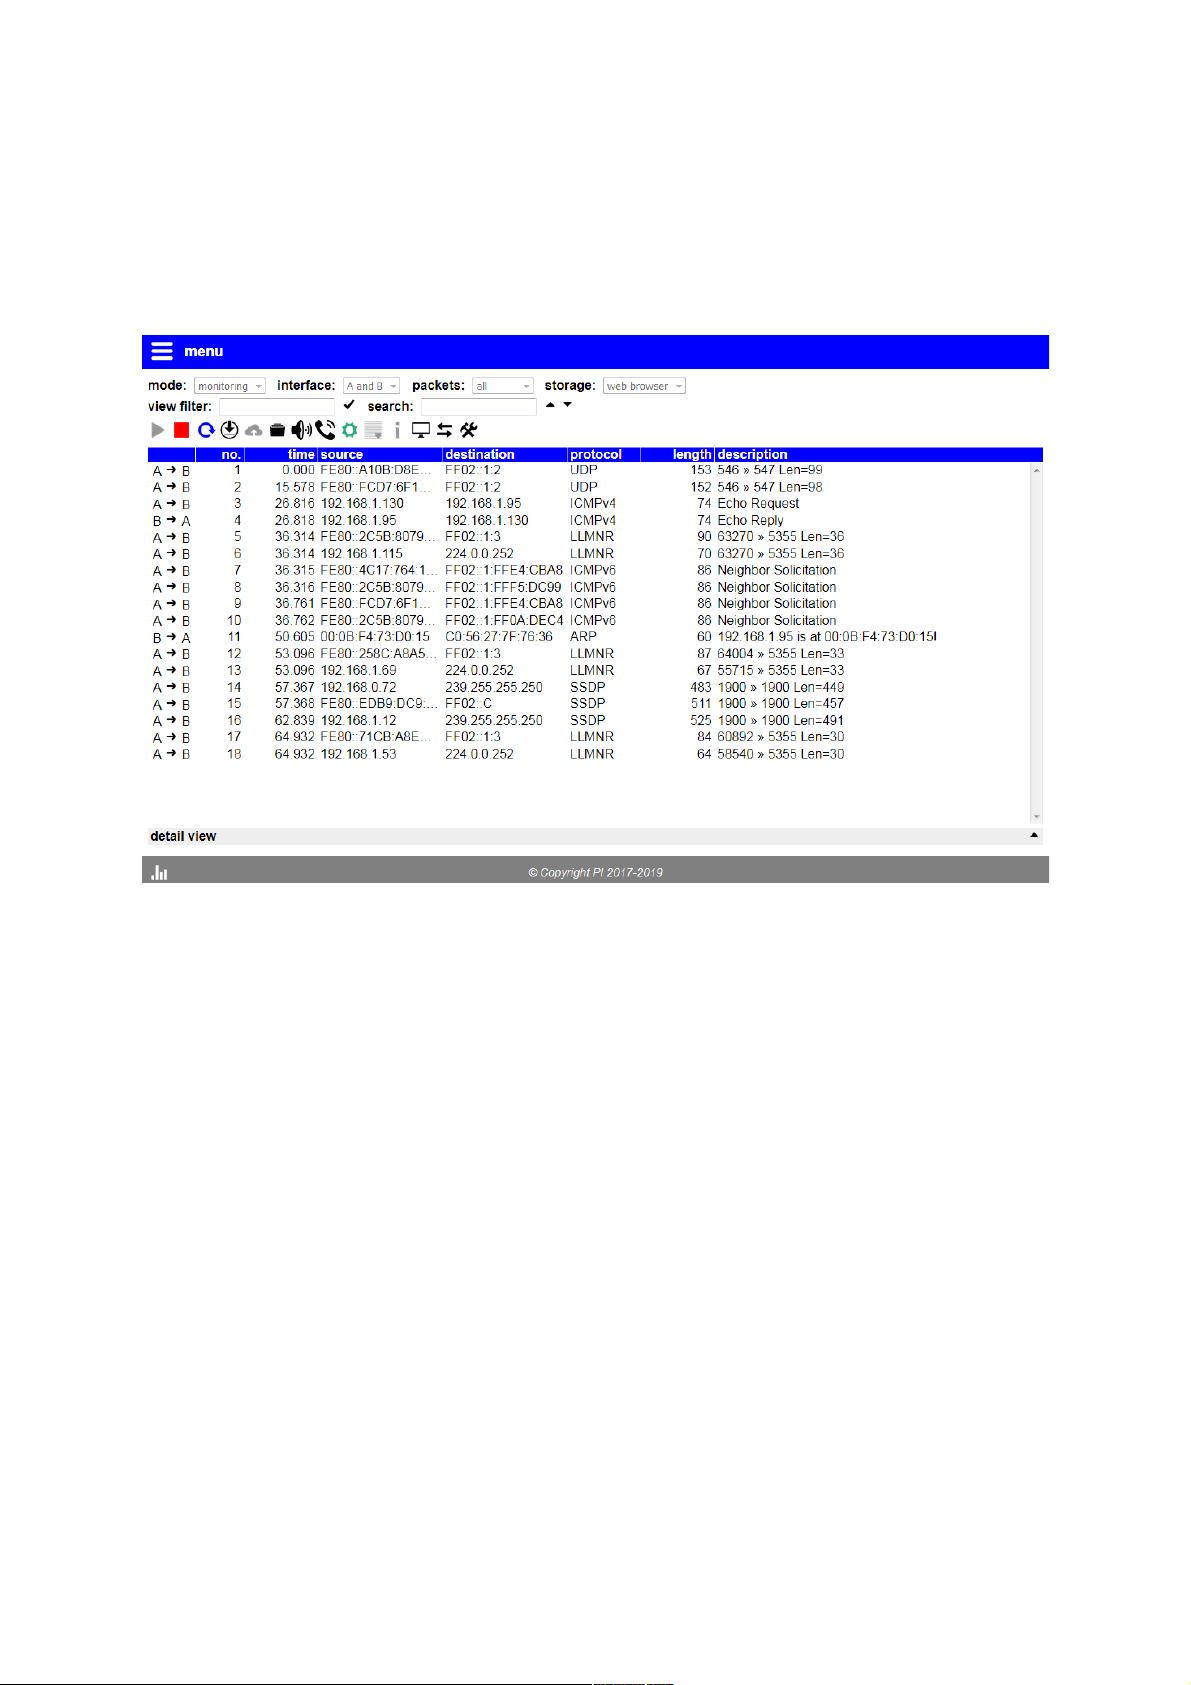
If you want to record the frames who are considered as a burglary, you
have to change the recording mode to “monitoring”. Furthermore it's
mainly useful to set the interface to “A and B”, so burglaries on both
interfaces are recorded. If the record settings are set you can start it
normally.
Hint:
Please note that on the selection “packets” the option “all” or
“received” have to be selected, because the monitoring only
respects in-going frames.
page 73 manual TINA / ProfiNet-WATCHDOG V1.08
Page 74
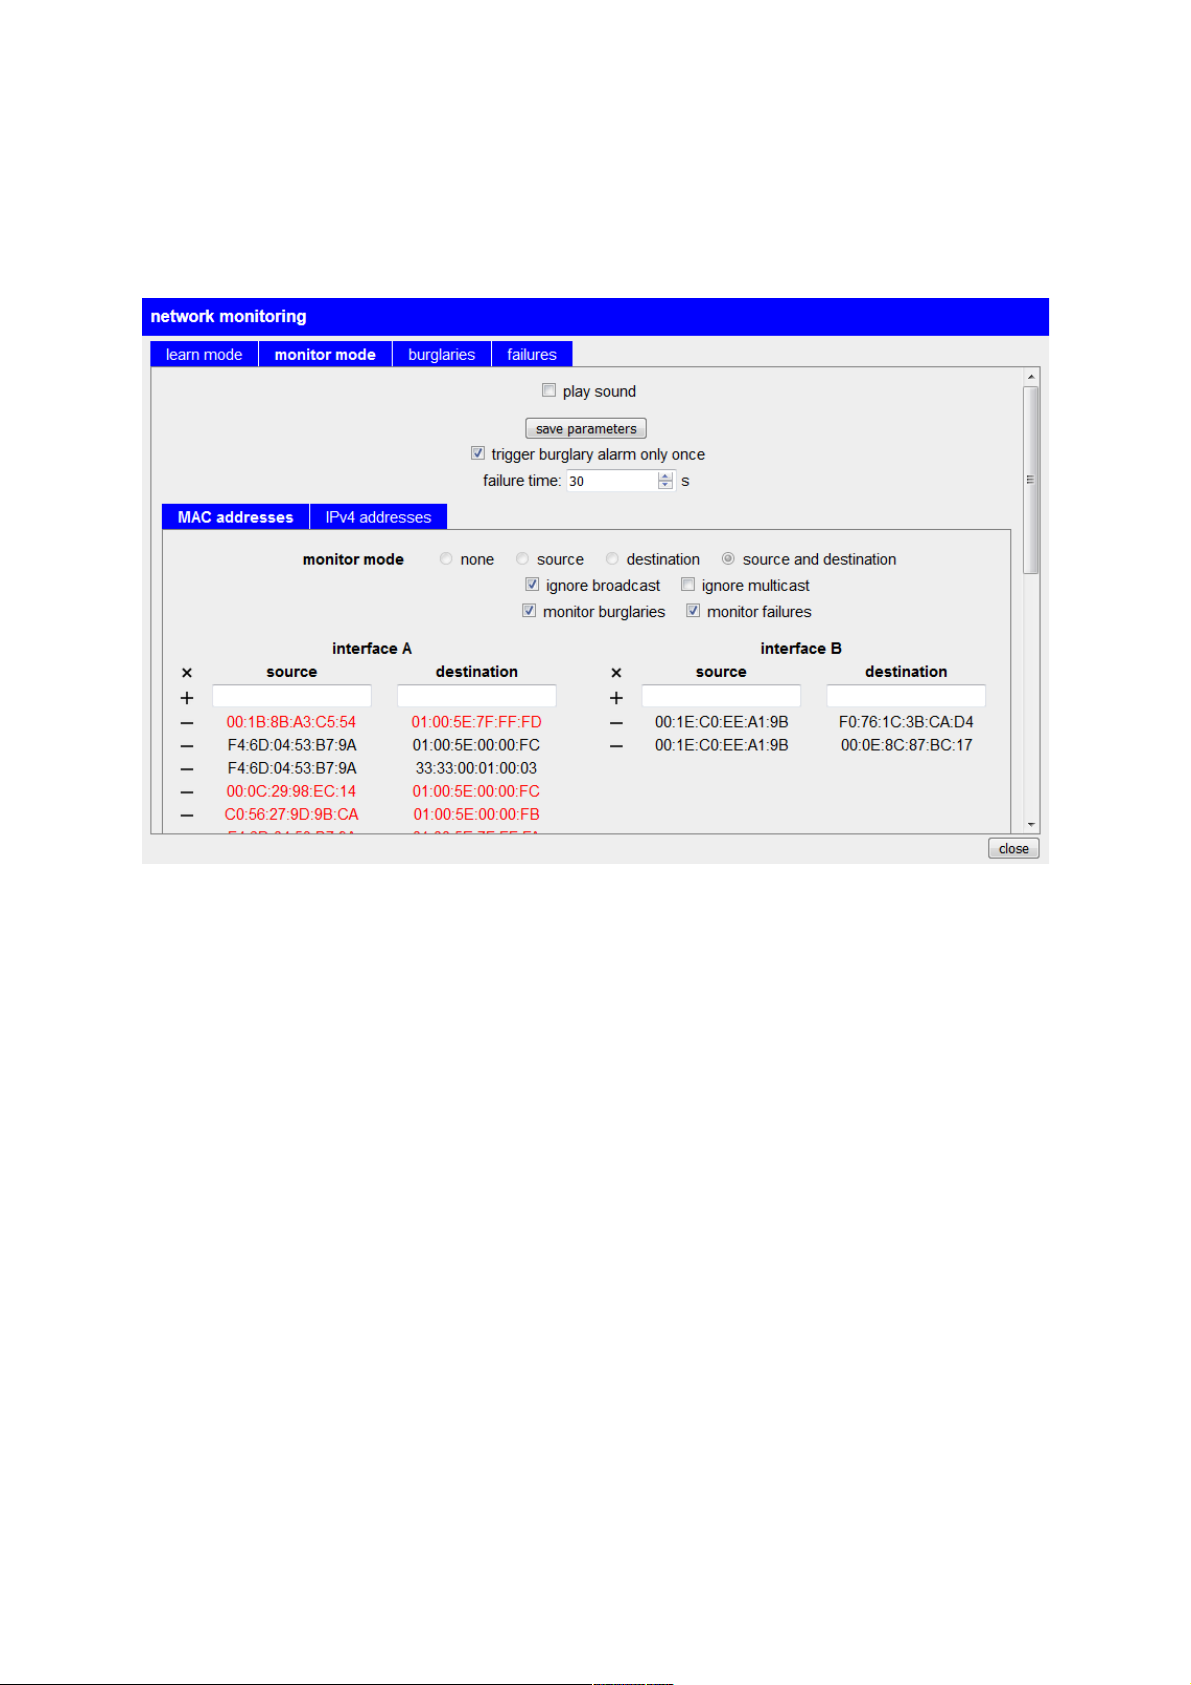
If you have enabled the monitoring of failures, you can see the state of
the addresses on the tab “monitor mode”. Addresses which are
considered as failed are colored in red. If the text color is black the
address is (currently) not considered as failed.
If you want to keep the network monitor open within your browser and do
some other work in the meantime, it can be useful to enable the option
“play sound”. If the option is enabled a sound will be played if a burglary
(only if a monitor recording is running or the parameter “trigger burglary
alarm only once” is set) or failure has detected.
A deep sound (750 Hz) signals a failure while a high sound (1250 Hz)
signals a burglary.
Hint:
The audio playing is using the “Web Audio API” from your browser.
Some internet browsers (e. g. the Microsoft Internet Explorer and
the Android Browser) unfortunately aren't supporting this feature.
manual TINA / ProfiNet-WATCHDOG V1.08 page 74
Page 75
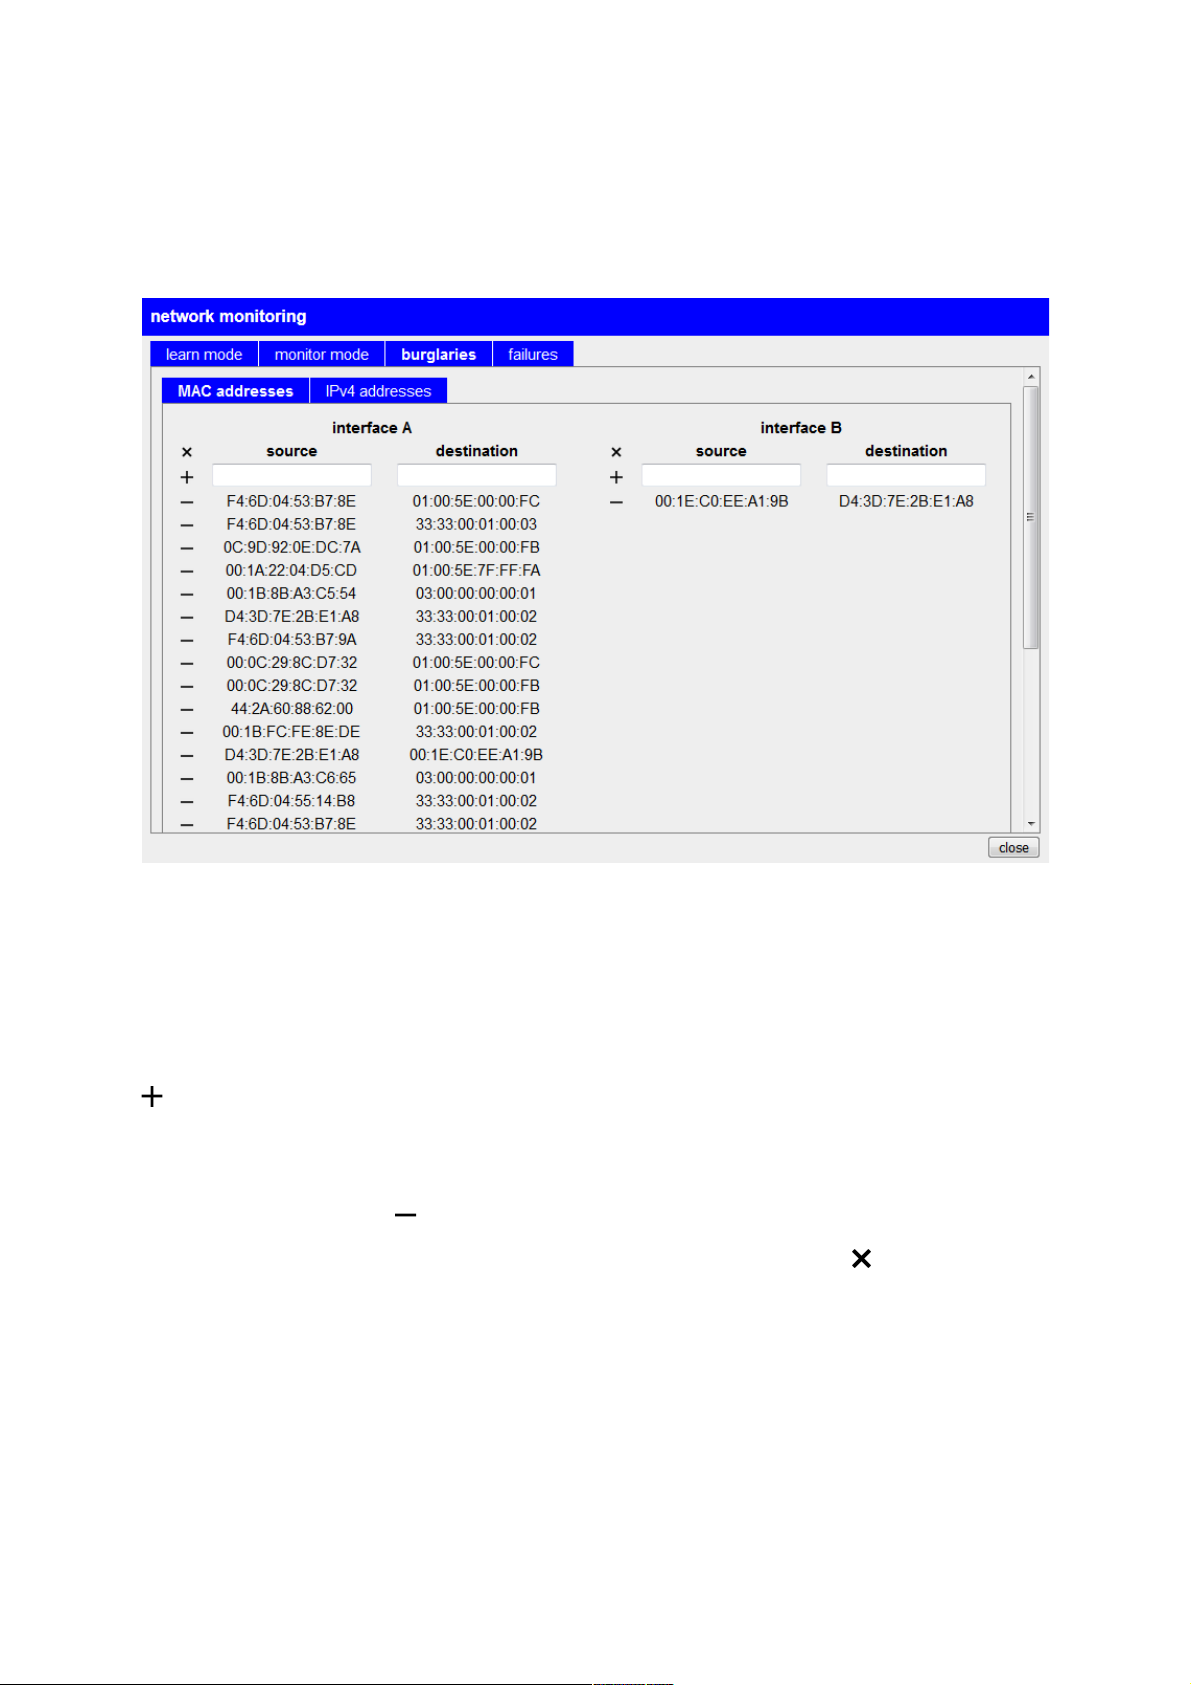
If you have enabled the burglary monitoring on one of the address types
and set the parameter “trigger burglary alarm only once” you can see
which addresses have triggered an burglary alarm already within the tab
“burglaries”:
On this tab you will also get a tool-tip if you place your cursor on one of
the address entries. The tool-tip shows the first and last communication
time which represents the first and last detection of a burglary.
If an specific address shouldn't trigger an alarm temporarily you can add
it to the burglary list manually by filling in the first row and clicking on the
icon. The procedure is the same as on the other tabs.
The same applies to the removing of an address. If an address which
was already triggered should be triggered again on the next occurrence
you can click on the icon of the corresponding line.
If you want to reset the complete list you can click on the icon.
Hint:
The monitoring runs automatically in your device. The lists are also
expanding if you haven't opened your web browser.
Important:
The burglary list get's cleared on a device reboot.
page 75 manual TINA / ProfiNet-WATCHDOG V1.08
Page 76
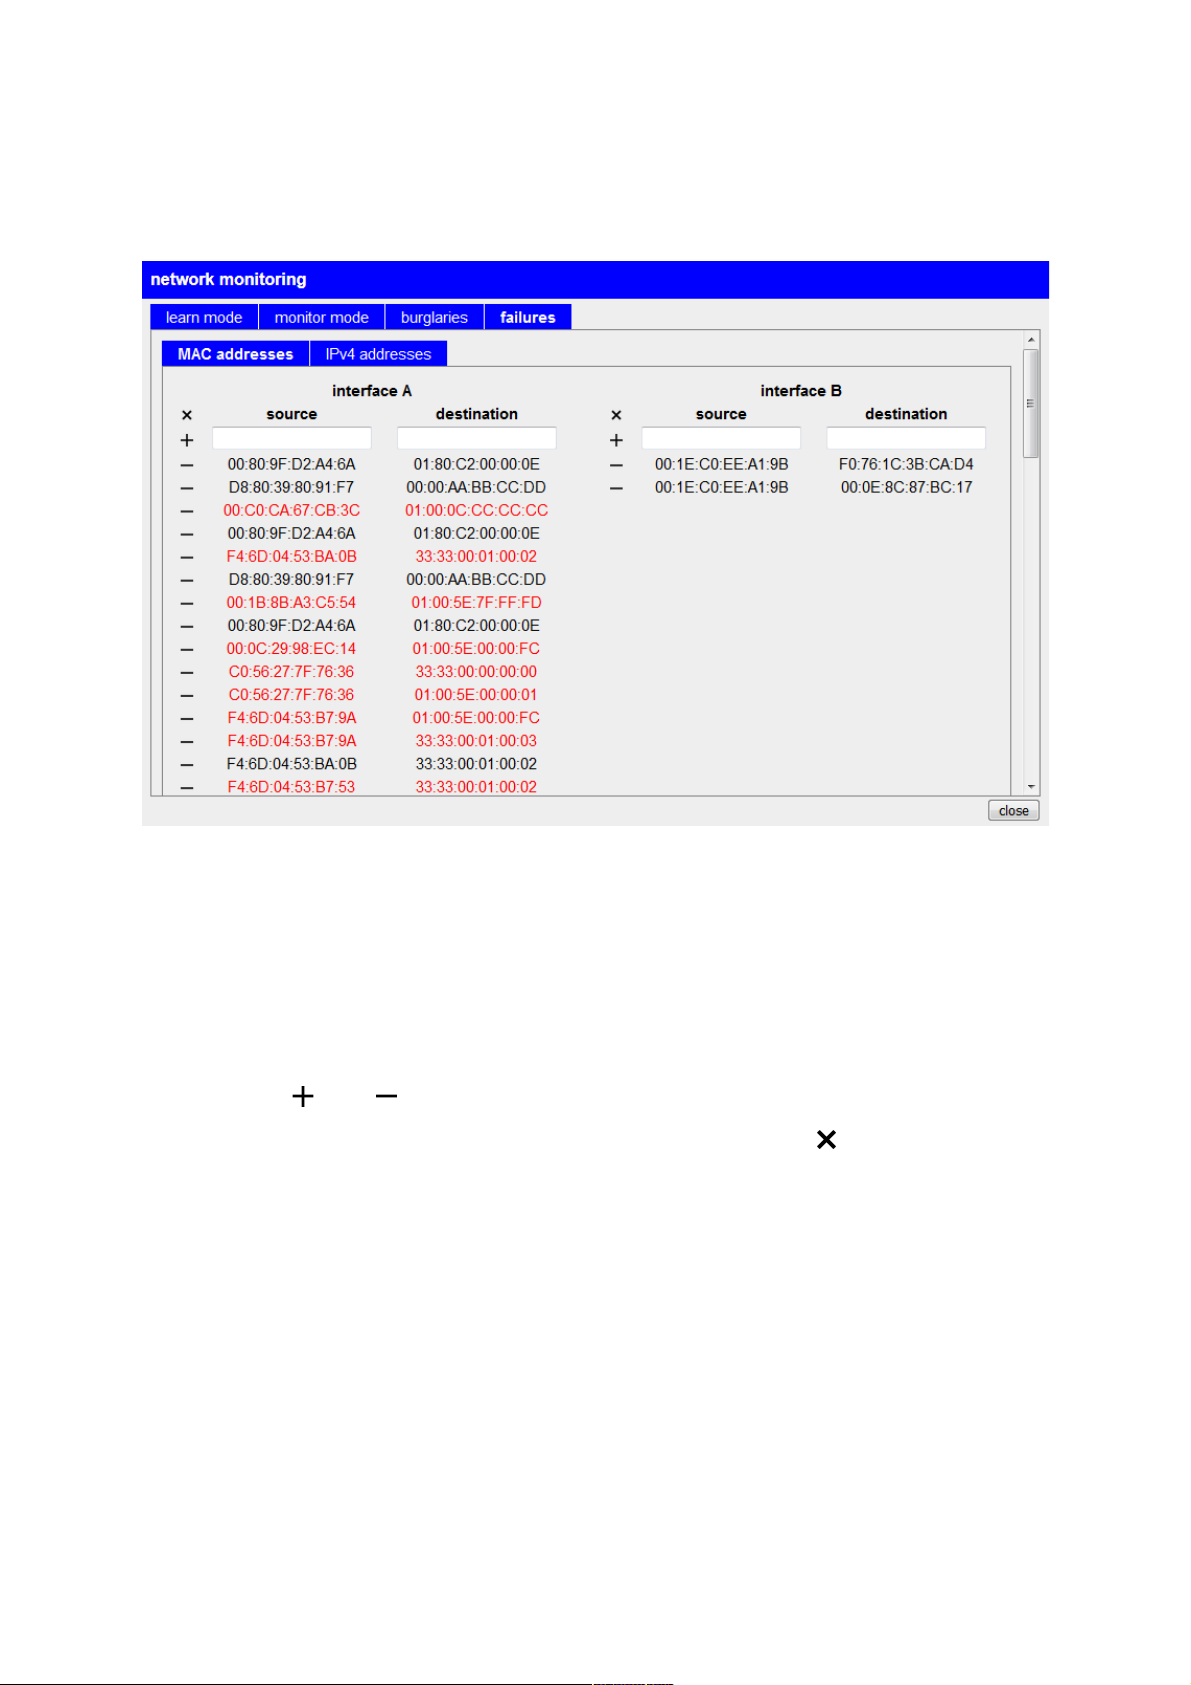
If the failure monitor is enabled, you can view a log of failures within the
tab “failures”. There you will see all failures since the starting of
monitoring:
The newest failure will be shown on the first row. If an address hasn't
returned since the failure, the entry will be colored in red. Otherwise the
text color will be black. If you want to view the time or time span of the
failure, you can move the cursor on the entry and the information will be
shown as tool-tip.
Even if the adding and removing of entries in the failure log with the help
of the icons and is possible, this won't affect the failure monitoring.
If you want to clear the failure log you can click on the symbol.
Hint:
The monitoring runs automatically in your device. The lists are also
expanding if you haven't opened your web browser.
Important:
The failure list get's cleared on a device reboot.
manual TINA / ProfiNet-WATCHDOG V1.08 page 76
Page 77

As mentioned earlier the network monitoring can also sent burglaries and
failures via e-mail. Therefore you have to configure the SMTP server on
the configuration page as well as enable the option “enable monitoring”
(see also chapter web server → configuration → SMTP server).
The e-mail shipping runs in parallelism to the analyzing and monitoring
which can be done via the web browser. This means it is possible that a
monitor recording in your web browser is running as well as burglaries
and failures are sent by e-mail.
Important:
Please note that depending on your configuration an e-mail gets
sent for each burglary and failure. This can lead to an enormous
number of e-mails. You should check your settings carefully before
enabling the e-mail shipping.
page 77 manual TINA / ProfiNet-WATCHDOG V1.08
Page 78
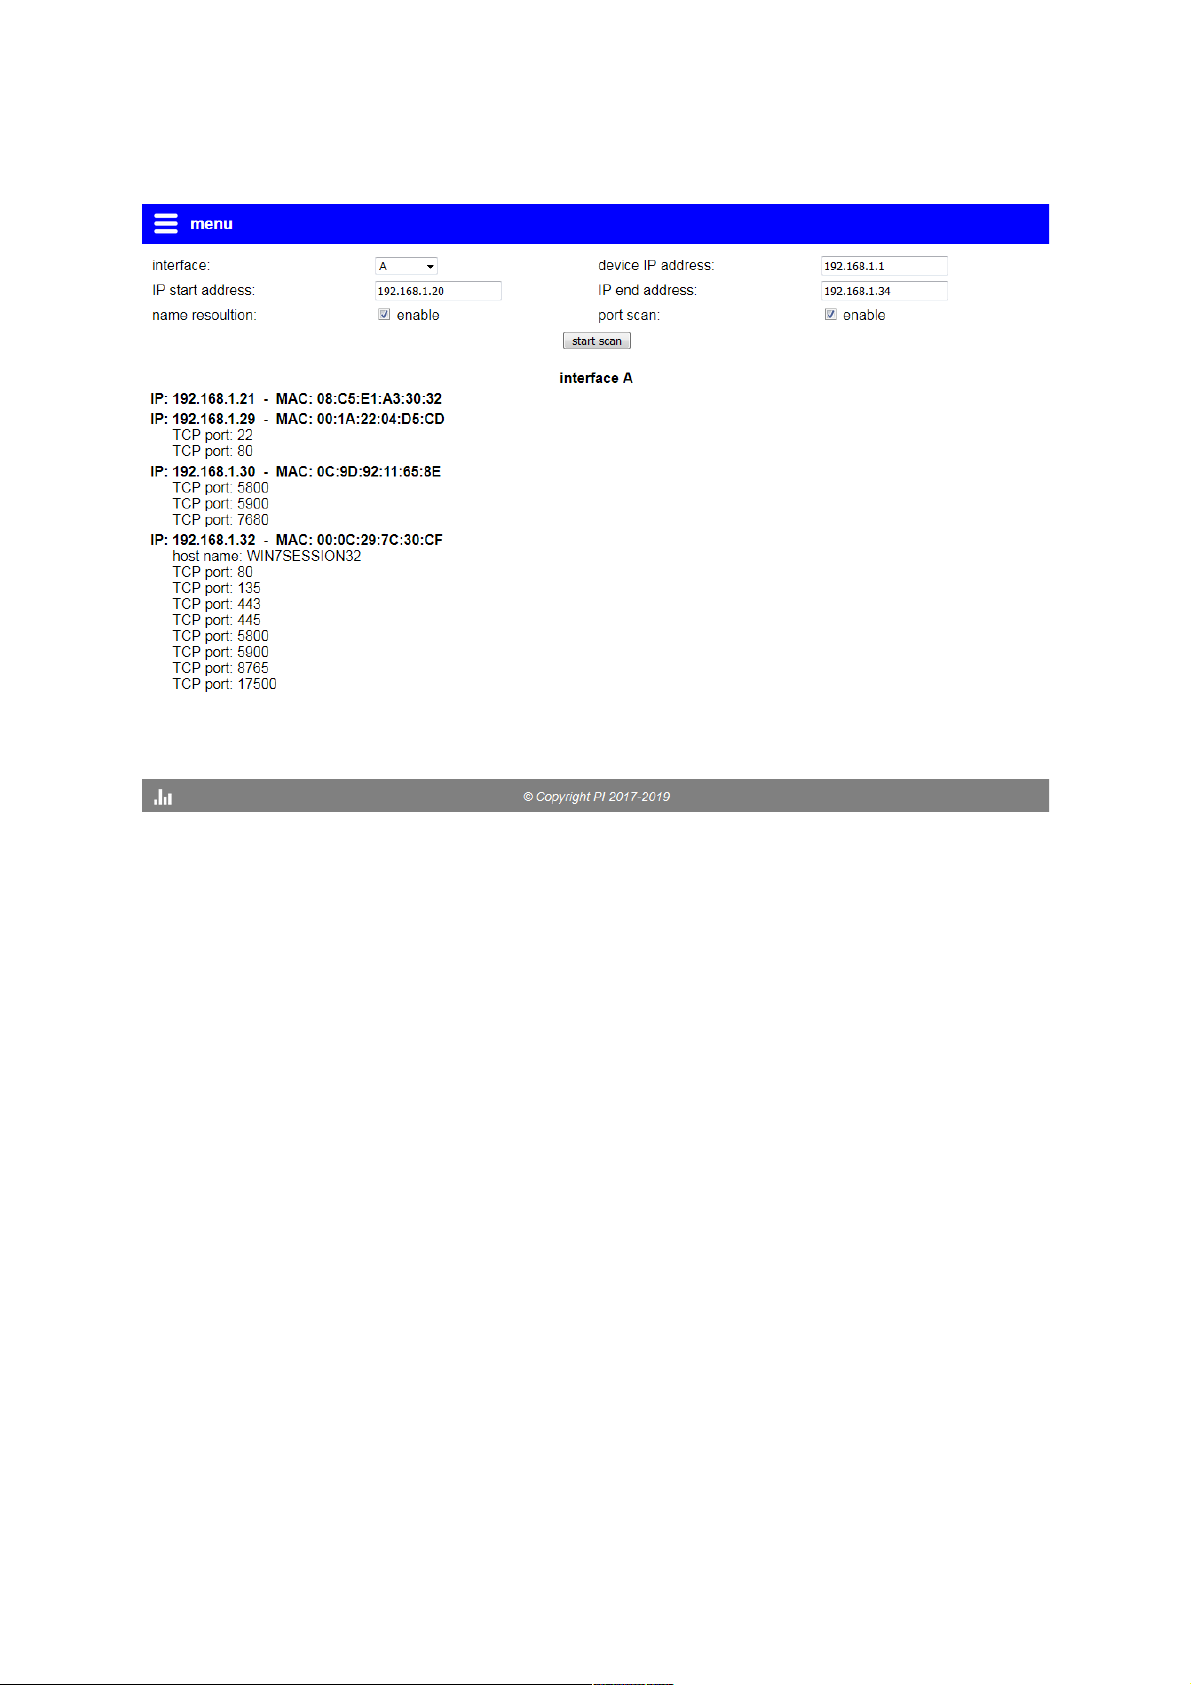
4.4 page network scan
On the page “network scan” you have the possibility to execute a scan of
your network. Thus you can determine which devices are available on
your network.
Before you can start a scan you will have to specify some settings. The
following settings are available:
interface: The interface on which the scan should be
executed. It is also possible that the scan is
executed on both interfaces.
device IP address: The IP address which should be used from the
device during the scan.
IP start address: The first IP address of the range which should be
scanned.
IP end address: The last IP address of the range which should be
scanned.
name resolution: Determines if the host name of the founded
devices should be determined.
manual TINA / ProfiNet-WATCHDOG V1.08 page 78
Page 79

port scan: Determines if the TCP ports of the founded
devices should be checked.
Important:
Please make sure that the chosen device IP address is available on
the network or is the IP address of the device itself (for the web
server). Otherwise a IP conflict occurs.
If you have specified all settings you can click on the button “start scan”.
The duration of the scan depends on the size of the scan range and the
number of activated options. However it's completely normal that the
scan works a few minutes.
If you have started the scan you can abort it at any time with the “stop
scan” button. Otherwise the scan get's stopped automatically if it's
completed.
The network scan is separated in 3 steps:
1. At the first step the device checks the available network
participants. If a device was found it will be displayed on the web
page.
2. At the next step the device will try to determine the host name of
the devices which where found in step 1. Of course this step gets
only executed if the option “name resolution” is activated.
3. The last step get's only executed if the port scan is enabled. The
port scan will try to check all TCP ports (port 1 to 65535) if they are
opened.
Hint:
Please note that devices which are in a different subnet as the scan
IP address will be found on the first step, but will fail on the name
resolution and port scan.
Furthermore only devices which are on the same physically
network as the device can be found.
page 79 manual TINA / ProfiNet-WATCHDOG V1.08
Page 80

After the network scan is finished you can sort the result by IP addresses
and port numbers by clicking on the button “sort results”. The unsorted
list shows the sequence in which the information were collected.
Hint:
The network scan can't be used on ProfiNet-WATCHDOG devices.
manual TINA / ProfiNet-WATCHDOG V1.08 page 80
Page 81
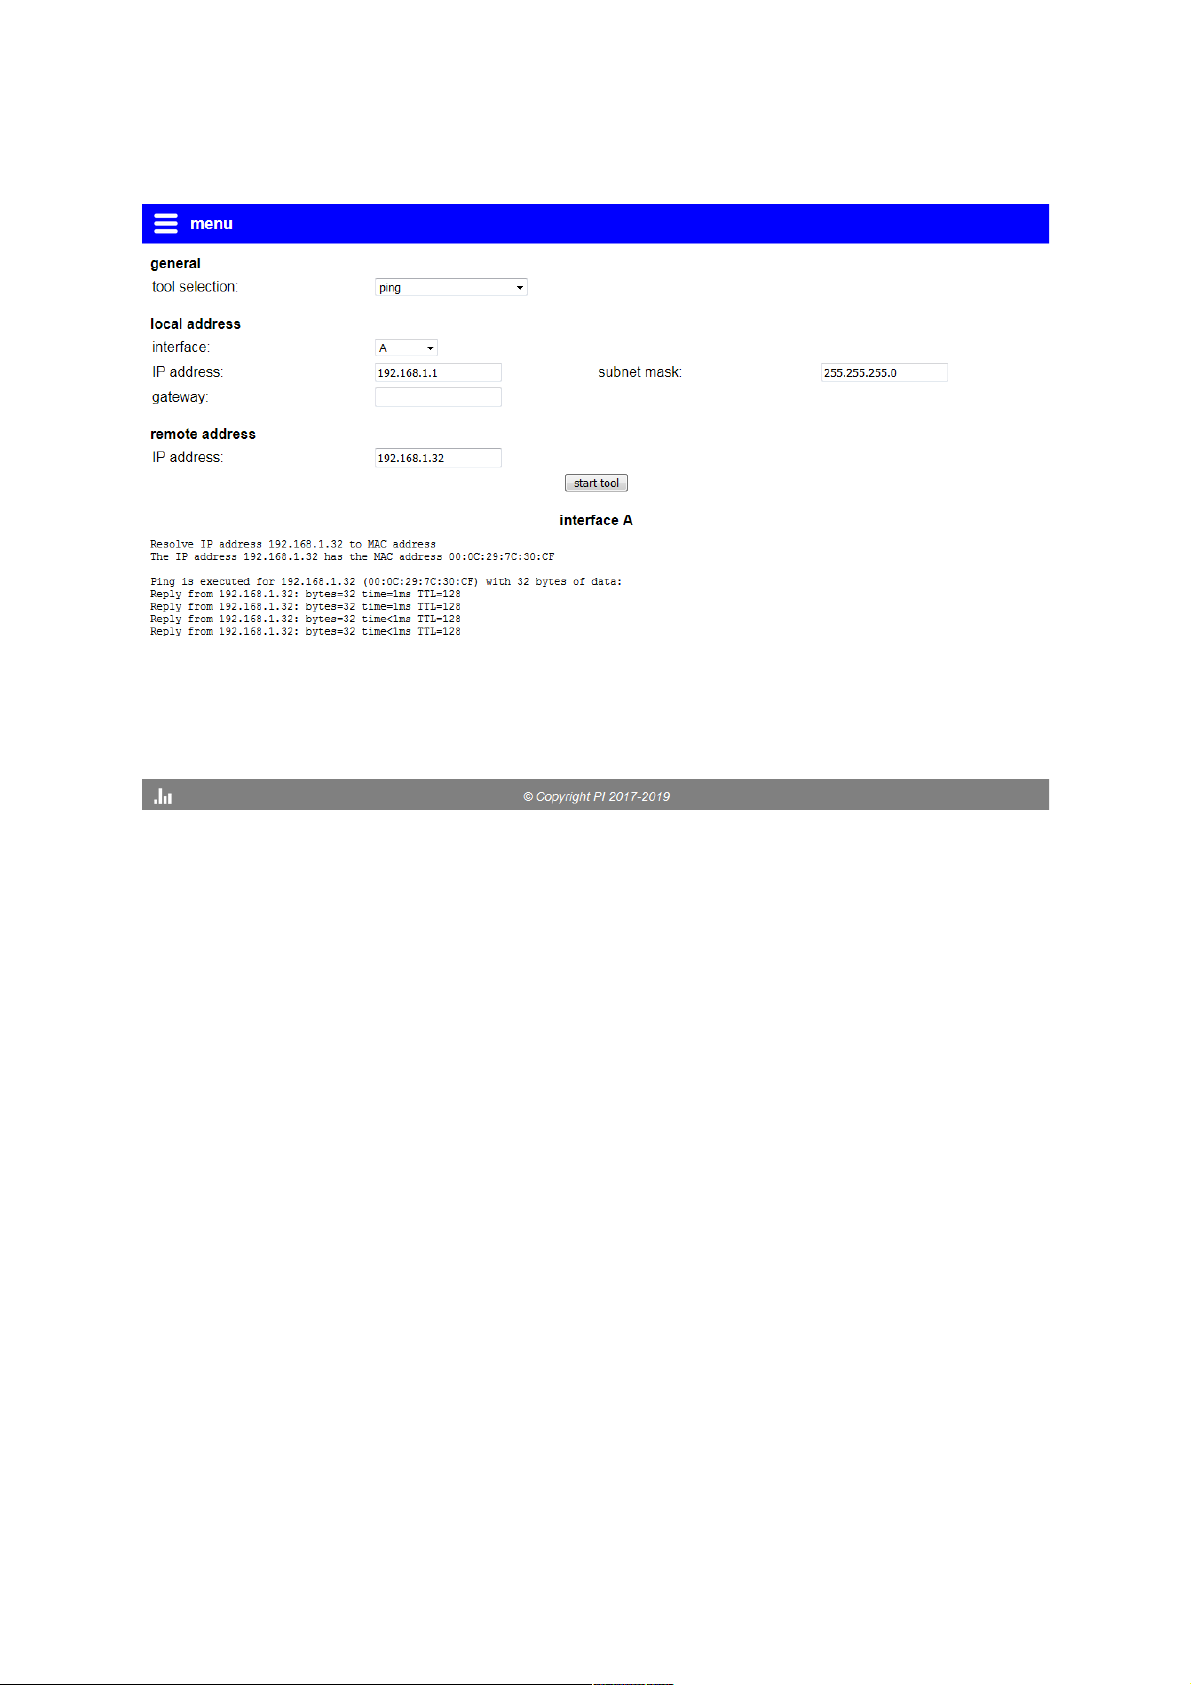
4.5 page network tools
On the page “network tools” you can execute different network tools like
ping, traceroute, “Wake On LAN” or name resolution.
Before you can run a network tool you have to specify some settings.
The available and needed settings are different from tool to tool.
With the list “tool selection” you can select the tool which you want to
use. After you have selected a tool, settings which aren't available for
this tool are getting hidden.
The following settings are available for the local address:
interface: The interface on which the tool should be
executed. It is also possible that the tool is
executed on both interfaces at the same time.
IP address: The IP address of the device for the tool.
subnet mask: The subnet mask of the device for the tool.
gateway: The IP address of the gateway of the device for
the tool.
page 81 manual TINA / ProfiNet-WATCHDOG V1.08
Page 82

DNS server: The IP address of the DNS server of the device
for the tool.
Important:
Please make sure that the chosen IP address is available or is the
IP address of the device itself (for the web server). Otherwise a IP
conflict occurs.
The following settings are available for the remote device:
MAC address: The MAC address of the remote device.
IP address: The IP address of the remote device.
port: The port for the remote device.
The following general settings are available:
host name: The host name, which should be resolved.
SecureOn password: The password which can be used for “Wake On
LAN”.
If you have specified all settings you can click on the button “start tool” to
execute the tool. If the tools is finished it get's stopped by itself.
Otherwise you can stop the tool manually by clicking on the button “stop
tool”.
The process and the result of the tool will be displayed in the “output
window” below the button bar.
4.5.1 resolve IP to MAC
For this tool you will have to enter the local and remote IP address. With
the help of the ARP protocol the device determines the MAC address of
the device with the entered IP address.
manual TINA / ProfiNet-WATCHDOG V1.08 page 82
Page 83

4.5.2 ping
The tool “ping” is a common tool for testing the network communication
to a network participant. The tool sends 4 pings (ICMP Echo Requests)
and is similar to windows. If you specify a gateway you can also send
pings to a device in another subnet.
4.5.3 traceroute
If you want to follow a network route the tool “traceroute” (also know an
“tracert”) could help you. The tool works very similar to windows and
sends 3 pings for each hop. The trace route will run on a maximum of 32
hops.
4.5.4 resolve NetBIOS name
To determine the IP address of a given NetBIOS name you can use the
tool “resolve NetBIOS name”. The tool sends a NetBIOS request with the
specified host name to the broadcast of the local subnet. The resolving
of the NetBIOS name is limited to the physical and logical network.
4.5.5 determine NetBIOS name
The tool “determine NetBIOS name” is the counterpart of the tool
“resolve NetBIOS name”. For this tool you don't enter a host name to get
the devices IP address rather you enter the device IP address and get
the host name.
4.5.6 resolve LLMNR name
The tool “resolve LLMNR name” is used to resolve a given host name in
a local subnet to it's IP address. Some network participants, especially
windows, are responding to NetBIOS and LLMNR requests.
4.5.7 determine LLMNR name
Similar to the tool for resolving NetBIOS names, the tool for resolving
LLMNR names has also a counterpart. This tool, “determine LLMNR
name”, can be used to get the host name of a given IP address.
page 83 manual TINA / ProfiNet-WATCHDOG V1.08
Page 84

4.5.8 resolve DNS name
With the tool “resolve DNS name” you have the possibility to resolve a
DNS name to an IP address. At the settings you have to fill in the IP
address of the DNS server and the host name. As result you will get the
IP address of the host name and some additional information (e. g. name
servers). The resolving of DNS names is, instead of NetBIOS and
LLMNR names, also possible through routers.
4.5.9 determine DNS name
In some situations it is helpful to determine the DNS name of a given IP
address. For this situation you can use the tool “determine DNS name”.
For this tool you have to specify the remote IP address instead of the
host name. As a result you will get the DNS name of the device.
4.5.10 Wake On LAN - MAC
If you want to wake up a device via network you need to send the “Magic
Packet” from the “Wake On LAN” protocol. This can be done by the tool
“Wake On LAN - MAC”. The only thing you have to do is to specify the
MAC address of the device which should be woken up. If you're using a
SecureOn password, you have to specify this as well (as IP or MAC
address). A feedback if the device was woken up can't be done, because
the protocol doesn't provides this function.
4.5.11 Wake On LAN - IP
The tool “Wake On LAN - IP” is very similar to the tool “Wake On LAN MAC”. But this tool doesn't send the “Magic Packet” directly via the
Ethernet layer rather it is send in a UDP frame. Because of that you have
to specify the local IP address. The target IP address can't be specified
because the protocol get's send to the broadcast address. Default ports
for “Wake On LAN” are 0, 7 and 9, but you can specify any port.
Hint:
The network tools can't be used on ProfiNet-WATCHDOG devices.
manual TINA / ProfiNet-WATCHDOG V1.08 page 84
Page 85
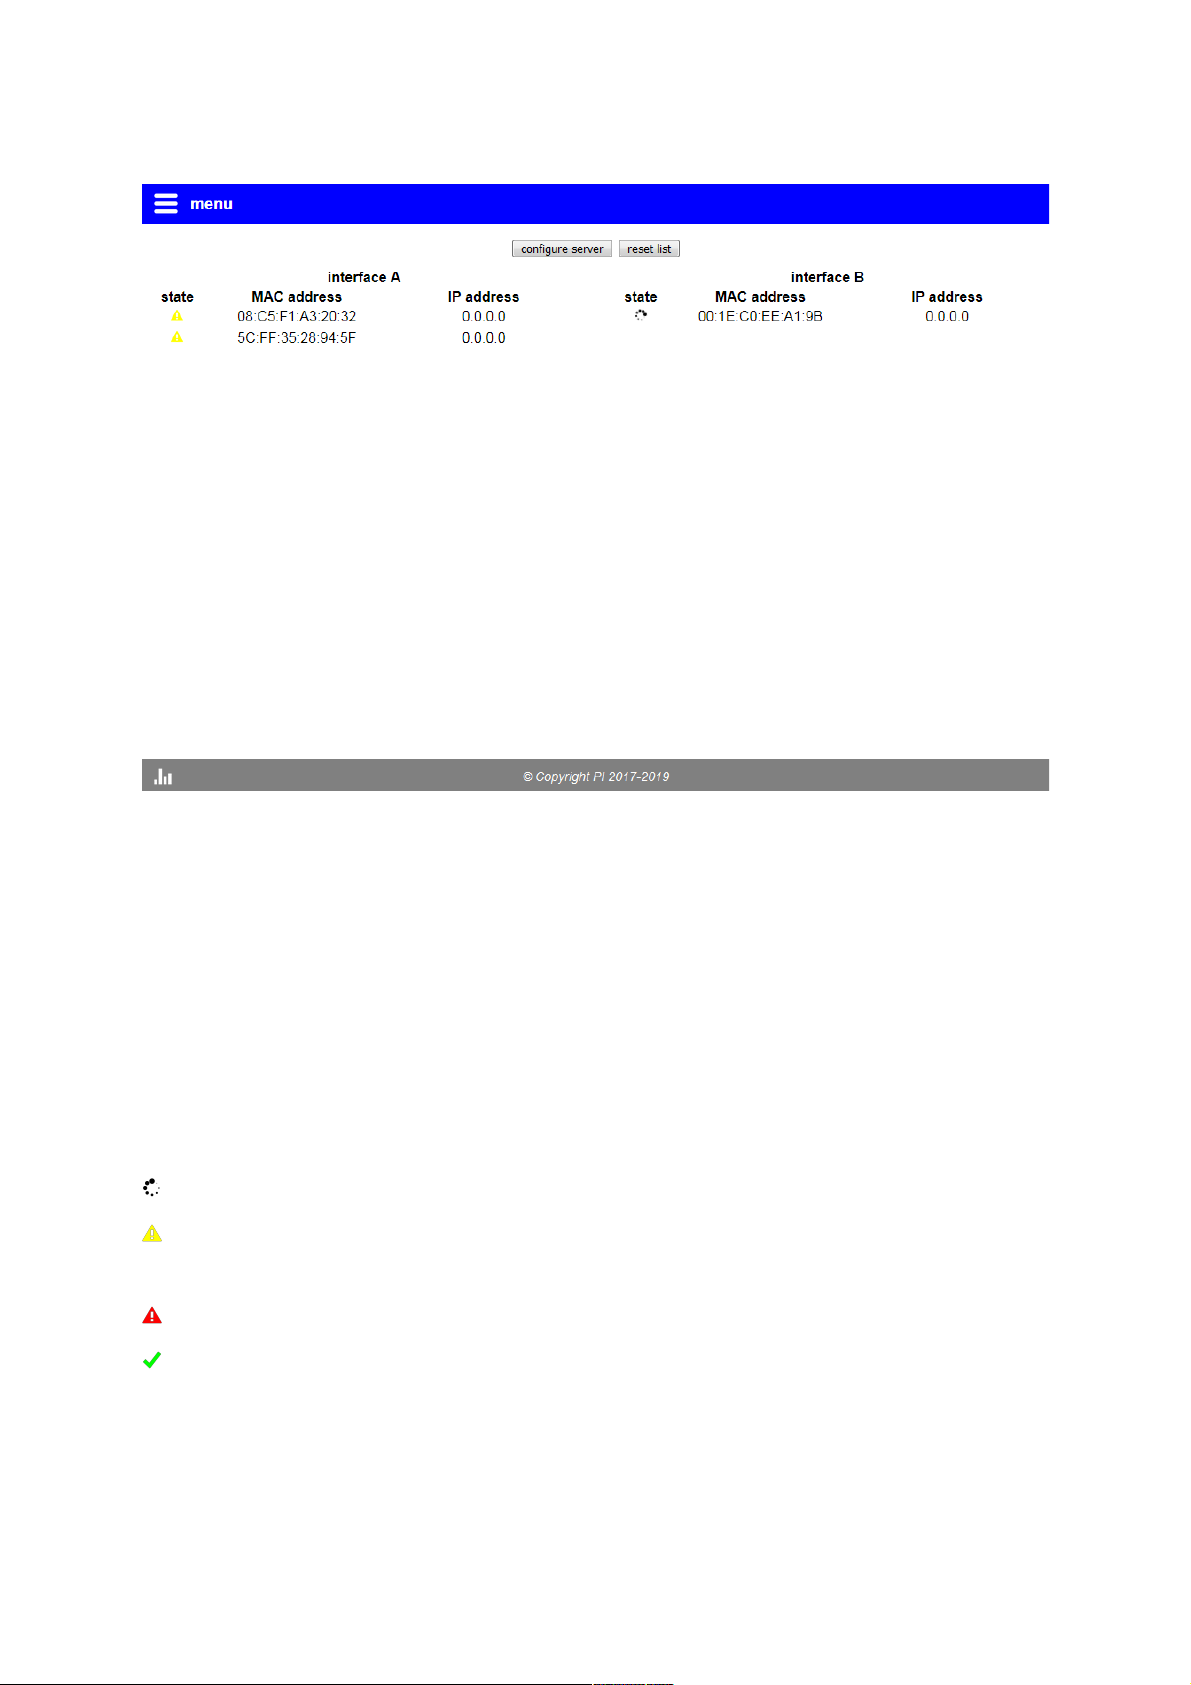
4.6 page DHCP clients
On the page “DHCP clients” you are able to list the DHCP clients which
were detected in your network. Furthermore you can assign IP
addresses to single devices.
In the table you can see that every DHCP client is shown in a separated
row with the MAC and IP address. If the DHCP client hasn't any IP
address yet, you will normally see the IP address 0.0.0.0. In the first
column you can see the state of the DHCP client. The state is shown via
an icon:
DHCP client is searching for servers
DHCP client requests an IP address / DHCP client was offered an IP
address
DHCP client or server has declined / rejected the IP address
DHCP client was assigned an IP address
page 85 manual TINA / ProfiNet-WATCHDOG V1.08
Page 86
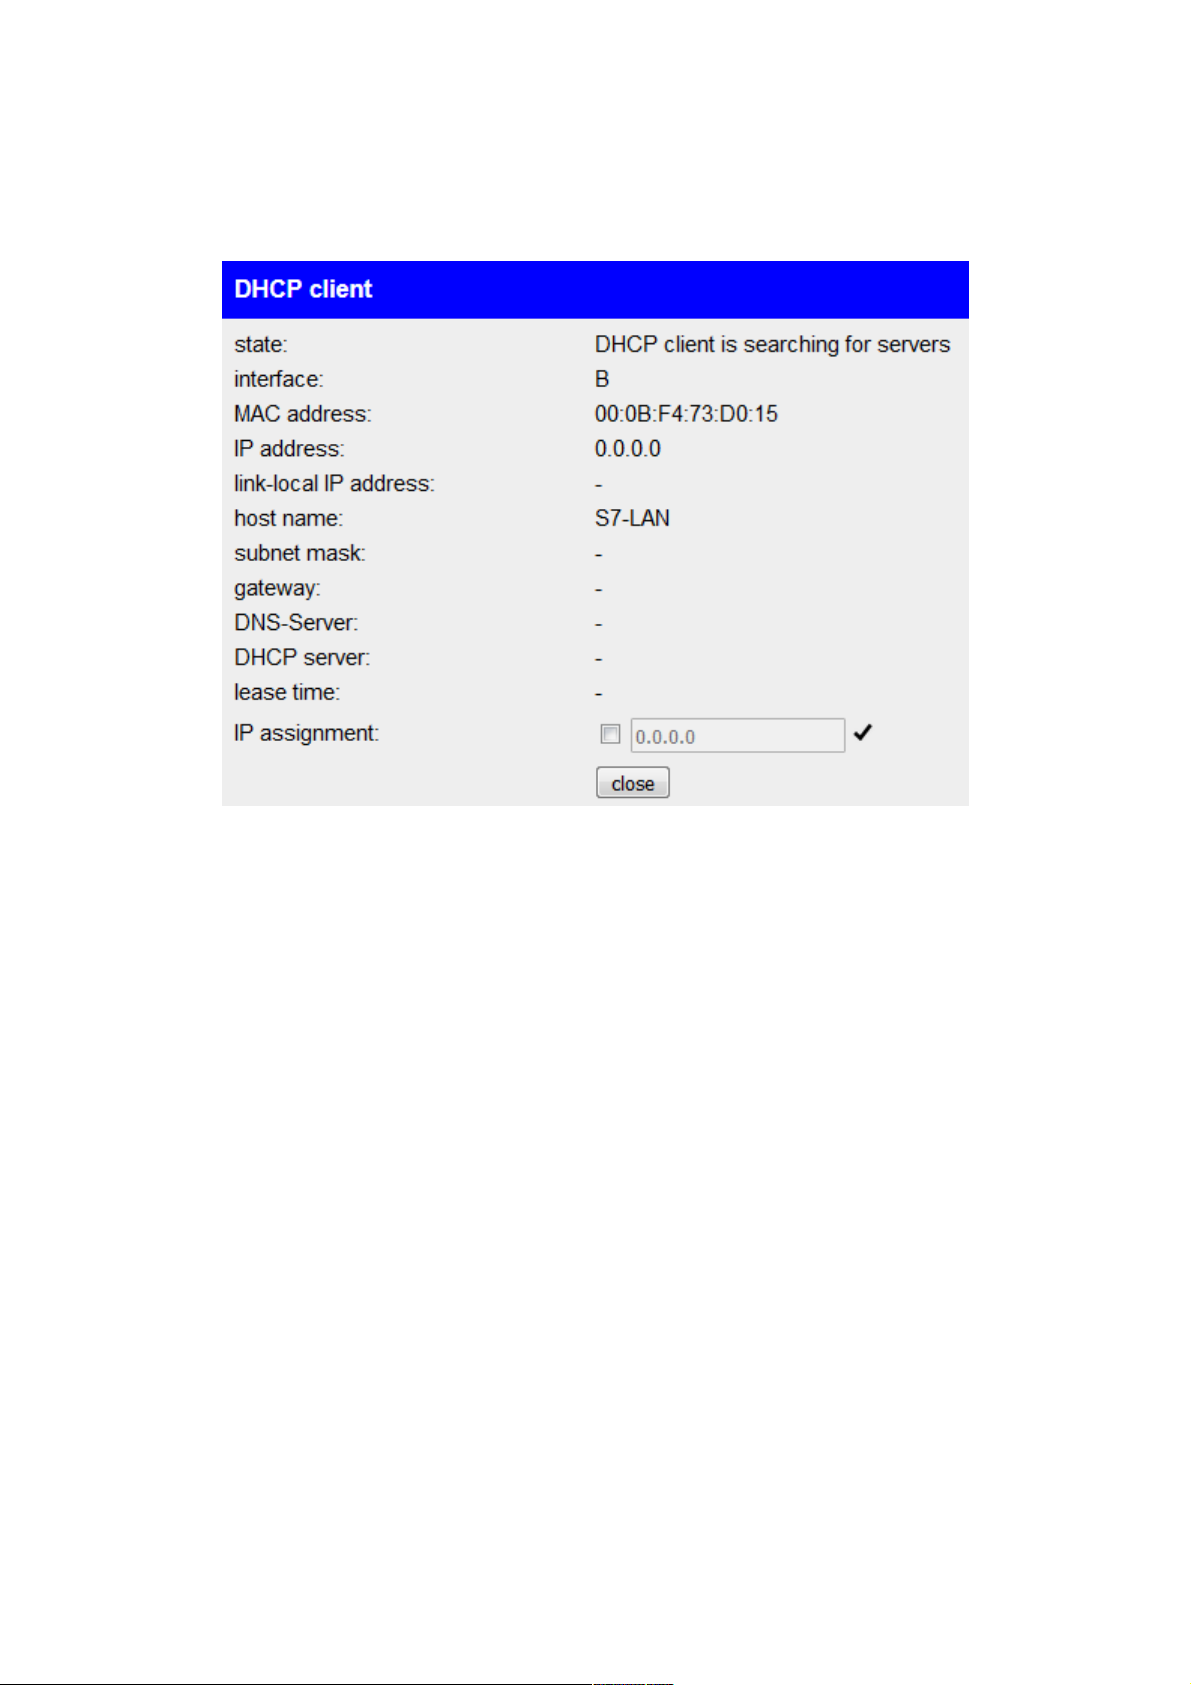
If you want to see more information about a specific DHCP client you can
simply click on the entry of the DHCP client in the table. Now you should
see the following window:
Here you can see e. g. the state of the client in textual form, the link-local
IP address (if the device assigns an IP address to itself) and information
about the DHCP lease (if the devices has received an IP address from a
DHCP server).
Furthermore you have the possibility to assign an IP address to the
device. Therefore you just have to check the check box and enter an IP
address into the text field. After that you have to click on the symbol to
submit the configuration (this is also necessary if you remove or change
the assignment).
Important:
Please note that the IP address which you assign to a device have
not to be in used. Otherwise a IP conflict occurs.
Furthermore the IP address have to be in the same subnet as the IP
address of the server.
manual TINA / ProfiNet-WATCHDOG V1.08 page 86
Page 87
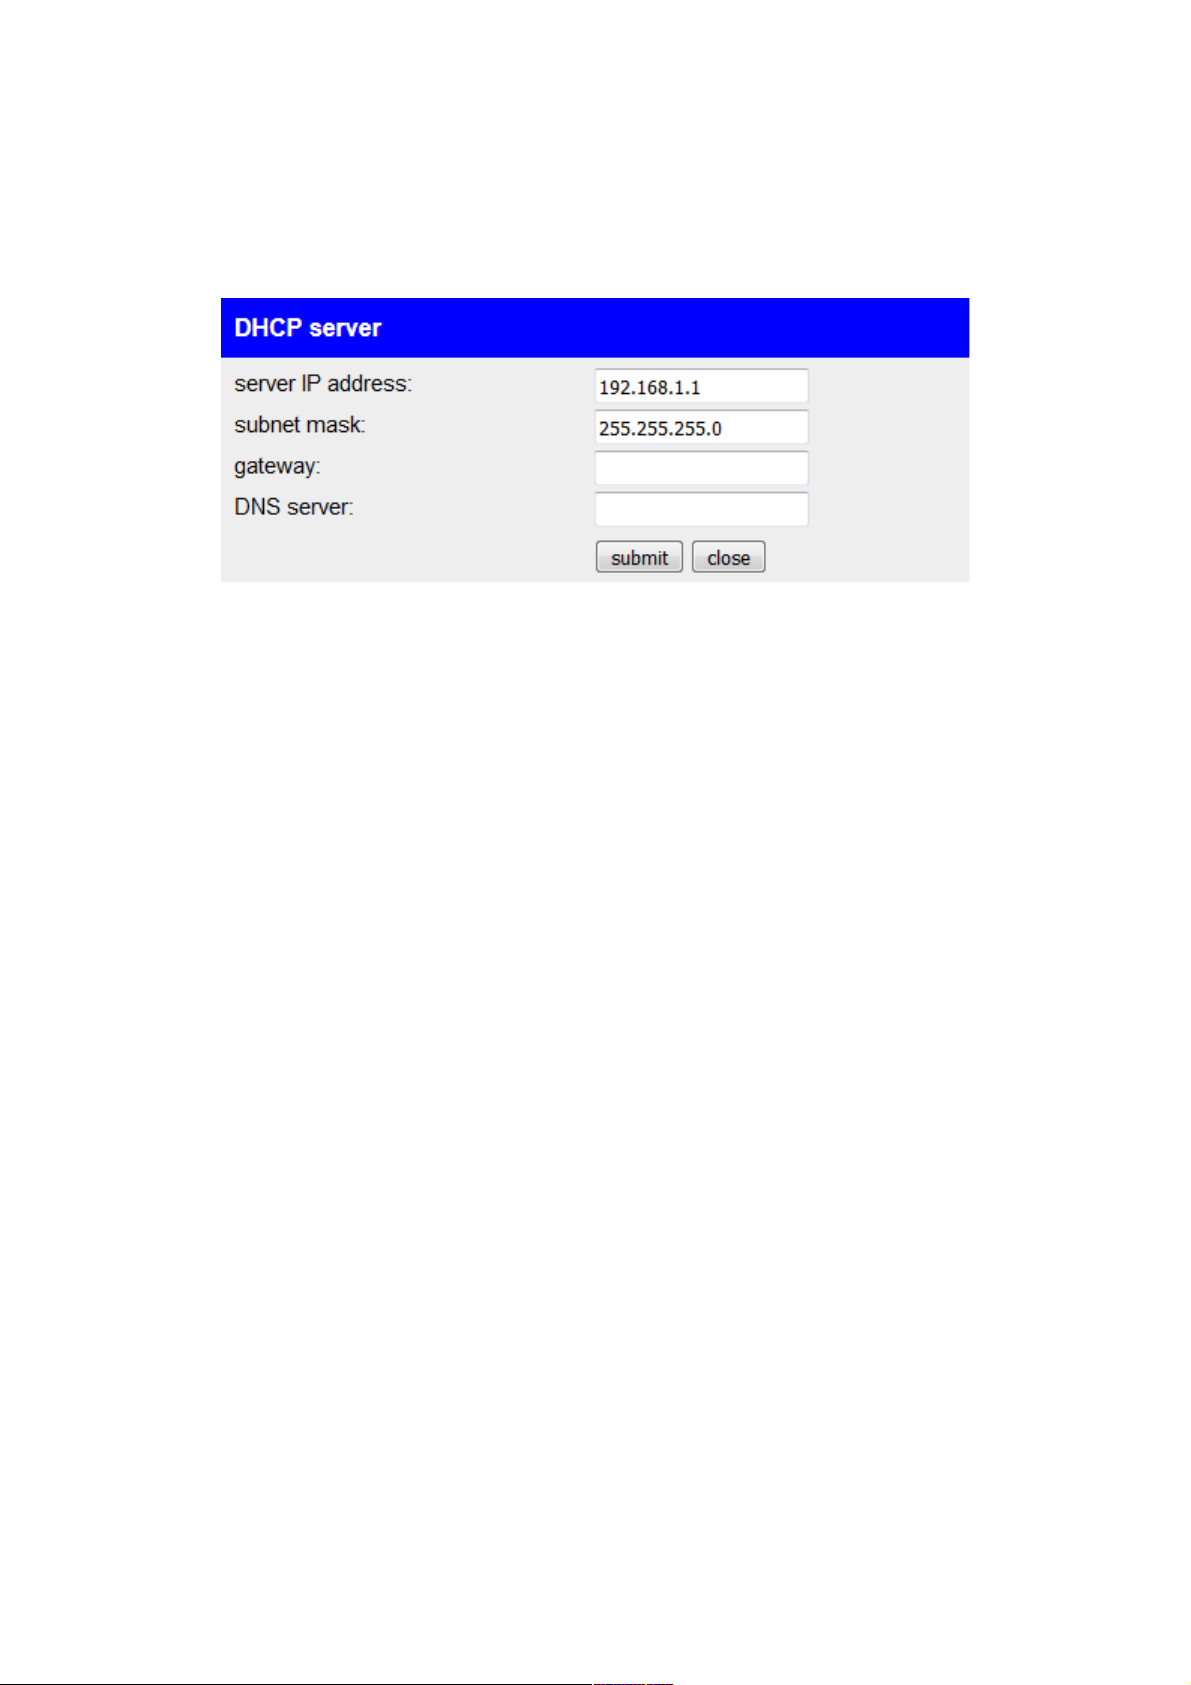
Before you can to such assignments you will have to configure the
DHCP server. Therefore you just have to click on the button “configure
server” on the top of the page. Now you should see the following
window:
Here you can change the IP address from the DHCP server of the
device. The fields gateway and DNS server are optional. The settings
are automatically preassigned (if possible) with the network settings of
the interface A of the device. If you want to save the DHCP server
settings you just have to click on the “submit” button.
The DHCP server which can be configured on this page has nothing to
do with the DHCP server which can be enabled on the configuration
page. The DHCP server which can be configured on this page does not
offer IP addresses to devices automatically. Instead it only offers the
manually entered IP addresses to the devices shown and enabled on
this page.
Important:
Please make sure that the chosen IP address is available or is the
IP address of the device itself (for the web server). Otherwise an IP
conflict occurs.
page 87 manual TINA / ProfiNet-WATCHDOG V1.08
Page 88
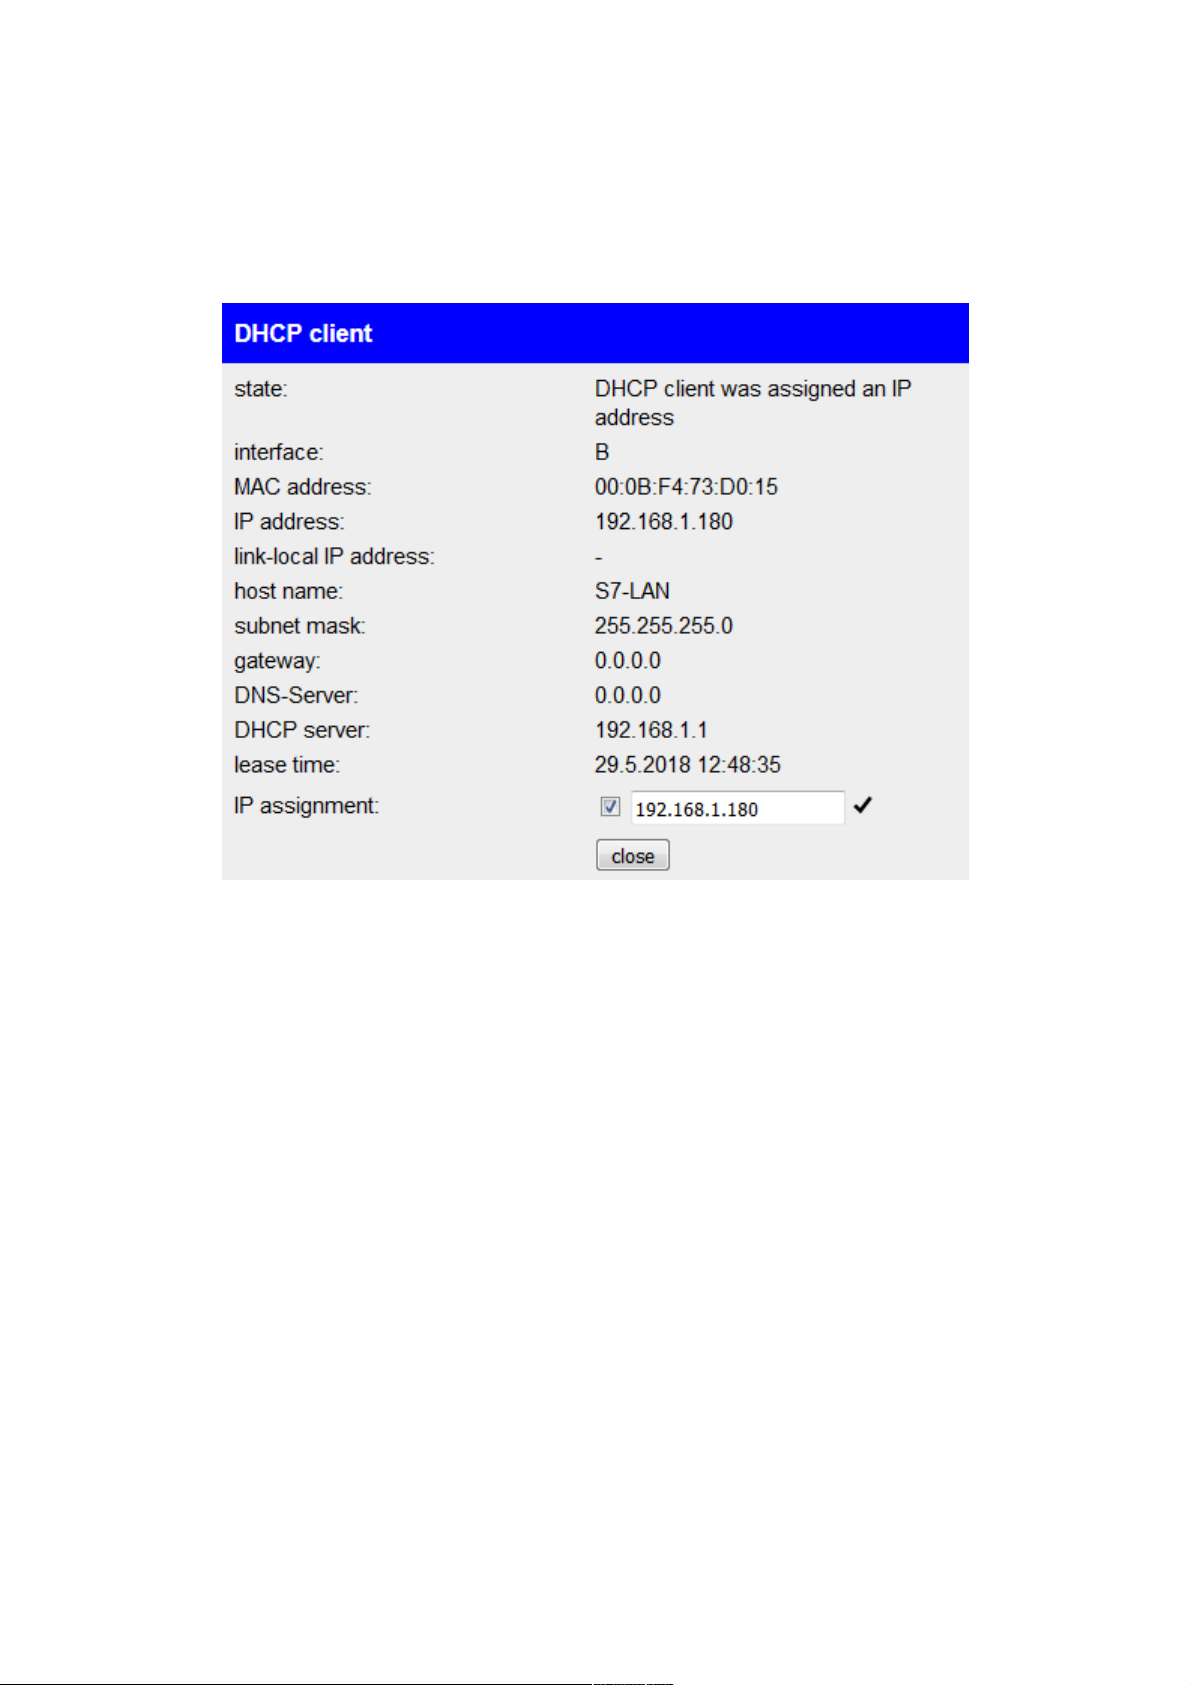
If a device has received an IP address from a DHCP server (regardless if
the device configuration is from the DHCP server of the device or from
another DHCP server), some more information (received parameters and
lease time) are shown in the detail view of the DHCP client:
Hint:
If you have enabled the DHCP server on interface A the IP address
assignment via the page “DHCP clients” isn't possible for devices
which are located on interface A.
If you want to clear the list of DHCP clients (and thereby all DHCP
leases) you can click on the button “reset list”.
Hint:
The assignment of IP addresses via this page can't be used on the
ProfiNet-WATCHDOG devices. But you can still use this page for
the monitoring of DHCP assignments.
manual TINA / ProfiNet-WATCHDOG V1.08 page 88
Page 89
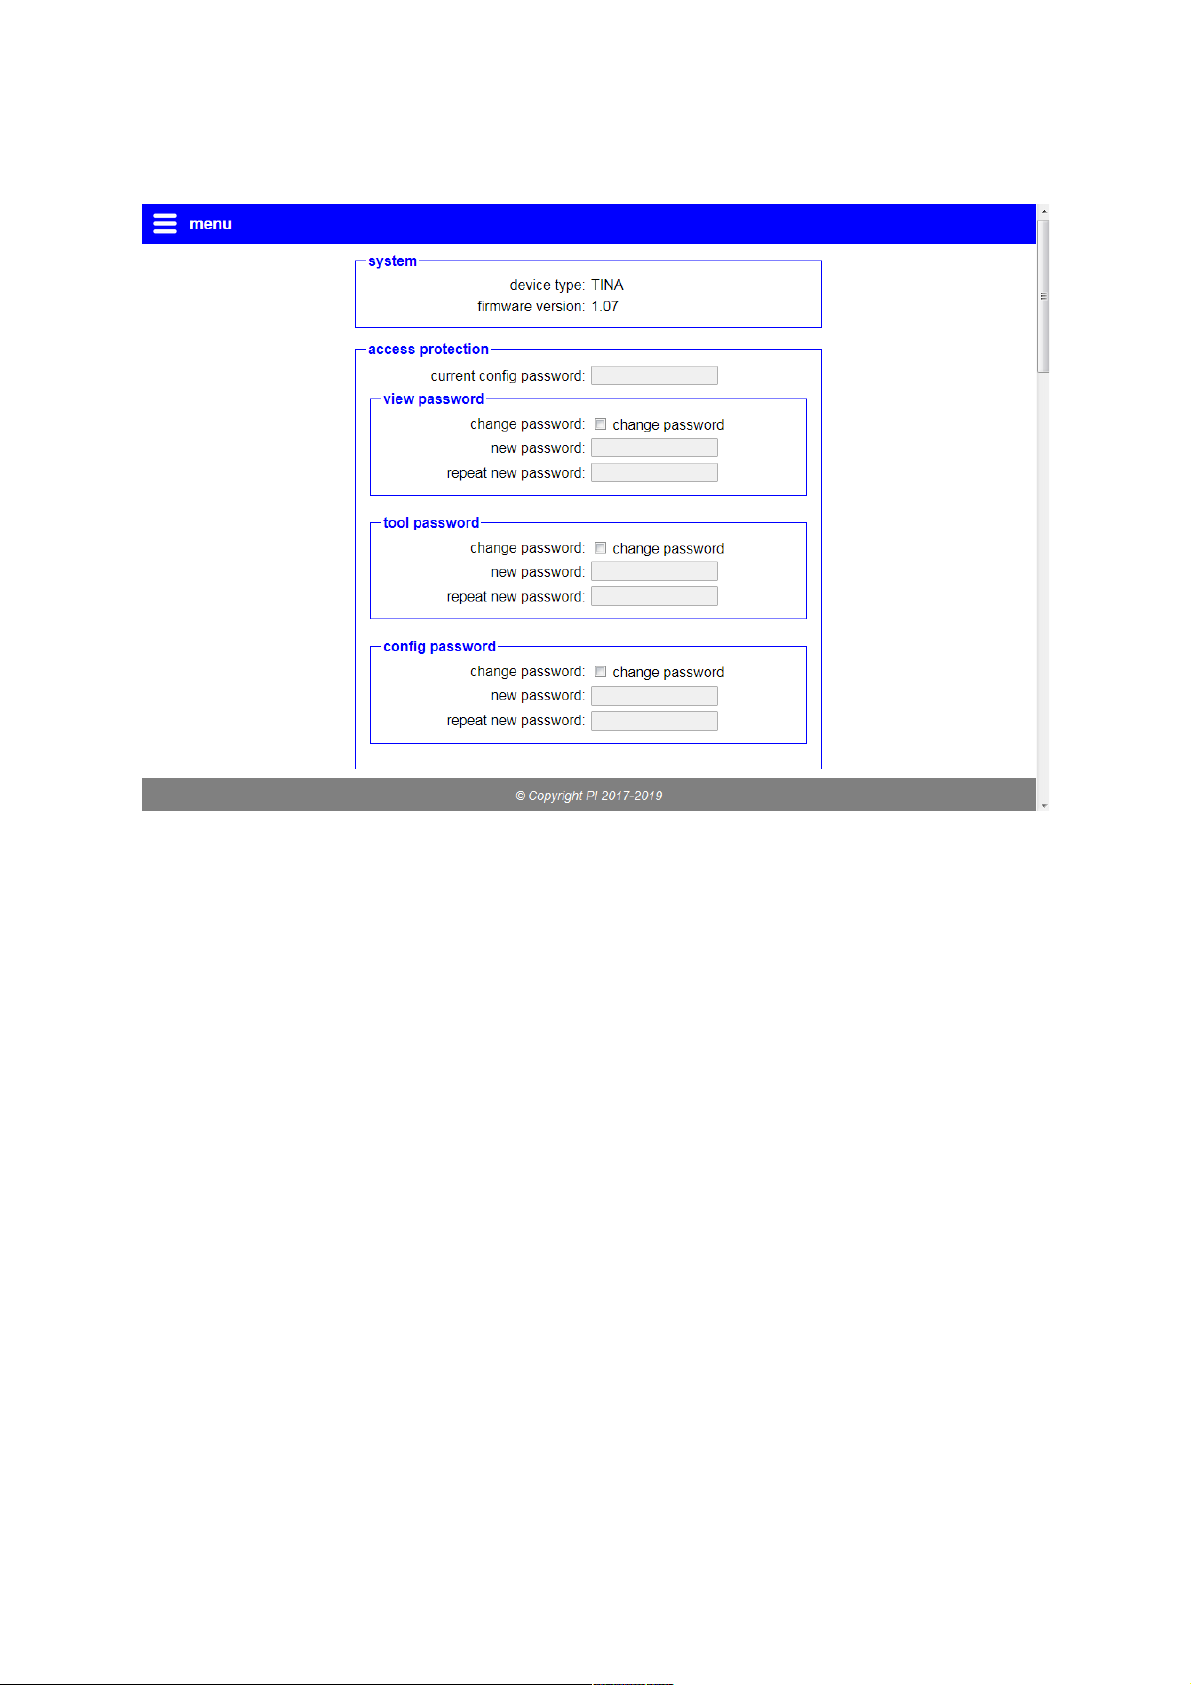
4.7 page configuration
On the configuration page (menu item “configuration”) you have the
possibility to set various settings. This allows you to configure the device
as needed for your usage. The configuration settings are described in
the next points in more detail.
If one of the network interfaces is configured as “DHCP client” you can
see if the device has already an IP configuration and how it looks like on
this page. Furthermore this page shows the MAC addresses of the single
network interfaces.
page 89 manual TINA / ProfiNet-WATCHDOG V1.08
Page 90
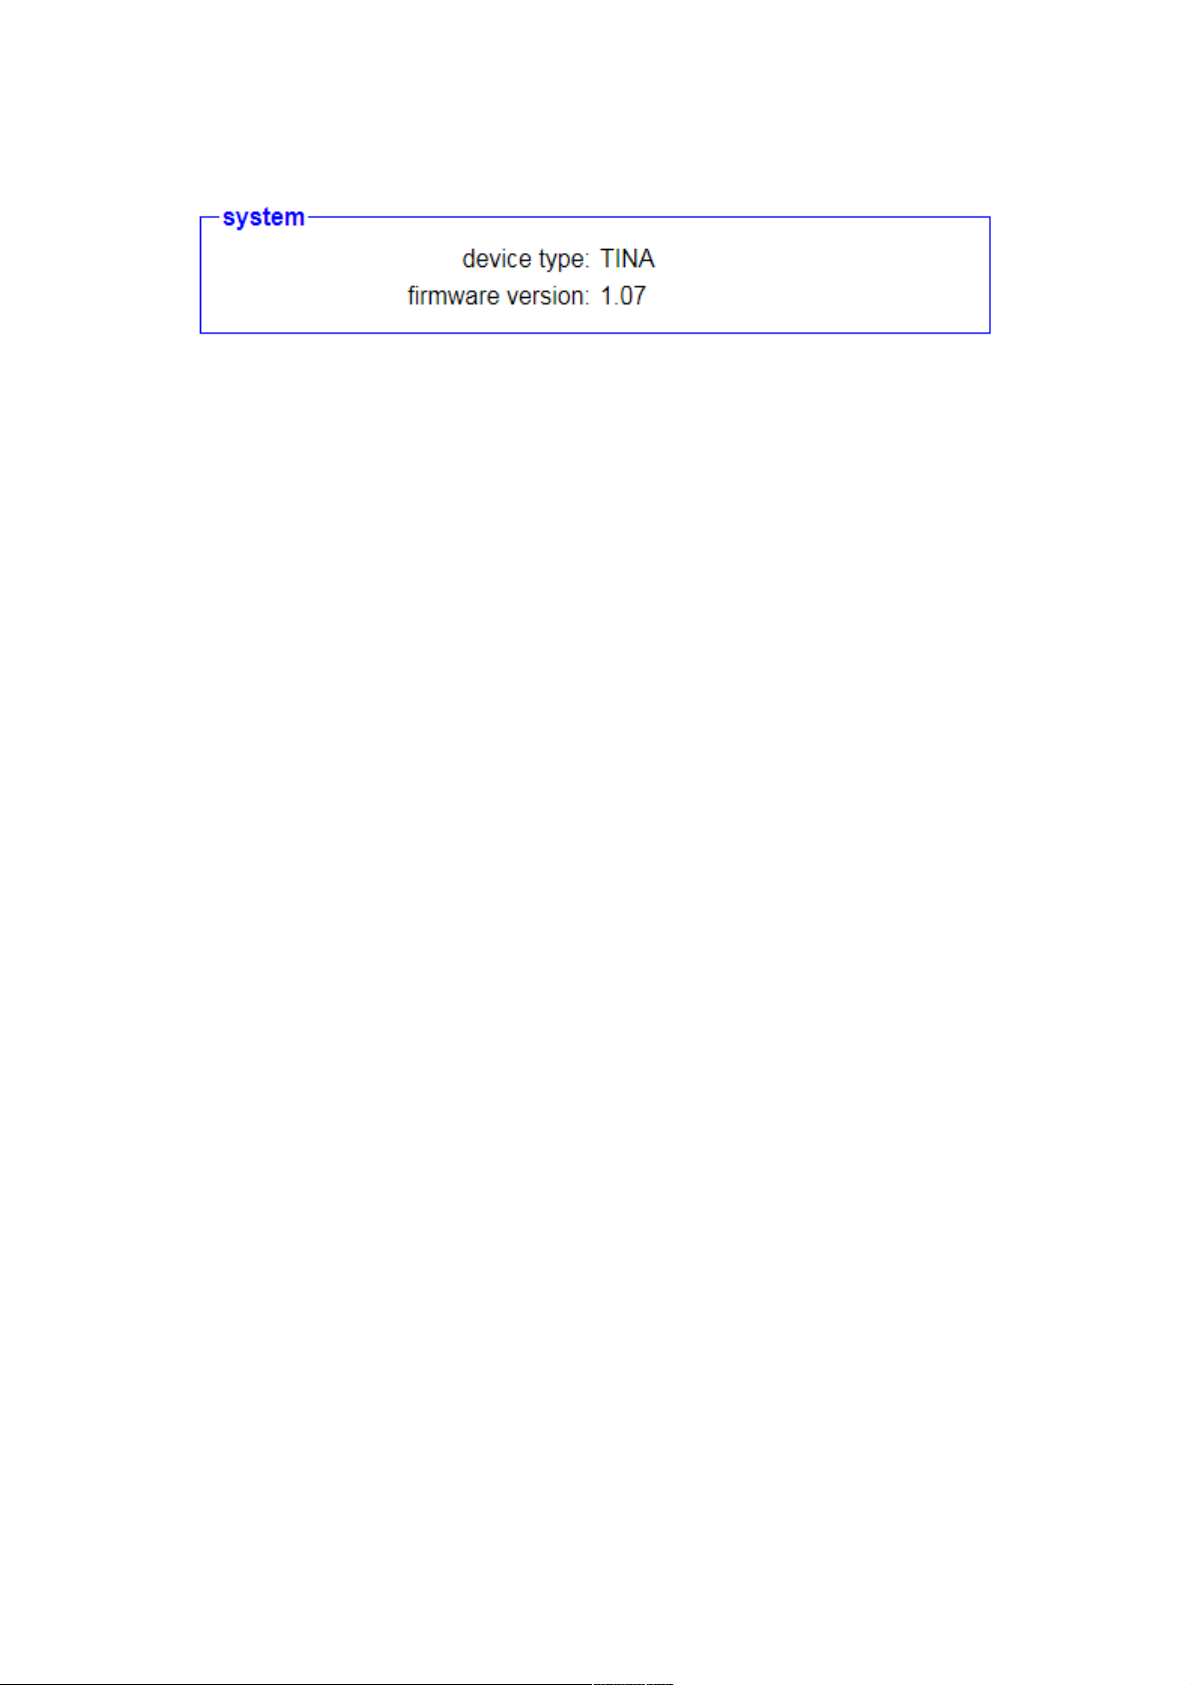
4.7.1 system
The area “system” isn't used for configuration rather then it gives you
some general information about your device. Thus it shows you the
device type (TINA or ProfiNet-WATCHDOG) as well as the firmware
version. An update of the firmware can be done on the page “firmware
update”.
manual TINA / ProfiNet-WATCHDOG V1.08 page 90
Page 91
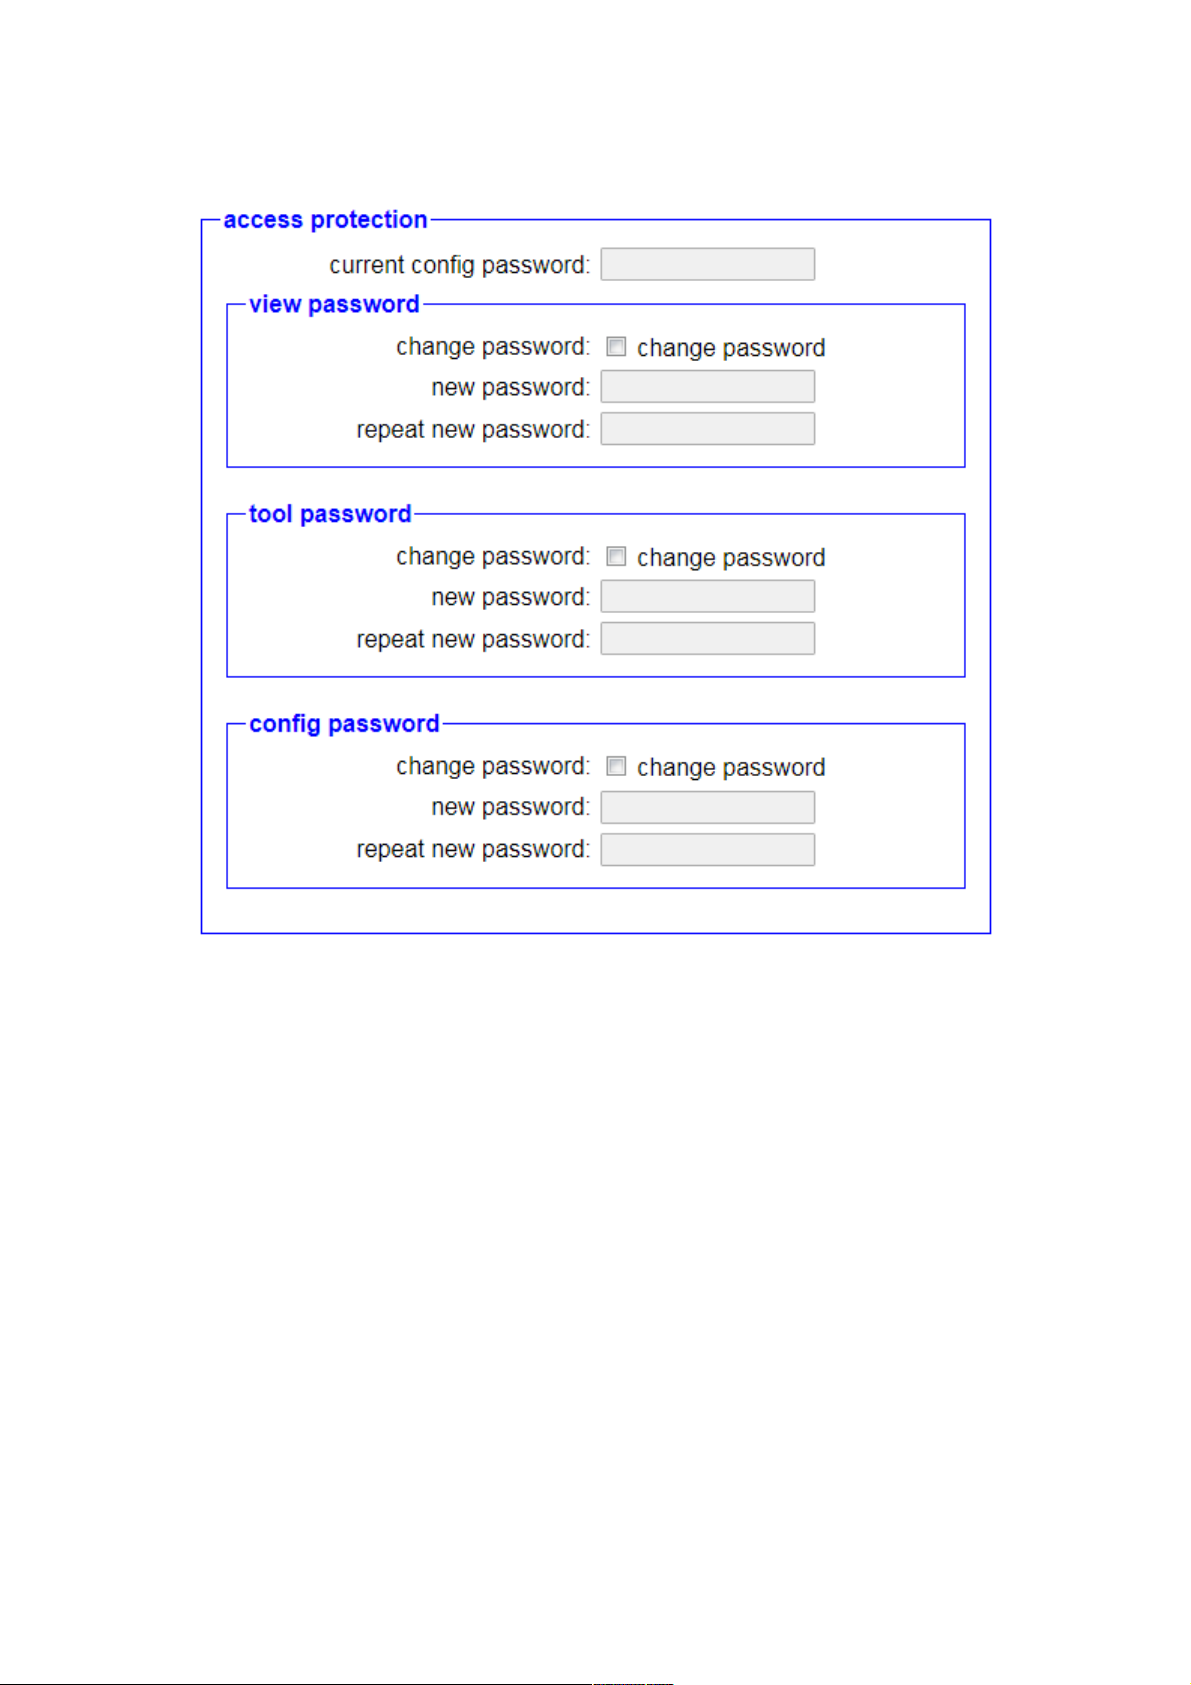
4.7.2 access protection
The field “access protection” allows you to set the passwords who are
needed to access the web pages of the analyzer. If an empty password
is configured, the page can be accessed without getting a password
prompt. The device offers you to configure three different passwords. Of
course you can use the same password for different protections. The
following passwords can be configured:
• view password: This password is needed to access the page
“overview” and thus for analyzing and controlling the network
traffic.
• tool password: This password is used for accessing the pages
“network scan”, “network tools” and “DHCP clients”.
• config password: With this password you can access the web
pages “configuration” and “firmware update”. Persons who know
this password can change all passwords.
If you want to change one or multiple passwords you have to select the
option “change password” on the access types where you want to
page 91 manual TINA / ProfiNet-WATCHDOG V1.08
Page 92

change the password first. On the next step you have to enter the new
password. This have to be done twice, to reduce the risk of type errors.
Before you can save the configuration you have to enter your current
config password in the text field “current config password”. On factory
defaults this is an empty password.
Important:
On factory defaults the passwords of all access levels are empty
passwords. This should definitely be changed, to avoid
unauthorized insight to your network traffic as well as unwanted
changes on the configuration of the device.
manual TINA / ProfiNet-WATCHDOG V1.08 page 92
Page 93
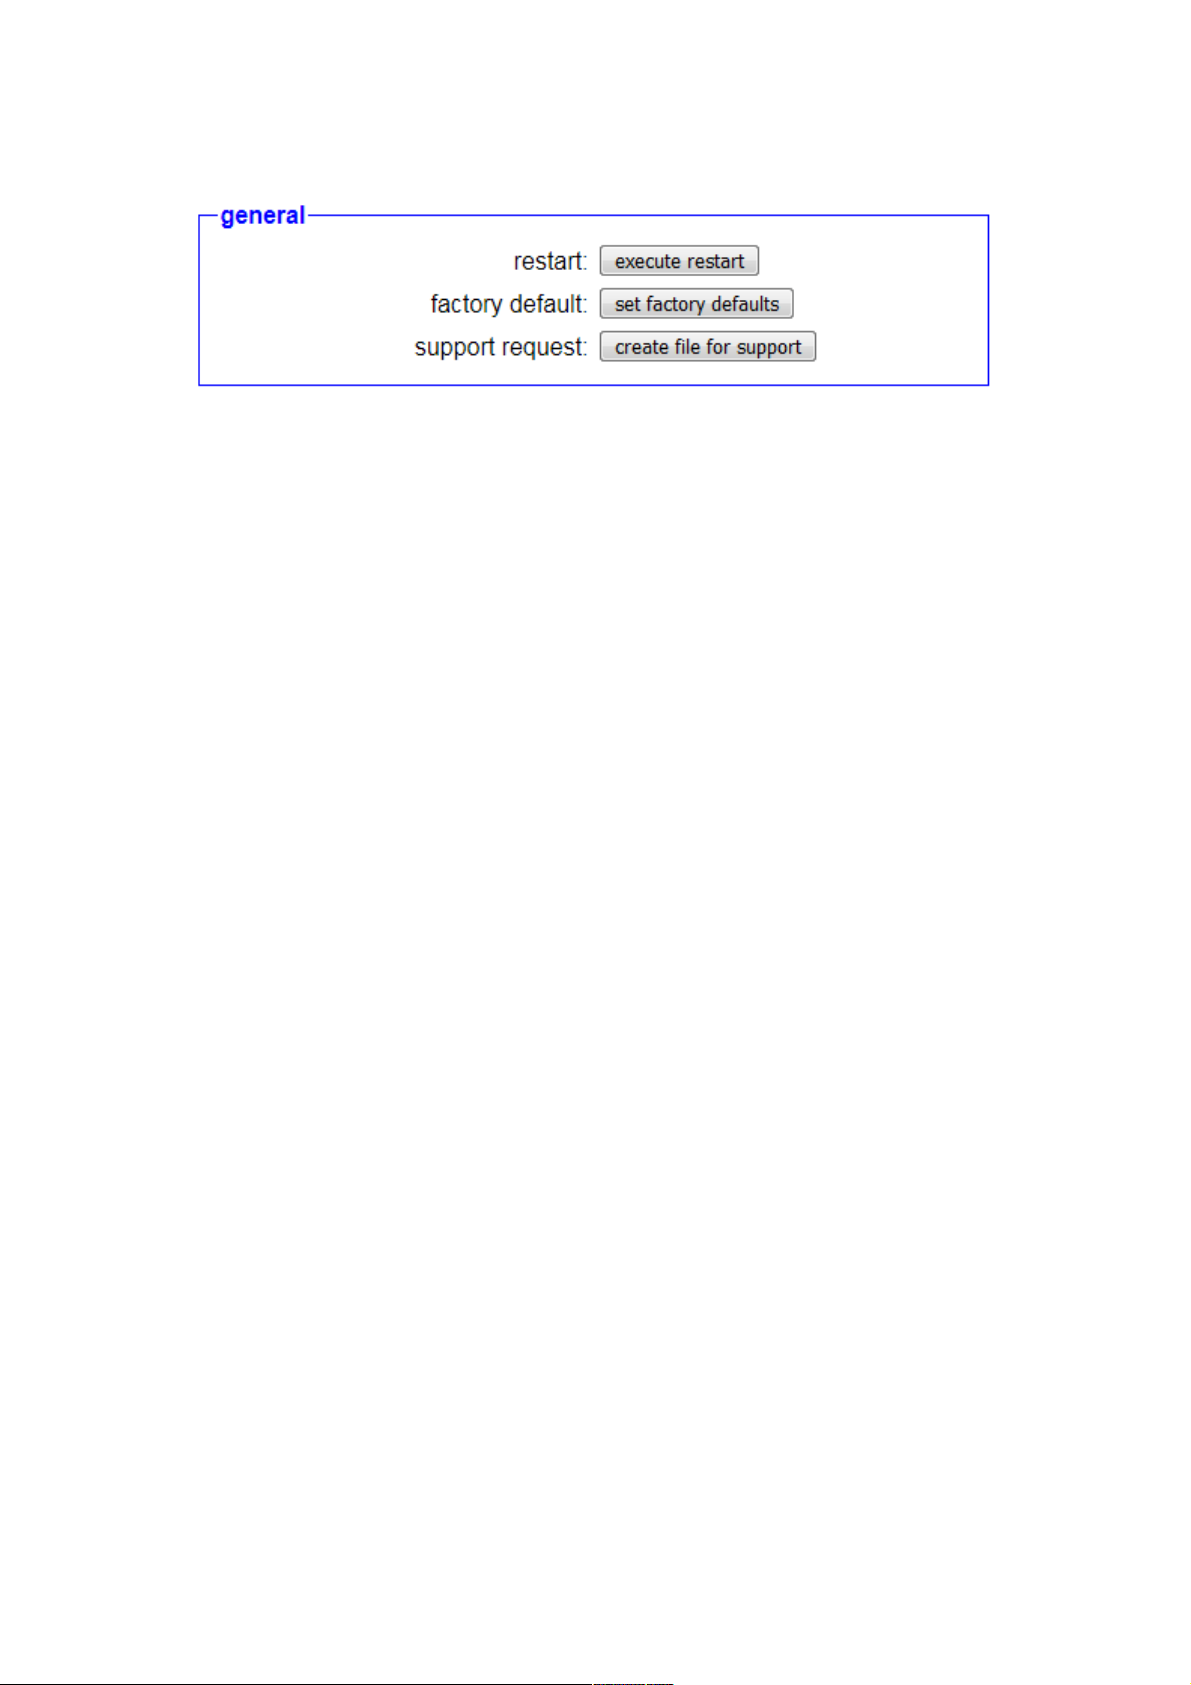
4.7.3 general
In the “general” area you can restart your device as well as setting the
device back to it's factory defaults. To execute the action you have to
click on the corresponding button.
Furthermore you can click on the button “create file for support” to create
a .bin file which contains the configuration and status of your device. This
information can be helpful for the support if you have problems or
questions to the device.
Important:
If you set your device to factory defaults all settings will be lost.
This means the function release have to be performed again. Please
read the chapter “commissioning”.
page 93 manual TINA / ProfiNet-WATCHDOG V1.08
Page 94
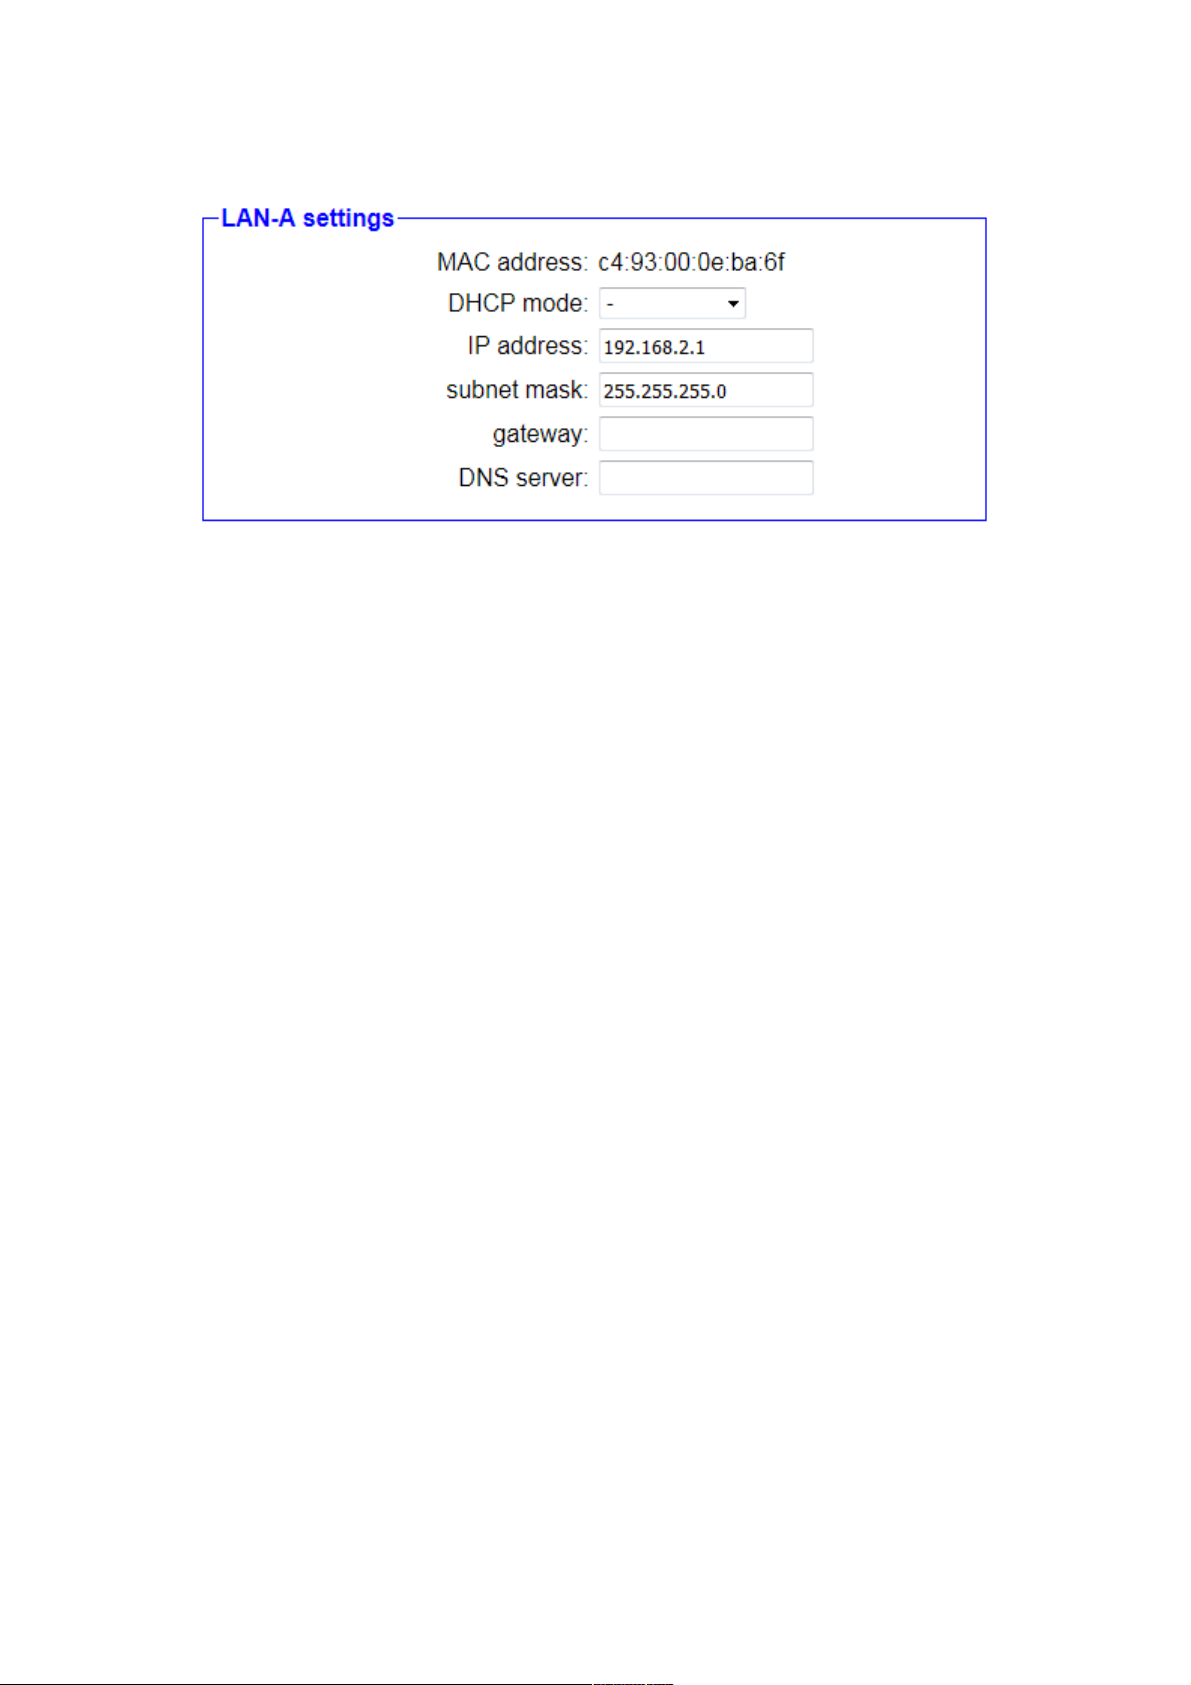
4.7.4 LAN-A settings
The settings in the group “LAN-A settings” are used for the network
attachment and belong to the LAN-A interface:
MAC address: The MAC address of the interface (this value can't
be changed).
DHCP mode: - The device is reachable via the
specified address.
client The device refers an IP address from
a DHCP server.
server The device is reachable via the
specified address and provides IP
addresses to other devices.
IP address: The IP address of the device.
subnet mask: The subnet mask of the device.
gateway: The IP address of the gateway (optional).
DNS server: The IP address of the DNS server (optional).
Hint:
If the web server should not be reachable through the LAN-A
interface, you just have to set the DHCP mode to “-” and remove the
inputs from the IP address and subnet mask fields.
Important:
ProfiNet-WATCHDOG devices can generally not be accessed via the
LAN-A interface, to not influence the RealTime management.
manual TINA / ProfiNet-WATCHDOG V1.08 page 94
Page 95
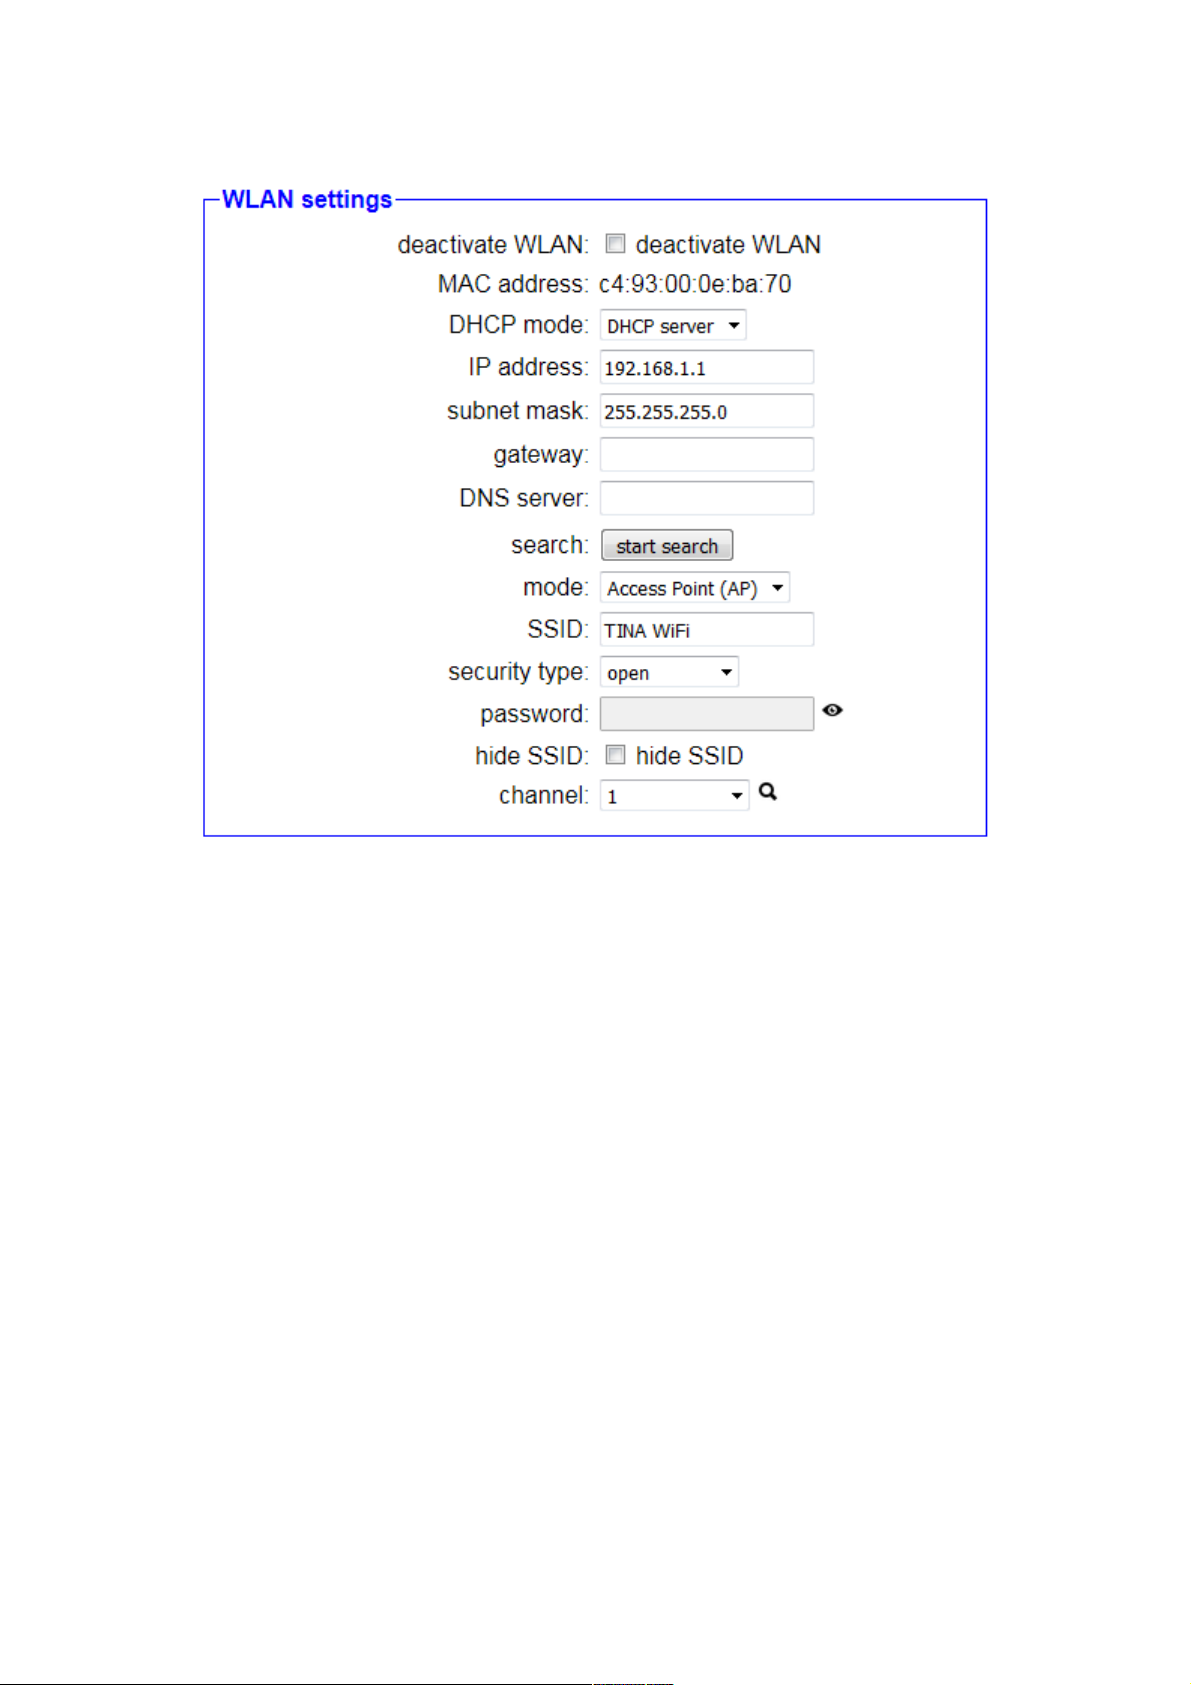
4.7.5 WLAN settings
In the group “WLAN settings” you can specify the configuration of the
WLAN interface:
deactivate WLAN: Specifies if the WLAN interface should be
disabled or not.
MAC address: The MAC address of the interface (this value can't
be changed).
DHCP mode: - The device is reachable via the
specified address.
client The device refers an IP address from
a DHCP server.
server The device is reachable via the
specified address and provides IP
addresses to other devices.
IP address: The IP address of the device.
subnet mask: The subnet mask of the device.
gateway: The IP address of the gateway (optional).
DNS server: The IP address of the DNS server (optional).
page 95 manual TINA / ProfiNet-WATCHDOG V1.08
Page 96
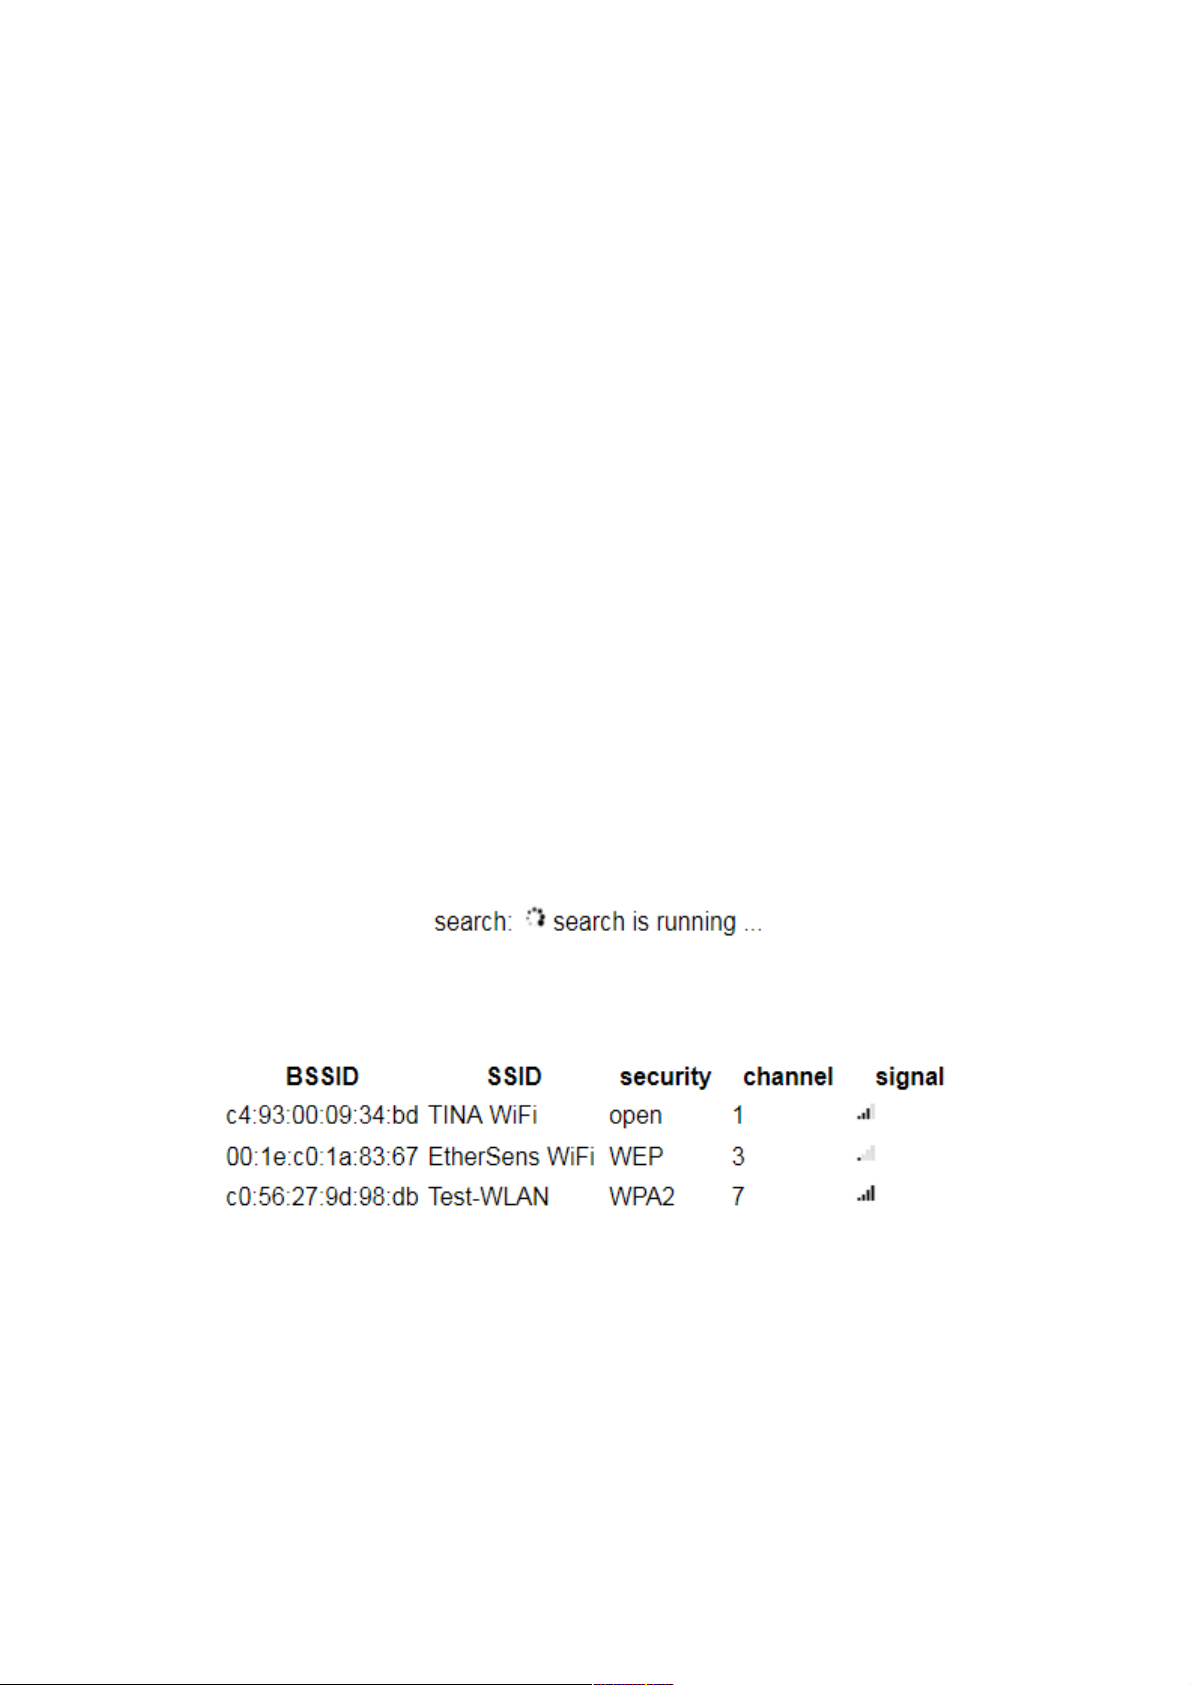
mode: Access Point The device provides an own
WLAN network.
client The device connects to an
existing WLAN network.
SSID: The SSID (name) of the WLAN network.
security type: The security type / encryption of the WLAN
network.
password: The password, which is needed for logging in to
the WLAN network.
hide SSID: Specifies if the SSID should be hidden (only
applicable if the mode is “Access Point”).
channel: The channel of the WLAN network.
(auto channel = best WLAN channel will be used)
If you are not sure about the settings of your existing WLAN network you
can scan for all available WLAN networks. Therefore you just have to
click on the button “start search”.
The following message should be shown:
After a few seconds a list with all available WLAN networks is shown:
To select the configuration of one of the founded WLAN networks you
have to click on the row of the entry in the table. Now all fields are filled
in with information. Of course the password have to be entered manually,
if necessary.
If you want to configure the analyzer to operate as an Access Point (AP)
it can be useful to determine which WLAN channel is least charged.
manual TINA / ProfiNet-WATCHDOG V1.08 page 96
Page 97
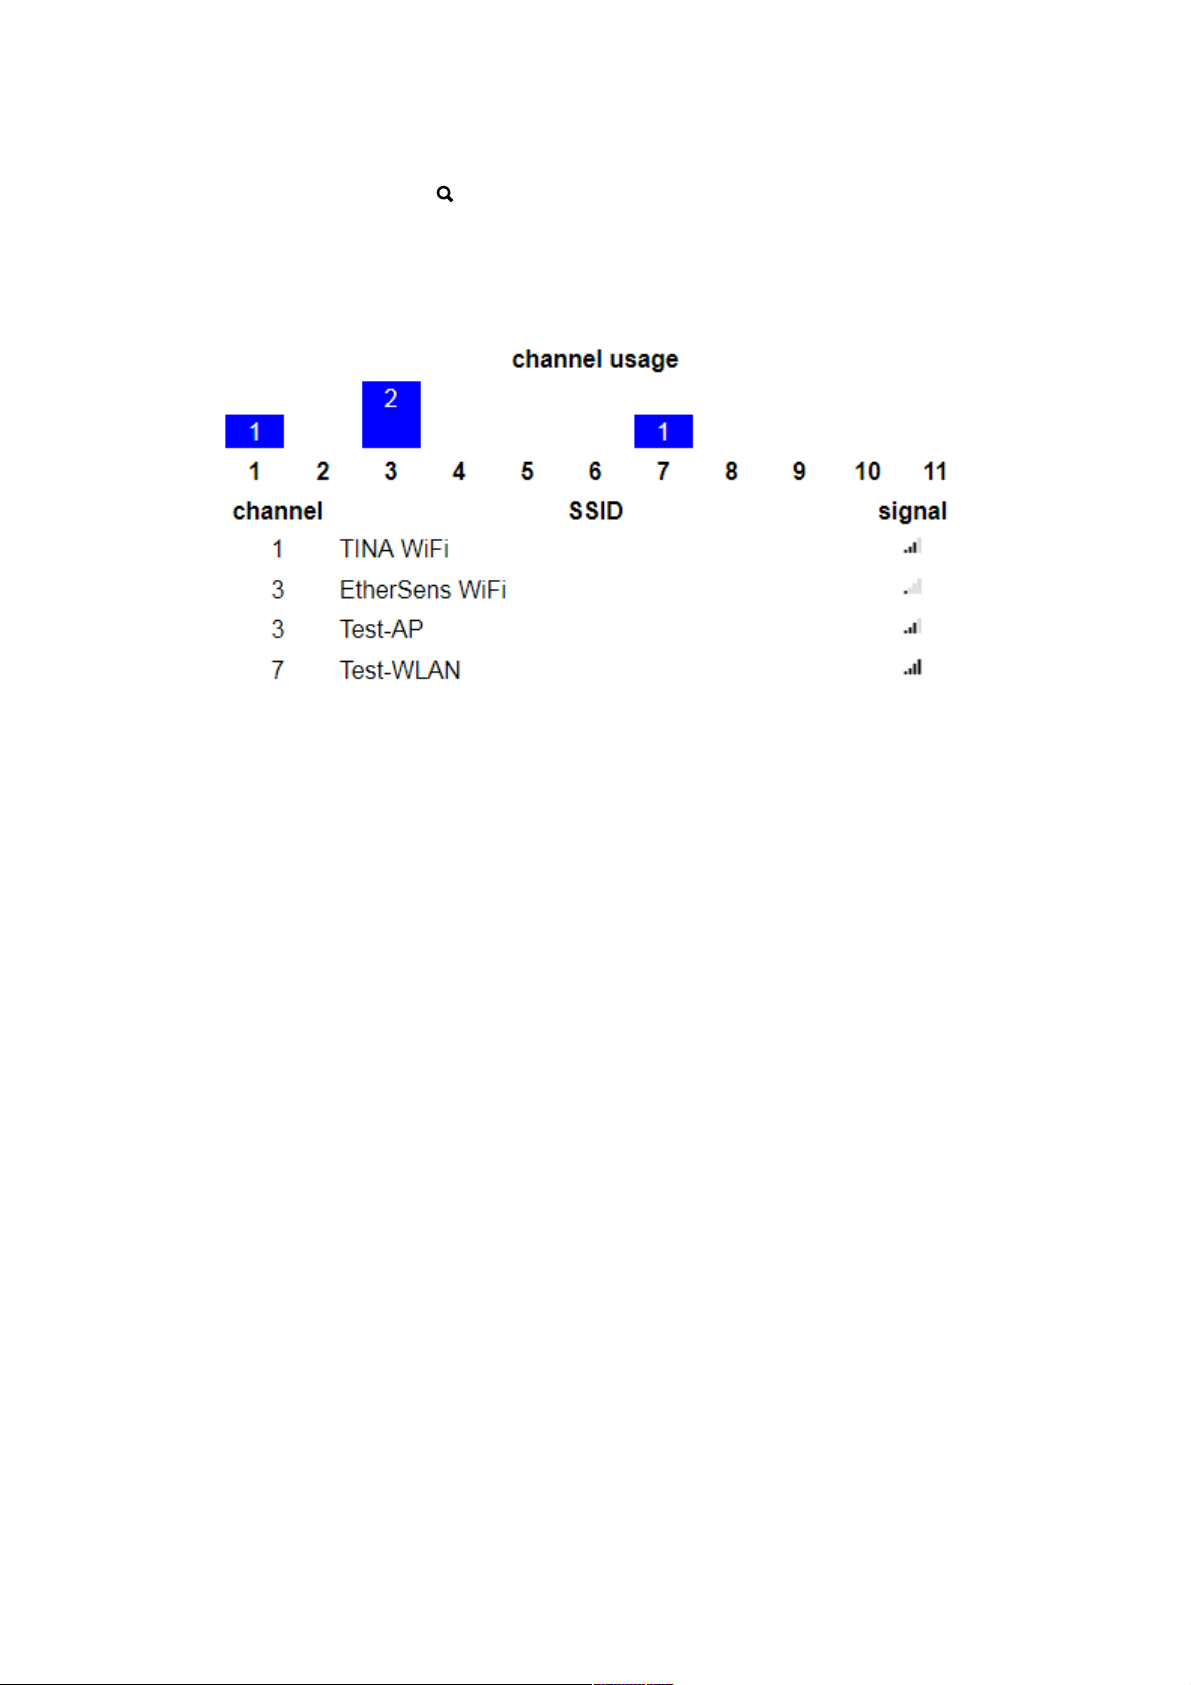
Therefore the device can show you the channel work load. This can be
done by clicking on the icon behind the channel selection list.
After clicking on the search icon a load symbol will appear instead. A few
seconds later the channel work load is determined and shown in a table.
This should look similar to the following:
Hint:
If the web server should not be reachable through the WLAN
interface, you just have to set the DHCP mode to “-” and remove the
inputs from the IP address and subnet mask fields.
The WLAN interface can only be disabled if the operating mode is
set to “LAN-LAN Bridge” and the LAN-A interface has an valid IP
address.
page 97 manual TINA / ProfiNet-WATCHDOG V1.08
Page 98
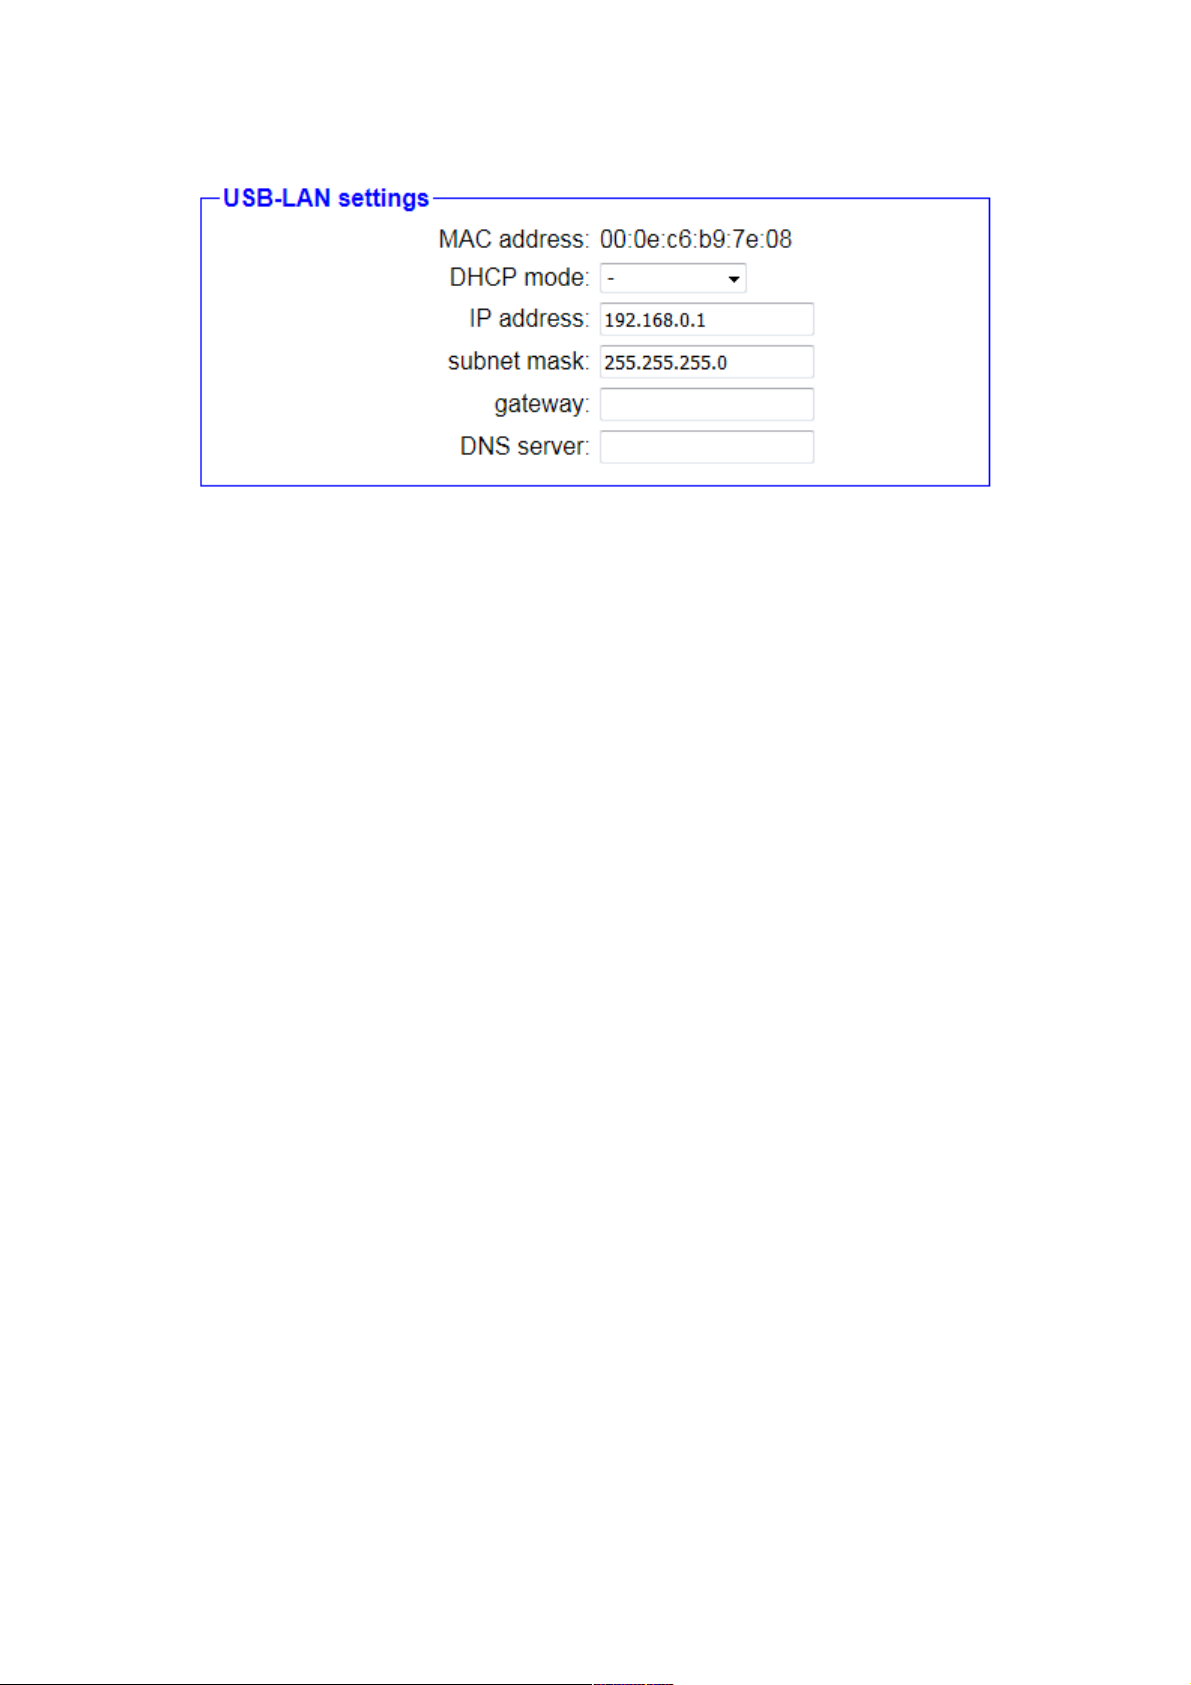
4.7.6 USB-LAN settings
The settings in the group “USB-LAN settings” are used for the network
attachment and belong to the LAN interface of the “Ethernet over USB”
adapter:
MAC address: The MAC address of the interface (this value can't
be changed).
DHCP mode: - The device is reachable via the
specified address.
client The device refers an IP address from
a DHCP server.
server The device is reachable via the
specified address and provides IP
addresses to other devices.
IP address: The IP address of the device.
subnet mask: The subnet mask of the device.
gateway: The IP address of the gateway (optional).
DNS server: The IP address of the DNS server (optional).
Hint:
Please note that this section is only visible if the USB adapter is
connected to the device.
If the web server should not be reachable through the USB-LAN
interface, you just have to set the DHCP mode to “-” and remove the
inputs from the IP address and subnet mask fields.
manual TINA / ProfiNet-WATCHDOG V1.08 page 98
Page 99
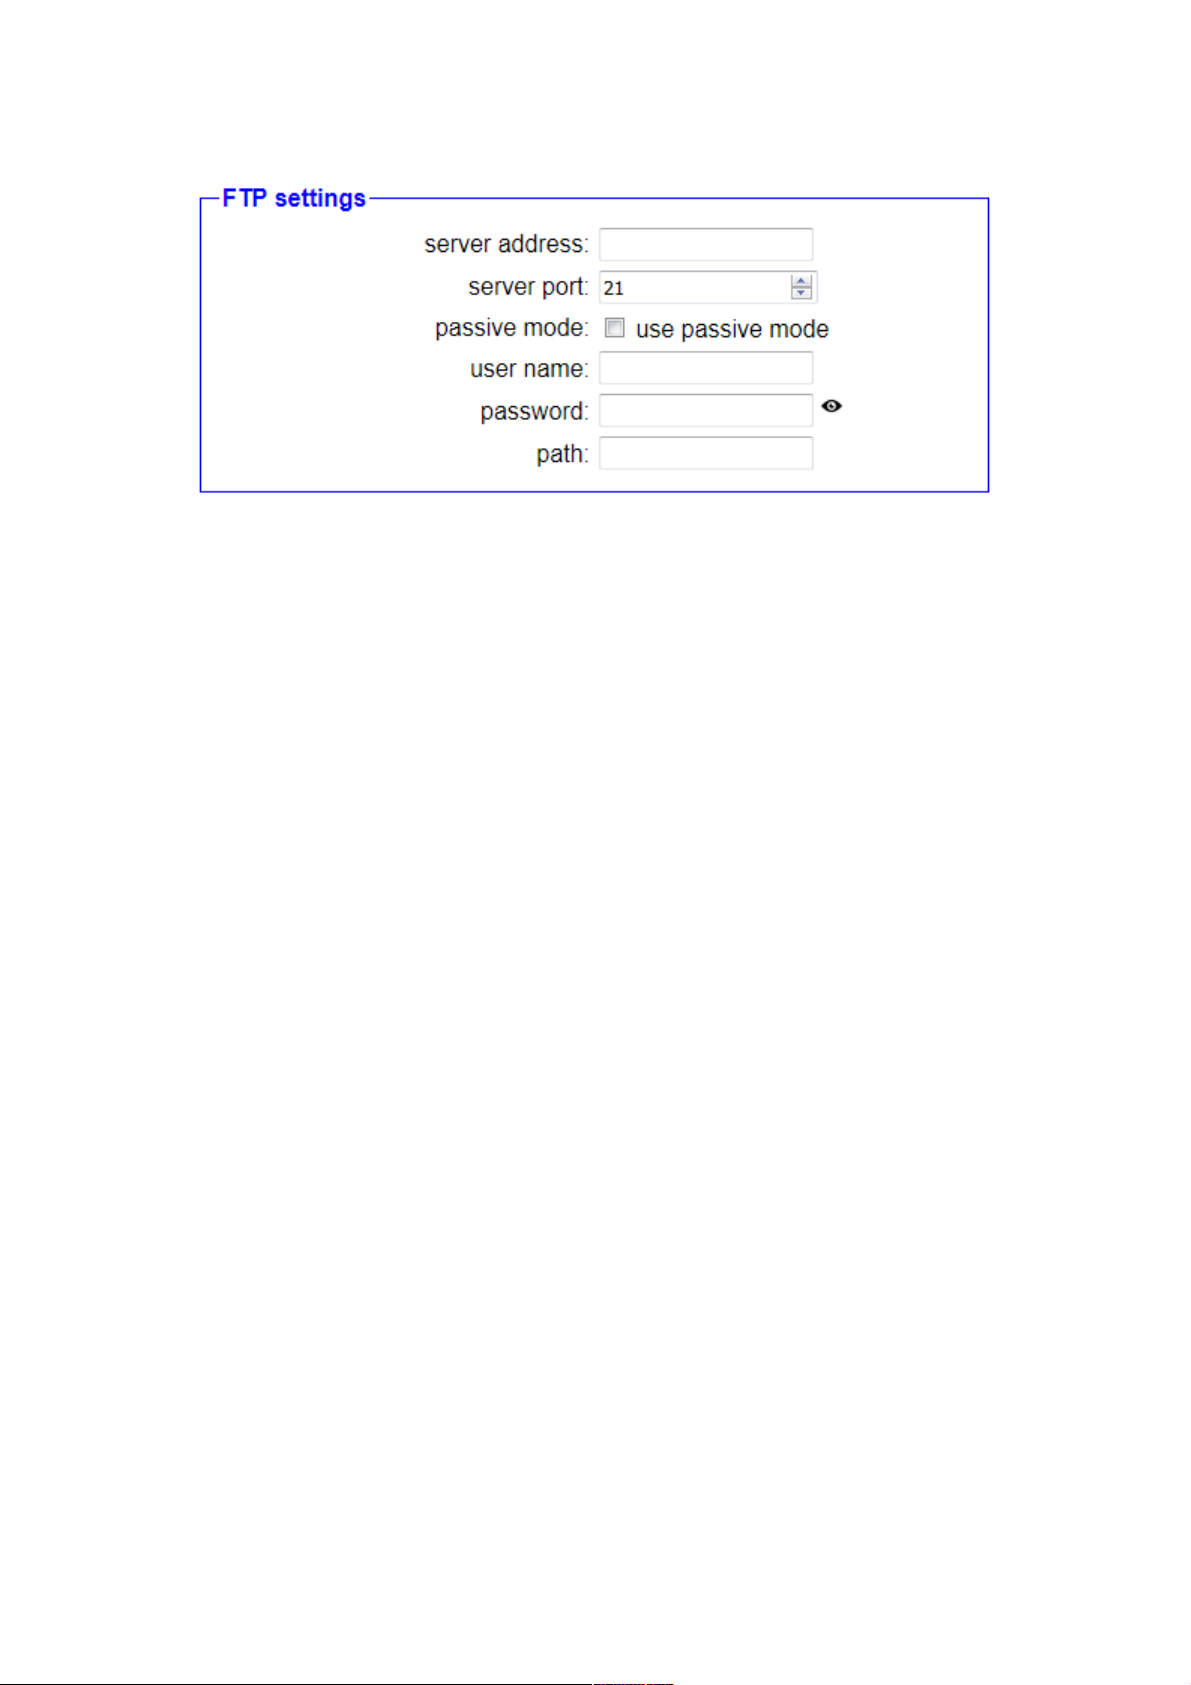
4.7.7 FTP settings
The following settings belong to the FTP server:
server address: The IP address or DNS name of the FTP server.
server port: The port of the FTP server (default is 21).
passive mode: Specifies if passive mode should be used instead
of active mode (uses always port 20 for data
transfer).
user name: The user name which is used to log in on the FTP
server.
password: The password which is used to log in on the FTP
server (optional).
path: The path which should be used by the FTP client
(optional).
Hint:
Please note that usually a connection to a FTP server via the
internet needs an enabled passive mode.
page 99 manual TINA / ProfiNet-WATCHDOG V1.08
Page 100
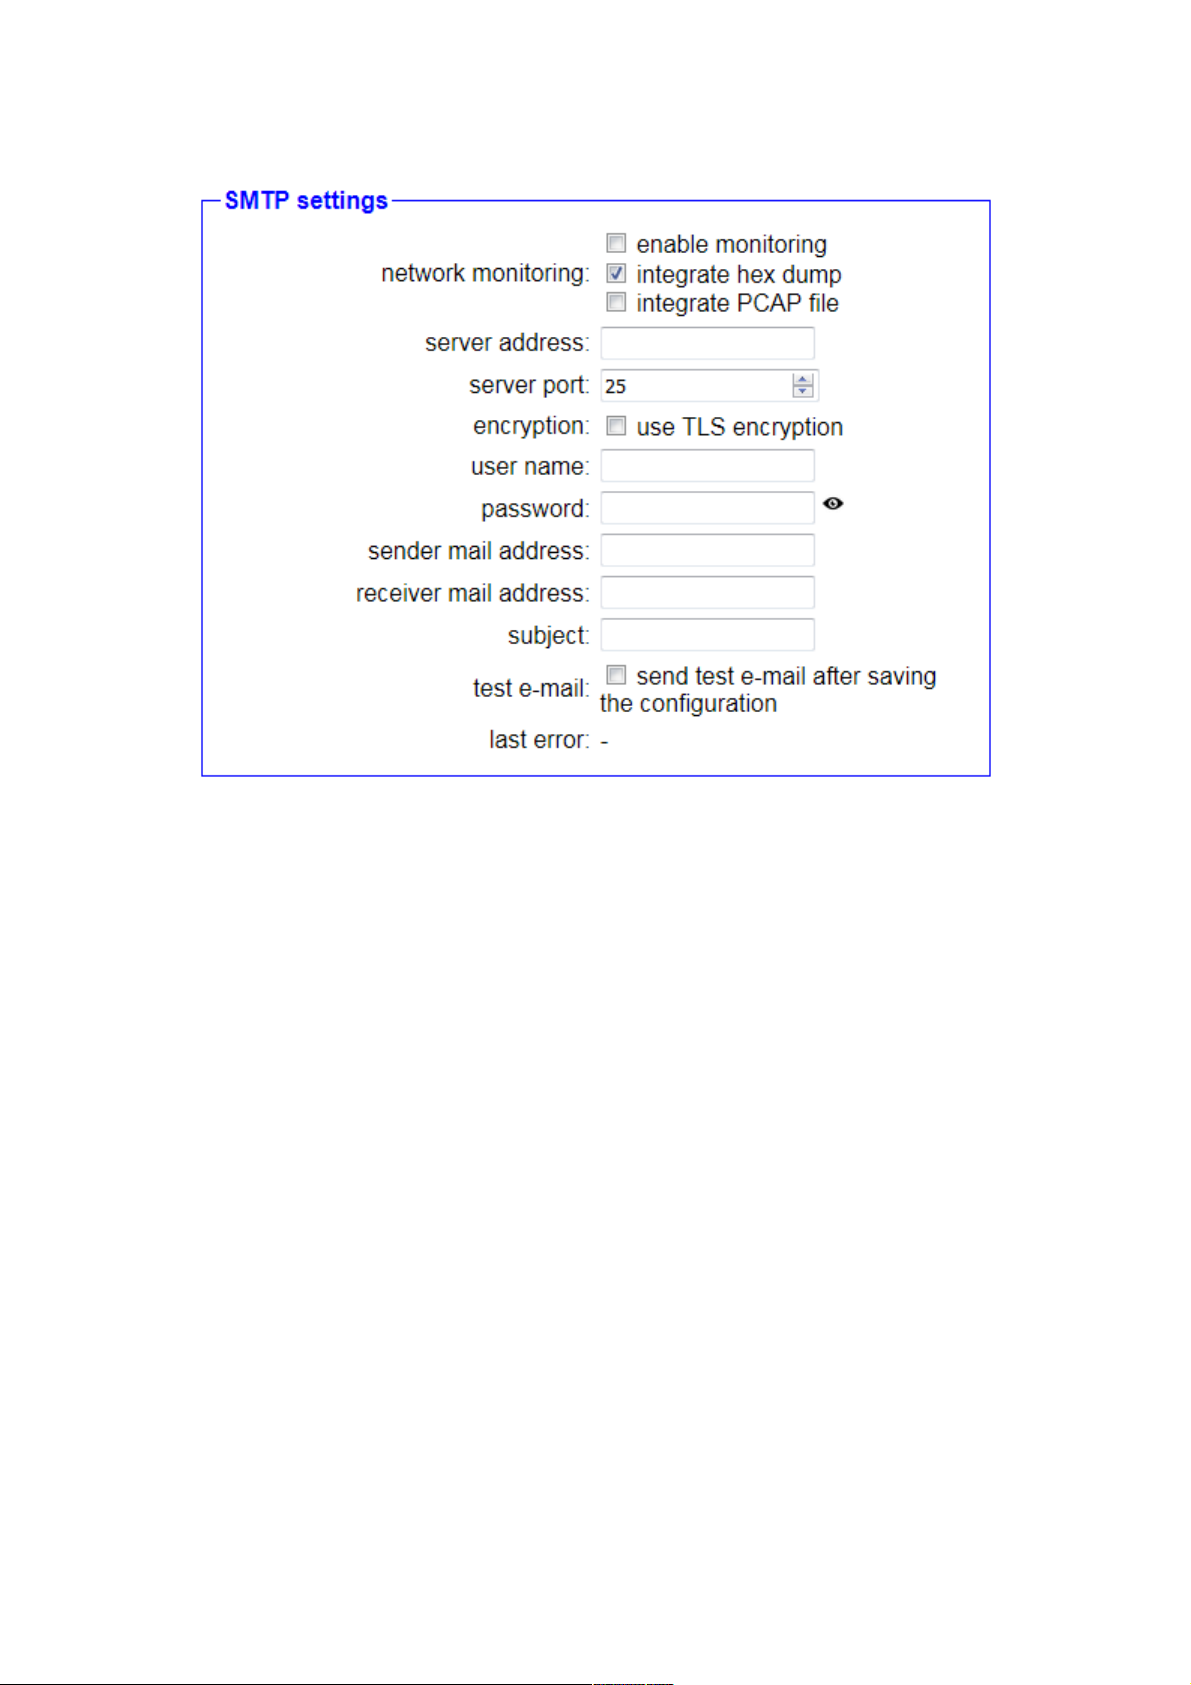
4.7.8 SMTP settings
The following settings belong to the SMTP server:
network monitoring: enable monitoring (enables the mail shipping for
the network monitoring)
integrate hex dump (adds a hex dump of the
frame on burglary mails)
integrate PCAP file (attaches a .pcap file of the
frame on burglary mails)
server address: The IP address or DNS name of the SMTP server.
server port: The port of the SMTP server (default is 25 or 465
with TLS).
encryption: Specifies if the connection should be encrypted
with TLS.
user name: The user name which is used to log in on the
SMTP server (optional).
password: The password which is used to log in on the
SMTP server (optional).
sender mail address: The e-mail address from which the e-mails should
be sent.
manual TINA / ProfiNet-WATCHDOG V1.08 page 100
 Loading...