

Page 1
The Philips 12-Lead Algorithm
Physician’s Guide
Page 2

Notice
About This Edition
Publication number M5000-91000
Edition 1
Copyright
2003 Koninklijke Philips Electronics N.V.
All rights are reserved.
Permission is granted to copy and
distribute this document for educational
purposes.
Warranty
Philips Medical Systems makes no
warranty of any kind with regard to this
material, including, but not limited to, the
implied warranties or merchantability and
fitness for a particular purpose.
Philips Medical Systems shall not be
liable for errors contained herein or for
incidental or consequential damages in
connection with the furnishing,
performance, or use of this material.
CAUTION
In the U.S., Federal Law restricts this
product to sale on or by the order of a
physician. Use of accessories other than
those recommended by Philips may
compromise product performance.
THIS PRODUCT NOT INTENDED FOR
HOME USE.
Medical Device Directive
This algorithm is a software component
used in many Philips Medical Systems
medical devices. Consult the
documentation supplied with your product
for information about Medical Device
Directive and other medical regulations.
Authorized EU-representative:
Philips Medizinsysteme Böblingen GmbH
Hewlett Packard Str. 2
71034 Böblingen
Germany
i
Page 3

About This Guide
This Physician Guide explains how ECG signals are analyzed by the Philips 12Lead Algorithm.
NOTE No automated analysis is completely reliable. Computerized ECG analysis
should always be reviewed by a qualified physician.
Who Should Read This Guide?
This guide is intended for physicians who overread ECGs interpreted by the
Philips 12-Lead Algorithm. It also may be of interest to other health care
professionals who want to know more about ECG interpretation.
NOTE This Physician Guide describes features that may not be available on all Philips
Medical Systems equipment. Refer to the documentation supplied with your
particular product to learn more about available features.
ii Philips 12-Lead Algorithm Physician Guide
Page 4

Contents
About This Guide . . . . . . . . . . . . . . . . . . . . . . . . . . . . . . . . . . . . . . . . . . . . . . . . . . . . . . . . . ii
Who Should Read This Guide? . . . . . . . . . . . . . . . . . . . . . . . . . . . . . . . . . . . . . . . . . . . . . . ii
The Philips 12-Lead Algorithm
Introduction. . . . . . . . . . . . . . . . . . . . . . . . . . . . . . . . . . . . . . . . . . . . . . . . . . . . . . . . . . . . . . . 1-1
The Philips 12-Lead Algorithm Process . . . . . . . . . . . . . . . . . . . . . . . . . . . . . . . . . . . . . . . . . 1-2
Quality Monitor. . . . . . . . . . . . . . . . . . . . . . . . . . . . . . . . . . . . . . . . . . . . . . . . . . . . . . . . . . . . 1-3
Reducing Artifact . . . . . . . . . . . . . . . . . . . . . . . . . . . . . . . . . . . . . . . . . . . . . . . . . . . . . . . 1-3
Common Mode . . . . . . . . . . . . . . . . . . . . . . . . . . . . . . . . . . . . . . . . . . . . . . . . . . . . . 1-3
Differential Mode . . . . . . . . . . . . . . . . . . . . . . . . . . . . . . . . . . . . . . . . . . . . . . . . . . . . 1-3
Using Filters . . . . . . . . . . . . . . . . . . . . . . . . . . . . . . . . . . . . . . . . . . . . . . . . . . . . . . . . . . . 1-4
Artifact Filter . . . . . . . . . . . . . . . . . . . . . . . . . . . . . . . . . . . . . . . . . . . . . . . . . . . . . . . 1-4
AC Filter . . . . . . . . . . . . . . . . . . . . . . . . . . . . . . . . . . . . . . . . . . . . . . . . . . . . . . . . . . 1-5
Frequency Response Filters . . . . . . . . . . . . . . . . . . . . . . . . . . . . . . . . . . . . . . . . . . . . 1-5
Baseline Wander Filter . . . . . . . . . . . . . . . . . . . . . . . . . . . . . . . . . . . . . . . . . . . . . . . 1-5
Waveform Recognition and Measurements . . . . . . . . . . . . . . . . . . . . . . . . . . . . . . . . . . . . . . 1-6
Waveform Recognition . . . . . . . . . . . . . . . . . . . . . . . . . . . . . . . . . . . . . . . . . . . . . . . . . . 1-6
Comprehensive Measurements . . . . . . . . . . . . . . . . . . . . . . . . . . . . . . . . . . . . . . . . . . . . 1-7
Group Measurements . . . . . . . . . . . . . . . . . . . . . . . . . . . . . . . . . . . . . . . . . . . . . . . . 1-7
Lead Measurements . . . . . . . . . . . . . . . . . . . . . . . . . . . . . . . . . . . . . . . . . . . . . . . . . . 1-7
Atrial Rhythm Analysis . . . . . . . . . . . . . . . . . . . . . . . . . . . . . . . . . . . . . . . . . . . . . . . . 1-7
Global Measurements. . . . . . . . . . . . . . . . . . . . . . . . . . . . . . . . . . . . . . . . . . . . . . . . . . . . 1-7
Axis Measurements . . . . . . . . . . . . . . . . . . . . . . . . . . . . . . . . . . . . . . . . . . . . . . . . . . 1-8
Interpretation . . . . . . . . . . . . . . . . . . . . . . . . . . . . . . . . . . . . . . . . . . . . . . . . . . . . . . . . . . . . . 1-8
Overall Severity . . . . . . . . . . . . . . . . . . . . . . . . . . . . . . . . . . . . . . . . . . . . . . . . . . . . . . . . 1-8
Adult and Pediatric Rhythm Analysis
Cardiac Rhythm Categories . . . . . . . . . . . . . . . . . . . . . . . . . . . . . . . . . . . . . . . . . . . . . . . . . . 2-1
Paced Rhythm . . . . . . . . . . . . . . . . . . . . . . . . . . . . . . . . . . . . . . . . . . . . . . . . . . . . . . . . . . 2-2
Basic Cardiac Rhythm . . . . . . . . . . . . . . . . . . . . . . . . . . . . . . . . . . . . . . . . . . . . . . . . . . . . 2-2
Ventricular Preexcitation . . . . . . . . . . . . . . . . . . . . . . . . . . . . . . . . . . . . . . . . . . . . . . . . . 2-3
Premature Complexes . . . . . . . . . . . . . . . . . . . . . . . . . . . . . . . . . . . . . . . . . . . . . . . . . . . 2-3
Pauses . . . . . . . . . . . . . . . . . . . . . . . . . . . . . . . . . . . . . . . . . . . . . . . . . . . . . . . . . . . . . . . . 2-4
Miscellaneous Arrhythmias. . . . . . . . . . . . . . . . . . . . . . . . . . . . . . . . . . . . . . . . . . . . . . . . 2-4
Atrioventricular Conduction . . . . . . . . . . . . . . . . . . . . . . . . . . . . . . . . . . . . . . . . . . . . . . 2-4
Philips 12-Lead Algorithm Physician Guide iii
Page 5

Table of Contents
Adult Morphology Analysis
Adult Morphology Categories . . . . . . . . . . . . . . . . . . . . . . . . . . . . . . . . . . . . . . . . . . . . . . . . .3-1
Dextrocardia. . . . . . . . . . . . . . . . . . . . . . . . . . . . . . . . . . . . . . . . . . . . . . . . . . . . . . . . . . . .3-2
Right Atrial Abnormality . . . . . . . . . . . . . . . . . . . . . . . . . . . . . . . . . . . . . . . . . . . . . . . . . .3-2
Left Atrial Abnormality. . . . . . . . . . . . . . . . . . . . . . . . . . . . . . . . . . . . . . . . . . . . . . . . . . . .3-2
Biatrial Abnormality . . . . . . . . . . . . . . . . . . . . . . . . . . . . . . . . . . . . . . . . . . . . . . . . . . . . . .3-2
QRS Axis Deviation . . . . . . . . . . . . . . . . . . . . . . . . . . . . . . . . . . . . . . . . . . . . . . . . . . . . . .3-2
Ventricular Conduction Delays . . . . . . . . . . . . . . . . . . . . . . . . . . . . . . . . . . . . . . . . . . . . .3-3
Right Ventricular Hypertrophy . . . . . . . . . . . . . . . . . . . . . . . . . . . . . . . . . . . . . . . . . . . . .3-3
Left Ventricular Hypertrophy. . . . . . . . . . . . . . . . . . . . . . . . . . . . . . . . . . . . . . . . . . . . . . .3-4
Low Voltage and Chronic Obstructive Pulmonary Disease Pattern. . . . . . . . . . . . . . . . .3-5
Inferior Myocardial Infarction. . . . . . . . . . . . . . . . . . . . . . . . . . . . . . . . . . . . . . . . . . . . . . .3-5
Lateral Myocardial Infarction . . . . . . . . . . . . . . . . . . . . . . . . . . . . . . . . . . . . . . . . . . . . . . .3-5
Anteroseptal and Anterior Myocardial Infarction . . . . . . . . . . . . . . . . . . . . . . . . . . . . . . .3-6
Anterolateral and Extensive Anterior Myocardial Infarct . . . . . . . . . . . . . . . . . . . . . . . . .3-6
Posterior Myocardial Infarction . . . . . . . . . . . . . . . . . . . . . . . . . . . . . . . . . . . . . . . . . . . . .3-6
ST Depression and Myocardial Ischemia . . . . . . . . . . . . . . . . . . . . . . . . . . . . . . . . . . . . . .3-7
T Wave Abnormalities and Myocardial Ischemia . . . . . . . . . . . . . . . . . . . . . . . . . . . . . . .3-7
Repolarization Abnormalities and Myocardial Ischemia . . . . . . . . . . . . . . . . . . . . . . . . . .3-8
ST Elevation, Myocardial Injury, Pericarditis, and Early Repolarization . . . . . . . . . . . . . .3-8
Tall T Waves. . . . . . . . . . . . . . . . . . . . . . . . . . . . . . . . . . . . . . . . . . . . . . . . . . . . . . . . . . . .3-8
QT Abnormalities, Electrolyte Disturbance, and Drug Effects . . . . . . . . . . . . . . . . . . . . .3-9
Pediatric Morphology Analysis
Pediatric Morphology Categories . . . . . . . . . . . . . . . . . . . . . . . . . . . . . . . . . . . . . . . . . . . . . . .4-1
Dextrocardia. . . . . . . . . . . . . . . . . . . . . . . . . . . . . . . . . . . . . . . . . . . . . . . . . . . . . . . . . . . .4-2
Right Atrial Abnormality . . . . . . . . . . . . . . . . . . . . . . . . . . . . . . . . . . . . . . . . . . . . . . . . . .4-2
Left Atrial Abnormality. . . . . . . . . . . . . . . . . . . . . . . . . . . . . . . . . . . . . . . . . . . . . . . . . . . .4-2
Biatrial Abnormality . . . . . . . . . . . . . . . . . . . . . . . . . . . . . . . . . . . . . . . . . . . . . . . . . . . . . .4-2
QRS Axis Deviation . . . . . . . . . . . . . . . . . . . . . . . . . . . . . . . . . . . . . . . . . . . . . . . . . . . . . .4-3
Ventricular Conduction Delays . . . . . . . . . . . . . . . . . . . . . . . . . . . . . . . . . . . . . . . . . . . . .4-6
Right Ventricular Hypertrophy . . . . . . . . . . . . . . . . . . . . . . . . . . . . . . . . . . . . . . . . . . . . .4-7
Left Septal Hypertrophy . . . . . . . . . . . . . . . . . . . . . . . . . . . . . . . . . . . . . . . . . . . . . . . . . . .4-7
Left Ventricular Hypertrophy. . . . . . . . . . . . . . . . . . . . . . . . . . . . . . . . . . . . . . . . . . . . . . .4-7
Biventricular Hypertrophy . . . . . . . . . . . . . . . . . . . . . . . . . . . . . . . . . . . . . . . . . . . . . . . . .4-8
Low Voltage . . . . . . . . . . . . . . . . . . . . . . . . . . . . . . . . . . . . . . . . . . . . . . . . . . . . . . . . . . . .4-8
Q Wave Abnormality and Myocardial Infarct . . . . . . . . . . . . . . . . . . . . . . . . . . . . . . . . . .4-9
ST Depression . . . . . . . . . . . . . . . . . . . . . . . . . . . . . . . . . . . . . . . . . . . . . . . . . . . . . . . . . .4-9
T Wave Abnormality . . . . . . . . . . . . . . . . . . . . . . . . . . . . . . . . . . . . . . . . . . . . . . . . . . . . .4-9
Repolarization Abnormality . . . . . . . . . . . . . . . . . . . . . . . . . . . . . . . . . . . . . . . . . . . . . . . .4-9
ST Elevation, Pericarditis, and Early Repolarization . . . . . . . . . . . . . . . . . . . . . . . . . . . . .4-9
Tall T Waves. . . . . . . . . . . . . . . . . . . . . . . . . . . . . . . . . . . . . . . . . . . . . . . . . . . . . . . . . . .4-10
QT Abnormality and Electrolyte Disturbance. . . . . . . . . . . . . . . . . . . . . . . . . . . . . . . . .4-10
Congenital Heart Defects. . . . . . . . . . . . . . . . . . . . . . . . . . . . . . . . . . . . . . . . . . . . . . . . .4-10
iv Philips 12-Lead Algorithm Physician Guide
Page 6

Table of Contents
Reading the Printed ECG Report
Interpretive, Reason, and Severity Statements. . . . . . . . . . . . . . . . . . . . . . . . . . . . . . . . . . . . 5-2
Severity Statement . . . . . . . . . . . . . . . . . . . . . . . . . . . . . . . . . . . . . . . . . . . . . . . . . . . 5-3
Basic Measurements . . . . . . . . . . . . . . . . . . . . . . . . . . . . . . . . . . . . . . . . . . . . . . . . . . . . . . . . 5-3
Patient ID Clinical Information . . . . . . . . . . . . . . . . . . . . . . . . . . . . . . . . . . . . . . . . . . . . . . . . 5-4
Patient ID Clinical Codes . . . . . . . . . . . . . . . . . . . . . . . . . . . . . . . . . . . . . . . . . . . . . . . . . 5-5
Patient ID Information . . . . . . . . . . . . . . . . . . . . . . . . . . . . . . . . . . . . . . . . . . . . . . . . . . . . . . 5-7
Patient ID Ethnicity Codes . . . . . . . . . . . . . . . . . . . . . . . . . . . . . . . . . . . . . . . . . . . . . . . . 5-8
Institution Information . . . . . . . . . . . . . . . . . . . . . . . . . . . . . . . . . . . . . . . . . . . . . . . . . . . . . . 5-9
Configurable Clinical Information . . . . . . . . . . . . . . . . . . . . . . . . . . . . . . . . . . . . . . . . . . . . . 5-10
ECG Order Information . . . . . . . . . . . . . . . . . . . . . . . . . . . . . . . . . . . . . . . . . . . . . . . . . . . . 5-11
Physician Information . . . . . . . . . . . . . . . . . . . . . . . . . . . . . . . . . . . . . . . . . . . . . . . . . . . . . . 5-12
Report Information . . . . . . . . . . . . . . . . . . . . . . . . . . . . . . . . . . . . . . . . . . . . . . . . . . . . . . . . 5-12
Calibration Information. . . . . . . . . . . . . . . . . . . . . . . . . . . . . . . . . . . . . . . . . . . . . . . . . . . . . 5-13
Time Separator . . . . . . . . . . . . . . . . . . . . . . . . . . . . . . . . . . . . . . . . . . . . . . . . . . . . . . . . . . . 5-15
Pacing Detection Settings . . . . . . . . . . . . . . . . . . . . . . . . . . . . . . . . . . . . . . . . . . . . . . . . . . . 5-15
Algorithm Version Number . . . . . . . . . . . . . . . . . . . . . . . . . . . . . . . . . . . . . . . . . . . . . . . . . 5-17
Speed and Sensitivity Settings . . . . . . . . . . . . . . . . . . . . . . . . . . . . . . . . . . . . . . . . . . . . . . . . 5-18
Device Identification Number. . . . . . . . . . . . . . . . . . . . . . . . . . . . . . . . . . . . . . . . . . . . . . . . 5-18
12-Lead ECG Report Examples . . . . . . . . . . . . . . . . . . . . . . . . . . . . . . . . . . . . . . . . . . . . . . 5-19
Extended Measurements Report . . . . . . . . . . . . . . . . . . . . . . . . . . . . . . . . . . . . . . . . . . . . . 5-26
Morphology Analysis. . . . . . . . . . . . . . . . . . . . . . . . . . . . . . . . . . . . . . . . . . . . . . . . . . . . 5-27
Morphology Lead Measurements . . . . . . . . . . . . . . . . . . . . . . . . . . . . . . . . . . . . . . . . . . 5-28
Derived Transverse QRS Vector . . . . . . . . . . . . . . . . . . . . . . . . . . . . . . . . . . . . . . . . . . 5-31
Frontal/Horizontal Plane Axis Parameters. . . . . . . . . . . . . . . . . . . . . . . . . . . . . . . . . . . 5-32
Global Measurements. . . . . . . . . . . . . . . . . . . . . . . . . . . . . . . . . . . . . . . . . . . . . . . . . . . 5-32
Analysis Statement Codes . . . . . . . . . . . . . . . . . . . . . . . . . . . . . . . . . . . . . . . . . . . . . . . 5-32
Rhythm Analysis . . . . . . . . . . . . . . . . . . . . . . . . . . . . . . . . . . . . . . . . . . . . . . . . . . . . . . . 5-33
Group Measurements. . . . . . . . . . . . . . . . . . . . . . . . . . . . . . . . . . . . . . . . . . . . . . . . . . . 5-34
Group Flags. . . . . . . . . . . . . . . . . . . . . . . . . . . . . . . . . . . . . . . . . . . . . . . . . . . . . . . . . . . 5-35
Global Rhythm Parameters . . . . . . . . . . . . . . . . . . . . . . . . . . . . . . . . . . . . . . . . . . . . . . 5-36
Rhythm Grouping of Beats . . . . . . . . . . . . . . . . . . . . . . . . . . . . . . . . . . . . . . . . . . . . . . . 5-37
Ectopic Rhythm. . . . . . . . . . . . . . . . . . . . . . . . . . . . . . . . . . . . . . . . . . . . . . . . . . . . . . . . 5-37
Pacemaker. . . . . . . . . . . . . . . . . . . . . . . . . . . . . . . . . . . . . . . . . . . . . . . . . . . . . . . . . . . . 5-38
Rhythm Report . . . . . . . . . . . . . . . . . . . . . . . . . . . . . . . . . . . . . . . . . . . . . . . . . . . . . . . . . . . 5-40
Disclose Report. . . . . . . . . . . . . . . . . . . . . . . . . . . . . . . . . . . . . . . . . . . . . . . . . . . . . . . . . . . 5-43
Appendix A. Normal Measurement Values
Appendix B. Interpretive Statements (by Category)
Appendix C. Interpretive Statements (Alphabetical)
Philips 12-Lead Algorithm Physician Guide v
Page 7

Introduction
Development of computer-assisted ECG analysis began in the 1960s. Initially used in research
facilities, computer interpretation has developed into an accepted tool for physicians.
Development of the adult ECG Criteria Program began in 1971 as a combined effort between
engineers and a worldwide panel of cardiologists. At the core of ECG analysis is the ECG
Criteria Language (ECL). ECL is a computer programming language that was developed
specifically for the definition of electrocardiographic criteria, and was first introduced in
1978. The primary objective of ECL is to provide a method for ECG criteria to be expressed in
a form meaningful to both a cardiologist and to computers. ECL describes ECG criteria using
consistent terminology selected from a broad base of cardiologists as well as
electrocardiography texts.
The Philips 12-Lead Algorithm provides an analysis of the amplitudes, durations, and
morphologies of the ECG waveforms and the associated rhythm. ECG waveform analysis is
based on standard criteria for interpretation of these parameters, calculations of the electrical
axis, and the relationship between leads.
1
The Philips 12-Lead Algorithm
The algorithm is highly age and gender specific. Patient age and gender are used throughout
the program to define normal limits for heart rate, axis deviation, time intervals, and voltage
values for interpretation accuracy in tachycardia, bradycardia, prolongation or shortening of
PR and QT intervals, hypertrophy, early repolarization, and myocardial infarct.
Adult criteria apply if the patient age entered is 16 years old or older, or if no age is specified.
Pediatric criteria apply if the patient age entered is younger than 16 years of age.
A computer-interpreted ECG report is not intended to be a substitute for interpretation by a
qualified physician. The interpreted ECG is a tool to assist the physician in making a clinical
diagnosis in conjunction with the physician’s knowledge of the patient, the results of the
physical examination, and other findings. The algorithm helps to identify problem areas for
the physician and saves time for the physician or editing technician who may only need to add,
delete, or modify a few statements.
1-1
Page 8
The Philips 12-Lead Algorithm The Philips 12-Lead Algorithm Process
The Philips 12-Lead Algorithm Process
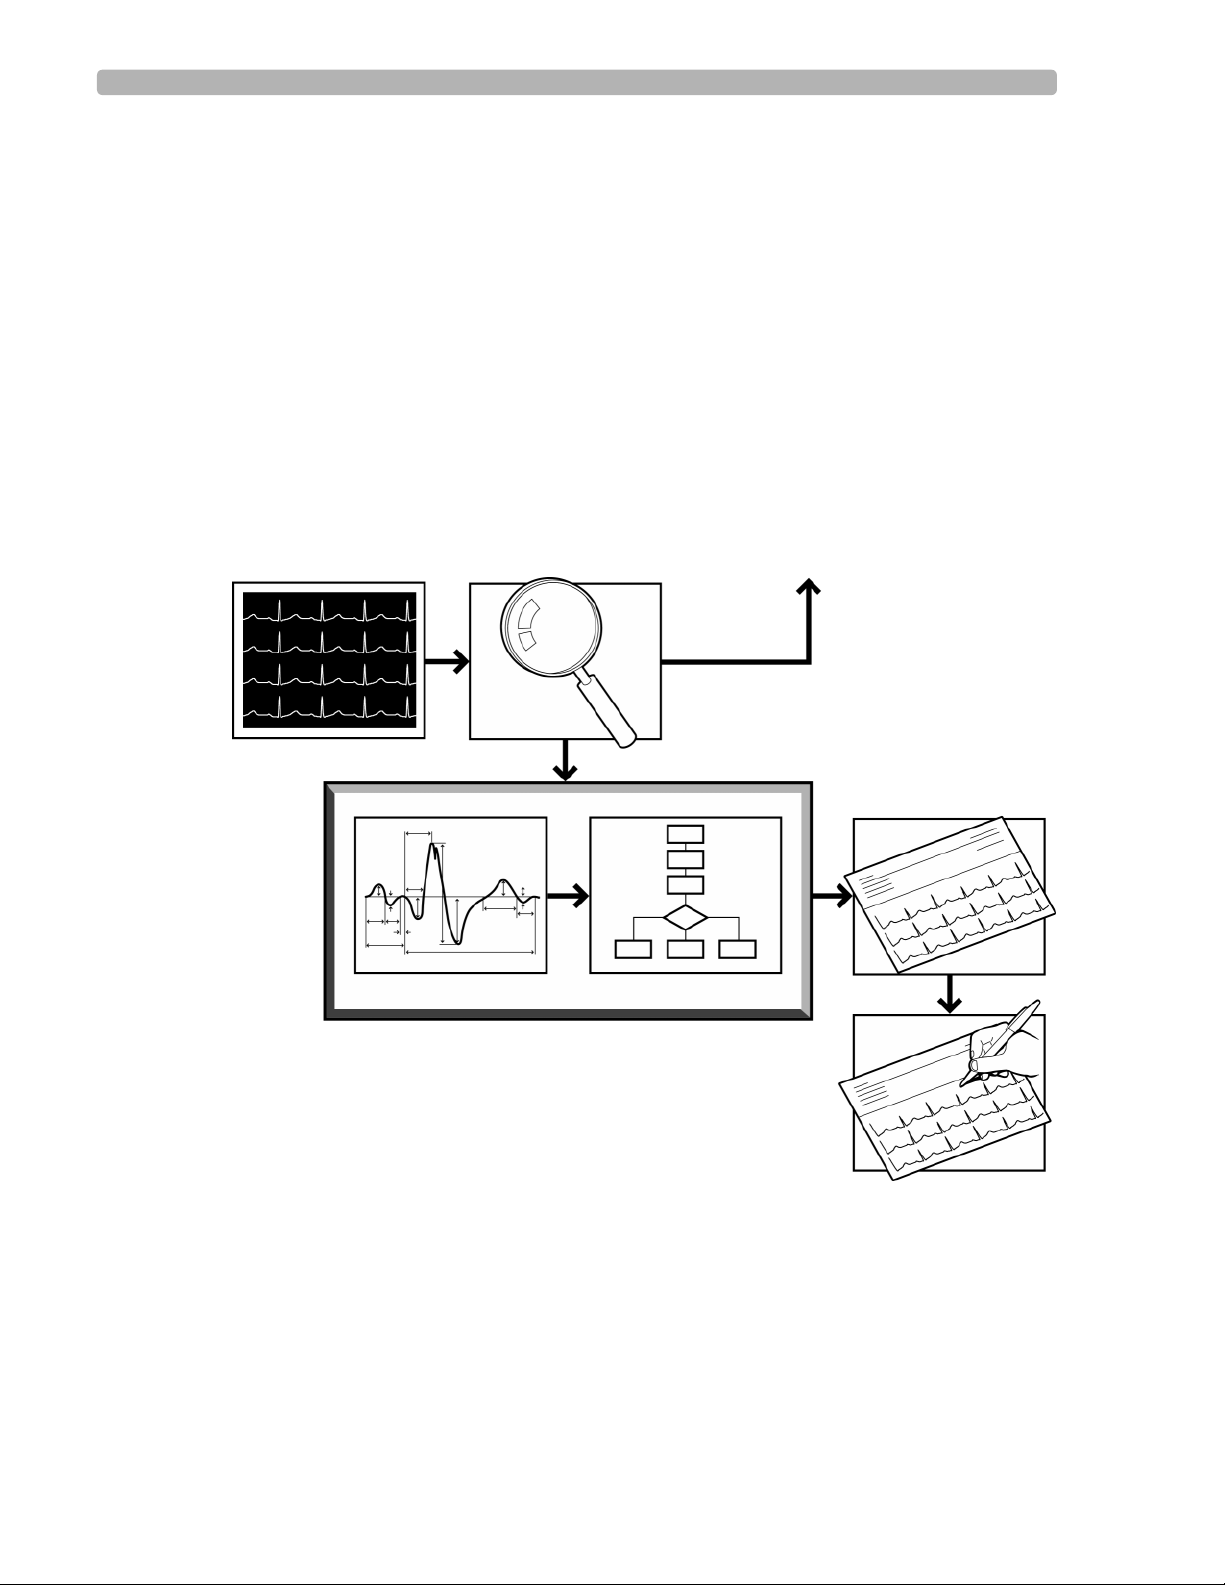
The Philips 12-Lead Algorithm produces precise and consistent ECG measurements that are
used to provide interpretive statements. The process begins with the simultaneous acquisition
of the twelve conventional leads and follows four steps to produce the interpreted ECG report.
1 Quality Monitor – examines the technical quality of each ECG lead
2Waveform Recognition – locates and identifies the various waveform components
3Measurement – measures each component of the waveform and performs basic rhythm
analysis, producing a comprehensive set of measurements
4 Interpretation – uses extended measurements and Patient ID information (age, gender) to
select interpretive statements from the program
Figure 1-1 The Philips 12-Lead Algorithm Analysis Process
ECG Patient Data Quality Monitor Feedback to Operator
Extended Measurements Criteria
Philips 12-Lead Algorithm
Interpretive Report
Overreader
1-2 Philips 12-Lead Algorithm Physician Guide
Page 9

Quality Monitor The Philips 12-Lead Algorithm
Quality Monitor
Computer-assisted ECG analysis begins by obtaining accurate ECG waveforms through
simultaneously acquiring and analyzing 12 ECG leads.The analog ECG signal at the body
surface is digitized by the Patient Module. The ECG waveform data is captured at a sample
rate of 4 Mhz and reduced to 500 samples per second with 5
will accurately detect pacemaker pulses.
Philips Medical Systems equipment monitors ECG trace quality from the time of lead
attachment, to ECG acquisition, and throughout the analysis process. This ensures the highest
possible quality ECG trace. This also enables the correction of problems before the ECG trace
is printed.
During analysis, the trace quality is analyzed to ensure good ECG measurements. The ECG is
also analyzed for muscle artifact, AC noise, baseline wander, and leads-off. Any noise
problems not corrected by the operator are described in the interpretive statements on the ECG
report.
If noise conditions are severe, a report may not be printed. If noise conditions are significant
enough to prevent ECG analysis, the ECG may be printed without interpretation. The operator
must then correct the noise problem and retake the ECG.
µV resolution. This sampling rate
Modifying lead placement and improving patient preparation helps to eliminate most noise
quality problems.
Reducing Artifact
Electrical interference, patient respiration, patient movement, and muscle tremors may add
noise and artifact to the ECG signal. Poor quality electrodes or inadequate patient preparation
may also degrade the ECG signal.
The two types of AC interference in the ECG signal are common mode and differential mode.
Common Mode
Some noise sources that interfere with the ECG signal affect all of the electrodes attached to
the patient. These common noise sources are removed from the ECG by input circuitry as the
signal is acquired and digitized. The amount by which these common mode signals are
reduced is referred to as the common mode rejection ratio. The common mode rejection ratio
for Philips Medical Systems input circuitry meets or exceeds current AAMI and IEC
standards.
Differential Mode
The magnetic fields associated with electrical power interact with the lead wires. These fields
induce electrical signals that appear as high frequency noise on the ECG. The amount of
distortion differs from lead to lead, depending on the size of any loop created by the lead wire
and on its orientation. A good way to prevent distortion is to align all the lead wires with the
patient’s body along the head-to-foot axis.
1-3
Page 10
The Philips 12-Lead Algorithm Quality Monitor
Using Filters
A variety of noise sources may degrade the reproduction of the ECG signal. A sophisticated
set of digital filters may be selected by the operator (or during system configuration) to
optimize the displayed or printed ECG waveform.
With the exception of the AC filter (which is highly selective) there is trade off between
fidelity and clarity of the ECG trace when a filter is applied. The more filtering applied, the
greater the possibility of removing ECG signal details.
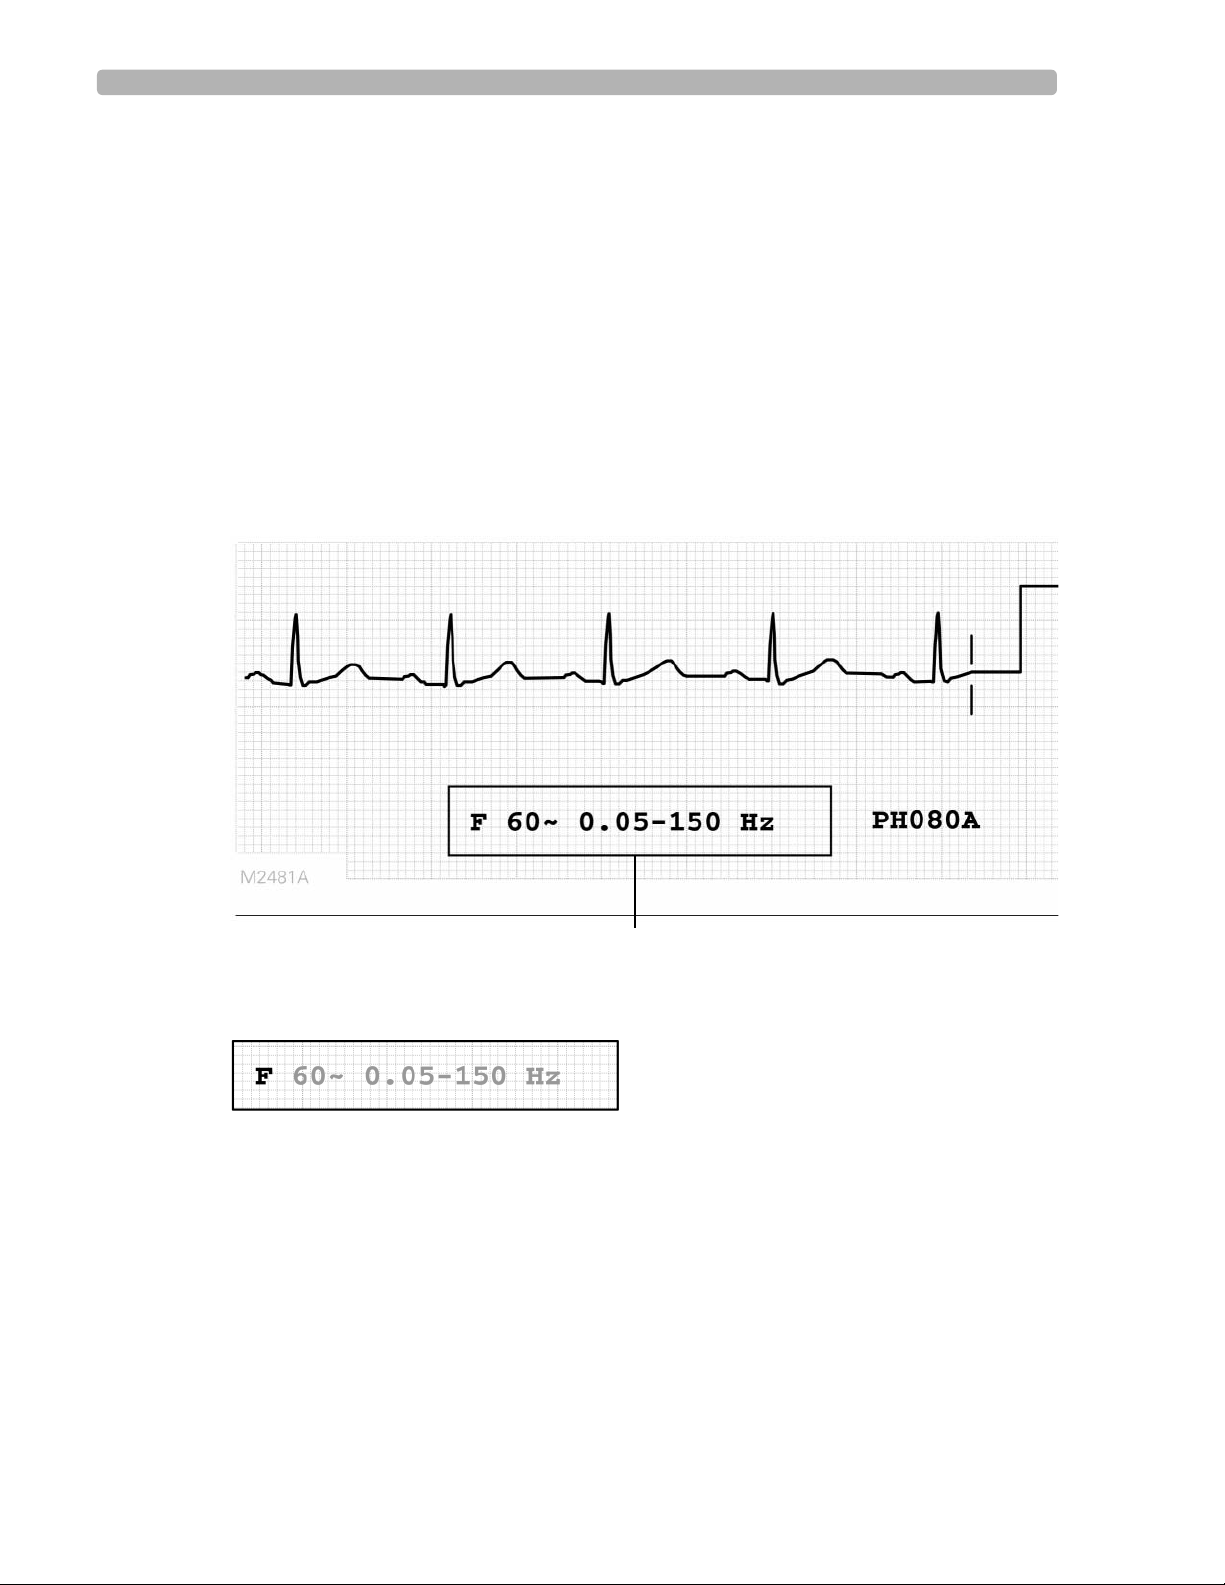
In the lower right corner of the ECG report is a box that displays information about the
filtering options used on the ECG.
NOTE While all filters affect displayed and printed ECGs, the Philips 12-Lead Algorithm always receives and
analyzes unfiltered data.
Figure 1-2 Example of the Filter Box on the ECG Report
Artifact Filter
The artifact filter removes skeletal muscle artifact. This noise source is the most difficult to
eliminate because it has the same frequencies as ECG signals. The artifact filter eliminates
skeletal muscle artifact, but also reduces all high frequency components of the ECG.
The filter removes up to 50
affect P waves and the entire QRS-T complex. Use the artifact filter only for ECGs that would
be unreadable due to significant levels of muscle artifact.
1-4 Philips 12-Lead Algorithm Physician Guide
µV of signals in the 5 Hz to 150 Hz frequency range. This may
Filter Box
Page 11
Quality Monitor The Philips 12-Lead Algorithm
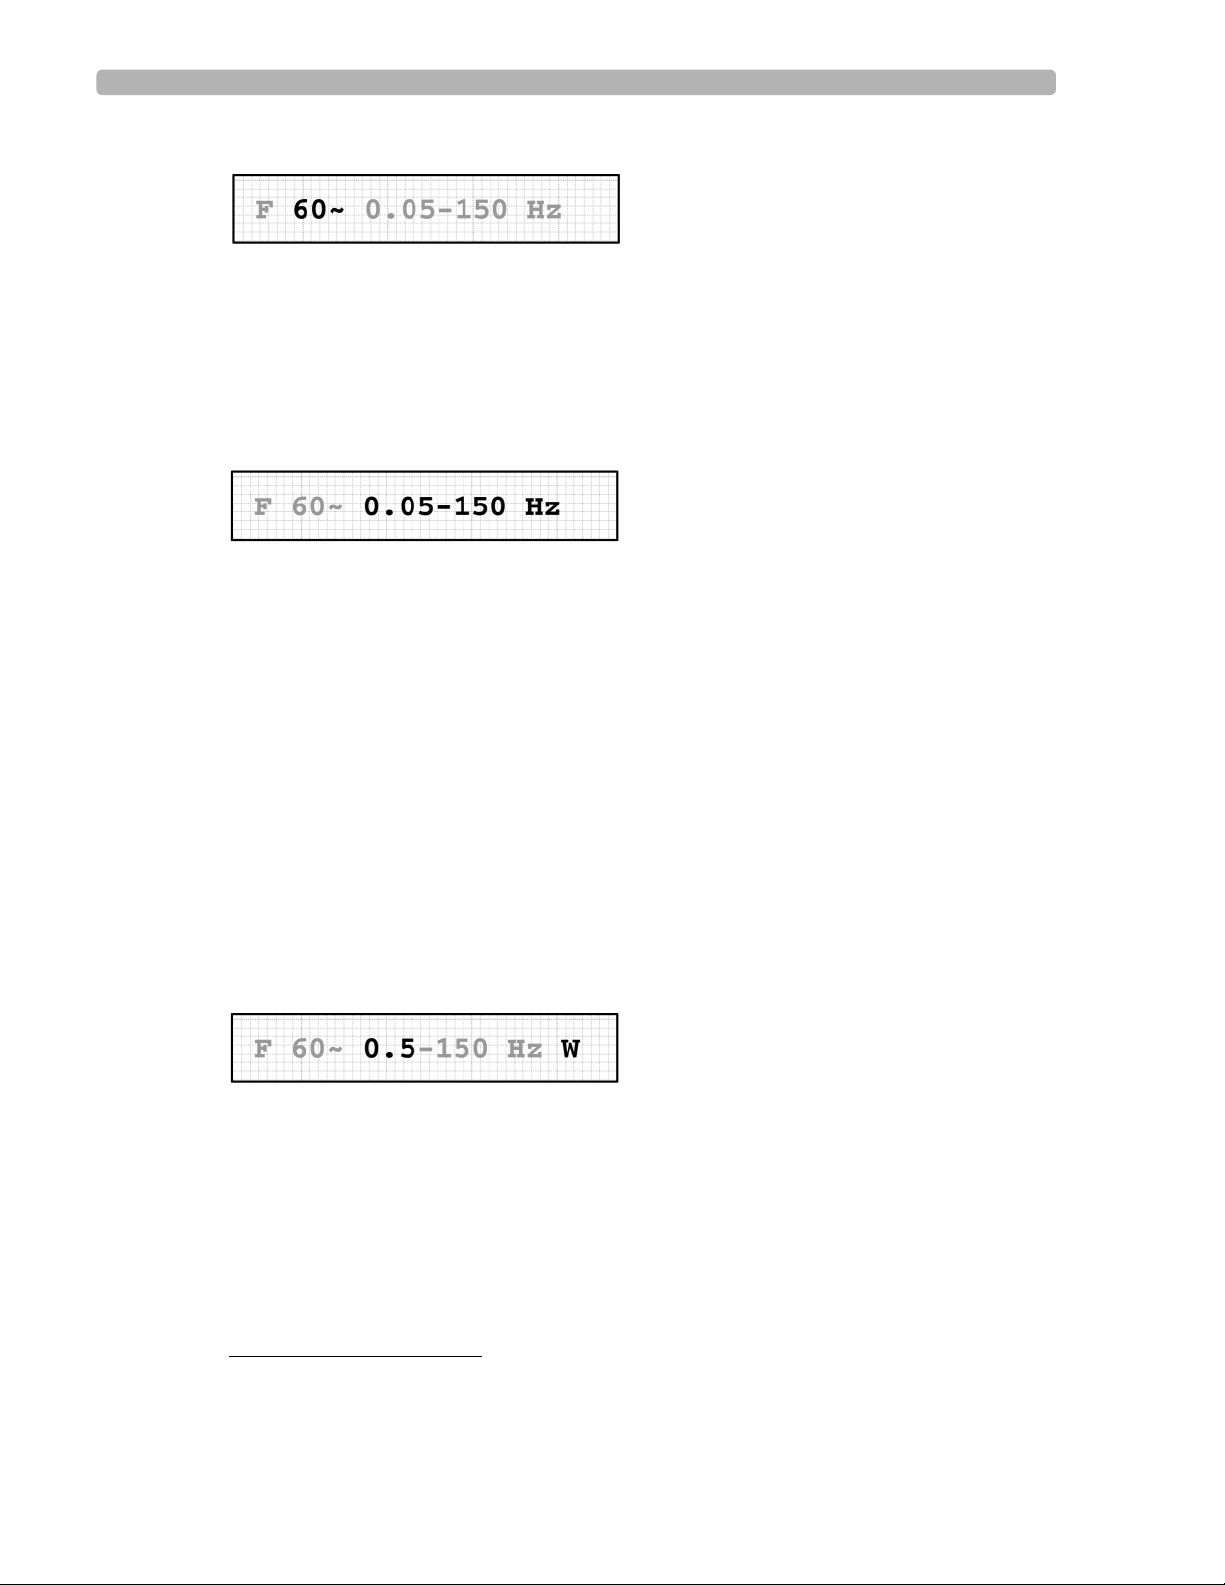
AC Filter
The AC filter removes interference created by the magnetic fields associated with electrical
power interacting with the lead wires. The frequency of the AC interference is stable at 60 or
50 Hz, so the AC filter removes the AC noise and leaves the ECG signal intact. The line
frequency of 60 or 50 Hz is selected during system configuration.
If the filter box does not contain the AC filter symbol, the AC filter was not used for the ECG.
Frequency Response Filters
These filters suppress frequencies at the high and low ends of the ECG signal spectrum. The
available low frequency response filter settings are 40, 100, and 150 Hz. In 1989, the
American Heart Association recommended that frequencies up to 125 Hz be recorded for adult
ECGs and that frequencies up to 150 Hz be recorded for pediatric ECGs.
1
Changing the low frequency filter to 40 or 100 Hz results in a smoother-looking ECG
waveform while eliminating some fine detail in the signal. Small deflections, notches, and
slurs may be distorted or may disappear if one of these filters is applied.
The high frequency response filter settings are 0.05, 0.15, and 0.5 Hz.
NOTE With the baseline wander filter on, the high frequency response filter is automatically set to 0.5. It is
recommended that the 0.05 high frequency response filter setting be used for all other ECGs. See
“Baseline Wander Filter” below for more information.
The frequency response of the printed ECG is indicated in the ECG report filter box. The
algorithm uses 0.05 to 150 Hz bandwidth for maximum fidelity.
Baseline Wander Filter
Baseline wander is the slow (typically 0.1 - 0.2 Hz) drifting of the ECG baseline up or down
during ECG recording. Baseline wander may result from patient respiration or from other
sources. Severe baseline wander may make it difficult to determine the true wave shapes in the
ECG.
Effective baseline wander suppression techniques do not distort the ST segment. While the
highest frequency response limit of 0.05 Hz (recommended for normal use) eliminates
baseline wander from most ECGs, additional suppression may be required. Turning on the
baseline wander filter suppresses all frequencies above 0.5.
1. Bailey JJ, Berson AS, Garson A, Horan LG, Macfarlane PW, Mortara DW, Zywietz C: Recommendations for
Standardization and Specifications in Automated Electrocardiography: Bandwidth and Digital Signal
Processing. Circulation, 81:730-739 (1990).
1-5
Page 12
The Philips 12-Lead Algorithm Waveform Recognition and Measurements
NOTE A 0.5 Hz baseline wander filter that may distort the ST segment is used during continuous ECG
recording in Rhythm mode. Do not attempt to interpret the contour aspects of Rhythm ECGs at this
setting. If contour analysis is important in Rhythm mode, use the 0.05 Hz Rhythm high-pass frequency
response setting that minimizes the ST segment distortion. Rhythm characteristics of the ECG are
accurately recorded regardless of the low-pass frequency setting in Rhythm mode.
Waveform Recognition and Measurements
The Philips 12-Lead Algorithm calculates measurements for all the waveforms on an ECG
report. Every beat in each lead is measured individually, allowing the natural variation among
beats to contribute to the representative measurements. In the algorithm, all of the
representative group, lead, and global measurements are calculated from the comprehensive
set of measurements for each beat. The algorithm can use any combination of these three types
of measurements (group, lead, global) thereby enhancing the flexibility and power of its
interpretive capabilities.
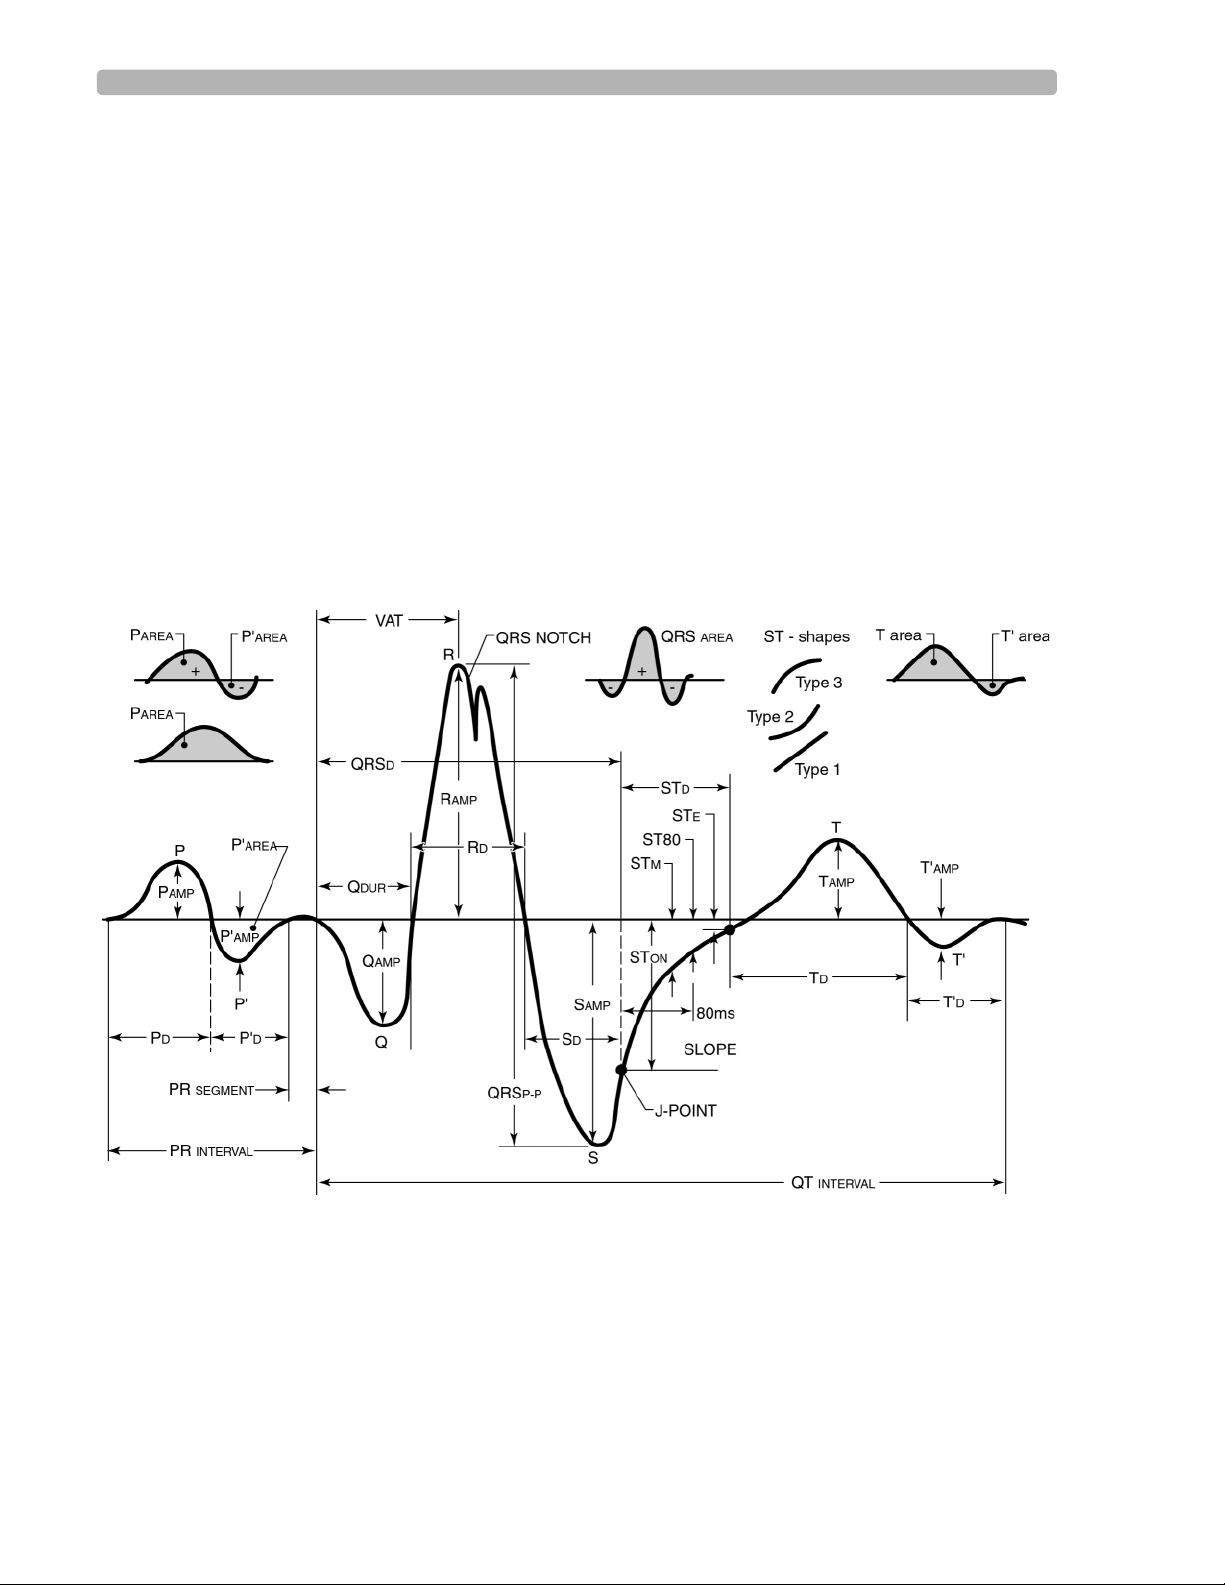
Figure 1-3 ECG Morphology Measurements
Waveform Recognition
The first step of the measurement program involves waveform recognition and beat detection.
A pacing spike detector is run on all leads if the ECG pacemaker setting is
Pacer spikes are removed and the resulting waves are analyzed with a boundary indicator
derived from all leads over the ten-second analysis period. After the approximate QRS
complex and pacemaker spike locations are known, another boundary indicator waveform that
1-6 Philips 12-Lead Algorithm Physician Guide
On or Unknown.
Page 13

Waveform Recognition and Measurements The Philips 12-Lead Algorithm
enhances P and T wave detection is derived. Approximate P wave, QRS complex, and T wave
regions are then determined for each beat in the ECG.
Comprehensive Measurements
After the approximate waveform locations are known, they are further refined to determine
precise onsets and offsets for each waveform. Once the onsets and offsets are determined, the
amplitude, duration, area, and shape are calculated for every P wave, QRS complex, ST
segment, and T wave in each lead. Waveform irregularities such as notches, slurs, delta waves,
and pacemaker spikes are also noted for every beat.
Group Measurements
Each beat in the ECG is classified into one of five rhythm groups based on rate and
morphology parameters. Each group has beats with similar R-R intervals, durations, and
shapes. All ventricular paced beats are grouped together, regardless of other parameters.
Group 1 measurements represent the type of beat that is predominant.
Groups 2 through 5 represent other beat types whose measurements are averaged together.
The group into which each beat is classified is noted under the heading
OF BEATS
in the Rhythm Analysis section of the Extended Measurements report. See
“Extended Measurements Report” on page 5-26.
Lead Measurements
Measurements for each of the 12 leads are calculated from the Group 1 beats. Only if all beats
in the ECG are ventricular paced will the measurements be for paced beats. If an ECG
contains both paced and non-paced beats, only the non-paced beats will be measured.
The lead measurements are averaged representatives of the dominant waveform present in
each lead and are reported in the Morphology Analysis section of the Extended Measurements
Report.
Atrial Rhythm Analysis
Atrial rhythm is determined by examining leads V1, aVF, II, and III in succession until the
algorithm can determine the number of P waves per QRS complex. If the determination fails,
no atrial rhythm parameters are calculated.
Global Measurements
The global measurements for the ECG (including the frontal and horizontal plane axis
measurements) are reported to the right of the lead measurements in the Morphology Analysis
section of the Extended Measurements Report. See “Extended Measurements Report” on
page 5-26 for more information.
RHYTHM GROUPING
These interval, duration, and segment measurements are the measurements of the
representative beat in each lead from Group 1. The global rate reported is the mean ventricular
rate over the entire ECG unless the algorithm determines that one of the group mean
ventricular rates is more representative of the underlying rhythm.
1-7
Page 14
The Philips 12-Lead Algorithm Interpretation
Axis Measurements
Although it is convenient to use waveform amplitudes when making axis measurements
manually, using the areas of the waveforms yields more accurate results. Philips Medical
Systems equipment uses the waveform areas from the lead measurements in calculating the P,
QRS, and T axes. The sum of the ST onset, and middle and end amplitudes are used in
calculating the ST axis.
The frontal plane axis measurements use the limb leads and nine lead pairs (all at least 60
apart) to estimate the axes. The horizontal plane axis measurements are calculated from leads
V1-V6 in a similar manner.
The resulting estimates are examined to ensure that they converge to a single result. They are
averaged to form the representative axis measurement.
Interpretation
Within a diagnostic category, the criteria for interpretive statements become more and more
restrictive from beginning to end. Criteria met for any given interpretive statement in a
diagnostic category automatically suppresses any previous statement (in that category) that
had been selected.
Each category may only be represented on the final report by one statement. This statement is
the last one encountered whose medical criteria were true based on the measurements, earlier
decisions, and Patient ID information (age, gender).
Overall Severity
Each interpretive statement selected for the ECG report has an associated severity. Severities
that are more abnormal override lesser severities. The severities of all selected interpretive
statements are combined to determine the overall severity of the ECG. This severity is printed
on each page of the ECG report.
º
Table 1-1 Overall ECG Severity
Severity Code
No Severity NS
Normal ECG NO
Otherwise Normal ECG ON
Borderline ECG BO
Abnormal ECG AB
Defective ECG DE
1-8 Philips 12-Lead Algorithm Physician Guide
Page 15

2
Adult and Pediatric Rhythm Analysis
The interpretive statements generated by the Philips 12-Lead Algorithm are based on the full
range of ECG wavelet measurements and include wavelet durations,
other parameters.
All of the interpretive statements are grouped into diagnostic categories. In each diagnostic
category, more clinically significant findings override more benign ones. For instance, in the
category of Ventricular Conduction Delays, the statement Left Bundle Branch Block (LBBB)
overrides Borderline Intraventricular Conduction Delay and Incomplete Left Bundle Branch
Block. In addition, the presence of LBBB also suppresses a statement from a previous
category such as Left Axis Deviation and bypasses tests for ventricular hypertrophy, most
infarcts, ST deviations, and abnormal T waves. These suppression and bypass conditions
generally are not addressed in the descriptions of the diagnostic categories.
The diagnostic categories are divided into two sections: cardiac rhythm and morphology. Each
diagnostic category includes a set of interpretive statements with variations in severity and
probability. Detailed cardiac rhythm criteria are described in the following section. Detailed
morphology detection criteria are described in Chapter 3, “Adult Morphology Analysis” and
Chapter 4, “Pediatric Morphology Analysis.”
amplitudes, areas, and
ECG analysis begins with rhythm analysis with the first interpretive statement describing the
basic rhythm of the ECG, or the paced rhythm of the ECG.
A second interpretive statement may be appended to describe additional rhythm
abnormalities, including premature complexes, pauses, atrioventricular conduction
abnormalities, and miscellaneous arrhythmias.
Cardiac Rhythm Categories
Paced Rhythm . . . . . . . . . . . . . . . . . . . . . . . . . . . . . . . . . . . . . . . . . . . . . . . . . . .(page 2-2)
Basic Cardiac Rhythm . . . . . . . . . . . . . . . . . . . . . . . . . . . . . . . . . . . . . . . . . . . . .(page 2-2)
Ventricular Preexcitation . . . . . . . . . . . . . . . . . . . . . . . . . . . . . . . . . . . . . . . . . . .(page 2-3)
Premature Complexes . . . . . . . . . . . . . . . . . . . . . . . . . . . . . . . . . . . . . . . . . . . . .(page 2-3)
Pauses . . . . . . . . . . . . . . . . . . . . . . . . . . . . . . . . . . . . . . . . . . . . . . . . . . . . . . . . . .(page 2-4)
Miscellaneous Arrhythmias . . . . . . . . . . . . . . . . . . . . . . . . . . . . . . . . . . . . . . . . .(page 2-4)
Atrioventricular Conduction . . . . . . . . . . . . . . . . . . . . . . . . . . . . . . . . . . . . . . . .(page 2-4)
2-1
Page 16

Adult and Pediatric Rhythm Analysis Cardiac Rhythm Categories
Paced Rhythm
Paced rhythm interpretation concentrates on the apparent rhythm, not on the underlying
pacemaker mode (which may not be apparent from the observed rhythm). Atrial, ventricular,
dual AV sequential, and atrial-sensed ventricular-paced pacing rhythms may be described.
The term
PACED RHYTHM is used when all beats fit a characteristic paced pattern.
Paced complexes are described when pacing is intermittent and non-paced complexes are also
detected. Such complexes may include ectopic atrial or ventricular premature complexes, or
episodes of sinus rhythm. Intermittently paced rhythms are not further analyzed for rhythm
patterns during the non-paced periods.
Demand behavior with pulse inhibition in one or both chambers may be detected.
Noise spikes in technically poor tracings may mimic pacer spikes. If these are suspected, a
statement of pacemaker-like artifact is generated.
When the ECG record is obtained with a magnet in place, the pacemaker spikes occur at a
fixed rate and may be asynchronous with the underlying rhythm. This phenomenon is declared
as a failure to sense and/or capture and the presence of a magnet is questioned.
An attempt is made to diagnose atrial fibrillation in the presence of ventricular pacing. No
other atrial rhythm diagnosis is performed.
QRS complexes that are not ventricular paced (non-paced or atrial paced complexes) and that
are not classified as ventricular ectopic beats will be measured and used for further
morphology interpretation. No further interpretation is considered for ECGs with continuous
ventricular or AV dual pacing.
Basic Cardiac Rhythm
When no pacing spikes are found, one interpretive statement describes the basic cardiac
rhythm and is based on the interrelationship of the atrial rate, ventricular rate, P wave axis,
QRS duration, and other measurements. Possible statements include those related to:
Sinus, atrial, supraventricular, junctional, and ventricular rhythms
Tachycardia, bradycardia, and varying rate
Complete AV block
AV dissociation
Atrial fibrillation
Atrial flutter
A normal P axis measurement (-30
º to 120º in the frontal plane) is assumed to indicate a sinus
origin of the P wave. An abnormal P axis signifies an atrial or a junctional origin.
Tachycardia is generally defined as a rate of 100 bpm or higher in adults; bradycardia is
1
slower than 50 bpm. This is different from the value of 60 cited by many ECG texts
. The
operator may reset the default criteria from 50 bpm to 60 bpm (if available). Consult the
Philips Medical Systems product documentation for more information.
1. Surawicz B, Uhley H, Borun R, Laks, M, et al. Task Force 1: Standardization of Terminology and
Interpretation. Amer J Cardio 41:130-145 (1978).
2-2 Philips 12-Lead Algorithm Physician Guide
Page 17

Cardiac Rhythm Categories Adult and Pediatric Rhythm Analysis
Heart rates slower than the normal range are considered bradycardia and those higher are
considered tachycardia as shown in Appendix A (pediatric values only).
An interpretive statement of complete AV block is generated when the ventricular rate is low
(< 45 bpm) and the atrial rhythm is asynchronous with the ventricular rhythm. Additional
categories of complete AV block include wide QRS complexes and atrial fibrillation.
AV dissociation is detected by looking for a normal ventricular rate with considerable
variation of the apparent PR intervals. While describing the ECG rhythm strip, the algorithm
does not define the underlying rhythm (which may be complete heart block or a junctional
rhythm). An attempt is made to diagnose the underlying rhythm, complete heart block or
junctional rhythm, rather than AV dissociation.
The criteria for atrial fibrillation are rather complex. Fine fibrillation is diagnosed with
missing P waves in most leads and marked variation in the ventricular rate. Coarse fibrillation
is diagnosed from multiple shapes of P waves with a rapid apparent atrial rate and variation in
the ventricular rate.
An interpretive statement of atrial flutter is generated when the atrial rate falls between 220-
340. An attempt is made to describe the degree of block with flutter.
Ventricular Preexcitation
Ventricular preexcitation is recognized based on the occurrence of delta waves in multiple
leads and a mean QRS duration greater than 100 ms.
A short PR (PR segment <55 ms or PR interval <120 ms) reduces the number the leads with
delta waves required to detect this condition.
Leftward or rightward initial QRS axis deviation criteria are added to determine whether a left
or right accessory pathway is present. The rest of the algorithm program is bypassed if
ventricular preexcitation criteria are met.
Premature Complexes
Premature complexes are recognized when the preceding R-R interval is shorter than the
average R-R interval of a background ventricular rate that is basically regular. A reduction in
R-R interval of 15% (typical) or greater is considered significant.
Premature complexes with normal QRS duration (QRSd) are considered to be atrial or
junctional in origin, depending on the presence or absence of a P wave. Those with longer than
normal QRSd are considered to be either ventricular in origin or to be aberrant
supraventricular in origin.
Atrial premature complexes (APC, multiple APC) are generally recognized by their early
appearance, normal QRS duration, and atypical P-wave morphology. More than one APC is
diagnosed as multiple APCs.
Ventricular premature complexes (VPC, multiple VPC) are generally recognized by an early
appearance, wider than normal QRS duration, a compensatory pause, and a different polarity
than normal beats. Interpolated VPCs have ventricular morphologic characteristics without
compensatory pauses. Multiple VPCs are diagnosed when more than one VPC is detected.
2-3
Page 18

Adult and Pediatric Rhythm Analysis Cardiac Rhythm Categories
Junctional premature contractions (JPC) have the same characteristics as APCs, but without a
P-wave being detected. No attempt is made to detect retrograde P waves with JPCs.
Ventricular or supraventricular bigeminy is diagnosed when ventricular (V) or
supraventricular (A) premature beats alternate with normal (N) beats.There must be at least
two consecutive occurrences of the pattern (NV or NA) to generate an interpretive statement
of bigeminy.
Ventricular trigeminy is diagnosed when two consecutive occurrences of the pattern NNV are
detected.
Two adjacent VPCs are diagnosed as a pair. The characteristics are primarily morphological
since compensatory pauses are not usually seen.
A run of VPCs is diagnosed when three or more adjacent VPCs are seen.
Pauses
Long R-R intervals are significant if they are more than 140% (typical) of the average R-R in a
background ventricular rate that is basically regular. They are considered to indicate either a
sinus arrest or an intermittent AV block.
The presence or absence of a P wave, as well as the duration of the QRS, indicate the origin of
an escape beat. Atrial and supraventricular escapes show a P wave and a normal QRS duration
(QRSd). Junctional escapes show no P wave, but a normal QRSd. A prolonged QRSd
indicates a ventricular origin of the escape beat, although aberration cannot be excluded.
Different grades of second degree AV block are indicated on the basis of more P waves than
QRS complexes.
A statement indicating Mobitz I (Wenckebach) AV block depends on progressively longer PR
intervals preceding the long R-R interval.
Miscellaneous Arrhythmias
This category includes arrhythmias that are not covered in the preceding sections.
Statements relating to interpolated beats depend on recognizing that consecutive R-R intervals
are approximately one-half the average R-R of a background ventricular rate that is basically
regular.
Aberrant complexes are recognized when the R-R interval is only slightly decreased but the
QRSd is prolonged, as if it were of ventricular origin.
Atrioventricular Conduction
Statements in this category are based on the measurement of a prolonged PR interval.
2-4 Philips 12-Lead Algorithm Physician Guide
Page 19
Cardiac Rhythm Categories Adult and Pediatric Rhythm Analysis
The PR interval varies slightly according to age and heart rate, as shown in the following table.
Table 2-2 Borderline and Abnormally Prolonged PR Intervals (ms)
Heart Rate (bpm)
Left Value = PR Interval Upper Limit (Borderline)
Right Value = PR Interval Upper Limit (1st degree AV Block)
Age (years)
less than 50 51-90 91-120 over 120
16-60 210-220 200-210 195-205 190-200
over 60 200-230 210-220 205-215 200-210
2-5
Page 20

Adult Morphology Analysis
The morphology interpretation starts by testing for dextrocardia. Morphology abnormalities
are examined in anatomical order from right to left and from atria to ventricles. The
interpretive criteria are described (by diagnostic category) in the following section.
Adult Morphology Categories
Dextrocardia . . . . . . . . . . . . . . . . . . . . . . . . . . . . . . . . . . . . . . . . . . . . . . . . . . . . .(page 3-2)
Right Atrial Abnormality . . . . . . . . . . . . . . . . . . . . . . . . . . . . . . . . . . . . . . . . . . .(page 3-2)
Left Atrial Abnormality . . . . . . . . . . . . . . . . . . . . . . . . . . . . . . . . . . . . . . . . . . . .(page 3-2)
Biatrial Abnormality . . . . . . . . . . . . . . . . . . . . . . . . . . . . . . . . . . . . . . . . . . . . . .(page 3-2)
QRS Axis Deviation . . . . . . . . . . . . . . . . . . . . . . . . . . . . . . . . . . . . . . . . . . . . . .(page 3-2)
3
Ventricular Conduction Delays . . . . . . . . . . . . . . . . . . . . . . . . . . . . . . . . . . . . . .(page 3-3)
Right Ventricular Hypertrophy . . . . . . . . . . . . . . . . . . . . . . . . . . . . . . . . . . . . . .(page 3-3)
Left Ventricular Hypertrophy . . . . . . . . . . . . . . . . . . . . . . . . . . . . . . . . . . . . . . . .(page 3-4)
Low Voltage and Chronic Obstructive Pulmonary Disease Pattern . . . . . . . . . .(page 3-5)
Inferior Myocardial Infarction . . . . . . . . . . . . . . . . . . . . . . . . . . . . . . . . . . . . . . .(page 3-5)
Lateral Myocardial Infarction . . . . . . . . . . . . . . . . . . . . . . . . . . . . . . . . . . . . . . .(page 3-5)
Anteroseptal and Anterior Myocardial Infarction . . . . . . . . . . . . . . . . . . . . . . . .(page 3-6)
Anterolateral and Extensive Anterior Myocardial Infarct . . . . . . . . . . . . . . . . . .(page 3-6)
Posterior Myocardial Infarction . . . . . . . . . . . . . . . . . . . . . . . . . . . . . . . . . . . . . .(page 3-6)
ST Depression and Myocardial Ischemia . . . . . . . . . . . . . . . . . . . . . . . . . . . . . .(page 3-7)
T Wave Abnormalities and Myocardial Ischemia . . . . . . . . . . . . . . . . . . . . . . . .(page 3-7)
Repolarization Abnormalities and Myocardial Ischemia . . . . . . . . . . . . . . . . . .(page 3-8)
ST Elevation, Myocardial Injury, Pericarditis, and Early Repolarization . . . . . .(page 3-8)
Tall T Waves . . . . . . . . . . . . . . . . . . . . . . . . . . . . . . . . . . . . . . . . . . . . . . . . . . . .(page 3-8)
QT Abnormalities, Electrolyte Disturbance, and Drug Effects . . . . . . . . . . . . . .(page 3-9)
3-1
Page 21

Adult Morphology Analysis Adult Morphology Categories
Dextrocardia
Dextrocardia is suggested if the P wave and the QRS axes are abnormal in the frontal plane
(deviated rightward), if the horizontal plane QRS is directed rightward, and if small QRS
complexes are present in V5 and V6. The rest of the morphology interpretation is bypassed if
dextrocardia criteria are met.
Right Atrial Abnormality
Large P waves are considered suggestive of right atrial abnormality (RAA). The minimum
duration considered significant is 60 ms, the minimum voltage considered significant is 0.24
mV (typical).
Greater than normal P wave duration and amplitude in limb leads produce a statement of
consider right atrial abnormality. Additional conditions such as a biphasic P wave in Lead V1
indicate probable RAA. Larger P waves lead to more definitive interpretive statements
regarding the likelihood of RAA.
Left Atrial Abnormality
Left atrial abnormalities (LAA) are detected from large P waves on limb leads and a biphasic
P in Lead V1, and the durations and the amplitudes of the initial and terminal portions of a
biphasic P wave.
A duration greater than 110 ms combined with amplitudes over 0.10 mV in limb leads is
considered significant, though not necessarily abnormal unless present in multiple leads. A
notched P wave adds to the significance of the other values. Lead V1 is specifically examined
for duration, amplitude, and area of the negative component of the P wave. Although duration
of over 30 ms and amplitudes over 0.09 mV can be considered significant, the area of this
negative component must be greater than 0.60 Ashman units to be considered LAA. An
Ashman unit is the area of 1 square millimeter at normal speed (25 mm/sec) and normal
sensitivity (10 mm/mV). An Ashman unit equals 40 ms x 0.1 mV.
Biatrial Abnormality
Biatrial abnormality (BAA) combines right and left atrial abnormalities. Associated LAA is
diagnosed when a P amplitude greater than 0.1 mV in V1 co-exists with RAA. Associated
RAA is considered when LAA statements are combined with a significant P wave greater than
10 ms in duration and greater than 0.07 mV in amplitude, and an R wave greater than 1.0 mV
in Lead V6. BAA is considered if RAA and LAA statements with high severity were
previously generated.
QRS Axis Deviation
Interpretive statements based on frontal QRS axis measurements describe left and right
deviation as well as superior, horizontal, and vertical directions.
The mean QRS axis (mean vector of the electric force) is calculated in the frontal and
horizontal planes. The normal frontal axis range varies with age and gender. The frontal QRS
axis in young male patients tends to the right. The frontal QRS axis in older patients tends to
the left.
3-2 Philips 12-Lead Algorithm Physician Guide
Page 22

Adult Morphology Categories Adult Morphology Analysis
A frontal QRS axis between -30º and 90º is considered normal, subject to modification by age
and gender. Frontal QRS axis measurements counterclockwise from -30
deviated to the left, and those clockwise from 90
º are considered to be deviated to the right.
º are considered to be
Ventricular Conduction Delays
A QRS duration (QRSd) greater than 100 ms is common to all of the interpretive statements in
this category except for isolated left anterior fascicular block (LAFB) and left posterior
fascicular block (LPFB), which do not cause a prolonged QRS.
LAFB interpretations are associated with leftward deviation of the mean frontal QRS axis
between -40
deviation of the mean frontal QRS axis between 120
Other than the fascicular blocks, a definitive block interpretation requires that the QRSd
exceed 120 ms. A QRSd between 110 and 120 ms is non-specific intraventricular conduction
delay, and between 100 and 110ms is considered borderline intraventricular conduction delay.
Right bundle branch block (RBBB) interpretations are always associated with the terminal
portion of the QRS being directed to the right (dominant negative Q, S forces in Leads I, aVL,
and V6, and positive forces in Lead V1). A QRSd between 110-120 ms is considered
incomplete RBBB.
º and 240º counterclockwise. LPFB interpretations are associated with rightward
º and 210º clockwise.
Left bundle branch block (LBBB) interpretations are always associated with the terminal
portion of the QRS being directed to the left dominant positive (R, R') forces in Leads I, aVL,
and V6, and negative forces (Q, S) in Lead V1. A QRSd between 110-120 ms is considered
incomplete LBBB.
Right Ventricular Hypertrophy
Right ventricular hypertrophy (RVH) is detected on the basis of several findings:
Presence of a prominent R or R' in Lead V1
Presence of a prominent Q, S, or S' in either Lead I or V6
Right atrial abnormality
Right axis deviation in the frontal plane
Repolarization abnormalities typical of RVH
An R in V1 that is more than 75% the size of the Q or S is significant, and is considered to be
prominent. An R' larger than 20 ms and 0.30 mV in V1 is significant. A QRS in V1 with a
positive component larger than the negative component is highly significant.
Repolarization abnormalities typical of RVH are determined by an examination of Leads II,
aVF, V1, V2, and V3 for the presence of depressed ST segments and inverted T waves as
typical of the right ventricular strain pattern.
The statements to be printed regarding RVH are determined by combinations of the above
findings. One voltage criterion generates a consider RVH statement. Two voltage criteria or
one voltage plus repolarization abnormality generates a probable RVH statement. Definitive
RVH statements result when multiple findings are present.
3-3
Page 23

Adult Morphology Analysis Adult Morphology Categories
A Q, S, or S' larger than 40 ms and 0.20 mV in either Lead I or V6 is significant and is
considered to be prominent. A QRS with a negative component larger than the positive
component is highly significant.
Left Ventricular Hypertrophy
Left ventricular hypertrophy (LVH) is detected on the basis of several findings:
Prominent R or R' in V5 or V6
R in Lead I plus S in Lead III
Sokolow-Lyon Voltage (R in V5/V6 plus S in V1)
Cornell Voltage (R in aVL plus S in V3)
Cornell Product (R in aVL plus S in V3) multiplied by QRSd
Left axis deviation in the frontal plane
Left atrial abnormality
Prolonged QRS duration or ventricular activation time (VAT)
Repolarization abnormality typical of LVH
Voltage values for the QRS complexes that are considered excessively high vary with patient
age and gender. Because higher voltages are normal for young patients, age is considered
when evaluating LVH. The younger the patient, the more stringent are the requirements for an
LVH statement. Females have lower voltage values than males
. Voltage limits also vary with
the leads involved and whether the deflection is positive or negative.
In frontal leads the minimum value considered excessive is a positive deflection of more than
1.20 mV in Lead aVL. Precordial Leads V1 and V2 are examined for negative deflections (Q
or S) and V5 and V6 are examined for positive deflections (R or R'). These values are
considered individually; any value greater than 2.50 mV is considered significant.
The negative values in V1, V2 and the positive values in V5, V6 are added together. Any total
for Q or S in V1 plus R or R' in V5 or V6 that exceeds 3.50 mV is significant. A total of Q or S
in V2 plus R or R' in V5 or V6 must exceed 4.0 mV to be significant.
Higher voltages contribute to qualifying statements regarding LVH. Cornell Voltage criteria
are used for LVH detection. This limit is an R amplitude in Lead aVL plus S amplitude in
Lead V3 greater than or equal to 2.8 mV in males and 2.0 mV in females. LVH voltage criteria
combine with additional features determined in previous categories such as left axis deviation,
presence of LAA, QRS duration greater than 95 ms, and ventricular activation time (VAT)
greater than 55 ms.
LVH with secondary repolarization abnormalities is determined separately and results in more
definite statements regarding the likelihood of LVH. Secondary repolarization abnormalities
are determined by examining Leads I, aVL, V4, V5, and V6 for the presence of ST depression
and inverted T wave as a typical left ventricular strain pattern.
3-4 Philips 12-Lead Algorithm Physician Guide
Page 24

Adult Morphology Categories Adult Morphology Analysis
Low Voltage and Chronic Obstructive Pulmonary Disease Pattern
All leads are examined for QRS peak-to-peak voltage.
Frontal leads: if no lead has a value exceeding 0.60 mV, the ECG is considered borderline low
voltage. If no value exceeds 0.50 mV, the ECG is considered definite low voltage, an
abnormal finding.
Precordial leads: if no lead has a value exceeding 1.00 mV, the ECG is considered definite low
voltage, an abnormal finding.
Combinations of low voltage statements, rightward deviation of the frontal P and QRS axes,
and right atrial enlargement may generate statements suggesting the likelihood of chronic
pulmonary disease.
Inferior Myocardial Infarction
Leads II, III, and aVF are examined for Q wave presence and size, the ratio of Q to R, the
presence of T wave changes (flattened or inverted), and the presence of an elevated or
depressed ST segment.
As the Q waves become larger or appear in more leads and the R waves become less
prominent, the interpretive statements are more significant. For inferior Q waves to be
considered significant, at least one of them must be longer than 25 ms in duration and greater
than one-sixth the amplitude of the associated R. For any infarct statement to qualify, at least
one Q wave must be longer than 35 ms and greater than one-fifth the amplitude of the R wave.
A leftward direction of the axis of the initial portion of the QRS adds to the likelihood of an
inferior infarct statement. T wave and ST changes are used to estimate the age of the infarct.
Deeper T wave inversion and larger ST segment deviations generate statements indicating
more recent infarction. Gender and age influence the detection of inferior infarct. Males and
younger patients are more likely to have normal Q waves in the inferior leads.
Lateral Myocardial Infarction
Leads I, aVL, V5, and V6 are examined for Q wave presence and size, the ratio of Q to R, the
presence of T wave changes (flattened or inverted), and the presence of an elevated or
depressed ST segment.
For lateral Q waves to be considered significant, at least one must be longer than 35 ms and
greater than 0.10 mV in amplitude. It must also have an amplitude that is at least 20% as large
as that of the R wave. As the Q waves become larger or show in more leads and the R waves
become less prominent, the interpretive statements become more significant.
T wave and ST changes are used to estimate the age of the infarct. Deeper T wave inversion
and larger ST segment deviations generate statements indicating more recent infarction.
Gender and age influence the detection of lateral infarct. Males and younger patients are more
likely to have normal Q waves in the lateral leads.
3-5
Page 25

Adult Morphology Analysis Adult Morphology Categories
Anteroseptal and Anterior Myocardial Infarction
Leads V1, V2, V3, and V4 are examined for the presence of Q wave, Q wave area, the relative
and absolute sizes of the R and S waves, whether the QRS area is negative or positive, the
presence of T wave changes (flattened or inverted), and the presence of elevated or depressed
ST segments. Positive findings in V1 and V2 tend to be reported as anteroseptal infarcts, while
abnormalities in V2, V3, and V4 tend to be reported as anterior infarcts.
For any anteroseptal or anterior Q wave to be considered significant, it must be longer than
30 ms in duration and over 0.07 mV in amplitude. As the Q waves become larger or show in
more leads and the QRS progression from negative to positive becomes shifted more laterally,
the interpretive statements become more definitive for infarction in the anterior region.
T wave and ST changes are used to estimate the age of the infarct. Deeper T wave inversion
and greater ST elevations generate statements indicating more recent infarction.
Anterolateral and Extensive Anterior Myocardial Infarct
Leads V2, V3, V4, V5, and V6 are examined for Q wave presence and size, the relative and
absolute sizes of the R and S, whether the QRS area in V3 is negative or positive, the presence
of T wave changes (flattened or inverted), and the presence of elevated or depressed ST
segments.
For any anterolateral Q wave to be considered significant, it must be longer than 30 ms
(typical) in duration and over 0.07 mV in amplitude. As the Q waves become larger or show in
more leads, the interpretive statements become more definitive for infarction.
Positive findings in all six precordial leads generate statements describing extensive anterior
infarction.
Gender and age influence the detection of anterolateral infarct. Males and younger patients are
more likely to have normal Q waves in the anterolateral leads.
Q, ST changes, and T wave are used to estimate the age of the infarct. Deeper T wave
inversion and greater ST elevations generate statements indicating more recent infarction.
Posterior Myocardial Infarction
Leads V1, V2, and V3 are examined for the relative and absolute sizes of the R and S waves,
an absent or insignificant Q wave, ST depression, and a positive T wave.
A prominent R, in the presence of an insignificant Q, and an upright T may generate a
statement suggesting the likelihood of a posterior infarct (PMI). ST depression in V1-V3, and
upward T or T' are detected for acute posterior infarct. Combined inferior and posterior MI is
called inferoposterior MI, and combined acute inferior MI and acute posterior MI is called
acute inferoposterior MI.
Indications of LVH or RVH decrease the likelihood of a PMI statement. Gender and age
influence the detection of a posterior infarct. Males and younger patients are more likely to
have prominent R waves in V1 and V2.
3-6 Philips 12-Lead Algorithm Physician Guide
Page 26

Adult Morphology Categories Adult Morphology Analysis
ST Depression and Myocardial Ischemia
All leads are examined for negative values in the ST segment. The values examined include
the following points in the ST segment:
The onset of the ST segment (the J point)
The point midway between the onset and the end of the ST segment
80 ms past the J point
The end of the ST segment (the beginning of the T wave)
Besides negative values in the ST segment, other features are examined:
The slope of the ST segment in degrees
The shape of the ST segment (straight, concave up, or concave down).
The smallest negative ST deflection that is considered significant is 0.03 mV
As the negativity of the ST segment increases, more severe statements are generated. Minor
depression of the segment produces statements with a severity code of
(ON) or NORMAL (NO). Increasing depression produces statements progressing through from
BORDERLINE to ABNORMAL.
OTHERWISE NORMAL
Whenever possible, the location of ST abnormalities is indicated as part of the interpretive
statement. The localization generally fits the description that follows.
Table 3-1 Location of Infarcts and Lead Group of ST-T Abnormalities
Lead Groups
(Location) I IIIIIaVRaVLaVFV1V2V3V4V5V6
Anterior XXXX
AnterolateralX X X XXXXX
Lateral X X X X
Inferior X X X
ST depression is associated with rapid heart rate. A statement is generated indicating ST
depression, probably rate related, if the mean heart rate is greater than 190 minus (age in
years) bpm.
A concurrent statement regarding RVH, LVH, LBBB, RBBB, any new infarct, or any
statement associated with drug therapy or electrolyte imbalance impacts this category by
tending to suppress ST depression statements. This is more likely for the less severe ST
depression statements than for the more severe ones.
T Wave Abnormalities and Myocardial Ischemia
All leads are examined for T wave amplitude, the relative amplitude of the T and the QRS, and
whether the T is negative or positive. The frontal axis of the T wave and its relation to the
frontal QRS axis is also measured.
3-7
Page 27

Adult Morphology Analysis Adult Morphology Categories
Reduced T wave amplitude (both absolute and relative to the QRS), and negative T waves are
considered to be abnormal findings. Minimal changes in one or a few leads produce less
severe statements. As the changes become more prominent in magnitude and the number of
affected leads increases, the statements become more severe.
A frontal T axis that is not between -10
may result in a statement indicating nonspecific T wave abnormalities. Whenever possible, the
lead group of T wave abnormalities is indicated as part of the interpretive statement.
A concurrent statement regarding RVH, LVH, LBBB, RBBB, any infarct, or any statement
associated with drug therapy or electrolyte imbalance impacts this category by tending to
suppress T wave statements. This is more likely for the less severe T wave statements than for
the more severe ones.
º and 100º or a QRS-T angle that is greater than 90º
Repolarization Abnormalities and Myocardial Ischemia
This category includes statements indicating the presence of both ST segment and T wave
abnormalities. None of these statements involve any new examination of measurements.
All statements in this category are determined by the combination of statements in the
T Wave Abnormalities and ST Depression categories. The severity of the statements in this
category depends on the severity of the qualifying ST and T wave abnormalities.
ST Elevation, Myocardial Injury, Pericarditis, and Early Repolarization
ST segment elevation is based on examination of all lead groups for positive values of the ST
onset (J point), the deflection at 80 msec after onset, and the slope of the ST segment (in
degrees).
The smallest positive ST displacement considered significant is 0.05 mV (0.5 mm). When ST
elevation is small (0.05 mV to approximately 0.10 mV, that is, less than 1 mm), the statements
are considered to be of
elevation greater than 1 mm is generally classified as
A specific lead group always follows a statement of borderline or abnormal ST elevation.
Abnormal ST elevation in a specific lead group is described as consider, probable, or definite
myocardial injury. If ST elevation is widespread on all anterior, lateral, and inferior lead
groups, either pericarditis or probable early repolarization is suggested.
Tall T Waves
All leads are examined for the presence of positive T waves with amplitudes that exceed
1.20 mV, or for positive T waves that exceed 0.50 mV and are also more than half the size of
the peak-to-peak QRS voltage.
The presence of such T waves generates statements alerting to the possibility of metabolic,
electrolyte, or ischemic abnormalities.
OTHERWISE NORMAL (ON) or BORDERLINE (BO) severity. ST
ABNORMAL (AB).
3-8 Philips 12-Lead Algorithm Physician Guide
Page 28

Adult Morphology Categories Adult Morphology Analysis
QT Abnormalities, Electrolyte Disturbance, and Drug Effects
Measurements of QT interval, as corrected for heart rate, and measurements associated with
ST segment depression and T wave changes are examined for values characteristic of the
effects of digitalis and abnormal calcium and potassium levels.
A QT interval corrected for heart rate (QTc) that is shorter than 340 ms is considered to be a
short QT interval with a severity code as
QTc greater than 465 ms is considered as borderline prolonged QTc. An additional 20 ms
qualifies the condition as prolonged QTc. Presence of RVH, LVH, and VCD suppresses
statements of a prolonged QTc.
If the QTc is shorter than 310 ms, a statement of short QTc suggesting hypercalcemia is
generated.
A significantly prolonged QTc interval greater than 520 ms is considered to be due to
hypocalcemia.
A significantly prolonged QTc interval ( > 520 ms), combined with ST segment depression
and a positive T wave in multiple leads, is considered to be due to hypokalemia.
The presence of an Rx code indicating use of digitalis favors interpretive statements that the
findings are compatible with the effects of this drug. A combination of a short QTc and
repolarization abnormality is considered to be due to digitalis effect.
OTHERWISE NORMAL (ON).
3-9
Page 29

Pediatric Morphology Analysis
The pediatric Philips 12-Lead Algorithm is intended for use on ECGs of patients from birth up
to 16 years of age. Age is an important factor in the pediatric algorithm since normal limits in
heart rate, axis deviation, and waveform amplitudes are highly age dependent. Specification of
age is highly recommended to improve overall ECG interpretation quality. If an age is not
entered or is invalid, the interpretation is based on a default adult age, and a special statement
noting this assumption is printed on the report.
Specific age limits of ECG features are adopted in the pediatric algorithm.
information, see Appendix A, “Normal Measurement Values.”
The interpretive statements are described (by diagnostic category) in the following section.
Pediatric Morphology Categories
Dextrocardia . . . . . . . . . . . . . . . . . . . . . . . . . . . . . . . . . . . . . . . . . . . . . . . . . . . . .(page 4-2)
1
For more
4
Right Atrial Abnormality . . . . . . . . . . . . . . . . . . . . . . . . . . . . . . . . . . . . . . . . . . .(page 4-2)
Left Atrial Abnormality . . . . . . . . . . . . . . . . . . . . . . . . . . . . . . . . . . . . . . . . . . . .(page 4-2)
Biatrial Abnormality . . . . . . . . . . . . . . . . . . . . . . . . . . . . . . . . . . . . . . . . . . . . . .(page 4-2)
QRS Axis Deviation . . . . . . . . . . . . . . . . . . . . . . . . . . . . . . . . . . . . . . . . . . . . . .(page 4-3)
Ventricular Conduction Delays . . . . . . . . . . . . . . . . . . . . . . . . . . . . . . . . . . . . . .(page 4-6)
Right Ventricular Hypertrophy . . . . . . . . . . . . . . . . . . . . . . . . . . . . . . . . . . . . . .(page 4-7)
Left Septal Hypertrophy . . . . . . . . . . . . . . . . . . . . . . . . . . . . . . . . . . . . . . . . . . .(page 4-7)
Left Ventricular Hypertrophy . . . . . . . . . . . . . . . . . . . . . . . . . . . . . . . . . . . . . . . .(page 4-7)
Biventricular Hypertrophy . . . . . . . . . . . . . . . . . . . . . . . . . . . . . . . . . . . . . . . . . .(page 4-8)
Low Voltage . . . . . . . . . . . . . . . . . . . . . . . . . . . . . . . . . . . . . . . . . . . . . . . . . . . . .(page 4-8)
Q Wave Abnormality and Myocardial Infarct . . . . . . . . . . . . . . . . . . . . . . . . . . .(page 4-9)
ST Depression . . . . . . . . . . . . . . . . . . . . . . . . . . . . . . . . . . . . . . . . . . . . . . . . . . .(page 4-9)
T Wave Abnormality . . . . . . . . . . . . . . . . . . . . . . . . . . . . . . . . . . . . . . . . . . . . . .(page 4-9)
Repolarization Abnormality . . . . . . . . . . . . . . . . . . . . . . . . . . . . . . . . . . . . . . . . .(page 4-9)
1. Davignon A, Rautuharju P, Boiselle E, et al.: Normal ECG Standards for Infants and Children. Ped Cardiol
1:123-131 (1979/80).
4-1
Page 30

Pediatric Morphology Analysis Dextrocardia
ST Elevation, Pericarditis and Early Repolarization . . . . . . . . . . . . . . . . . . . . . .(page 4-9)
Tall T Waves . . . . . . . . . . . . . . . . . . . . . . . . . . . . . . . . . . . . . . . . . . . . . . . . . . . (page 4-10)
QT Abnormality and Electrolyte Disturbance . . . . . . . . . . . . . . . . . . . . . . . . . (page 4-10)
Congenital Heart Defects . . . . . . . . . . . . . . . . . . . . . . . . . . . . . . . . . . . . . . . . . .(page 4-10)
Dextrocardia
Dextrocardia is suggested if:
The frontal P axis is between 90º and 180º
Lead I or V6 has a negative P wave
Leads I and V6 have a large S wave ( > 0.6 mV)
The P wave amplitude in Lead III is greater than in Lead II
The remainder of the algorithm is bypassed if dextrocardia criteria are met.
Right Atrial Abnormality
Large P waves are considered suggestive of right atrial abnormality (RAA). The minimum
duration considered significant is 60 ms, the minimum voltage considered significant is
0.20 mV (typical).
Greater than normal P wave duration and amplitude in limb leads produce a statement of
consider right atrial abnormality. Additional conditions such as a biphasic P wave in Lead V1
indicate probable RAA. Larger P waves lead to more definitive interpretive statements
regarding the likelihood of RAA.
Left Atrial Abnormality
Left atrial abnormalities (LAA) are detected from large P waves on limb leads, a biphasic P in
Lead V1, and the durations and the amplitudes of the initial and terminal portions of a biphasic
P wave.
A duration greater than 110 ms combined with amplitudes over 0.10 mV in limb leads is
considered significant, though not necessarily abnormal unless present in multiple leads. A
notched P wave adds to the significance of the other values. Lead V1 is specifically examined
for duration, amplitude, and area of the negative component of the P wave. Although duration
of over 30 ms and amplitudes over 0.09 mV can be considered significant, the area of this
negative component must be greater than 0.60 Ashman units to be considered LAA. An
Ashman unit is the area of 1 square millimeter at normal speed (25 mm/sec) and normal
sensitivity (10 mm/mV). An Ashman unit equals 40 ms x 0.1 mV.
Biatrial Abnormality
Biatrial abnormality (BAA) combines right and left atrial abnormalities. Associated LAA is
considered when a P amplitude greater than 0.1 mV in V1 co-exists with RAA. Associated
RAA is considered when LAA statements are combined with a high amplitude P wave. If
4-2 Philips 12-Lead Algorithm Physician Guide
Page 31

QRS Axis Deviation Pediatric Morphology Analysis
RAA and LAA statements with high severity are generated from previous RAA and LAA
categories, a statement of biatrial hypertrophy is generated.
QRS Axis Deviation
The frontal plane axis is examined for left axis deviation and right axis deviation. The normal
limits of QRS axis are adjusted for age.
Figure 4-1 Limits for QRS Axis Deviation
Right
90
A
o
Left
B
o
15
High limit
o
0
E
Low limit
D
o
15
C
A Right axis deviation D Borderline left axis deviation
B Borderline right axis deviation E Left axis deviation
C Normal
The diagram above illustrates the conditions for generating QRS axis deviation statements.
Left axis deviation: a borderline left axis deviation statement is generated if the QRS axis in
o
the frontal plane is within 15
of the low limit of normal. A left axis deviation statement is
generated if the QRS axis is less than the low limit of normal.
Right axis deviation: a borderline right axis deviation statement is generated if the QRS axis
o
in the frontal plane is within 15
of high limit of normal. A right axis deviation statement is
generated if the QRS axis is greater than the high limit of normal.
4-3
Page 32

Pediatric Morphology Analysis QRS Axis Deviation
Specific limits are listed in the tables that follow.
Table 4-1 Left Axis Deviation
Age High Limit (
o
)Low Limit (
0-23 hours -90 54
1-3 days -90 54
4-6 days -90 54
7-29 days -90 54
1-2 months -90 20
3-5 months -90 -6
6-11 months -90 -6
1-2 years -90 -6
3-4 years -90 -10
5-7 years -90 -10
8-11 years -90 -10
12-15 years -90 -15
Table 4-2 Borderline Left Axis Deviation
o
)
o
Age High Limit (
)Low Limit (
0-23 hours 55 65
1-3 days 55 65
4-6 days 55 65
7-29 days 55 65
1-2 months 21 30
3-5 months -5 1
6-11 months -5 1
1-2 years -5 1
3-4 years -9 1
5-7 years -9 1
8-11 years -9 1
12-15 years -14 1
o
)
4-4 Philips 12-Lead Algorithm Physician Guide
Page 33

QRS Axis Deviation Pediatric Morphology Analysis
Table 4-3 Right Axis Deviation
Age High Limit (
o
)Low Limit (
0-23 hours 216 269
1-3 days 216 269
4-6 days 216 269
7-29 days 216 269
1-2 months 131 269
3-5 months 131 269
6-11 months 131 269
1-2 years 131 269
3-4 years 146 269
5-7 years 201 269
8-11 years 151 269
12-15 years 161 269
Table 4-4 Borderline Right Axis Deviation
o
)
o
Age High Limit (
)Low Limit (
0-23 hours 205 215
1-3 days 205 215
4-6 days 205 215
7-29 days 200 215
1-2 months 115 130
3-5 months 115 130
6-11 months 115 130
1-2 years 115 130
3-4 years 126 145
5-7 years 160 200
8-11 years 135 150
12-15 years 145 160
o
)
4-5
Page 34

Pediatric Morphology Analysis Ventricular Conduction Delays
Ventricular Conduction Delays
The mean QRS duration normal limits are age dependent and listed in the following table. A
mean QRS duration that exceeds 110% of the normal limit is considered borderline
intraventricular conduction delay. A mean QRS duration that exceeds 120% of the normal
limit generates a statement of nonspecific intraventricular conduction delay (IVCD).
Table 4-5 Mean QRS Duration Normal Limits
Age Normal Limit (ms)
12-15 years 100
8-11 years 88
5-7 years 88
3-4 years 88
1-2 years 78
6-11 months 84
3-5 months 84
1-2 months 84
7-29 days 70
4-6 days 70
1-3 days 70
0-23 hours 70
The presence of a ventricular conduction delay for age and either an RSR' or no negative
component at all (no Q or S) in V1 generates a right bundle branch block (RBBB) statement.
In order for the RSR' to be significant, the R' must be at least 20 ms in duration and 0.15 mV in
amplitude.
Incomplete right bundle branch block (IRBBB) requires a QRS complex similar to RBBB,
RSR' or pure R, but with a narrower mean QRS duration, which is less than 120% of normal
limit. In addition, synthesized vector measurements in the horizontal plane are applied to
distinguish IRBBB from right ventricular hypertrophy.
A statement indicating left bundle branch block (LBBB) is generated in the presence of:
Prolonged QRS duration for age
A QRS axis for the terminal 40 ms between -90º and 90º (clockwise)
A short (< 20 ms) or absent S in I, aVL, V5, V6, and a small or absent R wave in
V1, V2, V3
4-6 Philips 12-Lead Algorithm Physician Guide
Page 35

Right Ventricular Hypertrophy Pediatric Morphology Analysis
In the absence of a statement regarding LBBB, a mean QRS axis between -60º and -90º
generates a left anterior superior fascicular block (LAFB) statement.
Right Ventricular Hypertrophy
This category is bypassed in the presence of RBBB. The detection of RVH is based on
findings in RVH voltage, upright T, and right axis deviation (RAD).
Right ventricular hypertrophy (RVH) voltage is heavily age dependent. Six different age
groups are established with appropriate voltage criteria for each group. A total of 24 different
conditions form the criteria for significant RVH voltage in the varying age groups. Factors
considered include:
The absolute size of R and R' in V1 and V2
The absolute size of S in V6
The relative sizes of R and S in V1 and V6
The presence of a QR pattern in V1
A statement indicating consider RVH or probable RVH is generated if the required voltage
exceeds 98% of the normal distribution as listed in Appendix A.
Upward T wave criteria apply to newborns older than 48 hours and to children less than 9
years old. To qualify for RVH, an upward T in V1 without inverted T in V5 and V6 is
required. Right axis deviation and borderline right axis deviation also support the
determination of RVH. The terminal angle of the horizontal plane synthesized vector
measurement using a 12-Lead ECG also supports identifying mild RVH versus incomplete
3
RBBB
.
2
Combinations of statements relating to these conditions generate statements varying in
severity from
BORDERLINE (BO) to ABNORMAL (AB). The likelihood of RVH increases as the
severity of the qualifying statements increases.
Left Septal Hypertrophy
A statement of left septal hypertrophy (LSH) is generated if prominent R waves in V1 and Q
waves in V5 and V6 are detected (R wave amplitude > 98% of the R wave amplitude for
normal distribution). Left septal hypertrophy is considered if moderate R waves in V1 and Q
waves in V5 and V6 are detected.
Left Ventricular Hypertrophy
This category is bypassed in the presence of RBBB or LBBB.
The determination of left ventricular hypertrophy (LVH) is based on the presence of
qualifying statements in the LVH voltage criteria, left axis deviation (LAD), and an abnormal
repolarization pattern typical for LVH. Various combinations of statements from these
2. Zhou SH, Liebman J, Dubin AM, Gillette PC, et al.: Using 12-Lead ECG and Synthesized VCG in Detection of
Right Ventricular Hypertrophy with Terminal Right Conduction Delay versus Partial Right Bundle Branch
Block in the Pediatric Population. Journal of Electrocardiography 34 (supp):249-257 (2001).
3. Ibid.
4-7
Page 36

Pediatric Morphology Analysis Biventricular Hypertrophy
abnormalities produce statements of varying severity and certainty regarding the presence
of LVH.
LVH voltage criteria applied in LVH classification are:
R amplitude in I, II, aVL, aVF, V5 or V6
S amplitude in V1 or V2
R amplitude in V6 plus S amplitude in V1
Prominent Q wave in V5, V6 or II, III, aVF
The LVH voltage criteria are age dependent. A measured value in voltage is considered
abnormal only if it exceeds 98% limits in the normal distribution.
A left atrial abnormality reflected by P wave and left axis deviation supports determination of
LVH. Leads I, aVL, V4, V5 and V6 are examined for repolarization changes typical for LVH.
Two types of repolarizations are considered positive findings:
The first is a mid ST elevation, with a large positive T wave
The second is a slight mid ST depression that is upsloping, with a negative T wave
The pediatric LVH voltage criteria are highly age dependent. Appendix A includes the values
that are considered significant for LVH voltages.
Biventricular Hypertrophy
The category of biventricular hypertrophy (BVH) combines findings of right and left
ventricular hypertrophy.
Associated RVH is considered when an R amplitude greater than 1.0 mV in V1 exists with the
presence of LVH. Associated LVH is considered when RVH statements are combined with a
Q wave greater than 10 ms in duration, greater than 0.07 mV in amplitude, and an R wave
greater than 1.0 mV in Lead V6.
BVH is also considered when the combined amplitudes of R and S exceed 6.0 mV in two of
the following Leads: V2, V3, or V4. If RVH and LVH statements with high severity are
generated from previous RVH and LVH categories, a statement of biventricular hypertrophy is
generated. The BVH statement suppresses individual RVH and LVH statements.
4
Low Voltage
All leads are examined for QRS peak-to-peak voltage.
Frontal leads: if no lead has a value exceeding 0.60 mV, the ECG is considered borderline low
voltage. If no value exceeds 0.50 mV, the ECG is considered definite low voltage, an
abnormal finding.
Precordial leads: if no lead has a value exceeding 1.00 mV, the ECG is considered definite low
voltage, an abnormal finding.
4. Op cit., Davignon A, Rautuharju P, Boiselle E, et al.
4-8 Philips 12-Lead Algorithm Physician Guide
Page 37

Q Wave Abnormality and Myocardial Infarct Pediatric Morphology Analysis
Combinations of low voltage statements, rightward deviation of the frontal P and QRS axes,
and right atrial enlargement may generate statements suggesting the likelihood of chronic
pulmonary disease.
Q Wave Abnormality and Myocardial Infarct
A statement of borderline Q wave abnormalities in an individual lead group is generated in the
presence of large Q waves in two leads out of that group.
Q waves greater than one-fifth of the R wave amplitude generate a statement that the abnormal
Q wave suggests infarct.
ST Depression
ST depression is determined in anterior, lateral, and inferior lead groups.
ST depression of more than 0.20 mV in one lead group produces a nonspecific ST depression
statement.
If tachycardia is present, the statement of ST depression, probably rate related is generated.
Any type of hypertrophy or ventricular conduction delay suppresses statements from this
category.
T Wave Abnormality
Inverted T waves are sought in anterior, lateral, anterolateral, and inferior lead groups.
A tall T wave abnormality statement is generated if the amplitude of the inverted T exceeds
1.0 mV in two or more leads in the particular lead group.
If RVH co-exists with inverted T waves in the anterior lead groups, the statement abnormal T,
probably secondary to RVH, anterior leads is generated.
The statement abnormal T, probably due to LVH, anterolateral leads is generated if LVH coexists with inverted waves in the anterolateral lead group.
Repolarization Abnormality
This category combines statements from the previous ST depression and inverted T wave
categories to generate statements of repolarization abnormality. If ST depression and inverted
T are found in the anterior lead group, a statement is generated to indicate repolarization
abnormality, anterior leads.
ST Elevation, Pericarditis, and Early Repolarization
All leads are tested for ST elevation. ST elevation greater than 0.15 mV in these leads
generates a statement suggesting a probable normal variation. Any hypertrophy and
ventricular conduction delay suppresses statements from this category.
If ST elevation is seen on all anterior, lateral, and inferior lead groups, pericarditis is
considered in children 5 to 15 years old.
4-9
Page 38

Pediatric Morphology Analysis Tall T Waves
For ECGs with nonspecific ST elevation and no T wave inversion, probable early
repolarization is suggested in children 13 to 15 years old.
Tall T Waves
All leads are examined for the presence of T waves with amplitudes that exceed 1.20 mV, or
that exceed 0.50 mV and are more than half the size of the peak-to-peak QRS voltage. The
presence of such T waves may generate statements with the possibility of metabolic or
electrolyte abnormalities.
QT Abnormality and Electrolyte Disturbance
A QT interval corrected for heart rate (QTc) shorter than 340 ms is considered to be borderline
short QT interval with a severity of
A borderline prolonged QTc is greater than:
450 ms in children below 5 years
454 ms for children 5 to 12 years old
458 ms for boys 13 years and older
OTHERWISE NORMAL (ON).
465 ms for females 13 years and older
An additional 20 ms qualifies as prolonged QT
470 ms in children below 5 years
474 ms for children 5 to 12 years old
478 ms for boys 13 years and older
485 ms for females 13 years and older
With RVH, LSH, LVH, BVH, or VCD present, the statement prolonged QTc probably
secondary to wide QRS complex is generated.
Hypercalcemia is suggested if the QTc is shorter than 310 ms. Hypocalcemia is suggested by a
significantly prolonged QTc interval ( > 520 ms). Hypokalemia is suggested by a significantly
prolonged QTc interval ( > 520 ms) combined with ST segment depression and a positive
T wave in multiple leads.
Congenital Heart Defects
Various congenital cardiac conditions are suggested by varying combinations of atrial
abnormalities, ventricular hypertrophy, ventricular conduction delays, QRS axis deviations,
and QRS morphological features.
5
.
5. Rautaharju PM, Zhou SH, Wong S, et al. Sex differences in the evolution of the electrocardiographic QT
interval with age. Can J Cardio 8(7): 690-695 (1992).
4-10 Philips 12-Lead Algorithm Physician Guide
Page 39

5
Reading the Printed ECG Report
The following ECG report types may be generated by Philips Medical Systems equipment.
For more information on available printed report formats, see your product documentation.
Figure 5-1 A 12-Lead 3x4, 1R Report (page one)
D
C
B
A
E
F
G
H
I
J
K
O
A Interpretive, Reason, and Severity Statements (page 5-2) I Report Information (page 5-12)
B Basic Measurements (page 5-3) J Calibration Information (page 5-13)
C Patient ID Clinical Information (page 5-4) K Time Separator (page 5-15)
D Patient ID Information (page 5-7) L Pacing Detection Setting (page 5-15)
E Institution Information (page 5-9) M Algorithm Version Number (page 5-17)
F Configurable Clinical Information (page 5-10) N Speed and Sensitivity Settings (page 5-18)
G ECG Order Information (page 5-18) O Device Identification Number (page 5-18)
H Physician Information (page 5-12)
NM
(see page 1-4)
L
5-1
Page 40

Reading the Printed ECG Report Interpretive, Reason, and Severity Statements
s
Additional Patient ID Clinical Information may appear on the top of a second page of the ECG
report if more than two clinical fields (Rx, Dx, Sx, Hx) are entered with the Patient ID.
Additional Configurable Clinical Information may also appear on the top of a second page of
the ECG report if more than four fields are configured.
Figure 5-2 A 12-Lead 3x4, 1R Report (page two)
P
Q
P Additional Patient ID Clinical Information (page 5-4)
Q Additional Configurable Clinical Information (page 5-10)
Interpretive, Reason, and Severity Statements
This area of the report contains the interpretive, reason, and severity statements generated by
the Philips 12-Lead Algorithm.
Figure 5-3 Interpretive, Reason, and Severity Statements on the ECG Report
Interpretive
Statements
Severity
Statement
Reason
Statement
Complete interpretive statements may include a reason statement that summarizes the criteria
that generated the interpretive statement. A listing of all of the interpretive statements included
in the Philips 12-Lead Algorithm (listed in alphabetical order and by diagnostic category) are
included in Appendices A and B.
5-2 Philips 12-Lead Algorithm Physician Guide
Page 41

Basic Measurements Reading the Printed ECG Report
NOTE The interpretive statements may include quality statements that describe a signal quality problem that
occurred during recording, such as
ARTIFACT IN LEAD(S) I, III, aVL.
Severity Statement
The severity statement represents the overall severity of the ECG. See “Overall Severity” on
page 1-8 for more information.
Basic Measurements
These measurements provide standard interval and duration measurements in milliseconds,
and limb lead axis measurements in degrees. These are the values measured from the
representative beat pattern in the ECG.
Figure 5-4 Basic Measurements on the ECG Report
NOTE Some reports do not include the heart rate (RATE) in Basic Measurements, but do include a heart rate
above the interpretive statements. This rate may be edited.
Table 5-1 Basic Measurements
Label Description Units
RATE Heart rate beats per minute
PR PR interval milliseconds
QRSD QRS duration milliseconds
QT QT interval milliseconds
QTc QT interval corrected for rate milliseconds
P Frontal P axis degrees
Philips 12-Lead Algorithm Physician Guide 5-3
Page 42

Reading the Printed ECG Report Patient ID Clinical Information
Table 5-1 Basic Measurements (continued)
Label Description Units
QRS Frontal QRS axis degrees
T Frontal T axis degrees
Patient ID Clinical Information
This area of page one or page two of the report contains clinical patient information that is
entered with the Patient ID. This includes information about the patient’s Medications (Rx),
Diagnoses (Dx), Symptoms (Sx), History (Hx), and a Diagnosis Related Group (DRG) code.
This information is optional and configurable. The example below is for informational
purposes only.
Figure 5-5 Patient ID Clinical Information on the ECG Report (page one)
5-4 Philips 12-Lead Algorithm Physician Guide
Page 43

Patient ID Clinical Information Reading the Printed ECG Report
If more than two Patient ID Clinical Information fields are entered, the third and subsequent
fields appear at the top of a second page of the report.
Figure 5-6 Patient ID Clinical Information on the ECG Report (page two)
Patient ID Clinical Codes
The following tables list the Patient ID Medications (Rx), Diagnoses (Dx), Symptoms (Sx),
and History (Hx) codes that are used when editing reports with a Philips ECG Management
System. The codes are used to quickly enter patient information.
Table 5-2 Patient ID Medication (Rx) Codes
Rx Statement Code
ACE Inhibitor J
Amiodarone E
Antiarrhythmia Drug A
Beta Blocker Drug 6
Calcium Blocker C
Digitalis 7
Phenothiazine V
Pressor Drug O
Procainamide 2
Psychoactive Drug F
Quinidine 3
Tricyclic Antidepressant X
No Known Rx Z
Philips 12-Lead Algorithm Physician Guide 5-5
Page 44

Reading the Printed ECG Report Patient ID Clinical Information
Table 5-3 Patient ID Diagnosis (Dx) Codes
Dx Statement Code
Acute Myocardial Infarct I
Aortic Valvular Disease 8
Arrhythmia E
Cardiomyopathy 3
Chest Leads Right-sided H
Chest Pain Chief Complaint Y
Chest Pain Secondary S
Congenital Heart Defect 4
Coronary Angioplasty C
Coronary Artery Disease 1
Heart Transplant G
Hypertension 5
Mitral Valvular Disease 9
No Chest Pain N
Old Myocardial Infarct D
Pacemaker 2
Post Op Cardiac Surgery B
Preoperative ECG F
Pulmonary Disease 6
Valvular Heart Disease 7
V3 moved to V3R J
No Known Dx Z
Table 5-4 Patient ID Symptom (Sx) Codes
Label Code
Arm Pain 6
Chest Pain 1
Dizzy 4
Indigestion 8
Light Headed 7
Palpitations 9
5-6 Philips 12-Lead Algorithm Physician Guide
Page 45

Patient ID Information Reading the Printed ECG Report
Table 5-4 Patient ID Symptom (Sx) Codes (continued)
Label Code
Shortness of Breath 2
Shoulder Pain 5
Tight Chest 3
Table 5-5 Patient ID History (Hx) Codes
Label Code
Cardiac Arrhythmia 3
Chest Pain 8
Coronary Artery Bypass Graft 1
Diabetes 4
Hypertension 2
Ischemic Heart Disease 6
Myocardial Infarction 9
Valvular Heart Disease 5
Patient ID Information
This section contains patient identification information. This block of information is
configurable. The example below is for informational purposes only.
Figure 5-7 Patient ID Information on the ECG Report
Table 5-6 Patient ID Information
Label Description
125-43-3247 Patient identification number
Philips 12-Lead Algorithm Physician Guide 5-7
Page 46

Reading the Printed ECG Report Patient ID Information
Table 5-6 Patient ID Information (continued)
Label Description
03/15/2003; 12:27:11 PM
Doe, John T.
Born 1936
Male
Race
247 lbs, 70 in.
BP: 133/90
Patient ID Ethnicity Codes
The following table lists the Patient ID ethnicity codes that are used when editing reports with
a Philips ECG Management System.
Table 5-7 Patient ID Ethnicity Codes
Label Code
Date and time of ECG acquisition
Cannot be edited
Patient name
Patient date of birth (may be configured to
display patient age)
Patient gender
Patient ethnicity (see table below for codes)
Patient weight and height
Patient blood pressure (mmHg)
African American 3
Aleutian or Eskimo 1
American Indian 2
Asian 6
Caucasian 8
Hawaiian 4
Hispanic 5
Other Race 9
Pacific Islander 7
5-8 Philips 12-Lead Algorithm Physician Guide
Page 47

Institution Information Reading the Printed ECG Report
Institution Information
This block of identification information is optional and may be customized by an institution.
For more information see the Philips Medical Systems product documentation. The example
below is for informational purposes only.
Figure 5-8 Institution Information on the ECG Report
Table 5-8 Institution Information
Label Description
Community Hospital (21) Name and ID number of institution
Dept: ICU (13)
Room: 228
Name and ID number of department
Room number of patient or room number where
ECG was acquired
Oper: Williams
Fac: West Campus (5)
Operator identification
Name and ID number of facility or other unit
within an institution
Philips 12-Lead Algorithm Physician Guide 5-9
Page 48

Reading the Printed ECG Report Configurable Clinical Information
Configurable Clinical Information
This information is configured by an institution to fit specific clinical needs. Up to eight
configurable text fields are available. The text label (Smoker, Temp) is configured on the
system, and the user enters the value (Yes, 99.4) before acquiring the ECG.
The first four text fields appear on page one of the ECG report. The fifth and subsequent text
field appears on page two of the ECG report. The examples below are for informational
purposes only.
Figure 5-9 Configurable Clinical Information on the ECG Report (page one)
Figure 5-10 Configurable Clinical Information on the ECG Report (page two)
5-10 Philips 12-Lead Algorithm Physician Guide
Page 49

ECG Order Information Reading the Printed ECG Report
ECG Order Information
This area of the report may be customized to meet the requirements of an order management
system.
Figure 5-11 ECG Order Information on the ECG Report
Table 5-9 ECG Order Information
Label Description
Order: 0-123 Institution-defined order number, part of order
management system
Enc: E-123
Institution-defined encounter number, part of
order management system
Reason: Annual Physical
The reason for acquiring the ECG, may be part
of an order management system
Philips 12-Lead Algorithm Physician Guide 5-11
Page 50

Reading the Printed ECG Report Physician Information
Physician Information
This information block contains physician identification information, including the name of
the ordering physician and UPIN (Universal Physician Identification Number).
Figure 5-12 Physician Information on the ECG report
Report Information
Information about the status of the ECG report is included in this section.
Figure 5-13 Report Information on the ECG Report
Table 5-10 Report Information
Label Description
Unconfirmed Diagnosis Indicates that the ECG report has not been
overread by a qualified physician
COPY The ECG report is a printed copy of an original
STAT
5-12 Philips 12-Lead Algorithm Physician Guide
This statement may be customized by an
institution
The ECG report is designated as STAT
Page 51

Calibration Information Reading the Printed ECG Report
Table 5-10 Report Information (continued)
Label Description
Non-standard lead gains
Calibration Information
The calibration pulse is the rectangular waveform shown in each line of ECG trace. It shows
the hypothetical deflection of the trace in response to a 1 mV calibration pulse applied to the
acquisition circuitry.
Figure 5-14 Calibration Pulse on the ECG Report
The limb leads or precordial leads were
recorded at a gain other than the standard
10mm/mV
See "Calibration Information" on page 5-13
Calibration
Pulse
The shape of the calibration pulse reflects the scaling of the trace.
If the calibration pulse is square the precordial leads and limb leads were recorded at
the same scale.
If the calibration pulse is stepped the precordial leads were recorded at half the scale
of the limb leads.
Table 5-11 Calibration Pulse Shapes
Calibration Pulse Shape
Limb
(mm/mV)
Precordial
(mm/mV)
55
52.5
10 10
Philips 12-Lead Algorithm Physician Guide 5-13
Page 52

Reading the Printed ECG Report Calibration Information
Table 5-11 Calibration Pulse Shapes (continued)
Calibration Pulse Shape
Limb
(mm/mV)
10 5
20 20
20 10
Precordial
(mm/mV)
NOTE For ECG recordings where the precordial leads or limb leads were recorded at a gain other than
10mm/mV, the statement
section on the printed report.
Figure 5-15 Calibration information on the ECG report
Non-standard lead gains appears in the Report Information
5-14 Philips 12-Lead Algorithm Physician Guide
Page 53

Time Separator Reading the Printed ECG Report
Time Separator
The time separator marks indicate whether the ECG data is displayed simultaneously or
time-sequentially. The data for each lead is always acquired simultaneously.
Figure 5-16 Simultaneous time separator on ECG report
Simultaneous
Time Separator
The double line indicates that the ECG data for each lead is displayed simultaneously. The
starting point of each lead is the same time even though they may appear to start at different
times on the printed report.
Figure 5-17 Time sequential separator on ECG report
The single line indicates that the ECG data for each lead is displayed over a continuous period
of time. For example, on a 3x4 grid all signals start at 0 in the first column, 2.5 seconds in the
second column, 5.0 seconds in the third column, and 7.5 seconds in the fourth column.
Pacing Detection Settings
This area of the report contains information about the pacing detection settings that were
selected when the ECG report was printed.
Pacemaker pulses that are detected by the recording equipment are marked on the ECG report
with small vertical tick marks. These marks enable the overreader to identify false pacemaker
pulse detections, or if true pulses are not being detected.
Figure 5-18 Pacing Detection Setting on the ECG report
Time Sequential
Separator
Philips 12-Lead Algorithm Physician Guide 5-15
Page 54

Reading the Printed ECG Report Pacing Detection Settings
The table below describes the available Pacing Detection Settings with the pacing detection
code that appears on the printed ECG report.
Table 5-12 Pacing Detection Settings
Setting Description ECG Report Code
Not known if paced This is the default setting and
normally is used for both paced
and non-paced patients.
Pacemaker pulse detection is on
and is at normal sensitivity.
Occasional false pacemaker pulse
detections may occur in ECGs
with excessive noise.
False detections may result in an
incorrect interpretive statement
appearing on the report.
Small amplitude pacemaker
pulses may not be detected using
this setting.
Non-paced
Pacemaker pulse detection is off.
Use this setting if there are false
pacemaker pulse detections from
noise, or if incorrect interpretive
statements or inappropriate paced
ECG complexes appear on the
report.
P?
No code appears on the
ECG report if the Nonpaced setting is selected.
Paced
Pacemaker pulse detection is on
and is set at a higher sensitivity.
Use this setting if small amplitude
pacemaker pulses are not being
detected at the default (Not
Known if Paced) setting.
False pacemaker pulse detections
may occur if the ECG is noisy.
5-16 Philips 12-Lead Algorithm Physician Guide
P
Page 55

Algorithm Version Number Reading the Printed ECG Report
Table 5-12 Pacing Detection Settings (continued)
Setting Description ECG Report Code
Paced (magnet) Use this setting if the ECG is
acquired with an active
pacemaker magnet or
programmer in place.
Pacemaker pulse detection is on
and is at a higher sensitivity.
Magnets or programmers often
put the pacemaker in a fixed-rate,
non-sensing mode.
The statement ECG ACQUIRED
WITH MAGNET IN PLACE is
printed on the ECG report. This
statement notifies the overreader
that a magnet or programmer was
used and would explain the fixed
rate behavior of the pacer.
Algorithm Version Number
PM
The version number of the Philips 12-Lead Algorithm is printed at the bottom of the
ECG Report.
Figure 5-19 Algorithm Version Number on the ECG Report
Table 5-13 Algorithm Version Number
Label Description
PH080A PH refers to Philips
08 refers to the version of the measurement
program
0A refers to the criteria version installed on the
cardiograph
Philips 12-Lead Algorithm Physician Guide 5-17
Page 56

Reading the Printed ECG Report Speed and Sensitivity Settings
Speed and Sensitivity Settings
This area contains information about the speed and sensitivity settings that were used for the
ECG recording.
Figure 5-20 Speed and Sensitivity Settings on the ECG Report
Table 5-14 Speed and Sensitivity Settings
Label Description
Speed The speed at which the ECG was printed
Available settings:
– 25mm/sec
– 50 mm/sec
Limb
The limb lead sensitivity setting
Available settings:
– 5, 10, or 20 mm/mV
Chest
Precordial lead sensitivity setting
Available settings:
– 2.5, 5, 10, or 20 mm/mV
NOTE For ECG recordings where the precordial leads or limb leads were recorded at a gain other than
10mm/mV, the statement
section on the printed report.
Non-standard lead gains appears in the Report Information
Device Identification Number
This number is entered on Philips Medical Systems equipment and is used to identify an
individual device that was used to acquire the ECG.
Figure 5-21 Device ID on the ECG Report
5-18 Philips 12-Lead Algorithm Physician Guide
Page 57

12-Lead ECG Report Examples Reading the Printed ECG Report
12-Lead ECG Report Examples
The following section includes examples of other 12-Lead report formats.
3x4, 3R report with Standard Leads
3x4, 1R report with Cabrera Leads
6x2 report (5-second waveform segments) with Cabrera Leads
12x1 report with Cabrera Leads. The 12x1 report shows 10 seconds of continuous
waveform data for 12 leads and includes a second page with interpretive, reason, and
severity statements (if configured).
Panoramic (Pan-12) report with Cabrera Leads. The Pan-12 report shows a one-second
representative complex for each Cabrera Lead and three pre-selected rhythm strips at the
bottom (aVF, V2, V5).
Philips 12-Lead Algorithm Physician Guide 5-19
Page 58

Reading the Printed ECG Report 12-Lead ECG Report Examples
Figure 5-22 3x4, 3R Report with Standard Leads
5-20 Philips 12-Lead Algorithm Physician Guide
Page 59

12-Lead ECG Report Examples Reading the Printed ECG Report
Figure 5-23 3x4, 1R Report with Cabrera Leads and Simultaneous Acquisition
Philips 12-Lead Algorithm Physician Guide 5-21
Page 60

Reading the Printed ECG Report 12-Lead ECG Report Examples
Figure 5-24 6x2 Report with Cabrera Leads
5-22 Philips 12-Lead Algorithm Physician Guide
Page 61

12-Lead ECG Report Examples Reading the Printed ECG Report
Figure 5-25 12x1 Report with Cabrera Leads (page one)
Philips 12-Lead Algorithm Physician Guide 5-23
Page 62
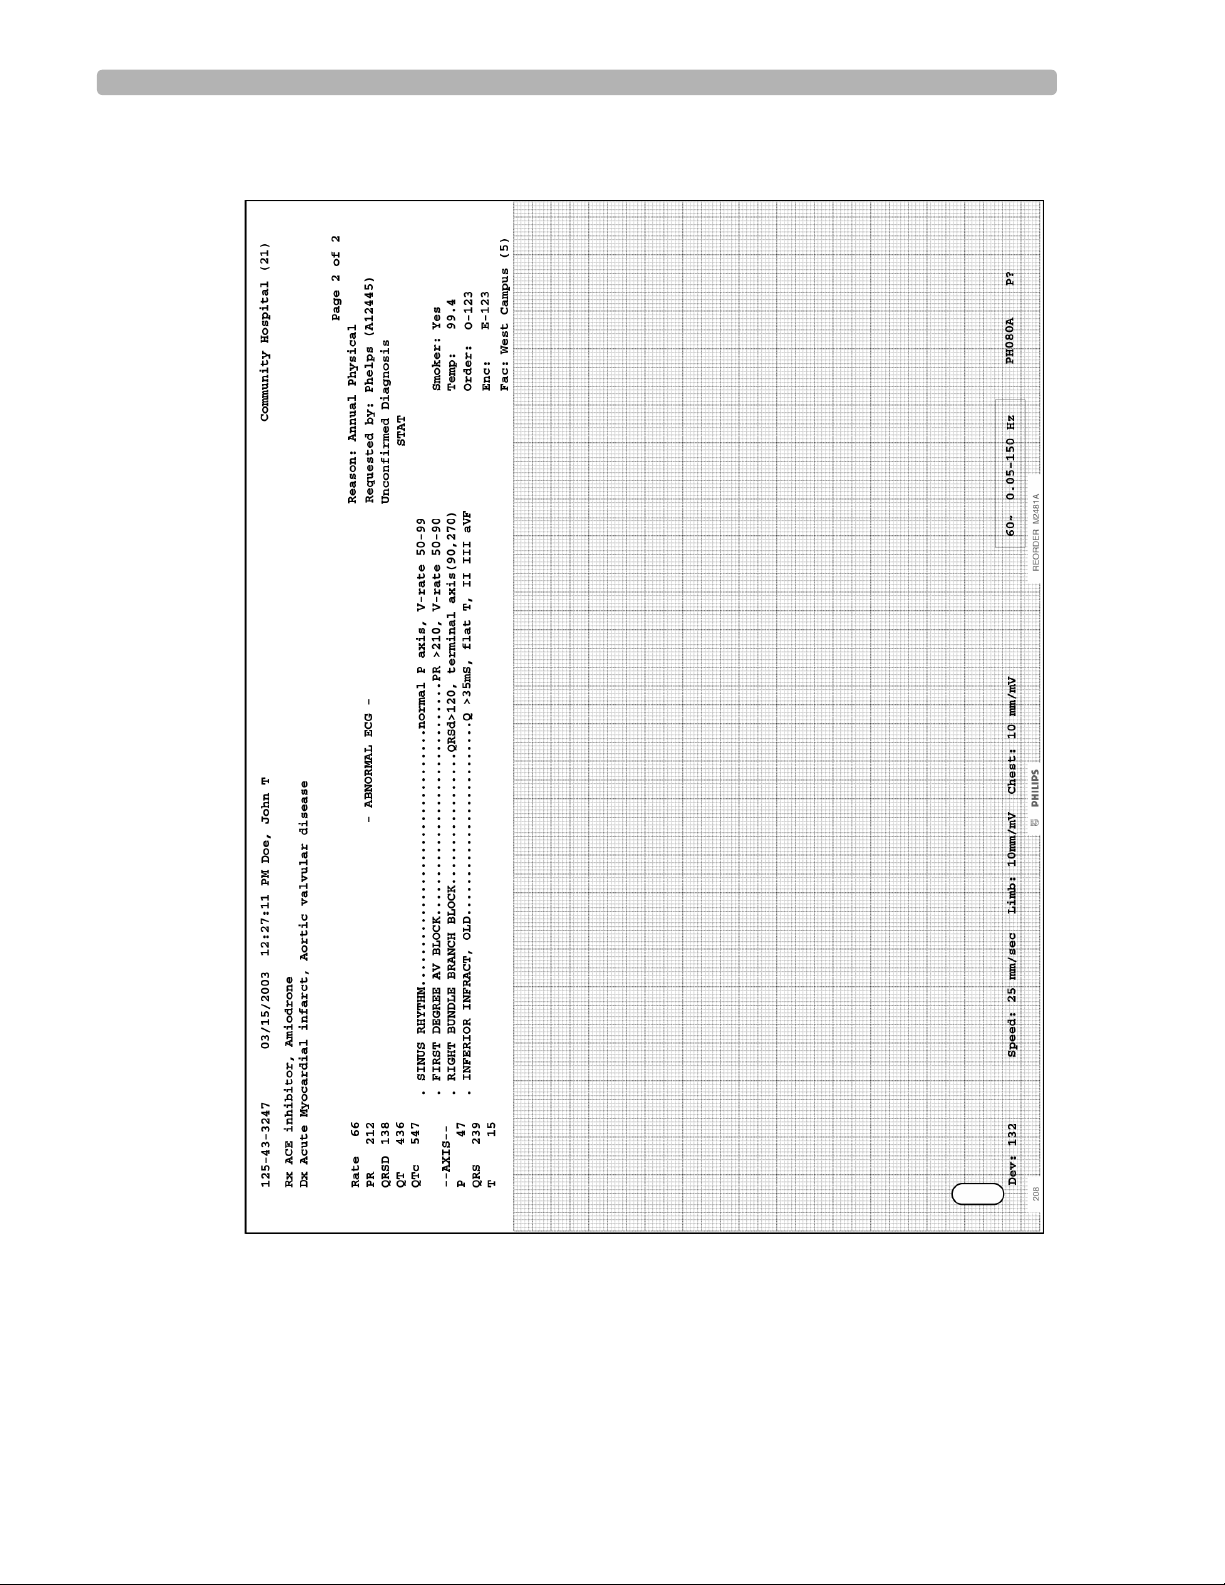
Reading the Printed ECG Report 12-Lead ECG Report Examples
Figure 5-26 12x1 Report with Cabrera Leads (page two)
5-24 Philips 12-Lead Algorithm Physician Guide
Page 63

12-Lead ECG Report Examples Reading the Printed ECG Report
Figure 5-27 Panoramic (Pan-12) Report
NOTE Leads are displayed in Cabrera sequence on the Panoramic (Pan-12) Report regardless of the selected
lead standard on the acquisition equipment.
Philips 12-Lead Algorithm Physician Guide 5-25
Page 64

Reading the Printed ECG Report Extended Measurements Report
Extended Measurements Report
The Extended Measurements report summarizes the output of the Philips 12-Lead Algorithm.
The report includes the morphology characteristics for the individual leads, and the rhythm
characteristics for the rhythm groups. The algorithm uses this measurement information to
generate interpretive statements. The Extended Measurements report is especially useful if
you want to examine the measurements used to generate an interpretation.
5-26 Philips 12-Lead Algorithm Physician Guide
Page 65

Extended Measurements Report Reading the Printed ECG Report
Morphology Analysis
Figure 5-28 Morphology Analysis page of the Extended Measurements Report
The following tables define the parameters in the order that they appear on the Morphology
Analysis page of the Extended Measurements report.
Philips 12-Lead Algorithm Physician Guide 5-27
Page 66

Reading the Printed ECG Report Extended Measurements Report
Morphology Lead Measurements
The parameter measurements are shown in the illustration below. The following table
describes every representative measurement in each lead.
Figure 5-29 ECG Morphology Measurements
Table 5-15 Morphology Lead Measurements
Parameter Units or Value Description
P AMP millivolts P wave amplitude
P DUR milliseconds P wave duration
P AREA Ashman units
(40 ms x 0.1 mV)
a
P wave area for monophasic P waves or the area of
the initial portion of a biphasic P wave
P NOTCH Yes or No Indicates the presence or absence of a notch in the
P wave
P' AMP millivolts P' wave amplitude
P' DUR milliseconds P' wave duration
P' AREA Ashman units
Area of the terminal portion of a biphasic P wave
a
(40 ms x 0.1 mV)
Q AMP millivolts Q wave amplitude
a
An Ashman unit is the area of 1 square millimeter at normal speed (25 mm/sec) and normal sensitivity (10 mm/mV).
An Ashman unit equals 40 ms x 0.1 mV.
5-28 Philips 12-Lead Algorithm Physician Guide
Page 67

Extended Measurements Report Reading the Printed ECG Report
Table 5-15 Morphology Lead Measurements (continued)
Parameter Units or Value Description
Q DUR milliseconds Q wave duration
R AMP millivolts R wave amplitude
R DUR milliseconds R wave duration
S AMP millivolts S wave amplitude
S DUR milliseconds S wave duration
R' AMP millivolts R' wave amplitude
R' DUR milliseconds R' wave duration
S' AMP millivolts S' wave amplitude
S' DUR milliseconds S' wave duration
V.A.T. milliseconds Ventricular Activation Time is the interval from
the onset of the QRS complex to the latest positive
peak in the complex, or the latest substantial notch
on the latest peak (whichever is later)
QRS PPK millivolts Peak-to-peak QRS complex amplitude
QRS DUR milliseconds QRS complex duration, measured from its onset to
the ST segment onset (J point)
QRSAREA Ashman units
a
The area of the QRS complex
(40 ms x 0.1 mV)
QRSNTCH + or -
Indicates a notch in the QRS complex
+ indicates a notch or slur in the R or R' wave
- indicates a notch or slur in the Q, S, or S' wave
DELTA Yes or No Indicates the presence or absence of pronounced
delta waves preceding QRS complexes
ST ON millivolts Elevation or depression at the onset (J point) of the
ST segment
ST MID millivolts Elevation or depression at the midpoint of the ST
segment
ST 80ms millivolts Elevation or depression of the ST segment 80 ms
after the end of the QRS complex (J point)
ST END millivolts Elevation or depression at the end of the ST
segment
a
An Ashman unit is the area of 1 square millimeter at normal speed (25 mm/sec) and normal sensitivity (10 mm/mV).
An Ashman unit equals 40 ms x 0.1 mV.
Philips 12-Lead Algorithm Physician Guide 5-29
Page 68

Reading the Printed ECG Report Extended Measurements Report
Table 5-15 Morphology Lead Measurements (continued)
Parameter Units or Value Description
ST DUR milliseconds ST segment duration
STSLOPE degrees ST segment slope. Slope is measured in degrees
for 25 mm/sec, 1mV/cm scaling, and can range
from -90 to +90 degrees.
STSHAPE -, V, or ^ The ST segment shape:
- = Straight
V = Concave upward
^ = Concave downward
T AMP millivolts T wave amplitude
T DUR milliseconds T wave duration
T AREA Ashman units
(40 ms x 0.1 mV)
a
T wave area for monophasic T waves or the area
of the initial portion of a biphasic T wave
T NOTCH Yes or No Indicates the presence or absence of a notch in the
T wave
T' AMP millivolts T' wave amplitude
T' DUR milliseconds T' wave duration
T' AREA Ashman units
a
Area of the terminal portion of a biphasic T wave
(40 ms x 0.1 mV)
PR INT milliseconds Interval from the onset of the P wave to the onset
of the QRS complex
PR SEG milliseconds Interval from the end of the P wave to the onset of
the QRS complex
QT INT milliseconds Interval from the onset of the QRS complex to the
end of the T wave
GROUP 1 (or 2-5) Indicates the rhythm group used to derive the
representative beat waveform, from which
measurements are calculated. Will be Group 1
unless no Group 1 beats were detected during the
analysis interval for this lead.
CLIP Y = Yes Indicates clipping of QRS complexes
OVERRNG Y = Yes Indicates that the ECG signal is outside the
measurement parameters of the instrument
a
An Ashman unit is the area of 1 square millimeter at normal speed (25 mm/sec) and normal sensitivity (10 mm/mV).
An Ashman unit equals 40 ms x 0.1 mV.
5-30 Philips 12-Lead Algorithm Physician Guide
Page 69

Extended Measurements Report Reading the Printed ECG Report
Table 5-15 Morphology Lead Measurements (continued)
Parameter Units or Value Description
AFACT MOD = Moderate artifact
MARK = Significant artifact
SEV = Severe artifact
Artifact (most likely muscle tremor) is present
when more than 16 up-and-down strokes
exceeding 1mm in amplitude are detected within 1
second
LINE MOD = Moderate noise
AC (power line) noise is present
MARK = Significant noise
SEV = Severe noise
WANDER MOD = Moderate wander
MARK = Significant wander
A steady baseline wander exceeding 10mm/sec is
present
SEV = Severe wander
a
An Ashman unit is the area of 1 square millimeter at normal speed (25 mm/sec) and normal sensitivity (10 mm/mV).
An Ashman unit equals 40 ms x 0.1 mV.
Derived Transverse QRS Vector
The derived transverse QRS vector is a three-dimensional signal made up of X, Y, and Z
(Frank leads) signals projected onto a transverse plane. The values are derived by estimating
the X, Y, and Z signals from a standard 12-lead. The following table lists the derived
transverse QRS vector parameters.
Table 5-16 Derived QRS Vector Parameters
Parameter Units or Value Description
Initial vector angle in degrees
vector magnitude in mV
Maximum
Terminal
Rotation
vector angle in degrees
vector magnitude in mV
vector angle in degrees
vector magnitude in mV
100 to -100 The direction of the vector rotation over
The vector for the initial (first 40 ms)
transverse QRS signal
The maximum transverse QRS vector
The vector from the terminal (last 40 ms) or
last part of the transverse QRS signal
the entire QRS complex
– A positive rotation value indicates a
clockwise vector rotation
– A negative rotation value indicates a
counterclockwise vector rotation
A larger magnitude indicates a higher
confidence in the rotation estimate
Philips 12-Lead Algorithm Physician Guide 5-31
Page 70

Reading the Printed ECG Report Extended Measurements Report
Frontal/Horizontal Plane Axis Parameters
The following table lists frontal and horizontal plane axis parameters.
Table 5-17 Frontal/Horizontal Plane Axis Parameters
Parameter Units or Value Description
P degrees or ind (indeterminate) Mean P wave axis
I:40 degrees or ind (indeterminate) Initial 40 ms QRS complex axis
QRS degrees or ind (indeterminate) Mean QRS complex axis
T:40 degrees or ind (indeterminate) Terminal 40 ms QRS complex axis
ST degrees or ind (indeterminate) Mean ST wave axis
T degrees or ind (indeterminate) Mean T wave axis
Global Measurements
The following table lists the global measurements representative of the entire ECG.
Table 5-18 Global Measurement Parameters
Parameter Units or Value Description
Mean Ventr Rate beats per minute Representative ventricular rate for the entire ECG
Mean PR Int milliseconds Representative PR interval for the entire ECG
Mean PR Seg milliseconds Representative PR segment for the entire ECG
Mean QRS Dur milliseconds Representative QRS duration for the entire ECG
Mean QT Int milliseconds Representative QT interval for the entire ECG
Mean QTc milliseconds Representative QT interval adjusted for heart rate
QT Dispersion milliseconds Difference between the longest and shortest QT
Analysis Statement Codes
These statement codes are the abbreviated criteria codes for the interpretive statements. These
statement codes are used when editing reports with a Philips ECG Management System.
interval for the entire ECG
For lists of codes and statements, see Appendix B, “Interpretive Statements (by Category) and
Appendix C, “Interpretive Statements (Alphabetical).”
5-32 Philips 12-Lead Algorithm Physician Guide
Page 71

Extended Measurements Report Reading the Printed ECG Report
Rhythm Analysis
Figure 5-30 Rhythm Analysis Section of the Extended Measurements Report
The following parameters are given for each rhythm group detected by the cardiograph during
the analysis interval.
Philips 12-Lead Algorithm Physician Guide 5-33
Page 72

Reading the Printed ECG Report Extended Measurements Report
Group Measurements
The group measurements are listed in the table below.
Table 5-19 Group Measurements
Parameter Units or Value Description
Member Count not applicable Number of beats in the rhythm group
Member % percentage Percentage of the total number of beats
represented by the rhythm group
Longest Run not applicable Longest contiguous run of beats in the
rhythm group
Mean QRS
Duration
milliseconds Average QRS duration in the rhythm
group
Low Ventr Rate beats per minute Lowest ventricular rate in the rhythm
group
Mean Ventr Rate beats per minute Average ventricular rate in the rhythm
group
High Ventr Rate beats per minute Highest ventricular rate in the rhythm
group
V-Rate Std Dev same units as the
associated
Standard deviation of the ventricular rate
in the rhythm group
measurement
Mean RR Interval milliseconds Average interval between R waves in the
rhythm group
Mean Atrial Rate beats per minute Average atrial rate in the rhythm group
A-Rate Std Dev same units as the
associated
Standard deviation of the atrial rate in the
rhythm group
measurement
Avg P Count not applicable Average number of P waves per QRS
complex in the rhythm group
# Not Avg P Beats not applicable Number of QRS complexes in the rhythm
Low PR Interval milliseconds Shortest PR interval in the rhythm group
Mean PR Interval milliseconds Average PR interval in the rhythm group
High PR Interval milliseconds Longest PR interval in the rhythm group
5-34 Philips 12-Lead Algorithm Physician Guide
group that do not have the average number
of P waves per QRS complex
Page 73

Extended Measurements Report Reading the Printed ECG Report
Table 5-19 Group Measurements (continued)
Parameter Units or Value Description
Group Flags
The parameters in this part of the rhythm analysis indicate the presence or absence of various
rhythm-related conditions in the rhythm groups identified.
Table 5-20 Group Flags
PR Int Std Dev same units as the
associated
Standard deviation of the PR interval in
the rhythm group
measurement
Mean PR
milliseconds Average PR segment in the rhythm group
Segment
Mean QT Interval milliseconds Average QT interval in the rhythm group
Comp. Pause Count not applicable Number of beats followed by a
compensatory pause in the rhythm group
Parameter Units or Value Description
Atrial Pace Yes or No Beats in the rhythm group are atrial paced
Ventricular Pace Yes or No Indicates that beats in the rhythm group are
paced. All paced beats are grouped together
unless the pacing is a mixture of atrial and
ventricular/dual chamber paced beats. In this
case, the atrial paced beats fall together in a
separate group.
Interpolated Beat Yes or No Indicates the rhythm group contains only
interpolated beats
Sinus Arrest Yes or No Indicates a prolonged R-to-R interval. Set for
the sinus arrest resumption group.
PR Progress Longer Yes or No Indicates the PR interval is getting
progressively longer in the rhythm group
Wenckebach Yes or No Indicates presence of the Wenckebach
phenomenon in the rhythm group
Bigeminy Yes or No Indicates presence of a bigeminy rhythm. Set
for the group consisting of ectopic beats.
Trigeminy Yes or No Indicates presence of a trigeminy rhythm. Set
for the group consisting of ectopic beats.
Philips 12-Lead Algorithm Physician Guide 5-35
Page 74

Reading the Printed ECG Report Extended Measurements Report
Table 5-20 Group Flags (continued)
Parameter Units or Value Description
Aberrant Shape Yes or No Indicates that beats in the rhythm group are in
the minority, and are either wider or of a
different polarity from other beats in the same
lead(s)
Multifocal Yes or No Indicates that beats in the rhythm group have
different foci or origin
Mult. P Test Done Yes or No Indicates that beats in the rhythm group were
tested for multiple P waves
QRS Measured Yes or No Indicates that QRS-related parameters were
measured in the rhythm group
Global Rhythm Parameters
The following parameters provide global information for beats in the ECG.
Table 5-21 Global Rhythm Parameters
Parameter Units or Value Description
Atrial Rate beats per minute The representative atrial rate for the
analysis interval. This is not a simple
arithmetic average.
Low Ventr Rate beats per minute The lowest ventricular rate during the
analysis interval
Mean Ventr Rate beats per minute The average ventricular rate during the
analysis interval
High Ventr Rate beats per minute The highest ventricular rate during the
analysis interval
Flut-Fib Indicator not applicable Indicates approximate number of flutter-
like or coarse fibrillatory waves per lead
Fixed Mult P Morph Yes or No Indicates that all P waves are of consistent
morphology
Mult P Test Valid Yes or No Indicates that the tests performed to detect
multiple P waves produced consistent
results
Paced Beats Measrd Yes or No Indicates that a dual or ventricular paced
5-36 Philips 12-Lead Algorithm Physician Guide
beat group was used for the representative
beat (no non-paced or atrial paced beats
were measured)
Page 75

Extended Measurements Report Reading the Printed ECG Report
Table 5-21 Global Rhythm Parameters (continued)
Parameter Units or Value Description
Delta Wave Count not applicable Number of QRS complexes with
pronounced delta waves
Delta Wave % percentage Percent of total beats with pronounced
delta waves
Bigeminy Count not applicable Total number of beats in a bigeminy
pattern, whether or not they are contiguous
Bigeminy String not applicable Total number of beats in the longest
continuous bigeminy pattern
Trigeminy Count not applicable Total number of beats in a trigeminy
pattern, whether or not they are contiguous
Trigeminy String not applicable Total number of beats in the longest
continuous trigeminy pattern
Wenckebach Count not applicable Total number of Wenckebach cycles. A
Wenckebach cycle is a series of beats
whose PR intervals grow progressively
longer, culminating in an unusually long
RR interval (a dropped beat).
Wenckebach String not applicable The number of beats preceding the
Rhythm Grouping of Beats
The Rhythm Grouping of Beats is a number sequence that shows the rhythm group number for
each beat as determined by the rhythm analysis portion of the algorithm.
Table 5-22 Rhythm Grouping of Beats
Number Description
1, 2, 3, 4, or 5 Rhythm group number
0 Beat unclassifiable by program
Ectopic Rhythm
The parameters in this section indicate the type of ectopic beats detected including their
underlying rhythm.
dropped beat
NOTE If more than one ectopic rhythm code is generated for the report, only the highest severity
rhythm code is printed in this section.
Philips 12-Lead Algorithm Physician Guide 5-37
Page 76

Reading the Printed ECG Report Extended Measurements Report
Table 5-23 Ectopic Rhythm Parameters
Parameter Description
NONE No ectopic beats detected
APC Atrial Premature Complex
JPC Junctional Premature Complex
APCs Atrial Premature Complexes
JPCs Junctional Premature Complexes
ABIG Supraventricular Bigeminy
VPC Ventricular Premature Complex
VPCs Ventricular Premature Complexes
APC & VPC Ectopic beats of Supraventricular and Ventricular origin
VTRIG Ventricular Trigeminy
Pacemaker
VBIG Ventricular Bigeminy
MFPVCs Multiform Premature Ventricular Complexes
PAIR One or more pairs of Ventricular Complexes
MFPAIR One or more pairs with Multiform Ventricular Complexes (not
necessarily in the same pair)
RUN Runs of three or more Ventricular Complexes
MFRUN Runs with Multiform Ventricular Complexes (not necessarily in the
same run)
The parameters in this section indicate the type of paced rhythm detected. There are three
types of pacemaker information included: Mode, Malfunction, and Miscellaneous.
The Mode information indicates the type of pacing identified.
Table 5-24 Pacemaker Mode Parameters
Parameter Description
APACE Continuous Atrial Paced
VPACE Continuous Ventricular Paced
ASVPR Continuous Atrial-Sensed Ventricular Paced (with P-
5-38 Philips 12-Lead Algorithm Physician Guide
wave tracking)
Page 77

Extended Measurements Report Reading the Printed ECG Report
Table 5-24 Pacemaker Mode Parameters (continued)
Parameter Description
AVDPR A-V Dual Paced
MIXPR Mixed pacing type with inhibition of at least one
chamber
IAPACE Intermittent Atrial Paced
IVPACE Intermittent Ventricular Paced
IASVRP Intermittent Atrial-Sensed Ventricular Paced
IAVDPR Intermittent A-V Dual Paced
IVPACD Intermittent Ventricular Paced (On Demand)
IAPACD Intermittent Atrial Paced (On Demand)
IMIXPR Intermittent Paced Beats with inhibition of at least one
chamber detected in the paced beats
UNKPR Unrecognized Pacemaker Rhythm where pacer spikes
or artifact are present
The Malfunction information identifies any detected pacing system malfunctions.
Table 5-25 Pacing Malfunction Parameters
Parameter Description
PACENC Pacer Non-Capture
PACENS Pacer Non-Sense
PACNCNS Pacer Non-Capture and Non-Sense
PACERA
Runaway Pacer (asynchronous pacing, for example
fixed rate pacing with no sensing)
A pacemaker magnet may be present
The Miscellaneous information section contains pacing information not included in any other
section.
Table 5-26 Miscellaneous Pacing Information
Parameter Description
PACART Miscellaneous pacing artifact was detected
MAGNET The ECG was specified as being acquired with a
pacemaker magnet or interrogator in place
Philips 12-Lead Algorithm Physician Guide 5-39
Page 78

Reading the Printed ECG Report Rhythm Report
Rhythm Report
Rhythm reports show up to 12 leads of continuous waveform data. The amount of report
information that is included on the report is dependent upon the number of leads selected for
recording. Information at the top of the report may include:
Patient ID information
Date and time of recording
Settings information (scale and sensitivity, filter settings)
Rhythm reports are not analyzed, so they do not provide measurement information or
interpretive statements. The calibration pulse appears at the beginning of the ECG trace.
5-40 Philips 12-Lead Algorithm Physician Guide
Page 79

Rhythm Report Reading the Printed ECG Report
Figure 5-31 A Rhythm Report with 6 Leads
Philips 12-Lead Algorithm Physician Guide 5-41
Page 80

Reading the Printed ECG Report Rhythm Report
Figure 5-32 A Rhythm Report with 12 Leads
5-42 Philips 12-Lead Algorithm Physician Guide
Page 81

Disclose Report Reading the Printed ECG Report
Disclose Report
The Disclose report (available on some equipment) displays up to 5 minutes of continuous
ECG waveforms for 1 to 3 selected leads. A 1 minute report (1 lead) or a 5 minute report (up
to 3 leads) may be printed.
Disclose reports are not analyzed, so they do not provide measurement information or
interpretive statements.
Figure 5-33 1 Minute Disclose Report
Philips 12-Lead Algorithm Physician Guide 5-43
Page 82

Reading the Printed ECG Report Disclose Report
Figure 5-34 A Full (5 Minute) Disclose Report (page one of three total pages)
5-44 Philips 12-Lead Algorithm Physician Guide
Page 83

1Normal Measurement Values
Table A-1 Summary of Normal Values
Frontal
Plane
QRS
Heart Rate
Age Group
Less than 1
day
1 to 2 days 91-159
3 to 6 days 91-166
1 to 3 weeks 107-182
1 to 2 months 121-179
3 to 5 months 106-186
6 to 11 months 109-169
1 to 2 years 89-151
3 to 4 years 73-137
5 to 7 years 65-133
8 to 11 years 62-130
12 to 15 years 60-119
(beats/min)
93-154
(123)
(123)
(129)
(148)
(149)
(141)
(134)
(119)
(108)
(100)
(91)
(85)
Vector
*
(degrees)
+59 to -163
(137)
+64 to -161
(134)
+77 to -163
(132)
+65 to +161
(110)
+31 to +113
(74)
+7 to +104
(60)
+6 to +99
(56)
+7 to +101
(55)
+6 to +104
(55)
+11 to +143
(65)
+9 to +114
(61)
+11 to +130
(59)
PR Interval
(sec)
0.08-0.16
(.11)
0.08 - 0.14
(.11)
0.07-0.14
(.10)
0.07 - 0.14
(.10)
0.07-0.13
(10)
0.07-0.15
(.11)
0.07 - 0.16
(.11)
0.08 - 0.15
(.11)
0.09-0.16
(.12)
0.09-0.16
(.12)
0.09-0.17
(.13)
0.09-0.18
(.14)
QRS
Duration
V
5
.03-0.07
(.05)
.03-.07
(.05)
.03-.07
(.05)
.03-.08
(.05)
.03-.08
(.05)
.03-.08
(.05)
.03-.08
(.05)
.04-.08
(.06)
.04-.08
(.06)
.04-.08
(.06)
.04-.09
(.06)
.04-.09
(.07)
Q
III
(mm)
4.5 2 5-26
6.5 2.5 5-27
5.5 3 3-24
6 3 3-21
7.5 3 3-18
6.5 3 3-20
8.5 3 1.5-20
6 3 2.5-17
5 3.5 1-18
44.5.5-14
3 3 0-12
3 3 0-10
†‡
Q
V
6
(mm)
RV
†
(mm)
(14)
(14)
(13)
(11)
(10)
(10)
(9.5)
(9)
(8)
(7)
(5.5)
(4)
A
1
SV
1
(mm)
0-23
(8)
0-21
(9)
0-17
(7)
0-11
(4)
0-12
(5)
0-17
(6)
.5-18
(4)
.5-21
(8)
.2-21
(10)
.3-24
(12)
.3-25
(12)
.3-21
(11)
Source: Garson A, Bricker JT, Fisher DJ, Neish SR (eds): The Science and Practice of Pediatric Cardiology, Volume I
(Second Edition), Baltimore, Williams & Wilkins p. 736 (1998). Reproduced by permission of the publisher.
* 2 to 98% (mean)
†Ninety-eighth percentile
‡Millimeters at normal standarization
§Undefined
A-1
Page 84

Table A-1 Summary of Normal Values (continued)
Age Group
R/SV
1
RV6
(mm)
SV6
(mm)
R/SV
R + S
V
6
4
(mm)
†
SV1 + RV6
(mm)
†
Less than 1
day
1 to 2 days .1-U
.1-U§
(2.2)
§
(2.0)
3 to 6 days .2-U
§
(2.7)
1 to 3 weeks 1.0-U
(2.9)
1 to 2
months
3 to 5
months
6 to 11
months
.3-U
(2.3)
.1-U
(2.3)
.1-3.9
(1.6)
§
§
1 to 2 years .05-4.3
(1.4)
3 to 4 years .03-2.8
(.9)
5 to 7 years .02-2.0
(.7)
8 to 11 years 0-1.8
(.5)
12 to 15
years
0-1.7
(.5)
0-11
(4)
0-12
(4.5)
.5-12
(5)
§
2.5-16.5
(7.5)
5-21.5
(11.5)
6.5-22.5
(13)
6-22.5
(12.5)
6.5-22.5
(13)
8-24.5
(15)
8.5-26.5
(16)
9-25.5
(16)
6.5-23
(14)
0-9.5
(3)
0-9.5
(3)
0-10
(3.5)
0-10
(3.5)
0-6.5
(3)
0-10
(3)
0-7
(2)
0-6.5
(2)
0-5
(1.5)
0-4
(1)
0-4
(1)
0-4
(1)
.1-U§
(2.0)
.1-U§
(2.5)
.1-U§
(2.2)
.1-U
(3.3)
.2-U§
(4.8)
.2-U§
(6.2)
.2-U
(7.6)
.3-U
(9.3)
.6-U
(10.8)
.9-U
(11.5)
1.5-U
(14.3)
1.4-U
(14.7)
52.5 28
52 29
49 24.5
§
49 21
53.5 29
61.5 35
§
§
§
§
§
§
53 32
49.5 39
53.5 42
54 47
53 45.5
50 41
Source: Garson A, Bricker JT, Fisher DJ, Neish SR (eds): The Science and Practice of Pediatric Cardiology, Volume I
(Second Edition), Baltimore, Williams & Wilkins p. 736 (1998). Reproduced by permission of the publisher.
* 2 to 98% (mean)
†Ninety-eighth percentile
‡Millimeters at normal standarization
§Undefined
A-2 Philips 12-Lead Algorithm Physician Guide
Page 85

1Interpretive Statements (by Category)
Introduction
Appendix B contains a listing (by diagnostic category) of all of the Adult, Pediatric, and
Technical Quality statements available in the Philips 12-Lead Algorithm.
See Appendix C “Interpretive Statements (Alphabetical)” for a listing of all interpretive
statements in alphabetical order (by statement code).
Statement Format
Figure B-1 Interpretive, Reason, and Severity Statement on the ECG Report
B
Interpretive
Statements
NOTE
Reason
Statements
Severity
Statement
The symbol *** in an interpretive statement is replaced with a numeric value on the ECG
report.
Table B-1 Overall ECG Severity
Severity Code
No Severity NS
Normal ECG NO
B-1
Page 86

Statement Listings Cardiac Rhythm Categories (Adult and Pediatric)
Table B-1 Overall ECG Severity (continued)
Severity Code
Otherwise Normal ECG ON
Borderline ECG BO
Abnormal ECG AB
Defective ECG DE
Statement Listings
The statements are presented in the following order:
Cardiac rhythm categories (Adult and Pediatric)
Adult morphology Categories
Pediatric morphology categories
Technical quality
Cardiac Rhythm Categories (Adult and Pediatric)
Paced Rhythm . . . . . . . . . . . . . . . . . . . . . . . . . . . . . . . . . . . . . . . . . . . . . . . . . . (page B-5)
Basic Cardiac Rhythm . . . . . . . . . . . . . . . . . . . . . . . . . . . . . . . . . . . . . . . . . . . . (page B-7)
Premature Complexes . . . . . . . . . . . . . . . . . . . . . . . . . . . . . . . . . . . . . . . . . . . (page B-11)
AV Conduction Disorders . . . . . . . . . . . . . . . . . . . . . . . . . . . . . . . . . . . . . . . . (page B-13)
Ventricular Preexcitation . . . . . . . . . . . . . . . . . . . . . . . . . . . . . . . . . . . . . . . . . (page B-14)
B-2 Philips 12-Lead Algorithm Physician Guide
Page 87

Statement Listings Adult Morphology Categories
Adult Morphology Categories
Dextrocardia . . . . . . . . . . . . . . . . . . . . . . . . . . . . . . . . . . . . . . . . . . . . . . . . . . . (page B-15)
Right Atrial Abnormality . . . . . . . . . . . . . . . . . . . . . . . . . . . . . . . . . . . . . . . . . (page B-15)
Left Atrial Abnormality . . . . . . . . . . . . . . . . . . . . . . . . . . . . . . . . . . . . . . . . . . (page B-15)
Biatrial Abnormality . . . . . . . . . . . . . . . . . . . . . . . . . . . . . . . . . . . . . . . . . . . . (page B-16)
QRS Axis Deviation . . . . . . . . . . . . . . . . . . . . . . . . . . . . . . . . . . . . . . . . . . . . (page B-16)
Ventricular Conduction Delays . . . . . . . . . . . . . . . . . . . . . . . . . . . . . . . . . . . . (page B-17)
Right Ventricular Hypertrophy . . . . . . . . . . . . . . . . . . . . . . . . . . . . . . . . . . . . (page B-18)
Left Ventricular Hypertrophy . . . . . . . . . . . . . . . . . . . . . . . . . . . . . . . . . . . . . . (page B-19)
Low Voltage and Chronic Obstructive Pulmonary Disease Pattern . . . . . . . . (page B-21)
Inferior Myocardial Infarction . . . . . . . . . . . . . . . . . . . . . . . . . . . . . . . . . . . . . (page B-21)
Lateral Myocardial Infarction . . . . . . . . . . . . . . . . . . . . . . . . . . . . . . . . . . . . . (page B-23)
Anteroseptal and Anterior Myocardial Infarction . . . . . . . . . . . . . . . . . . . . . . (page B-25)
Anterolateral and Extensive Anterior Myocardial Infarct . . . . . . . . . . . . . . . . (page B-28)
Posterior Myocardial Infarction . . . . . . . . . . . . . . . . . . . . . . . . . . . . . . . . . . . . (page B-30)
ST Depression and Myocardial Ischemia . . . . . . . . . . . . . . . . . . . . . . . . . . . . (page B-31)
T Wave Abnormalities and Myocardial Ischemia . . . . . . . . . . . . . . . . . . . . . . (page B-33)
Repolarization Abnormalities and Myocardial Ischemia . . . . . . . . . . . . . . . . (page B-35)
ST Elevation, Myocardial Injury, Pericarditis, and Early Repolarization . . . . (page B-38)
Tall T Waves . . . . . . . . . . . . . . . . . . . . . . . . . . . . . . . . . . . . . . . . . . . . . . . . . . (page B-39)
QT Abnormalities, Electrolyte Disturbance, and Drug Effects . . . . . . . . . . . . (page B-40)
B-3
Page 88

Statement Listings Pediatric Morphology Categories
Pediatric Morphology Categories
Dextrocardia . . . . . . . . . . . . . . . . . . . . . . . . . . . . . . . . . . . . . . . . . . . . . . . . . . . (page B-41)
Right Atrial Abnormality . . . . . . . . . . . . . . . . . . . . . . . . . . . . . . . . . . . . . . . . . (page B-41)
Left Atrial Abnormality . . . . . . . . . . . . . . . . . . . . . . . . . . . . . . . . . . . . . . . . . . (page B-41)
Biatrial Abnormality . . . . . . . . . . . . . . . . . . . . . . . . . . . . . . . . . . . . . . . . . . . . (page B-42)
QRS Axis Deviation . . . . . . . . . . . . . . . . . . . . . . . . . . . . . . . . . . . . . . . . . . . . (page B-42)
Ventricular Conduction Delays . . . . . . . . . . . . . . . . . . . . . . . . . . . . . . . . . . . . (page B-42)
Right Ventricular Hypertrophy . . . . . . . . . . . . . . . . . . . . . . . . . . . . . . . . . . . . (page B-43)
Left Septal Hypertrophy . . . . . . . . . . . . . . . . . . . . . . . . . . . . . . . . . . . . . . . . . (page B-45)
Left Ventricular Hypertrophy . . . . . . . . . . . . . . . . . . . . . . . . . . . . . . . . . . . . . . (page B-45)
Biventricular Hypertrophy . . . . . . . . . . . . . . . . . . . . . . . . . . . . . . . . . . . . . . . . (page B-46)
Low Voltage . . . . . . . . . . . . . . . . . . . . . . . . . . . . . . . . . . . . . . . . . . . . . . . . . . . (page B-47)
Q Wave Abnormality and Myocardial Infarct . . . . . . . . . . . . . . . . . . . . . . . . . (page B-47)
ST Depression . . . . . . . . . . . . . . . . . . . . . . . . . . . . . . . . . . . . . . . . . . . . . . . . . (page B-48)
T Wave Abnormality . . . . . . . . . . . . . . . . . . . . . . . . . . . . . . . . . . . . . . . . . . . . (page B-48)
Repolarization Abnormality . . . . . . . . . . . . . . . . . . . . . . . . . . . . . . . . . . . . . . (page B-49)
ST Elevation, Myocardial Injury, Pericarditis, and Early Repolarization . . . . (page B-50)
Tall T Waves . . . . . . . . . . . . . . . . . . . . . . . . . . . . . . . . . . . . . . . . . . . . . . . . . . (page B-51)
QT Abnormality and Electrolyte Disturbance . . . . . . . . . . . . . . . . . . . . . . . . . (page B-51)
Congenital Heart Defects . . . . . . . . . . . . . . . . . . . . . . . . . . . . . . . . . . . . . . . . . (page B-52)
Miscellaneous Category
Technical Quality . . . . . . . . . . . . . . . . . . . . . . . . . . . . . . . . . . . . . . . . . . . . . . . (page B-52)
B-4 Philips 12-Lead Algorithm Physician Guide
Page 89

Cardiac Rhythm Paced Rhythm
Cardiac Rhythm
Paced Rhythm
(APACEC) AB ATRIAL-PACED COMPLEXES
other complexes also detected
(APACED) AB A-PACED COMPLEXES WITH SOME INHIBITION
non-paced complexes also detected
(APACE) AB ATRIAL-PACED RHYTHM
(VPACEC) AB VENTRICULAR-PACED COMPLEXES
other complexes also detected
(VPACCF) AB AFIB/FLUT AND V-PACED COMPLEXES
other complexes, A-rate>240
(VPACCD) AB V-PACED COMPLEXES WITH SOME INHIBITION
non-paced complexes also detected
(VPACFD) AB AFIB/FLUT, V-PACED COMPLEXES WITH INHIBITION
non-paced complexes, A-rate>240
(VPACE) AB VENTRICULAR-PACED RHYTHM
(ASVPC) AB ATRIAL-SENSED VENTRICULAR-PACED COMPLEXES
other complexes also detected
(ASVP) AB ATRIAL-SENSED VENTRICULAR-PACED RHYTHM
ventricular pacing tracks p-waves
(VPACEF) AB AFIB/FLUTTER AND VENTRICULAR-PACED RHYTHM
V-paced rhythm, A-rate>240
(AVDPC) AB ATRIAL-VENTRICULAR DUAL-PACED COMPLEXES
other complexes also detected
B-5
Page 90

Cardiac Rhythm Paced Rhythm
(AVDPCF) AB DUAL-PACEMAKER W/ A-NONCAPT DUE TO AFIB/FLUT
other complexes and A-rate>240
(AVDP) AB ATRIAL-VENTRICULAR DUAL-PACED RHYTHM
(AVDPF) AB DUAL-PACEMAKER W/ A-NONCAPT DUE TO AFIB/FLUT
dual pacing with A-rate>240
(PCMMC) AB A-V DUAL-PACED COMPLEXES W/ SOME INHIBITION
other complexes also detected
(PCMM) AB A-V DUAL-PACED RHYTHM WITH SOME INHIBITION
atrial and/or vent inhibition
(BVPACE) AB BIVENTRICULAR PACED RHYTHM
non-simultaneous bi-vent pacing
(ABVPC) AB ATRIAL- BIVENTRICULAR PACED RHYTHM
non-simultaneous bi-vent pacing
(PACENC) AB PACEMAKER FAILURE TO CAPTURE APPROPRIATELY
(PACENS) AB PACEMAKER FAILURE TO SENSE APPROPRIATELY
(PCNSNC) AB PACEMAKER FAILURE TO CAPTURE AND SENSE
(PACEM) AB FAILURE TO SENSE AND/OR CAPTURE (?MAGNET)
fixed pacing with async rhythm
(AOO) NS RHYTHM CONSISTENT WITH AOO PACING
(VOO) NS RHYTHM CONSISTENT WITH VOO PACING
(DOO) NS RHYTHM CONSISTENT WITH DOO PACING
(AAI) NS RHYTHM CONSISTENT WITH AAI PACING
(VVI) NS RHYTHM CONSISTENT WITH VVI PACING
B-6 Philips 12-Lead Algorithm Physician Guide
Page 91

Cardiac Rhythm Basic Cardiac Rhythm
(DVI) NS RHYTHM CONSISTENT WITH DVI PACING
(DDI) NS RHYTHM CONSISTENT WITH DDI PACING
(VDD) NS RHYTHM CONSISTENT WITH VDD PACING
(DDD) NS RHYTHM CONSISTENT WITH DDD PACING
(UNKRM) NS UNDETERMINED RHYTHM: REVIEW
rhythm measurements incomplete
(PSAR) AB PACEMAKER SPIKES OR ARTIFACTS
timing non-diagnostic
(NFRA) NS NO FURTHER RHYTHM ANALYSIS ATTEMPTED DUE TO PACED
RHYTHM
(NFAD) NS NO FURTHER ANALYSIS ATTEMPTED DUE TO PACED
Basic Cardiac Rhythm
(SR) NO SINUS RHYTHM
(SB) ON SINUS BRADYCARDIA
(ST) ON SINUS TACHYCARDIA
(SEAR) ON SINUS OR ECTOPIC ATRIAL RHYTHM
(SEAB) ON SINUS OR ECTOPIC ATRIAL BRADYCARDIA
RHYTHM
normal P axis, V-rate ***-***
V-rate<***
V-rate>***
P axis (-45,135)
P axis (-45,135), V-rate<***
(SEAT) ON SINUS OR ECTOPIC ATRIAL TACHYCARDIA
P axis (-45,135), V-rate>***
B-7
Page 92

Cardiac Rhythm Basic Cardiac Rhythm
(EAR) BO ECTOPIC ATRIAL RHYTHM
abnormal P axis, normal rate
(EAB) BO ECTOPIC ATRIAL BRADYCARDIA
abnormal P axis, V-rate<***
(EAT) AB ECTOPIC ATRIAL TACHYCARDIA
abnormal P axis, V-rate>***
(LLAR) NS LOW LEFT ATRIAL RHYTHM
(HLAR) NS HIGH LEFT ATRIAL RHYTHM
(LRAR) NS LOW RIGHT ATRIAL RHYTHM
(HRAR) NS HIGH RIGHT ATRIAL RHYTHM
(JERA) AB ACCELERATED JUNCTIONAL ESCAPE RHYTHM
absent P waves, V-rate 50-70
(JER) AB JUNCTIONAL ESCAPE RHYTHM
absent P waves, slow V-rate
(JRA) AB ACCELERATED JUNCTIONAL RHYTHM
absent P waves, accele'd V-rate
(JT) AB JUNCTIONAL TACHYCARDIA
absent P waves, rapid V-rate
(RVAR) BO UNKNOWN RHYTHM, IRREGULAR RATE ***-***
V-rate variation>10%
(BWRV) BO BRADYCARDIA WITH IRREGULAR RATE ***-***
(TWRV) BO SINUS TACHYCARDIA WITH IRREGULAR RATE ***-***
B-8 Philips 12-Lead Algorithm Physician Guide
mean V-rate<***, variation>8%
V-rate>***,variation>10%
Page 93

Cardiac Rhythm Basic Cardiac Rhythm
(SA) ON SINUS ARRHYTHMIA, RATE ***-***
V-rate variation >10%
(SAB) ON SLOW SINUS ARRHYTHMIA, RATE ***-***
varied V-rate, mean<***
(SAT) ON FAST SINUS ARRHYTHMIA, RATE ***-***
varied V-rate, mean>***
(WPACE) BO WANDERING PACEMAKER
varying PR interval & P axis
(AVDIS) AB AV DISSOCIATION
PR variation>15%
(ETACH) AB EXTREME TACHYCARDIA
V-rate >(220-age)
(SVT) AB SUPRAVENTRICULAR TACHYCARDIA
V-rate>(220-age), QRSd<***
(AFIBT) AB ATRIAL FIBRILLATION WITH RAPID V-RATE
A-rate>240, V-rate>(180-age)
(TACHW) AB WIDE COMPLEX TACHYCARDIA
V-rate>***, QRSd>***
(VTACH) AB EXTREME TACHYCARDIA WITH WIDE COMPLEX, NO FURTHER
RHYTHM ANALYSIS ATTEMPTED
(ARYP) AB POSSIBLE ATRIAL ARRHYTHMIA, A-RATE ***
multiple Ps
(FLFIB) AB ATRIAL FLUTTER/FIBRILLATION, A-RATE ***
(AFIB0) AB ATRIAL FIBRILLATION
? Atrial activity
multiple Ps
B-9
Page 94

Cardiac Rhythm Basic Cardiac Rhythm
(AFIB) AB ATRIAL FIBRILLATION, V-RATE ***-***
var'd rate, irreg atrial activity
(AFLT) AB ATRIAL FLUTTER, A-RATE ***
A-rate 220-340
(AFLT2) AB A-FLUTTER W/ PREDOM 2:1 AV BLOCK, A-RATE ***
A-rate 220-340, multiple Ps
(AFL2) AB ATRIAL FLUTTER WITH 2:1 AV BLOCK
A-rate 220-340, V-rate>***
(AFLT3) AB A-FLUTTER W/ PREDOM 3:1 AV BLOCK, A-RATE ***
A-rate 220-340, multiple Ps
(AFLT4) AB A-FLUTTER W/ PREDOM 4:1 AV BLOCK, A-RATE ***
A-rate 220-340, multiple Ps
(AFLTV) AB A-FLUTTER W/ VARIED AV BLOCK, A-RATE ***
A-rate 220-340, var'd AV conduc'n
(2AVB) AB SECOND DEGREE AV BLOCK
multiple P waves
(2AVB2) AB PREDOMINANT 2:1 AV BLOCK
most complexes 2 Ps
(2AVB3) AB PREDOMINANT 3:1 AV BLOCK
most complexes 3 Ps
(2AVB4) AB PREDOMINANT 4:1 AV BLOCK
most complexes 4 Ps
(2AVBV) AB VARYING SECOND DEGREE AV BLOCK
(3AVB) AB COMPLETE AV BLOCK, A-RATE ***
B-10 Philips 12-Lead Algorithm Physician Guide
multiple Ps, varied AV conduction
V-rate<45, AV dissociation
Page 95

Cardiac Rhythm Premature Complexes
(3AVBIR) AB COMPLETE AV BLOCK WITH WIDE QRS COMPLEX
V-rate<***, QRSd>***, dissoc
(3AVBFF) AB A-FLUTTER/FIBRILLATION W/ COMPLETE AV BLOCK
A-rate>220, V-rate<***, AV dissoc
Premature Complexes
(UNKBIG) NS BIGEMINY PATTERN, UNCERTAIN MECHANISM
(UNKTRI) NS TRIGEMINY PATTERN, UNCERTAIN MECHANISM
(SVTRI) NS SUPRAVENTRICULAR TRIGEMINY
(JBIG) NS JUNCTIONAL RHYTHM WITH VPC'S IN A BIGEMINY
PATTERN
(JTRI) NS JUNCTIONAL RHYTHM WITH VPC'S IN A TRIGEMINY
PATTERN
(ABAPC) NS ABERRANTLY CONDUCTED ATRIAL PREMATURE COMPLXS
(UNKPC) NS PREMATURE COMPLEX, UNCERTAIN MECHANISM
(VSVPC) NS PREMATURE COMPLEX, VENT OR ABERRANT SUPRAVENT
(APC) ON ATRIAL PREMATURE COMPLEX
SV complex w/ short R-R interval
(JPC) ON JUNCTIONAL PREMATURE COMPLEX
SV complex w/ short R-R, absent P
(MAPC) AB MULTIPLE ATRIAL PREMATURE COMPLEXES
SV complexes w/ short R-R intvls
(VPC) ON VENTRICULAR PREMATURE COMPLEX
V complex w/ short R-R interval
B-11
Page 96

Cardiac Rhythm Premature Complexes
(MVPC) AB MULTIPLE VENTRICULAR PREMATURE COMPLEXES
V complexes w/ short R-R intervls
(MVSPC) AB MULTIPLE PREMATURE COMPLEXES, VENT & SUPRAVEN
V and SV complexes w/ short R-R
(SVBIG) AB SUPRAVENTRICULAR BIGEMINY
bigeminy string>4 w/ SV complexes
(VBIG) AB VENTRICULAR BIGEMINY
bigeminy string>4 w/ V complexes
(VTRI) AB VENTRICULAR TRIGEMINY
trigeminy string>6 w/ V complexes
(MFVPC) AB MULTIFORM VENTRICULAR PREMATURE COMPLEXES
short R-R, variable morphology
(PVPC) AB PAIRED VENTRICULAR PREMATURE COMPLEXES
sequence of 2 V complexes
(RVPC) AB RUN OF VENTRICULAR PREMATURE COMPLEXES
sequence of 3 or more V complexes
(MFPVPC) AB PAIRED MULTIFORM VENTRICULAR COMPLEXES
sequence of 2 V complexes
(MFRVPC) AB RUN OF MULTIFORM VENTRICULAR COMPLEXES
sequence of 3 or more V complexes
(LRRV) BO LONG R-R WITH VENTRICULAR ESCAPE
R-R>175% of normal, wide QRS
(SARV) AB SINUS PAUSE/ARREST WITH VENTRICULAR ESCAPE
(WENCK) AB MOBITZ I AV BLOCK (WENCKEBACH)
B-12 Philips 12-Lead Algorithm Physician Guide
long R-R interval, wide QRS
PR lengthens & dropped complexes
Page 97

Cardiac Rhythm AV Conduction Disorders
(RECA) NS RETROGRADE ATRIAL CAPTURE
(VIC) ON VENTRICULAR INTERPOLATED COMPLEX
interpolated complex, wide QRS
(MVIC) AB MULTIPLE VENTRICULAR INTERPOLATED COMPLEXES
interpolated complexes, wide QRS
(IVPC) ON INTERPOLATED VENTRICULAR PREMATURE COMPLEX
interpolated complex, wide QRS
(MIVPC) AB MULT INTERPOLATED VENT PREMATURE COMPLEXES
interpolated complexes, wide QRSd
(ABC) ON ABERRANT COMPLEX
(ABCS) ON ABERRANT COMPLEX, POSSIBLY SUPRAVENTRICULAR
AV Conduction Disorders
(SPRB) ON BORDERLINE SHORT PR INTERVAL
(SPR) BO SHORT PR INTERVAL, ACCELERATED AV CONDUCTION
(BAVCD) BO BORDERLINE AV CONDUCTION DELAY
(1AVB) AB FIRST DEGREE AV BLOCK
small R-R variation, aberrant QRS
aberrant shape, PR 80-220
PR int <*** mS
PR <*** mS
PR >***, V-rate ***-***
PR >***, V-rate ***-***
(2AVBA) NS ADVANCED SECOND DEGREE AV BLOCK
B-13
Page 98

Cardiac Rhythm Ventricular Preexcitation
(SARSV) AB SINUS PAUSE/ARREST W/ SUPRAVENTRICULAR ESCAPE
long R-R interval, normal QRSd
(SARN) AB SINUS PAUSE/ARREST WITH JUNCTIONAL ESCAPE
long R-R, normal QRSd, absent P
(SARA) AB SINUS PAUSE/ARREST WITH ATRIAL ESCAPE
long R-R, normal QRSd, normal P
(I2AVB) AB INTERMITTENT SECOND DEGREE AV BLOCK
long R-R with multiple Ps
(MOBII) AB MOBITZ II AV BLOCK
dropped ventricular complex
(A2AVB) AB ALTERNATING SECOND DEGREE AV BLOCK
Ventricular Preexcitation
(VPELP) NS VENTRICULAR PREEXCITATION, A LEFT POSTEROSEPTAL
(VPERP) NS VENTRICULAR PREEXCITATION, A RIGHT POSTEROSEPTAL
(VPERA) NS VENTRICULAR PREEXCITATION, A RIGHT ANTEROSEPTAL
(VPELA) NS VENTRICULAR PREEXCITATION, A LEFT ANTEROSEPTAL
(VPELL) NS VENTRICULAR PREEXCITATION, A LEFT LATERAL
alternating long R-R, multiple Ps
ACCESSORY PATHWAY
ACCESSORY PATHWAY
ACCESSORY PATHWAY
ACCESSORY PATHWAY
ACCESSORY PATHWAY
(VPERL) NS VENTRICULAR PREEXCITATION, A RIGHT LATERAL
ACCESSORY PATHWAY
(VPE) AB VENTRICULAR PREEXCITATION
B-14 Philips 12-Lead Algorithm Physician Guide
Delta waves
Page 99

Adult Morphology Dextrocardia
(VPEL) AB VENT PREEXCITATION, LEFT ACCESSORY PATHWAY
Delta wave & initial axis(30,120)
(VPER) AB VENT PREEXCITATION, RIGHT ACCESSORY PATHWAY
Delta wave & initial axis(-60,29)
Adult Morphology
Dextrocardia
(DEXC) AB CONSIDER DEXTROCARDIA
P, QRS axis rightward
Right Atrial Abnormality
(RAE) NS RIGHT ATRIAL ENLARGEMENT
(CRAA) ON CONSIDER RIGHT ATRIAL ABNORMALITY
(PRAA) ON PROBABLE RIGHT ATRIAL ABNORMALITY
(RAA) AB RIGHT ATRIAL ABNORMALITY
Left Atrial Abnormality
(LAE) NS LEFT ATRIAL ENLARGEMENT
(CLAA) ON CONSIDER LEFT ATRIAL ABNORMALITY
(PLAA) BO PROBABLE LEFT ATRIAL ABNORMALITY
P >0.24 mV limb lead
biphasic P >0.20 mV in V1
P>0.25 mV 2 lds or<-0.24 mV aVR/aVL
wide or notched P waves
P >50 mS, <-0.10 mV V1
(PPND) BO PROMINENT P WAVES, NONDIAGNOSTIC
wide/notched/biphasic P waves
B-15
Page 100

Adult Morphology Biatrial Abnormality
(LAA) AB LEFT ATRIAL ABNORMALITY
P, P'>60 mS, <-0.15 mV V1
Biatrial Abnormality
(LAACB) AB LAA, CONSIDER BIATRIAL ABNORMALITIES
P>80 mS <-.15 mV V1&>.25 mV limb lds
(RAACB) AB RAA, CONSIDER BIATRIAL ABNORMALITIES
P>0.30 mV 2 lds & <-0.30 mV aVR/aVL
(BAA) AB BIATRIAL ABNORMALITIES
P>80 mS,<-0.15 mV V1 &>0.30 mV 2 lds
QRS Axis Deviation
(AXR) ON BORDERLINE RIGHT AXIS DEVIATION
(RAD) ON RIGHT AXIS DEVIATION
(AXL) ON BORDERLINE LEFT AXIS DEVIATION
(LAD) ON LEFT AXIS DEVIATION
(AXSUP) ON SUPERIOR QRS AXIS
(AXIND) ON INDETERMINATE QRS AXIS
QRS axis (***,***)
QRS axis (***,***)
QRS axis (***,***)
QRS axis (***,***)
QRS axis (-91,240)
QRS axis indeterminate
(S123) ON S1,S2,S3 PATTERN
B-16 Philips 12-Lead Algorithm Physician Guide
S >30 mS & >0.2 mV, I II III
 Loading...