

Page 1
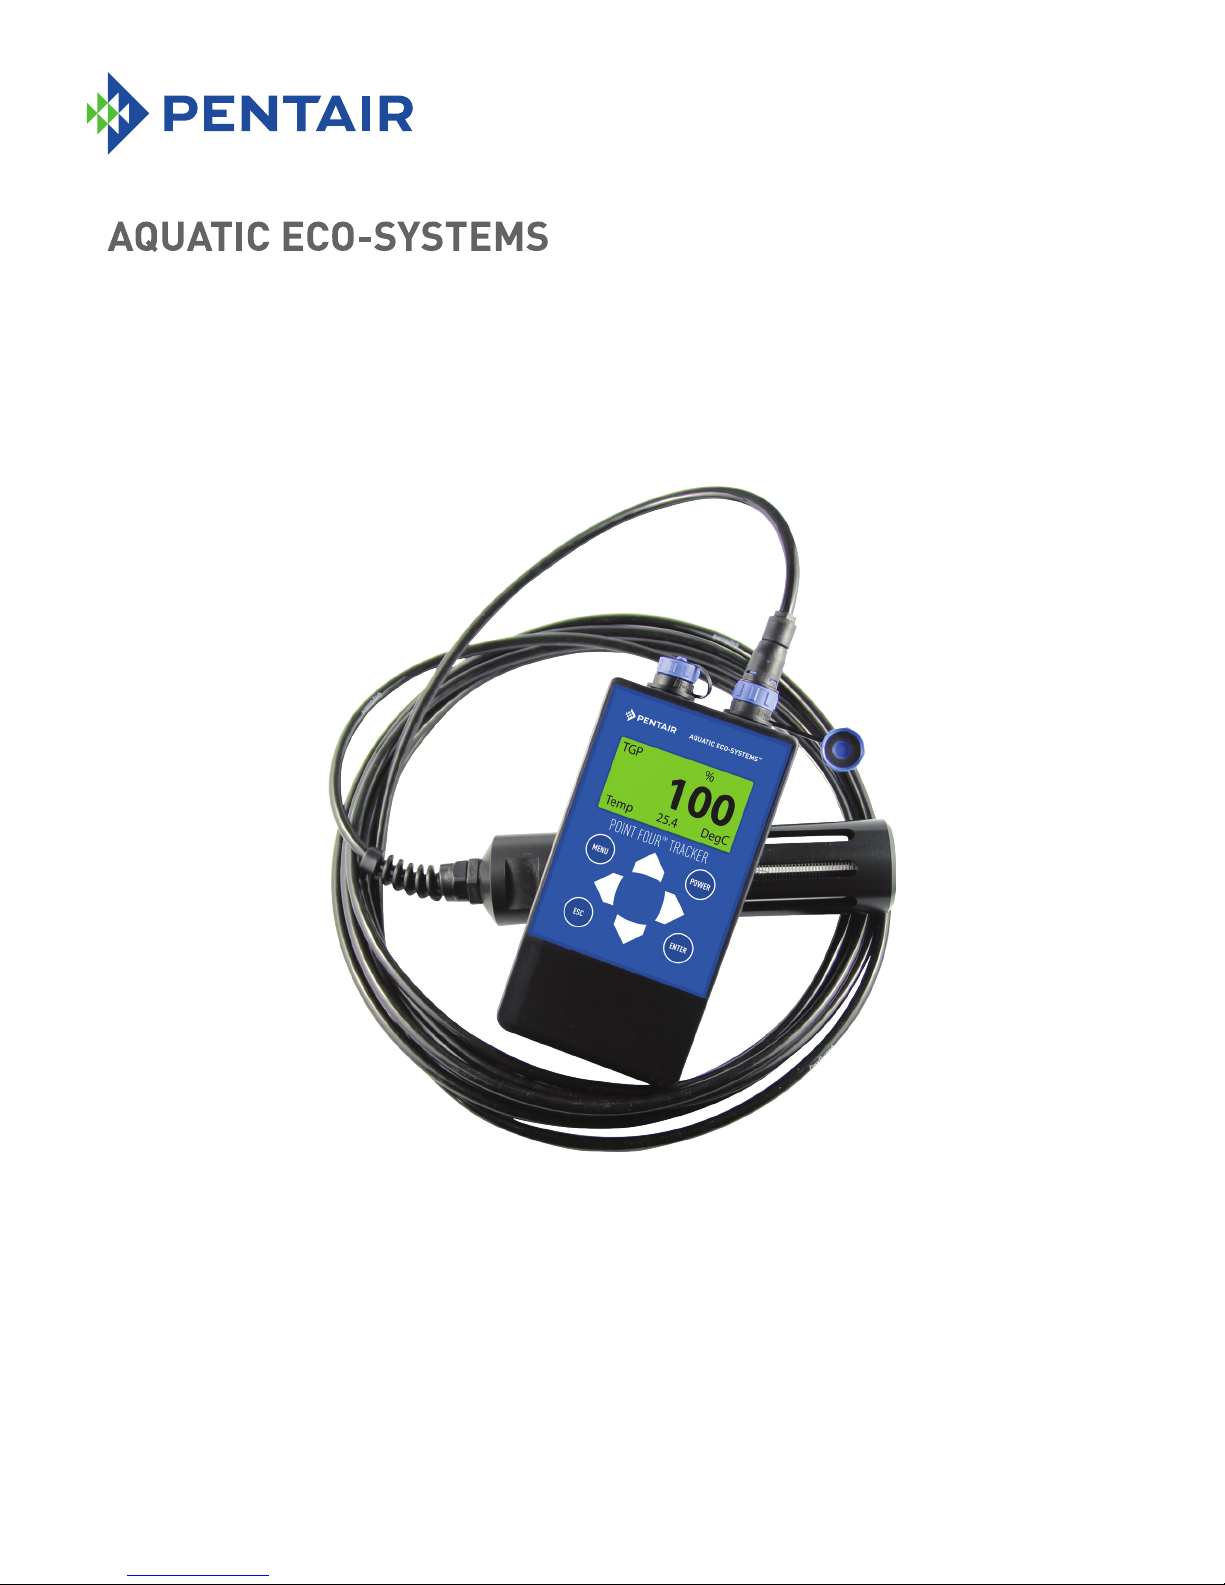
POINT FOUR TRACKER
PORTABLE TGP METER
IMPORTANT SAFETY INSTRUCTIONS
READ AND FOLLOW ALL INSTRUCTIONS
SAVE THESE INSTRUCTIONS
USER'S MANUAL
Page 2

2
CUSTOMER SERVICE / TECHNICAL SUPPORT
If you have questions about ordering Pentair Aquatic Eco Systems replacement parts, and products,
please use the following contact information:
CUSTOMER SERVICE
8 AM to 7 PM Monday to Thursday
8 AM to 5 PM Friday
Eastern Standard Time Zone
Phone: +1 (407) 886-3939
Fax: +1 (407) 886-6787
Toll Free: (877) 347-4788
WEB SITE
Visit www.PentairAES.com to nd information about Pentair products.
© 2017 Pentair Aquatic Eco-Systems, Inc. All rights reserved.
This document is subject to change without notice.
2395 Apopka Blvd., Apopka, FL 32703, USA Phone: 407.886.3939 Web: PentairAES.com
All Pentair trademarks and logos are owned by Pentair or one of its global afliates. Pentair Aquatic Eco-Systems®
and Point Four™ are registered trademarks and/or trademarks of Pentair Aquatic Eco-System, Inc. and/or its afliated
companies in the United States and/ or other countries. Unless expressly noted, names and brands of third parties
that may be used in this document are not used to indicate an afliation or endorsement between the owners of these
names and brands and Pentair Aquatic Eco-Systems, Inc. Those names and brands may be the trademarks or registered
trademarks of those third parties. Because we are continuously improving our products and services, Pentair reserves
the right to change specications without prior notice. Pentair is an equal opportunity employer.
P/N 450026 Rev. A 11/15/2017
POINT FOUR TRACKER User’s Manual
Page 3

TABLE OF CONTENTS
3
1.0 OVERVIEW ........................................................... 4
1.1 Components ................................................... 4
1.2 Keypad ...........................................................4
1.3 Turning the Meter On and Off ....................... 4
1.4 Calibration ...................................................... 5
1.5 Set Display Channels .................................... 6
1.6 Set External Channels ................................... 6
1.7 Options ........................................................... 7
1.8 Datalogging .................................................... 7
1.9 Manual Datalogging ......................................7
1.10 Auto Log .......................................................8
1.11 Set Clock .......................................................9
1.12 Logger Setup ................................................ 9
1.13 Dump Data .................................................. 10
1.14 Installing Hyper Terminal ........................... 11
1.15 Ins talling Driver........................................... 11
1.16 Conguring Com Port Setting ................... 11
1.17 Setting Up The Hyper Terminal ................. 12
2.0 SERVICE & MAINTENANCE ............................. 16
2.1 Normal Periodic Use .................................... 16
2.2 Continuous Use ........................................... 16
2.3 A Simple Check for a Damaged or Broken
Membrane Tube ................................................. 17
2.4 Changing the Membrane Cartridge ............ 17
2.5 The TGP Syringe Test .................................. 18
2.6 Testing The Cartridge .................................. 18
2.7 Testing The Tgp Probe ................................19
2.8 Batteries ....................................................... 19
3.0 TROUBLESHOOTING........................................20
3.1 Normal Periodic Use .................................... 20
4.0 SPECIFICATIONS ..............................................21
6.0 APPENDIX ..........................................................22
6.1 About TGP .................................................... 22
6.2 Understanding the Measurement ...............22
6.3 Denitions .................................................... 22
Figure 1: % by Volume, Mole and
Pressure Fraction of Constituents of Air .......... 23
6.4 Compensation Depth ..................................23
Figure 2: Relation of Equilibrium,
Percent Saturation and Depth .......................... 23
Table 1: Standard Atmospheric
Pressure Values .................................................24
Figure 3: Schematic Diagram of the
Direct Measurement of TGP ............................. 24
Table 2: PCO2 Values for pH and Carbonate
Alkalinity (Fresh Water, 10ºC ............................. 26
Table 3: Pressure Conversions ......................... 27
6.5 Gas Bubble Trauma ..................................... 28
6.6 Denitions ....................................................28
6.7 TGP Calculations .........................................28
6.8 How to calculate N2 ....................................29
6.9 Compensation Depth ..................................29
Figure 6: Compensation Depth with
Proper Tank Depth ............................................. 29
Figure 7: Compensation depth with tank not
allowing for minimum depth required. .............29
6.10 Current Guidelines ..................................... 29
6.11 Hatchery Environments ............................. 29
Notes .................................................................. 30
POINT FOUR TRACKER User’s Manual
Page 4
4
1.0 OVERVIEW
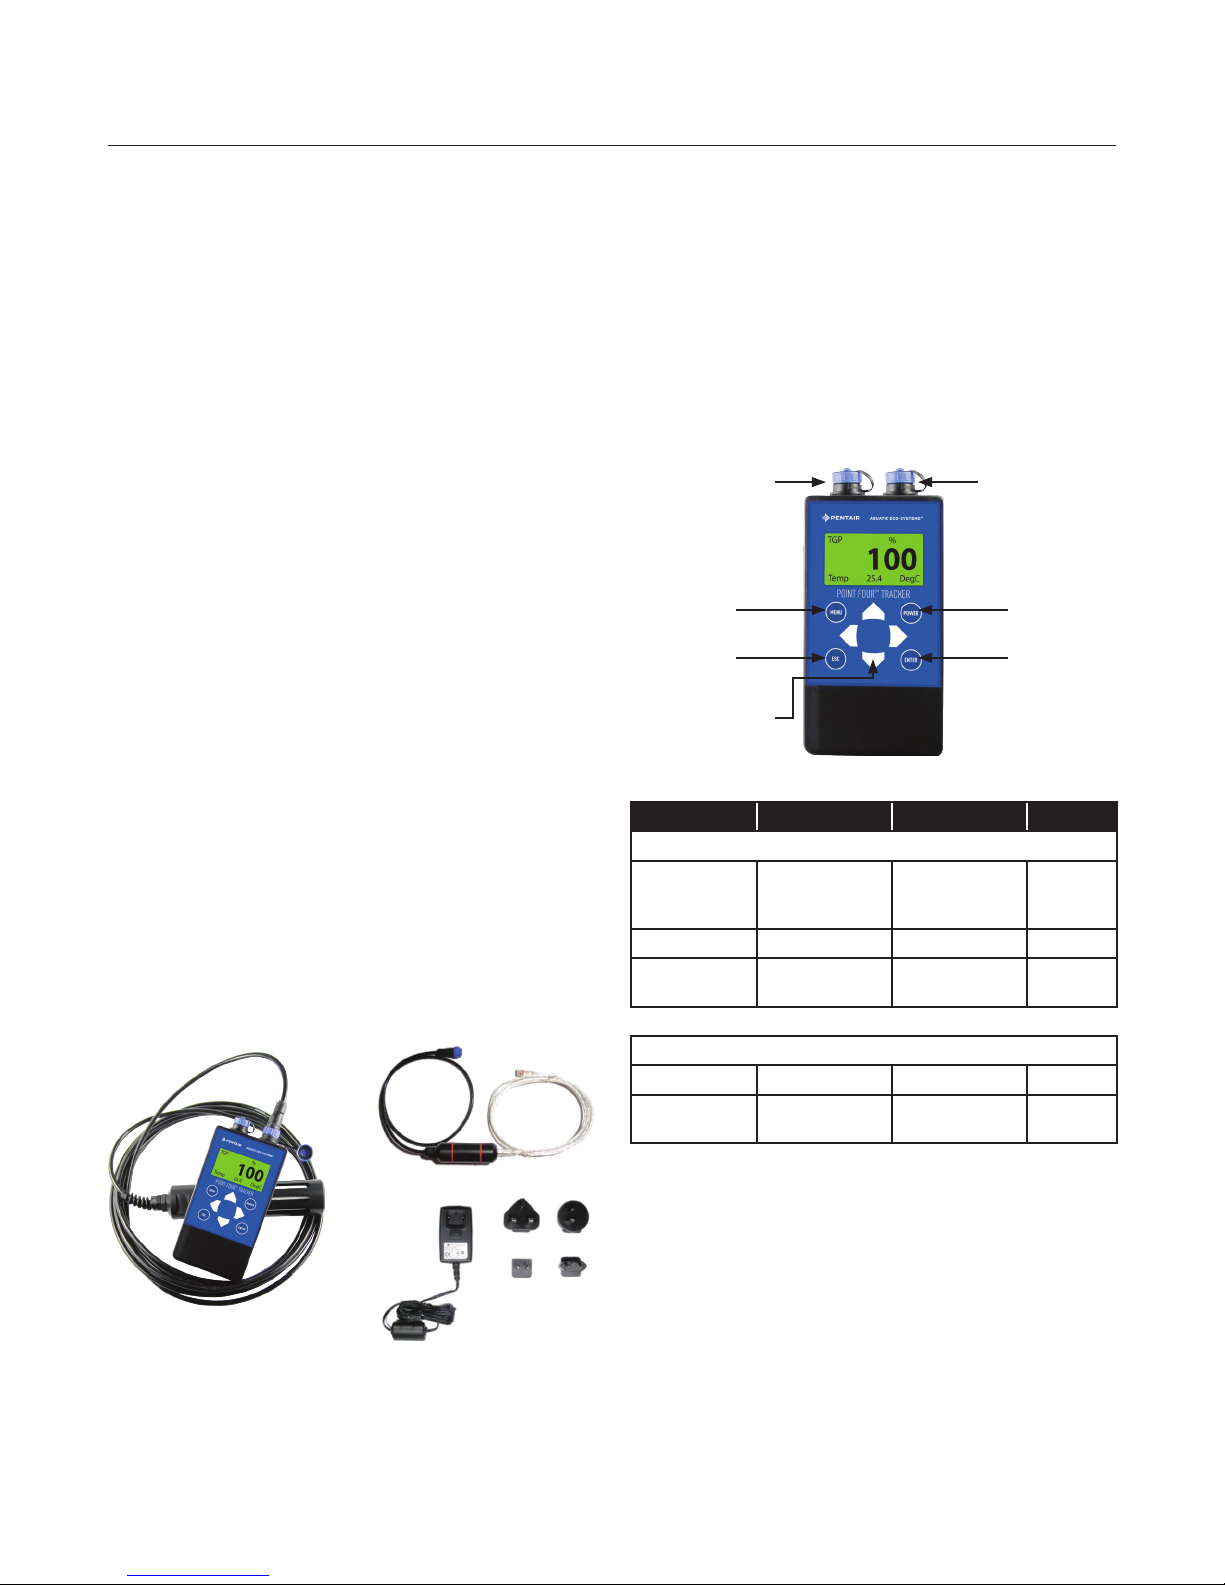
1.1 COMPONENTS
The PT4 Tracker is a portable Total Gas Pressure (TGP)
meter, consisting of a hand-held meter and a TGP
probe which measures total dissolved gas pressure
(TDGP often abbreviated as TGP) and temperature.
Display parameters of the Tracker are: ΔP (TGP-BP),
% saturation, barometric pressure (BP) in mmHg, and
temperature in degrees Celsius.
Included components:
• Handheld Tracker Meter
• Total Gas Pressure Probe and Cable
• Charger Cable with AC Adapter
• Plastic Waterproof Pouch
• Manual
• Data Transfer Cable with USB Adapter
• TGP Pressure Test Syringe Kit
Optional components:
1.2 KEYPAD
The display area can include up to 6 lines of text.
It will also display the larger primary reading when
selected to do so.
Each round key (MENU, PWR, ESC and ENTER) will
control a number of actions. The arrows (Up, Right,
Down and Left) allow for cursor movement within the
display area, for increasing and decreasing selected
values, or for switching between the "Main Screen" &
the "Secondary Screen".
4-pin Connector
(Charger Cables)
Display
Menu Power
Escape
Arrows (Up, Right,
Down, Left)
6-pin Connector
(Probe & Data
Transfer Cable)
Enter
• 1SSA006 - Charger Cable with Car Adapter
• 1SSA003 - Replacement TGP Cartridge
• 1SSA009 - TGP Membrane Rewind Kit
• 1SSA015 - Extended Deployment Package
Handheld Meter Data Transfer Cable
TGP Probe and Cable
(5 m / 16.4 ft) optional cable
length up to 300 m/ 984 ft
USB Adapter
AC Charger with
Interchangeable World
Plug Attachments
ABBREVIATION CALCULATION UNITS
Measured
Total
Dissolved Gas
Pressure
Temperature TEMP — deg C
Barometric
Pressure
Derived
Delta P (dP) dP or ΔP TGP - BP mmHg
TGP in %
Saturation
TGP — mmHg
BP — mmHg
% Sat TGP/BP x 100 %
1.3 TURNING THE METER ON AND OFF
• Attach the probe to the handheld meter before
turning meter on. (Right Side Connector)
• Press "PWR" to turn the meter on. This will
automatically detect the presence or absence of
the probe. If the meter is not detecting the probe,
turn the meter off (by pressing & holding the PWR
button), attach the probe again, and turn the meter
on.
POINT FOUR TRACKER User’s Manual
Page 5
1.0 OVERVIEW
5
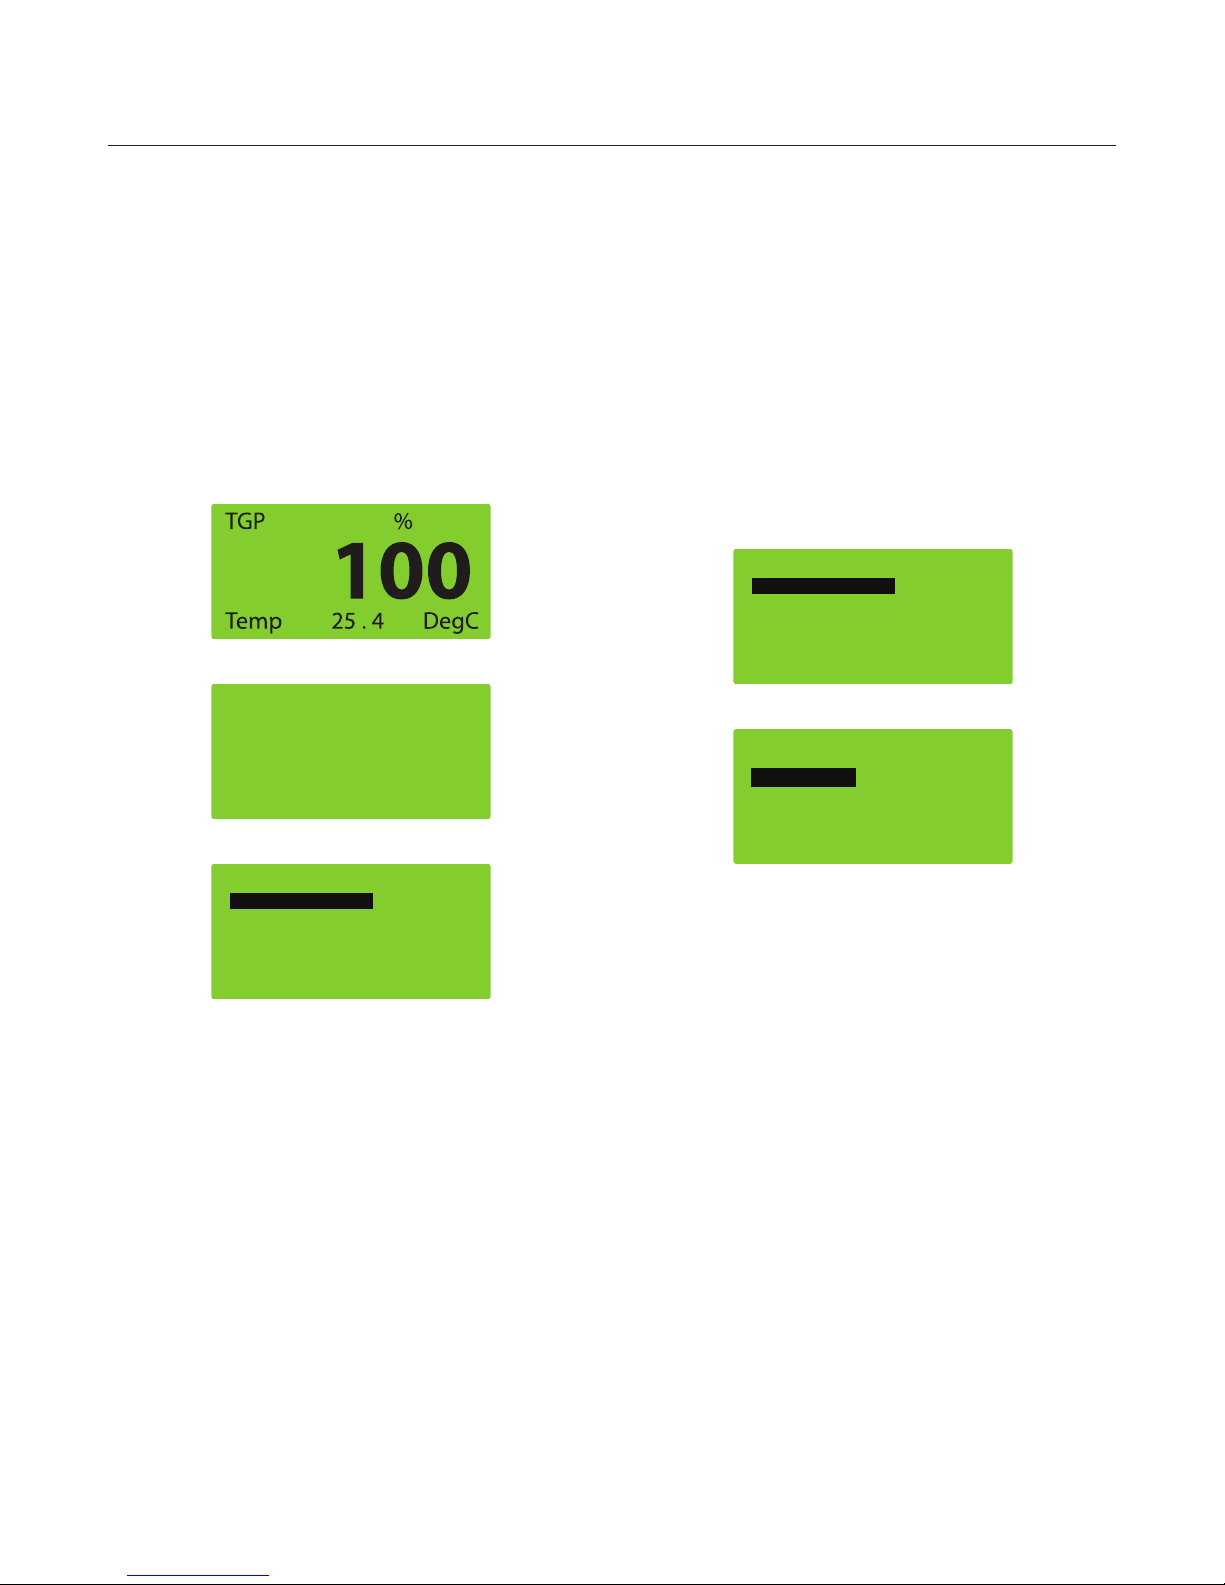
• The main display screen will appear (see Figure 1
as example). The information displayed includes a
(user selectable) primary parameter (larger number)
and a secondary parameter (smaller number) as
selected by the user.
• To view all channels on the same screen (alternative
display), press the "RIGHT ARROW". The readings
for probe measurements are displayed under the
title "TGP PRB". To return to the primary display,
press the "LEFT ARROW".
Figure 1:
Main Screen
TGP PRB
TGP
Temp
BP
TGP
dP
Secondary Screen
756
25 . 4
767
100
-11
mmHg
Deg C
mmHg
%
mmHg
To check the calibration of the pressure sensors (BP),
obtain a reading of the barometric pressure from the
local weather ofce (convert to mmHg using Table
3) and compare it to the sensor reading. Note that
weather ofce readings are usually referenced to
sea level, therefore altitude compensation may be
necessary.
When checking or calibrating the TGP reading, leave
the TGP probe in air for a minimum of 10 minutes
to allow the pressure to equilibrate with atmospheric
pressure. Once the probe is dry, continue with the
following procedures.
• Press “MENU” and use the arrows to select
“CALIBRATION”. Press “ENTER”.
MENU
CALIBRA T ION
S E T DISP C Hs
S E T E X T C H
OPTIONS
D ATA L O G GER
V b a t : 5 . 6 8
Main Display Parameter
CALIBRA T ION
TGP
mmHg
Temp
Deg C
BP HH
mmHg
MENU
CALIBRA T ION
S E T DISP C Hs
S E T E X T C H
OPTIONS
D ATA L O G GER
V b a t : 5 . 6 8
Main Menu
Press "MENU" and use the arrows to select
"CALIBRATION", "SET DISP CHs", "SET EXT CHs",
or "OPTIONS", and then press "ENTER".
* At any time, you can press the "ESC" button to return
to the previous screen (and press "ESC" again to
view the Main Screen.)
1.4 CALIBRATION
All TGP measurement systems come precalibrated
from the factory. Calibration is generally not necessary
and should only be undertaken if sensor readings
appear to be incorrect. There are three sensors: two
pressure sensors [TGP (mmHg), BP (mmHg)] and one
Temperature sensor (degC).
Secondary Display Parameter
• 3 choices will appear on screen: “TGP mmHg”,
“Temp DegC”, and “BP HH mmHg”. Use the
arrow keys and “ENTER” to select the appropriate
measurement calibration.
• Use the arrow keys to highlight “1 Point Cal” and
press “ENTER” to begin.
• Use the arrow keys to manipulate the sensor reading
and press “ENTER” to accept the reading (after
each calibration) and complete the calibration. The
mV sensor reading is for diagnostic purposes only.
POINT FOUR TRACKER User’s Manual
Page 6
6
1.0 OVERVIEW
Calibration Sequence:
1. Calibrate the Barometric Pressure (BP) using the
value in mmHg obtained from the local weather
ofce (modied according to altitude). Press
“ENTER”.
2. Calibrate the TGP using the same value as used for
the BP. Press “ENTER”.
3. Calibrate the Temperature if needed. Press
“ENTER”.
TEMP 2PT. IN WATER BATH
Due to inherent limitations common to all TGP
probes, the probe must be periodically removed
from in-situ measurement and dried completely
prior to calibrating. In most cases this should be
done once every 3 weeks. If the probe is used in
water with temperatures above 20 degrees C,
this should be done more frequently than every
3 weeks.
CALIBRA T ION
TGP
1 P o i n t C a l
2 P o i n t C a l
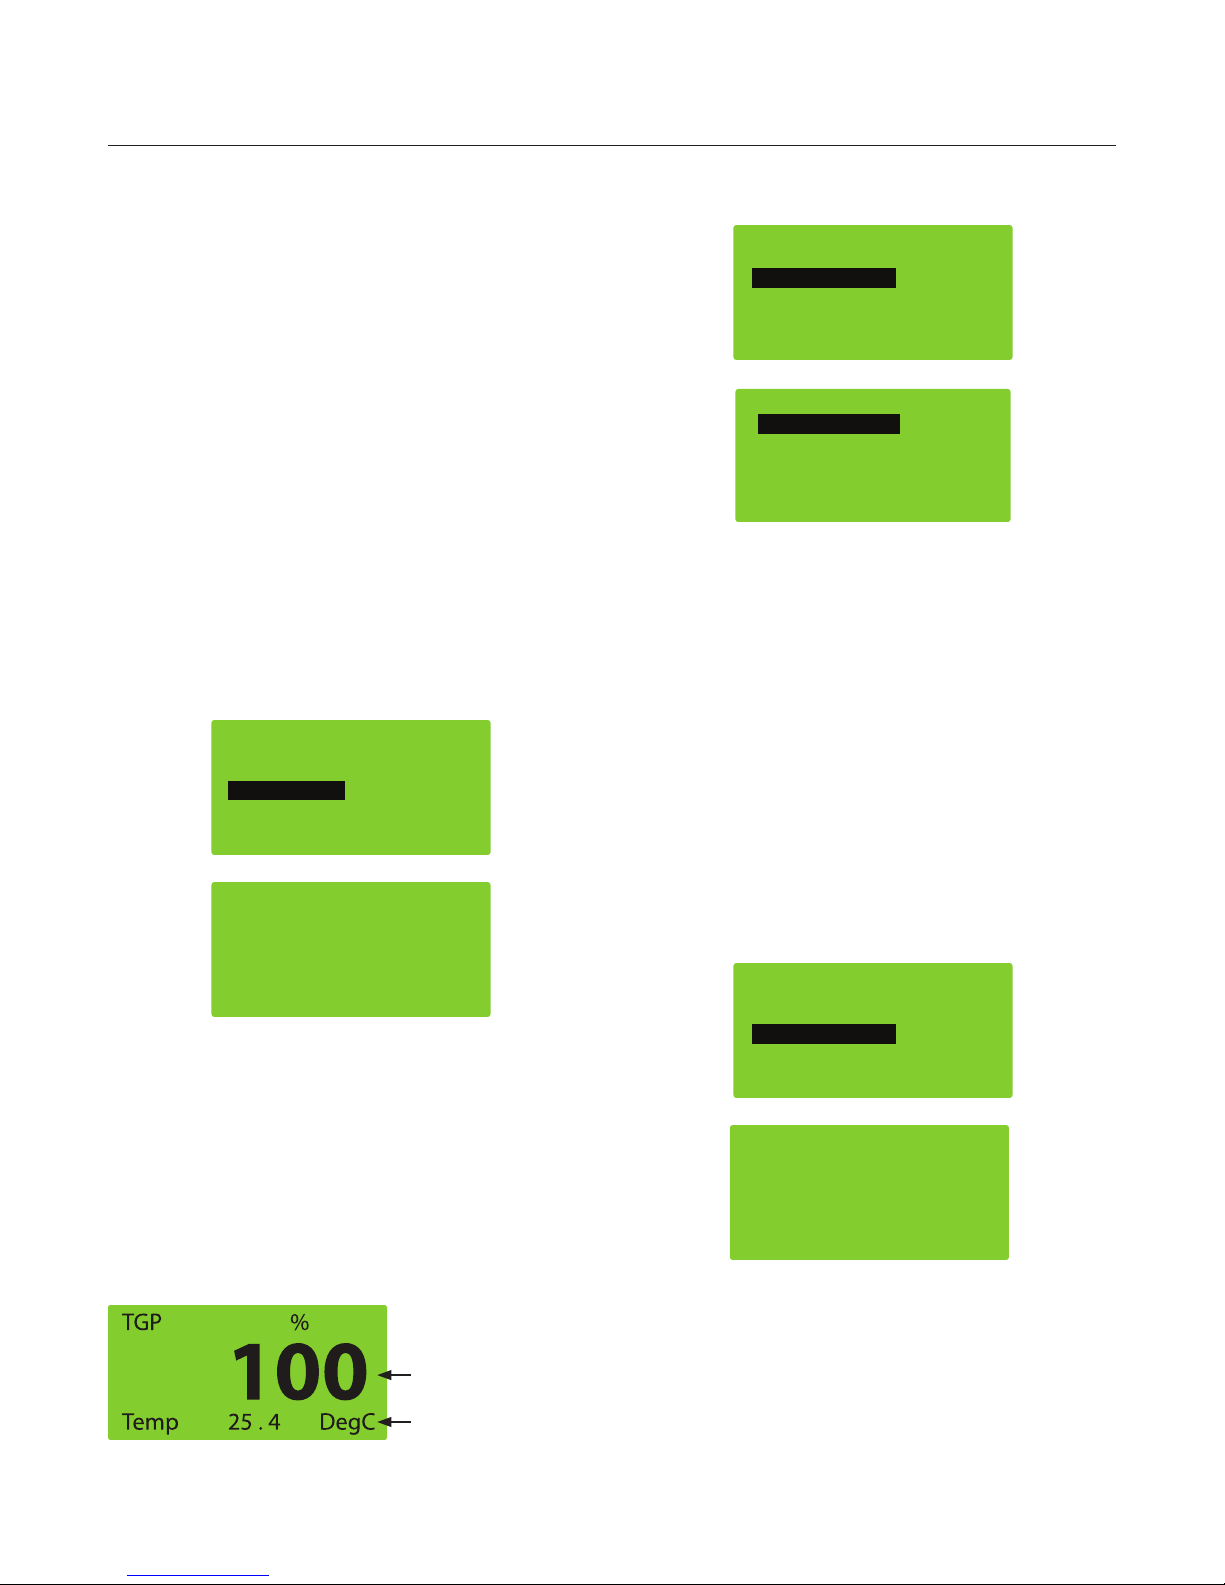
• Press “MENU” and use the arrows to select “SET
DISP CHs”, and then press “ENTER”.
MENU
CALIBRA T ION
S E T DISP CHs
S E T EXT C H
OPTIONS
D ATA L O G GER
V b a t : 5 . 6 8
SELEC T DISP C H
T G P m m H g
s T emp DegC
B P m m H g
P T G P %
D P m mHg
• The 5 channels will appear in a column. On the left
of the column, the letters “P” for primary and “s”
for secondary show which channels are presently
selected.
• To select a new primary and secondary channel, use
the up and down arrows to highlight the channel
of interest, then press the left arrow to select as
secondary or the right arrow to select as primary.
Once satised with the selections made, press
“ENTER” to accept the changes.
1PT CALIBA T ION
mmHg
### ####
TGP
mV
NOTE: A “2 Point Calibration” is generally unnecessary
and should not be undertaken without rst consulting
Pentair Aquatic Eco-Systems Technical Support.
1.5 SET DISPLAY CHANNELS
• This option will allow you to select the main and
secondary parameter that will be viewed on the
main display screen.
Main Display Parameter
Secondary Display
Parameter
1.6 SET EXTERNAL CHANNELS
• This option is not required for the TGP probe used
with this meter.
MENU
CALIBRA TION
S E T DISP CHs
S E T EXT C H
OPTIONS
D ATA L O G GER
V b a t : 5 . 6 8
SET EXT CH
Device only has a BP
CH. It is automatically
set by the Handheld.
• Press “MENU” and use the arrows to select “SET
DISP CHs”, and then press “ENTER”.
POINT FOUR TRACKER User’s Manual
Page 7
1.0 OVERVIEW
7
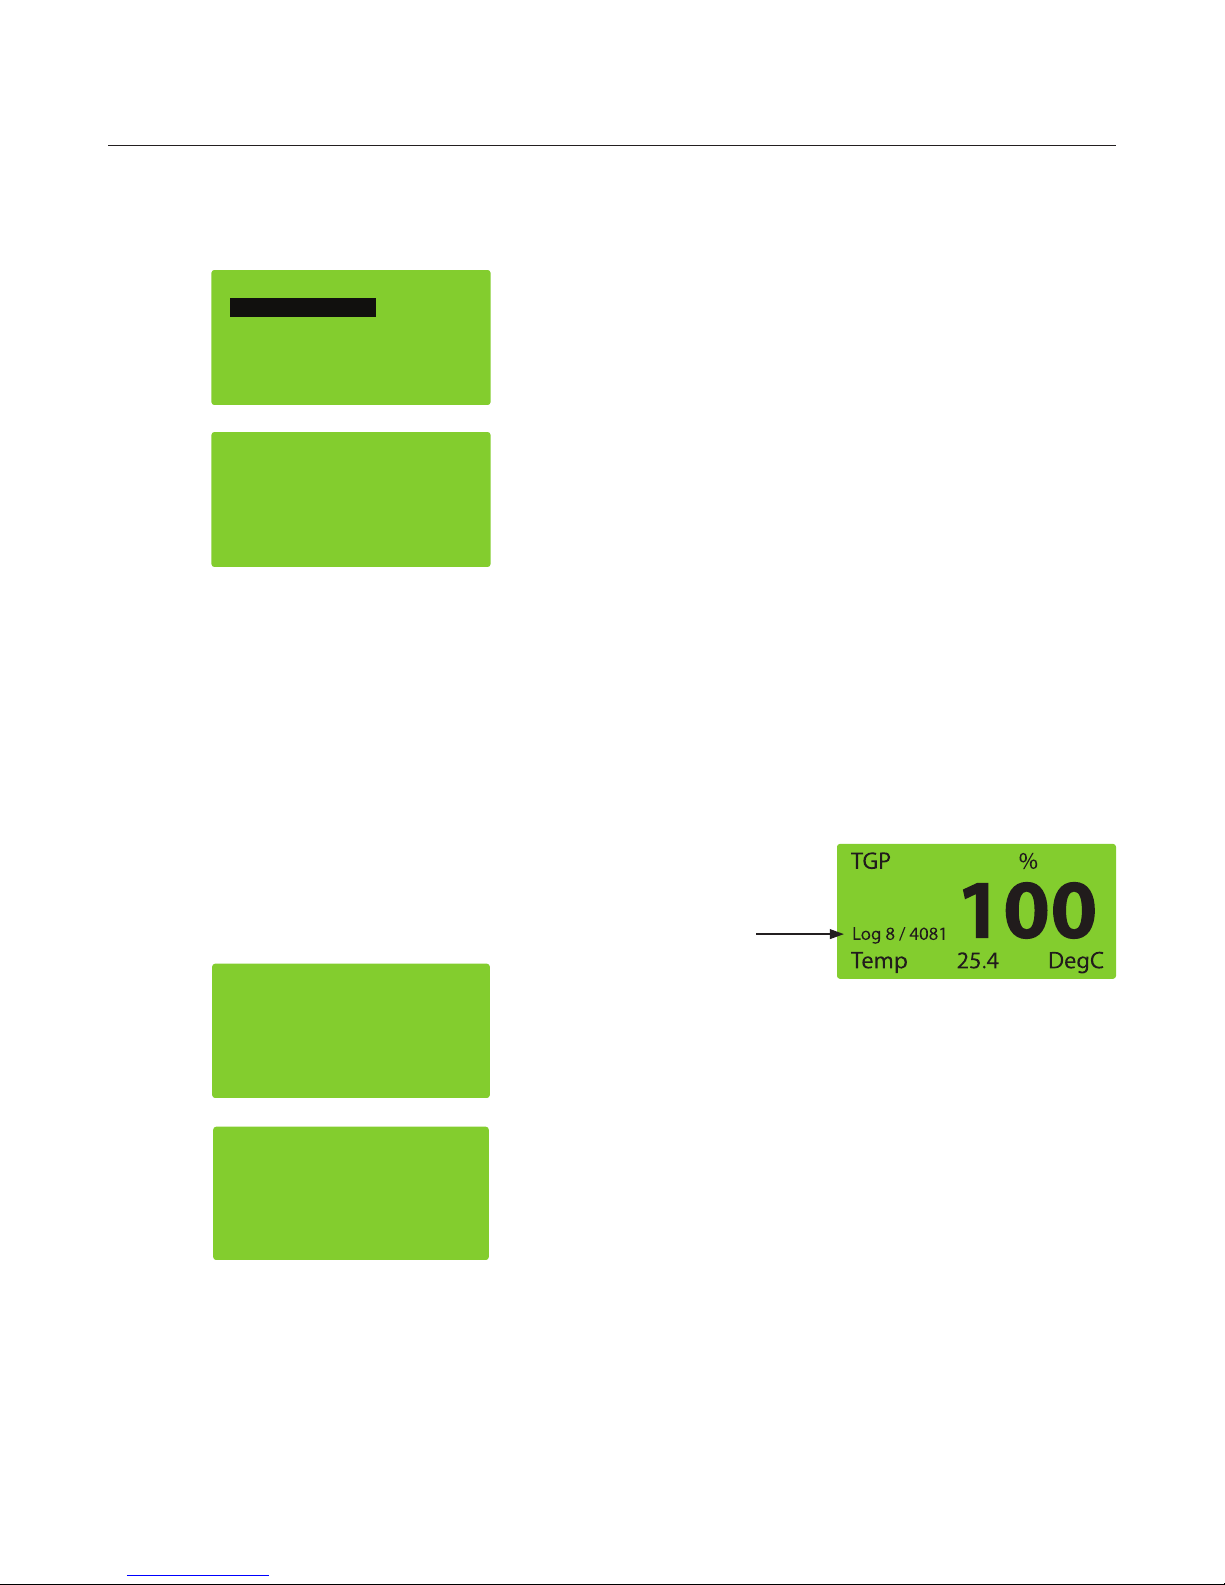
1.7 OPTIONS
• Press “MENU” and use the arrows to select
“OPTIONS”, and then press “ENTER”.
MENU
CALIBRA T ION
S E T DISP CHs
S E T EXT C H
OPTIONS
D ATA L O G G E R
V b a t : 5 . 6 8
OPTIONS
Shutdown T ime
Back light
• Options include setting a “Shutdown Time” for the
meter, as well as setting the time for turning the
“Backlight” off.
• The “Shutdown Time” refers to the time in seconds
that the meter will remain on after the last button
has been pressed. Following this time, the meter
will automatically shutdown.
• The “Backlight” option refers to the time in seconds
during which the backlight will remain on after any
button has been pressed.
NOTE: The “Shutdown Time” option will only
be in effect when the meter is NOT logging (see
DATALOGGING). This is to allow for continuous
logging data (for as long as there is adequate
power). The meter will also not shutdown if it is in
charging mode (i.e. charger cable is connected.)
1.8 DATALOGGING
The datalogging option allows the user to store data
in the meter and then transfer the data to a computer
or laptop. The user can select which parameters will
be datalogged and the time between each reading.
1.9 MANUAL DATALOGGING
It is possible to manually record a reading with the
Tracker, without the datalogging feature being on. To
do so, simply press the “ENTER” button (while on the
Main Screen) when a reading should be logged. Each
time a reading is logged, the main display screen
will show the log number and the total possible logs
(according to the settings established by the user).
Example: On this screen, the meter has logged
reading number 8 out of a possible total of 4081
logged readings.
• Select the option you wish to change, using the up
and down arrows, and then press “ENTER”.
OPTIONS
SHUTDOWN TIME
Only applies if
logger is OFF
Enter time in
Seconds: ####
OPTIONS
BACKLIGHT TIME
Enter time in
Seconds: ####
• The TRACKER will prompt you to enter the
desired time in seconds. The time can be changed
(increments of 30 seconds only) using the up and
down arrows.
• To accept the changes, press “ENTER”. This will
return you to the “OPTIONS” screen.
Log information
(ashing)
NOTE: the meter will log the information for the
parameters selected under “Logger Setup”.
POINT FOUR TRACKER User’s Manual
Page 8
8
1.0 OVERVIEW
For all other datalogging options, follow these
directions:
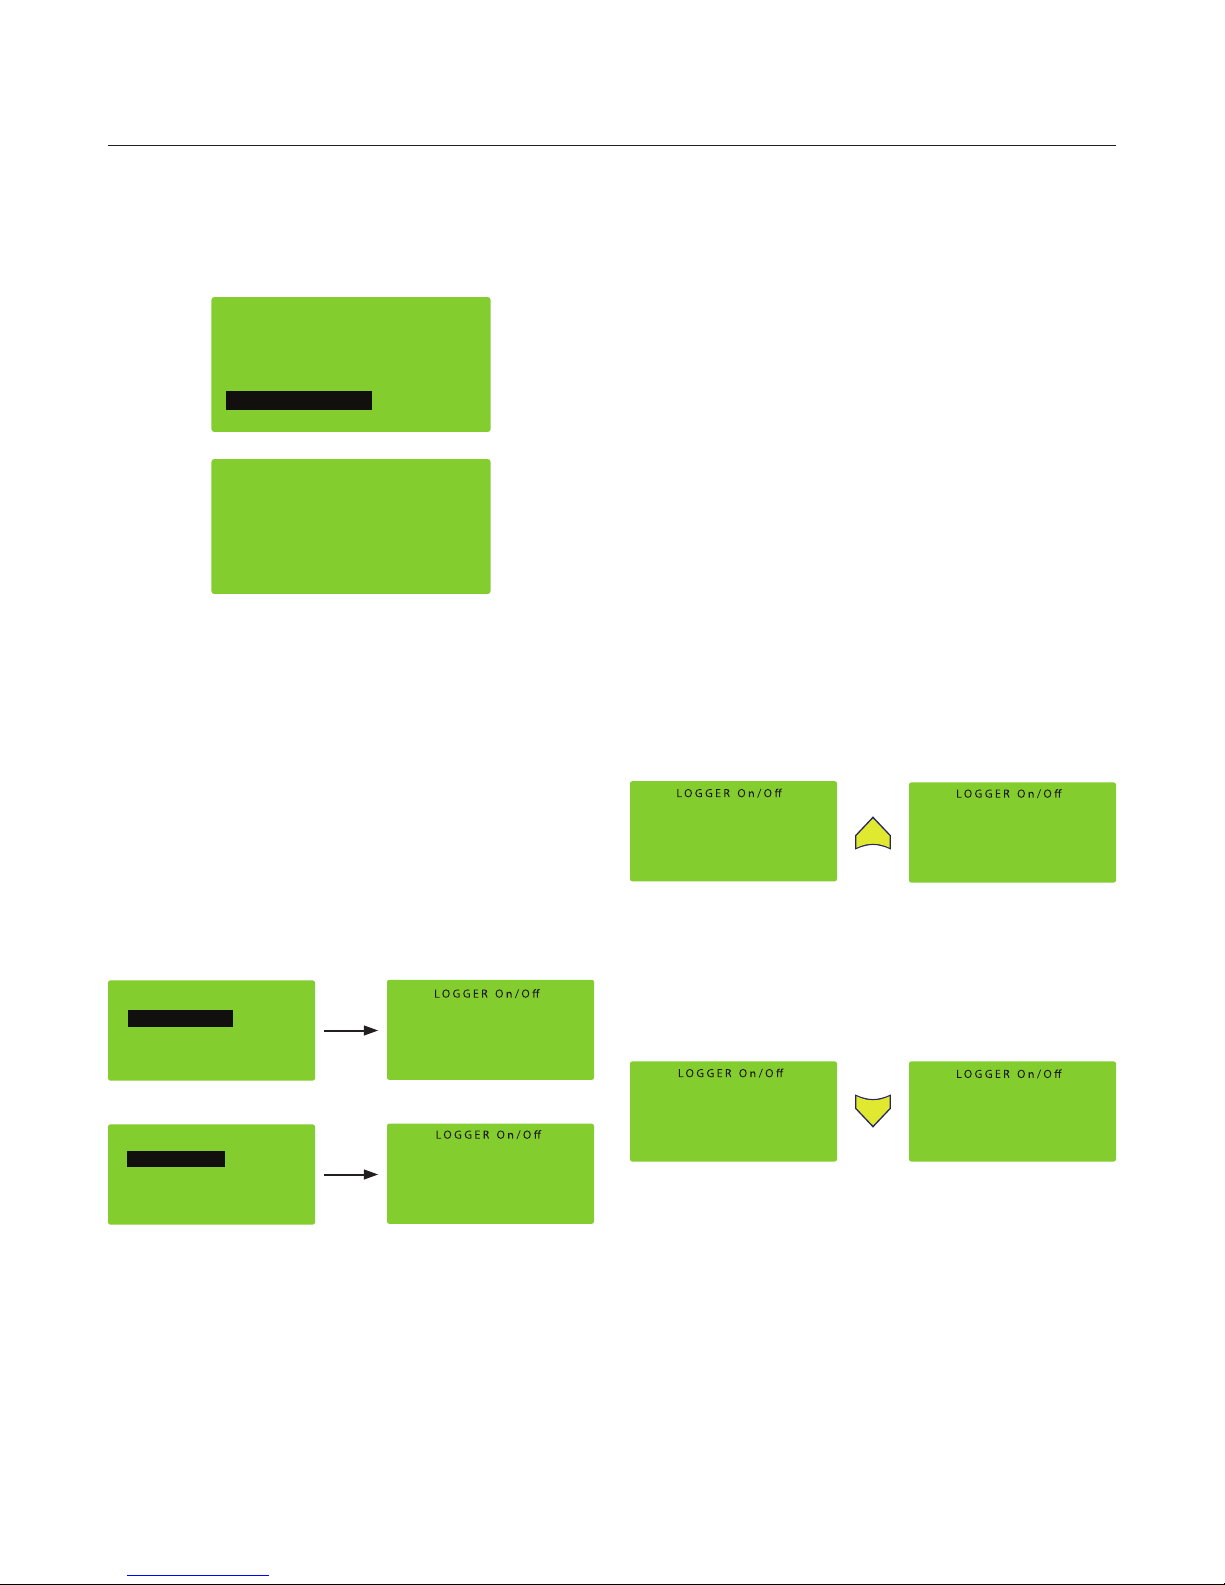
• Press “MENU” and use the arrows to select
“DATALOGGER”. Press “ENTER”.
MENU
CA LIBR ATION
SET DISP CHs
SET EXT CH
OPTIONS
DATA LOGGER
Vbat:5 .6 8
LOGGER Main
Auto Log: OFF
Set Clock
Logger setup
Dump Data
• 4 choices will appear on screen: “Auto Log”, “Set
Clock”, “Logger setup”, and “Dump Data”.
1.10 AUTO LOG
According to the present datalogging mode (i.e. on or
off), these provide the user with information as to the
function for the up and down arrows.
For example:
Pressing the “UP Arrow”: if logger off: starts the
datalogging mode from the beginning thereby erasing
all previous data if logger on: stops the datalogging
mode, but does not erase any recorded readings
Pressing the “DOWN Arrow”: if logger off: continues
datalogging following the last recorded reading (no
recorded readings are lost). If logger on: has no effect.
NOTE: To delete recorded readings: The only method
for erasing all readings stored in the Tracker is to
use the “UP” arrow in the “LOGGER On/Off” menu
while the logger is “OFF”.
If the logger was off, and readings had been recorded,
pressing the “UP” arrow will result in a WARNING
screen being displayed: “Starting Logger will erase
all logged data”.
Auto log displays the status of the auto log function,
i.e. on or off. When off, the meter is no longer
recording any readings. When on, the meter is
recording readings according to the rate that was
selected by the user.
• Use the arrow keys and press “ENTER” to select
“Auto Log”.
LOGGER Main
Auto Log: OFF
Set Clock
Logger setup
Dump Data
or
LOGGER Main
Auto Log: ON
Set Clock
Logger setup
Dump Data
Logger: OFF
UP=Start DN= ContAuto
Log end time:
07 09 13:38
Records:
101 / 5038
Logger: ON
UP=Stop
Log start time:
11 09 13:38
Records:
101 / 5038
The “LOGGER On/Off” menu provides the following
information:
1. Logger: OFF: the meter is not presently recording
any readings
ON: the meter is presently recording readings
2. UP=Start or DN=ContAuto or UP=Stop
Logger: OFF
UP=Start DN=ContAuto
Log end time:
10 09 13:38
Records:
101 / 5038
WARNING
Starting Logger will erase
all logged data.
ENTER = Start
To accept (and lose all previously recorded readings),
press “ENTER”. To refuse (and keep all previously
recorded readings), press “ESC” and press the
“DOWN” arrow to continue readings from stop point.
Logger: OFF
UP=Start DN=ContAuto
Log end time:
09 09 13:38
Records:
101 / 5038
Logger: ON
UP=Stop
Log start time:
08 09 13:38
Records:
101 / 5038
3. Log end time or Log start time:
Log end time (displays when Logger is off):
Displays the day, month and time (hr:min) of the last
recorded reading.
Note that this is synchronized according to the
settings in “Set Clock” (see next page: SET CLOCK).
Log start time (displays when Logger is on):
POINT FOUR TRACKER User’s Manual
Page 9
1.0 OVERVIEW
9
Displays the day, month and time (hr:min) of the rst
recorded reading.
Note that this is synchronized according to the
settings in “Set Clock” (see next page: SET CLOCK).
4. Records:
Displays the number of records logged over the
maximum number of records that can be logged
according to the present settings.
For example: 100 / 5038: 100 records logged with a
maximum of 5038 records that can be logged. The
Maximum number of records varies based on the
selected parameters to record.
• To return to the “LOGGER Main” menu, press “ESC”
once.
LOGGER Main
Auto Log: OFF
Set Clock
Logger setup
Dump Data
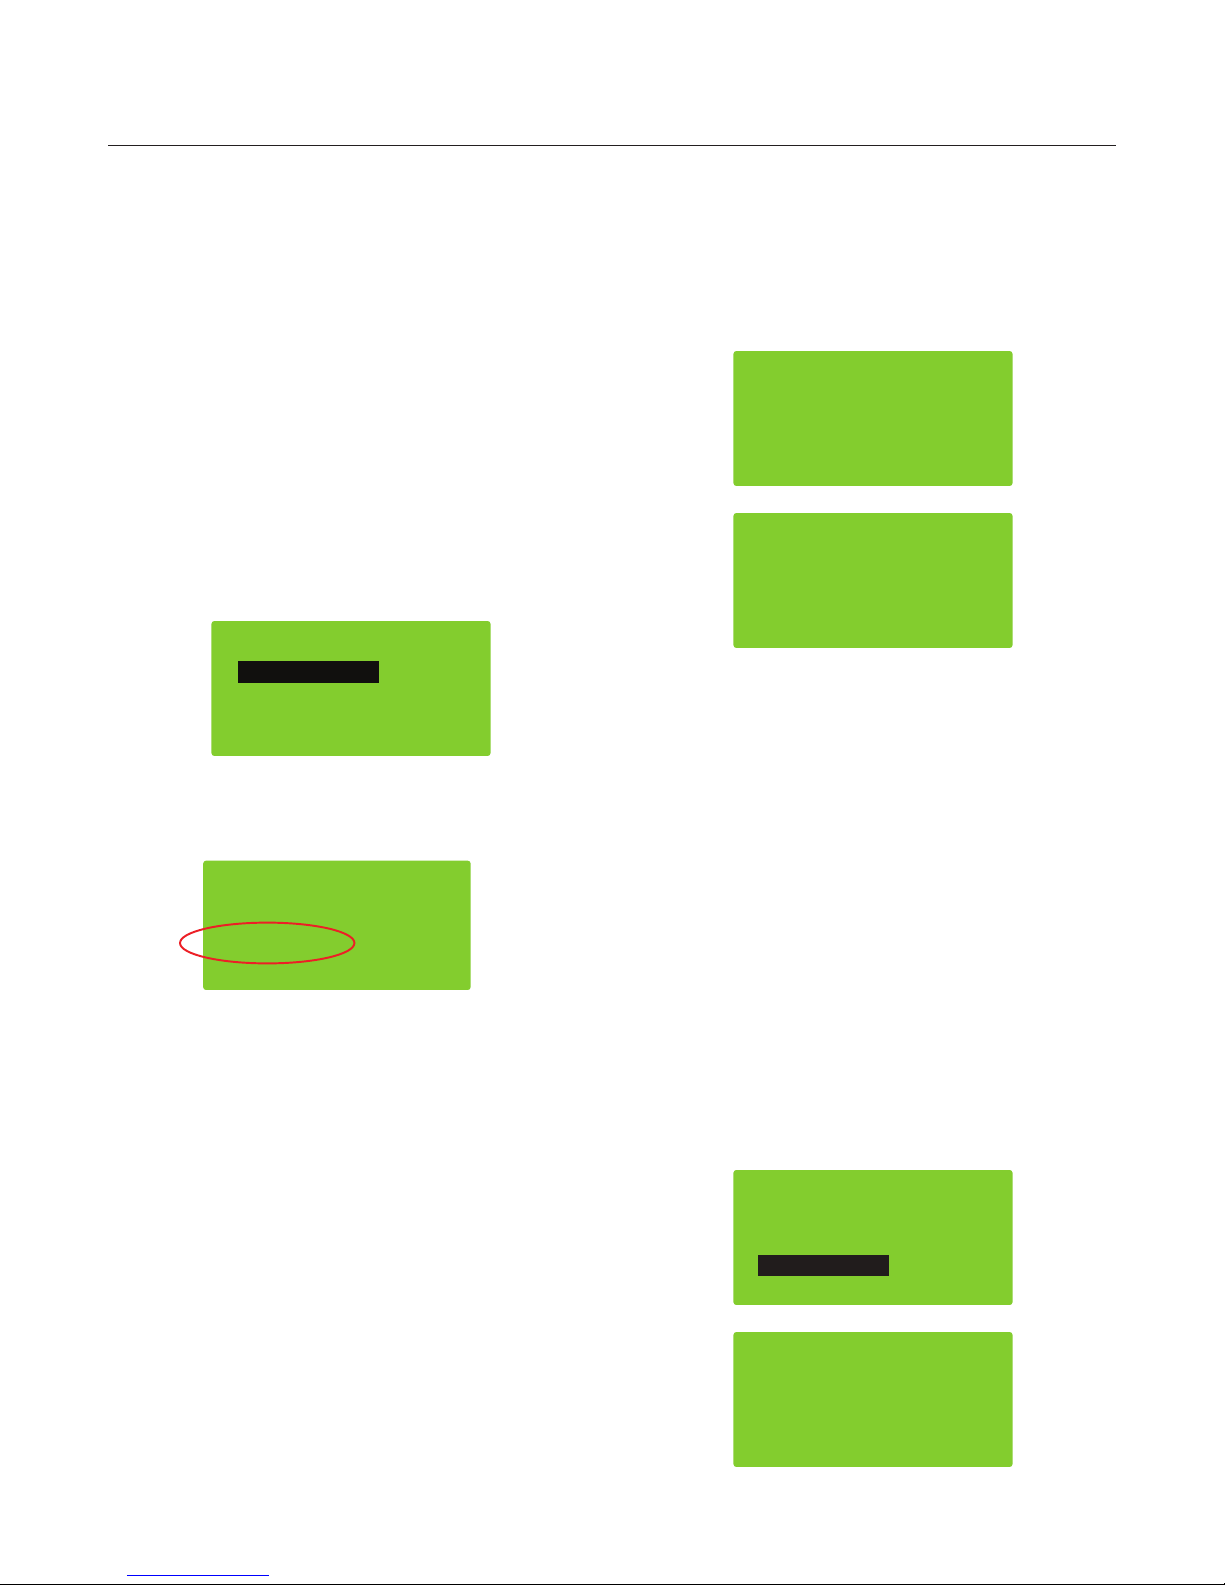
1.11 SET CLOCK
This option allows the user to set the meter’s clock
according to their time zone (or any other desired
time). The selected time is then used by the meter
to display when the rst and last readings were
recorded, as well as the time each record was made.
L OGGER Mai n
A u t o L o g: OFF
Set C l ock
L o gger s e t u p
Dum p D a t a
Clo c k
Y e ar: 4
Month: 7
D a te: 9
Hou r : 1 3
M in: 4 0
Sec: 3 4
• Use the “UP” and “DOWN” arrows to increase or
decrease a value highlighted by the cursor. “LEFT”
and “RIGHT” arrows can be used to move the
cursor left or right.
• To return to the “Main Display Screen” directly,
press “MENU” once.
TGP %
Log 102/5038
100
Temp 25.4 DegC
The “Log 102/5038” message ashes and counts up
each time a reading is recorded using the datalogging
function.
• When the value has been corrected, press “ENTER”
to accept the value and move the cursor to the next
row.
• The last “ENTER” will return you to the “Logger
Main menu”.
1.12 LOGGER SETUP
This function allows you to select which parameters
will be recorded and at which interval (number of
seconds between each recorded reading).
• Use the “UP” and “DOWN” arrows to select “Logger
setup”. Press “ENTER”.
LOGGER Main
Auto Log: OFF
Set Clock
Logger setup
Dump Data
LOGGER Setup
SELECT LOG CH
RATE (s): 10
POINT FOUR TRACKER User’s Manual
Page 10

10
1.0 OVERVIEW
Two options will appear: SELECT LOG CH: allows
you to select the parameters that will be recorded
using the datalogging feature.
RATE (s): XX: allows you to select the interval in
seconds between each reading.
1. Select log channel:
• Use the “UP” and “DOWN” arrows to select
“SELECT LOG CH” and press “ENTER”.
Logger: OFF
UP=Start DN=ContAuto
Log end time:
09 09 13:38
Records:
101 / 5038
LOGGER Sel Ch
LTGP mmHg
LTemp DegC
LBP mmHg
LTGP %
LdP mmHg
To select a parameter that will be recorded:
• Use the “UP” and “DOWN” arrows to highlight the
desired parameter.
2. Set recording rate: Use the “UP” and “DOWN”
arrows to select “RATE (s): XX” and press “ENTER”.
LOGGER Main
Auto Log: OFF
Set Clock
Logger setup
Dump Data
L O G GER S etu p
SELEC T L O G C H
R AT E (s): 1 0
Use “UP” and “DOWN” arrows to increase or
decrease the value that is highlighted by the cursor,
and use the “LEFT”and “RIGHT” arrows to move the
cursor to the appropriate position.
The value displayed is in seconds.
L O G Setup R ate
Enter L o g rate
(10 sec m i nim um)
1 0
• Press the “RIGHT” or “LEFT” arrow to select the
parameter. The letter “L” will appear next to the
parameter.
To remove a parameter from the list of recorded
readings:
• Use the “UP” and “DOWN” arrows to highlight the
desired parameter.
• Press the “RIGHT” or “LEFT” arrow to remove the
parameter. There should be no letter “L” next to the
removed parameter.
To return to “LOGGER Setup”: Press the “ESC”
button.
To return to the Main Display Screen: Press the
“MENU” button.
The maximum time allowed is 9999 seconds (or 2
hours, 46 minutes and 39 seconds).
• Press “ENTER” to accept the new value. (This will
return you to the “LOGGER Setup” menu).
• Press “ESC” to return to the “LOGGER Main” menu.
• Press “ESC” again to return to the “MAIN” menu.
1.13 DUMP DATA
Instructions for using Hyper Terminal to dump data
from PT4 Tracker to Windows (32 or 64-bit)
POINT FOUR TRACKER User’s Manual
Page 11
1.0 OVERVIEW
11
1.14 INSTALLING HYPER TERMINAL
HyperTerminal is only included on Windows machines
that are running Windows XP and is no longer
available In Vista, 7, or any later version.
If you need HyperTerminal in one of these later
versions of Windows you can actually extract two
les from your XP installation and copy them over to
your Windows installation.
The two les you will need are hypertrm.dll and
hypertrm.exe.
You should be able to nd hypertrm.exe in C:\Program
Files\Windows NT and hypertrm.dll in C:\ Windows\
System32.
If you have the Windows XP CD, you should be able
to nd both of these les in the i386 directory on the
CD.
Step 1: On the Windows 7 PC create a new folder
under C:\Program Files\HyperTerminal for 32-bit.
For 64-bit PC, create a new folder C:\ Program Files
(x86)\HyperTerminal
Step 2: Copy both les to that folder (hypertrm.exe
and hypertrm.dll)
Step 3: Now you can run the program by clicking on
"hypertrm.exe".
A free alternative to the Original HyperTerminal is
Putty, which can also be found online, this program
has a different look and feel to HyperTerminal and may
require different set of steps in order to achieve the
same results. Use the steps listed in this manual as
an overall guideline to what is required to connect to
the Tracker, but refer to the Putty manual specically
to achieve the desired result.
1.15 INSTALLING DRIVER
Step 1: Plug the USB to Serial Converter into you PC.
Step 2: Windows will automatically search for the
appropriate drivers.
Note that you may need to be connected to the
internet for this process to complete.
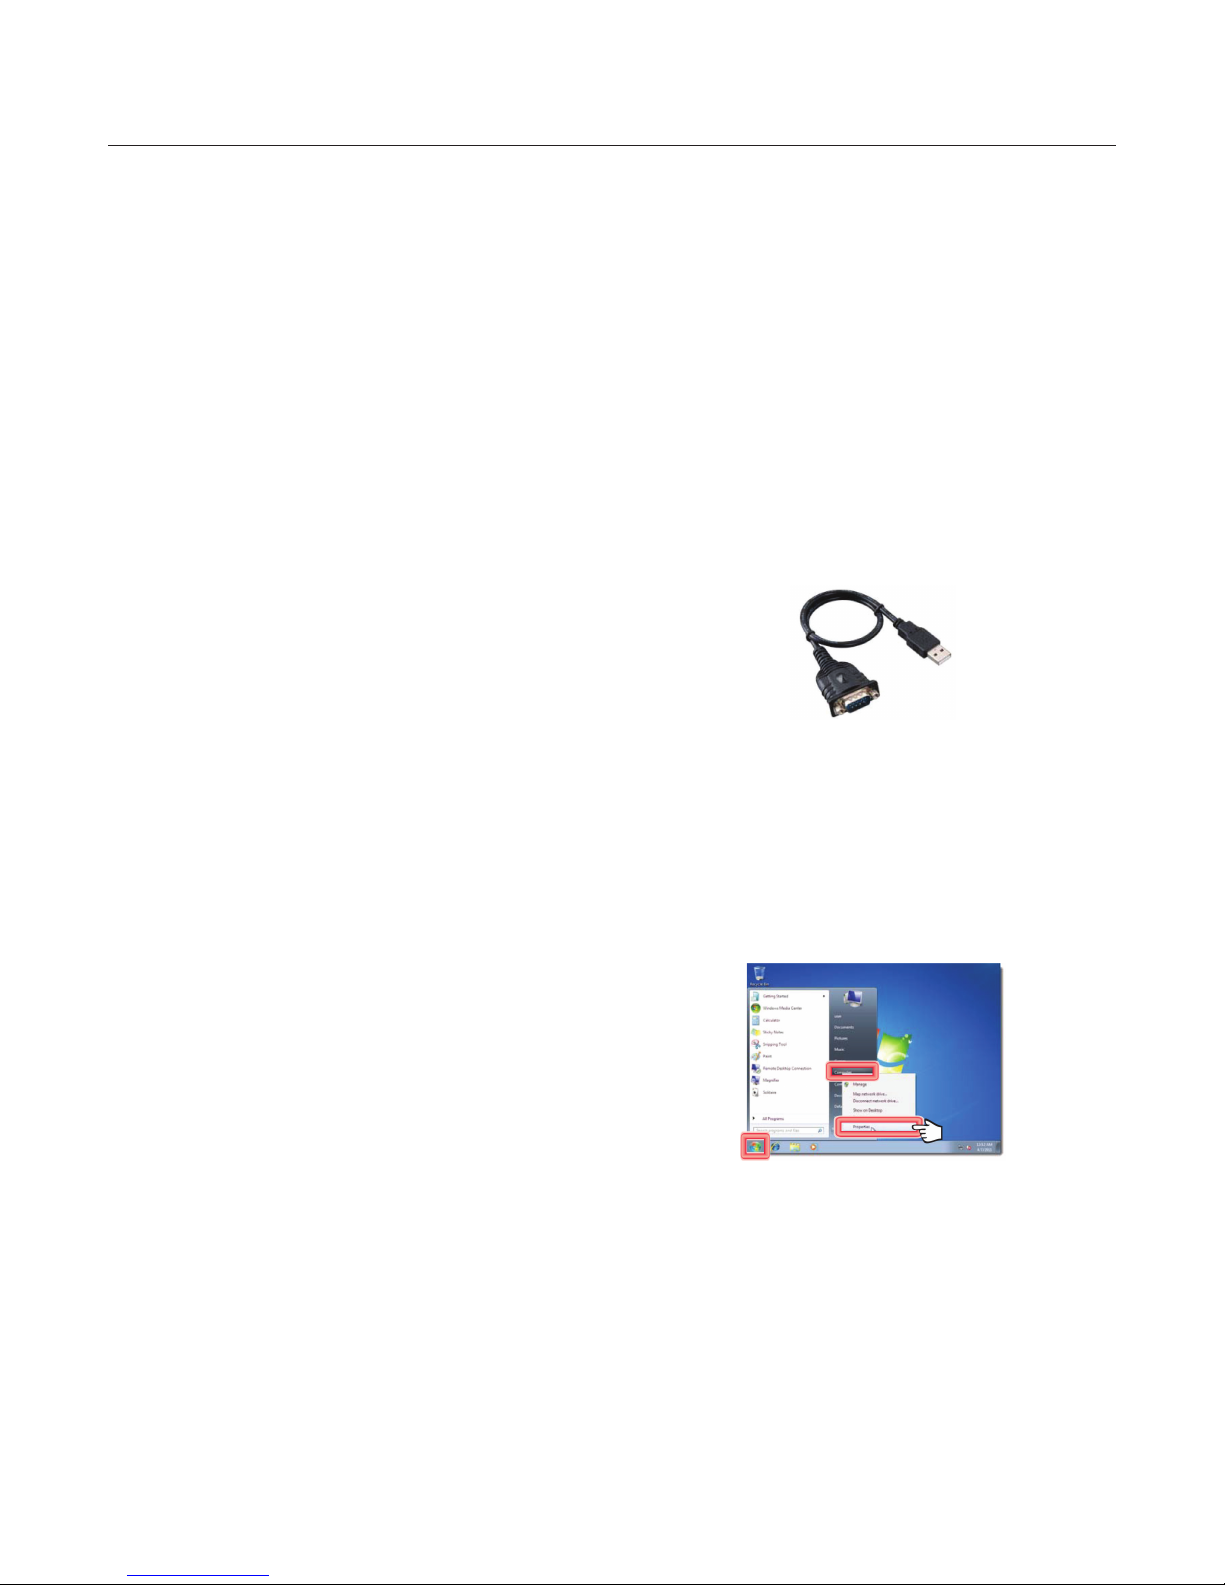
1.16 CONFIGURING COM PORT SETTING
Step 1: Connect USB data cable to your PC. Do not
connect it to the Tracker yet
Step 2: Press the [START] button.
Step 4: If you want to have HyperTerminal on your
Start Menu just create a shortcut to hypertrm.exe and
put it in C:\ProgramData\Microsoft\Windows\Start
Menu\Programs and when you go to All Programs
under the Start
Menu Hyper Terminal will be there (you might have to
rename the shortcut).
If you do not have access to the original HyperTerminal
or an XP installation you can still use alternative
programs.
The most common alternative is HyperTerminal
Private Edition which is a commercial emulation
program that can be found online with a free trial. This
successor to the original HyperTerminal functions
the same way and can use the same instructions as
outlined for HyperTerminal.
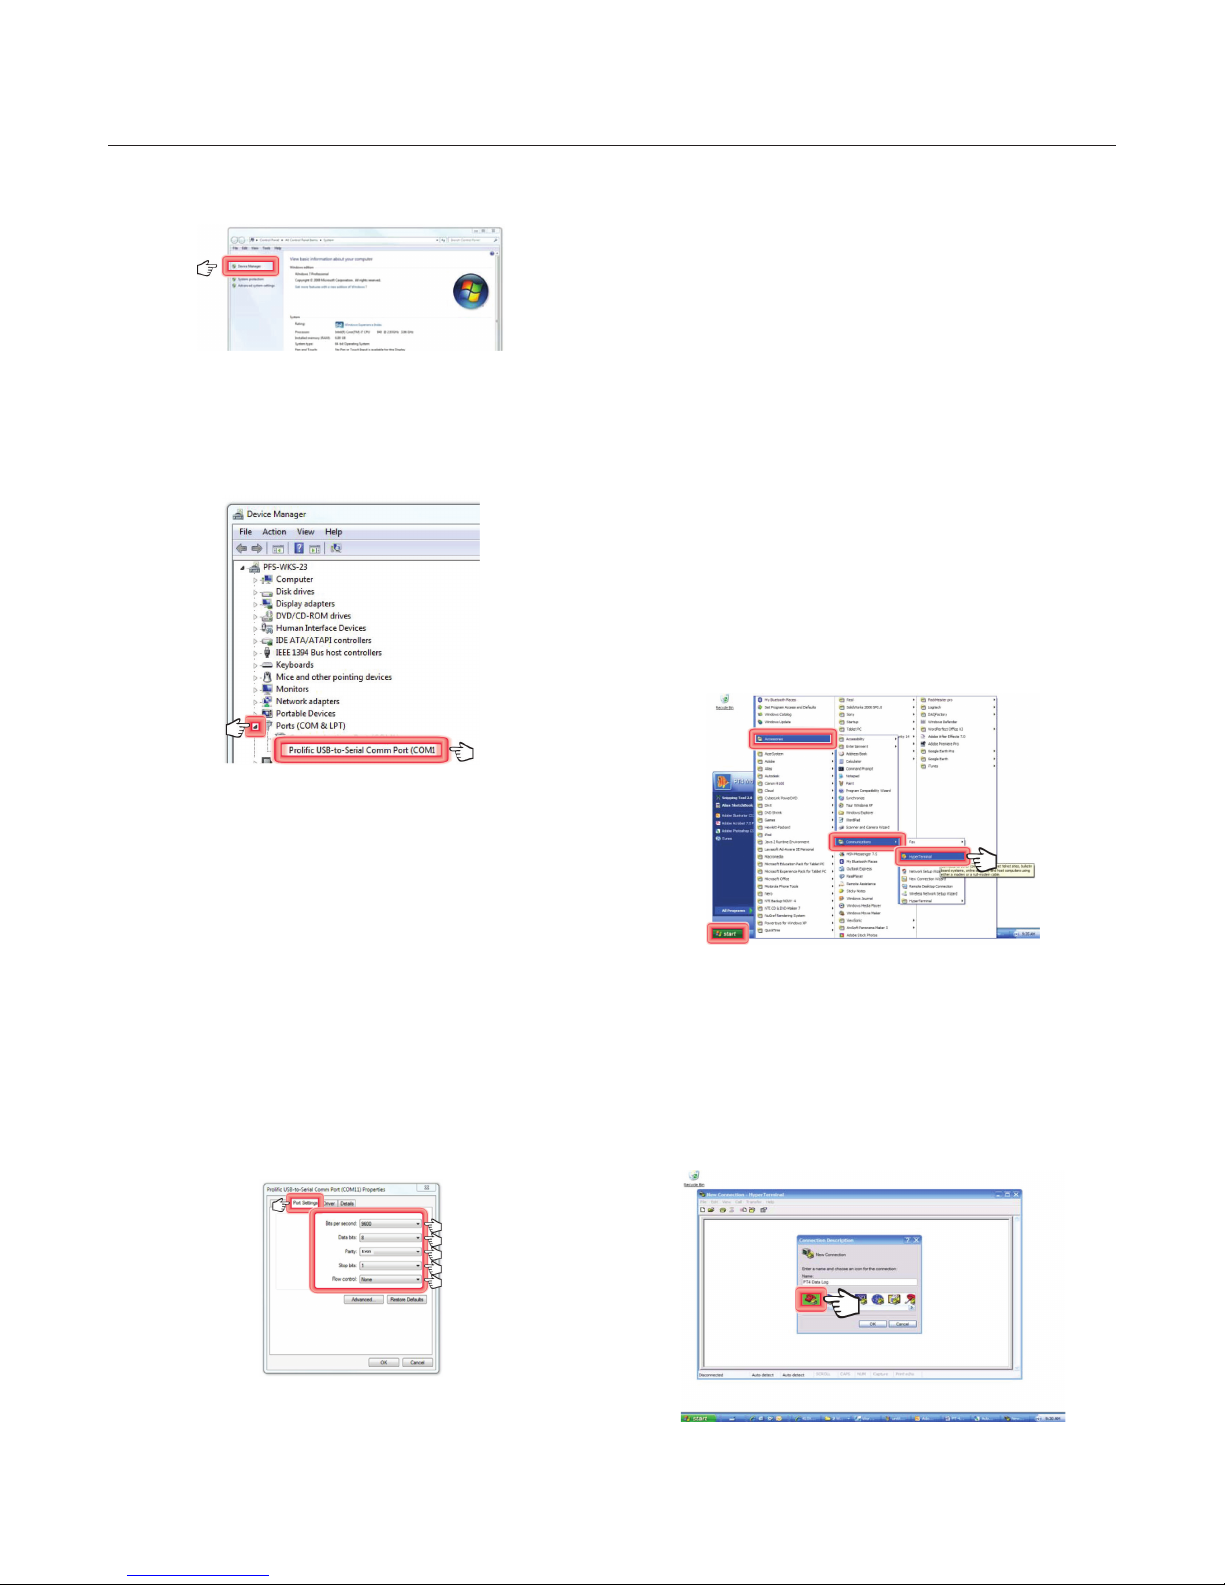
Step 3: Right click [Computer] and select [Properties].
Step 2 & 3
Step 4: From the Properties window select
[Device Manager].
In the Device Manager locate
[Port (COM & LPT)].
POINT FOUR TRACKER User’s Manual
Page 12
12
1.0 OVERVIEW
Click the arrow on the left to expand the list to see all
of the items connected to the PC.
Step 4
Step 5: Right click [USB Serial Port (COM_)] and
select [Properties].
1.17 SETTING UP THE HYPER TERMINAL
Step 1: For XP Machines
Open the Hyper Terminal Folder:
Click [START]
Select [ALL Programs]
Select [ACCESSORIES]
Select [COMMUNICATIONS]
Click [HYPER TERMINAL]
For Windows 7 (if a shortcut was created as per
instructions on page 13)
Click [START]
Select [ALL Programs]
Click [HYPER TERMINAL]
Step 5
Step 6: Select the [Port Setting] Tab.
Step 7: Congure the Port Setting to Read: [9600]
[8]
[Even]
[1]
[None]
Remember the Com Port # associated with “Prolic
USB to Serial Comm Port”.
Step 2: When Connection Description box appears:
ENTER NAME (e.g.. PT4 Data Log)
SELECT the [TELEPHONE ICON] for the connection.
Your communication settings will reside in this le.
Click [OK].
Step 6 & 7
Step 8: Close Program and launch Hyper Terminal.
POINT FOUR TRACKER User’s Manual
Page 13
1.0 OVERVIEW
13
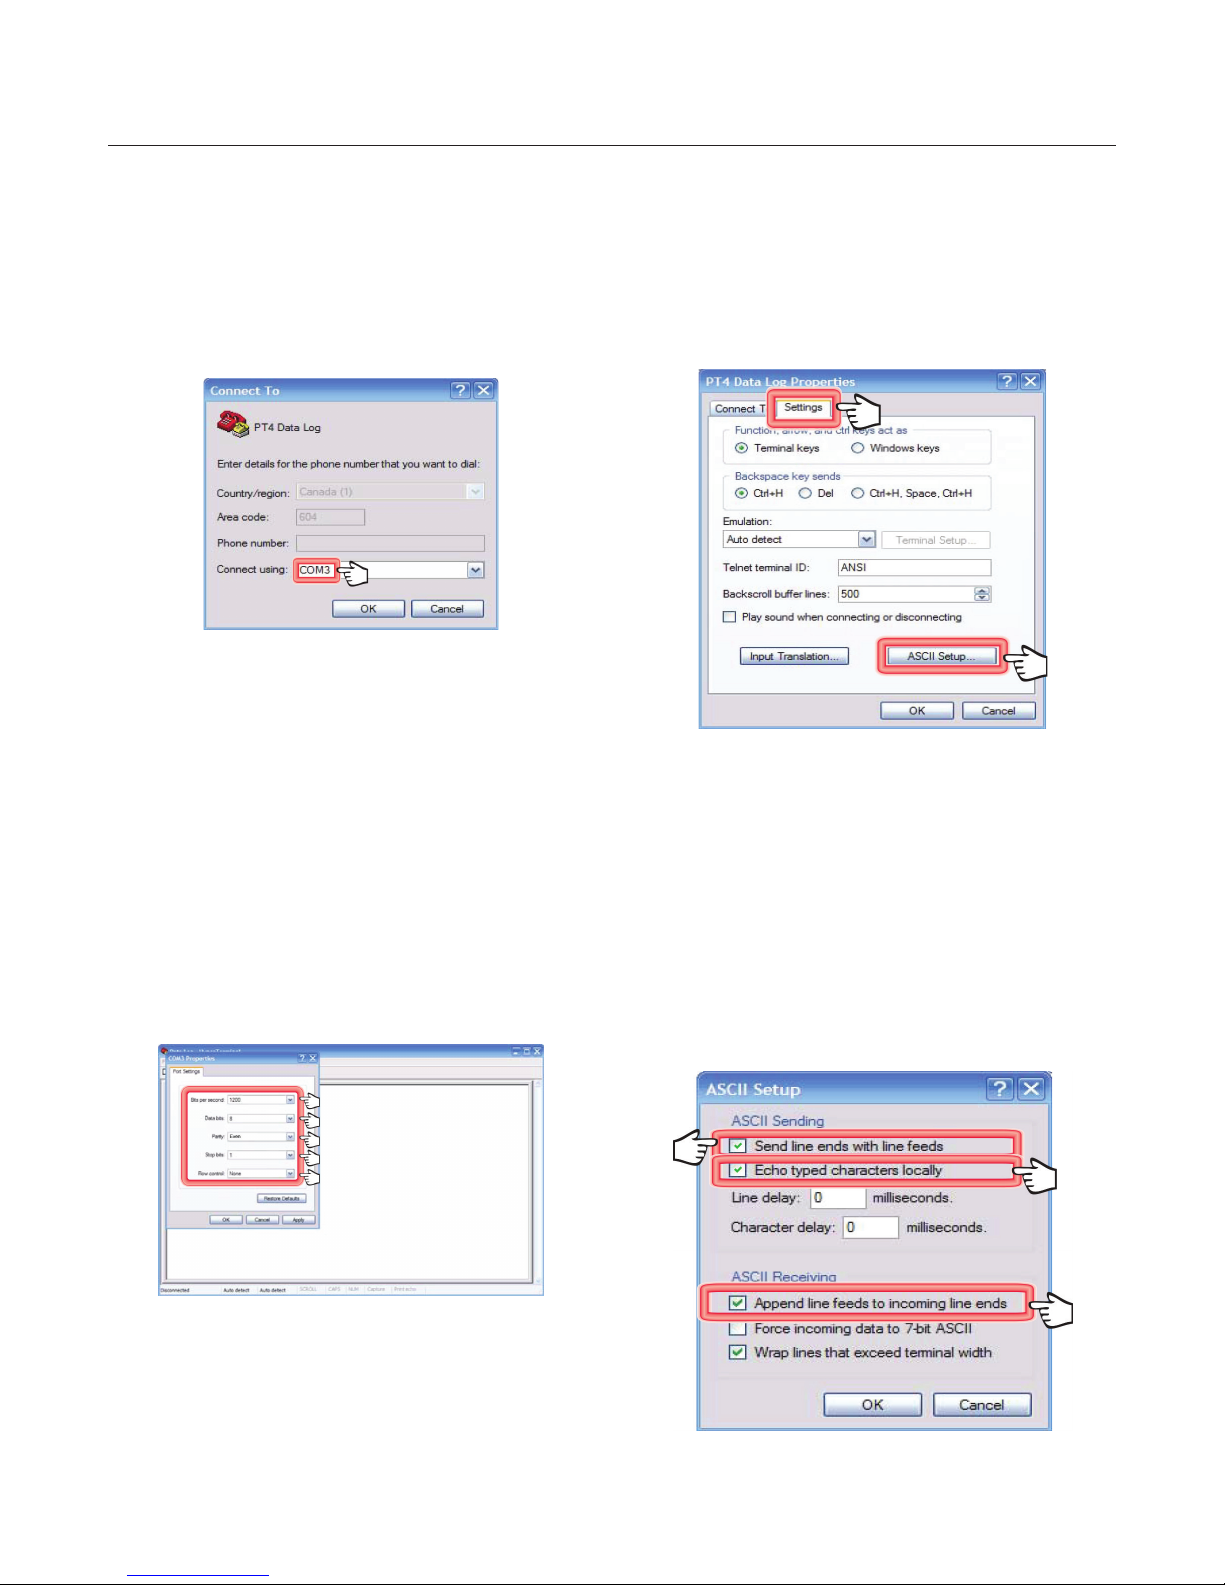
Step 3: When the Phone Number box appears, select
the correct [COM PORT] that is connected
to the PT4 Tracker as found in the device
manager (previous page).
Click [OK].
This [COM PORT] now represents the RS232 9 pin
connected to the PT4 Tracker.
Step 4:
Under [COM “#”] Properties Window
Step 5:
Under the [FILE] MENU.
Select [PROPERTIES].
Click [SETTINGS].
Click the [ASCII SETUP] BUTTON.
Select the following values:
BITS PER SECOND OPTION to [9600]
DATA BITS to [8]
PARITY to [EVEN]
STOP BITS to [1]
Select [NONE] for FLOW CONTROL
Click [OK]
Step 6:
Under the [ASCII SETUP] MENU check off:
[APPEND LINE FEEDS TO INCOMING LINE ENDS].
[Send line ends with line feeds].
[Echo typed characters locally].
All other settings remain the same (default).
Click [OK].
POINT FOUR TRACKER User’s Manual
Page 14
14
1.0 OVERVIEW
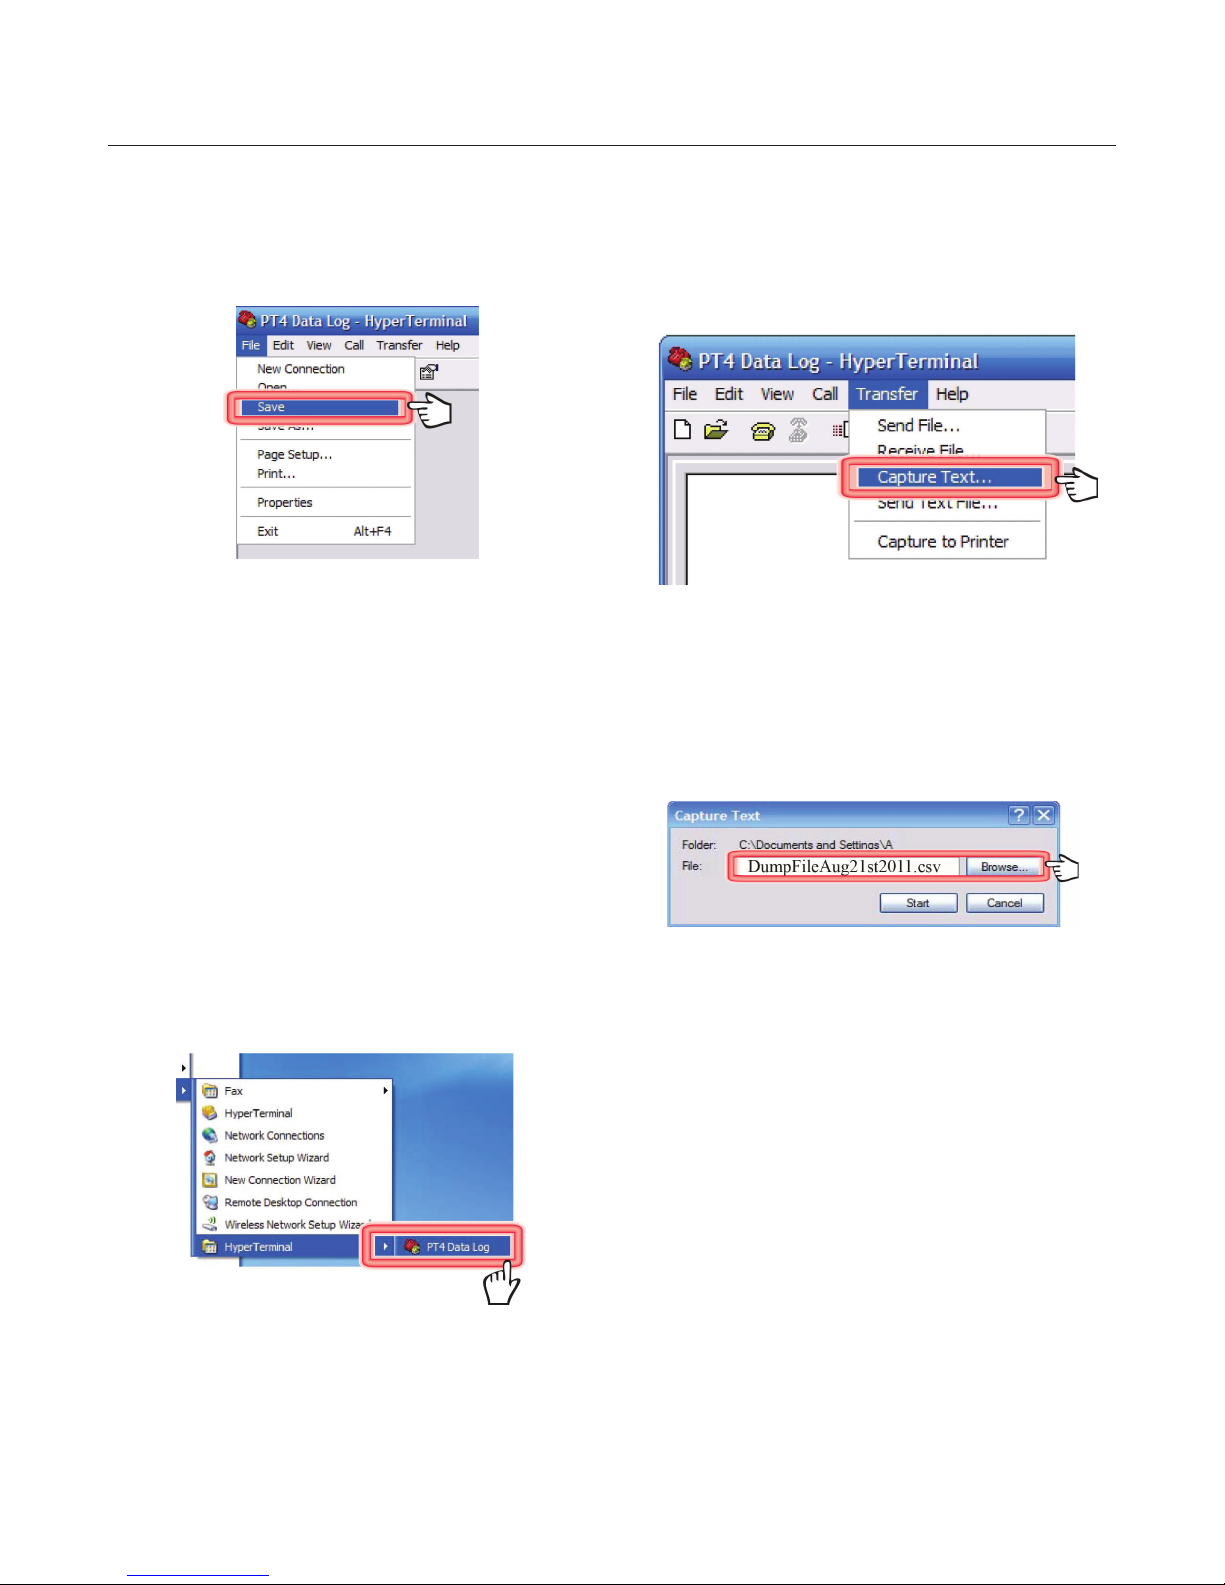
Step 7:
Save this connection by selecting [FILE] from the
main pull down menu.
Select [SAVE].
The above settings are retained when the [SAVE]
option is executed.
This completes the setup procedure.
When launching Hyperterminal for future use:
For XP:
This saved connection conguration le will now be
present beside the Hyperterminal launch button.
Step 8:
Capturing Data under Hyper Terminal.
Click the [TRANSFERS] MENU.
Select [CAPTURE TEXT FILE].
Step 9
Click [BROWSE]
Name the le to be saved with the le extension
“.csv”
Click [START].
For Windows 7:
Launch Hyperterminal
Select [ File ] [ Open ]
Click on the le name created in Step 2 (the le
extension for hyperterminal is “.ht”)
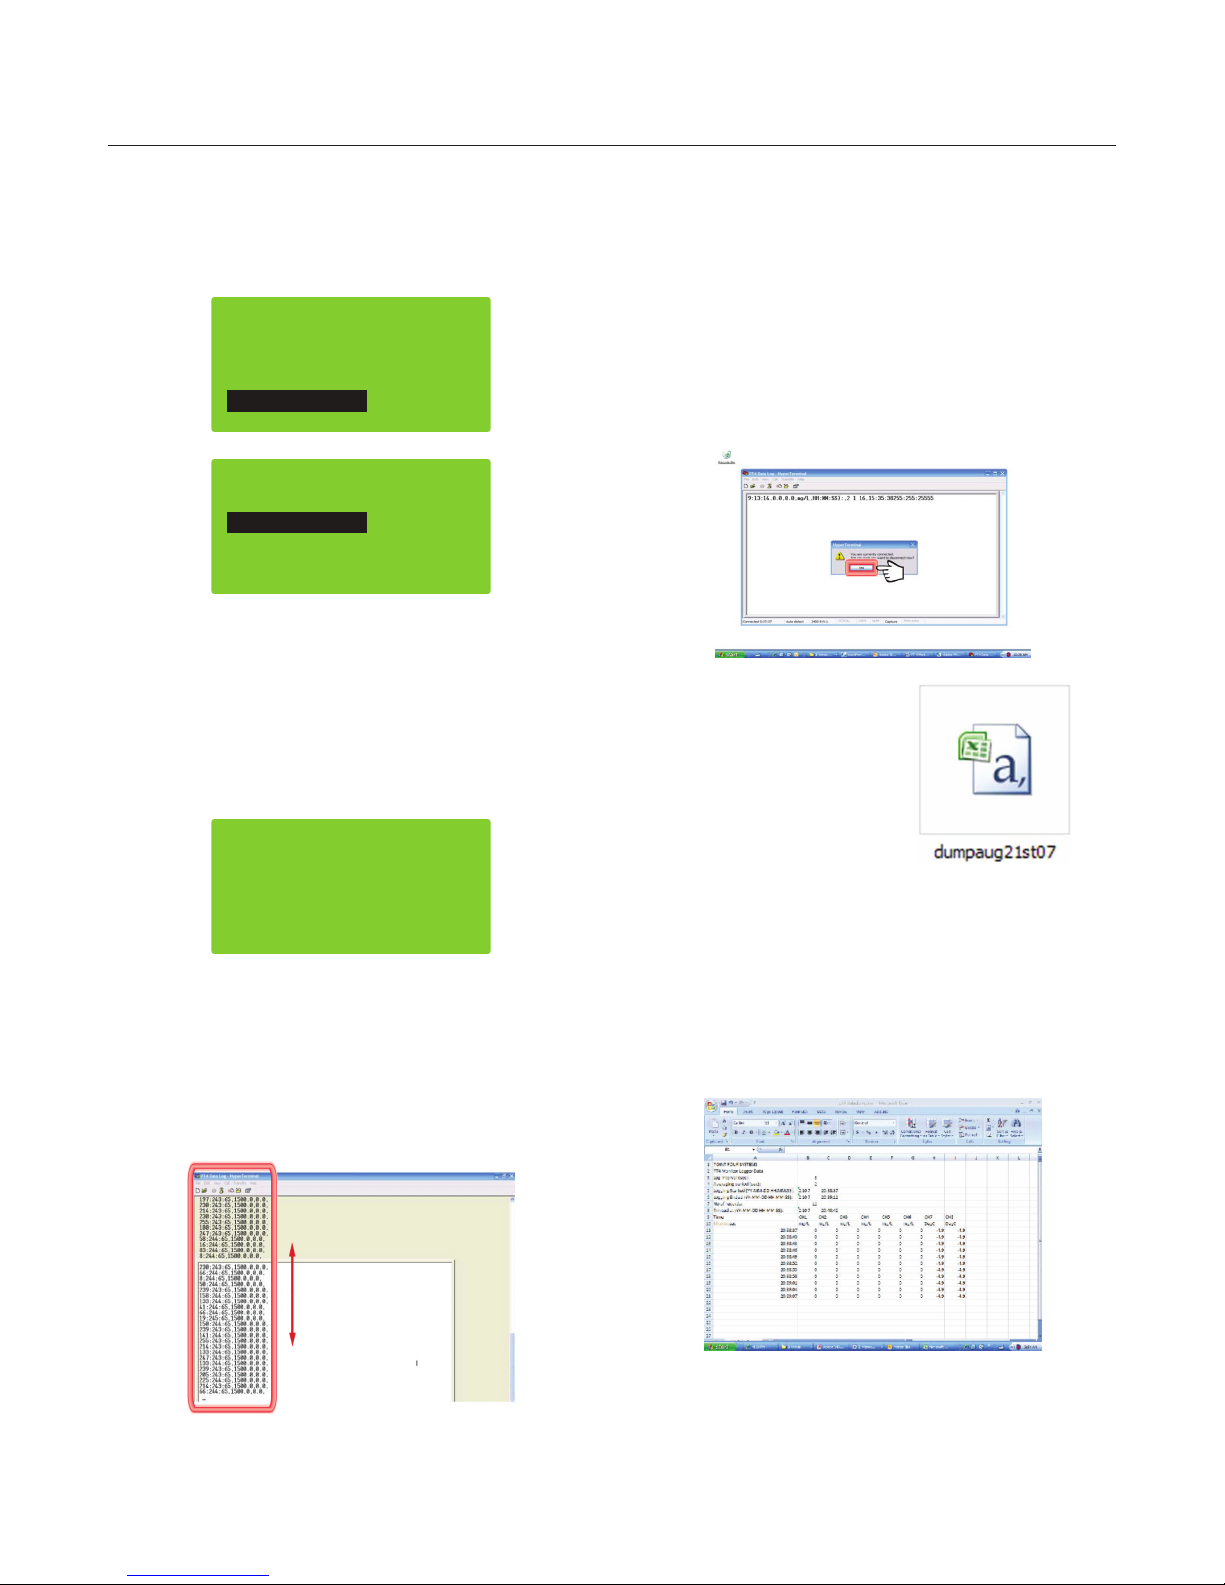
Step 10:
Turn on PT4 Tracker, by pressing the PWR button
wait to initialize.
*The probe should still be attached at this point.
Step 11:
To enter DATALOGGING Program:
Press and hold MENU.
Select DATALOGGER and press ENTER.
Use the “UP” and “DOWN” arrows to highlight “Dump
Data” and press “ENTER”.
POINT FOUR TRACKER User’s Manual
Page 15
1.0 OVERVIEW
15
Remove probe from meter and attach the data
transfer cable (USB adaptor or RS485 adaptor) to the
right 6-pin connector.
Press the “ENTER” button on the meter.
LOGGER Main
Auto Log: OFF
SetClock
Logger setup
Dump Data
LOGGER Dump
ENTER = Start
ESC = Abort
Step 12:
From the DATALOGGER menu select Dump Data and
press ENTER.
Press ENTER to start Data Dump Procedure.
Step 14:
To Close the Hyper Terminal Folder:
Select [FILE] from the main pull down menu.
Select [SAVE].
Select [Exit] from the [File] menu.
When prompted “Do you want disconnect now?”
Select “Yes” in the Disconnection Box.
Step 15:
To View Logged Data:
Press ESC to abort Data Dump process.
LOGGER Dump
Dumping Data....
Step 13:
Your logged data should appear in the Hyper Terminal
Window.
When logger is nished, close the Hyper Terminal
Window.
Open the captured text le
from the Hyper Terminal
as saved in a specic
location on your computer
(see Step 9).
DumpFileAug21st2011.csv
Step 16:
The data will open in a Microsoft EXCEL Spreadsheet.
Adjust the columns width of the spreadsheet to align
the data properly.
Note: If your system is not equipped with Microsoft
Excel, a trial version can be downloaded at: http://
ofce.microsoft.com/en-us/excel/
POINT FOUR TRACKER User’s Manual
Page 16
16
2.0 SERVICE & MAINTENANCE
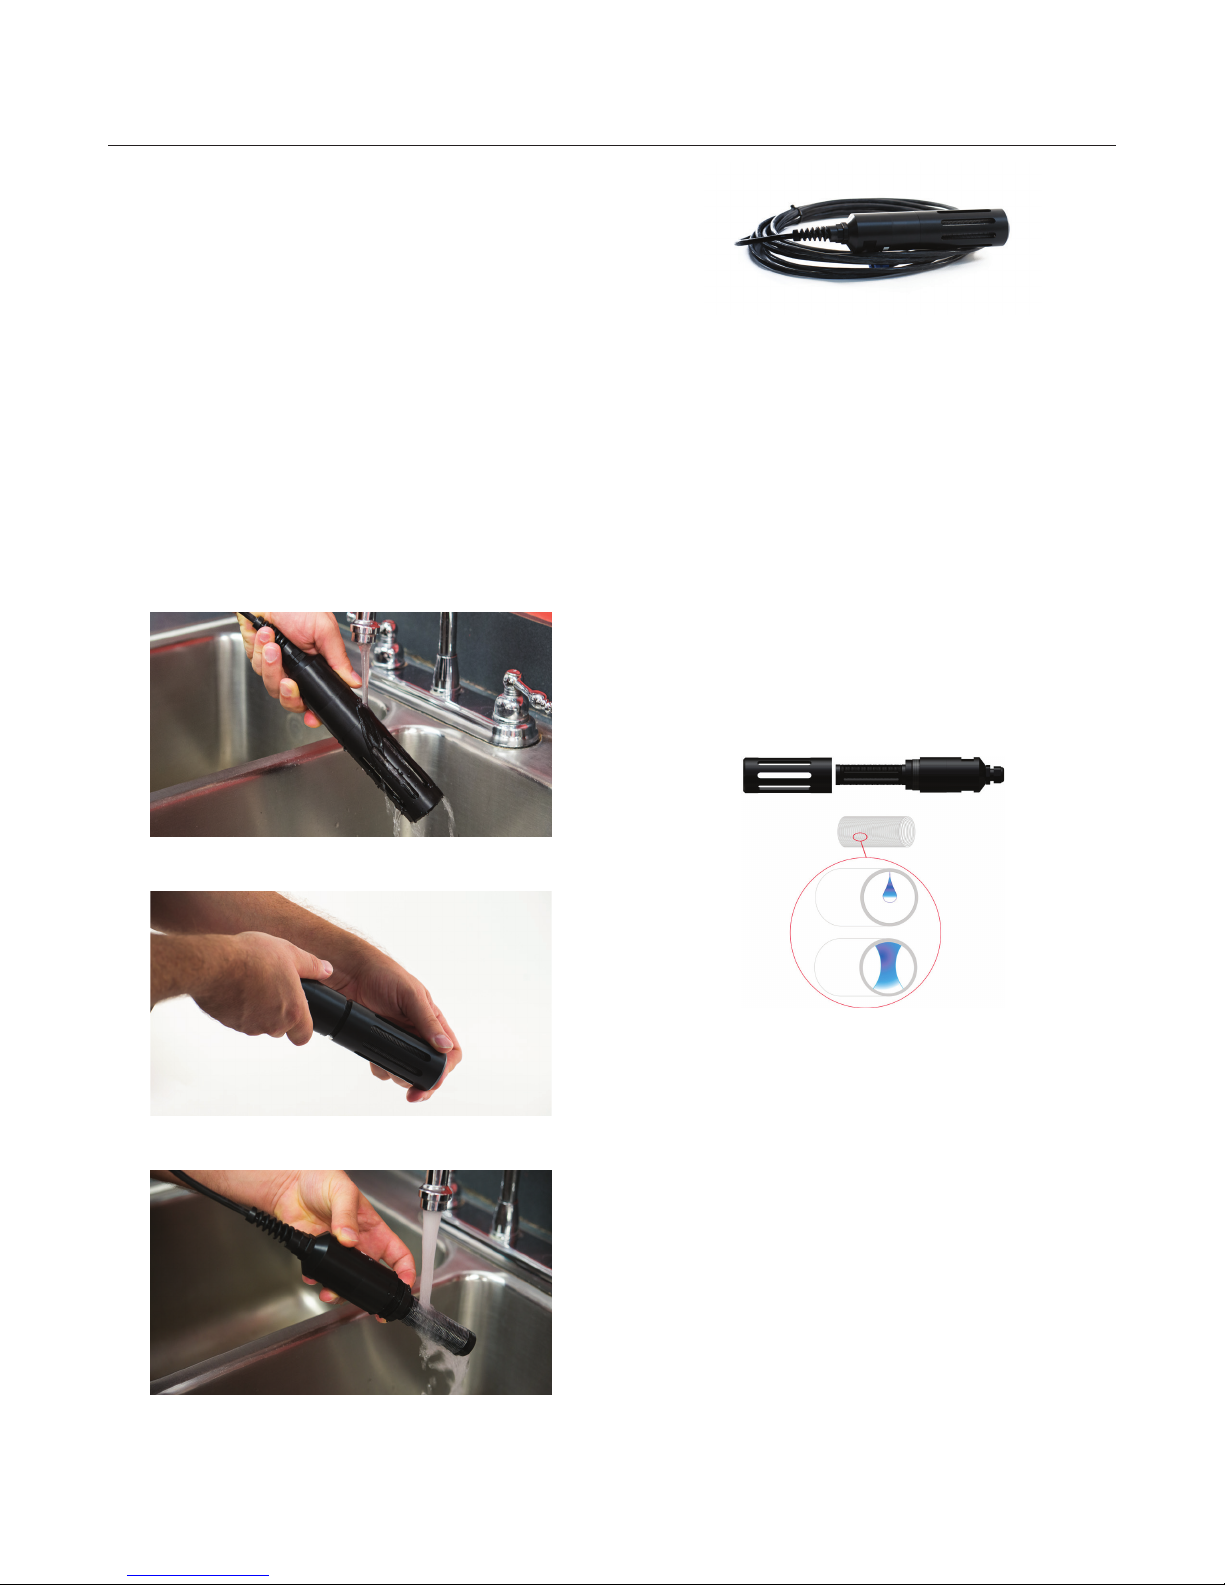
2.1 NORMAL PERIODIC USE
After each measurement session:
• Remove the probe from the water, rinse clean
straight away before any form of fouling dries on
the membrane tubing.
• Slide off the protective tubing shield.
Allowing probe to dry and store.
• Rinse off the membrane tubing with clean fresh
water and gently shake the probe dry.
• Allow up to 4 hours for the probe to dry out (*more
time might be required in cold damp environments).
• Store dry at room temperature.
• If time is of the essence, have a spare cartridge
available, and swap out the cartridges.
Probe being rinsed under water.
2.2 CONTINUOUS USE
In some applications the TGP probe is left continuously
submerged in water. Under such circumstances,
eventually water condenses as small droplets on
the internal walls of the tubing. As these droplets
grow in size, they will eventually coalesce resulting
in “cross-bridging”. The pressure detected by the
sensor will produce a difcult-to-dene average of
the actual TGP. Cross-bridging can lead to excess
water accumulation inside the tubing.
Excess water in the tubing can damage the pressure
transducer if actual contact is made with the pressure
sensitive wafer.
Unscrewing protective screen from the probe body.
Rinsing membrane cartridge (still connected
to probe) under running water.
POINT FOUR TRACKER User’s Manual
The time taken for such a condition to arise is
inversely proportional to water temperature. i.e: the
higher the water temperature, the faster the bridging
will occur.
In summary, the frequency of probe maintenance is
site and condition specic.
AS A GUIDELINE, THE PROBE SHOULD BE
REMOVED FROM THE WATER ON A ROUTINE
BASIS EVERY THREE WEEKS FOR CLEANING.
(based on water temp of 15Deg C)
* Refer to section NORMAL PERIODIC USE for
maintenance procedures.
Page 17
2.0 SERVICE & MAINTENANCE
17
2.3 A SIMPLE CHECK FOR A DAMAGED
OR BROKEN MEMBRANE TUBE
If the membrane tube is compromised in any way,
TGP readings will be wrong. A simple way to check
the integrity of the tubing is to observe the TGP
readings as the probe is steadily immersed in water. A
fast increase (several mmHg per second) in displayed
values indicates a damaged or broken membrane
tube. Replace the cartridge and recalibrate.
The recommended method to check for a faulty
membrane cartridge is to use the syringe test as
shown on the following page.
• Inspect the tubing for any visible signs of damage.
If damaged or broken, replace the cartridge.
Otherwise leave the probe in air until there is no
sign of water present in the tubing.
• Re-calibrate if necessary.
Note: A need for an unusual degree of calibration
correction could mean that the pressure sensor has
been damaged by the bulk water.
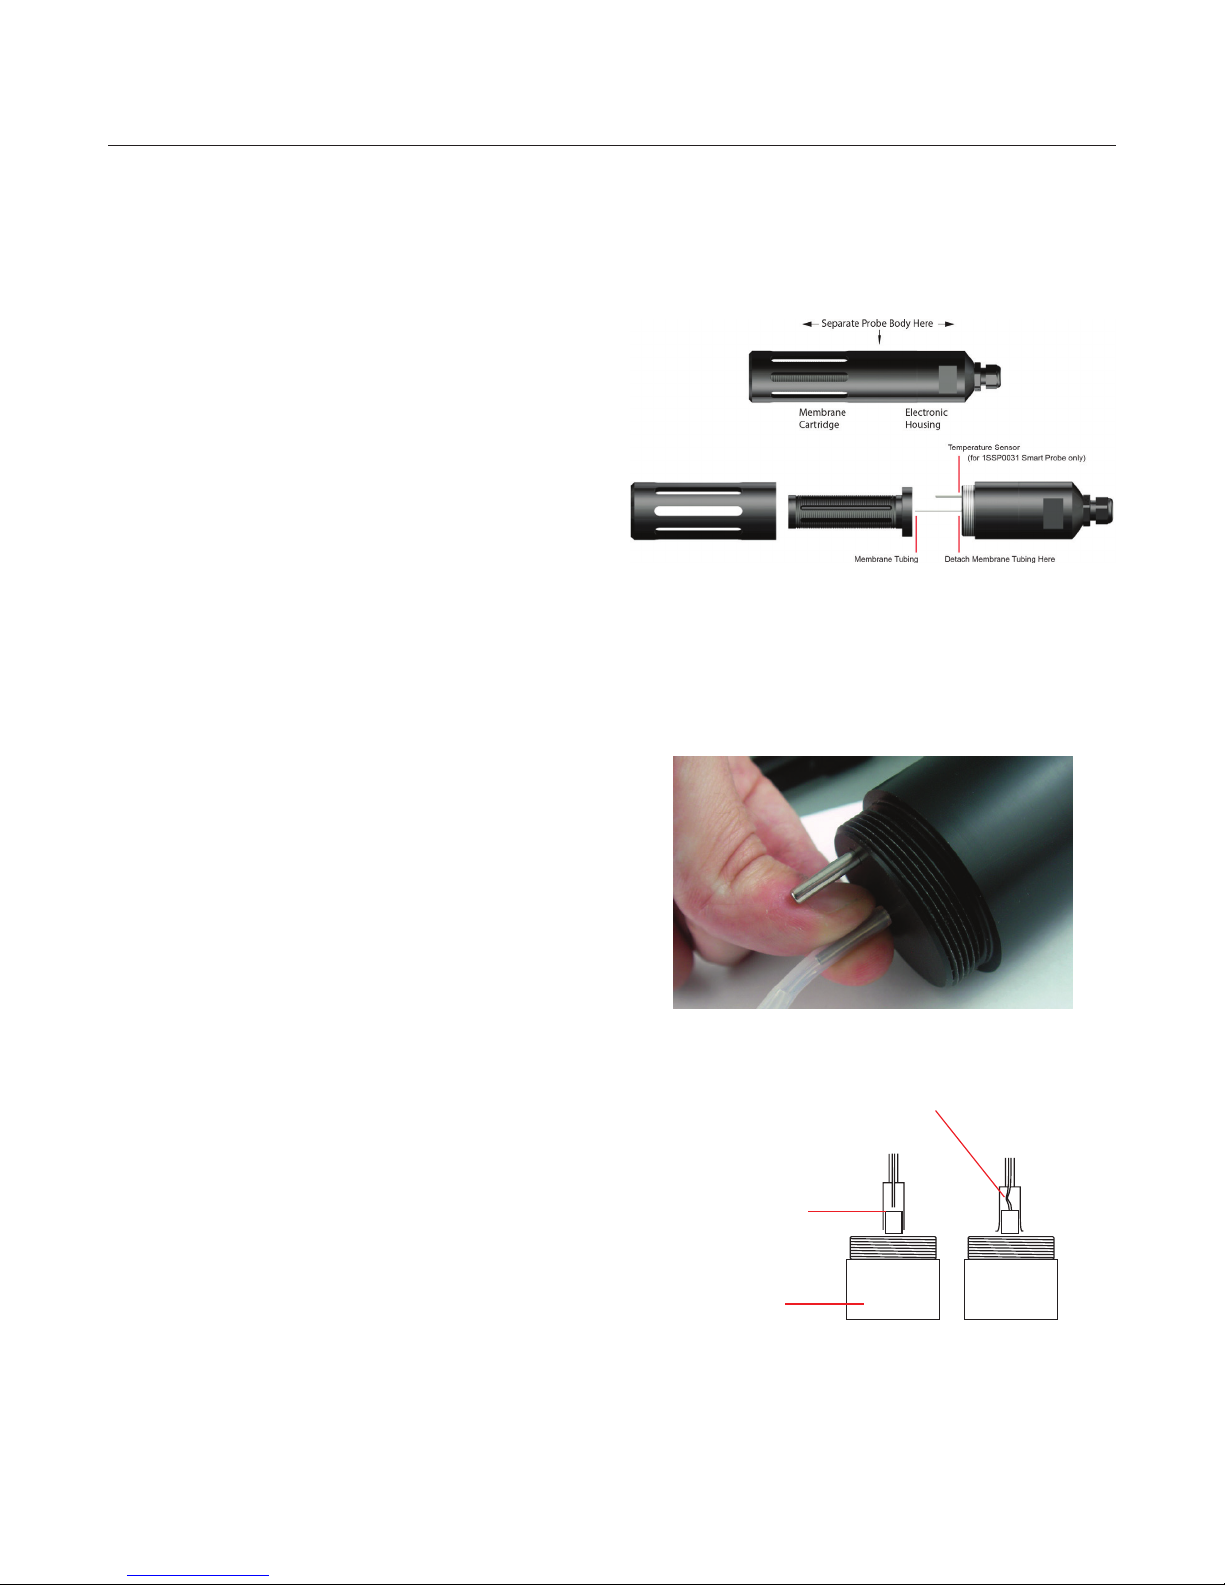
Step 1:
CAREFULLY unscrew the membrane cartridge from
the probe body. Be careful not to damage or stress
the ne membrane tube, which connects to the
pressure sensor in the electronics housing.
Step 2:
Pinch the head of the membrane tube; carefully
separate the membrane tubing from the sensor port
and set the now completely detached membrane
assembly aside.
2.4 CHANGING THE
MEMBRANE CARTRIDGE
Occasion may arise where the membrane tubing
becomes damaged resulting in erroneous readings.
This is typically displayed as a sharp increase in TGP
when the probe is in water with values that remain
high over time.
To x this issue, the membrane cartridge must
be replaced, or returned to Point Four Systems
for reconditioning. It is crucial that the probe not
remain in water as this can damage the sensor and
electronics within.
Use the following steps to change the membrane
cartridge:
NOTE: ENSURE THAT INNER SILASTIC TUBE HAS
NOT COLLAPSED! SEE IMAGE BELOW.
TGP cartridge
Probe Body
POINT FOUR TRACKER User’s Manual
Page 18
18
2.0 SERVICE & MAINTENANCE
Step 3:
Take the new membrane cartridge, and reassemble
the TGP probe in the reverse order of disassembly.
NOTE: IF POSSIBLE, APPLY SILICONE GREASE ON
THE MEMBRANE CARTRIDGE THREADS TO AVOID
THE PLASTIC BODY FROM SEIZING IN FUTURE
DISASSEMBLY.
WHEN ASSEMBLED, CHECK DOWN THE INSIDE
OF THE MEMBRANE CARTRIDGE TO ENSURE
THAT THE TUBING IS NOT KINKED.
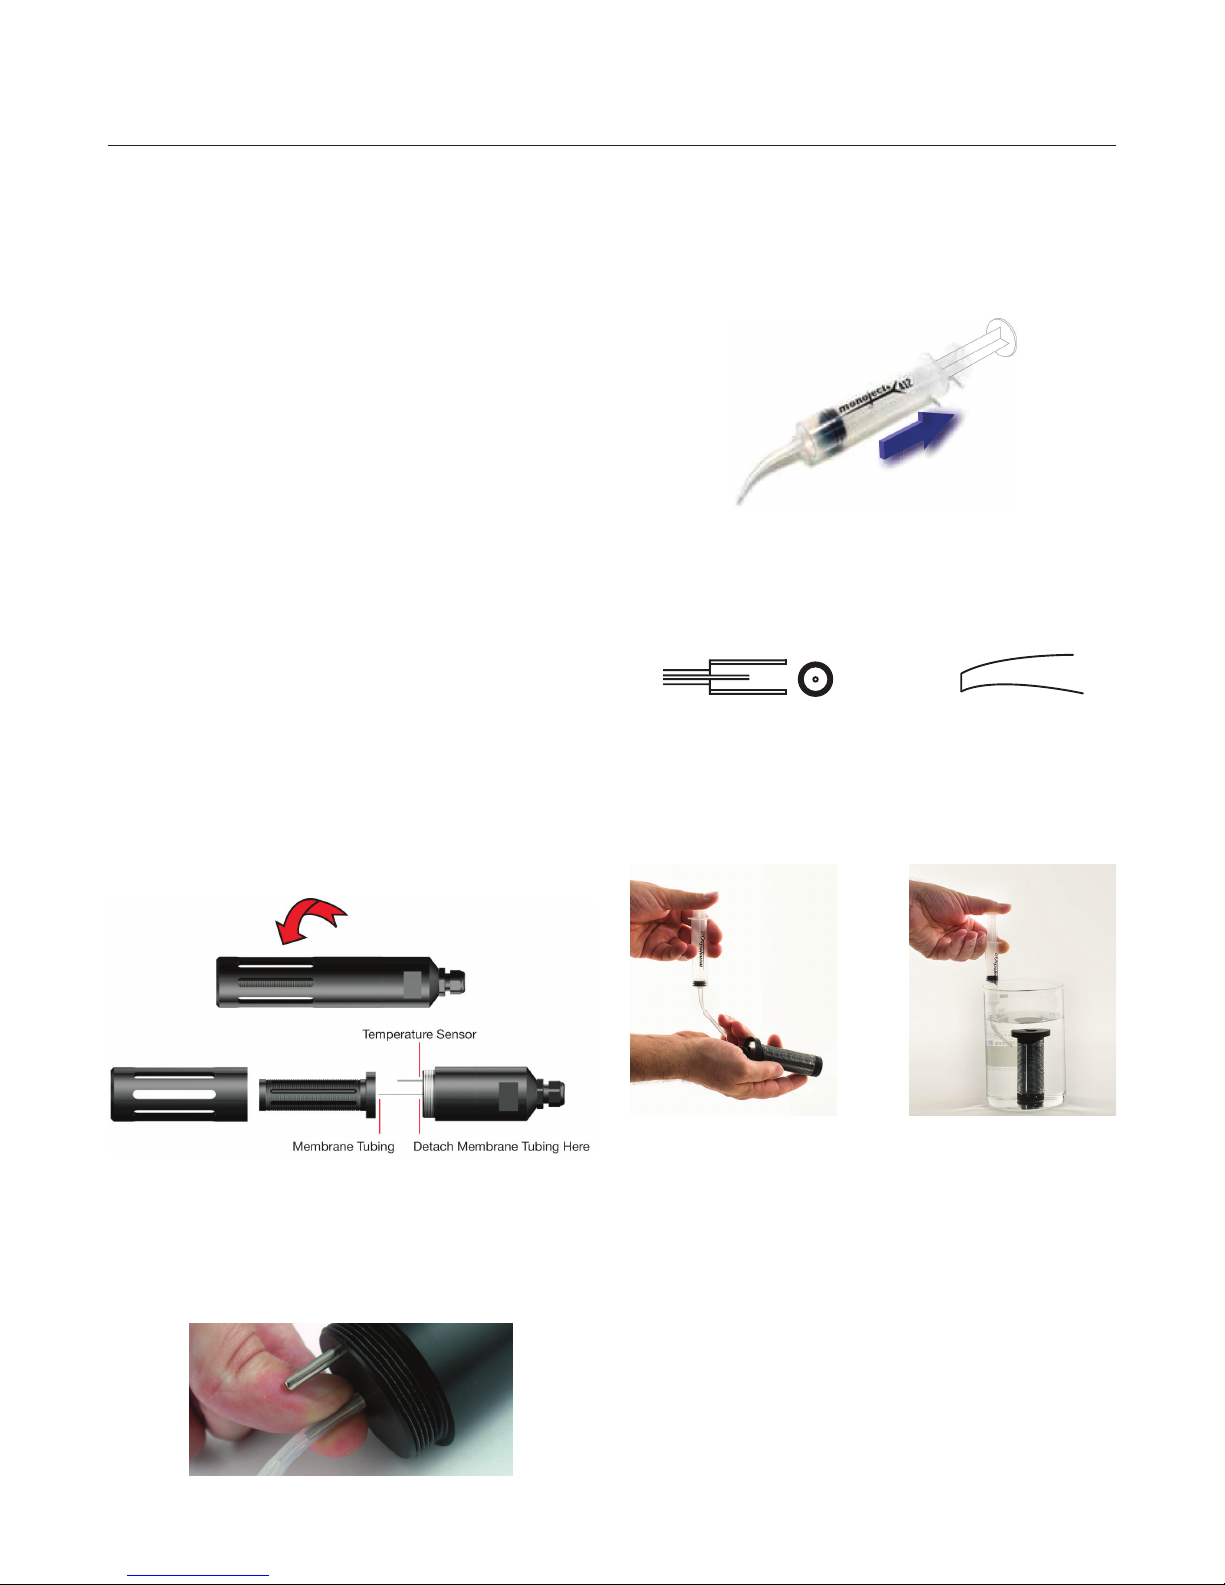
2.5 THE TGP SYRINGE TEST
The TGP Syringe Test is a simple and effective test
to determine:
If the Silastic tubing within the TGP cartridge is
damaged and needs to be replaced.
It can also be used to routinely check the functionality
of the TGP probe.
2.6 TESTING THE CARTRIDGE
Step 3:
Draw the plunger of the syringe half way back and
then attach the cartridge tubing to the end of the
syringe. Note: Do not slide the tubing more then
cartridge opening.
Step 4:
Attach the cartridge tubing to the end of the syringe.
[front view]
Note: Do not slide the tubing more then cartridge
opening.
Step 1:
Unscrew the cartridge from the TGP probe.
Step 2:
Disconnect the Silastic tubing from the probe sensor
by pinching the end of the tubing and gently sliding
it off.
5. Place the cartridge in a container of water and
GENTLY apply pressure to the plunger.
If resistance is felt in the syringe when pressed and
no bubbles appear from the cartridge when placed
underwater, there are no holes in the Silastic tubing.
This indicates that the unit is good.
If bubbles appear from the cartridge when placed
underwater, there are holes in the Silastic tubing.
This indicates that the unit needs to be replaced.
POINT FOUR TRACKER User’s Manual
Contact supplier for a replacement TGP Cartridge.
Page 19
2.0 SERVICE & MAINTENANCE
19
NOTE: IF POSSIBLE, APPLY SILICONE GREASE ON
THE MEMBRANE CARTRIDGE THREADS TO AVOID
THE PLASTIC BODY FROM SEIZING IN FUTURE
DISASSEMBLY.
WHEN ASSEMBLED, CHECK DOWN THE INSIDE
OF THE MEMBRANE CARTRIDGE TO ENSURE
THAT THE TUBING IS NOT KINKED.
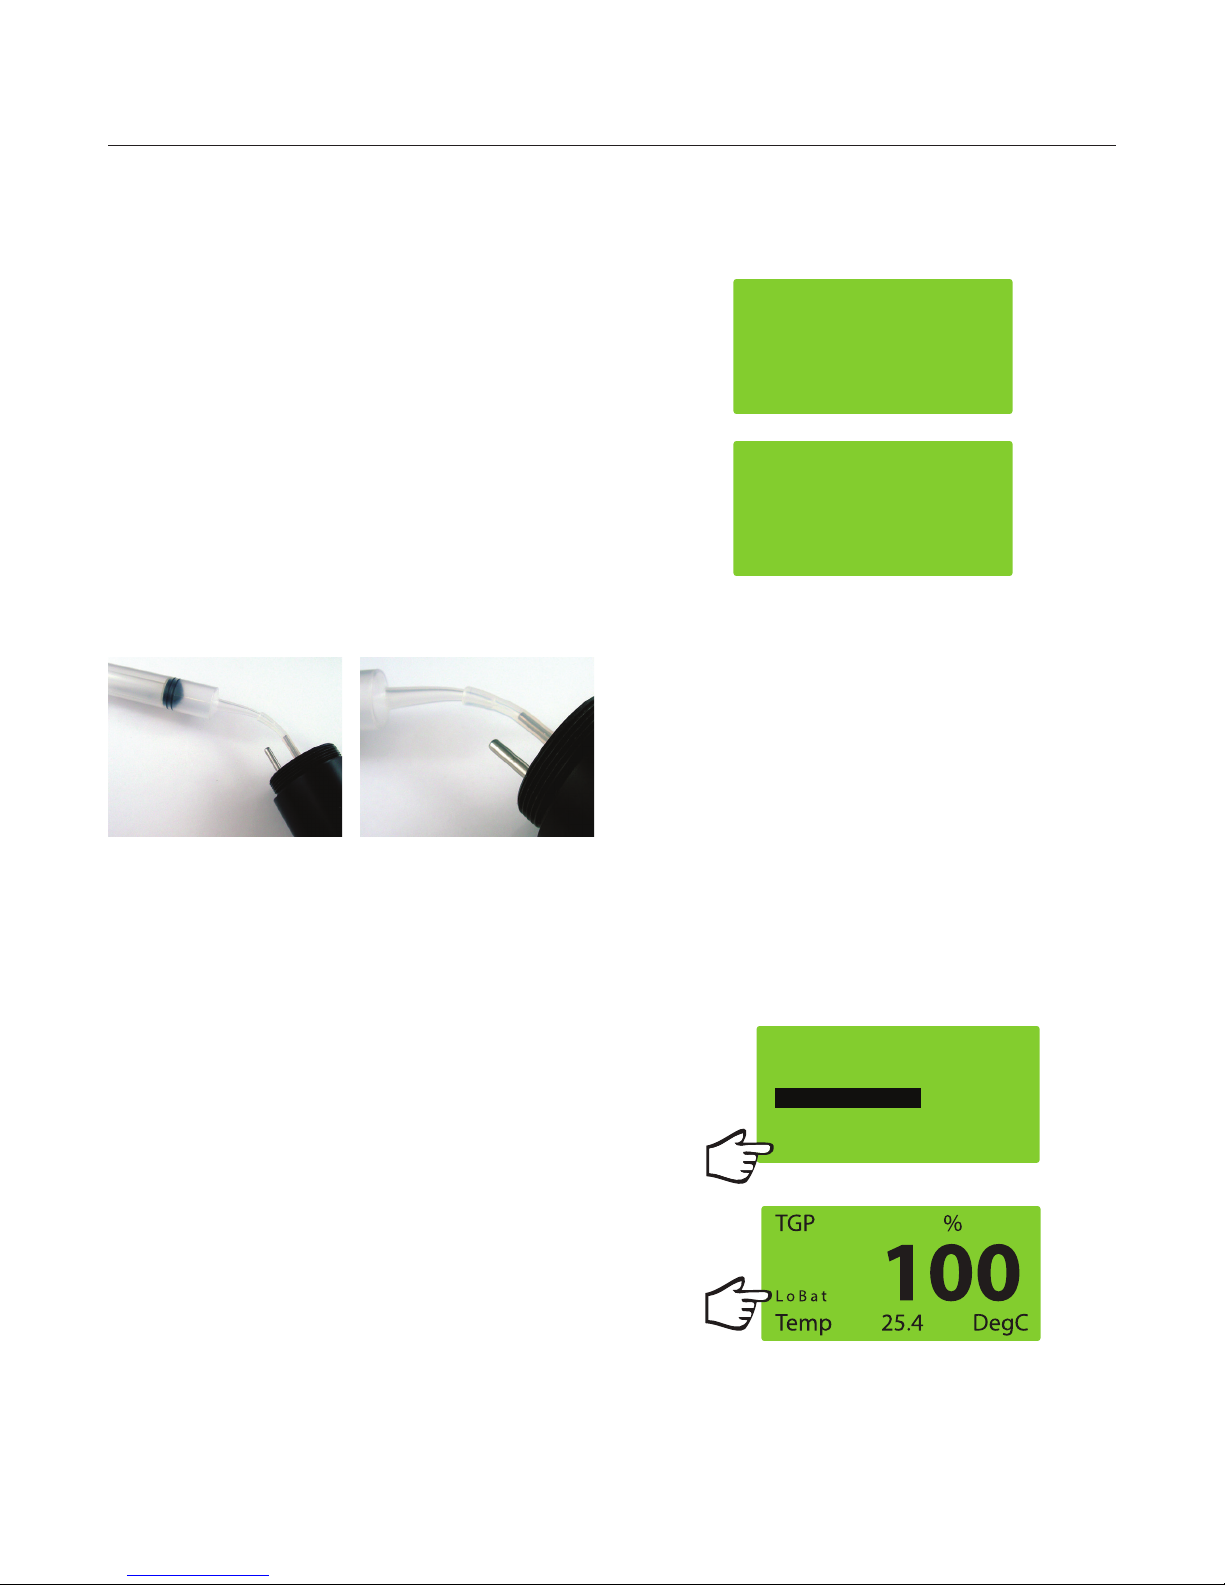
2.7 TESTING THE TGP PROBE
1. Remove TGP Cartridge from the TGP probe. Make
sure TGP Probe is still connected to the monitoring
device.
2. Draw the plunger of the syringe half way back.
3. Attach syringe to sensor port in the TGP probe
using the silicon tube that was supplied with the
syringe.
4. Apply pressure (push the plunger) or vacuum
(pull the plunger) with the syringe, and check the
displayed values. The reading should respond
accordingly. (I.E. When Applying pressure, the
TGP readings will increase and when applying a
vacuum, the TGP readings will decrease).
To conrm that charging is complete, attach the
probe (right 6-pin connector). With the charger
plugged in, press the “RIGHT ARROW” button twice.
The following screen will be displayed:
CHARGE STATUS
Charging
CHARGE STATUS
Charge Done
The screen will display the message “Charging”
until the battery is fully charged, at which point the
message will change to “Charge Done”. Total charge
time is approximately 2 hours (for a full charge).
To avoid discharging the battery, it is advisable to
keep the Tracker connected to the charger when it
is not in use, as Ni-MH batteries have a fairly high
discharge rate while in storage and will be fully
discharged in about 3 months if the Tracker is not
used.
The Tracker can be connected to the AC charger
at any time regardless of the amount of battery life
remaining, this will not compromise the performance
of the battery, as the Ni-MH battery within the Tracker
does not suffer from the memory effect.
When test has been concluded, remove syringe, reinstall cartridge, and recommission probe.
2.8 BATTERIES
The PT4 Tracker is powered by a rechargeable Ni-MH
battery, that supplies unit power for up to 70 hours
per charge.
To recharge the battery, attach the charger cable
(LEFT SIDE 4-PIN CONNECTOR) to the meter, and
insure that the correct wall plug connector is placed
on the charger (refer to section “Components”). The
meter will remain on while it is charging ( ashing the
message “No Probes Detected”).
MENU
CALIBRA T ION
S E T DISP CHs
S E T EXT C H
OPTIONS
D ATA L O G G E R
V b a t : 5 . 6 8
POINT FOUR TRACKER User’s Manual
Page 20

20
2.0 SERVICE & MAINTENANCE
*Note:
• Although the meter has been charged prior to
shipping, it is recommended that you fully charge
your meter prior to its rst use.
• Battery life of the Tracker is reduced depending on
the use of the backlight as well as when it is used in
extremely high or low temperatures (-5°C / +30°C).
• Store the Tracker in a cool, dry and well ventilated
place out of direct sunlight. The ambient temperature
should be kept below 30°C for long-term storage.
3.0 TROUBLESHOOTING
3.1 NORMAL PERIODIC USE
1. Display remains blank after pressing PWR.
a. Verify that the batteries are charged by
plugging in the Charger Adapter.
b. Hold the PWR down for a longer period of
time.
2. “ERROR NO PROBES DETECTED” appears on the
screen after pressing PWR.
a. Press PWR again to turn meter off.
• Prevent charging or using batteries in extremely
high or low temperatures (-5°C / +30°C).
• The Data Logging capacity of the Tracker
signicantly exceeds the battery life of the installed
battery (normally 70 hour battery life). For logging
periods over 100 hours connect the Tracker to the
supplied power supply or a supplementary battery
pack.
• A low battery will be indicated either by the Vbat
reading 4.0V or less (in the MENU display), or by the
main display showing the message “LoBat”.
3. Readings appear to be erroneous.
a. Insure that the probe is clean and not caked
with dirt or biofouling.
b. Verify that the battery has sufcient power
(“Vbat“ should be at least 4.00).
MENU
CALIBRA T ION
S E T DISP C Hs
S E T E X T C H
OPT IONS
D ATA L O GGER
Vbat : 5 . 6 8
b. Detach probe.
c. Verify that all four prongs on the connector
are intact and that no dirt is present.
i. If the prongs are damaged, contact
Pentair Technical Support.
ii. If dirt is present, clean with distilled water
and allow to dry prior to reattaching the
probe.
d. Firmly reattach probe to the meter.
e. Press PWR to turn meter on.
f. If message persists, contact Pentair Technical
Support.
POINT FOUR TRACKER User’s Manual
c. If readings persist, compare them with
expected values.
i. For temperature, verify value by placing
probe in an ice water bath.
ii. For TGP and BP, compare value with
weather ofce readings.
d. If a large, unexplained difference exists, the
meter may no longer be calibrated.
e. If the meter has been left in water (or
exposed to regular rain), the humidity may
have penetrated the tubing (this is inherent
to all existing TGP probes). Remove the
probe from the water and place in a dry area
for 24 hours. Then follow the calibration
instructions.
f. If readings persist, contact Pentair Technical
Support.
Page 21
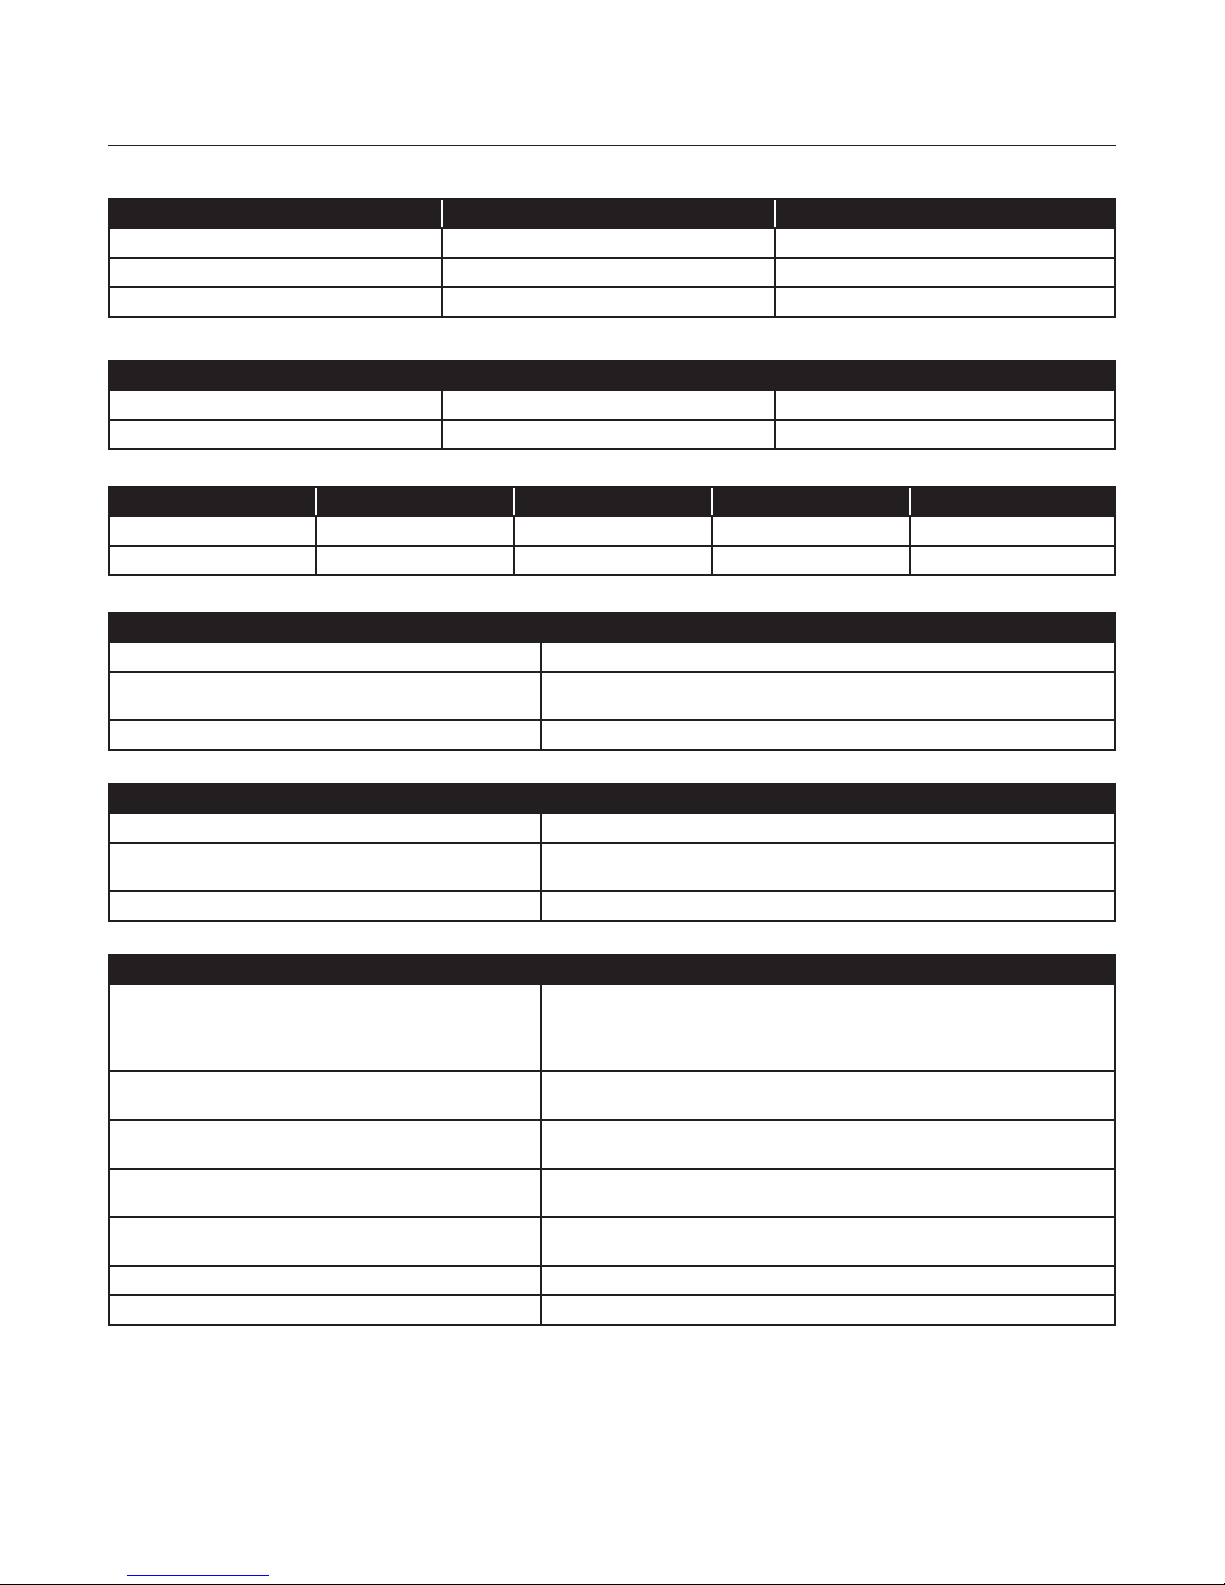
4.0 SPECIFICATIONS
General: Provides digital output of TGP probe measurements.
MEASURED MEASUREMENT RANGE RESOLUTION
Total Gas Pressure [TGP] 0–1550 mmHg 1 mmHg
Barometric Pressure [BP] 0–1550 mmHg 1 mmHg
Temperature [°C] 0.0–40 °C 0.2 °C
DERIVED
Total Gas Pressure [TGP] 0 - 200% 1%
ΔP [ TGP - BP] 1550 - 1550 mmHg 1 mmHg
PROBE DIMENSIONS LENGTH WIDTH HEIGHT DIAMETER
Probe 19 cm (7.4 in) — — 4.2 cm (1.6 in)
Handheld 16 cm (5.1 in) 8.5 cm (3.3 in) 3.2 cm (1.3 in) —
STORAGE
Temperature -10 °C to +60 °C, in factory container
Relative Humidity 5% to 85% RH at up to +40 °C
5% to 40% RH above +40 °C up to +60 °C
Altitude Up to 3,000 meters ( 10,000 feet)
21
OPERATION
Temperature 0 °C to 50 °C
Relative Humidity 5% to 85% RH at up to +40 °C
Altitude Up to 3,000 meters ( 10,000 feet)
PROPERTIES
Response Time Typical: 5 minutes (90%)
Power 4xAA NiMH rechargeable batteries/ 20 mA (backlight off), 30 mA (backlight
Battery Life (backlight off)
(backlight on)
Connector (Left Side Connector)
(Right Side Connector)
Probe Cable Std. 5 m (16.4 ft) four conductor, polyurethane jacketed, with custom
Charger Cable Std. 1.5 m (5 ft)
A/C Charger Adapter 100-240 VAC / 47-63Hz / 12 VDC, 0.85 Amp
Response time is improved by insuring there is water ow past the probe.
However, this is a passive measurement and therefore can require up to 1
hour for accurate measurements.
on). Includes battery charger and adapter.
NiMH cells: 70 hours
6 pin –IP68 rated connector (for probe and data transfer cable)
4 pin –IP68 rated connector (for charger cable)
lengths available on request.
5% to 40% RH above +40 °C up to +60 °C
45 hours
POINT FOUR TRACKER User’s Manual
Page 22

22
6.0 APPENDIX
6.1 ABOUT TGP
A Brief Discussion of Gas Bubble Disease, Dissolved
Gases and Techniques for Measurement
Brian G. D’Aoust
Common Sensing Inc.
Clark Fork ID, USA
Although Gas Bubble Disease was rather well
described by Marsh & Gorham the problem was
not well known to sh culturists and was often
“rediscovered” as facilities were expanded, built
in new locations, or otherwise altered through man
made or natural causes. More recently, increases in
“accelerated aquaculture” involving pumped water,
extra aeration and hyper oxygenation has also led
to severe outbreaks in numerous cases. Recognition
in the late 1960’s that the entire Columbia River in
the Northwest USA was supersaturated to levels
lethal to downstream migrant salmon focused
an unprecedented amount of attention on the
recognition, pathology, analysis and avoidance of
this condition. In like manner the current interest
in supplemental oxygen addition for purposes of
restoring water quality and/or increased production of
sh per volume of water has prompted development
of reliable and consistent techniques for monitoring
all relevant parameters.
The chief hazard in all systems for enhancing oxygen
concentration is that the total gas pressure, (TGP)
may exceed the sum of atmospheric and hydrostatic
pressure (due to the depth of the water column)
because of a lack of provision for removing enough
nitrogen in the water source to make up for the extra
oxygen added. In many situations, therefore, it is
desirable to monitor both oxygen and TGP (PT) or
percent saturation relative to atmospheric pressure.
6.2 UNDERSTANDING THE MEASUREMENT
To provide a basis for understanding the measurement
a summary of the relevant physics of gases
follows. Figures 1 to 5 present conceptual guides
to understanding the relationship between Total
Dissolved Gas Pressure (TGP), hydrostatic pressure,
gas solubility and gas partial pressure.
indicates the differences in actual gas content, i.e. the
number of molecules (expressed either as a weight
or volume) contained in a given weight or volume of
water at equilibrium at two different temperatures,
0.0ºC and 20.0ºC.
Total Dissolved Gas Pressure (TGP) = Barometric
Pressure + ΔP
ΔP = TGP – BP
or
[O2] = pO2 x β OXYGEN, TEMP
Where: β OXYGEN, TEMP is the solubility of
oxygen at temperature “T”
β OXYGEN, 0ºC = 49.1 ml/L
β OXYGEN, 20ºC = 31.05 ml/L
Where: β OXYGEN, TEMP is the solubility
of oxygen at temperature “T”
β OXYGEN, 0ºC = 49.1 ml/L
β OXYGEN, 20ºC = 31.05 ml/L
The example serves to illustrate the convenience of
using pressure as a measure of saturation state rather
than content or concentration, which then requires
the use of solubility coefcients.
The habit of using content or concentration to
describe the amount of any particular constituent
in water, while intuitive, does not lend itself as
readily to understanding cases that involve gas
supersaturation.
On the other hand, as is shown in Figure 1, the %
concentration of each gas in air expressed as
either pressure, volume or mole – fraction has
direct equivalency to pressure measurement and
therefore provides simpler calculations and clearer
understanding of what is being measured.
6.3 DEFINITIONS
These are denitions used in discussing dissolved
gas saturation in Aquaculture and Fisheries. The
symbol “β” (Beta) represents the solubility coefcient
of a gas at temperature “T”. The following example
POINT FOUR TRACKER User’s Manual
Page 23
6.0 APPENDIX
GAS MOLE FR
PRESSURE FR
SAMPLE MEASURMENT
23
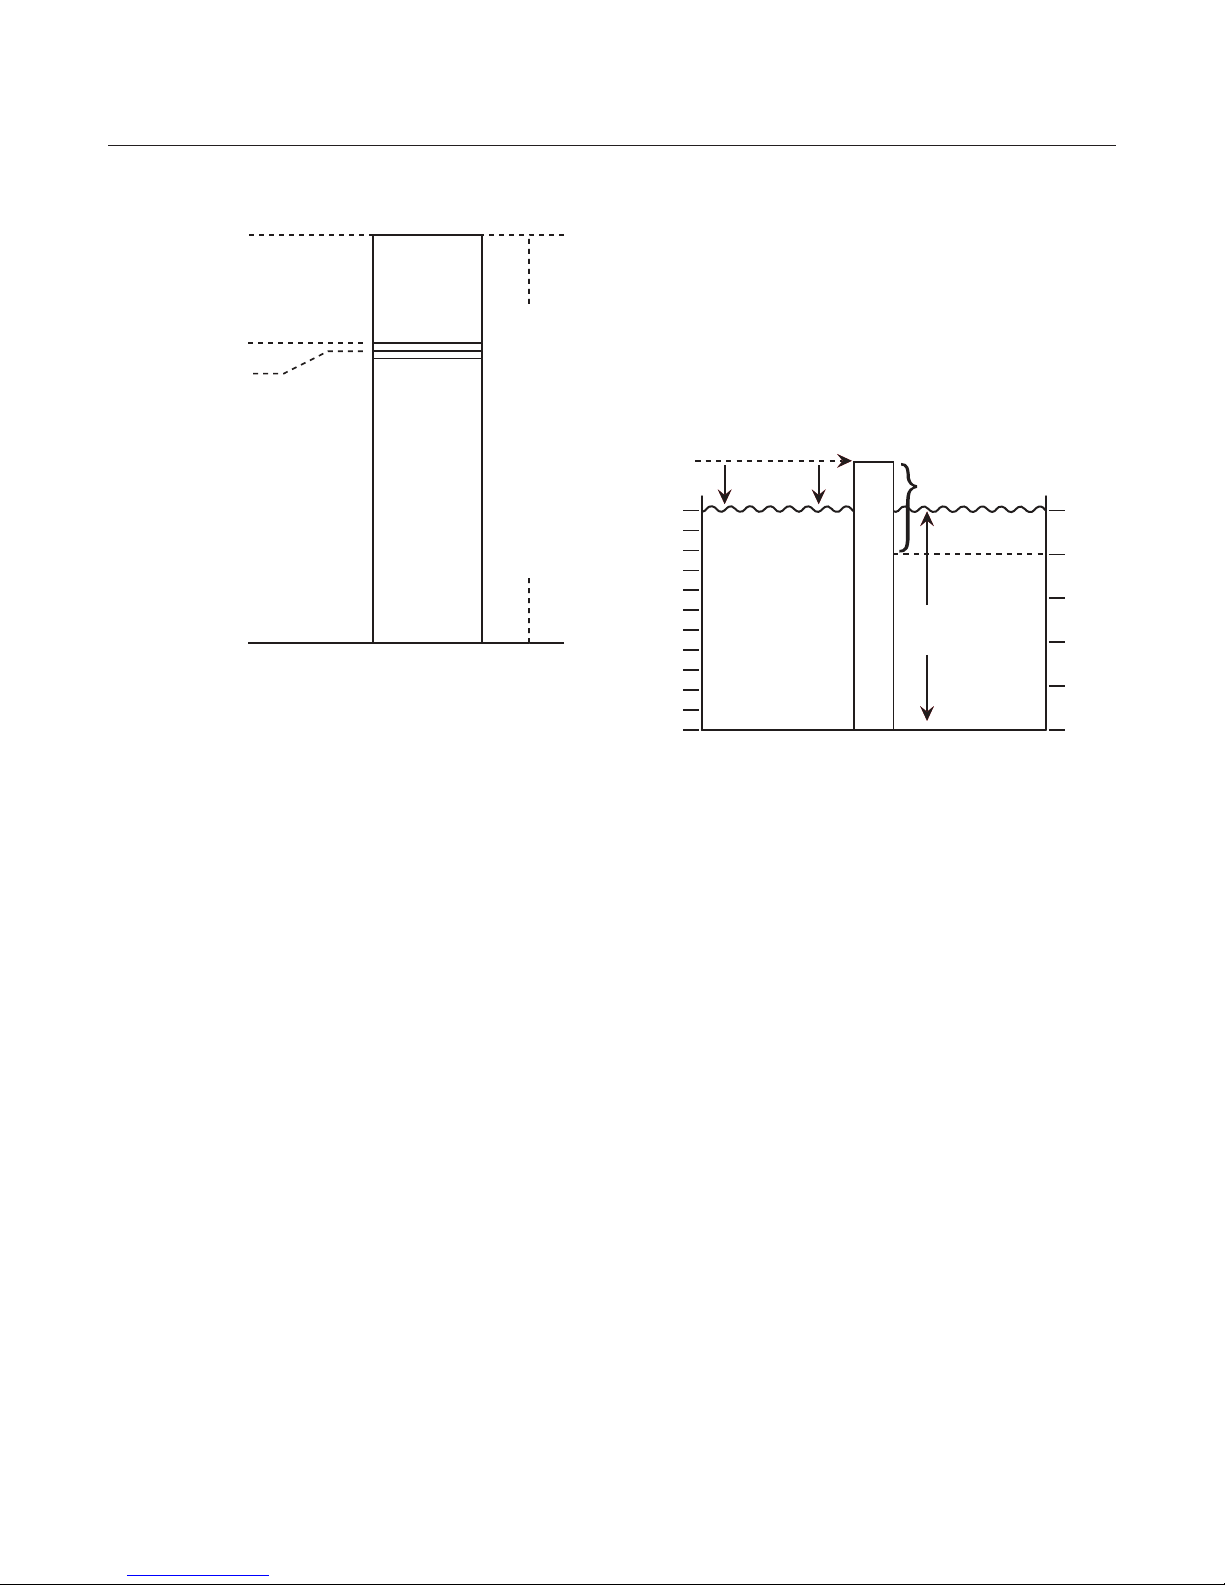
Figure 1: % by volume, mole and pressure fraction of
constituents of air.
- 760 mmHg
P
T
PT - pO
PT - pO2- pH
20.94%pO
2
O
2
79.03%
2
[
ACTION
ACTION
pN
+ Ar
2
[
PRECENT VOLUME
The percent by volume, mole fraction and pressure
fraction of the constituents of air shown as a bar graph.
On the left of the graph the successive subtraction of
oxygen, then oxygen and water vapor from the total
pressure, PT shows the relative accuracy that can be
realized by simultaneous measurement of total gas
pressure and oxygen. Nitrogen and argon are treated
as one inert gas, since argon bears a constant ratio
to nitrogen and is approximately 0.94% in dry air. The
pressure of C02 varies in air but is negligible for our
purposes (about 0.031%).
6.4 COMPENSATION DEPTH
In converting the %Sat to ΔP – the difference between
the TGP or PT and BP (Barometric Pressure), it
is convenient to think in terms of 1.0% saturation
increments. For example, when at a higher altitude
where the Barometric pressure is, say, 700 mmHg at
about 2000 ft (615 m) Above Mean Sea Level (AMSL)
each 1.0% saturation would be represented by 7.00
mmHg,
Figure 2: Relation of equilibrium, percent saturation
and depth
120%
1.0 Atm
100%
150%
Figure 2 shows the relationship of equilibrium
percent saturation and depth. The bar graph shows a
hypothetical measurement of 120 %sat, and the ΔP
that this represents. The depth at which this ΔP would
be balanced by the hydrostatic pressure is shown as
approximately two meters in fresh water. On the left,
the increasing total dissolved gas pressure (shown
on the ordinate as “Percent Saturation”) is allowed
by an increase in depth. Depth increments are 22.35
mmHg/foot (73.8 mmHg/meter) of fresh water.
22.35 mmHg/ft
73.8 mmHg/m
ΔP= 0.2Atm
DEPTH TO
COMPENSATE
0.2 Alm ΔP
34 ft
10.3 m
0
2
4
METERS
6
8
10.3200%
A simple way to assess the impact on your sh of
a given level of supersaturation is to think in terms
of the compensation depth, which is the depth (i.e.
hydrostatic pressure) below which bubbles cannot
form. This is illustrated in Figure 2. The compensation
depth is easily calculated by dividing the ΔP by the
pressure-per-depth factor (22.4 mmHg/foot of fresh
water or 73.8 mmHg/meter of fresh water).
For example in Figure 2, 120% saturation (at sea level)
means a ΔP of 152.0 mmHg. Dividing this number by
22.4 mmHg/ft gives a compensation depth of 6.8ft or
approximately 2 meters. If sh are always kept below
this limit, they will not be susceptible to Gas Bubble
Disease, because bubbles cannot form below this
depth.
POINT FOUR TRACKER User’s Manual
Page 24
24
6.0 APPENDIX
Reference to Table 1 indicates the standard
Barometric pressure at different altitudes; for
intermediate altitudes not listed in Table 3, taking an
average between the two nearest altitudes will be
sufciently accurate. To continue the example then,
a reading of, say 115% Sat at 2000 ft (615 m) AMSL
would represent a ΔP of approximately 15 x 7.066
mm = 106 mmHg. This estimate can be further used
then, to check what expected oxygen partial pressure
would be encountered in the water by reference to
Figure 1, which indicates the percentage of O2 in
the atmosphere as 20.94% or a fraction of 0.2094. In
other words assuming that the water is in equilibrium
with air (but supersaturated) the proportion of the
“DELTA-P” due to oxygen can be estimated as: 106
mmHg TGP x .2094 = 22.2 mmHg. Reference to Table
1 will then allow estimating the oxygen content in
ppm or mg/L.
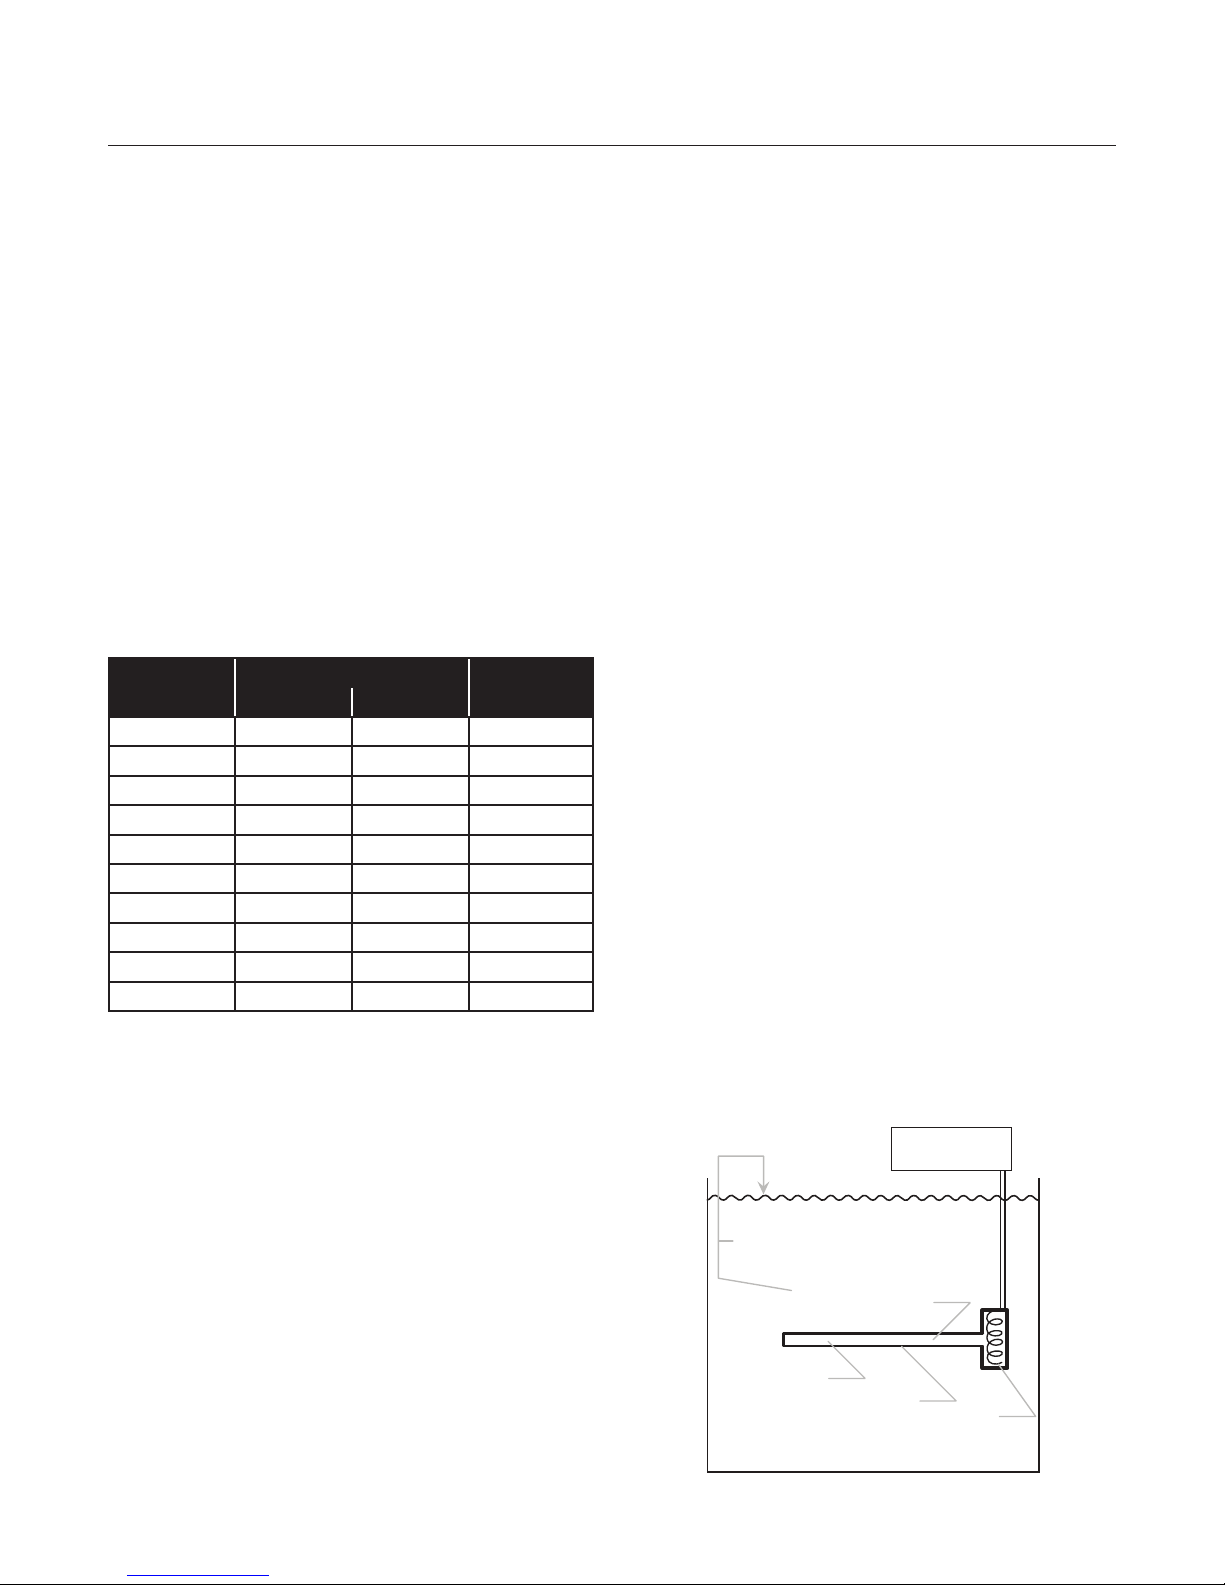
TABLE 1: Standard Atmospheric Pressure Values
Feet (Meters)
AMSL
16,000 (4,923) 16.21 411.7 -17
14,000 (4,308) 17.57 446.3 -13
12,000 (3,692) 19.03 483.4 -9
10,000 (3,077) 20.58 522.7 -5
8,000 (2,462) 22.22 564.4 -1
6,000 (1,846) 23.98 609.1 3
4,000 (1,231) 25.84 656.3 7
2,000 (615) 27.81 706.6 11
1,000 (308) 28.86 733.0 13
SEA LEVEL 29.92 760.0 15
Pressure
Temp (ºC)inchHg mmHg
The value of the constants for oxygen are:
Al = -58.3877 Bl = -0.034892
A2 = 85.8079 B2 = 0.015568
A3 = 23.8439 B3 = -0.0019387
Thus
ln β = -58.3877+85.8079(l00/T)+23.8439
ln(T/l00)+S%[-0.034892+0.015568(T/l00)-B3(T/l00)2]
Multiplying the value of β, which is in units of Litters
gas STP/Litter water, by the partial pressure in mm Hg
x 1000/760 gives the volume of dissolved gas in ml/
Litter STP; a further correction for molecular weight
and molar volume gives the concentration of oxygen
in mg atoms or parts per million (ppm)
Thus, [02] ppm. = p02 (mmHg) x β x 31.9988 x
1000/ 760 x 22.414
Without an oxygen reading, this approach allows a
good estimate of the oxygen content, however, there
are many situations where air equilibrium will not
hold, such as well water which is often essentially
anaerobic, or pumped storage water where air may
have been trapped for some time. It is important to
keep in mind what is being measured by the TDG
meter. The schematized illustration in Figure 3 shows
the tubing connected to a pressure sensor, which
“sees” a pressure inside the tubing, which is the
result of the sum of the partial pressures of all gases
present as shown in Figure 1. Only if one can assume
air equilibrium, or that air is the only gas mixture
present, can you make any conclusions about the
constituent gases in the manner done above.
For example in Figure 2, 120% saturation (at sea
level) means a ΔP of 152.0 mmHg. Dividing Partial
Pressure to ppm
To make the conversion from partial pressure to
ppm, the following equation from Weiss, 1970 can
be used to calculate the desired result. The equation
evaluates the natural log (ln) of the Bunsen solubility
coefcient, “β3” (alpha3) in some texts or β in Weiss
(1970), as a function of temperature and salinity using
three constants for temperature and three for salinity:
ln β = Al + A2(l00/T) + A3 ln(T/l00) + S%. [Bl + B2(T/
l00) +]B3(T/lOO)2]
where A’s and B’s are constants, T is the absolute
temperature in Kelvin (°C + 273.15)
S%. is salinity in per mil.
POINT FOUR TRACKER User’s Manual
Figure 3: Schematic diagram of the direct
measurement of TGP
760 mmHg
PT = pN
*
+ pO2 + pH2O + CO
2
Total Dissolved
[
Gas Pressure
2
[
Gas Phase
Membrane
Sensor
*
Includes Argon
Page 25
6.0 APPENDIX
25
In gure 3, the surface of the water is subjected to
the partial pressures of all atmospheric gases, which
add up to PT or 1.0 Atmosphere (760 mm Hg, 14.7
psi, 29.92 inches of mercury etc). An articial gas
phase shown as the long tubing in cross section is
connected to a pressure sensor, which can read out
in any units desired.
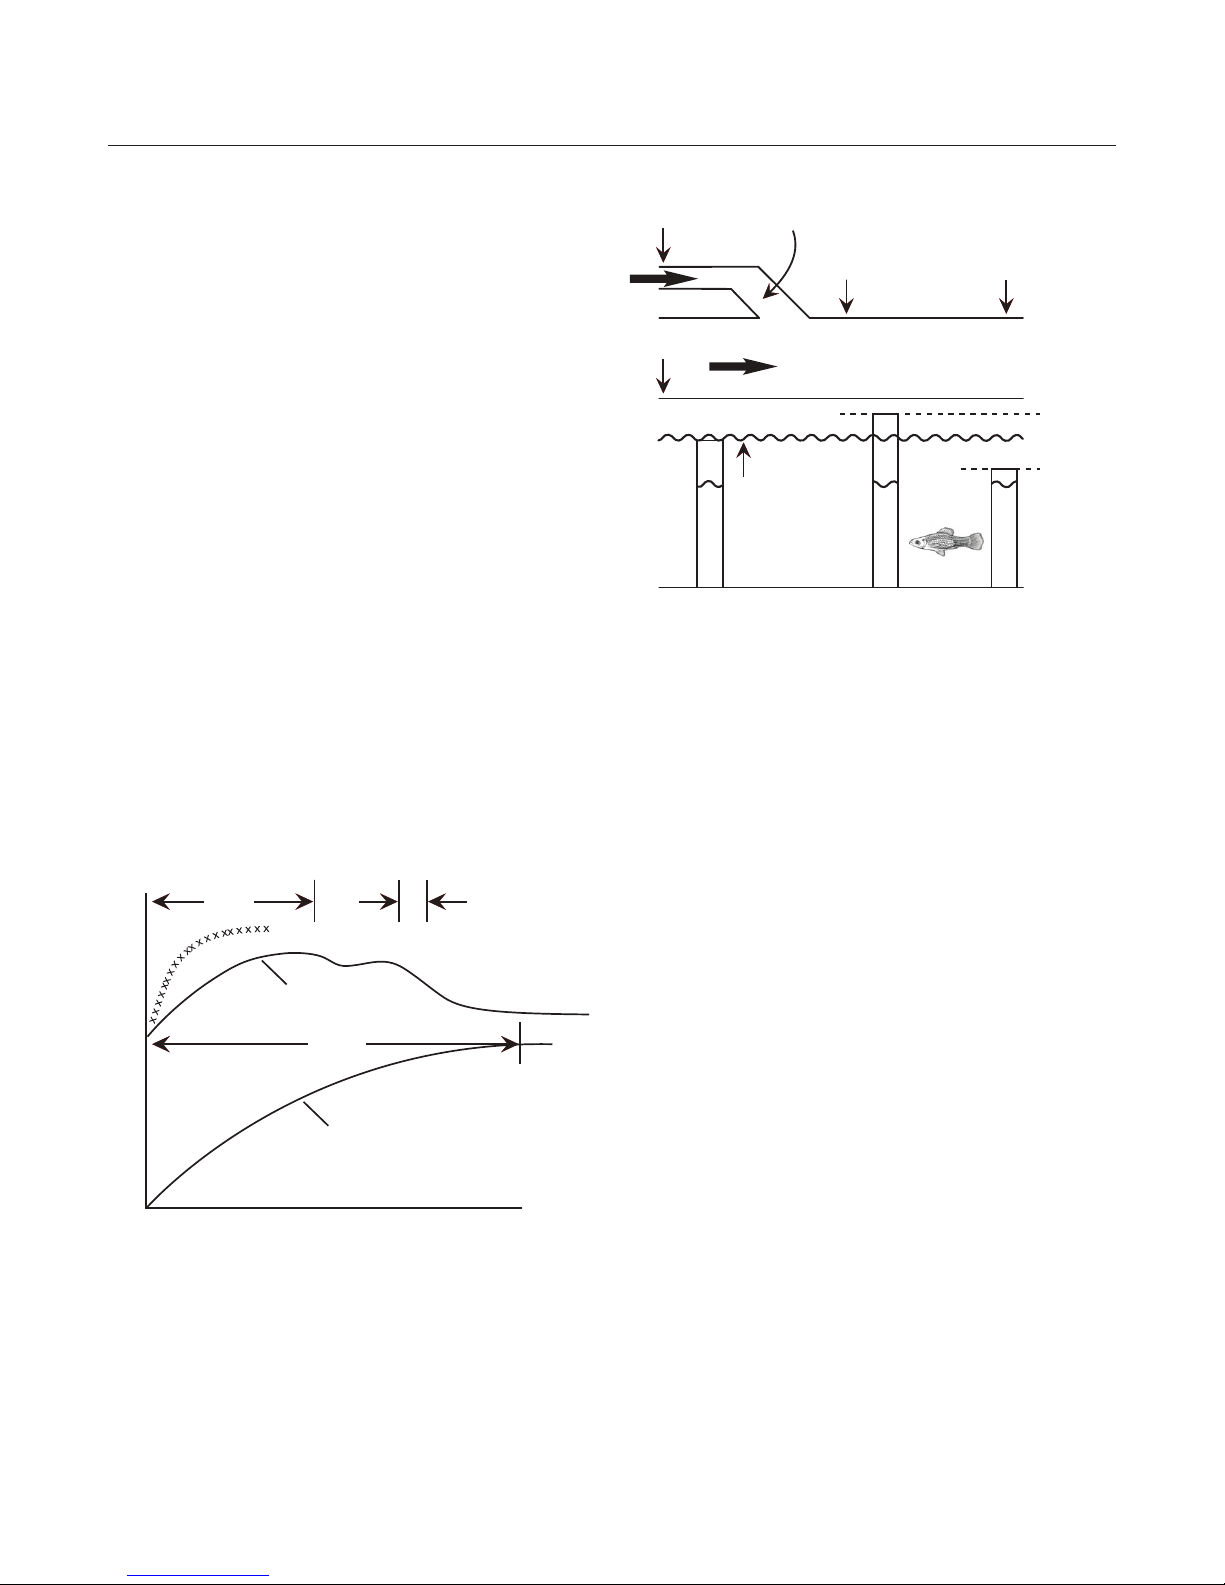
Keep in mind also that each time the sensor is
moved to another location, or removed and put back
in the same location, you are “starting over” on the
process of equilibration of the volume in the tubing
shown schematically in Figure 3. This process of
equilibration in the probe is shown in Figure 4. The
small “x’s” illustrate the equilibration with the fastest
tubing. The effect of temperature is illustrated with
the curves taken on the same probe at 38.0 and 8.0ºC.
When using the TGP meter to check various water
systems it is important to secure samples at a number
of locations in the system to get an idea of the
processes of increasing and decreasing saturation
that are occurring. An illustration of an intensive
aquaculture set up –where oxygen is being added
is shown in Figure 5. The labels “M” show different
points in this hypothetical system where minimal
sampling is advisable.
Figure 5:
M
M
High O
Main Strean
O
2
PT = 760 mmHg
or 1.0 Atm
N
2
2
M
M
Mix
}
O
ΔP
2
N
2
N
ΔPO
}
2
2
Figure 4:
% SATURATION
38.0
o
C
12.0 min
8.0
nim0.1nim 0.5
o
C
POINT FOUR TRACKER User’s Manual
Page 26
26
6.0 APPENDIX
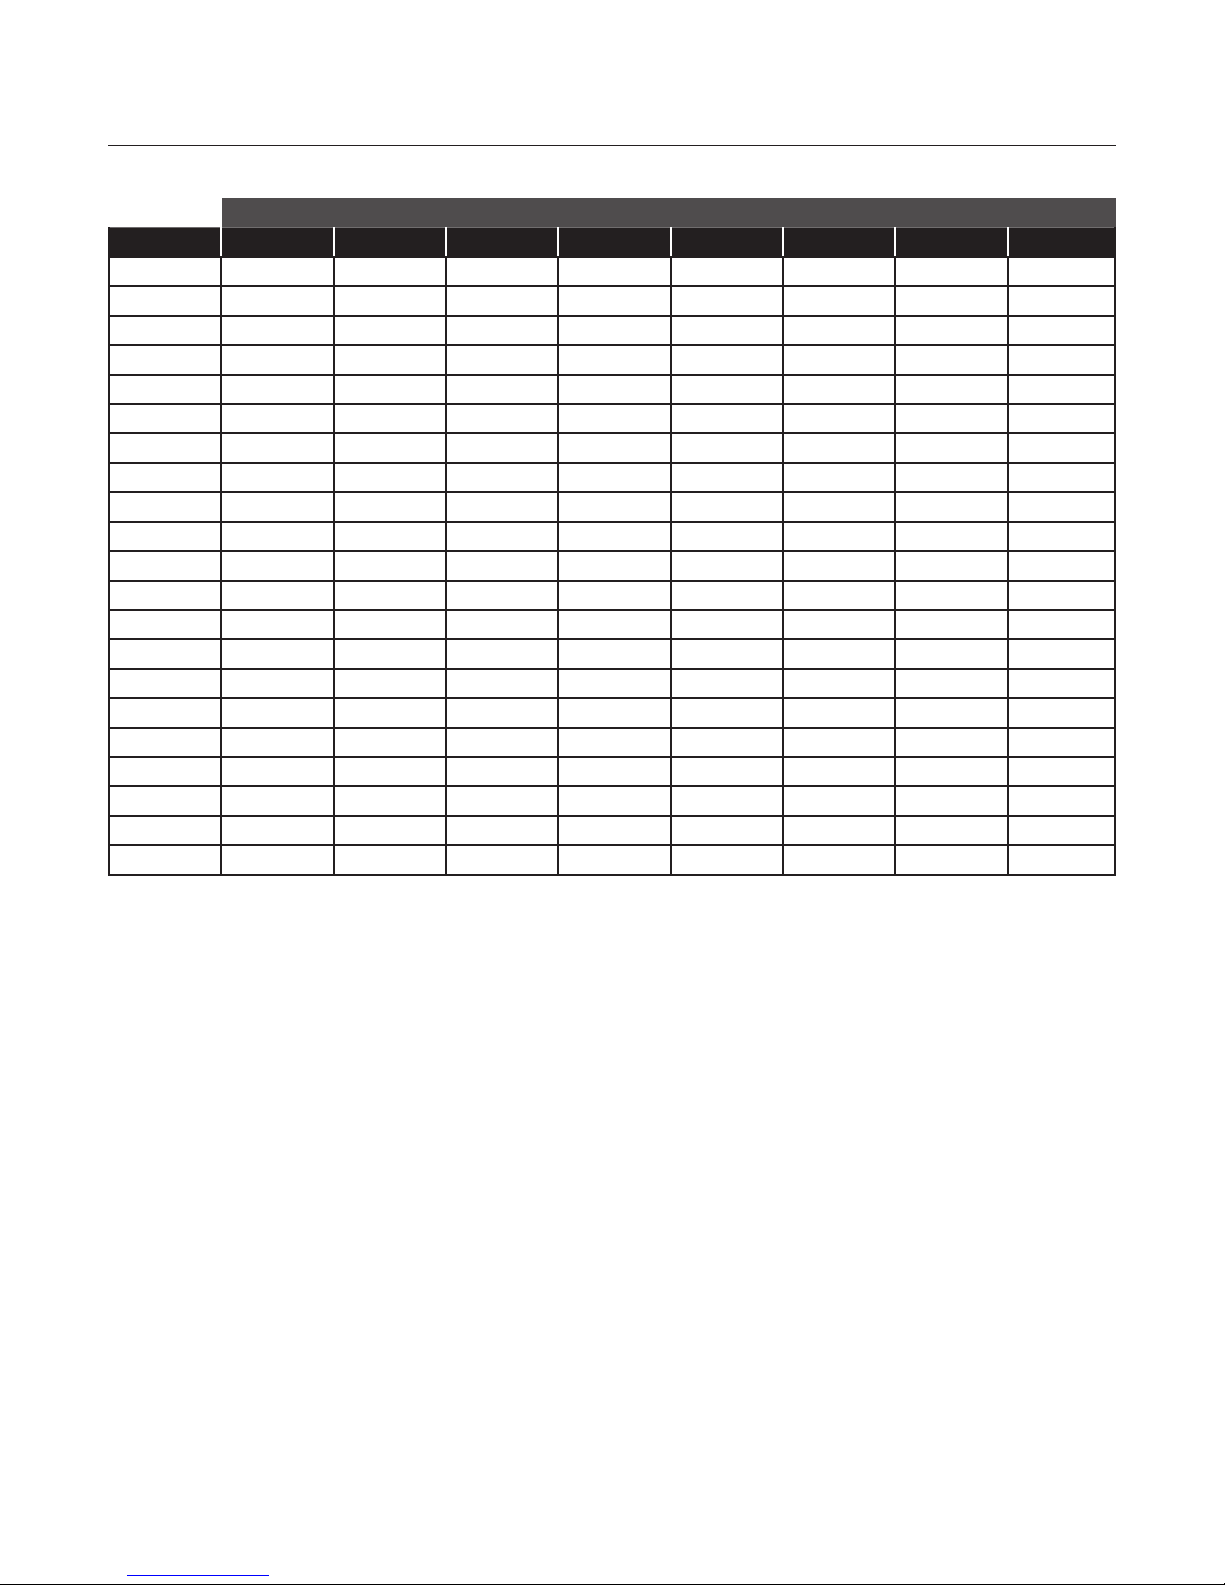
TABLE 2: PCO2 values for pH and carbonate alkalinity (fresh water, 10ºC)
CARBONATE AKALINITY
pH 600 500 400 300 200 150 75 25
6.0 61.4 51.4 41.1 30.8 20.6 15.4 7.7 2.6
6.1 57.6 48.0 38.4 28.8 19.2 14.4 7.2 2.4
6.2 53.2 44.3 35.5 26.6 17.7 13.3 6.7 2.2
6.3 48.5 40.4 32.4 24.3 16.2 12.1 6.1 2.0
6.4 43.7 36.4 29.1 21.9 14.6 10.9 5.5 1.8
6.5 38.0 32.3 25.9 19.4 12.9 9.7 4.8 1.6
6.6 34.0 28.4 22.7 17.0 11.3 8.5 4.2 1.4
6.7 29.5 24.6 19.7 14.8 9.8 7.4 3.7 1.2
6.8 25.2 21.0 16.8 12.6 8.5 6.3 3.2 1.1
6.9 21.3 17.8 14.2 10.7 7.1 5.3 2.7 0.9
7.0 17.9 70.5 11.9 8.9 5.9 4.5 2.2 0.7
7.1 14.8 12.3 9.9 7.4 4.9 3.7 1.9 0.6
7.2 12.3 10.2 8.2 6.1 4.1 3.1 1.5 0.5
7.3 10.0 8.3 6.7 5.0 3.3 2.5 1.3 0.4
7.4 8.2 6.8 5.4 4.1 2.7 2.0 1.0 0.3
7.5 6.6 5.5 4.4 3.3 2.2 1.6 0.8 0.3
7.6 5.3 4.5 3.6 2.7 1.8 1.3 0.7 0.2
7.7 4.3 3.6 2.9 2.1 1.4 1.1 0.5 0.2
7.8 3.5 2.9 2.3 1.7 1.2 0.9 0.4 0.1
7.9 2.7 2.3 1.8 1.4 0.9 0.7 0.3 0.1
8.0 2.2 1.8 1.5 1.1 0.7 0.6 0.3 0.1
*This assumes a CO2 solubility value (CO2) of 1.194 1/L and a pK’ for H2CO3 of 6.428 at 10ºC.
POINT FOUR TRACKER User’s Manual
Page 27
6.0 APPENDIX
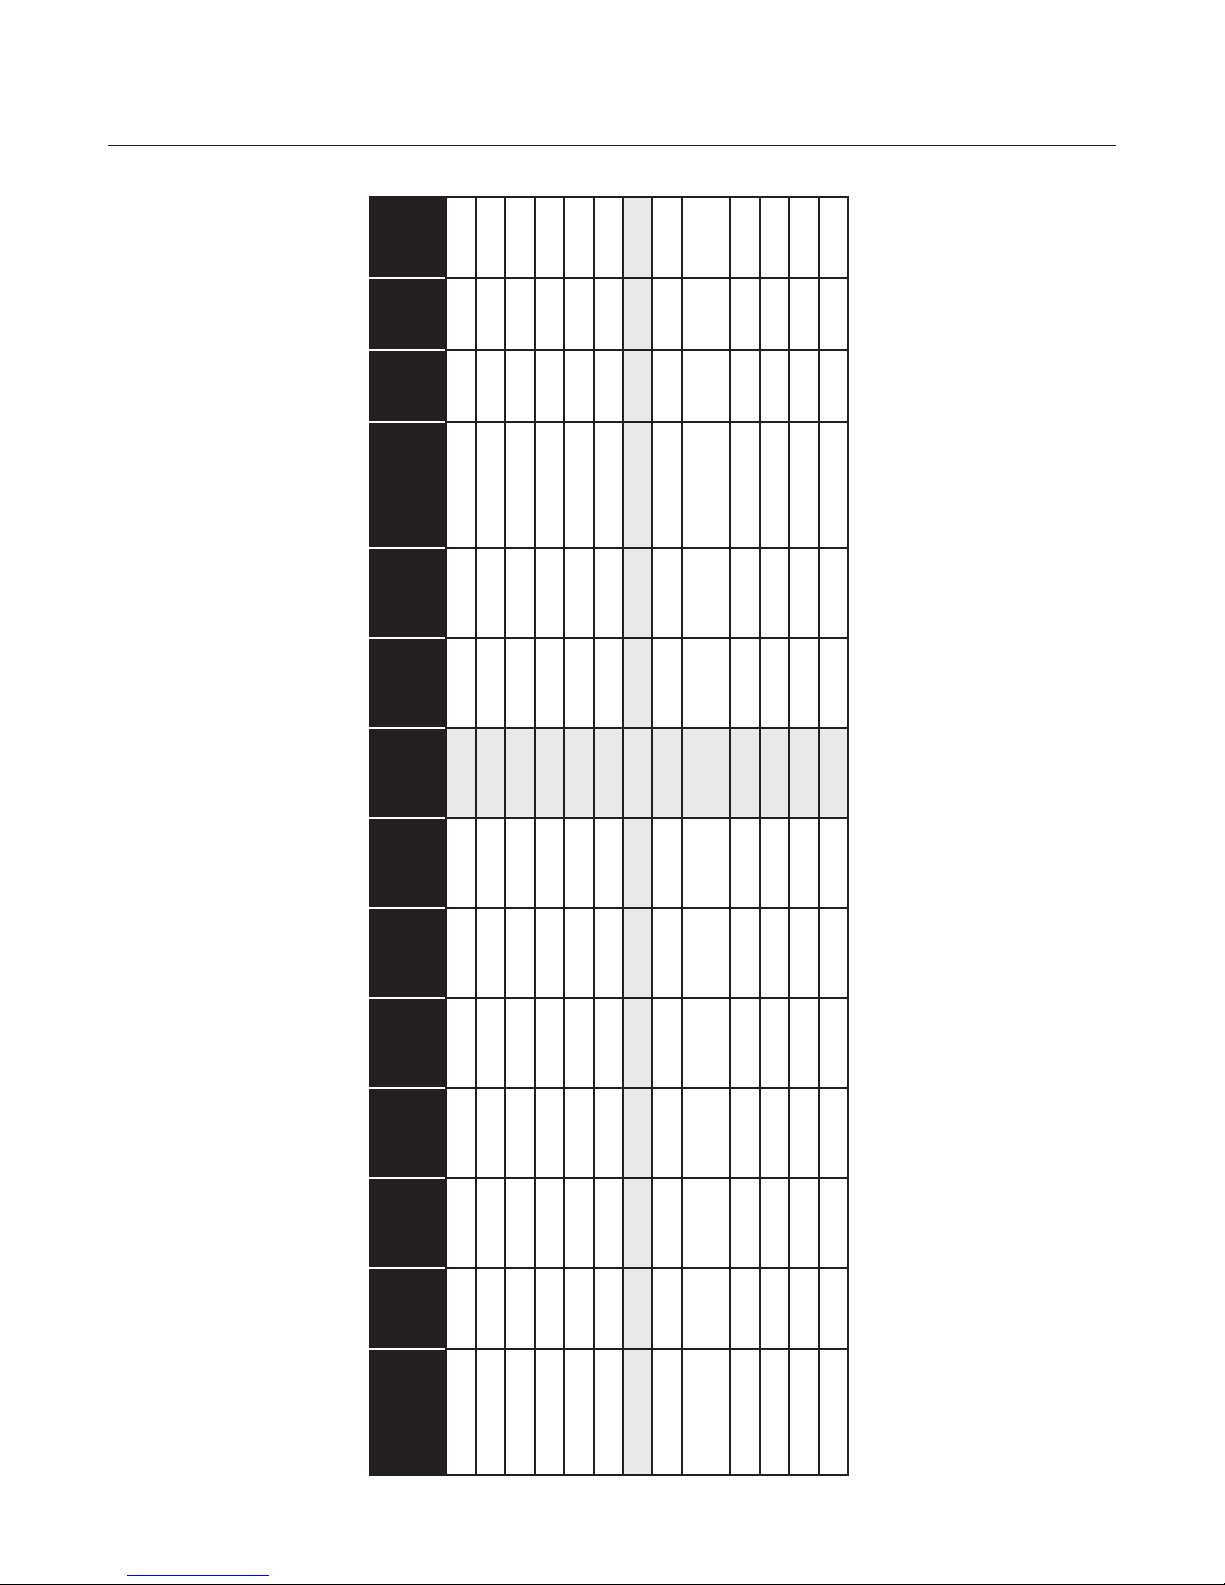
TABLE 3: Pressure Conversions
PER
INCH ATMOSPHERES BAR MBAR MPA
SQUARE
OUNCES
27
O
2
OF H
INCHES
HG
MM OF
OF HG
INCHES
O
2
H
FEET OF
O
2
H
CM OF
2
psi 1 6.89476 0.07031 70.30693 2.306723 2.03602 51.71486 27.68068 16 0.06805 0.06895 68.948 0.00689
DESIGNATION PSI KPA KG/CM
kPa 0.14504 1 0.01020 10.19745 0.334562 0.29530 7.50061 4.01472 2.32060 0.00967 0.01 10 0.001
kg/cm2 14.22334 98.06694 1 1000.026 32.80931 28.95901 735.5588 393.71181 227.5735 0.96784 0.98066 1013.3 0.09806
cm of H2O 0.01422 0.09806 0.00100 1 0.032808 0.02896 0.735537 0.3937 0.22757 0.00097 0.00098 0.9806 0.00098
feet of H2O 0.43352 2.96896 0.03048 30.48 1 0.88265 22.4192 12 6.93624 0.02950 0.02969 29.689 0.00298
inches of Hg 0.49115 3.38639 0.03453 34.53253 1.132957 1 25.4 13.59548 7.85847 0.03342 0.03386 33.864 0.00386
mm of Hg 0.01934 0.13332 0.00136 1.35955 0.04460 0.03937 1 0.53526 0.30939 0.00132 0.00133 1.3332 0.00013
inches of H2O 0.03613 0.24908 0.00254 2.54 0.08333 0.07355 1.86827 1 0.57802 0.00246 0.00249 2.4909 0.00025
0.0625 0.43092 0.00439 4.394308 0.14417 0.12725 3.23218 1.73004 1 0.00425 0.00431 4.309 0.000431
ounces per
square inch
atmospheres 14.696 101.3254 1.03323 1033.263 33.8995 29.9213 760 406.794 235.136 1 1.01325 1013.3 0.1013
bar 14.5038 100 1.01972 1019.747 33.4833 29.53 750.0626 401.8596 232.0608 0.98692 1 1000 0.1
MPa 145.038 1000 10.197 10197.45 334.56 295.299 7500.61 4014.74 0.23206 9.669 10 1000 1
mbar 0.0145 0.1 0.00102 1.019 0.003456 0.02953 0.75006 0.40146 0.23206 0.00099 0.001 1 0.0001
POINT FOUR TRACKER User’s Manual
Page 28

28
6.0 APPENDIX
6.5 TOTAL GAS PRESSURE
INFORMATION SHEET
GAS BUBBLE TRAUMA
Figure 1: Bulging eyes due to bubble formation caused by
supersaturation.
“Gas Bubble Trauma” can result when the water is
supersaturated with gas (bottom of a waterfall or
overactive aquarium aerator).
Both oxygen and nitrogen enter the sh via the gills,
where it is rapidly distributed via the bloodstream
to the tissues. At this juncture, supersaturated
gases come out of solution and form gas bubbles,
thus leading to the condition known as “gas bubble
trauma.”
Supersaturation by nitrogen is generally the culprit,
but oxygen alone (i.e., in systems using oxygen
injection) may cause GBD. With zebra sh research
systems, the cause is often a leaky pipe on the
suction side of the pump, which causes air injection.
Unfortunately, many cases of GDB do not present
specic clinical or pathological changes—i.e., sh
die without visible bubbles in the tissues.
The main symptoms are:
• Bubbles (emboli) visible in the lateral line, gill
laments, gill covers and ns
• Exophthalmia (bulging eyes)
• No visible signs
Results in:
• Damage to blood capillaries
• Impaired organ development and function,
particularly in relation to the gills
• An increased susceptibility to disease
• Behavioral effects (more vulnerable to predation)
6.6 DEFINITIONS
a) Barometric Pressure:
The “weight” of the air above the water surface.
b) Hydrostatic Pressure:
The “weight” of the water.
1 atm = 760 mmHg = 34 ft freshwater = 33 ft saltwater
c) Total Dissolved Gas Pressure:
The sum of the pressures exerted by the dissolved
gases in the water.
6.7 TGP CALCULATIONS
PTG = pO2 + pN2 + pCO2 + pH2O + p…
Or PTG(%) = (PTG / PBP) x 100
Where:
pO2 = partial pressure of oxygen
pN2 = partial pressure of nitrogen
pCO2 = partial pressure of carbon dioxide
pH2O = partial pressure of water vapor
p… = all other partial pressures present
(from dissolved gases)
PTG(%) = TGP expressed as percent saturation
PBP = Barometric Pressure at water surface
POINT FOUR TRACKER User’s Manual
Page 29
6.0 APPENDIX
29
Therefore:
If the water is in equilibrium with air:
TGP = BP and % sat = 100%
If the water is supersaturated:
TGP > BP and % sat ≥100%
TGP can also be expressed as Δ P:
Δ P = TGP – BP
6.8 HOW TO CALCULATE N
2
If we assume that the dissolved CO2 and Ar are
negligible, then we can use the measure of TGP and
Dissolved Oxygen to determine the value of dissolved
N2.
TGP = pO2 + pN
2
where
pO2 is the partial pressure of Oxygen
pN2 is the partial pressure of Nitrogen
To facilitate the equation, both the TGP and DO
measurement should be expressed as a percentage.
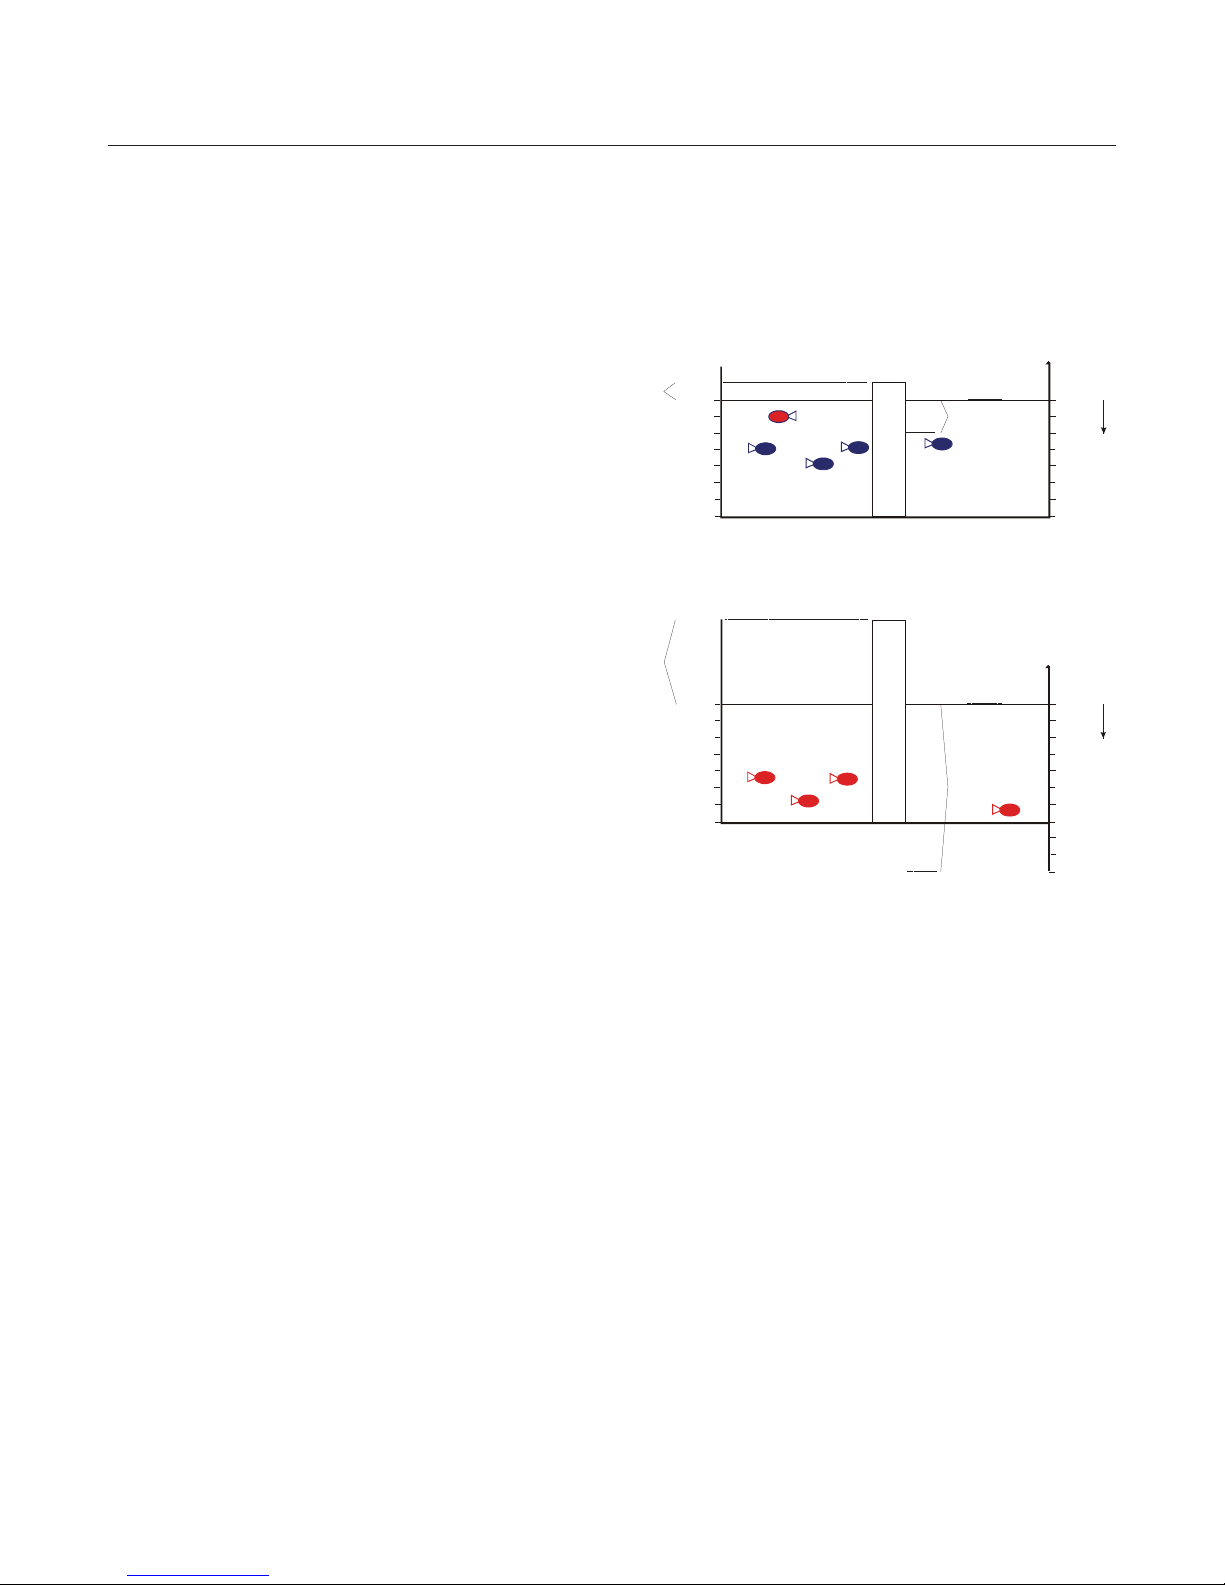
As a guide, for every 1% increase in gas pressure,
the sh have to swim 10 cm (4 inches) deeper in
the water to equilibrate. If the total gas pressure
increases to 110% and the depth of the tank is only
50 cm (20 inches), the sh cannot escape and the
consequences will be 100% mortality in about 30
minutes (gure 3).
102%
Δ
P
100%
samp le measurement
ΔP = 0.02 atm (2%), compensation depth is: 2 x 10cm = 20 cm (8”)
Figure 6: Compensation depth with proper tank depth
110%
Δ
P
100%
samp le me asurem ent
Compensation
Depth
20 cm
Compensation
Depth
100 cm
0 cm
20 cm
40 cm
60 cm
0 cm
20 cm
40 cm
60 cm
80 cm
TGP (%sat) = [DO (%sat) x 0.2095] +
[N2 (%sat) x 0.7808)]
Solve for N2:
N2
(%sat) = [TGP - (0.2095xDO)] / 0.7808
6.9 COMPENSATION DEPTH
When TDGP is at 110% at the surface of a water
body, the TDGP saturation one meter (3 feet) below
the surface is 100%. For each meter you go down
in the water, because the water pressure goes up
(hydrostatic pressure), the TDGP saturation actually
experienced by the sh drops by 10%. Therefore,
when the surface TDGP is 120%, a sh two meters
down is exposed to a TDGP level of only 100%.
Fish sense high gas pressures, and will go deeper
in the tank to compress the gases and thereby
preventing bubble formation in the blood stream and
tissue. When water is at 102% gas saturation (gure
2), for example, the compensation depth (or depth at
which bubbles will not form) is 20 cm (8 inches).
100 cm
ΔP = 0.10 atm (2%), compensation depth is: 10 x 10cm = 100cm (40”)
Figure 7: Compensation depth with tank not allowing
for minimum depth required.
6.10 CURRENT GUIDELINES
British Columbia Ministry of Environment Guidelines:
Freshwater & Marine Aquatic Life
Max. ΔP ≤ 76 mmHg (or 110% at sea level)
6.11 HATCHERY ENVIRONMENTS
Max. ΔP = 24 mmHg (or 103% at sea level)
ΔP = 0 mmHg when pO2 is ≤ 100 mmHg
Visit http://www.env.gov.bc.ca/wat/wq/
BCguidelines/tgp/ for more details.
POINT FOUR TRACKER User’s Manual
Page 30

30
NOTES
POINT FOUR TRACKER User’s Manual
Page 31

NOTES
31
POINT FOUR TRACKER User’s Manual
Page 32

2395 Apopka Blvd., Apopka, FL 32703, USA Phone: 407.886.3939
Web: PentairAES.com
© 2017 Pentair Aquatic Eco-Systems, Inc. All rights reser ved.
This document is subject to change without notice.
P/N 450026 Rev. A 11/15/2017
 Loading...