

Page 1

Th ree Ph ase Pow er Meter
PCE-83 0+PCE-6801/6802/300 7
Users Manual
PCE Americas Inc.
711 Commerce Way
Suite 8
Jupiter
FL-33458
USA
From outside US: +1
Tel: (561) 320-9162
Fax: (561) 320-9176
info@pce-americas.com
www.pce-instruments.com/english
www.pce-instruments.com
PCE Instruments UK Ltd.
Units 12/13
Southpoint Business Park
Ensign way
Hampshire / Southampton
United Kingdom, SO31 4RF
From outside UK: +44
Tel: (0) 2380 98703 0
Fax: (0) 2380 98703 9
info@industrial-needs.com
Page 2

EN 61010-2-032
CAT III 600V
Pollution Degree 2
Definition of Symbols:
Caution: Refer to Accompanying Documents
Caution: Risk of Electric Shock
Double Insulation
Over-voltage category III (CAT III):
equipment in fixed installations.
WARNING: If the power analyzer is used in a manner
Not specified by the manufacturer, the protection
Provided by the clamp meter may be impaired.
Please read the following instructions before usage
1. Do not operate in wet or dusty environments.
2. Do not operate in presence of combustible or explosive gas
3. Do not touch exposed metal parts, unused terminals.
4. Consider the use of rubber glove in operation.
5. Do not operate in excess of AC 500V (Phase to Neutral), or
AC 600V (Phase to Phase)
6. Do not operate when the unit seems to be mal-functioning
Page 3

Do not use the flexible current probe before you read
the following instructions.
1. Do not install the flexible current probe around bare
conductors carrying a voltage from 30V to 600V unless you
are wearing protective clothing and glove suitable for
high-voltage work.
2. Always inspect and check for any damage of the current
probe assembly before usage. Do not use the flexible
current probe if any damage is found.
3. Do not use the flexible current probe on circuit rated higher
than 600V in installation category III.
Page 4

TABLE OF CONTENTS
I. FEATURES.................................................................................................................1
II. PANEL DESCRI PTION........................................................................................2
III. OPERATING INSTR UCTIONS......................................................................11
III.0. Set up before operation.................................................................................................... 13
III.1. Power Quality of a 3 Phase 4 Wire (3P4W) System..................................................... 15
III.2 Power Quality of a 3 Phase 3 Wire (3P3W) System...................................................... 17
III.3 Power Quality of a Single Phase (1P2W) System ......................................................... 19
III.4 Power Quality of a 1 Phase 3 Wire (1P3W) System...................................................... 20
III.5 Measurement of a System with CT or VT...................................................................... 21
III.6 Harmonic Analysis of Voltage or Current....................................................................... 23
III.7 Display the Phase Angle of Harmonics........................................................................... 25
III.8 Measurement of Maximum Demand.............................................................................. 26
III.9 Waveform of Voltage and Current................................................................................... 27
III.10 Waveform of Voltage Only ............................................................................................ 28
III.11 Graphic Phasor Diagram................................................................................................ 29
III.12 Phase Sequence of a 3 Phase System............................................................................ 31
III.13 Balanced and Unbalanced 3 Phase (3P3W, 3P4W) Power Source System.............. 32
III.14 Balanced and Unbalanced 3 Phase (3P3W or 3P4W) Load System...................... 33
III.15 Transient Capture Setup (Dips, Swells, Outage) .......................................................... 34
III.16 Download Transient Data .............................................................................................. 37
III.17 Data Logging of Power Data (3P4W, 3P3W, 1P2W, 1P3W)..................................... 38
III.18 Download Power Data................................................................................................... 39
III.19 Data Logging of Harmonics.......................................................................................... 40
III.20 Download Harmonics Data ........................................................................................... 41
III.21 Clear Memory of Data Logging.................................................................................... 41
IV. HARDC OPY OF SCR EEN................................................................................42
V. READ THE SAVED SCREEN............................................................................43
VI. SET THE CT AND V T RA TIO.........................................................................44
VII. SET THE TIME I NTER VAL FOR MAXIMUM DEMAND...................45
VIII. SET THE SAMPLING TIME FOR DAT A LOGGING...........................46
Page 5

IX. SET THE CALEND ER CLOCK.....................................................................47
X. PROTOCOL OF RS-23 2C INTERFACE........................................................48
XI. SPECIFICA TIONS (23℃± 5℃)........................................................................49
XII. BATTERY REPLACEMENT.........................................................................59
XIII. MAINTENANCE & CLEANING................................................................61
XIV. NOMENCLA T URE..........................................................................................62
Page 6

1
I. FEATURES
■ Analysis for 3P4W , 3P3W , 1P2W , 1P3W
■ True RMS value (V
123
and I
123
)
■ Active Power (W, KW , MW , GW)
■ Apparent and Reactive Power (KV A, KVAR)
■ Power Factor (PF), Phase Angle (Φ)
■ Energy (WH, KWH, KV ARH, PFH)
■ Current measurement from 0.1mA to 3000A, capable of an alyzing IT stand by
power consumption to the maximum demand of a factory
■ Display of 35 Parameters in One Screen (3P4W)
■ Programmable CT (1 to 600) and PT (1 to 3000) Ratios
■ Display of Overlapped V oltage and Current W aveform
■ Average Demand (AD in W , KW , MW)
■ Maximum Demand (MD in KW , MW , KV A, MVA) with Programmable Period
■ Harmonic Analysis to the 99
th
Order
■ Display of 50 Harmonics in one Screen with W aveform
■ Display of Waveform with Peak V alues (102 4 Samples / Period)
■ Analysis of Total Harmonic Distortio n (THD-F)
■ Graphic Phasor Diagram with 3 Phase System Parameters
■ Capture 28 T ransient Events (T ime + Cycles) with Programmable Threshold
(%)
■ DIP, SWELL, and OUT AGE are included in transient event s.
■ 3 Phase V oltage or Current Unbalance Ratio (VUR, IUR)
■ 3 Phase V oltage or Current Unbalance Factor (d0%, d2%)
■ Calculated Unbalanced Current through Neutral Lin e (In)
■ 512K Memory with Programmable Interval (Sampling time from 2 to 3000
seconds, 17,000 recor ds for 3P4W system)
■ Output of Waveform, Power Param eters and Harmonics at Command
■ Large Dot Matrix LCD Display with Backlight
■ Optical Isolated RS-232C to USB Interface
■ Built-in timer and calendar for data logging
Page 7

2
II. PANEL DESCRIPTION
PCE-830
Page 8

3
1. Input Terminal for Neutral Line (Voltage)
2. Voltage Input Terminals for Each Phase (V1, V2, V3)
3. External DC Input (The AC adaptor must be 600V isolated)
4. Current Input Terminals for Each Phase (I1, I2, I3)
5. LCD Display
6. Buttons
7. RS-232C Window
8. Stand Holder
9. Stand
10. Battery Cover
11. Battery Compartment
Page 9

4
Press this button to exit transient detection or to exit SETUP menu.
Press this button to perform transient detection.
Press this button to hold the data displayed in LCD. Press this button
and then REC button to record the displayed data. Press HOLD
button again to continue operation.
Press this button to start measurement of harmonics in magnitude.
Page 10

5
Press this button to select V1, I1, V2, I2, V3, or I3 for harmonics analysis
Press this button for the voltage or current input range
Press this button to enter SETUP mode and then select the paramete r
to be adjusted
Press this button to increment value by one. Hold the button for
two seconds or more to speed up the increment.
Press this button to decrement value by one. Hold the button for
two seconds or more to speed up the decrement.
In the mode of harmonic analysis, press this button to move the
cursor left to the previous order .
In the mode of harmonic analysis, press this button to move the
cursor right to the next order .
Press this button to start data logging. Press it again to stop data
logging. The sampling interval is displayed in LCD pointed by SEC
Page 11

6
indicator .
In the mode of power measurement, press this button to display
the phasor diagram. In the mode of harmonic analysis, press
this button to display phase angle instead of magnitude.
Press this button to turn the back light on. Press it again to turn
the back light off.
Press this button to start measurement of power parameters.
Press this button to display waveform of voltage and current.
Press this button to display waveform of voltage only
In the mode of power parameter measurement, press this
button to select appropriate system (3P4W , 3P3W , 1P2W or
1P3W). In the mode of displaying waveform, press this button
to select (V1, I1), (V2, I2), or (V3, I3).
Press this button to turn the power on or off.
Page 12

7P
PCE-6801 Current Probe (100A)
1A
10A
100A
1. Jaw Assembly
2. Trigger
3. Range Selector
4. 6 pin mini DIN connector
NOTE: To setup 100A current probe as selected probe, press the SETUP button to
select CLAMP. When the CLAMP is reverse video, press the ▲ or ▼ button to
select 100.
Page 13

8
PCE-6802 Current Probe (1000A)
10A
100A
1000A
1. Jaw Assembly
2. Trigger
3. Range Selector
4. 6 pin mini DIN connector
NOTE: To setup 1000A current probe as selected probe, pre ss the SETUP button to
select CLAMP. When the CLAMP is reverse video, press the ▲ or ▼ button to
select 1000.
PCE-3007 Current Probe (3000A)
Page 14
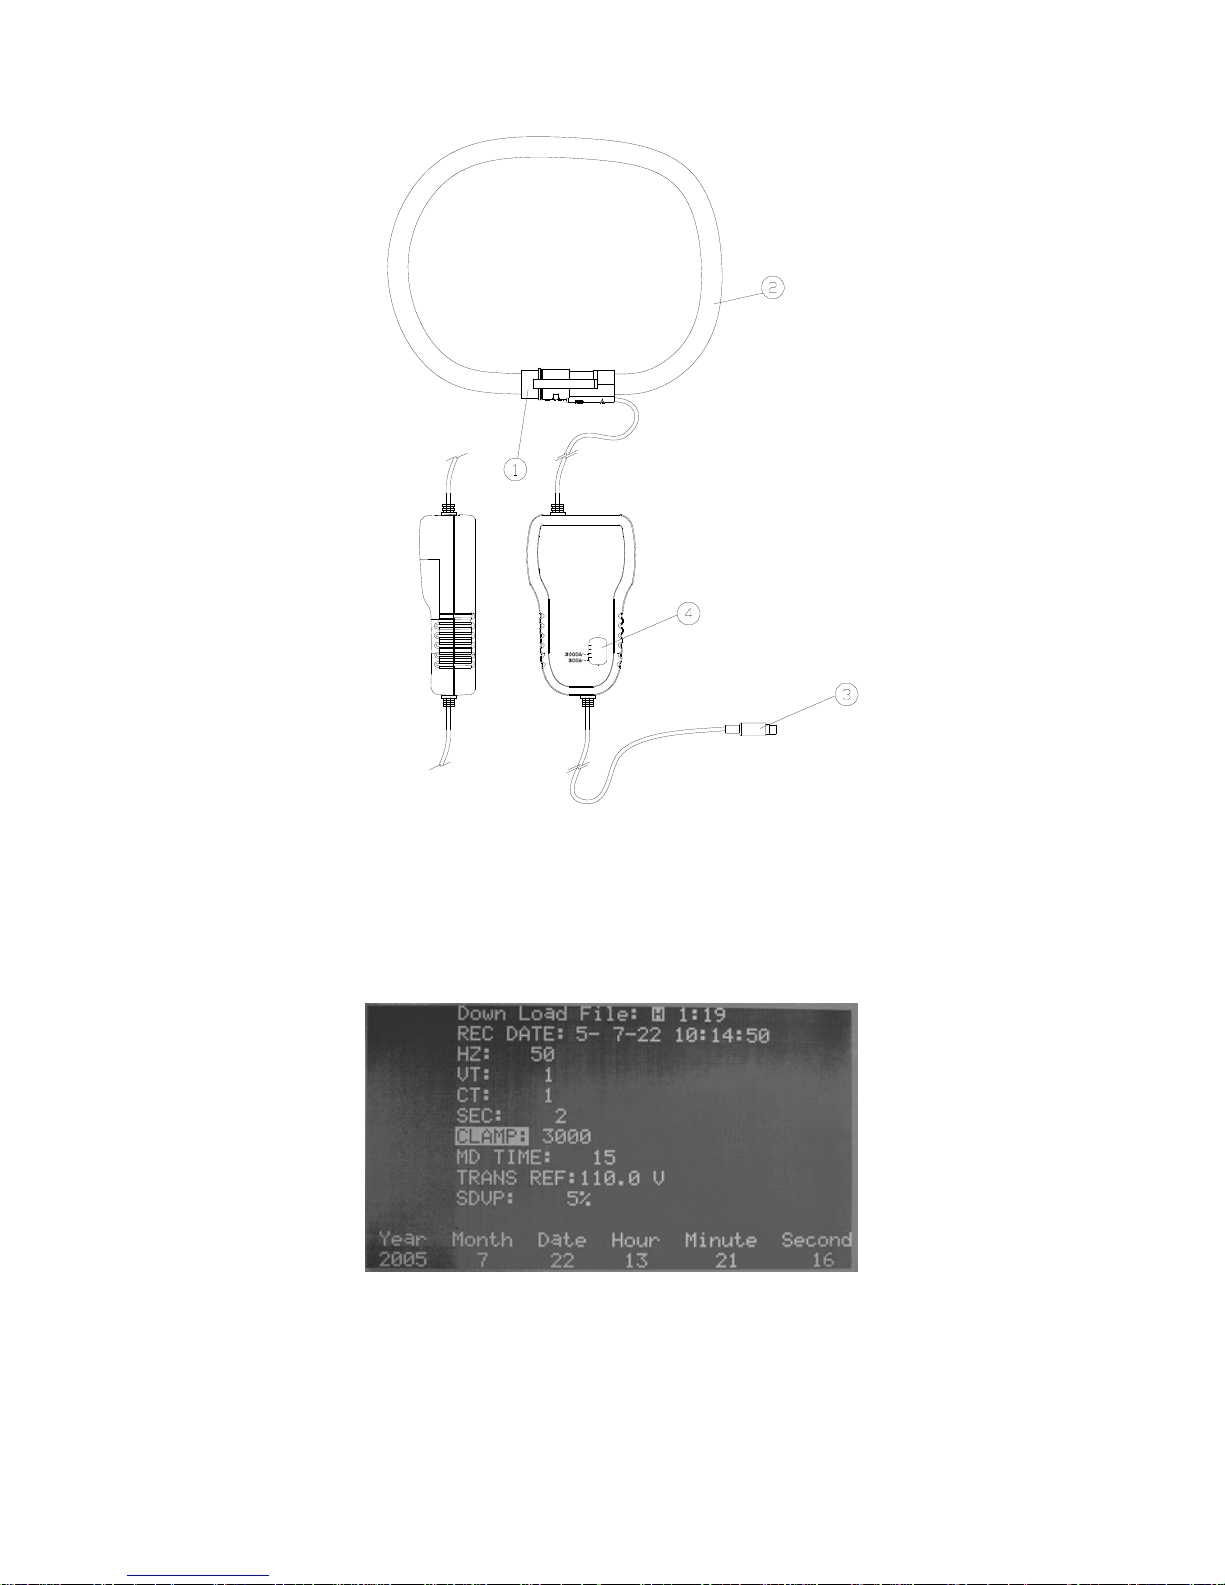
9
1. Coupling Assembly
2. Flexible Loop
3. Mini-DIN connector for Output
4. Output Range Select Switch
Page 15

11
III. OPERATING INSTRUCTIONS
NOTE:
Select the correct CLAMP in the SETUP menu. When the current probe is
connected to the power analyzer, power analyzer will automatically detect the range
selected.
NOTE:
Select the correct frequency (Hz) in the SETUP menu.
WARNING:
All the current probes connected to the power analyzer must be of the same
model and same range. Mixed models and different ranges selected will
cause incorrect result of measurement.
Page 16

12
NOTE:
Please pay special attention to the flexible current probes (model 3007/3009)
connected to the power analyzer.
1. Connect the flexible probe around the conductor .
2. Make sure the current flowing direction is in consistent with the arrow
marked on the probe coupling. If the flexible current probe is
connected in the right orientation, the correct phase will be disp layed in
the oscilloscope.
3. Keep the probe coupling more than 25mm away from the conductor .
WARNING: Always wear appropriate gloves in operation.
Page 17

13
III.0. Set up before operation
a. Press SETUP button to enter setup screen. Press SETUP again to select the
item for setting (the selected item will be displayed in reverse video).
b. After selecting the item, press ▲ or ▼ buttons to set up its value.
c. After finishing setting up, press EXIT button to leave setup mode.
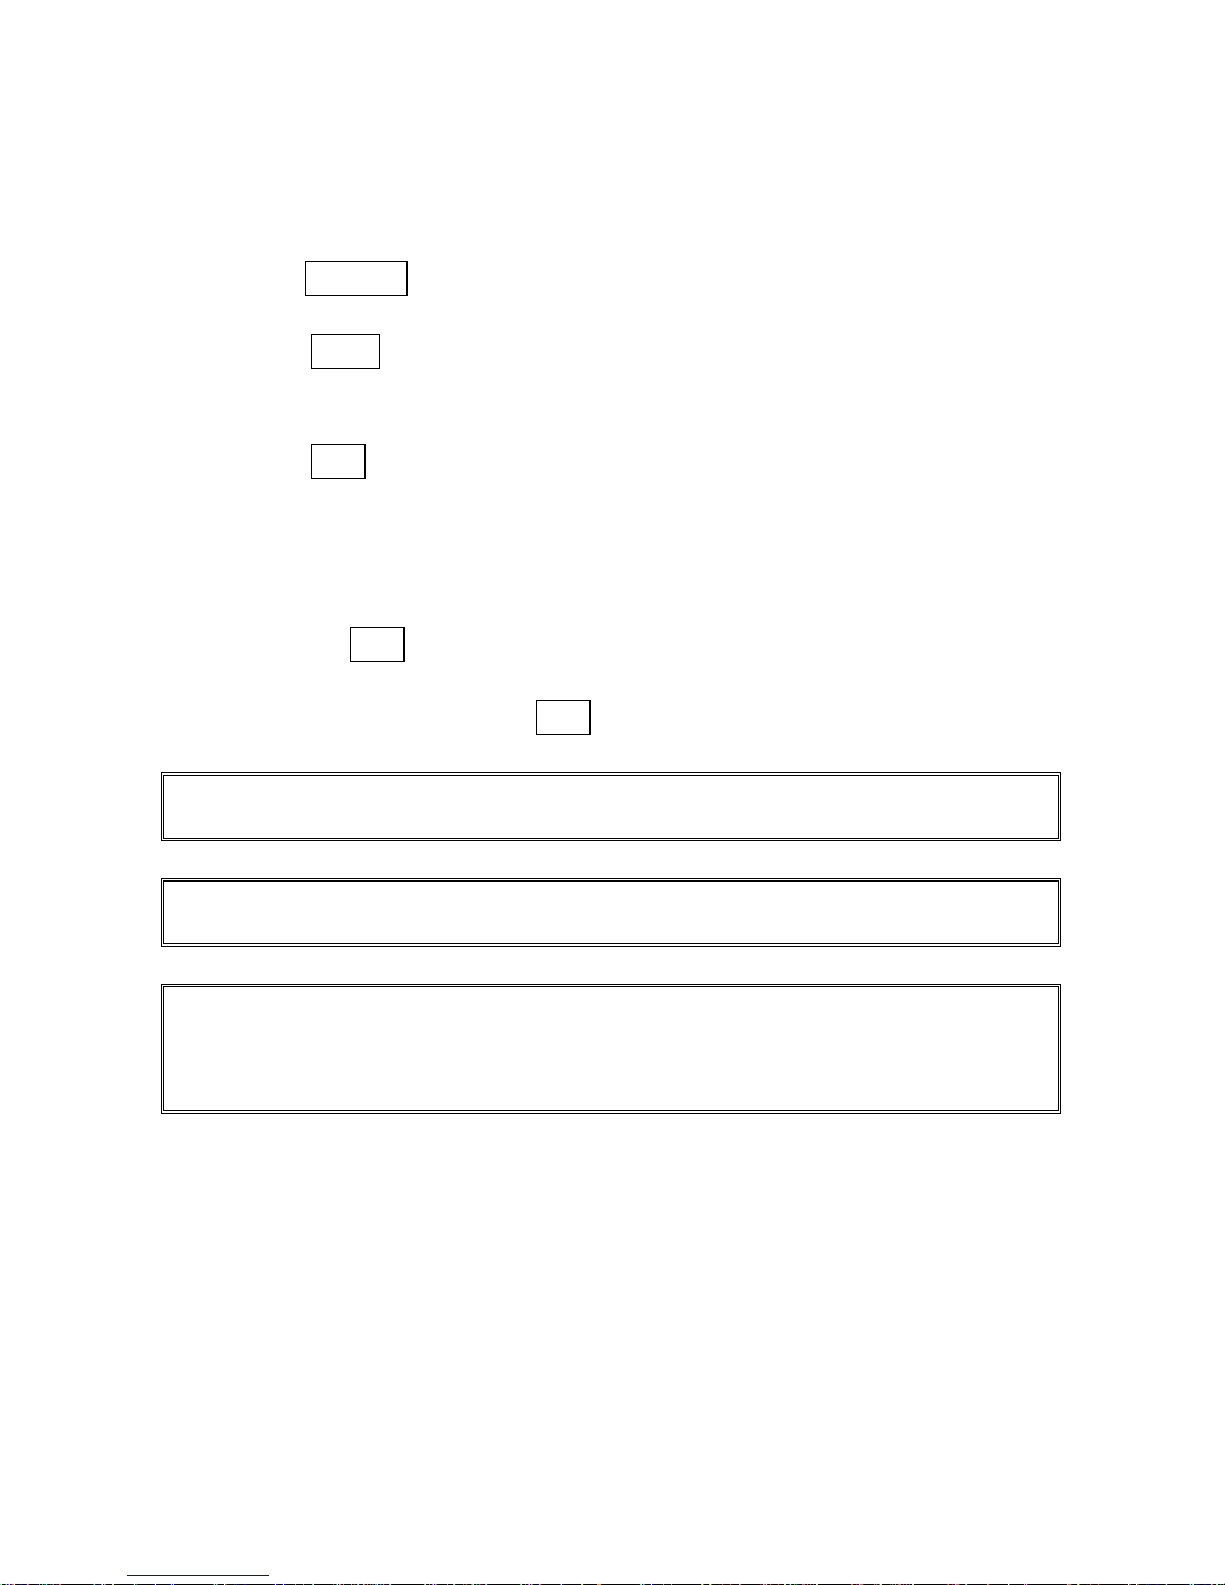
1. Select the data for download:
H means harmonics;
H in reverse video means HOLD screen data (if the data is the one you want,
you can press HOLD button to display the data, and press HOLD button again
to exit);
P means power data which can be a reference for downloadi ng, the data in
order is 0~84.
2. Shows the total logged data in the analyzer: max. 85 logging data.
3. REC DATE: shows the starting logging time of the 1
st
downloaded file.
Page 18

14
4. Hz: set up the frequency (50, 60 or AUTO) of the system.
5. PT: set up PT value.
6. CT: set up CT value.
7. SEC: set up the interval seconds of logged data.
8. CLAMP: set up the clamps selected (100A, 1000A, 3000A or 1200A).
9. MD TIME: set up the time of Maximum Demand (1~60 minutes).
10. TRANS REF: set up the transient voltage (which will be automatically changed
in accordance with PT).
11. SDVP: set up upper and lower limits % of transient voltage detection.
12. YEAR: Set up “year” of calendar clock.
13. MONTH: Set up “month” of calendar clock.
14. DATE: Set up “date” of calendar clock.
15. HOUR: Set up “hour” of calendar clock.
16. MINUTE: Set up “minute” of calendar clock.
17. SECOND: Second can be displayed only (it can not be adjusted).
Page 19

15
III.1. Power Quality of a 3 Phase 4 Wire (3P4W) System
POWER
3 4W
V
N
3
V
V
2
1
V
3I
I
2
1I
(POWER)
60A
60A
(POWER)
100A
100A
(HARMON)
1A
10A
(HARMON)
(HARMON)
10A
1A
(HARMON)
100A
100A
60A
(POWER)
100A
100A
(HARMON)
1A
10A
(HARMON)
a. Turn the power on. Press the POWER and the 1Φ3Φ buttons to select
Page 20

16
the 3P4W system. The type of system will be displayed at the left bottom
corner in the LCD.
b. Connect the four test leads to the voltage terminals V1, V2, V3 and the V
N
(Neutral) of the system.
c. Connect the test leads to L1, L2, and L3 of the 3P4W system.
d. Connect the three current probes to the power analyzer input terminal I1, I2,
and I3.
e. Clamp on to the L1, L2, and L3 of the 3P4W system. Make sure the
current flows from the front of the current probe to the back of it.
f. All parameters of the system will be shown in LCD.
For the meaning of each parameter, refer to XIV. NOMENCLATURE.
Page 21

17
III.2 Power Quality of a 3 Phase 3 Wire (3P3W) System
Page 22

18
3 3W
V
3
2
V
V
1
I
3
2I
I
1
(HARMON)
10A
1A
(HARMON)
100A
100A
(POWER)
60A
(HARMON)
10A
1A
(HARMON)
100A
100A
(POWER)
60A
60A
(POWER)
100A
100A
(HARMON)
1A
10A
(HARMON)
POWER
a. Turn the power on. Press the POWER and the 1Φ3Φ buttons to select
the 3P3W system. The type of system will be displayed at the bottom
right of the LCD.
b. Connect the three test leads to the voltage terminals L1, L2, and L3 of the
system.
c. Connect the three current probes to the power analyzer input terminal I1,
I2, and I3.
d. Clamp on to the L1, L2, and L3. Make sure the current flows from the
front of the current probe to the back of it.
e. All parameters of the system will be shown i n LCD
For the meaning of each parameter, refer to XIV. NOMENCLATURE.
Page 23

19
III.3 Power Quality of a Single Phase (1P2W) System
POWER
1 2W
N
V
1
V
1
I
(HARMON)
(POWER)
(HARMON)
60A
100A
100A
10A
1A
a. Turn the power on. Press the POWER and the 1Φ3Φ buttons to select
the 1P2W system. The type of system will be displayed at the bottom
right of the LCD
b. Connect the two test leads to the voltage terminals L1 and V
N
(Neutral) of
the system.
c. Connect one current probe to the power analyzer in put terminal I1.
d. Clamp on to the L1. Make sure the current flows from the front of the
current probe to the back of it.
e. All following parameters of the system will be shown in LCD
For the meaning of each parameter, refer to XIV. NOMENCLATURE.
Page 24

20
III.4 Power Quality of a 1 Phase 3 Wire (1P3W) System
(HARMON)
(POWER)
(HARMON)
60A
100A
100A
10A
1A
1A
10A
100A
100A
60A
(HARMON)
(POWER)
(HARMON)
POWER
1 3W
2I
I
1
V
2N
1N
V
N
a. Turn the power on. Press the POWER and the 1Φ3Φ buttons to select
the 1P3W system. The type of system will be displayed at the bottom
right of the LCD.
b. Connect the three test leads to the voltage terminals L1, L2 and V
N
(Neutral) of the system.
c. Connect the two current probes to the power analyzer input terminal I1
and I2.
d. Clamp on to the L1 and L2. Make sure the current flows from the front of
the current probe to the back of it.
e. All parameters of the system will be shown i n LCD
For the meaning of each parameter, refer to XIV. NOMENCLATURE.
Page 25

21
III.5 Measurement of a System with CT or VT
POWER
(HARMON)
10A
1A
(HARMON)
100A
100A
(POWER)
60A
3 4W+PT+CT
X
Y-Y連接
PT 3
CT3
CT2
CT1
I3
2I
I
1
V
3N
2N
V
V
1N
+
++
++
+
60A
(POWER)
100A
100A
(HARMON)
1A
10A
(HARMON)
(HARMON)
10A
1A
(HARMON)
100A
100A
(POWER)
60A
a. Turn the power on. Press the POWER and the 1Φ3Φ buttons to select
the 3P4W system. The type of system will be displayed at the bottom
right of the LCD.
b. Connect the four test leads to the secondary voltage terminals L1, L2, L3
and the V
N
(Neutral) of the system.
c. Clamp on to the secondary coils of L1, L2, and L3. Make sure the
current flows from the front of the current probe to the back of it.
d. Press the SETUP button and the CT symbol will be shown in reverse
video in LCD.
e. Press the ▲ or ▼ buttons to increment or decrement the RATIO
specified by the CT.
Page 26

22
f. Press the SETUP button and the VT symbol will be shown in reverse
video in LCD.
g. Press the ▲ or ▼ buttons to increment or decrement the RATIO
specified by the VT.
h. Press EXIT to return to POWER mode. All the parameters of the
system will be shown in LCD
For the meaning of each parameter, refer to XIV. NOMENCLATURE.
Page 27

23
III.6 Harmonic Analysis of Voltage or Current
(Normal Voltage without Distortion and Harmonics)
(Distorted Current with Harmonics)
a. Set up the analyzer for measurement of any power system (3P4W, 3P3W,
1P2W, or 1P3W). To see the harmonic analysis of voltage or current, users
can press the MAG. button.
Page 28

24
b. Once the MAG. button is pressed, the waveform will be shown in the left part in
LCD, and the 1st to 50th order harmonics will be shown in the right part in LCD.
c. The positive and negative peak values will be shown in the waveform (Vpk).
d. The true RMS value and total harmonic distortion (THD-F) of voltage or current
will be shown under the waveform.
e. The cursor (↑arrow) will point to the current order of harmonics. The
frequency (HZ) will be displayed next to the cursor. The percentage of
harmonics (%) will be displayed below the cursor. The magnitude of the
harmonics (V or A) or phase angle will be displayed next to the %.
f. To move the cursor to next harmonics, press the ◄or ► button.
g. To see the next page of 51
st
to 99th order, press the ► button to pass 50th order
or press the ◄ button to pass 1
st
order.
NOTE:
If the waveform is chopped off at the peak or too small in the LCD, press the
RANGE button to select HIGH or LOW range for better display. The range
indicator is a symbol after the unit of RMS value, L or H.
Page 29

25
III.7 Display the Phase Angle of Harmonics
When the MAG. is pressed the magnitude of each harmonics is displayed. To
review the phase angle of each harmonic, users can press the PHASE button.
The phase angle shall be displayed next to the %. This phase angle is measured
from the sampled waveform. It may not be 0 for V1. The rest of the phase angle
(V2, V3, I1, I2, and I3) is sampled with respect to V1.
NOTE:
If the waveform is chopped off at the peak or too small in the LCD, press the
RANGE button to select HIGH or LOW range for better display. The range
indicator is a symbol after the unit of RMS value, L or H.
Page 30

26
III.8 Measurement of Maximum Demand
1. Set the time interval for maximum demand (refer to section VII)
2. The analyzer will integrate the KW and KVA over the specified interval.
3. The maximum demand (MD) will be updated if new demand is greater
than the previous value.
In the following example, the maximum demand is 527.4VA and 527.4W. The time
interval for maximum demand is 2 minutes.
Page 31

27
III.9 Waveform of Voltage and Current
Press this button to display waveform of voltage and current at the
same time.
Press this button to select different inputs (V1, I1), (V2, I2), or (V3,
I3).
NOTE:
The triggering point is the zero crossing point of V1 for V2, V3, I2, and I3. The
triggering point for I1 is its own zero crossing point in case V1 is not present.
NOTE:
In the mode of displaying waveform, one period/cycle of 1024 data is displayed.
Page 32

28
III.10 Waveform of Voltage Only
Press this button to display voltage waveform only. The true RMS
value of voltage will be displayed at the bottom in LCD.
Press this button to select V1, V2, or V3.
NOTE:
The triggering point is the zero crossing point of V1 for V2 and V3.
NOTE:
In the mode of displaying waveform, one period/cycle of 1024 data is displayed.
Page 33

29
III.11 Graphic Phasor Diagram
Press this button to display the phasor diagram.
The voltages and currents will be displayed in phasor format (magnitude, angle).
V1 will be referred as reference. The angle of V1 is always 0. The phase angles
of V2, V3, I1, I2, and I3 will be displayed with respect to V1. V1, V2, V3, I1, I2, I3,
V12, V23, and V31 will be displayed in vector form graphically.
V1, V2, V3: Phase voltages in phasor format with respect to V1
I1, I2, I3: Line currents in phasor format with respect to V1.
IVn: Calculated voltage and current of neutral with respect to ground.
V12, V23, V31: Line voltage in phasor format with respect to V1.
Ave: Average of line voltages V12, V23, and V31 and line current I1, I2, and I3
dV%: Historical maximum % value of
(Max (V1, V2, V3) – Min (V1, V2, V3)) / Min (V1, V2, V3) * 100%
VUR: Voltage Unbalance Ratio
d02: The first number is Zero Sequence Unbalance Ratio in % (d0) of voltage.
The second number is the Negative Sequence Unbalance Ratio in % (d2) of
voltage. When VUR is displayed before d02, d02 represents the Zero and
Negative Sequence Unbalance Ratios for voltage.
REF: nominal voltage for transient detection reference
Sd%: threshold in % for transient detection with respect to nominal voltage (REF).
Page 34

30
NOTE:
The phasor is drawn only when the reading is more than 200 counts. And if the
reading of V is zero, then phasor of current will not be drawn.
Press this button to change the display from VUR to IUR
dA%: Historical maximum % value of
(Max (I1, I2, I3) – Min (I1, I2, I3) ) / Min(I1, I2, I3) * 100%
IUR: Current Unbalance Ratio
d02: The first number is Zero Sequence Unbalance Ratio in % (d0) of current, The
second number is the Negative Sequence Unbalance Ratio in % (d2 ) of
current. When IUR is displayed before d02, d02 represe nts the Zero (d0) and
Negative (d2) Sequence Unbalance Ratios for current.
REF: nominal voltage for transient detection reference
Sd%: threshold in % for transient detection with respect to nominal voltage (REF).
NOTE:
If the voltage of L1, L2, and L3 is not connected in right sequence, the analyzer will
show L1-3-2 in the right top corner, and beep to warn the users of incorrect phase
sequence.
Page 35

31
III.12 Phase Sequence of a 3 Phase System
Press this button to display phasor diagram.
In this mode, the analyzer also detects the correctness of the pha se sequence. If
the voltage of L1, L2, and L3 is not connected in right sequence, the analyzer will
show L1-3-2 in the right top corner, and beep to warn the users of incorrect phase
sequence.
Page 36

32
III.13 Balanced and Unbalanced 3 Phase (3P3W, 3P4W) Power
Source System
In order to check if a system is balanced, press this button to display
the phasor diagram with the VUR displayed.
Balanced System
If a 3 phase power source system is balanced, the param eters should be as
following:
V1 = V2 = V3
V12 = V23 = V31
The phase angle of phasor V2 = -120
The phase angle of phasor V3 = 120
Vn (voltage of neutral with respect to ground) = 0V
VUR = 0%
d0% = 0%
d2% = 0%
Unbalanced System
If the values are different from the numbers above, then we can say it is an
unbalanced power source system. The magnitude of the difference can be used
as an indication of an unbalanced power source syst em. The larger the difference,
the more unbalanced the system is.
Page 37

33
III.14 Balanced and Unbalanced 3 Phase (3P3W or 3P4W) Load
System
In order to check if current of a system is balanced, press the button
twice to display the phasor diagram with the IUR displayed.
Balanced System
If a 3 phase load system is balanced, the parameters should be as following:
I1 = I2 = I3
The phase angle of phasors I2 and I1 (I2 ± I1) = ±120
The phase angle of phasors I3 and I2 (I3 ± I2)= ±120
In (current of neutral) = 0A
IUR = 0%
d0% = 0%
d2% = 0%
Unbalanced System
If the values are different from the numbers above, then we can say it is an
unbalanced load system. The magnitude of the difference can be used as an
indication of an unbalanced power source system. The larger the difference, the
more unbalanced the load is.
Page 38

34
III.15 Transient Capture Setup (Dips, Swells, Outage)
1. Press button to enter the mode of PHASOR DIAGRAM.
2. Press the SETUP button to let TRANS REF is displayed in reverse video.
3. Press the ▲ or ▼ buttons to increment or decrement nominal voltage as
reference. To exit, press the EXIT button.
4. Press the SETUP button to let SDVP displayed in reverse video.
Page 39

35
5. Press the ▲ or ▼ button to increment or decrement threshold in % (SDVP).
To exit, press the EXIT button.
6. Press the TRANSIENT button to start operation of “Transient Capture”.
7. The backlight will be turned off when the TRANSIENT button is pressed.
8. If the analyzer captures any transient events (DIP, SWELL, or OUTAGE), the
backlight will be turned on. User can press the TRANSIENT button to review
the TRANSIENT events recorded.
9. To exit TRANSIENT CAPTURE, press the EXIT button.
Definition of SWELL, DIP, and OUTAGE:
SWELL: V
RMS
> [V
REF
+ (V
REF
* SD%)]
Code for SWELL: 1
If true RMS value of either phase (V1, V2, or V3) rises above the nominal value plus
the threshold (REF + SD%), it is regarded as SWELL. The code for SWELL is 1.
DIP: V
RMS
< [V
REF
– (V
REF
* SD%)]
Code for DIP: 2
If the true RMS value of either phase (V1, V2, or V3) falls below the nominal value
plus the threshold, it is regarded as DIP. The code for DIP is 2.
OUTAGE: V
RMS
< 30 to 40V
Code for OUTAGE: 4
If the true RMS value of either phase is less than 30 to 40V, it is regarded as
OUTAGE. The code for OUTAGE is 4.
Page 40

36
Code Table:
SWELL DIP OUTAGE COMMENT
CODE 1 2 4 Codes can be added together
DISPLAY FORMAT:
First column: sequential number of events.
Second column: elapsed time since the time of start. The elapsed time format is
(DAYS, HOURS, MINUTES). The maximum time is 99 day 24 hours 60 minutes.
The third column: number of cycles.
The fourth column: code of transient events. There might be more than one
transient condition occurs in one event.
NOTE: In the mode of TRANSIENT CAPTURE, the analyzer takes 128 samples of
each cycle for each phase continuously.
NOTE: When the users press the TRANSIENT button to review the record ed
events, the analyzer stops capture operation until the TRANSIENT is pressed again.
The timer is also stopped when users press the TRANSIENT button. So the time
stamp is not correct when users press the TRANSIENT button to resume operation.
NOTE: The analyzer can record up to 28 events. When the analyzer has recorded
28 events, it stops the capture operation, turns the backlight on, and displays the 28
transient events.
NOTE: The code can be added together to indicate two or three co nditions. For
example, if code is 6, that means DIP and OUTAGE (2+4).
NOTE: The longest duration for capture opera tion is 99 days. So users should use
external 12V DC power adaptor for capture operation.
WARNING: Users must select 50 or 60 Hz for transien t capture. If users select
AUTO for frequency, the unit will not allow users to enter the TRANSIENT capture,
and will beep to warn users.
Page 41

37
III.16 Download Transient Data
When users press the TRANSIENT button to display CAPTURED EVENTS, the
data is also output through RS-232 at the same time.
The data output is in the same format as in LCD in ASCII format
YEAR MONTH DAY HOUR MINUTE SECOND CT REF CODE
01 ELAPSED_TIME CYCLES CODE
02 ELAPSED_TIME CYCLES CODE
03 ELAPSED_TIME CYCLES CODE
04 ELAPSED_TIME CYCLES CODE
…
NOTE:
When users download data in the office, one additional event will be capture d due to
no input connected. The additional (last) event should show:
1. Elapsed time is reset to 0.
2. Transient event is LO and OUT.
Page 42
38
III.17 Data Logging of Power Data (3P4W, 3P3W, 1P2W, 1P3W)
1. Set the sampling time of data logging.
2. Press the POWER button to enter mode of power measurement.
3. Press the 1Φ3Φ button to select appropriate system (3P4W, 3P3W, 1P3W, or
1P2W).
4. Press the REC button to start data logging. A REC symbol will be displayed at
the bottom line in LCD.
If the memory is full, a FULL symbol will display at the bottom line in LCD, and
the buzzer will last 3 seconds. Now the recording function is disabled, i.e.
pressing the REC button won’t work.
5. To stop data logging, press the REC button again.
NOTE:
Do not communicate with PC during data logging.
WARNING:
If there is no input at V1, then the sampling time could be longer than the set value.
WARNING:
If the unit detects battery low during the period of logging, Data Logging will be
ended automatically . So if users want to log dat a for a longer period, please be sure
to connect the AC power adapters (which are provided with the analyzers).
Page 43

39
III.18 Download Power Data
1. Press the SETUP button.
2. The “Down Load File” will be shown in reverse video.
3. Press the ▲ or ▼ button to select file number.
4. If the data stored in a selected file is power data, a leading symbol “P” will be
shown in front of the file number
5. Press EXIT button.
6. When the unit receives a CTRL D command through the RS-232C port, it will
down load stored power data.
NOTE:
In the setup mode, the unit will not accept any command through RS-232C port.
To down load data, users must press the EXIT button to return to normal
measurement mode.
Page 44

40
III.19 Data Logging of Harmonics
1. Set the sampling time of data logging/
2. Press MAG. button to enter mode of harmonics mea surement.
3. Press the VI button to select desired input (V1, I1, V2, I2, V3, or I3).
4. Press the REC button to start data logging. A REC symbol will be displayed at
the bottom line in LCD.
If the memory is full, a FULL symbol will display at the bottom line in LCD, and
the buzzer will last 3 seconds. Now the recording function is disabled, i.e.
pressing the REC button won’t work.
5. To stop data logging, press the REC button again.
NOTE:
Do not communicate with PC during data logging.
WARNING:
If there is no input at V1, then the logging time will be incorrect.
WARNING:
If the unit detects battery low during the period of logging, Data Logging will be
ended automatically.
Page 45

41
III.20 Download Harmonics Data
1. Press the SETUP button.
2. The “Down Load File” will be shown in reverse video.
3. Press the ▲ or ▼ button to select file number.
4. If the data stored in a selected file is harmonics data, a leading symbol “H” will be
shown in front of the file number.
5. Press EXIT button.
6. When the unit receives a CTRL+D command through the RS-232C port, it will
down load stored harmonics data.
NOTE:
In the setup mode, the unit will not accept any command through RS-232C port.
To down load data, users must press the EXIT button to return to normal
measurement mode.
III.21 Clear Memory of Data Logging
To clear all data memory of the unit, hold the REC button and turn the power on.
Page 46

42
IV. HARDCOPY OF SCREEN
1. Press the HOLD/READ button.
2. Press the REC button. It take s few seconds to hardcopy the screen, and st ore
the screen in an internal file. The LCD will show RE C in reverse video when in
operation. The number following the REC is the file number .
3. Users can store up to 85 screens if no power or harmonics data is stored.
Page 47

43
V. READ THE SAVED SCREEN
1. Press the SETUP button. The DOWN LOAD FILE is displayed in reverse video.
If the data in the selected file is hardcopy of screen, a leading symbol of H is
displayed in reverse video.
2. Press the ▲ or ▼ to select the saved screen.
3. Press the HOLD/READ button, then the saved screen will b e restored.
NOTE:
If the data saved in a specific file is a HARDCOPY of screen, a leading symbol of H
is displayed in reverse video.
NOTE:
Hardcopy data can not be down loade d.
Page 48

44
VI. SET THE CT AND VT RATIO
Press the SETUP button several times until CT or VT is shown in reverse video.
Press the ▲ or ▼ button to increment or decrement the value by 1. Holding the
▲
or ▼ button will speed up the process of incrementing or decrementing. To
exit, press the EXIT button.
The range of CT ratio is from 1 to 600. The range of VT ratio is from 1 to 3000.
Once the CT or VT is set, the voltage and current readings becomes
CURRENT (displayed) = CURRENT (measure d) x CT Ratio
VOLTAGE (displayed) = VOLTAGE (measured) x VT Ratio
Page 49

45
VII. SET THE TIME INTERVAL FOR MAXIMUM DEMAND
Press the SETUP button several times until MD TIME is displayed in reverse
video.
Press the ▲ or ▼ buttons to increment or decrement the value by 1. Holding
the ▲ or ▼ buttons will speed up the process of incrementing or decrementing.
To exit, press the EXIT button.
The range of MD time interval is from 1 to 60 minutes. Once the time interval is set,
the unit will calculate the maximum demand and average demand in wattage (W)
or VA. To toggle between W and VA, press the POWER button.
Page 50

46
VIII. SET THE SAMPLING TIME FOR DATA LOGGING
Press the SETUP button several times until SEC is displayed in reverse video.
Press the ▲ or ▼ buttons to increment or decrement the value (users can set up
the sampling time from 2 sec. to 3000 sec., step by 2, e.g. 2 sec., 4 sec., 6
sec., … ). Holding the ▲ or ▼ buttons will speed up the process of
incrementing or decrementing.
To exit, press the EXIT button.
The example about how to decide the sampling time for data logging:
If users want to log data for 3 weeks and the power system is 3P4W, first clear the
memory of the analyzer , then set up the sampling time as 104 sec. or more. See
the calculation on below:
3 (weeks) x 7 (days) x 24 (hours) x 60 (min.) x 60 (sec.) = 1,814,400 (sec.)
1,814,400 (sec.) / 17,474 (the max. file capaci ty of 3P4W) = 103.83 (sec.)
Page 51

47
IX. SET THE CALENDER CLOCK
1. Press the SETUP button to select (Y ear , Month, Date, Hour, Minute).
2. Press the ▲ or ▼ buttons to increment or decrement the number.
NOTE:
Second can not be adjusted.
Page 52

48
X. PROTOCOL OF RS-232C INTERFACE
RS-232C Interface:
Baud Rate 9600
Data bits 8
St op bit 1
No Parity
Page 53

49
XI. SPECIFICATIONS (23℃± 5℃)
AC Watt
(50 or 60 Hz, PF 0.5 to 1, CT = 1, Voltage>AC 20V, Current>AC 40mA for 1A
range, Current>AC 0.4A for 10A range, Current>AC 4A for 100A range, and
continuous waveform)
PCE-830 + PCE-6801 (100A)
Range (0 to 100A) Resolution Accuracy of Readings
1
5.0 – 999.9 W 0.1W ±1% ± 0.8W
1.000 – 9.999 KW 0.001 KW ±1% ± 8W
10.00 – 99.99 KW 0.01 KW ±1% ± 80W
100.0 – 999.9 KW 0.1 KW ±1% ± 0.8KW
1000 – 9999 KW 1 KW ±1% ± 8KW
(50 or 60 Hz, PF 0.5 to 1, CT = 1, Voltage > AC 20V, Current > AC 0.4A for 10A
range, Current > AC 4A for 100A range, Current > AC 40A for 1000A range, and
continuous waveform)
PCE-830 + PCE-6802 (1000A)
Range (0 to 1000A) Resolution Accuracy of Readings
2
5.0 – 999.9 W 0.1W ±1% ± 0.8W
1.000 – 9.999 KW 0.001 KW ±1% ± 8W
10.00 – 99.99 KW 0.01 KW ±1% ± 80W
100.0 – 999.9 KW 0.1 KW ±1% ± 0.8KW
1000 – 9999 KW 1 KW ±1% ± 8KW
0.000 – 9.999MW 0.001MW ±1% ± 80KW
(50 or 60 Hz, PF 0.5 to 1, CT = 1, Voltage > AC 20V, Current > AC 12A for 300A
range of 3007, Current > AC 120A for 3000A range of 3007, and continuous
waveform. Conductor is located at the center of flexible loop. Position sensitivity is
2% of range.
External field effect of < 40A/m and 200mm from the coupling is 1%
of range. Temperature coefficient is 0.02% of reading /°C)
PCE-830 + PCE-3007 (3000A/1200A)
Accuracy of Readings
3
Range (0 to
3000A/1200A)
Resolution
> 20 V and > 30A < 20V or < 30A
10.0 – 999.9 W 0.1W ±1% of range ±2% of range
1.000 – 9.999 KW 0.001 KW ±1% of range ±2% of range
10.00 – 99.99 KW 0.01 KW ±1% of range ±2% of range
100.0 – 999.9 KW 0.1 KW ±1% of range ±2% of range
Page 54

50
1000 – 9999 KW 1 KW ±1% of range ±2% of range
1,2,3
For CT ≠1, the accuracy in percentage is the same (±1%). But the
additional digits should be multiplied by the CT ratio.
For example, ±0.8W becomes ± 0.8W * CT ratio
Range of CT (Current Transformer) Ratio: 1 to 600
AC Apparent Power (VA, from 0.000VA to 9999 KVA):
VA = V r.m.s. x A r.m.s
AC Reactive Power (VAR, from 0.000 VAR to 9999 KVAR):
VAR = √(VA
2
– W2)
AC Active Energy (mWH, WH, or KWH, from 0 mWH to 999,999 KWH)
WH = W * Time (in hours)
AC Current
(50 or 60 Hz, Auto Range, True RMS, Crest Factor < 4, CT=1)
PCE-830+PCE-6801 (Overload Protection AC 200A)
Range Resolution Accuracy of Readings
4
0.04 – 1 A 0.1mA / 1mA ±0.5% ± 0.05A
0.4 – 10 A 0.001A / 0.01A ±0.5% ± 0.05A
4 – 100 A 0.01A / 0.1A ±1.0% ± 0.5A
PCE-830+PCE-6802 (Overload Protection AC 2000A)
Range Resolution Accuracy of Readings
5
10.00A 0.001A / 0.01A –
5A - 100.0A 0.01A / 0.1A ±0.5% ± 0.5A
50A – 1000.0 A 0.1A / 1A ±0.5% ± 5A
PCE-830+PCE-3007 (Overload Protection AC 3000A)
Range Resolution Accuracy of Readings6
10.0 – 300.0A 0.01A / 0.1A ±1% of range
300.0 – 3000A 0.1A / 1A ±1% of range
Page 55

51
4, 5, 6
For CT ≠1, the accuracy in percentage is the same (±0.5%). But the
additional digits should be multiplied by the CT ratio.
For example, ±0.5A becomes ±0.5A * CT ratio
AC Voltage
(50 or 60 Hz, Auto Range, True RMS, Crest Factor < 4, Input Impedance 10 MΩ,
VT (PT) = 1, Overload Protection AC 800V)
Range Resolution Accuracy of Readings
7
20.0 V – 500.0 V (Phase to Neutral) ±0.5% ± 5dgts
20.0 V – 600.0 V (Phase to Phase)
0.1 V
±0.5% ± 5dgts
7
For VT (PT) ≠1, the accuracy in percentage is the same (±0.5%). But the
additional digits should be multiplied by the VT ratio.
For example, ±5 digits becomes ±5 digits * VT (PT) ratio
Range of VT (Voltage Transformer) Ratio: 1 to 3000
Harmonics of AC Voltage in Percentage
(1 to 99th order, minimum voltage at the 50 or 60 Hz > AC 80V. If the voltage is 0 at
50 or 60 Hz, all the percentage (%) display is 0.)
Range Resolution Accuracy
1 – 20th ±2%
21 – 49th ±4% of reading ± 2.0%
50 – 99th
0.1%
±6% of reading ± 2.0%
Harmonics of AC Voltage in Magnitude
(1 to 99th order, minimum voltage at the 50 or 60 Hz > AC 80V, VT=1)
Range Resolution Accuracy
1 – 20th ±2% ± 0.5V
21 – 49th ±4% of reading ± 0.5V
50 – 99th
0.1V
±6% of reading ± 0.5V
Page 56

52
Harmonics of AC Current in Percentage
(1 to 99th order. Min. current at 50 or 60 Hz is: 3&(830+3&(6801 > 10% of the
range; 3&(830+3&(6802 > 20A; 3&(830+PCE-3007 > 30A. If the current
is 0 at 50 or 60 Hz, all the percentage (%) display is 0)
PCE-830+PCE-6801
Range Resolution Accuracy
1 – 10th ±0.2% of reading ± 1%
11 – 20th ±2% of reading ± 1%
21 – 50th (A range) ±5% of reading ± 1%
21 – 50th (mA range) ±10% of reading ± 1%
51 - 99th
0.1%
±35% of reading ± 1%
PCE-830+PCE-6802
Range Resolution Accuracy
1 – 20th ±2%
21 – 49th ±4% of reading ± 2.0%
50 – 99
th
0.1 %
±6% of reading ± 2.0%
PCE-830 + PCE-3007
Range Resolution Accuracy
1 – 20th 0.1% ±2%
21st – 50th 0.1% ±6%
51st – 99th 0.1% ±10%
Harmonics of AC Current in Magnitude
(1 to 99th order. Min. current at the 50 or 60 Hz: 3&(830+3&(6801 > 10% of the
range; 3&(830+3&(6802 > 20A. CT=1)
PCE-830+PCE-6801
Range Resolution Accuracy
1 – 10th ±0.2% of reading ±7dgts
11 – 20th ±2% of reading ±7dgts
21 – 50
th
(A range) ±5% of reading ±7dgts
21 – 50th (mA range) ±10% of reading ±7dgts
51 - 99th
0.1mA / 0.1A
±35% of reading ±7dgts
PCE-830+PCE-6802
Range Resolution Accuracy
1 – 20th ±2% of reading ±0.4A
21 – 49th ±4% of reading ±0.4A
50 – 99th
0.1A
±6% of reading ±0.4A
(1 to 99th order, min. current at the 50 or 60 Hz, True RMS < 300A for 3007, True
RMS )
Page 57

53
PCE-830+PCE-3007
Range
(0 – 300A for 3007)
(0 – 120A for 3009)
Resolution Accuracy
1 – 20th 0.1% ±2% of reading ± 4A
21st – 50th 0.1% ±4% of reading ± 4A
51st – 99th 0.1% ±6% of reading ± 4A
(1 to 99th order, min. current at the 50 or 60 Hz, 3000A > True RMS > 300A for 3007,
1200A > True RMS )
PCE-830+PCE-3007
Range
(300 – 3000A for 3007)
(120 – 1200A for 3009)
Resolution Accuracy
1 – 20th 0.1% ±2% of reading ± 40A
21st – 50th 0.1% ±4% of reading ± 40A
51st – 99th 0.1% ±6% of reading ± 40A
Power Factor
(PF)
PCE-830+PCE-6801 or PCE-830+PCE-6802
Range Resolution Accuracy
0.00 – 1.00 0.01 ± 0.04
PCE-830+PCE-3007
Accuracy
Range Resolution
> 20V and > 30A < 20V or < 30A
0.000 – 1.000 0.001 ± 0.04 ±0.1
Phase Angle
(Φ)
PCE-830+PCE-6801 or PCE-830+PCE-6802
Range Resolution Accuracy
-180° to 180° 0.1° ± 1°
PCE-830+3PCE-3007 (Φ, V > 20V, A > 30A)
Range Resolution Accuracy
-180° to 180° 0.1° ± 2°
0° to 360° 0.1° ± 2°
Peak Value
of ACV
(peak value > 20V)
or ACA
(peak value: 3&(830 +3&(6801> 10% of the
Page 58

54
range; model 3&(830+3&(6802> 20A; model 3&(830+3&(3007> 30A)
, VT=1
Range Sampling Time Accuracy of Reading
50 Hz 19μs ± 5% ± 30 digits
60 Hz 16μs ± 5% ± 30 digits
Crest Factor (C.F.)
of ACV
(peak value >20V)
or ACA
(peak value: 3&(830+3&(6801> 10% of the
range; model 3&(830+3&(6802> 20A; model 3&(830+3&(3007 > 30A), VT=1
Range Resolution Accuracy of Readings
1.00 – 99.99 0.01 ± 5% ± 30 digits
Frequency
in AUTO mode
PCE-830+PCE-6801 or PCE-830+PCE-6802
Range Resolution Accuracy
45 – 65 Hz 0.1Hz ± 0.1Hz
Frequency
of ACV
(RMS value > 10V)
or ACA
(RMS value > 30A)
PCE-830+PCE-3007
Range Resolution Accuracy
45 – 65 Hz 0.1 Hz ± 0.2Hz
Page 59

55
Total Harmonic Distortion
(THD-F with respect to the fundamental frequency, min. value at 50 or 60 Hz is
voltage > AC 80V and current is: 3&(830+3&(6801> 10% of the range;
3&(830+
3&(6802> 20A; 3&(830+3&(3007> 30A. Calculation is done over 1 to
50
th
Harmonics. If the voltage or current is 0 at 50 or 60 Hz, all the percentage (%)
display is 0).
PCE-830 + PCE-6801
Range Resolution Accuracy
0.0 – 20.0 % ± 1%
20.0 – 100% ±3% of reading ± 5%
100 – 999.9%
0.1%
±10% of reading ±10%
PCE-830 + PCE-6802
Range Resolution Accuracy
0.0 – 20% ± 2%
20 – 100% ± 6% of reading ± 1%
100 – 999.9 %
0.1%
± 10% of reading ± 1%
PCE-830 + PCE-3007
Range Resolution Accuracy
0.0 – 20% 0.1% ± 2%
20 – 100% 0.1% ± 6% of reading ± 5%
100 – 999.9 % 0.1% ± 10% of reading ± 10%
Page 60

56
GENERAL SPECIFICATIONS
PCE-830 Analyzer
Indoors Use
Battery Type: 1.5V SUM-3 x 8
External DC Input: Use only power supply adapter Model PHAPSA
Display: Dot Matrix LCD (240x128) with backlight
LCD Update Rate: 1 time / second
Power Consumption: 140mA (approx.)
No. Of Samples: 1024 samples / period
Data Logging Files: 85
Max. File Capacity: 17474 records (3P4W, 3P3W)
26210 records (1P3 W)
52420 records (1P2 W)
4096 records (50 Harmonics / record )
Sampling Time: 2 to 3000 seconds for data logging
Low battery Indication:
Overload Indication: OL
Operating Temperature: -10°C to 50°C
Operating Humidity: less than 85% relative
Storage Temperature: -20°C to 60°C
Storage Humidity: less than 75% relative
Dimension: 257(L) x 155(W) x 57(H) mm
10.1”(L) x 6.1”(W) x 2.3”(H)
Weight: 1160g (Batteries included)
Accessories: Test leads (3 meter long) x 4
Probes (3&(6801 or 3&(6802 or 3&(3007 ) x 3
Alligator clips x 4
Carrying bag x 1
Users manual x 1
Batteries 1.5V x 8
Software CD x 1
Software users manual x 1
USB to RS232 cable x 1
AC power adapter x 1
Page 61

57
PCE-6801 Current Probe (100A)
Conductor Size: 30mm (approx.)
Range Selection: Manual (1A, 10A, 100A)
Cable Length: 3000mm
Battery: powered by power analyzer
Dimension: 210mm (L) x 62mm (W) x 36mm (H)
8.3" (L) x 2.5" (W) x 1.4" (H)
Weight: 200g
PCE-6802 Current Probe (1000A)
Conductor Size: 55mm (approx.), 64 x 24mm (bus bar)
Range Selection: Manual (10A, 100A, 1000A)
Cable Length: 3000mm
Battery: powered by power analyzer
Dimension: 244mm (L) x 97mm (W) x 46mm (H)
9.6" (L) x 3.8" (W) x 1.8" (H)
Weight: 600g
PCE-3007 Flexible Current Probe (3000A)
Probe Length: 3007-24 24 in / 610 mm
Minimum Bending Diameter: 35mm
Connector Diameter: 23mm
Cable Diameter: 14mm
Cable Length from Probe to Box: 1700mm
Cable Length from Box to Output: 1700mm
Range Selection: Manual (300A, 3000A)
Battery: powered by power analyzer
Dimension (Box): 130mm(L) x 80mm(W)x 43mm(H)
5.1”(L) x 3.1”(W) x 1.7”(H)
Weight: 410g
Page 62

5
XII. BATTERY REPLACEMENT
When the low battery symbol is displayed on the LCD, replace the old batteries with
eight new batteries.
Page 63

60
Turn the power off and remove all the test leads and current probes from the unit.
1. Remove the screw of the battery cover.
2. Lift and remove the battery cover.
3. Remove the old batteries.
4. Insert eight new 1.5V SUM-3 batteries.
5. Replace the battery cover and secure the screw.
Page 64

61
XIII. MAINTENANCE & CLEANING
Servicing not covered in this manual should only be performed by qualified
personnel. Repairs should only be performed by qualified personnel. Periodically
wipe the case with a damp cloth and detergent; do not use abrasive s or solvents.
For flexible probes (PCE-3007):
Always inspect the flexible current probe for any damage. If any damage is found,
do not use the flexible current probe. Return the probe to a qualified person for repair
or replacement.
Page 65

62
XIV. NOMENCLATURE
V12, V23, V31: Line Voltage
V1, V2, V3: Phase Voltage
I1, I2, I3: Line Current
P1, P2, P3: True Power (W) of Each Phase
S1, S2, S3: Apparent (VA) Power of Each Phase
Q1, Q2, Q3: Reactive Power (VAR) of Each Phase
PΣ: Total System Power (W)
SΣ: Total System Apparent Power (VA)
QΣ: Total System Reactive Power (VAR)
PFΣ: Total System Powe r Factor (PF)
PF1, PF2, PF3: Power Factor of Each Phase
PFH: Long Term Average Power Factor (WH / SH )
Φ1, Φ2, Φ3: Phase Angle of Each Phase
WH: Watt Hours
SH: VA hours
QH: VAR hours
HZ: Selected Frequency 50, 60 or Auto.
MD: Maximum Demand in W and VA over Specified Interval
3P4W: 3 Phase 4 Wire System
3P3W: 3 Phase 3 Wire System
1P2W: Single Phase 2 Wire System
1P3W: Single Phase 3 Wire System
SEC: sampling interval in seconds from 2 to 3000 for data logging
CT: Current Transformer Ratio from 1 to 600
VT: Voltage Transformer Ratio from 1 to 3000
 Loading...