

Page 1
®
Top Valve
Bottom Valve
Val ve
Handles
1 Liter Reservoir
1 Liter Reservoir
Milliliter
Scale
Centimeter
Scale
Pouring Spout
Instruction Manual
012-12254A
*012-12254*
PASCO Earth Science
Density Circulation Model
ME-6816
800-772-8700 www.pasco.com
Page 2

®
Density Circulation Model ME-6816
Recommended Equipment* Other Items
PASPORT Temperature Sensor (PS-2125 or equivalent) Water
PASPORT Salinity Sensor (PS-2195) Ice cubes
PASPORT® Interface Salt, reagent grade (non-iodized)
PASCO Data Acquisition Software Food coloring (or equivalent)
*See the PASCO catalog or PASCO web site at www.pasco.com for more information.
Introduction
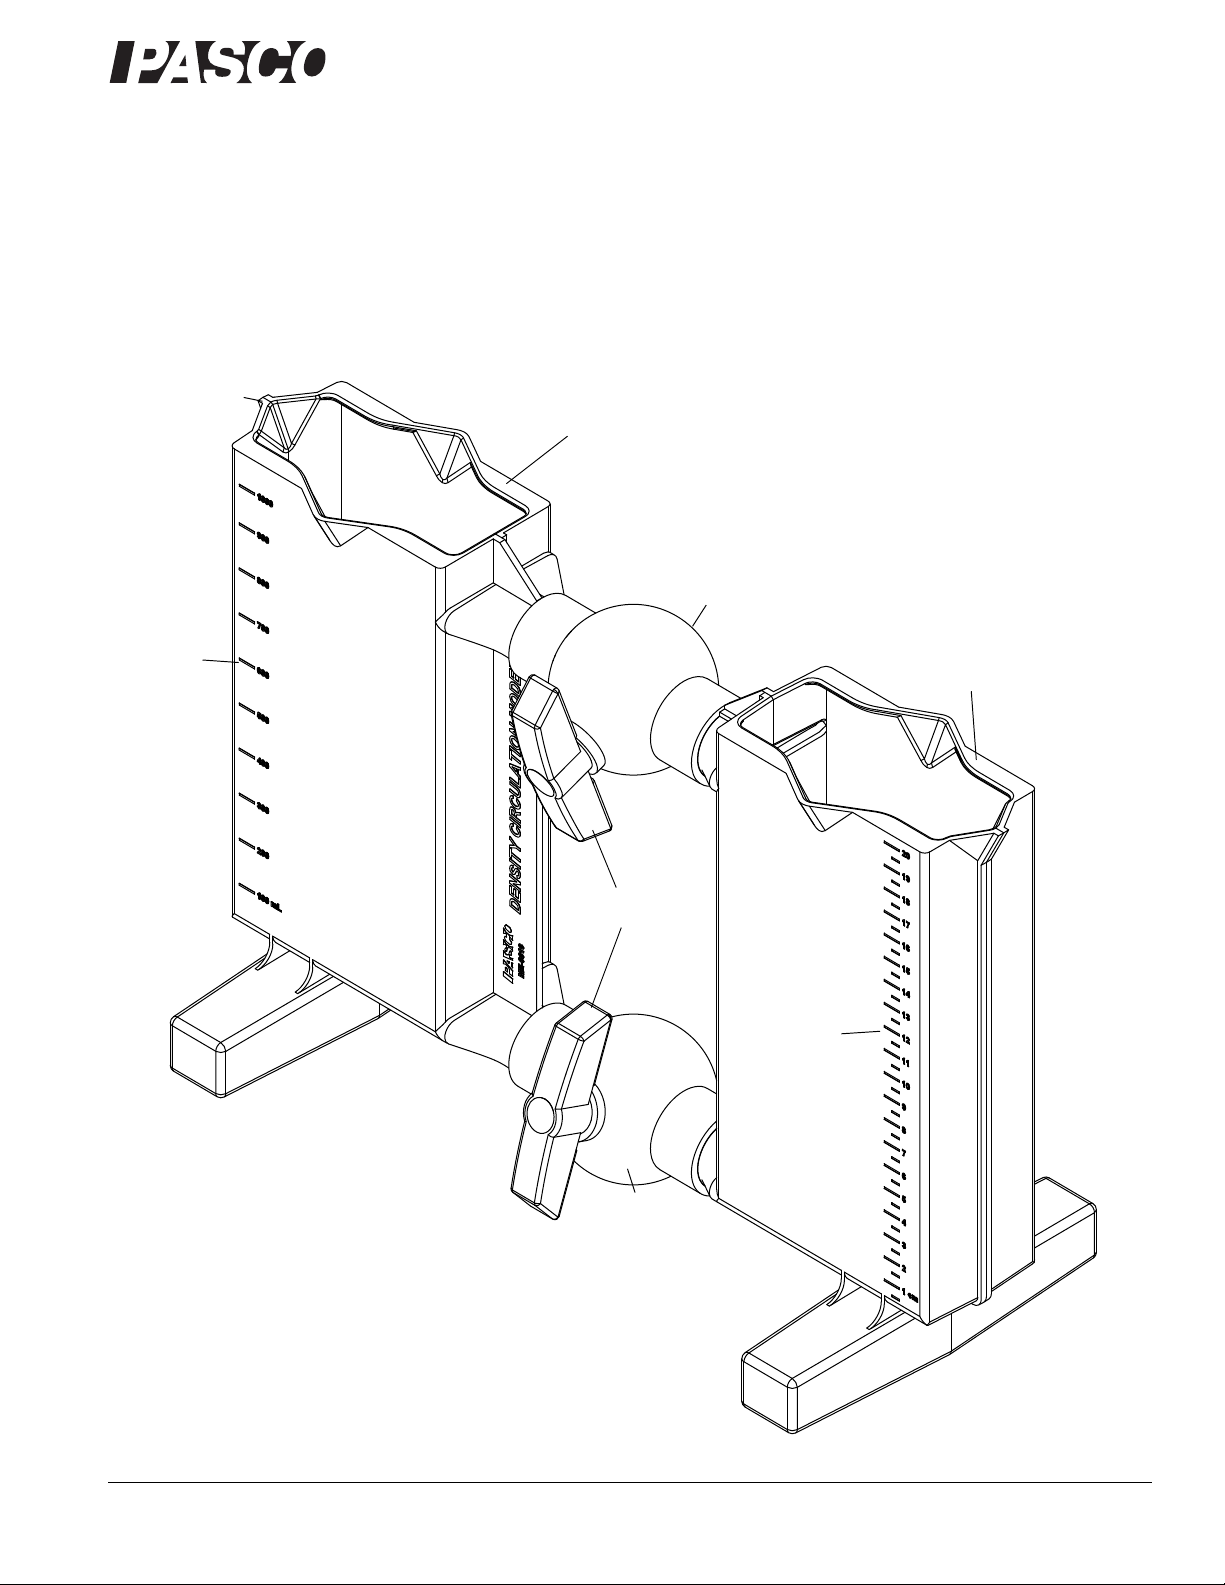
The Density Circulation Model consists of two one-liter reservoirs connected by two valves. Each reservoir has a milliliter (mL)
scale on one side and a centimeter (cm) scale on the other side for measuring volume and depth. The reservoirs feature pouring
spouts on three sides.
When the valve handles are vertical, the valves are closed. Turn a handle so it is horizontal in order to open the valve.
The Density Circulation Model is designed to allow students to investigate the circulation of fluids with different densities due to
conditions such as differences in temperature or differences in salinity.
Background
Temperature and Salinity
Two of the most important characteristics of Earth’s oceans are the temperature and salinity (salt content) of the water. Together,
temperature and salinity determine the density of the water, which is a major factor controlling the circulation and vertical movement of ocean water. Density-driven circulation accounts for 90% of all the movement of water (currents) in the oceans. Water
movement of this type is also called thermohaline circulation (“thermo” for temperature and “haline” for salinity). Colder and saltier water is heavier than warmer, fresher water. Water gets denser in higher latitudes due to the cooling of the atmosphere and the
increased salt levels, which result from the freezing of surface water. (Frozen water normally contains mostly freshwater, leaving
higher concentrations of salt in the water that remains liquid.) The polar regions have very dense, very cold, and very salty water.
Evaporation can also cause an increase in salinity. As sea water evaporates, the salt is left behind, increasing the salinity. (The
Mediterranean Sea is an example of an area where this happens.)
The global average for sea-water temperature is 3.51 °C. Although surface water temperatures can range from 10 °C to 25 °C,
about 77 percent of the water in the oceans is cooler than 4 °C. The global average for salinity is 34.72 grams (g) of dissolved solids per kilogram (kg) of seawater. Most of the water in the ocean is in the narrow salinity range of 33.8 to 36.8 g/kg.
Differences in water density generate slow moving currents due to the sinking of the colder, saltier water into deeper parts of the
oceans' basins and the displacement of lighter, less salty water upward. Deep water currents move very slowly, usually around 1
meter per hour (0.001 km/h), compared to wind-driven surface water currents that move at about 1 km per hour (0.6 miles per
hour). Dense water will sink until it reaches an area of even denser water. The water will then spread horizontally as more water
sinks behind it. For example, Antarctic Bottom Water, formed along the coast of Antarctica, will sink below less dense water as it
makes its way north toward the equator. As the dense water moves north, it is warmed by the surrounding water. As it warms and
becomes less dense, the water will rise toward the surface. This upwelling of water from the polar regions provides essential nutrients for phytoplankton which live closer to the surface, and phytoplankton is the beginning of the food chain for many of the creatures in the ocean.
Ocean Layers
The ocean has layers of water that differ in temperature. Overall, there is a three layered thermal structure in most of the ocean. The
lop layer of water is called the mixed layer. The sun-warmed surface water mixes with cooler, deeper water due to winds, breaking
waves, and turbulent currents. Below the mixed layer is the main thermocline that extends down about 1,000 m. The temperature
in this layer changes rapidly with depth. The main themocline separates the warmer mixed layer from the cooler deep layer that
extends to the ocean floor).
2
Page 3

®
ME-6816 012-12254A Theory
Theory
• Water density is affected by temperature and salinity, resulting in deep water currents in the ocean.
Procedure
Temperature Differences
Prepare the water
You will need a hot plate, two containers (one-liter or larger), water, ice cubes, a stirring rod, and food coloring.
• Fill one of the containers with one liter of cool water and add six ice cubes. Stir the water until all of the ice melts.
• At the same time, fill the other container with one liter of water and place the container on the hot plate. Stir the water as it
warms up to at least 10 ° C above room temperature.
Prepare the chambers
• Start with the top and bottom valves closed on the Density Circulation Model.
• Add one liter of the ice cold water to one reservoir and add one liter of warm water to the other reservoir. Stir the water in each
chamber to make sure they are homogeneous.
• Add a few drops of food coloring to each reservoir. Stir if necessary.
• Allow the model to sit very still for a few minutes.
Observe and Record
1. Open the top and bottom valves to allow circulation.
2. Observe the movement of the more dense, cooler water and the less dense, warmer water.
3. Record what happens in both reservoirs.
Salinity Differences
• Start with the top and bottom valves open. Add cool tap water to each reservoir until the water level is at 1 liter for both. Close
the top and bottom valves after you add the water.
• Instead of ice, add about 200 g of salt to one of the reservoirs. Use a stirring rod or long handle spoon to stir the salt and water
until all of the salt is dissolved. Follow the same procedure as for water.
1. Allow the model to sit very still for a few minutes. Add a few drops of food coloring to each reservoir.
2. Open the top and bottom valves to allow circulation.
3. Observe the movement of the more dense, saltier water and the less dense, fresh water.
4. Record what happens in both reservoirs.
Using the Model with a Temperature Sensor
Equipment Setup
1. If you are using a computer, connect a PASCO interface to the computer, turn on the interface, and turn on the computer.
If you are using a stand alone interface, turn on the PASCO interface.
3
Page 4

®
Density Circulation Model ME-6816
2. Connect the PASCO sensors to the PASCO interface.
3. Prepare the Density Circulation Model.
Experiment Setup
• Use the data acquisition software to set up a Table into which you can enter data and a Graph to view your data.
1. Use the PASCO data acquisition software to set up an experiment with a Table display of Temperature and Depth (cm).
2. Set up the experiment for manual sampling so that temperature is measured by the sensor and depth is entered manually. Enter
the depth data in the Table display starting at 20 cm and ending at 1 cm with 1 cm decrements.
3. Set up a Graph display that will show Temperature versus Depth (cm).
Data Recording
Note: Data recording is easier if one person handles the Density Circulation Model and another person handles the computer or
data logger.
1. Put the temperature sensor in the warm water reservoir at the 10 cm depth.
2. Click or touch “Start” to begin data recording. Click or touch the “Keep” button to record the initial temperature of the warm
reservoir. Click or touch “Stop” to end data recording.
3. Record the value of the initial temperature of the warm reservoir in the Data section.
4. Move the temperature sensor to the cool reservoir and repeat the process to measure and record the initial temperature of the
cool reservoir.
5. Delete the first two data runs after you have recorded the initial temperatures in the Data section.
6. Open the top valve and the bottom valve to allow circulation. Wait a few minutes.
7. Position the tip of the temperature sensor at the 20 cm mark of one of the reservoirs.
8. Click or touch “Start” to begin data recording.
• Watch the value of temperature in the first cell of the Table display.
9. Click or touch “Keep” to record the value of temperature at the 20 cm mark.
10. Move the temperature sensor so the tip is at the 19 cm mark of the reservoir. Wait a few seconds.
11. Click or touch “Keep” to record the value of temperature at the 19 cm mark
12. Continue the process until the tip of the temperature sensor is at the 1 cm mark. After recording the value at the 1 cm mark,
click or touch “Stop” to end data recording.
4
Page 5
®
ME-6816 012-12254A Data
Data
Warm reservoir Cool reservoir
Initial Temperature
Data Analysis
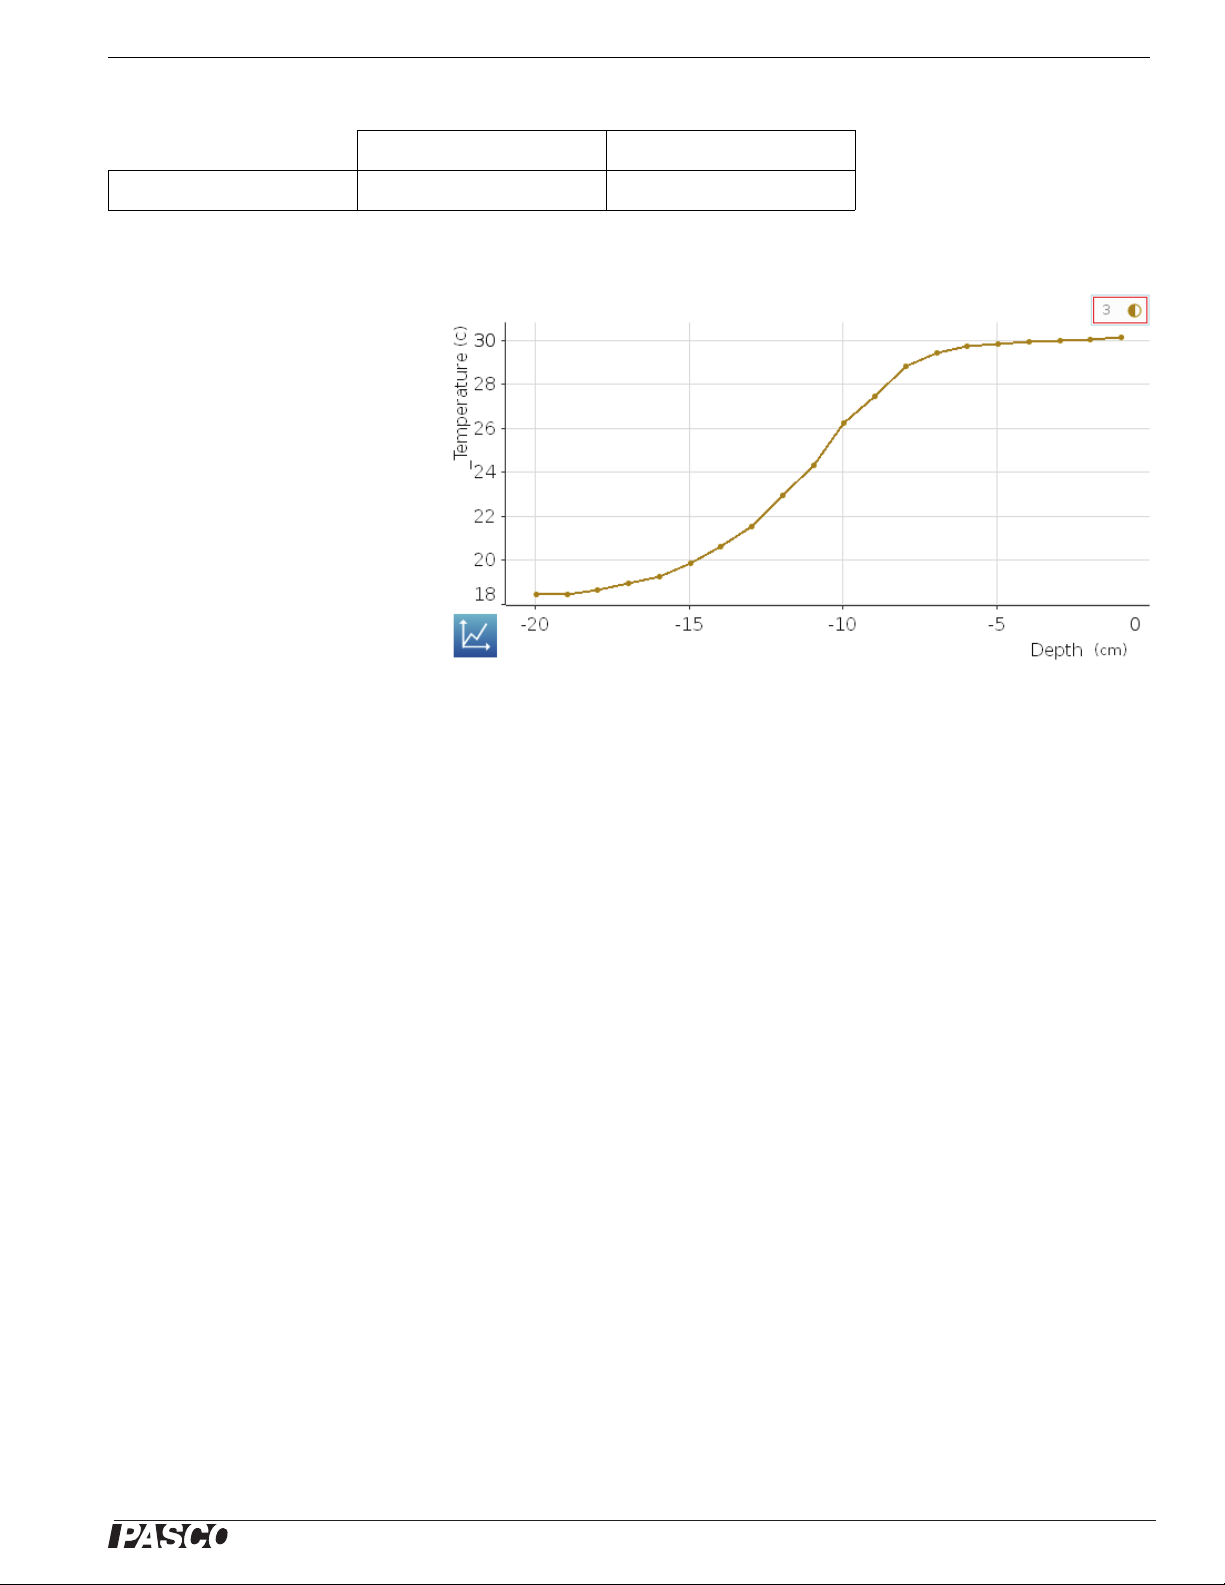
1. Examine the data in the Graph display. Resize the graph area if necessary to see all of the data.
2. Identify the zone of rapid temperature change on the Graph.
3. Use the data analysis tools to determine the final temperatures in both
reservoirs.
Questions
1. How does the colored “mixed”
zone compare to the zone of rapid
temperature change?
2. How is the temperature at the very top and very bottom different after the mix?
3. How does the mixed model relate to actual water bodies in the oceans?
Using the Model with a Salinity Sensor
Equipment Setup
1. Replace the temperature sensor with a PASCO Salinity Sensor.
2. Prepare the Density Circulation Model for salinity.
Experiment Setup
• Use the data acquisition software to set up a Table into which you can enter data and a Graph to view your data.
1. Use the PASCO data acquisition software to set up an experiment with a Table display of Conductivity and Depth (cm).
2. Set up the experiment for manual sampling so that conductivity is measured by the sensor and depth is entered manually. Enter
the depth data in the Table display starting at 20 cm and ending at 1 cm with 1 cm decrements.
3. Set up a Graph display that will show Conductivity versus Depth (cm)..
Data Recording
Note: Data recording is easier if one person handles the Density Circulation Model and another person handles the computer or
data logger.
1. Put the salinity sensor in the warm water reservoir at the 10 cm depth.
2. Click or touch “Start” to begin data recording. Click or touch the “Keep” button to record the initial conductivity of the warm
reservoir. Click or touch “Stop” to end data recording.
5
Page 6
®
Density Circulation Model ME-6816
3. Record the value of the initial conductivity of the warm reservoir in the Data section.
4. Move the salinity sensor to the cool reservoir and repeat the process to measure and record the initial conductivity of the cool
reservoir.
5. Delete the two data runs after you have recorded the initial conductivity of each reservoir in the Data section.
6. Open the top valve and the bottom valve to allow circulation. Wait a few minutes.
7. Position the tip of the salinity sensor at the 20 cm mark of one of the reservoirs.
8. Click or touch “Start” to begin data recording.
• Watch the value of conductivity in the first cell of the Table display.
9. Click or touch “Keep” to record the value of conductivity at the 20 cm mark.
10. Move the salinity sensor so the tip is at the 19 cm mark of the reservoir. Wait a few seconds.
11. Click or touch “Keep” to record the value of conductivity at the 19 cm mark
12. Continue the process until the tip of the salinity sensor is at the 1 cm mark. After recording the value at the 1 cm mark, click or
touch “Stop” to end data recording.
Data
Warm reservoir Cool reservoir
Initial Conductivity
Data Analysis
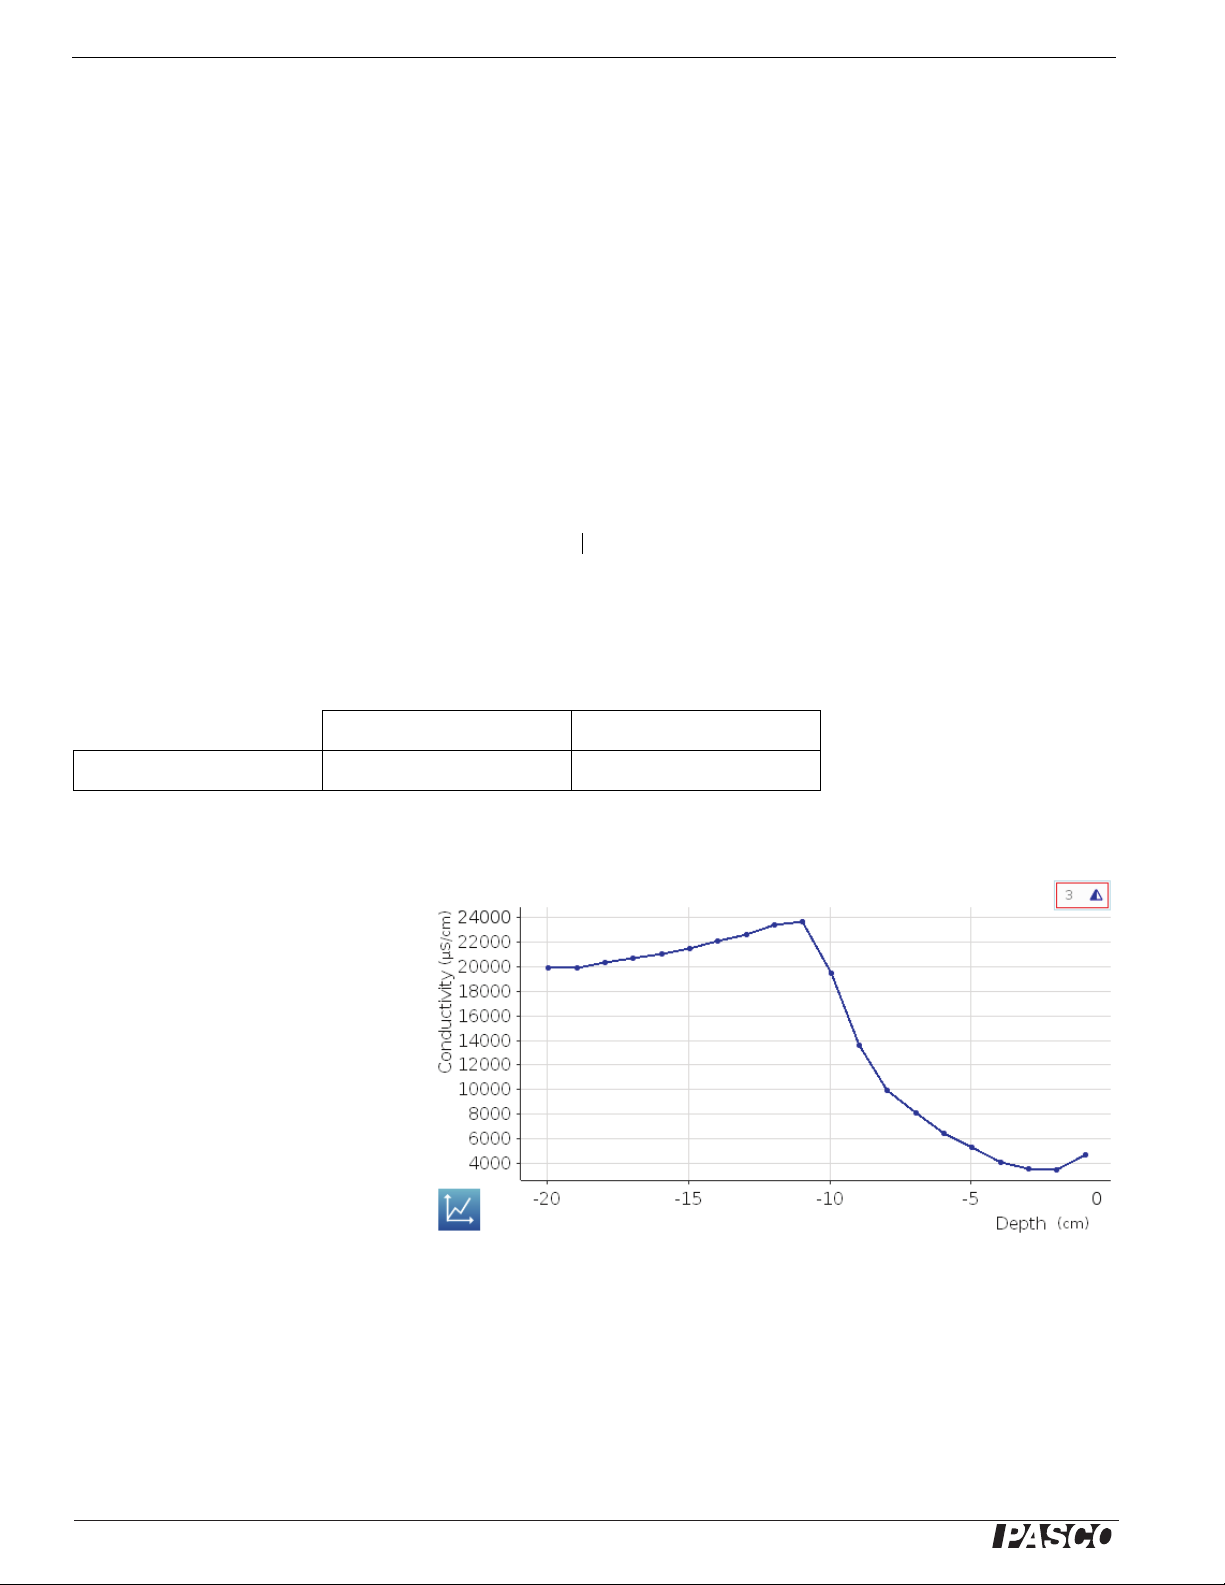
1. Examine the data in the Graph display.
Resize the graph area if necessary to
see all of the data.
2. Identify the zone of rapid conductivity
change on the Graph display.
3. Use the data analysis tools to determine the final conductivities in both
reservoirs.
Questions
1. How does the colored “mixed” zone
compare to the zone of rapid conductivity change?
2. How is the conductivity at the very top and very bottom different after the mix?
3. How does the mixed model relate to actual water bodies in the oceans
6
Page 7

®
ME-6816 012-12254A Other Density Circulation Phenomena
Other Density Circulation Phenomena
Inversion
• Put warm salt water in one reservoir and cold fresh water in the other reservoir to observe the phenomenon of temperature
inversion. In an estuary, cold fresh water will sometimes “float” on top of warm salt water.
Convection
• Fill both reservoirs with the same temperature or same salinity of water. Add a few drops of food coloring. Shine a light on one
reservoir to observe the convection of the water
Technical Support
For assistance with any PASCO product, contact PASCO at:
Address: PASCO scientific
10101 Foothills Blvd.
Roseville, CA 95747-7100
Phone: 916-786-3800 (worldwide)
800-772-8700 (U.S.)
Fax: (916) 786-7565
Web: www.pasco.com
Email: support@pasco.com
For the latest revision of this Instruction Manual, visit:
www.pasco.com/go?ME-6816
Limited Warranty For a description of the product warranty, see the PASCO catalog. Copyright The PASCO scientific 012-12254A Density
Circulation Model Instruction Manual is copyrighted with all rights reserved. Permission is granted to non-profit educational institutions for reproduc-
tion of any part of this manual, providing the reproductions are used only in their laboratories and classrooms, and are not sold for profit. Reproduction under any other circumstances, without the written consent of PASCO scientific, is prohibited. Trademarks PASCO and PASCO scientific are
trademarks or registered trademarks of PASCO scientific, in the United States and/or in other countries. All other brands, products, or service names
are or may be trademarks or service marks of, and are used to identify, products or services of, their respective owners. For more information visit
www.pasco.com/legal.
7
 Loading...