


Guide to Using
NeuralTools
Neural Network Add-In for
®
Microsoft
Version 5.5
February, 2009
Excel
Palisade Corporation
798 Cascadilla St.
Ithaca, NY USA 14850
(607) 277-8000
(607) 277-8001 (fax)
http://www.palisade.com (website)
sales@palisade.com (e-mail)

Copyright Notice
Copyright © 2009, Palisade Corporation.
Trademark Acknowledgments
Microsoft, Excel and Windows are registered trademarks of Microsoft, Inc.
IBM is a registered trademark of International Business Machines, Inc.
Palisade, TopRank, BestFit and RISKview are registered trademarks of Palisade
Corporation.

Welcome to NeuralTools for Excel
Welcome
NeuralTools gives Microsoft Excel - the industry-standard data
analysis and modeling tool - a new, powerful modeling toolset!
NeuralTools is a Microsoft Excel neural networks add-in, allowing
you to analyze data in Excel worksheets and work in the familiar
Microsoft Office environment. By combining a powerful data
manager, along with state-of-the-art neural networks algorithms,
NeuralTools brings you the best of two worlds: Microsoft Office easeof-use and reporting, with robust, accurate predictions from neural
networks.
Work Where You're Comfortable
If you know Excel, you'll know NeuralTools! NeuralTools works just
as Excel does, with toolbars, menus and custom worksheet functions,
all inside of Excel. Unlike stand-alone neural networks software,
there's no steep learning curve and upfront training costs with
NeuralTools, because you work just as you are used to working in
Excel. Your data and variables are in Excel spreadsheets. You can
utilize standard Excel formulas for calculations, along with Excel
sorting and pivot tables. Reports and charts from your analyses are in
standard Excel format and can utilize all of Excel's built-in formatting
capabilities.
Welcome to NeuralTools for Excel i

NeuralTools Analyses
Neural Networks are capable of learning complex relationships in
data. By mimicking the functions of the brain, they can discern
patterns in data, and then extrapolate predictions when given new
data. The problems Neural Networks are used for can be divided in
two general groups:
• Classification Problems: Problems in which you are trying to
determine what type of category an unknown item falls into.
Examples include medical diagnoses and prediction of credit
repayment ability.
• Numeric Problems: Situations where you need to predict a
specific numeric outcome. Examples include stock price
forecasting and predicting the level of sales during a future
time period.
Neural Networks are used in a broad range of applications including:
stock market prediction, credit and loan risk assignment, credit fraud
detection, forecasting sales, general business forecasting, investment
risk, medical diagnosis, research in scientific fields, and control
systems.
NeuralTools includes the latest neural network algorithms to make
the best predictions on both classification problems (called category
prediction in NeuralTools) and numeric problems.
NeuralTools Data Management
NeuralTools provides a comprehensive dataset and variable manager
right in Excel, similar to that provided with StatTools, Palisade's
statistics add-in for Excel. You can define any number of datasets,
each with the variables you want to analyze, directly from your data
in Excel. NeuralTools intelligently assesses your blocks of data,
suggesting variable names and types as well as data locations. Your
datasets and variables can reside in different workbooks and
worksheets, allowing you to organize your data as you see fit. Then,
you train neural networks that refer to your variables, instead of reselecting your data over and over again in Excel. And NeuralTools'
variables aren't limited in size to a single column of data in an Excel
worksheet – you can use the same column across up to 255
worksheets for a single variable!
ii Welcome

NeuralTools Reporting
Excel is great for reports and graphs, and NeuralTools makes the
most of this. NeuralTools uses Excel-format graphs, which can be
easily customized for new colors, fonts and added text. Report titles,
number formats and text can be changed just as in any standard Excel
worksheet. Drag and drop tables and charts from NeuralTools
reports straight into your own documents in other applications.
NeuralTools Industrial also includes Live Prediction, where predicted
values are calculated as new data is entered into your Excel
worksheet. This live calculation happens automatically, just like other
Excel recalculations.
Data Access and Sharing
Excel has great data import features, so bringing your existing data
into NeuralTools is easy! Use standard Excel capabilities to read in
data from Microsoft SQL Server, Oracle, Microsoft Access, or any
other ODBC compliant database. Load data from text files or other
applications – if you can read it into Excel, you can use it with
NeuralTools!
NeuralTools saves all its results and data in Excel workbooks. Just
like any other Excel file, you can send your NeuralTools results and
networks to colleagues anywhere. Sharing couldn't be easier!
NeuralTools Professional and Industrial Versions
NeuralTools is available in two versions – Professional and Industrial.
The differences are as follows:
• Datasets in NeuralTools Professional are limited to 1000 cases,
while NeuralTools Industrial supports datasets with up to
16,777,216 cases.
• Live Prediction, where predicted values are calculated as new
data is entered into your Excel worksheet, is provided in
NeuralTools Industrial only. This live calculation happens
automatically, just like other Excel recalculations.
Welcome to NeuralTools for Excel iii

iv Welcome

Table of Contents
Chapter 1: Getting Started 1
Introduction.........................................................................................3
Checking Your Package ..........................................................................3
What the Package Includes.....................................................................3
About This Version .................................................................................3
Working with your Operating Environment ......................................4
If You Need Help .....................................................................................4
NeuralTools System Requirements......................................................6
Installation Instructions.....................................................................7
General Installation Instructions..........................................................7
Setting Up the NeuralTools Icons or Shortcuts..................................8
The DecisionTools Suite.........................................................................9
Software Activation..........................................................................11
Chapter 2: An Overview of NeuralTools 15
Overview............................................................................................17
Why Neural Networks?.........................................................................17
NeuralTools and Neural Networks ....................................................18
NeuralTools Menu and Toolbar..........................................................19
Data Sets and the Data Set Manager ..................................................19
Training a Neural Network..................................................................21
Testing a Network..................................................................................26
Prediction.................................................................................................27
NeuralTools Reports and Charts.........................................................29
NeuralTools Utilities.............................................................................29
Using NeuralTools with StatTools, Solver and Evolver.................30
Chapter 3: NeuralTools Reference Guide 31
Introduction.......................................................................................33
Reference: NeuralTools Icons 35
NeuralTools Toolbar.........................................................................35
Table of Contents v

Reference: NeuralTools Menu Commands 37
Introduction ...................................................................................... 37
Icons in Dialog Boxes ........................................................................... 38
Command Reference ....................................................................... 39
Data Set Manager Command .............................................................. 39
Train Command..................................................................................... 44
Test Command....................................................................................... 56
Predict Command.................................................................................. 64
Utilities ..............................................................................................69
Application Settings Command ......................................................... 69
Neural Net Manager Command ......................................................... 72
Missing Data Utilities Command ...................................................... 74
More on Neural Networks 77
Neural Network Basics ....................................................................77
Neural Nets vs. Statistical Methods................................................... 77
The Structure of a Neural Net............................................................. 78
Numeric and Category Prediction...................................................... 78
Training a Net........................................................................................ 78
Computer Processing of Neural Nets................................................ 79
Types of Neural Networks .................................................................. 79
Multi-Layer Feedforward Nets.........................................................81
MLF Architecture .................................................................................. 81
MLF Net Training ................................................................................. 83
Generalized Regression Neural Nets and Probabilistic Neural
Nets ................................................................................................87
Generalized Regression Neural Nets ................................................ 87
Probabilistic Neural Nets .................................................................... 89
Comparison of MLF Nets to PN/GRN Nets ....................................93
Input Transformation.......................................................................95
Recommended Readings ................................................................97
Index 99
vi Welcome

Chapter 1: Getting Started
Introduction.........................................................................................3
Checking Your Package ..........................................................................3
What the Package Includes.....................................................................3
About This Version .................................................................................3
Working with your Operating Environment ......................................4
If You Need Help .....................................................................................4
NeuralTools System Requirements......................................................6
Installation Instructions.....................................................................7
General Installation Instructions..........................................................7
Setting Up the NeuralTools Icons or Shortcuts..................................8
@RISK 4.5 Help System © Palisade Corporation, 1999
Chapter 1: Getting Started 1

2

Introduction
This introduction describes the contents of your NeuralTools package
and shows you how to install NeuralTools and attach it to your copy
of Microsoft Excel 2000 for Windows 2000 or higher.
Checking Your Package
Your NeuralTools package should contain:
The NeuralTools or DecisionTools Suite CD-ROM including:
• NeuralTools Program
• NeuralTools Tutorial
• The NeuralTools Users Guide (this book) in .PDF format
The NeuralTools Licensing Agreement
If your package is not complete, please call your NeuralTools dealer
or supplier or contact Palisade Corporation directly at (607) 277-8000.
What the Package Includes
NeuralTools may be purchased on its own and also ships with the
DecisionTools Suite Professional and Industrial versions. The
NeuralTools CD-ROM contains the NeuralTools Excel add-in, several
NeuralTools examples, and a fully-indexed NeuralTools on-line help
system. The DecisionTools Suite Professional and Industrial versions
contain all of the above plus additional applications.
About This Version
This version of NeuralTools can be installed as a 32-bit program for
Microsoft Excel 2000 or higher.
Chapter 1: Getting Started 3

Working with your Operating Environment
This User’s Guide assumes that you have a general knowledge of the
Windows operating system and Excel. In particular:
• You are familiar with your computer and using the mouse.
• You are familiar with terms such as icons, click, double-click, menu,
window, command and object.
• You understand basic concepts such as directory structures and file
naming.
If You Need Help
Technical support is provided free of charge for all registered users of
NeuralTools with a current maintenance plan, or is available on a per
incident charge. To ensure that you are a registered user of
NeuralTools, please register online at
http://www.palisade.com/support/register.asp.
If you contact us by telephone, please have your serial number and
User’s Guide ready. We can offer better technical support if you are
in front of your computer and ready to work.
Before Calling
4 Introduction
Before contacting technical support, please review the following
checklist:
• Have you referred to the on-line help?
• Have you checked this User's Guide and reviewed the on-line
multimedia tutorial?
• Have you read the README.WRI file? It contains current information
on NeuralTools that may not be included in the manual.
• Can you duplicate the problem consistently? Can you duplicate the
problem on a different computer or with a different model?
• Have you looked at our site on the World Wide Web? It can be found at
http://www.palisade.com. Our Web site also contains the latest FAQ
(a searchable database of tech support questions and answers) and
NeuralTools patches in our Technical Support section. We recommend
visiting our Web site regularly for all the latest information on
NeuralTools and other Palisade software.

Contacting Palisade
Palisade Corporation welcomes your questions, comments or
suggestions regarding NeuralTools. Contact our technical support
staff using any of the following methods:
• Email us at support@palisade.com.
• Telephone us at (607) 277-8000 any weekday from 9:00 AM to 5:00 PM,
EST. Follow the prompt to reach technical support.
• Fax us at (607) 277-8001.
• Mail us a letter at:
Technical Support
Palisade Corporation
798 Cascadilla St.
Ithaca, NY 14850 USA
If you want to contact Palisade Europe:
• Email us at support@palisade-europe.com.
• Telephone us at +44 1895425050 (UK).
• Fax us at +441895425051 (UK).
• Mail us a letter at:
Palisade Europe
31 The Green
West Drayton
Middlesex
UB7 7PN
United Kingdom
If you want to contact Palisade Asia-Pacific:
• Email us at support@palisade.com.au.
• Telephone us at +61 2 9929 9799 (AU).
• Fax us at +61 2 9954 3882 (AU).
• Mail us a letter at:
Palisade Asia-Pacific Pty Limited
Suite 101, Level 1
8 Cliff Street
Milsons Point NSW 2061
Australia
Regardless of how you contact us, please include the product name,
version and serial number. The exact version can be found by
selecting the Help About command on the NeuralTools menu in
Excel.
Chapter 1: Getting Started 5

Student Versions
Telephone support is not available with the student version of
NeuralTools. If you need help, we recommend the following
alternatives:
♦ Consult with your professor or teaching assistant.
♦ Log on to http://www.palisade.com for answers to frequently asked
questions.
♦ Contact our technical support department via e-mail or fax.
NeuralTools System Requirements
System requirements for NeuralTools 5.0 for Microsoft Excel for
Windows include:
• Pentium PC or faster with a hard disk.
• Microsoft Windows 2000 SP4, Windows XP or higher.
• Microsoft Excel 2000 or higher.
6 Introduction

Installation Instructions
General Installation Instructions
The Setup program copies the NeuralTools system files into a
directory you specify on your hard disk.
To run the Setup program in Windows 2000 or higher:
1) Insert the NeuralTools or DecisionTools Suite CD-ROM in your CD-
ROM drive
2) Click the Start button, click Settings and then click Control Panel
3) Double-click the Add/Remove Programs icon
4) On the Install/Uninstall tab, click the Install button
5) Follow the Setup instructions on the screen
If you encounter problems while installing NeuralTools, verify that
there is adequate space on the drive to which you’re trying to install.
After you’ve freed up adequate space, try rerunning the installation.
Removing NeuralTools from Your Computer
Chapter 1: Getting Started 7
If you wish to remove NeuralTools from your computer, use the
Control Panel’s Add/Remove Programs utility and select the entry
for NeuralTools.

Setting Up the NeuralTools Icons or Shortcuts
Creating the Shortcut in the Windows Taskbar
In Windows, setup automatically creates a NeuralTools command in
the Programs\Palisade DecisionTools menu of the Taskbar.
However, if problems are encountered during Setup, or if you wish to
do this manually another time, follow these directions. Note that the
directions given below are for Windows XP Professional. Instructions
for other operating systems may vary.
1) Click the Start button, and then point to Settings.
2) Click Taskbar and Start Menu, and then click the Start Menu tab.
3) Click Customize, click Add, and then click Browse.
4) Locate the file NeuralTools.EXE, click it and then click OK.
5) Click Next, and then double-click the menu on which you want the
program to appear.
6) Type the name “NeuralTools”, and then click Finish.
7) Click OK on all opened dialogs.
8 Installation Instructions

The DecisionTools Suite
NeuralTools is part of the DecisionTools Suite, a set of products for
risk and decision analysis available from Palisade Corporation. The
default installation procedure of NeuralTools puts NeuralTools in a
subdirectory of a main “Program Files\Palisade” directory. This is
quite similar to how Excel is often installed into a subdirectory of a
“Microsoft Office” directory.
One subdirectory of the Program Files\Palisade directory will be the
NeuralTools directory (by default called NeuralTools5). This
directory contains the NeuralTools add-in program file
(NEURALTOOLS.XLA) plus example models and other files
necessary for NeuralTools to run. Another subdirectory of Program
Files\Palisade is the SYSTEM directory which contains files needed
by every program in the DecisionTools Suite, including common help
files and program libraries.
Chapter 1: Getting Started 9

10 Installation Instructions
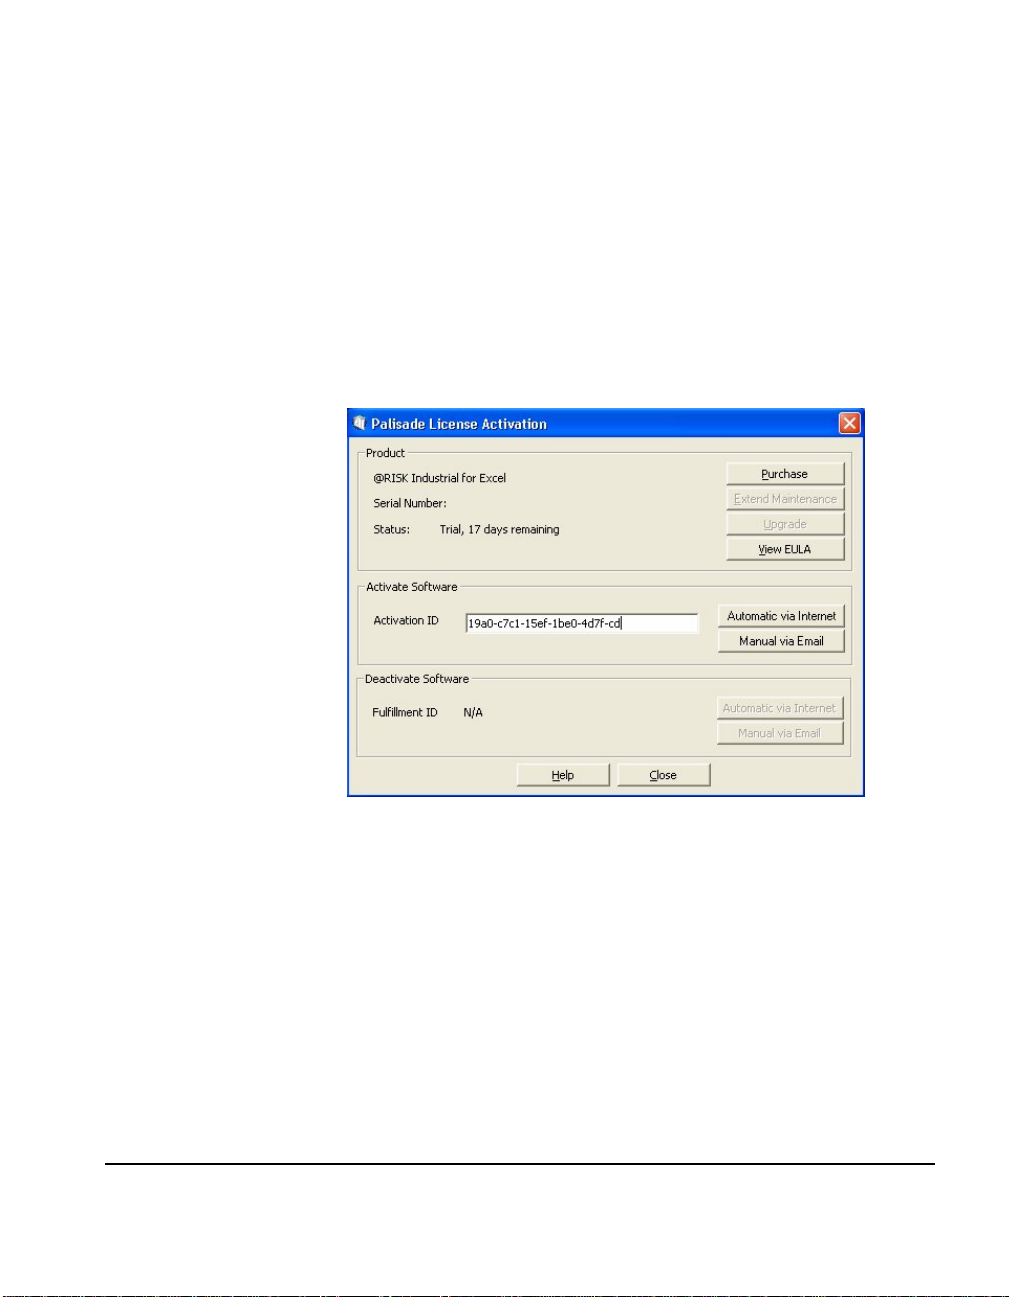
Software Activation
Activation is a one time license verification process that is required in
order for your NeuralTools software to run as a fully licensed
product. An activation code is on your printed/emailed invoice and
may resemble a dash separated sequence like "19a0-c7c1-15ef-1be04d7f-cd". If you enter your Activation code during installation, then
your software is activated the first time the software is run and no
further user action is required. If you wish to activate your software
after installation, select the NeuralTools Help menu License
Activation command and enter your activation code in the displayed
Palisade License Activation dialog box.
Frequently Asked Questions
Chapter 1: Getting Started 11
1) What if my software is not activated?
If you do not enter an activation code during installation or you are
installing a trial version, your software will run as a trial version with
time and/or number of uses limitations and must be activated with
an activation code in order to run as a fully licensed product.
2) How long can I use the product before I have to activate it?
Software that is not activated may be run for fifteen days. All of the
product's features are present, but the License Activation dialog will
appear each time the program is launched to remind you to activate
and to indicate the time remaining. If the 15 day trial period expires,
the software will require activation in order to run.

3) How do I check my activation status?
The License Activation dialog box is viewed through the NeuralTools
Help menu License Activation command. Activated software shows
a status of Activated and trial version software shows a status of Not
Activated. If the software is not activated, the remaining time that the
software is allowed to run is displayed.
4) How do I activate my software?
If you do not have an activation code you may obtain one by clicking
the Puchase button in the License Activation dialog. An online
purchase will be immediately given an activation code and an
optional link to download the installer should reinstallation become
necessary. To purchase by phone call the local Palisade office given
in the Contacting Palisade section of this chapter.
Activation may be done over the Internet or via email:
• Activation if you have Internet Access
In the Palisade License Activation dialog box, type or paste the
activation code and press "Automatic via Internet". A success
message should appear after a few seconds and the License Activation
dialog box will reflect the software's activated status.
• Activation if you do not have Internet Access
Automated activation by email requires a few steps:
1. Click "Manual via Email" to display the request.xml file
which you may save to disk or copy to the Windows
clipboard. (It is recommended you note the location on your
computer of the request.xml file.)
2. Copy or attach the XML file to an email and send it to
activation@palisade.com. You should receive an automatic
response to the return address in your email shortly.
3. Save the response.xml attachment in the response email to
your hard drive.
4. Click on the Process button that is now in the Palisade
License Activation dialog box and navigate to the
response.xml file. Select the file and click OK.
A success message should appear and the License Activation dialog
will reflect the software's activated status.
12 Software Activation

5) How do I transfer my software license to another machine?
Transfer of a license, or rehosting, may be peformed through the
Palisade License Activation dialog box as a two step procedure:
deactivation on the first machine and activation on the second machine.
A typical use of rehosting is to transfer your copy of NeuralTools
from your office PC to your laptop. To rehost a license from Machine1
to Machine2, make sure both machines have the software installed and
are connected to the Internet during the deactivation/activation
rehosting.
1. On Machine1, click deactivate Automatic via Internet in the
License Activation dialog. Wait for the success message.
2. On Machine2, click activate Automatic via Internet. Wait for
the success message.
If the machines do not have Internet access then you may follow the
similar instructions above for rehosting by the automated email
process.
6) I have Internet Access but I am still unable to Activate/Deactivate
automatically.
Your firewall must be set to allow TCP access to the licensing server.
For single user (non network installations) ths is
http://service.palisade.com:8888 (TCP port 8888 on
http://service.palisade.com).
Chapter 1: Getting Started 13

14 Software Activation

Chapter 2: An Overview of NeuralTools
Overview............................................................................................17
Why Neural Networks?.........................................................................17
NeuralTools and Neural Networks ....................................................18
NeuralTools Menu and Toolbar..........................................................19
Data Sets and the Data Set Manager ..................................................19
Variable Types ..........................................................................21
Multi-Range Data.....................................................................21
Training a Neural Network..................................................................21
Combining Training, Testing and Prediction.....................22
Net Configurations...................................................................22
Training Preview ......................................................................23
Training Process .......................................................................24
Training Reports.......................................................................25
Testing a Network..................................................................................26
Testing Reports.........................................................................26
Prediction.................................................................................................27
Prediction Results.....................................................................28
Live Prediction..........................................................................28
NeuralTools Reports and Charts.........................................................29
Chapter 2: An Overview of NeuralTools 15

16

Overview
NeuralTools provides you with powerful neural network capabilities
in an environment that you are familiar with - Microsoft Excel.
NeuralTools procedures - such as defining data sets, training and
testing neural networks and predicting values using trained networks
- can be run on your data in Excel and the reports and charts from
your analyses are created in Excel.
Why Neural Networks?
Neural Networks are capable of learning complex relationships in
data. By mimicking the functions of the brain, they can discern
patterns in data, and then extrapolate predictions when given new
data. The problems Neural Networks are used for can be divided in
two general groups:
• Classification Problems: Problems in which you are trying to
determine what type of category an unknown item falls into.
Examples include medical diagnoses and prediction of credit
repayment ability.
• Numeric Problems: Situations where you need to predict a
specific numeric outcome. Examples include stock price
forecasting and predicting the level of sales during a future
time period.
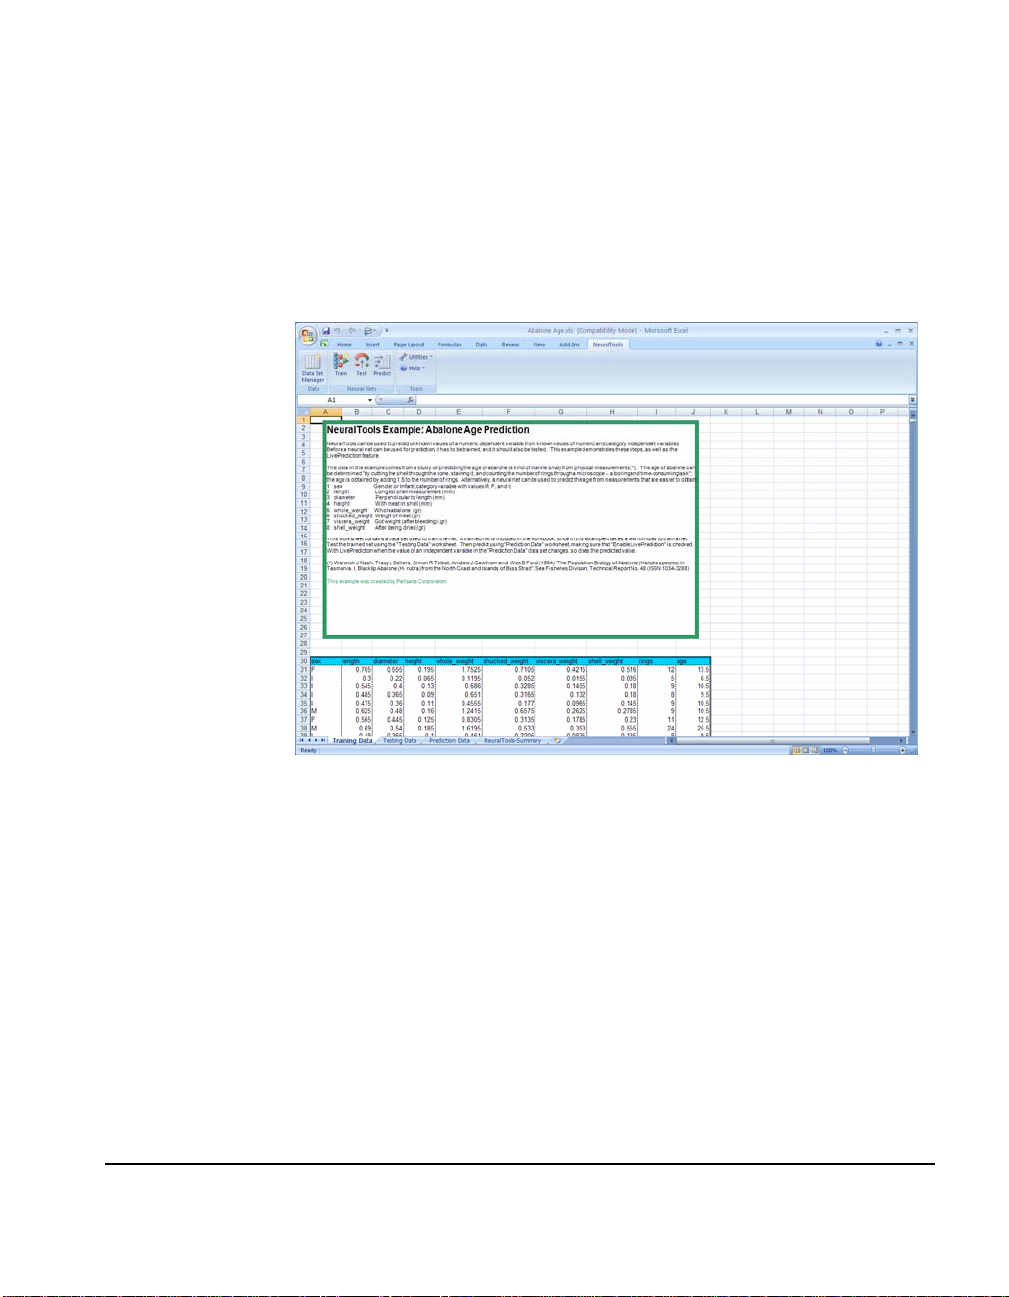
NeuralTools comes with examples that show how to apply neural
networks to different prediction problems. The
NeuralTools\Examples folder contains the provided examples as
Excel workbooks.
Chapter 2: An Overview of NeuralTools 17

NeuralTools and Neural Networks
When using NeuralTools, neural networks are developed and used in
four steps:
• Data Preparation - The data you use in NeuralTools is
defined in data sets. A Data Set Manager is used to set up
data sets so they can be used over and over again with your
neural networks.
• Training – With training, a neural network is generated from
a data set comprised of cases with known output values. This
data often consists of historical cases for which you know the
values of output/dependent variable.
• Testing – With testing, a trained neural network is tested to
see how well it does at predicting known output values. The
data used for testing is usually a subset of your historical
data. This subset was not used in training the network. After
testing, the performance of the network is measured by
statistics such as the % of the known answers it correctly
predicted.
• Prediction - A trained neural network is used to predict
unknown output values. Once trained and tested, the
network can be used as needed to predict outputs for new
case data.
Training and testing are an iterative, sometimes time-intensive
process. Typically, you may train several different times with
different settings in order to generate a neural network that tests best.
Once you have your "best net" you can quickly use it for predicting.
Now, let's look at how NeuralTools works in Excel and how you
define data sets and train and test neural networks using those data
sets. Then we will predict unknown output values using trained
networks.
18 Overview
NeuralTools Menu and Toolbar
Once you have installed NeuralTools, its menu and commands will be
included as part of the Excel menu bar in Excel 2003 and earlier.
There will also be a NeuralTools toolbar displayed. The menu shows
commands for 1) defining your data in data sets, 2) training and
testing neural networks and 3) predicting values using trained neural
networks. In Excel 2007, all commands are available via the
NeuralTools ribbon bar.
Data Sets and the Data Set Manager
Data in NeuralTools is structured around cases and variables. You
work with a data set, or a set of statistical variables, located in
contiguous columns with variable names in the first row of the data
set. Each row in the data set is a case. Each case has a set of
independent variable values and either a known or missing value for
the dependent output variable. It is the job of NeuralTools to predict
output variable values for cases where they are not known.
Chapter 2: An Overview of NeuralTools 19
The NeuralTools Data Set Manager allows you to define your data
sets, variables and cases. You can then use these predefined variables
for training and testing neural networks, without re-selecting the data
you wish to analyze over and over. You may place all known,
historical cases in one data set and cases you wish to predict results
for in a different data set. You can also combine all your data –
known historical data and data you wish to predict - in a single data
set.
Each variable in a data set has a name and a range of Excel cells
associated with it. Each column within the range contains data for a
different variable. A data set can include multiple blocks of cells,
allowing you to put data on different sheets in the same workbook.
When you are defining a data set, NeuralTools attempts to identify
the variables in a block of cells surrounding the current selection in
Excel. This makes it quick and easy to set up a data set with variable
names in the top row and variables laid out by column.
20 Overview
Variable Types
Multi-Range Data
In NeuralTools, variables can be independent or dependent and
numeric or categorical (for example Yes or No, or Red, Green or Blue.)
The Data Set Manager attempts to identify the type of each variable in
your data set, but you can override this with your own selections.
A single column in an Excel 2003 or earlier worksheet can hold up to
65,536 data points for a variable. If your variables have more values
than this and you choose not to adopt Excel 2007, NeuralTools allows
multiple cell ranges to be assigned to a single data set. In other
words, you can "repeat" a data set across multiple sheets, assigning
the same columns in different worksheets to hold all the values for a
data set.
Training a Neural Network
After you have defined a data set that contains cases with known
historical values, you can train a neural network using that data.
There are different options that determine the type of network that
will be generated by NeuralTools. Depending on the nature of your
data, different network options will generate better performing
trained networks (i.e. networks that do a better job predicting
answers). The testing process – done following training – gives
precise measurements of how well your trained network does at
predicting output values.
Training a neural network, along with testing and prediction, requires
that you specify a data set that contains the data to be used during
training. NeuralTools will either save your trained network directly
in your workbook or optionally, to a file on disk.
Chapter 2: An Overview of NeuralTools 21
Combining Training, Testing and Prediction
If all your data is in a single data set (including both known historical
data and new data where you do not know output values),
NeuralTools allows you to train and test a network, then predict
output values, all in a single step. You select to withhold a certain
percentage of the historical data for testing (20% is shown on the prior
page) and then select to automatically predict output values for cases
with missing dependent values. By doing this you quickly can get the
answers you need in one operation.
Net Configurations
NeuralTools supports different neural network configurations to give
the best possible predictions. For classification/category prediction
(where the dependent variable is a category type), two types of
networks are available: Probabilistic Neural Networks (PNN) and
Multi-Layer Feedforward Networks (MLF). Numeric prediction can
be performed using MLF networks, as well as Generalized
Regression Neural Networks (GRNN), which are closely related to
PNN networks.
NeuralTools makes selecting a network configuration easy by offering
a Best Net search. When selected, NeuralTools will train and test a
variety of neural network configurations to generate the one the gives
the best predictions for your data. The best configuration is
determined based on testing data, so for Best Net search the
"Automatically Test" option needs to be selected in the Train tab.
22 Overview

Training Preview
Once training and network configuration options are selected,
NeuralTools previews what it will perform during network training.
Since training is the most time-intensive process in neural network
modeling, it helps to review the training setup prior to proceeding.
NeuralTools will try to identify any problems it has found in your
data so you can correct them prior to proceeding with training.
Chapter 2: An Overview of NeuralTools 23

Training Process
As NeuralTools proceeds with training a neural net on your data, it
reports how well it is doing. Typically the net gets better and better
as training proceeds, as NeuralTools generates networks that make
better predictions on your data with fewer errors. Graphs update to
show NeuralTools' progress during training.
Training stops when any of the stopping conditions you have set –
such as maximum training time – are reached. If you have selected to
automatically test the net or predict missing output values in your
data set, this will be performed after training.
24 Overview

Training Reports
Training reports show how well your trained net performed.
Statistics such as % Bad Predictions show the number of cases in the
training set for which the network predicted an output value that did
not agree with the actual known value.
Chapter 2: An Overview of NeuralTools 25

Testing a Network
During testing, a trained neural network is tested to see how well it
does at predicting known output values. The testing data is usually a
subset of your historical data with known output values. This subset
was not used in training the network.
When testing data is in a separate data set, NeuralTools will match
the variables in the testing data set with those in the training data. As
with training, NeuralTools will preview your testing setup prior to
running.
Testing Reports
Testing (along with prediction) runs much faster than training.
NeuralTools reports how well it did in predicting the known answers
in the testing data. This helps you see if the network will be a good
predictor when applied to cases with unknown output values.
26 Overview

Prediction
The end use of a neural network is prediction. You will apply a
trained network to new cases where you do not know output values
but you want to predict them. NeuralTools offers two methods for
prediction – 1) a command-driven method for predicting values for
cases in a data set, and 2) Live Prediction (Industrial version only),
where the independent variable values for a case in your worksheet
can be entered and NeuralTools will automatically calculate the
predicted output value.
When you wish to predict values for a group of cases in a data set, the
Prediction dialog helps you set up the prediction process. You can
predict for just cases with missing output values and optionally
enable Live Prediction so you can make modifications to your data to
see how it will affect predictions. Different trained nets can be used
to see how predicted values will differ.
As with training and testing, NeuralTools first previews the data and
setup it will use for prediction. Then, predictions are reported to your
worksheet in Excel.
Chapter 2: An Overview of NeuralTools 27

Prediction Results
Live Prediction
Predicted output values are shown next to the cases for which
prediction is performed. In the screen here, predicted values are in
purple.
When Live Prediction is enabled, NeuralTools automatically adds an
Excel formula to the cell where the predicted value is shown. This
formula generates the predicted value, so if you change independent
variable values for a case, the predicted value will be automatically
recalculated. Using Live Prediction you can simply type data for new
cases directly in Excel and automatically generate a new prediction,
without going through the Prediction dialog. For example, if the
independent variable values for the case in row 7 in the above
worksheet are changed as shown, the predicted value automatically
updates. As with any worksheet cell, you can reference a
LivePrediction cell in any Excel formula.
(Note: Live Prediction is available in the Industrial version only.)
28 Overview

NeuralTools Reports and Charts
NeuralTools creates both Summary and Detailed Reports from
training, testing and prediction. Summary Reports are shown on
their own worksheet and have overall information on Testing or
Training. A Detailed Report gives information on a case-by-case
basis and is shown next to the data being reported on. In addition,
most of the Summary Report information can be found inside the
Detailed Report as a comment added to the title cell; that version of
the Summary Report is referred to as the Quick Summary.
Whenever NeuralTools creates one or more charts, it places them with
the reports. Charts are created in Excel format and may be
customized using standard Excel chart commands.
NeuralTools Utilities
Two utilities are provided to help you to manage neural network
modeling in NeuralTools. A Neural Net Manager allows you to copy
or move trained neural networks between workbooks and files. A
Missing Data utility helps identify and correct cases with missing
data in your data sets.
Chapter 2: An Overview of NeuralTools 29

Using NeuralTools with StatTools, Solver and Evolver
NeuralTools is designed to be used with StatTools, the statistics addin for Excel from Palisade. Both products share the same Data Set
Manager; data sets defined in NeuralTools can be analyzed in
StatTools and vice versa. Using StatTools, you can calculate statistics
on variables in data sets defined in NeuralTools along with statistics
on predictions generated by NeuralTools.
Detailed Reports generated in NeuralTools are immediately available
for analysis in StatTools; they automatically show on the list of data
sets in StatTools Data Set Manager. This facilitates the use of
StatTools to obtain statistical results beyond those contained in
NeuralTools' Summary Reports. For example, a testing Summary
Report includes a histogram of residuals (defined as differences
between actual and predicted values). Based on the histogram, the
residuals may appear to be approximately normally distributed. To
test the hypothesis of normal distribution, one of StatTools' normality
tests can be applied to the Residuals variable in the Detailed Report.
An example is provided in the file "Abalone Age Prediction with
StatTools Analysis.xls".
NeuralTools' Live Prediction feature makes it easy to see how changes
to independent values affect the prediction. With Live Prediction,
other tools available in Excel can be used to explore the relationship
between independent variables and the dependent one.
Solver – Excel's built in optimizer can be used with NeuralTools' Live
Prediction capability to calculate optimal decision values for
predictions made in NeuralTools. The file "Auto Loans with
Solver.xls" provides an example. In the example, a neural net is used
to predict whether a borrower will be making timely payments.
However, the network may only be 60% confident of the answer.
Excel's Solver could then be used to determine a loan amount where
the network would be 90% sure that the individual will be making
timely payments. In this case, the optimizer would try different loan
amounts while NeuralTools automatically updated the probability
value. Evolver, Palisade genetic algorithm based optimizer, can be
used instead of Solver to find the answer. Evolver can solve problems
in which values of multiple variables are varied, which cannot be
done with Solver.
30 Overview

Chapter 3: NeuralTools Reference Guide
Introduction.......................................................................................33
Reference: NeuralTools Icons 35
NeuralTools Toolbar.........................................................................35
Reference: NeuralTools Menu Commands 37
Introduction.......................................................................................37
Icons in Dialog Boxes............................................................................38
Command Reference........................................................................39
Data Set Manager Command...............................................................39
Train Command .....................................................................................44
Test Command........................................................................................56
Predict Command...................................................................................64
Utilities...............................................................................................69
Application Settings Command..........................................................69
Neural Net Manager Command..........................................................72
Missing Data Utilities Command .......................................................74
More on Neural Networks 77
Chapter 3: NeuralTools Reference Guide 31

32

Introduction
The NeuralTools Reference Guide chapter describes the icons,
commands, and statistics functions used by NeuralTools. This
chapter is divided into two sections:
1) Reference: NeuralTools Icons
2) Reference: NeuralTools Menu Commands
Chapter 3: NeuralTools Reference Guide 33

34 Introduction

Reference: NeuralTools Icons
NeuralTools Toolbar
NeuralTools icons are used to define data sets with cases and
variables and then create and use neural networks on that data.
NeuralTools icons appear on the Excel toolbar (i.e., as a custom
toolbar in Excel) in Excel 2003 and earlier and on a ribbon in Excel
2007. This section briefly describes each icon, outlining the functions
they perform and the menu command equivalents associated with
them. In Excel 2007, all commands are available via the NeuralTools
ribbon bar.
The following icons are shown on the NeuralTools toolbar in Excel
2003 and earlier and/or in NeuralTools dialog boxes.
Icon Function Performed and Command Equivalent
Define a data set and variables, or edit or delete an
existing data set and variables
Command equivalent: Data Set Manager command
Train a neural network
Command equivalent: Train command
Test a neural network
Command equivalent: Test command
Predict values using a trained network
Command equivalent: Predict command
Run neural network utilities
Command equivalent: Utilities command
Display NeuralTools help file
Command equivalent: Help command
Reference: NeuralTools Icons 35

The following icons are shown on the NeuralTools ribbon in Excel
2007.
Icon Function Performed and Command Equivalent
Define a data set and variables, or edit or delete an
existing data set and variables
Command equivalent: Data Set Manager command
Train a neural network
Command equivalent: Train command
Test a neural network
Command equivalent: Test command
Predict values using a trained network
Command equivalent: Predict command
Run neural network utilities
Command equivalent: Utilities command
Display NeuralTools help file
Command equivalent: Help command
36

Reference: NeuralTools Menu Commands
Introduction
This section of the Reference Guide details the available NeuralTools
commands as they appear on the NeuralTools menu or ribbon in
Excel. Commands are discussed as they appear on the menu, starting
with the Data Set Manager command and subsequently moving
down. NeuralTools icons can be used to perform many of the
available commands. The Reference: NeuralTools Icons section of
this chapter gives the command equivalents for each NeuralTools
icon.
Reference: NeuralTools Menu Commands 37

Icons in Dialog Boxes
Up to two icons – the Help icon and the Application Settings icon –
may appear in individual NeuralTools dialog boxes. The Help icon
allows you to quickly access the help topic on the relevant dialog.
The Application Settings icon displays the Application Settings dialog
where you can enter or edit settings for NeuralTools reports, as well
as default settings for Training, Prediction and Runtime.
38 Introduction

Command Reference
Data Set Manager Command
Defines NeuralTools data sets and variables, or edits or deletes
an existing data set and variables
The Data Set Manager command allows you to define your data sets
with cases and variables. Once data sets are defined, they may be
used for neural network training, testing and prediction. The Data Set
Manager dialog box allows you to add or remove data sets, name a
data set, specify the layout of the variables in a data set, and name the
variables in a data set.
What Are Data Sets and Variables?
NeuralTools is structured around variables and cases. You work with
a data set, or a set of statistical variables, located in contiguous
columns in an Excel worksheet with variable names in the first row of
the data set. Each row in the data set is a case. Each case has a set of
independent variable values and either a known or missing value for
the dependent output variable.
Each variable in a data set has a name and a range of Excel cells
associated with it. A data set can include multiple blocks of cells,
allowing you to put data on different sheets in the same workbook.
When you are defining a data set, NeuralTools attempts to identify
the variables in a block of cells surrounding the current selection in
Excel. This can make it quick and easy to set up a data set with
variable names in the top row and variables laid out by column.
Reference: NeuralTools Menu Commands 39

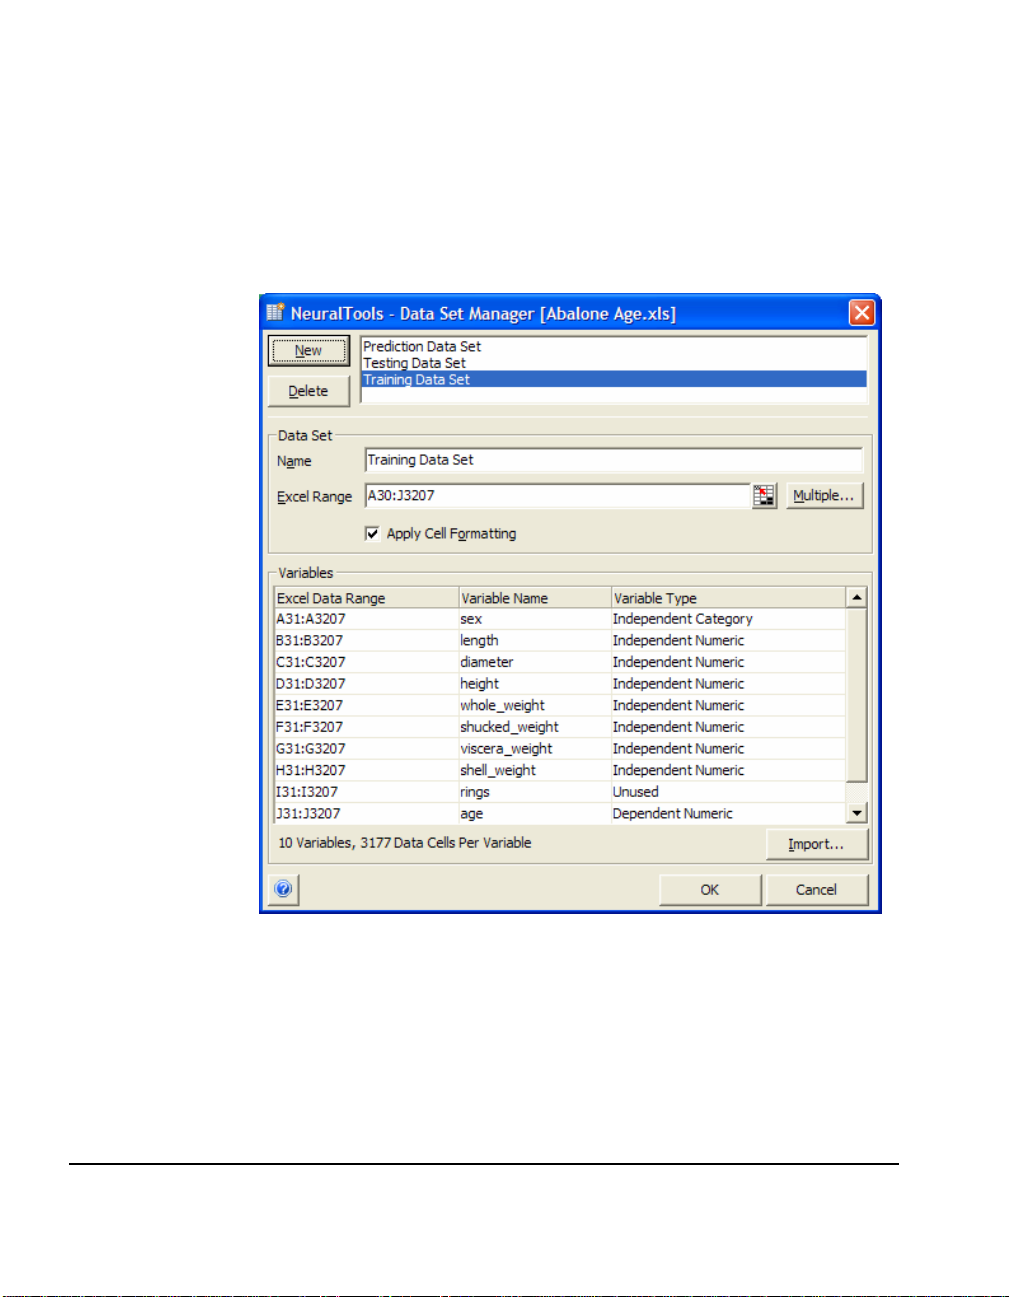
Data Set Manager Dialog Box
The Data Set options in the Data Set Manager dialog box include:
• New, Delete – adds a new data set, or deletes an existing
one.
• Name – specifies the name of the data set.
• Excel Range – specifies the Excel Range associated with a
data set. If multiple cell ranges have been assigned to a data
set this entry will be prefaced by the label Multiple.
• Apply Cell Formatting - adds a grid and colors that identify
your data sets.
• Multiple - clicking the Multiple button in the Data Set
Manager dialog box displays the Multiple Range Selector
dialog. This dialog allows the entry of individual cell ranges
that comprise the multiple cell range data set.
• Import – allows variable types to be copied to this data set
from another data set or trained neural net. The Import
Variable Types dialog allows you to select the location and
net to use for variable definitions.
40 Command Reference

Multiple Range Data Sets
NeuralTools allows multiple cell ranges on different worksheets to be
assigned to a single data set. A multiple range data set can be used
when:
1) Each variable in a data set has more than 65,536 data points in an
Excel 2003 or earlier worksheet, requiring the data set to extend
across multiple worksheets in the same workbook,
2) The data for a variable is located in multiple blocks scattered
throughout the worksheets in a workbook.
Note: A multiple range data set cannot be defined within a single
worksheet. They can be defined on multiple worksheets within the
same workbook.
The options in the Multiple Range Selector dialog include:
• Clear All – Clears all entered ranges.
• Auto Fill – Applies the first range entered (in row 1) to all
visible worksheets in the active workbook, and enters these
SheetName!CellRange references in the grid
• Select – Displays a selector for highlighting a block of cells to
be used as a Data Set Range.
• Secondary Ranges Have Variable Names in the First
Column (Row) - Multiple range data sets can have variable
names labeling each column in each range listed in the dialog,
or variable names labeling columns in just the first selected
range. The first selected range is the range entered in row 1 of
the Multiple Range Selector dialog.
Reference: NeuralTools Menu Commands 41

Variable Options
Each row in the grid in the Data Set Manager dialog box lists the
variables in a data set, including the Excel Data Range that holds the
data points for a variable, the Variable Name, and the Variable Type.
The Variable Type options include:
• Dependent Category – dependent or output variable whose
possible values are taken from a set of possible categories; for
example Yes or No, or Red, Green or Blue.
• Dependent Numeric – dependent or output variable whose
possible values are numeric.
• Independent Category – an independent variable whose
possible values are taken from a set of possible categories; for
example Yes or No, or Red, Green or Blue.
• Independent Numeric – an independent variable whose
possible values are numeric.
• Tag – a variable that takes the possible values "train", "test" or
"predict". This type of variable is used to identify cases in a
data set that will be used for training, testing and prediction.
• Unused – a variable in a data set that will not be used in a
neural net.
42 Command Reference

More on Tag Variables
Data Set and Variable Capacities
Tag variables are a special type of variable in a NeuralTools
dataset that are used to identify cases in a data set that will be
used for training, testing and prediction. They are especially
useful when you want to include all data (to be used for network
training, testing and prediction) in a single dataset. When you
have a tag variable, NeuralTools selects the cases to use for
training, testing or prediction based on the tag variable's value.
By changing tag variable values, you can retrain a network using
different cases and see how network performance changes. You
can also add new cases with unknown dependent variable values
to a dataset and assign them to be predicted using the "Predict"
tag. A Tag variable can take only three possible values:
• Train – specifies that the case will be used for training
• Test - specifies that the case will be used for testing
• Predict - specifies that the case will be used for prediction
Note: If you have a tag variable in your data set, options in the
Training dialog will change. See the Train command for more
information.
In a single session, NeuralTools allows:
• Up to 256 data sets, located in a single workbook.
• Up to 16384 variables per data set in Excel 2007 (256 variables
in earlier versions of Excel). All the data for a single data set
must be located in the same workbook.
• Number of data points per variable and cases per data set
limited only by available memory in Excel 2007 (16,777,216
data points in earlier versions of Excel).
Actual data capacities may be less than shown above depending on
the system configuration and version of Excel in use. Memory
limitations of Excel itself may also affect data capacities.
Note: the Data Set Manager dialog box lists all data sets and
variables in the active workbook (this is the workbook listed in the
caption of the Data Set Manager dialog). To list data sets in other
workbooks, activate the desired workbook in Excel and display the
Data Set Manager dialog.
Reference: NeuralTools Menu Commands 43

Train Command
Specifies settings for training a neural network and runs the
training
The Train command allows you to 1) specify settings to be used for
training a neural network in NeuralTools and 2) start training a net.
Train Tab
44 Command Reference
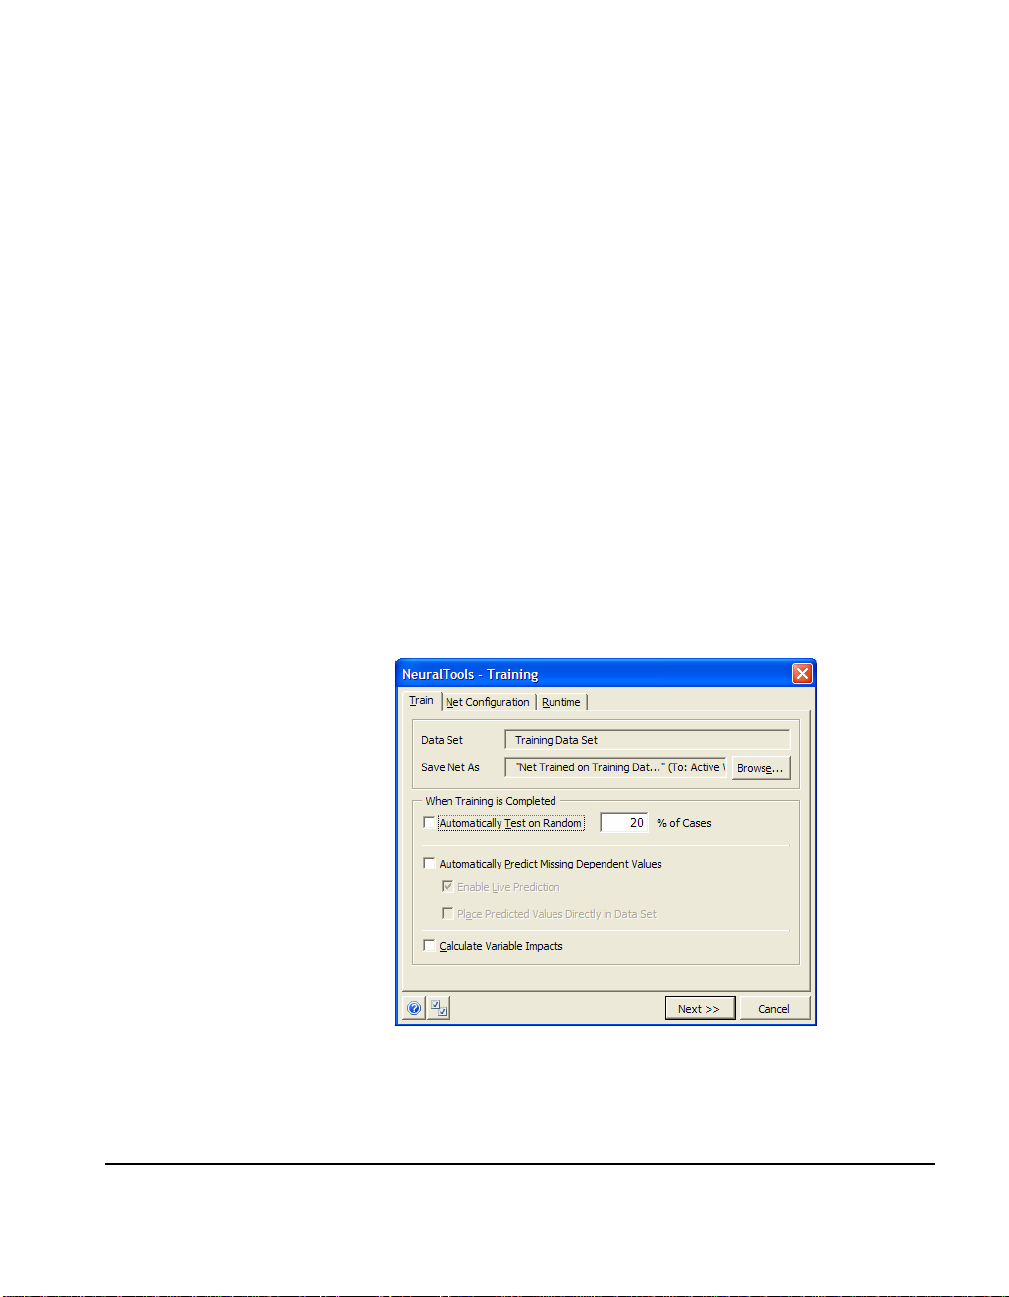
The Train tab in the Training dialog box specifies general options for
training a neural network. It includes the following:
• Data Set – shows the data set to be used when training the
neural network. This data set needs to be defined using the
Data Set Manager and present in the active sheet.
• Save Net As – specifies the name and location for the neural
net to be trained. Neural networks may be saved to an Excel
workbook or to a file on disk. Click Browse… to change the
name or location shown.

You may also enter a name and description for the neural
network to be saved.
The When Training is Completed options allow you to
automatically test and predict using the trained net following
training. This can be done when the data to test and predict is
located in the same data set with the training data.
• Automatically Test on – specifies that either:
1) a % of the cases in the data set will automatically be
"held out" from training to be used for testing
2) cases where the Tag variable = "test" will be used for
testing. A tag variable is a variable type as specified
in the Data Set Manager.
• Automatically Predict Missing Dependent Values –
specifies that the trained net will be used to predict
dependent variable values for either:
1) cases where the dependent variable value is missing,
or
2) cases where the Tag variable = "predict". A tag
variable is a variable type as specified in the Data Set
Manager.
• Enable Live Prediction – specifies that NeuralTools will
place formulas in the cells where the predicted dependent
variable values are shown to calculate the predicted
values. For more on Live Prediction, see the Predict
command in this chapter.
• Calculate Variable Impacts – specifies that NeuralTools
will calculate the relative impact of each independent
variable in the training data set in determining the
predictions calculated by the net.
Reference: NeuralTools Menu Commands 45

What is Variable Impact Analysis?
The purpose of Variable Impact analysis is to measure the sensitivity
of net predictions to changes in independent variables. This analysis
is only done on training data. As a result of the analysis, every
independent variable is assigned a "Relative Variable Impact" value;
these are percent values and add to 100%. The lower the percent
value for a given variable, the less that variable affects the predictions.
The results of the analysis can help in the selection of a new set of
independent variables, one that will allow more accurate predictions.
For example, a variable with a low impact value can be eliminated in
favor of some new variable. However, one needs to keep in mind that
the results of the Impact Analysis are relative to a given net. The fact
that one net "learned" to disregard a given variable makes it likely
that another net will also "learn" to disregard it; but then again,
another training session with a different type of net might "discover"
how the variable can make a significant contribution to accurate
predictions. In data sets with smaller numbers of cases and/or larger
numbers of variables, the differences in the relative impact of the
variables between trained nets may be more pronounced. Also, it is
important to remember that these values are "relative". Suppose that
with two independent variables one is assigned 99%, and the other
1%. This means that the latter is much less important than the former,
but does not mean that it is unimportant, particularly if high accuracy
of predictions is desired.
Some additional points to note about Variable Impact Analysis
include:
1) Only the training data set is included in the analysis. (If Auto-
Testing or Auto-Prediction are used, those cases are not included.
The reason is that they might have numeric values outside the
training range, which could make analysis results more
unpredictable.)
2) For a given category independent variable, for every case the
analysis steps through all the valid categories for that variable,
and measures the change to the predicted value. (With category
prediction there is no numeric predicted value, but there are raw
numeric net outputs on which the category prediction is based;
those numeric outputs are used by the analysis.)
3) For a given numeric independent variable, for every case the
analysis steps through the range from the minimum to the
maximum training value for that variable, measuring the change
to the predicted value (or, in the case of category prediction,
change to the raw numeric outputs).
46 Command Reference

The purpose of the Variable Impact Analysis is not meant to support
firm conclusions, like stating with high confidence that a given
variable is irrelevant. Instead, it's meant to help in a search for the best
set of independent variables: the results of the analysis may be telling
us that a given variable looks irrelevant, sufficiently so that it's worth
trying to train a net without this variable.
The results of a Variable Impact analysis are displayed in the Training
Summary report:
Reference: NeuralTools Menu Commands 47

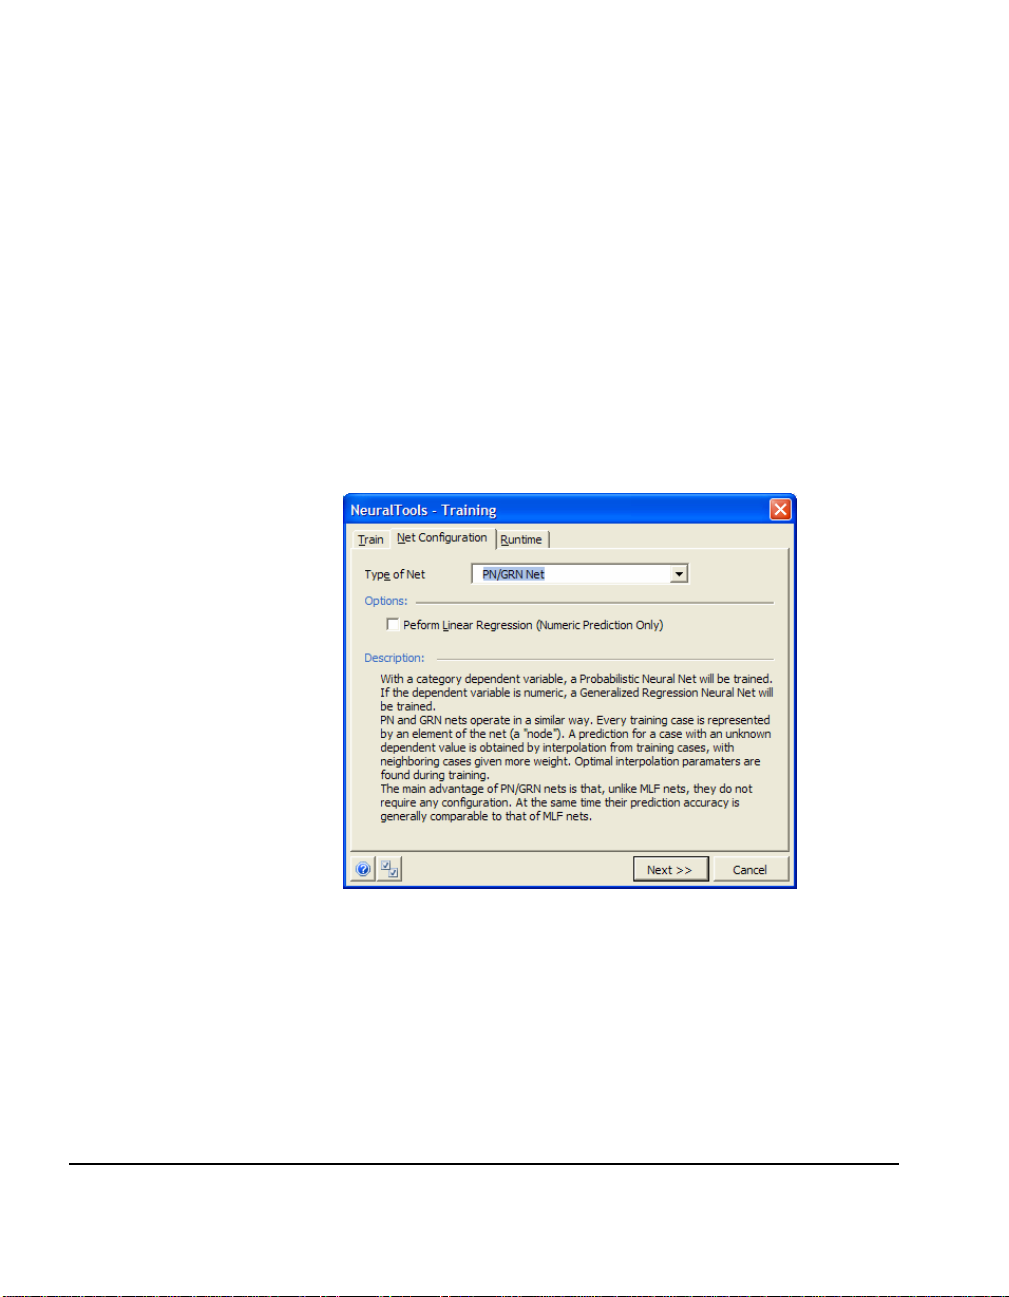
Net Configuration Tab
The Net Configuration tab in the Training dialog allows you to select
the type of neural network that will be trained on your data. You
may select a specific net configuration or select a Best Net search
where NeuralTools will test a variety of possible configurations to
identify the best performing one for you.
NeuralTools supports different neural network configurations to give
the best possible predictions. For classification/category prediction,
two types of networks are available: Probabilistic Neural Networks
(PNN) and Multi-Layer Feedforward Networks (MLF). Numeric
prediction can be performed using MLF networks, as well as
Generalized Regression Neural Networks (GRNN), which are
closely related to PNN networks. For more information on the
technical aspects of the available network configurations, see the
More on Neural Networks section.
The Net Configuration tab includes the following:
• Type of Net – Selects the type of net to be used in training, or
alternatively, selects a Best Net search. The Net Configuration
tab Options change depending on the type of net selected.
Available net types are:
1) Best Net Search. In a Best Net Search, NeuralTools tests
all checked net configurations, including PNN/GRNN
and MLFN nets with node counts in the entered
minimum-maximum range. The best performing
configuration for your data is identified. If Store All
Trial Nets in New Workbook is selected, you will be able
to individually load each tested net (regardless if it was
the best performing network) from a workbook and use it
for prediction after training is done; a full testing
Summary Report for each net will also be available.
48 Command Reference

2) PNN/GRNN Net. These net types require no additional
options to be selected for training; for this reason this
setting is the default when NeuralTools is installed. If
your data has numeric output values a GRNN network
will be trained and if your data has categorical output
values a PNN network will be trained.
3) MLFN Net. A Multi-Layer Feedforward Network
(MLFN) has one or two hidden layers of nodes.
By selecting zero nodes for the second layer it will be
eliminated. The most reliable way to find the best
configuration of an MLFN net is to use the Best Net
Search option instead of the option to train a single
MLFN net. If there is not enough time for Best Net
Search, it is recommended that the "Number of Nodes"
values be left as "Auto-Selected".
Reference: NeuralTools Menu Commands 49

Runtime Tab
The Runtime tab in the Training dialog allows you to enter stopping
conditions for training. If no stopping conditions are selected,
training will stop eventually; that period will be relatively short for
PNN/GRNN nets, and much longer with MLF nets. One possible
approach is to select no stopping conditions and click the Stop button
in the training progress dialog when no more time is available for
training. With Best Net Search a time limit for training a single net
must be defined, to ensure that the search algorithm does not devote
too much time to one particular configuration. The three available
stopping conditions can be combined, specifying that NeuralTools
will stop when any of the conditions are reached.
The Stop Training options include:
• Train No Longer Than – Specifies a fixed time limit for training
a single network. Training may stop before the specified
period elapses, as soon as the algorithm determines that it is
unlikely that further progress will be made. If a Best Net
search is used, each tested net configuration will train for the
entered time.
• Stop After #### Trials – Specifies that NeuralTools will
execute no more than the specified number of trials before
stopping. With Multi-Layer Feedforward Networks, a "trial" is
a single assignment of "weights" to connections between
neurons; training consists of an intelligent search for weights
that will generate best predictions. With Probabilistic Neural
Nets and Generalized Regression Neural Nets, a trial is an
assignment of "smoothing factors" to variables. Training
consists of a search for best smoothing factors.
50 Command Reference

• Stop when Change in Error Less Than X% within ## Minutes
– Specifies that NeuralTools will stop if it cannot improve the
error statistic at least the entered % with the specified
timeframe.
Training Preview Dialog
The Training Preview dialog shows the setup of the current network
training along with any errors detected in your data, prior to starting
training. By examining the contents of this dialog, you can see all
your selected training assumptions as reported by NeuralTools. The
Errors and Warnings section gives a description of any problems
NeuralTools has detected in your data or settings which you can
correct if necessary prior to spending time training.
Reference: NeuralTools Menu Commands 51

Training Progress Window
The Training Progress window reports on the status of network
training as it runs. Graphs detail how NeuralTools is doing at
improving the network and reducing the reported error.
52 Command Reference

Training Reports
Both summary and detail reports can be created after training. These
reports detail the performance of the trained neural network. The
actual contents of the generated reports are specified in the
Application Settings dialog, under the Reports to Generate and
Columns in Detailed Reports settings.
• Training Summary Report – The training summary report
gives statistics and graphs on the performance of the trained
neural net.
For Category Prediction/ Classification, key statistics and graphs in
the training summary report include:
1) % Bad Predictions - the percent of cases for which the
predicted category does not agree with the actual category.
Reference: NeuralTools Menu Commands 53

2) Mean Incorrect Probability (available with PNN nets only) -
for every case, NeuralTools computes Probability of Incorrect
Categories, which is the sum of probabilities assigned by
PNN net to incorrect categories. For example, if for a given
case a net assigns 30% probability to red, 20% to yellow, and
50% to green, and we know that the correct answer is red,
then the value for that case is 20% + 50% = 70%. This value
provides a case-by-case error measure for category prediction,
corresponding to the Residual Error for numeric prediction.
"Mean Incorrect Probability" is the average error value for all
the cases.
Detailed Reports show Incorrect Probability on a case-by-case
basis, and to better understand the concept it may be helpful
to change Detailed Report settings to show the probabilities
assigned by a Probabilistic Neural Net to every possible
category for the dependent variable. To do that, select
Application Settings in the Utilities menu, and click the
drop-down menu at the right of the Columns in Detailed
Reports row. The NeuralTools - Columns to Display in
Detailed Reports dialog will display. In that dialog select
Probabilities of All Categories (for PNN) for Testing. Then
train a PN Net on a data set with at least 3 categories in the
dependent variable (the Auto Loans.xls example file can be
used) with Automatically Test selected. In the resulting
Detailed Report, observe how the values in the Incorrect%
column relate to the probabilities assigned to each possible
category; the Incorrect% is the sum of the probabilities for all
incorrect categories.
3) Classification Matrix - compares actual to predicted
categories on category-by-category basis. For example,
classification matrix may reveal that a net correctly detects a
medical condition in patients that have it, but has some
tendency to raise false alarms for healthy patients.
4) Variable Impacts – (if selected) displays the relative impact of
independent variables on predicted answers.
5) Histogram of Probability of Incorrect Categories (available
with PNN nets only) - see "Mean Incorrect Probability" above
for explanation of "Probability of Incorrect Categories".
54 Command Reference

For Numeric Prediction, key statistics and graphs in the training
summary report include:
1) % Bad Predictions - a prediction counts as "bad" if it falls
outside the defined margin around the actual value; the
width of the margin is defined as ‘Good/Bad Tolerance
(Training)’ setting in the Application Settings dialog.
2) Root Mean Square Error - a measure of deviation of
predictions from actual value (calculated as square root of
average square deviation).
3) Mean Absolute Error - average deviation of predictions from
actual values.
4) Variable Impacts – (if selected) displays the relative impact of
independent variables on predicted answers.
5) Histogram of Residuals - "residual" is the difference between
the actual and the predicted value.
6) Scatter plots showing relationships between actual values,
predicted values, and residuals.
Reference: NeuralTools Menu Commands 55

Test Command
Specifies settings for testing a trained neural network and runs
the testing
The Test command allows you to 1) specify settings to be used for
testing a trained neural network and then 2) start the testing.
Testing data usually is data with known output values that were not
used in training the net. Options in the Testing dialog include:
• Data Set – shows the data set to be used when testing the
trained neural network. This data set needs to be defined
using the Data Set Manager and be present in the active
worksheet.
• Net to Use – specifies the name and location for the neural net
to be tested. Neural networks may be saved to an Excel
workbook or to a file on disk. Click Browse… to change the
name or location shown.
56 Command Reference

Variable Matching
Variable Matching specifies how variables in the data set to be tested
will be matched with variables in the data set that was used to train
the net.
Two options are possible for variable matching:
1) Automatic Matching. Variable Names in the testing data
set are matched by name with those in the trained net's
data set, and variable types are set based on this matching
2) Custom Matching. Custom matching allows you to
individually assign the matching of variables in the
testing data set with those in the trained net's data set.
This is done when variable names are different in the two
data sets or different assignments are desired.
The Variable Matching dialog lists the names of variables in each data
set so they can be matched. Only variables with the same type may
be matched. Each time you do a matching, the assignments made are
stored with the data set. By clicking Load Prior Matching, you can
cycle through previously-made matchings to access a set of previous
assignments for the data set.
Reference: NeuralTools Menu Commands 57

Testing Preview Dialog
The Testing Preview dialog shows the setup of the current network
testing along with any errors detected in your data, prior to starting
testing. By examining the contents of this dialog, you can see all your
selected testing assumptions as reported by NeuralTools. The Error
and Warnings section gives a description of any problems
NeuralTools has detected in your data which you can correct if
necessary prior to testing.
58 Command Reference

Testing Reports
Both summary and detail reports can be created after testing. These
reports detail the performance of the trained neural network on the
test data set. The actual contents of the generated reports are
specified in the Application Settings dialog, under the Reports to
Generate and Columns in Detailed Reports settings. The detailed
report is especially useful when testing as it shows how the trained
net did at predicting individual output values in the test data set.
• Testing Summary Report – The testing summary report gives
statistics and graphs on the performance of the trained neural
net on the test data set.
For Category Prediction, key statistics and graphs in the testing
summary report include:
1) % Bad Predictions - the percent of cases for which the
predicted category does not agree with the actual
category.
2) Mean Incorrect Probability (available with PNN nets
only) - for every case, NeuralTools computes Probability
of Incorrect Categories, which is the sum of probabilities
assigned by PNN net to incorrect categories. For
example, if for a given case a net assigns 30% probability
to red, 20% to yellow, and 50% to green, and we know
that the correct answer is red, then the value for that case
is 20% + 50% = 70%. This value provides a case by case
error measure for category prediction, corresponding to
Reference: NeuralTools Menu Commands 59

the Residual Error for numeric prediction. "Mean
Incorrect Probability" is the average error value for all the
cases.
Detailed Reports show Incorrect Probability on a case-bycase basis, and to better understand the concept it may be
helpful to change Detailed Report settings to show the
probabilities assigned by a Probabilistic Neural Net to
every possible category for the dependent variable. To do
that, select Application Settings in the Utilities menu,
and click the drop-down menu at the right of the
Columns in Detailed Reports row. The NeuralTools Columns to Display in Detailed Reports dialog will
display. In that dialog select Probabilities of All
Categories (for PNN) for Testing. Then train a PN Net
on a data set with at least 3 categories in the dependent
variable (the Auto Loans.xls example file can be used)
with Automatically Test selected. In the resulting
Detailed Report, observe how the values in the
Incorrect% column relate to the probabilities assigned to
each possible category; the Incorrect% is the sum of the
probabilities for all incorrect categories.
3) Classification Matrix - compares actual to predicted
categories on category-by-category basis. For example,
classification matrix may reveal that a net correctly
detects a medical condition in patients that have it, but
has some tendency to raise false alarms for healthy
patients.
4) Histogram of Probability of Incorrect Categories
(available with PNN nets only) - see "Mean Incorrect
Probability" above for explanation of "Probability of
Incorrect Categories".
60 Command Reference

For Numeric Prediction, key statistics and graphs in the testing
summary report include:
1) % Bad Predictions - a prediction counts as "bad" if it falls
outside the defined margin around the actual value; the
width of the margin is defined in the ’Good/Bad
Tolerance (Testing)’ setting in the Application Settings
dialog.
2) Root Mean Square Error - a measure of deviation of
predictions from actual value (calculated as square root of
average square deviation).
3) Mean Absolute Error - average deviation of predictions
from actual values.
4) Histogram of Residuals - "residual" is the difference
between the actual and the predicted value.
5) Scatter plots showing relationships between actual
values, predicted values, and residuals.
Reference: NeuralTools Menu Commands 61

• Testing Detailed Report. This report is placed next to the
testing data set and shows how the trained net did at
predicting individual output values in the test data set.
In the Testing Detailed Report, predictions are marked as "Good" or
"Bad" based on the tolerance level set in the Application Settings
dialog. If you are running multiple tests, Detailed Reports may be
added in new columns to the right of the test data set, so you can see
how predictions change for individual cases as new trained nets are
tested.
62 Command Reference

Quick Summaries in Detailed Reports
A popup comment in Excel provides quick access to Summary Report
information while examining a Detailed Report. Simply roll the
mouse over the report header and the popup comment will be
displayed. Note – Comments must be enabled in the Excel Tools
Command Options Dialog View tab for popup comments to be
displayed.
Reference: NeuralTools Menu Commands 63

Predict Command
Specifies settings for predicting values using a trained neural
network and runs the prediction
The Predict command allows you to 1) specify settings to be used for
predicting values using a trained neural network and then 2) run the
prediction.
Data to predict typically are cases with unknown dependent variable
values. Options in the Testing dialog include:
• Data Set – shows the data set to be used for prediction. This
data set needs to be defined using the Data Set Manager and
be present in the active worksheet.
• Net to Use – specifies the name and location for the neural net
to be used for prediction. Neural networks may be saved to
an Excel workbook or to a file on disk. Click Browse… to
change the name or location shown.
• Variable Matching – Specifies how variables in the data set
with the prediction data will be matched with variables in the
data set that was used to train the net. Click Edit… to change
variable matching. For more information on Variable
Matching, see the Test command in this chapter.
64 Command Reference

• Predict For – Selects the cases for which predictions will be
made. Typically you will select to predict cases with Missing
Dependent Variable Values, but you can make prediction for
All Cases (even those where the dependent variable value is
known) if desired. If you have a Tag variable in the data set,
dependent variable values will be predicted only for cases
marked with the Tag "predict".
• Options – sets predicted value location and Live Prediction
options.
1) Place Predicted Values Directly in Data Set. This
option specifies that predicted values will be placed
directly in the dependent variable location in the data set
for each predicted case, possibly in addition to being
placed in the Detailed Report (depending on whether
Detailed Reports are selected in the Reports to Generate
setting in Application Settings). This overwrites any
current contents of the cell so should be used with
caution. You will be able to identify predicted values by
color in the data set.
2) Enable Live Prediction - specifies that NeuralTools will
place formulas in the cells where the predicted
dependent variable values are shown. These formulas
allow NeuralTools to calculate the predicted values as
independent values change.
3) Exclude Live Prediction for Cases with Missing or
Invalid Values – specifies that a live prediction formula
will not be added where input variable values for a case
are missing. Missing input values cause live prediction
formulas to return an error value. However, it may be
useful to allow NeuralTools to enter formulas in cases
where independent values are missing, because as soon
as missing values are filled, the prediction will
automatically show.
Reference: NeuralTools Menu Commands 65

Live Prediction
Live Prediction is a powerful capability of NeuralTools
(Industrial version only) that allows you to perform
predictions automatically in Excel without going through a
specific Predict operation. With Live Prediction, NeuralTools
places formulas in the cells where the predicted dependent
variable values are shown. These formulas use a custom
NeuralTools function to calculate the predicted values, such
as:
=NetOutputPrediction(_PALDS_DG25B8C82B!$A$140,
"DG25B8C82B", "VG1DD83AF2", 'Prediction Data'!$A$6:$I$6,
A7:I7)
The actual formula is added to your worksheet by
NeuralTools and does not need to be entered by you. The
arguments let NeuralTools identify the trained network in
use, along with the location of the independent values in the
worksheet. When the input independent variable values for a
case are added or changed, NeuralTools will automatically
return a new predicted value. This makes it simple to add
and generate predictions for new cases using an existing
trained net.
66 Command Reference

Prediction Preview Dialog
The Prediction Preview dialog shows the prediction setup for the
selected data set along with any errors detected in your data or
settings, prior to starting prediction. By examining the contents of
this dialog, you can see all your selected prediction assumptions as
reported by NeuralTools. The Error and Warnings section gives a
description of any problems NeuralTools has detected in your data
which you can correct if necessary prior to prediction.
Reference: NeuralTools Menu Commands 67

Prediction Reports
Both summary and detail reports can be created after prediction.
These reports detail the performance of the trained neural network on
the test data set. The actual contents of the generated reports are
specified in the Application Settings dialog, under the Reports to
Generate and Columns in Detailed Reports settings.
• Prediction Detailed Report. This report is placed next to the
prediction data set. It provides a location for predictions when
the user does not want to place them inside the dependent
variable in the data set itself; if the dependent variable contains
historical data for some cases, it may be safer to not mix those
historical cases with net predictions.
If you are running multiple predictions, Detailed Reports may be
added in new columns to the right of the data set, so you can see how
predictions change for individual cases as new trained nets are used.
68 Command Reference

Utilities
Application Settings Command
Specifies settings for reports for training, testing and prediction
The Application Settings command allows you to select 1) which
reports to generate for training, testing and prediction, 2) what
Training defaults to use and 3) what Prediction and Runtime defaults
to use. Many Application Settings are defaults to be used in the
Training, Testing or Prediction dialogs. See the description of those
dialogs to get more information on those settings. Other settings are
covered here.
Reports
Reference: NeuralTools Menu Commands 69
Reports settings include:
• Reports to Generate - Each operation in NeuralTools can
produce both a summary and a detailed report. However,
typically you will want to use the default report setting as
certain reports add little value to certain operations. For

example, the Detailed report is the standard report from
Prediction, and a Summary report in this case adds little value.
Summary Reports are placed on their own worksheet, while
Detailed Reports are placed in columns to the right of a data set,
in the same worksheet as the data set.
• Place Summary Reports in options include:
- New Worksheet where a new worksheet is created for
each report. You may reuse the same workbook for your
reports or always create a new workbook.
• Detailed Report Location options include:
- Overwrite Existing Reports, where columns with data
from prior Detailed Reports in a data set are overwritten
with new Detailed Reports (to delete a Detailed Report
manually, select entire columns containing it by clicking
and dragging over column headers, then select Delete
from the Edit menu).
- Right of the Data Set where new columns are inserted to
the right of the data set to hold the new Detailed Reports.
- Right of Existing Reports where columns to the right of
the data set and existing reports are used to hold the new
Detailed Reports.
• Columns to Display in Detailed Reports. For every selected
row, a column will be displayed in the Detailed Report to the
right of the data set that will show the information for every
case.
70 Utilities

The following columns can be displayed:
1) Tag Used - "train", "test" and "predict" tags show for
every case if it was used as part of the training or testing
set, or whether a prediction was made for a given case.
2) Prediction Obtained Using Net - Number or category
predicted by net.
3) Probability of Predicted Category (for PNN) -
Probabilistic Neural Nets not only predict an unknown
category, but also assign a probability of that category.
Not available when categories are predicted using MultiLayer Feedforward Networks. Does not apply to numeric
prediction.
4) Probability of Incorrect Categories (for PNN) - Sum of
probabilities assigned by a PNN net to incorrect
categories. For example, if for a given case a net assigns
30% probability to red, 20% to yellow, and 50% to green,
and we know that the correct answer is red, then the
value for that case is 20% + 50% = 70%. This column
provides a case-by-case error measure for category
prediction, corresponding to the "Residual Error" column
for numeric prediction.
5) Residual Error - The difference between the actual and
the predicted dependent value. Does not apply to
category prediction.
6) Good/Bad Evaluation - For numeric prediction, the
column states if the prediction for a given case falls
within the defined margin around the actual value; the
width of the margin is defined as "Tolerance for
Good/Bad Evaluation". For category prediction, the
column simply states if the predicted category agrees
with the actual one.
7) Probabilities of All Categories (for PNN) - If this option
is selected and a Probabilistic Neural Net is trained, one
column will be inserted for every dependent category.
For example, if the net is used to predict a color, there
may be "red%", "yellow%", and "green%" columns,
containing probabilities assigned to each color.
• Tolerance for Good/ Bad Evaluation. For testing and training,
if a numeric prediction is within the entered % of the actual
dependent variable value, it will be labeled as "Good".
Reference: NeuralTools Menu Commands 71

Neural Net Manager Command
Allows the copying, moving and deletion of trained neural
networks
The Neural Net Manager Command allows you to manage trained
neural networks, moving them between workbooks and files as well
as adding descriptive information to them.
Neural networks can be stored in an Excel workbook or in a file on
disk. Any number of networks may be placed in a single Excel
workbook. Using the Neural Net Manager you can move networks to
new workbooks or files, or delete or replace them. This allows you to
easily analyze data sets in other workbooks using existing trained
networks, without the workbook with the training data present.
72 Utilities

Neural Net Manager options include:
• Copy – This copies a trained neural network to a different
location. Simply select the workbook or file where you wish to
place the network.
• Remove – Deletes a trained neural network.
• Replace – Overwrites a trained neural network with a new one.
This feature is available with nets that are used for Live
Prediction. After replacement, live predictions that were
previously made using the old net will be made using the new
one. This, however, does not apply to Detailed Reports. If a
detailed report contains live prediction cells where the net to be
replaced is used, then after replacement those cells will contain
fixed values.
• Net Information – Allows descriptive information to be added
to a network. This helps identify the trained network and the
conditions it was trained under.
Reference: NeuralTools Menu Commands 73

Missing Data Utilities Command
Allows the replacement of missing data and error values in a
data set with actual values
The Missing Data Utilities command allows you to replace missing or
other unwanted data in your data set with actual values. Cases with
missing variable values are disregarded by NeuralTools during
training, testing and prediction, so it is often useful to correct these
prior to processing.
The Training Preview dialog box will give you a warning when you
have cases with missing values in a data set. If this happens, these
cases can be fixed using the Missing Data Utilities command.
The Missing Data Utilities dialog has the following options:
• Variables to Modify – Provides a list of the variables used in the
data set in the current worksheet and displays the number
missing, error and (for numeric variables) non-numeric data.
Checking a variable selects it to have missing or other unwanted
data replaced.
The variable list provides a right-click menu with commands for
selecting and deselecting groups of variables.
74 Utilities

• Values to Replace – Selects the types of values in the selected
variables that will be replaced. Specific Value allows you to
replace all instances of a specific value for a variable with a new
value.
• What to Use For Replacement – Specifies the values to be placed
in the data set instead of the missing or other unwanted data.
Different values are specified for Category and Numeric
variables:
Category Variables – Options are:
- Most or Least Frequent Category – the category
value that occurs most or least frequently for cases in
the data set
- Neighboring Category – the category value that
occurs in the case in the data set next to the case with
the missing value
- Randomly Selected Category – a category value
randomly selected from those in the data set
- Specific Category – sets all missing or unwanted
values to a specific value
Numeric Variables – Options are:
- Variable Average Value – the average value for the
variable across all cases in the data set
- Variable Median Value – the median value for the
variable across all cases in the data set
- Interpolation from Neighboring Values – the value
calculated by interpolating between the variable
values in the cases in the data set next to the case with
the missing value
- Random Val. (between Min. and Max.) – a random
value selected between the variable minimum and
maximum for all cases in the data set
For both variable types, Clear Cells clears the selected values for the
variable.
Reference: NeuralTools Menu Commands 75

More on Missing Values
The Missing Data Utilities dialog provides one possible approach to
missing data: it generates artificial data where actual data is missing.
It may often be better to simply leave missing data as blank cells, and
let NeuralTools disregard cases with missing data. Note that
NeuralTools will not recognize special symbols like "?" as missing
data; question marks need to be cleared, and this can be accomplished
with the Missing Data Utilities, by selecting "Specific Value" in Values
to Replace section, and "Clear Cells" in "What to Use for Replacement"
section.
It may also be possible to use NeuralTools to predict missing values in
one independent variable from other independent variables that have
little or no missing data. Testing results will indicate if a net trained
to predict missing values is reliable.
76 Utilities

More on Neural Networks
Neural Network Basics
A neural network is a system that takes numeric inputs, performs
computations on these inputs, and outputs one or more numeric
values. When a neural net is designed and trained for a specific
application, it outputs approximately correct values for given inputs.
For example, a net could have inputs representing some easily
measured characteristics of an abalone (a sea animal), such as length,
diameter and weight. The computations performed inside the net
would result in a single number, which is generally close to the age of
the animal (the age of an abalone is harder to determine).
The inspiration for neural nets comes from the structure of the brain.
A brain consists of a large number of cells, referred to as "neurons". A
neuron receives impulses from other neurons through a number of
"dendrites". Depending on the impulses received, a neuron may send
a signal to other neurons, through its single "axon", which connects to
dendrites of other neurons. Like the brain, artificial neural nets
consist of elements, each of which receives a number of inputs, and
generates a single output, where the output is a relatively simple
function of the inputs.
Neural Nets vs. Statistical Methods
Neural nets provide an alternative to more traditional statistical
methods. Like Linear Regression, they are used for function
approximation. Like Discriminant Analysis and Logistic Regression,
they are used for classification. The advantage of neural nets is that
they are capable of modeling extremely complex functions. This
stands in contrast with the traditional linear techniques (Linear
Regression and Linear Discriminant Analysis). Techniques for
optimizing linear models were well known before artificial neural
nets were invented in middle of the 20th century. Effective
algorithms for training neural nets took many years to develop.
However, we now have a range of sophisticated algorithms for neural
net training, making them an attractive alternative to the more
traditional methods.
More on Neural Networks 77

The Structure of a Neural Net
The structure of a neural net consists of connected units referred to as
"nodes" or "neurons". Each neuron performs a portion of the
computations inside the net: a neuron takes some numbers as inputs,
performs a relatively simple computation on these inputs, and returns
an output. The output value of a neuron is passed on as one of the
inputs for another neuron, except for neurons that generate the final
output values of the entire system.
Neurons are arranged in layers. The input layer neurons receive the
inputs for the computations, like the length, diameter, and weight of
an individual abalone. These values are passed to the neurons in the
first hidden layer, which perform computations on their inputs and
pass their outputs to the next layer. This next layer could be another
hidden layer, if there is one. The outputs from the neurons in the last
hidden layer are passed to the neuron or neurons that generate the
final outputs of the net, like the age of the abalone.
Numeric and Category Prediction
When neural nets are used to predict numeric values, they typically
have just one output. This is because single-output nets are more
reliable than multiple-output nets, and almost any prediction problem
can be addressed using single-output nets. For example, instead of
constructing a single net to predict the volume and the price for a
stock on the following day, it is better to build one net for price
predictions, and one for volume predictions. On the other hand,
neural nets have multiple outputs when used for
classification/category prediction. For example, suppose that we
want to predict if the price of a stock the following day will "rise more
that 1%", "fall more than 1%", or "not change more than 1%". Then the
net will have three numeric outputs, and the greatest output will
indicate the category selected by the net.
Training a Net
Training a net is the process of fine-tuning the parameters of the
computation, where the purpose is to make the net output
approximately correct values for given inputs. This process is guided
by training data on the one hand, and the training algorithm on the
other. The training algorithm selects various sets of computation
parameters, and evaluates each set by applying the net to each
training case to determine how good the answers given by the net are.
Each set of parameters is a "trial"; the training algorithm selects new
sets of parameters based on the results of previous trials.
78 Neural Network Basics

Computer Processing of Neural Nets
A neural net is a model of computations that can be implemented in
various types of computer hardware. A neural net could be built
from small processing elements, with each performing the work of a
single neuron. However, neural nets are typically implemented on a
computer with a single powerful processor, like most computers
currently in use. With single-processor computers the program, like
NeuralTools, uses the same processor to perform each neuron's
computations; in this case the concept of a neuron describes part of
the computations needed to obtain a prediction, as opposed to a
physical processing element.
Types of Neural Networks
There are various types of neural networks, differing in structure,
kinds of computations performed inside neurons, and training
algorithms. One type offered in NeuralTools is the Multi-Layer
Feedforward Network. With MLF nets, a NeuralTools user can
specify if there should be one or two layers of hidden neurons, and
how many neurons the hidden layers should contain (NeuralTools
provides help with making appropriate selections, as described in the
section on MLF nets). NeuralTools also offers Generalized
Regression Neural Nets and Probabilistic Neural Nets; these are
closely related, with the former used for numeric prediction, and the
latter for category prediction/classification. With GRN/PN nets there
is no need for the user to make decisions about the structure of a net.
These nets always have two hidden layers of neurons, with one
neuron per training case in the first hidden layer, and the size of the
second layer determined by some facts about training data.
The remaining sections of this chapter discuss in more detail each
type of neural network offered in NeuralTools.
More on Neural Networks 79

80 Neural Network Basics

Multi-Layer Feedforward Nets
Multi-Layer Feedforward Networks (also referred to as "Multi-Layer
Perceptron Networks") are systems capable of approximating
complex functions, and thus capable of modeling complex
relationships between independent variables and a dependent one.
MLF Architecture
The diagram below shows an MLF net for numeric prediction with
three independent numeric variables; the net was configured to have
2 neurons/nodes in the first hidden layer, and 3 neurons/nodes in the
second hidden layer.
Output
Second
Hidden
Layer
First
Hidden
Layer
Inputs
The behavior of the net is determined by:
• Its topology (the number of hidden layers and the numbers of
nodes in those layers)
• The "weights" of connections (a parameter assigned to each
connection) and bias terms (a parameter assigned to each neuron)
• Activation/transfer function, used to convert the inputs of each
neuron into its output
More on Neural Networks 81

Specifically, a hidden neuron with n inputs first computes a weighted
sum of its inputs:
Sum = in
where in
to w
* w0 + in1 * w1 + ... + inn * wn + bias
0
to inn are outputs of neurons in the previous layer, while w0
0
are connection weights; each neuron has its own bias value.
n
Then the activation function is applied to the Sum to generate the
output of the neuron.
A sigmoid (s-shaped) function is used as the activation function in
hidden layer neurons. Specifically, NeuralTools uses the hyperbolic
tangent function. In NeuralTools the output neuron uses identity as
the activation function; that is, it simply returns the weighted sum of
its inputs. Neural nets are sometimes constructed with sigmoid
activation functions in output neurons. However, that is not needed
for a neural net to be able to approximate complex functions.
Moreover, sigmoid functions have restricted output range (-1 to 1 for
the hyperbolic tangent function), and there will typically be
dependent values outside the range. Thus using a sigmoid function
in the output neuron would force an additional transformation of
output values before passing training data to the net.
When MLF nets are used for classification, they have multiple output
neurons, one corresponding to each possible dependent category. A
net classifies a case by computing its numeric outputs; the selected
category is the one corresponding to the neuron that outputs the
highest value.
82 Multi-Layer Feedforward Nets

MLF Net Training
Training an MLF net consists of finding a set of connection weights
and bias terms that will get the net to generally give right answers
when presented with new cases (for simplicity the bias term will be
omitted in the presentation below). Training starts by assigning a set
of randomly selected connection weights. A prediction is made for
each training case (by presenting independent values as inputs to
obtain the output). The output will most likely be different from the
known dependent value. Thus for each training case we have an
error value. From these we compute an error measure for the entire
training set; it tells us how well the net does given the initial weights.
The net will probably not do very well with the random initial
assignment of weights, and we proceed to subsequent trials: other
assignments of weights. However, the assignments of weights are no
longer random, but rather are decided by our training algorithm: the
method for selecting connection weights based on results of previous
trials. The problem is one of optimization: we want to minimize the
error measure by changing connection weights.
Historical Background
The first successful algorithm for training connection weights in MLF
nets was "back-propagation"; researchers now tend to favor other
algorithms as faster and more likely to find the global optimum.
NeuralTools uses the "Conjugate Gradient Descent" method,
belonging to the category of "second-order" optimization methods.
These "deterministic" optimization methods are designed to find the
local minimum of a function: they proceed efficiently down the slope
of the error function. To reduce the risk of finding the local rather
than the global minimum, NeuralTools combines "deterministic" with
"stochastic" optimization methods. Specifically, the stochastic
"Simulated Annealing" method is used along with the Conjugate
Gradient Descent method. The algorithm decides which method to
use at a particular point, based on the results of previous trials. For
more information on the Conjugate Gradient Descent method see
Bishop (1995) and Masters (1995). For more information on Simulated
Annealing see Masters (1995).
More on Neural Networks 83

Error Measures
The error measure used when training numeric prediction nets is the
Mean Squared Error over all the training cases, that is the mean
squared difference between the correct answer, and the answer given
by the net. With classification, we have more than one output for
each training case (with one output corresponding to each dependent
category). We compute the Mean Squared Error over all the outputs
for all the training cases, by reference to the desired output values: for
each training case we want the output value to be close to 1 for the
output corresponding to the correct category, and we want the
remaining output values to be close to 0.
Training Time
Topology Selection
The NeuralTools MLF training algorithms restarts itself multiple
times from different initial starting weights. Therefore, the longer a
net is trained, the better. The more times it is allowed to restart itself,
the more likely it is that the global minimum of the error function will
be found.
The selection of the number of layers and the numbers of neurons in
the layers determines whether the net is capable of learning the
relationship between the independent variables and the dependent
one. Typically a net with a single hidden layer and two hidden
neurons will not train to a satisfactory error level. However,
increasing the number of layers and neurons comes at a price that is
often not worth paying. A single hidden layer is sufficient for almost
any problem; using two layers will typically result in unnecessarily
long training times. Moreover, a few neurons in a single hidden layer
are typically sufficient.
NeuralTools can auto-configure the net topology based on training
data. However, the Best Net Search feature offers a more reliable
approach. As part of the Best Net Search a range of single-hiddenlayer nets with different numbers of neurons will be trained. By
default, five MLF nets, with 2 to 6 hidden neurons will be included. If
sufficient time is available, the range can be broadened; but it is
recommended that it start with a 2-neuron net, for reasons related to
preventing over-training.
Preventing Over-Training
The term "over-training" refers to the situation where the net learns
not only the general characteristics of the relationship between
independent variables and the dependent one, but instead starts
learning facts about training cases that will not apply in general; that
is, they will not apply to cases not included in training. Sometimes to
address this problem the testing set is divided into testing-whiletraining set, and the proper testing set, to be used after training. The
error on the testing-while-training set is periodically computed
during training. When it starts to increase, this is taken as evidence
that the net is beginning to over train, and training is stopped.
84 Multi-Layer Feedforward Nets

NeuralTools takes a different approach to preventing over-training.
The approach with two distinct testing sets is often unrealistic, insofar
as typically there is not enough data to split into a training set and
two testing sets. Also, the increase of error on a testing-while-training
set is not a reliable indicator of over-training; the increase could be
local, and the error might continue to decrease with more training.
NeuralTools’ Best Net Search is designed to prevent over-training.
With default settings, Best Net Search will start with a net with 2
neurons, which is typically too small to get over-trained. With default
settings it will train nets with up to 6 neurons. If the nets with 5 and 6
neurons over-train, that will show in the results from the single
testing set; one of the nets with 2, 3 or 4 neurons will have the lowest
testing error.
More on Neural Networks 85

86 Multi-Layer Feedforward Nets

Generalized Regression Neural Nets and
Probabilistic Neural Nets
Generalized Regression Neural Nets and Probabilistic Neural Nets
are based on similar ideas. GRN nets are used for numeric
prediction/function approximation, while PN nets are used for
category prediction/classification. Both types of nets were put
forward by Donald Specht ("Probabilistic Neural Networks", Neural
Networks, 3, 1990, pp. 109-118; "A General Regression Neural
Network", IEEE Transactions on Neural Networks, 2, 1991, pp. 568-576).
They are covered in Masters (1995), whose presentation is
summarized below. Please consult these sources for additional
details.
Generalized Regression Neural Nets
By way of example, consider the training data set presented in the
graph, with one independent numeric variable, and one dependent
numeric variable.
1200
1000
800
600
400
200
0
-12 -10 -8 -6 -4 -2 0 2 4 6 8 10 12
A human observer can discern a pattern in the data. If asked about
the unknown dependent value for the independent value 6, we can
estimate it as greater than 200 and smaller than 400. Note that this
estimate is not based on the two closest known cases, which would
indicate a value below 200; we look at cases beyond the closest ones.
More on Neural Networks 87
-200
-400
-600
-800
-1000

N
However, we do not pay much attention to cases with independent
values around -10; the closer a known case is to the unknown one, the
more weight it is given when estimating the unknown dependent
value. The Generalized Regression Neural Net is built on these
intuitive ideas. Every training case is represented in the net. When
presented with a case, the net computes the predicted dependent
value using the dependent values of every training case, with closer
training cases contributing more significantly to the value of the
output.
GRN Architecture
A Generalized Regression Neural Net for two independent numeric
variables is structured as shown in the graph (assuming there are just
three training cases):
Output
Summation Layer
(Numerator and
Denominator
odes)
Patte r n La ye r
(one neuron per
training case)
Inputs
The Pattern Layer contains one node for each training case.
Presenting a training case to the net consists here of presenting two
independent numeric values. Each neuron in the pattern layer
computes its distance from the presented case. The values passed to
the Numerator and Denominator Nodes are functions of the distance
and the dependent value. The two nodes in the Summation Layer
sum its inputs, while the Output Node divides them to generate the
prediction.
The distance function computed in the Pattern Layer neurons uses
"smoothing factors"; every input has its own "smoothing factor" value.
With a single input, the greater the value of the smoothing factor, the
more significant distant training cases become for the predicted value.
With 2 inputs, the smoothing factor relates to the distance along one
axis on a plane, and in general, with multiple inputs, to one
dimension in multi-dimensional space.
88 Generalized Regression Neural Nets and Probabilistic Neural Nets

Training a GRN net consists of optimizing smoothing factors to
minimize the error on the training set, and the Conjugate Gradient
Descent optimization method is used to accomplish that. The error
measure used during training to evaluate different sets of smoothing
factors is the Mean Squared Error. However, when computing the
Squared Error for a training case, that case is temporarily excluded
from the Pattern Layer. This is because the excluded neuron would
compute a zero distance, making other neurons insignificant in the
computation of the prediction.
Probabilistic Neural Nets
Turning to Probabilistic Neural Nets, consider the following training
data set with 2 independent numeric variables, and a dependent
variable with 2 categories:
?
The circles represent training cases in one category, while the squares
designate those belonging to the other category. We want to predict
the category of the case shown as the question mark. A human
observer will decide that the case is more likely in the circle category
than the square category. However, many classification methods will
not be able to reach the same conclusions. Methods that require linear
separability of categories will fail. Nearest neighbor methods will
assign the unknown case into the square category. So will methods
that focus on central tendencies, since the unknown case is closer to
the centroid of the square category than to the centroid of the circle
category.
On the other hand, a PN net will make the correct prediction. It will
consider the distance of the new case to every training case, giving
greater weight to closer cases. The effect of the neighboring square
will be outweighed by the circles in the immediate vicinity.
More on Neural Networks 89

r
PNN Architecture
A Probabilistic Neural Net is structured as shown in the graph, which
assumes there are two independent numeric variables, two dependent
categories, and five training cases (three in one category and two in
the other):
Output
Summation Laye
(one neuron per
category)
Pattern Layer (one
neuron
per training case)
Inputs
When a case is presented to the net, each neuron in the Pattern Layer
computes the distance between the training case represented by the
neuron, and the input case. The value passed to Summation Layer
neurons is a function of the distance and smoothing factors. Like with
GRN nets, each input has its own smoothing factor; those factors
determine how rapidly the significance of training cases decreases
with distance. In the Summation Layer there is one neuron per
dependent category; each neuron sums up the output values for the
neurons corresponding to the training cases in that category. The
output values of the Summation Layer neurons can be interpreted as
probability density function estimates for each class. The output
neuron selects the category with the highest probability density
function value as the predicted category.
90 Generalized Regression Neural Nets and Probabilistic Neural Nets

Like with GRN nets, training a PN net consists of optimizing
smoothing factors to minimize the error on the training set, and the
Conjugate Gradient Descent optimization method is used. The error
measure used during training to evaluate different sets of smoothing
factors is computed based on all the values returned by neurons in the
Summation Layer for all the training cases. The measure takes into
account not only the probability assigned to the correct category, but
also distribution of probabilities assigned to incorrect categories
(approximately uniform distribution of probabilities among incorrect
categories is better than some incorrect category having a large
probability). Note that when computing the error for a training case,
that case is temporarily excluded from the Pattern Layer. This is
because the excluded neuron would compute a zero distance, making
other neurons insignificant in the computation.
More on Neural Networks 91

92 Generalized Regression Neural Nets and Probabilistic Neural Nets
 Loading...