

DOC026.53.80104
OTT Acoustic Digital Current
(ADC) Meter
05/2013, Edition 3 (North American Version) 10.500.001.B.U.
User Manual


Table of Contents
Specifications..............................................................................................................3
General information..................................................................................................4
Safety information........................................................................................................4
Use of hazard information............................................................................................ 4
Precautionary labels....................................................................................................5
Certification..................................................................................................................5
Product overview.......................................................................................................6
System components....................................................................................................6
About the sensor..................................................................................................8
Temperature compensation.................................................................................. 8
Installation.....................................................................................................................8
About the power supply and battery............................................................................8
Battery specifications ........................................................................................... 9
Charge the battery................................................................................................9
Connect the sensor cable to the handheld unit...........................................................9
To disconnect the sensor...................................................................................10
Attach the handheld display unit to the wading rod...................................................10
Attach the sensor to a wading rod.............................................................................12
Operation.....................................................................................................................12
Turn the handheld unit On and Off............................................................................12
Display screen...........................................................................................................13
Operating key icons ..................................................................................................13
Menu navigation and data entry................................................................................14
Display symbols ........................................................................................................14
Main Menu ................................................................................................................15
System settings.........................................................................................................15
Advanced settings ....................................................................................................16
Upgrade firmware......................................................................................................17
Performing measurements..................................................................................18
Station set up.............................................................................................................18
Angle of flow.......................................................................................................19
Quality control............................................................................................................19
Adjust quality thresholds..................................................................................... 20
Quick quality checks..................................................................................................21
Internal quality check.................................................................................................22
Calibrate the pressure cell (depth calibration)...........................................................22
Turn the depth sensor on or off..........................................................................23
About sensor offsets..................................................................................................23
Perform a single point measurement.........................................................................24
Velocity and discharge measurement methods.........................................................24
Methods for velocity measurement..................................................................... 24
Methods of discharge calculation.......................................................................26
Measurement settings menus.................................................................................... 28
Measurement settings [1/3] ...............................................................................28
Measurement settings [2/3]................................................................................28
1

Measurement settings [3/3]................................................................................29
Field quality checks...................................................................................................30
Perform a discharge measurement...........................................................................30
Perform an ICE measurement...................................................................................33
Discharge measurement window .............................................................................. 34
QReview discharge measurement summary file.......................................................35
Delete a file................................................................................................................36
QReview software....................................................................................................36
Overview....................................................................................................................36
QReview main menu options ............................................................................. 37
Installation..................................................................................................................37
Install the QReview software..............................................................................37
Operation...................................................................................................................37
Change the language.........................................................................................37
Change the units................................................................................................38
Connect the ADC................................................................................................ 38
Retrieve ADC data.............................................................................................. 39
Open and view ADC data files............................................................................ 40
Export data.........................................................................................................43
Edit screen.......................................................................................................... 43
Print a report.......................................................................................................44
Maintenance...............................................................................................................44
Handheld unit maintenance.......................................................................................45
Sensor maintenance..................................................................................................45
Troubleshooting.......................................................................................................45
Measurement guidance.............................................................................................45
Common problems....................................................................................................45
Device warning messages ........................................................................................46
Measurement warnings and errors ...........................................................................47
View system status....................................................................................................48
Contact information................................................................................................48
Table of Contents
2

Specifications
Specifications are subject to change without notice.
Specification Details
Velocity measurement (Acoustic
Ultrasonic Transducers)
Measurement range: – 0.2 m/s to 2.4 m/s (–0.65 ft/s to 7.87 ft/s)
Accuracy: ±1% of the measured value, ±0.25 cm/s (±0.01 ft/s)
Resolution: 0.001 m/s (0.001 ft/s)
Ultrasonic transducers
Frequency: 6 MHz
Beam angle: 20°
Measured volumes
Distance from the sensor: 10 cm (3.93 in.)
Diameter: 1 cm (0.39 in.) per sound pulse
Length: 5 cm (1.97 in.)
Depth measurement (Piezoresistive
pressure cell (absolute))
Measurement range: 0 to 5 m (0 to 16.4 ft)
Accuracy: 0.1% FS
Resolution: 0.01% FS
Maximum overload: 1.5 times the measuring range
Temperature measurement
Measuring range: –5 to 40°C (23 to 104 °F)
Accuracy: ± 0.5 °C
Resolution: 0.1 °C (0.1 °F)
Salinity Range: 0 to 50 ppt (mg/L)
Power supply
Type of batteries: Rechargeable NiMH, fixed battery pack
Life duration: > 14 hours (the battery lifetime is affected by
environmental conditions and charging cycles)
Charging cycles: > 500 (charging cycles vary by use, environment and
other factors)
Nominal voltage: 9.6 VDC
External class II AC/DC power supply: Input 90–240V, 50/60 Hz
Output voltage of power supply: 18 VDC/VAC
Operating conditions
Operating temperature range: –20 to 60 °C (–4 to 140 °F)
Storage temperature range: –40 to 85 °C (–40 to 185 °F)
Shock resistance: compatible with EN 60068-2-32
Dimensions and weight
Cylindrical sensor body: Ø 40 mm (0.20 in.)
Length: 14.5 cm (5.71 in.)
Weight in air: 800 g (1.76 Ib)
Weight in water: 620 g (1.37 Ib)
Handheld unit:
Dimensions: 23.3 x 8.3 x 3.2 cm (9.20 x 11.41 x 1.26 in.)
Weight: 700 g (1.76 Ib)
English 3

Specification Details
Material
Sensor housing: Delrin®/stainless steel
Screws: stainless steel
Handheld unit: aluminium, powder coated
Keypad: Autotex V 150 XI
IP protection class
Handheld unit: IP65 (housing, keypad)
Sensor: IP68
EMC
EN 61000-6-2
EN 61000-6-4
FCC Part 15
EMC Directive 2004/108/EU, Article 5
Internal data memory Capacity: 4 MB (flash)
OTT QReview software
Operating system: Windows®98, Windows®ME, Windows®NT,
Windows®2000, Windows®XP, Windows® Vista, Windows® 7
Functionality: Data transfer from handheld unit, Data check and
processing, Data export (XML, ASCII)
General information
Revised editions are found on the manufacturer’s website.
Safety information
N O T I C E
The manufacturer is not responsible for any damages due to misapplication or misuse of this product including,
without limitation, direct, incidental and consequential damages, and disclaims such damages to the full extent
permitted under applicable law. The user is solely responsible to identify critical application risks and install
appropriate mechanisms to protect processes during a possible equipment malfunction.
Please read this entire manual before unpacking, setting up or operating this equipment. Pay
attention to all danger and caution statements. Failure to do so could result in serious injury to the
operator or damage to the equipment.
Make sure that the protection provided by this equipment is not impaired. Do not use or install this
equipment in any manner other than that specified in this manual.
Use of hazard information
D A N G E R
Indicates a potentially or imminently hazardous situation which, if not avoided, will result in death or serious injury.
W A R N I N G
Indicates a potentially or imminently hazardous situation which, if not avoided, could result in death or serious
injury.
C A U T I O N
Indicates a potentially hazardous situation that may result in minor or moderate injury.
N O T I C E
Indicates a situation which, if not avoided, may cause damage to the instrument. Information that requires special
emphasis.
4 English

Precautionary labels
Read all labels and tags attached to the instrument. Personal injury or damage to the instrument
could occur if not observed. A symbol on the instrument is referenced in the manual with a
precautionary statement.
This symbol, if noted on the instrument, references the instruction manual for operation and/or
safety information.
This symbol indicates that a risk of explosion is present.
This symbol indicates that a risk of fire is present.
This symbol indicates the need for protective eye wear.
Electrical equipment marked with this symbol may not be disposed of in European public disposal
systems after 12 August of 2005. In conformity with European local and national regulations (EU
Directive 2002/96/EC), European electrical equipment users must now return old or end-of-life
equipment to the Producer for disposal at no charge to the user.
Note: For return for recycling, please contact the equipment producer or supplier for instructions on how to return
end-of-life equipment, producer-supplied electrical accessories, and all auxiliary items for proper disposal.
Certification
Canadian Radio Interference-Causing Equipment Regulation, IECS-003, Class A:
Supporting test records reside with the manufacturer.
This Class A digital apparatus meets all requirements of the Canadian Interference-Causing
Equipment Regulations.
Cet appareil numérique de classe A répond à toutes les exigences de la réglementation canadienne
sur les équipements provoquant des interférences.
FCC Part 15, Class "A" Limits
Supporting test records reside with the manufacturer. The device complies with Part 15 of the FCC
Rules. Operation is subject to the following conditions:
1. The equipment may not cause harmful interference.
2. The equipment must accept any interference received, including interference that may cause
undesired operation.
Changes or modifications to this equipment not expressly approved by the party responsible for
compliance could void the user's authority to operate the equipment. This equipment has been tested
and found to comply with the limits for a Class A digital device, pursuant to Part 15 of the FCC rules.
These limits are designed to provide reasonable protection against harmful interference when the
equipment is operated in a commercial environment. This equipment generates, uses and can
radiate radio frequency energy and, if not installed and used in accordance with the instruction
manual, may cause harmful interference to radio communications. Operation of this equipment in a
residential area is likely to cause harmful interference, in which case the user will be required to
correct the interference at their expense. The following techniques can be used to reduce
interference problems:
English
5

1. Disconnect the equipment from its power source to verify that it is or is not the source of the
interference.
2. If the equipment is connected to the same outlet as the device experiencing interference, connect
the equipment to a different outlet.
3. Move the equipment away from the device receiving the interference.
4. Reposition the receiving antenna for the device receiving the interference.
5. Try combinations of the above.
Product overview
The OTT Acoustic Digital Current meter (ADC) is a mobile acoustic current meter designed
specifically for measuring point velocities and water depth in open channels and natural streams.
Examples of ideal uses include single or multiple point velocity measurements and discharge
measurements.
Velocity and depth information from the sensor is displayed in real time on the graphical display of
the handheld unit.
Discharge measurements are based on standard vertical or sub-section measurement techniques
associated with MID and MEAN section discharge calculations. The process used to calculate
discharge measurements is based on internationally recognized USGS and ISO748 standards. Mean
velocity and depth measurements taken by the OTT ADC, along with the position of a vertical relative
to a reference, are used to calculate the discharge.
All measurements, including quality checks, velocity and discharge measurements can be
downloaded using the QReview application software. QReview displayed provides basic analysis
tools, graphics, one-second time series, reports, and review of potential quality issues. Data can be
exported in different formats.
System components
The system consists of two components: the sensor, and the handheld display with sensor
connection cable. The sensor itself contains two 6 MHz acoustic transducers, along with a
temperature and depth sensor.
Other components of the system include wading rod adapter, power adapters, charging and
connection cables. Refer to Figure 1 for a complete list of system components.
The handheld unit contains calibration data for the temperature sensor and the pressure cell of the
relevant sensor. Sensors and handheld units that are used together as part of the same
measurement system must have the same serial numbers. The sensor serial number is engraved on
the rear of the sensor body, below the sensor cable connector. The serial number is also listed on
the gray label on the back of the handheld display.
6
English

Figure 1 OTT ADC components
1 Location of user documentation and software 6 Wading rod (accessory)
2 USB charging cable 7 Mounting clamp
3 USB download cable 8 Sensor
4 Power charger (not shown, located below handheld
unit)
9 ADC handheld unit
5 AC/DC adapter
English 7
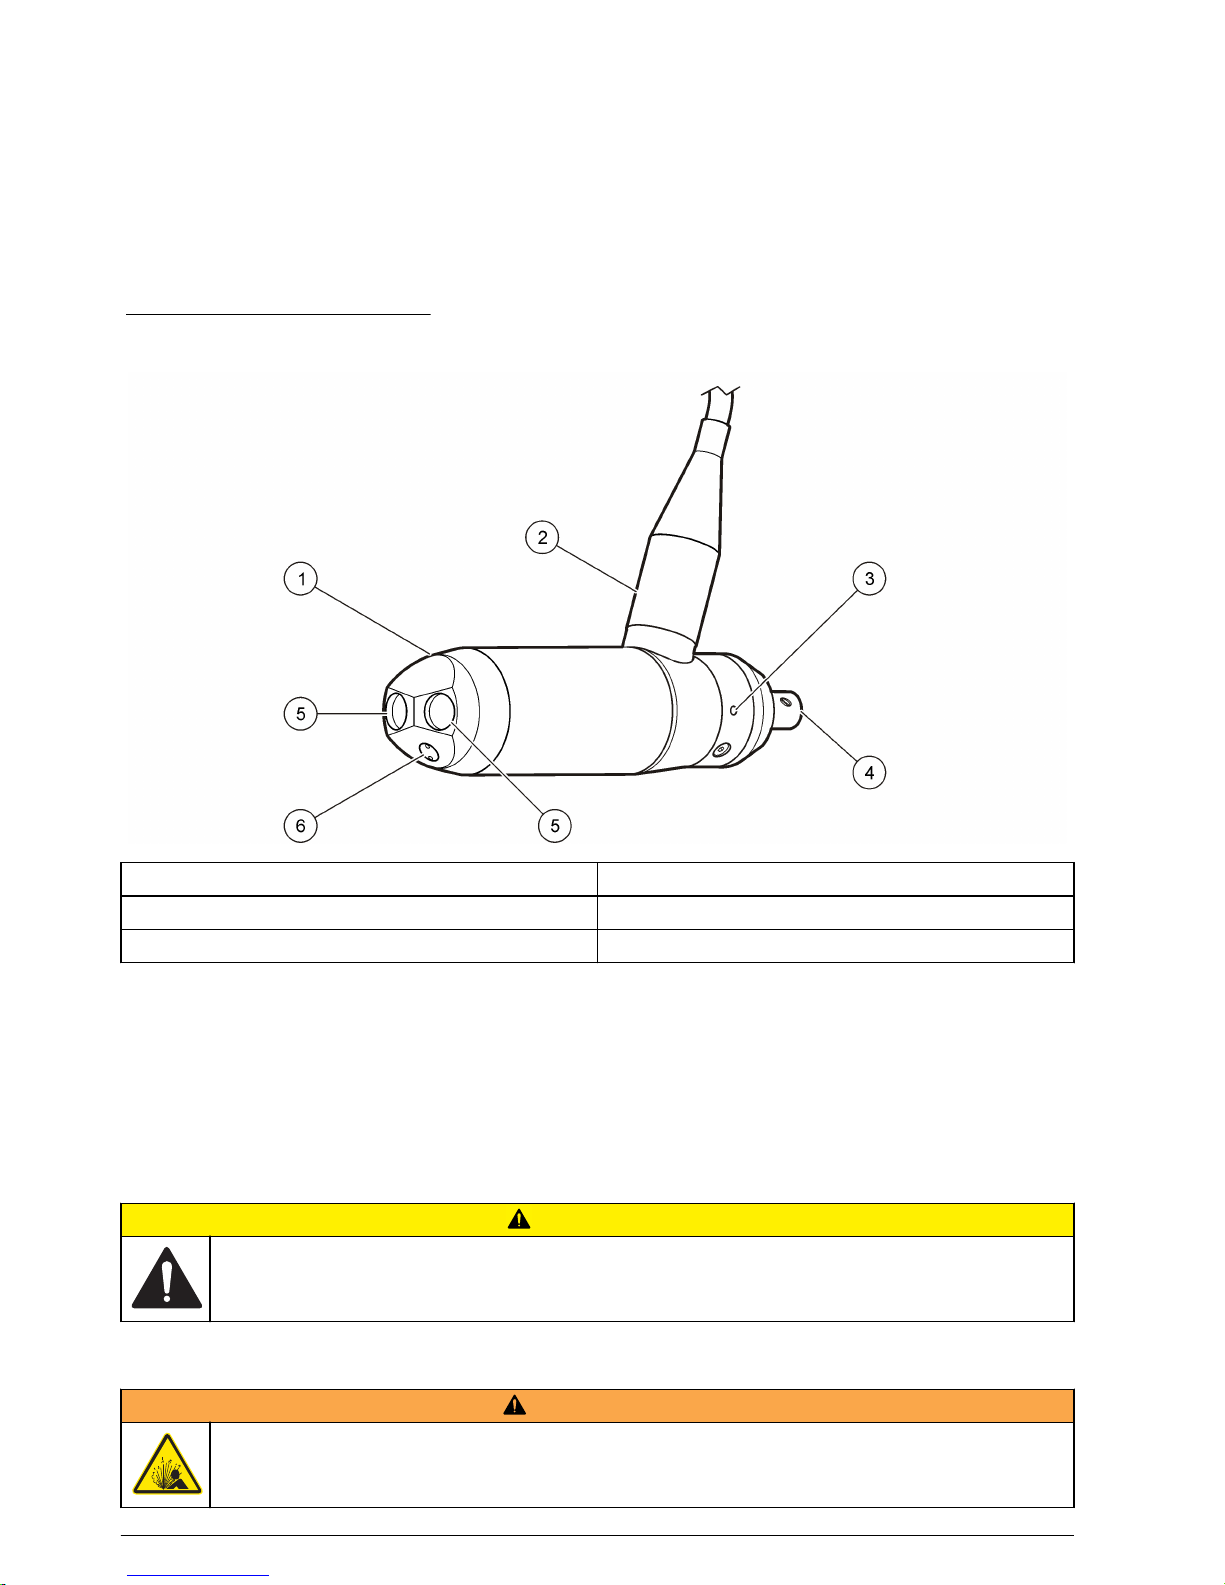
About the sensor
The sensor components are shown in Figure 2.
The transducers transmit ultrasonic signals which are reflected back to the sensor by air bubbles or
particles suspended in the water column. These received backscatter echoes are amplified in the
sensor head and digitized in the digital signal processor (DSP) inside the handheld display. This
transmit-and-receive process is repeated to generate a second echo pattern. The DSP uses a pulsecoherent technique to calculate the phase of each returned pulse echo. Phase differences (lag time)
between the returned pulse echoes is proportional to the flow velocity. Each measurement is
validated against quality thresholds for accuracy.
Figure 2 Sensor components
1 Sensor head 4 Sensor end piece (for attachment to wading rod)
2 Sensor connection cable 5 Ultrasonic transducers
3 Pressure cell chamber 6 Temperature sensor
Temperature compensation
The OTT ADC is equipped with a temperature sensor. Water temperature is an important parameter,
both for the calculation of the speed of sound and for the temperature-compensated depth
measurement given by the pressure cell. Therefore, a best practice when starting a measurement is
to allow the sensor to adjust to the water temperature. The temperature adjustment of the sensor
under extreme conditions (from approximately 50 ºC to 5 ºC) takes approximately 5 to 6 minutes.
Installation
C A U T I O N
Multiple hazards. Only qualified personnel must conduct the tasks described in this section of the
document.
About the power supply and battery
W A R N I N G
Explosion hazard. Incorrect battery installation can cause the release of explosive gases. The battery
pack cannot be replaced by the user. Contact technical support.
8 English

Power for both the sensor and handheld unit is provided by a rechargeable battery installed in the
handheld unit. A battery symbol in the upper right corner of the display indicates the battery charge
level. The charge level can also be viewed by selecting Main menu>System Status>Battery.
A fully charged battery can provide more than 14 hours of measurement operation. The battery can
be charged more than 500 times. Charging cycles vary by use, environment and other factors.
All data saved on the handheld unit are retained even if the battery becomes fully discharged.
The battery cannot replaced by the user. Attempts by a user to replace the battery will void
applicable warranties. Refer to Contact information on page 48 for repair contact information.
Battery specifications
Values listed in the table are typical and approximate.
Hours of measurement operation per charge 14
Number of possible charge cycles 500
Length of charge cycle, in hours (complete discharge to
full charge)
2
Charge the battery
W A R N I N G
Fire and explosion hazard. The power supply is designed specifically for this product. Do not attempt to
use this product with any other power supply even if the device conforms to the USB standard. This
may cause damage to the battery.
Although the unit is shipped with the battery partially charged, the manufacturer recommends that the
battery be charged to full capacity before the system is used.
A completely discharged battery will reach full charge after approximately 2 hours of charging time.
Entries may be made in the handheld unit while the battery is being charged.
1. Connect the charging cable connector of the power supply to the charging cable with the barrel
connector.
2. Connect the charging cable to the handheld unit with the USB connection.
3. Connect the plug of the power supply to the electrical outlet.
The battery begins to charge and the unit switches on. A charging icon appears in the upper right
corner of the display. The battery icon will appear solid when the battery is fully charged.
Note: The battery can also be charged with a vehicle voltage converter, available as an accessory. Refer to the
Parts and Accessories list for more information.
Connect the sensor cable to the handheld unit
Refer to Figure 3 and the steps to connect the sensor to the handheld unit.
English
9
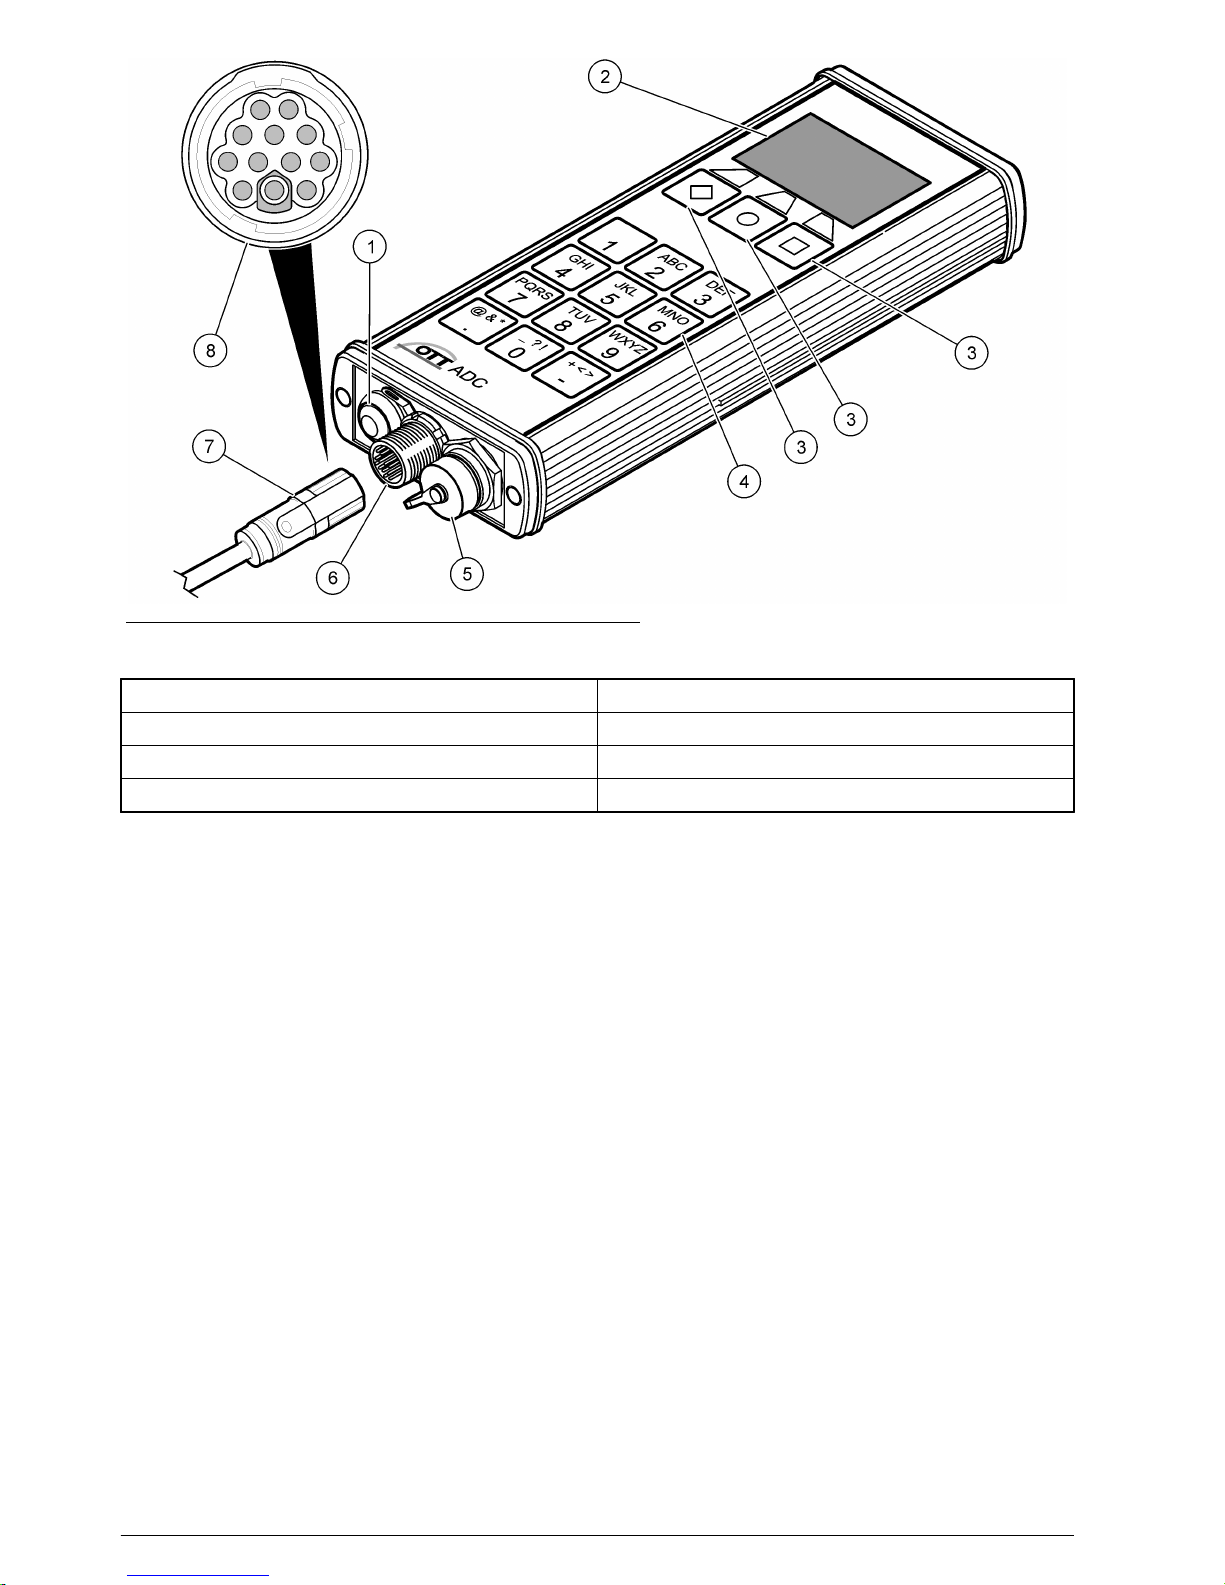
Figure 3 Handheld unit overview and connections
1 On/Off switch 5 USB connection
2 Liquid crystal display (LCD) 6 Sensor connection
3 Operating keys 7 Sensor cable
4 Keypad 8 Connector contact pins
1. Align the red markings on the sensor connector cable and the handheld unit connector.
2. Grasp the sensor connector cable plug and push it on to the handheld unit connector until it
snaps in place.
3. Turn the sensor connector cable plug clockwise until clicking sounds are heard. The clicks
indicate the connection is secure.
To disconnect the sensor
1. Grasp the sensor cable connector and turn it counterclockwise until the red mark on the sensor
cable is aligned with the red mark on the handheld unit.
2. Pull back on the sensor cable connector plug until it disengages from the handheld unit.
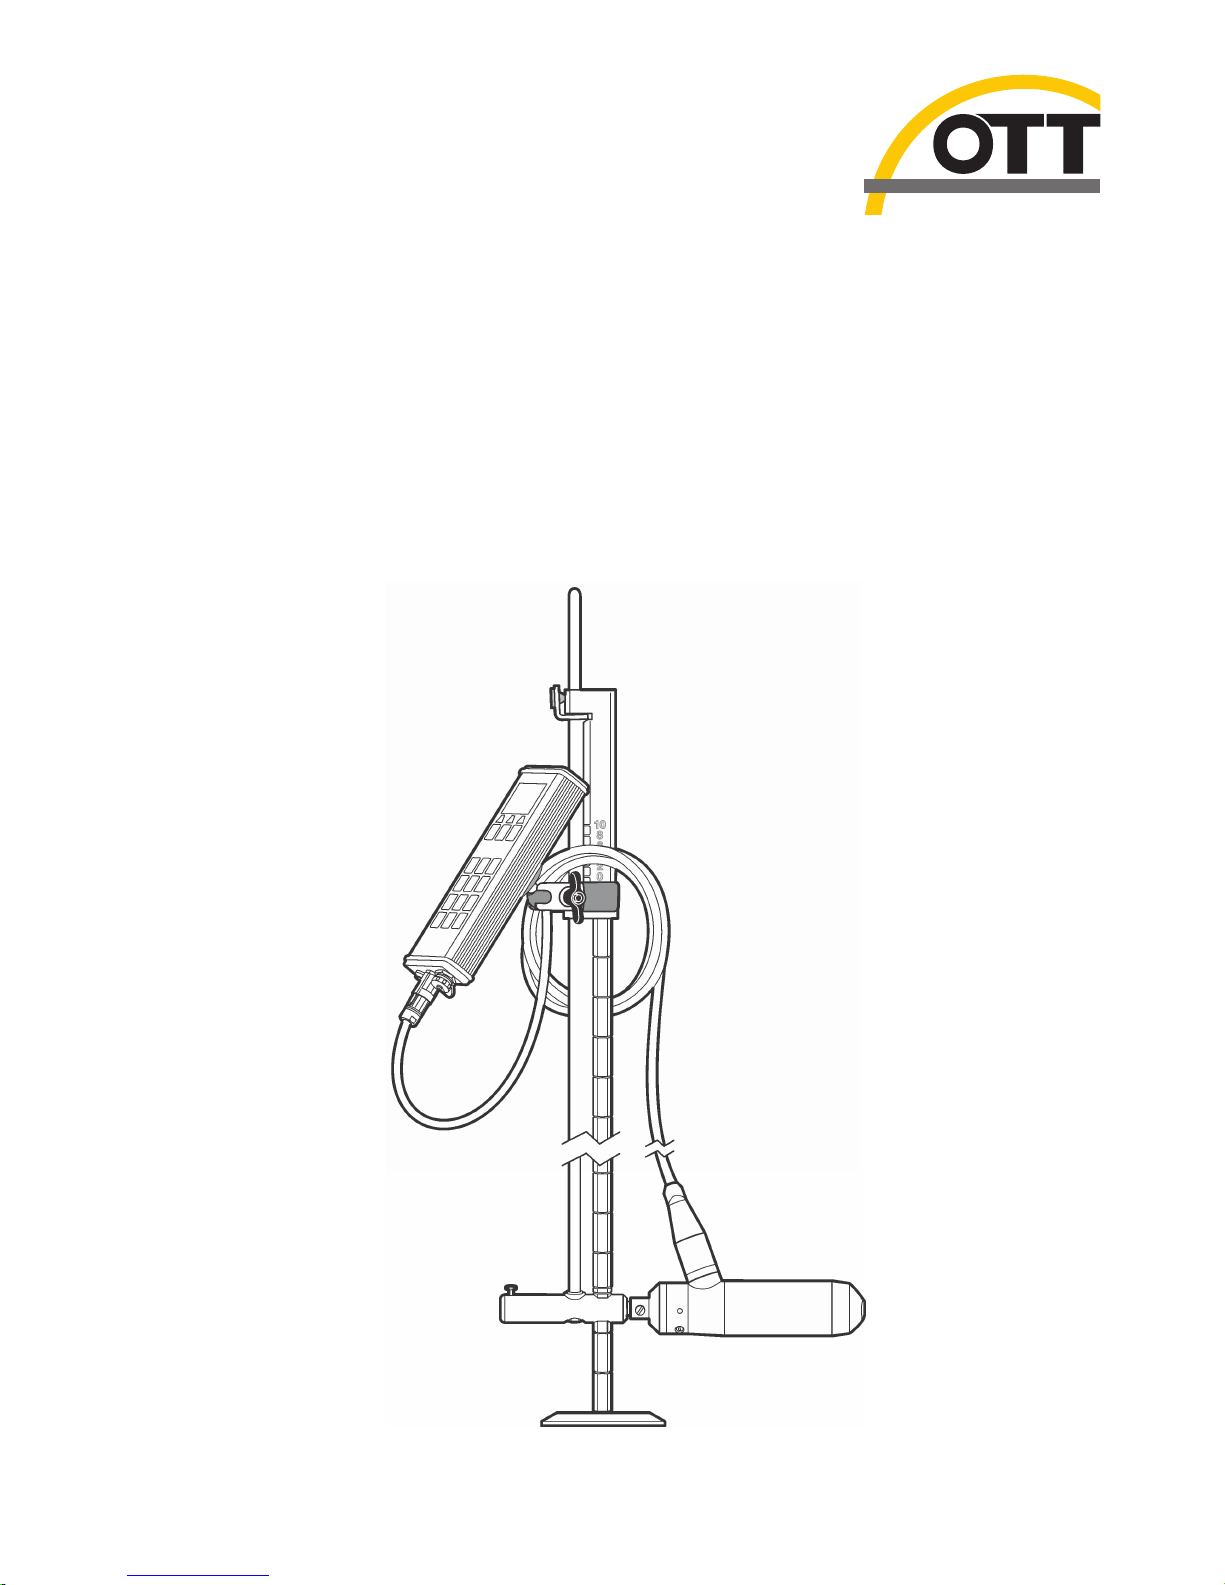
Attach the handheld display unit to the wading rod
The OTT ADC is supplied with a universal attachment for USGS wading rods. The unit is
manufactured with a fixing plate on the rear of the handheld unit that contains a ball head. This
arrangement allows the unit to move and rotate in different directions.
Refer to the steps and Figure 4 to attach the handheld unit to the wading rod.
Note: Attach the sensor cable to the handheld display before attaching the handheld display to the wading rod.
10
English
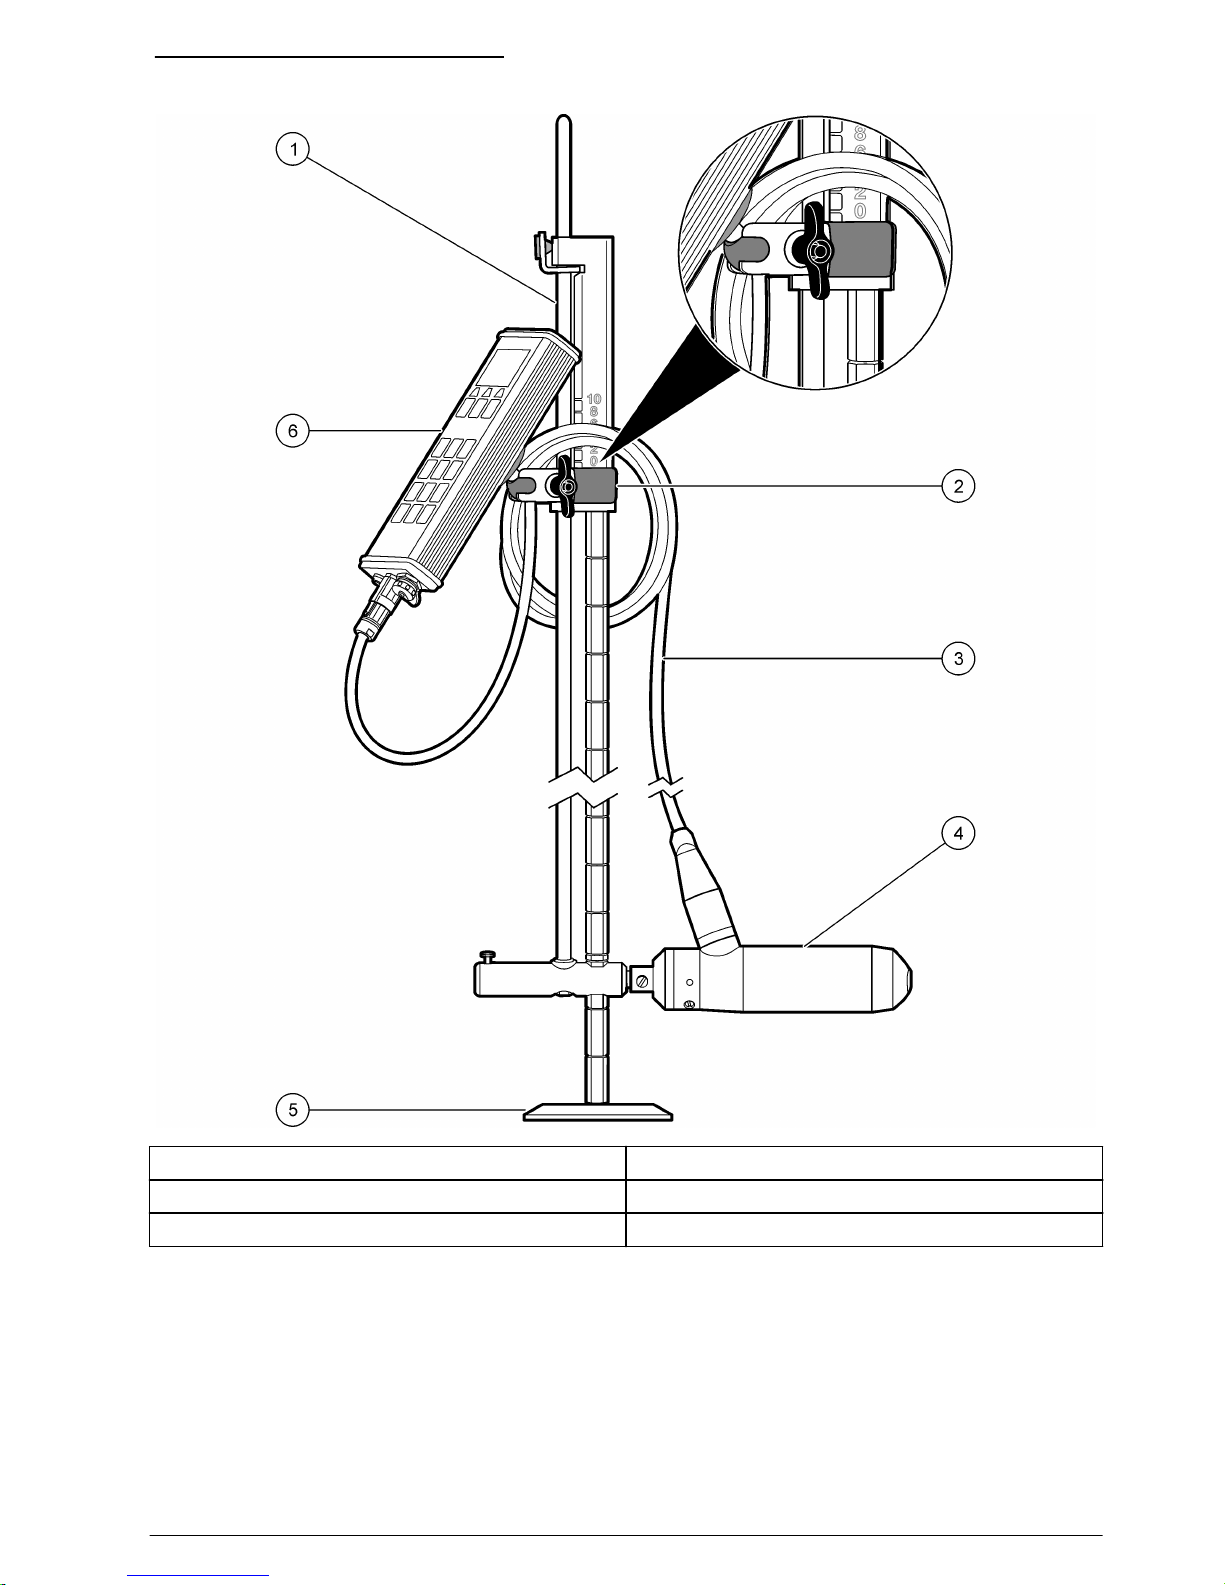
Figure 4 Attach the handheld unit
1 Wading rod assembly 4 Sensor
2 Handheld unit clamp 5 Wading rod base plate
3 Sensor connection cable 6 Handheld display unit
1. Attach the silver ends of the universal wading rod mounting bracket to the ball on the backside of
the handheld display.
2. Place the black ends of the universal wading rod mounting bracket on the handle of the topsetting wading rod, or near the top of the standard wading rod.
Note: Make sure that the handheld display faces in the direction opposite of the sensor. Also make sure the
relocating rod of the top-setting wading rod can move freely when the sensor is raised or lowered.
3. Tighten the wingnut on the bracket to secure the clip to the wading rod.
4. To position the sensor vertically, press the rubber stopper of the catch on the handle, move the
sensor to the new position, and release the rubber stopper to secure.
English
11

Attach the sensor to a wading rod
• OTT ADC sensor with sensor end piece.
• USGS type standard or top-setting wading rod
• Extensions for rod if necessary
Refer to Figure 5 for a top-setting wading rod. Refer to Figure 6 for a standard wading rod. Follow the
steps to attach the sensor.
1. Push the sensor on to the receiver of the meter/sensor bracket of the wading rod. Make sure the
sensor connection cable is vertically aligned with the wading rod.
2. Secure the sensor by tightening the mechanical adapter fixing screw.
3. Extend the rod as required.
Figure 5 Attachment of the sensor to a top-setting wading rod
1 Meter/sensor bracket 2 Sensor end piece
Figure 6 Attachment of the sensor to a USGS rod
1 Meter/sensor bracket 2 Sensor end piece
Operation
Turn the handheld unit On and Off
To turn the unit on or off, press the On/Off switch and hold it for approximately one second. The
startup process takes approximately ten seconds. During this time, the upper edge of the display will
show a series of + symbols until the startup process is complete.
12
English

Note: To conserve battery power, the unit is equipped with an automatic shut off feature. If no key presses or
communications have occured for 15 minutes while the unit is under battery power, the unit turns off. Remove the
USB data cable to make sure this feature operates correctly.
Display screen
Saved data and current measurement information are shown on the display screen (Figure 7).
To conserve battery power, if no keys are pressed for 30 seconds, the display background
illumination turns off. The auto turn-off feature is active by default but can be made inactive through
the Display Settings menu.
Figure 7 Display screen
1 Data quality (correlation) indicator 6 Actual depth indicator
2 Battery charge indicator 7 Position of the verticals
3 Target submersion depth (set value) 8 Distance of verticals from the reference point
4 Position of the sensor on the vertical 9 Flow velocity
5 Key function indicator 10 Measurement progress indicator
Operating key icons
The function of the operating keys depends on the current operating situation. The function
associated with a key is shown in the display directly above the key. Symbols and their functions are
shown in Table 1.
Table 1 Symbols and functions
Call main menu Return to previous menu
OK and continue Delete character
Delete or Cancel Confirm entry
English 13

Table 1 Symbols and functions (continued)
Move Up or Down in multipart menu or
list
Call help
Switch between two display views Start measurement
Menu navigation and data entry
To select a menu or menu option, press the key with the menu or option number.
Some menus, such as the Main Menu and Measurement Settings menus, are divided in to multiple
parts. Each part may be divided in to other sub-menus and screens.
The current menu and the number of available menus are shown in the display screen next to the
main heading. For example, Main Menu [1/2] means the user is in the first of two available Main
Menu divisions. Navigate to the next division of the menu by pressing the down arrow key.
Fields accept alpha and numeric data depending on the use and application. Entry modes are
automatically selected by the handheld unit.
To enter data in a field, press the key that shows the letter or number. The first key press causes the
first alpha character on the key to appear in the display. Additional key presses will cause the rest of
the letters to appear in order, followed by the key number before the cycle begins again. For
example, to enter the letter K, press the 5 key two times in quick succession. To enter the numeral 5,
press the 5 key four times.
Approximately one second after an alpha or numeric entry is made, the entry is saved and the cursor
automatically moves one space to the right. To move the cursor back to a previous position, press
the backspace key.
Display symbols
Display symbols give information on the system status and the current measurement. During a
measurement, the symbols give information on the sensor position. Display symbols and their
meaning are shown in Table 2.
Table 2 Display symbols and meaning
Battery charge indicator
Distance of verticals from cross-section zero
point
Data quality (correlation) indicator Position of vertical
Measurement progress indicator
Position of sensor on the vertical (actual
value)
Water temperature Position of sensor on the vertical (set value)
Battery power supply Depth of the sensor (actual value)
14 English

Table 2 Display symbols and meaning (continued)
Flow velocity
Note: Leave sensor at current position
(depth)
No signal (symbol flashes) Note: Position sensor further up or down
Main Menu
The Main Menu of the OTT ADC is divided in to two windows, each with specific options. The
function of the menu options are given in the tables in the steps below. More details can be found in
the respective sections of this manual.
1. If the unit shows the measurement window, press the menu key to view the first Main Menu
window [1/2].
Option Description
Load Load basic settings from a saved file.
Quick Quality Check Choose this option to perform a quick quality check of the handheld unit.
Measurement Settings Choose this option to enter basic settings for a measurement.
Start Measurement Choose this option to start a discharge measurement.
View Data Choose this option to view data from a completed measurement.
2. Scroll down to view the second window of the Main Menu [2/2].
Option Description
Depth calibration Choose this option to perform a depth calibration.
Delete Files Choose this option to delete existing files.
System Status Choose this option to view system information, including amount of available memory,
unit serial number, firmware revision and amount of battery charge.
System Settings Choose this option to change the date and time, sound level and display characteristics.
Advanced [1/2] In the first Advanced Settings window, change the quality thresholds, turn the
measurement guidance feature on or off, format the memory, or reset the handheld unit
settings to the default values.
Advanced [2/2] In the second Advanced Settings window, turn the key sound on or off and set the units
to be used in measurements.
System settings
Use the System Settings menu to set the Date and Time, Display, and Sound Level options for the
handheld unit. From the second Main Menu [2/2], select System Settings.
1. To change the date or time, select Date and Time and change or update the entries. The current
date and time will show in the display when all entries are completed. Push OK to save the
information. An example of the date and time display is shown below the table.
Option Description
Hour (0 - 24) Current time in whole hours
Minutes (0 - 60) Current time in minutes
Seconds (0 - 60) Current time in seconds
English 15

Option Description
Day (1 - 31) Current day
Month (0 - 12) Current month
Year (0 - 99) Current year
Time:
14:22:32
Date: 11/13/08
2. To change the display options, in the System Settings menu, select Display and change or
update the entries. Press OK to save the information.
Option Description
Backlight --On,
Automatic, Off
If set to on, the display illumination remains turned on until the handheld unit is
switched off. Use of this option may increase the rate of battery discharge.
If set to Automatic, the illumination turns off after 30 seconds if no entry or
communication has occurred. If a key is pressed, the illumination turns on and the
timer is again set to 30 seconds.
If set to Off, there is no display illumination.
Contrast (0 - 10) Sets the display contrast (1 = low contrast, 10 = maximum contrast)
Velocity display-Continuous, Result
only
If set to continuous, the measurement results for flow velocity measurement are
continuously displayed and updated each second.
Note: The continuous display allows a visual impression of the waterway flow
turbulence.
If set to Result Only, only the end result of the flow velocity measurement is
displayed.
3. To change the sound volume for key clicks and feedback sounds, go to System menu and select
Sound Level. Enter a value between 0 and 10 (0=no sound, 10= maximum volume). Push OK to
save the setting.
Advanced settings
The Advanced option has two windows. The second window in the Advanced menu is used to set the
language, key sound and units options, format the memory, and reset the unit to the default values.
To update any of these options, in the second Main Menu [2/2] window, select option 5 Advanced.
Measurement Guidance and Quality Thresholds settings can also be accessed through the
Advanced menu. Details for these options are given in respective sections in this manual.
1. To change the language, scroll to the second Advanced menu window [2/2] and select 1.
Language. Press the number of the language to be used in the handheld unit display.
Option Description
1. English
2. Dutch
3. German
4. Spanish
5. French
6. Russian
Available languages for the handheld display.
16 English

The display switches to the selected language.
2. To turn the key sound on or off, select option 2 Key Sound in the Advanced [2/2] window. Press
the number 2 key to toggle the sound on and off. The current state is shown in the display.
Option Description
On The unit emits sound when keys are pressed (default).
Off The unit does not emit a sound when keys are pressed.
3. To set the units used in measurement displays, select option 3 Units in the Advanced [2/2]
window and enter the option number.
Option Description
1. Metric Measurement values are shown in metric units.
2. Imperial Measurement values are shown in imperial units (default).
4. Depth can be measured with the water surface or the streambed as a reference. To change the
reference depth settings, scroll to the Advanced Menu [2/2] and select Option 4 Depth Reference.
Option Description
Surface The water surface is used as the reference point. Depth and sensor positions are shown as
distance from the water surface. During a measurement, the depth is shown on the display by an
underlined arrow pointing down. If a manual depth entry is required, the value entered must be
equal to the distance from the water surface. The distance displayed in the point results screen is
referenced to the water surface.
Bottom The bottom, i.e., the streambed, is used as the reference point. Depth and sensor positions will be
shown as distance from the streambed. During a measurement, depth is shown on the display by
an underlined arrow pointing up. If a manual depth entry is required, the value entered must be
equal to the distance from the streambed. The distance displayed in the point results screen is
referenced to the streambed.
5. To format the memory, scroll up to the first Advanced [1/2] menu window, and select option
4 Format Recorder (a warning statement will appear). To begin the formatting process, select 1.
To return to the menu without formatting, press the BACK key.
Note: The Format Recorder option will cause all data stored in memory to be erased. Make sure all data is
downloaded before the format process is started.
6. To reset the handheld unit settings to their default values, select option 4 in the first Advanced
[1/2] window. A warning statement will appear. To continue, press the number 1 key. To return to
the menu without resetting the values, press the BACK key.
Upgrade firmware
Each handheld unit is supplied with a particular version of firmware. The manufacturer periodically
releases new versions of the firmware. The firmware should be periodically upgraded to make sure
the instrument has the most current features and functionality.
• Download all saved data before the upgrade is started. The upgrade will cause a hard format and
all saved data will be lost.
• Make sure the battery is fully charged
• Make sure that the QReview software is installed on the PC
• Make sure the handheld unit USB driver is installed on the PC
• Make sure the current firmware is saved on the PC
The current version of the firmware can be viewed through the second Main Menu [2/2]. Select
System Status, System Info to view the current version.
Information about current or new firmware releases is available at http://www.ott.com. The firmware
file name has the naming convention ADC_Vxxx.bin, where xxx is the version number. Do not
change the filename.
English
17

To start the firmware upgrade process, do the following:
Note: During the upgrade, the On/Off switch is disabled.
1. Place the handheld unit in upgrade mode.
a. Switch off the device.
b. Connect the handheld unit to the PC via the USB connection.
c. Press and hold the . and the - keys and turn on the handheld unit.
The message FIRMWARE UPGRADE CHECKING STATUS appears on the display. After a
few seconds a prompt for the upgrade code appears.
d. Enter the upgrade code (1234) and push OK.
The handheld unit is now in firmware upgrade mode.
2. Start the QReview application.
3. From the Tools menu, select ADC Firmware Upgrade.
4. In the window under Upgrade file, select the current firmware and click Open.
5. Select the COM port (serial port) used by the USB interface.
6. Click Start.
The upgrade process begins and a progress indicator shows the upgrade status. When the
upgrade is complete, a message appears indicating the process is complete. The unit is placed
into ready mode and switches off automatically.
Performing measurements
Station set up
Measurement quality is dependent on the correct selection of a measurement cross section. The first
step in making a current-meter measurement is to select a reach of stream with the following
characteristics:
• Cross section lies within a straight reach and stream lines are parallel to each other.
• The streambed is stable and free of large rocks, weeds, and protruding obstructions such as piers
that create turbulence.
• The streambed has a flat profile. This helps eliminate vertical velocity components.
It is often impossible to completely satisfy all of the above conditions. Use the criteria to select the
best possible reach and then select a cross section.
Number of verticals and vertical spacing
For a well-chosen cross-section, 25 to 30 partial sections is typically sufficient. If the cross section is
very smooth and the velocity distribution is consistent, the number of sections can be reduced.
The partial sections should be spaced so that no individual section contains no more than 10 percent
of the discharge. The ideal measurement is one in which each partial section contains 5 percent or
less (<=5%) of the total discharge, but this is rarely achieved when 25 sections are used. Partial
sections should not have equal widths across the entire cross section unless the discharge is welldistributed.
Distances between verticals are generally smaller where water depth and flow velocities change
significantly. Places where depth and velocities may change significantly include bank areas, vertical
or steep slopes, ledges in divided cross-sections and transitions from the main stream bed to the
foreland. Verticals should also be located at points of significant changes in the stream bed profile.
The measurement cross section must be set at right angles to the direction of flow. Avoid cross
sections with still areas, counter currents or eddies. Do not place the sensor in deep pools, below
large inflows, or near ship moorings, ferries or sluices.
The percentage of the computed discharge for each measured vertical is automatically calculated by
the OTT ADC and is shown on the display of the handheld unit when the vertical measurement is
complete.
18
English
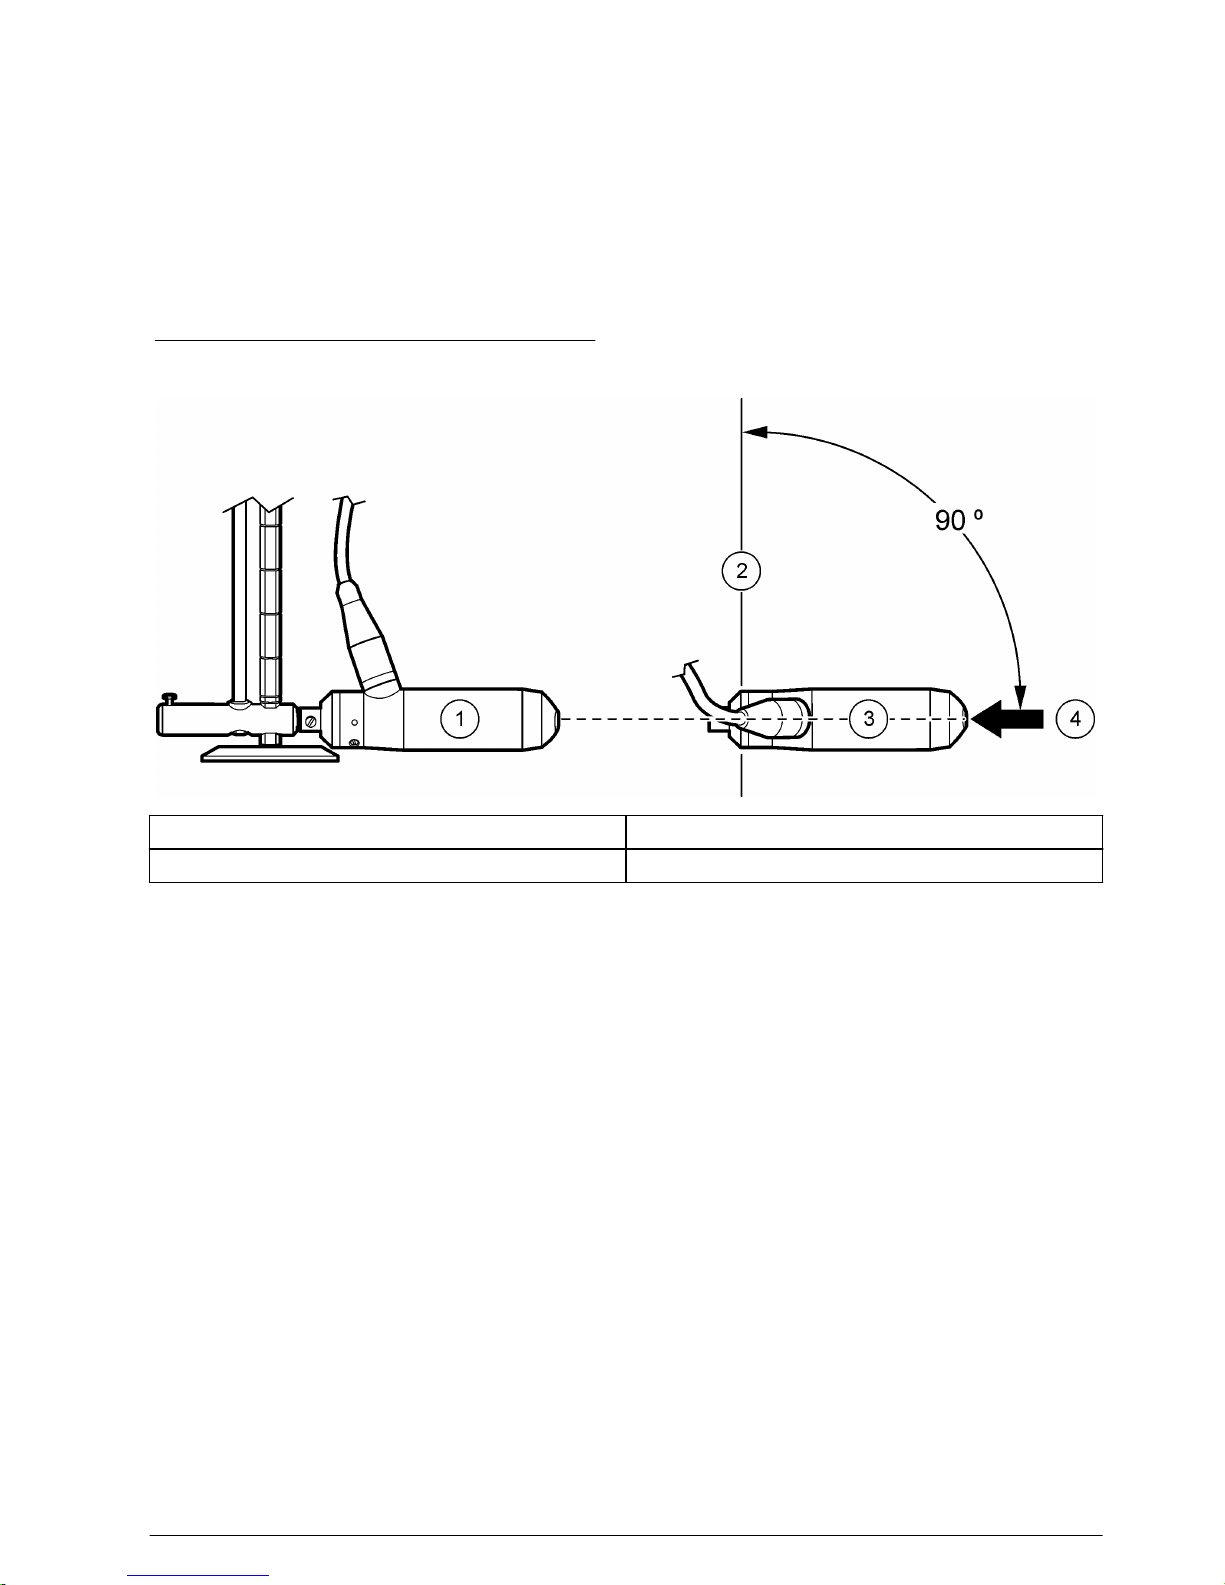
Angle of flow
The angle of flow is defined as the angle between the symmetry axis of the sensor and the direction
of flow. In an ideal situation, the flow angle is 0º.
The flow angle can affect the quality of measurement. The best measurement stations have a low
angle of flow when the sensor is positioned at right angles to the measurement cross-section and the
flow is parallel to the edges.
In the field, it may be difficult to achieve flow angles of 0º. In field tests of the OTT ADC, velocity
measurement has been found to be unaffected by flow angles of up to 10º. Flow angles of 20º and
30º typically result in measurement errors of approximately 6% and 8% respectively.
Figure 8 shows two views of a sensor in proper position.
Figure 8 Sensor position and angle of flow
1 Side view 3 Top view
2 Measurement cross section 4 Flow direction
Quality control
Quality parameters determine whether the measurement value is valid. Information about each
parameter is given below. Quality threshold values are output in the Discharge Summary File. If there
are no changes input by the user, the default settings appear. If the user has made changes to the
settings, the user-defined settings appear.
• Signal to Noise Ratio--The strength of the reflected acoustic signal relative to the noise in the
OTT ADC electronics.
• Maximum angle--Maximum angle (+/-) between the direction of a measured velocity and the Xaxis.
• Correlation--Pairs of echoes from the sensor are used to calculate the average velocity. In stable
flow conditions, the correlation between the averaged raw measurements is higher than 70% and
correspond to small standard deviations. Turbulent conditions result in lower correlation values.
The signal bars in the handheld display indicate the correlation value. Each bar corresponds to a
20% correlation. The default minimum is 40%. During the majority of a measurement, at least two
bars should be visible. The minimum correlation factor necessary for measurement can be
decreased to below 40. However, the quality of the measurement may be lower and may not meet
the same specifications. For example, if the correlation is reduced to 20, the associated
measurement error is 5%. Reducing the correlation threshold can be useful when working in
turbulent streams. If the correlation threshold is set to lower than 40 and the unit is turned off, the
display will show a correlation warning when the unit is again turned on.
• Velocity Gradient--The instantaneous measurement minus the previous measurement. A valid
measurement must have a velocity gradient below 0.82 ft/s (0.25 m/s). This helps make sure that
measurement spikes are not included in the final measurement value.
English
19

• Standard Deviation--Indicates measurement accuracy. The standard deviation is calculated only
from values that have passed the quality control.
• % Discharge per Vertical--Percentage of total discharge in a vertical. Defined ideal standard is
less than 5% and no more than 10%.
• 1-point Maximum Depth--Maximum depth for a 1 point measurement. If this depth is exceeded, a
warning message appears on the handheld unit and the user is prompted to change to a 2-point
measurement.
Table 3 gives the value range for each quality threshold. Default values are shown in parentheses.
Table 3 Quality threshold ranges
Quality threshold (resolution and units) Range
Minimum correlation xx.x% 01-100 (40)
Maximum angle ( xx.x º) 0-45 (20)
Velocity gradient (x.xx ft/s, m/s) 0.0-2.5 (0.82 ft/s)
Standard deviation (x.xx ft/m) 0.0-2.5 (0.33 ft)
% Discharge per vertical (xx %) 0-100 (5)
Minimum signal-to-noise ratio (SNR) (xx dB) 10-100 (10)
1-Point maximum depth (xx.x ft/m) User defined (1.5 ft)
If less than 50% of the measured values meet their defined criteria, the measurement is discarded
and the user is asked to repeat the measurement, accept the measurement as is or skip the
measurement. If the measurement is skipped, measured values will not be included in calculations.
Data from all valid measurements is stored in the handheld unit.
All valid averaged data is recorded in the Discharge Measurement Summary file. QReview can be
used to review and export this file and to review all one-second time series data.
Adjust quality thresholds
Quality thresholds can be adjusted for specific measurements.
1. From the second Main Menu [2/2], select Advanced.
The Advanced [1/2] window appears.
2. Select option 1, Quality Thresholds.
The QA Thresholds [1/2] window appears.
3. Enter the number of the quality threshold to be adjusted and update or change the entry.
Option Description
Minimum correlation xx.x, default 40.0
Maximum angle xx.x, default 20.0
Velocity gradient x.xx, default 0.82
Standard deviation x.xx, default 0.33
Minimum SNR xx, default 10%
4. Scroll down to view the second Quality Thresholds [2/2] window. Update or change the entries.
Option Description
%Discharge/Vertical xx%, default 5%
20 English

Option Description
1-Point Maximum Depth xx.x, default 1.5 ft
Set to defaults Reset to default settings.
5. To return to the Main Menu, scroll up to the first Quality Thresholds window, and press the BACK
key.
Quick quality checks
A Quick Quality Check (QQC) helps make sure the system is ready for use and will give reliable and
accurate measurement data. The Quick Quality Check option is found in the Main Menu [1/2] screen.
It is recommended that a Quick Quality Check be done before the system is moved to the field,
although this is not mandatory. A container with appropriate dimensions and a metal plate placed
4-6 inches in front of the sensor can be used. The metal plate should be at least as high as the depth
of water, and 10" wide. Refer to Figure 9 for minimum container dimensions and sensor placement.
At least 50% of the quick quality check parameters must be within their specified values for the
quality check to pass.
The results of a quick quality check are stored with a default or user-defined name and the file can be
downloaded with QReview. The file has a .QQC extension and the following default naming
convention: QCMMDDYYXXXXXX_QQC, where MM = month, DD = Day, YY = Year and XXXXXX =
the ADC serial number.
Figure 9 Container dimensions
1 Side view 3 Metal plate
2 Top view
To do a quick quality check, do the following:
1. From the Main menu, select Quick Quality Check.
2. Enter a name for the QQC file or proceed directly to the depth calibration. In the latter situation,
the default name for the QQC file will be used. (For example, QCMMDDYXXXXXX_QCC, where
XXXXXX is the device serial number). File names are limited to 20 alpha numeric characters.
3. Select option 2, Depth Calibration. Refer to Calibrate the pressure cell (depth calibration)
on page 22. The absolute pressure cell built in to the OTT ADC sensor body determines the
water and sensor depths. The pressure cell must be calibrated in the existing air pressure
conditions to make sure depth readings are accurate. If the depth sensor is not calibrated before
a QQC is started, a warning message will appear.
4. Place the sensor in the water, select option 3 and in the QQC screen press the start key to begin
the quality check. The following parameters are examined by the handheld unit during the quality
check: signal amplitude, signal-to-noise, depth, temperature, battery voltage, and noise.
English
21

The quality check starts. A PASS or FAIL message will appear in the handheld unit display. Scroll
to additional screens to view information about the test results. Push OK to confirm the quality
check results and return to the QQC menu.
5. To verify the depth sensor performance, check the instantaneous reading against a reference
such as the wading rod.
Internal quality check
Internal quality checks are closely linked to the flow velocity measurement process.
Each measured value is internally checked against the following criteria:
• Correlation > 40%
• Velocity > -0.25 m/s and < 0.25 m/s
• Velocity gradient (the difference between the current measurement and the previously measured
velocity) < 0.25 m/s
• Signal to Noise Ration (SNR) > 10 dB
Measured values that meet the criteria are saved. If the measurement time (integration time) is set to
30 seconds, for example, the OTT ADC collects a maximum of 30 values for each sound pulse. At
the end of the measurement time, the OTT ADC checks whether at least 50% of all measured values
meet the associated criteria. If the 50% standard is not met, the measurement is rejected and the
user is prompted to repeat the measurement.
If the measured values are confirmed, the OTT ADC calculates the mean and standard deviation for
the measured velocities in the cells closest to and furthest from the sensor. Based on the result of the
calculation, the final velocity is determined and shown in the display.
The focus of an internal quality check for flow velocity measurement is based on the parameters
given in Table 4.
Table 4 Internal quality check parameters for flow velocity measurement
Parameter Description Comment
Signal to Noise Ration (SNR) Indicator for the strength of the
reflections caused by particles in the
water.
If the SNR value is too low, a valid
measurement is not possible. Limit
SNR > 10 db.
Correlation Factor (CF) Indicator for the consistency of
sequentially received scan patterns
Limit CF > 40%
Peaks Outliers in the measured velocity
values caused by environmental
conditions
Peaks are eliminated in the velocity
gradient check
Standard deviation Standard deviation for the velocity
indicator for the measurement
accuracy
Standard deviation is decisive for
the determination of the valid
measuring range.
%Q Percentage proportion of a
discharge segment to the total
discharge
Ideal < 5%
Maximum 10%
After a measurement is completed,
the percentage proportion of each
segment of the total discharge is
shown on the display of the
handheld unit. The user can then
decide whether additional verticals
need to be allocated.
Calibrate the pressure cell (depth calibration)
Water depth is given by an absolute pressure cell built in to the OTT ADC sensor body. The pressure
cell must be calibrated to make sure the sensor measurement values are correct. This calibration
must be done under the current air pressure conditions with the sensor outside of the water in air. A
depth calibration is done before a measurement is started. Once a measurement is started, an
22
English

internal timer in the handheld unit prompts for a depth calibration every 30 minutes unless the depth
sensor is turned off.
In some situations, it may be convenient or even necessary to turn the depth sensor off. This can be
done through the third Measurement Settings [3/3] menu.
Note: If the depth sensor is turned off, a calibration is still required because calibration data is related to the noise
level measurement. However, the automatic calibration prompts are disabled, and the ADC assumes the noise
level from the last calibration unless a quick quality check has been done.
To do a depth calibration:
1. With the sensor in the air, from the first of the two Main Menus [1/2], select Depth Calibration.
2. Verify the sensor offset and current reading and push Start.
3. When the reading on the handheld unit display is stable, push OK to accept the calibration.
Turn the depth sensor on or off
By default, the depth sensor is turned on. To turn the depth sensor off, do the following:
1. From the first Main Menu [1/2], select Measurement Setting.
2. Scroll to the third Measurement Setting [3/3] screen and select option 2, Depth Sensor.
Each time the number 2 key is pressed, the sensor turns on or off, whichever is opposite of the
current state.
About sensor offsets
This is the offset between the depth sensor and the wading rod. Rod Offsets can be changed in the
third [3/3] Measurement Settings menu. Two offsets can be entered, a Sensor Offset or a Point
Offset.
The Point Offset refers to the distance between the flat base and a pointed end. Standard USGS topsetting and standard wading rods do not have a point below the flat base. Therefore, the point offset
for each is set to zero and does not need to be entered.
A sensor offset must be entered. For a standard USGS top-setting wading rod this offset should be
around 0.10 feet. This is the default value. Refer to Figure 10.
Figure 10 Sensor offset
Do the steps below to verify if the offset is correct.
1. Set the OTT ADC to the bottom of the wading rod and rest the rod base on the bottom of the
channel or stream.
2. Compare the displayed depth read by the pressure sensor with the depth indicated on the wading
rod.
3. If the depths indicated are different, adjust the Sensor Offset until the depths are the same.
English
23

Perform a single point measurement
Place the handheld unit in Measure mode.
1. Place the sensor in the flow. Make sure the sensor faces upstream and is aligned perpendicular
to the cross section.
2. With the sensor in the flow, push the START key.
The unit performs a measurement. The measurement duration is based on the average setting in
the Measurement Settings [2/3] screen.
3. Enter a filename at the prompt.
The measurement file is stored with the entered name.
Note: If a warning message appears at the end of the measurement, the filename prompt will appear after the
warning is acknowledged.
Velocity and discharge measurement methods
Discharge in a waterway with flow is defined as the volume of water that flows through a particular
cross-section per unit time. Discharge is normally given in m³/s or ft³/s and is the product of the
discharge cross-section and the average velocity of the water through the cross-section.
Figure 11 shows an example of a cross-section used for discharge measurement.
Figure 11 Discharge cross section
The discharge measurement method that uses the classic verticals process is an indirect
measurement method. When the average flow velocity of the specified verticals and the discharge
cross-section have been determined, a mathematical model is used to calculate the discharge.
Methods for velocity measurement
The average flow velocity at a vertical is calculated from a defined number of individual
measurements at different depths. These individual velocities when applied to the vertical depth give
an image of the velocity distribution. The quotient of velocity surface and water depth equals the
average flow velocity.
Figure 12 shows how the average flow velocity is calculated.
24
English

Figure 12 Example of average flow-velocity calculation, multi-point method
There are various ways to arrange the individual points. Methods include the Reduced Measure
Points Method, the 2-point KREPS measurement, the Velocity Distribution Method (Multi-point
Method), and supplementary methods. More information about each type of method is given below.
• Reduced measurement points methods (1 or 2-point)--These require less time, but assume a
consistent, logarithmic velocity distribution. Confirm the accuracy of these methods through
comparison to multi-point measurements.
• 2-point KREPS measurement--Velocity measurements are taken near the surface and at 38% of
the depth. Also requires less time and assumes consistent distribution. Should be confirmed
through comparative multi-point measurements.
• Multi-point methods--Measurement points are freely determined based on depth and flow
conditions. Highest and lowest measurement points should be as close to the surface and the
bottom as possible. The multi-point method gives a more precise reading of the velocity surfaces,
but measurement reliability decreases as water levels vary. Table 5 gives a guide to the number of
measurement points for a given water depth.
• Supplementary methods--In methods where the velocity near the surface (Vo) and the velocity
near the bed (Vs) are measured, the sensor must be positioned as near as possible to the surface
and the bed. The sensor must be submerged when near the surface, and the high and low points
must be the same for each vertical to the extent possible. Measurements made below the surface
must not be influenced by wind or surface waves.
Table 5 Water depth and number of measurement points (valid for multi-point method)
Water depth in feet Number of measurement points
< 3.3 3-4
3.3 - 9.8 4-6
13 - 23 5-8
> 23 6-10
English 25
Methods of discharge calculation
Discharge calculation can be done with graphical or arithmetic methods. The OTT ADC supports
arithmetic calculation methods including the MEAN section method, and the MID section method.
More information about each is given below.
MEAN section method (procedure with average cross-section)
With this method, the measurement cross-section is divided in individual flow segments. Each partial
segment is limited by two adjacent verticals.
The equation describes the discharge calculation for an individual segment for the MEAN section
method. The total discharge is equal to the sum of the partial discharges of all segments. The MEAN
section method is illustrated in Figure 13.
Note: The additional discharge element of the two edge segments is calculated with the assumption that speed and
depth at the edges are zero.
Figure 13 MEAN section method
1 Cross section zero point 2 Segment
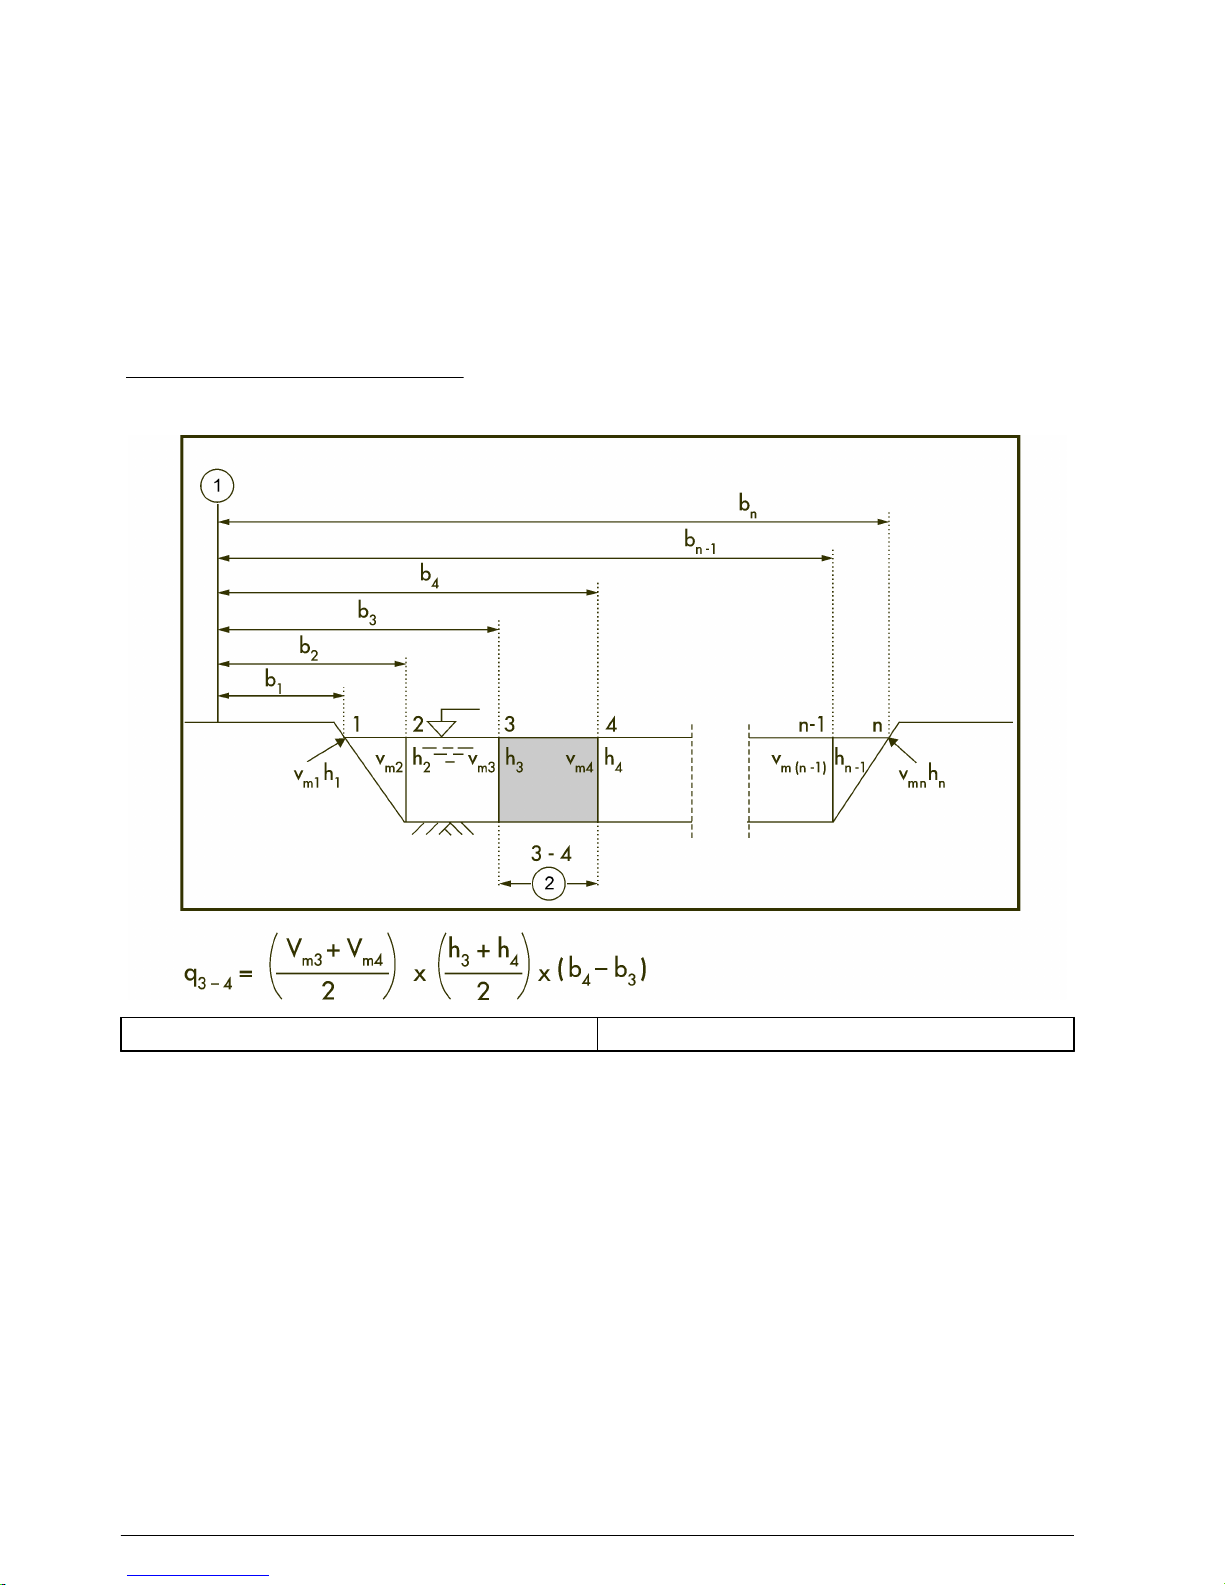
MID section method (mid cross section method)
In this method, the measurement cross section is also divided in to individual segments. The
individual segments do not lie between the verticals, but are defined by half the distance to the
neighboring vertical in each case. For this reason, the first and last verticals should be as close to the
edges as possible when this method is used. Figure 14 illustrates the concept.
The equation gives the the discharge calculation for an individual segment when the MID section
method is used. The total discharge is the sum of the partial discharges of all segments.
26
English

Figure 14 MID section method
1 Cross section zero point
Experience shows that the MID section method gives more exact results when compared to the
average cross section method, and requires less calculation time. For these reasons, it is the default
setting for the handheld unit of the OTT ADC.
Vertical edges and measurements
The flow element in the edge areas with vertical edge walls is accounted for with the method
illustrated in Figure 15. In the equation, KR equals the edge factor that allows for the roughness of
the edge wall.
Figure 15 Vertical edges in discharge calculations
The edge factor is dependent on the roughness of the edge. Use KR values listed below as guide
values.
English
27

Edge characteristics K
R
Smooth edge with no vegetation (e.g. concrete, steel,
cement)
0.8 - 0.9
Brick sides with vegetation 0.7
Rough walls with heavy vegetation 0.6 - 0.5
Measurement settings menus
Measurement settings [1/3]
The Measurement Settings menu is divided into three screens where the basic settings for a
discharge measurement are entered. These settings are used as input parameters for internal
advance planning of measurements and for calculating partial flows and complete discharge. The
settings available in the first screen are described in the steps below. Scroll down to view the other
Measurement Settings screens.
Note: Step 1 describes how to load settings from a previous measurement or continue from the point where a
previous measurement was halted.
1. To use settings from a previous measurement or to continue a previous measurement, navigate
to the first Main Menu [1/2] and select Load.
Option Description
Load settings only Calls the list of saved files. After selecting a file, the saved settings of that file are
loaded and will be used for the new measurement. The settings can be modified.
Continue previous
measurement
Calls the list of saved files. After a file is selected, the settings of the file are loaded.
Additional measurement points can be added. Press the START key three times to
return to the measuring mode. The vertical and position of the next measurement
point are shown.
2. For a new measurement, from the first Main Menu [1/2], select Measurement Setting.
3. In the Measurement Settings [1/3] screen, enter the information for the displayed options.
Option Description
File/Station name This is the name that will be given to the measurement file or station. The name can
be up to 20 alphanumeric characters.
Station Number This is the station identification number. The number can be up to 20 numeric
characters.
Measurement Number This is the Measurement identification number. Can be up to 8 numeric characters.
Operator This is the name of the operator who does the measurement.
Note: A file/station name and station number are required for a measurement. Entries for other settings are
optional, and if not changed, default values will be used.
Measurement settings [2/3]
This is the second of the three screens in the Measurement Settings menu.
1. Enter the information for the Estimated or Rated discharge.
2. Enter the estimated width of the discharge measurement cross section.
3. Enter the value for vertical spacing. This is the distance from one vertical to the next.
4. Enter the gage height at the start and finish verticals.
5. Enter a value for the averaging interval in seconds.
28
English

Measurement settings [3/3]
This is the third screen of the Measurement Settings menu. Update or change the entries for each
option.
1. Select Rod Offsets. Rod offsets compensate for the fact that the symmetry axis of the sensor
never lies directly on the waterway bed.
Option Description
Sensor offset (Range
0.00 - 1.00 ft)
Distance between the symmetry axis of the sensor and the base plate of the rod.
A sensor offset must be entered.
Point offset (Range
0.00 - 0.50 ft)
Distance between the base plate of the rod and the waterway bed. (Does not
apply to Standard USGS top-setting wading rods or standard wading rods.)
2. Select Depth Sensor to turn the sensor on or off.
Option Description
On During a measurement, the handheld unit prompts the user to perform a depth calibration every
30 minutes.
Off The handheld unit does not prompt the user to perform a depth calibration.
3. Select Salinity and enter a value in ppt. Range: 0 - 50. The salinity influences the speed of sound
and is used as a parameter in the velocity measurement. In freshwater waterways, the value is
generally 0 ppt. The current salinity value is shown in the display.
4. Select the Measurement Method.
Option Description
1-point Position of measure points: 0.6 x h
Mean velocity formula: Vm = V
0.6
2-point Position of measure points: 0.2 / 0.8 x h
Mean velocity formula: Vm = (V
0.2
+ V
0.8
)/2
3-point Position of measure points: 0.2 / 0.6 / 0.8 x h
Mean velocity formula: Vm = 0.25 x (V
0.2
+2 x V
0.4
+ V
0.8
)
4-point Position of measure points: 0.2 / 0.4 / 0.7 / 0.9 x h
Mean velocity formula: Vm = 0.25 x (V
0.2
+ V
0.4
+ V
0.7
+ V
0.9
)
5-point Position of measure points: near to surface / 0.2 / 0.6 / 0.8 x h / near to bed
Mean velocity formula: Vm = 0.1 x (Vo + 3 x V
0.2
+ 3 x V
0.6
+ 2 x V
0.8
+ Vs)
6-point Position of measure points: near to surface / 0.2 / 0.4 / 0.6 / 0.8 x h / near to
bed
Mean velocity formula: Vm = 0.1 x (Vo + 2 x V
0.2
+ 2 x V
0.4
+ 2 x V
0.6
+ 2 x V
0.8
+
Vs)
2-point Kreps Position of measure points: near to surface / 0.62 x h
Mean velocity formula: Vm = 0.31 x Vo + 0.634 x V
0.62
1-point ICE 0.5 Position of measure points: 0.5 x h
effective
Mean velocity formula: Vm = V
0.5
x K
ice
where K
ice
= 0.88 - 0.90 (ISO 1996)
1-point ICE 0.6 Position of measure points: 0.6 x h
effective
Mean velocity formula:Vm = V
0.6
x K
ice
where K
ice
= 0.92 (USGS)
2-point ICE Position of measure points: 0.2 / 0.8 x h
effective
Mean velocity formula: Vm = (V
0.2
+ V
0.8
) / 2
English 29

Option Description
Surface 1-point ISO Position of measure points: near to surface
Mean velocity formula: Vm = Vo X Ko where Ko = 0.84 - 0.9 (ISO 748)
Multi-point
measurement
Position of measure points: Number and position of measure points are freely
selected
Mean velocity formula: Refer to Calculation of Average Flow Velocity figure.
5. Enter the correction factor for the 1-point ice measurement and the surface 1-point measurement.
Range : 0.7 - 1.0.
Note: Can only be selected if Ice, Single point or ISO, surface method has been selected as the Measure
Method.
6. Select the Discharge Method. Press the number 5 key to toggle between the options.
Option Description
Mid-section Individual segments are defined by half the distance to the adjacent vertical.
Mean section The measurement cross-section is divided in to individual flow segments defined by a vertical
on either side.
Field quality checks
Quality checks can also be done while in the field environment. The Field Quality Check option can
be found in the Start Measurement screen. If a field QC is repeated, the previous check is
overwritten.
At least 50% of the quick quality check parameters must be within their specified values for the
quality check to pass. This rule applies whether user-defined parameter values or the default
parameter values are used for the quality check.
To do a field quality check, do the following:
Note: If necessary, adjust the quality thresholds for the site before the quality check is started.
1. Do a depth calibration. The absolute pressure cell built in to the OTT ADC sensor body
determines the water and sensor depths. The pressure cell must be calibrated in the existent air
pressure conditions to make sure depth readings are accurate. If the depth sensor is not
calibrated before a QQC is started, a warning message will appear.
Note: Depth sensor calibration is still required if the depth sensor is turned off.
2. Select number 3, Start Measurement.
3. Read the depth indicated on the wading rod.
4. Read the depth indicated on the handheld unit display.
5. Verify that the readings are within ± 0.01 ft. If the readings are not within this specification, check
the rod offset.
6. Place the sensor in the mean flow at 6/10 depth, as close to the middle of the cross section as
possible.
7. Push the start button to begin the field quality check.
The unit performs the field check, and the QC Results [1/3] screen will appear. Scroll down to
view additional screens. The information in these screens includes whether the field check
passed or failed, status of the amplitude and correlation checks, depth, temperature and other
parameters. The details of the field check can also be viewed in the QReview Summary File.
Perform a discharge measurement
Measurement notes
• The sensor is ideally positioned when the head points against the direction of flow and the
symmetry axis is at right angles to the measurement cross section.
• Make sure there are no obstructions near the sensor.
30
English

• Allow time for the temperature sensor of the OTT ADC to adjust to the water temperature
(5-6 minutes in extreme conditions).
• If conducting a wading measurement, stand so that submerged portions of the body (e.g., legs and
feet) give no or minimal resistance to the flow of water that reaches the sensor.
• All discharge measurement data are automatically saved on the handheld unit.
• After it is started, a measurement can be interrupted by switching off the unit. When the unit is
again powered on, a warning message will prompt the user to continue the measurement.
• If no name has been specified when the Start menu option is selected, the user is prompted to
enter a name for the measurement file.
• During a velocity measurement, the depth measurement display updates automatically every
3 seconds. If the tolerance for the actual depth compared to the target depth exceeds 1%
(assuming a minimum of 0.79 inches (2 cm), the target depth in the upper right corner blinks. An
up or down arrow appears on the display to indicate whether the depth needs to be increased or
decreased. When the actual and target depths are within the 1% tolerance, the arrow disappears
and is replaced by a black diamond.
1. Do a field quality check.
2. From the first Main Menu [1/2], select Measurement Setting.
3. In the Measurement Setting menu, select the Station Name option and enter a name for the
discharge measurement file. Push Enter to confirm.
4. Select the Station number option and enter a value. Push Enter to confirm.
5. The settings entered in the Measurement Settings menus will be used for the discharge
measurement. To use settings from a previous measurement, or to continue a previous
measurement, go to the Main Menu [1/2] and select Load.
Note: Both a Station Name and Station Number are required for a measurement. Other measurement settings
are optional. For example, an estimated/rated Discharge can be entered in the measurement settings, and the
measurement method and averaging time can be modified.
6. To start the discharge measurement, go to the first Main Menu [1/2] and select Start
Measurement.
If no name for the discharge measurement file has been entered, the unit displays a No
Filename warning. Enter a name for the file and press Enter, then select Start Measurement. The
Start Measurement screen appears.
7. Select one of the options in the Start Measurement screen, update the entries as necessary and
press OK to confirm.
Option Description
1. Depth
calibration
Choose this option to calibrate the depth sensor.
2. Field quality
check
Choose this option to initiate a field quality check.
3. Start Edge Choose this option to enter a value and position for the starting edge of the discharge
measurement.
1. Start at:-- Left or Right. Press the number 1 key to toggle between Left and Right.
2. Position:--Enter the position value of the starting edge. Range: 0.00-985.00 ft. The
position value = 0 if the near edge corresponds to the reference point for calculating
the position of the verticals. As a rule, the reference point is the cross section zero
point of a measured discharge cross section. The position value > 0 if the near edge is
not the reference point. The value is then equal to the distance of the near edge from
the reference point.
3. Depth:--Depth of the water at the near edge. (Range: 0.00 - 33.00 ft). The depth is
typically 0 for natural waterways and > 0 for right angled cross sections.
4. Roughness:--Roughness factor of the side wall. Range: 0 = rough, 1=smooth. This
value is relevant only for right angled cross sections and is used in calculating the
discharge proportion of the edge areas.
English 31

Option Description
4. First Vertical
[1/2]
Information about the first vertical is shown in the display. To update an entry, enter the
option number.
1. Position--Position of the first vertical in feet from the starting edge
2. Depth (if an ICE measurement, refer to the ICE Measurement section)--Depth in
feet of the first vertical. (When defining the depth of water associated with a vertical,
first lower the sensor to the bottom of the stream).
Note: If the vertical location of the depth sensor does not meet the 1% criteria, a
manual depth can be entered. This will be logged in QReview.
3. Number of points--Number of measurement points on the first vertical
4. Gage height--Height of the gage in feet
5. Notes--Used to enter notes about the first vertical
First Vertical
[2/2]
1. Define obstruction--Values for the first and last edge and width of a defined
obstruction
2. End measurement--Select this option to end the measurement
The point screen appears.
8. Update and verify the information in the point screen and press OK to confirm.
Option Description
1. Position Position of the measure point in feet
2. Water depth Water depth as measured by the pressure sensor (cannot be zero)
3. Current measurement method The measurement method currently used by the handheld unit
4. End this vertical Ends the vertical
The unit switches to measurement mode.
9. Place the sensor at the bottom of the channel or streambed. Raise or lower the sensor as
indicated on the display screen. A black diamond next to the depth reading indicates an
acceptable depth level for the sensor.
Note: If a Depth Calibration required warning appears, do a depth calibration, and press OK.
10. Press 2 to select the depth shown on the screen.
11. Push the START key to begin the measurement.
The measurement runs for the set averaging time. If the measurement is successful, the
measurement information for the point is displayed.
If the measurement is not successful, a warning message will appear. The specific warning
message depends on the underlying reason for the warning, e.g., a quality threshold that has not
been met.
12. Some warnings prompt the user to repeat the point, prompt the user to go to the next point, or
recommend possible corrective action. If this warning message appears, enter the number of the
option.
Option Description
1. Repeat this point The measurement is repeated at the same point on the same vertical.
2. Go to next point The next measurement will be done on the next point of the discharge measurement.
13. Press OK to continue with the measurements of points on the current vertical. When a vertical is
complete, the Vertical Complete [1/3] screen appears.
a. The first two Vertical Completed screens show information about the vertical. The third screen
gives additional options as shown in the table below. Scroll down to view this screen and
select an option.
32
English

b. Press OK in any of the Vertical Completed screens to advance to the next point in the
discharge measurement.
Note: Depending on the measurement mode, the next measure point may be on another vertical.
Option Description
1. Review measurement Choose this option to view information about the measurement up to the current
measurement point.
2. Notes Choose this option to enter notes.
3. Insert vertical Choose this option to insert another vertical. Enter the position of the new vertical
in feet and follow the screens to take a measurement at this position.
Note: If the new vertical is in the same position as an existing vertical, the
measurement of the new vertical replaces the measurement of the existing
vertical.
4. End measurement End the measurement.
14. When the next vertical screen [1/2] appears, place the sensor at the correct position for the next
measure point. Verify the information for the vertical and press OK to confirm.
The next measurement point screen appears.
15. Verify the information for the measurement point as necessary and press OK to confirm.
The unit switches to measure mode.
16. Repeat steps 8 to 13 for the remaining points and verticals.
When all measurements for all points on all verticals are completed, select End Discharge
Measurement from the Completed Vertical [3/3] screen.
17. Update the values for the First and Last edges and Stream width. Push OK to confirm.
Option Description
Finish edge Displays Edges screen where the user can update values for the first and last edges and
stream width.
Quality Rating Assign a quality rating for the discharge measurement
Review Review information for the discharge measurement
End Confirm the end of the discharge measurement
The handheld unit shows shows the complete discharge measurement.
Perform an ICE measurement
1. From the Measurement Settings menu, select Measurement Method, 1 or 2 Point ICE.
a. If 1 Point, select either 0.5 or 0.6.
b. Verify the coefficient for the chosen option (Table 6), or enter a user selectable coefficient.
Table 6 Coefficient values
Measurement option Coefficient value
0.5 0.89 (default)
0.6 0.92 (default)
2. Press Start Discharge Measurement.
3. Calibrate the depth sensor.
4. Conduct a Field QC test (optional).
5. Define the Start Edge.
6. Measure the first vertical.
a. Enter the vertical position.
English
33

b. Manually measure the ice thickness and enter the value in the handheld.
c. Measure the distance from the water surface (WS) to the bottom of the ice.
1. Place the ADC sensor below the ice.
2. Confirm the sensor offset (upper offset).
d. Measure the distance from the water surface to the bottom of slush.
Note: This step is used only if slush is present or to determine if slush is present. Entry of data is not
required.
1. Place the ADC below the ice.
2. From the menu, select WS to bottom of Slush.
3. Move the ADC down in the water column until the SNR is > 10 db and the Corr and Ampl
check pass. This establishes the slush boundary.
4. Press OK to accept this depth value. This stores the depth of the sensor below the water
surface at the slush boundary.
Note: If slush is present, the water surface to bottom of ice depth measurement is used to calculate
area.
e. Place the sensor on the bottom of the streambed to find the WS to streambed depth.
The Effective Depth automatically populates.
7. Conduct the measurement.
8. Review the Completed Point measurement.
9. Review the Completed Vertical measurement.
Screen [2a/4] includes Ice thickness, WS to Bottom of Ice and Slush thickness values.
10. Select End Discharge Measurement.
a. Review the Discharge Measurement.
The mean ice thickness value is included with the current parameters.
Discharge measurement window
When a discharge measurement is completed, the discharge measurement window appears. The
information in the window is summarized below.
Name File name of the discharge measurement
Discharge Calculated total discharge (ft3/s)
Details
Discharge Calculated total discharge (ft3/s)
Average Velocity Average flow velocity (ft/s)
Average Depth Average water depth
Area Size of the measurement cross section (ft2)
Press the Start key to view the details of the Uncertainty ISO 748 calculation.
Overall 6.3%
Accuracy 1.0%
Depth 0.5%
Velocity 5.5%
Width 0.2%
Method 2.5%
Number of verticals 1.4%
34 English

Vertical nr.i [x%] ([x%] shows the proportion of the total discharge represented by the partial discharge of the
vertical i).
Position Distance of the respective vertical i from the reference
point (ft)
Discharge Partial discharge represented by vertical (ft3/s)
Average velocity Average flow velocity at vertical i (m/s)
Depth Water depth at vertical i (ft)
Area Cross section of the measured discharge segment
represented by vertical i (ft2/s)
QReview discharge measurement summary file
The information from a discharge measurement can be found in a summary file in the QReview
software. The information in a typical summary file is given below. The information has been
categorized in individual tables for visual understanding. The appearance in the QReview application
may be different.
Discharge measurement summary
Station number Units
Date/Time Discharge method
OTT ADC (Serial number, firmware) Measurement method
Measurement number Averaging interval
Operator Mean correlation
Start edge Standard deviation
Number of verticals Mean temperature
Total width Estimated / Rate Q
Total area Gage Height start
Total discharge Gage height finish
Mean depth Depth sensor (On/Off)
Mean velocity Measurement guidance (On/Off)
Mean SNR Measurement rating
Rod offsets (Sensor, Point offsets)
Quality threshold settings
Minimum correlation % discharge per vertical
Maximum angle Minimum signal to noise (SNR) ratio
Velocity gradient 1-point maximum depth
Standard deviation
Field quality check
Parameter Threshold
Number of valid measurements —
English 35

Field quality check
Amplitude check 0.8 - 1.2
Mean SNR 10 - 100
Depth 0-16.4 ft
Temperature -5 to 35
Battery voltage 9 to 15
Mean velocity -0.65 to 7.87 ft/s
Mean flow angle 0 - 45º
Mean correlation
Beam 1 > 40
Beam 2 > 40
Mean signal amplitude
Beam 1 30 - 255
Beam 2 30 - 255
Noise level 40 to 100
Time Series
Time Vert Pos DepthVel %Q Area Std
Dev
Amp1 Amp2 Corr1 Corr2 Flowº SNR Tem
p
In addition to the above, the QReview summary file lists all notes, including notes entered for
individual verticals, flag messages, and the Warning Log along with corrective action if applicable.
Warnings are related to verticals.
Example: Vertical 3, Corr. too low - Skipped
This example indicates that the correlation for vertical 3 was too low to give a valid measurement.
The user chose to skip the vertical.
Delete a file
Files saved on the handheld unit can be deleted. Backup important files or data before deletion.
1. Navigate to the second Main Menu [2/2], and select option 2, Delete Files.
The Delete screen appears and shows a list of saved files. The list may continue on multiple
screens. Scroll down to view items in the additional screens. The first item in each screen will
have the number 1.
2. Enter the number of the file to be deleted.
A warning screen appears asking to confirm the file deletion.
3. Push OK to delete the file, or push Cancel to return to the list of files.
QReview software
Overview
The QReview software is used to retrieve data from the ADC and transfer this data to a PC. All
measurements, including quality checks, velocity and discharge measurements can be downloaded
using the QReview application software. QReview displayed provides basic analysis tools, graphics,
one-second time series, reports, and review of potential quality issues.
36
English

QReview main menu options
This section gives an overview of the menu options available in the QReview main screen menu bar.
To access menu options, do the following:
1. Click an option in the menu bar.
Available sub menu options will appear in a drop down menu.
2. Select an option in the drop down menu.
Option Description
File Select this option to Open a file, Print a report, or perform a Printer Setup.
Edit Select this option to make changes to Configuration and Vertical settings and perform a new
calculation with the new settings.
Settings Select this option to set the Units and Language used in QReview displays.
Tools Select this option to update the ADC firmware. Refer to the OTT ADC user manual for more
information on how to perform firmware updates.
ADC Select this option to connect the ADC to the PC.
Export Select this option to save or export data to a specified location or printer.
Help Select this option to view the QReview help or information about the QReview application.
The software performs the selected action or a pop up screen or window may appear. Refer to
specific sections of this manual for more details on how to perform the associated tasks.
Installation
Install the QReview software
The program is supplied as a stand-alone executable on the CD included with the ADC unit. The
software can also be downloaded from http://www.hachhydromet.com. This file does not alter any
registry settings and requires no additional steps for installation.
1. Copy the executable file to a suitable location and start the setup program.
A wizard screen will appear. Use the wizard as a guide for how to name files, where to place
them, and the rest of the installation process. A shortcut can also be created on the desktop. After
installation, the Q-review application is ready to be used.
2. Double click the executable file or the desktop shortcut to open the QReview program.
3. If a security warning window appears, select Run to launch the QReview program.
The QReview Main screen appears.
Operation
W A R N I N G
Fire and explosion hazard. This equipment is intended for only aqueous type samples. Use with
flammable samples can result in a fire or explosion.
C A U T I O N
Chemical hazard. Always follow appropriate laboratory safety procedures when chemicals are handled.
Always wear all personal protective equipment appropriate to the chemicals used.
Change the language
This option sets the language for all text and menus. The default language is English.
English
37
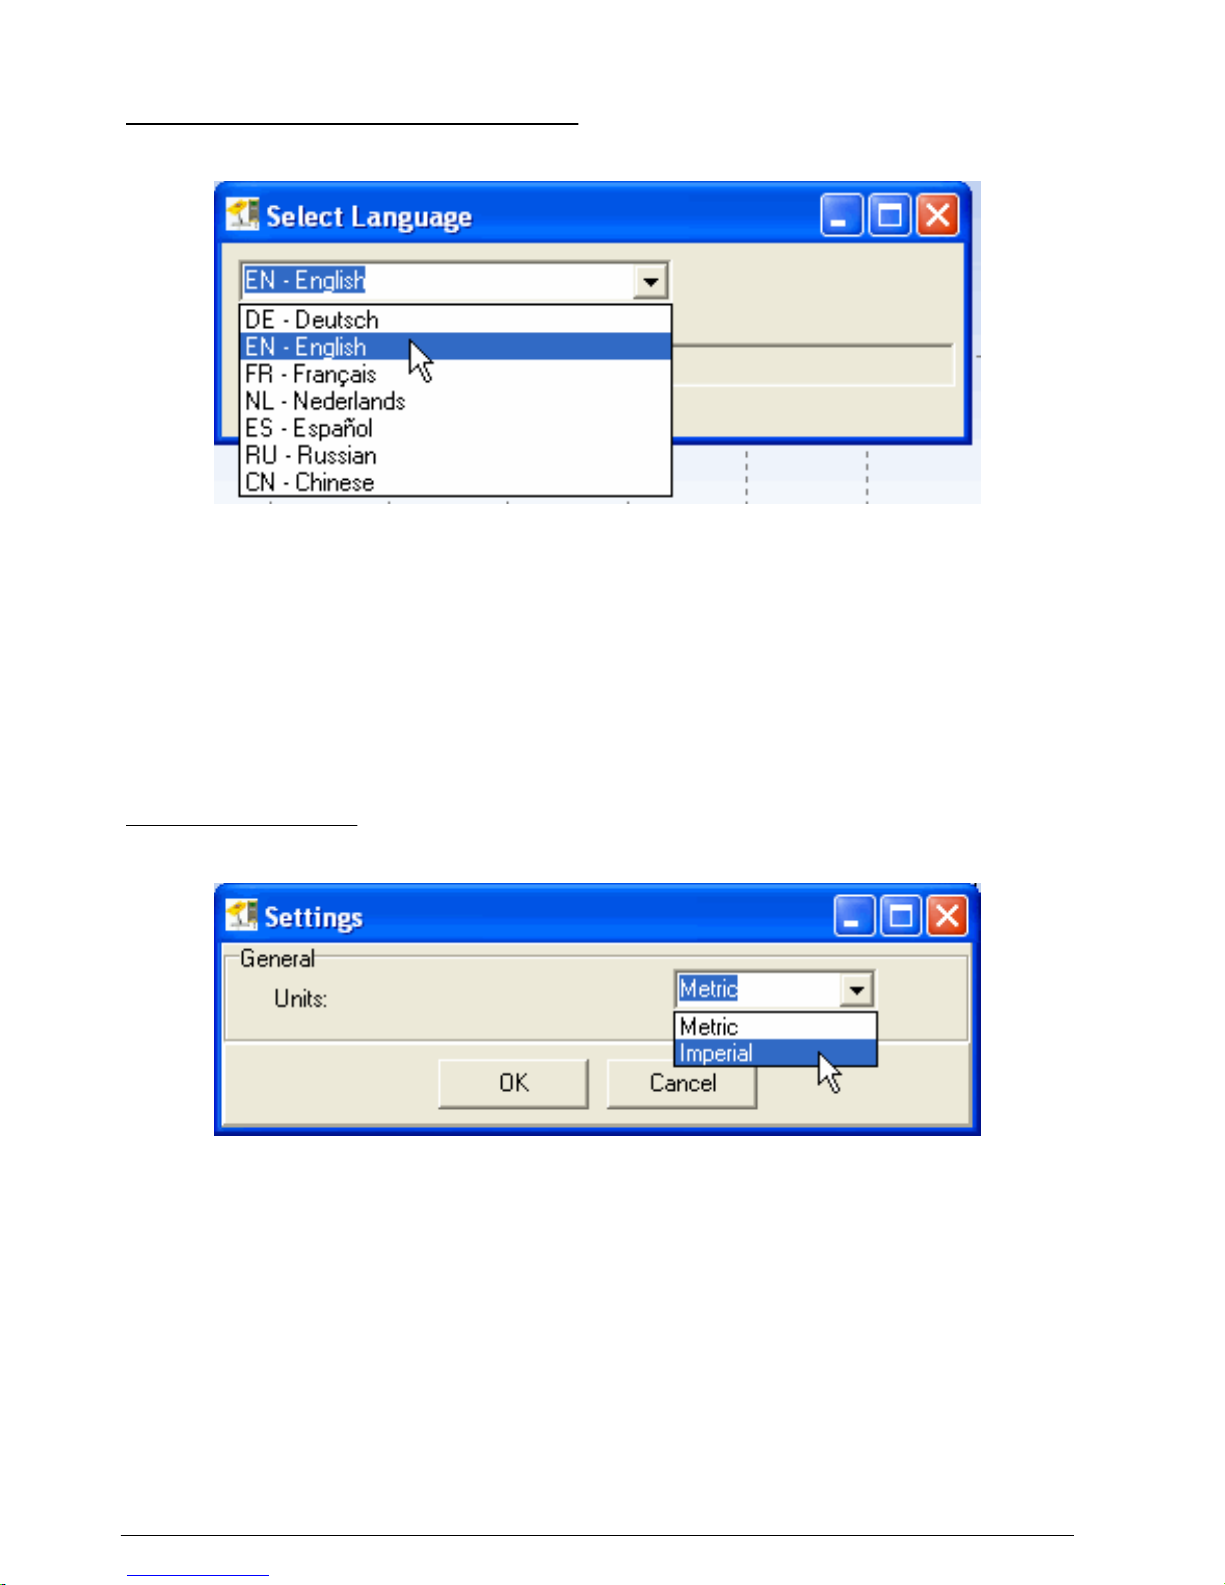
1. In the menu bar of the QReview main screen, click Settings, then select Language.
The Select Language pop up window appears.
Figure 16 Select Language screen (English)
2. Click the drop down menu to view the list of available languages.
3. Highlight the language to be used.
The text of all tabs and menus changes to the selected language.
4. Close the Select Language window.
Change the units
Set the units through the Calculations menu. If the open file is an ADC file, only the Units field will be
shown.
1. In the menu bar of the QReview main screen, click Settings, then select Calculations.
A Settings pop up window appears.
Figure 17 Select units
2. Click the drop down menu arrow to view the list of available units.
3. Highlight the units option to be used.
A warning appears that says the program must be closed and started again for the change to
take effect.
4. Click OK. Close QReview and then launch QReview again to complete the units change.
Connect the ADC
Make sure the QReview software and the correct USB drivers are installed on the PC.
1. Attach the end of the USB connection cable with the blue locking ring to the ADC handheld unit
USB connector. Hand tighten the locking ring to secure the connection.
2. Attach the other end of the USB connection cable to the USB port of the PC.
3. Power on the handheld unit.
38
English

4. Launch the QReview application.
Note: If this is the first time the QReview application has been opened since it was installed, the Units must be
changed to Imperial. In the main screen, go to Settings, Calculations and select the Units from the drop down
menu.
5. Make sure the correct COM port is selected on the PC.
a. Go to the PC Control Panel and select System.
b. Select the Hardware tab, then click Device Manager.
c. In the device manager list, expand the Ports option and select from the available COM ports.
6. In the menu bar of the QReview main screen, click ADC, then select Connect.
The Connecting to ADC window appears. When a successful connection is established, the OTT
ADC screen will appear. This screen shows details about the ADC instrument, the files on the
instrument available for download, and the folder on the PC where downloaded files will be
placed. Files that have been downloaded to that location are also shown.
Retrieve ADC data
The QReview software is used to retrieve data from the ADC and transfer this data to a PC. All
measurements, including quality checks, velocity and discharge measurements can be downloaded
using the QReview application software. The QReview display provides basic analysis tools,
graphics, one-second time series, reports, and review of potential quality issues.
Make sure the correct USB drivers have been installed and make sure the serial port used by the
ADC has been identified.
1. Make sure the ADC is connected to the PC and the list of files stored on the unit is shown in the
OTT ADC screen.
2. Click the check boxes next to the files to be downloaded, or click Select all to select all listed files.
3. Select the directory where the files are to be stored.
4. Click Retrieve Files.
The data is transferred from the ADC to the specified location.
Note: The files cannot be opened from the OTT ADC screen.
English
39
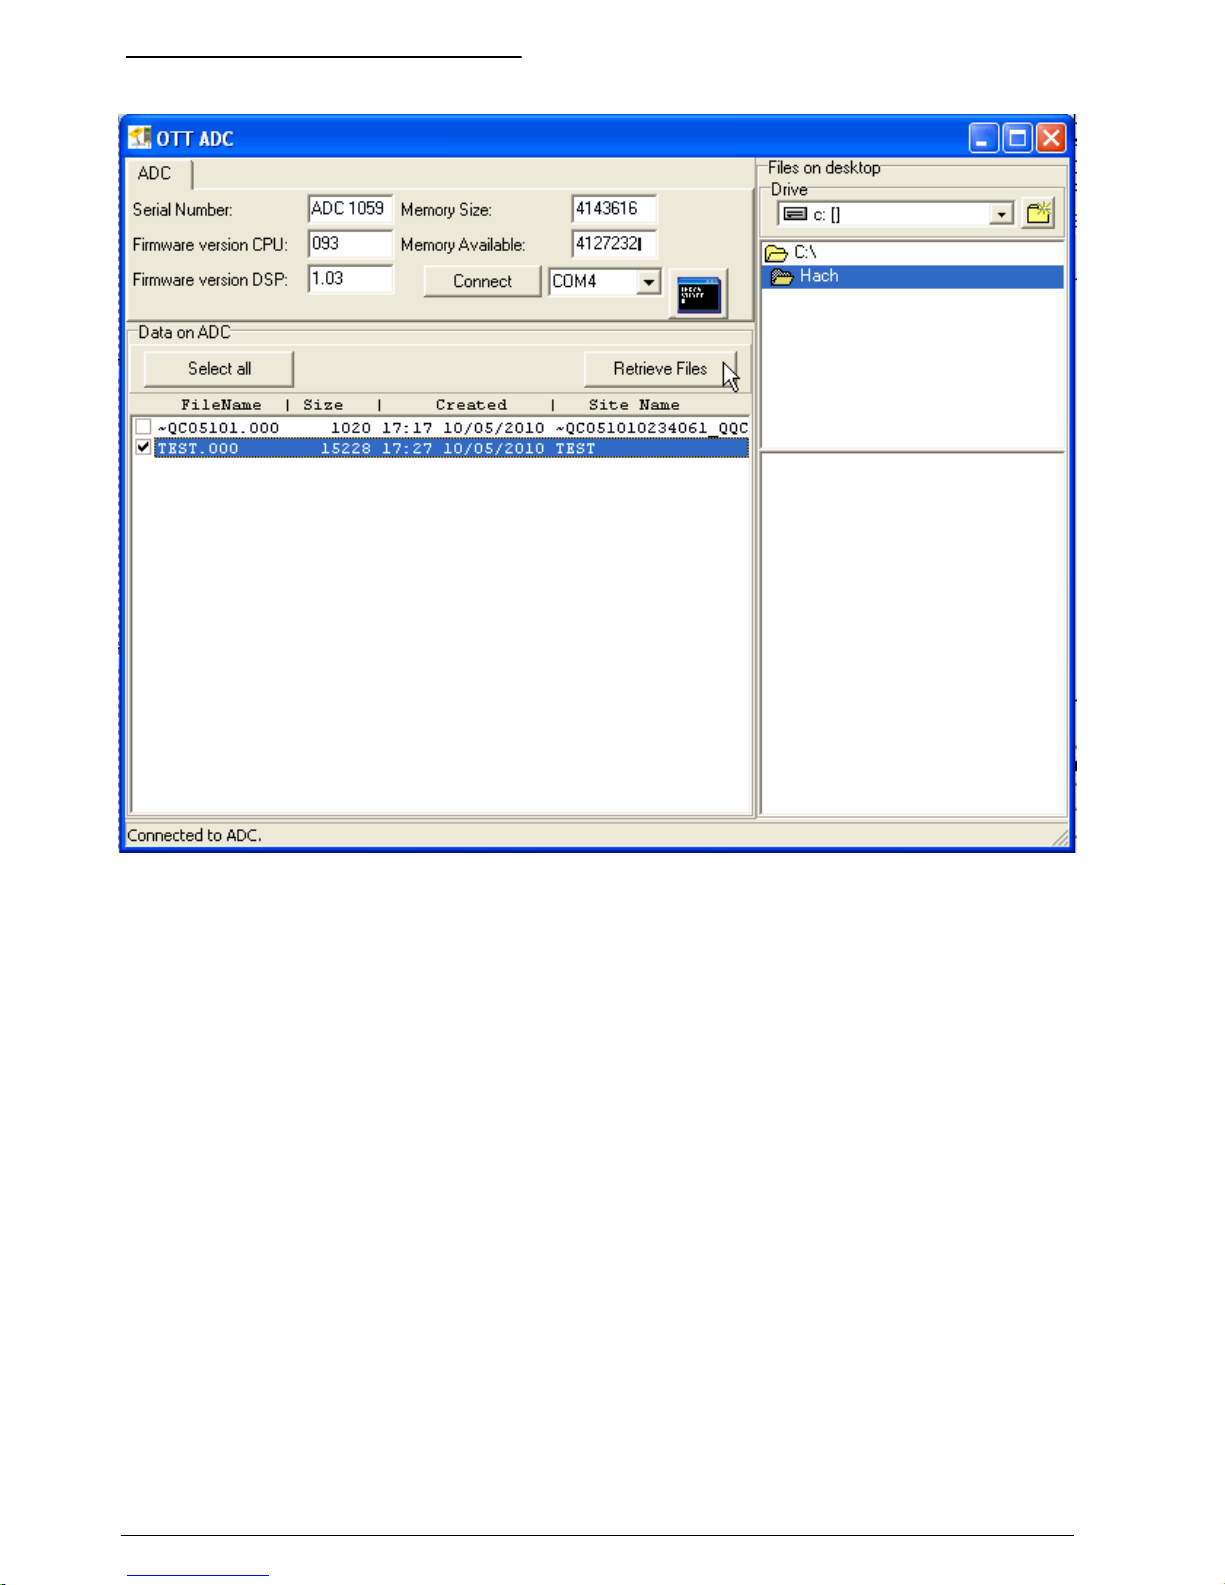
Figure 18 Files available for download
Open and view ADC data files
1. In the menu bar of the QReview main screen, click File, then select Open.
The Select File to open screen appears.
2. If necessary, in the File area, click the Data from arrow and select ADC from the drop down
menu.
The list of ADC files available on the handheld unit are shown in the window.
3. Select a file from the list of ADC files and click OK.
The review program reads all verticals, and shows an overview of the data with the Graphics tab
selected by default. The three main graphs give an overview of the total measurement. The table
summarizes the information shown in the graphs.
40
English

Figure 19 File data graphs
Table 7 Overview of graphs
Parameter Description
Velocity (ft/s)
Mean velocity over the total depth for each vertical. The
arrows indicate the velocity and direction related to the
direction of the cross section.
Q/Vertical (ft3/s)
Discharge corrected for the width of the measured
section. The line shows the absolute discharge and the
bars show the relative discharge. A green bar indicates
<5% and a red one >5% discharge of the specific
vertical in relation to the whole discharge.
Depth (ft)
Bathymetric profile of the measured section. The areas
used in the discharge calculation are marked with a red
line.
In the Depth portion of the graphs, triangles indicate the positions of verticals that have
associated warning information. To view warning details, click on a triangle. The information
appears in a small pop-up window.
English
41
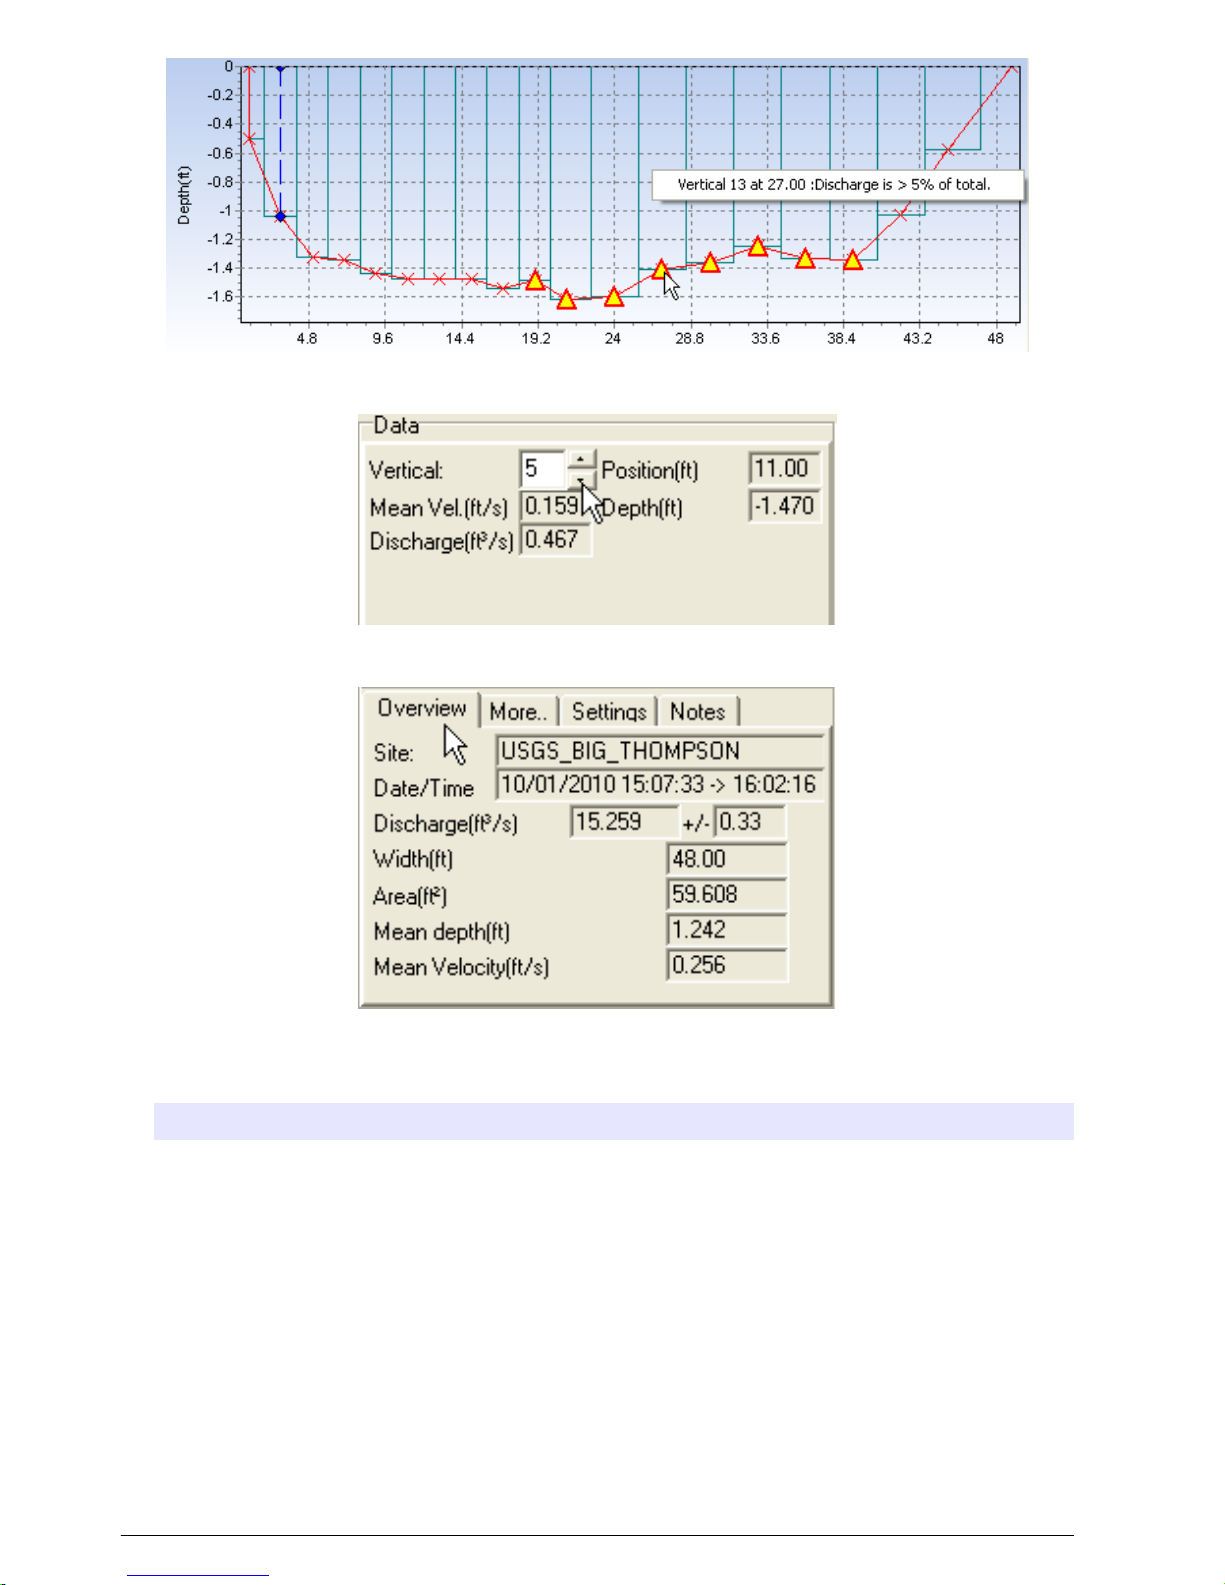
4. The graph on the right side of the screen gives data for individual vertical profiles. Click the up
and down arrow buttons next to the Vertical field to view different vertical profiles.
5. Select the Overview, More, Settings or Notes tabs below to view additional data about the
selected vertical.
Note: The settings tab displays two types of data: 1) data controlled by the Q-Review software, and 2) data
controlled by the ADC. The data controlled by the ADC appears against a darker background.
6. Select other tabs above the left side graph area to view additional measurement data.
Option Description
Discharge Summary This tab displays discharge measurement summary information in a table format.
Information includes details about the test, information about the depth sensor, the
quality threshold settings, and the field quality check. Notes, warnings, possible
quality issues and time series data are also shown.
Uncertainty
According to ISO 748
• Overall 6.3%
• Accuracy 1.0%
• Velocity 5.5%
• Method 2.5%
• Depth 0.5%
• Width 0.2%
• Number of verticals 1.4%
Time Series This tab displays Averaged Points and Raw Point Data in a time series table format.
42 English
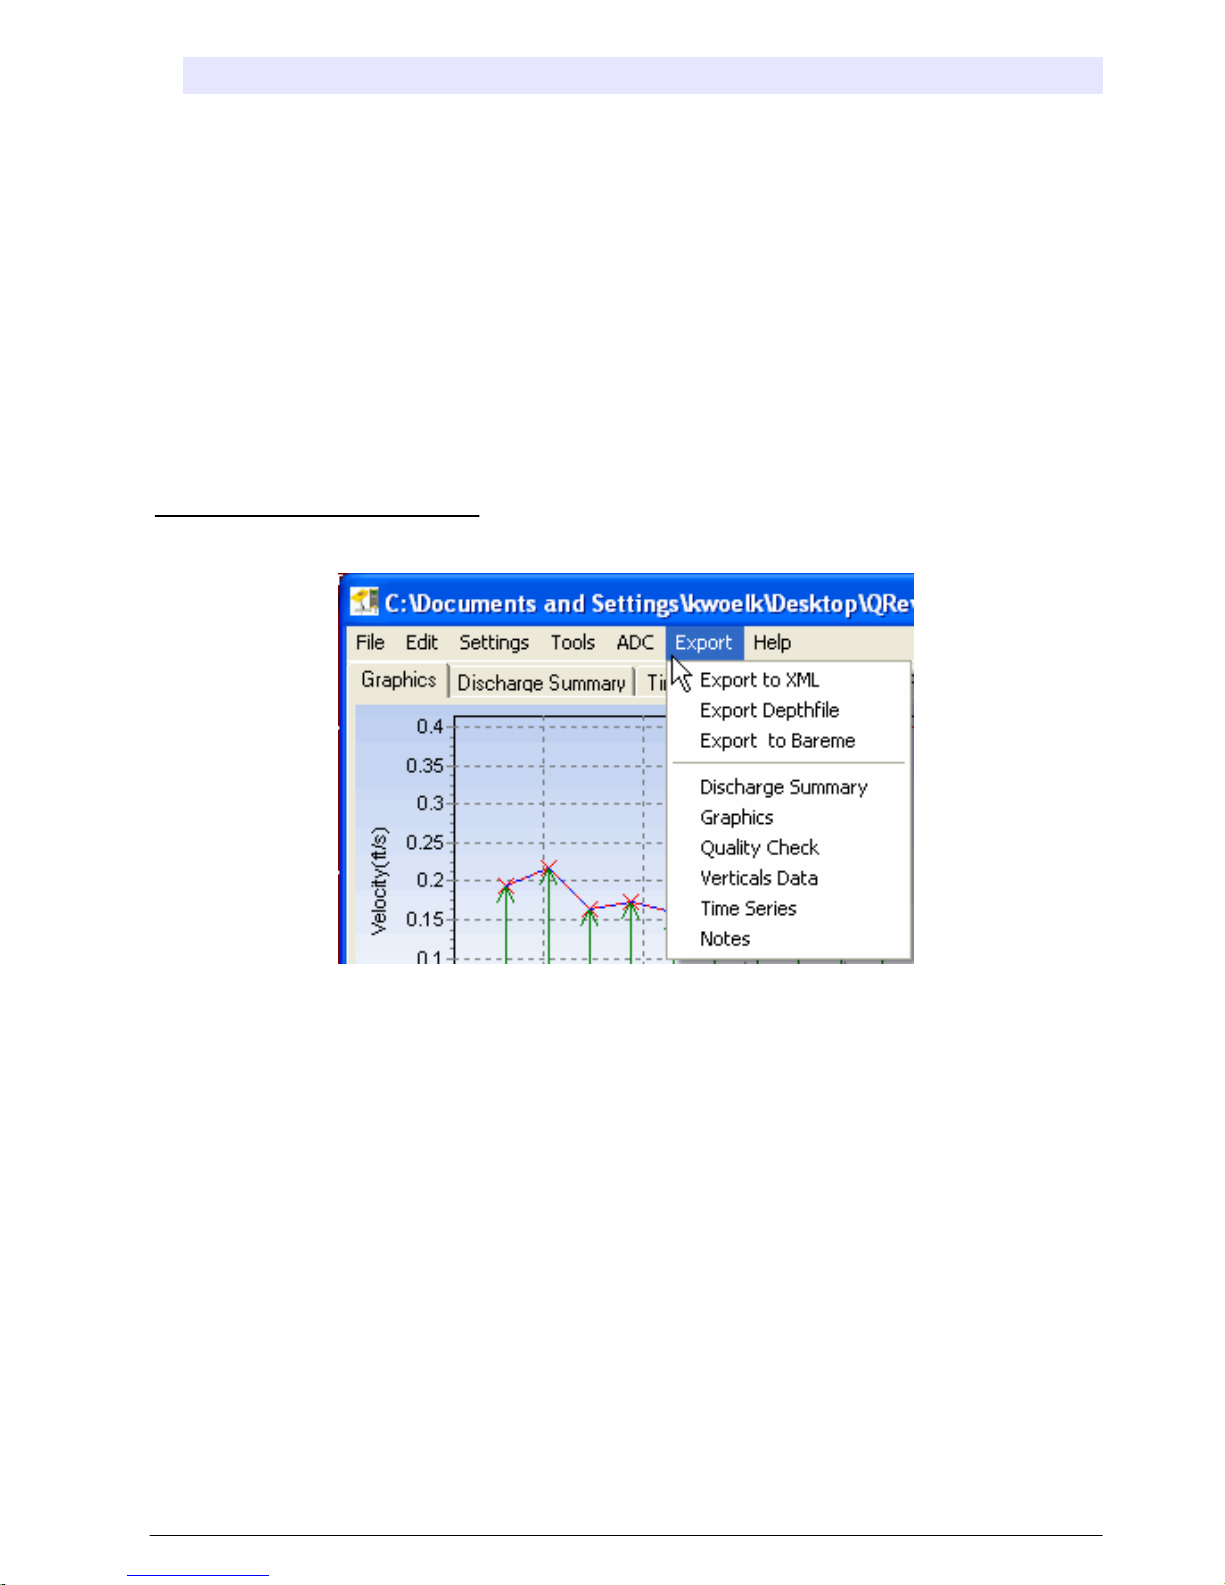
Option Description
Verticals Data This tab displays the data about each vertical in a table format. Quality issues and
ADC warnings are included at the bottom of the window.
Field Quality Check This tab displays the data of the latest Field Quality Check (FQC).
Notes This tab displays any General or Vertical-related notes that were entered while the
measurement was performed.
Note: Save and Print buttons are available under each of the Discharge Summary, Time Series, Verticals Data
and Notes tabs. If either of these buttons are used, location or printer selection windows will open. A location for
the saved file and a printer must be confirmed or selected to save or print the file.
Export data
1. If necessary, open the file that contains the data to be exported.
2. In the menu bar of the QReview main screen, click Export.
3. Select one of the drop down menu options. A Save Report window will open.
Figure 20 Export menu options
4. In the Save in box, click the arrow to navigate to the location where the data will be saved.
5. In the File name box, enter a name for the saved file.
6. Select the file type from the Save As Type drop down menu.
7. Click Save.
Edit screen
Use the Edit option to make changes to general settings. The Edit option can also be used to step
through individual profiles and edit the position or depth of each profile.
1. Open a file in QReview.
2. In the menu bar of the QReview main screen, click Edit.
The Edit screen appears.
Note: The original files are copied to <filename>.BAK files when the Edit screen opens. If the Cancel button is
clicked before changes are applied, the .BAK files are removed and the Edit window closes. The original data
files are not changed until an Apply button is clicked.
English
43
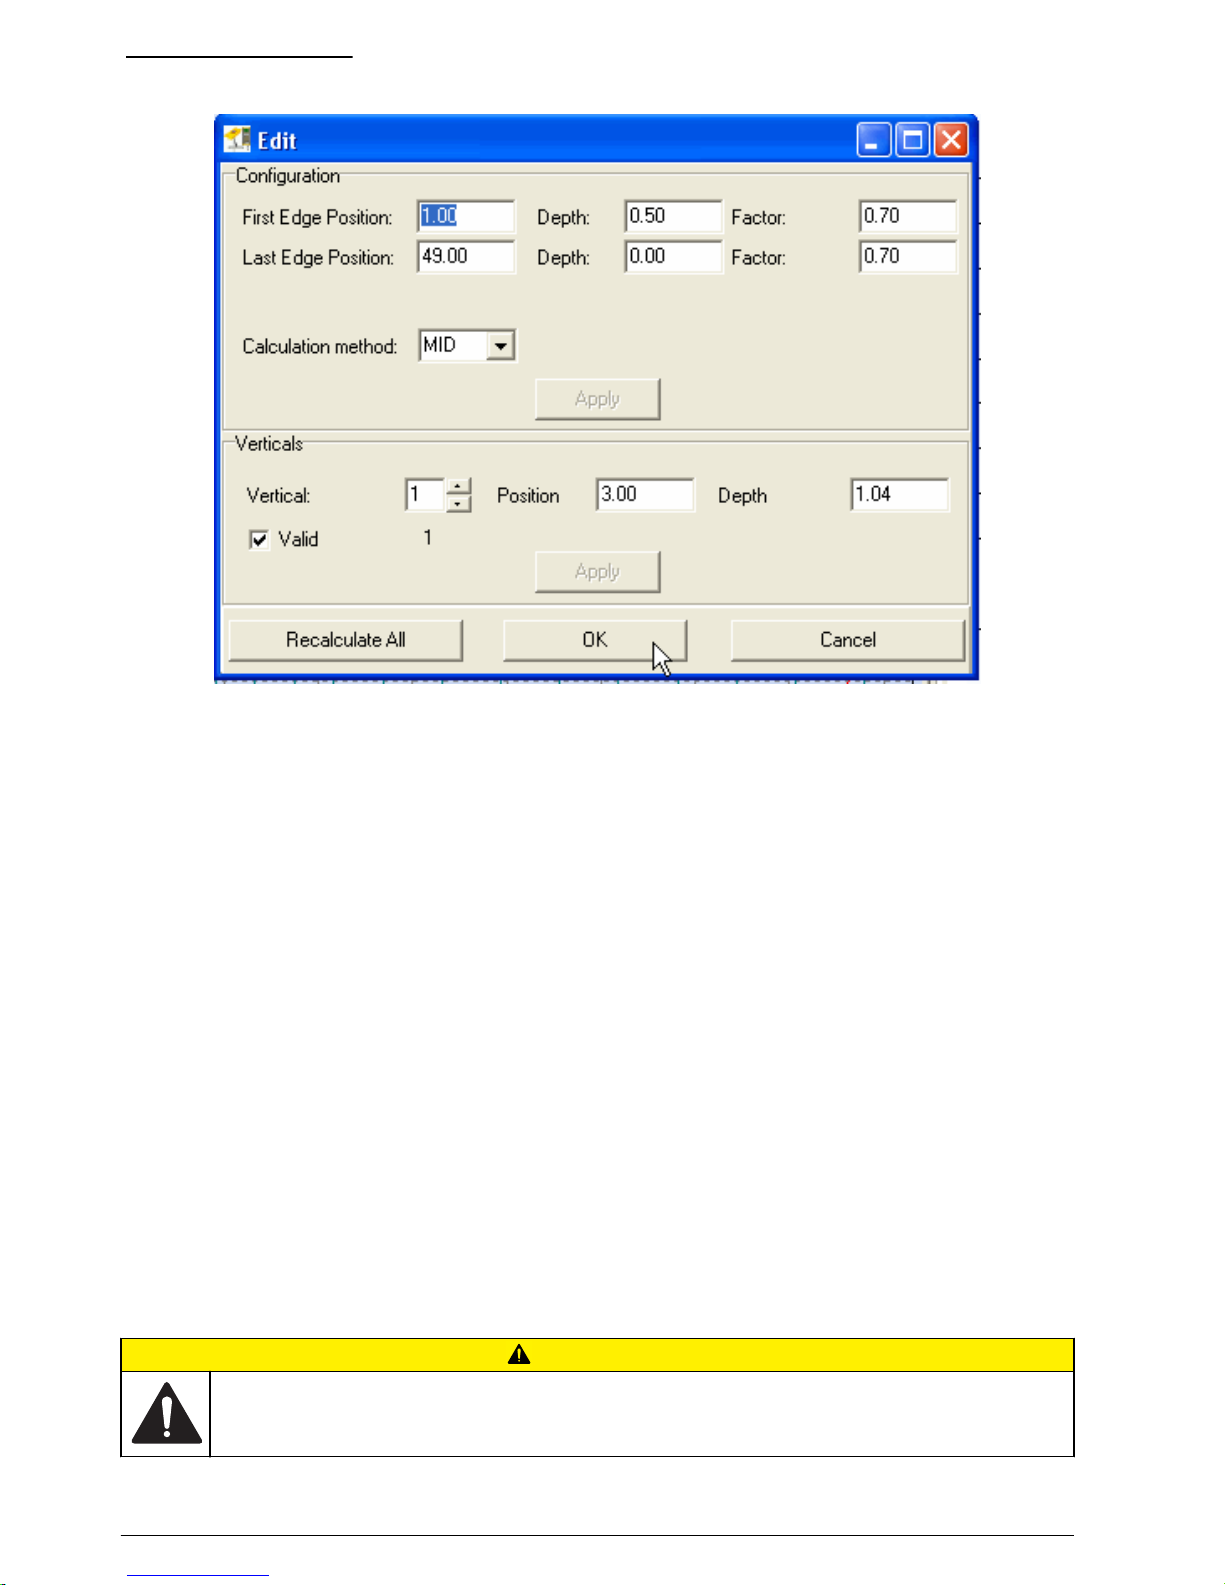
Figure 21 Edit screen
3. Change or update the values in the Configuration or Verticals areas.
4. Click Apply in the applicable areas to save the new values.
5. Click Recalculate All to calculate the entire measurement with the new settings and update the
graphs.
6. Click OK when edits are complete.
Print a report
The Print option can be used to print a report of a measurement. Make sure the printer has been set
up correctly and selected before the printout is started.
1. To select and set up a printer, do the following:
a. From the main screen, click File, then select Printer Setup.
The Print Setup window opens.
b. Click the Printer Name drop down menu to select the printer.
c. Update or change the settings for the selected printer.
d. Click OK to save the printer setup.
2. Open the necessary file in QReview.
3. Click the tab that has the data to be printed.
4. Click File, then select Print from the drop down menu options.
The report is sent to the printer.
Maintenance
C A U T I O N
Multiple hazards. Only qualified personnel must conduct the tasks described in this section of the
document.
44 English

Handheld unit maintenance
Under normal circumstances, the handheld unit requires minimal maintenance. The following are
general considerations and tips that will help keep the unit in good operating condition.
• Keep the protective cover on the USB port closed when the connector unit is not in use.
• Examine the battery level before and after a measurement. Charge the battery if necessary when
the charge level is low. The battery can be charged more than 500 times. The battery cannot be
replaced by the user. Refer to Contact information on page 48 for repair contact information.
• Make sure the unit is clean and dry before it is placed in the storage case.
• Store the unit in the case when it is not in use to keep it dry and protected from dust and other
possible contamination.
• If the unit is soiled, wipe it with a damp, lint free cloth. Do not use wet cloths or harsh solvents or
abrasive cleaning materials or solutions to clean the unit.
Sensor maintenance
Under normal circumstances, the sensor requires minimal maintenance. The following tips and
suggestions will help keep the sensor in good operating condition.
• Remove any contamination from the sensor and rod with a dry, lint free absorbent cloth.
• Check the ultrasonic transducers regularly for contamination such as sand. If necessary, the
transducers can be cleaned with a lint free cloth or with a soft brush.
• After the sensor has been used in sandy or muddy waterways, clean the sensor body under clear,
running water. Make sure the holes for the pressure cell chambers are washed out and all
contamination removed. If the sensor is heavily soiled, place it in clear water for a few minutes to
dissolve hardened contamination.
• To protect the sensor from dust, moisture and contamination, store the sensor in the protective
case when not in use.
Troubleshooting
Measurement guidance
The Measurement Guidance option determines which warning messages are shown. The option can
be set to ON (default) or OFF.
When Measurement Guidance is set to ON, all warning messages, including those in the Discharge
Measurement Summary file in Q-Review, are shown.
When Measurement Guidance is set to OFF, only applicable warning messages are shown. Warning
messages that are not applicable are not shown.
Common problems
Problem Possible cause Action or resolution
Measured depth is unrealistic or
inaccurate
Sensor not calibrated properly, e.g.
sensor was calibrated in water
Calibrate the pressure cell
Sand or mud in the pressure cell
chamber
Clean the chamber. Refer to the full
version of this manual for details on
how to clean the chamber.
No velocities are displayed during a
measurement
Continuous data output not set Set the measured value display to
Continuous.
Ultrasonic transducers are dirty Clean the ultrasonic transducers
Sensor incorrectly connected to the
handheld unit
Check the sensor connection cable.
Check the alignment of the
connector contact pins.
English 45
Problem Possible cause Action or resolution
The measured velocity seems
unrealistic
Ultrasonic transducers may be
soiled or damaged
Check the transducers for
contamination or damage. Clean the
transducers with an absorbent lintfree cloth or soft brush. Conduct a
Quick Quality Check.
Sensor incorrectly aligned
Align the sensor at right angles to
the measurement cross-section.
Make sure the rod is held straight.
Sensor is obstructed
Clear any obstruction or select a
different measuring position.
Data quality is not sufficient (e.g.,
SNR > 10)
Choose a different measuring
position
The SNR value does not change or
only changes a small amount
The sensor is not properly
calibrated in air
Calibrate the pressure cell
Device warning messages
These warning messages may appear as a result of quality checks or at the end of a velocity
measurement.
Message or error Probable cause Possible actions
% Q for vertical measured is
greater than specified % of
Total Q threshold
Vertical spacing is too wide Insert vertical
Accept
Average correlation below 40 Turbulent water or near boundary
Take another measurement
Accept
Go to the next point (measured values
are saved in raw data but are not
included in the measurement)
Poor correlation-Potential
boundary issue?
Measurement interference from
submerged obstruction or bank
Repeat the measurement, Accept, or
Go to the next point.
Actual Average Velocity Std
Deviation is equal to or greater
than quality threshold setting
Turbulent waters, measurement was
taken near an obstruction or rocks on
the streambed
Take another measurement
Accept
Go to the next point (measured values
are saved in raw data but are not
included in the measurement)
SNR < 10 dB Too few scatterers in the water
Go upstream and disperse dirt in the
water to increase scatterers, then
measure again.
Go to the next point (measured values
are saved in raw data but are not
included in the measurement)
8/10 vel > 2/10 vel
Add 6/10 velocity
Ignore
2/10 2 X 8/10 vel
8/10 velocity measurement may be
near a boundary or obstruction
Add 6/10 velocity
Ignore
46 English

Message or error Probable cause Possible actions
Flow angle > 20º
Angle of sensor orientation compared
to the tag line is too large. Large flow
angles may occur near boundaries
such as a start or finish edge.
Accept
Repeat measurement
Go to the next point (measured values
are saved in raw data but are not
included in the measurement)
Depth > 1-Point Method Depth for 1-point method exceeded
Switch to 2-point method
Ignore
Low Battery
Battery has approximately 20% life
remaining
Press OK to accept message
Charge battery when possible
Discharge Mode
Handheld meter was turned off while
still in the discharge mode
Continue measurement
Measurement warnings and errors
Certain warnings and error messages are specific to measurement processes. The meaning of the
warnings and suggested actions are listed in the table.
Table 8 Measurement warnings and errors
Warning Meaning Action
Stream width is incorrect. Check
edges.
The distance between the near and
far edges is to small (< 1.6 ft).
Change the position of the near and
far edges as appropriate.
The file already exists. Press 1 to
overwrite.
A file already exists with the name
entered.
Push the 1 key to overwrite the file
(this will delete the existing data) or
use a different file name.
Cannot calculate the number of
verticals. Spacing = 0
The distance between the verticals
was entered as 0.
Enter a value for number of verticals
that is greater than 0.
Position is beyond the edge The position of the verticals lies
outside the area defined by the near
and far edges.
Check the near and far edges and
adjust the position of the verticals as
appropriate.
Depth cannot be zero. At the start of the measurement of
the first measurement point of a
new vertical, the water depth is
automatically set to zero. For each
vertical, the user must give a water
depth value.
Enter a valid depth value.
Not enough valid data There are not enough valid
measured values available to
calculate the average flow velocity.
Possible causes are an SNR value
that is too low or water turbulence
that is too high.
Make sure as many measured
values as possible meet acceptable
criteria.
Critical error messages (Discharge measurement cannot be completed)
File System Fail. Press 1 to format Can occur after switching on a new
handheld unit for the first time or
after a new memory chip has been
installed.
Format the flash memory (all data
will be lost)
English 47

Table 8 Measurement warnings and errors (continued)
Warning Meaning Action
Could not open/close/write to/delete
the file
Error in the internal file system Select Format Recorder from the
Advanced Settings. If the error
occurs again, the device must be
sent for repair.
Error while starting sensor The handheld unit CPU cannot
make a connection to the digital
signal processor.
The device must be sent for repair.
View system status
The system status option shows information about the system. This information may be useful when
troubleshooting problems.
1. Navigate to the second Main Menu [2/2] window and select option 3, System Status.
The System Info screen appears.
2. Press OK to return to the Main Menu window.
Contact information
For technical assistance, repair, information about price and orders for Hydrolab and OTT products:
Inside the U.S.A.
Hach Hydromet
P.O. Box 389
Loveland, CO 80539
Telephone: 1-800-949-3766
Fax: 970-669-2932
Email technical assistance: techsupport@hachhydromet.com
Product Information: sales@hachhydromet.com
Outside the U.S.A.
OTT Hydromet
Ludwigstrasse 16
87437 Kempten, Germany
Hydroservice:
Telephone: +49 831 5617 430
Fax: +49 831 5617 439
Email: hydroservice@ott.com
Repair Center:
+49 831 5617 433
48
English


OTT Hydromet
Ludwigstrasse 16
87437 Kempten, Germany
Tel. +49 (0)8 31 5617-0
Fax +49 (0)8 31 5617-209
info@ott.com
www.ott.com
Hach Hydromet
5600 Lindbergh Drive
Loveland, CO 80538 U.S.A.
Tel. (970) 669-3050
(800) 949-3766 (U.S.A. only)
Fax (970) 461-3921
sales@hachhydromet.com
www.hachhydromet.com
©
Hach Company, 2011, 2013.
All rights reserved. Printed in U.S.A.
 Loading...