

Page 1

OpenOffice.org 3
Draw Guide
Drawing Vector Graphics in OpenOffice.org
Page 2

Copyright
This document is Copyright © 2005–2011 by its contributors as listed below. You may
distribute it and/or modify it under the terms of either the GNU General Public
License (http://www.gnu.org/licenses/gpl.html), version 3 or later, or the Creative
Commons Attribution License (http://creativecommons.org/licenses/by/3.0/), version
3.0 or later. All trademarks in this guide belong to their legitimate owners.
Contributors
Agnes Belzunce Daniel Carrera Martin Fox
Thomas Hackert Regina Henschel Peter Hillier-Brook
Jared Kobos Hazel Russman Gary Schnabl
Bernd Schukat Wolfgang Uhlig Jean Hollis Weber
Claire Wood Linda Worthington
Feedback
Please direct any comments or suggestions about this document to: odfauthors-
discuss@lists.odfauthors.org
Acknowledgments
Several chapters in this book are based on an original French document written for
OpenOffice.org 1.x by Michel Pinquier (translated into English by Alex Thurgood) and
previous content revised by Jim Taylor. The chapters were revised for OOo 2.0 by
Linda, Daniel, Jean, and Agnes, and later translated into German by Bernd, Regina,
and Wolfgang. The German revisions were then translated into English and revised
for OOo 3.3 by Martin Fox.
Publication date and software version
Published 27 August 2011. Based on OpenOffice 3.3.
You can download
an editable version of this document from
http://wiki.services.openoffice.org/wiki/Documentation/
Page 3

Contents
Copyright.......................................................................................................................2
Chapter 1
Introducing Draw............................................................................................................7
Introduction...................................................................................................................8
The Draw workplace.....................................................................................................8
Rulers............................................................................................................................9
Status bar....................................................................................................................10
Toolbars.......................................................................................................................11
Drawing grid and guides............................................................................................15
Floating and moving toolbars.....................................................................................15
Quick printing.............................................................................................................17
Controlling printing....................................................................................................18
Exporting to PDF........................................................................................................22
Exporting to other formats.........................................................................................22
Exporting Draw documents as web pages.................................................................23
E-mailing documents..................................................................................................23
Chapter 2
Drawing Basic Shapes..................................................................................................24
Creating simple drawings...........................................................................................25
Custom shapes............................................................................................................25
Drawing basic shapes.................................................................................................25
Gluepoints and connectors (basics)...........................................................................32
Drawing geometric shapes.........................................................................................33
Adding text to objects.................................................................................................35
Chapter 3
Working with Objects and Object Points......................................................................38
Introduction................................................................................................................39
Moving and dynamically adjusting an object’s size..................................................41
Rotating and shearing an object using the mouse....................................................44
Setting size and position exactly................................................................................46
Editing object points...................................................................................................48
Another way to change the form of basic shapes......................................................48
How curves work........................................................................................................49
Chapter 4
Changing Object Attributes.........................................................................................55
Toolbars and menus....................................................................................................56
Editing lines and borders...........................................................................................57
Editing the inside (fill) of an object............................................................................63
Using styles.................................................................................................................71
Special effects.............................................................................................................72
Chapter 5
Combining Multiple Objects.........................................................................................78
OpenOffice.org 3.3 Draw Guide 3
Page 4

Introduction: grouping and combining objects.........................................................79
Grouping objects.........................................................................................................79
Combining objects......................................................................................................80
Merging, subtracting, or intersecting shapes...........................................................81
Aids for positioning objects........................................................................................83
Chapter 6
Editing Pictures (Raster Graphics)..............................................................................88
Introduction................................................................................................................89
Importing raster and vector graphics........................................................................89
Exporting graphics.....................................................................................................92
Modifying raster object properties............................................................................95
The picture (editing) toolbar......................................................................................95
Cropping......................................................................................................................97
The graphic filter toolbar...........................................................................................98
Changing colors using the eyedropper....................................................................101
Conversion................................................................................................................105
Print options with raster graphics...........................................................................109
Chapter 7
Working with 3D Objects............................................................................................111
Creating 3D objects..................................................................................................112
Editing 3D objects.....................................................................................................116
Combining objects in 3D scenes..............................................................................134
Chapter 8
Tips and Tricks............................................................................................................138
Positioning objects with zoom..................................................................................139
Positioning objects with snap functions...................................................................140
Drawing to scale.......................................................................................................146
Splitting drawings on multiple layers......................................................................146
Creating a multi-page document..............................................................................150
Color palette: adding or changing single colors......................................................153
Changing colors using the Color dialog...................................................................155
Creating cool effects.................................................................................................157
Chapter 9
Organization Charts, Flow Diagrams, and More.......................................................159
Drawing an organization chart................................................................................160
Drawing a flow diagram...........................................................................................162
Glue points and connectors......................................................................................164
Adding text to connectors........................................................................................168
Chapter 10
Advanced Draw Techniques........................................................................................171
Drawing to scale.......................................................................................................172
Dimensioning a drawing...........................................................................................180
Working with text in Draw........................................................................................183
Guide to Bézier curves..............................................................................................196
4 OpenOffice.org 3.3 Draw Guide
Page 5

Adding comments to a drawing................................................................................202
Connecting and breaking lines.................................................................................203
Index..............................................................................................................................204
OpenOffice.org 3.3 Draw Guide 5
Page 6

Note for Mac users
Some keystrokes and menu items are different on a Mac from those used in Windows
and Linux. The table below gives some common substitutions for the instructions in
this chapter. For a more detailed list, see the application Help.
Windows/Linux Mac equivalent Effect
Tools > Options
menu selection
OpenOffice.org >
Preferences
Access setup options
Right-click Control+click Open context menu
Ctrl (Control)
z (Command)
Used with other keys
F5
Shift+z+F5
Open the Navigator
F11
z+T
Open Styles & Formatting window
6 OpenOffice.org 3.3 Draw Guide
Page 7

Chapter 1
Introducing Draw
Page 8

Introduction
Draw is a vector graphics drawing tool, although it can also perform some operations
on raster graphics (pixels). Using Draw, you can quickly create a wide variety of
graphical images.
Vector graphics store and display a picture as simple geometric elements such as
lines, circles, and polygons rather than as a collection of pixels (points on the screen).
This permits simpler storage and supports precise scaling of the picture elements.
Draw is fully integrated into the OpenOffice.org suite, and this simplifies exchanging
graphics with all components of the suite. For example, if you create an image in
Draw, reusing it in a Writer document is as simple as copying and pasting the image.
You can also work with drawings directly from within Writer or Impress, using a
subset of the functions and tools from Draw.
Draw’s functionality is extensive, and even though it was not designed to rival highend graphics applications, it possesses significantly more functionality than the
drawing tools that are generally integrated with most office productivity suites.
A few examples of the drawing functions are: layer management, magnetic grid-point
system, dimensions and measurement display, connectors for making organization
charts, 3D functions that enable small three-dimensional drawings to be created
(with texture and lighting effects), drawing and page-style integration, and Bézier
curves.
The Draw Guide is not a course book to be worked through from beginning to end.
Rather, it is a reference work in which you can browse for guidance on particular
topics.
This document describes only the functions associated with Draw. Some concepts,
such as file management or the way the OpenOffice.org environment works, are
mentioned only briefly; they are covered in more detail in the Getting Started guide.
The Draw workplace
The main components of the Draw interface are shown in Figure 1.
The large area in the center of the window is where you make the drawings. You can
surround the drawing area with toolbars and information areas. The number and
position of the visible tools vary with the task in hand and user preferences.
Therefore, your setup may look different. For example, many users put the main
Drawing toolbar on the left-hand side of the workspace—not at the bottom, as shown
here.
You can split drawings in Draw over several pages. Multi-page drawings are used
mainly for presentations. The Pages pane, on the left side of the Draw window in
Figure 1, gives an overview of the pages that you create. If the Pages pane is not
visible on your setup, you can enable it from the View menu (View > Page Pane). To
make changes to the page order, just drag and drop one or more pages.
In Draw 3.3, the maximum size of a drawing page is 300 cm by 300 cm.
8 OpenOffice.org 3.3 Draw Guide
Page 9
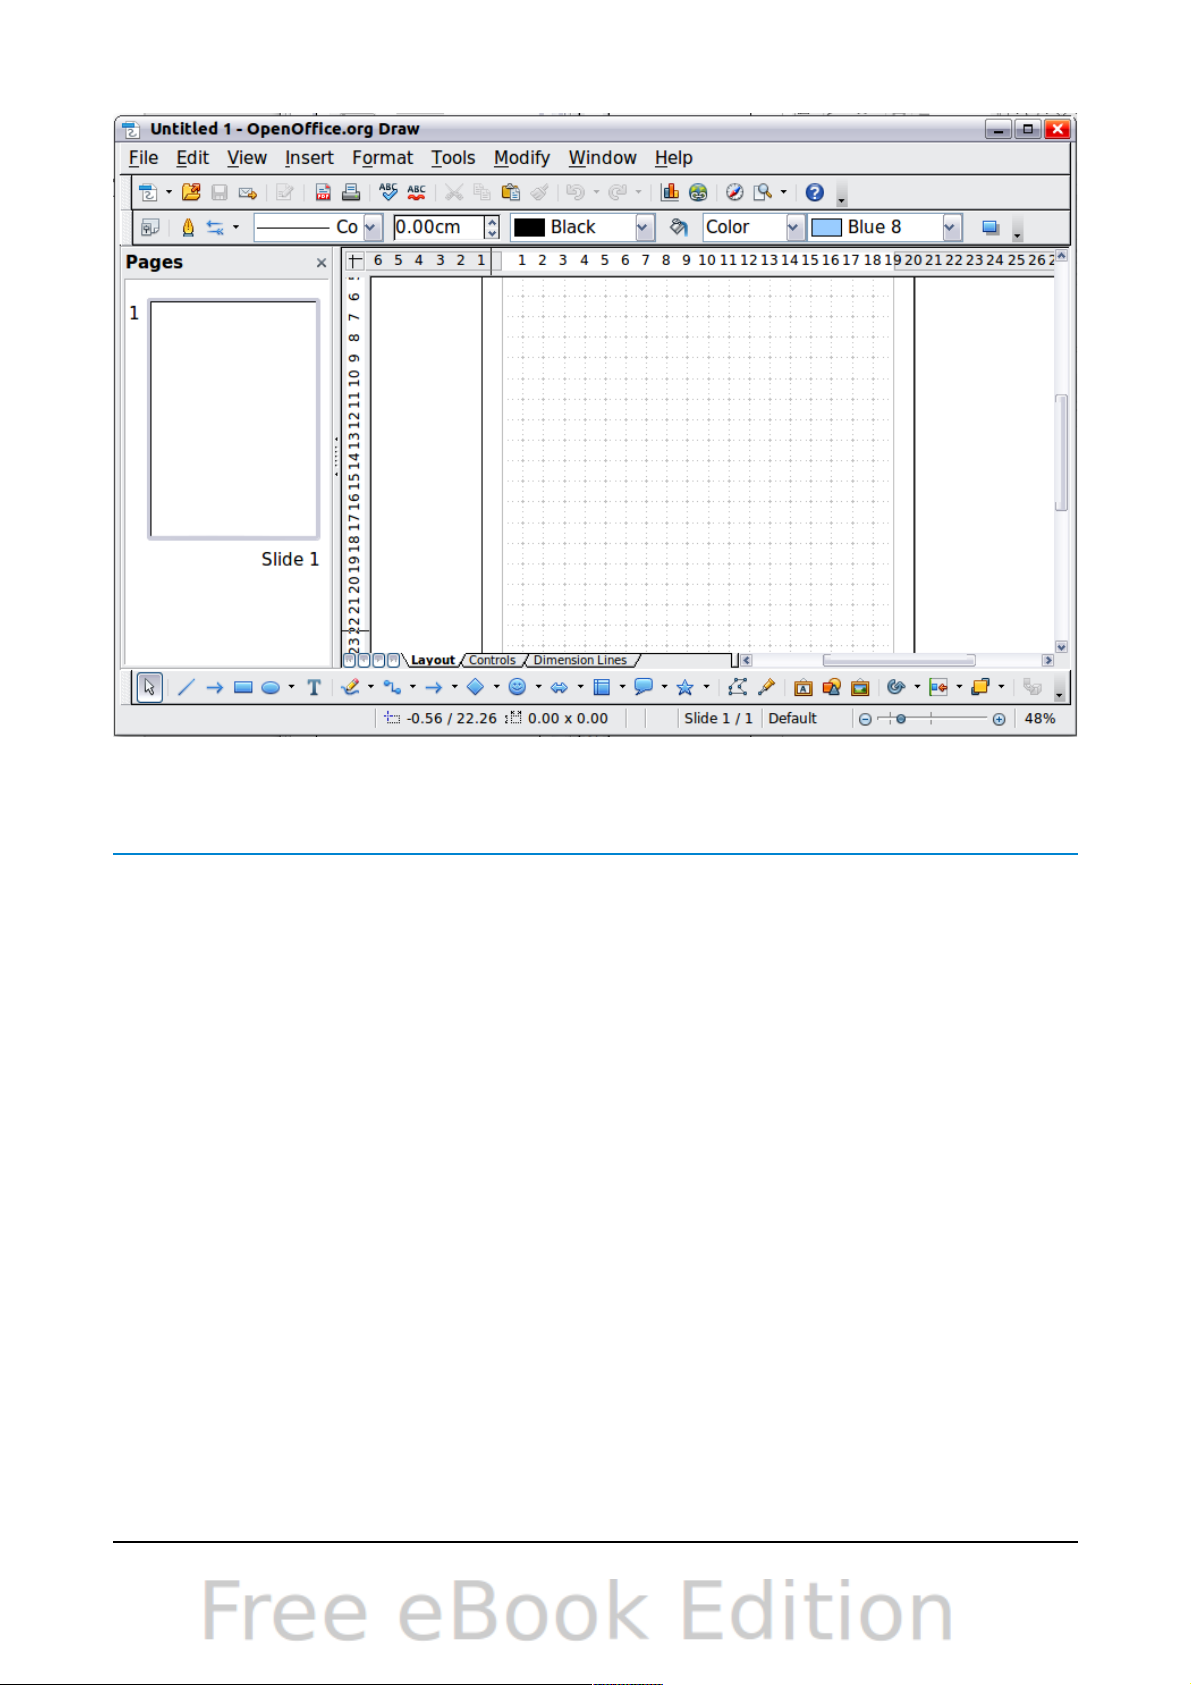
Figure 1: Initial Draw window
Rulers
You should see rulers (bars with numbers) on the upper and left-hand sides of the
workspace. If they are not visible, you can enable them by selecting them from the
View menu (View > Ruler).
The rulers show the size of a selected object on the page (see the gray double lines,
highlighted in Figure 2). When no object is selected, they show the location of the
mouse pointer, which helps to position drawing objects more accurately.
You can also use the rulers to manage object handles and guide lines, making it
easier to position objects.
The page margins in the drawing area are also represented on the rulers. You can
change the margins directly on the rulers by dragging them with the mouse.
Chapter 1 Introducing Draw 9
Page 10
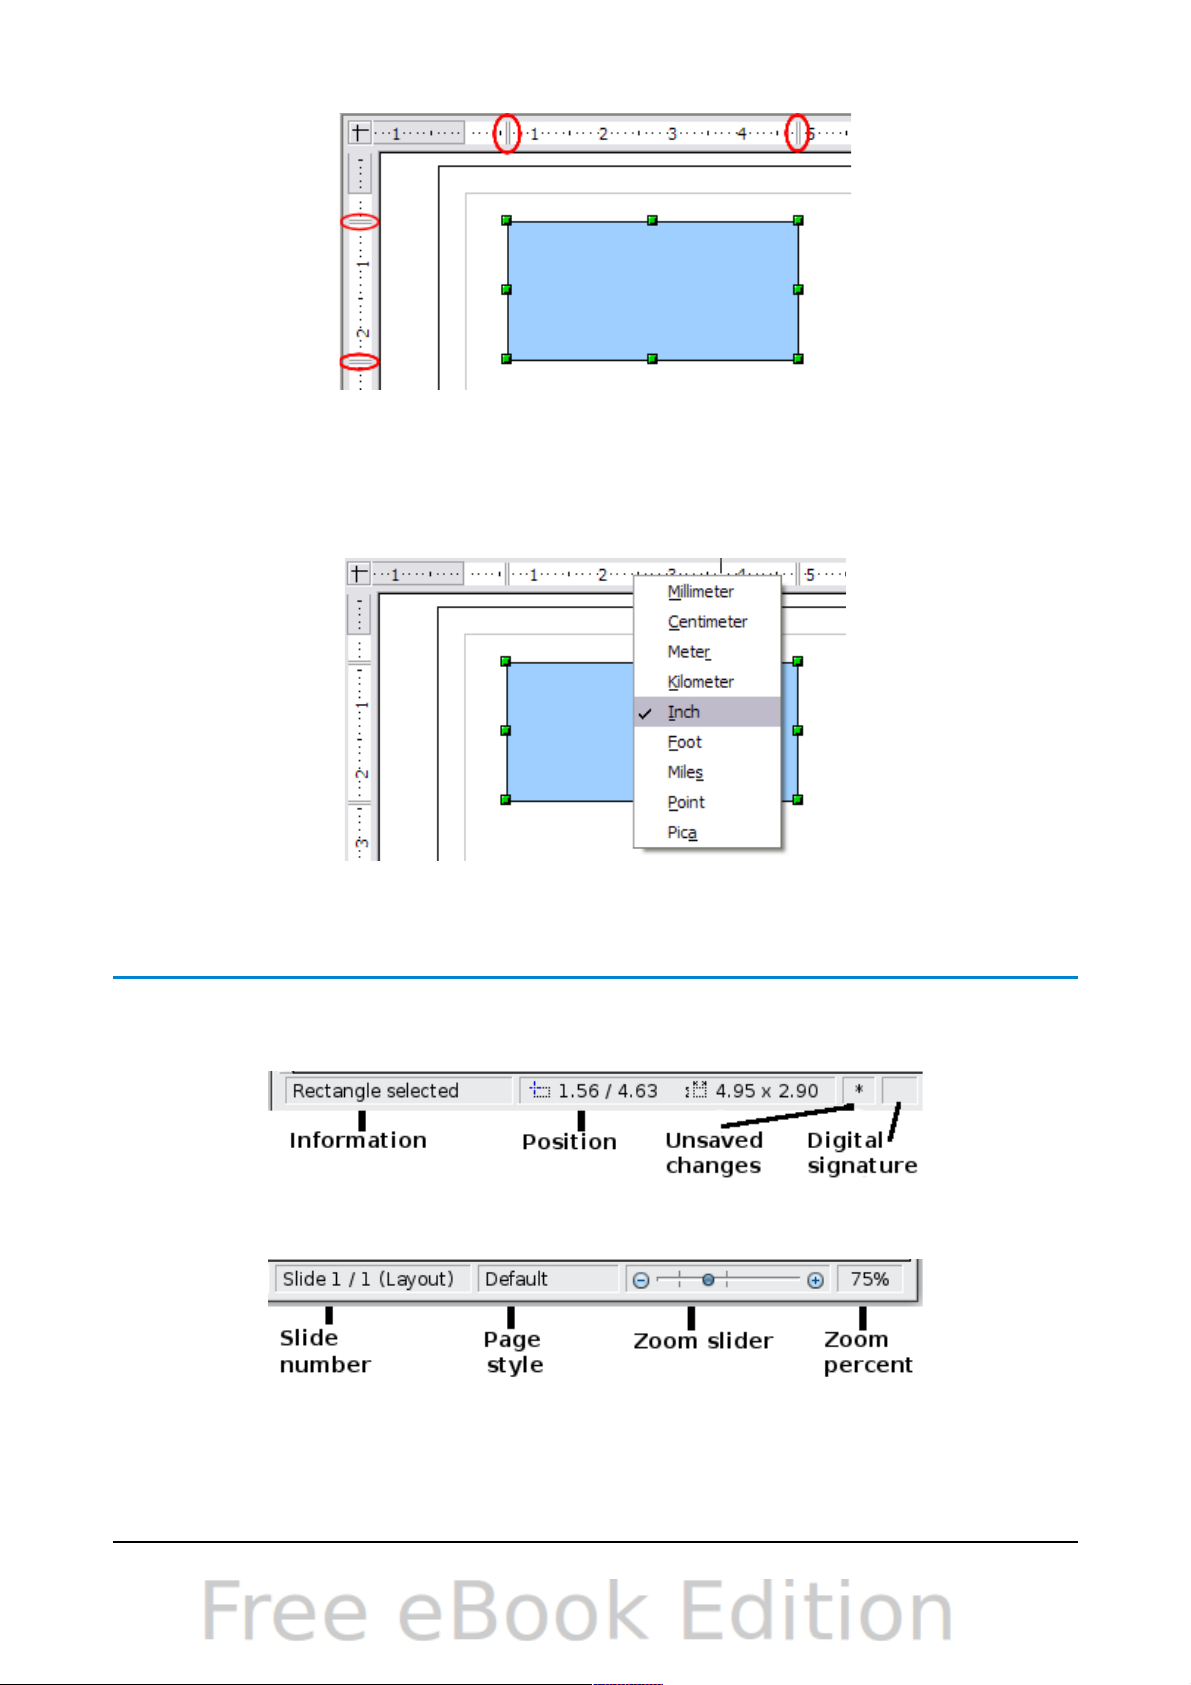
Figure 2: Rulers show the size of the
To modify the units of measurement of the rulers (which you can define
independently), right-click on the desired ruler, as illustrated for the horizontal ruler
in Figure 3.
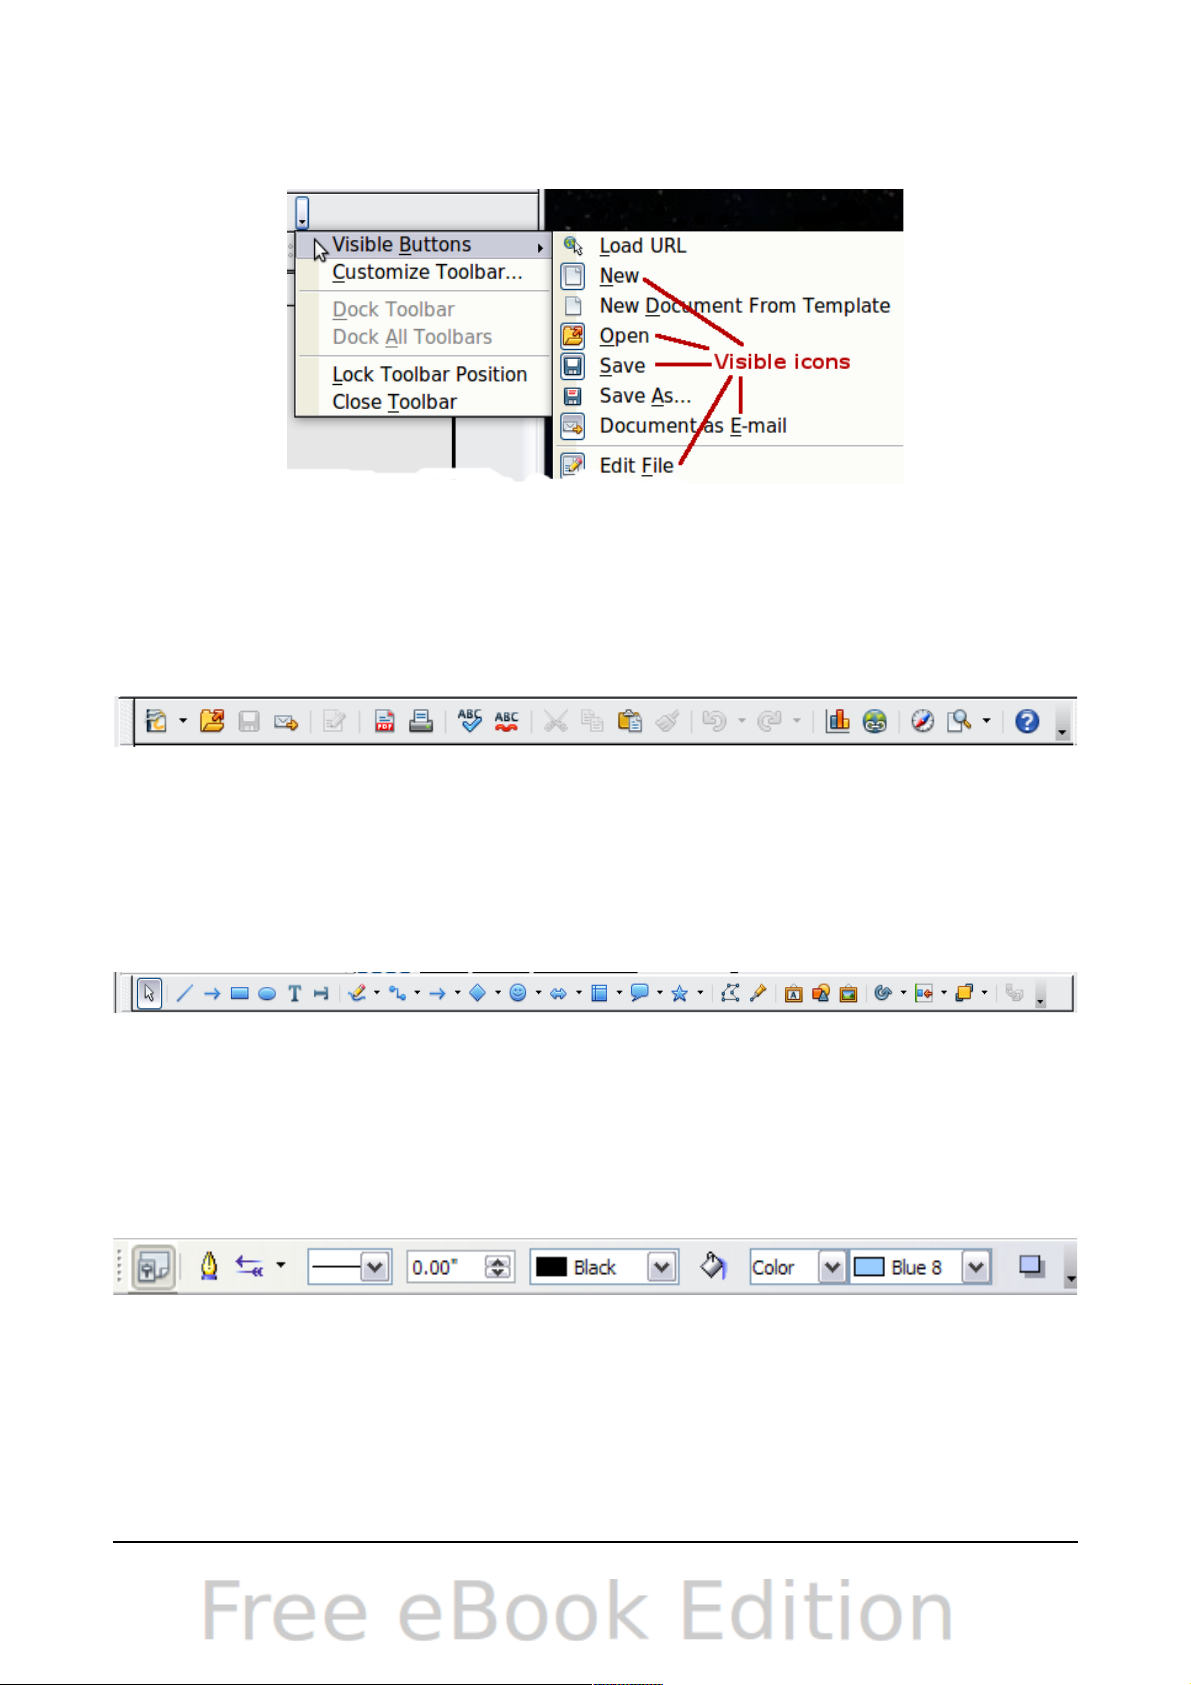
Status bar
The Status bar is located at the bottom of the Draw window and includes several
Draw-specific fields, as identified in Figures 4 and 5.
The Information field shows which action is being carried out, or which object type is
selected.
10 OpenOffice.org 3.3 Draw Guide
selected object
Figure 3: Rulers in a drawing
Figure 4: Left end of Draw status bar
Figure 5: Right end of Draw status bar
Page 11

The Position field shows different information, depending on whether objects are
currently selected or not:
• When no object is selected, the left number pair shows the current position (in
X,Y Cartesian coordinates) of the mouse cursor.
• While an object is being resized with the mouse, the right number pair shows
the size of the object (width and height).
Note
The sizes are given in the current measurement unit (not to be confused
with the ruler units). This unit is defined in Tools > Options >
OpenOffice.org Draw > General, where you can also change the scale of
the page. Another way to change the scale is to double-click on the
number shown in the status bar.
• If an object is selected, the left number pair shows the X,Y coordinates of the
upper-left corner, and the right number pair displays the size of the object, as
seen in Figure 4. These numbers do not relate to the object itself, but to the
selection outline, which is the smallest possible rectangle that can contain the
visible part or parts of the object; see also Chapter 3 (Working with Objects
and Object Points).
• When an object is selected, a double-click on this field opens the Position and
Size dialog, which is described in detail in Chapter 4 (Changing Object
Attributes).
In the Indicator field, an asterisk (*) is shown whenever any change is made to the
document but not yet saved to disk.
If you wish to digitally sign the document, a double-click or right-click in the
Signature field brings up the signature box. Note that a document must be saved at
least once before it can be signed. After it is signed, an indicator is present in this
field.
The Slide field shows the sequence number for the current drawing page, in addition
to the total number of pages that you created so far. This is useful when your drawing
has a number of pages. If you select an object, the field enclosed by parentheses
shows the layer in which the object resides within the drawing. In the example of
Figure 5, the object is on the Layout layer of Slide 1, and there is a total number of
one slide so far.
The Page style field shows which template is being used.
The vertical bar in the middle of the Zoom slider represents a zoom factor of 100%.
To change the view magnification, drag the Zoom slider, or click on the + and – signs,
or right-click on the zoom level percent to pop up a list of magnification values from
which to choose. Double-clicking on the zoom level percent to open the Zoom &
View Layout dialog.
Toolbars
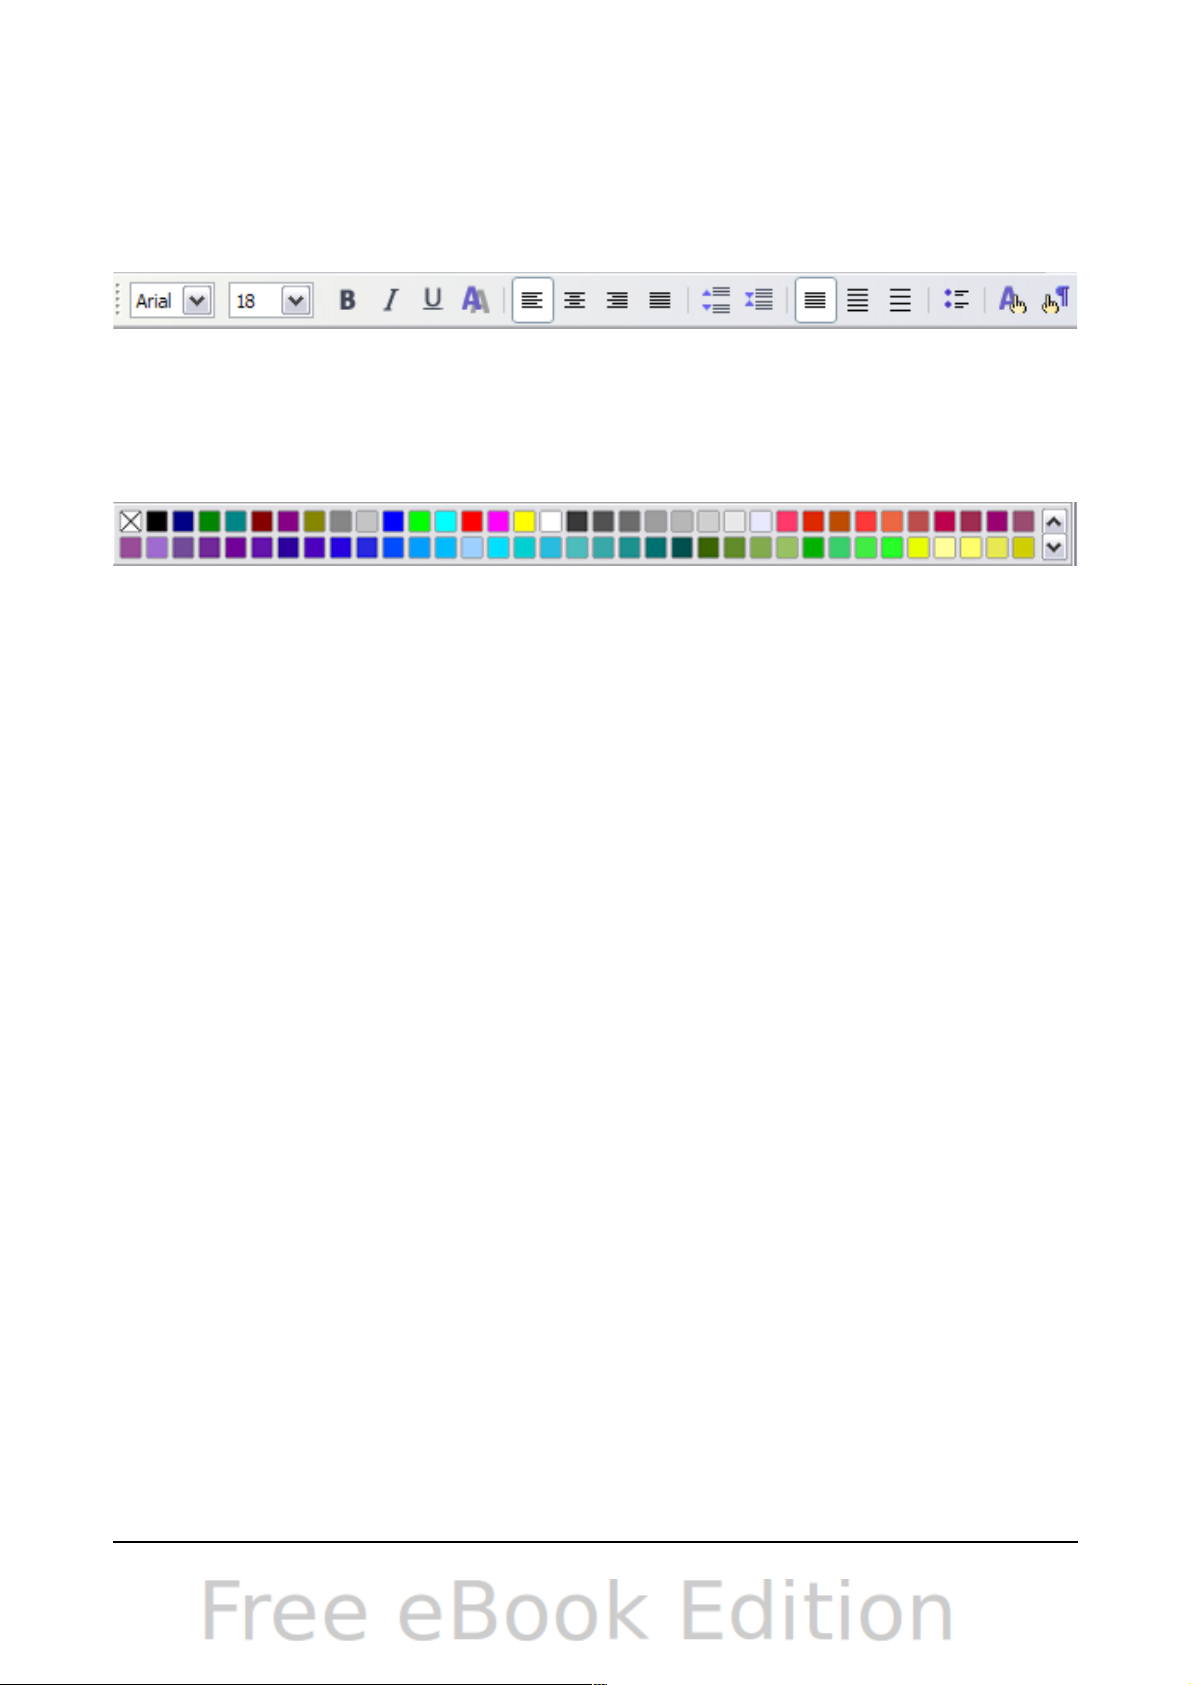
You can display or hide the various Draw toolbars, according to your needs. To
display or hide a toolbar, click View > Toolbars. On the menu that appears, choose
which toolbars you want to display.
You can also select the icons that you wish to appear on the toolbars. To change the
visible icons on any toolbar, click the arrow at the right-hand end of that toolbar and
Chapter 1 Introducing Draw 11
Page 12
choose Visible Buttons from the drop-down menu. Visible icons are indicated by an
outline around the icon. Click on icons to hide or show them on the toolbar.
The tools available in the various toolbars are explained in the following sections.
Standard toolbar
The Standard toolbar is the same for all OpenOffice.org components and is not
described in detail here.
Drawing toolbar
The Drawing toolbar is the most important toolbar in Draw. It contains all the
necessary functions for drawing various geometric and freehand shapes and for
organizing them on the page. It is described in detail in Chapter 2 (Drawing Basic
Shapes).
Line and Filling toolbar
The Line and Filling toolbar lets you modify the main properties of a drawing object:
the icons and pull-down lists vary with the type of object selected. For example, to
change the thickness of a line with the spinner, hover the mouse over the spinner and
click the up or down arrow to achieve the desired thickness.
In the example above, the available functions enable you to change the color, style,
and width of the line drawn or the fill color, style, and other properties of an object.
The object must first be selected with a mouse click. If the selected object is a text
frame, the buttons for line style and fill color are changed to Invisible by default. You
can change them to something else if you want.
12 OpenOffice.org 3.3 Draw Guide
Figure 6: Selection of visible toolbar icons
Figure 7: Standard toolbar
Figure 8: Drawing toolbar
Figure 9: Line and Filling toolbar
Page 13
Text Formatting toolbar
When text is selected, the Line and Filling toolbar changes to the Text Formatting
toolbar, which is very similar to the Formatting toolbar in Writer. A more detailed
explanation of the buttons on this toolbar can be found in Chapter 4 (Changing
Object Attributes).
Color bar
To display the Color bar, use View > Toolbars > Color Bar. The toolbar then
appears at the bottom of the workspace and displays the current color palette.
This toolbar lets you rapidly choose the color of the various objects (lines, areas, and
3D effects) in your drawing. The first box in the panel corresponds to transparency
(no color).
Choosing a color palette
You can access several specialized color palettes in Draw, as well as change
individual colors to your own taste. This is done using the Area dialog, reached by
choosing Format > Area, or the pouring can icon on the Line and Filling toolbar
(Figure 9).
On the Area dialog, choose the Colors tab (Figure 12).
To load another palette, click on the Load Color List button (circled). The file
selector dialog asks you to choose one of the standard OpenOffice.org palettes (files
bearing the file extension *.soc). For example, web.soc is a color palette that is
particularly adapted to creating drawings that are going to appear in Web pages.
These colors will display correctly on workstations with screens capable of at least
256 colors.
A more detailed description of color palettes and their options can be found in
Chapter 8 (Tips and Tricks).
Chapter 1 Introducing Draw 13
Figure 10: Text Formatting toolbar
Figure 11: Color bar
Page 14
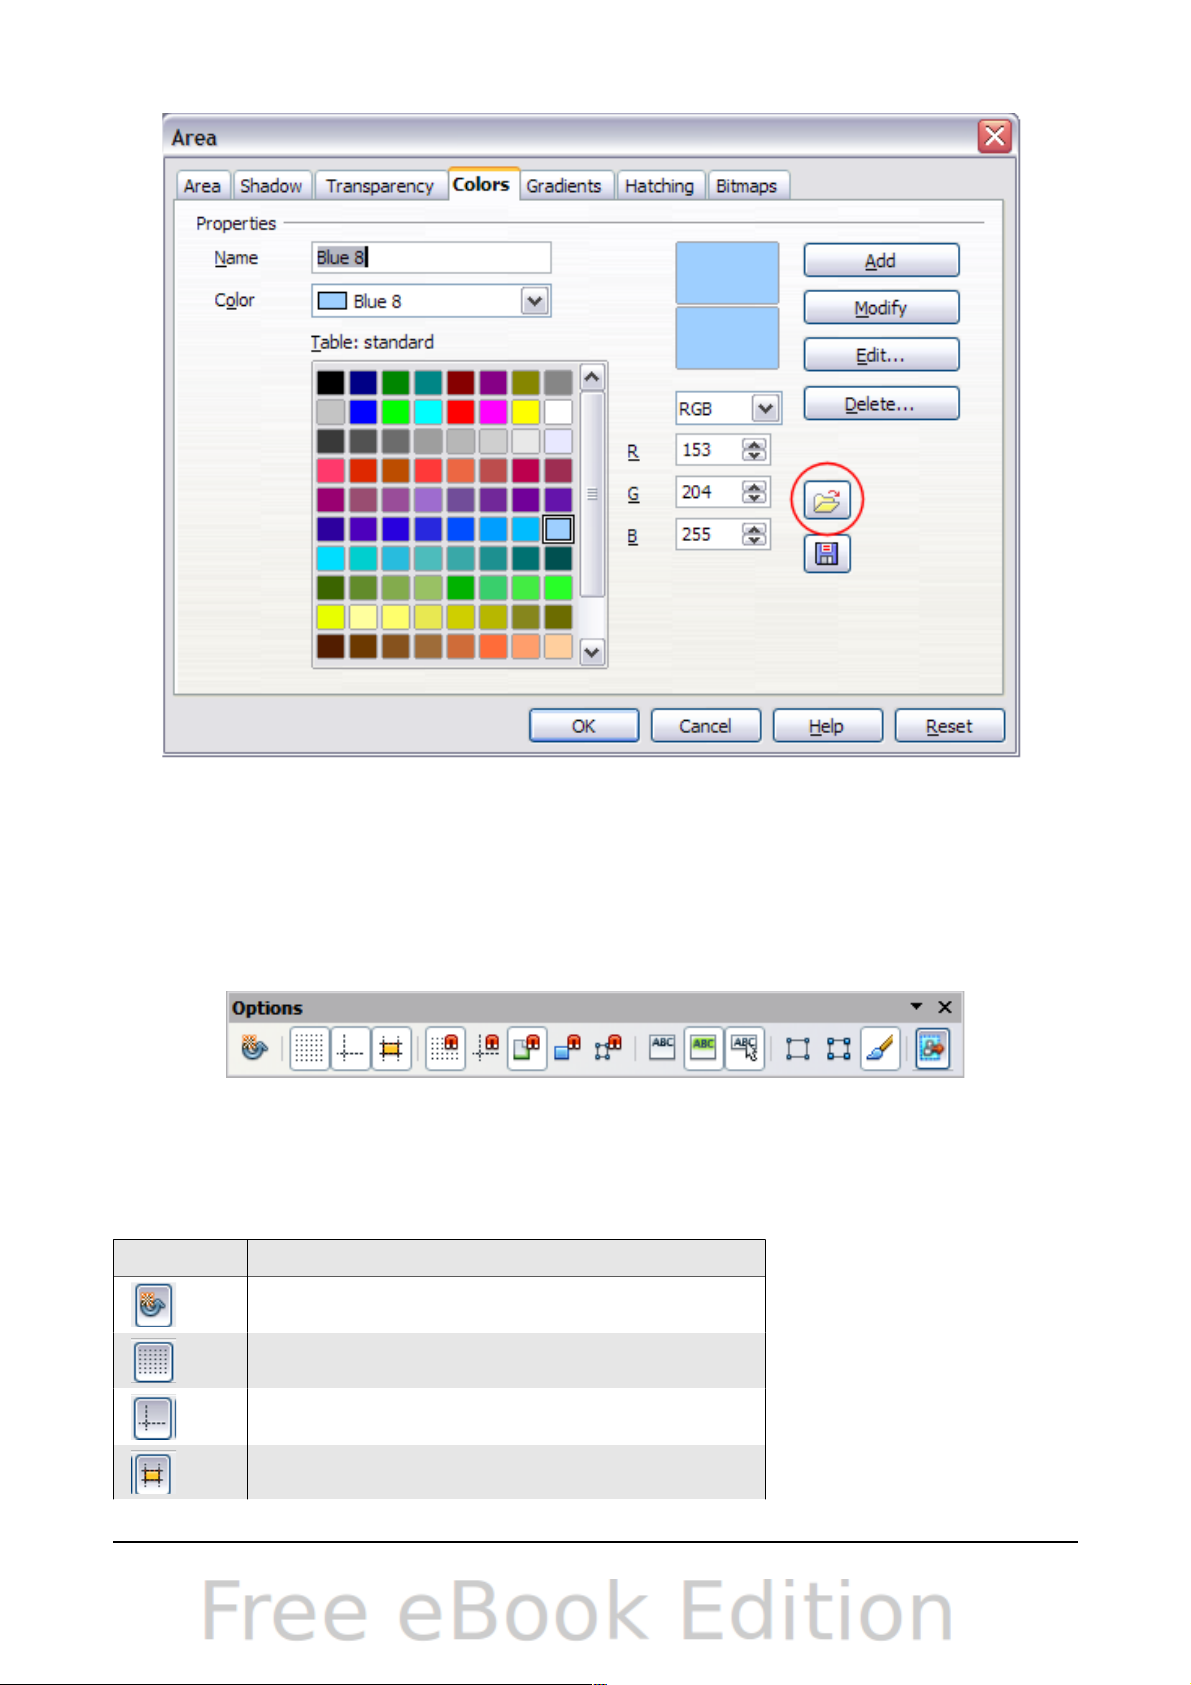
Figure 12. Changing the color palette
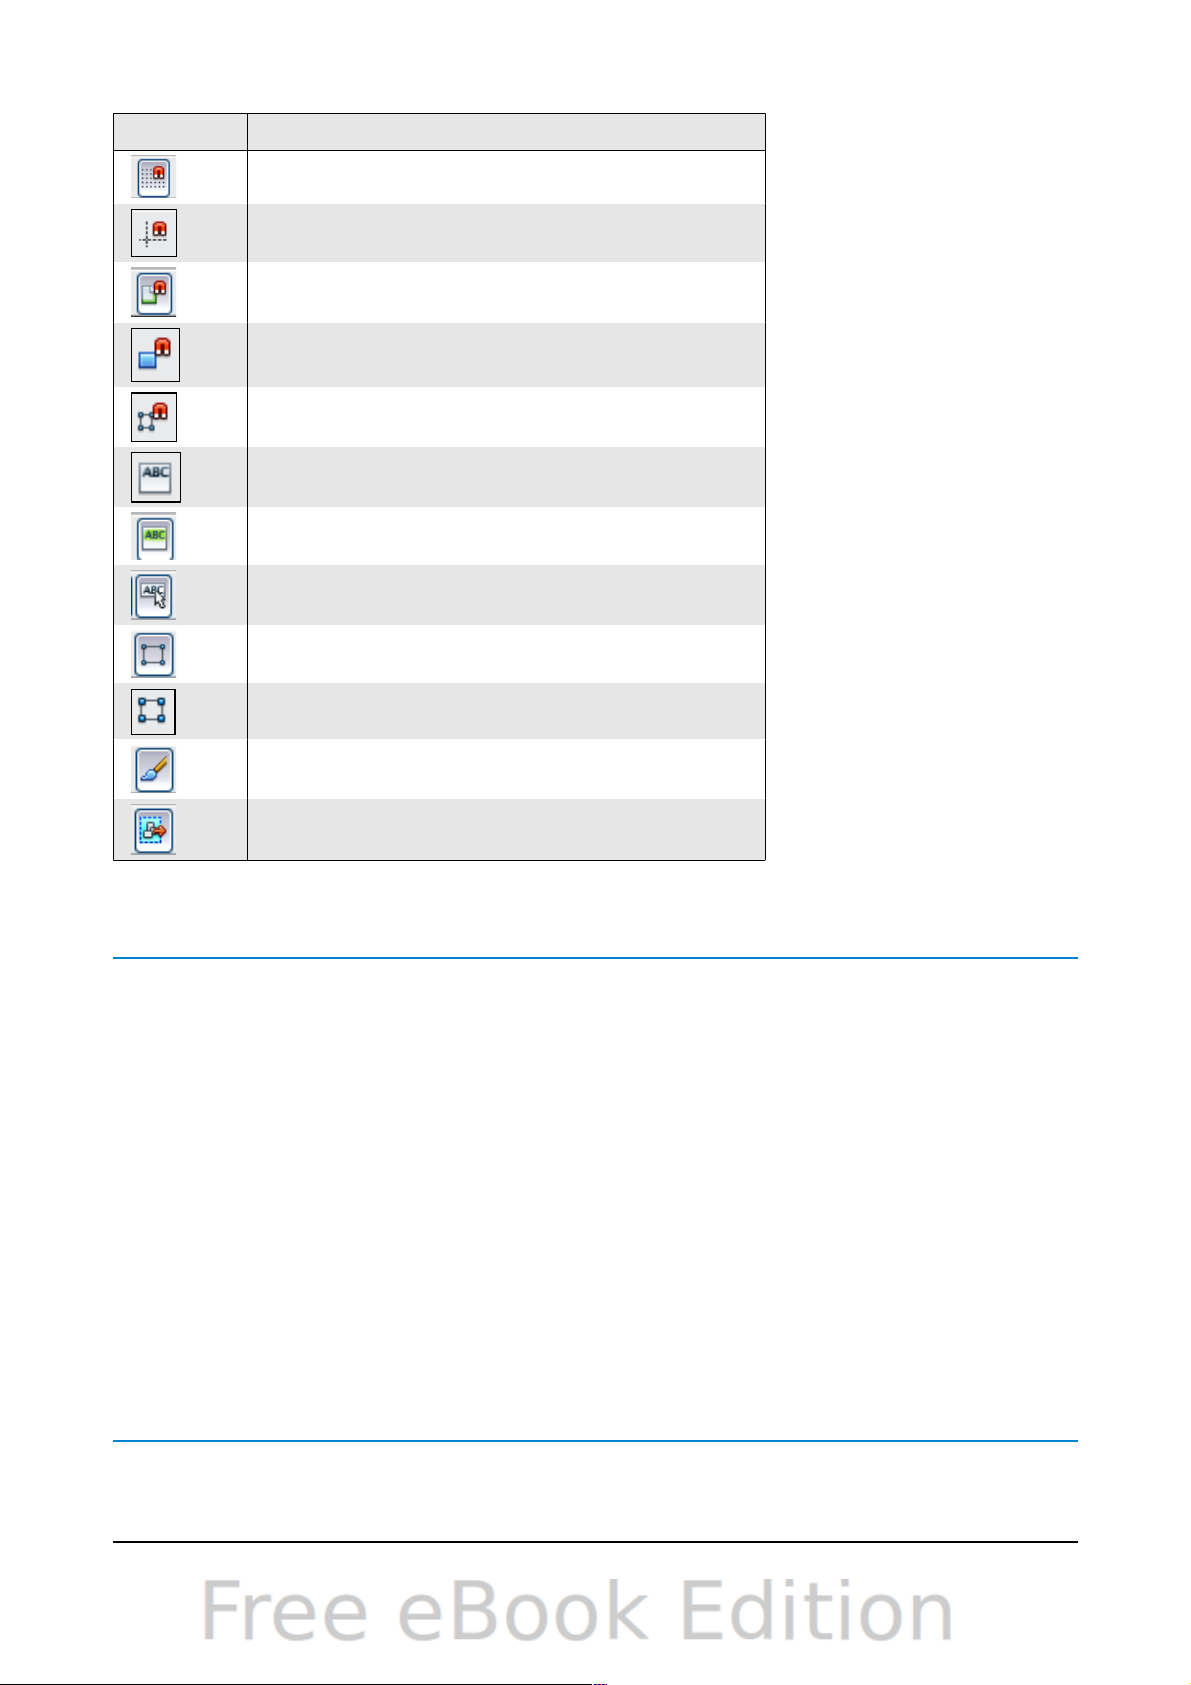
Options toolbar
The Options toolbar lets you activate or deactivate various drawing aids. The Options
Bar is not one of the toolbars displayed by default. To display it, select View >
Toolbars > Options.
The options are described in the table below and in greater detail in other chapters of
the Draw Guide.
Table 1: Functions on the Options toolbar
Icon Function
Rotation mode after clicking object
Display (or hide) the grid
Display (or hide) the guides
Display (or hide) guides when moving
14 OpenOffice.org 3.3 Draw Guide
Figure 13: Options toolbar
Page 15
Icon Function
Snap to grid
Snap to guides
Snap to page margins
Snap to object borders
Snap to object points
Allow quick editing
Select text area only
Double-click to edit text
Simple handles
Large handles
Modify object with attributes
Exit all groups
Drawing grid and guides
Draw offers a grid as a drawing aid. The grid can be turned on or off by clicking on
the Grid icon on the Options toolbar. The points of the grid displayed on the screen
are not shown on the printed drawing. The color, spacing, and resolution of the grid
points can be individually chosen for each axis. This is described in more detail in
Chapter 8 (in the section titled “Configuring the grid”).
Guides are special “helper lines” that can be turned on or off by clicking on the
Guides icon on the Options toolbar. Draw offers a “Snap” function, with which you
can place drawings exactly on these guides or on a grid point, a page margin, or a
border or point of another object. All snap functions are described in detail in
Chapter 8 (Tips and Tricks).
Showing the position of the object while moving it makes positioning the object much
easier. If the Guides function is activated, pairs of vertical and horizontal lines
enclosing the object are shown while moving the object. These lines extend to the
edges of the drawing area. This function is also described in detail in Chapter 8.
Floating and moving toolbars
Many toolbar icons are marked with a small arrow. The arrow indicates that this icon
has additional tools. Click the arrow to display the full set of tools (see Figure 14).
Chapter 1 Introducing Draw 15
Page 16
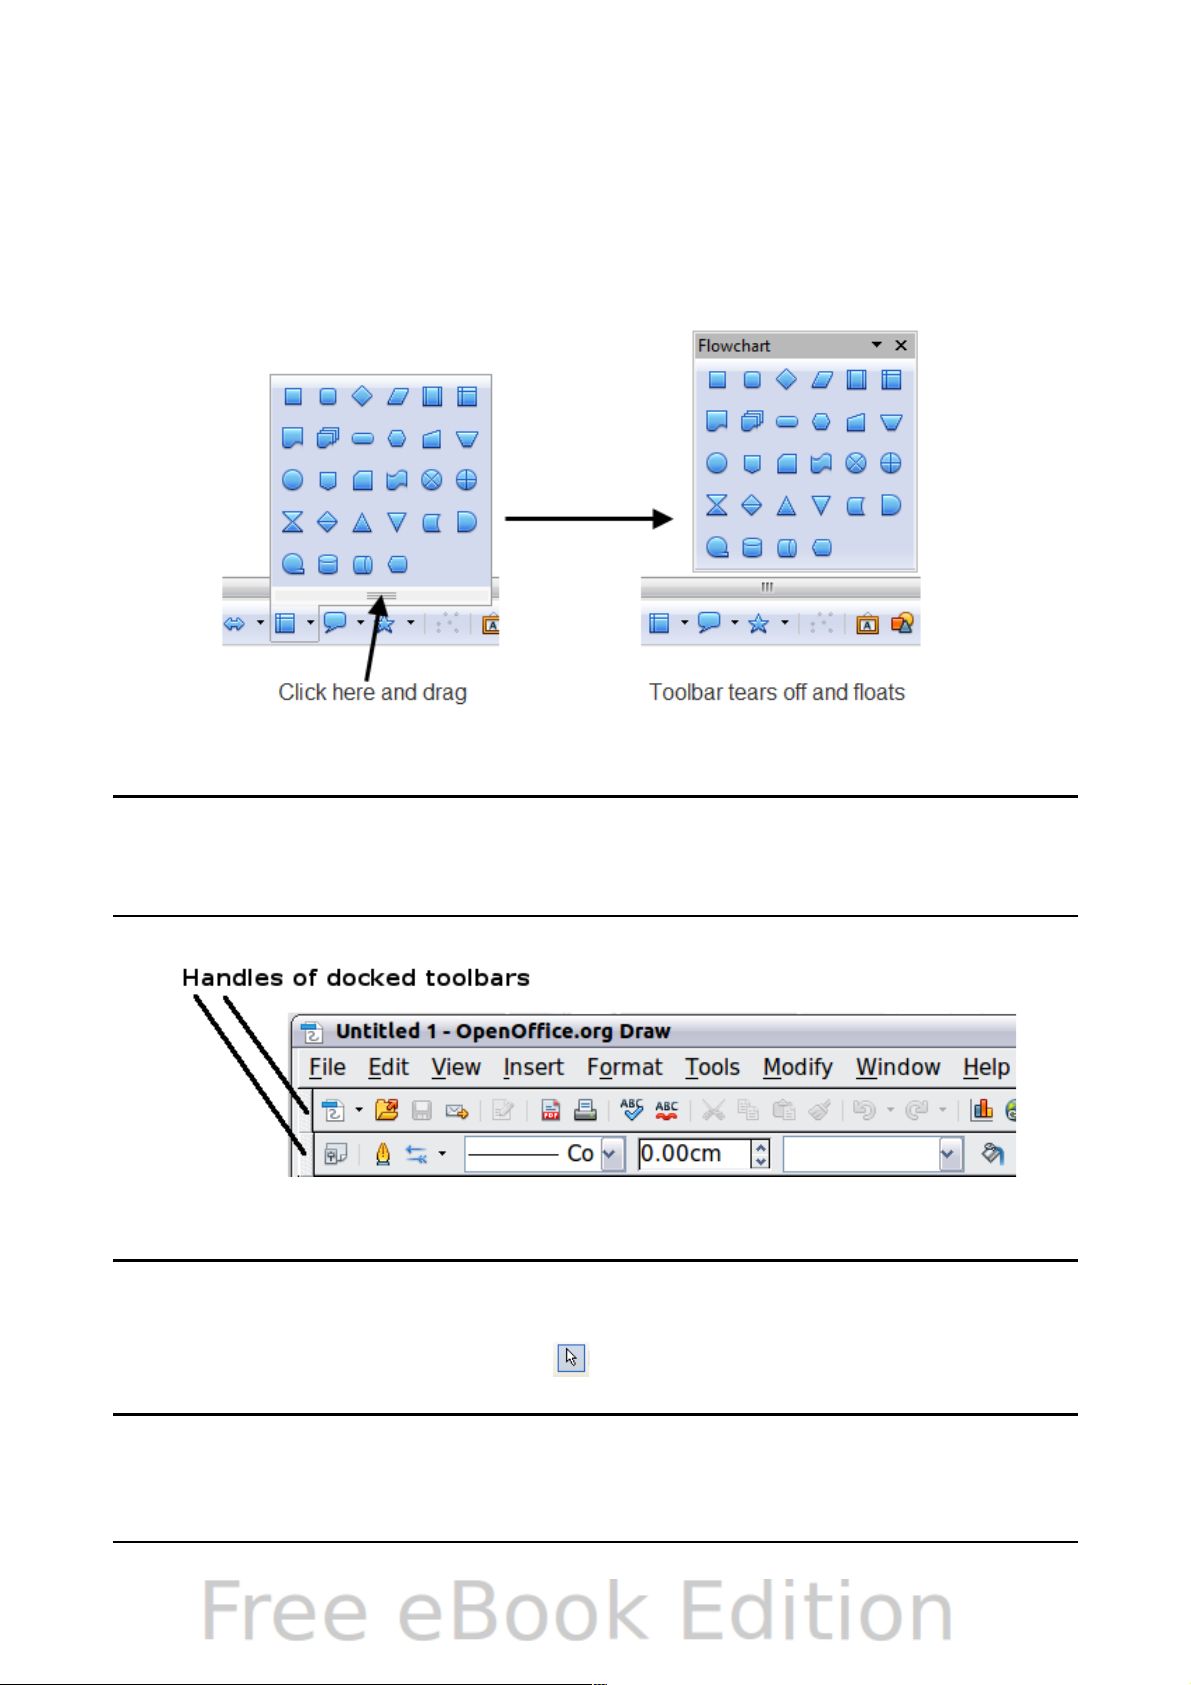
You can “tear off” this tool set so it becomes a floating toolbar. Click the area at the
bottom of the toolset, drag it across the screen to a location you want, and then
release the mouse button.
To dock a floating toolbar to the top or side of the Draw workspace, Ctrl+click on the
title of the toolbar. To float a docked toolbar, click on its handle and drag it off the
side of the workspace (see Figure 15). The floating-toolbar capability is common to all
components of OpenOffice.org.
Note
When a toolset is made into a floating toolbar, the icon on the existing
toolbar remains in the toolbar and always shows the last command you
used. This means that the icon you see on your screen may differ from the
icon shown in this Guide.
Tip
When you double-click on an icon on a floating toolbar, the command
corresponding to that icon will run. You can then repeat this action as
often as you like. To exit from this mode, press the Esc key or click on
another icon (for example ). This may not work for every icon on
every toolbar.
16 OpenOffice.org 3.3 Draw Guide
Figure 14: An arrow next to an icon indicates additional functions
Figure 15: Moving a docked toolbar
Page 17
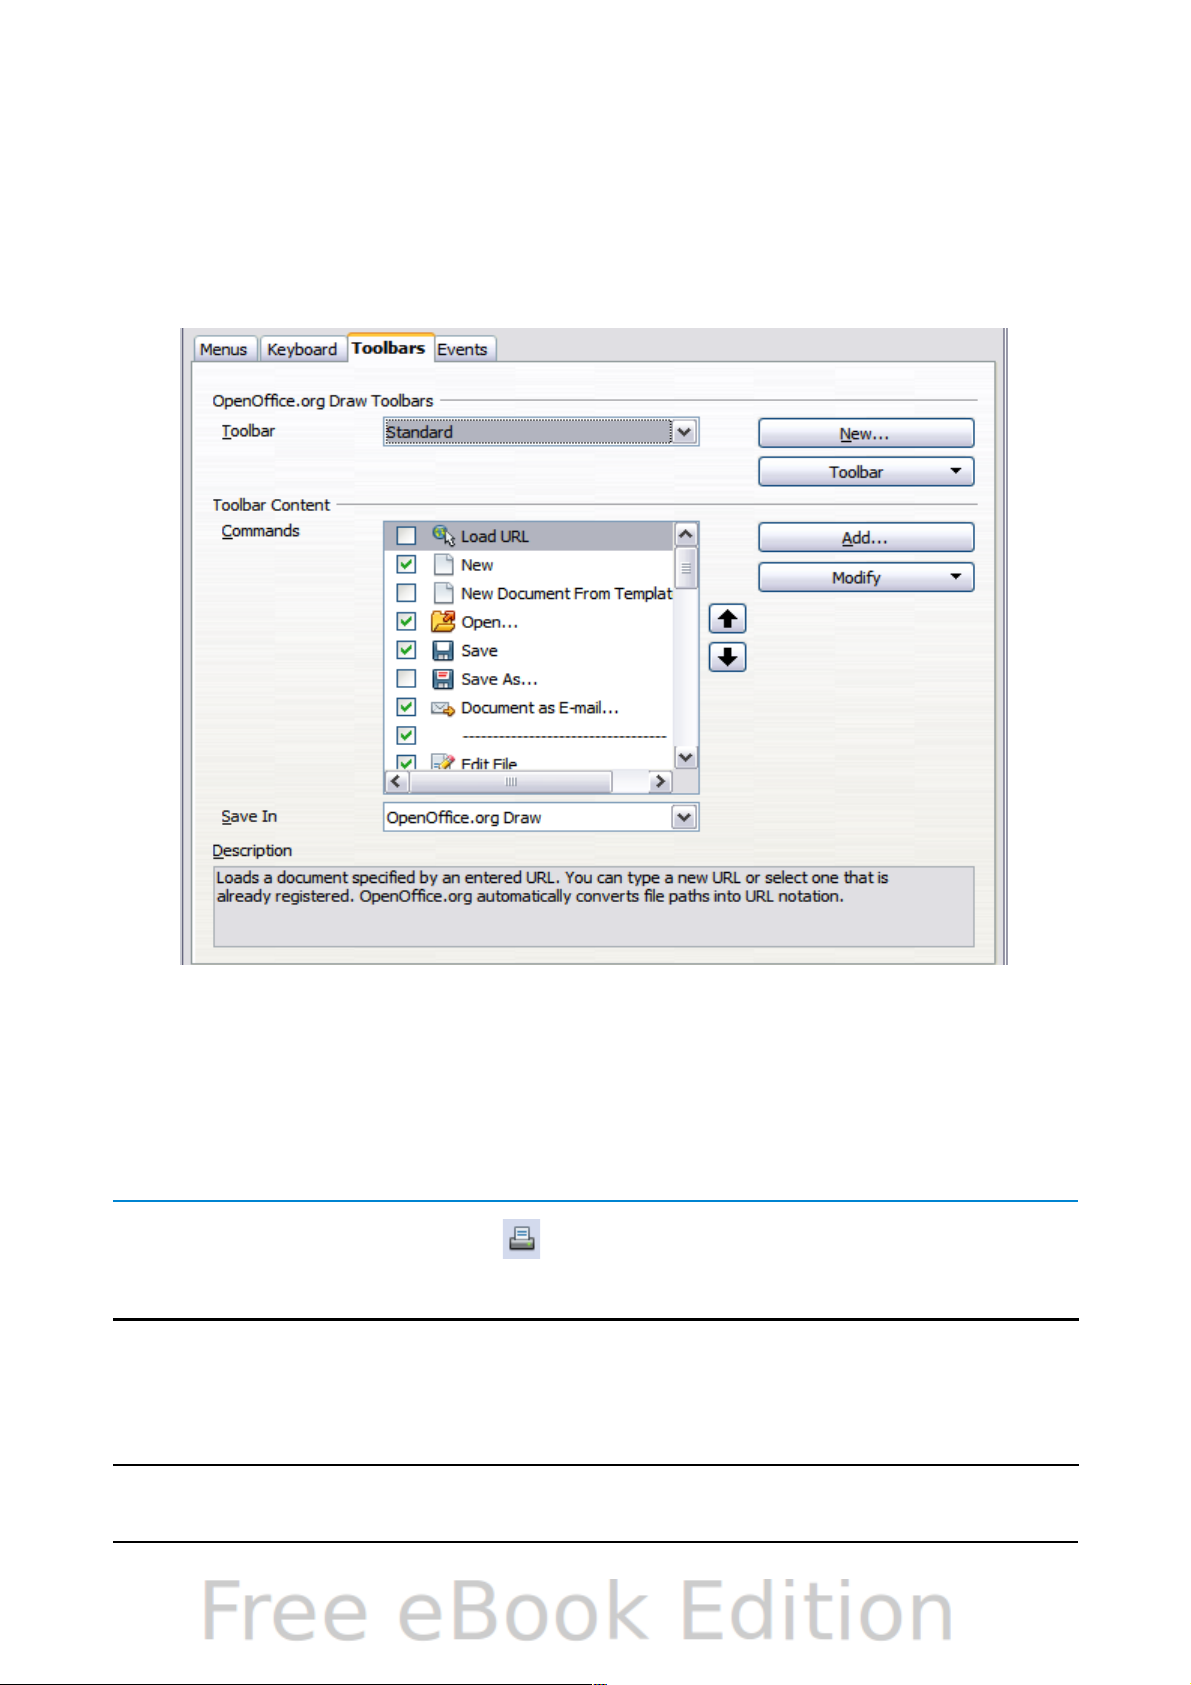
Customizing toolbars
You can customize toolbars in several ways. To show or hide icons defined for a
toolbar, see Figure 6 on page 12.
To add functions to a toolbar, move tools between toolbars, or create new toolbars.,
choose View > Toolbars > Customize, select the Toolbars tab (Figure 16) and the
toolbar you want to change, and then select the desired buttons for that toolbar.
Each toolbar has a different list of functions. For details, see Chapter 14
(Customizing OpenOffice.org) in the Getting Started guide. That chapter also
describes how to customize menus.
Quick printing
Click the Print File Directly icon to send the entire document to the default
printer defined for your computer.
Note
You can change the action of the Print File Directly icon to send the
document to the printer defined for the document instead of the default
printer for the computer. Go to Tools > Options > Load/Save >
General and select the Load printer settings with the document
option.
Chapter 1 Introducing Draw 17
Figure 16: Customizing a toolbar
Page 18
Controlling printing
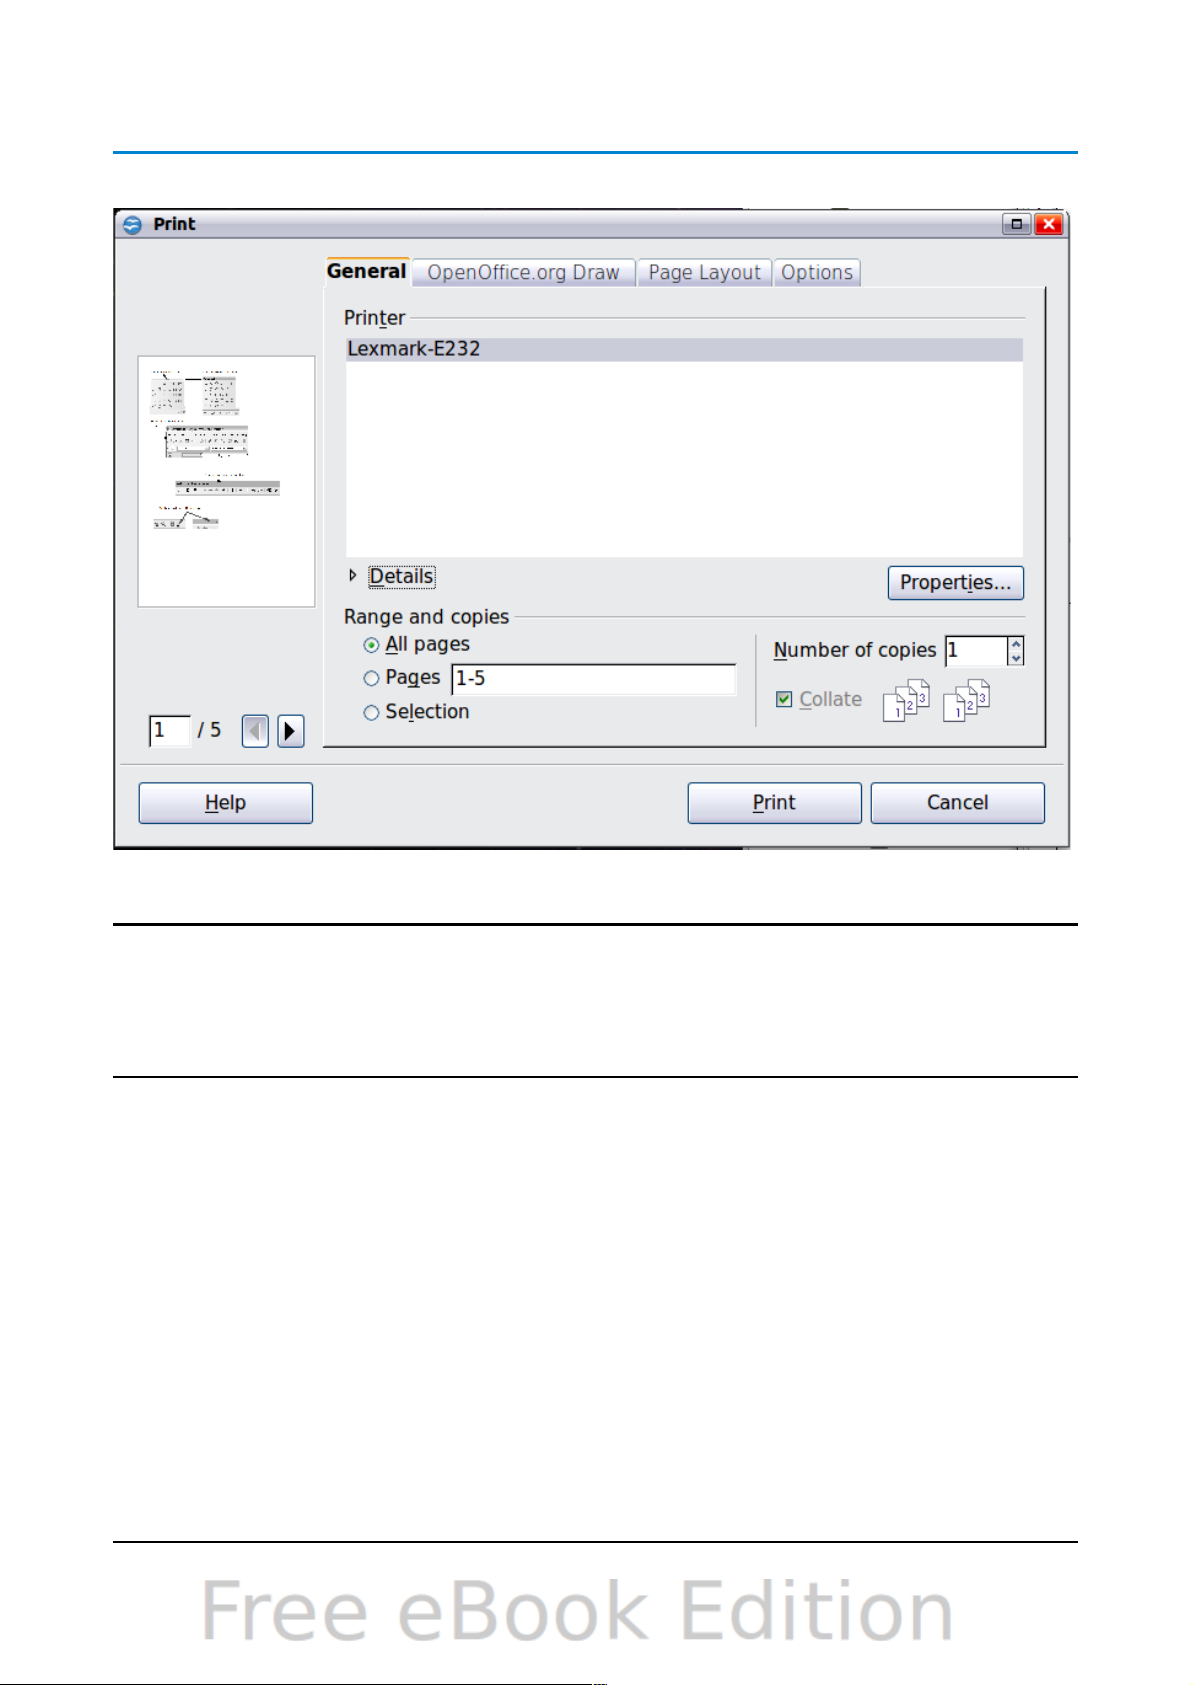
For more control over printing, use the Print dialog (File > Print or Ctrl+P).
Note
The options selected on the Print dialog apply to this printing of this
document only.
To specify default printing settings for OpenOffice.org, go to Tools >
Options > OpenOffice.org – Print and Tools > Options >
OpenOffice.org Draw – Print.
The Print dialog has four tabs, from which you can choose a range of options, as
described in the following sections.
Selecting general printing options
On the General tab of the Print dialog, you can choose:
• The printer (from the printers available)
• Which pages to print, the number of copies to print, and whether to collate
multiple copies (Range and copies section)
Select the Properties button to display a dialog where you can choose portrait or
landscape orientation, which paper tray to use, and the paper size to print on.
On the Options tab of the Print dialog (Figure 18) you can set a number of other,
lesser used, options for printing.
18 OpenOffice.org 3.3 Draw Guide
Figure 17. The Print dialog
Page 19
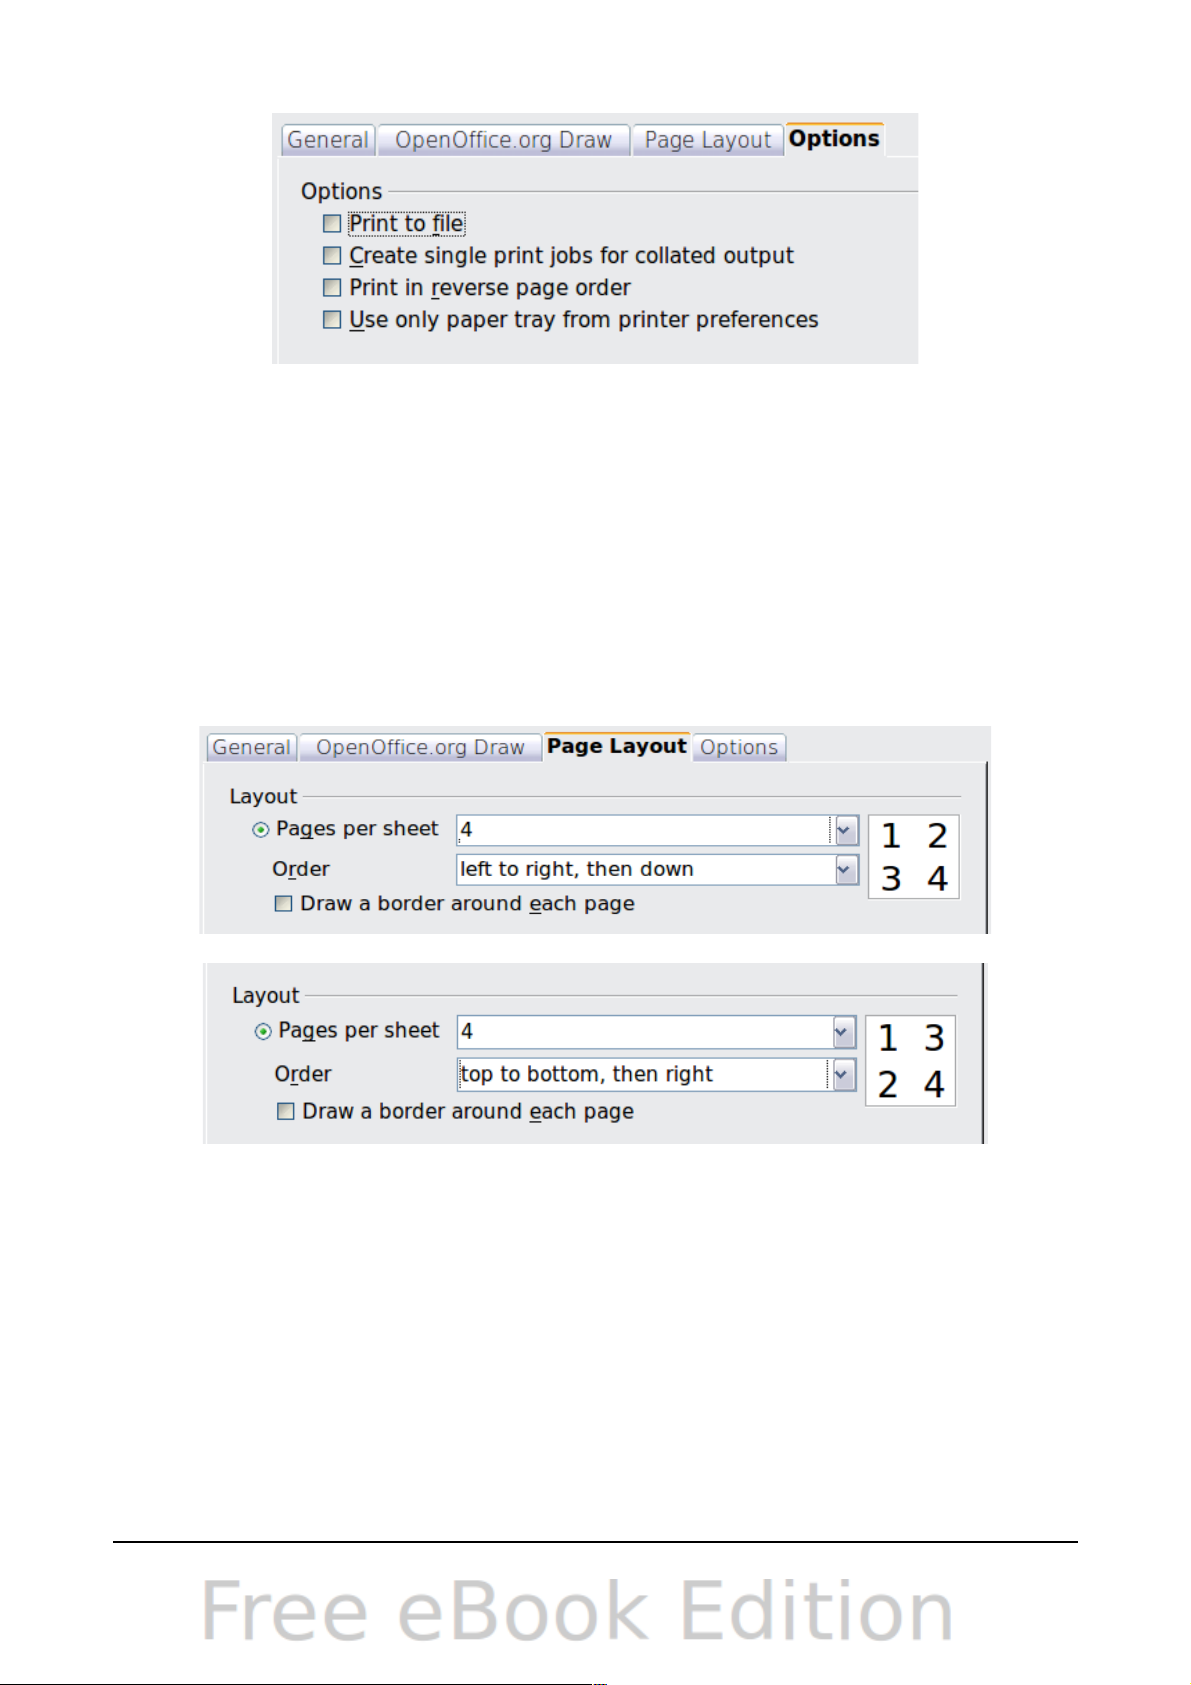
Figure 18: General print options
Printing multiple pages on a single sheet of paper
You can print multiple pages of a document on one sheet of paper. To do this:
1) In the Print dialog, select the Page Layout tab.
2) In the Layout section, select from the drop-down list the number of pages to
print per sheet. The preview panel on the left of the Print dialog shows how the
printed document will look.
When printing more than two pages per sheet, you can choose the order in
which they are printing across and down the paper. The two pictures below
show the difference.
3) In the Page sides section, select whether to print all pages or only some pages.
4) Click the Print button.
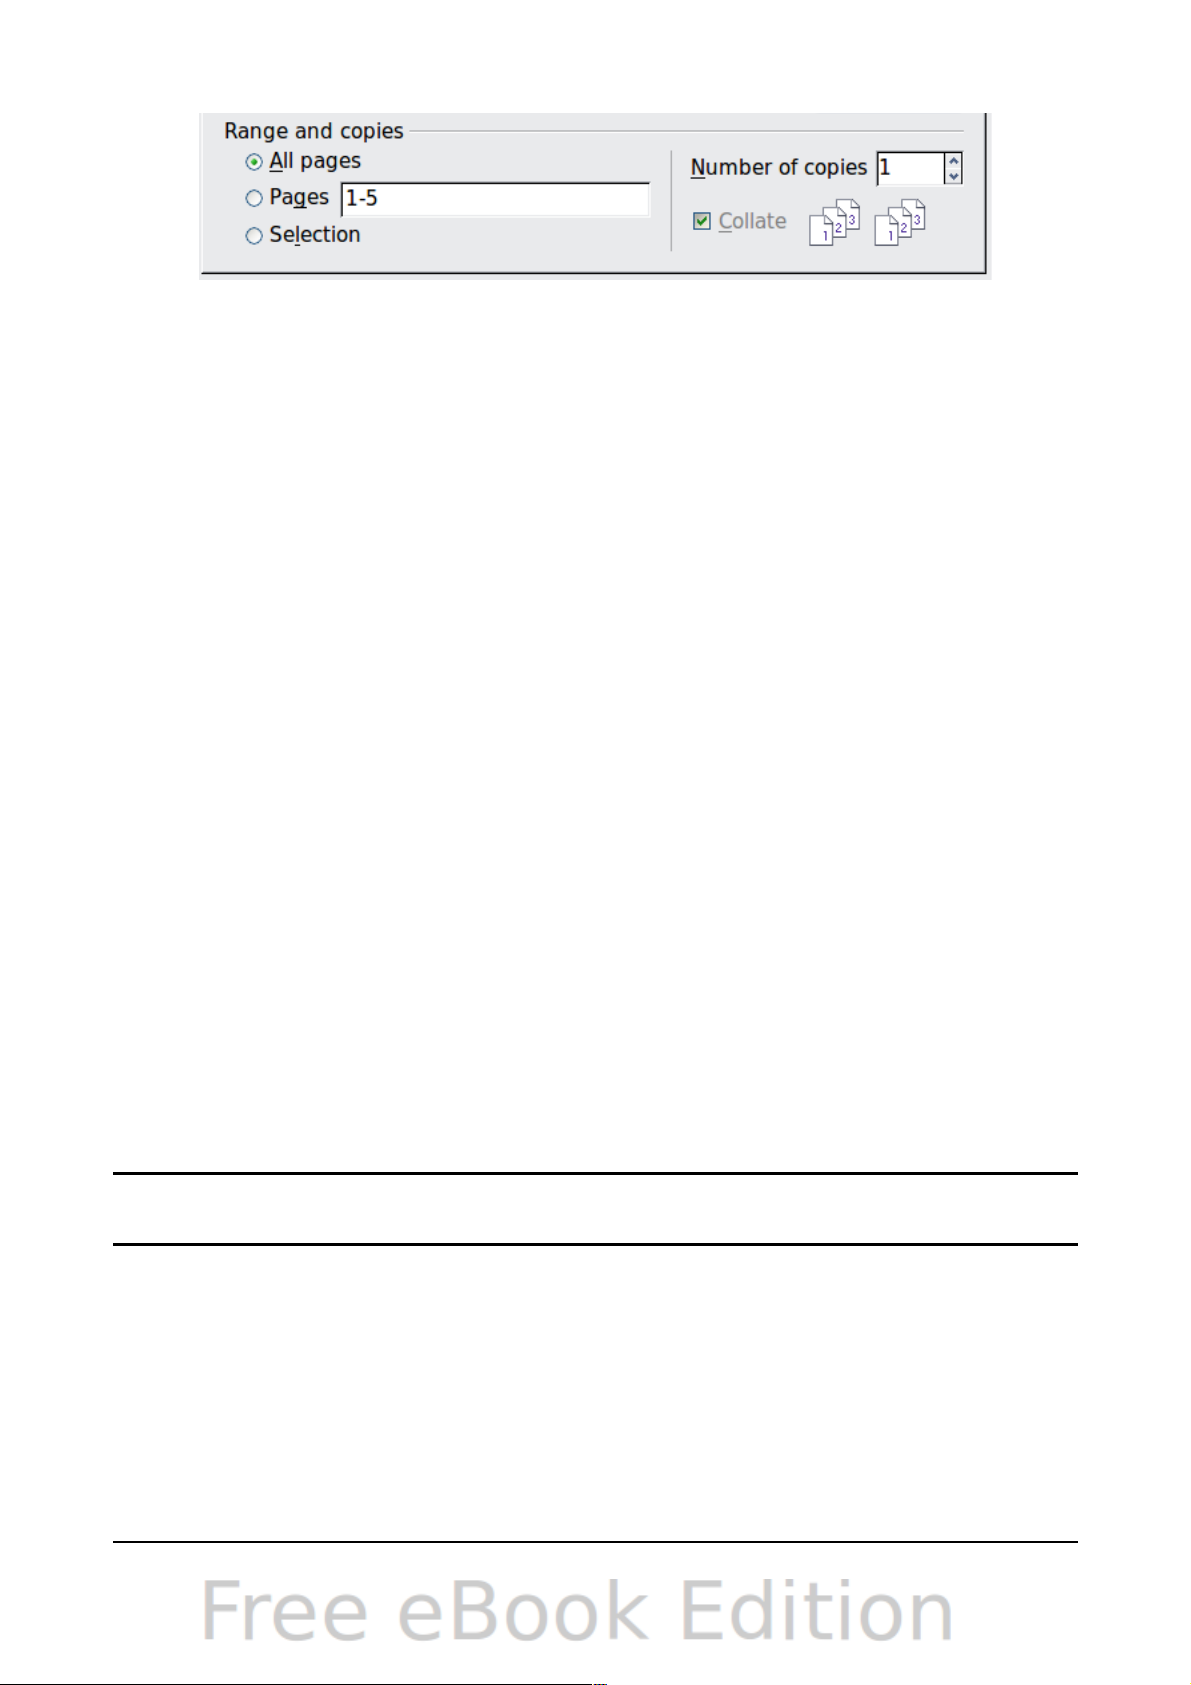
Selecting pages to print
In addition to printing a full document, you can choose to print individual pages,
ranges of pages, or a selection of a document.
Chapter 1 Introducing Draw 19
Page 20
To print an individual page:
1) Choose File > Print from the menu bar.
2) Select the page to print.
a) In the Ranges and copies section of the Print dialog, select the Pages
option.
b) Enter the number of the page to print.
3) Click the Print button.
To print a range of pages:
1) Choose File > Print from the menu bar.
2) Select the pages to print.
a) In the Ranges and copies section of the Print dialog, select the Pages
option.
b) Enter the number of the pages to print (for example 1-4 or 1,3,7,11), or any
combination of the two, for example: 1-4,5-9,10.
3) Click the Print button.
To print a selection of a page, or a selection from multiple pages:
1) In the document, select the section of the page to print.
2) Choose File > Print from the menu bar.
3) Choose the Selection option in the Ranges and copies section of the Print
dialog.
4) Click the Print button.
Printing a brochure
In Writer, Impress, and Draw, you can print a document with two pages on each side
of a sheet of paper, arranged so that when the printed pages are folded in half, the
pages are in the correct order to form a booklet or brochure.
Tip
Plan your document so it will look good when printed half size; choose
appropriate margins, font sizes, and so on. You may need to experiment.
To print a brochure on a single-sided printer:
1) Choose File > Print.
2) In the Print dialog, click Properties.
3) Check the printer is set to the same orientation (portrait or landscape) as
specified in the page setup for your document. Usually the orientation does not
matter, but it does for brochures. Click OK to return to the Print dialog.
4) Select the Page layout tab in the Print dialog.
20 OpenOffice.org 3.3 Draw Guide
Page 21
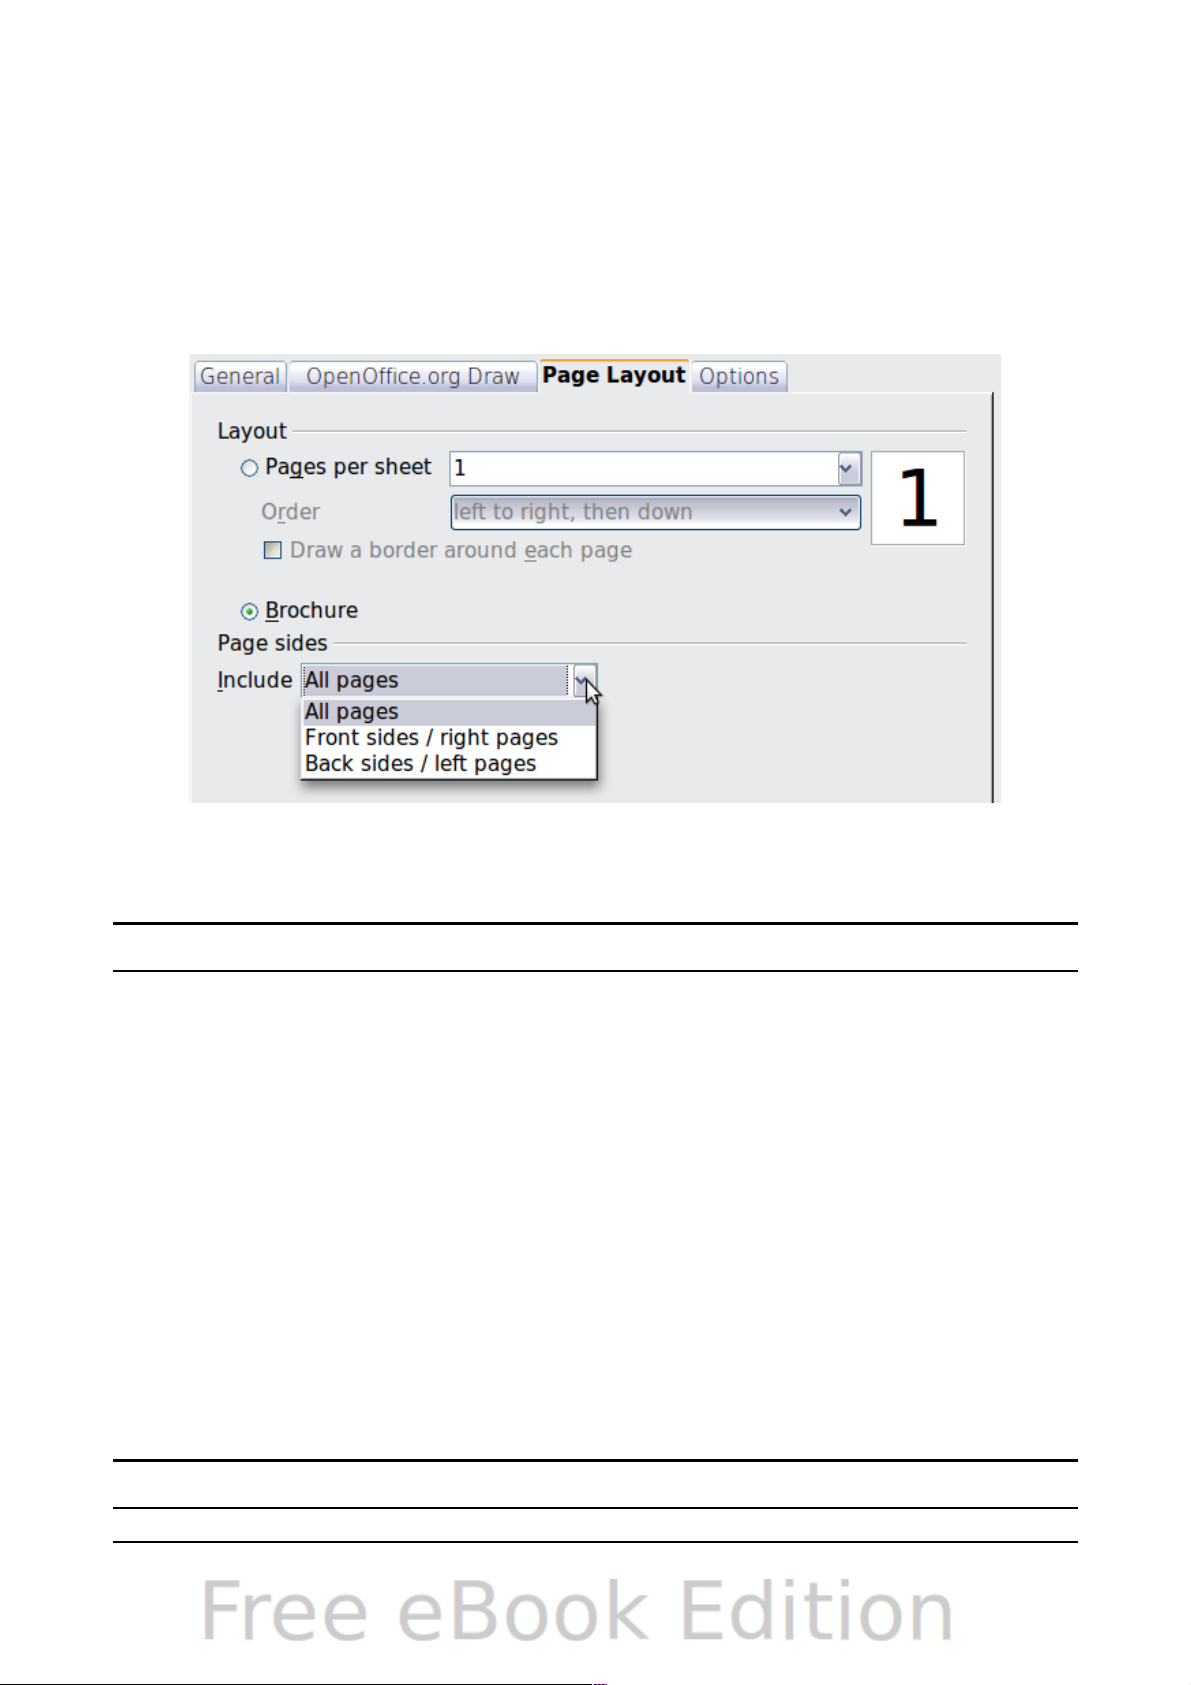
5) Select the Brochure option.
6) In the Page sides section, select Back sides / left pages option from the Include
drop-down list.
7) Click the Print button.
8) Take the printed pages out of the printer, turn the pages over, and put them
back into the printer in the correct orientation to print on the blank side. You
may need to experiment a bit to find out what the correct arrangement is for
your printer.
9) On the Print dialog, in the Page sides section, select Front sides / right pages
option from the Include drop down box.
10) Click the Print button.
Tip
If your printer can print double-sided automatically, choose All pages.
Printing in black and white (on a color printer)
You may wish to print documents in black and white on a color printer. Several
choices are available. Please note that some color printers may print in color
regardless of the settings you choose.
To change the printer settings to print in black and white or grayscale:
1) Choose File > Print to open the Print dialog.
2) Click Properties to open the Properties dialog for the printer. The available
choices vary from one printer to another, but you should find options for the
Color settings. See your printer’s help or user manual for more information.
3) The choices for color might include black and white or grayscale. Choose the
required setting.
4) Click OK to confirm your choice and return to the Print dialog,
5) Click the Print button to print the document.
Tip
Grayscale is best if you have any graphics in the document.
Chapter 1 Introducing Draw 21
Page 22

To change the OpenOffice.org settings to print all color text and graphics as
grayscale:
1) Choose Tools > Options > OpenOffice.org > Print.
2) Select the Convert colors to grayscale option. Click OK to save the change.
3) Open the Print dialog (File > Print).
4) Click the Print button to print the document.
To change the Draw settings to print all color text as black, and all graphics as
grayscale:
1) Choose Tools > Options > OpenOffice.org Draw > Print.
2) Under Contents, select the Print text in black option. Click OK to save the
change.
3) Open the Print dialog (File > Print).
4) Click the Print button to print the document.
Exporting to PDF
OpenOffice.org can export documents to PDF (Portable Document Format). This
industry-standard file format is ideal for sending the file to someone else to view
using Adobe Reader or other PDF viewers.
The process and dialogs are the same for Writer, Calc, Impress, and Draw, with a few
minor differences mentioned in this section.
Quick export to PDF
Click the Export Directly as PDF icon to export the entire document using your
default PDF settings. You are asked to enter the file name and location for the PDF
file, but you do not get a chance to choose a page range, the image compression, or
other options.
Controlling PDF content and quality
For more control over the content and quality of the resulting PDF, use File > Export
as PDF. The PDF Options dialog opens. This dialog has five pages (General, Initial
View, User Interface, Links, and Security). Select the appropriate settings, and then
click Export. In the following dialog, enter the location and file name of the PDF to
be created, and click Save to export the file. See Chapter 10 (Printing, Exporting,
Emailing) in the Getting Started book for details.
Exporting to other formats
OpenOffice.org uses the term “export” for some file operations involving a change of
file type. If you cannot find what you want under File > Save As, look under File >
Export as well.
OpenOffice.org can export files to XHTML. In addition, Draw can export to Adobe
Flash (.swf) and a range of image formats.
22 OpenOffice.org 3.3 Draw Guide
Page 23

To export to one of these formats, choose File > Export. On the Export dialog,
specify a file name for the exported document, then select the required format in the
File format list and click the Export button.
See Chapter 6 (Editing Pictures) for more about exporting graphics.
Note
The content of the exported file will depend on the element(s) selected
on the page. No selection results in the entire image being exported. For
most export formats only the image on the current page will be
exported.
Exporting Draw documents as web pages
To export a multi-page Draw document to a series of web pages, choose File >
Export and select HTML Document as the file type. The HTML Export wizard
opens. Follow the prompts to creat the web pages. If you wish, the wizard can
generate a navigation aid to help in moving from page to page.
E-mailing documents
OpenOffice.org provides several ways to send documents quickly and easily as an email attachment in one of three formats: OpenDocument (OpenOffice.org’s default
format), Microsoft Office formats, or PDF.
Note
Documents can only be sent from the OpenOffice.org menu if a mail
profile has been set up.
To send the current document in OpenDocument format:
1) Choose File > Send > Document as E-mail. OpenOffice.org opens your
default e-mail program. The document is attached.
2) In your e-mail program, enter the recipient, subject, and any text you want to
add, then send the e-mail.
If you choose E-mail as PDF, OpenOffice.org first creates a PDF using your default
PDF settings (as when using the Export Directly as PDF toolbar button) and then
opens your email program with the PDF file attached.
You can email a document to several recipients. For details, see Chapter 10 (Printing,
Exporting, Emailing) in the Getting Started book.
Chapter 1 Introducing Draw 23
Page 24

Chapter 2
Drawing Basic Shapes
Page 25
Creating simple drawings
You can create 2D and 3D objects in Draw. This chapter shows how to draw simple
2D objects. The following chapters describe how to work with and edit such objects.
All shapes, whether they are lines, rectangles, or more complicated shapes, are
called objects. This is common notation in vector drawing software.
The drawing tools are found on the Drawing toolbar. Figures 19 and 32 show parts of
the standard form of the toolbar, as installed with Draw.
As described in Chapter 1 (Introducing Draw), the Drawing toolbar is normally
located at the bottom of the window. If you do not see it, you can activate it from the
View > Toolbars menu. As in all components of OpenOffice.org, you can place the
toolbar on the Draw window wherever you wish, and you can configure toolbars as
you wish by adding, moving, hiding, or deleting toolbar icons.
Custom shapes
Draw 3 offers the ability to create custom shapes. These correspond to autoshapes in
Microsoft Office.
The two types of shapes differ in their properties and are dealt with separately in the
relevant chapter of this guide. The main differences relate to the behavior of 3D
objects and text handling. Beginners can safely ignore both for the present.
Text frames in Draw 3 have their own geometric format.
Drawing basic shapes
Basic shapes include:
• Lines
• Arrows
• Rectangles and squares
• Ellipses and circles
• Curves and polygons
• Connectors
• Lines and arrows
Note
When you draw a basic shape or select one for editing, the Information
field in the status bar changes to reflect the action taken or in progress:
Line created, Text frame xxyy selected, TextEdit: Paragraph 1, Row 1,
Column 8 and so on.
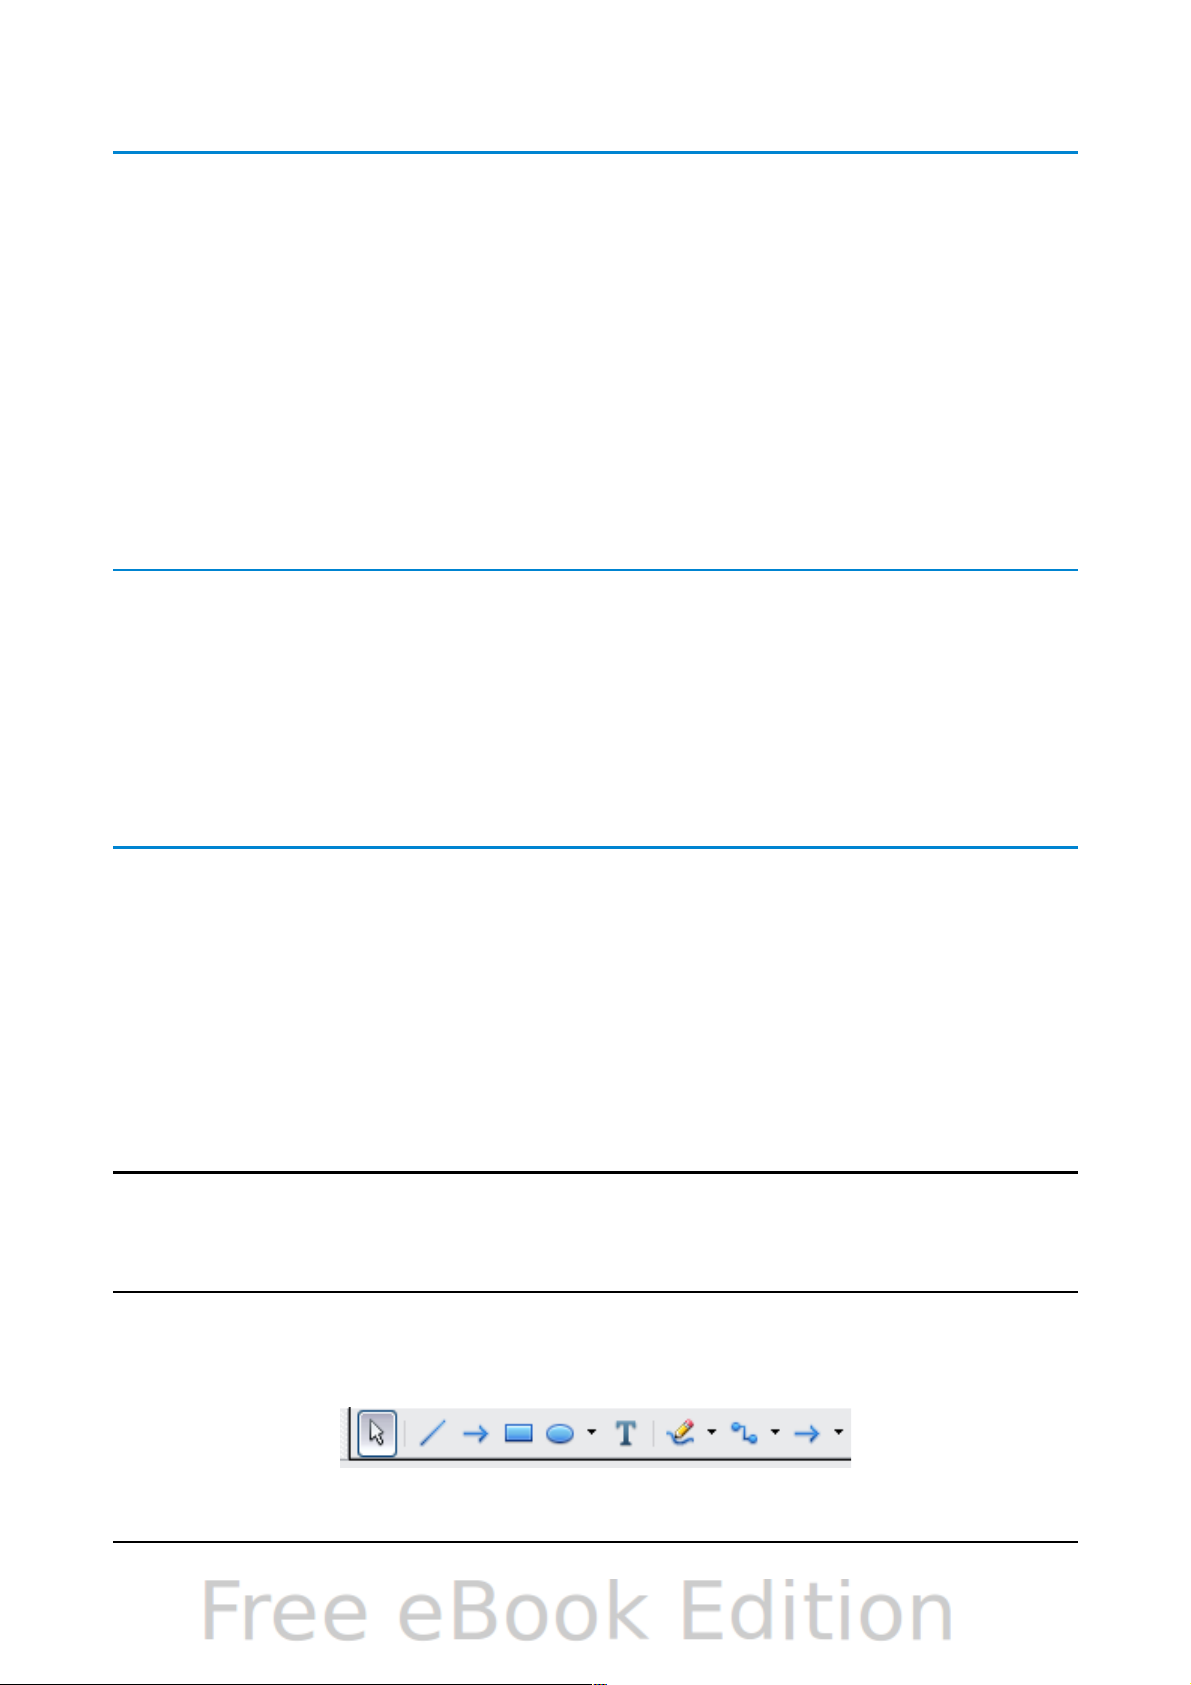
Figure 19 shows part of the Drawing toolbar with the icons needed in the following
sections. The Text icon is also included.
Chapter 2 Drawing Basic Shapes 25
Figure 19: Part of the Drawing toolbar
Page 26
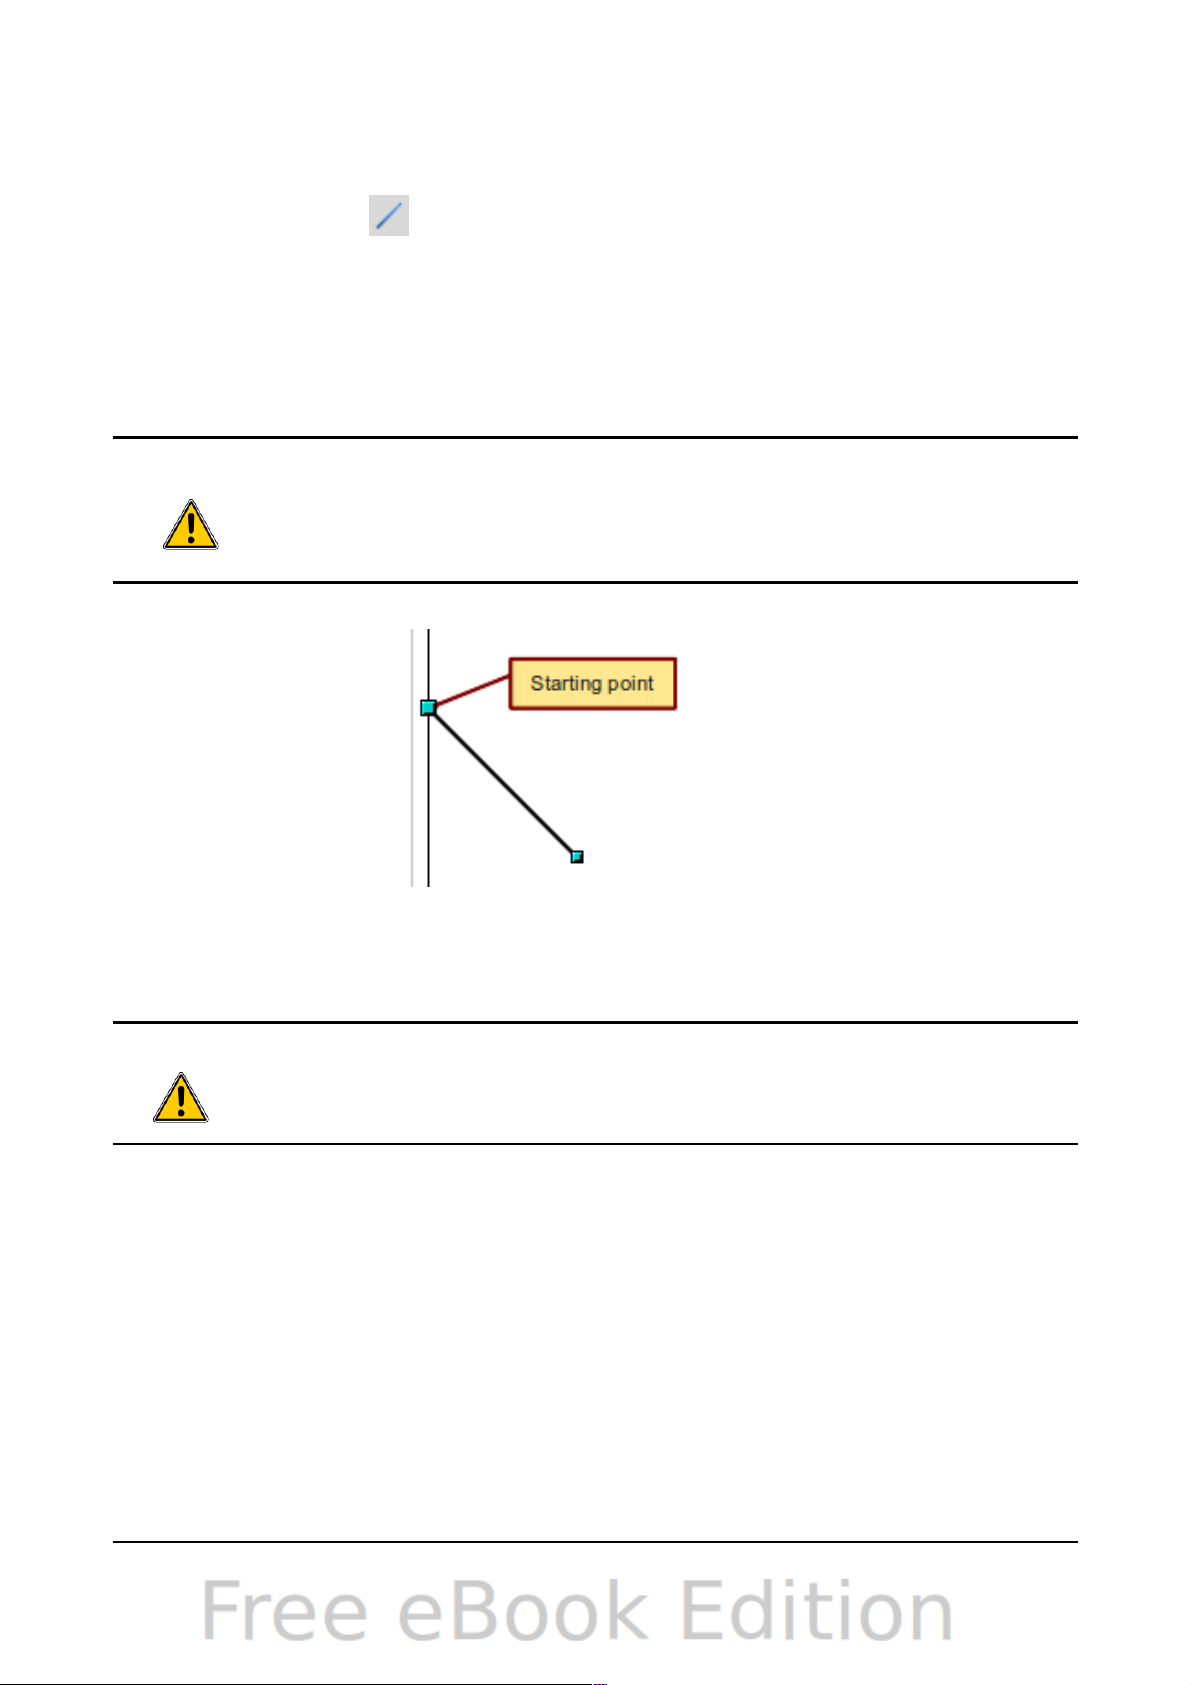
Drawing a straight line
We begin with the drawing of the simplest element—a straight line.
Click on the Line icon on the Drawing toolbar and place the mouse pointer at the
point where you want to start the line (see Figure 20). Drag the mouse while keeping
the mouse button pressed. Release the mouse button at the point where you want to
end the line. A blue selection handle appears at each end of the line, showing that
this is the currently selected object.
Holding down the Shift key while you draw a line restricts the angle of the line to a
multiple of 45 degrees (0, 45, 90, 135, and so on).
Caution
This is the default behavior of the Shift key. However, if you have used
Tools > Options > OpenOffice.org Draw > Grid to set Snap position
to When creating or moving objects, the action of the Shift key is the
opposite: lines will always be at a multiple of 45 degrees unless the
Shift key is pressed.
Keeping the Ctrl key pressed while drawing a line enables the end of the line to snap
to the nearest grid point.
Caution
The effect of the Ctrl key depends on the settings of the Snap to Grid
option on the View->Grid menu:
Snap to Grid on: Ctrl deactivates the snap option for this activity.
Snap to Grid off: Ctrl activates the snap option for this activity.
The spacing (resolution) of the grid points can be adjusted under Tools > Options >
OpenOffice.org-Draw > Grid. See also Chapter 8 (Tips and Tricks).
Holding down the Alt key while drawing a line results in the line extending outwards
symmetrically in both directions from the start point. This lets you draw lines by
starting from the middle of the line.
The line just drawn has all the standard line attributes, such as color and line style.
To change any of these properties, select the line by clicking on it, then right-click
and select Line.
While you are working with a line (or any other element), you can use the information
field on the status bar to monitor the activity. A description of the current activity or
selection is shown when you are working with elements. Figure 21 shows two
examples.
26 OpenOffice.org 3.3 Draw Guide
Figure 20: Drawing a straight line
Page 27
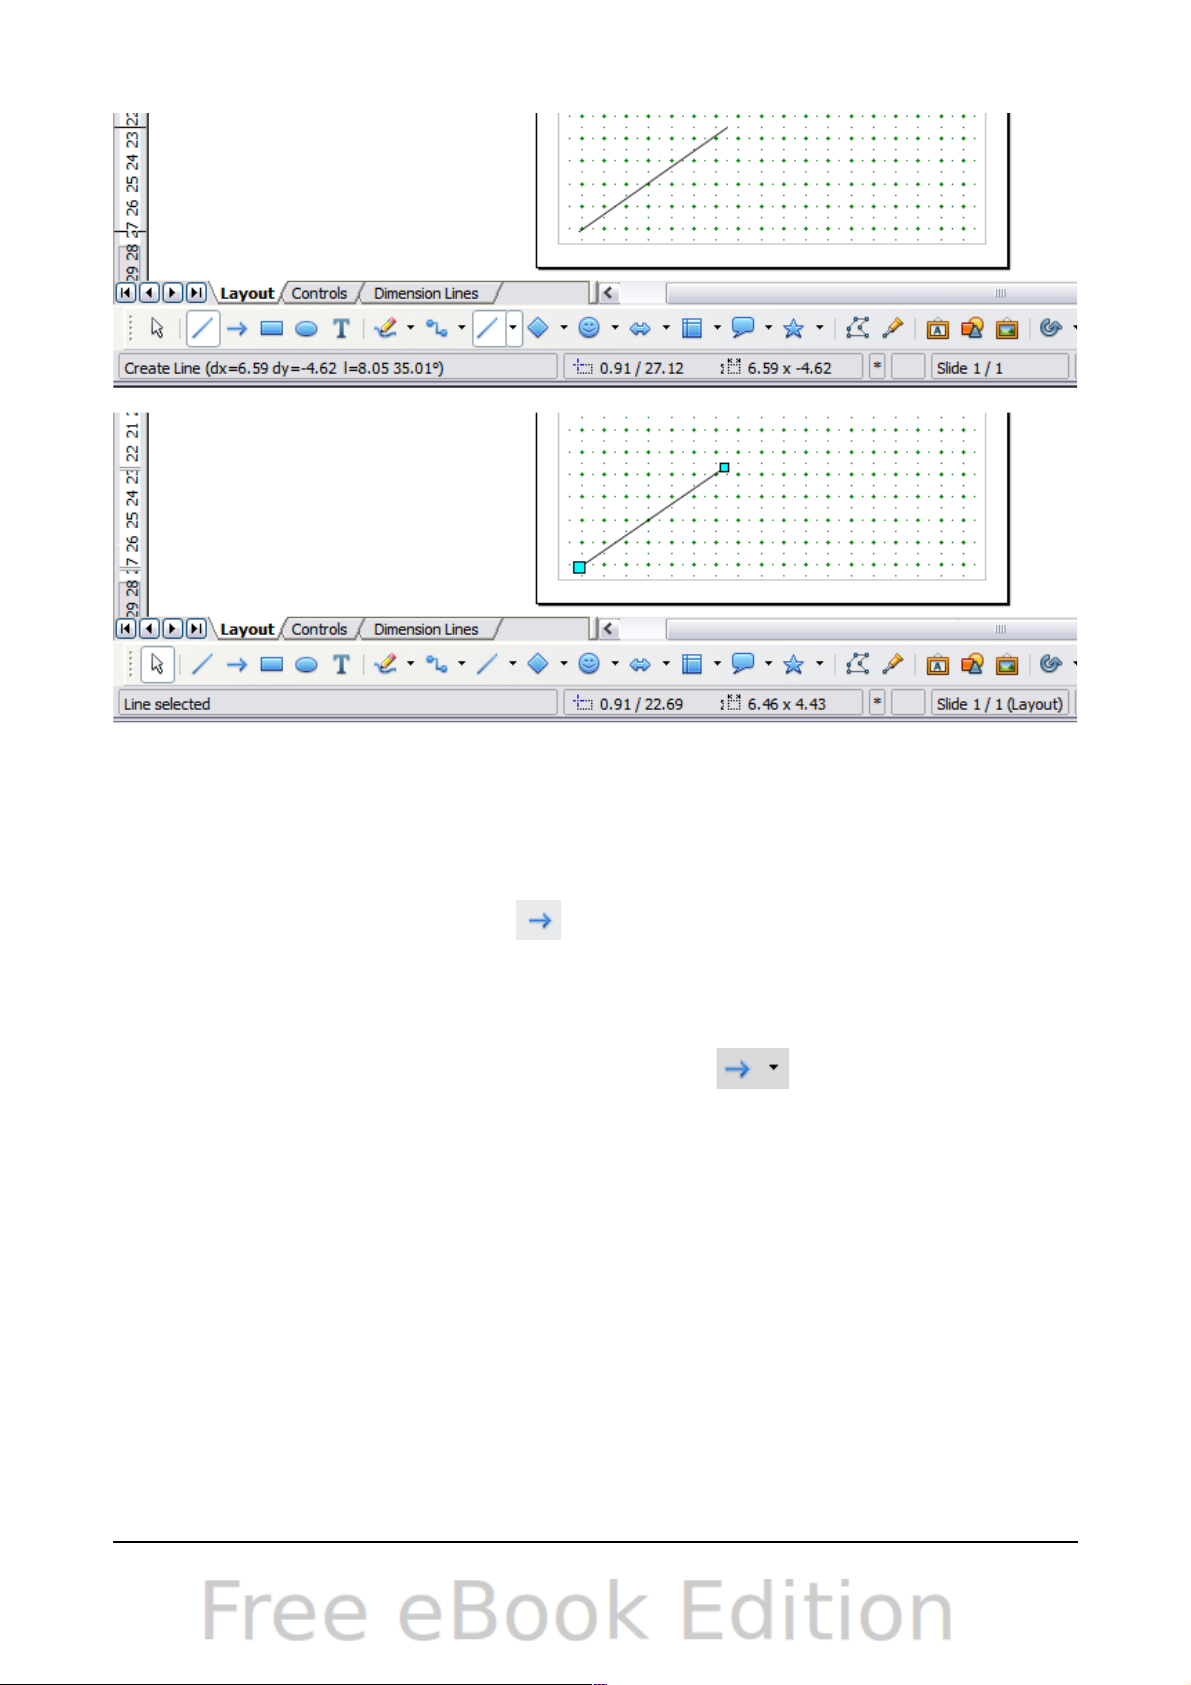
Figure 21: The information area in the status bar
Drawing an arrow
Arrows are drawn like lines. Draw classifies arrows as a subgroup of lines: lines with
arrowheads. The information field on the status bar shows them only as lines. Click
on the Line Ends with Arrow icon to draw an arrow.
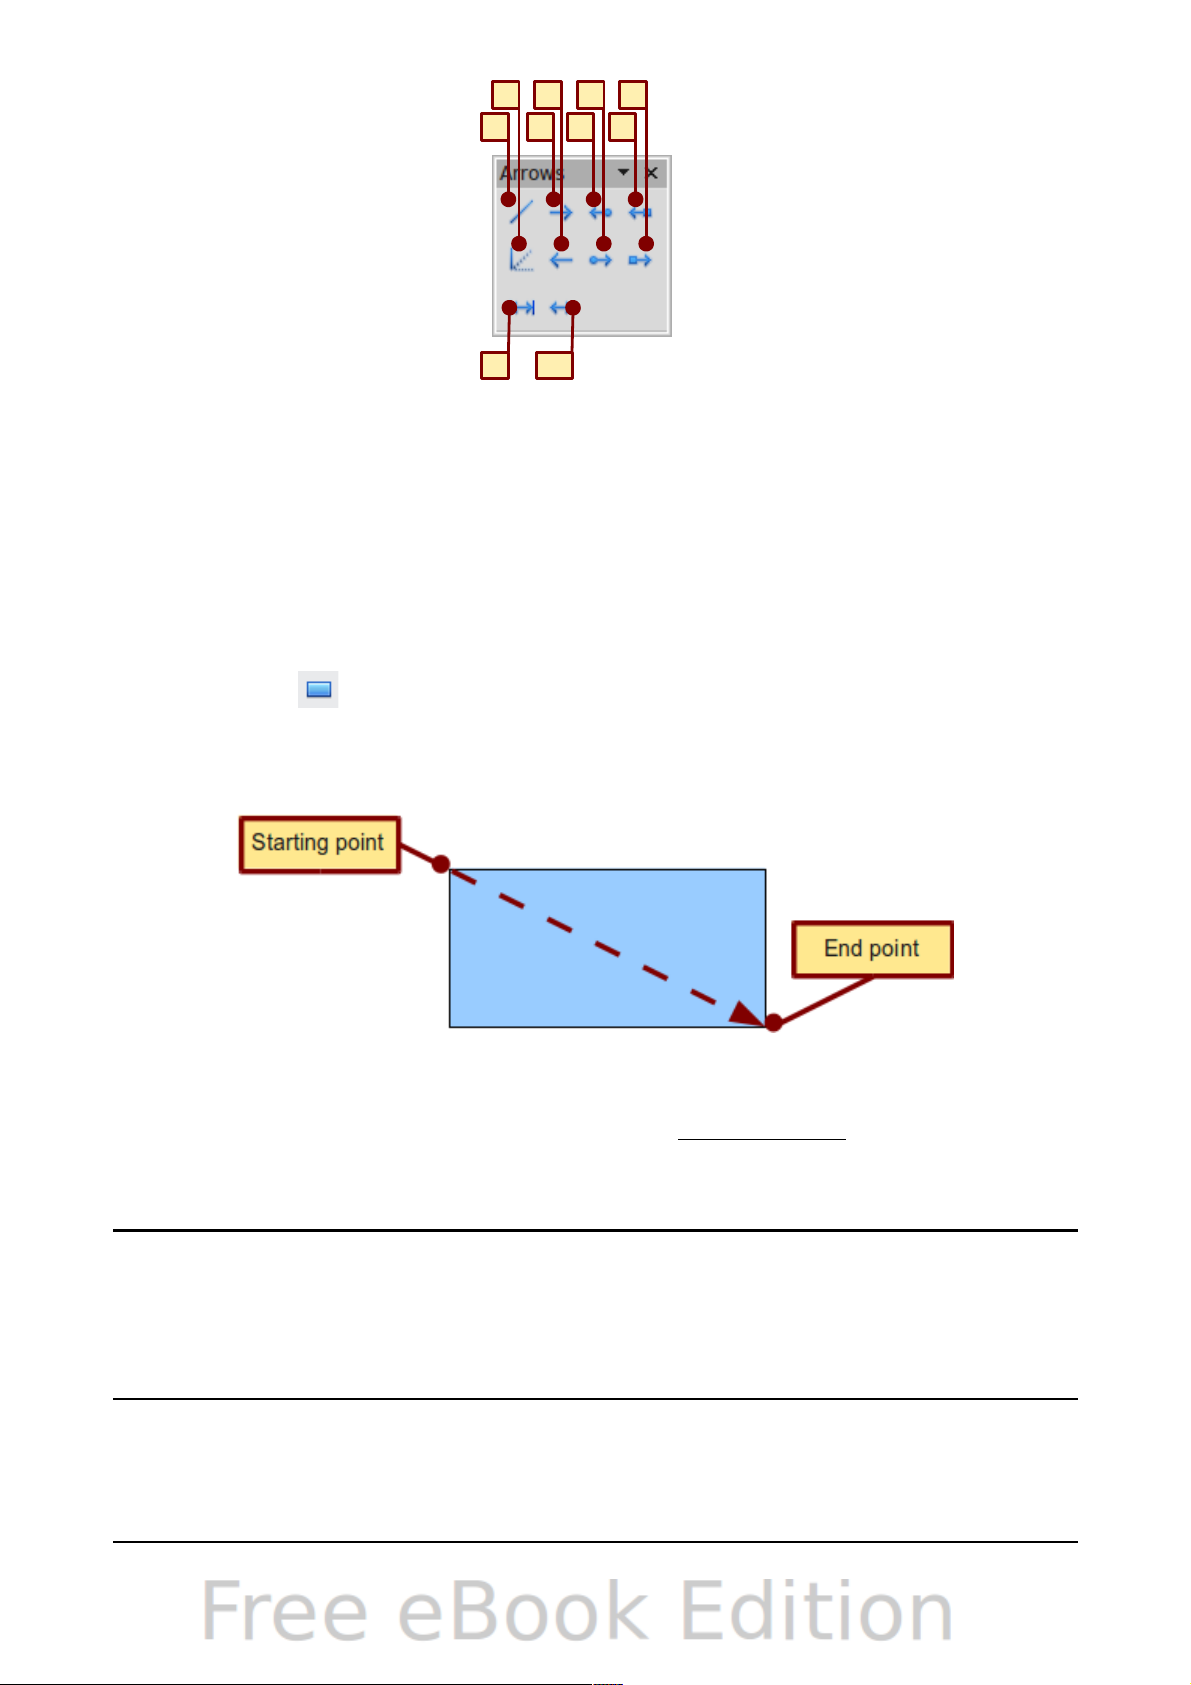
Drawing lines and arrows
If you added the lines and arrows toolbar to the main Drawing toolbar you can click
on the small black triangle on the Lines and Arrows icon on the Drawing
toolbar to open a toolbar with ten tools for drawing lines and arrows (Figure 22).
(Alternatively View > Toolbars > Arrows opens the toolbar as a floating toolbar.) In
both cases, the last-used command will be stored on the toolbar to make it quicker to
call it up again: click directly on the symbol to repeat the last used command chosen
from this toolbar.
After drawing the line, you can change the arrow style by clicking on the Arrow
button in the Line and Filling toolbar and choose from 13 arrow start and end
options.
Chapter 2 Drawing Basic Shapes 27
Page 28
Drawing a rectangle or square
Drawing a rectangle is similar to drawing a straight line, except that you click on the
Rectangle icon on the Drawing toolbar, and the (imaginary) line drawn by the
mouse corresponds to a diagonal of the rectangle. In addition, the outline of the
future rectangle changes shape as you drag the mouse around. The outline may be
shown as a dashed line until you release the mouse button.
Draw considers squares to be rectangles with sides of equal length. Hold down the
Shift key to draw a square. Hold down the Alt key while dragging with the mouse to
create a rectangle with its center (rather than a corner) at the start point (where you
first clicked the mouse).
Note
Blue or green selection handles appear around an object made up of
more than 2 points, showing that this is the currently selected object.
The colors depend on the standard selection mode—green with a normal
selection or blue if you are in the point edit mode. This effect is easily
seen if both Simple Handles and Large Handles are switched on in
the Options toolbar. See Chapter 3 for more details on points.
28 OpenOffice.org 3.3 Draw Guide
1
2 3 4
5 6 7 8
9 10
1 Line 5 Line (45°) 8 Line with square/arrow
2 Line Ends with Arrow 6 Line starts with arrow 9 Dimension line
3 Line with arrow/circle 7 Line with circle/arrow 10 Line with arrows
4 Line with arrow/square
Figure 22: Arrows toolbar
Figure 23: Drawing a rectangle
Page 29
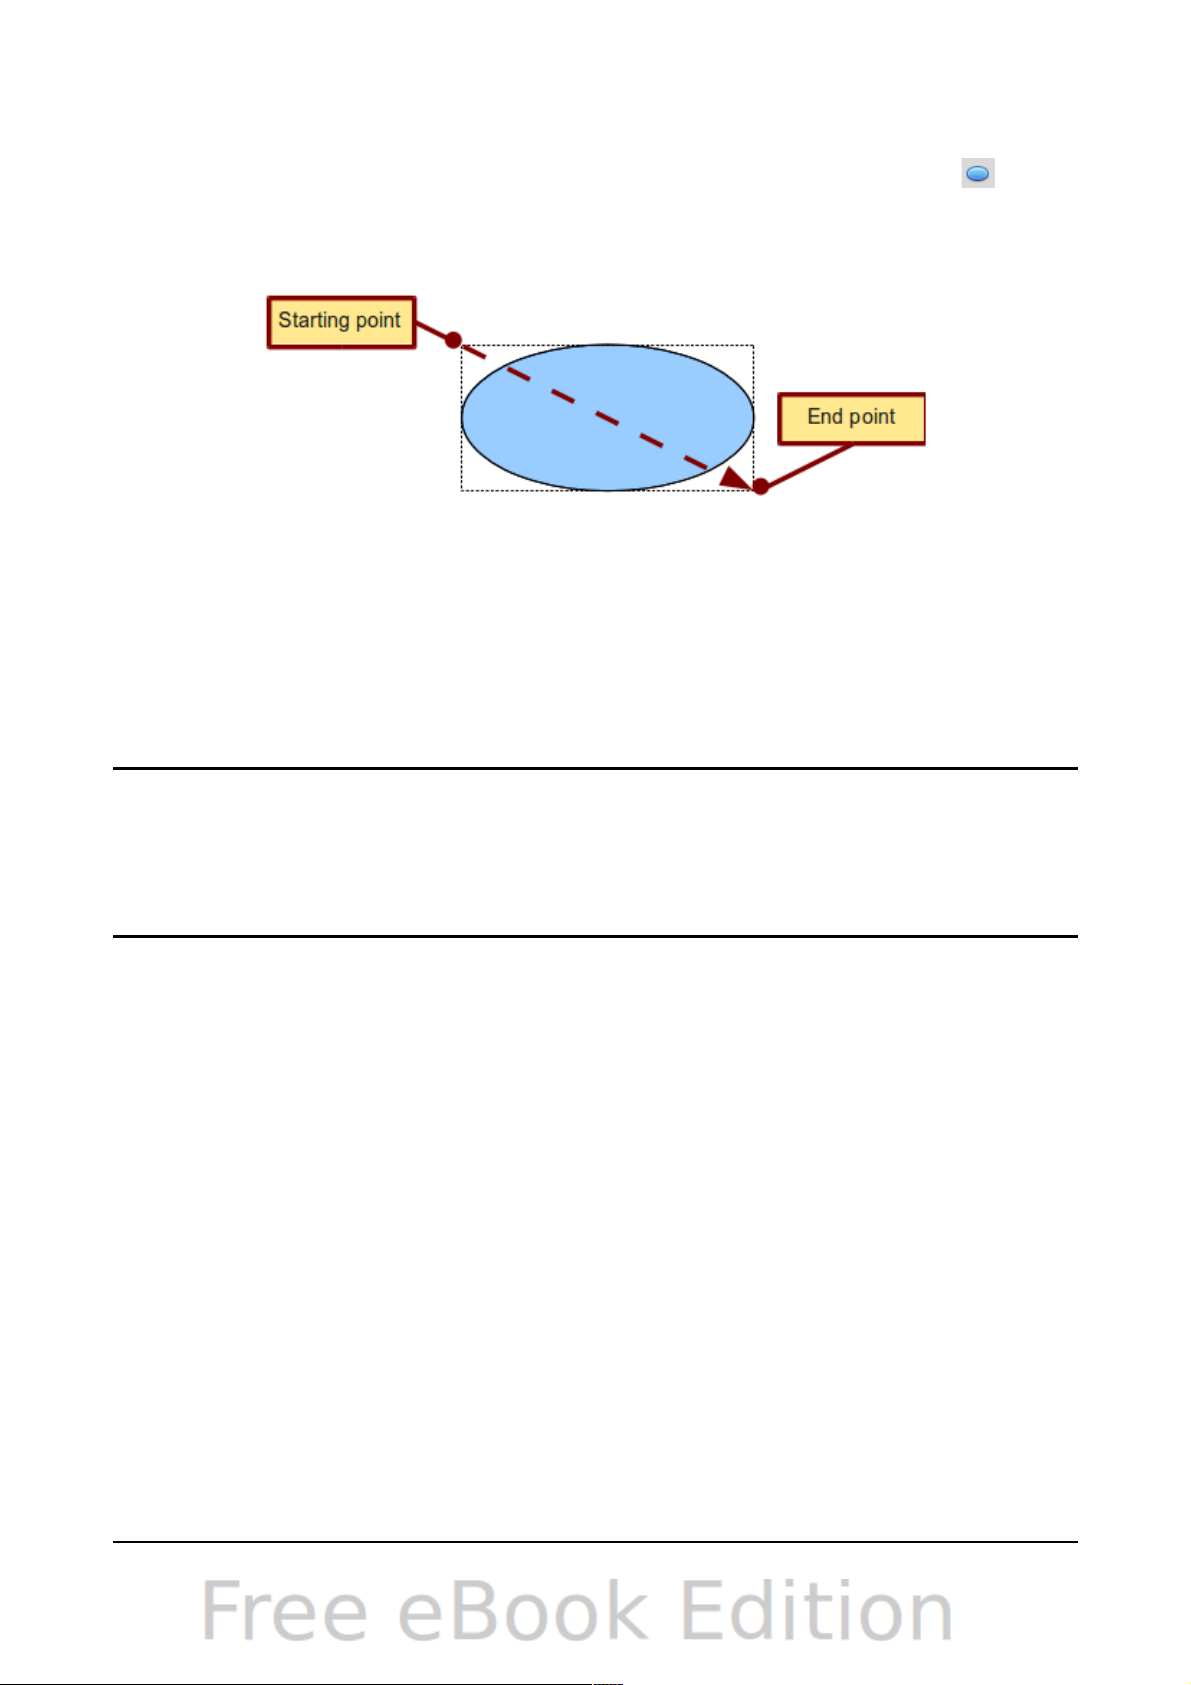
Drawing ellipses (ovals) and circles
To draw an ellipse (also called an oval) or a circle, click on the Ellipse icon on the
main Drawing toolbar. (A circle is simply an ellipse with both axes the same length.)
The ellipse drawn is the largest ellipse that fits within the (imaginary) rectangle
drawn by the mouse (Figure 24).
There are three ways to draw an ellipse or a circle:
• Holding down the Shift key while dragging with the mouse draws a circle.
• Holding down the Alt key (together with the Shift key) draws a symmetrical
ellipse (a circle) with the starting point at the center.
• Holding down the Ctrl key while dragging with the mouse draws an ellipse or
circle that snaps to the nearest grid points.
Note
If you first press and hold the Ctrl key down and then click on one of the
icons for Line, Rectangle, Ellipse or Text, a standard sized object is
drawn automatically in the work area: the size, shape, and color are all
standard values. These attributes can be changed later, if desired. This
only works if the icon has no associated toolbar—no arrow on the right
side of the icon.
Adding ellipse and arc tools to the Drawing toolbar
In previous versions of Draw, a long-click on the ellipse button opened a new toolbar
that contained tools for drawing elliptical and circular arcs. This function is not
directly available in Version 3.3.
If you really need this tool, you can add an Ellipse toolbar to the Drawing toolbar:
1) Click on the arrow on the right-hand end of the Drawing toolbar and select
Customize Toolbar.
2) On the Toolbars page of the Customize dialog, select Drawing in the Toolbar
field and click Add.
3) In the Add Commands dialog (Figure 25), select Drawing in the Category list,
select the first Ellipse command in the Commands list, click Add, and then
click Close.
Chapter 2 Drawing Basic Shapes 29
Figure 24: Drawing an ellipse
Page 30
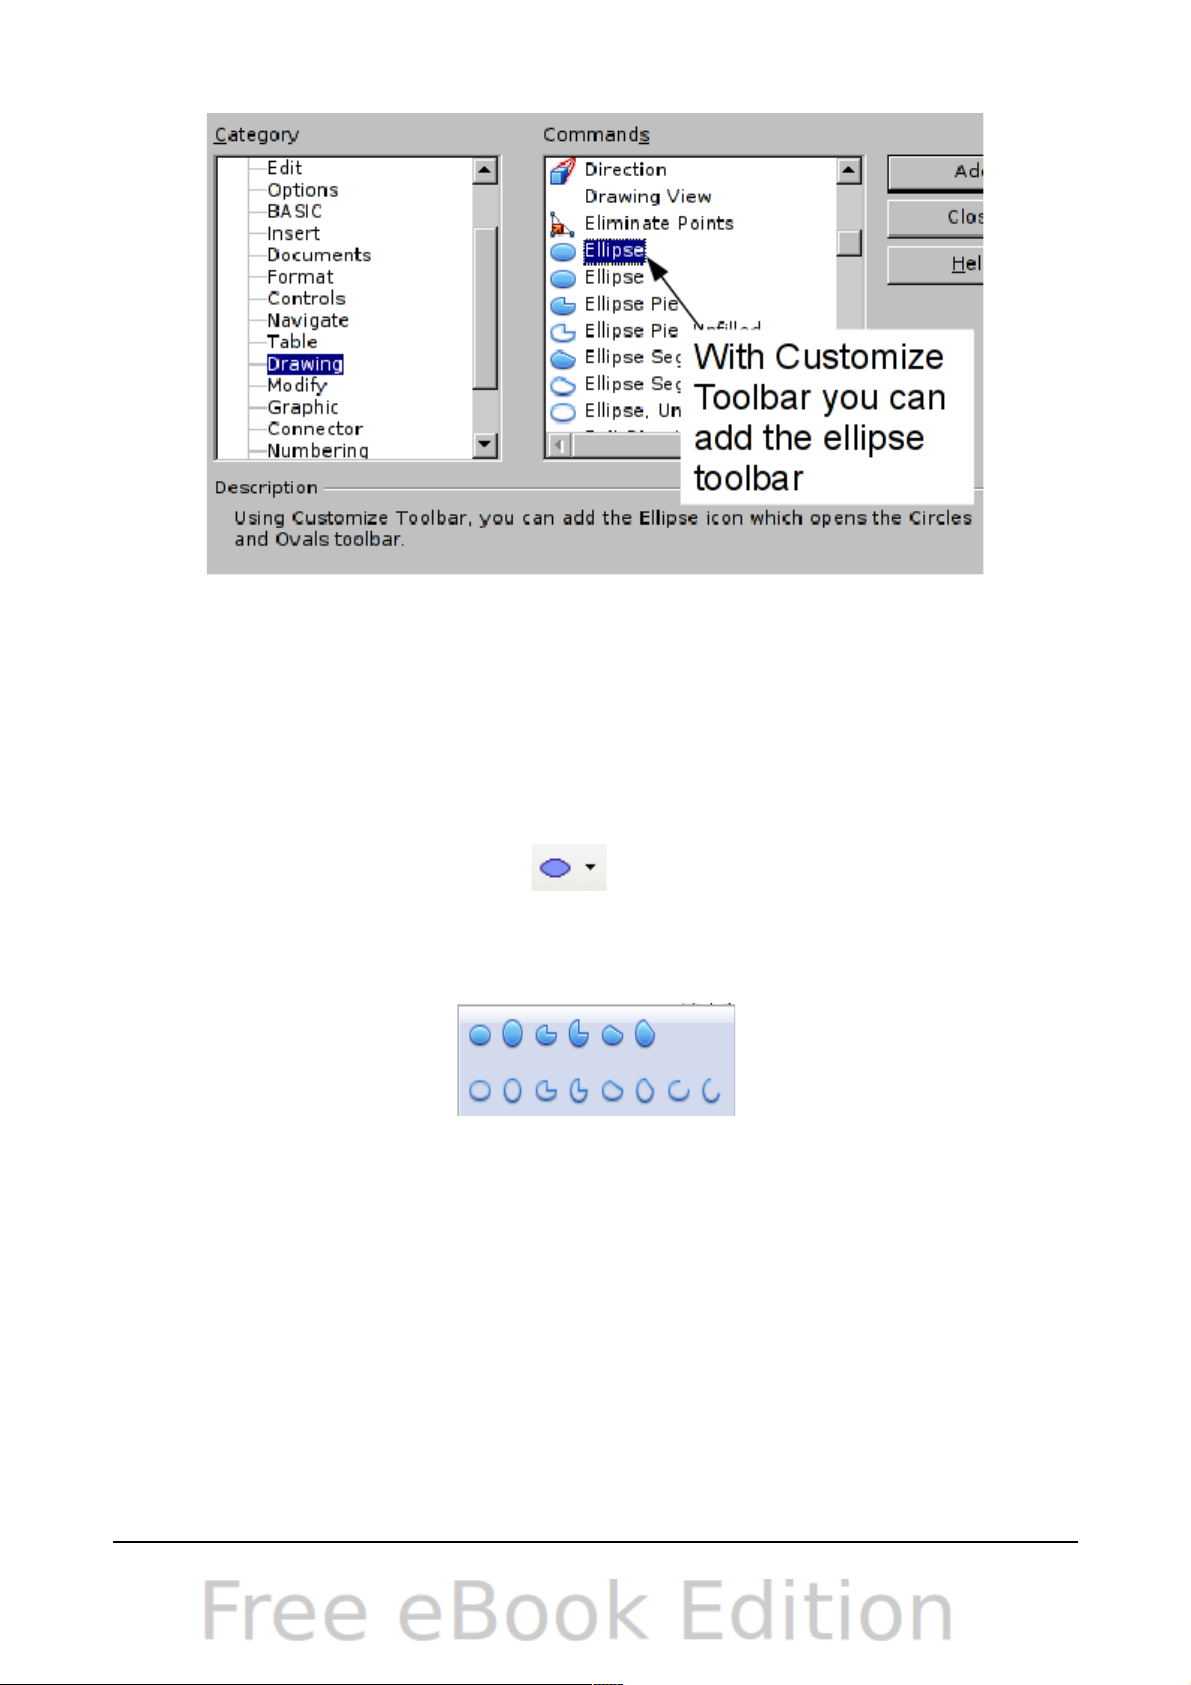
Figure 25: Adding the extended Ellipse toolbar
4) On the Customize dialog, ensure that the checkbox by the new Ellipse
command is selected, and then use the up and down arrow buttons to move it
to the desired position on the toolbar.
5) To remove the simple Ellipse icon from the Drawing toolbar, click to highlight
it in the Customize dialog, and press the Delete key (or click the Modify
button and choose Delete from the drop-down menu).
6) Click OK to complete the process.
You should now see this Ellipse icon on the Drawing toolbar. If you use this
icon instead of the standard Ellipse icon, all the extended ellipse functions are
available. Clicking on the black arrow by the icon opens the floating Circles and
Ovals toolbar (Figure 26).
30 OpenOffice.org 3.3 Draw Guide
Figure 26: Circles and Ovals toolbar
Page 31

Drawing elliptical and circular arcs
To draw an arc, choose the appropriate Arc symbol in the Circles
and Ovals toolbar. Drag with the mouse to create a guide circle or
ellipse.
Release the mouse button and move the cursor to the position where
you want the arc to start. In the status bar, you can measure the
actual angle in degrees. Single-click this point; the circle (or ellipse)
disappears and moving the mouse creates the arc. Again, the status
bar shows the current angle.
When you have drawn the arc to the length you want, click once
more. The drawing of the arc is complete.
Curves
The tools for drawing curves or polygons are on the toolbar that appears when you
click the Curve icon on the Drawing toolbar. This toolbar contains eight tools
(Figure 27).
Note
Hovering the mouse pointer over this icon gives a tooltip of Curve. If you
convert the icon to a floating toolbar, however, the title is Lines, as
shown in Figure 27.
If you move the mouse cursor over one of the icons, a tooltip pops up with a
description of the function. For a more detailed description of the handling of Bézier
curves (curves and filled curves), see Chapter 10 (Advanced Draw Techniques).
• Polygons: Draw the first line from the start point with the left mouse button
held down. As soon as you release the mouse button, a first corner point is
drawn; move the mouse to see how subsequent lines will look. Every mouse
click sets another corner point. A double-click ends the drawing. A filled
polygon automatically joins the last point to the first point to close off the
figure and fills it with the current standard fill color. A polygon without filling
will not be closed at the end of the drawing.
• Polygon 45
0
: Like ordinary polygons, these are formed from lines but with
angles of only 45 or 90 degrees between them.
Chapter 2 Drawing Basic Shapes 31
Freeform Line, Filled
Polygon, Filled
Curve, Filled
Freeform Line
Polygon (45°), Filled
Polygon (45°)Polygon
Curve
Figure 27: Curves toolbar (incorrectly titled “Lines”)
Page 32

• Freeform Line: With this tool you can draw just like with a pencil. Press and
hold the left mouse button and drag the mouse. It is not necessary to end the
drawing with a double-click. Just release the mouse button and the drawing is
completed. If you have selected Freeform Line, Filled, the end point is joined
automatically to the start point and the object is filled with the appropriate
color.
Gluepoints and connectors (basics)
Gluepoints
All Draw objects have associated invisible gluepoints, which become visible when you
choose any of the connectors under the Connectors icon on the Drawing
toolbar and then move the mouse pointer over the object.
Most objects have four gluepoints, as shown in Figure 28. You can add more
gluepoints, and customize gluepoints, using the toolbar of the same name (Figure
29).
Gluepoints are not the same as the little blue or green “handles” of an object. The
handles are for moving or changing the shape of an object, as described in Chapter 3
(Working with Objects and Object Points), but the gluepoints are used to “glue” a
connector to an object.
For a more detailed description of the use of gluepoints, see Chapter 9 (Organization
Charts, Flow Diagrams, and More).
Connectors
Connectors are lines or arrows whose ends automatically dock to a gluepoint of an
object. Connectors are especially useful in drawing organization charts, flow
diagrams, and mind-maps. Even when objects are moved or reordered, the
connectors remain attached.
Figure 30 shows two Draw objects and a connector.
32 OpenOffice.org 3.3 Draw Guide
Figure 28: Four gluepoints
Figure 29: Gluepoints toolbar
Page 33

Figure 30: A connector between two objects
Draw offers a range of different connectors and connector functions. Open the
floating Connectors toolbar by clicking on the arrow next to the Connector icon
(Figure 31).
For a more detailed description of the use of connectors, see Chapter 9 (Organization
Charts, Flow Diagrams, and More).
Drawing geometric shapes
Geometric shapes include:
• Basic shapes
• Symbol shapes
• Block arrows
• Flowcharts
• Callouts
• Stars
Chapter 2 Drawing Basic Shapes 33
Line Connector Ends with Arrow
Connector
Connector Ends with Arrow
Connector with Arrows
Line Connector
Straight Connector
Straight Connector Ends with Arrow
Straight Connector with Arrows
Curved Connector with Arrows
Curved Connector
Curved Connector Ends with Arrow
Line Connector with Arrows
Figure 31: The Connectors toolbar
Page 34

Note
If you select shapes for editing, the information field in the toolbar
shows the type of shape selected and, if more than one object is
selected, the total number.
Figure 32 shows part of the Drawing toolbar with the icons referred to in the
following sections. Clicking on the arrow next to the icon opens a floating toolbar
with the relevant work tools.
Tip
The use of all these tools is similar to that of the Rectangle tool, even
though they produce different geometric shapes.
Basic shapes
The Basic Shapes icon makes available a range
of tools for drawing basic shapes, including a rectangle
tool identical to the one on the main toolbar.
The only differences you will see are in the information
field in the status bar (in this case “Shape selected”
rather than “Rectangle selected”).
Symbol shapes
The Symbol Shapes icon gives you an array of
tools for drawing various symbols.
Block arrows
The Block Arrows icon opens the Block Arrows
toolbar.
34 OpenOffice.org 3.3 Draw Guide
Figure 32: Part of the main Drawing toolbar
Page 35

Flowcharts
The tools for drawing flowcharts are accessed by
clicking on the Flowcharts icon .
The creation of flowcharts, organization charts, and
similar planning tools are described in Chapter 9
(Organization Charts, Flow Diagrams, and More).
Callouts
Use the Callouts icon , to open the Callouts
toolbar.
Stars and banners
These tools are associated with the Stars icon .
You can add text to all these shapes. See “Using text elements in Draw objects” on
page 37.
Adding text to objects
Draw offers two ways to add text to a drawing: in a dynamic text frame as an
independent Draw object or as text contained within a previously drawn object. In the
latter case, the text is integrated with the object.
Using dynamic text frames
The text tool is activated by clicking on the Text icon for horizontal text or the
Vertical Text icon for vertical script (to be able see the icon and use this latter
option, you must check Enabled for Asian languages under Tools > Options >
Chapter 2 Drawing Basic Shapes 35
Page 36

Language Settings > Languages). If you still do not see the Vertical Text icon,
enable it on the Drawing toolbar by clicking the arrow on the right hand side of the
toolbar, select Visible Buttons, and click on Vertical Text to make this icon show on
the toolbar.
Text frames can be moved and rotated like all draw objects. For more details on text
input, see Chapter 10 (Advanced Draw Techniques).
After activating Text command mode, click at the location where you want to position
the text. A small text frame appears. It contains only the cursor. You can move the
frame, if desired. The Text Formatting toolbar appears (Figure 33), and you can
choose the font type, font size, and other text properties and begin to type in your
text.
The text frame grows with the text. You can insert a line break with the Shift+Enter
key combination. The Enter key begins a new paragraph. Neither line breaks nor new
paragraphs terminate the text frame.
Observe the information field in the status bar: it shows that you are editing text and
also provides details about the current cursor location—paragraph, line, and column
numbers.
Text properties can also be changed during text input. Any changes will be reflected
from the cursor position onwards (Figure 35).
After choosing the Text icon, you can also draw a frame with the mouse to contain
future text. You can move the frame only after typing some text in it. Line breaks are
inserted automatically at the right edge of the frame when the text fills the frame
36 OpenOffice.org 3.3 Draw Guide
Text input – properties
changed
Figure 33: Text Formatting toolbar
Figure 34: Text input in a dynamic text frame
Figure 35: Changing text properties
Page 37

width (Figure 36). You can, however,—just as when editing any other text—insert
your own line breaks, begin new paragraphs, or change any of the text properties.
Using text elements in Draw objects
A text element is associated with most Draw objects. By means of these elements,
text can be added to an object (see Figure 37).
The exceptions to this are control elements like buttons or list boxes, as well as 3D
scenes and their associated elements and groups.
If the Double-click to edit Text icon on the Options toolbar is active, you can
start editing an object by double-clicking on it (or by pressing F2). In the middle of
the Draw object, a black bar indicates the text cursor; start typing to input text. The
status bar shows “Text Edit” at the lower left and the position of the cursor within the
text.
Text can contain paragraphs, and these can be in the form of bulleted or numbered
lists. To begin a new line without beginning a new paragraph, use the key
combination Shift+Enter (as in text documents). To end the text input, click next to
the object or press the Esc key.
Figure 37: Adding text to objects
Chapter 2 Drawing Basic Shapes 37
Text input
in a fixed frame –
the text wraps
automatically
Figure 36: Text frame
Page 38

Chapter 3
Working with Objects
and Object Points
Page 39

Introduction
This chapter looks at the tools and functions that let you modify existing drawings. All
of the functions apply to a selected object or group of objects, which can be
distinguished by small colored squares or circles located around it. These points are
called handles.
The handles form a rectangular frame that is just big enough to contain the object.
Where several objects are selected, the frame around them corresponds to the
smallest rectangle that can contain all of the objects. This frame is called the
selection rectangle.
If the Options toolbar is displayed (select View > Toolbars > Options to turn it on,
if it is not displayed), you can change the size of the handles using two buttons:
Simple Handles shows the handles as flat squares; otherwise they are shown in 3D.
Large Handles increases the size of the handles. You can combine the two effects.
The figure below shows the location of the handles and other buttons.
Selection modes
There are three selection modes:
1) Moving and changing size
2) Editing
3) Rotating points
To set the default mode (1 or 2) for selecting objects, click on the Points button
on the Drawing toolbar.
In standard mode (when you begin a new drawing), the Points
button is not active, and the default mode is for selections to be
moved or changed in size; these selections are indicated by
small green squares.
When the Points button is active, the default mode is for
selections to be edited; these selections are indicated by blue
squares. Some objects will have one or more extra handles,
which are larger or colored differently. This is explained in more
detail in “Editing object points” on page 48.
Chapter 3 Working with Objects and Object Points 39
Figure 38: Location of handles on the Options toolbar
Page 40

Selections for rotating objects are indicated by small red circles
and a symbol representing the center of rotation. To choose
these selections, click on the Effects drop-down button
from the Drawing toolbar and after that on the object.
Changing the selection mode
To go from one mode to another, you can do one of the following:
• Choose the Points button from the Drawing toolbar to switch from simple
selection mode to Points mode. You can also use the keyboard shortcut F8
(Points). See “Editing object points” on page 48 for details on using Points
mode.
• Choose the Effects drop-down button from the Drawing Toolbar to
activate the Rotation mode for a selected object. To exit Rotation mode, click
on the Selection icon .
• If you often work in Rotation mode, you can choose the Rotation Mode after
Clicking Object button from the Options bar and cycle through normal
and rotation modes just by clicking on the object. This can be more convenient
than repeatedly clicking the selected object, then clicking the Rotate button
from the Drawing toolbar.
Selecting objects
Direct selection
The easiest way to select an object is to click directly on it. For objects that are not
filled, click on the object’s outline to select it. One click selects; a second click
deselects. To select or deselect more than one object, hold the shift button down
while clicking.
Selection by framing
You can also select several objects at once by using the mouse to
drag a large rectangle around the objects with the Select button,
as shown. For this to work, the icon on the Drawing toolbar
must be active.
Only objects that lie entirely within the rectangle will be selected.
Selecting hidden objects
Even if objects are located behind others and not visible, they can still be selected.
Hold down the Alt key and click where the object is located. If there are several
overlapping objects, hold down the Alt key and click until you reach the object you
want. To cycle through the objects in reverse order, hold down the Alt+Shift keys and
40 OpenOffice.org 3.3 Draw Guide
Page 41

click. The number and type of the selected objects is shown at the left of the status
bar to help you to select the correct object.
Note
This method generally works in Windows, but on a Linux system it usually
does not. If the Alt key on your system does not operate as described
above, use the Tab key method described below.
To select an object that is covered by another object using the keyboard, use the Tab
key to cycle through the objects, stopping at the object you wish to select. To cycle
through the objects in reverse order, press Shift+Tab. This is a very quick way to
reach the object you want, but it may not be practical if you have a large number of
objects in your drawing.
When you click on the selected object, its outline will appear briefly through the
objects covering it.
In the illustration to the right, the square located beneath the
circle was selected in this way (the circle has been made
semi-transparent in order to show the square).
Arranging objects
In a complex drawing, several objects may be stacked on top of one another. To
rearrange the stacking order (move an object to the front or to the back of the stack),
select the object, click Modify > Arrange and choose Bring Forward or Send
Backward. Or right-click the object, choose Arrange from the context menu, then
choose Bring Forward or Send Backward.
These options are also available from the Arrange tear-off toolbar accessible from the
icon on the Drawing toolbar. A keyboard shortcut is Shift+Ctrl+plus sign to
bring an object to the top, and Shift+Ctrl+minus sign to send an object to the
bottom.
Note, however, that an object located on the Controls layer always lies above all other
objects.
Moving and dynamically adjusting an object’s size
There are several ways of moving or changing the size of an object. The dynamic
method described here uses the mouse.
When you dynamically change an object, remember to check the left-hand area of the
status bar at the bottom of the Draw window. This area shows detailed information
about the ongoing manipulation
Chapter 3 Working with Objects and Object Points 41
Page 42

Figure 39: Left end of status bar during dynamic adjustment
For example, when you are resizing an object, the object information fields show
which object is selected, the current position in X/Y coordinates, and object
dimensions (width x height). The information changes as the mouse is moved. The
units of measurement are those selected under Tools > Options > OpenOffice.org
Draw > General.
Dynamic movement of objects
To move an object, select it and then click within the object’s
border and hold down the left mouse button while dragging the
mouse. During movement, the shape of the object appears as
dotted lines to help with repositioning.
To drop the object at its new location, release the mouse button. The new position
appears immediately in the Status Bar.
Dynamic size modification of objects
To change the size of a selected object (or a group of selected
objects) with the mouse, move one of the handles located around
the selection. As shown in the illustration, the outline of the
resulting new object appears as a dotted line while the mouse
button is pressed.
The results depend on which handle you use. To resize an object
along one axis, use the appropriate side handle. To resize along
both axes, use a corner handle. The new size appears immediately in the status bar.
Note
If you press the Shift key while resizing an object, the change in size will
be carried out symmetrically with respect to the two axes, so that the
aspect ratio of the object remains the same.
42 OpenOffice.org 3.3 Draw Guide
Page 43

Caution
This is the default behavior of the Shift key. However, if you have used
Tools > Options > OpenOffice.org Draw > Grid to set Snap position
to When creating or moving objects, the action of the Shift key is the
opposite: the aspect ratio will be preserved unless the Shift key is
pressed.
Dynamic size modification of objects with the help of the status bar
If you select an object and modify it using the mouse, the changes are immediately
reflected in the information field of the status bar. With geometric shapes (such as
basic shapes, symbol shapes, block arrows), the only information shown in the status
bar is that the shape is being resized, as shown in the top-left image in Figure 40.
With geometric elements (rectangles, circles, and so on), the changes to the
attributes of the element (either relative or absolute) are also shown, as in the topright image in Figure 40.
In the case of a rectangle, the new size is shown as percentages of the original x and
y dimensions. For a line, much more information is given: the absolute change in x
and y coordinates of the end point being moved, together with the current length and
bearing of the modified line. These are updated dynamically as the end point is
moved (see Figure 40).
This is the only place where the exact start and end angles of an arc or the length
and bearing of a sloping line are shown. This information enables you to size the
object with considerable accuracy.
Modifying an arc
The beginning and end points of an arc can be modified. Select the arc and click on
the Points icon on the Drawing toolbar to enter the Edit points mode (described
later in this chapter). In this mode, the handles on the selection frame change—two
larger blue handles appear at the beginning and end points of the arc. When the
mouse hovers over one of these points the cursor will change to a hand.
Chapter 3 Working with Objects and Object Points 43
Figure 40: The Information field during dynamic size modification of objects
Page 44

Figure 41: Editing an arc
If you click and hold the mouse button when the hand cursor appears, moving the
mouse will change the location of the start or end point of the arc. The actual
coordinates are shown in the Status Bar (see lower left graphic in Figure 40.
Rotating and shearing an object using the mouse
Use the red rotation handles to either rotate an object around an axis or slant or
shear the object.
Rotating
To rotate an object (or a group of objects), drag a red corner handle point of the
selection with the mouse. The mouse cursor takes the shape of an arc of a circle with
an arrow at each end. A dotted outline of the object being rotated appears and the
current angle of rotation is dynamically shown in the status bar.
Note
Rotation works in a slightly different way for 3D objects because the
rotation occurs in 3D space and not in one plane. See Chapter 7 (Working
with 3D Objects) regarding rotation when the Edit Points mode is active.
Rotations are made about an axis which is displayed as a small symbol. This is
normally located at the midpoint of the object, but you can move the axis of rotation
with the mouse to any location you like, even outside the object.
If you hold down the Shift key during the rotation, the operation will be carried out in
increments of 15° (subject to whether Snap position is set to When creating or
moving objects under Tools > Options > OpenOffice.org Draw > Grid).
44 OpenOffice.org 3.3 Draw Guide
Figure 42: Rotating an object
Page 45

Changing inclination or perspective
To slant or shear objects, use the red handles located at the midpoint of an edge of
the selected objects. The mouse pointer changes to a when the pointer hovers
over one of these midpoint handles.
Note
In current versions of Draw, basic shapes can be sheared and slanted. The
effect however will probably be different to that obtained when a classic
object has the same slant or shear applied to it, particularly when the
mouse is used to create the effect.
The slant axis is the point directly opposite the midpoint handle to be used for
shearing the object. This point stays fixed in location; the other sides and edges move
in relation to it as the mouse is dragged (make sure that the icon is showing
before dragging).
Figure 43 shows how the vertices move in relation to each other during the shearing
process. The circles represent the path of the vertices. The inclination axis is the
bottom vertex of the triangle (the slanting handle used is the midpoint of the upper
enclosing frame). All points on the figure will move through the same angle
irrespective of the final shape. The actual angle is shown in the status bar.
Note
The triangle in Figure 43 was produced with the (unfilled) polygon tool
and then Close Object was selected from the context menu.
This tool can be used to produce perspective drawings. The series of pictures in
Figure 44 shows the method of constructing a cuboid or rectangular prism. To
shorten the edges leading from front to back, reduce the length before you distort the
height or width of the surface.
As with rotation, you can make the slanting occur in steps of 15° by pressing the
Shift key while moving the handle.
Chapter 3 Working with Objects and Object Points 45
Figure 43: Shearing an object
Figure 44: Perspective production of a cuboid
Page 46

Setting size and position exactly
You can position and resize objects with the mouse, but this method is not very exact.
If you need accurate positioning of objects, use Format > Position and Size from
the menu bar, or right-click the object and select Position and Size from the context
menu, or press F4.
Position and Size
Open the Position and Size dialog (see Figure 45) and click on the first tab to set
the appropriate values.
Position is defined as an X,Y coordinate relative to a fixed point (the base point),
typically located at the upper left of the drawing area. If desired, you can temporarily
change this base point to make positioning or dimensioning simpler (click on the
radio button corresponding to the location of the base point in either of the two
selection windows on the right side of the dialog—upper for positioning or lower for
dimensioning). The possible base point positions correspond to the handles on the
selection frame plus a central point. The change in position lasts only as long as you
have the dialog open; when you close this dialog, Draw resets the base point to the
standard position.
Tip
The Keep ratio checkbox is very useful. Click it to keep the ratio of width
to height fixed while you change the size of an object.
Either or both the size and position can be protected so that they cannot be
inadvertently changed. Check the appropriate boxes to achieve this.
Tip
You cannot move an object? Check to see if the position is protected!
46 OpenOffice.org 3.3 Draw Guide
Figure 45: Position and size of an object
Page 47

Rotating objects
Click on the Rotation tab of the Position and Size dialog (see Figure 46). Here you
can define the rotation angle, as well as the location of the pivot point.
Slant and corner radius
The slant angle (inclination or shearing) and corner radius can be set in this dialog
(Figure 47).
Corner radius
Chapter 3 Working with Objects and Object Points 47
Figure 46: Rotating an object
Figure 47: Setting rounded corners and slant angle
Figure 48: Example of setting rounded corners
Page 48

You can use this dialog to round the corners of the usual Draw objects—text boxes,
legends, rectangles, and squares, as shown in Figure 48. The same effect can be
achieved when you are in the points mode (click the Points icon on the Drawing
toolbar), by dragging the large handle with the mouse. The larger the value for the
corner radius, the rounder the object becomes.
Slant
You can shear both the older, classic Draw objects and the newer Shape objects.
Enter the slant angle in the box marked Slant Angle.
Figure 49: Example of setting the slant angle
Editing object points
For polygons and Bézier curves, Draw offers a complete set of tools that let you
accurately edit the contour of an object. To edit other objects in the same way, you
must first convert them into curves. To do this, select the object, then right-click and
choose Convert > To Curve or choose Modify > Convert > To Curve from the
menu bar.
You can also convert the shapes to a polygon (Convert > To Polygon). With
polygons, the edge points are always connected with straight lines and not with
curves. Some of the techniques described work equally with polygons as with curves.
Another way to change the form of basic shapes
In current versions of Draw, many of the new shapes can be directly edited without
having to convert them to curves first. You can recognize these objects by the
presence of one or more circular yellow handles as shown in Figure 50.
48 OpenOffice.org 3.3 Draw Guide
Figure 50: Some basic shapes with yellow “handles”
Page 49

The mouse pointer changes shape when hovered over a yellow handle. If you drag
one of these handles, you can modify the shape of the object; the type of change is
dependent on the shape itself. For example, you can round the corners of a rectangle
or square, change the angles of an arc or ellipse, or alter the control points of a
circular or elliptical segment.
How curves work
The editing of curves depends on the mathematics of Bézier curves1. The complete
study of such curves goes beyond this scope of this guide, and only the basics are
covered here. Chapter 10 (Advanced Draw Techniques) provides more information on
drawing and manipulating Bézier curves.
The editing of a Bézier curve consists in principle of moving points or tangents
passing through these points. Each tangent has two control points—one at each end
—and a junction point where it meets the curve. The relative angle and distance
between the control points determine the shape of the curve. Figure 51 shows
several variations starting from a basic circle and changing only one point on the
circle.
You can create many different shapes by moving either the junction point itself, or
one or both of the round handle points at either end of the tangent.
Draw offers even more possibilities when you use the functions on the Bézier curve
Edit Points toolbar.
The Edit Points toolbar
When you work in Edit Points mode, use the Edit Points toolbar, shown in Figure 52.
To activate this toolbar, choose View > Toolbars > Edit Points. It will then appear
whenever you select a curve and the Edit Points icon on the Drawing toolbar is
active.
On this toolbar, icons may be active or inactive depending on the selected object and
object point. With the Convert to Curve icon, you can determine for individual points
whether their connection will be made with straight lines or with curves.
Only with curves are the icons for tangents activated. An object that contains no
curves is treated as a polygon.
1 Bézier curves were invented by Pierre Bézier, an engineer working with the Renault car
manufacturer, who developed the technique in the 1960s. The technology was intended to
make modeling the surface of vehicles easier.
Chapter 3 Working with Objects and Object Points 49
Figure 51: Creating different shapes by changing the tangent
Page 50

1 Points 5 Split Curve 9 Symmetric Transition
The three kinds of tangent
Three buttons in the Edit Points Toolbar let you select the type of tangent and convert
from one type to another. Only one of these buttons can be active at any given time.
Their use is described in the following chapter.
Choose the Symmetric Transition button to work
with a symmetrical tangent (Figure 53). Any movement of
one or the other of the handles is carried over
symmetrically to the other handle.
Choose the Smooth Transition button to separately
adjust the lengths of the two parts of a tangent and so
make the curve flatter or steeper. In Figure 54, the curve
is flatter on the longest side of the tangent. The tangent
remains as a single straight line. This kind of tangent is
known as a smooth junction.
It is also possible to separate both sides of the tangent
from the curve. In this case, the central point is known as
the inflexion point. Using this technique, you can draw
spikes and troughs in objects. Choose the Corner Point
button to create an inflexion point around the
selected point.
Examples
The other buttons in the Edit Points Toolbar are described here in relation to working
examples. The following examples start from a filled circle. As mentioned earlier, in
order to use Edit Points mode, you first need to convert the object to a curve.
You will notice that after the conversion, the handles located in the corners of the
rectangle have disappeared. This behavior is normal in that the handles which are
used in the Edit Points mode are located along the outline or trace of the drawn
object.
50 OpenOffice.org 3.3 Draw Guide
2 Move Points 6 Convert to Curve 10 Close Bézier
3 Insert Points 7 Corner Point 11 Eliminate Points
4 Delete Points 8 Smooth Transition
Figure 52: Edit Points toolbar
Figure 53:
Symmetric
tangent
Figure 54:
Asymmetric
tangent
Figure 55:
Inflexion point
Page 51

Figure 56: Moving a
The Move Points button is the default mode when
editing points. If it has not been activated, click on its
button. When this mode is active, the mouse pointer has
the following shape when it is hovered over an edit point:
Movement of a point is one of the easiest manipulations to
do. Figure 56 illustrates how you can draw an egg very
easily by starting from a circle and dragging the top point
upwards.
To change the direction or location of the tangents, move
the circular handles at each end. The mouse pointer then
looks like this:
Use the Points button to add an extra edit point to
an existing curve. Click on the curve at the spot where
you want to insert a point and then move the mouse
slightly in any direction while holding down the button.
Caution
If you just click, the new point will not be
added.
The tangent attributes associated with the new point
depend on the buttons that are selected on the toolbar.
Chapter 3 Working with Objects and Object Points 51
junction point
Figure 57: Rotating a
tangent
Figure 58: Adding an
edit point to a curve
Page 52

The Delete Points button has the opposite effect: it
subtracts one or more points from the curve. The
resulting curve stretches itself automatically around the
remaining points after subtraction.
Select one or more points to delete. You can select several
points by holding down the Shift key (➊).
When you have selected the points you want to delete,
click the Delete Points button. The selected points
disappear from the curve, which then reforms around the
remaining points (➋).
You can also delete the selected points by pressing the
Del key on the keyboard.
Use the Split Curve button to split or cut a curve at
the location of the selected handle. If the object is filled, it
will be emptied because the curve that represented the
edge is no longer closed.
Check that you have selected the correct handle (➊),
click the Split Curve button (➋) and notice that the
object is no longer filled. You can then check, by moving
the point, that the curve has indeed been separated (➌).
If you have an open curve, the start point of the curve is
larger than the others.
You can also separate a curve at several points
simultaneously. Keep the Shift key pressed down and
select all of the points at which the cut should occur.
Drag and drop segments with the mouse to move them
from the original curve.
52 OpenOffice.org 3.3 Draw Guide
➊
➋
➊
➋
3
Figure 59: Deleting
points from a curve
Figure 60: Cutting a
curve
Figure 61: Moving a
segment
Page 53

Figure 62: Closing
To close an existing curve, select an open curve and click
on the Close Bézier button .
The opening point is identified by a slightly larger handle
(Figure 62).
The Eliminate Points button button only functions
with lines with multiple points.
If the button is active, click on a point, hold the mouse
button down and move the mouse to draw virtual straight
lines between the neighboring left and right points.
Release the mouse button when the two lines have more
or less coalesced into one straight line. The point is
deleted and the new line replaces the previous two lines,
eliminating one point.
Note that this only works when the angle between the two
lines (shown dashed in Figure 63) is less than a certain
amount.
In the Tools > Options > OpenOffice.org Draw > Grid
window there are options for snap settings relating to
editing points when rotating and in point reduction mode.
Chapter 3 Working with Objects and Object Points 53
an open curve
1.
Select object and set
Edit points mode
2.
Draw virtual lines
3.
Release mouse button
Figure 63: Reducing a
line by one point
Page 54

The Rotate function from the Effects drop-down button
on the Drawing toolbar and the Rotation Mode
after Clicking Object button on the Options toolbar
can be used in Edit Point mode. In this case, it can be
used to move single points around the contour of an
object.
Switch into rotation mode by clicking on either of the
rotation buttons. Notice that in rotation mode, all of the
tangent points become red dots.
Select the point to be moved and then drag it around the
contour while keeping the left mouse button pressed
down (➊). When you release the mouse button, the point
will be moved to the new position (➋).
If you move one of the handles located at the end of the
tangents during rotation, you will make the object rotate
in exactly the same way as with the usual rotation
operations.
Important: To exit the effects mode, do not just click on
the Effects button; click the Select button on the
Drawing toolbar.
54 OpenOffice.org 3.3 Draw Guide
➋
➋
➊
Figure 64: Moving a
point on a curve
Page 55

Chapter 4
Changing Object
Attributes
Page 56

Toolbars and menus
To change an object’s attributes (such as color or border width) you can use the Line
and Filling toolbar or the context menu.
Line and Filling toolbar
If the Line and Filling toolbar is not visible, you can display it using View > Toolbars
> Line and Filling. From here you can edit the most common object attributes. You
can also open the Line dialog by clicking on the Line icon and the Area dialog by
clicking on the Area icon to see more options.
1 Styles and Formatting
2 Line
3 Arrow Style
4 Line Style
5 Line Width
6 Line Color
7 Area
8–9 Area Style / Filling
10 Shadow
Figure 65: Line and Filling toolbar
Text Formatting toolbar
When you select text, the Line and Filling toolbar changes to show text formatting
options. You can also display the Text Formatting toolbar by choosing View >
Toolbars > Text Formatting.
Figure 66: Text Formatting toolbar (when text is selected)
The context menu
When an object is selected, you can right-click on the object to bring up a context
menu (Figure 67). The context menu provides additional access to the options shown
above and another way to change an object’s attributes. The entries with a small
arrow on the right-hand side contain a submenu.
56 OpenOffice.org 3.3 Draw Guide
Page 57

Figure 67: Right-click on an object to see the context menu
Editing lines and borders
Lines, arrows, and the borders of an object are managed through the same dialog
(Figure 69).
You can change some properties from the Line and Filling toolbar. To see more
options, select the object and right-click on the object and choose Line from the
context menu. This opens the Line dialog.
Chapter 4 Changing Object Attributes 57
Figure 68: Lines and borders
Page 58

Figure 69: Line dialog (right-click on an object and choose Line).
Common line properties
In most cases the property you want to change is the line’s style (solid, dashed,
invisible, and so on), its color, or its width. These options are all available from the
Line and Filling toolbar.
You can also edit these properties from the Line dialog. They are on the first tab, left
column (see Figure 69). From the Line dialog you can also change the line’s
transparency. Figure 71 illustrates different degrees of transparency.
58 OpenOffice.org 3.3 Draw Guide
Figure 70: Common line options (style, width, color)
Figure 71: The vertical lines have different levels
of transparency (0%, 25%, and 50%).
Page 59

Drawing arrows
Arrowheads (and other line endings—usually referred to in this guide collectively as
arrows) are a line property. Select a line and click on the Arrow Style icon.
This opens the Arrowheads menu.
There are several types of arrowheads available. Each end of the line can have a
different arrowhead (or no arrowhead).
Note
Arrowheads are only applicable to lines. They have no effect on the
border of an object.
In the Line dialog (Figure 69), Arrow styles on the right-hand side contains a number
of options to fine tune the arrow properties. If Synchronize ends is selected, both
line endings will have the same appearance. The Center option places the center of
the arrow over the end point of the line. If this option is not selected, the line ends at
the far edge of the arrow. The following sketch illustrates the difference.
Chapter 4 Changing Object Attributes 59
Figure 72: Arrowheads menu
Figure 73: Default arrowheads (left) vs centered
arrowheads (right)
Page 60

Line shadows
Lines can have a shadow property associated with them.
Check the box Use shadow to enable this feature. The properties shown—position,
distance, color, and transparency—may be independently adjusted to your choice and
the results seen in the preview window. You can also click on the Filling icon on
the Line and Filling toolbar—next to the area fill functions – to get a basic shadow.
Customizing line and arrow styles
You are not constrained to using the line and arrow styles provided by default in
Draw. You can modify the styles and create your own.
Customizing line styles
In the Line dialog, click on the Line Styles tab (see Figure 75). From here you can
customize the line styles or create your own by clicking on the Add button. You can
change the length of the dashes, the space between them, and several other
attributes.
Use the Load Line Style and Save Line Style icons to save a new definition
or read one from disk (file extension .sod).
60 OpenOffice.org 3.3 Draw Guide
Figure 74: Shadow page of Line dialog
Page 61

Figure 75: Editing line styles
Customizing arrow styles
You can also create your own arrowheads to provide some interesting effects, such
as:
The first step is to draw a curve with the shape you want for the arrowhead.
Note
The arrowhead must be a curve. A curve is something you could draw
without lifting a pencil. For example, is a curve but is not a curve.
You can however draw forms which are not curves and then convert
them to a curve afterwards.
Select the curve, open the Line dialog, and go to the Arrow Styles page. Click on
Add, enter a name for the arrow style and click OK (see Figure 77).
Chapter 4 Changing Object Attributes 61
Figure 76: To create your own arrowhead, you must
first draw a curve.
Page 62

Tip
The part of the shape which should point in the direction of the line must
be drawn facing upwards. In Figure 76 the top of the shape will point
towards the “outside” of the line.
Now you can access the new style from the Arrow style list (Figure 78) or the
Arrowheads dialog (Figure 72).
62 OpenOffice.org 3.3 Draw Guide
Figure 77: Adding an arrow style
Figure 78: Arrow style list
Page 63

Editing the inside (fill) of an object
The OpenOffice.org term for the inside of an object is Area fill. The area fill of an
object can be a uniform color, a gradient, a hatching pattern, or an image. It can be
made partly or wholly transparent and can throw a shadow.
Common fill properties
In most cases, you will choose one of the standard fill options, whether it is a color, a
gradient or an image. These options are all available from the Line and Filling
toolbar.
If you want no fill at all, select the object you wish to edit and on the Line and
Filling toolbar select the option Invisible on the pull down list at the right of the
paint can.
Fill with a uniform color
Select the object you wish to edit. On the Line and Filling toolbar, select Color on
the pull down list at the right of the paint can, and then choose a color from the righthand menu.
Chapter 4 Changing Object Attributes 63
Figure 79: Different types of area fill
Figure 80: Common fill options
Figure 81: Filling with a color
Page 64

Fill with a gradient
Select the object you wish to edit. On the Line and Filling toolbar, select Gradient
and then choose a gradient from the right-hand menu.
Fill with a line pattern
The OOo term for line patterns is Hatching. Select the object you wish to edit. On the
Line and Filling toolbar, select Hatching and then choose an option from the menu.
Fill with an image
You can fill an object with a bitmap image (as opposed to a vector graphic image).
Select the object you wish to edit. On the Line and Filling toolbar, select Bitmap
and then choose an option from the menu.
64 OpenOffice.org 3.3 Draw Guide
Figure 82: Filling with a gradient
Figure 83: Filling with a line pattern
Page 65

Figure 84: Filling with an image
Adding a shadow to an area
Click on the Filling icon on the Line and Filling toolbar—next to the area fill
functions (Figure 85).
Advanced area fill options
Click on the Area icon to bring up the Area dialog. From this dialog, you can fine
tune the area fill of an object in greater detail.
Creating your own fill color
Click on the Colors tab of the Area dialog (Figure 86). From here you can modify
existing colors or create your own.
Depending on the color model in use (RGB or CMYK can be selected from the pull
down menu), you can change the individual values of the constituent colors—Red,
Green, and Blue or Cyan, Magenta, Yellow, and Black. Click on Add to add this color
to the color table. Clicking on the Modify button will change the values of the
current color (here it is Blue 8, shown in the upper rectangle) to those on the screen
in the lower rectangle. The Edit button allows you to fine tune the color using a
palette with visual feedback.
Further explanation about color palettes can be found in Chapter 8 (Tips and Tricks).
Chapter 4 Changing Object Attributes 65
Figure 85: Adding a shadow
Page 66

Figure 86: Customizing the color palette
Creating your own gradient
On the Area dialog, click on the Gradients tab. From here you can modify existing
gradients or create your own.
A gradient works by creating a smooth transition from one color to another. First, you
need to choose two colors (Figure 88).
66 OpenOffice.org 3.3 Draw Guide
Figure 87: Customizing gradients
Page 67

Figure 88: Choosing colors for a gradient
Then choose a type of gradient. There are several available (Linear, Axial, Radial, and
so on) and each has up to four different options to specify it in detail. For example, a
radial gradient has a center you can specify (Figure 89).
Figure 90 shows how an ellipsoid gradient is rotated, moved vertically and
horizontally, and the color of the border area varied.
Creating your own hatching (line pattern)
On the Area dialog, click on the Hatching tab (Figure 91). From here you can modify
existing hatchings (line patterns) or create your own.
Chapter 4 Changing Object Attributes 67
Figure 89: Center option in a radial gradient
Figure 90: Center, Angle, and Border options for a gradient
Page 68

You can customize options like the spacing between lines, the angle and the color of
the lines. There is no way to edit the line thickness.
Creating your own bitmap fill
You can add your own bitmap images to fill an area. First, you need to create the
bitmap image. This could be a photo or another sketch you have created in another
program. For example, you can draw something with Draw and export it as a PNG
format image file.
To export a PNG image file: Create the image, select it, then choose File > Export,
choose PNG from the pull-down list of file formats, give the file a name, and save it.
To use an image as a bitmap fill, open the Area dialog and click on the Bitmaps tab
(Figure 92).
68 OpenOffice.org 3.3 Draw Guide
Figure 91: Modifying hatchings
Figure 92: Adding your own bitmap images
Page 69

From there you can add new bitmap images to serve as area fills. Click on Import
and choose a file you previously saved. Give it a name that will make it easy to
remember. The last imported image will appear at the bottom of the pull-down list of
bitmap fills. Now you can use that image as an area fill.
Tip
If the imported image seems to be very small in the preview (Figure 92)
you probably forgot to select the image before you exported it. In that
case, the exported image would be the whole page with a (small) drawing
on it.
Customizing shadows
First, select the object you want to apply a custom shadow to. Open the Area dialog
and go to the Shadow tab (Figure 94). There you can customize the shadow’s
position, distance and color.
Chapter 4 Changing Object Attributes 69
Figure 93: Adding your own bitmap images
Figure 94: Customizing shadows
Page 70

Shadows can also have transparency, so the shadow does not hide objects behind it.
Adding transparency
You can make objects partly or fully transparent, or even a with a varying degree of
transparency (as a gradient). On the Transparency page (Figure 96), choose
Transparency (for a uniform transparency) or Gradient for a gradient transparency.
An example of gradient transparency is shown in Figure 97. See also “Dynamic
gradients” on page 76.
70 OpenOffice.org 3.3 Draw Guide
Figure 95: Shadow with 50% transparency
Figure 96: Transparency page of Area dialog
Figure 97: Example of gradient transparency
Page 71

Using styles
Suppose that you want to apply the same area fill, line thickness, and border to a set
of objects. This repetitive process can be greatly simplified by the use of styles. Styles
allow you to define a formatting template (a style) and then to apply that style to
multiple objects. For more about styles, see Chapter 6 (Introduction to Styles) in the
Writer Guide.
Click on the Styles and Formatting icon on the Line and Filling toolbar or
press the F11 key to open the Styles and Formatting window (Figure 98). This
window can be docked to the left or right side of the main Draw window, if you wish.
Creating a new style
Select an object and customize the area fill and border. When you are satisfied, click
on the New Style from Selection icon on the Styles and Formatting window.
This defines a new style based on the selected object. Type a name for the new style
and click OK.
Applying a style
Once the new style is defined, you can apply it to other objects. Select another object
and double-click on the style name you defined. The new object will acquire the area
fill and line properties of that style.
Tip
Question: What happens if I modify a style after it has been applied?
Answer: Then every object with that style is updated automatically!
Chapter 4 Changing Object Attributes 71
Figure 98: Styles and Formatting window
Page 72

Modifying a style
Modifying a style is similar to creating a new style. Select an object with that style
and change the area and line properties. When satisfied, click on the Update Style
icon . Alternatively click the Styles and Formatting icon or press F11, right-click
the style you wish to modify and select Modify. Edit the properties you want to
change and click OK to finish.
Special effects
First make sure that the Drawing toolbar is selected (View > Toolbars > Drawing).
On the Drawing toolbar, locate the Effects icon . Click on the arrow next to that
icon. This opens a submenu with all the special effect tools (see Figure 99).
1 Rotate
2 Flip
3 In 3D Rotation Object
4 Set in Circle (perspective)
5 Set to Circle (slant)
6 Distort
7 Transparency
8 Gradient
Figure 99: Mode tear-off submenu
The tools are described in the following sections with the exception of the 3D rotation
tool, which is described in Chapter 7 (Working with 3D Objects).
Rotating an object
Click on the Effects icon to select the Rotate tool. Then select an object. The
selected object will have red handles instead of the usual green handles.
Grab one of the handles and move it to
rotate the object. The black circle in the
middle of the object is the pivot (center of
rotation). You can move the location of the
pivot with the mouse.
72 OpenOffice.org 3.3 Draw Guide
Page 73

Flip an object
Select an object and click on the Flip icon . You will see a
dashed line through the middle of the object.
This dashed line is the axis of symmetry. The object will be
reflected about this line. Move one or both ends of the line
with your mouse to set the orientation of the axis.
Then, grab any one of the eight green handles and move it
across to the other side of the dashed line. The new position of
the figure is shown faintly until the mouse is released.
Note
If you press the Shift key while moving the line, the line will rotate in 45degree increments.
Mirror copies
Officially, this useful command does not (yet) exist in Draw. It can, however, be easily
emulated.
Move the axis of symmetry to the desired location of the mirror axis. Copy the object
to the clipboard. Flip the object, then click on an empty area of the Draw screen in
order to deselect the object. Paste from the clipboard to put a copy of the object in its
original location and now you have a mirror copy.
Chapter 4 Changing Object Attributes 73
Figure 100: Making a mirror copy of an object
Page 74

Distorting an image
There are three tools on the Effects menu that let you drag the corners and edges of
an object to distort the image.
The Distort tool distorts an object in perspective, the Set to Circle (slant) and Set
in Circle (perspective) tools both create a pseudo three-dimensional effect.
The results of using these tools are shown in the following figures.
Distort an object
Select an object and click on the Distort icon . Draw will ask if you want to
transform the object to a curve. This is a necessary step before distortion, so click
Yes. Then you can move the object handles to stretch it.
The corner handles distort, as shown in Figure 101. The midpoint handles distort the
figure either horizontally (handle on vertical side of figure) or vertically (handle on
horizontal side of figure).
Set in circle (perspective)
Select an object and click on the Set in Circle (perspective) icon. Draw will ask
if you want to transform the object to a curve. This is a necessary step before
distortion, so click Yes. Then you can move the object handles to give a pseudo three-
dimensional perspective).
74 OpenOffice.org 3.3 Draw Guide
Figure 101: Distort an image
Page 75

Figure 102: Set an image in a circle with perspective
Set to circle (slant)
Select an object and click on the Set to Circle (slant) icon. Draw will ask if you
want to transform the object to a curve. This is a necessary step before distortion, so
click Yes. Then you can move the object handles to give a pseudo three-dimensional
slant perspective.
Note
Transforming an object into a curve is a safe operation, but it cannot be
reversed other than by clicking the Undo button.
Chapter 4 Changing Object Attributes 75
Figure 103: Set an image to a circle with slant perspective
Page 76

Dynamic gradients
You can control transparency gradients in the same manner as color gradients. Both
types of gradient can be used together. With a transparency gradient, the direction
and degree of an object’s fill color changes from opaque to transparent (in a regular
gradient, the fill changes from one color to another, but the degree of transparency
remains the same).
If you have assigned transparency to an object with a color fill, you can control the
transparency by clicking on the Transparency icon . To define a transparent
gradient, select an object, choose a transparency fill from the Line and Filling
toolbar, The transparency icon is now active. When you click on this icon, a dashed
line connecting two squares appears on the object. Move the two squares to modify
the gradient. You can define the direction of the gradient (vertical, horizontal, or at
any angle) and the spot at which the transparency begins.
A regular color gradient can be defined in the same manner. Select an object, choose
a gradient fill from the Line and Filling toolbar. The Gradient icon is now
active. When you click on the gradient icon, a dashed line connecting two squares
appears on the object, just as it does for a transparency gradient.
In both cases, click outside the object to set the gradient.
Note
If the transparency and gradient icons are not visible, you can display
them using View > Toolbars > Mode.
Moving the squares will have different effects, depending on the type of
gradient. For example, for a linear gradient, the start and end squares of
the gradient will always be situated to either side of the center point of
the object.
The three examples in Figure 104 demonstrate how the type and degree of
transparency can be controlled.
76 OpenOffice.org 3.3 Draw Guide
Page 77

A single color object and a transparency gradient,
Chapter 4 Changing Object Attributes 77
covering part of the underlying object.
The gradient can be dynamically adjusted, made
more transparent by moving the white square or
more opaque by moving the black square.
An object with a color gradient, completely
covering another object.
The gradient is adjusted dynamically by moving
the squares – the color of the square relating to
the increase or decrease in that color.
An object with both color and transparency
gradients, partly covering the underlying object.
Figure 104: Dynamic gradients
Page 78

Chapter 5
Combining Multiple
Objects
Page 79

Introduction: grouping and combining objects
Using Draw, you can combine drawing objects together in two distinct ways:
grouping and combining. These two methods allow you to treat multiple objects as
one unit, or to merge objects to form a new shape.
Grouping is like putting objects in a container. You can move them as a group and
apply global changes to them. A group can always be undone and the objects that
make up the group can always be manipulated separately.
A combination is a permanent fusion of objects leading to a new object. The original
objects are no longer available as individual entities and the operation is not
reversible.
Tip
To select multiple objects, click on each object while holding down the
Shift key or click the Select icon (on the Drawing toolbar) and draw a
rectangle around the objects.
Grouping objects
Grouping by common selection
When several objects are selected, any operations you carry out are applied to all of
the objects. For example, you can rotate a group of objects in its entirety. Groups
obtained through common selection of several objects are undone as soon as you
click outside the group. However, you can choose to maintain a grouping so that the
selected objects will remain together after they are deselected.
Maintaining groups and undoing groups
To group objects, first select the objects, then right-click and choose Group from the
pop-up menu. You can also use the keyboard shortcut Control+Shift+G or choose
Modify > Group from the menu bar.
When objects are grouped, any editing operations carried out on that group are
applied to all members of the group. If you click on one member of the group, the
whole group is selected.
The objects of a group retain their own individual properties. To undo a group, rightclick and choose Ungroup from the pop-up menu, use the keyboard shortcut
Control+Alt+Shift+G or choose Modify > Ungroup from the menu bar.
Chapter 5 Combining Multiple Objects 79
Figure 105: Grouping objects using the right-click
menu
Page 80

Editing individual objects in a group
You can edit a member of a group individually without breaking the group. To do this,
right-click and choose Enter group or double-click on the group.
Once inside the group, click on any object to edit it.
To leave this mode, right-click and choose Exit group or double-click outside the
group.
Nesting groups
You can create “nested” groups, or groups of groups. In this case, Draw keeps the
initial group hierarchy. If you ungroup a group made of other groups, you are left
with individual groups that you can then ungroup further, until only single objects
remain.
Combining objects
In contrast to grouping functions, combinations create a new object; it is not possible
to edit an individual constituent afterwards. Select a collection of objects, then rightclick and choose Combine from the pop-up menu or use the keyboard shortcut
Control+Shift+K. The result of this operation is shown in Figure 108.
80 OpenOffice.org 3.3 Draw Guide
Figure 106: When you enter a group, objects outside
the group cannot be selected and appear pale
Figure 107: Editing an object inside a group
Figure 108: Combining objects
Page 81

At first glance, the appearance of the combined objects can seem rather surprising.
However, once you understand the rules governing combination in Draw, it will
become clearer.
• The attributes (for example, area fill) of the resulting object are those of the
object furthest back. In this example, it is the circle.
• Where the objects overlap, the overlapping zone is either filled or empty
depending on the number of overlaps. When the number of overlaps is even,
you get an empty space; when the number is odd, you get a filled area.
Tip
You can reorder objects before combining them so that they are further
back or further forward: right-click on the object and select Arrangement
from the pop-up menu. See also “Aids for positioning objects” on page 83.
An object which is a combination can be broken up again by selecting Modify >
Split or using the keyboard shortcut Control+Alt+Shift+K. The combination can also
be broken up into its constituent parts by selecting Modify > Break. These are not
an exact equivalent to ungrouping, as the objects were converted to Bézier curves
when they were combined. An object which is split will, for example, have an ellipse
converted to a Bézier curve.
A object which is broken will consist of a set of base level objects (for example, a
rectangle will be broken into 4 separate lines) and the original formatting—line
thickness, colors, and area properties—is not retained.
Connecting lines
Lines may be connected by selecting them and using Modify > Connect. The
connections established are based on joining the ends of pairs of lines with minimum
separation. Once a group of lines is connected, you can “close” the remaining gap by
selecting the line, right-clicking and choosing Close Object. The resultant object is
filled with the default fill. If you modified the line properties (color, weight) these are
retained in the resulting polygon.
Merging, subtracting, or intersecting shapes
After you have selected more than one object, the Merge, Subtract, and Intersect
functions can be reached in the Modify > Shapes menu or though the group’s rightclick menu under the heading Shapes.
Chapter 5 Combining Multiple Objects 81
Figure 109: Odd numbered overlaps are filled, even numbered
overlaps are empty
Page 82

Merge
When you merge objects, the new object covers the entire
surface of the original objects (it is the union of the
objects). In the same way as combining, the fill of the
merged object is determined by the fill of the object
furthest in the background. Other properties are not
taken over into the new object.
Subtract
When you subtract, the front object is subtracted from the
object behind it.
Intersect
When you intersect two objects, you get only the area
covered by both objects.
Tip
For more information on moving objects to the front or back, see page 83.
Practical example
The following example shows how you can use the merge functions to create a
complex shape—a knife with a wooden handle.
1) Draw an ellipse and then a rectangle overlapping half
of its width.
2) Select both shapes, right-click, and choose Shapes > Subtract from the popup menu. The result should resemble the shape to the right:
3) Draw another rectangle and put it over the top half of the ellipse. Then
subtract again.
82 OpenOffice.org 3.3 Draw Guide
Page 83

4) Draw a small ellipse covering just the lower right corner and subtract again.
5) The knife blade is now complete. To make the handle, draw a rectangle and an
ellipse as shown.
6) Merge the shapes together.
7) Group this image with the previous one.
Aids for positioning objects
Draw has various tools to help you arrange the objects with respect to each other.
Here we explore some of the more important ones.
Moving an object to the front or to the back
When you combine or merge objects, the end result varies drastically depending on
which object is “in front” and which one is “behind”. In Figure 110 you can see the
difference.
Figure 110: Subtracting objects: the result varies depending on which object is in
front.
If you imagine several objects stacked one on top of the other, the one referred to as
“Front” is the one on top of the stack. The one referred to as “Back” is the one on the
very bottom of the stack.
First select an object, then on the Drawing toolbar, long-click on the Arrange icon
to open the Position toolbar. This toolbar can be torn off and made to float.
Chapter 5 Combining Multiple Objects 83
Page 84

1 Bring to Front 5 In Front of Object
brings the selected object to the front of the group.
brings the selected object one step forwards.
sends the selected object one step backwards.
sends the selected object to the back of the group.
moves the selected object in front of another chosen object.
moves the selected object behind another chosen object.
Click first on the object you want to change in position. Next click on the icon
and then move the mouse over the other object. The mouse cursor changes
84 OpenOffice.org 3.3 Draw Guide
2 Bring Forward 6 Behind Object
3 Send Backward 7 Reverse
4 Send to Back
Figure 111: The floating Position toolbar
Page 85

into a hand and the outline of the second object becomes a dashed line (see
below). Clicking on this object completes the rearrangement of position.
reverses the order of the selected objects (this option is grayed out if only
one object is selected).
Aligning objects
Select two objects and long-click on on the Drawing toolbar to open the Align
toolbar. This toolbar can be torn off and made to float. The tools help you position
objects with respect to each other.
Align left.
Center horizontally.
Chapter 5 Combining Multiple Objects 85
1 Align left 4 Align top
2 Center horizontally 5 Center vertically
3 Align right 6 Align bottom
Figure 112: The floating Align toolbar
Page 86

Align right.
Align top.
Center vertically.
Align bottom.
If you have selected only one object, clicking the various buttons on the Align toolbar
positions the object in relation to the drawing page.
Distributing the distance and space between objects
Select at least three objects. Now you are able to select the option Distribution on
the Modify menu or from the right-click menu. The Distribution dialog contains a
number of options, described below.
86 OpenOffice.org 3.3 Draw Guide
Figure 113: Distribution of spacing between objects
Page 87

Horizontal distribution
None. Does not distribute the objects horizontally.
Left. The left edges of the objects are evenly spaced from one another.
Center. The horizontal centers of the objects are evenly spaced from one another.
Spacing. The horizontal spacing between the objects is evenly distributed.
Right. The right edges of the objects are evenly spaced from one another.
Vertical distribution
None. Does not distribute the objects vertically.
Top. The top edges of the objects are evenly spaced from one another.
Center. The vertical centers of the objects are evenly spaced from one another.
Spacing. The vertical spacing between the objects is evenly distributed.
Bottom. The bottom edges of the objects are evenly spaced from one another.
Figure 114 shows four objects before distribution of horizontal spacing.
The result of the selections made in Figure 113 is shown in Figure 115.
Chapter 5 Combining Multiple Objects 87
Figure 114: Before distribution
Figure 115: After distribution: change to equal horizontal spacing, no vertical change
Page 88

Chapter 6
Editing Pictures
(Raster Graphics)
Page 89

Introduction
Earlier chapters of the Draw Guide have dealt only with vector graphics. However,
Draw also contains a number of functions for handling raster graphics (bitmaps) such
as photographs and scanned pictures, including import, export, and conversion from
one format to another.
Draw can read all the usual graphics file formats. It has a subset of the same
capabilities as specialized raster graphics programs like Adobe Photoshop or The
Gimp.
Importing raster and vector graphics
To import stored graphics files, choose Insert > Picture > From File on the menu
bar or click the icon on the Draw toolbar. Draw possesses import filters for many
different vector and raster graphics formats. If your file has a nonstandard extension,
you must choose the format explicitly when importing it.
Note
A filter for *.svg (scaleable vector graphics) files is available as an
extension (http://extensions.services.openoffice.org/en/project/svgimport),
but rather than using Insert > Picture > From File just open the *.svg
file with File > Open. The SVG graphic is translated during the import
into OOo graphics primitives.
If you select the Preview option in the Insert picture dialog (Figure 116), Draw
shows a preview of the picture in the box on the right-hand side. This makes it much
easier to choose the picture you want and to see whether Draw can import a file of
this format.
Chapter 6 Editing Pictures (Raster Graphics) 89
Figure 116: Inserting a picture; notice Link and Preview options in lower left of
dialog
Page 90

To link or to embed?
If you select the Link option in the Insert picture dialog, the graphic is linked rather
than embedded. It is not actually inserted into the document; instead, a link to the
graphic is created. This link is relative to the folder where the document is stored,
even though it shows up in the Edit Links dialog (see Figure 117) as an absolute link.
If you store the document and the graphic in the same folder, and transport the folder
as a whole to another computer, the graphic will show up in the document as before.
Linked graphics are not changed as a result of any actions carried out within
OpenOffice.org. Such changes affect only the view of the graphic in the document
and not the graphic itself. In particular, the format of a linked graphic remains
unchanged. In contrast, when a raster graphic is embedded in an OOo document, it is
converted into PNG format.
Linking keeps the file size of the Draw document small. The picture can be edited or
even replaced by another and the link will still function. As long as the new picture is
given the same name as the old one, links will be re-established and updated when
the document containing the link is next opened. However, some actions do not last
beyond the current session (for example, Filter) or are simply not possible on a linked
graphic (for example using the color replacer to exchange colors).
Links can easily be removed. The linked picture will then be embedded in the
document. To break a link, choose Edit > Links from the main menu bar. In the Edit
Links dialog (see Figure 117), choose the link to be broken and then click on the
Break Link button.
Scanning
With most scanners you can directly insert a scanned picture into a document.
Scanned images are embedded in the document in PNG format.
Make sure that the scanner is supported by the SANE system if you are running a
Linux (or other UNIX-like) operating system, or TWAIN if you are using Windows, and
that it is already configured on the machine on which OpenOffice.org is running. If
more than one scanner or equivalent device is present, you can select the source
from Insert > Picture > Scan > Select Source.
90 OpenOffice.org 3.3 Draw Guide
Figure 117: Editing links to documents
Page 91

To insert an image from the scanner:
1) Prepare the image in the scanner and make sure that the scanner is ready.
2) Choose Insert > Picture > Scan > Request.
3) The rest of the procedure depends on the scanner driver and interface. You
will normally be required to specify the resolution, a scan window, and other
options. Consult the scanner’s documentation for more information.
4) When the image is scanned, Draw places it on the page. At this point it can be
edited like any other image.
Pasting from the clipboard
The clipboard offers another way to insert graphics. Depending on the source and the
operating system, figures may be in different formats. You can obtain an overview by
choosing Edit > Paste Special from the menu bar or by clicking on the Paste icon’s
drop-down menu on the main toolbar. The choices on the list vary with the type of
graphic on the clipboard.
Dragging and dropping
Drag and drop is also possible in many cases. The exact way that drag and drop
works is determined by the operating system in use and the source of the graphic,
regardless of whether the graphic is to be embedded or linked. The behavior can be
controlled by the use of the Control or Control+Shift keys together.
Draw objects and images which are used frequently can be stored in the Gallery.
Objects can be dragged from the Gallery to the Draw surface quite simply. Working
with the Gallery is dealt with in Chapter 10 (Advanced Draw Techniques).
Inserting from a file
With this option, you can insert complete pages or single objects from existing Draw
or Impress documents into your Draw document. In addition you can insert text in
Rich Text Format (RTF), HTML format or plain text. The text will be contained within
a text frame. The usual paragraph and character formatting options are available for
this text.
Choosing Insert > File brings up the File selection dialog. Select the required file
and click Insert. If the file is a Draw or Impress document, the Insert Slides/Objects
dialog (Figure 118) opens.
To access single pages or slides of the document, click on the expansion symbol
(usually a + or a small triangle, depending on your operating system) to the left of
the file name in the selection area. The same method is used to display single objects
within slides. Raster graphics (for example, photos) and Metafiles are marked with a
, drawing objects with a , and OLE objects with a .
Chapter 6 Editing Pictures (Raster Graphics) 91
Page 92

Figure 118: Inserting complete pages or objects on a page
Choose the slides or objects you want to insert; for multiple selections, press the
Control or Shift key while clicking on the items. Click OK to insert the selected items.
If the inserted object was named in the source document, it keeps its original name
unless the name already exists in the current document. In that case you must give
the object a new name before it is inserted. To rename an inserted object, right-click
and choose Name from the pop-up menu. Renaming has the advantage that the
object is then listed in the Navigator.
You can choose whether to embed or link the selected page or object.
Exporting graphics
Draw saves drawings by default in the *.ODG format. Some programs cannot open
these files. To use the drawings in other programs, you can export the graphics in
various formats. Choose File > Export and then in the File format pull-down list
select the desired format (see Figure 119).
Exporting the entire file
The file format options in the upper area of the File format box (HTML, XHTML, PDF,
and Flash) always apply to the complete file. Use of Flash or HTML format causes
each page of the Draw document to be exported as a raster graphic. You will no
longer be able to access individual objects on the page.
92 OpenOffice.org 3.3 Draw Guide
Figure 119: Lower part of the Export dialog
Page 93

To export a multi-page Draw document as a series of web pages, choose File >
Export and select HTML Document as the file type. The HTML Export wizard
opens. Follow the prompts to create the web pages. If you wish, the wizard can
generate a navigation aid to help in moving from page to page.
If you want to use the objects in other applications, select one of the Metafile formats
(JPEG, PNG, TIFF, BMP and so on) in the lower part of the File format list (see Figure
120). With this type of export, only the currently active page is exported.
Exporting single objects
In order to export individual drawing objects, you first need to select them. A
selection can include more than one object. Take care to choose the Selection option
on the Export dialog.
Exporting as a vector graphic
The choice of vector formats is still limited. An export to a DXF format file (Autocad)
is not yet possible. Even the export of a graphic to a SVG format file is not yet fully
implemented: 2D graphic objects are exported as paths and 3D objects only as
preview images. Best supported are the Metafile formats and exporting to one of
these is usually successful.
Exporting as a raster graphic
The choice of formats for export as a raster graphic is large enough to support most
other applications. In case of doubt, test different formats to see which gives the best
results; some programs behave differently depending on the format of the image
imported into them.
After typing in a name for the exported file and selecting the file format, you may be
able to set options for the exported image—compression, color format, version of
Metafile—depending on the format chosen. Some examples of the various option
dialogs are shown in Figure 121.
Where the export dialog allows you to specify the image resolution, this does not
affect the number of raster points in the image. Rather it inserts information into the
picture that tells other programs the dimensions to be used in displaying the image.
This means that, among other things, missing raster points can be interpolated when
the graphic is opened in the other program.
Chapter 6 Editing Pictures (Raster Graphics) 93
Figure 120: Section of the file selection list
Page 94

Figure 121: Adjusting format specific properties prior to export
The actual number of pixels used is determined by the screen resolution set up by the
operating system and the Drawing scale factor set in Tools > Options >
OpenOffice.org Draw > General. This is a limitation of the current user interface;
it is possible to set other resolutions using macros.
Embedded raster graphics, or objects that have been converted to a bitmap or
Metafile (from the context menu Convert > To Bitmap / To Metafile) may
subsequently be saved as a picture; from the context menu choose Save as Picture.
This saves the picture without Draw-specific additions such as text elements, borders,
or shadows and without the possibility of setting any of the options available when
exporting.
Draw objects can easily be imported into Writer, Calc, or Impress documents. For
objects used often, this is most simply done by storing them in the Gallery or by using
the clipboard. As Writer and Calc do not possess the same range of tools available
within Draw, it makes sense to use Draw to produce a complex drawing and then to
copy it into the other OOo application. A link to single drawing objects is not possible,
but you can incorporate Draw documents in the other modules as linked OLE objects.
Tip
To avoid problems when scaling Draw objects containing text after
importing them into Writer, convert the object to a polygon before
storing it in the Gallery or copying it to the clipboard. See “Convert to a
polygon” on page 105.
94 OpenOffice.org 3.3 Draw Guide
Page 95

Modifying raster object properties
As with other objects, the properties of a raster graphic can be modified. You can
format the graphic using the Format menu or the context menu. Use the Picture
toolbar to add or change filters using the Graphic Filter Bar; adjust the Lines, Areas
and Shadows properties. The Transparency property in the Format menu does not
relate to the transparency of the raster graphic itself but to the background area. To
set the transparency of the graphic, you must use the Picture toolbar.
Graphics can also have a text element. For more on text, see Chapter 10 (Advanced
Draw Techniques).
You can change the position and size of graphics, or rotate them, using the methods
described in Chapter 3 (Working with Objects and Object Points). Raster graphics can
be flipped (Modify > Flip), but note that some Metafile formats might have problems
flipping text.
Graphics included as a member of a group behave like other drawing objects when
the properties of the group are modified.
It is a good idea to (re-)name the graphic using Name from the Modify menu or the
context menu. Only named objects are visible in the Navigator and only named
objects can be directly imported from another file.
The picture (editing) toolbar
If you have enabled the Picture toolbar (in View > Toolbars), it will automatically
appear on the screen whenever you select a (bitmap) picture (see Figure 122). It
appears either directly under the menu bar in place of the formatting toolbar or as a
floating toolbar elsewhere on the screen.
The following table explains the individual functions on the Picture toolbar and
illustrates their use with examples.
Filter
Opens the Filter toolbar, which is described in “The graphic
filter toolbar” on page 98.
Graphics Mode
Use the Graphics mode menu to change the display of the
graphic from normal color to grayscale, black and white, or a
watermark. This setting affects only the display and printing of
the picture; the picture itself remains unchanged.
Default: The graphic is displayed unaltered in color.
Grayscale: The graphic is displayed in 256 shades of gray.
Black/White: The graphic is displayed in black and white.
Watermark: The brightness and contrast of the graphic are reduced to the
extent that the graphic can be used as a watermark
(background).
Chapter 6 Editing Pictures (Raster Graphics) 95
Figure 122: The Picture toolbar
Page 96

Color
Use the Color tool to adjust the values of the three RGB colors,
the brightness, contrast and the Gamma value. These
adjustments do not affect the original picture but the values
are stored in Draw as a separate formatting set.
You can select values from between –100% (no color) to
+100% (full intensity); 0% represents the original value of the
property.
The brightness can be adjusted between –100% (totally black)
and +100% (totally white).
The contrast can be adjusted between –100% (minimum) and
+100% (maximum).
The Gamma value affects the brightness of the middle color
tones. Values can range from 0.10 (minimum) to 10 (maximum)
Hint: Try adjusting this value if changing brightness /contrast
does not give you the result you want.
Transparency
The degree of transparency of the picture can be adjusted
between 0% (opaque) and 100% (fully transparent).
Line
Opens the Line dialog. In this context, line refers to the outline
of the border. See also Chapter 4 (Changing Object Attributes).
Area
Opens the Area dialog. Here you can edit color, gradient,
hatching and fills of the background area that contains the
graphic—not the graphic itself. To see the background, you
must set the transparency of the graphic to a suitably high
value.
Shadow
Use this tool to set a shadow effect around the graphic.
Crop
Use this function to crop (trim) an image. When you click on
this icon, crop marks appear on the image (Figure 123). Drag
one or more of these marks to crop the picture to your desired
size. For more accurate cropping, see “Cropping” below.
96 OpenOffice.org 3.3 Draw Guide
Page 97

Cropping
More control and accuracy over cropping functions are available via the Format
menu. Click Format > Crop Picture and the dialog box in Figure 124 will appear.
The fields Left, Right, Top, and Bottom establish the amount to be trimmed off the
appropriate edge.
In addition to cropping, you can also enlarge or reduce the size of the graphic by
changing the percentage scaling values. The new dimensions of the graphic are
shown in the Image Size width and height boxes, which can also be directly adjusted.
In Figure 124 you can see that 2 cm from the left side and 1 cm from the top, bottom,
and right side will be trimmed from the original object. The preview pane shows the
location of the new edges of the graphic. In addition both height and width have been
scaled down by 28%.
Chapter 6 Editing Pictures (Raster Graphics) 97
Figure 123: Interactive crop marks on an image
Figure 124: The Crop dialog
Page 98

• If you choose Keep Scale, the graphic will be cropped to the scales shown in
the width and height boxes and the picture reduced in size accordingly.
• If you choose Keep image size, the graphic will be cropped and then enlarged
to the original image size.
Take care with these operations: in the Crop dialog the width and height are treated
as totally independent values. Changing one without the other can result in
significant distortion of the image; this might not be what you want. (The Position and
Size dialog on the context menu has an option for keeping the width:height ratio
fixed while changing one of the two dimensions.) Changing values in one area (Scale
or Image Size) will show up correspondingly in the other area.
Caution
Any changes made in the Crop dialog change only the view of the
picture. The original picture is not changed. If you want to export a
cropped graphic, you must do it through File > Export. If you use the
option Save as Picture from the context menu, the changes are not
exported.
The graphic filter toolbar
Click the Filter icon to open the Filter toolbar. Draw offers eleven filter effects.
Filters work on the current view of an object and they can be combined. Filters
always apply to the entire graphic; it is not possible to use filters to edit only a part of
the object.
Invert reverses (inverts) the colors of an image so that it appears as a
color negative of the image.
Smooth reduces the contrast between neighboring pixels and produces a
slight lack of sharpness. If you use the filter several times in a row, the
effect will be strengthened.
98 OpenOffice.org 3.3 Draw Guide
Page 99

Sharpen increases the contrast between neighboring pixels, emphasizing
the brightness difference. This will accentuate the outlines. The effect will
be strengthened if you apply the filter several times in a row.
Remove noise compares every pixel with its neighbors and replaces the
extreme values (those that deviate in color by a large amount from a mean
value) by a pixel with a mean color value. The amount of picture
information does not increase, but because there are fewer contrast
changes our brains can better recognize the resulting graphic. This filter
tends to make the picture also a little more smooth.
Solarization was originally a photochemical effect. If the location of a
photograph is extremely highly lit, you can experience a reversal of color
and brightness. Similarly, entry of light during the developing process
reverses the brightness values. These phenomena were used for artistic
production of pictures.
With this filter you input a threshold brightness value, above which the
color values are reversed (middle picture, threshold value 70%). With the
Invert option the whole of the resulting picture is inverted in color (right
picture).
Chapter 6 Editing Pictures (Raster Graphics) 99
Page 100

Aging lends pictures a certain “look” resembling that of old photos. The
process first produces a grayscale picture from the original and then
reduces the intensity of the blue and green color values, so that the final
picture appears darker and redder. In the middle example, the aging
degree was set to 0%, on the right it was 15%.
Posterize reduces the number of colors in the picture. The fewer colors,
the more flat the picture appears. In the right hand picture below the
number of colors was reduced to 8. The results of this filter are not always
good.
The Pop-Art filter is supposed to change the colors of the picture to a
pop-art format, but unfortunately it does not seem to function correctly at
present.
Charcoal sketch makes the picture appear as if it had been drawn with
charcoal. The outlines are in black and the original colors are suppressed.
100 OpenOffice.org 3.3 Draw Guide
 Loading...