

Page 1
Cat. No. W373-E1-04
SYSMAC CS Series
WS02-LCTC1-E
CX-Process Monitor
(Ver. 2.60)
Page 2

WS02-LCTC1-E CX-Process Monitor (Ver. 2.60)
Operation Manual
Revised December 2003
Page 3

iv
Page 4

Notice:
OMRON products are manufactured for use according to proper procedures by a qualified operator
and only for the purposes described in this manual.
The following conventions are used to indicate and classify precautions in this manual. Always heed
the information provided with them. Failure to heed precautions can result in injury to people or damage to property.
DANGER Indicates an imminently hazardous situation which, if not avoided, will result in death or
!
serious injury.
WARNING Indicates a potentially hazardous situation which, if not avoided, could result in death or
!
serious injury.
Caution Indicates a potentially hazardous situation which, if not avoided, may result in minor or
!
moderate injury, or property damage.
OMRON Product References
All OMRON products are capitalized in this manual. The word “Unit” is also capitalized when it refers
to an OMRON product, regardless of whether or not it appears in the proper name of the product.
The abbreviation “Ch,” which appears in some displays and on some OMRON products, often means
“word” and is abbreviated “Wd” in documentation in this sense.
The abbreviation “PLC” means Programmable Controller. “PC” is used, however, in some Programming Device displays to mean Programmable Controller.
Visual Aids
The following headings appear in the left column of the manual to help you locate different types of
information.
OMRON, 2000
All rights reserved. No part of this publication may be reproduced, stored in a retrieval system, or transmitted, in any
form, or by any means, mechanical, electronic, photocopying, recording, or otherwise, without the prior written permission of OMRON.
No patent liability is assumed with respect to the use of the information contained herein. Moreover, because OMRON is
constantly striving to improve its high-quality products, the information contained in this manual is subject to change
without notice. Every precaution has been taken in the preparation of this manual. Nevertheless, OMRON assumes no
responsibility for errors or omissions. Neither is any liability assumed for damages resulting from the use of the information contained in this publication.
Note Indicates information of particular interest for efficient and convenient operation
of the product.
1, 2, 3... 1. Indicates lists of one sort or another, such as procedures, checklists, etc.
v
Page 5

vi
Page 6

TABLE OF CONTENTS
PRECAUTIONS xi. . . . . . . . . . . . . . . . . . . . . . . . . . . . . . . . .
1 Intended Audience xii. . . . . . . . . . . . . . . . . . . . . . . . . . . . . . . . . . . . . . . . . . . . . . . . . . . . . . . . . . .
2 General Precautions xii. . . . . . . . . . . . . . . . . . . . . . . . . . . . . . . . . . . . . . . . . . . . . . . . . . . . . . . . . .
3 Safety Precautions xii. . . . . . . . . . . . . . . . . . . . . . . . . . . . . . . . . . . . . . . . . . . . . . . . . . . . . . . . . . .
4 Application Precautions xiii. . . . . . . . . . . . . . . . . . . . . . . . . . . . . . . . . . . . . . . . . . . . . . . . . . . . . .
SECTION 1
Introduction 1. . . . . . . . . . . . . . . . . . . . . . . . . . . . . . . . . . . .
1-1 CX-Process Monitor 2. . . . . . . . . . . . . . . . . . . . . . . . . . . . . . . . . . . . . . . . . . . . . . . . . . . . . .
1-2 Basic Operating Procedure 18. . . . . . . . . . . . . . . . . . . . . . . . . . . . . . . . . . . . . . . . . . . . . . . . .
SECTION 2
Setup 21. . . . . . . . . . . . . . . . . . . . . . . . . . . . . . . . . . . . . . . . . .
2-1 Installation 22. . . . . . . . . . . . . . . . . . . . . . . . . . . . . . . . . . . . . . . . . . . . . . . . . . . . . . . . . . . . .
2-2 Connecting the PLC 33. . . . . . . . . . . . . . . . . . . . . . . . . . . . . . . . . . . . . . . . . . . . . . . . . . . . . .
SECTION 3
Monitor Screen Functions and Operations 37. . . . . . . . . . .
3-1 Outline 38. . . . . . . . . . . . . . . . . . . . . . . . . . . . . . . . . . . . . . . . . . . . . . . . . . . . . . . . . . . . . . . .
3-2 Procedure to Start Monitoring 38. . . . . . . . . . . . . . . . . . . . . . . . . . . . . . . . . . . . . . . . . . . . . .
3-3 Starting and Stopping 39. . . . . . . . . . . . . . . . . . . . . . . . . . . . . . . . . . . . . . . . . . . . . . . . . . . . .
3-4 Overview Screen 40. . . . . . . . . . . . . . . . . . . . . . . . . . . . . . . . . . . . . . . . . . . . . . . . . . . . . . . .
3-5 Screen Configurations 42. . . . . . . . . . . . . . . . . . . . . . . . . . . . . . . . . . . . . . . . . . . . . . . . . . . .
3-6 Control Screens 44. . . . . . . . . . . . . . . . . . . . . . . . . . . . . . . . . . . . . . . . . . . . . . . . . . . . . . . . .
3-7 Tuning Screens 52. . . . . . . . . . . . . . . . . . . . . . . . . . . . . . . . . . . . . . . . . . . . . . . . . . . . . . . . . .
3-8 Trend Screens 57. . . . . . . . . . . . . . . . . . . . . . . . . . . . . . . . . . . . . . . . . . . . . . . . . . . . . . . . . . .
3-9 Graphic Screens 63. . . . . . . . . . . . . . . . . . . . . . . . . . . . . . . . . . . . . . . . . . . . . . . . . . . . . . . . .
3-10 Annunciator Screens 64. . . . . . . . . . . . . . . . . . . . . . . . . . . . . . . . . . . . . . . . . . . . . . . . . . . . .
3-11 Operation Guide Message Screens 65. . . . . . . . . . . . . . . . . . . . . . . . . . . . . . . . . . . . . . . . . . .
3-12 Alarm Log Screens 67. . . . . . . . . . . . . . . . . . . . . . . . . . . . . . . . . . . . . . . . . . . . . . . . . . . . . . .
3-13 Operation Log Screens 68. . . . . . . . . . . . . . . . . . . . . . . . . . . . . . . . . . . . . . . . . . . . . . . . . . . .
3-14 System Monitor Screens 69. . . . . . . . . . . . . . . . . . . . . . . . . . . . . . . . . . . . . . . . . . . . . . . . . . .
3-15 System Monitor Log Screens 77. . . . . . . . . . . . . . . . . . . . . . . . . . . . . . . . . . . . . . . . . . . . . . .
SECTION 4
Configuration Screens 79. . . . . . . . . . . . . . . . . . . . . . . . . . . .
4-1 Before Configuring 80. . . . . . . . . . . . . . . . . . . . . . . . . . . . . . . . . . . . . . . . . . . . . . . . . . . . . .
4-2 Basic Configuration Procedure 82. . . . . . . . . . . . . . . . . . . . . . . . . . . . . . . . . . . . . . . . . . . . .
4-3 Basic Configuration Operations 83. . . . . . . . . . . . . . . . . . . . . . . . . . . . . . . . . . . . . . . . . . . . .
4-4 System Monitor Settings 86. . . . . . . . . . . . . . . . . . . . . . . . . . . . . . . . . . . . . . . . . . . . . . . . . .
4-5 Creating Graphic Screens 89. . . . . . . . . . . . . . . . . . . . . . . . . . . . . . . . . . . . . . . . . . . . . . . . . .
4-6 Screen Configuration 99. . . . . . . . . . . . . . . . . . . . . . . . . . . . . . . . . . . . . . . . . . . . . . . . . . . . .
4-7 System Information Settings 117. . . . . . . . . . . . . . . . . . . . . . . . . . . . . . . . . . . . . . . . . . . . . . .
4-8 Checking Configurations 131. . . . . . . . . . . . . . . . . . . . . . . . . . . . . . . . . . . . . . . . . . . . . . . . . .
SECTION 5
Troubleshooting 135. . . . . . . . . . . . . . . . . . . . . . . . . . . . . . . . .
Appendices
A Reading/Writing Function Block ITEMs 139. . . . . . . . . . . . . . . . . . . . . . . . . . . . . . . . . . . . . . . .
B FinsGateway Settings when Connected Using Controller Link 159. . . . . . . . . . . . . . . . . . . . . .
Revision History 177. . . . . . . . . . . . . . . . . . . . . . . . . . . . . . . . .
vii
Page 7

About this Manual:
This manual describes the installation and operation of the WS02-LCTC1-E CX-Process Monitor software package and includes the sections described below. The CX-Process Monitor is used to control and
monitor the operation of the CS1W-LC001 Loop Control Unit.
Please read this manual carefully and be sure you understand the information provided before attempting
to install and operate the CX-Process Monitor. Please read the following manuals carefully and be sure
you understand the information provided before setting up or using an application for a Loop Control Unit.
Product Manual name Cat. No. Contents
WS02-LCTC1-E
CX-Process Tool
WS02-LCTC1-E
CX-Process Monitor
CS1W-LC001
Loop Control Unit
Section 1 introduces the CX-Process Monitor.
Section 2 describes installing the CX-Process and connections to the PLC.
Section 3 describes the monitor screens used with the CX-Process Monitor.
Section 4 describes operating procedures to create screens and monitor using the CX-Process Monitor.
Section 5 describes errors that can occur while using the CX-Process Monitor.
Appendices are provided containing a list of ITEM settings for function blocks and FinsGateway settings
to connect to the PLC using Controller Link.
CX-Process Tool
Operation Manual
CX-Process Monitor
Operation Manual
Loop Control Unit
Operation Manual
Loop Control Unit
Function Block
Reference Manual
W372 Installation and operation procedures
for the CX-Process Tool.
W373
(this manual)
W374 Installation and operation procedures
W375 Detailed information on function
Installation and operation procedures
for the CX-Process Monitor.
for the Loop Control Unit (except for
function blocks).
blocks.
!
WARNING Failure to read and understand the information provided in this manual may result in
personal injury or death, damage to the product, or product failure. Please read each
section in its entirety and be sure you understand the information provided in the section
and related sections before attempting any of the procedures or operations given.
ix
Page 8

PRECAUTIONS
This section provides general precautions for using the CX-Process Monitor.
The information contained in this section is important for the safe and reliable application of the CX-Process Monitor.
You must read this section and understand the information contained before attempting to set up or operate the CXProcess Monitor.
1 Intended Audience xii. . . . . . . . . . . . . . . . . . . . . . . . . . . . . . . . . . . . . . . . . . . . . . . . . . . . . . . . . . . .
2 General Precautions xii. . . . . . . . . . . . . . . . . . . . . . . . . . . . . . . . . . . . . . . . . . . . . . . . . . . . . . . . . . .
3 Safety Precautions xii. . . . . . . . . . . . . . . . . . . . . . . . . . . . . . . . . . . . . . . . . . . . . . . . . . . . . . . . . . . .
4 Application Precautions xiii. . . . . . . . . . . . . . . . . . . . . . . . . . . . . . . . . . . . . . . . . . . . . . . . . . . . . . . .
xi
Page 9

1 Intended Audience
This manual is intended for the following personnel, who must also have knowledge of electrical systems (an electrical engineer or the equivalent) and knowledge about instrumentation system.
• Personnel in charge of installing FA systems.
• Personnel in charge of designing FA systems.
• Personnel in charge of managing FA systems and facilities.
2 General Precautions
The user must operate the product according to the performance specifications
described in the operation manuals.
Before using the product under conditions which are not described in the manual
or applying the product to nuclear control systems, railroad systems, aviation
systems, vehicles, combustion systems, medical equipment, amusement machines, safety equipment, petrochemical plants, and other systems, machines,
and equipment that may have a serious influence on lives and property if used
improperly, consult your OMRON representative.
Make sure that the ratings and performance characteristics of the product are
sufficient for the systems, machines, and equipment, and be sure to provide the
systems, machines, and equipment with double safety mechanisms.
This manual provides information for programming and operating the Unit. Be
sure to read this manual before attempting to use the Unit and keep this manual
close at hand for reference during operation.
4Safety Precautions
WARNING It is extremely important that a PLC and all PLC Units be used for the specified
!
purpose and under the specified conditions, especially in applications that can
directly or indirectly affect human life. You must consult with your OMRON
representative before applying a PLC System to the above-mentioned
applications.
3 Safety Precautions
WARNING Check the following items before starting Loop Control Unit operation:
!
Analog I/O Units used in combination with the Loop Control Unit must be
mounted correctly, and the unit number set on the front panel of the Analog I/O
Unit must be the same as the unit number set on the Field Terminal Function
Block. If the unit numbers are not the same, I/O (read/write) will be performed on
the data for another Special I/O Unit (i.e., the one whose unit number is set in the
Field Terminal Function Block).
The initial settings of the System Common Block on the Loop Control Unit must
be set correctly. In particular, make sure that the Data Memory for the Node Terminals in the CPU Unit controlling the Loop Control Unit is not used for other applications on the PLC. If the same words in Data Memory are used for more than
one application, the PLC system may act unexpectedly and cause injury.
When writing data to the I/O memory in the CPU Unit with function blocks (e.g.,
using Send All Blocks, Expanded DO/AO Terminal to CPU Unit, or DO/AO Terminal to CPU Unit), be sure that the words written to in the I/O memory are not
being used for any other purpose. If I/O memory words are allocated to more
than one purpose, the PLC system may act unexpectedly and cause injury.
xii
WARNING Do not perform processing in such a way that the Loop Control Unit and CPU
!
Unit write to identical I/O memory words allocated to a contact output or analog
output of an external Unit. If the same words are written to, the externally
connected loads may act unexpectedly and cause injury.
Page 10

Caution Before transferring function block data (initial setting data or operation data) to
!
the Loop Control Unit, confirm that the destination for the data is correct and also
confirm the overall safety of the system (including the Loop Control Unit). Not
doing so may result in unexpected operation.
4 Application Precautions
Observe the following precautions when using CX-Process Tool.
Caution Loop Control Unit data is monitored and operated using CX-Process Monitor
!
based on the monitor tag files created using CX-Process Tool. CX-Process Tool
can be used on Microsoft Windows 95, 98, Me, 2000, or NT (Service Pack 4 or
later). When creating monitor tag files using CX-Process Tool, CX-Process
Monitor must be installed on the same computer.
Caution Before using function block data in actual operation, confirm operation by moni-
!
toring run status (to check the load rate; select Execute/Operation/Monitor
Run Status) and validating actions (select Validate Action/Start) with CX-Pro-
cess Tool. In particular, be sure to confirm that the load rate will be less than 60%.
(For details on the load rate, refer to the Loop Control Unit Operation Manual.)
4Application Precautions
Caution The Loop Control Unit can read and write I/O memory in the CPU Unit using the
!
Field Terminal Function Blocks or CPU Terminal Blocks independent of the user
program (Step Ladder Program) in the CPU Unit. Do not write to the same I/O
memory words from both the Loop Control Unit and the CPU Unit.
Caution To hold an analog output or contact output at a specific value (for example, the
!
maximum value or minimum value) when the Loop Control Unit stops running,
create a Step Ladder Program in the CPU Unit so that the corresponding output
bit allocated to Analog Output Unit or Contact Output Unit is set to the desired
value using an NC condition of the Loop Control Unit Running Flag (bit 00 in allocated CIO word “n”) as an input condition.
Caution If a fatal error occurs in the CPU Unit (including fatal errors created by execution
!
of an FALS instruction), the Loop Control Unit will also stop running. To hold analog outputs to the previous values before the stop occurred, and to set analog
outputs to either the minimum value or maximum value, use the output hold
function of the Analog Output Unit or Analog I/O Unit.
Caution Before turning ON the power to the PLC, make sure that the facilities are safe.
!
The analog output values and contact outputs from the Loop Control Unit are
updated when the power to the PLC is turned ON regardless of the operating
mode of the CPU Unit (including in the PROGRAM mode). (Internally, the analog
output values and contact outputs are sent from the CPU Unit to Basic I/O Units
and Analog Output Units.)
Caution Fail-safe measures must be taken by the customer to ensure safety in the event
!
of incorrect, missing, or abnormal signals caused by broken signal lines, momentary power interruptions, or other causes.
Caution Confirm that no adverse effect will occur in the system before attempting any of
!
the following:
xiii
Page 11

• Changing the operating mode of the PLC
• Force-setting/force-resetting any bit in memory
• Changing the present value or any set value in memory
Caution Be sure that all mounting screws, terminal screws, and cable connector screws
!
are tightened to the torque specified in the user manuals. Incorrect tightening
torque may result in malfunction.
Caution In the event of system or power failure, CX-Process function files (extension
!
“.ist”) may not be saved. It is recommended that function files are saved regularly.
4Application Precautions
xiv
Page 12

This section introduces the CX-Process Monitor.
1-1 CX-Process Monitor 2. . . . . . . . . . . . . . . . . . . . . . . . . . . . . . . . . . . . . . . . . . . . . . . . . . . . . . .
1-1-1 Outline 2. . . . . . . . . . . . . . . . . . . . . . . . . . . . . . . . . . . . . . . . . . . . . . . . . . . . . . . . . .
1-1-2 Screen Outlines 4. . . . . . . . . . . . . . . . . . . . . . . . . . . . . . . . . . . . . . . . . . . . . . . . . . .
1-1-3 CX-Process Monitor System Requirements 9. . . . . . . . . . . . . . . . . . . . . . . . . . . . .
1-1-4 Relationship to CX-Process Tool 10. . . . . . . . . . . . . . . . . . . . . . . . . . . . . . . . . . . . . .
1-1-5 Relation between Screens and Function Blocks 12. . . . . . . . . . . . . . . . . . . . . . . . . .
1-1-6 Monitor Software Specifications 13. . . . . . . . . . . . . . . . . . . . . . . . . . . . . . . . . . . . . .
1-1-7 CX-Process Monitor Setting and Monitoring Capabilities 17. . . . . . . . . . . . . . . . . .
1-1-8 Version Changes 17. . . . . . . . . . . . . . . . . . . . . . . . . . . . . . . . . . . . . . . . . . . . . . . . . .
1-2 Basic Operating Procedure 18. . . . . . . . . . . . . . . . . . . . . . . . . . . . . . . . . . . . . . . . . . . . . . . . . .
SECTION 1
Introduction
1
Page 13

1-1 CX-Process Monitor
1-1-1 Outline
The CX-Process Monitor is a Windows NT/2000/XP-based application that
monitors the Function Block data within the Loop Control Unit using selection,
Control screen (on-site instrument image), Trend screen, Graphic screen, and
Annunciator screen, etc., via the Controller Link, serial communications, or an
Ethernet. The CX-Process Monitor uses settings and the CX-Process Tool to
create function blocks within Loop Control Units.
Note To use the CX-Process Monitor, you also need License key WS02-LCTK1-EL01
(sold separately). In addition to installing the CX-Process Monitor, make sure to
first connect License key WS02-LCTK1-EL01 to the IBM PC/AT or compatible
printer port, and then install the License key driver before using the CX-Process
Monitor. Also, when using the CX-Process Monitor, make sure that the License
key WS02-LCTK1-EL01 is always connected to the printer port.
You can also perform the following four functions.
1-1SectionCX-Process Monitor
Monitoring Function
Blocks in a Loop Control
Unit
Controlling Function
Blocks in a Loop Control
Unit
Monitoring Function
Block Alarm Status in a
Loop Control Unit
Configuring CX-Process
Monitor Screens
Monitor PV, SP, and MV, etc., within the Control Block, monitor analog signals,
and monitor contact signals.
Perform Run/Stop instructions in the Loop Control Unit.
Display the status of the CPU Unit, such as the current operating mode.
Change settings, switch between auto and manual, and perform manual operations, tune PID constants, etc., in the Control Block.
You can perform stop block operation commands for each Control Block (when
using the Tuning screen).
Display Control Block and Alarm Block alarms if they occur, and store the alarms
in the alarm history.
You can configure the screen to suit your needs.
2
Page 14

CX-Process Monitor Functions
y
--- Screen Monitoring operating
User-defined
screens
System screens
Overview --- --- OK
Control OK (Display PV bar) OK (Change SP, switch
Tuning OK (Display PV, SP, and
Trend OK (Display Control
Graphic OK (Display status for
Annunciator --- --- OK (Use colors or sound
Operation
Guide Message
System Monitor OK (Display the run/stop
Alarm Log --- --- OK (Stored when an
Operation Log --- OK (Stores run operation
System Monitor
Log
status
MV trends for 1 loop)
Block or analog signal
trends)
contact or analog signal
graphics)
OK (Display message
when Internal Switch is
turned ON)
status for the Loop
Control Unit, display
Execution errors, RAM
checksum errors, and
battery errors, and
monitor the status of the
CPU Unit control mode,
etc.)
OK (Displays run/stop
command history and
Execution error history
when an error occurs)
Controlling operation Monitoring alarm
status
OK
between auto/manual,
and perform manual
operations)
OK (Change SP, and
change P, I, D, etc.)
--- OK
OK (Turn ON/OFF the
contact, and set the
analog value)
--- OK
OK (Run/stop command
for the Loop Control
Unit)
history; e.g., SP change,
etc.)
--- OK
OK (Change bar graph
colors)
OK
to notify of an alarm)
OK
alarm occurs)
OK
1-1SectionCX-Process Monitor
Note If License key WS02-LCTK1-JL01 is not connected to the IBM PC/AT or compat-
ible printer port, or even if it is connected, if the License key driver is not installed,
you cannot use the following monitor screens or configuration screens. (If you try
to switch to the following screens, an error message will be displayed.)
Monitor Screens
Item Screen
User-defined screens
System screens
Trend Screens
Graphic Screens
Operation Guide Screens
Alarm Log Screens
Operation Log Screens
System Monitor Log Screens
Configuration Screens
Item Screen
Created using Graphic
Builder Button
Graphic Screen Create Window
3
Page 15
1-1-2 Screen Outlines
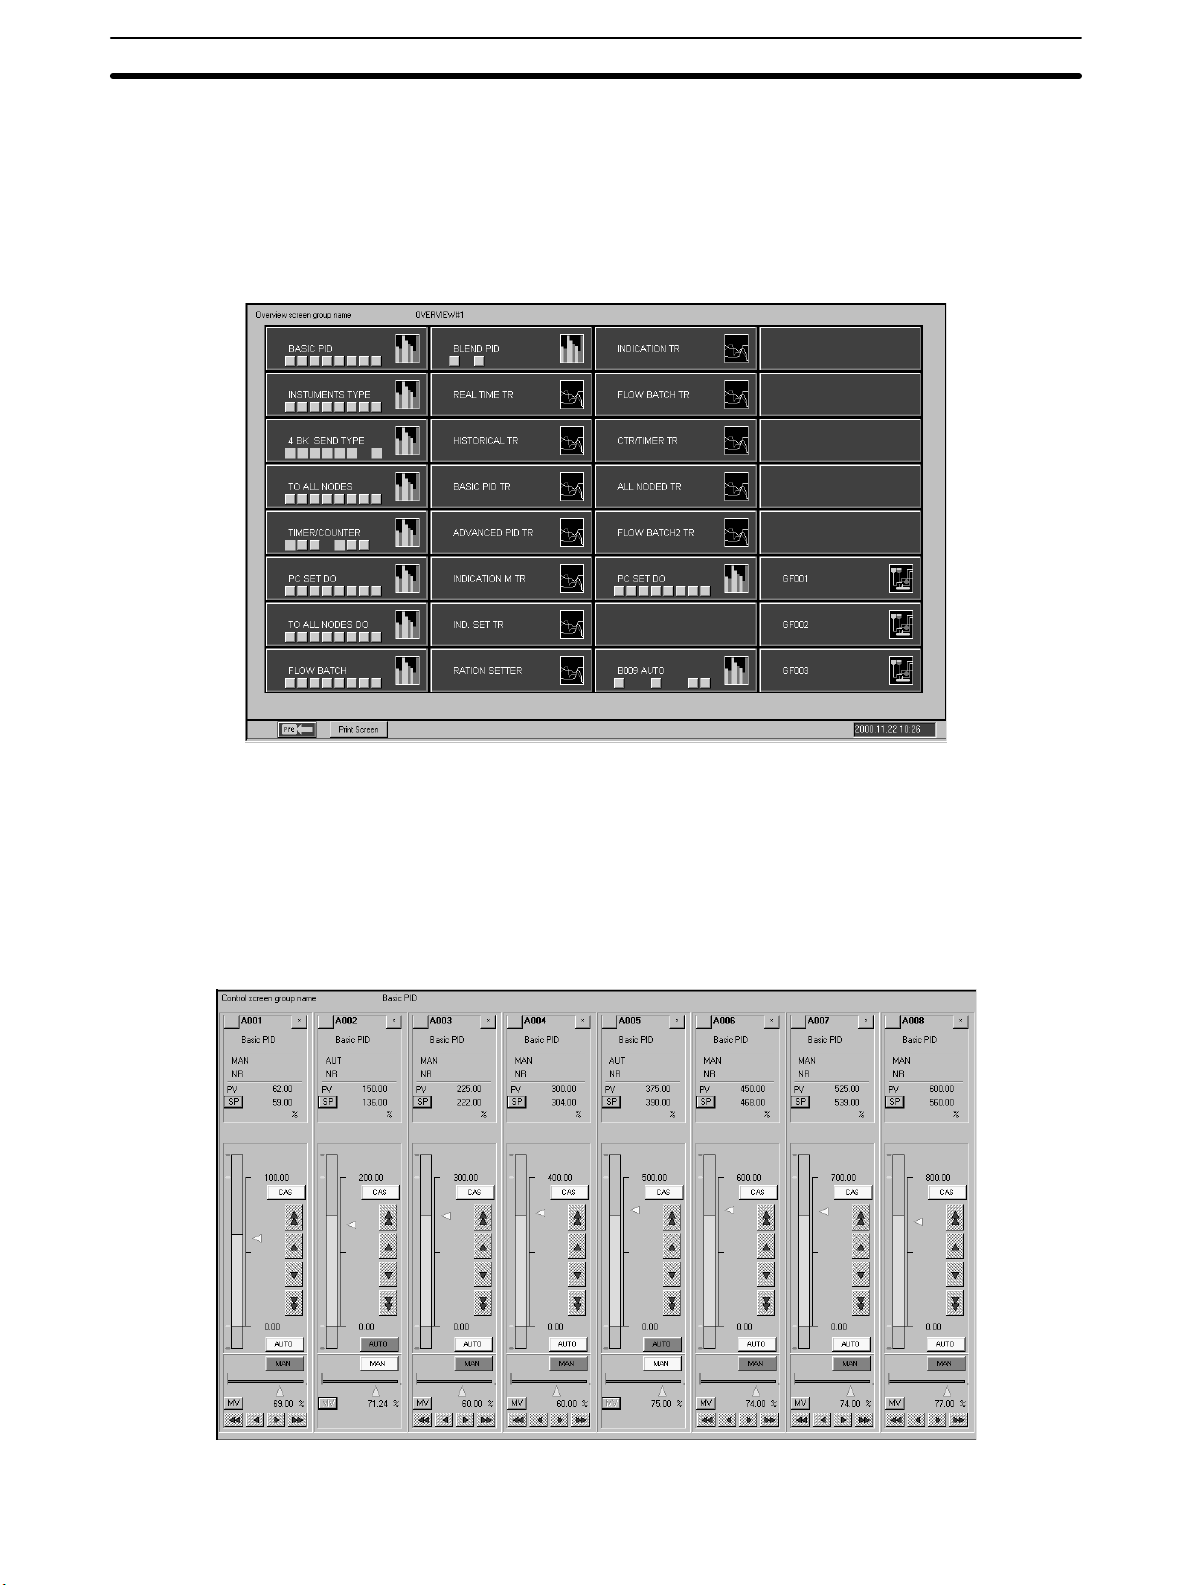
Overview Screen
1-1SectionCX-Process Monitor
Possesses the functions of all menu screens and alarm display screens.
Control Screens
Monitor and set the Control Block and part of the Operation Block, monitor analog signals, and monitor and set contact signals.
4
Page 16
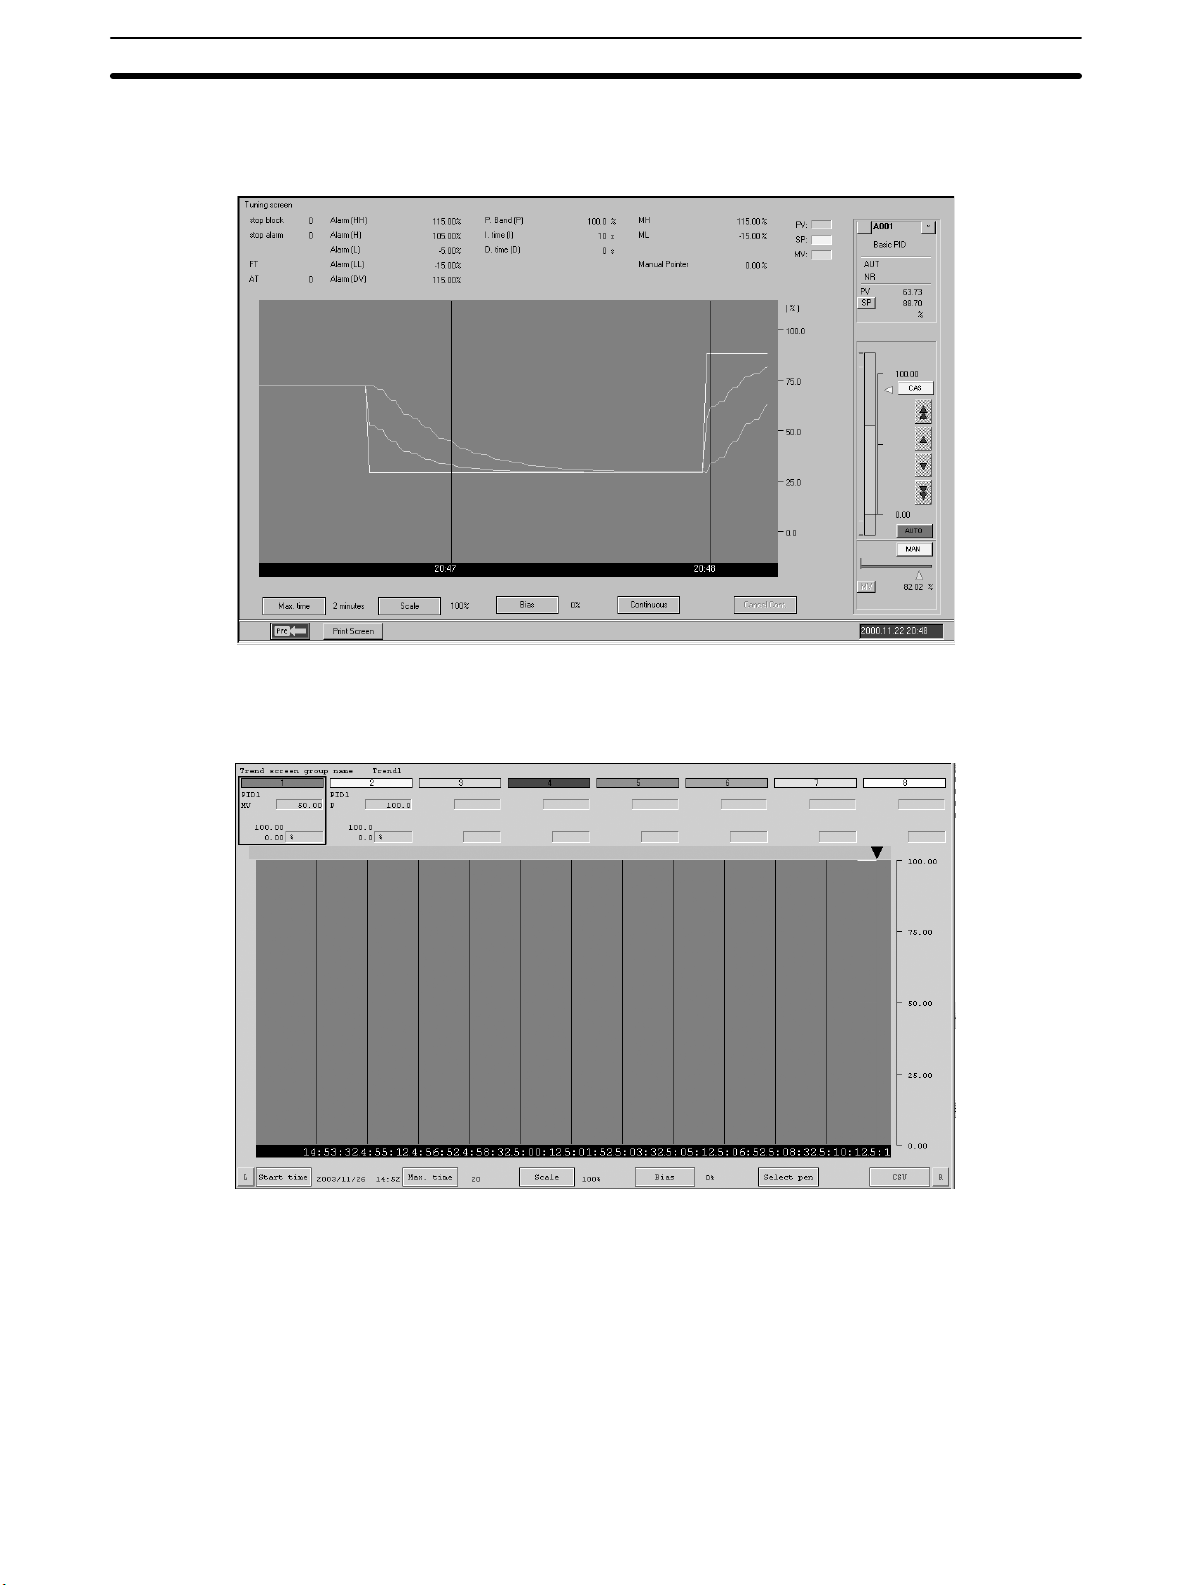
Tuning Screens
1-1SectionCX-Process Monitor
Use this screen to change Control Block P, I, D constants specified using Send
Terminals per block addressed to the computer.
Trend Screens
Display as an image changes due to the passage to time of the Control Block PV,
SP, MV, or other analog signals.
5
Page 17
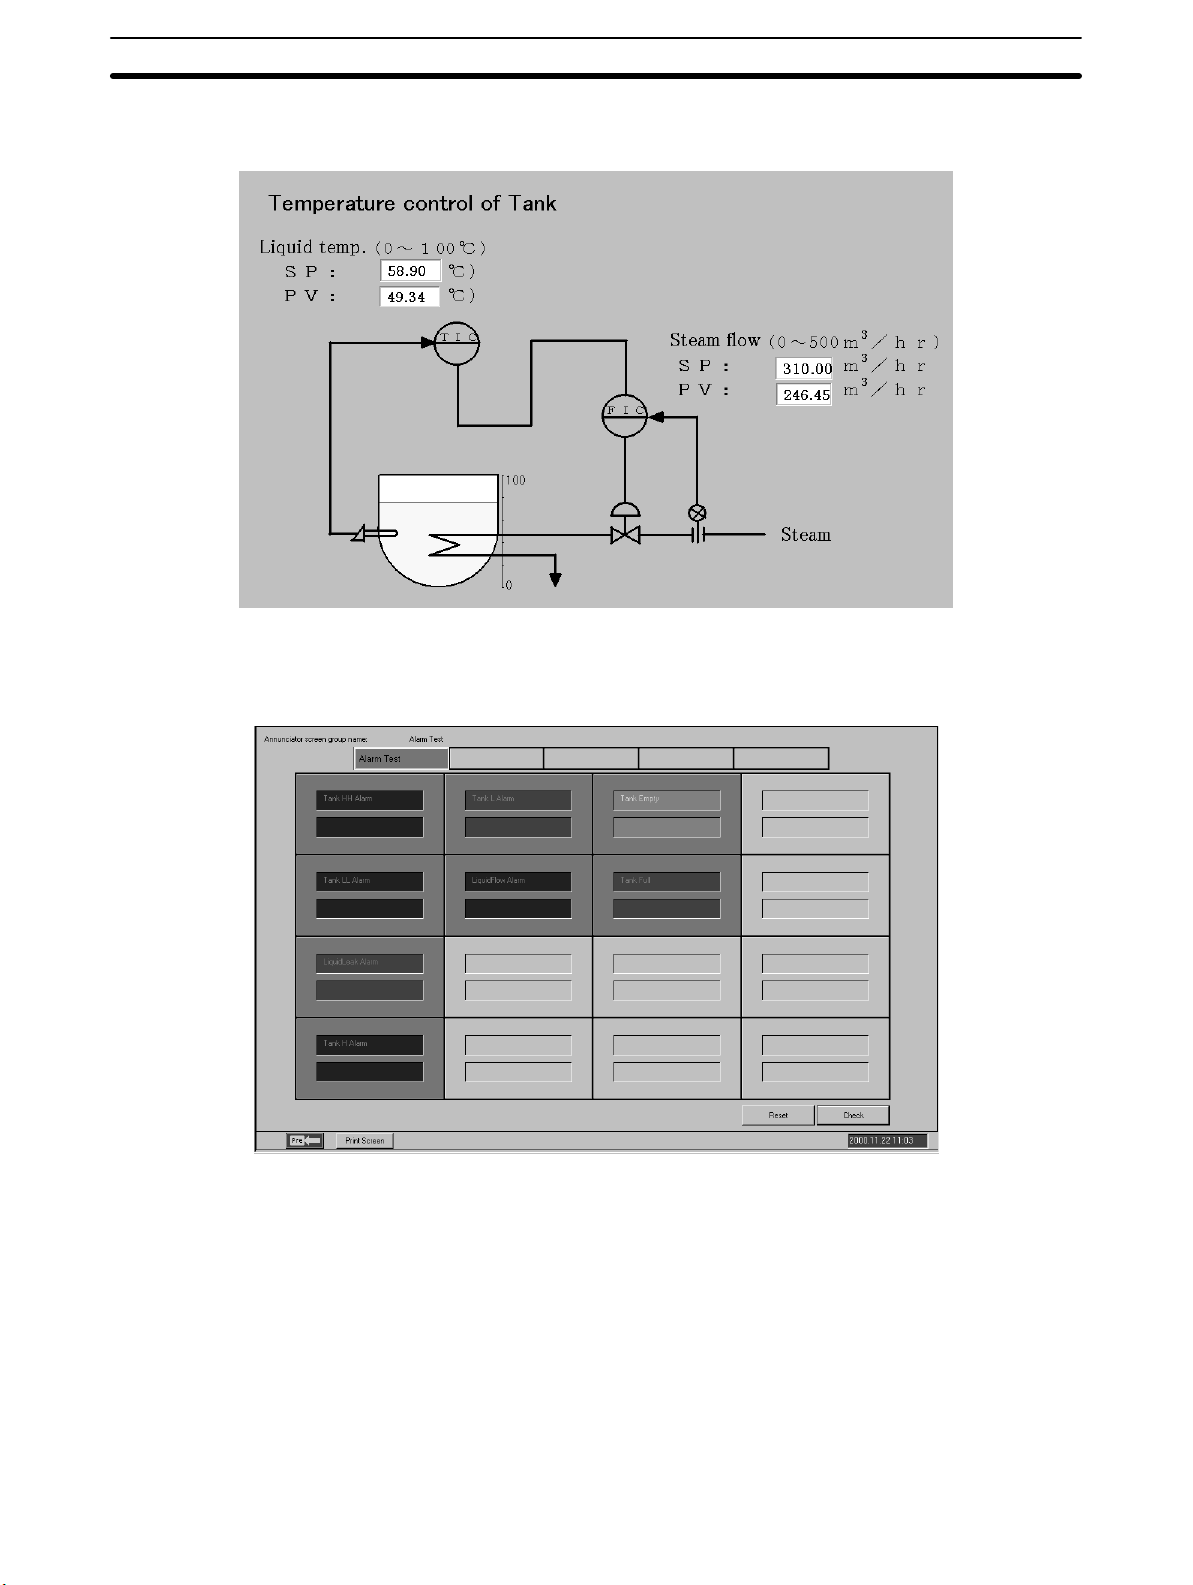
Graphic Screens
1-1SectionCX-Process Monitor
Use the screen to display the device status as a schematic.
Annunciator Screens
Use this screen to display comprehensively the status (mainly the alarm status)
of the contacts.
6
Page 18
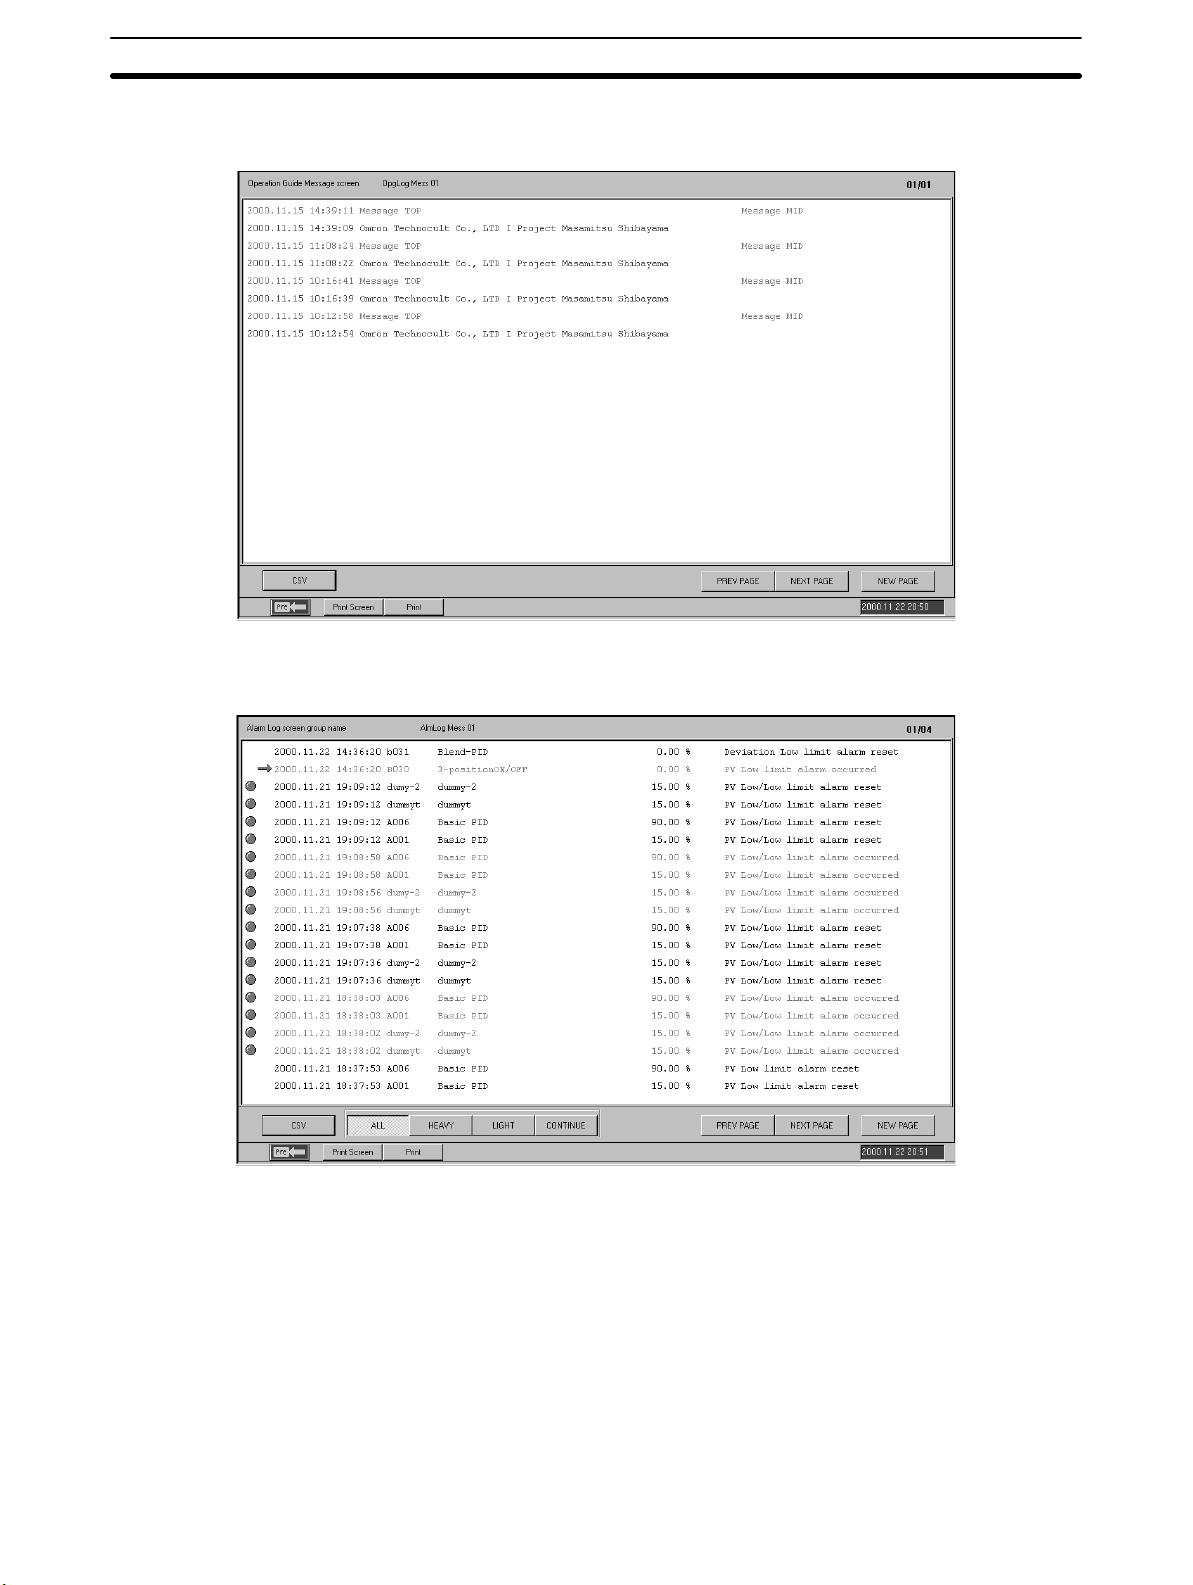
Operation Guide Screens
1-1SectionCX-Process Monitor
Use this screen to display registered messages when the contact signal is ON.
Alarm Log Screens
Use this screen to display the alarm history.
7
Page 19
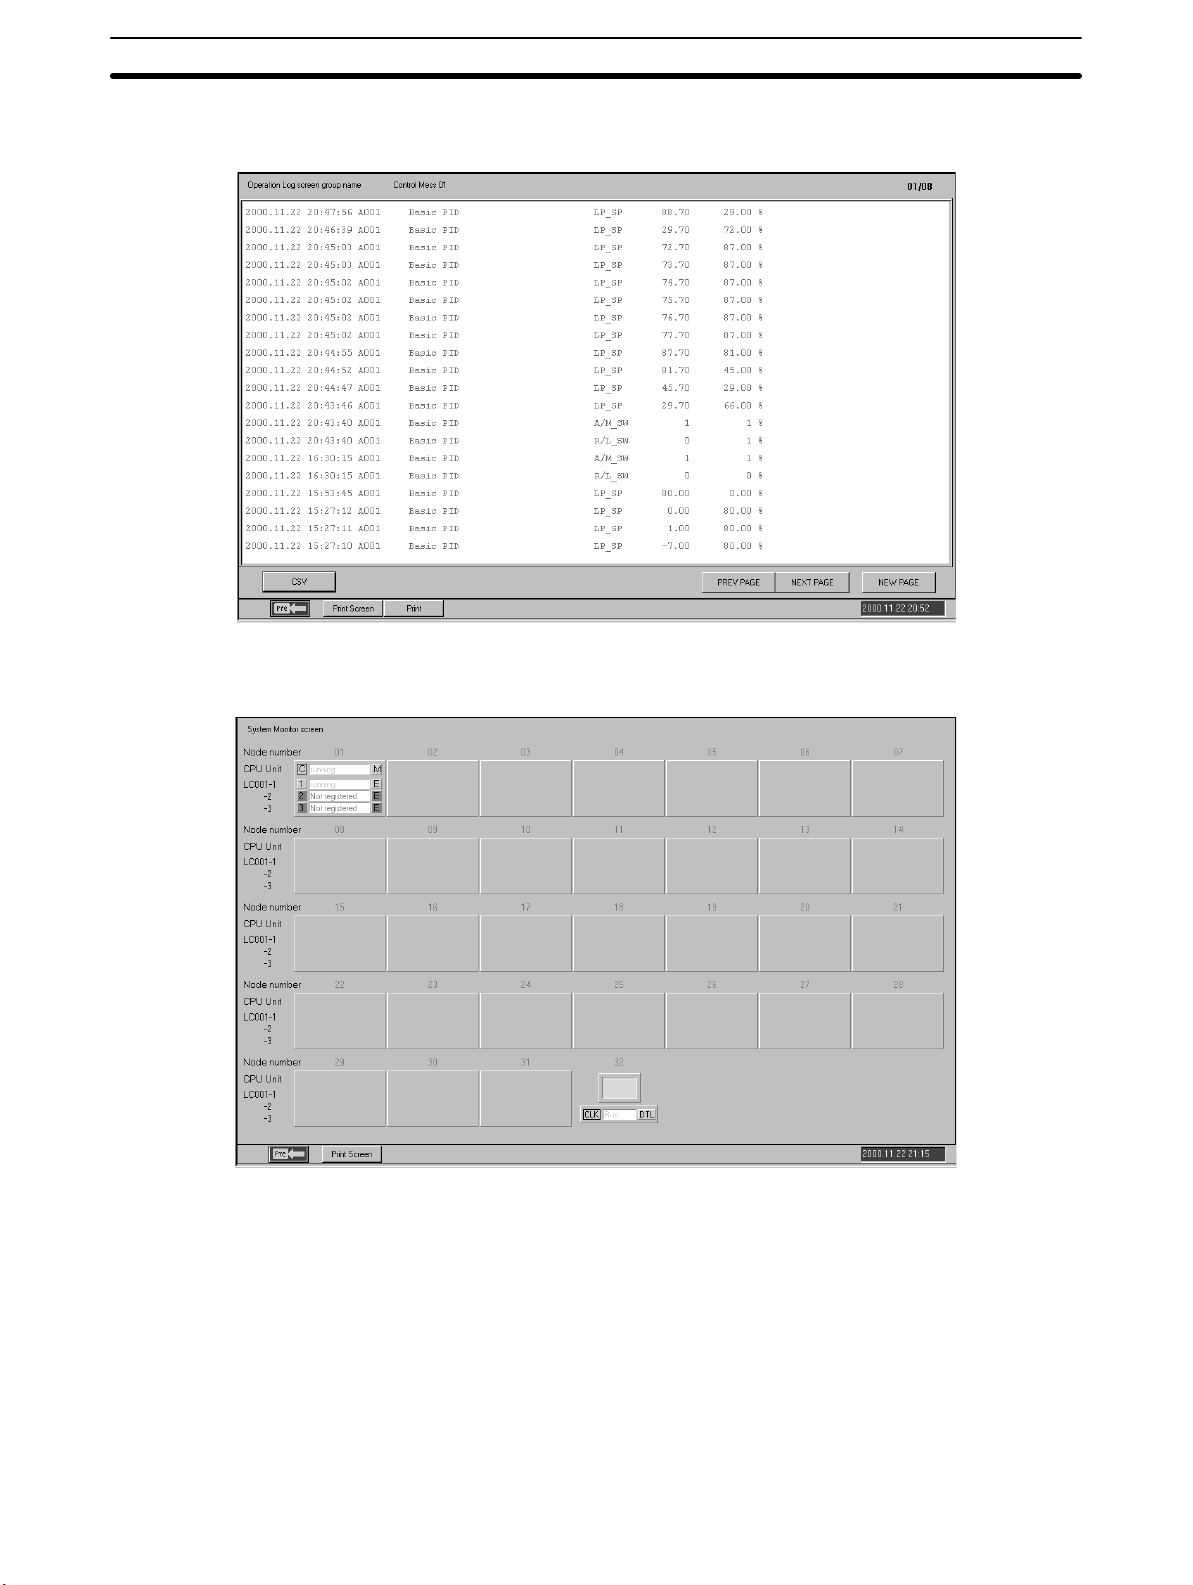
Operation Log Screens
1-1SectionCX-Process Monitor
Use this screen to display the operation history.
System Monitor Screens
Use this screen to display the system status, and run/stop the Loop Control Unit.
8
Page 20
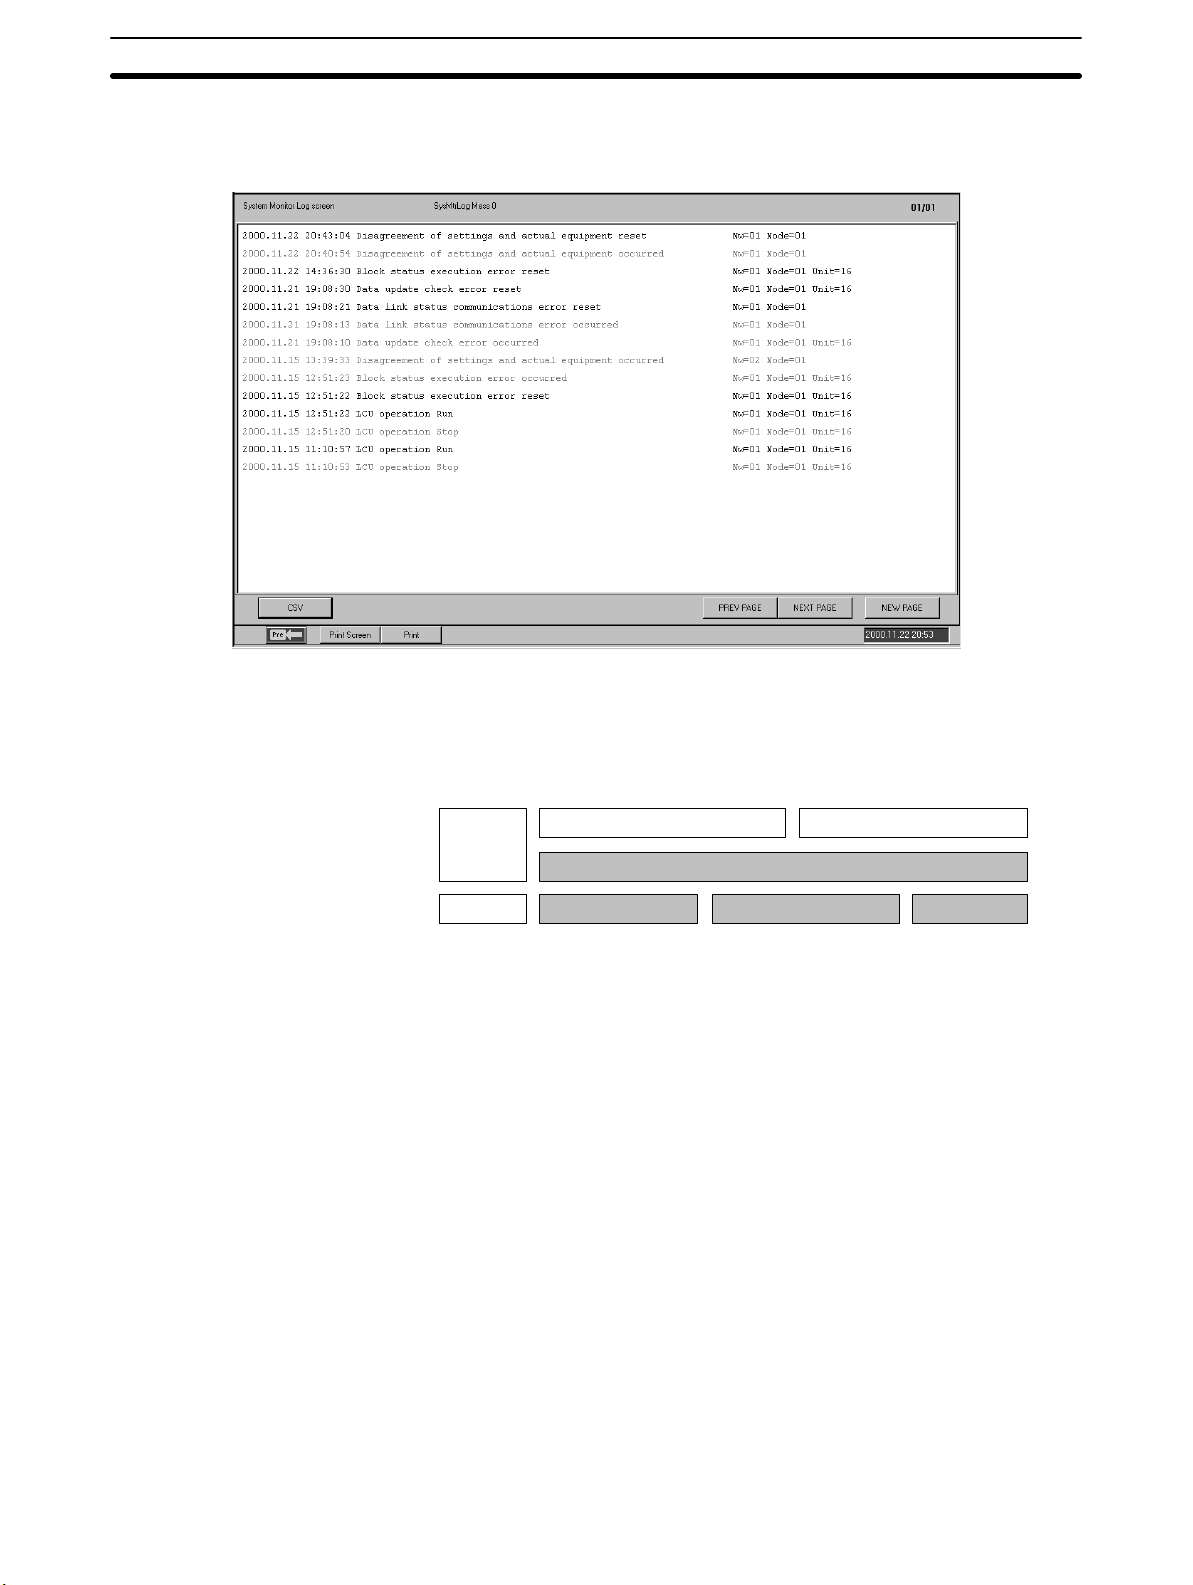
System Monitor Log Screens
1-1SectionCX-Process Monitor
Use this screen to display the run/stop history and Execution error history, and to
record the time at which they occurred.
1-1-3 CX-Process Monitor System Requirements
FinsGateway Version 3
Creating Monitor Tag
Files Using CX-Process
Tool
1, 2, 3... 1. Register the Function Block to Exchange Data with the CX-Process Monitor.
As shown below, the CX-Process Monitor uses the communications driver FinsGateway Version 3 (Embedded version) to communicate with the PLC (Programmable Controller) mounted to the Loop Control Unit.
CX-Process Tool CX-Process Monitor
Software
FinsGateway Version 3 (Embedded version)
Hardware
RS-232C port
You can use any one of the FinsGateway Version 3 (Embedded version) given
below.
• Serial Unit driver
• Controller Link driver
• CLK (PCI) driver
• ETN_UNIT driver
The CX-Process Monitor reads/writes data within the Loop Control Unit via the
Tag names of Execution blocks addressed to the IBM PC/AT or Compatible set
using the CX-Process Tool. Consequently, when using the CX-Process Monitor,
you must first set items 1 to 3 below, using on the CX-Process Tool.
Specify a Function Block, analog signal (including parameters), or contact
signal (including parameters) as the source, depending on the Send Terminal to Computer Block (Block Models 401 to 404), using on the CX-Process
Tool. Also, prepare to receive analog signals or contact signals from the IBM
PC/AT or compatible using on the IBM PC/AT or compatible AO setting or
DO Terminal Block setting.
2. Set the Tag Name.
Next, set the Tag name for the Function Block, analog signal (including pa-
rameters), or contact signal (including parameters) you have set as the
Controller Link
Support Board
Ethernet board
9
Page 21

source, using the CX-Process Tool. Also, set the Tag name for the analog
output or contact output for the IBM PC/AT or compatible AO setting or DO
Terminal setting. At the same time, you must set the zero point, span point,
decimal point location, and the engineering units scaling for the analog signals (including parameters).
3. Compile Tag Files for the CX-Process Monitor.
Compile Tag files to pass Tag data to the CX-Process Monitor. The Tag files
must be complied using the CX-Process Tool installed on the same computer as the CX-Processor Monitor.
Note Monitor Tag files are stored in the following directory with fixed file
names.
Directory: Omron/CX-Process Monitor
tory in which the CX-Process Monitor is installed.)
File name: mtagmst, and mtagsubmst
It is possible to create multiple Monitor Tags and switch between them. For
details, refer to 4-6 Screen Configuration.
/db (The underlined part is the direc-
1-1SectionCX-Process Monitor
Set Network Address,
Node Address, and Unit
Address Using
CX-Process Tool
The network address, node address, and unit address for communications between the CX-Process Monitor and PLC using the CX-Process Tool address
settings (Setting/Network).
Note 1. Be aware that you cannot start CX-Process Monitor if FinsGateway Version
3 (Embedded version) is not installed.
2. CX-Process (Monitor and Tool) cannot use FinsGateway Version 1 as a
communications driver. Be sure to use Version 3.
3. If CX-Programmer, CX-Protocol, CX-Motion, or other Support Software
(i.e., CX-Server communications software), or applications that use special
serial drivers, are connected online, they use the same COM port, so CXProcess (Monitor and Tool) cannot connect online (i.e., initialize serial communications) using the Host link (SYSMAC WAY). First disconnect offline
other Support Software or applications that use special serial drivers, before
reconnecting online (i.e., initializing serial communications) CX-Process.
Conversely, while CX-Process is connected online (i.e., initializing serial
communications), other Support Software that communicate using CXServer cannot connect online.
4. You cannot install CX-Process and FinsGateway Version 1 on the same IBM
PC/AT or compatible.
5. If using Windows NT 4.0 as your OS, you must use Service Pack 4 or later.
6. FinsGateway Version 3 (Embedded version) is bundled with CX-Process,
but you can also use FinsGateway Version 3 (Runtime version). If FinsGateway Version 3 (Runtime version) is already installed, you do not need to
install FinsGateway Version 3 (Embedded version).
1-1-4 Relationship to CX-Process Tool
Tag Names
ITEM Settings
10
(As shown earlier in CX-Process Monitor Conditions of Use, if monitoring or operating Function Blocks using CX-Process monitor, you must first compile Tag
names and Monitor Tag files using CX-Process Tool. Also, CX-Process Monitor
handles all items allocated Tag names as one string. CX-Process Monitor does
not differentiate which Function Block was used to specify the Tag names; Send
to Computer Block, DO/AO Terminal to all Nodes Block, or DO/AO Terminal Settings from Computer Block. (In Tuning screen, however, you can use only the
Function Block specified using 1-Block Send Terminal to Computer.
Function block ITEMs are set as shown in the following table. The CX-Process
Tool is normally used to set initial data S and the CX-Process Monitor is normally
used to set operation data O.
Page 22

1-1SectionCX-Process Monitor
CX-Process Tool
data classification
Initial settings S Initial setting parameter
Operation data O Operation parameters
Type ITEM Example: PID Block CX-Process
for each function block
for each function block
Note Initial settings O and operation data S classifications are displayed on ITEM Set-
ting Screens of the CX-Protocol Tool. For details on the ITEMs set each function
block, refer to the Function Block Reference Manual.
Example
ITEM type ITEM Contents
Parameter 004 Operation cycle (s) R/W (S) ---
Parameter
Parameter
008 High/Low alarm R/W (O) R/W
012 Hysteresis set value R/W (S) ---
023 Local SP set value R/W (O) R/W
024 SP set method (Initial setting)
Forward/Reverse direction,
SP setting method,
compensation method, etc.
Example: PID Block SP,
alarm settings, PID
constants, etc.
0: Local, 1: Remote/Local
CX-Process
Tool
Set Cannot be
Set in special
cases
R: Read, W: Write,
R/W: Read/write,
---: R/W disabled
r, t/w: CX-Process Tool
operation monitor/Operation
monitor read and write
(S): Initial setting,
(O): Operation data
CX-Process
Tool
R/W (S) R
Monitor
set
Set
CX-Process
Monitor
Note Analog values are normally set with the CX-Process Monitor. They can be set
with the CX-Process Tool provided that they are in percentage increments between 0% and 100%. Scaling engineering units cannot be set with the CX-Process Tool.
11
Page 23

1-1-5 Relation between Screens and Function Blocks
de ed
The relation between screens and function blocks is shown below.
1-1SectionCX-Process Monitor
Screen 1-Block
Userdefined
screens
Overview
Screen
Control
Screens
Tuning
Screens
Trend
Screens
Graphic
Screens
Annunciator
Screens
Operation
Guide
Message
Screens
System
Monitor
Screens
4-Block Send to
Send to
Computer
(403)
--- --- --- --- --- ---
Basic PID,
Advanced
PID, batch
flowrate
capture (See
note),
Indication and
Setting,
Indication and
Operation,
Ratio Setting,
Indicator,
2-Position
ON/OFF,
3-Position
ON/OFF,
blended PID
(As above) Segment Program 2 --- --- --- ---
(As above)
(PV, SP, MV
only)
Tag ITEMs as
above
Contacts
within tag
ITEMs as
above
--- --- --- Contact
--- --- --- --- --- ---
Computer (404)
Basic PID, Advanced
PID, Indication and
Setting, Indication and
Operation, Ratio
Setting, Indicator,
2-Position ON/OFF,
3-Position ON/OFF,
High/Low Alarm,
Segment Program 2,
ON/OFF Valve
Manipulator, Motor
Manipulator,
Reversible Motor
Manipulator, Motor
Opening Manipulator,
Timer, Counter
Basic PID, Advanced
PID, Indication and
Setting, Indication and
Operation, Ratio
Setting, Indicator,
2-Position ON/OFF,
3-Position ON/OFF
(PV, SP, MV only),
Segment Program 2,
ON/OFF Valve
Manipulator, Motor
Manipulator,
Reversible Motor
Manipulator, Motor
Opening Manipulator
Same tag ITEMs as for
Control screens.
Same tag ITEMs as for
Control screens.
AO to
Computer
(402), AO
Terminal to
All Nodes
(408)
Analog
signal or
analog
value
parameters
Analog
signal or
analog
value
parameters
Analog
signal or
analog
value
parameters
--- Contact
DO to
Computer
(401), DO
Terminal to
All Nodes
(407)
Contact
signal or
contact
parameters
Contact
signal or
contact
parameters
Contact
signal or
contact
parameters
signal or
contact
parameters
signal or
contact
parameters
AO
Terminal
Settings
from
Computer
(410)
Analog
output
Analog
output
Analog
output
--- Resend
--- Resend
Contact
output
Contact
output
Contact
output
contact
output
contact
output
DO
Terminal
Settings
from
Computer
(409)
12
Page 24
1-1SectionCX-Process Monitor
pp
Screen DO
System
screens
Alarm Log
Screens
Operation
History
Screens
System
Monitor Log
Screens
1-Block
Send to
Computer
(403)
Alarms only
within Tag
ITEMs as
above
--- --- --- --- --- ---
--- --- --- --- --- ---
4-Block Send to
Computer (404)
Same as alarm tag
ITEMs as for Control
screens.
AO to
Computer
(402), AO
Terminal to
All Nodes
(408)
--- --- --- ---
DO to
Computer
(401), DO
Terminal to
All Nodes
(407)
AO
Terminal
Settings
from
Computer
(410)
Note Be sure to send Batch Flowrate Capture (014) and Blended PID (013) using
1-Block Send Terminal to Computer (403). You can specify batch flowrate capture (014) and blended PID (013) as the send source for 4-Block Send Terminal
to Computer (404) using CX-Process Tool. You cannot monitor batch flowrate
capture sent using 4-Block Send Terminal to Computer (404) using CX-Process
Monitor, however.
Terminal
Settings
from
Computer
(409)
1-1-6 Monitor Software Specifications
CX-Process Monitor Specifications
Item Descriptions
Product name CX-Process Monitor
Model WS02-LCTC1
Applicable PLC-series CS1-series
Applicable Unit Loop Control Unit
Applicable
computer
Required software One of the FinsGateway Version 3 (Embedded version) drivers given below
Personal computer PC AT or compatible
CPU Min. required: Pentium MMX233 MHz or faster, Recommended: Pentium
Celeron 400 MHz or faster
OS Microsoft Windows NT4.0 Service Pack 4 or later, Windows 2000, or
Windows XP (Windows 95 and 98 cannot be used.)
Memory Min. required: 96 Mbytes, Recommended: 128 Mbytes or more
Hard disk drive Min. required: 400 Mbytes of free space, Recommended: 500 Mbytes or
more of free space
Monitor Min. required: XGA, Recommended: XGA or higher, min. 1024 x 768 dots,
256 colors
CD-ROM drive At least one
Mouse Recommended: Microsoft mouse or compatible pointing device
Printer (See note.) Any printer supported by Microsoft Windows.
Sound board 1 board
must be installed on the computer.
Serial Unit driver (Host Link)
Controller Link driver (Controller Link)
CLK (PCI) driver (Controller Link, PCI bus)
ETN_UNIT driver (Ethernet)
13
Page 25

1-1SectionCX-Process Monitor
g
Item Descriptions
Connecting
method
Loop Control Unit data specification
method
Data exchange method with CPU Unit
mounted on Loop Control Unit
Offline operation functions Prepare the user configuration screen for use in the online operation screen.
Connection with CPU Unit
(or Serial Communications
Board/Unit)
Connection via Controller
Link
Connection via Ethernet Using
Using
FinsGateway
Serial Unit
version
Using
FinsGateway
CLK (PCI)
Driver
Using
FinsGateway
Controller
Link driver
FinsGateway
ETN_UNIT
driver
Function blocks, analog signals and contact signals (including parameters)
that are designated as the source by the Send to Computer blocks (Block
Models 401 to 404) are appended a tag name by the CX-Process Tool.
Specify this tag name to specify the Loop Control Unit data.
Mode name Description Connection method
On-demand read
mode:
Data Link mode: CX-Process Monitor reads
The computer is connected to the CPU Unit peripheral ports
or integrated RS-232C port, or RS-232C port of the Serial
Communications Unit. (Only a 1:1 connection is possible.)
– Connector cable:
When connecting to the CPU Unit peripheral ports: Model
CS1W-CNjjj (2 m, 6 m)
When connecting to the CPU Unit’s RS-232C port: Model
XW2Zjjj-j (2 m, 5 m)
– Communications protocol with PLC: Host Link (not
supported on Peripheral bus)
Install the driver in a computer equipped with a Controller Link
Support Board (PCI slot) to support communications between
the computer and PLCs equipped with a Controller Link Unit.
Install the driver in a computer equipped with a Controller Link
Support Board (ISA slot) to support communications between
the computer and PLCs equipped with a Controller Link Unit.
Install the FinsGateway ETN_UNIT driver on the computer on
which an Ethernet board is mounted to enable to enable
communications with the PLC on which the Ethernet Unit is
mounted.
CX-Process Monitor reads
the data in the terminal to
computer send area
whenever necessary.
the terminal to computer
send area at all times by
the Controller Link data
link.
One of Host Link, Ethernet
or Controller Link
Only Controller Link is
possible
14
Page 26

Online
operation
functions
Item Descriptions
User Configuration
screen
Overview
screen
Control
screen
Tuning
screen
Trend
screen
Place buttons for progressing to the Control screen, Trend screen and other
screens. 4 columns and 8 lines are displayed on each screen (max. 32
screens).
Control blocks such as the PID blocks and Indication blocks, and some
Operation blocks are displayed for up to 8 loops in a single screen in the form
of a field device. The maximum number of screens is 400.
This screen displays the Set Point, PV and MV numeric values, displays PV
as a bar graph, and can be used for changing Set Point, MAN and other
setting values. The color of bar graphs changes when an alarm occurs.
You can progress to the Tuning screen from the Control screen.
Fine tuning according to the degree specified by the user is possible for PID
constants.
This screen is for setting P, I, D parameters in Control blocks such as the PID
blocks, and for setting alarm setting values. PV, Set Point and MV can be
tuned while their trends are monitored. The maximum number of screens is
3200.
Run stop/stop cancellation are possible on each function block.
Note Only the Control block that is designated as the source at the 1-Block
Send Terminal to Computer block can be registered.
The analog signals (analog values such as the Control block Set Point, PV
and MV, and other analog values) input from the terminals to the computer
are collected at a fixed cycle and saved to a file. If necessary, up to 8 analog
signals can be displayed on one screen in the form of a multi-dot recorder.
Data collected
(logger function)
Data display Horizontal (time) axis: 2, 4, 8, 12 and 24 hour time units
Real time trend
12 hour’s of data is saved
at 10-second cycles
appended with up to 480
tags.
Output possible in CSV
format.
Historic trend
10 day’s of data is saved
at 1-minute cycles
appended with up to 960
tags.
Output possible in CSV
format.
can be scrolled
Vertical (8-point common) axis: Graduation can be
enlarged by a factor or 1, 2, 5 and 10.
Data is displayed from the time when the specified
display start time is reached.
Display color: red, yellow, green, blue, magenta, purple,
cyan, white
1-1SectionCX-Process Monitor
Data can be saved in CSV
format either using button
commands, or
automatically at a set
interval (every 1, 2, 3, 4, 6,
8, 10, 12, 18, 20, 24, 48,
72, 96, 120, or 240 hours)
15
Page 27

Online
operation
functions
Online
operation
functions
Item Descriptions
User Configuration
screen
System
Fixed
screen
Graphic
screen
Annunciator
screen
Operation
Guide
Message
screen
Alarm Log
screen
Operation
Log screen
System
Monitor
screen
System
Monitor Log
screen
This screen displays changes in the plant status using graphic elements
representing plant devices pasted to the screen from the graphic elements
library (provided with the CX-Process Monitor). The maximum number of
screens is 200.
Fixed graphic elements provided in library: Devices, thermometers,
transmitters, orifices, text
Variable graphic elements provided in library:
Analog input: Bar graph display, numeric indication, tanks
Analog output: Numeric setting (by AO Terminal Settings from Computer
block)
Contact input: Pumps, valves, indicators
Contact output: Switches (by DO Terminal Settings from Computer block)
This screen notifies the operator of alarms or errors that occur by changing
the display color and emitting sound. At the same time, a 32-character
message is displayed over two lines on screen elements.
A total of 16 screen elements (4 columns x 4 lines) can be displayed on each
screen. The maximum number of screens is 5.
This screen displays pre-registered 128-character messages over two lines
together with the date of occurrence when the specified internal switch is set
to ON.
Max. number of registerable messages: 100, Number of display colors: 7
Up to 1000 messages are displayed in a single screen.
Output possible in CSV format.
A record of alarms (time of error occurrence, tag name, PV or MV current
value at occurrence, alarm type, etc.) that occur and that are input from the
Control and Alarm blocks is saved and displayed as a list later.
Up to 1000 alarm messages are displayed in a single screen.
Output possible in CSV format.
A record of changes (date and time of change, tag name, original ITEM data
setting, new ITEM data setting, etc.) made to ITEM data on the Loop Control
Unit in the Control or Tuning screen is saved and displayed as a list later.
Up to 1000 operation messages are displayed in a single screen.
Output possible in CSV format.
This screen displays the Loop Control Unit operation run/stop commands,
operation start/stop status, execution errors, RAM sum errors, battery errors,
and the status of the Controller Link Data Link.
This screen displays a log of the run/stop history and a history of execution
errors that occur on the Loop Control Unit together with the date of
occurrence.
Output possible in CSV format.
1-1SectionCX-Process Monitor
16
Page 28

1-1-7 CX-Process Monitor Setting and Monitoring Capabilities
ou pu
Co pu e (b oc 09), O
1-1SectionCX-Process Monitor
Target Function Block Read using
Control Block (and part of
Operation Block) Tag ITEMs
(See note 1)
Contact signal (including
parameters) or analog signal
(including parameters)
Contact output or analog
output
Written using
1-Block Send Terminal to Computer (403) or
4-Block Send Terminal to Computer (block 404)
DO Terminal Settings from Computer (block
401)/AO Terminal Settings from Computer (block
402), or DO Terminal to all nodes (block 407)/AO
Terminal to all nodes (block 408)
DO Terminal Settings from
Computer (block 409), AO
Terminal Settings from
Computer (block 410)
Resend signal
to Network ON
Resend signal
to network OFF
CX-Process
Monitor
OK OK
OK Not possible
OK OK
Not possible
(You cannot use
CX-Process
Monitor when
resend signal is
OFF)
CX-Process
Monitor
OK
Note 1. Refer to Appendix A ITEM Settings for Function Blocks for which tag ITEMs
you can monitor and set using CX-Process Monitor for Function Blocks specified as send source using 1-Block Send Terminal to Computer or 4-Block
Send Terminal to Computer.
2. Using CX-Process Monitor, you can monitor and set only the data given
above to which Tag names have been allocated. Also, be sure to use CXProcess Tool to make Tag name settings.
3. If using Tuning screen, be sure to use 1-Block Send Terminal to Computer
(403). You cannot register data on the Tuning screen using 4-Block Send
Terminal to Computer.
4. The Control Block and part of the Operation Block (with 4-Block Send Terminal to Computer) are the only Function Blocks that can send to CX-Process
Monitor using 1-Block Send Terminal to Computer or 4-Block Send Terminal
to Computer. Also, ITEMs within these blocks are determined beforehand
for each Function Block as the default. (Fixed names called Tag ITEMs are
allocated to each ITEM.) To send other ITEMs (contact or analog value parameters) to CX-Process Monitor, specify the required ITEM as the send
source using DO to Computer or AO to Computer (or DO Terminal to all
nodes or AO Terminal to all nodes).
1-1-8 Version Changes
Version 2.50 to 2.60
The following functions have been added to the CX-Process Monitor with the
upgrade from Ver. 2.50 to Ver. 2.60.
• Alarms can be selected to sound at recovery (recovery alarm setting).
• Tag ITEMs MHA and MLA can be selected to function as warnings (MHA, MLA
alarm setting).
• The alarm sound can be stopped for a specified tag (alarm stop function).
• The Next/Prev. Buttons can be set to move in Block Database registration or-
der or Builder Window display order (page order function)
• The number of messages that can be registered as alarm messages has been
expanded from 50 to 2,000.
• The Trend Screen has been changed.
• The pen can be changed, deleted, or added in the Trend Screen without hav-
ing to shut down Monitor Plus (changing online trend definitions).
17
Page 29

Version 2.00 to 2.50
Version 1.50 to 2.00
1-2SectionBasic Operating Procedure
The following functionality has been added or upgraded in version 2.50
(compared to version 2.00).
• FinsGateway Version 3 (embedded version) is now supported.
Although version 2.00 of the Process Monitor supported FinsGateway Version 2 (embedded version), either FinsGateway Version 2 or Version 3 (embedded version) can be used as the communications driver for version 2.50.
• Windows 2000 is now supported.
• The monitor process startup operation when configurating screens has been
changed.
The monitor process will start automatically when the File Mapping Button is
clicked when configurating screens. (With version 2.00, the Start Up Button
had to be clicked before the monitor process would start.)
• The graphic file name can now be displayed for a graphic screen button on the
overview screen.
The following functionality has been added or upgraded in version 2.00
(compared to version 1.50).
• Fine tuning can now be used to adjust PID constants to the extent specified by
the user.
• An Auto-start setting is now available in System Information to specify the
screen to be automatically displayed when the CX-Monitor is started.
• The trend data collected for a Trend screen can be automatically saved to an
CSV file as a specified interval. The file name and save interval are specified
when creating the Trend screen. You can also set an alarm or error to occur
when available disk space has reached a set level (CSV save settings in the
System Information).
• More than one overview mode screen can be displayed at the same time (Multi-screen settings in System Information.
• An Auto-exit setting is available to automatically exit the background task
(monitor process) for automatic ends in Operator Mode.
• The unit can be displayed to engineering units or percentages for the scale display in a Tuning or Trend screen (Auto-start settings in System Information).
• Direct switching is possible from an Overview screen to a Tuning screen, and
the type of Tuning screen (list or analog) can be specified (Auto-start settings in
System Information).
• Previous/Next Page Buttons have been added to switch between the same
type of screen without going through the Overview screen.
• Time-scrolling can be performed on a Trend screen using Arrow Buttons.
• The color can be specified for alarms on an Annunciator screen (Auto-start set-
tings in System Information).
• A setting is available to control the display of confirmation dialog boxes when
contact output buttons are pressed. (Added to color settings in System Information.)
• A tenkey size setting (large/small) has been added.
• Printing the entire screen (hardcopy) has been added.
• Printing is supported for Operation Guide Message Screens, Alarm Log
Screens, Operation Log Screens, and System Monitor Log Screens.
1-2 Basic Operating Procedure
This section explains the procedure up to monitoring using CX-Process Monitor.
Before performing settings and operations using CX-Process Monitor, you must
make the following settings using CX-Process Tool.
18
Page 30

1-2SectionBasic Operating Procedure
1, 2, 3... 1. Install CX-Process Monitor and License Key Driver (Refer to Section 2 Set-
up).
a) Install CX-Process Monitor.
b) Mount License key WS02-LCTK1-EL01 to the IBM PC/AT or compatible
printer port. (Keep the key attached while CX-Process Monitor is in use.)
c) Install the License key driver.
2. Make Settings and Transfer Using CX-Process Tool (Refer to CX-Process
Tool Operation Manual (W372).
• Create Function Blocks.
• Set the Network address, Node address, and Unit Address (Settings/Net-
work).
• Set the CX-Process Monitor Tag (Tag Setting/Monitor Tag).
• Compile the Monitor Tags (Execute/Create Tag File/Monitor Tag).
• Download the Function Block data to the Loop Control Unit.
Note a) If not setting and compiling Monitor Tags using CX-Process Tool,
you cannot monitor using CX-Process Monitor.
b) You can also enable the Network address, Node address, and
Unit address settings made with CX-Process Tool using CX-Process monitor.
3. Configure the Screen Using CX-Process Monitor (refer to Section 4 Screen
Configuration).
• Design the monitor system using CX-Process Monitor.
• Create and register the Control screen, Trend screen, Graphic screen,
and Annunciator screen on the Overview screen.
• When registering, specify on the screen the Loop Control Unit data by se-
lecting the Tag name set using CX-Process Tool.
• Set the communications conditions with the PLC using the system monitor
setting window (if using serial communications).
Perform the following operation.
a) Select Omron/CX-Process Monitor/CX-Process Monitor from the
Windows Start Menu.
b) Click the Start Button in the Main Window.
c) Click the Engineer Button in the Mode Selection Dialog Box.
d) Click the Set Up Button in the Mode Selection Dialog Box.
e) Enter password.
f) Click the System Monitor Builder Button in the Setup Dialog Box, and
make settings using the System Monitor Setting Window.
g) Click the Graphic Builder Button in the Setup Dialog Box, create the
Graphic Screen Create Window (including Tag name specifications),
and save.
h) Click the CRT Builder Button in the Setup Dialog Box, and register the
screen using the Builder Window (including Tag name specifications).
i) From the Builder Window Settings menu, select Save, and then click
the OK Button.
4. Check Screen Configuration Using CX-Process Monitor (Refer to 4-8
Checking Configurations).
• Check if you can monitor the Loop Control Unit using the configured
screen.
• Start FinsGateway Serial Unit communications according to the commu-
nications conditions set using the System monitor setting window by start-
19
Page 31

1-2SectionBasic Operating Procedure
ing the monitoring process (i.e., start FinsGateway Controller Link and
Ethernet manually).
Perform the following operation.
a) Click the Start Button in the Main Window.
b) Click the Engineer Button in the Mode Selection Dialog Box.
c) Click the Set Up Button in the Mode Selection Dialog Box.
d) Enter password.
e) Click the File Mapping Button in the Setup Dialog Box (mapping to the
Monitor Tag File Screen).
f) Click the Overview Button in the Mode Selection Dialog Box.
g) Select the screens using the Overview Screen, and check that each
function is operating normally.
5. Start the Monitor Operation to monitor the Loop Control Unit (Refer to Sec-
tion 3 Monitor Screen Functions and Operations for details).
Perform the following operation.
a) Click the Start Button in the Main Window.
b) Click the Operator Button in the Mode Selection Dialog Box.
c) Click the screens using the Overview Screen.
20
Page 32

This section describes installing the CX-Process and connections to the PLC.
2-1 Installation 22. . . . . . . . . . . . . . . . . . . . . . . . . . . . . . . . . . . . . . . . . . . . . . . . . . . . . . . . . . . . . .
2-1-1 Before Installing FinsGateway 22. . . . . . . . . . . . . . . . . . . . . . . . . . . . . . . . . . . . . . .
2-1-2 Installing FinsGateway 23. . . . . . . . . . . . . . . . . . . . . . . . . . . . . . . . . . . . . . . . . . . . .
2-1-3 Installing CX-Process Monitor 28. . . . . . . . . . . . . . . . . . . . . . . . . . . . . . . . . . . . . . .
2-1-4 Installing the License Key Driver 32. . . . . . . . . . . . . . . . . . . . . . . . . . . . . . . . . . . . .
2-2 Connecting the PLC 33. . . . . . . . . . . . . . . . . . . . . . . . . . . . . . . . . . . . . . . . . . . . . . . . . . . . . . .
2-2-1 Connecting via Host Link 33. . . . . . . . . . . . . . . . . . . . . . . . . . . . . . . . . . . . . . . . . . .
2-2-2 Connecting through a Controller Link Support Board 35. . . . . . . . . . . . . . . . . . . . .
2-2-3 Connections via Ethernet 35. . . . . . . . . . . . . . . . . . . . . . . . . . . . . . . . . . . . . . . . . . . .
SECTION 2
Setup
21
Page 33

2-1 Installation
Note 1. To use the CX-Process Monitor, you also need the WS02-LCTK1-EL01 Li-
2-1SectionInstallation
To use CX-Process Monitor, you must install the following software on the same
computer. After installing FinsGateway Embedded Version 3, install CX-Process Monitor.
• FinsGateway Embedded Version 3
• CX-Process Monitor
• License Key Driver
cense Key (sold separately). In addition to installing the CX-Process Monitor, make sure to first connect the WS02-LCTK1-EL01 License Key to the
computer printer port, and then install the License Key Driver before using
the CX-Process Monitor. When using the CX-Process Monitor, make sure
that the WS02-LCTK1-EL01 License Key is always connected to the printer
port.
2. This software must be installed on an computer using Windows NT 4.0 or
Windows 2000 as its OS. It will not operate on Windows 95, 98, or Me.
3. Be sure to install FinsGateway Embedded Version 3 before installing CXProcess Monitor. You cannot install CX-Process Monitor first.
4. Be aware that you cannot start CX-Process Monitor if FinsGateway Embedded Version 3 is not installed.
5. If connecting CX-Process online using a PLC and Host Link, you cannot
install and use CX-Process on the same computer as FinsGateway Version
1.
2-1-1 Before Installing FinsGateway
If an earlier version of FinsGateway has been installed already, start from Step 1:
Backing Up the FinsGateway Settings.
If FinsGateway is being installed on the computer for the first time, skip to Step 5:
ComCtl32.dll Update.
Step 1: Backing Up the
FinsGateway Settings
1, 2, 3... 1. Execute the Backup/Restore FinsGateway Setting Data program on the
If necessary, back up the previous FinsGateway settings, as follows:
Note If FinsGateway is removed (uninstalled) without backing up the setting data, the
previous setting data will all be lost.
CD.
<CD-ROM drive>:\Fgwv3\FgwUtils\SettingSalvage.exe
Step 2: Removing the
Previous FinsGateway
22
2. Select the Backup to File option, and click OK.
Remove the previous version of FinsGateway by referring to that manual for details.
Page 34

2-1SectionInstallation
Note The FinsGateway removal process does not delete all of the FinsGateway files
and registry data used by FinsGateway. As a result, the FinsGateway reinstallation process sometimes fails. If this happens, execute the following program
from the distribution CD to remove all the files and registry data used by FinsGateway.
<CD-ROM drive>:\Fgwv3\FgwUtils\FgwRemover3.exe
Step 3: System Restart
Step 4: Internet Explorer
Installation
Step 5: ComCtl32.dll
Update
Step 6: DCOM95 for
Windows 95, Version 1.3
Installation
1, 2, 3... 1. Execute the following program from the FinsGateway CD:
After removing FinsGateway, restart the computer. If the following steps are performed without restarting the computer, the installation will not be completed
properly.
If Internet Explorer is not already installed, or if the version is old, the FinsGateway installation will display a warning to update it. Update Internet Explorer.
Internet Explorer is not included with FinsGateway. Refer to the Microsoft website for details, and install the newest version.
If the operating system is Windows 95, the Windows 95 ComCtl32.dll has a bug
that must be corrected. Be sure to update the ComCtl32.dll file.
If using Windows NT 4, use the following procedure to update ComCtl32.dll for
systems where the display or other operations do not function properly.
For Windows 2000 and Windows 98 no update is necessary for this file.
Microsoft provides an update program called 401comupd.exe.
If the operating system is Windows 95, FinsGateway requires the DCOM95 for
Windows 95, version 1.3 from Microsoft.
Note If the operating system is Windows 95, FinsGateway requires the DCOM95 for
Windows 95, version 1.3 from Microsoft.
<CD-ROM drive>:\Fgwv3\Update\DCOM\English\dcom95.exe
2. The program will suggest a system restart when it finishes.
Do not proceed to the next step without restarting the computer. If the installation is continued without restarting the computer, the FinsGateway will not
operate properly.
Step 7: Updating the
HTML Help Runtime
Component
1, 2, 3... 1. Execute the following program from the FinsGateway CD:
If the HTML Help runtime component is not already installed, or if the version is
old, the FinsGateway installation will display a warning to update it. Update the
HTML Help runtime component as follows:
<CD-ROM drive>:\Fgwv3\Update\hhupd.exe
2. Update the HTML Help runtime component according to the instructions
displayed on the screen.
3. The program will suggest a system restart when it finishes.
Do not proceed to the next step without restarting the computer. If the installation is continued without restarting the computer, the FinsGateway will not
operate properly.
2-1-2 Installing FinsGateway
You cannot install and use CX-Process Tool alone. You must install FinsGateway Embedded Version 3 on the same computer.
Note FinsGateway Embedded Version 3 is bundled with CX-Process, but you can
also use FinsGateway Runtime Version 3. If FinsGateway Runtime Version 3 is
already installed, you do not need to install FinsGateway Embedded Version 3.
Use the following procedure to complete the installation.
1, 2, 3... 1. Install the FinsGateway drivers compatible with your communications pro-
tocol.
23
Page 35

2-1SectionInstallation
2. Update FinsGateway.
First, install the FinsGateway drivers compatible with your communications protocol.
1, 2, 3... 1. Using Explorer, select one of the following folders from within the FinsGate-
way V2 folder on the CD-ROM, depending on the communications protocol
compatible with your PLC.
CLK (PCI) Select if connecting CX-Process Tool and CX-Process Monitor to your
Serial Select if connecting CX-Process Tool and CX-Process Monitor to your
Clk Select if connecting CX-Process Tool and CX-Process Monitor to your
Etn Select if connecting CX-Process Tool and CX-Process Monitor to your
PLC (Programmable Controller) using the Controller Link Support
Board for a PCI Bus.
PLC (Programmable Controller) using the Host Link.
PLC (Programmable Controller) using the the Controller Link Support
Board for an ISA Bus.
PLC (Programmable Controller) using an Ethernet.
The following explanation is for Host Link.
2. On the CD-ROM, select Serial, and then disk1, and then double-click the
Setup.exe icon as shown below.
The following screen will be displayed.
24
Page 36

2-1SectionInstallation
3. Click the Next Button. The User Registration Dialog Box will be displayed.
4. Enter your name and organization, and then click the OK Button. The Note
Dialog Box will be displayed.
5. Click the Yes Button. The Choose Destination Location Dialog Box will be
displayed.
6. Click the Next Button. The Select Program Folder Dialog Box will be displayed.
25
Page 37

7. Check the installation destination is correct, and then click the Next Button.
Installation will start automatically.
When installation is completed, the following dialog box will be displayed.
8. Click the Finish Button.
Next, update FinsGateway.
9. On the CD-ROM, select Fgwv3, and then FgwUpdate, and then double-
click the FgwUpdate3.exe icon as shown below.
2-1SectionInstallation
FgwUpdate3.exe
10. The following screen will be displayed.
26
Page 38

2-1SectionInstallation
11. Click the Next Button. The Select Program Folder Dialog Box will be displayed.
12. Check the installation destination is correct, and then click the Next Button.
The Start Copying Files Dialog Box will be displayed.
13. Check the installation destination is correct, and click the Next Button.
Installation will start automatically.
When installation is completed, the following dialog box will be displayed.
14. Click the Finish Button.
The FinsGateway installation is now completed.
Note You cannot start CX-Process Monitor if FinsGateway is not installed.
27
Page 39

2-1-3 Installing CX-Process Monitor
1, 2, 3... 1. Insert the installation CD-ROM in the CD-ROM drive.
2. On the CD-ROM, select CX-Process Monitor, and then disk1, and then
double-click the Setup.exe icon as shown below.
After the Preparing Setup Dialog Box has been displayed, the following
screen will appear.
2-1SectionInstallation
28
3. Click the Next button. The Software License Agreement Dialog Box will be
displayed.
4. Click the Yes Button.
The Read Me Information Dialog Box will be displayed.
5. Click the Next Button.
The User Information Dialog Box will be displayed.
6. Enter your name and company name, and then click the Next Button.
Page 40

2-1SectionInstallation
The Choose Destination Location Dialog Box will be displayed.
7. Specify the drive and folder to which you want to install CX-Process Monitor.
The default is as follows:
C:\ Program Files\omron\CX-Process Monitor
You do not need to make any changes to install to the directory displayed.
To change the destination, click the Browse Button, and then select the directory.
8. Click the Next Button. The Select Program Folder Dialog Box will be displayed. Select the program folder. The default is as follows:
Omron/CX-Process Monitor
9. Click the Next Button.
29
Page 41

The Start Copying Files Dialog Box will be displayed.
10. Click the Next Button.
Installation will start automatically.
Note a) If there is already a DB folder (Monitor Tag file) in the destination
folder, the following dialog box will be displayed.
2-1SectionInstallation
• Click the Yes Button to import the existing DB folder.
• Click the No Button to not import the existing DB folder.
b) If trend data created on version 1.50 or earlier of the software ex-
ists in the destination folder, a dialog box will be displayed asking if
the trend data should be converted to data for version
2.00/2.50/2.60.
30
Page 42

2-1SectionInstallation
If conversion is specified, the following dialog box will be displayed.
Specify the path of the CX-Process Monitor tags (i.e., the db path)
and click the Execute Button. (If there is more than one tag file,
double-click TrgrpCnv.exe under Omron\CX-Process Monitor to dis-
play the above Trend File Conversion Dialog Box. Then click the
Browse Button, specify the tag file, and click the Execute Button to
convert each file.) When conversion is completed, click the Finish
Button.
The installation process will continue.
If installation is completed normally, the following dialog box will be dis-
played.
11. Click the Finish Button.
Note 1. To uninstall CX-Process Monitor, first end the Monitor process (from the Set-
up Dialog Box, click the Shut Down Button), and then uninstall.
2. If the dialog box in step 10 is displayed while CX-Process Monitor is being
installed (refer to note (a) in step 10 on page 30), after installation select
31
Page 43

System Info from the Set up Menu and then open CRT Builder. After saving
once, set the main system settings.
2-1-4 Installing the License Key Driver
This section describes the License key driver installation procedure. You can
also install the License key driver before installing CX-Process Monitor.
1, 2, 3... 1. Connect the WS02-LCTK1-EL01 License Key to your computer printer port.
2. Using Explorer, select Setup.exe from the SystemDriver folder on the CDROM.
3. After installation is completed, be sure to restart Windows NT/2000.
Note If your computer is a Fujitsu FM/V, after installing the License Key
Driver, you must cycle the power supply to the computer, and then
restart Windows NT/2000.
2-1SectionInstallation
WS02-LCTK1-EL01
Note 1. When using the CX-Process Monitor, make sure that the the
WS02-LCTK1-EL01 License Key is always connected to the printer port. If
the WS02-LCTK1-EL01 License Key is not connected to the computer printer port, or even if it is connected, if the License key driver is not installed, you
cannot use CX-Process Monitor.
2. Even if the License key driver is installed, nothing will be displayed on the
screen. To check that the driver is installed correctly, select Settings, and
then Control Panel, and then Multimedia. Check using the Multimedia
Properties dialog box, by selecting Other Multimedia Devices, and then
displaying Sentinel for i386 Systems.
3. To uninstall the License key driver, in the Multimedia Properties dialog box,
select Sentinel for i386 Systems, and then select the Remove Button.
32
Page 44

2-2 Connecting the PLC
The following three methods can be used to connect to the PLC. Regardless of
the connection method, the FinsGateway communications driver (embedded
version 2) is used.
2-2SectionConnecting the PLC
Communications
network
Host Link Network
(See note.)
Controller Link
Network
Ethernet Network ETN_UNIT Driver Connecting through the Ethernet
Note Host Link communications use FINS commands wrapped in header and termi-
nator data (i.e., SYSWAY-CV for FinsGateway). Host Link communications
(SYSMAC WAY) is set for the PLC.
2-2-1 Connecting via Host Link
The personal computer uses the FinsGateway’s Serial Unit Driver to connect to
the peripheral or RS-232C port of the PLC via Host Link communications.
FinsGateway
Contents
communications
driver
Serial Unit Driver Connecting to the peripheral or
RS-232C port of the PLC over
Host Link.
CLK (PCI slot) Driver
(Not supported by
FinsGateway Version
Connecting through the Controller
Link Support Board to a PLC with
a Controller Link Unit mounted.
2)
Board to a PLC with an Ethernet
Unit mounted.
Connections to the Peripheral
Port of the CPU Unit
CX-Process
Tool
IBM PC/AT or
compatible
(9-pin male)
CS1W-CN226 or
CS1W-CN626
Connecting Cable
Loop Control Unit
Note 1. The Serial Communications Mode must be set to Host Link.
Connections to the RS-232C port of the CPU
Unit or Serial Communications Board or Unit
CS1 CPU Unit
Peripheral
port
CX-Process
Tool
IBM PC/AT or
compatible
(9-pin male)
XW2Z-200S-CV
Connecting Cable
Loop Control Unit
CS1 CPU Unit
RS-232C Port
Host Link communications use FINS commands wrapped in header and terminator data (i.e., SYSWAY-CV for FinsGateway). The peripheral bus cannot be used.
2. The FinsGateway Version 2 Serial Unit Driver must be installed to enable
connecting the PLC via Host Link communications.
3. The following Connecting Cables are used to connect the CX-Process Tool
(personal computer) to the PLC (CPU Unit or Serial Communications
Board/Unit).
33
Page 45

Connecting Cables
p
p
RS 232C port
connector
RS 232C port
AT or
SUB
WAY (Host
munications
Port
2-2SectionConnecting the PLC
Unit Port on Unit Comput-
CPU Unit Built-in pe-
ripheral port AT or
Built-in
RS-232C port
Female 9-pin
D-SUB
Serial Communications
Board or Unit
RS-232C port
Female 9-pin
D-SUB
Note Touch a grounded metal to discharge all static electricity from your body before
Unit Port on Unit Comput-
CPU Unit Built-in pe-
ripheral port
er
IBM PC/
compatible
Port on
computer
Male 9-pin DSUB
Serial Com-
munications
Mode
Host Link
Model Length Remarks
CS1W-CN226 2.0 m
CS1W-CN626 6.0 m
XW2Z-200S-CV 2 m
XW2Z-500S-CV 5 m
XW2Z-200S-CV 2 m
XW2Z-500S-CV 5 m
---
Anti-static
connector
anti-static
connector
connecting any of the above cable connectors to the RS-232C port of the PLC.
The XW2Z-jjjS-CV Cable uses the anti-static XM2S-0911-E Connector
Hood. For safety sake, however, discharge all static electricity from your body
before touching the connector.
The following components are used to connect RS-232C cable to the peripheral
port.
er
IBM PC/
AT or
compatible
Port on
computer
Male 9-pin DSUB
Serial Com-
munications
Mode
SYSMAC
WAY (Host
Link)
Model Length Remarks
CS1W-CN118 +
XW2Z-200SCV/500S-CV
CS1W-CN118 +
XW2Z-200S-V/
500S-V
0.1 m +
(2 or
5 m)
The
XW-2Zjjj
S-CV is an
anti-static
connector.
---
The following components are available for connecting the CQM1-CIF01 or
CQM1-CIF02 Cable to the peripheral port.
Unit Port on Unit Comput-
CPU Unit Built-in pe-
ripheral port
er
IBM PC/
AT or
compatible
Port on
computer
Male 9-pin DSUB
Serial Com-
munications
SYSMAC
WAY (Host
Link)
The following components are available for connecting the IBM PC/AT or compatible over RS-232C
Unit Port on Unit PLC Port on PLC Serial Com-
munications
CPU Unit Built-in
RS-232C port
Female 9-pin
D-SUB
Serial Communications
Board or Unit
RS-232C
Port
Female 9-pin
D-SUB
IBM PC/
AT or
compatible
Male 9-pin DSUB
SYSMAC
WAY (Host
Link)
Mode
Mode
Model Length Remarks
CS1W-CN114 +
CQM1-CIF02
Model Length Remarks
XW2Z-200S-V 2 m
XW2Z-500S-V 5 m
XW2Z-200S-V 2 m
XW2Z-500S-V 5 m
0.05 m +
3.3 m
---
---
34
Page 46

2-2-2 Connecting through a Controller Link Support Board
(ring configuration)
compatible (PCI
Driver
(y
The personal computer uses the FinsGateway Version 2 Controller Link Driver
to connect to the PLC over a Controller Link Network.
Controller Link Unit
Models
Controller Link Support
Boards
CX-Process Monitor
(IBM PC/AT or
compatible)
Note The FinsGateway Version 2 Controller Link Driver must be installed to enable
connecting the PLC via a Controller Link Network.
Controller Link
Unit
CS1W-CLK21-V1
CS1W-CLK11-V1 Optical Optical fiber cable
CS1W-CLK12-V1 Optical Ring Optical fiber cable
CS1W-CLK52-V1 Optical GI Optical fiber
Controller Link
Support Board
3G8F7-CLK12-V1
Loop Control Unit
Controller
Link Unit
Controller Link Support Board
PLC Unit Type Transmission
CS1 CPU Bus Unit
Transmission
medium
Optical fiber cable
IBM PC/AT or
Loop Control Unit
Controller
Link Unit
Controller Link Network
Wired Twisted-pair cable
Computer FinsGateway
2-2SectionConnecting the PLC
path
cable
Driver
CLK (PCI slot)
3G8F7-CLK52-V1
3G8F7-CLK21-V1 Wire
3G8F5-CLK11-V1 Optical fiber cable
3G8F5-CLK21-V1 Wire
Note When connecting the CX-Process Monitor to a PLC via Controller Link, refer to
Appendix B FinsGateway Settings when Connected Using Controller Link for
details on FinsGateway Settings.
2-2-3 Connections via Ethernet
The personal computer uses the FinsGateway Version 2 ETN_UNIT Driver to
connects to the PLC via Ethernet.
CX-Process Tool
IBM PC/AT or
compatible
Note The FinsGateway Version 2 ETN_UNIT Driver must be installed to enable con-
necting the PLC via Ethernet.
Ethernet Unit Model
Model PLC Unit Transmission path
CS1W-ETN01
CS1W-ETN11 Ethernet 10Base-T
slot)
IBM PC/AT or
compatible Driver
Loop Control Unit
Ethernet Unit
Ethernet
Ethernet Board
CS1 CPU Bus Unit
(FinsGateway
Version 2 cannot
be used.)
Controller Link
Loop Control Unit
Ethernet Unit
Ethernet 10Base-5
35
Page 47

Monitor Screen Functions and Operations
This section describes the monitor screens used with the CX-Process Monitor.
3-1 Outline 38. . . . . . . . . . . . . . . . . . . . . . . . . . . . . . . . . . . . . . . . . . . . . . . . . . . . . . . . . . . . . . . . .
3-2 Procedure to Start Monitoring 38. . . . . . . . . . . . . . . . . . . . . . . . . . . . . . . . . . . . . . . . . . . . . . .
3-3 Starting and Stopping 39. . . . . . . . . . . . . . . . . . . . . . . . . . . . . . . . . . . . . . . . . . . . . . . . . . . . . .
3-4 Overview Screen 40. . . . . . . . . . . . . . . . . . . . . . . . . . . . . . . . . . . . . . . . . . . . . . . . . . . . . . . . .
3-5 Screen Configurations 42. . . . . . . . . . . . . . . . . . . . . . . . . . . . . . . . . . . . . . . . . . . . . . . . . . . . .
3-6 Control Screens 44. . . . . . . . . . . . . . . . . . . . . . . . . . . . . . . . . . . . . . . . . . . . . . . . . . . . . . . . . .
3-6-1 Outline 44. . . . . . . . . . . . . . . . . . . . . . . . . . . . . . . . . . . . . . . . . . . . . . . . . . . . . . . . . .
3-6-2 Basic Displays and Operations 45. . . . . . . . . . . . . . . . . . . . . . . . . . . . . . . . . . . . . . .
3-6-3 Display Examples 47. . . . . . . . . . . . . . . . . . . . . . . . . . . . . . . . . . . . . . . . . . . . . . . . .
3-7 Tuning Screens 52. . . . . . . . . . . . . . . . . . . . . . . . . . . . . . . . . . . . . . . . . . . . . . . . . . . . . . . . . . .
3-8 Trend Screens 57. . . . . . . . . . . . . . . . . . . . . . . . . . . . . . . . . . . . . . . . . . . . . . . . . . . . . . . . . . . .
3-9 Graphic Screens 63. . . . . . . . . . . . . . . . . . . . . . . . . . . . . . . . . . . . . . . . . . . . . . . . . . . . . . . . . .
3-10 Annunciator Screens 64. . . . . . . . . . . . . . . . . . . . . . . . . . . . . . . . . . . . . . . . . . . . . . . . . . . . . .
3-11 Operation Guide Message Screens 65. . . . . . . . . . . . . . . . . . . . . . . . . . . . . . . . . . . . . . . . . . . .
3-12 Alarm Log Screens 67. . . . . . . . . . . . . . . . . . . . . . . . . . . . . . . . . . . . . . . . . . . . . . . . . . . . . . . .
3-13 Operation Log Screens 68. . . . . . . . . . . . . . . . . . . . . . . . . . . . . . . . . . . . . . . . . . . . . . . . . . . . .
3-14 System Monitor Screens 69. . . . . . . . . . . . . . . . . . . . . . . . . . . . . . . . . . . . . . . . . . . . . . . . . . . .
3-14-1 System Monitor Screen Outline 69. . . . . . . . . . . . . . . . . . . . . . . . . . . . . . . . . . . . . . .
3-14-2 Loop Control Unit Run/Stop 70. . . . . . . . . . . . . . . . . . . . . . . . . . . . . . . . . . . . . . . . .
3-14-3 Function Block Error Dialog Box Operations 71. . . . . . . . . . . . . . . . . . . . . . . . . . . .
3-14-4 Data Link Status 75. . . . . . . . . . . . . . . . . . . . . . . . . . . . . . . . . . . . . . . . . . . . . . . . . . .
3-15 System Monitor Log Screens 77. . . . . . . . . . . . . . . . . . . . . . . . . . . . . . . . . . . . . . . . . . . . . . . .
SECTION 3
37
Page 48

3-1 Outline
y
3-2SectionProcedure to Start Monitoring
This section explains the functions and operations for each screen primarily for
those people who will operate CX-Process Monitor. The explanations assume
that CX-Process Tool settings and screen configuration for the CX-Process
Monitor have already been completed.
Refer to Section 4 Screen Configuration for how to configure CX-Process Monitor screens. Also, refer to CX-Process Tool Operation Manual (W372) for CX-
Process Tool settings.
CX-Process Monitor screen configuration is already completed, monitor the
Loop Control Unit mainly by performing the following operations.
1, 2, 3... 1. Start CX-Process Monitor (refer to 3-3 Starting and Stopping CX-Process
Monitor).
2. In the Mode Selection Dialog Box, click the Operator Button to display the
Overview Screen (refer to 3-3 Starting and Stopping CX-Process Monitor).
3. From the Overview Screen, move to each of the following screens.
• Control Screen (see 3-6 Control Screens)
• Tuning Screen (see 3-7 Tuning Screens)
• Trend Screen (see 3-8 Trend Screens)
• Graphic Screen (see 3-9 Graphic Screens)
• Annunciator Screen (see 3-10 Annunciator Screens)
• Operation Guide Message Screen (see 3-11 Operation Guide Message
Screens)
• Alarm Log Screen (see 3-12 Alarm Log Screens)
• Operation Log Screen (see 3-13 Operation Log Screens)
• System Monitor Screen (see 3-14 System Monitor Screens)
• System Monitor Log Screen (see 3-15 System Monitor Log Screens)
Note If the WS02-LCTK1-JL01 License key is not connected to the computer printer
port, or even if it is connected, if the License key driver is not installed, you cannot use the following monitor screens or configuration screens. (If you try to
switch to the following screens, an error message will be displayed.)
Monitor Screens
Item Screen
User-defined screens
System screens
Trend screen
Graphic screen
Operation Guide screen
Alarm Log screen
Operation Log screen
System Monitor Log screen
3-2 Procedure to Start Monitoring
The procedure until starting monitoring is as follows:
1, 2, 3... 1. Select Start, Programs, Omron, CX-Process Monitor, CX-Process Mon-
itor.
2. In the Main Window, click the Start Button.
3. In the Mode Selection Dialog Box, click the Operator Button.
4. In the Overview Screen, select Control Screen, Trend Screen, etc. as required.
Note Steps 2 and 3 will not be required and a specified screen will be displayed if auto-
starting is enabled. Autostarting can be enabled by clicking the System Info.
38
Page 49

Button when configuring the screen and then setting the Auto-start–Auto-start
setting to Enable.
3-3 Starting and Stopping
This section explains how to start and stop CX-Process Monitor.
1, 2, 3... 1. Select Start, Programs, Omron, CX-Process Monitor, CX-Process Mon-
itor.
The CX-Process Monitor’s Main Window will be displayed.
Main Window
3-3SectionStarting and Stopping
Mode Selection Dialog Box
Note When you have finished using CX-Process Monitor, click the Exit
Button in the Main Window. The Main Window and CX-Process Monitor will both close.
2. Click the Start Button.
The Mode Selection Dialog Box will be displayed.
If configuration has already been completed, display the Overview Screen
using the step after next, and start monitoring. Refer to Section 4 Screen
Configuration for configuration.
Select the Operator Button
3. In the Mode field, select the Operator Button.
39
Page 50

3-4SectionOverview Screen
The monitoring process will be started and the Overview Screen will be displayed (Refer to 3-4 Overview Screen).
Note a) Steps 2 and 3, above, will not be required and the Overview
Screen will be displayed immediately if auto-starting has been
specified by setting the Auto-start–Auto-start setting to Enable.
b) To finish using CX-Process Monitor while in Operator mode, click
the Close Button in the top right of the Overview Screen, and the
monitor process will automatically end. In Engineer mode, click
the Close Button in the top right of the Overview Screen. If the
monitor process is running, a dialog box will be displayed to confirm whether the monitor process should be ended or not. Select
Yes to end the monitor process. Select No to continue running the
monitor process.
3-4 Overview Screen
The Overview Screen displays all the menu screens and displays alarms.
Click this button to move to the Control screen
Each button represents
one loop. Click the button
to display the Tuning
screen for the loop.
If a user-set error
occurs, the button for
the Annunciator
screen will flash.
40
The button icons for the registered Control Screen, Trend Screen, Graphic
Screen, and Annunciator Screen will be displayed.
Page 51

3-4SectionOverview Screen
Icon Screen type
Control Screen
Trend Screen
Graphic Screen
Annunciator Screen
Each screen displays eight rows and four columns to a maximum of 32 screens.
The alarm status for each loop is shown on the Control Screen button.
Select the icon to move to the registered screen.
If a user-set alarm occurs, the icon for the Annunciator Screen flashes.
When returning to the Overview Screen from any screen, first select Overview
from among the screen selection buttons, and then select the Overview Screen
name.
More than one Overview Screen can be displayed by clicking the System Info.
Button when configuring the screen and then setting the Multi-screen–Multiscreen setting to Enable. Refer to 4-7 System Information Settings for details.
Note Auto-starting can be disabled by clicking the right mouse button at the top of an
Overview Screen. Click the Yes Button on the dialog box that appears and then
set Auto-start to Disable.
41
Page 52

3-5 Screen Configurations
This section explains the configuration of the CX-Process Monitor Screen as a
whole. The following example shows the Overview Screen.
Screen Selection Buttons: Right-click
here to confirm the CRT-ID, group
number, and position of the screen
specified for automatic startup.
Refer to the table below for each
button’s function.
Click here and then set a tag
name to select any Tuning
Screen.
When a new message
appears in the
Operation Guide
Screen, a red mark is
displayed, and a
buzzer will sound at
the same time.
3-5SectionScreen Configurations
System Monitor Message Display Area:
Displays the most recent System Monitor
message, and a buzzer will sound at the same
time. The message is stored in the System
Monitor Log.
Click the Button to delete the message.
The buzzer will also stop at the same time.
Use these buttons to
scroll to other displays
of the same type
without going through
the Overview Screen.
Alarm Message
Display Area:
Displays the most
recent alarm
message, and a
buzzer will sound at
the same time. The
message is stored on
the Alarm Log
screen.
Click the Button
to delete the
message. The
buzzer will also stop
at the same time.
Prints a hardcopy of the screen.
Return to previous screen
This area displays
all the Monitor
Screens. The
example shows the
Overview Screen.
Use the Screen
Selection Buttons to
change the display.
Displays the date and time
Note The bottom line will appear as follows for some screens.
Prints error log data on Operation Guide
Message Screens, Alarm Log Screens,
Operation Log Screens, and System
Monitor Log Screens.
42
Page 53

3-5SectionScreen Configurations
Screen Selection
Buttons
Button name Function
Overview Displays the Overview Screen. If multiple Overview Screens
are registered, a pull-down menu will be displayed from
which you can select the Overview Screen you want.
Alarm Displays the Alarm Log Screen.
Operation Log Displays the Operation Log Screen.
Operation Guide Displays the Operation Guide Message Screen.
System Monitor Displays the System Monitor Screen to show system status.
System Monitor Log Displays the System Monitor Log Screen, which registers
system messages.
About Displays information on the CX-Process Monitor version.
43
Page 54

3-6 Control Screens
3-6-1 Outline
Use Control Screens to monitor and set the Control Block and part of the Operation Block, to monitor analog signals, and to monitor and set contact signals. For
the Control Block in particular, use the Control screen to perform such operations as monitoring Set Point (SP), Process Variable (PV), Manipulated Variable
(MV) run status, and Set Point (SP) changes, etc.
Click the Control Screen Button in the Overview screen to display the following
information on the Control Screen.
• You can display up to a maximum of eight loops per screen of PID, Indica-
tors, and other Control Blocks as on-site Instrument images. The maximum is 400 screens x eight loops.
• You can perform SP changes, auto/manual switching, and manual opera-
tions, etc. (Items indicated by a Button can be changed. Items without a
Button are displayed only.)
• You can also move to the Tuning Screen.
Block name (mode) Send source function block, or ITEM
Target function
block
Display SP, PV, MV, A/M status, R/L status (See note 1), bar color change
Setting SP, MV (only in manual mode), A/M switching (See note 3), R/L
1-Block Send Terminal to
Computer (403)
4-Block Send Terminal to
Computer (404)
AO to Computer (402), AO
Terminal to All Nodes (408)
DO to Computer (401), DO
Terminal to All Nodes (407)
AO Terminal Settings from
Computer (410)
DO Terminal Settings from
Computer (409)
Control Block: Basic PID (011), Advanced PID (012), Batch
flowrate capture (014), Indication and Setting (031), Indication and
Operation (032), Ratio Setting (033), Indicator (034), blended PID
(013), 2-position ON/OFF (001), 3-position ON/OFF (002)
Control Block: Basic PID (011), Advanced PID (012), Indication
and Setting (031), Indication and Operation (032), Ratio Setting
(033), Indicator (034), 2-position ON/OFF (001), 3-position
ON/OFF (002)
Operation Block: High/Low Alarm (111), Segment Program 2(157),
ON/OFF Valve Manipulator (221), Motor Manipulator (222),
Reversible Motor Manipulator (223), Motor Opening Manipulator
(224), Timer (205), Counter (208)
Analog input signals or analog output signals for all function
blocks, or analog value parameters
Contact input signals or contact output signals for all function
blocks, or contact value parameters
Analog output ITEM for AO Terminal Settings from Computer
(Used to set ordinary analog values. Displays using network
resend monitoring.)
Contact output ITEM for DO Terminal Settings from Computer
(Used to set ordinary contact values. Displays using network
resend monitoring.)
analog signal when an alarm occurs, contact signal
switching (See note 1 and note 2)
Contact signal (See note 4)
3-6SectionControl Screens
44
Note 1. When the SP setting (local only, or remote/local both possible) for ITEM024
for Basic PID, Advanced PID, Indication and Setting, Ratio Setting, 2-position ON/OFF, and 3-position ON/OFF is 1 (remote/local both possible), CAS
is displayed. If the setting is 0 (local only), nothing is displayed.
2. When the SP setting (local only, or remote/local both possible) for ITEM024
for Basic PID, Advanced PID, Indication and Setting, Ratio Setting, 2-position ON/OFF, and 3-position ON/OFF is 1 (remote/local both possible), CAS
is displayed, and settings can be made.
3. When set to remote, only auto is possible; manual is disabled (this limit only
applies to CX-Process Monitor).
4. Analog signals are not possible.
Page 55

3-6-2 Basic Displays and Operations
Basic PID (011)
Click this button to move to the Tuning
screen. See 3-7 Tuning Screen for details.
3-6SectionControl Screens
Click this button to display the Set
Label Dialog Box.
SP Change Button
HH (High/High Alarm)
H (High Alarm)
Displays SP position
PV bar display
L (Low Alarm)
LL (Low/Low Alarm)
Manual Pointer
MV Change Button
PV numerical value display
SP numerical value display
Remote/local switch
Up/Down Buttons to change SP
Switch to AUTO Button
Switch to MAN Button
Display MV position
Display MV
numerical value
Up/Down Buttons to
change MV
PV Bar Display
Changing SP
Changing MV
Remote/Local (R/L)
Switching
Displays the PV range from upper to lower limit as a bar.
Green: Status normal
Red: PV Alarm (either HH, H, L, LL)
Yellow: Deviation Alarm
Blue: Alarm OFF
Light blue: Function block calculations stopped
Change SP using the SP Change Up/Down Buttons.
First press the SP Button, select the value column, and then enter the change
using the ten-key dialog (using the mouse), or the keyboard. (The ten-key pad is
displayed when the input box is selected. To enable inputting from the ten-key,
click the System Info. Button in the Setup Dialog Box, and then change the setting to enable the ten-key.
Change the MP using the MP Change Up/Down Buttons.
First press the MP Button, and then enter the change using the ten-key dialog
box (using the mouse), or the keyboard.
When the SP setting (local only, or remote/local both possible) for ITEM024 for
Basic PID, Advanced PID, Indication and Setting, Ratio Setting, 2-position ON/
OFF, and 3-position ON/OFF is 1 (remote/local both possible), CAS is displayed.
When the CAS Button is red, the setting is on remote SP. When the CAS Button
is blue, the setting is on local SP. Click the CAS Button to switch the setting.
Note When the CX-Process Monitor is set to Remote SP, A/M automatically switches
to AUTO. You cannot set Manual.
45
Page 56

3-6SectionControl Screens
A/M Switching
When AUTO is lit red, the setting is AUTO. You can change the SP value. When
MAN is lit blue, the setting is manual. You can change MV and SP values. Select
AUTO or MAN to switch.
MV Adjustment Area Details
Basic PID (011), Advanced PID (012), Batch Flowrate Capture (014), Indication and Operation (032),
Ratio Setting (033)
MV open direction
enabled (0%)
AUTO or
remote (CAS)
No Manual Pointer
MV open direction
enabled (100%)
Manual
AUTO or
remote (CAS)
Manual
Pointer
Output limit (ML) Output limit (MH)
MV open direction
disabled
Manual
Make Manual Pointer and MV open direction settings when registering the Control Screen. Refer to 4-6 Screen Configuration for details.
Make output limit (ML, MH) settings using the Tuning screen. Refer to 3-7 Tuning
Screen for details.
2-position ON/OFF (001) 3-position ON/OFF (002)
AUTO or remote (CAS) AUTO or MAN AUTO or remote (CAS) AUTO or MAN
Output operation switches
Output operation switches
46
Page 57

3-6-3 Display Examples
3-6SectionControl Screens
Indication and Setting (031)
Click this button to move to the Tuning screen.
See 3-7 Tuning Screen for details.
Click this button to display
the Set Label Dialog Box.
SP Change Button
HH (High/High Alarm)
H (High Alarm)
SP position
display
PV bar display
L (Low Alarm)
LL (Low/Low Alarm)
PV Bar Display
Displays the PV range from upper to lower limit as a bar.
Green: Status normal
Red: PV Alarm (either HH, H, L, LL)
Blue: Alarm OFF
Light blue: Function block calculations stopped
PV numerical
value display
SP numerical
value display
Switch to Remote Button
Up/Down Buttons
to change SP
Switch to Local Button
Indication and Operation (032)
Click this button to move to the Tuning screen.
See 3-7 Tuning Screen for details.
Click this button to
display the Set Label
Dialog Box.
PV numerical
value display
AUTO input numerical
value display
HH (High/High Alarm)
H (High Alarm)
PV bar display
AUTO input
position display
L (Low Alarm)
LL (Low/Low Alarm)
PV Bar Display
Displays the PV range from upper to lower limit as a bar.
Green: Status normal
Red: PV Alarm (either HH, H, L, LL)
Blue: Alarm OFF
Light blue: Function block calculations stopped
Switch to AUTO Button
Switch to MAN Button
Ratio Setting (033)
Click this button to move to the Tuning screen.
See 3-7 Tuning Screen for details.
Click this button to display
the Set Label Dialog Box.
SP (Ratio)
Change Button
SP (ratio)
position
display
PV bar display
PV Bar Display
Displays the PV range from upper to lower limit as a bar.
Green: Status normal
Red: PV Alarm (either HH, H, L, LL)
Blue: Alarm OFF
Light blue: Function block calculations stopped
PV numerical
value display
SP (ratio) numerical
value display
Switch to
Remote Button
Up/Down Buttons to
change SP (ratio)
Switch to AUTO Button
Switch to MAN Button
Indicator (034)
Click this button to move to the Tuning screen.
See 3-7 Tuning Screen for details.
Click this button to
display the Set Label
Dialog Box.
PV numerical
value display
HH (High/High Alarm)
H (High Alarm)
PV bar display
L (Low Alarm)
LL (Low/Low Alarm)
PV Bar Display
Displays the PV range from upper to lower limit as a bar.
Green: Status normal
Red: PV Alarm (either HH, H, L, LL)
Blue: Alarm OFF
Light blue: Function block calculations stopped
47
Page 58

3-6SectionControl Screens
High/Low Alarm (111)
Click this button to move to the Tuning screen.
See 3-7 Tuning Screen for details.
H (High Alarm)
PV bar display
L (Low Alarm)
PV Bar Display
Displays the PV range from upper to lower limit as a bar.
Green: Status normal
Red: Alarm
Light blue: Function block calculations stopped
PV numerical value display
H (High Alarm)
Setting Button
H (High Alarm)
set value
L (Low Alarm)
Setting Button
L (Low Alarm) set value
Batch Flowrate Capture (014)
Click this button to move to the Tuning screen.
See 3-7 Tuning Screen for details.
Batch accumulated
value display
Accumulation Counter
Reset Button (S3)
SP (1 Batch)
Change Button
Batch Run
Button (S1 = ON)
Batch Stop
Button (S1 = OFF)
Click this button to display
the Set Label Dialog Box.
Instantaneous value of
flowrate display
Switch to
Remote Button
Preset value (BM) display
Batch accumulated value
(SM) display
SP numerical value display
Main batch display
Pre-batch display
Control Restart Button
(S2 = OFF)
Control Interrupt Button
(S2 = ON)
Switch to AUTO Button
Switch to MAN Button
Blended PID (013)
Click this button to move
to the Tuning screen.
See 3-7 Tuning Screen
for details.
PV bar display
PV Bar Display
Displays the PV range from upper to lower limit as a bar.
Green: Status normal
Red: Deviation Alarm (DHH, DH, DL, or DLL)
Yellow: MV Limit High/Low
Blue: Alarm OFF
Light blue: Function block calculations stopped
Click this button to display
the Set Label Dialog Box.
PV numerical value display
SP numerical value display
SP position display
Switch to AUTO Button
Switch to MAN Button
Segment Program 2 (157)
Position of program
output value display
Bar display for
reference input
value
Run Command/
Display Button
Stop Command/
Display Button
Step number
executing
Reference input
value display
Program output
numerical value
Move to Next Wait
Command Button
(Red during WAIT)
Move to Next Step
Command Button
Time Axis Hold
Cancel Button
Time Axis Hold Button
48
Page 59

3-6SectionControl Screens
Timer (205)
SP (Set Value)
Change Button
Prediction Value
Change Button
Run Command
Button
Stop Command
(Timer Reset)
Button
ON/OFF Valve Manipulator (221)
Click this button to display
the Set Label Dialog Box.
SP (Set Value)
Change Button
Numerical display of time elapsed
Set value display
Prediction value display
Time unit display
Indicates arrival at
set value
Indicates arrival at
prediction value
Operation Restart Button
Operation Interrupt Button
Click this button to display
the Set Label Dialog Box.
Prediction Value
Change Button
Counter (208)
Run Command
Button
Stop Command
(Counter Reset)
Button
Motor Manipulation (222)
Click this button to display
the Set Label Dialog Box.
Count display
Set value display
Prediction value
display
Indicates arrival at
set value
Indicates arrival at
prediction value
Click this button to display
the Set Label Dialog Box.
Valve open midway
(U3) indicator
Limit switch closed
indicator
Switch to AUTO Button
ON/OFF Buttons
Switch to MAN Button
Manipulation site (S4)
selection indicator
Indicates when limit
switch is closed (S6)
Valve action time
error (U2) indicator
CT input
high alarm
Switch to AUTO Button
Bar display
for CT input
Answer output
(S5 = OFF)
indicator
PV Bar Display
Displays the PV range from upper to lower limit as a bar.
Green: Status normal
Red: Alarm (H)
ON/OFF Buttons
Switch to MAN Button
Manipulation site (S4)
selection indicator
Answer input
(S5 = ON) indicator
Answer error (U2) indicator
49
Page 60

3-6SectionControl Screens
Reversible Motor Manipulator (223)
Click this button to display
the Set Label Dialog Box.
H (CT input
high alarm)
Switch to AUTO Button
Bar display
for CT input
FWD/REV/STOP Buttons
STOP answer
indicator
REV answer
(S9) indicator
PV Bar Display
Displays the PV range from upper to lower limit as a bar.
Green: Status normal
Red: Alarm (H)
Switch to MAN Button
Manipulation site (S7)
selection indicator
FWD answer
(S8) indicator
Answer error (S8) indicator
Motor Opening Manipulator (224)
SP Change
Button
H (opening input
high alarm)
Displays SP position
Bar display for
opening input
L (opening input
low alarm)
Stop manipulation
output display
Close manipulation
output (U2) indicator
PV Bar Display
Displays the PV range from upper to lower limit as a bar.
Green: Status normal
Red: Alarm (H)
Click this button to display
the Set Label Dialog Box.
Opening input numerical
value display
SP numerical value display
Switch to AUTO Button
FWD/REV/STOP Buttons
Switch to MAN Button
Manipulation site (S2)
selection indicator
Open manipulation
output (U1) indicator
Thermal relay
(S4) indicator
Control Screen for 1-Block Send Terminal to Computer
50
Page 61

Control Screen for 4-Block Send Terminal to Computer
You cannot move to
the Tuning screen from
the Control screen for
4-Block Send Terminal
to Computer.
Control Screen for AO Terminal Settings from Computer, AO to Computer, and AO Terminal to All
Nodes
3-6SectionControl Screens
Note As shown above, the AO Terminal to All Nodes Function Block cannot be ad-
justed using the display alone.
51
Page 62

Control Screen for DO Terminal Settings from Computer, DO to Computer, and DO Terminal to All
Nodes
3-7SectionTuning Screens
DO Terminal Settings from
Computer: You can turn
ON/OFF contacts
displayed in red.
3-7 Tuning Screens
Use Tuning Screens to change Control Block P, I, and D constants specified using 1-Block Send Terminal to Computer.
• You can set the parameters for PID Block P, I, D, and alarm set values.
• You can make adjustments while monitoring PV, SP, and MV trends.
• A maximum of 3,200 screens can be displayed.
• If an alarm occurs, the bar graph color changes.
Use one of the following methods to display the Tuning Screen.
• Select a button to move to the Tuning Screen using the Control Screen. Refer
to 3-6 Control Screen for details.
• Click the button displayed by the Control Screen icon in the Overview Screen.
Refer to 3-4 Overview Screen for details.
A pop-up menu of tag names or a dialog box to specify the tag name will be displayed if the button on the upper left of an Overview Screen is displayed. (Refer
to 3-5 Screen Configurations.) (Either a pop-up menu or a dialog box can be se-
lected by clicking the System Info. Button when configuring the screen and then
setting the Auto-start–Tuning screen list setting.
DO Terminal to Computer, and DO
Terminal to All Nodes: For contacts
marked with a circle, ON/OFF is
displayed only, and cannot be
changed manually.
Block name (model) Signal source Function Block or ITEM
Target
function
block
Display
Example:
Basic or Advanced PID
Settings
Example:
Basic or Advanced PID
1-Block Send
Terminal to
Computer (403)
4-Block Send
Terminal to
Computer (404)
Control Block: Basic PID (011), Advanced PID (012), Batch flowrate capture (014),
Indication and Setting (031), Indication and Operation (032), Ratio Setting (033),
Indicator (034), blended PID (013), 2-position ON/OFF (001), 3-position ON/OFF (002)
Segment Program 2 (157) (A 4-Block Send Terminal cannot be used.)
SP, PV, and MV trends
Setting values for P, I, D, and MV limit High/Low, High/High Alarm, High Alarm, Low
Alarm, Low/Low Alarm, and Deviation Alarm.
Alarm OFF switch, Stop block operation command, SP, PV, MV, and A/M status, R/L
status (See note 1), bar color change if alarm occurs.
Setting values for P, I, D, and MV limit High/Low, High/High Alarm, High Alarm, Low
Alarm, Low/Low Alarm, and Deviation Alarm.
SP, MV (manual mode only), A/M switching (See note 1), R/L switching (See note 1).
52
Page 63

Note 1. Same as for Control Screen
2. If using the Tuning Screen, use the 1-Block Send Terminal to Computer
function block (403). Tag names specified using the 4-Block Send Terminal
to Computer function block(404) cannot be displayed on the Tuning Screen.
3-7SectionTuning Screens
Click the text to display the dialog boxes for changing the settings. You can
make changes uses the ten-key dialog box (using the mouse), or the
keyboard. (The ten-key pad is displayed when you select the Enter box.
Refer to 4-7 Labels, Alarm Sounds, and Ten-key Settings for
ten-key/keyboard switching settings.)
Set operation or alarm to
1 to stop their operation.
Refer to 3-6 Control Screen
for how to operate.
Select these buttons to display the dialog boxes for changing the settings.
Click the Time Range Button to set the maximum amplitude for the time axis
displayed on the screen.
The scale can be set to either percentages or engineering units. The setting can
be made by clicking the System Info. Button when configuring the screen and
then setting the Auto-start–Divisions in Tuning screen setting.
To zoom in on the scale displayed, click the Scale Button and change the setting.
To add bias to the display, click the Bias Button and change the setting.
Collection of Trend data for the Tuning Screen starts once you have moved to
the Tuning Screen, and is displayed only while the Tuning Screen is displayed.
To continue to collect trend data even if you then move from the Tuning Screen to
another screen, and to display the data continuously if you return to the Tuning
Screen, click the Continuous Button. In this way, the data from three screens is
collected against the background of the Tuning Screen.
To cancel the Continuous function explained above, click the Cancel button.
53
Page 64

Note The display for Segment Program 2 (157) is shown below.
Step settings can be changed by clicking on the word.
3-7SectionTuning Screens
Auto-tuning (AT)
It is possible to automatically calculate and store the PID constants used for
Basic PID (011) or Advanced PID (012). This function is called auto-tuning (AT).
For details of the AT function, refer to the section on Basic PID (011) in the Loop
Control Unit Function Block Reference Manual. AT can be set in the same way
as the other settings, as shown below.
1, 2, 3... 1. If the value for AT displayed in the upper-left region of the Tuning Screen is 0,
then AT will not be executed.
2. Click AT.
The Change Data Dialog Box shown below will be displayed.
3. To execute AT, input 1 in the New Data Field.
4. Click the OK Button. AT will be executed (see note). The value for AT dis-
played in the upper-left region of the Tuning Screen will change to 1.
5. When the PID constants have been calculated and stored and AT has been
completed, the value for AT displayed in the upper-left region of the Tuning
Screen will return to 0.
54
Page 65

3-7SectionTuning Screens
Note Execution of AT can be cancelled from the above dialog box by inputting 0 in the
New Data Field and clicking the OK Button. (The value for AT displayed in the
upper-left region of the Tuning Screen will return to 0.)
Changing P, I, D
The following example shows how to change P (the proportional band).
1, 2, 3... 1. Click Proportional Band (P) displayed in the upper center of the screen.
The Change Data Dialog Box will be displayed.
2. Select the Change To Field.
The ten-key dialog box will be displayed as shown.
Note Refer to 4-7 Labels, Alarm Sounds, and Ten-key Settings for settings
to disable the ten-key pad (i.e., to input directly from the keyboard).
Changing Other Settings
Executing Fine Tuning
3. After using the mouse (or the keyboard) to enter a numerical value, click the
OK Button (or press Enter).
The display will return to the Change Data Dialog Box shown in Step 1.
4. Click the OK Button.
You can change the settings for I (integral time) and D (differential time) in the
same way.
You can use the procedure explained above to change the settings for MV High/
Low Limit, High/High Alarm, High Alarm, Low/Low Alarm, Low Alarm, and Deviation Alarm in the same way.
Fine tuning (FT) can be executed for either Basic PID (011) or Advanced PID
(012). Fine tuning lets the user use fuzzy inferences to set PID constants as required for more accurate control.
55
Page 66

3-7SectionTuning Screens
1, 2, 3... 1. Click Execute FT at the upper left portion of the Tuning Screen, as shown
below.
The following FT Execution Dialog Box will be displayed.
56
2. Set the degree of Response improvement, Overshooting control, and
Hunting control to any of the five levels and then click the OK Button. Either
one or two of these can be set for one executed, but all three cannot be set at
the same time.
Fine tuning will be executed according to the settings, the resulting PID
constants will be stored automatically, and the new values will be displayed
at the top of the Tuning Screen.
3. Repeat the above process as many times as required to achieve suitable
settings.
4. Click the Undo Button to return to the previous PID constant settings. If the
Undo Button is pressed a second time, the FT settings will be returned to.
Execute fine tuning when the control performance produced by autotuning is not
acceptable, when autotuning produces inconsistency in the PV, or when you
cannot allow control to be interrupted.
Fine tuning uses three user settings for hunting control, overshooting, and response improvement along with fuzzy inferences from previous control conditions to improve control by automatically setting PID parameters.
Either one or two of the user settings for hunting control, overshooting, and response improvement can be set to any of five levels. For example, to better con-
Page 67

3-8SectionTrend Screens
trol hunting and overshooting, the Overshoot and Hunting parameters can be
set to to the desired levels.
Overshooting control
For example, hunting control can be
set to level 4 and overshooting control can be set to 3.
Response improvement
3-8 Trend Screens
Trend Screens display changes in Control Block PV, SP, MV, and analog signals
across the passage of time as recording meter images. To display the Trend
Screen, click the Trend Screen Button in the Overview Window.
Real Time Trend Screen Display
Data setting values marked with this
symbol are graded on the graph. Select
the number icon to change the setting.
Hunting control
Data values at the point in time displayed by
this mark (the current value for the default)
are displayed in the upper part of the screen.
You can drag this mark to move it about the
screen. All data is displayed as real
numbers.
Time Scroll
Shifts one screen
further to the past.
Time Scroll
Shifts one screen
further to the future.
57
Page 68

3-8SectionTrend Screens
( ogge u c o )
Function block PV, SP, MV, and analog signals output from the Send Terminal to
Computer function block are collected in fixed cycles, the trend displayed, and
simultaneously stored in a file.
Trends are displayed as multi-dot recorder screen images to a maximum of eight
dots per screen.
The following two Trend Screens are supported.
Data collection
(Logger function)
Data display Horizontal axis: Time display axis: You can scroll through 2, 4, 8,
Realtime Trend 10-s cycle, 480 Tags max.,
stored for 12 hours
Historical Trend 60 s cycle, 960 Tags max.,
stored for 10 days
12, and 24-hour axes.
Vertical axis: 8-dot all-points axis. You can magnify the
gradations by 1x, 2x, 5x, or 10x.
Specify the display start time to display data from that point in
time.
Display colors: Red, yellow, green, blue, magenta, purple, cyan,
and white.
You can register a maximum of 60 Realtime Trend Screens, or 120 Historical
Trend Screens.
Set either Realtime Trend or Historical Trend when configuring the screen.
Regardless of the trend, trend data collection itself starts at the same time as the
monitor process is started (using the Start Up Button in the Set Up Dialog Box).
• Click the Start Time Button in the lower left of the screen to set the time
from which data will be displayed.
• Click the Maximum Display Time Button to set the maximum width of the
time axis displayed on the screen.
• To zoom in on the scale displayed, click the Scale Button and change the
setting.
• To add bias to the display, click the Bias Button and change the setting.
• Use the Select Pen Button to select the pen you want to display.
Realtime trends can be recorded for up to 12 hours, after which the oldest data is
discarded.
Target
function
block
Display SP, PV, and MV, analog value, and contact (See note.)
Setting None
58
Function block name (format) Send source function block, or ITEM
1-Block Send Terminal to Computer (403) Control Block: PV, SP, MV, Y1, Y2, and HL only for Basic PID
(011), Advanced PID (012), Batch flowrate capture (014),
Indication and Setting (031), Indication and Operation (032),
Ratio Setting (033), Indicator (034), blended PID (013),
2-position ON/OFF (001), and 3-position ON/OFF (002).
4-Block Send Terminal to Computer (404) Control Block: PV, SP, and MV only for Basic PID (011),
Advanced PID (012), Indication and Setting (031), Indication
and Operation (032), Ratio Setting (033), Indicator (034),
2-position ON/OFF (001), and 3-position ON/OFF (002),
Segment Program 2 (157), ON/OFF Valve Manipulation (223),
Motor Manipulator (222), Reversible Motor Manipulator (223),
Motor Opening Manipulator (224)
AO to Computer (402), AO Terminal to all
nodes (408)
DO to Computer (401), DO Terminal to all
nodes (407)
Analog input signals or analog output signals for all Function
Blocks, or analog value parameters
Contact input signals or contact output signals for all Function
Blocks, or contact value parameters
Note MV is displayed as an SP and PV range, not as a percentage.
Page 69

Historical Trend Screen Display
Data setting values marked with this
symbol are graded on the graph. Select
the number icon to change the setting.
3-8SectionTrend Screens
Data values at the point in time displayed by
this mark (the current value for the default)
are displayed in the upper part of the screen.
You can drag this mark to move it about the
screen. All data is displayed as real
numbers.
Time Scroll
Shifts one screen
further to the past.
CSV File Output
Time Scroll
Shifts one screen
further to the future.
Realtime Trend data and Historical Trend data (data grouped by date, time, or
Tag Name) can be output in CSV (Comma Separated Value) file format using the
following procedure.
1, 2, 3... 1. Press the CSV Button to display the Export to CSV File Dialog Box.
2. Specify a name for the CSV file, and click the OK Button. A CSV file will be
created. (By clicking the Browse Button, the CSV file can be created in a
desired folder. The default filename for Realtime Trend data is Trrl.csv and
the default filename for Historical Trend data is Trhl.csv.) The contents of
CSV files created are as follows.
Realtime Trend
“Real-time Trend”(carriage return)
<Screen_name>(carriage return)
<Date_exported>(comma)<Time_exported>(carriage return)
(comma)(comma)<Number_tag_number_1>(comma)<Number_tag_number_2>(comma)...(comma)<Number_Tag_number_8>(carriage return)
59
Page 70

3-8SectionTrend Screens
(comma)(comma)<Configuration_tag_number_1>(comma)<Configuration_tag_number_2>(comma)...(comma)<Configuration_tag_number_8>(carriage return)
<Date_of_trend_data>(comma)<Time_of_trend_data>(comma)<Data_1>(co
mma)<Data_2>(comma)...(comma)<Data_8>(carriage return)
Note Data for tag names that have not been registered will be 0.
Historical Trend
“Historical Trend”(carriage return)
<Screen_name>(carriage return)
<Date_exported>(comma)<Time_exported>(carriage return)
(comma)(comma)<Number_tag_number_1>(comma)<Number_tag_number_2>(comma)...(comma)<Number_Tag_number_8>(carriage return)
(comma)(comma)<Configuration_tag_number_1>(comma)<Configuration_tag_number_2>(comma)...(comma)<Configuration_tag_number_8>(carriage return)<Date_of_trend_data>(comma)<Time_of_trend_data>(comma)
<Data_1>(comma)<Data_2>(comma)...(comma)<Data_8>(carriage return)
Note Data for tag names that have not been registered will be 0.
Example: The following screen shows how Realtime Trend data exported
to spreadsheet software (e.g., Microsoft Excel) will be displayed.
Number tag name
Configuration tag name
Updating Trend
Definitions Online
Date exported
Data of trend data Time of trend data
Screen name
Time exported
Pens can be changed, deleted, or added to Trend Screens without shutting
down the CX-Process Monitor Plus.
Changing/Deleting Pens from the Dialog Box
1, 2, 3... 1. Double-click the pen selection area.
Double-click.
Tag data
60
Page 71

2. The following dialog box will be displayed. Click where indicated by numbers 1 to 4 in the following diagram to set the items.
(1) (2) (3) (4)
(1) Tag Name Selection for CSV Tag
Displays a list of tags registered in CX-Process Monitor Plus.
(2) ITEM Tag Selection
Set the type of ITEM to use to narrow the ITEM list displayed for the tag
names above.
(3) Detailed Settings
When the tag name is set above, the upper/lower limits of the specified tag
will be displayed by default. The setting can be changed.
(4) Delete
Deletes the selected pen.
3-8SectionTrend Screens
Note a) When the button is pressed, all tag information will be deleted
from the Trend Screen, including the graphic display for the pen.
b) After the four items above are set and the OK Button is clicked,
some time will be required before the results are displayed on the
Trend Screen. This time will be the collection cycle (approximately
10 s for realtime trends and 60 s for historical trends) plus the
screen refresh cycle (a few seconds). If another screen is
switched to, the changes will be reflected in the screen as soon as
it is returned to.
61
Page 72

Adding Pens from the Dialog Box
Use the following procedure to assign a tag to a pen for which one is not yet assigned.
1, 2, 3... 1. Double-click in the area circled in the screen shown below.
3-8SectionTrend Screens
The following dialog box will appear to change the pen.
2. Select a pen to which a tag is not yet assigned and click the OK Button.
62
3. Assign the pen using the same dialog box as used to change and delete
pens in the previous procedure.
Page 73

3-9 Graphic Screens
Graphic Screens display the status of the system or device in graphic form. To
display the Graphic Screen, click the Graphic Screen Icon in the Overview
Screen.
Graphic Screen
3-9SectionGraphic Screens
Paste to the screen graphic elements representing plant instrumentation, which
have been pre-prepared, and use them to display the device status, to a maximum of 200 screens.
Pre-prepared fixed graphic display elements: Text, instruments, thermometers,
transmitters, orifices.
Pre-prepared changeable graphic display elements:
Analog inputs: Bar graph displays, numerical value displays, tanks
Analog settings: Numerical settings (See note.)
Contact inputs (display): Pumps, valves, pipes
Contact settings (operation): Switches (See note.)
Note If making analog values or contact settings, use AO Settings from Computer or
DO Settings from Computer Tags function blocks.
For other fixed graphics, read and paste created using bitmap files. Basically,
after cutting and pasting the background and other graphics, paste the pre-prepared fixed or changeable graphic display elements mentioned above to create
the complete Graphic Screen.
63
Page 74

Element Function block name (model) Function block or ITEM set as send source
Function block
Display Analog values: Bar graphs, numerical values, tank level
Setting Analog values: Numerical values (using AO Terminal Settings
1-Block Send Terminal to
Computer (403)
4-Block Send Terminal to
Computer (404)
AO to Computer (402), AO
Terminal to all nodes (408)
DO to Computer (401), DO
Terminal to all nodes (407)
AO Terminal Settings from
Computer (410)
DO Terminal Settings from
Computer (409)
Control Block: Tag ITEMs for Basic PID (011), Advanced PID
(012), Batch flowrate capture (014), Indication and Setting (031),
Indication and Operation (032), Ratio Setting (033), Indicator
(034), blended PID (013), 2-position ON/OFF (001), 3-position
ON/OFF (002)
Control Block: Basic PID (011), Advanced PID (012), Indication
and Setting (031), Indication and Operation (032), Ratio Setting
(033), Indicator (034), 2-position ON/OFF (001), 3-position
ON/OFF (002)
Operation Block: High/Low Alarm (111), Segment Program 2
(157), ON/OFF Value Manipulator (221), Motor Manipulator
(222), Reversible Motor Manipulator (223), Motor Opening
Manipulator (224), Timer (205), Counter (208)
Analog input signals or analog output signals for all Function
Blocks, or analog value parameters
Contact input signals or contact output signals for all Function
Blocks, or contact value parameters
Analog output ITEM for AO Terminal Settings from Computer
(Used to set ordinary analog values. Displays using network
resend monitoring.)
Contact output ITEM for DO Terminal Settings from Computer
(Used to set ordinary contact values. Displays using network
resend monitoring.)
Contacts: Indicators, pumps, valves, pipes
from Computer)
Contacts: Switches (using DO Terminal Settings from Computer)
3-10SectionAnnunciator Screens
3-10 Annunciator Screens
Annunciator Screens display comprehensively the contacts status (mainly the
alarm status). To display the Annunciator Screen, click the Annunciator
Screen icon on the Overview Screen.
Switch screens using this button.
If an error occurs, the Error Display Panel
and Screen Switching Button will both flash.
64
There are no particular limits to contacts that can be specified. Basically, however, register contacts that display the alarm status of the Control Block’s HH
(High/High Alarm), H (High Alarm), L (Low Alarm), and LL (Low/Low Alarm), etc.
Page 75

3-11SectionOperation Guide Message Screens
If an alarm/error occurs, the icon color will change and a beep will sound. At the
same time, two rows of eight wide-size characters making a user-registered
message can be displayed.
You can display a total of 16 separate elements per screen as 4 rows x 4 columns, to a maximum of five screens.
Function block name (format) Send source Function Block, or ITEM
Target function
block
Display Color, sound, and messages displayed when contact is ON.
Setting None
1-Block Send Terminal to Computer
(403)
4-Block Send Terminal to Computer
(404)
DO to Computer (401), DO Terminal
to all nodes (407)
DO Terminal Settings from
Computer (409)
Control Block: Contacts within Tag ITEMs for Basic PID (011),
Advanced PID (012), Batch flowrate capture (014), Indication
and Setting (031), Indication and Operation (032), Ratio
Setting (033), Indicator (034), blended PID (013), 2-position
ON/OFF (001), and 3-position ON/OFF (002).
Control Block: PV, SP, and MV only for Basic PID (011),
Advanced PID (012), Indication and Setting (031), Indication
and Operation (032), Ratio Setting (033), Indicator (034),
2-position ON/OFF (001), and 3-position ON/OFF (002).
Operation Block: High/Low Alarm (111), Segment Program
2(157), ON/OFF Valve Manipulator (221), Motor Manipulator
(222), Reversible Motor Manipulator (223), Motor Opening
Manipulator (224), Timer (205), Counter (208)
Contact input signals or contact output signals for all Function
Blocks, or contact value parameters
Contact output ITEM for DO Terminal Settings from Computer
(Network resend only.)
3-11 Operation Guide Message Screens
Operation Guide Message Screens display messages registered when the contact signal was turned ON. To display the Operation Guide Message Screen,
click the Operation Guide Button.
When the specified contact (internal switch, etc.) is turned ON, the pre-prepared
wide-size character message (32 characters x 2 lines) will be displayed together
with the time the contact was turned ON. (When the contact is turned ON, a red
mark will be displayed next to the Operation Guide icon on the Overview
Screen.)
Possible No. of registrations: 100 messages max.
65
Page 76

Message colors: 16 colors, displayed with sound.
You can display a message with a maximum of 1,000 elements on one screen.
Note The internal switches are collated as one by the DO to Computer and the AO
Terminal to All Nodes function blocks, and then sent to the computer for use.
Function block name (format) Send source Function Block, or ITEM
Target
function
block
Display Color, sound, and messages displayed when contact is ON.
Setting None
1-Block Send Terminal to Computer
(403)
4-Block Send Terminal to Computer
(404)
DO to Computer (401) Contact input signals or contact output signals for all Function
DO Terminal Settings from Computer
(409)
Control Block: Contacts within Tag ITEMs for Basic PID (011),
Advanced PID (012), Batch flowrate capture (014), Indication and
Setting (031), Indication and Operation (032), Ratio Setting (033),
Indicator (034), blended PID (013), 2-position ON/OFF (001), and
3-position ON/OFF (002).
Control Block: PV, SP, and MV only for Basic PID (011), Advanced
PID (012), Indication and Setting (031), Indication and Operation
(032), Ratio Setting (033), Indicator (034), 2-position ON/OFF
(001), and 3-position ON/OFF (002).
Operation Block: High/Low Alarm (111), Segment Program 2 (157),
ON/OFF Value Manipulator (221), Motor Manipulator (222),
Reversible Motor Manipulator (223), Motor Opening Manipulator
(224), Timer (205), Counter (208)
Blocks, or contact value parameters
Contact output ITEM for DO Terminal Settings from Computer
(Network resend only.)
3-11SectionOperation Guide Message Screens
CSV File Output
Operation Guide message data (date, time, contents of Operation Guide) can
be output in CSV (Comma Separated Value) file format using the following procedure.
1, 2, 3... 1. Press the CSV Button to display the Export to CSV File Dialog Box.
2. Specify a name for the CSV file, and click the OK Button. A CSV file will be
created. (By clicking the Browse Button, the CSV file can be created in a
desired folder. The default filename is Opglog.csv.) The contents of CSV
files created are as follows.
“Operation Guide Message Log”(carriage return)
<Screen_name>(carriage return)
<Date_exported>(comma)<Time_exported>(carriage return)
<Date_of_Operation_Guide>(comma)<Time_of_Operation_Guide>(comma)<Contents_of_Operation_Guide>(carriage return)
Note “Contents of Operation Guide” refers to all the data in one line of an
Operation Guide Message Screen.
66
Page 77

3-12 Alarm Log Screens
Alarm Log Screens display alarm logs. To display the Alarm Log Screen, click
the Alarm Button.
The targets monitored for alarms are as follows: Control Block’s HH (High/High
Alarm), H (High Alarm), L (Low Alarm), LL (Low/Low Alarm), and DA (Deviation
Alarm) contacts, and other contact signals (including parameters).
3-12SectionAlarm Log Screens
Display all Display only LIGHT (Light alarm),
H (High alarm), or L (Low alarm)
Display only HEAVY (Heavy alarm), HH (High/High alarm), or LL (Low/Low alarm)
Display only current errors
Save and display comprehensively alarm records (time error occurred, Tag
name, current value when PV or MV occurred, alarm type, etc.) occurring from
the Controller and Alarm Blocks.
You can display a maximum of 1,000 alarm messages on one screen.
Element Function block name (model) Function block or ITEM set as send source
Function block
Display Alarm history (date and time of occurrence, and value when
Setting None
1-Block Send Terminal to Computer
(403)
4-Block Send Terminal to Computer
(404)
DO to Computer (401) Contact input signals or contact output signals for all Function
Control Block: High/High alarm, High alarm, Low alarm,
Low/Low alarm, and Deviation alarm for Basic PID (011),
Advanced PID (012), Batch flowrate capture (014), Indication
and Setting (031), Indication and Operation (032), Ratio
Setting (033), Indicator (034), blended PID (013), 2-position
ON/OFF (001), and 3-position ON/OFF (002).
Control Block: High/High alarm, High alarm, Low alarm,
Low/Low alarm, and Deviation alarm for Basic PID (011),
Advanced PID (012), Indication and Setting (031), Indication
and Operation (032), Ratio Setting (033), Indicator (034),
2-position ON/OFF (001), and 3-position ON/OFF (002),
Segment Program 2 (157), ON/OFF Value Manipulator (221),
Motor Manipulator (222), Reversible Motor Manipulator (223),
Motor Opening Manipulator (224).
Blocks, or contact value parameters
alarm occurred)
Time of occurrence: Red; Time of recovery: Black
67
Page 78

3-13SectionOperation Log Screens
CSV File Output
Date exported
Alarm log data (date, time, current value when alarm occurred, type of alarm)
can be output in CSV (Comma Separated Value) file format using the following
procedure.
1, 2, 3... 1. Press the CSV Button to display the Export to CSV File Dialog Box.
2. Specify a name for the CSV file, and click the OK Button. A CSV file will be
created. (By clicking the Browse Button, the CSV file can be created in a
desired folder. The default filename is Almlog.csv.) The contents of CSV
files created are as follows.
“Alarm Log”(carriage return)
<Date_exported>(comma)<Time_exported>(carriage return)
<Date_of_alarm>(comma)<Time_of_alarm>(comma)<Contents_of_alarm>(carriage return)
Note “Contents of alarm” refers to all the data in one line of an Alarm Log
Screen.
Example: The following screen shows how alarm log data exported to
spreadsheet software (e.g., Microsoft Excel) will be displayed.
Date of
alarm
Time of
alarm
Contents of alarm
(All the data in one line of
an Alarm Log Screen)
3-13 Operation Log Screens
Operation Log Screens display operation logs. To display the Operation Log
Screen, click the Operation Log Button.
Save and display comprehensively records (time and date operation occurred,
Tag name, ITEM data before change, ITEM data after change, etc.) of ITEM data
changed within the Loop Control Unit, using the Control Screen or the Tuning
Screen.
68
Page 79

You can display a maximum of 1,000 operation messages on one screen.
py
3-14SectionSystem Monitor Screens
CSV File Output
Date exported
Operation log data (date, time, contents of operation) can be output in CSV
(Comma Separated Value) file format using the following procedure.
1, 2, 3... 1. Press the CSV Button to display the Export to CSV File Dialog Box.
2. Specify a name for the CSV file, and click the OK Button. A CSV file will be
created. (By clicking the Browse Button, the CSV file can be created in a
desired folder. The default filename is Ctrlog.csv.) The contents of CSV files
created are as follows.
“Operation Log”(carriage return)
<Screen_name>(carriage return)
<Date_exported>(comma)<Time_exported>(carriage return)
<Date_of_operation>(comma)<Time_of_operation>(comma)<Contents_of_operation>(carriage return)
Note “Contents of operation” refers to all the data in one line of an Opera-
tion Log Screen.
Example: The following screen shows how operation log data exported to
spreadsheet software (e.g., Microsoft Excel) will be displayed.
Date of
operation
Time of
operation
3-14 System Monitor Screens
3-14-1 System Monitor Screen Outline
System Monitor Screen display the system status, and runs/stops the Loop Control Unit. To display the System Monitor Screen, click the System Monitor But-
ton.
You can display and operate the following items.
Display/operation Item
Display
Operation Loop Control Unit run/stop
All system allocations
All CPU Unit modes
All Loop Control Unit statuses (run/stop)
Block errors (Execution errors, RAM checksum errors, battery
errors)
Type of connection to computer (CLK, Ethernet, serial), and
connection status (OK, error)
Controller Link’s data link status (only with Controller Link
connection)
Contents of operation log
(All the data in one line of
an Operation Log Screen)
69
Page 80

Note The system status display on the System Monitor Screen depends on the set-
tings made in the System Monitor Setting Window (using the System Monitor
Builder Button in the Setup Dialog Box).
Select a number to display the run/stop command for the relevant Loop Control
Unit. Refer to 3-14-2 Loop Control Unit Run/Stop later in this manual for
operation details.
Click the M Button to display the CPU Unit’s operation mode.
Click the E Button to display the Function Block Error dialog box. Refer to
3-14-3 Block Error Dialog Box Operations later in this manual for details.
Displays 1 node
Shows the computer
connected to the CPU Unit.
Displays the connection type.
When connected to the Controller
Link, click the DTL Button to
display the Controller Link Data
Link Status Dialog Box. Refer to
3-14-4 Data Link Status later in
this manual for details.
3-14SectionSystem Monitor Screens
Displays the connection status
3-14-2 Loop Control Unit Run/Stop
WARNING Before starting a Loop Control Unit, check the following points.
!
• Make sure that I/O Units used in combination are correctly mounted. Also,
make sure that the Unit number on the front of analog I/O Units agree with the
Unit number set using the field terminals. If the Unit numbers do not agree, I/O
(i.e., read and write) will be performed incorrectly, with data for another Special
I/O Unit (with the Unit number set using the field terminal).
• Make sure that the initial settings for System Common Block within the Loop
Control Unit are correct. In particular, check that data memory (DM) for node
terminals within the CPU Unit used by the Loop Control Unit is not allocated to
other applications in the PLC as well. If the same DM has been allocated twice,
there is a risk that the PLC system will misoperate, resulting in injury.
• When writing data to the I/O memory in the CPU Unit with function blocks (e.g.,
using Send All Blocks, Expanded DO/AO Terminal to CPU Unit, or DO/AO Terminal to CPU Unit), be sure that the words written to in the I/O memory are not
being used for any other purpose. If I/O memory words are allocated to more
than one purpose, the PLC system may act unexpectedly and cause injury.
Note First sufficiently check system operation using the CX-Process Tool (check the
load rate, etc.: Execution, Operation, Monitor Run Status), and sufficiently check
operation (Monitor Run Status, Start) for the Function Block data that has been
created, and then change to actual operation. In particular, first check that the
load rate is 60% or less, and then change to actual operation. (Refer to the Loop
Control Unit Operation Manual for load rate details.)
70
Page 81

3-14SectionSystem Monitor Screens
1, 2, 3... 1. Click the number button for the Loop Control Unit you want to use, as shown.
Click here.
The Run/Stop Command Dialog Box will be displayed as shown.
• Loop Control Unit is stopped.
• Loop Control Unit is running.
2. Select Stop, HOT START, or COLD START, and then click the Execute
Button.
Click the Refresh Button to check and redisplay the run status of the Loop
Control Unit.
3-14-3 Function Block Error Dialog Box Operations
1, 2, 3... 1. Click the E Button.
The Function Block Error Dialog Box will be displayed.
Note A Block database error indicates an error has occurred in the function
block database.
Click here
71
Page 82

3-14SectionSystem Monitor Screens
The Function Block Error Dialog Box is displayed in green during normal operation, and red if there is an error.
2. Click the Execution Error or the Block Database Error button (Battery Error is displayed only and cannot be selected).
The Details of Function Block Error Dialog Box will be displayed.
Block Database Error
0 = Normal (no errors), –1 = Block number not in use, 90 = Relevant Function
Block has a database error.
Execution Error
0 = Normal (no errors), –1 = Block number not in use, other numbers (1 to 89) =
Error code.
The following table gives the function error codes.
Code Description Explanation Operation at Error Remedy
0 Normal
1 Connection
terminal/output
terminal connection
not defined
2 Default error When run/stop command
3 Variable value error A constant between A1
Either the function block is
not registered to the block
address of the source
designation or the
destination, or the ITEM
number does not exist.
S1 turned ON in the ramp
program or segment
program, the reference
input was outside the rise
ramp range.
and A8 or an intermediate
buffer between B1 and B4
that is used in the
conditional statement for
Arithmetic Operation
(Block Model 126) is not
defined.
Running of the function
block in question is
stopped, and the functions
in question do not operate
normally.
The program is not started. Check the connection of
Execution of the Arithmetic
Operation block will be
stopped.
Check the block address
and ITEM number of the
source designation or
destination designation.
the reference input and
program settings.
Set definitions for all
constants A1 to A8 and an
intermediate buffers B1 to
B4 that are used.
72
Page 83

Code RemedyOperation at ErrorExplanationDescription
10 Operation process:
Division by “0”
11 Operation process:
Operation out of
restricted value
12 Argument beyond
definition
15 AT error A limit cycle cannot be
19 Inappropriate
operation
20 Download terminal
data exchange error
An attempt was made to
execute division by a “0”
denominator in the
operation process.
An attempt was made to
execute division by a ”0”
denominator in Arithmetic
Operation block (Block
Model 126).
The output value of the
operation result exceeded
the data length of two
bytes.
Note An error does not occur
even if the output
range (e.g., 320.00) is
exceeded if the data
length of two bytes is
not exceeded.
The arguments or results
for a Arithmetic Operation
block exceed the defined
limits.
An argument used in
Arithmetic Operation
(Block Model 126) is
beyond the definition.
generated for Basic PID
(Block Model 011) or
Advanced PID (Block
Model 012) or suitable PID
constants cannot be
calculated.
Two or more S1 to S3
select switches are set to 1
(ON) at the same time in
the 3-output Selector block
(Block Model 163) or
3-input Selector block
(Block Model 164).
Data exchange with the
CPU Unit is not being
executed correctly on the
CPU Unit Terminal,
Expanded CPU Unit
Terminal, Node Terminals
and Field Terminal blocks.
In the case of
Multiplication, DI/AI
Terminal from CPU Unit,
DI/AI Terminal from
Expanded CPU Unit or
Field Terminal blocks, the
maximum value is output.
In the case of the Segment
Linearizer or Temperature
and Pressure Correction
blocks, the previous data
is retained.
Execution of the Arithmetic
Operation block will be
stopped.
Output becomes the
maximum value or
minimum value of the
output range. (For
example, when the output
range is 320.00, the output
becomes +320.00 or
320.00.)
Execution of the Arithmetic
Operation block will be
stopped.
Execution of the Arithmetic
Operation block will be
stopped.
Execution of the relevant
block will be stopped.
The output value that was
active before the error
occurred is held.
The data of the function
block in question is not
updated.
3-14SectionSystem Monitor Screens
In the case of DI/AI
Terminal from CPU Unit,
DI/AI Terminal from
Expanded CPU Unit or
Field Terminal blocks,
check the scaling value,
and in the case of the
Segment Linearizer block,
check the setting value of
the input coordinate side.
In the case of temperature
and pressure correction,
check the gain bias value.
Check the contents of the
conditional statement and
calculation expressions for
division by 0.
If there is a problem,
review the settings of
related ITEMs.
Check the contents of the
conditional statement and
calculation expressions
and correct the mistake.
Check the range of the
arguments and correct the
conditional statement or
calculation expressions.
Check the following AT
parameters: ITEM 036 to
ITEM 040. Also, set ITEM
051 to 2 s or less.
Re-program the Step
Ladder Program block so
that S1 to S3 select
switches are set to 1 (ON)
independent of each other.
If a malfunction has
occurred on the CPU Unit,
follow the remedy for that
error. If the CPU Unit is
normal, turn ON the power
supply again.
73
Page 84

Code RemedyOperation at ErrorExplanationDescription
21 I/O memory address
out-of-range
An address out of the I/O
memory address range
has been specified on the
CPU Unit Terminal,
Expanded CPU Unit
Terminal, Node Terminals
and Field Terminal blocks.
29 Reception error for
external device
A communications frame
error was generated by the
data received from an
ES100X Controller for an
ES100X Controller
Terminal (Block Model
045). (An FCS check error
or frame error occurred 3
times in a row.
30 Response timeout A response was not
returned after sending data
to the Controller for a
ES100X Controller
Terminal (Block Model
045). (Response was not
returned for 5 s 3 times.)
31 Controller unit number
duplicated
The unit number set in
ITEM 006 for a ES100X
Controller Terminal (Block
Model 045) is the same as
another ES100X Controller
Terminal. (A response
timeout will occur if the unit
number does not exist.)
70 Illegal combination of
function blocks
The function block on the
primary loop side is not
basic PID or advanced PID
when bumpless
processing between
primary/secondary loops
was specified in basic PID
or advanced PID.
71 Inappropriate
parameter
a) When restricted conditions
are applied across two
ITEMs:
(example: when the unit
pulse output is equal to or
greater than the operation
cycle when there is unit
pulse output in run time accumulation)
b) An attempt has been made
to write out-of-range data at
the ITEM Setting block.3.
Operation of the function
block in question is
stopped.
Communications will be
stopped with the specified
ES100X and tried with
another ES100X.
Communications will be
stopped with the specified
ES100X and tried with
another ES100X.
Communications will be
stopped with the ES100X
Controllers
Running of the function
block in question is
stopped.
a) The function block in ques-
tion is not executed.
b) Data cannot be written.
3-14SectionSystem Monitor Screens
On the CPU Unit Terminal
and Expanded CPU Unit
Terminal blocks, check the
leading address, and on
field terminals check the
setting of the CIO (channel
I/O) Area number setting.
In the case of Node
Terminals, check the
setting of the “leading
address of the memory for
the node terminals”
specified by System
Common block ITEM043.
Check the communications
path and the
communications settings
(7 data bits, even parity,
and 2 stop bits).
Check the communications
path, the communications
settings (7 data bits, even
parity, and 2 stop bits), and
other required settings in
the ES100X (parameter
setting mode, unit number,
etc.).
Change the unit number
settings (ITEM 006)so that
each is used only once.
Check the function block
model number on the
primary loop side.
Check the settings of the
ITEMs.
74
Page 85

Code RemedyOperation at ErrorExplanationDescription
80 Step Ladder Program
command error
81 Step Ladder Program
source designation not
defined
89 Overuse of Step
Ladder Program
differentiated
instruction
There is an irrelevant
command in the Step
Ladder Program, or the
method of use of
commands is wrong, for
example, there is an AND
command even though
there is no input command.
Either the function block is
not registered to the block
address currently specified
by each command in the
Step Ladder Program, or
the ITEM number does not
exist.
The number of
differentiated instructions
to be simultaneously
executed has exceeded
256.
3-14-4 Data Link Status
If using a Controller Link connection, you can display the Controller Link Network’s data link status.
Click the DTL Button.
The command in question
and onwards are not
executed.
The command in question
and onwards are not
executed.
Differentiated instructions
exceeding 256 instructions
are not executed.
3-14SectionSystem Monitor Screens
Check the program within
the Step Ladder Program
block.
Check the block address
and ITEM number.
Reduce the number of
differentiated instructions
to be executed
simultaneously.
The Data Link Status Dialog Box will be displayed.
Displays data link participation
status. (See note 2.) (1 bit per node.)
Click here.
Displays the data link status. (See note
1.) (8-bit 2-digit hexadecimal per node.)
75
Page 86

3-14SectionSystem Monitor Screens
Note 1. Data link status: The data link status is displayed for each node using the
following 8 bits (2-digit hexadecimal).
Bit
Odd node
addresses
0 8 PLC status (0: Inactive, 1: Active)
1 9 PLC’s CPU Unit error (0: Normal, 1: Error)
2 10 Communications error (data link reception) (0:
3 11 Data link participation (0: Not in data link or data
4 12 Offset error (0: Normal, 1: Error)
5 13 Insufficient (short) receive area (0: Sufficient, 1:
6 14 Remaining receive area (0: Not remaining, 1:
7 15 Set to 0
Even node
addresses
Normal, 1: Error)
link inactive, 1: In data link)
Insufficient)
Remaining)
Contents
The relationship between nodes and words displayed on the screen is as
follows:
Word 0 1 2 3 4
000 Node 2 Node 1 Node 4 Node 3 Node 6 Node 5 Node 8 Node 7 Node 10 Node 9
005 Node 12 Node 11 Node 14 Node 13 Node 16 Node 15 Node 18 Node 17 Node 20 Node 19
010 Node 22 Node 21 Node 24 Node 23 Node 26 Node 25 Node 28 Node 27 Node 30 Node 29
015 Node 32 Node 31 Data link
participation status
(nodes 1 to 16)
Data link
participation status
(nodes 17 to 32)
Set to
00
Set to
00
Set to
00
Set to
00
2. Data Link Participation Status
Network participation status (0: Not part of the network, 1: Part of the network)
The relationship between nodes and each bit in a word on the screen is as
follows:
Word
15 14 13 12 11 10 9 8 7 6 5 4 3 2 1 0
016 16 15 14 13 12 11 10 9 8 7 6 5 4 3 2 1
017 32 31 30 29 28 27 26 25 24 23 22 21 20 19 18 17
Bit
Refer to the Controller Link Unit or Board manuals for details of data link status.
76
Page 87

3-15 System Monitor Log Screens
System Monitor Log Screens record and display run/stop logs and the execution
error logs as soon as they occur. To display the System Monitor Log Screen,
click the System Monitor Log Button.
3-15SectionSystem Monitor Log Screens
CSV File Output
Display is red for an occurrence, and black following recovery.
System monitor log data (date, time, contents of runs/stops and execution
errors) can be output in CSV (Comma Separated Value) file format using the following procedure.
1, 2, 3... 1. Press the CSV Button to display the Export to CSV File Dialog Box.
2. Specify a name for the CSV file, and click the OK Button. A CSV file will be
created. (By clicking the Browse Button, the CSV file can be created in a
desired folder. The default filename is Sysmlog.csv.) The contents of CSV
files created are as follows.
“System Monitor Log”(carriage return)
<Date_exported>(comma)<Time_exported>(carriage return)
<Date>(comma)<Time>(comma)<Contents_of_system_monitor_log>(carriage return)
Note “Contents of system monitor log” refers to all the data in one line of a
System Monitor Log Screen.
77
Page 88

SECTION 4
Configuration Screens
This section describes operating procedures to create screens and monitor using the CX-Process Monitor.
4-1 Before Configuring 80. . . . . . . . . . . . . . . . . . . . . . . . . . . . . . . . . . . . . . . . . . . . . . . . . . . . . . .
4-2 Basic Configuration Procedure 82. . . . . . . . . . . . . . . . . . . . . . . . . . . . . . . . . . . . . . . . . . . . . .
4-3 Basic Configuration Operations 83. . . . . . . . . . . . . . . . . . . . . . . . . . . . . . . . . . . . . . . . . . . . . .
4-3-1 Starting and Stopping 83. . . . . . . . . . . . . . . . . . . . . . . . . . . . . . . . . . . . . . . . . . . . . .
4-3-2 Mode Selection Dialog Box 83. . . . . . . . . . . . . . . . . . . . . . . . . . . . . . . . . . . . . . . . . .
4-3-3 Password 84. . . . . . . . . . . . . . . . . . . . . . . . . . . . . . . . . . . . . . . . . . . . . . . . . . . . . . . .
4-3-4 Setup Dialog Box 85. . . . . . . . . . . . . . . . . . . . . . . . . . . . . . . . . . . . . . . . . . . . . . . . . .
4-4 System Monitor Settings 86. . . . . . . . . . . . . . . . . . . . . . . . . . . . . . . . . . . . . . . . . . . . . . . . . . .
4-5 Creating Graphic Screens 89. . . . . . . . . . . . . . . . . . . . . . . . . . . . . . . . . . . . . . . . . . . . . . . . . . .
4-5-1 Outline 89. . . . . . . . . . . . . . . . . . . . . . . . . . . . . . . . . . . . . . . . . . . . . . . . . . . . . . . . . .
4-5-2 Graphic Screen Creation Window Operations 90. . . . . . . . . . . . . . . . . . . . . . . . . . . .
4-5-3 Basic Operations 94. . . . . . . . . . . . . . . . . . . . . . . . . . . . . . . . . . . . . . . . . . . . . . . . . .
4-5-4 Graphic Objects 94. . . . . . . . . . . . . . . . . . . . . . . . . . . . . . . . . . . . . . . . . . . . . . . . . . .
4-5-5 Creation Example 95. . . . . . . . . . . . . . . . . . . . . . . . . . . . . . . . . . . . . . . . . . . . . . . . .
4-6 Screen Configuration 99. . . . . . . . . . . . . . . . . . . . . . . . . . . . . . . . . . . . . . . . . . . . . . . . . . . . . .
4-6-1 CRT Builder Functions 99. . . . . . . . . . . . . . . . . . . . . . . . . . . . . . . . . . . . . . . . . . . . .
4-6-2 Overview of Screen Registration 100. . . . . . . . . . . . . . . . . . . . . . . . . . . . . . . . . . . . . .
4-6-3 Registering Operation Guide Messages 112. . . . . . . . . . . . . . . . . . . . . . . . . . . . . . . . .
4-6-4 Registering Alarm Messages 114. . . . . . . . . . . . . . . . . . . . . . . . . . . . . . . . . . . . . . . . .
4-6-5 Saving Settings 116. . . . . . . . . . . . . . . . . . . . . . . . . . . . . . . . . . . . . . . . . . . . . . . . . . .
4-6-6 Deleting Registered Screens 116. . . . . . . . . . . . . . . . . . . . . . . . . . . . . . . . . . . . . . . . .
4-6-7 Starting the Monitor Process 117. . . . . . . . . . . . . . . . . . . . . . . . . . . . . . . . . . . . . . . . .
4-7 System Information Settings 117. . . . . . . . . . . . . . . . . . . . . . . . . . . . . . . . . . . . . . . . . . . . . . . .
4-7-1 Setting for Stopping Alarm Sound 128. . . . . . . . . . . . . . . . . . . . . . . . . . . . . . . . . . . .
4-8 Checking Configurations 131. . . . . . . . . . . . . . . . . . . . . . . . . . . . . . . . . . . . . . . . . . . . . . . . . . .
4-8-1 Starting the Monitor Process 132. . . . . . . . . . . . . . . . . . . . . . . . . . . . . . . . . . . . . . . . .
4-8-2 Executing File Mapping and Starting the Monitor Process 132. . . . . . . . . . . . . . . . . .
4-8-3 Displaying the Overview Screen 134. . . . . . . . . . . . . . . . . . . . . . . . . . . . . . . . . . . . . .
4-8-4 Setting the Auto-start Function 134. . . . . . . . . . . . . . . . . . . . . . . . . . . . . . . . . . . . . . .
4-8-5 Ending the Monitor Process 134. . . . . . . . . . . . . . . . . . . . . . . . . . . . . . . . . . . . . . . . . .
79
Page 89

4-1 Before Configuring
To send tag data to the CX-Process Monitor, you must first perform the following
three operations using CX-Process Tool.
Register Function Blocks for Data Exchange
Note The function blocks include the Send to Computer Block (401 to 404), Send Ter-
minal to All Nodes Block (407 and 408), and DO/AO Terminal Settings from
Computer (409 and 410).
Example: Register the 1-Block Send Terminal to Computer Function Block, and
specify block address 001 as the send source.
4-1SectionBefore Configuring
Specify send source
Set the Tag Names
Enter the tag names. The CX-Process Monitor differentiates data using tag
names.
Example: 1-Block Send Terminal to Computer/4-Block Send Terminal to Computer (403 and 404)
Item Max. No. of characters Forbidden characters
Tag Name 8 standard characters None
Tag comment 16 standard characters None
80
Note Make sure to set the range high limit (RH) and range low limit (RL) to indicate the
the CX-Process Monitor scaling within the following range.
No. of digits 5 digits max. (Including symbols and digits below the
decimal point.)
Value range –5000 to 99999
Example: With one digit below the decimal point:
–550.0 to 9999.9
Page 90

4-1SectionBefore Configuring
Compiling Monitor Tags
1, 2, 3... 1. From the Execution Menu, select Output Tag Files - Monitor Tags. The
Compile monitor tags for CX-Process Monitor using the following operation.
This operation is possible only when CX-Process Monitor is installed.
Compile Monitor Tags Dialog Box, shown below, will be displayed.
2. Click the Compile Button. The Compiler Dialog Box, shown below, will be
displayed.
3. Click the Start Button.
When compilation is complete, the following screen will be displayed.
Note The Monitor Tag file (i.e., Monitor Tag data for one CPU Unit) is com-
piled automatically with a fixed file name in the following directory, using the compile operation.
Directory: Omron/CX-Process Monitor
tory in which the CX-Process Monitor is installed.)
File names: mtagmst and mtagsubmst
/db (The underlined part is the direc-
81
Page 91

4-2 Basic Configuration Procedure
Select Omron, CX-Process Monitor, CX-Process Monitor from Windows Start Menu.
In the Main Window, click the Start Button.
In the Mode Selection Dialog Box, click the Engineer Button.
In the Mode Selection Dialog Box, click the Set Up Button.
Enter the password.
In the Setup Dialog Box, click the System Monitor Builder Button, and set the communications conditions,
etc., in the System Monitor Setting Window. (Only if using serial communications, when starting the monitor
process, the FinsGateway Serial Unit may start depending on the communications conditions that have been
set.)
4-2SectionBasic Configuration Procedure
In the Setup Dialog Box, click the Graphic Builder Button, and then in the Graphic
Builder, create the Graphic Screen (including Tag name selection, etc.,), and save.
In the Setup Dialog Box, click the CRT Builder Button, and set the Builder window
1. Select Settings, Register Screen.
2. Select new screen type.
3. Click New.
4. Double-click Tag Name, and select the Tag name.
5. Double-click Detailed Settings, and make the
detailed settings.
In CRT Builder, select the Settings Menu, and then select Save, and then click the OK Button.
Set the main system settings under System Information. (Refer to 4-7 System Information Settings.)
1. Select Settings, Register Screen.
2. Select new screen type.
3. Click New.
4. Select the Graphic Screen that has been saved.
82
Check the screen configuration that has been set. (Refer to 4-8 Checking Configurations.)
Page 92

4-3 Basic Configuration Operations
4-3-1 Starting and Stopping
Starting
1, 2, 3... 1. Select Programs, Omron, CX-Process Monitor, and CX-Process Moni-
tor from the Windows Start Menu.
The CX-Process Monitor Main Window will be displayed.
4-3SectionBasic Configuration Operations
2. Click the Start Button. The Mode Selection Dialog Box will be displayed as
shown below.
3. Select the function.
Stopping
In the Main Window, click the Exit Button.
The Main Window will close, and CX-Process Monitor will stop running.
4-3-2 Mode Selection Dialog Box
This section explains the functions of the Mode Selection Dialog Box.
1, 2, 3... 1. In the Main window, click the Start Button.
83
Page 93

The Mode Selection Dialog Box will be displayed.
4-3SectionBasic Configuration Operations
You cannot configure the screen
using Operator mode.
Note If you did not set a password the first time you started CX-Process Monitor, when
1. Click the Engineer Button to
configure the screen, and to
start and stop processing.
2. Click the Set Up Button to
configure the screen, and to
start and stop processing.
When you click the Set Up
Button, the Enter Password
Screen will be displayed.
Click the Cancel Button to close
the dialog box and return to the
Main Window.
you click the Set Up Button, the password registration screen will be displayed.
Register a password, and unless the correct password is entered thereafter, you
cannot configure the screen or make any settings. Make sure that people who
make settings register a password.
2. To set the CX-Process Monitor (i.e., to configure the screens, edit the
Graphic Screen, and run/stop processing, etc.), first click the Engineer Button (which is the default), and then click the Set Up Button. The input pass-
word box will be displayed.
4-3-3 Password
84
3. Enter the password, and click the OK Button. The Setup Dialog Box will be
displayed.
Set the password to configure the CX-Process Monitor Screen and to protect the
settings you have made.
Note Register a password, and unless the correct password is entered thereafter, you
cannot change to Engineer mode to make any settings (i.e., use the Set Up Button in the Mode Selection Dialog Box).
Page 94

4-3SectionBasic Configuration Operations
1, 2, 3... 1. If you do not set a password, when you click the Set Up Button in the Mode
Selection Dialog Box, the following dialog box will be displayed.
2. Click the OK Button.
The following dialog box will be displayed.
3. Enter the password, and click the OK Button.
The following dialog box will be displayed.
4. Enter the password once again, and click the OK Button.
Note If you have forgotten the password or want to change the password, perform the
following operation using the Registry Editor, and after deleting the PassWord
key, set the password once again using the above procedure.
1, 2, 3... 1. Select Start, then select Run, enter regedt32, and then click the OK Button.
2. On the local machine, select HKEY_LOCAL_MACHINE, SOFTWARE,
4-3-4 Setup Dialog Box
This section explains the functions of the Setup Dialog Box.
1, 2, 3... 1. In the Mode Selection Dialog Box, click the Set Up Button. The input pass-
The Registry Editor will start.
OMRON, CX-Process Monitor, 2.00, and then delete the password.
word box will be displayed. If you have not set a password, you cannot
85
Page 95

Setup Dialog Box
g
y
pg
change to Engineer mode. Refer to 4-3-3 Password Settings above for how
to set the password.
2. Enter the password, and click the OK Button.
The Setup Dialog Box will be displayed.
3. Click any button, and then select a function.
Sets auto-start, tuning
trend scale display,
multi-screen, label
information, alarm sound
information, and ten-key.
Refer to 4-7 System
Information Settings for
details.
1. Sets the System
Monitor Screen. Refer to
4-4 System Monitor Settings for details.
2. Opens the Graphic
Screen Create Window.
Refer to 4-5 Graphic
Screen Creation for
details.
3. Configures the screen.
Refer to 4-6 Screen
Configuration for details.
4-4SectionSystem Monitor Settings
4-4 System Monitor Settings
Refer to the following sections for details on the functions of each button.
Using the System Monitor Setting Window, register the PLC and Loop Control
Unit to be monitored using the System Monitor Screen. Also register the local
computer to perform the monitoring.
The setting items are as follows:
PLC setting
Computer setting
PLC node number (address)
Loop Control Unit address
Computer node number (default is 32)
Communications type (CLK, Serial, Ethernet) (Use the
System Monitor Screen to set CLK or Ethernet
communications.)
For serial connections, you must also set the COM port and
baud rate.
Use the System Monitor
Screen for this setting.
With serial (Host Link) communications only, when you start the Monitor Process
(i.e., select Start Up in the Setup Dialog Box), FinsGateway communications
will start according to the communications conditions given below that have
been set.
• Communications type: Serial (Host Link)
• COM port used and baud rate
Note The PLC settings (node address, Unit address, etc.) set here can be
used only from the System Monitor Screen. Actual communications
processing depends on the network address, node address, and Unit
address set using the CX-Process Tool. Controller Link and Ethernet
settings within the computer settings made here can also be used
only from the System Monitor Screen. Perform actual communications processing by manually starting FinsGateway.
86
Page 96

Note Set the PLC settings (node address, Unit address, etc.) made here to agree with
the network address, node address, and Unit address settings made using CXProcess Tool. If the settings do not agree, monitoring using the System Monitor
Screen will not be performed correctly.
1, 2, 3... 1. In the Setup Dialog Box, click the System Monitor Builder Button.
Click here
The System Monitor Setting Window will be displayed.
4-4SectionSystem Monitor Settings
Specify the node address of the computer connected to
the PLC (the default is 32). Normally, be sure to allocate
32 to the computer connected to the PLC. Also set the
node address of the personal computer for FinsGateway
to 32.
2. Select the node address allocated to the PLC or computer. Select the button
displayed beneath the node address. Normally, the computer is node 32.
The System Monitor Builder Dialog Box will be displayed.
3. Select the device (PLC or computer), and then make the appropriate settings.
Select PLC to enable the Settings Button.
Select computer to enable the Network
Type Button.
87
Page 97

4-4SectionSystem Monitor Settings
PLC Settings
In Node Type, select PC to enable the Settings Button.
Click the Settings Button. The following dialog box will be displayed.
Note When mounting multiple Loop Control Units to a single PLC, register the Units in
ascending order of unit addresses and LCU numbers.
You can connect up to three Loop Control Units to one PLC. Select the check box
for the Loop Control Unit mounted to the PLC, and enter the unit address.
Click the OK Button to return to the Set Node Dialog Box.
Note The unit address value for each node Unit (address) set here can be used only
from the System Monitor Screen. Which Loop Control Unit’s data and which PLC
CX-Process Monitor will access depends on the network address, node address, and unit address set using CX-Process Tool. (This is linked to the Tag information.)
Computer
In Node Type, select Computer to enable the Network Type Button.
Click the Communication type setting Button. The following dialog box will ap-
pear.
The Details button will be enabled if you
select Serial. If you click the Details Button,
the following dialog box will be displayed.
In Network Type, select CLK, Serial, or Ethernet.
If you select Serial, set the computer COM port, and the baud rate. If necessary,
also set Initialize serial port. Refer to the following Note.
Click the OK Button to return to the Set Node Dialog Box.
Note a) If you set the communications type to Serial (Host Link), when you
start the monitor process (i.e., select Start Up in the Setup Dialog
Box), FinsGateway Serial Unit driver will start according to the
communications conditions set here. If you have not selected Ini-
tialize serial port, however, the FinsGateway Serial Unit driver
will not start automatically.
If you select another communications type (Controller Link or
Ethernet), the communications type set here can be used only
from the System Monitor Screen. You must start the FinsGateway
manually.
88
Page 98

b) When using Controller Link as the communications network, you
must create Controller Link data link tables, and register to each
node (refer to Appendix B FinsGateway Settings when Con-
nected Using Controller Link). Use Ethernet as the communications type if not creating data link tables.
4. When you have finished making all the PLC and computer settings, click the
OK Button in the System Monitor Settings Window. This completes the System Monitor settings.
4-5 Creating Graphic Screens
4-5-1 Outline
The Graphic Screen displays schematically the device status.
Create the Graphic Screen using the Graphic Builder.
• Paste to the screen graphics representing plant instrumentation, which have
been pre-prepared, and use them to display the device status, to a maximum
of 200 screens.
• Pre-prepared fixed graphics: Text, instruments, thermometers, transmitters,
orifices.
• Pre-prepared changeable graphics:
Analog inputs: Bar graph displays, numerical value displays, tanks
Analog settings: Numerical settings (See note.)
Contact inputs (display): Pumps, valves, pipes
Contact settings (operation): Switches (See note.)
4-5SectionCreating Graphic Screens
Note If setting analog values or contact settings, use AO Settings from Computer or
DO Settings from Computer Tags.
• For other fixed graphics, read and paste graphics created using bitmap files.
Basically, after cutting and pasting the background and other graphics, paste
the pre-prepared fixed or changeable graphic display elements mentioned
above to create the complete Graphic Screen.
89
Page 99

4-5SectionCreating Graphic Screens
Element Function block name (model) Function block or ITEM set as send source
Function block
Display Analog values: Bar graphs, numerical values, tank level
Setting Analog values: Numerical values (using AO Terminal Settings
1-Block Send Terminal to Computer
(403)
4-Block Send Terminal to Computer
(404)
AO to Computer (402), AO Terminal
to all nodes (408)
DO to Computer (401), DO Terminal
to all nodes (407)
AO Terminal Settings from
Computer (410)
DO Terminal Settings from
Computer (409)
Control Block: Tag ITEMs for Basic PID (011), Advanced PID
(012), Batch flowrate capture (014), Indication and Setting
(031), Indication and Operation (032), Ratio Setting (033),
Indicator (034), blended PID (013), 2-position ON/OFF (001),
3-position ON/OFF (002)
Control Block: Basic PID (011), Advanced PID (012),
Indication and Setting (031), Indication and Operation (032),
Ratio Setting (033), Indicator (034), 2-position ON/OFF (001),
3-position ON/OFF (002)
Operation Block: High/Low Alarm (111), Segment Program
2(157), ON/OFF Valve Manipulator (221), Motor Manipulator
(222), Reversible Motor Manipulator (223), Motor Opening
Manipulator (224), Timer (205), Counter (208)
Analog input signals or analog output signals for all Function
Blocks, or analog value parameters
Contact input signals or contact output signals for all Function
Blocks, or contact value parameters
Analog output ITEM for AO Terminal Settings from Computer
(Used to set ordinary analog values. Displays using network
resend monitoring.)
Contact output ITEM for DO Terminal Settings from Computer
(Used to set ordinary contact values. Displays using network
resend monitoring.)
Contacts: Indicators, pumps, valves, pipes
from Computer)
Contacts: Switches (using DO Terminal Settings from
Computer)
Note If the WS02-LCTK1-EL01 License Key is not connected to the computer printer
port, or even if it is connected, if the License key driver is not installed, you cannot use the Graphic Builder. (If you try to click the Graphic Builder Button and
change to the Graphic Builder, an error message will be displayed.)
4-5-2 Graphic Screen Creation Window Operations
Starting
In the Setup Dialog Box, click the Graphic Builder Button.
Click here
90
Page 100

The Graphic Builder will be displayed.
4-5SectionCreating Graphic Screens
Stopping
Menu Command
Menu Command Shortcut
File
In the File menu, click Exit.
The Graphic Builder will close.
Note 1. When using the Graphic Screen, first create and save the graphics using
Graphic Builder (using the CRT Builder Button in the Setup Dialog Box),
and then register the saved graphics in the Overview Screen in the format
you have selected. Consequently, before registering the graphics in the
Overview screen, you must create and save the graphics using the Graphic
Builder.
2. If you have not saved the edited data when you click Exit, a window recommending that you save the data will be displayed. Save all necessary data.
After performing this operation, the Graphic Builder will close.
3. You must configure the screen to display the Graphics Screen you have
created using CX-Process Monitor. Refer to Graphic Screen Registration in
4-6 Screen Configuration for how to make the settings.
This shows the commands available in the Graphics Builder.
Function
key
New Ctrl + N Create new Graphic Screen
Open Ctrl + O Close created Graphic Screen
Save Ctrl + S Overwrite project being edited
Save As --- Save project being edited with a new name
Delete File Information --- Specify name of a registered Graphic Screen, and
delete that file information
Modify File Information --- Specify name of a registered Graphic Screen, and
change the file information for it
Recent Files --- Display the most recent files
Exit --- Close Graphic Builder
91
 Loading...