

Page 1

Bode 100
User Manual
Page 2

Bode 100 User Manual
Article Number VESD0661 - Manual Version: Bode100.AE.3
© OMICRON Lab 2008. All rights reserved.
This User Manual is a publication of OMICRON electronics GmbH.
This User Manual represents the technical status at the time of printing. The product information,
specifications, and all technic al data contai ned within this User Manual a re not contractu ally bindin g.
OMICRON electronics reserves the right to make changes at any time to the technology and/or
configuration without announcement. OMICRON electronics is not to be held liable for statements and
declarations given in this User Ma nual. T he user is respon sible for ev ery appli cati on descr ibed in this
User Manual and its results. OMICRON electronics explicitly exonerates itself from all liability for
mistakes in this manual.
Please feel free to copy this manual for your needs.
Windows is a registered trademark of Microsoft Corporation. Excel is a registered trademark of
Microsoft Corporation. Visual C++ is a registered trademark of Microsoft Corporation. MATLAB is a
registered trademark of The MathWorks, Inc. LabVIEW is a registered trademark of National
Instruments.
2
Page 3

Contents
Contents
Using This Manual. . . . . . . . . . . . . . . . . . . . . . . . . . . . . . . . . . . . . . . . . . . . . .7
Conventions and Symbols Used . . . . . . . . . . . . . . . . . . . . . . . . . . . . . . . .7
Related Documents. . . . . . . . . . . . . . . . . . . . . . . . . . . . . . . . . . . . . . . . . .7
1 Introduction . . . . . . . . . . . . . . . . . . . . . . . . . . . . . . . . . . . . . . . . . . . . . . . . . . .9
1.1 Overview . . . . . . . . . . . . . . . . . . . . . . . . . . . . . . . . . . . . . . . . . . . . . . . . . .9
1.2 Block Diagram. . . . . . . . . . . . . . . . . . . . . . . . . . . . . . . . . . . . . . . . . . . . .10
1.3 Connectors . . . . . . . . . . . . . . . . . . . . . . . . . . . . . . . . . . . . . . . . . . . . . . .11
1.4 Standard Compliance . . . . . . . . . . . . . . . . . . . . . . . . . . . . . . . . . . . . . . .12
1.5 Normative Conformity . . . . . . . . . . . . . . . . . . . . . . . . . . . . . . . . . . . . . . .12
1.6 Test Compliance . . . . . . . . . . . . . . . . . . . . . . . . . . . . . . . . . . . . . . . . . . .12
1.7 Delivery . . . . . . . . . . . . . . . . . . . . . . . . . . . . . . . . . . . . . . . . . . . . . . . . . .13
2 Getting Started. . . . . . . . . . . . . . . . . . . . . . . . . . . . . . . . . . . . . . . . . . . . . . . .15
2.1 Installing the Bode Analyzer Suite. . . . . . . . . . . . . . . . . . . . . . . . . . . . . .15
2.2 Powering the Bode 100. . . . . . . . . . . . . . . . . . . . . . . . . . . . . . . . . . . . . .15
2.3 Connecting the Bode 100 to the Computer. . . . . . . . . . . . . . . . . . . . . . .15
2.4 How to Proceed. . . . . . . . . . . . . . . . . . . . . . . . . . . . . . . . . . . . . . . . . . . .16
3 Gain/Phase Mode. . . . . . . . . . . . . . . . . . . . . . . . . . . . . . . . . . . . . . . . . . . . . .17
3.1 Basics . . . . . . . . . . . . . . . . . . . . . . . . . . . . . . . . . . . . . . . . . . . . . . . . . . .20
3.1.1 Internal Reference Connection. . . . . . . . . . . . . . . . . . . . . . . . . .21
3.1.2 External Reference Connection . . . . . . . . . . . . . . . . . . . . . . . . . 21
3.2 Choosing the Reference Connection. . . . . . . . . . . . . . . . . . . . . . . . . . . .22
3.3 Example: Gain/Phase Measurement. . . . . . . . . . . . . . . . . . . . . . . . . . . .24
4 Impedance/Reflection Mode . . . . . . . . . . . . . . . . . . . . . . . . . . . . . . . . . . . . .33
4.1 Basics . . . . . . . . . . . . . . . . . . . . . . . . . . . . . . . . . . . . . . . . . . . . . . . . . . .34
4.1.1 General Formulas. . . . . . . . . . . . . . . . . . . . . . . . . . . . . . . . . . . .34
4.1.2 Equivalent Circuits . . . . . . . . . . . . . . . . . . . . . . . . . . . . . . . . . . .35
4.1.3 Quality Factor . . . . . . . . . . . . . . . . . . . . . . . . . . . . . . . . . . . . . . .37
4.2 Example: Impedance/Reflection Measurement. . . . . . . . . . . . . . . . . . . .37
3
Page 4

Bode 100 User Manual
5 Frequency Sweep Mode . . . . . . . . . . . . . . . . . . . . . . . . . . . . . . . . . . . . . . . .43
5.1 Example: Frequency Sweep Measurement. . . . . . . . . . . . . . . . . . . . . . .46
5.2 Impedance Calibration. . . . . . . . . . . . . . . . . . . . . . . . . . . . . . . . . . . . . . .57
6 Frequency Sweep (External Coupler) Mode . . . . . . . . . . . . . . . . . . . . . . . .63
6.1 Example: Frequency Sweep (External Coupler) Measurement . . . . . . .65
7 Calibrating the Bode 100. . . . . . . . . . . . . . . . . . . . . . . . . . . . . . . . . . . . . . . .75
7.1 Calibration Methods. . . . . . . . . . . . . . . . . . . . . . . . . . . . . . . . . . . . . . . . .75
7.1.1 Probe Calibration . . . . . . . . . . . . . . . . . . . . . . . . . . . . . . . . . . . .75
7.1.2 User Calibration . . . . . . . . . . . . . . . . . . . . . . . . . . . . . . . . . . . . .76
7.1.3 Hierarchy of Calibration Methods . . . . . . . . . . . . . . . . . . . . . . . .77
7.2 Calibration in the Gain/Phase Mode
(Internal Reference Connection) . . . . . . . . . . . . . . . . . . . . . . . . . . . . . . .77
7.3 Calibration in the Gain/Phase Mode
(External Reference Connection – CH1). . . . . . . . . . . . . . . . . . . . . . . . .78
7.4 Calibration in the Impedance/Reflection Mode . . . . . . . . . . . . . . . . . . . .83
7.5 Calibration in the Frequency Sweep Mode . . . . . . . . . . . . . . . . . . . . . . .90
7.6 Calibration in the Frequ ency Sweep (External Coupler) Mode . . . . . . . .91
8 Common Functions . . . . . . . . . . . . . . . . . . . . . . . . . . . . . . . . . . . . . . . . . . . .95
8.1 Toolbars, Menus and Commands . . . . . . . . . . . . . . . . . . . . . . . . . . . . . . 95
8.2 Setting the Measurement Range. . . . . . . . . . . . . . . . . . . . . . . . . . . . . . .98
8.3 File Operations . . . . . . . . . . . . . . . . . . . . . . . . . . . . . . . . . . . . . . . . . . . . 98
8.3.1 Loading and Saving the Equipment Configuration . . . . . . . . . . .98
8.3.2 Exporting Measurement Data. . . . . . . . . . . . . . . . . . . . . . . . . . .99
9 Advanced Functions . . . . . . . . . . . . . . . . . . . . . . . . . . . . . . . . . . . . . . . . . .101
9.1 Advanced Display Options . . . . . . . . . . . . . . . . . . . . . . . . . . . . . . . . . .101
9.1.1 Gain/Phase and Impedance/Reflection Mode . . . . . . . . . . . . .101
9.1.2 Frequency Sweep and
Frequency Sweep (External Coupler) Mode. . . . . . . . . . . . . . .104
9.2 Advanced Sweep Options. . . . . . . . . . . . . . . . . . . . . . . . . . . . . . . . . . .116
9.3 Level Shaping . . . . . . . . . . . . . . . . . . . . . . . . . . . . . . . . . . . . . . . . . . . .120
9.4 Using Probes. . . . . . . . . . . . . . . . . . . . . . . . . . . . . . . . . . . . . . . . . . . . .125
4
Page 5

Contents
10 Automation Interface. . . . . . . . . . . . . . . . . . . . . . . . . . . . . . . . . . . . . . . . . .129
11 Troubleshooting. . . . . . . . . . . . . . . . . . . . . . . . . . . . . . . . . . . . . . . . . . . . . .133
11.1 USB Cable and/or Power Sup ply to the Bode 100 Is Missing. . . . . . . .133
11.2 Lost Communication . . . . . . . . . . . . . . . . . . . . . . . . . . . . . . . . . . . . . . .133
11.3 Cannot Select Frequencies Lower Than 10 Hz. . . . . . . . . . . . . . . . . . .133
12 Technical Data . . . . . . . . . . . . . . . . . . . . . . . . . . . . . . . . . . . . . . . . . . . . . . .135
12.1 Bode 100 Specifications . . . . . . . . . . . . . . . . . . . . . . . . . . . . . . . . . . . .135
12.2 Power Requirements. . . . . . . . . . . . . . . . . . . . . . . . . . . . . . . . . . . . . . .136
12.3 Absolute Maximum Ratings. . . . . . . . . . . . . . . . . . . . . . . . . . . . . . . . . .136
12.4 Computer Requirements. . . . . . . . . . . . . . . . . . . . . . . . . . . . . . . . . . . .137
12.5 Environmental Requirements . . . . . . . . . . . . . . . . . . . . . . . . . . . . . . . .137
12.6 Mechanical Data . . . . . . . . . . . . . . . . . . . . . . . . . . . . . . . . . . . . . . . . . .137
Contact Information / Technical Support . . . . . . . . . . . . . . . . . . . . . . . . .1 39
Index . . . . . . . . . . . . . . . . . . . . . . . . . . . . . . . . . . . . . . . . . . . . . . . . . . . . . . .141
5
Page 6

Bode 100 User Manual
This page intentionally left blank
6
Page 7

Using This Manual
Using This Manual
This User Manual provides detailed information on how to use all functions of
the Bode 100 vector network analyzer properly and efficiently. The Bode 100
User Manual is intended for all users of the Bode 100, providing instructions on
the operation, usage, and measurement procedures.
Any user of the Bode 100 should have fundamental working knowledge of basic
electronics, general measurement techniques, and the use of computer-based
applications running under a Windows
Conventions and Symbols Used
In this manual, the following symbol indicates paragraphs with special safety
relevant meaning:
Symbol Description
®
environment.
Equipment damage or loss of data
possible
Related Documents
The following documents complete the information covered in the Bode 100
User Manual:
Title Description
Automation Interface Object Hierarchy
and Automation Interface Reference
(available in the Automation
subdirectory of the
Bode Analyzer Suite directory)
Provide detailed information on the
Bode Analyzer Automation Interface.
7
Page 8

Bode 100 User Manual
This page intentionally left blank
8
Page 9

1 Introduction
1.1 Overview
The Bode 100 is a multifunctional test & measurement instrument designed for
professionals such as scientists, engineers and teachers engaged in the field of
electronics. Its concept – universal hardware controlled by the
Bode Analyzer Suite software running on a computer – makes the Bode 100 an
efficient and flexible solution for a wide spectrum of applications including:
• Gain/Phase measurements
The Bode 100 measures the gain and phase of passive and active electronic
circuits as well as complex electronic systems such as closed-loop control
systems, video systems and RF equipment.
• Impedance/Reflection measurements
The Bode 100 measures the impedance, admittance and reflection
coefficient of passive and active electronic circuits. An internal bridge allows
performing measurements by just connecting the device under test (DUT) to
the Bode 100 source.
Introduction
• Frequency Sweep measurements
In addition to single frequency measurements, the Bode 100 performs
measurements in the Frequency Sweep mode.
In this measurement mode, the Bode 100 is capable of measuring the
complex gain, reflection coefficient and impedance of the DUT. The results
are displayed as a function of the frequency in various display formats such
as group delay curves or Smith charts.
• Frequency Sweep (External Coupler) measurements
In this measurement mode you can measure the complex impedance,
admittance and reflection coefficient of the DUT by using an external
directional coupler or other external measurement bridge. Typical application
examples include measurements of broadcast antennas and impedance
measurements with signal levels above 20 mW.
The measurement results are available on your computer for processing and/or
documentation.
The Bode 100 includes a DDS (direct digital synthesis) signal source with
adjustable level and frequency for excitation of the DUT, two receivers
processing the DUT’s response and a microcontroller. A DC power converter
generates voltages for powering the circuitry involved. For the basic block
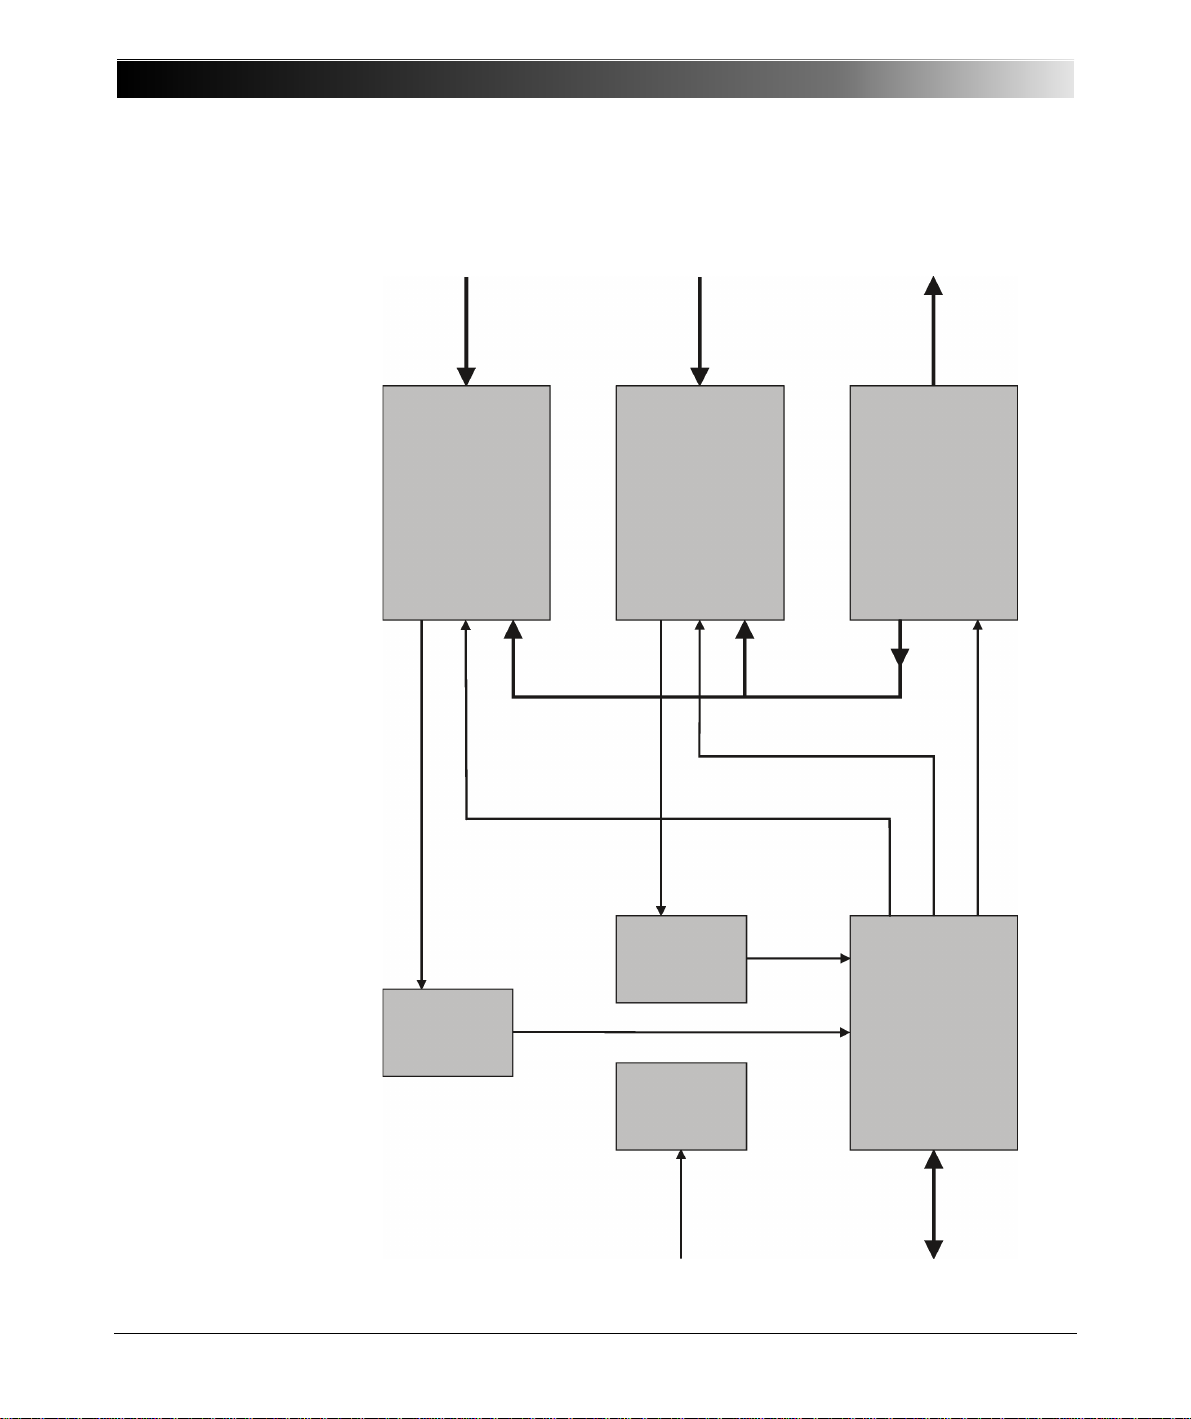
diagram of the Bode 100, see Figure 1-1: "Block diagram" on page 10.
The Bode Analyzer Suite runs on a computer connected to the Bode 100
through USB interface.
9
Page 10
Bode 100 User Manual
1.2 Block Diagram
Figure 1-1:
Block diagram
CH 2 INPUT
CH 2 receiver
CH 1 INPUT
CH 1 receiver
OUTPUT
DDS signal sourceMicrocontroller
10
CH 1
ADC
CH 2
ADC
DC power
converter
DC power
input
USB
interface
Page 11
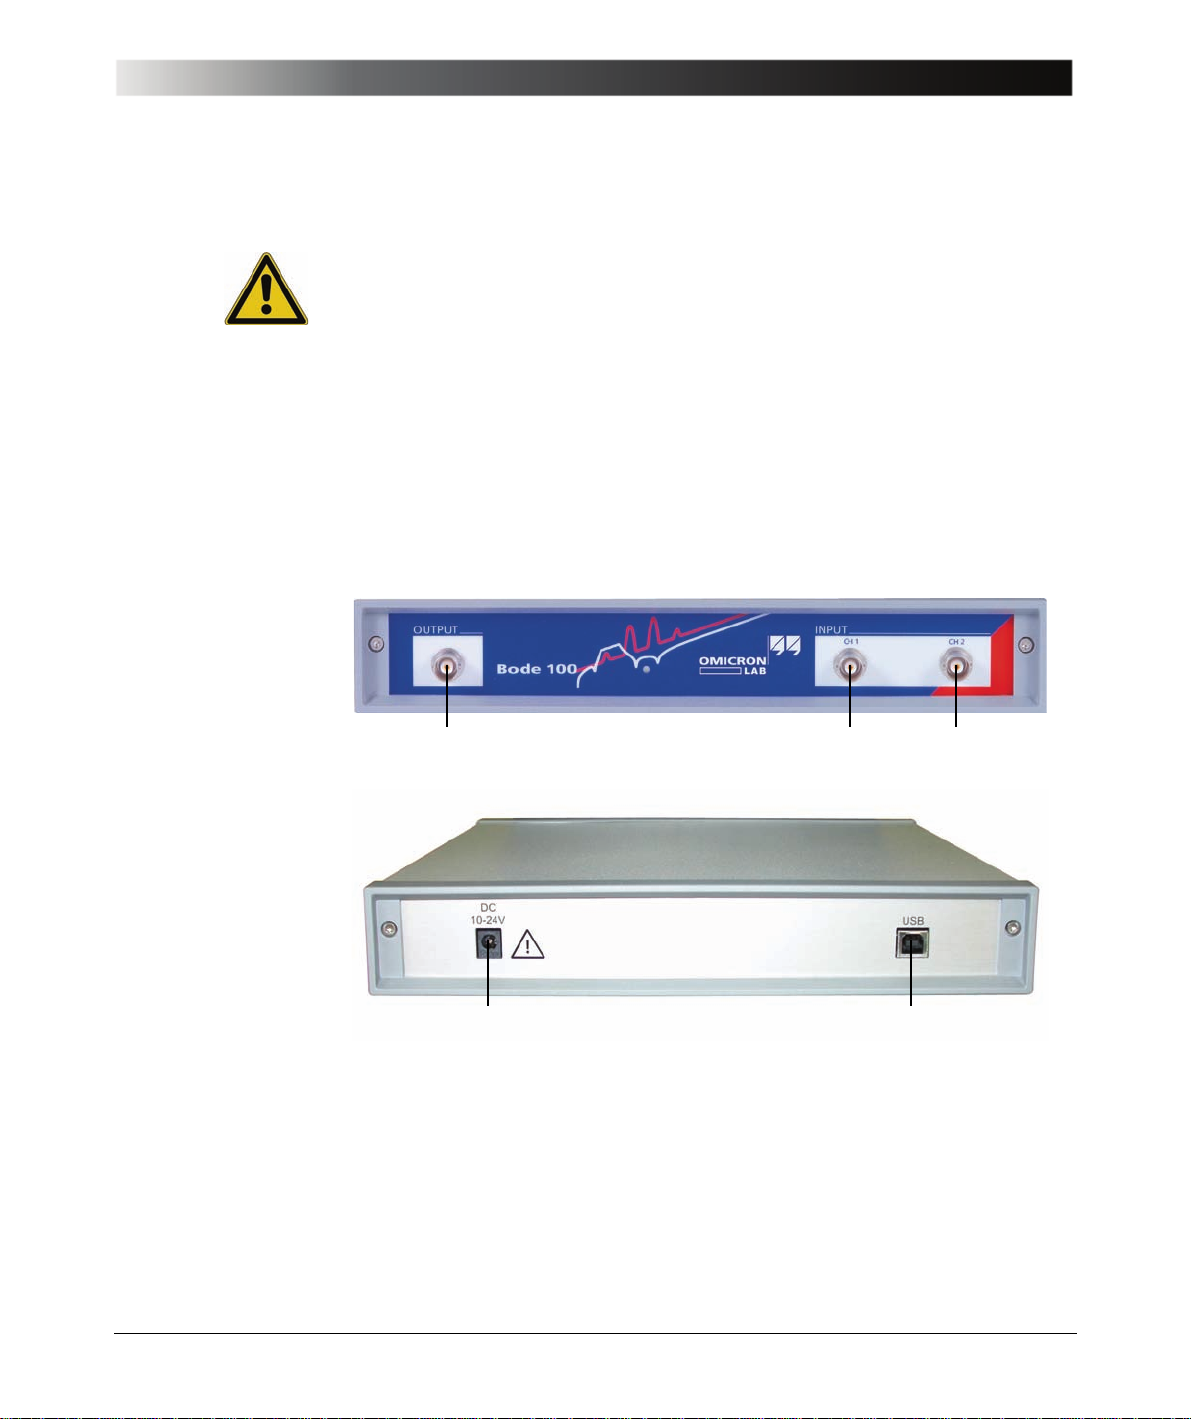
Figure 1-2:
Bode 100 front view
Introduction
1.3 Connectors
Caution: To avoid damage of the Bode 100, check 12.3 "Absolute
Maximum Ratings" on page 136 for maximum input signals at the
CH 1 INPUT and CH 2 INPUT connectors and maximum reverse power at
the OUTPUT connector.
The Bode 100 provides the following connectors:
• OUTPUT (signal source output) on the front panel
• CH 1 INPUT (channel 1 input) on the front panel
• CH 2 INPUT (channel 2 input) on the front panel
• DC power input on the rear panel
• USB connector on the rear panel
Figure 1-3:
Bode 100 rear view
OUTPUT CH 1 INPUT
DC power input USB connector
CH 2 INPUT
11
Page 12
Bode 100 User Manual
1.4 Standard Compliance
Table 1-1:
Standard compliance
1.5 Normative Conformity
Table 1-2:
Conformity documents
The Bode 100 complies with the following standards:
Standard Description
IEC 61326:
Class B equipment
Performance criterion B
Universal Serial Bu s (US B) Specification,
Revision 1.1 and Revision 2.0
The Bode 100 conforms to the following normative documents of the EU:
Document Description
73/23/EWG Concerning electrical devices for use of certain voltage limits
with changes due to the CE designation standard 93/68/EWG
89/336/EWG About electromagnetic compatibility changed by
the standard of the Council from 1991-04-29 (91/263/EWG),
the standard of the Council from 1992-04-28 (92/31/EWG),
and
the standard of the Council from 1993-07-22 (93/68/EWG)
EMC requirements
USB interface
12
1.6 Test Compliance
The Bode 100 passed the tests according to the EN/IEC 61010-1, IEC 61326.
Page 13
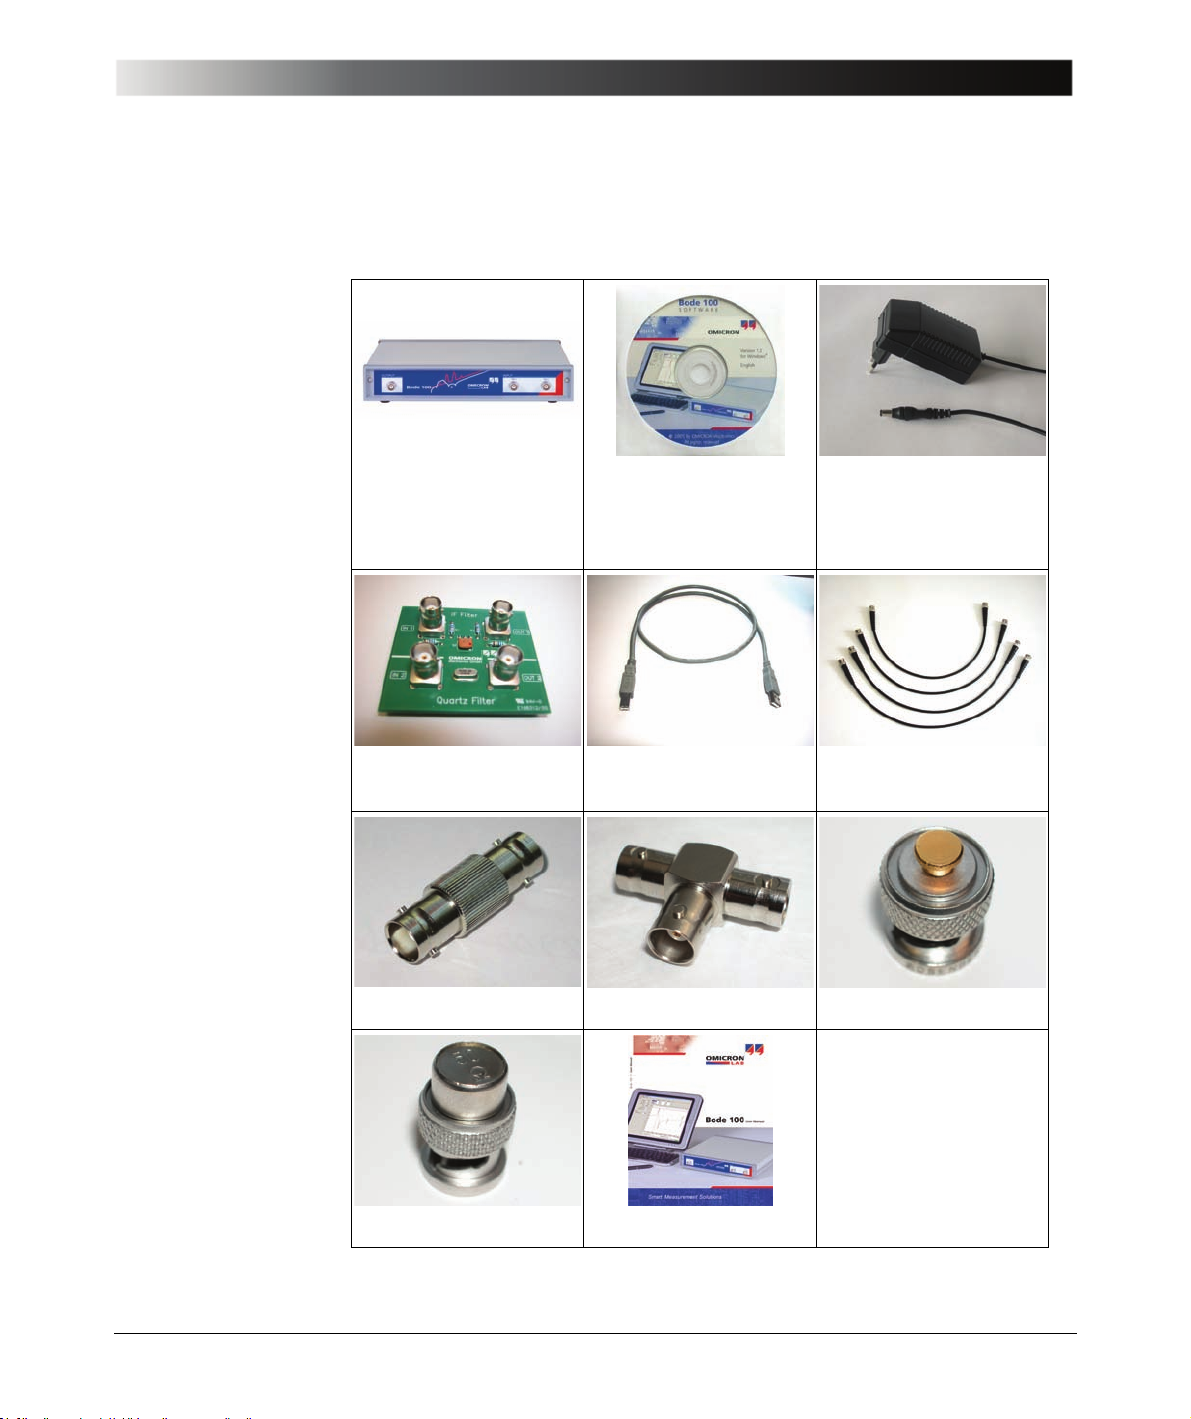
1.7 Delivery
Introduction
Bode 100 multifunctional
vector network analyzer
Test objects on a PCB:
quartz filter, IF filter
BNC straight adapter (f–f) BNC T adapter (f–f–f) BNC short circuit (m)
Bode 100 CD-ROM Wide-range AC power
supply including mains
input plugs for different
national standards
USB cable 4 × BNC 50 Ω cable
(m–m)
BNC 50 Ω load (m) Bode 100 User Manual
The delivered items
may differ slightly
from the picture.
13
Page 14

Bode 100 User Manual
This page intentionally left blank
14
Page 15
2 Getting Started
Caution: Before installing the Bode 100 , check the environmental and
power requirements (see 12 "Technical Data" on page 135).
2.1 Installing the Bode Analyzer Suite
Caution: Install the Bode Analyzer Suite from the delivered CD-ROM
before connecting the Bode 100 to the USB connector of your computer.
The Bode Analyzer Suite on the delivered CD-ROM controls the operation of the
Bode 100. Install the Bode Analyzer Suite first, before you connect the
Bode 100 to the computer. Put the Bode 100 CD-ROM in the CD-ROM drive and
follow the instructions on the screen. Select the 32-bit or 64-bit installation
according to your computer’s hardware. For installation support, visit the
OMICRON Lab Web site www.omicron-lab.com
center (see "Contact Information / Technical Support" on page 139).
or contact your nearest support
Getting Started
2.2 Powering the Bode 100
Caution: Before powering the Bode 100 using a DC power supply different
from the one delivered with the Bode 100, check the polarity of its output
voltage (see 12.2 "Power Requirements" on page 136).
The Bode 100 is powered with an external wide-range AC power adapter.
Before powering the Bode 100, select the adapter’s mains input plug fitting your
power outlet. Plug the adapter’s DC output connector into the Bode 100 DC
power input on the rear panel and the mains input plug into the power outlet.
Alternatively, you can power the Bode 100 with any DC power supply meeting
the power requirements specified on page 136.
2.3 Connecting the Bode 100 to the Computer
The Bode 100 communicates with the computer through USB interface (see
12.4 "Computer Requirements" on page 137). Connect the Bode 100 USB
connector on the rear panel to the USB connector of your computer using the
USB cable delivered with your Bode 100.
15
Page 16

Bode 100 User Manual
2.4 How to Proceed
Now, you are ready to work with your Bode 100. You can proceed with
Section 3 "Gain/Phase Mode" to make your first measurement with the
Bode 100, and then go through the Bode 100 User Manual to learn the
capabilities of your Bode 100 by doing practical examples. For the
Bode Analyzer Suite basics, see Section 8 "Common Functions".
16
Page 17
3 Gain/Phase Mode
Gain/Phase Mode
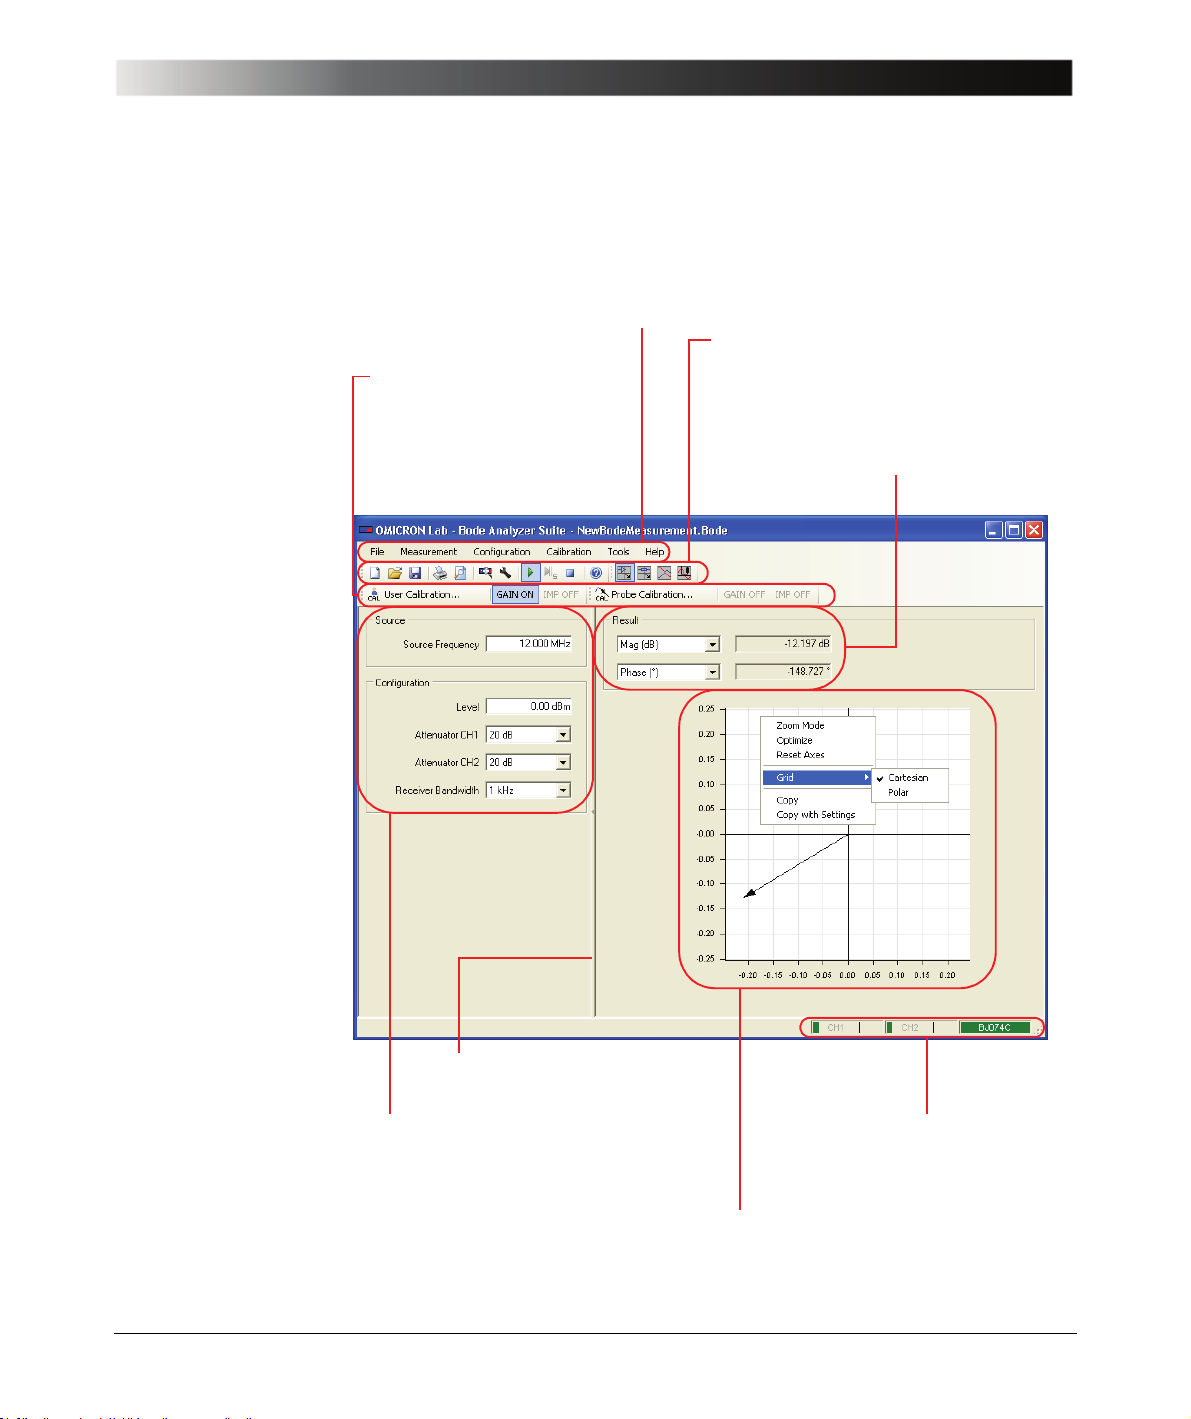
Figure 3-1:
Gain/Phase mode
window
Menu bar
Allows access to all Bode 100 functions. See Table 8-1: "Menus and commands" on page 96.
Toolbar
Calibration toolb a r
Choose the calibration mode.
Switch the calibration on and off.
See Figure 8-2: "Calibration toolbar"
on page 95.
Contains shortcuts to the most important
Bode 100 functions.
See Figure 8-1: "Toolbar" on page 95.
Results
Select the result format and get result values.
See Figure 3-3: "Gain/Phase mode results" on
page 18.
Split bar
Drag the split bar to resize the panes.
Configuration and me asurement setup
See Figure 3-2: "Configuration and
measurement setup" on page 18.
Graphical display of measurement results
Use the shortcut menu to optimize the display.
See Figure 3-4: "Graphical display of measurement results" on page 19.
Overload and connection indicators
See Figure 3-5: "Overload and
connection indicators" on page 19.
17
Page 18
Bode 100 User Manual
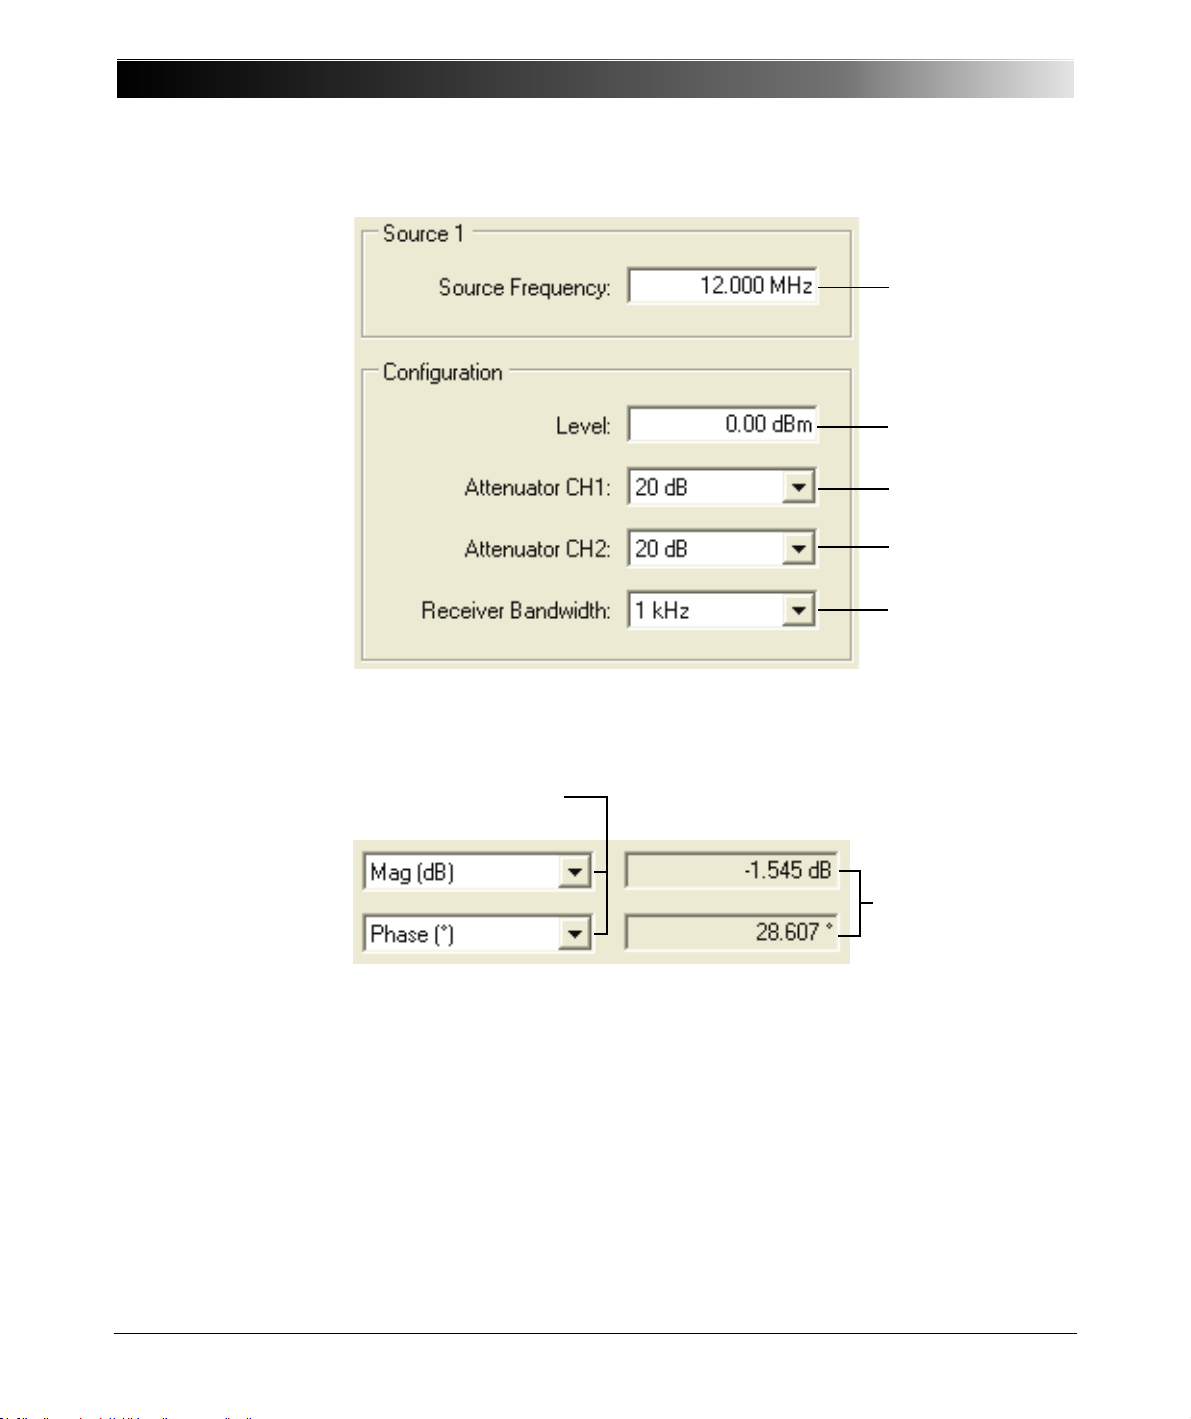
Figure 3-2:
Configuration and
measurement setup
Set the output source
generator frequency.
Set the output source
generator level.
Select the channel 1
input attenuation.
Select the channel 2
input attenuation.
Select the receiver
bandwidth.
Figure 3-3:
Gain/Phase mode
results
Hint: A higher receiver bandwidth allows faster measurements, a lower receiver
bandwidth in creases the measurement accuracy.
Select the output format of
measurement results.
Display of measurement
results in the selected
format.
18
Page 19
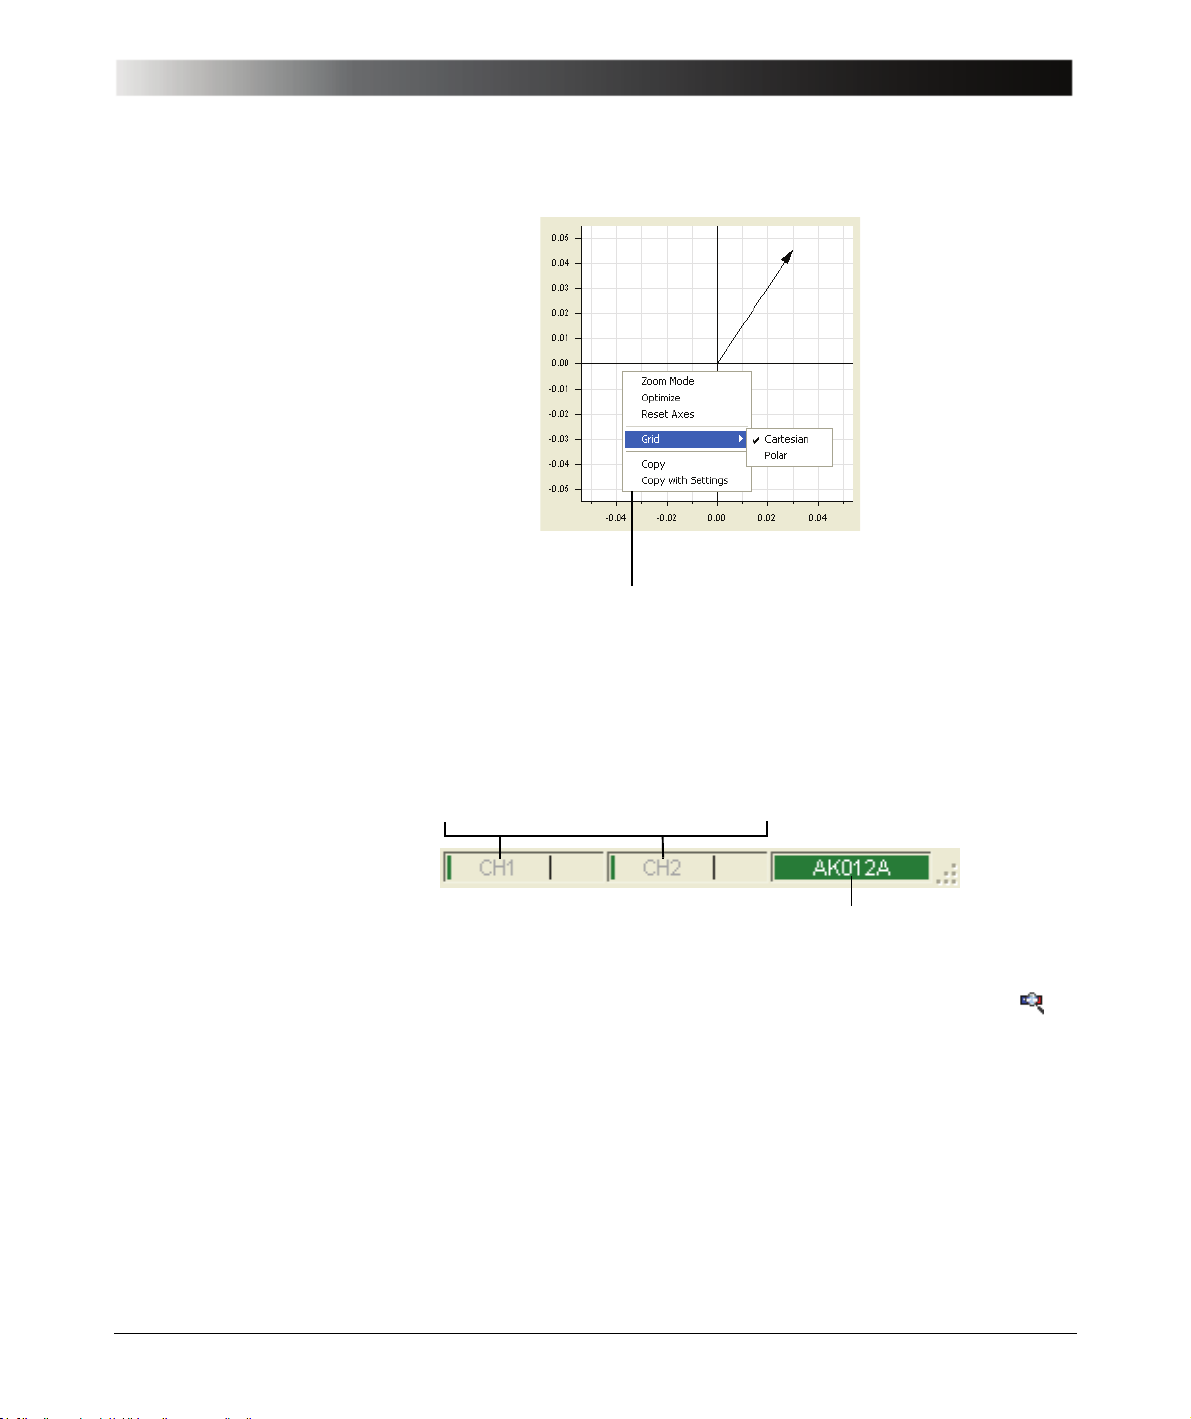
Figure 3-4:
Graphical display of
measurement results
Gain/Phase Mode
Right-click in the diagram to open the shortcut menu.
Use the shortcut menu to optimize the diagram, select the grid and zoom in the
diagram. After having zoomed in, click Optimize to get back to an optimized diagram.
Figure 3-5:
Overload and
connection indicators
Hint: Using the Copy and Copy with Settings function s y ou ca n ea si ly export
your diagram into other Windows
®
applications. For more information, see
9.1 "Advanced Display Options" on page 101.
Overload indicators for the channel 1 and channel 2 inputs. If you see a red bar, increase
the attenuation of the respective channel or reduce the source level to prevent the overload.
Serial number of the Bode 100
Hint: If the serial number field in the status bar displays No Device on red
background, check whether the Bode 100 is powered and connected to your
computer, and then click the Search and Reconnect Device toolbar button
to reconnect the Bode 100.
19
Page 20

Bode 100 User Manual
3.1 Basics
The gain and phase of the DUT is calculated from the measurement data
obtained using the reference channel 1 and the measurement channel 2. You
can connect the signal source to the reference channel internally or externally
as described in 3.2 "Choosing the Reference Connection" on page 22.
The basic definitions and formulas related to the gain/phase measurements are
summarized below:
Hf() abs Hf(){}=
φ f() Hf(){}arg=
Tgf()
----- 2π
1
d
φ f()•
fd
d
φω()–=–=
ωd
where
…displayed gain/phase function
Hf()
…magnitude of
Hf() Hf()
…phase of
φ f() Hf()
…group delay of
Tgf() Hf()
V
OUT
=
• ij≠,=
V
OUT
-------------
V
IN
-------------
V
0
Sjif() 2
HTf()
where
…S parameter from port i to port j of the DUT
Sjif() ij≠()
…transfer function of a two-port device, depends on the load of the
H
f() HTf()
T
V
OUT
V
0
V
IN
V
CH1
V
CH2
Z
IN
R
S
Assumptions for measuring :
port where is measured
V
OUT
…voltage at the DUT’s output
…open-circuit voltage of the source
…voltage at the DUT’s input
…voltage at the channel 1 input
…voltage at the channel 2 input
…input impedance of the DUT
…50 Ω source resistance
Sjif()
(Eq. 3-1)
(Eq. 3-2)
(Eq. 3-3)
(Eq. 3-4)
(Eq. 3-5)
20
• The source with resistance
•50Ω load (receiver resistance) at port j measuring , any other ports of
= 50 Ω is connected to port i.
R
S
V
OUT
the DUT are terminated with 50 Ω.
• Connections are made with 50 Ω cables.
Page 21
3.1.1 Internal Reference Connection
Table 3-1:
Formulas for Internal
Reference Connection
Gain/Phase Mode
The basic formulas for the internal reference connection are summarized below.
Note: In the internal reference connection mode of the Bode 100, the reference
voltage for the gain/phase measurement is always .
V02⁄
Channel 2 Input Resistance
50 Ω High Impedance
V
0
V
V
Hf()
= of the DUT (Eq. 3-11)
----- -
=
CH1
CH2VOUT
2
= V
V
CH2
-------------
V
CH1
2
V
-------------
•==
OUT
V
0
Sjif()
(Eq. 3-6) (Eq. 3-7)
(Eq. 3-8) (Eq. 3-9)
V
CH1
CH2
V
INV0
Hf()
2
•
= (Eq. 3-12)
Hf() 2 HTf()
If you make a through connection
from the source to CH 2:
0 dB gain will be displayed since
V
CH2V0
2⁄= V
If you make a through connection
from the source to CH 2:
+6 dB gain will be displayed since
CH2
3.1.2 External Reference Connection
V
0
----- -
=
2
V
=
OUT
--------------------------
•=
ZINRS+()
V
CH2
-------------
V
CH1
V
OUT
-------------
--------------------------
•
V
IN
V0=
Z
IN
V
OUT
-------------
2
•==
V
0
Z
IN
ZINRS+()
Z
IN
--------------------------
••=
ZINRS+()
(Eq. 3-10)
(Eq. 3-13)
Independent of the selected input impedance at the channel 1and channel 2
inputs, the following formulas apply:
V
V
Hf() HTf()
VIN=
CH1
V
=
CH2
OUT
V
CH2
===
-------------
V
CH1
V
OUT
-------------
V
IN
(Eq. 3-14)
(Eq. 3-15)
(Eq. 3-16)
21
Page 22
Bode 100 User Manual
3.2 Choosing the Reference Connection
Open the Configuration window by clicking Device Configuration on the
Configuration menu or the Device Configuration toolbar button (see
3.3 "Example: Gain/Phase Measurement" on page 24). By default, the
Device Configuration tab is selected.
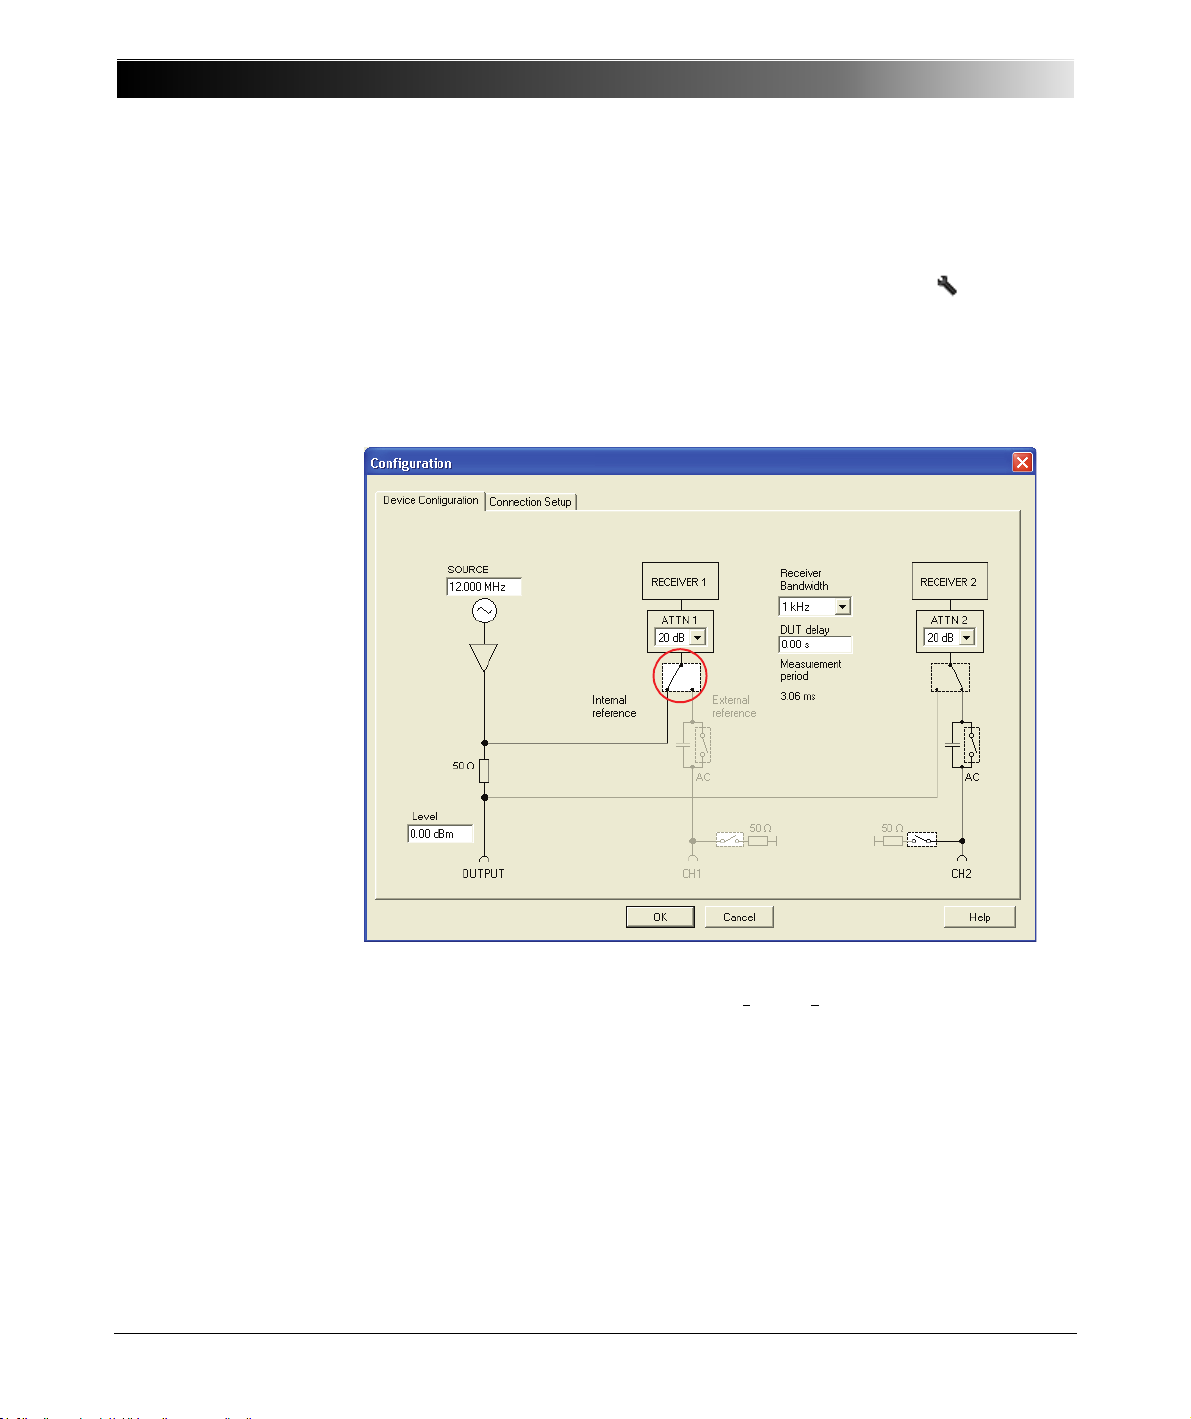
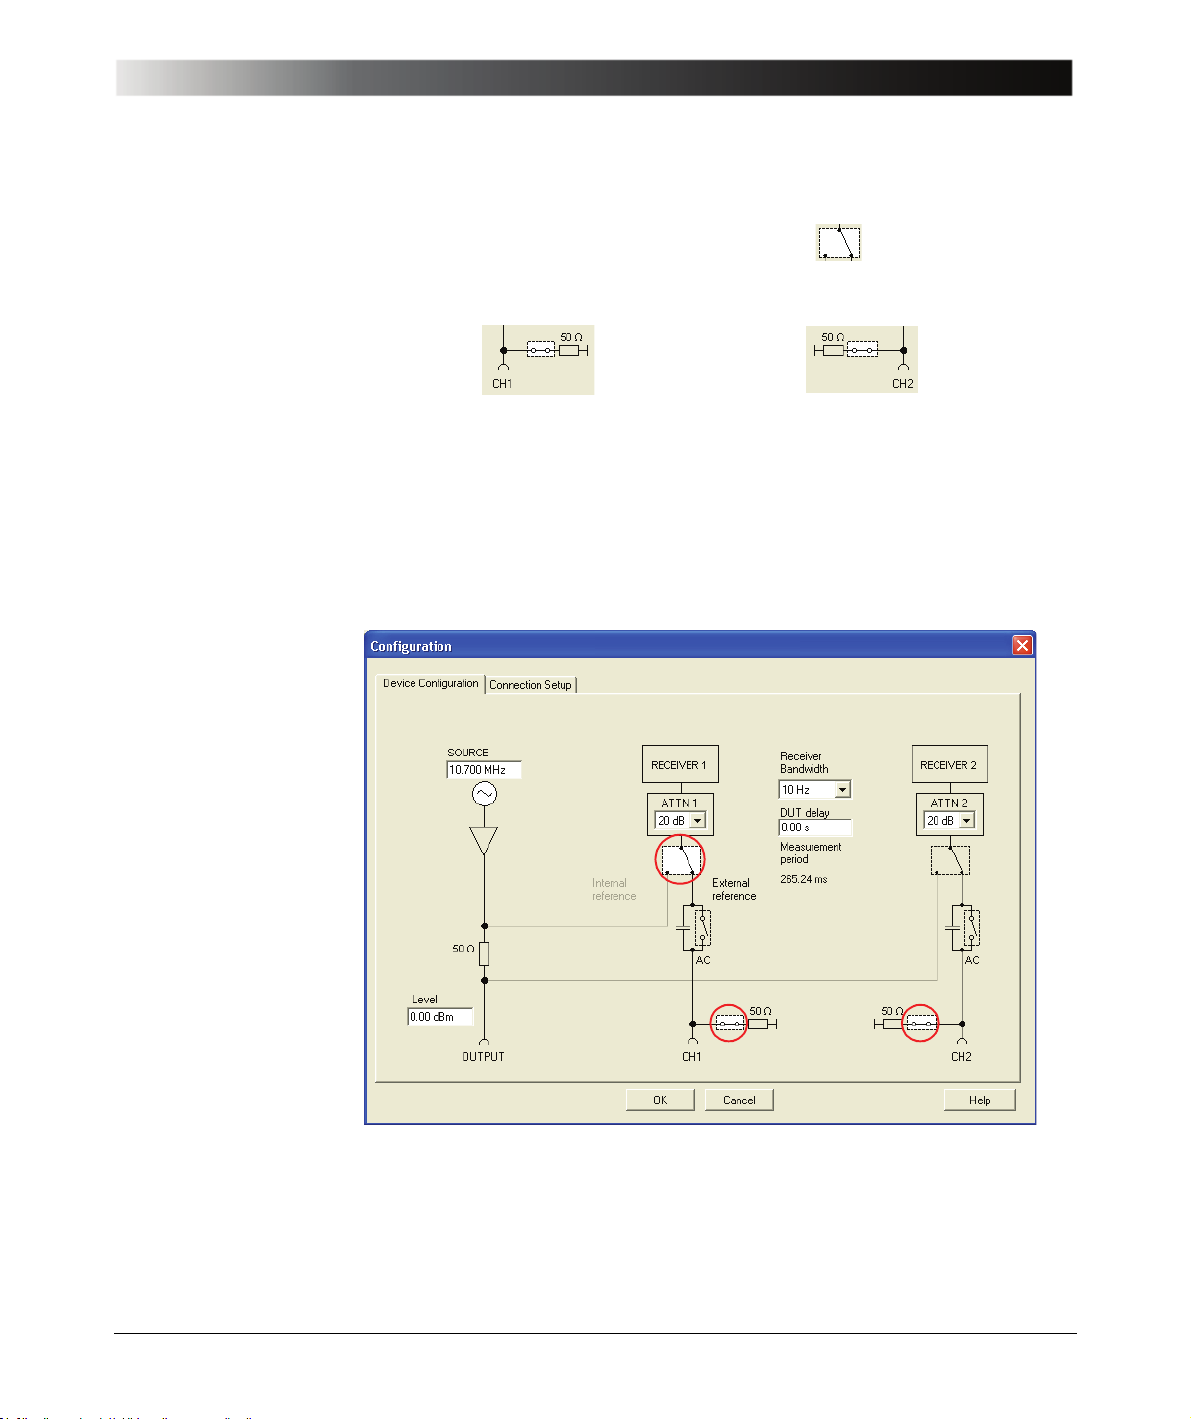
To connect the reference internally, set the marked configuration field as shown
below.
22
Note: The source signal is internally connected to the channel 1 input in front of
the 50 Ω source resistor (channel 1 voltage as defined in
3.1 "Basics" on page 20).
V
CH1
V02⁄=
Page 23
Gain/Phase Mode
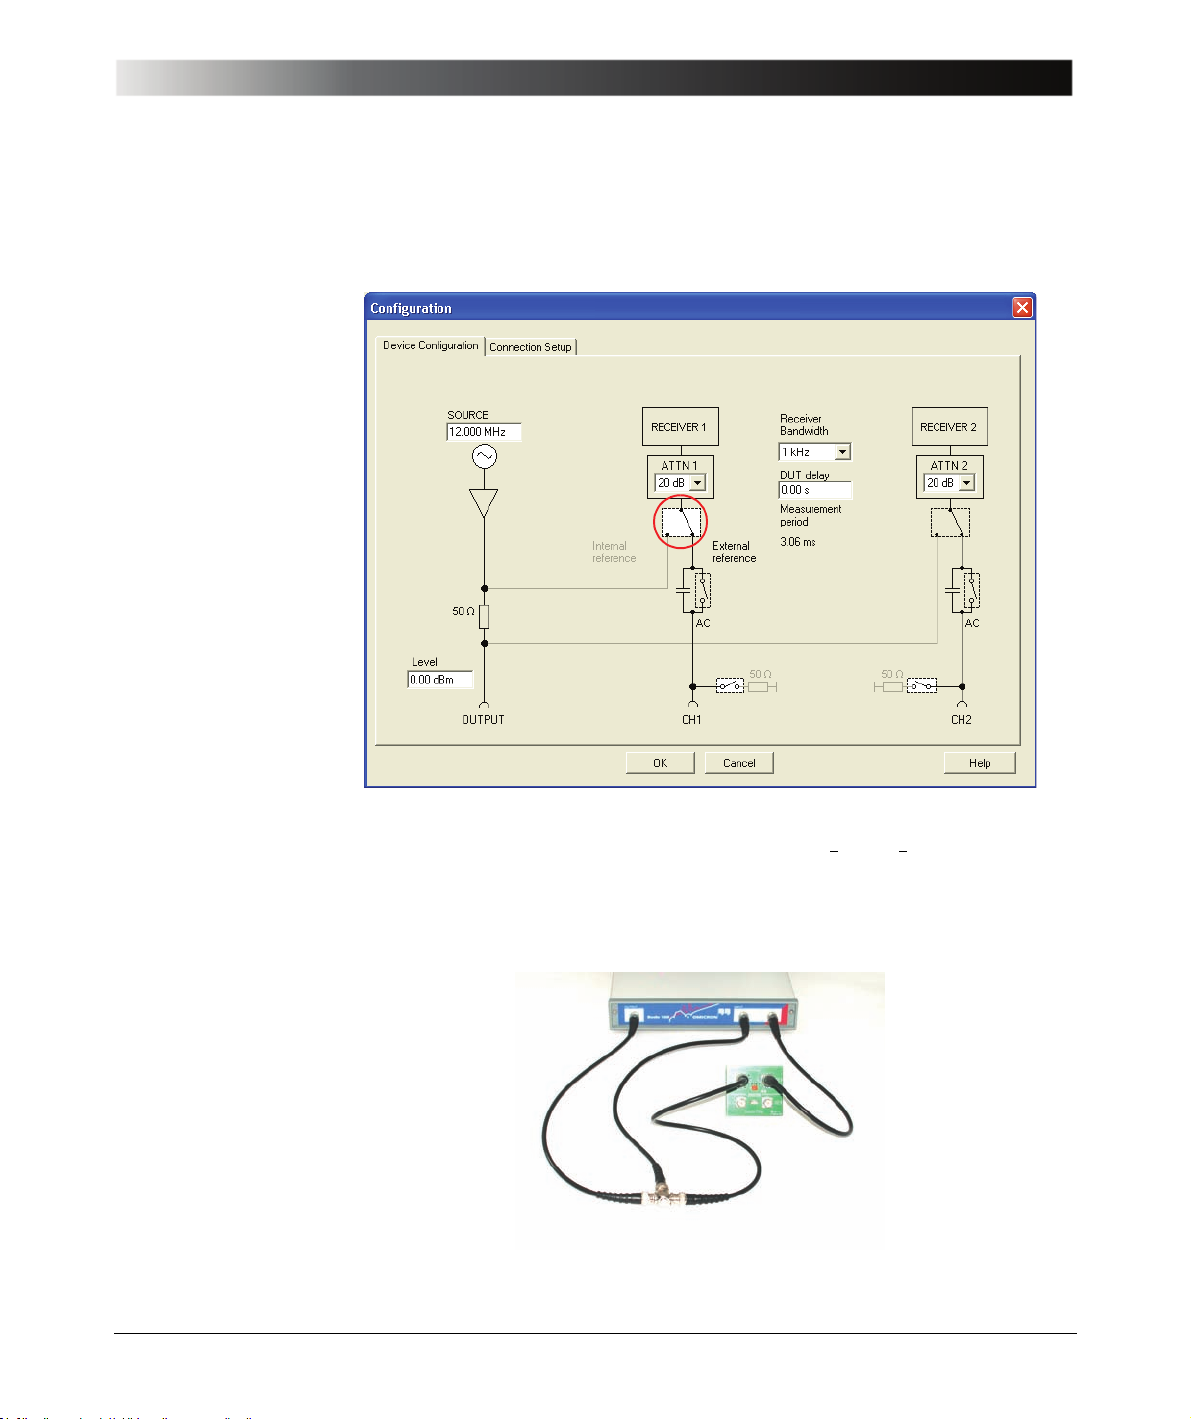
To connect the reference exter nal ly :
1. Set the marked configuration field as shown in the following figure.
Note: The source signal is externally connected to the channel 1 input
behind the 50 Ω source resistor (channel 1 voltage as defined in
V
=
CH1VIN
3.1 "Basics" on page 20).
2. Connect the reference point of the DUT to the CH 1 INPUT connector using
a cable.
23
Page 24

Bode 100 User Manual
3.3 Example: Gain/Phase Measurement
Expected example duration: 20 minutes.
In this example you will learn step by step how to use the Gain/Phase mode of
the Bode 100.
How to:
• Measure the gain and phase of a DUT with sinusoidal signal at a frequency
• Set the bandwidth, attenuators and amplitudes of the Bode 100
• Optimize the diagram
• Compensate the connection cables in the Gain/Phase mode
Question: What is the magnitude in dB of the delivered IF filter at 10.7 MHz?
These types of 10.7 MHz filters are used in FM radios.
24
Page 25
To find out the answer, proceed as follows:
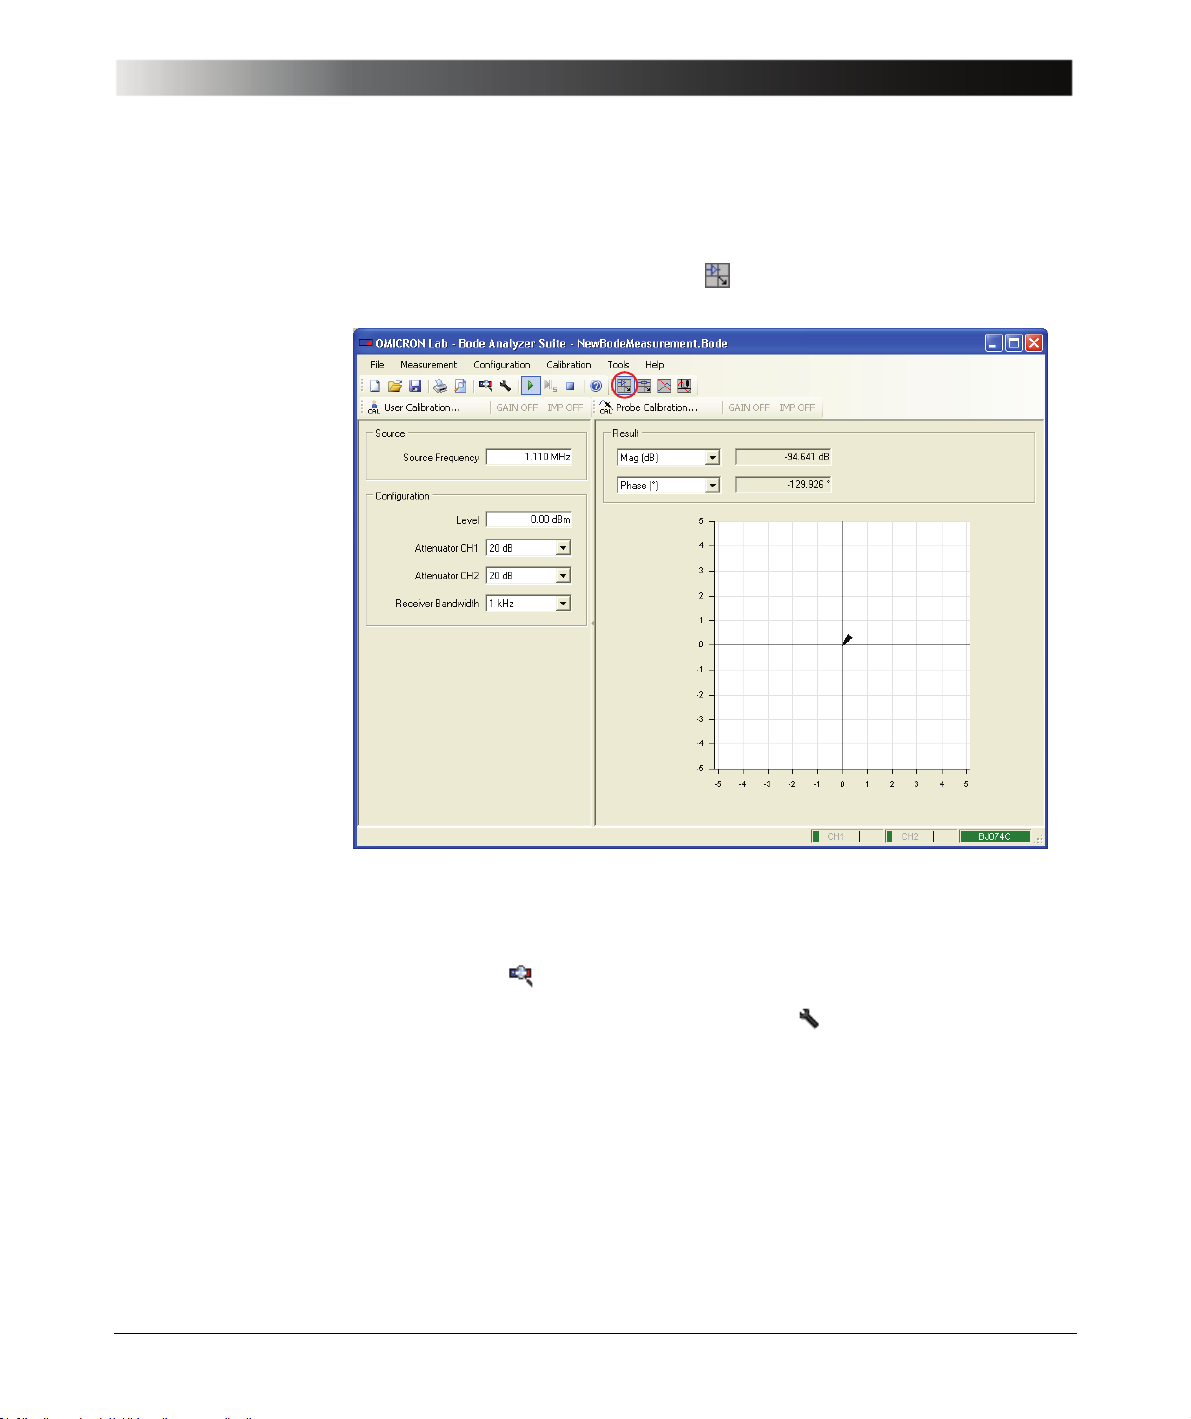
1. Connect the Bode 100 and start the Bode Analyzer Suite.
2. Click the Gain/Phase toolbar button .
Gain/Phase Mode
Hint: If you see the Bode 100 serial number in the status bar on the lower
right side of the window then the Bode Analyzer Suite communicates with the
Bode 100. Otherwise check whether your Bode 100 is connected and
powered properly, and then click the Search and Reconnect Device
toolbar button .
3. Click the Device Configuration toolbar button to configure the
Gain/Phase mode.
25
Page 26
Bode 100 User Manual
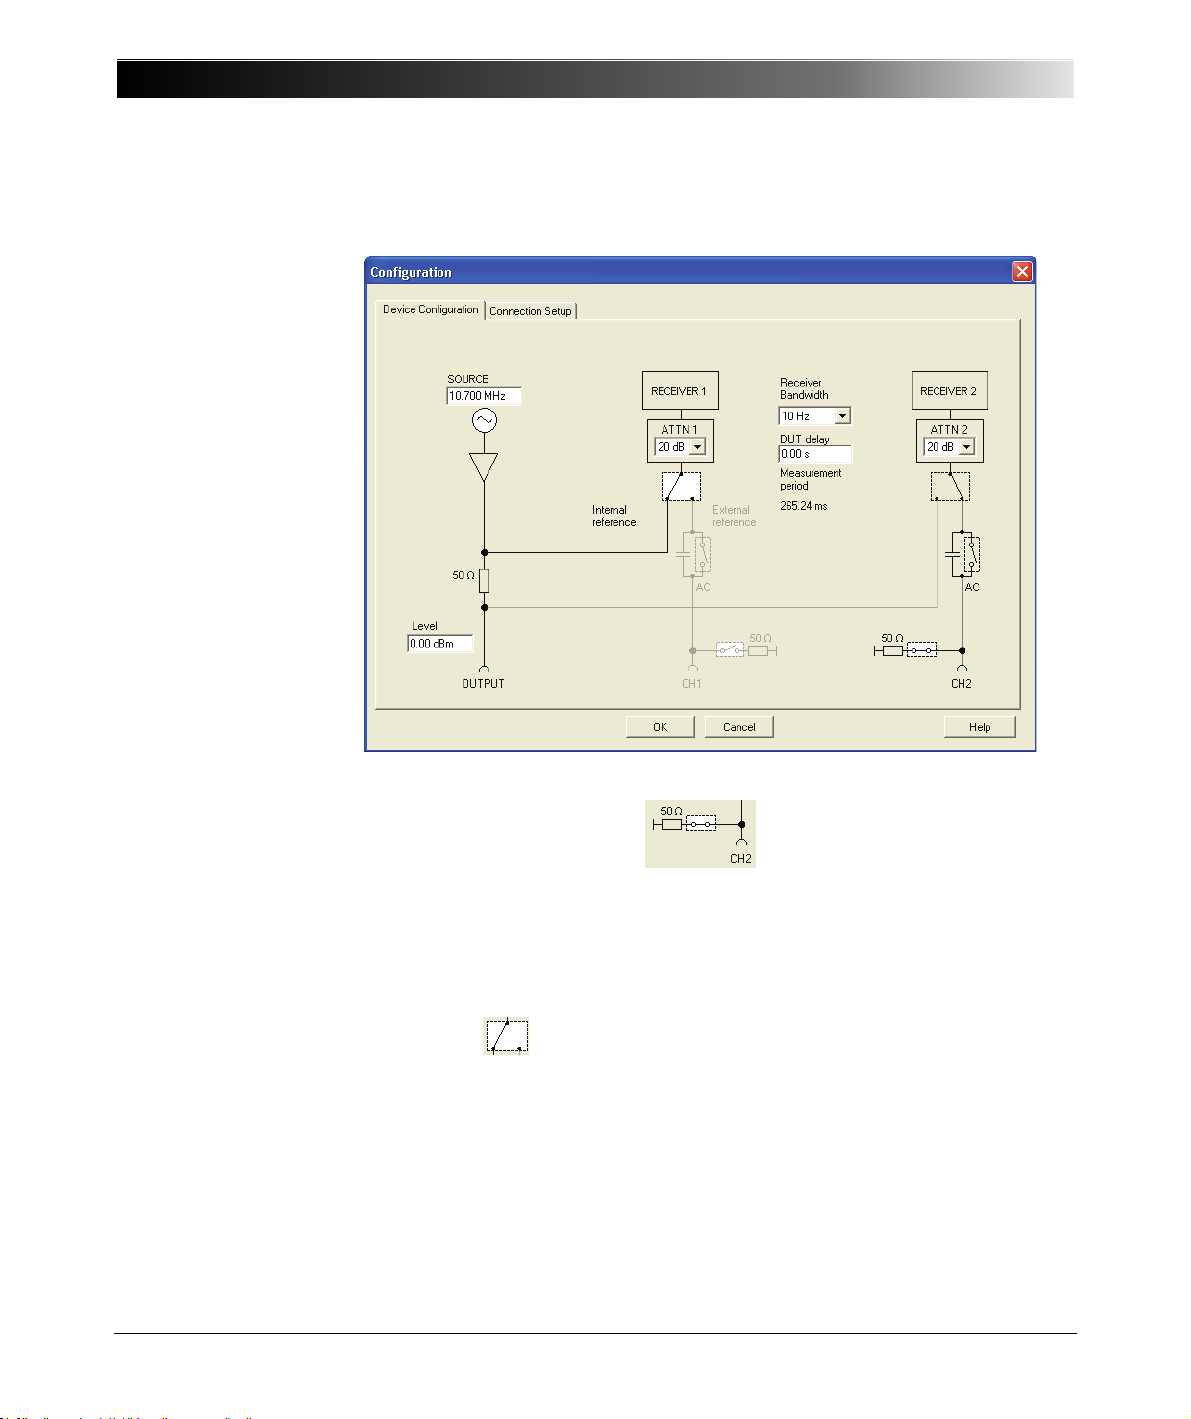
4. In the Configuration window, set:
26
•CH2: 50Ω ON (click the switch as shown)
• SOURCE: 10.7 MHz
• Receiver bandwidth: 10 Hz
• ATTN 1 (channel 1 input atten uato r): 20 d B
• ATTN 2 (channel 2 input atten uato r): 20 d B
• The switch (before ATTN1) to the internal source as reference
• Level: 0 dBm
Hint: Setting the receiver bandwidth to 10 Hz makes the readout more stable
but also makes the measurement slower.
Page 27
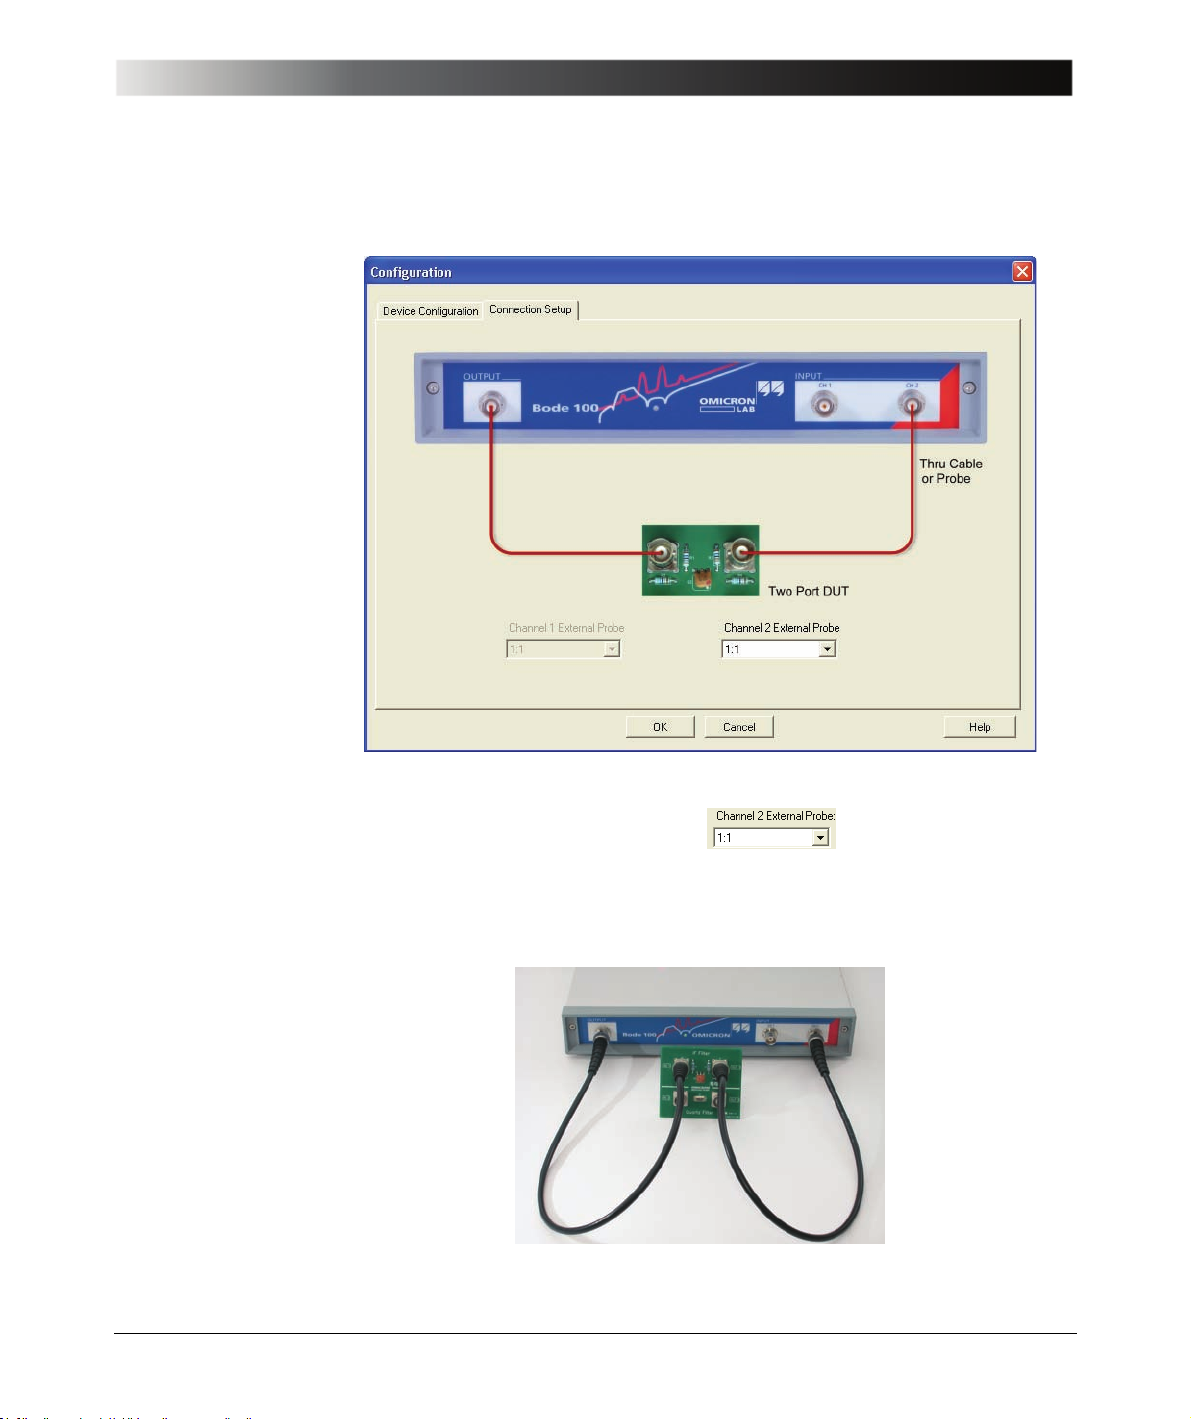
5. Click the Connection Setup tab.
Gain/Phase Mode
The connection diagram shows how to connect the DUT to the Bode 100.
Hint: Set the voltage ratio in the box if you use a probe
instead of cable connection (see 9.2 "Advanced Sweep Options" on
page 116).
6. Connect the IF filter to the Bode 100 as shown.
27
Page 28
Bode 100 User Manual
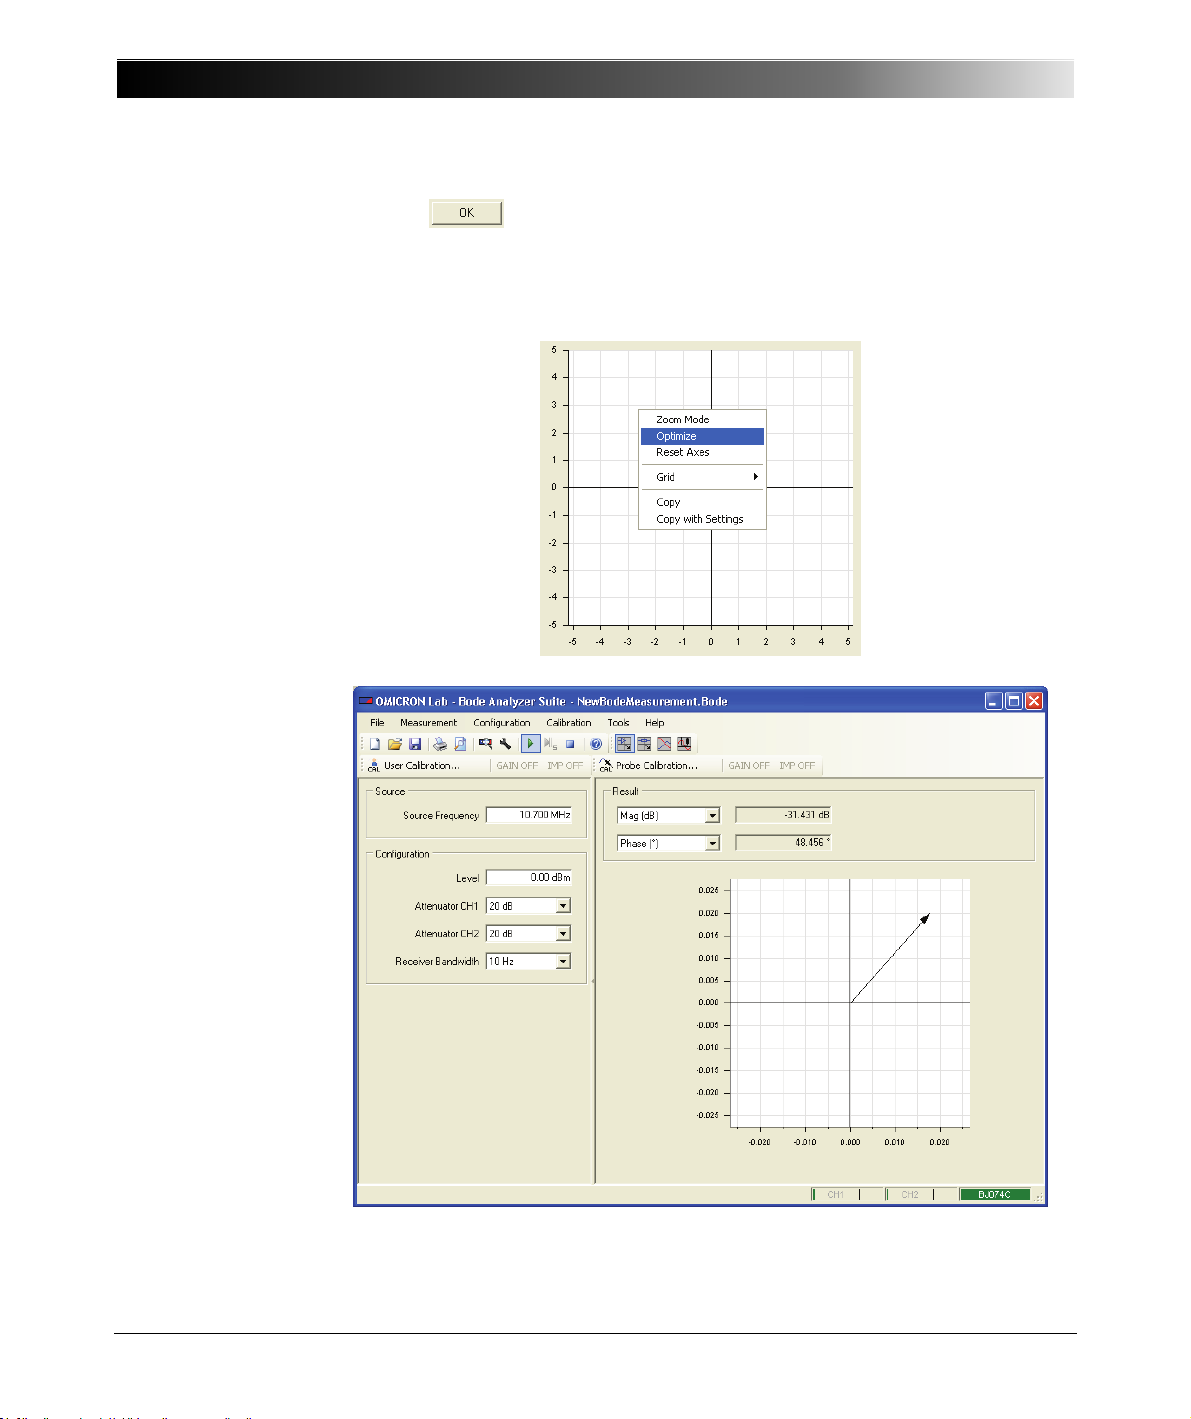
7. Click to close the Configuration window and to get back to the
8. For a better view of the Gain/Phase vector in the complex plane, right-click
Gain/Phase mode window.
in the diagram, and then click Optimize.
28
Result: The IF filter has a magnitude of –31.43 dB at 10.7 MHz. Your result may
differ because each IF filter is slightly different.
Page 29
Gain/Phase Mode
The phase readout of 48.5º is not the value you want to measure because it is
the sum of the phase shift of the cables and of the IF filter. To get the value of
the IF filter only, use the Gain/Phase calibration to compensate the phase shift
of the cables.
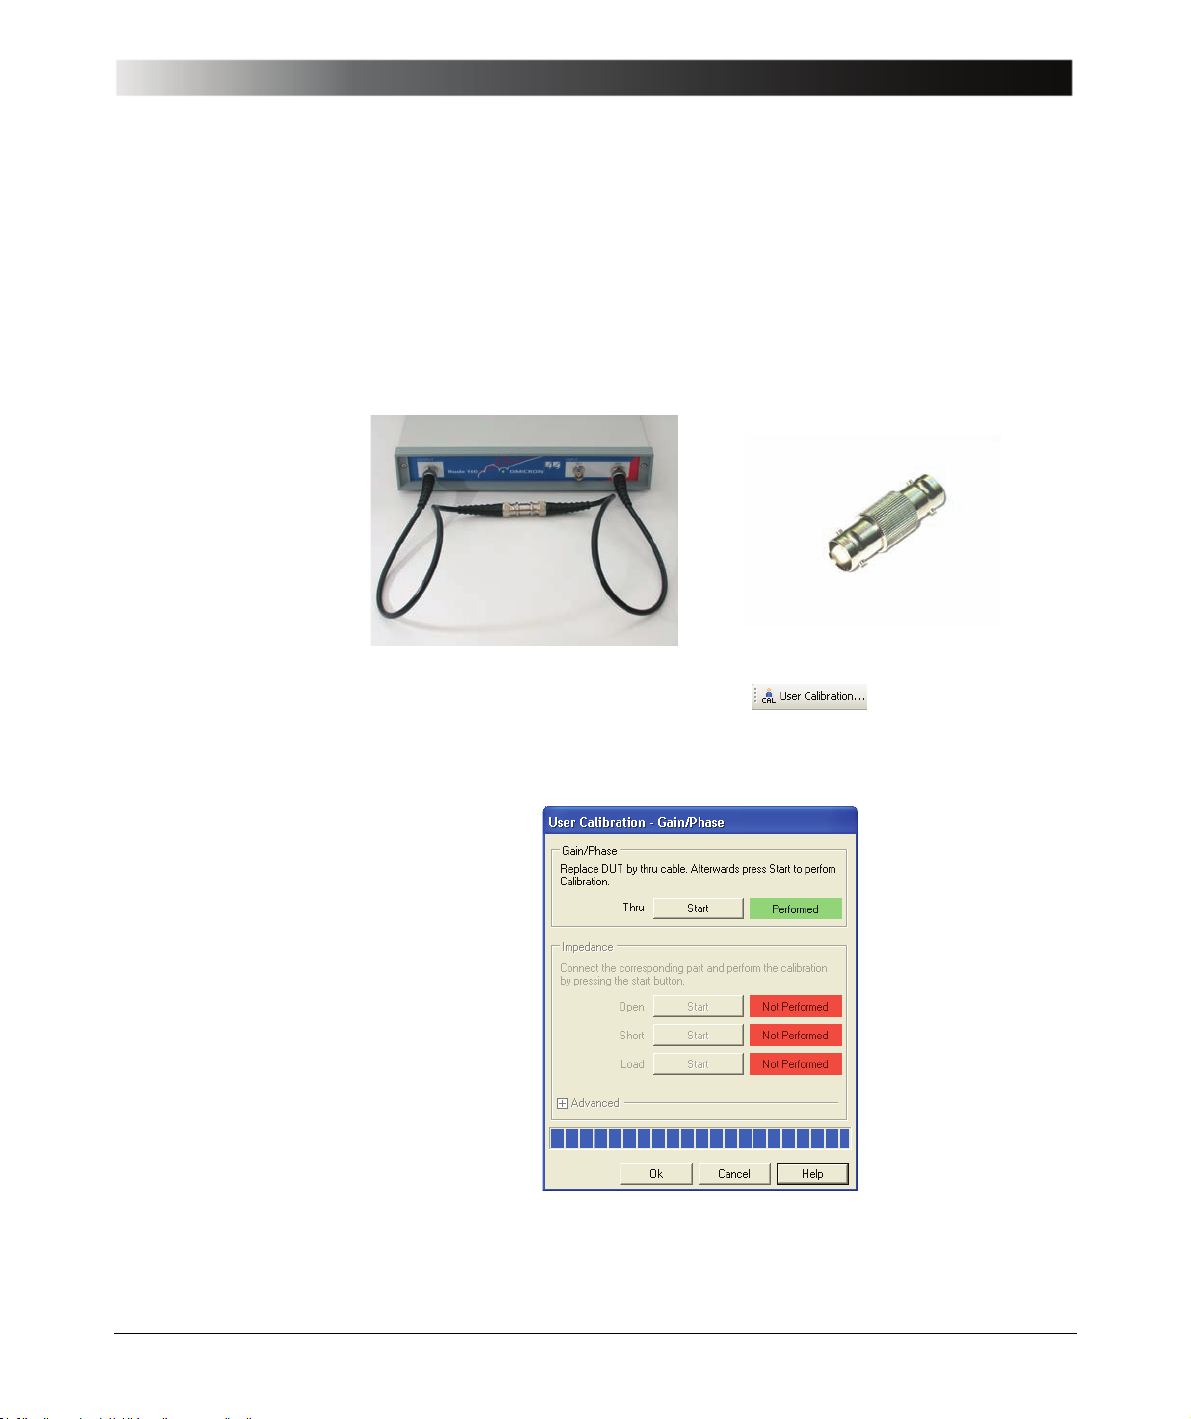
Continue the example and calibrate the Bode 100 to get the phase shift of the IF
filter:
1. Replace the IF filter with the BNC straight adapter (f–f).
2. Click the User Calibration toolbar button to open the
calibration window.
3. In the calibration window, click Start in the Gain/Phase area.
The calibration takes only a few seconds. The Gain/Phase mode is now
calibrated for the current specific measurement setup.
29
Page 30
Bode 100 User Manual
4. Click .
5. Reconnect the IF filter.
Hint: If you change settings you must repeat the User Calibration. If you use
the Probe Calibration instead you can change settings without
repeating the calibration. For more information, see 7 "Calibrating the Bode 100"
on page 75.
30
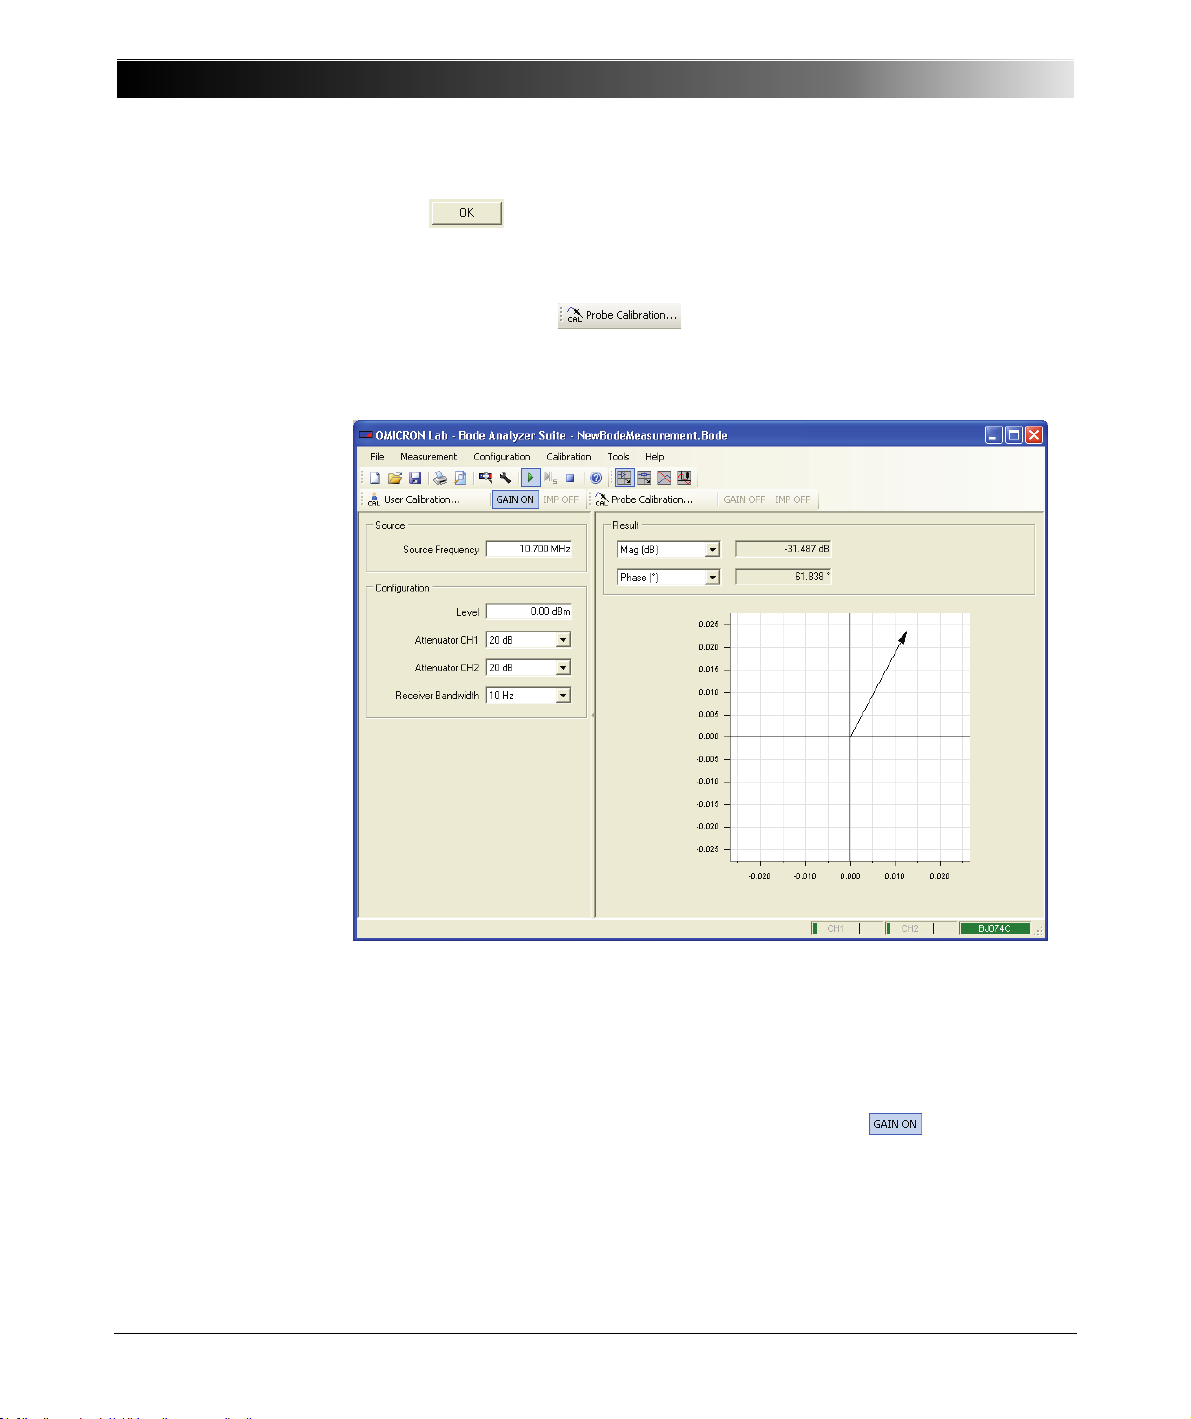
Result: The transfer function of the IF filter has a magnitude of –31.49 dB and
a phase shift of 61.8º at 10.7 MHz.
Again, your results may differ because every IF filter and measurement setup is
slightly different.
Hint: You can toggle between the measurement results with calibration and
without calibration by clicking the GAIN ON toolbar button .
Page 31

As OMIfuzius said: Only
applied knowledge
changes the world. We
are responsible to
change it to the better.
Gain/Phase Mode
Congratulation! You learned how to use the Gain/Phase mode.
How to:
• Measure the gain and phase shift of a DUT using a sinusoidal signal at a
certain frequency
• Set the bandwidth, attenuators and amplitude of the Bode 100
• Optimize the diagram
• Compensate the connection cables in the Gain/Phase mode
Go back to the overview chart at 3 "Gain/Phase Mode" on page 17 and try
different settings to check out their effect on the measurement.
31
Page 32

Bode 100 User Manual
This page intentionally left blank
32
Page 33
Impedance/Reflection Mode
4 Impedance/Reflection Mode
Figure 4-1:
Impedance/Reflection
mode window
For the description of the menu bar,
toolbar and calibration bar, see
8 "Common Functions" on page 95.
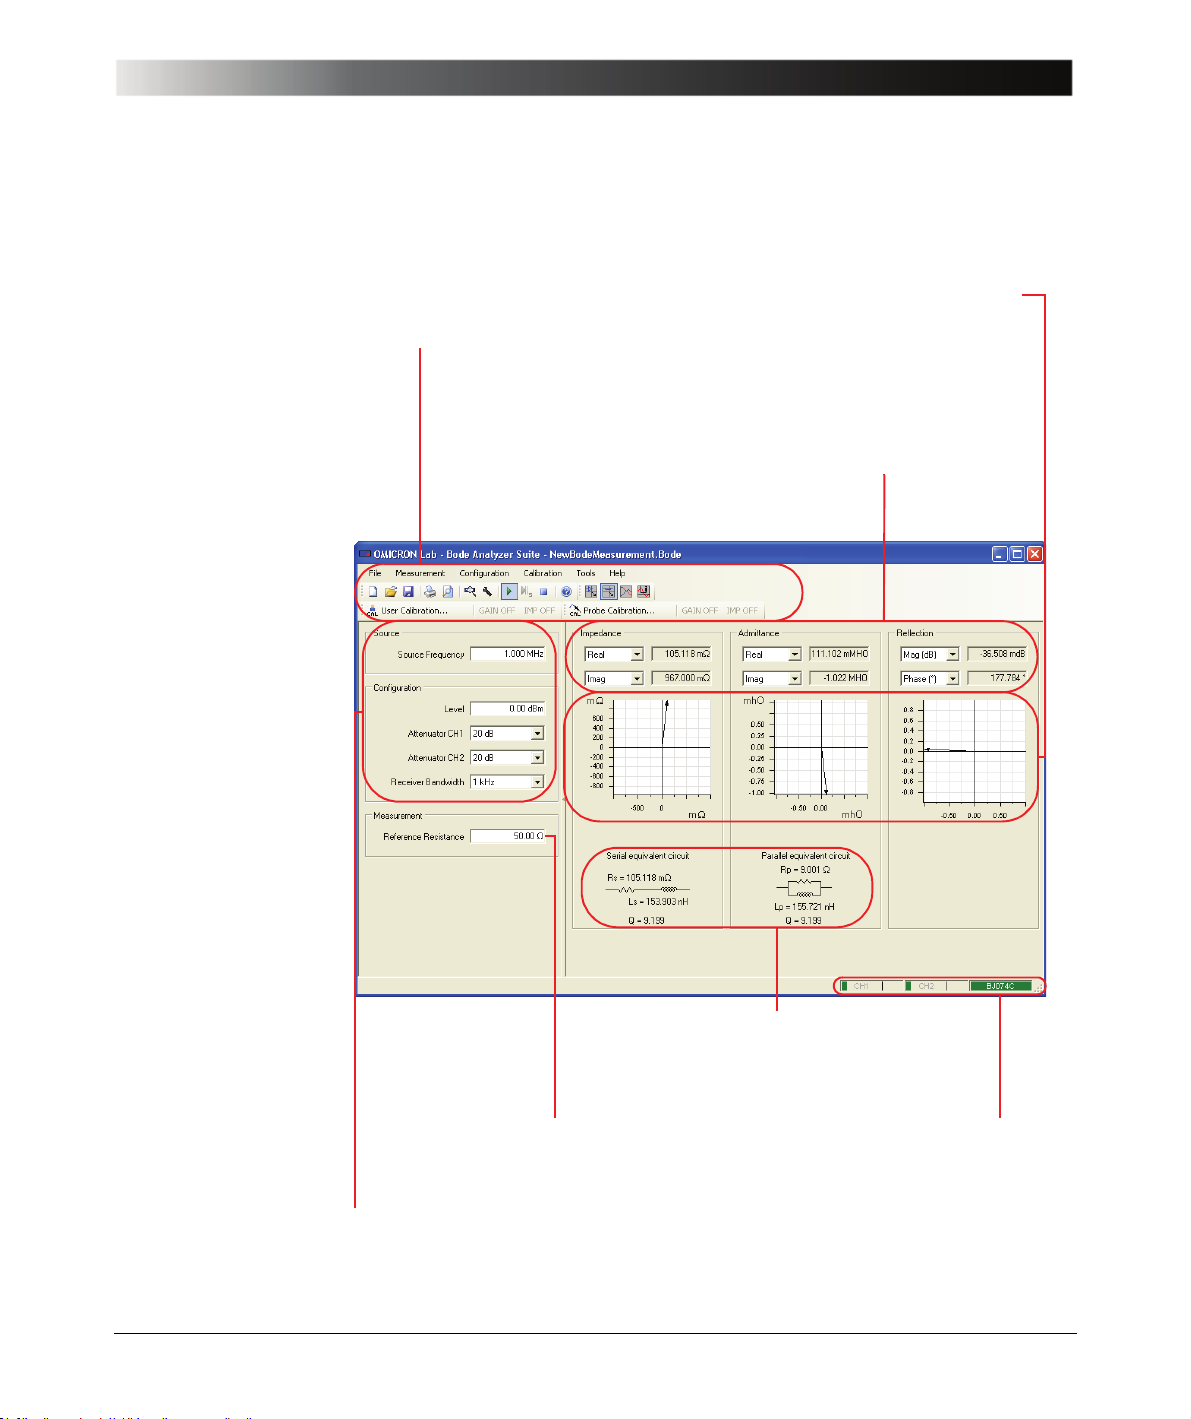
Results
Select the result format and get result values.
See Figure 4-2: "Impedance/Reflection mode results" on page 34.
Graphical display of measurement results
Use the shortcut menu to optimize the display.
See Figure 3-4: "Graphical display of
measurement results" on page 19.
Reference resistance
Set the reference resistance (see
4.1.1 "General Formulas" on page 34).
Configuration and measurement setup
See Figure 3-2: "Configuration and
measurement setup" on page 18.
Equivalent circuits
View the equivalent circuits
(see 4.1.2 "Equivalent
Circuits" on page 35).
Overload and connection indicators
See Figure 3-5: "Overload and
connection indicators" on page 19.
33
Page 34
Bode 100 User Manual
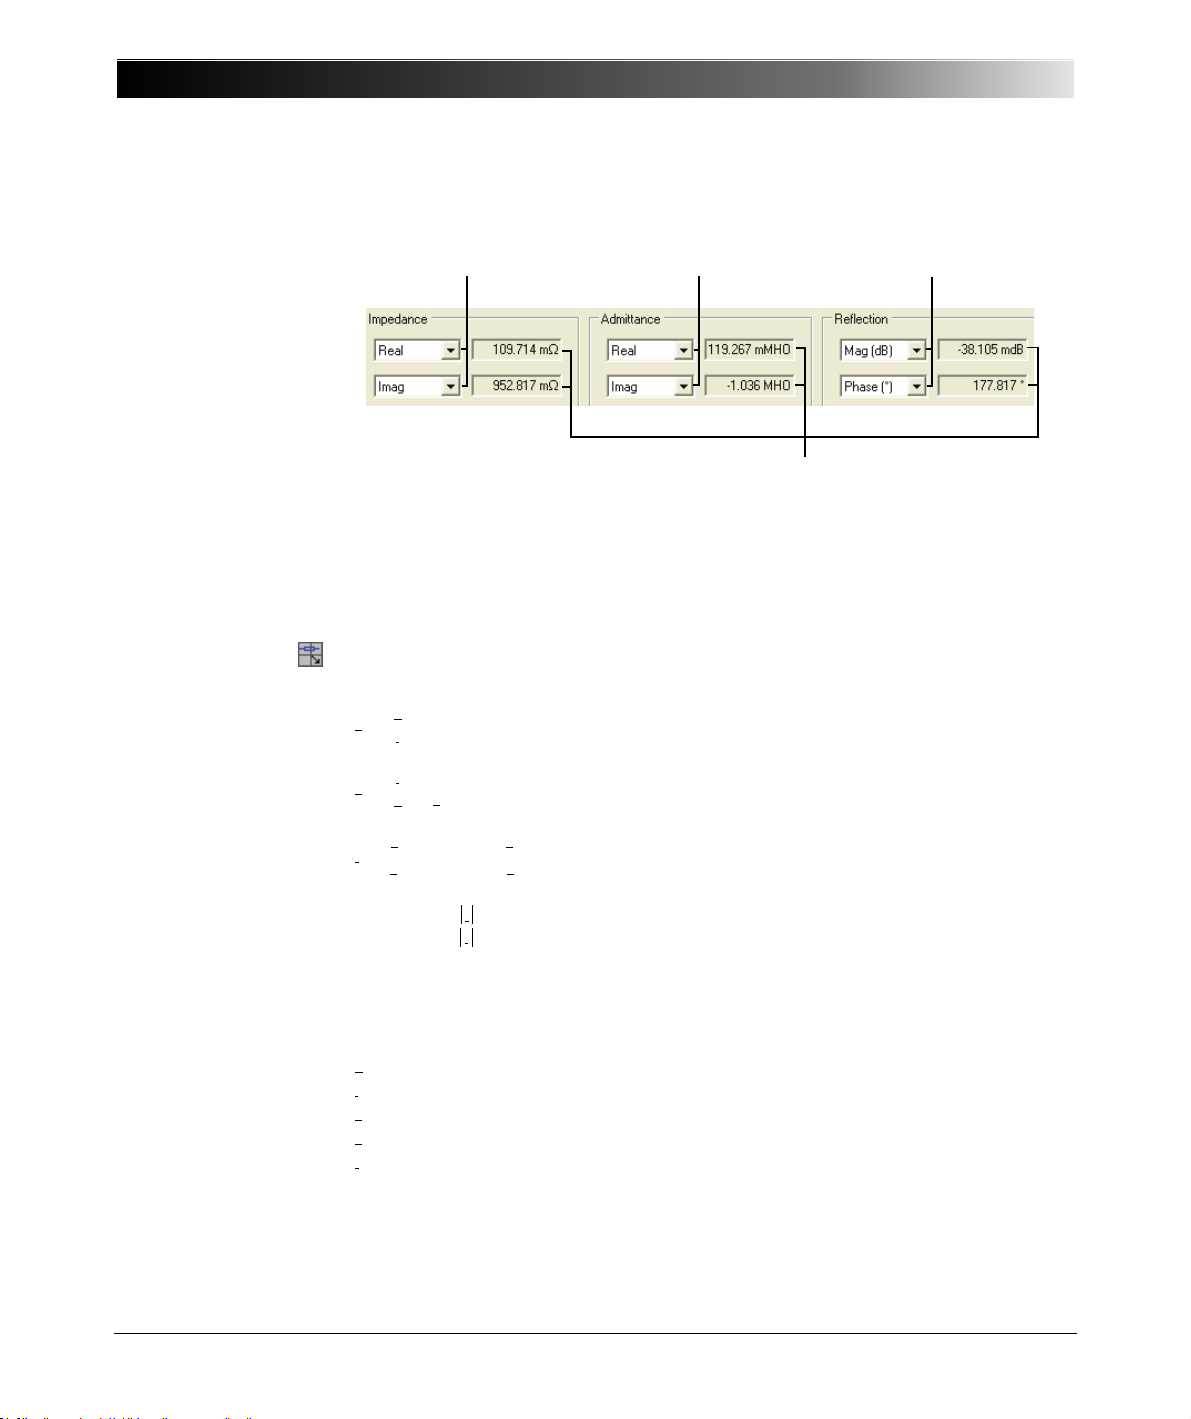
Figure 4-2:
Impedance/Reflection
mode results
4.1 Basics
4.1.1 General Formulas
Select the output format
of the impedance
measurement results.
Select the output format
of the admittance
measurement results.
Display of the respective measurement
results in the selected format.
Select the output format
of the reflection
measurement results.
The general formulas related to the Impedance/Reflection measurements are
summarized below:
V
---
Z
=
I
I
---
Y
==
V
1
-- -
Z
(Eq. 4-1)
(Eq. 4-2)
34
ZR
–
---------------
r
==
ZR
+
VSWR
------
R
=
0
G
1
=
0
0
0
1 r+
-------------1 r–
G
----------------
G
where
V
I
Z
Y
r
VSWR
R
0
G
0
…voltage at the reference plane
…current at the reference plane
…impedance
…admittance
…reflection coefficient
…voltage standing wave ratio
…reference resistance
…reference conductance
Y–
0
Y+
0
(Eq. 4-3)
(Eq. 4-4)
(Eq. 4-5)
Page 35

Impedance/Reflection Mode
Note: The reference res is t an ce can be set in t he Measurement area of t he
Impedance/Reflection mode window.
4.1.2 Equivalent Circuits
The basic formulas for the serial equivalent circuit are:
Z Real Z() jImag Z()+ RsjXs+==
RsReal Z()=
Imag Z() 0<
If :
1
--------------------------- -
C
=
s
ω Imag Z()
If :
Imag Z() 0>
Imag Z()
-----------------------
L
=
s
where
R
s
X
s
C
s
L
s
The basic formulas for the parallel equivalent circuit are:
ω
…series resistance
…series reactance
…series capacitance
…series inductance
R
0
(Eq. 4-6)
(Eq. 4-7)
(Eq. 4-8)
(Eq. 4-9)
Y Real Y() jImag Y()+
1
------------------ -
R
=
p
Real Y()
If :
Imag Y() 0<
1
--------------------------- -
L
=
p
ω Imag Y()
If :
Imag Y() 0>
Imag Y()
-----------------------
C
=
p
ω
where
…parallel resistance
R
p
…parallel reactance
X
p
…parallel inductance
L
p
…parallel capacitance
C
p
1
1–
⎛⎞
------
----- -
+==
j
⎝⎠
R
X
p
p
(Eq. 4-10)
(Eq. 4-11)
(Eq. 4-12)
(Eq. 4-13)
35
Page 36
Bode 100 User Manual
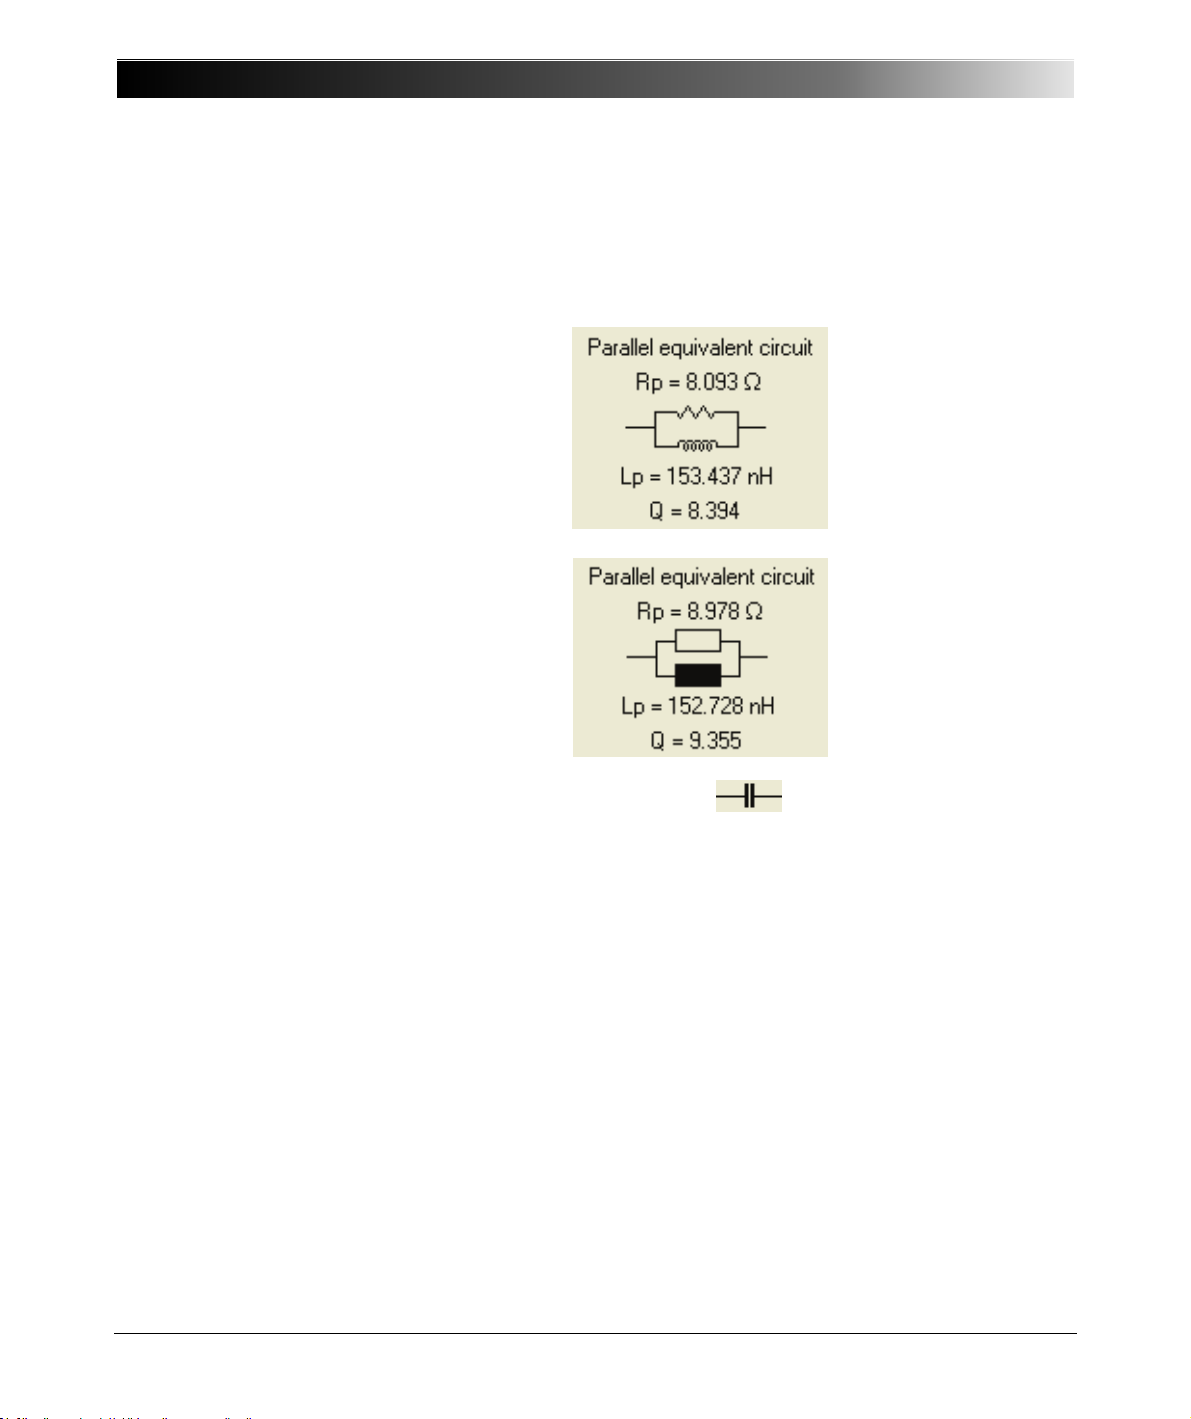
Figure 4-3:
Resistor and inductor
symbols according to
ANSI
Figure 4-4:
Resistor and inductor
symbols according to
IEC
Depending on the regional settings of your computer the elements of the serial
and parallel equivalent circuits are displayed according to the IEC (International
Electronic Commission) or ANSI (American National Standards Institute)
standards as shown below.
36
Note: Capacitors have the same symbol in both standards.
Page 37

4.1.3 Quality Factor
An ideal inductor will be lossless irrespective of the amount of current flowing
through the winding. An ideal capacitor will be lossless irrespective of the
voltage applied to it. However, real inductors have a winding resistance due to
the metal wire forming the coils and real capacitors have a resistance due to the
used insulation material. These resistances cause a loss of inductive or
capacitive quality. For serial equivalent circuits, the quality factor is defined as
the ratio of the reactance to the resistance at a given frequency. For parallel
equivalent circuits, the quality factor is defined as the ratio of the resistance
to the reactance at a given frequency.The factor is a measure of the inductor’s
and capacitor’s efficiency. The higher the factor of a capacitor or inductor, the
closer the capacitor/inductor approaches the behavior of an ideal, lossless
component.
The factor calculated using the serial equivalent circuit is given by
Q
Impedance/Reflection Mode
Q
Q
Q
Q
Imag Z()
-----------------------
Q
==
Real Z()
X
------- -
R
s
s
(Eq. 4-14)
and using the parallel equivalent circuit is given by
1
Imag Y()
-----------------------
Q
===
Real Y()
---------
---------
X
------
R
R
p
p
---------
1
X
p
p
(Eq. 4-15)
4.2 Example: Impedance/Reflection Measurement
Expected example duration: 20 minutes.
In this example you will learn step by step how to use the
Impedance/Reflection mode of the Bode 100.
How to:
• Measure the reflection coeffi ci ent at a frequency
• Set the bandwidth and amplitudes used for the measurement
• Connect the DUT for the impedance and reflection measurement
• Optimize the diagrams
• Work with the serial and parallel equivalent circuits
Question: What is the reflection coefficient in dB of the delivered IF filter input
at 10.7 MHz?
37
Page 38
Bode 100 User Manual
To find out the answer, proceed as follows:
1. Connect the Bode 100 and start the Bode Analyzer Suite.
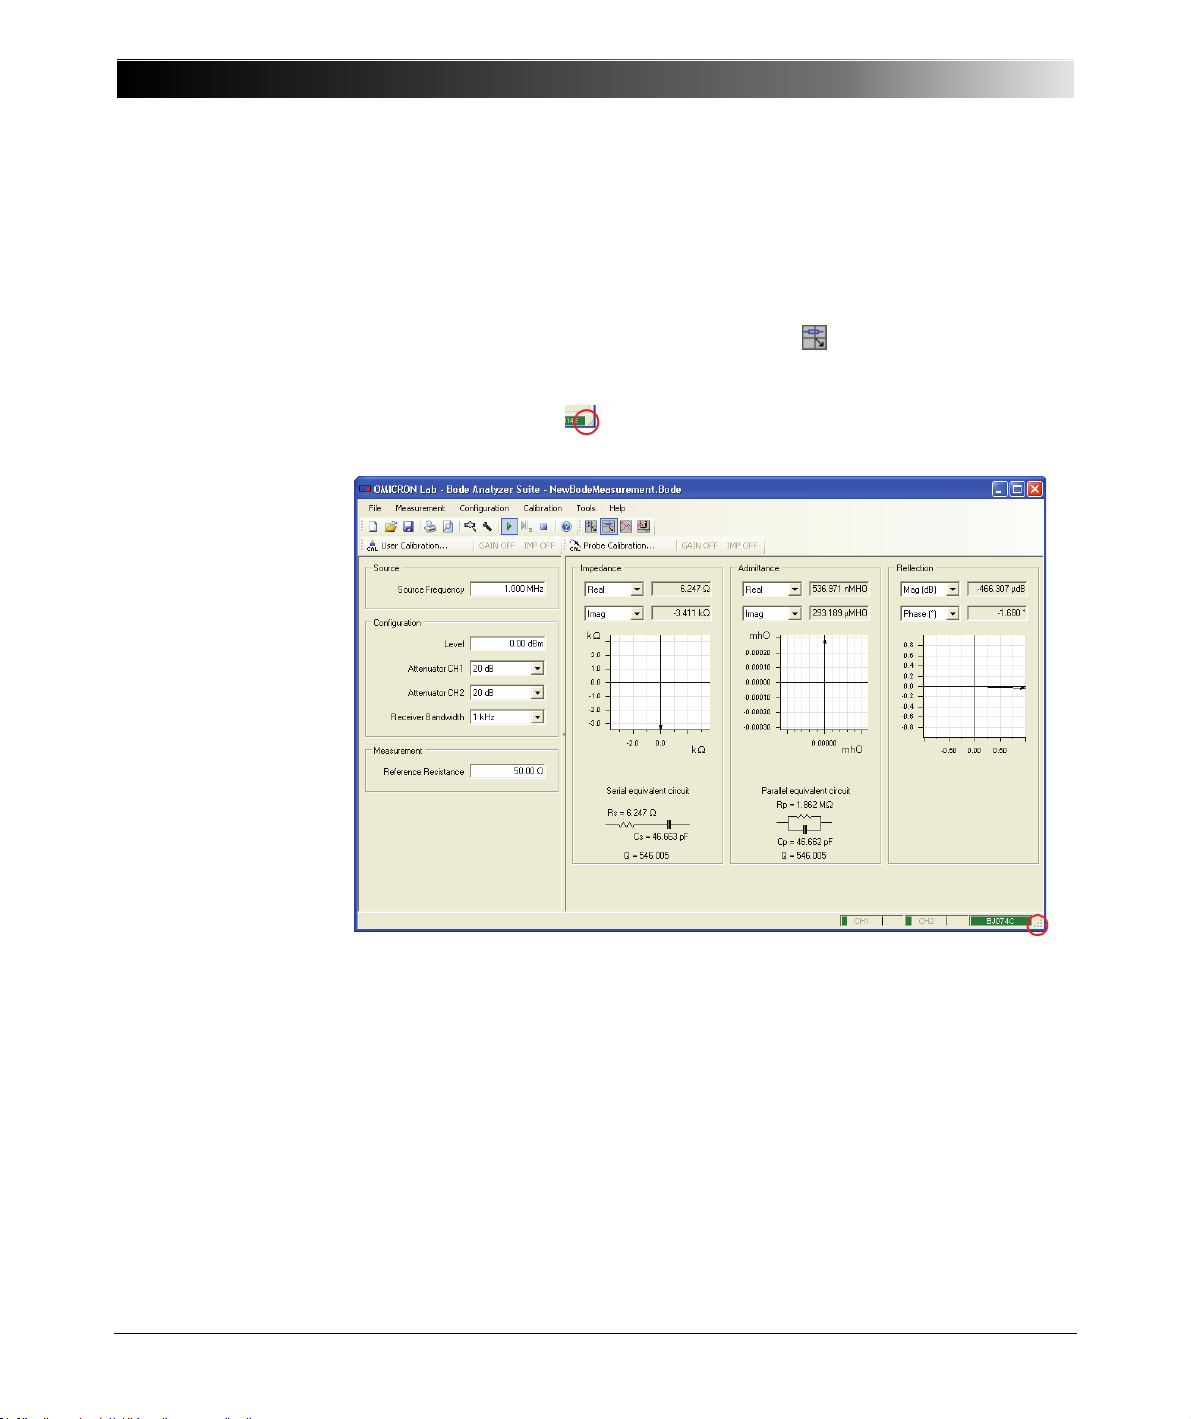
2. Click the Impedance/Reflection toolbar button to switch to the
3. If necessary, adjust your window size. Move the mouse to the lower right
Hint: If you see the serial number of your Bode 100 on the lower right side of
the status bar then your Bode 100 is working properly.
Impedance/Reflection mode.
corner of the w indow . By dragging t he corner you can adjus t the window.
38
Page 39
Impedance/Reflection Mode
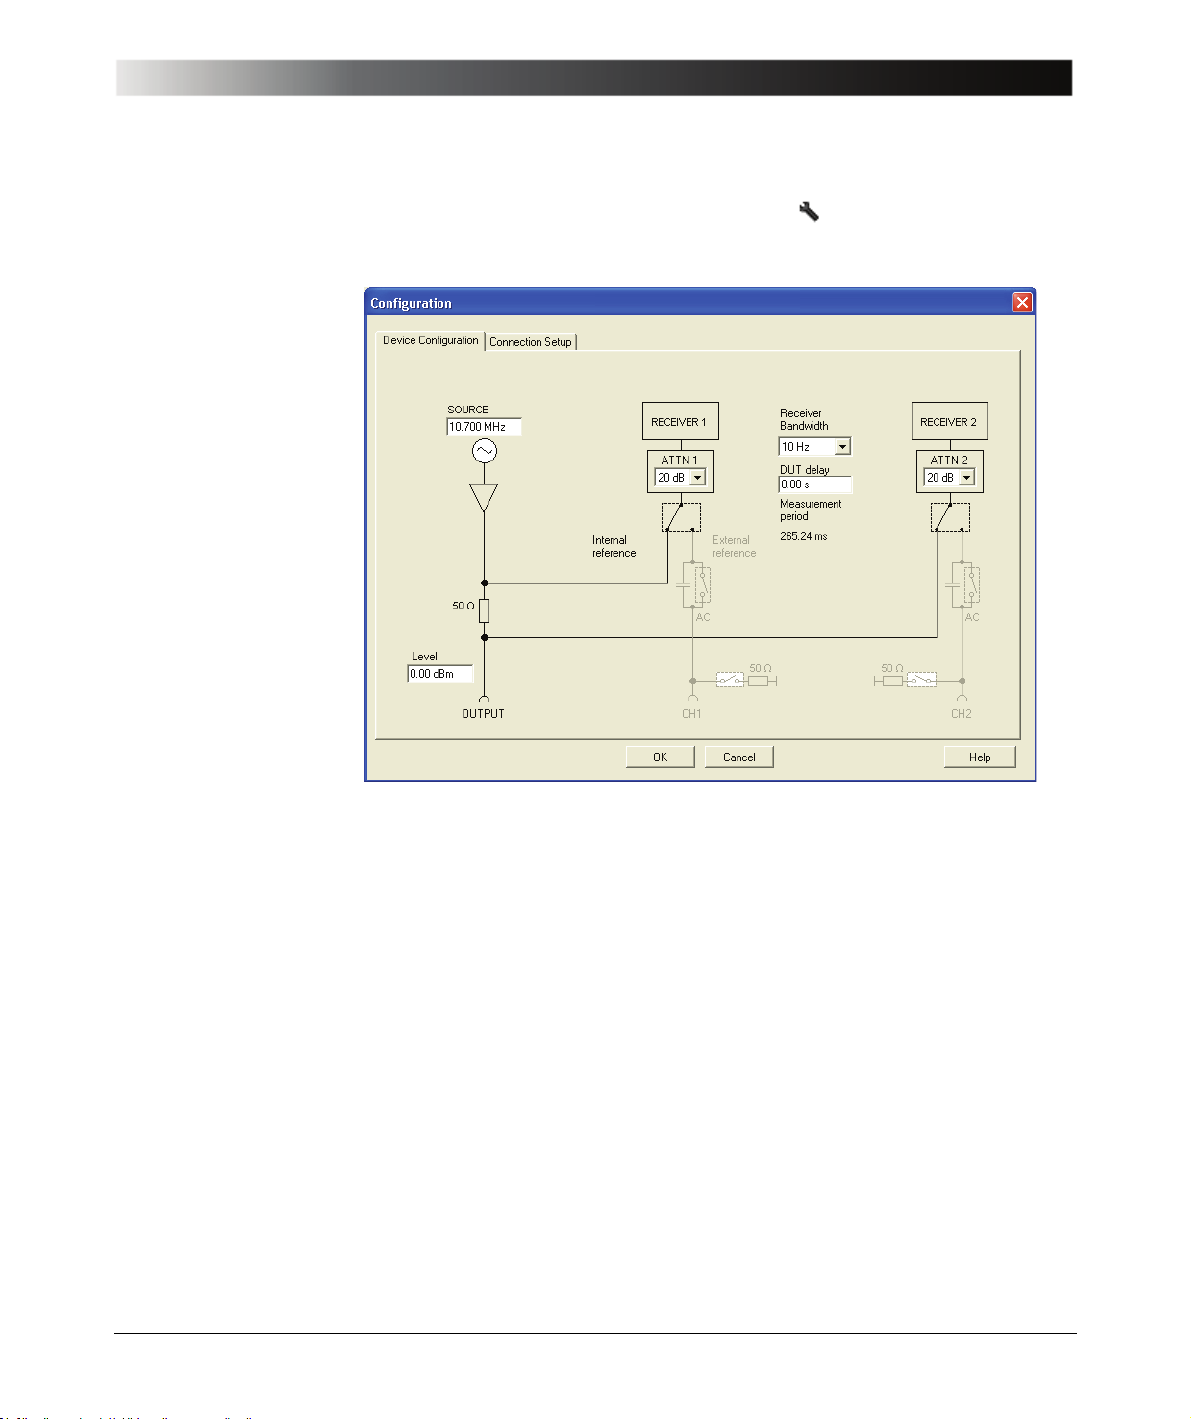
4. Click the Device Configuration toolbar button to configure the
Impedance/Reflection mode.
5. Set:
• SOURCE: 10.7 MHz
• Receiver bandwidth: 10 Hz
• Level: 0 dBm
39
Page 40
Bode 100 User Manual
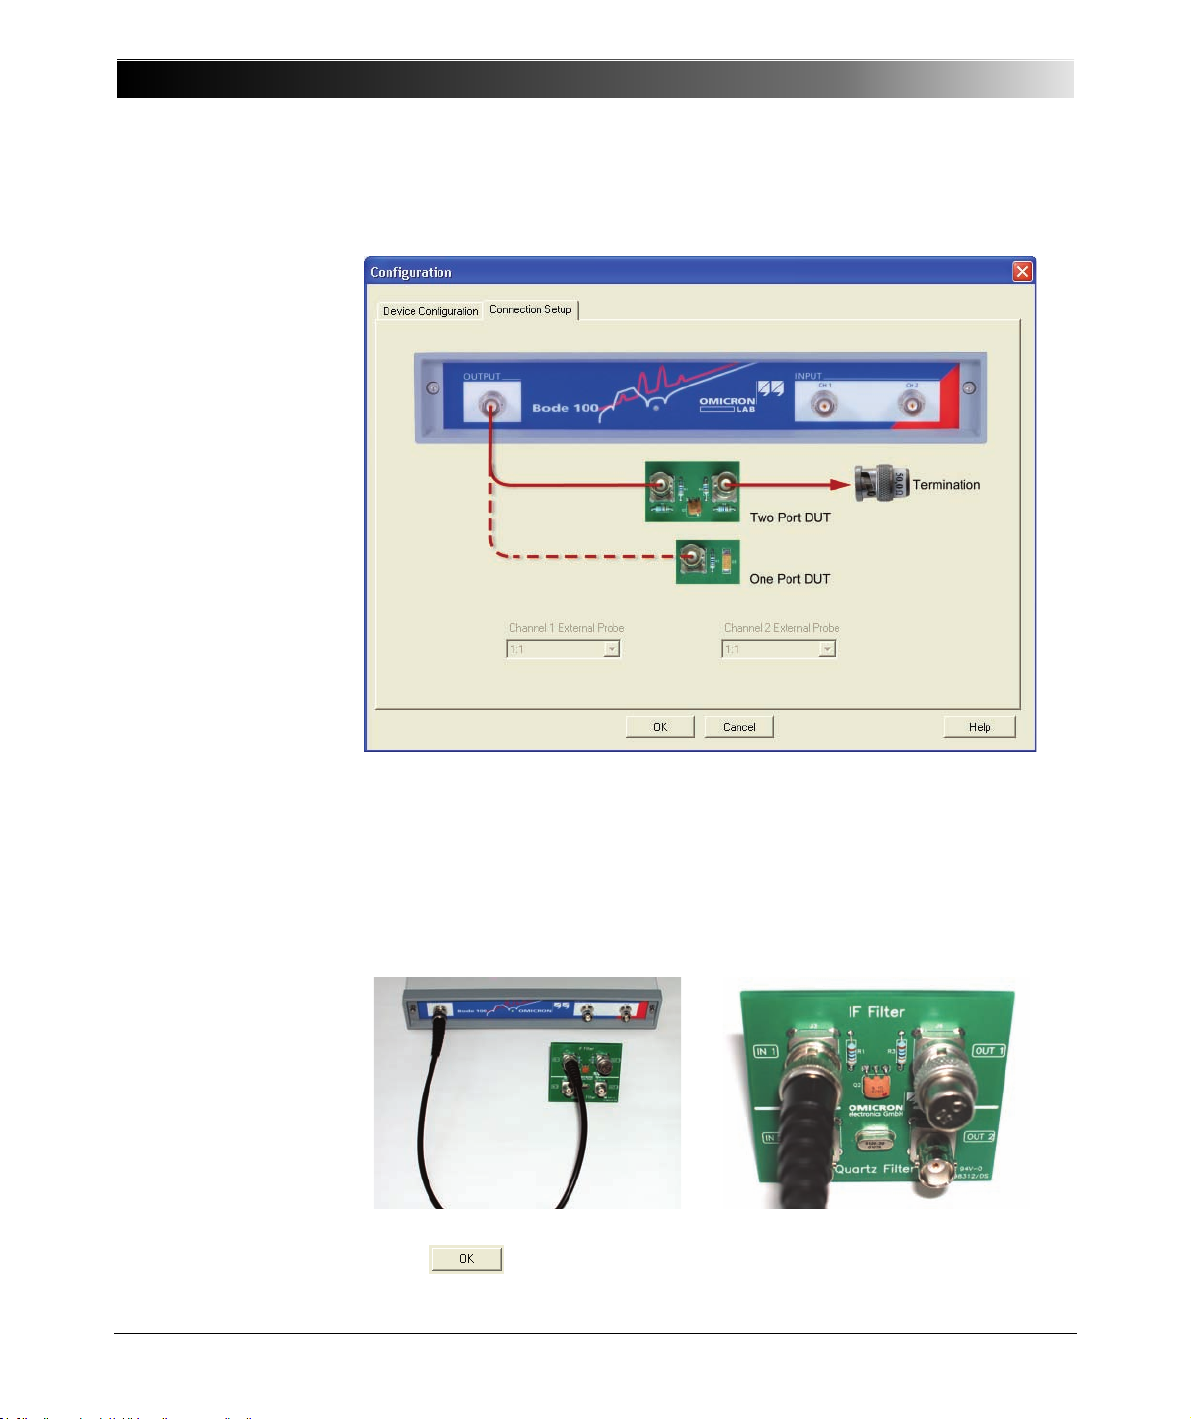
6. Click the Connection Setup tab.
40
The connection diagram shows how to connect the DUT to the Bode 100.
Hint: In the Impedance/Reflection mode, the channel 1 and channel 2
inputs are not used. Consequently, the External Probe boxes are
unavailable.
7. Connect the output of the Bode 100 to the input of the IF filter and the BNC
50 Ω load to the output of the IF filter as shown.
8. Click to close the Configuration window.
Page 41
Impedance/Reflection Mode
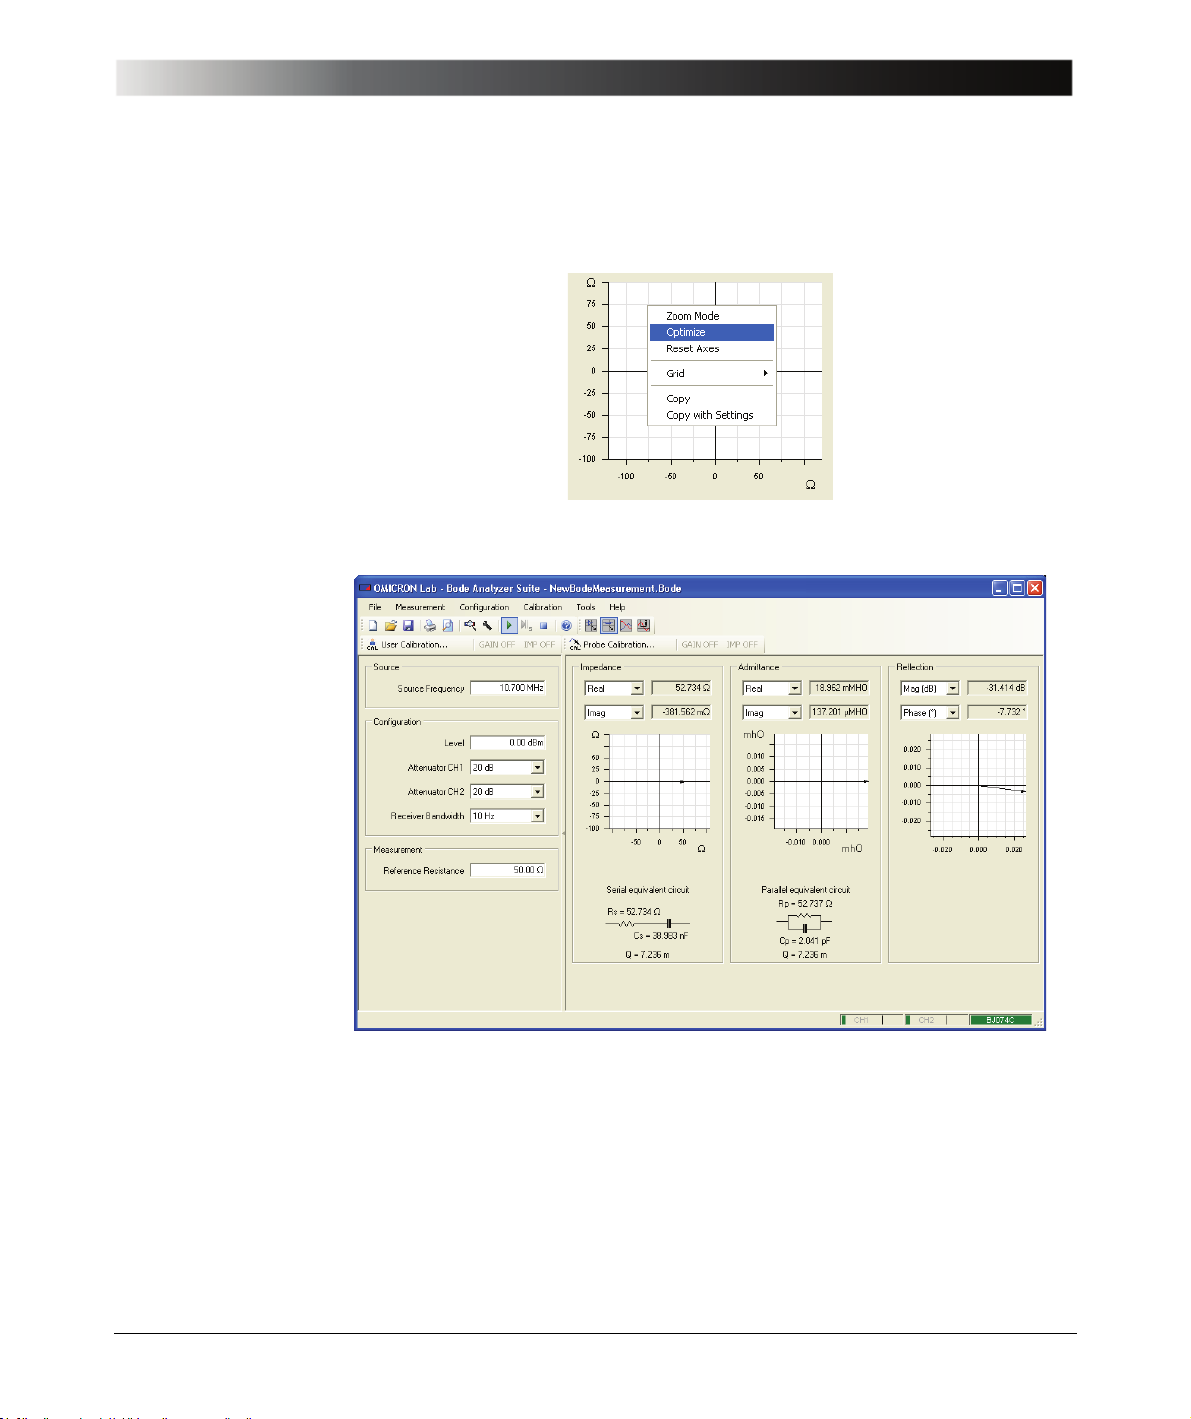
9. For a better view of the impedance, admittance and reflection vectors in the
complex plane, right-click in the respective diagrams, and then click Optimize.
10.View the results.
Result: The measured values of the IF filter at 10.7 MHz are:
• Reflection coefficient: –31.4 dB
• Impedance: nearly 50 Ω
Again, your results may differ because every IF filter and measurement setup is
slightly different.
Hint: To increase the size of the diagrams, make the window larger or hide the left
pane by clicking the split bar. To restore the left pane, click the split bar again.
41
Page 42
Bode 100 User Manual
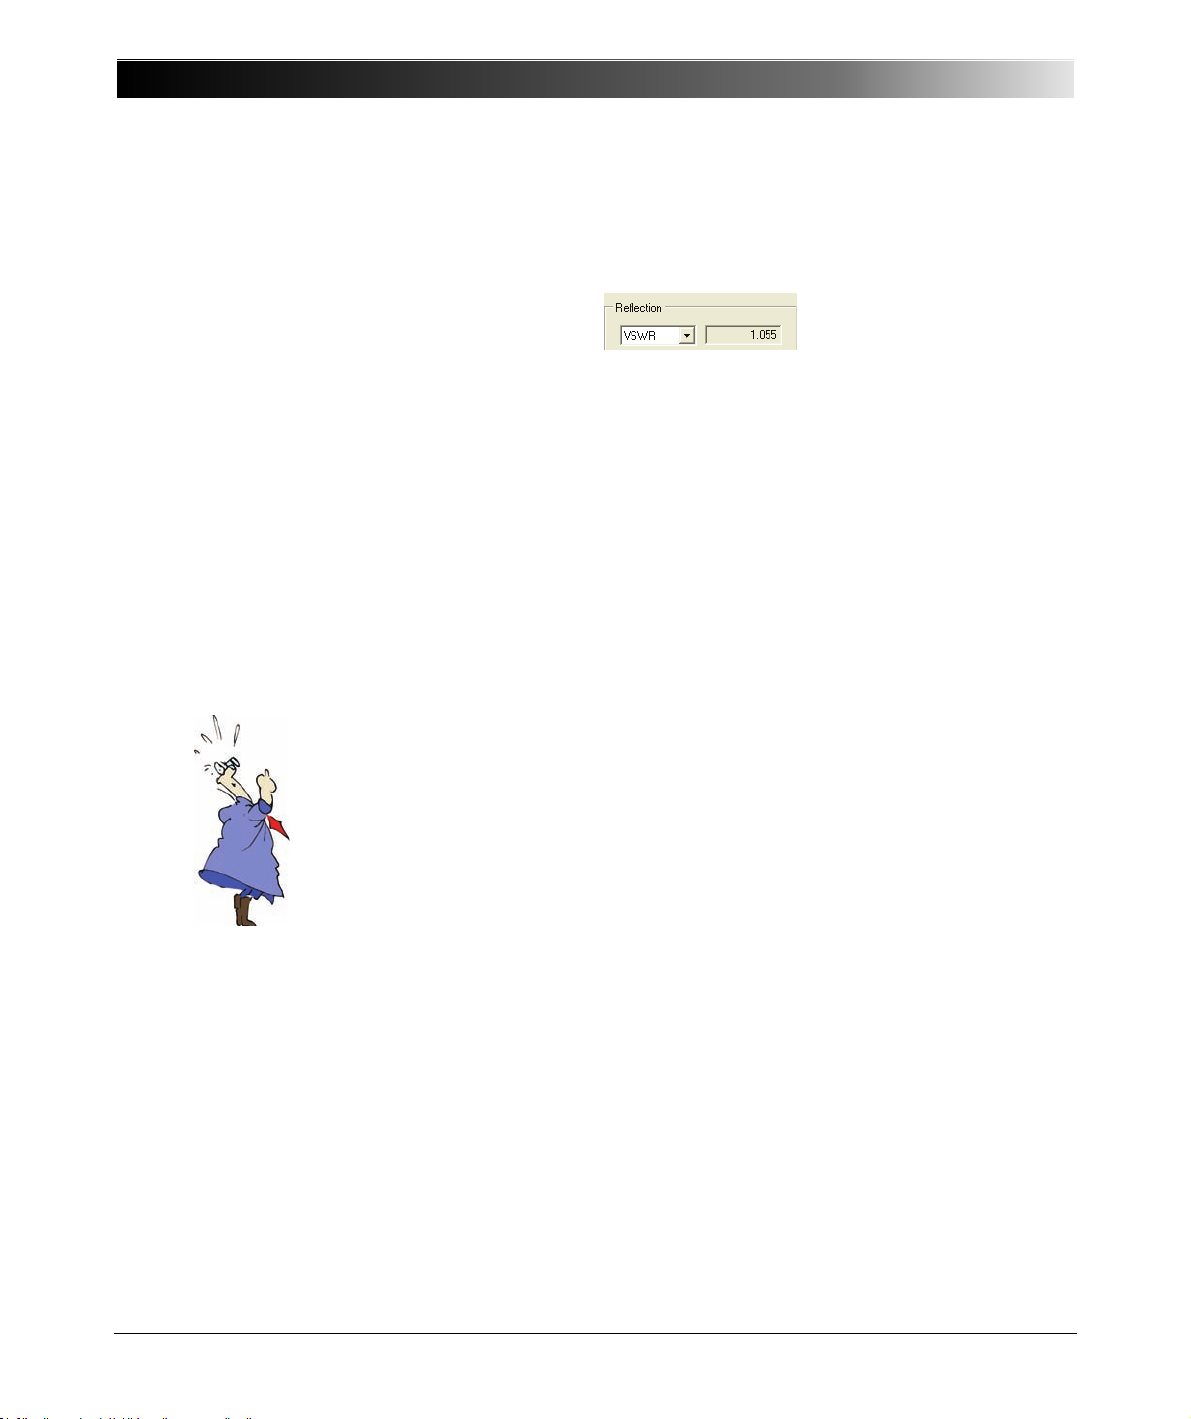
Hint: If you want to display the reflection in VSWR format select the VSWR
output format under Reflection as shown below.
Usually, the reference resistance of 50 Ω is used to calculate the reflection
coefficient and the VSWR. The Reference Resistance box allows you to enter
other reference resistance values if required.
The parallel and serial equivalent circuits give us an indication of the electrical
components that would be required to rebuild the electrical characteristics of
your DUT at the measurement frequency. In our example you would require a
39 nF capacitor and a 52.7 Ω resistor to build the series equivalent circuit.
Try it out, get yourself the required components and repeat the measurement. If
the results do not match 100% keep in mind that you are using real components
with a factor on their own.
Q
After this example get a
glass of water to
increase your reflection
mode and your attention
bandwidth. Then try
things out and right-click
and left-click to
everything that does not
move on the screen.
For inform ati on on how to c ali bra te the Bode 100 in the Impedance/Reflection
mode, see 7.4 "Calibration in the Impedance/Reflection Mode" on page 83.
Congratulation! You learned how to use the Impedance/Reflection mode.
How to:
• Measure the reflection coeffi ci ent at a frequency
• Set the bandwidth and amplitudes used for the measurement
• Connect the DUT for the impedance and reflection measurement
• Optimize the diagrams
• Understand serial and parallel equivalent circuits
Go back to the overview chart at 4 "Impedance/Reflection Mode" on page 33
and try things out.
42
Page 43
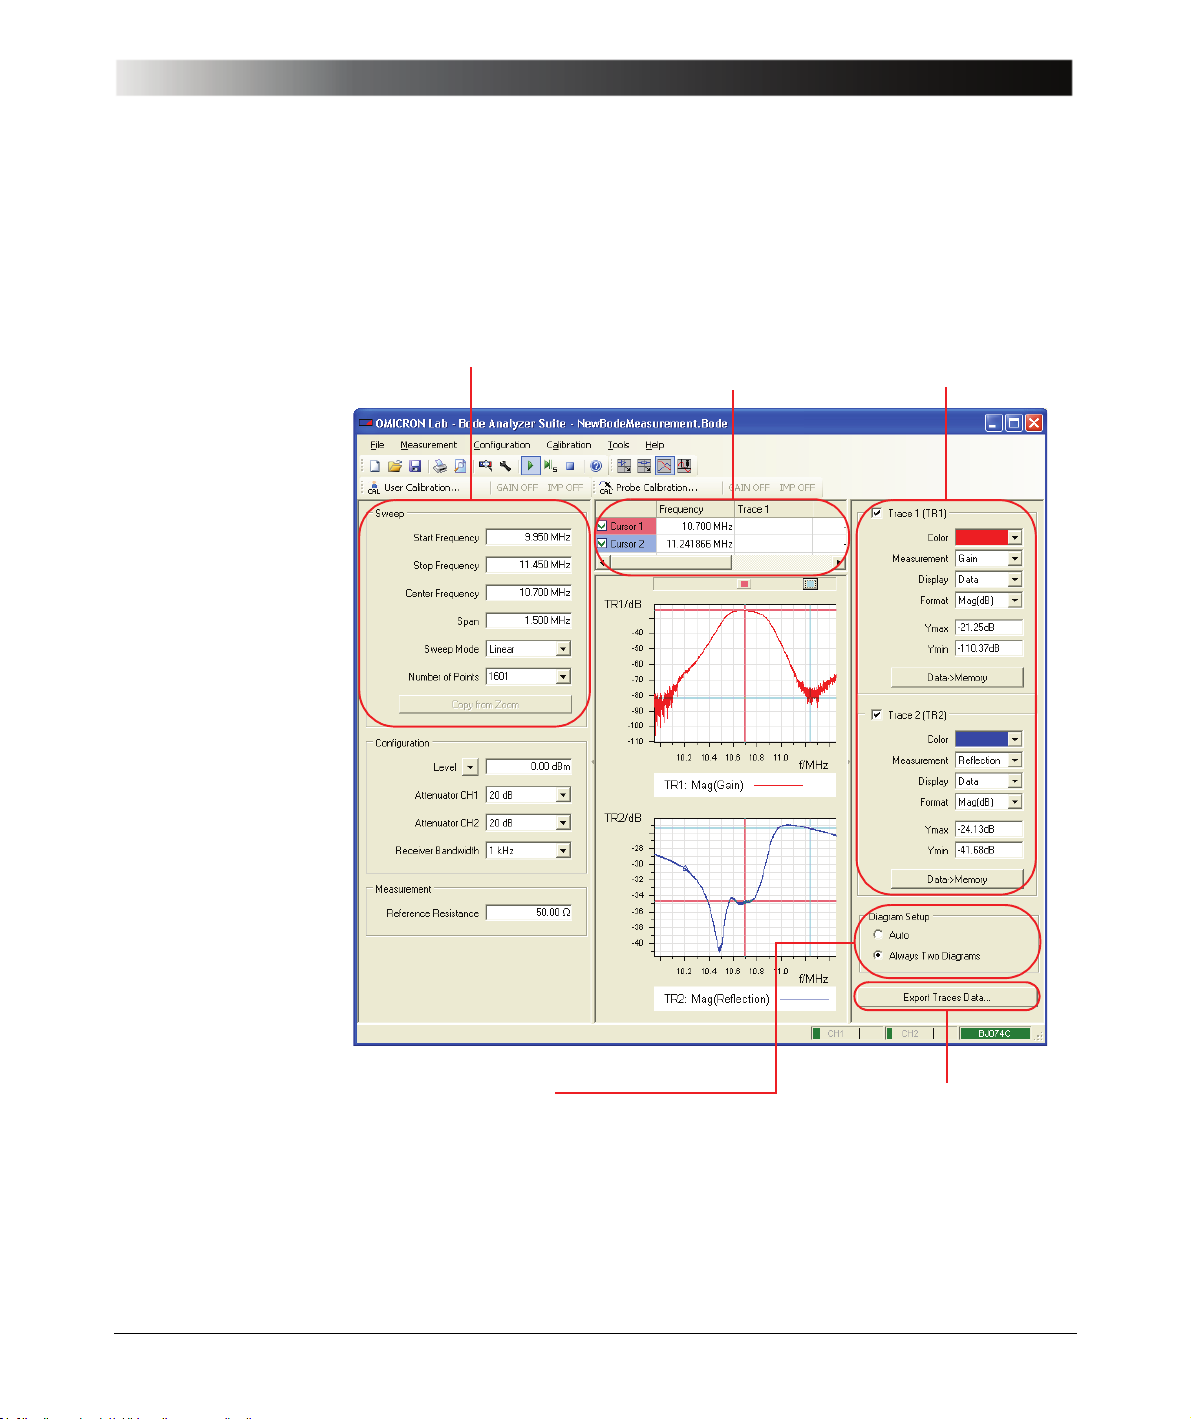
5 Frequency Sweep Mode
S
C
T
Frequency Sweep Mode
Figure 5-1:
Frequency Sweep
mode window
weep settings
Set frequency sweep.
See Figure 5-2: "Sweep
settings" on page 44.
ursor settings
Set cursors and view
measurement results.
See Figure 5-3: "Cursor
settings" on page 44.
race settings
Define measurement format
and display options.
See Figure 5-4: "Trace
settings" on page 45.
Diagram setup
See Figure 5-5: "Diagram
setup" on page 46.
Export traces data
Export traces as CSV file.
See 8.3.2 "Exporting Measurement
Data" on page 99.
Note: Only window areas specific for the Frequency Sweep mode are
explained. For window areas common to other measurement modes, see Figure
3-1: "Gain/Phase mode window" on page 17 and Figure
4-1: "Impedance/Reflection mode window" on page 33.
43
Page 44
Bode 100 User Manual
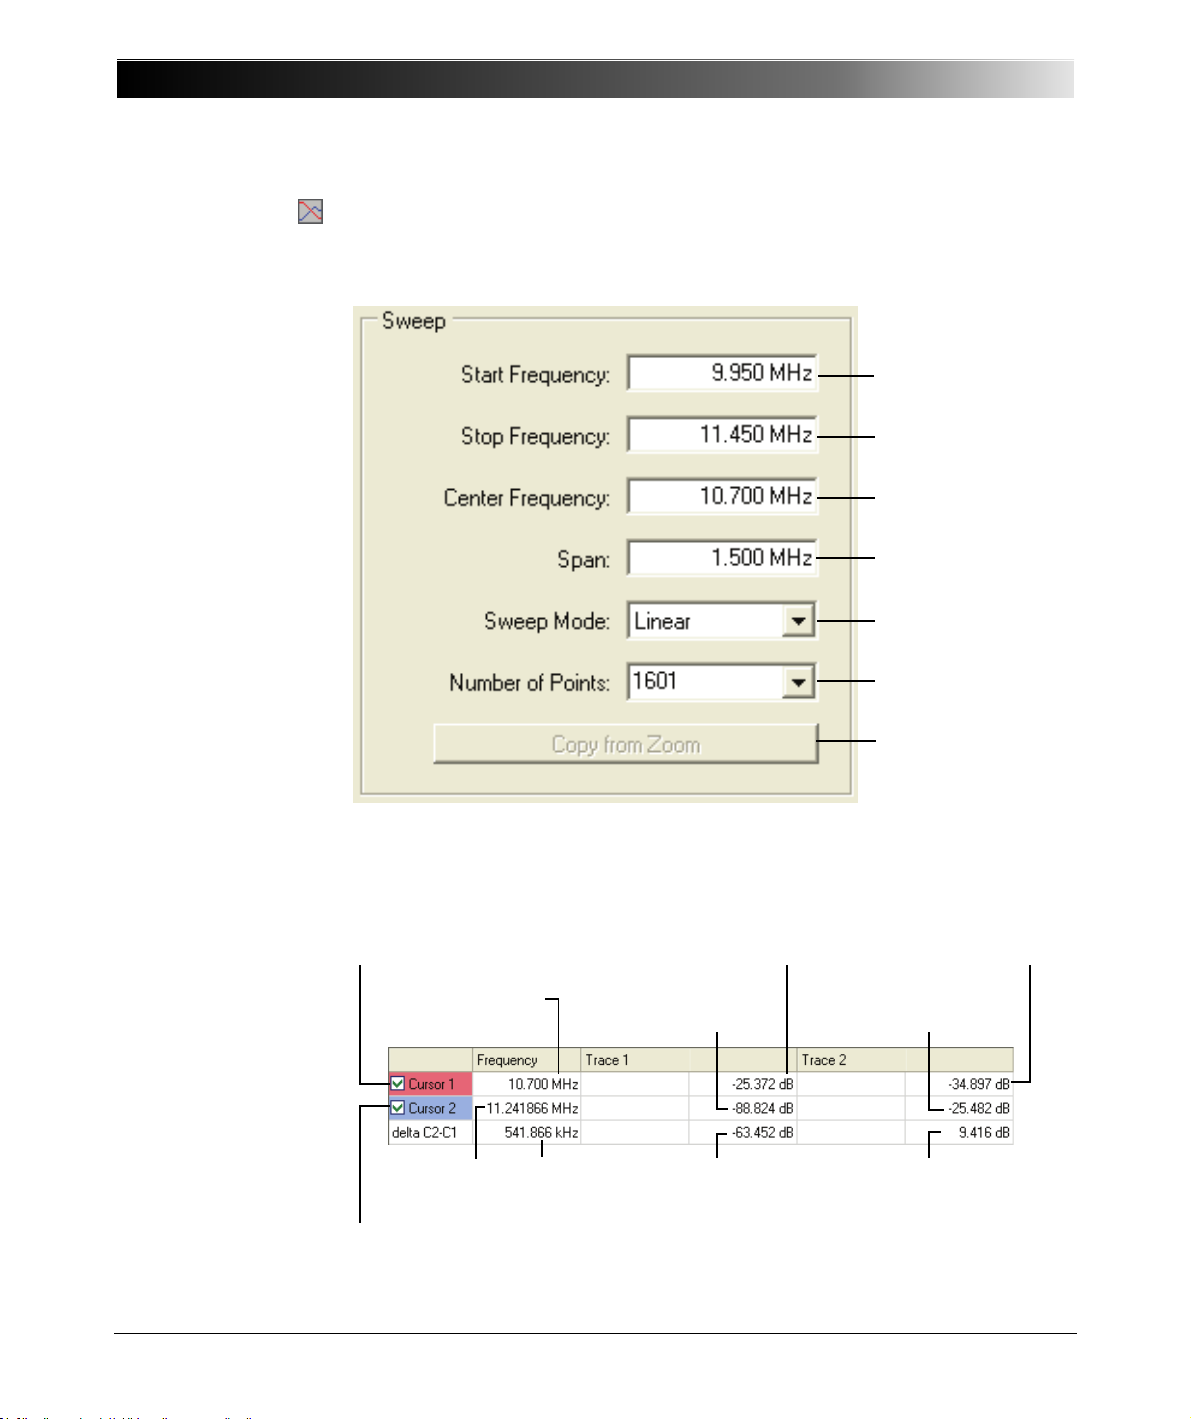
Figure 5-2:
Sweep settings
In the Frequency Sweep mode you can perform a sequence of Gain/Phase
and/or Impedance/Reflection measurements and examine the results in
different types of diagrams.
Set the frequency sweep
start frequency.
Set the frequency sweep
stop frequency.
Set the frequency sweep
center frequency.
Set the frequency sweep
span.
Click Linear or
Logarithmic to select
the respective scale of
measurement points.
Set the number of
measurement points.
Copy from Zoom
See "Copy from Zoom"
on page 107.
Figure 5-3:
Cursor settings
44
Hint: The start frequency, stop frequency, center frequency and span are
mutually dependent. After one of them has been changed, the others settings
are recalculated by the Bode Analyzer Suite.
Select the check box
to activate cursor 1.
Frequency marked
by cursor 1
Frequency marked
by cursor 2
Select the check box
to activate cursor 2.
Trace 1 measurement result
marked by cursor 1.
Trace 1 measurement result
marked by cursor 2.
Difference of cursor
frequencies
Difference of trace 1
measurement results
Trace 2 measurement result
marked by cursor 1.
Trace 2 measurement result
marked by cursor 2.
Difference of trace 2
measurement results
Page 45
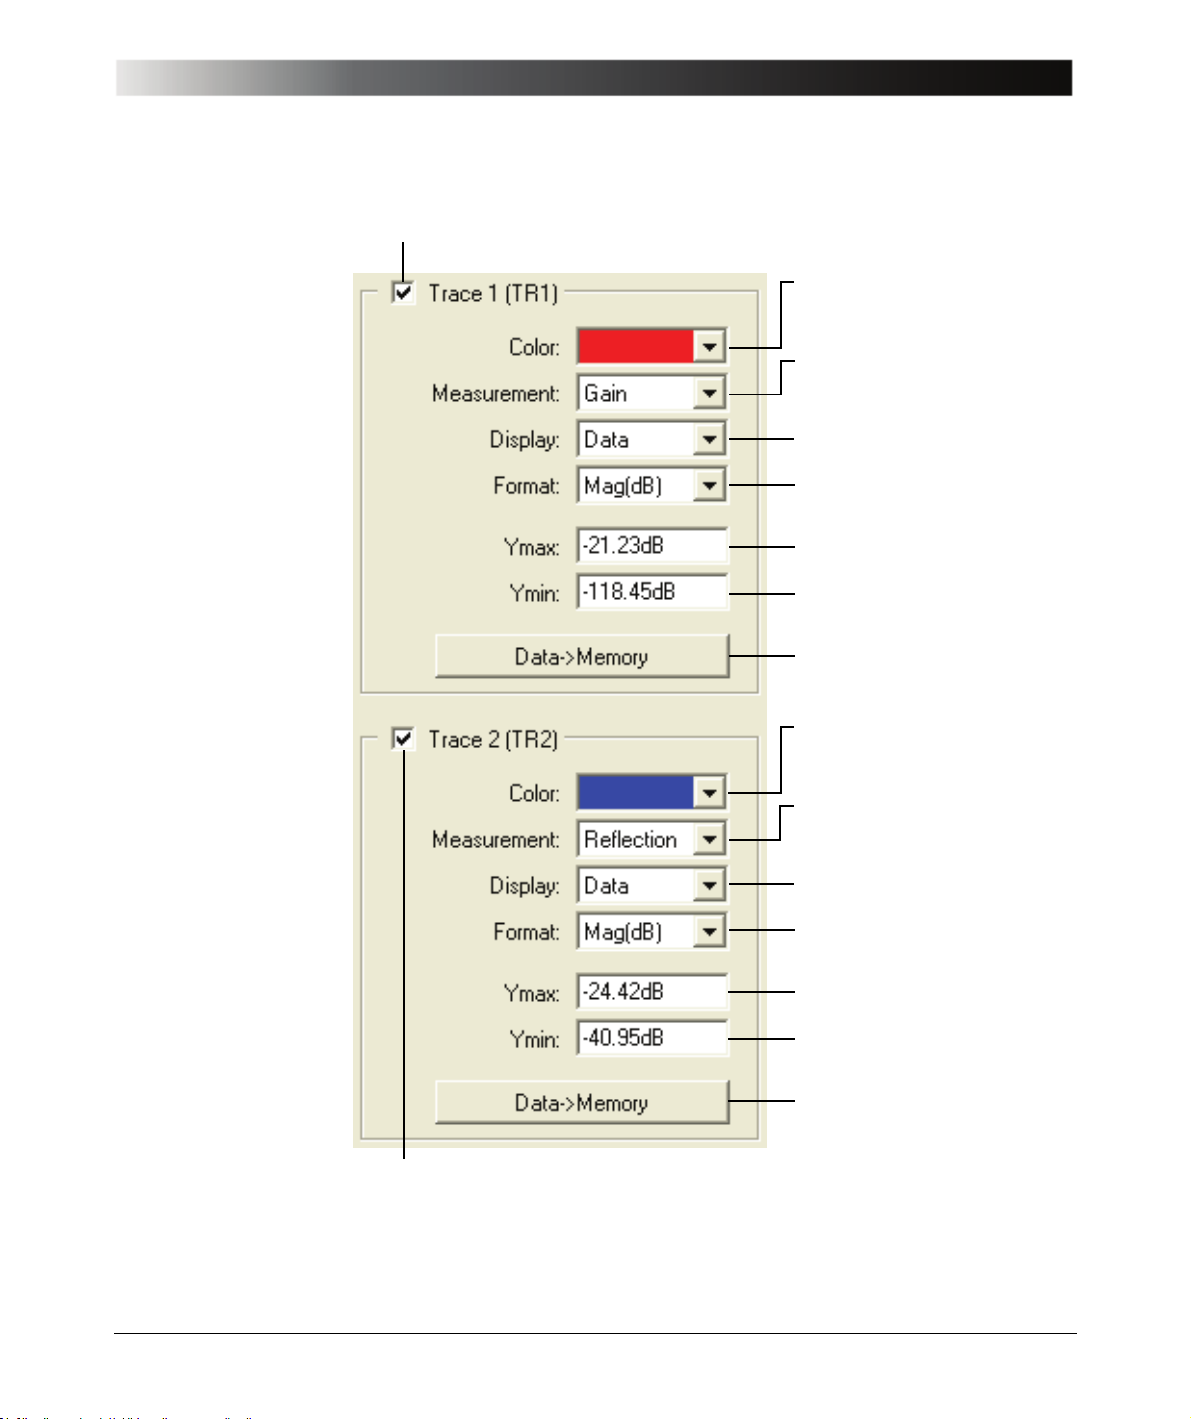
Figure 5-4:
Trace settings
Frequency Sweep Mode
Select the check box to activate trace 1.
Set the color of trace 1.
Click Gain, Reflection, Impedance
or Admittance to select the
respective trace 1 measurement.
Display
See "Data and Memory" on
page 111.
Select the output format of trace 1
measurement results.
Set the maximum value on
the trace 1 Y-axis.
Set the minimum value on
the trace 1 Y-axis.
Data –> Memory
See "Data and Memory" on
page 111.
Select the check box to activate trace 2.
Set the color of trace 2.
Click Gain, Reflection, Impedance
or Admittance to select the
respective trace 2 measurement.
Display
See "Data and Memory" on
page 111.
Select the output format of trace 2
measurement results.
Set the maximum value on
the trace 2 Y-axis.
Set the minimum value
on trace 2 the Y-axis.
Data –> Memory
See "Data and Memory" on
page 111.
45
Page 46
Bode 100 User Manual
Figure 5-5:
Diagram setup
5.1 Example: Frequency Sweep Measurement
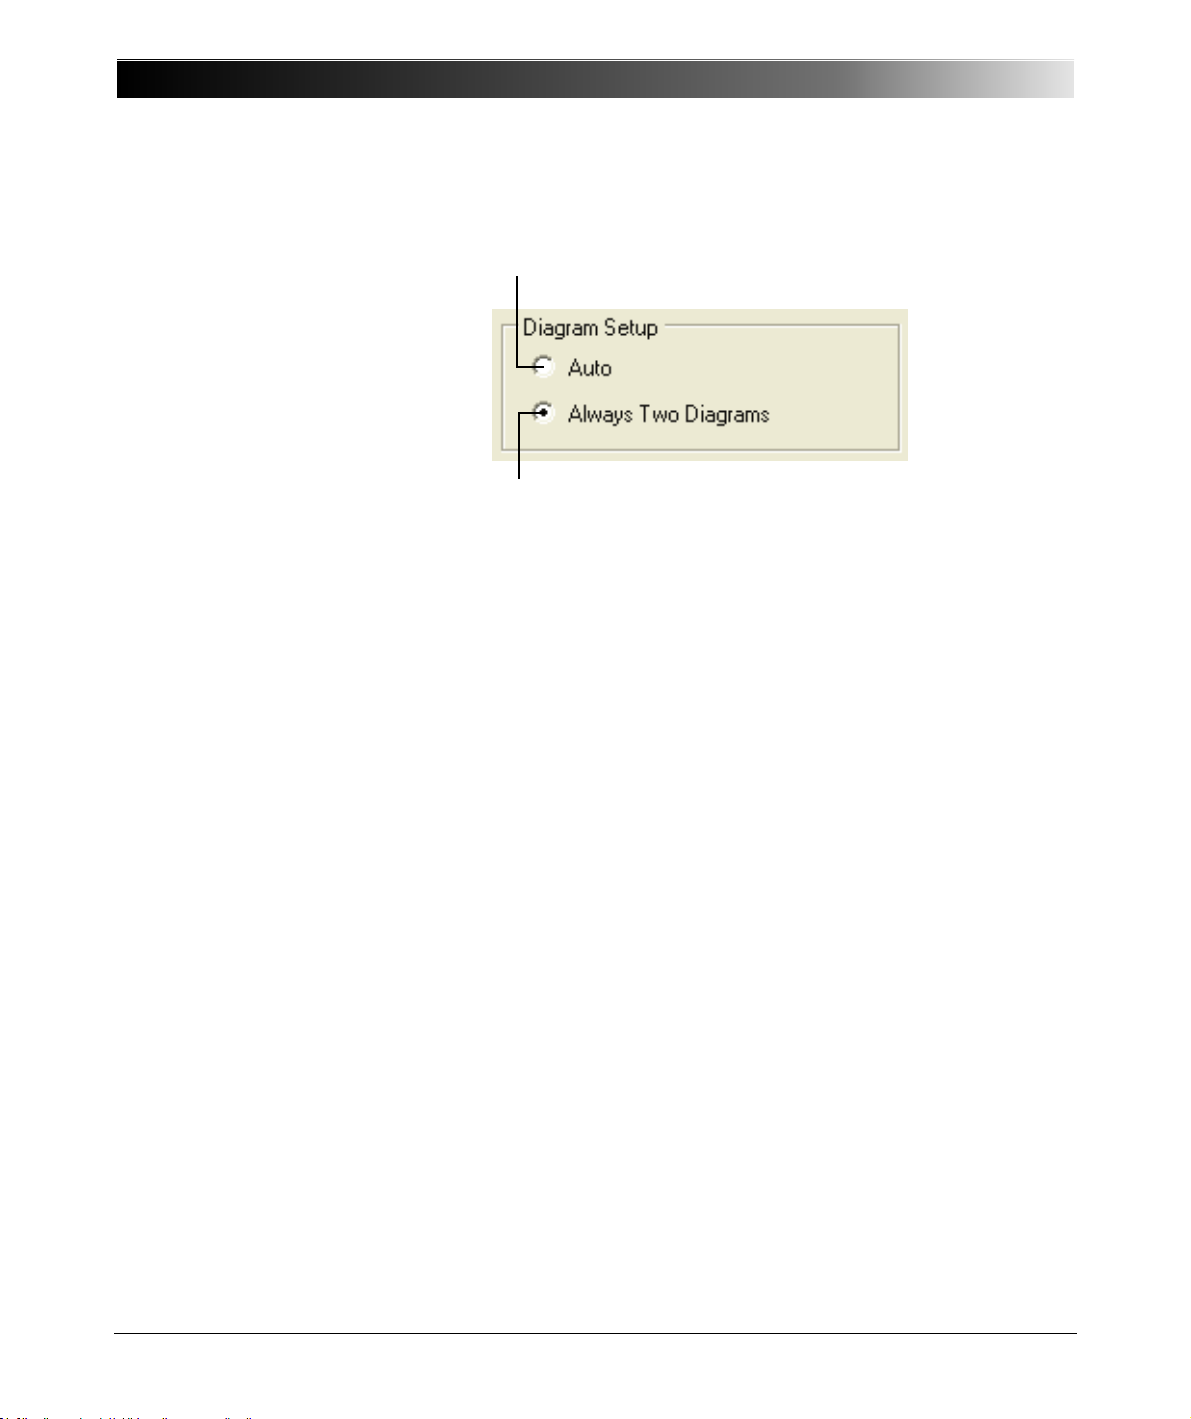
Click Auto to display both traces
in one diagram, if possible.
Click Always Two Diagrams
to display the traces in two
separate diagrams.
Note: Diagram Setup is only available if both traces are activated.
Expected example duration: 30 minutes.
In this example you will learn step by step how to use the Frequency Sweep
mode of the Bode 100.
How to:
• Visualize measurement data in a graph
• Set configuration parameters like the input resistor and bandwidth
• Set sweep parameters like start and stop frequencies
• Use cursors to read single measurement points
• Calibrate and compensate the cables
46
Page 47

Frequency Sweep Mode
Let’s examine the12 MHz quartz filter on the delivered printed circuit board
(PCB).
Questions:
• How does the gain of the quartz filter look if displayed as a function of
frequency?
• How does the reflection coefficient of the quartz filter look in the Smith chart?
• What are the series resonance and the parallel resonance frequencies?
• What is the attenuation of the quartz filter at its series resonance?
• What is the group delay T
• What is the series resistance R
of the quartz filter at its series resonance?
g
of the quartz filter?
s
To find out t he answers, proceed as follows:
1. Connect the Bode 100 to the computer and start the Bode Analyzer Suite.
Hint: If you see the Bode 100 serial number on the lower right side of the
status bar then your Bode 100 is working properly.
2. Click the Frequency Sweep toolbar button to switch to the
Frequency Sweep mode.
3. Click the Device Configuration toolbar button to configure the
Frequency Sweep mode.
We want to measure the quartz filter with 50 Ω load.
47
Page 48
Bode 100 User Manual
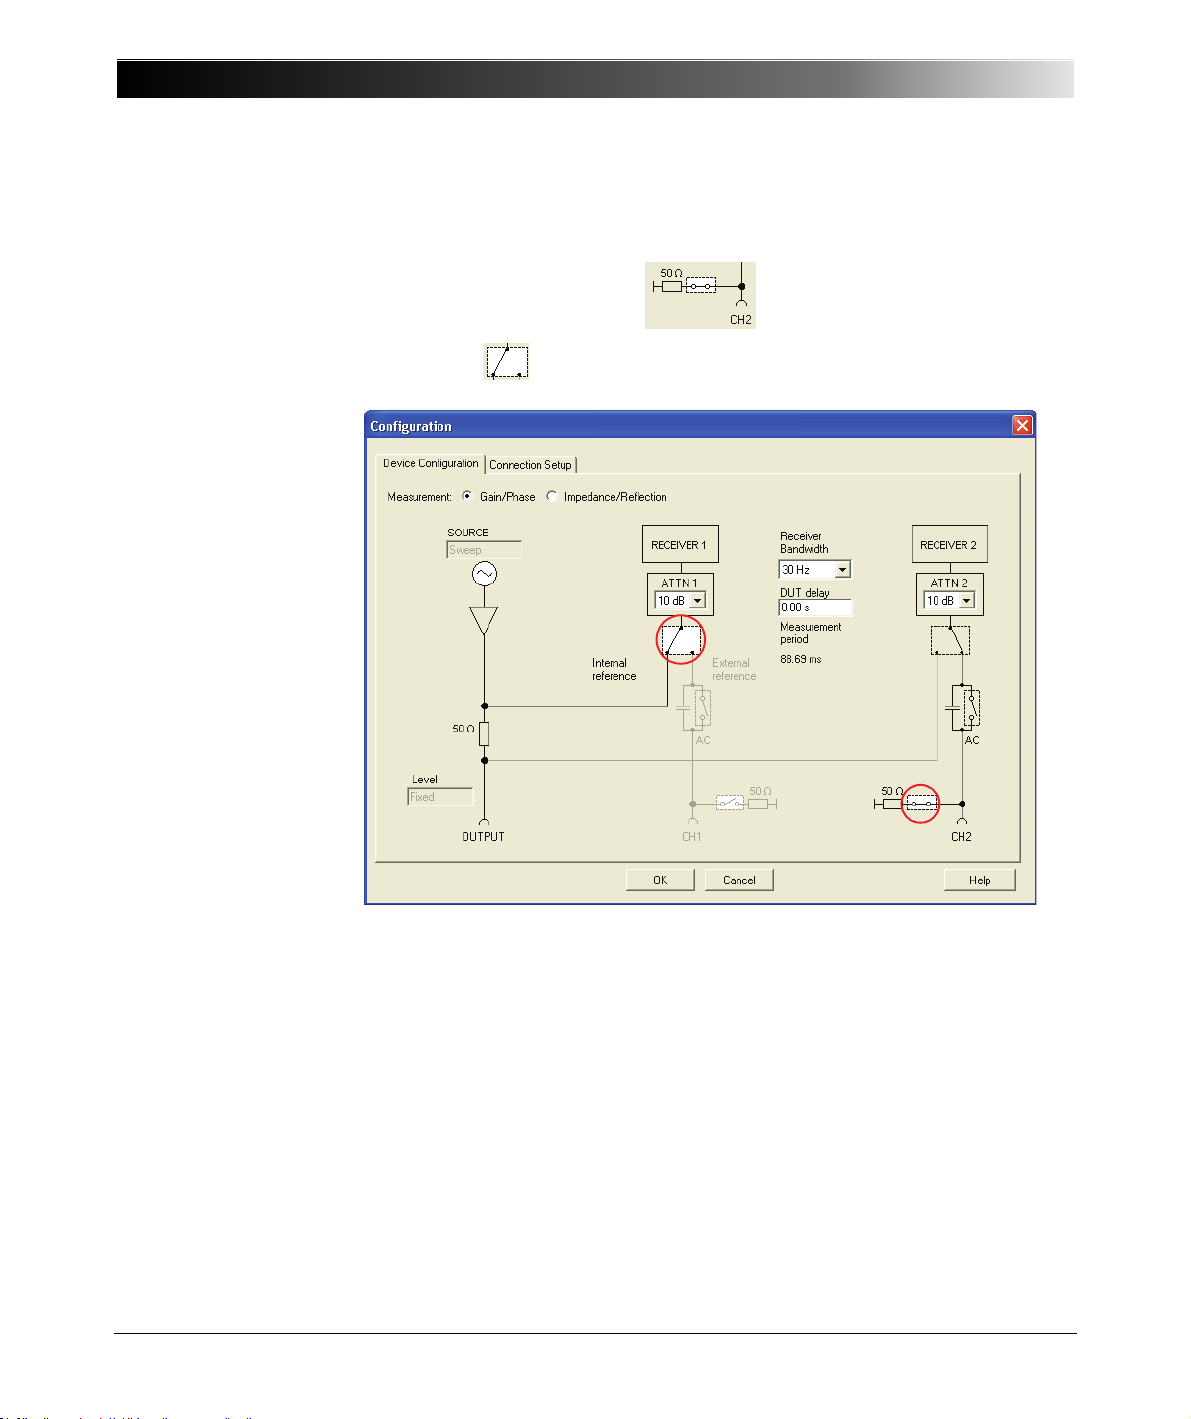
4. Set:
•CH2: 50Ω ON (click the switch as shown)
• The switch (before ATTN1) to the internal source as reference
48
Hint: In the Frequency Sweep mode, the Bode 100 can measure the
gain/phase as well as the impedance/reflection of the DUT versus frequency.
The Gain/Phase and Impedance/Reflection buttons in the Configuration
window are just used to show the respective device configurations. The
buttons have no impact on the measurements performed by the Bode 100 –
you select the measurement in the Measurement lists in the Trace 1 and
Trace 2 areas (see Figure 5-4: "Trace settings" on page 45). To see the
device configuration the Bode 100 uses for the Impedance/Reflection
measurement just cl ick the Impedance/Reflection button.
Hint: With a narrow receiver bandwidth like 30 Hz, the measurement is very
selective. Only little noise will affect the measurement and, consequently, the
measurements will be more stable but the sweep will be slow. The receiver
bandwidth of 3 kHz will perform the fastest sweep.
Page 49
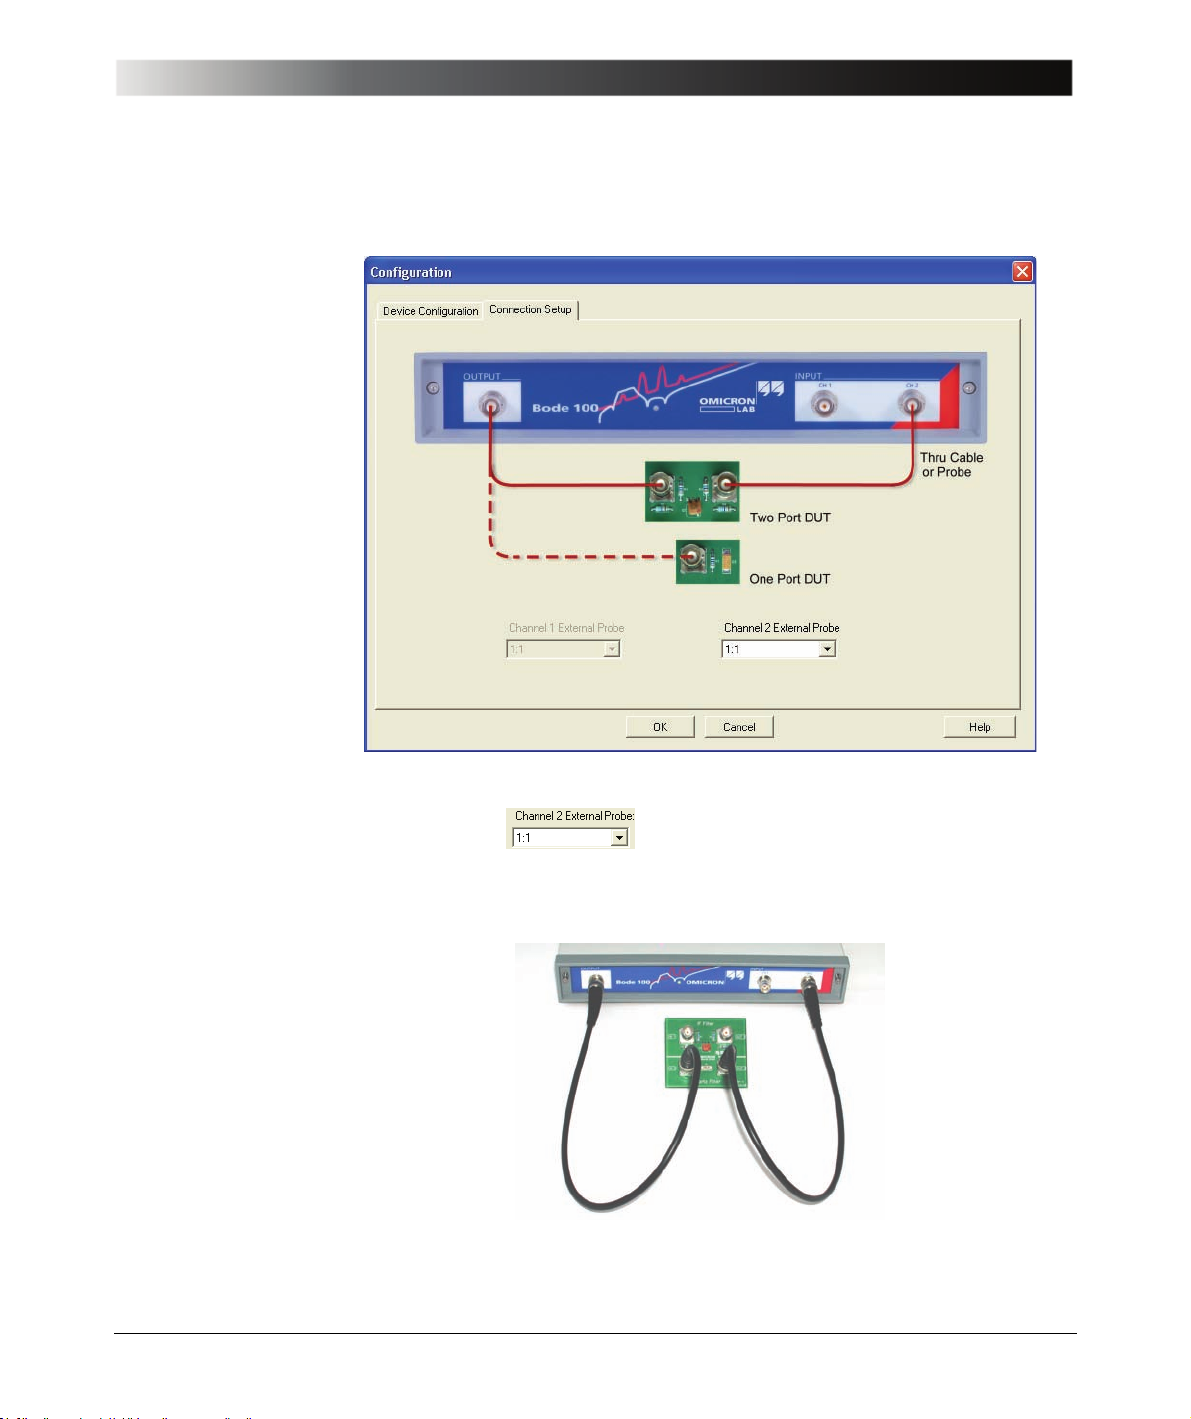
5. Click the Connection Setup tab.
Frequency Sweep Mode
The connection diagram shows how to connect the DUT to the Bode 100.
Hint: Use the box to set the voltage ratio when you use a
probe instead of cable connection (see 9.4 "Using Probes" on page 125).
6. Connect the quartz filter to the Bode 100 as shown.
49
Page 50
Bode 100 User Manual
7. Click to close the Configuration window and to get back to the
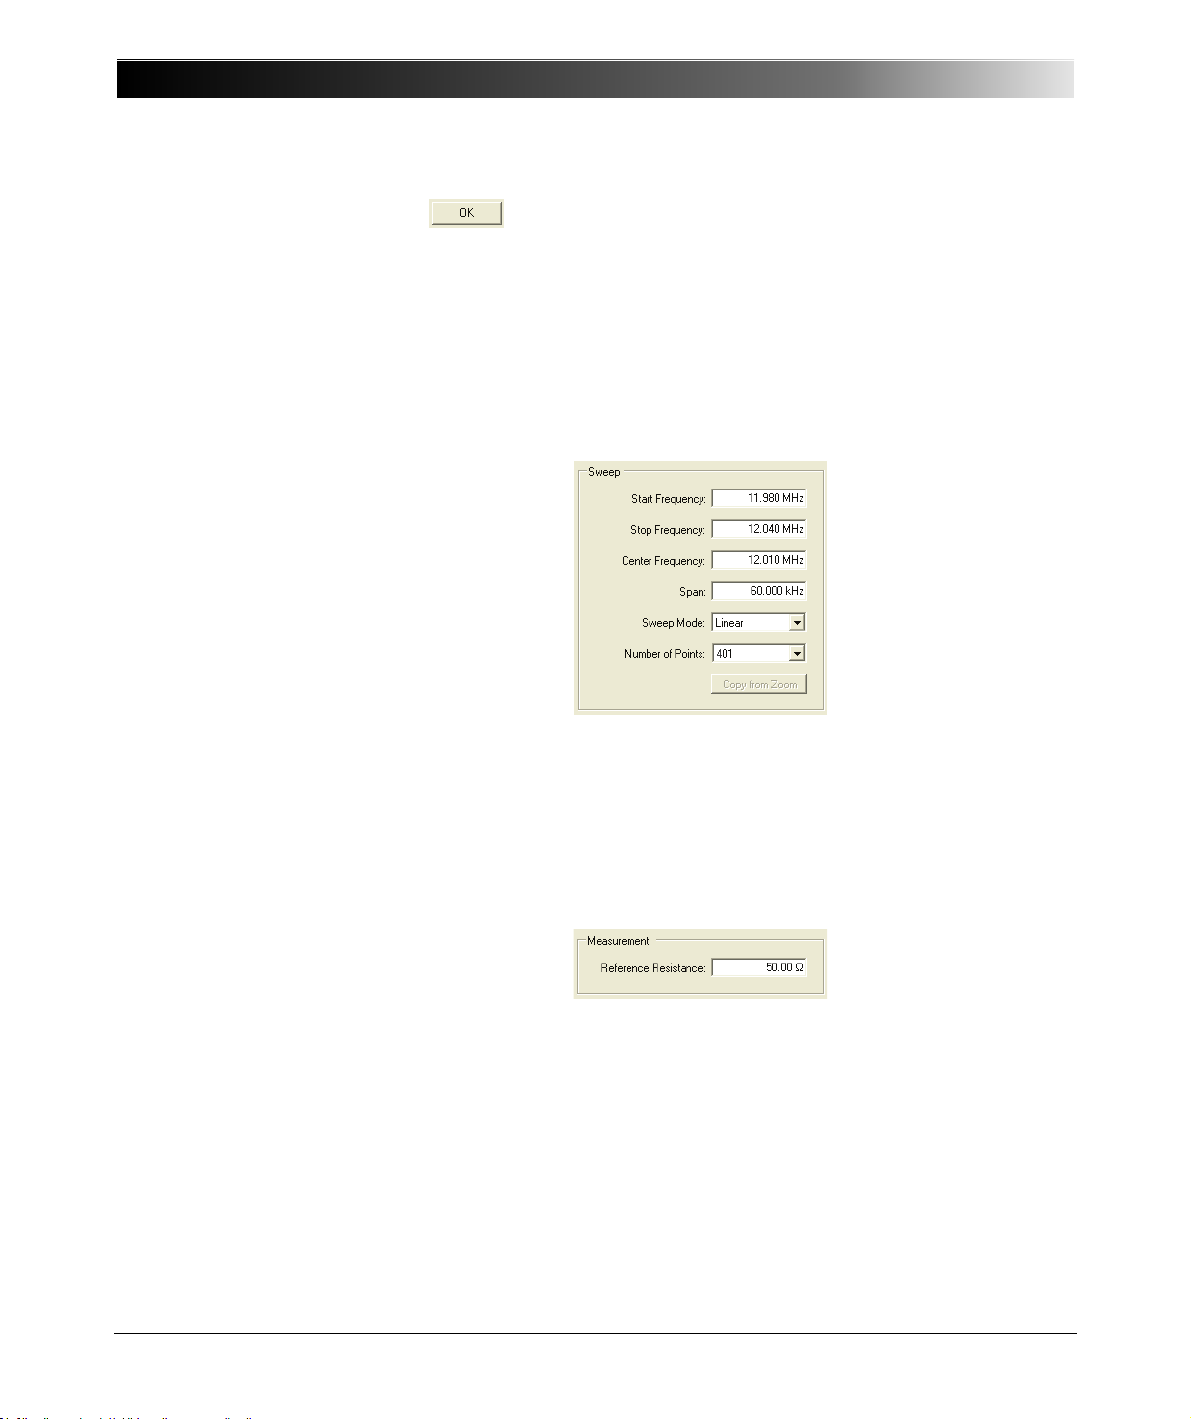
8. Set the sweep frequencies:
• Start frequency: 11.98 M Hz
• Stop frequency: 12.04 MHz
• Number of points: 401
Frequency Sweep mode window.
The other settings will be automatically calculated and the Sweep area of the
Frequency Sweep mode window should now look like below.
Hint: A setting which results in an out-of-range frequency for any other
parameter will be corrected to ensure that all sweep frequencies (start, stop,
center) are within the range of 10 Hz…40 MHz or 1 Hz…40 MHz if you
selected the extended measurement range (see 8.2 "Setting the
Measurement Range" on page 98).
9. Set the referenc e re sistance.
Default: 50 Ω
The reference resistance is used to calculate the reflection coefficient and
the VSWR.
50
Page 51
Frequency Sweep Mode
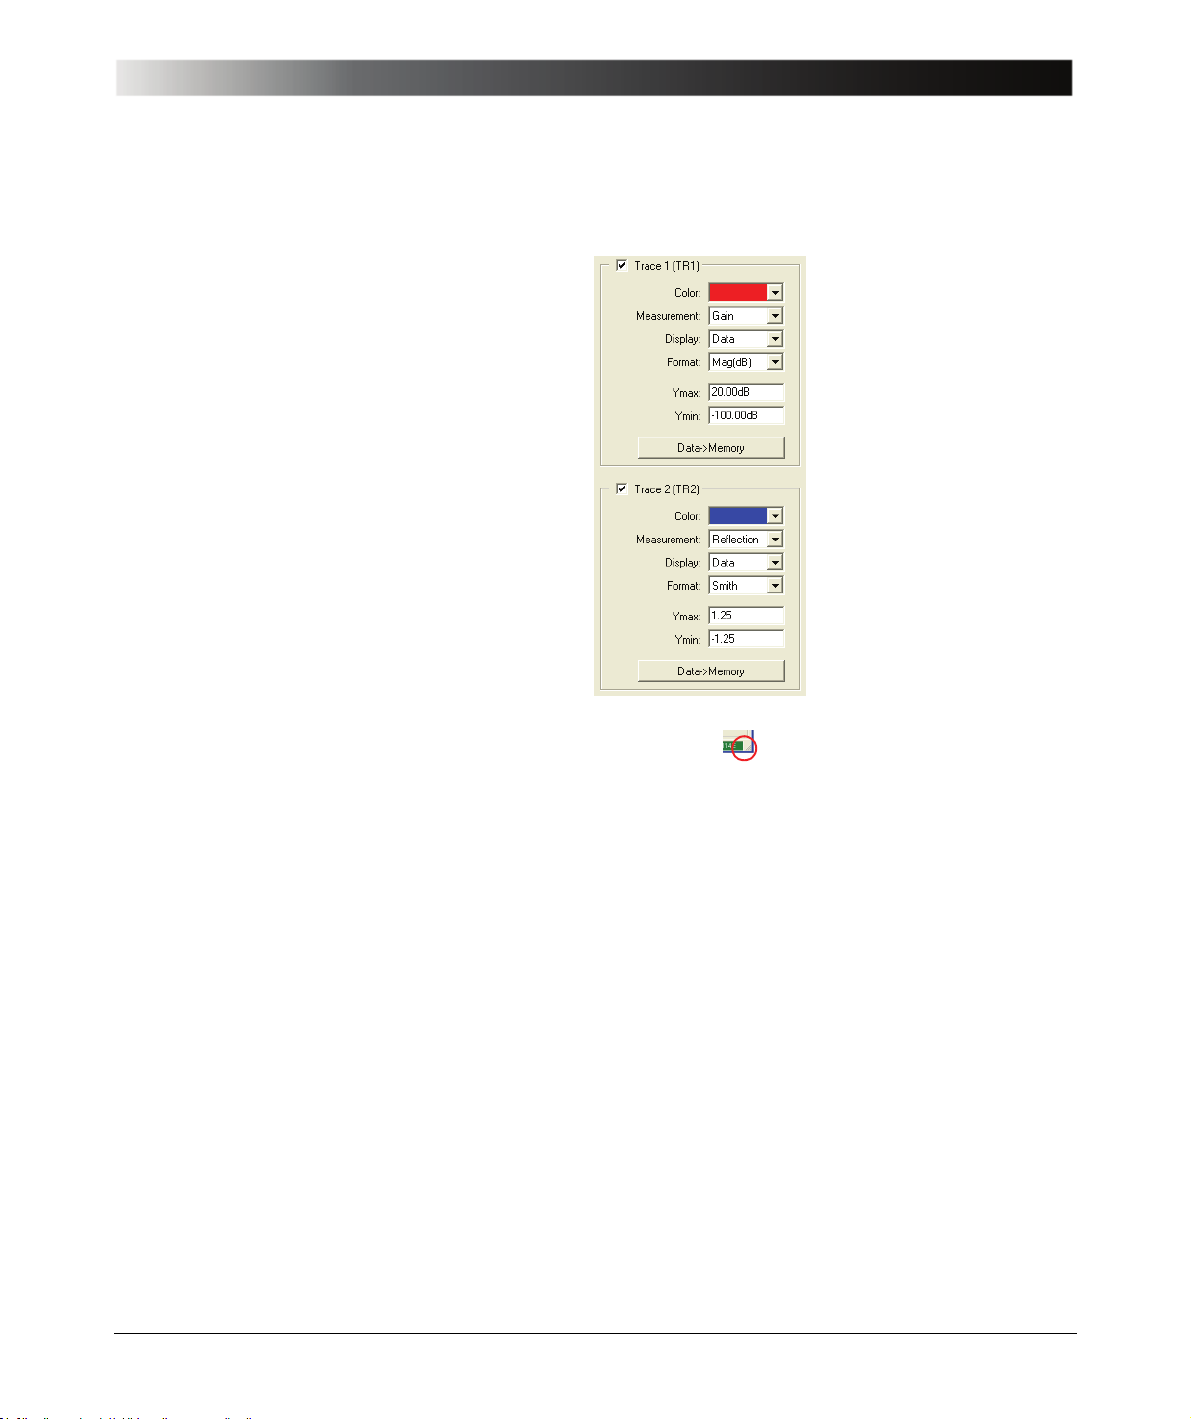
10.Activate both traces and set the parameters as shown below.
11.If you have a larger screen you can adjust your window size. Move the mouse
to the lower right corner of the window . and drag the corner.
51
Page 52
Bode 100 User Manual
Hint: In addition to resizing the window, you can click the split bar to hide the
left and right panes to increase the size of the diagrams.
52
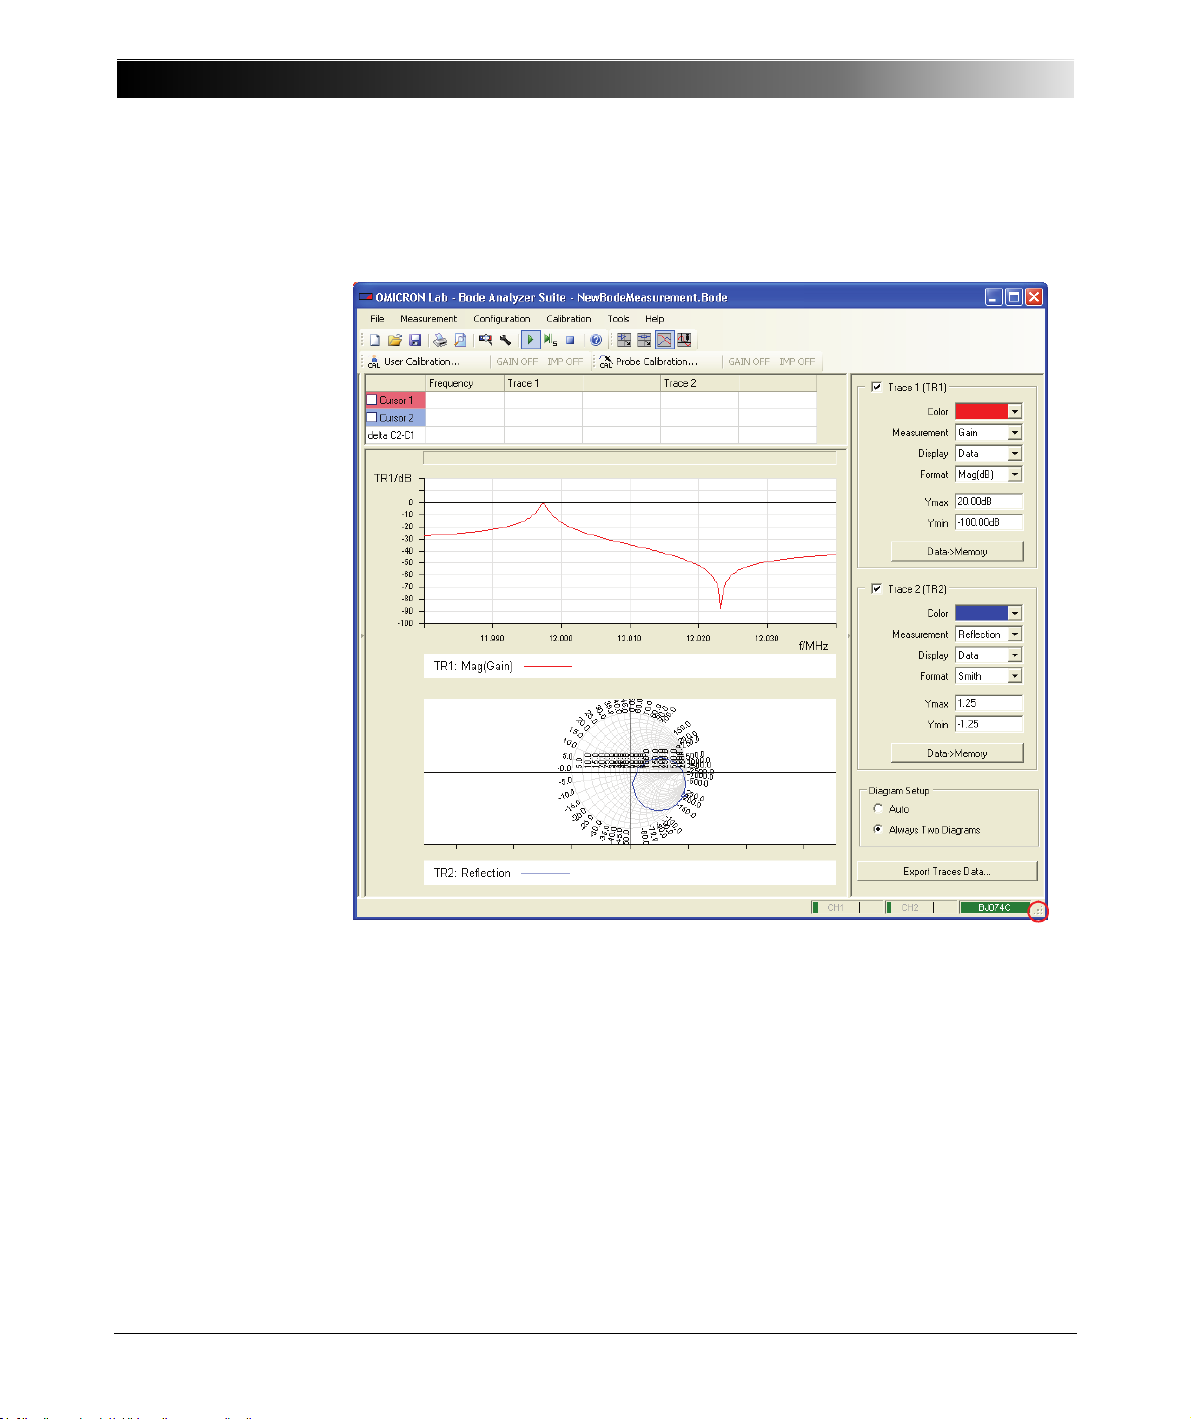
In the upper graph you see the gain of the quartz filter. You can use the
cursors to measure the series and parallel resonance frequencies.
12.Select the Cursor 1 and Cursor 2 check boxes to activate the cursors.
Page 53
Frequency Sweep Mode
13.To find the series resonance frequency of the quartz filter, right-click the
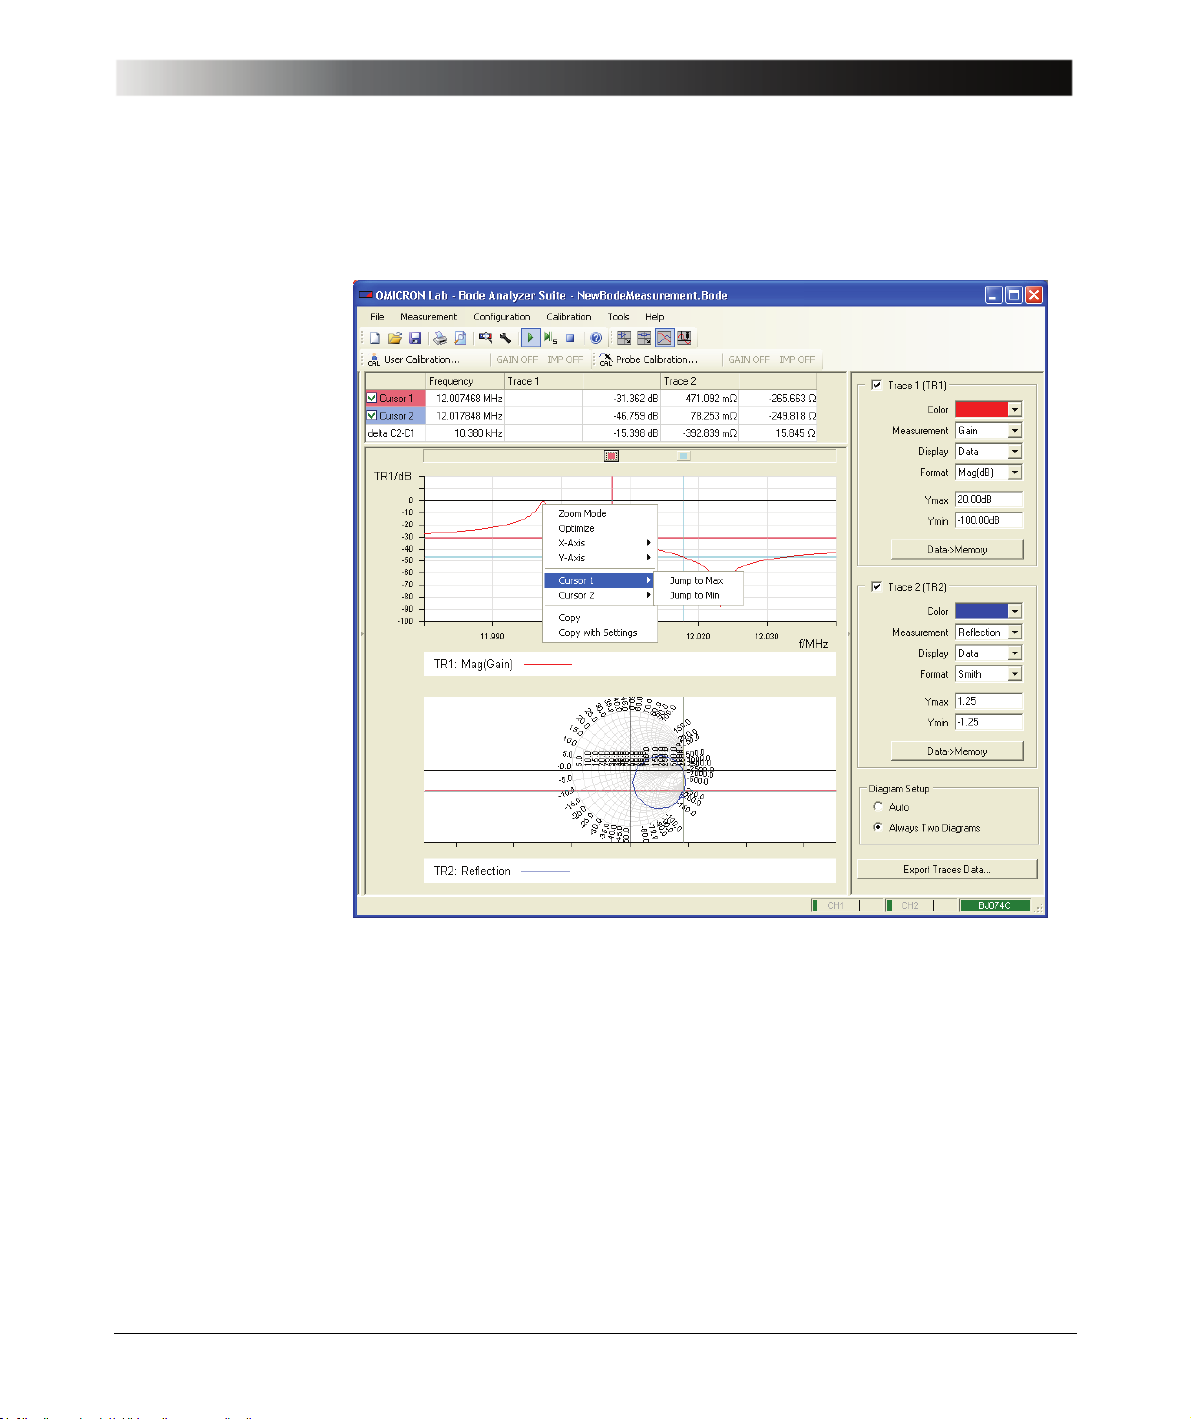
curve in the upper diagram, point to Cursor 1, and then click Jump to Max.
53
Page 54
Bode 100 User Manual
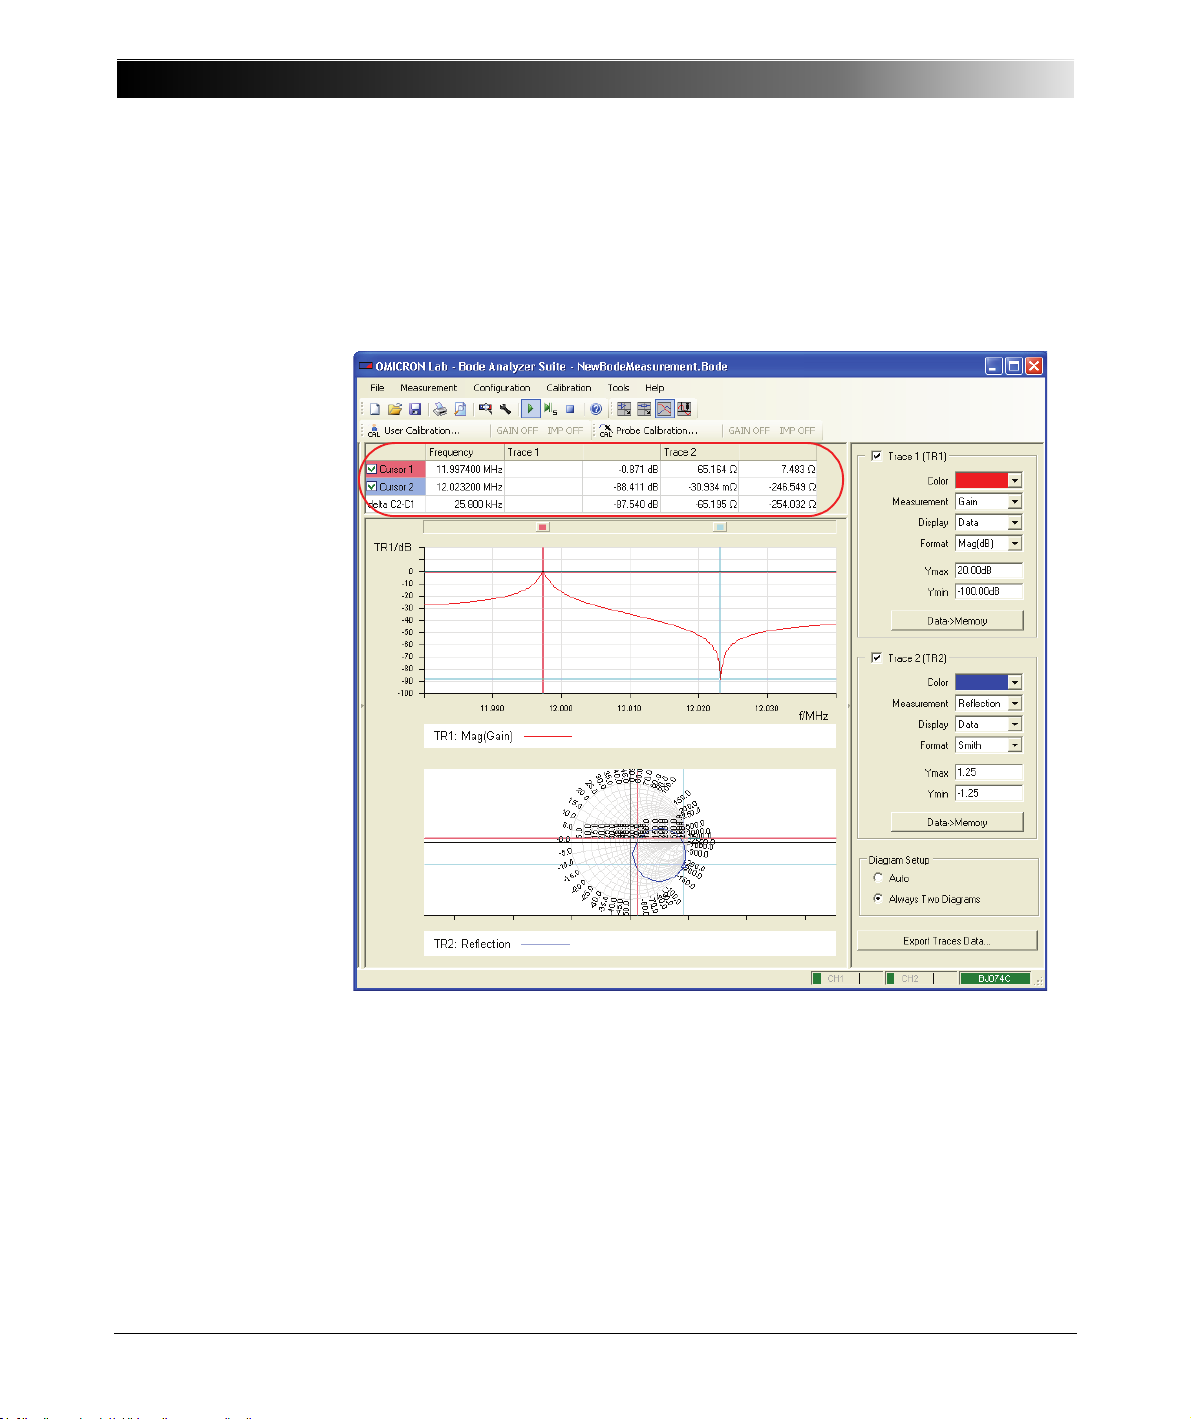
14.To find the parallel resonance frequency of the quartz filter, right-click the
curve in the upper diagram, point to Cursor 2, and then click Jump to Min.
In the marked area of the Frequency Sweep mode window, the series and
parallel resonance frequencies and the corresponding measurement data
are now displayed.
54
Results: Cursor 1 marks the series resonance frequency of 11.997 MHz and
an attenuation at the series resonance frequency of 0.871 dB.
Cursor 2 marks the parallel resonance frequency of 12.023 MHz and an
attenuation at the parallel resonance frequency of 87.725 dB.
Page 55
Frequency Sweep Mode
15.To measure the group delay of the quartz filter at its series resonance
frequency, select Tg in the Format list.
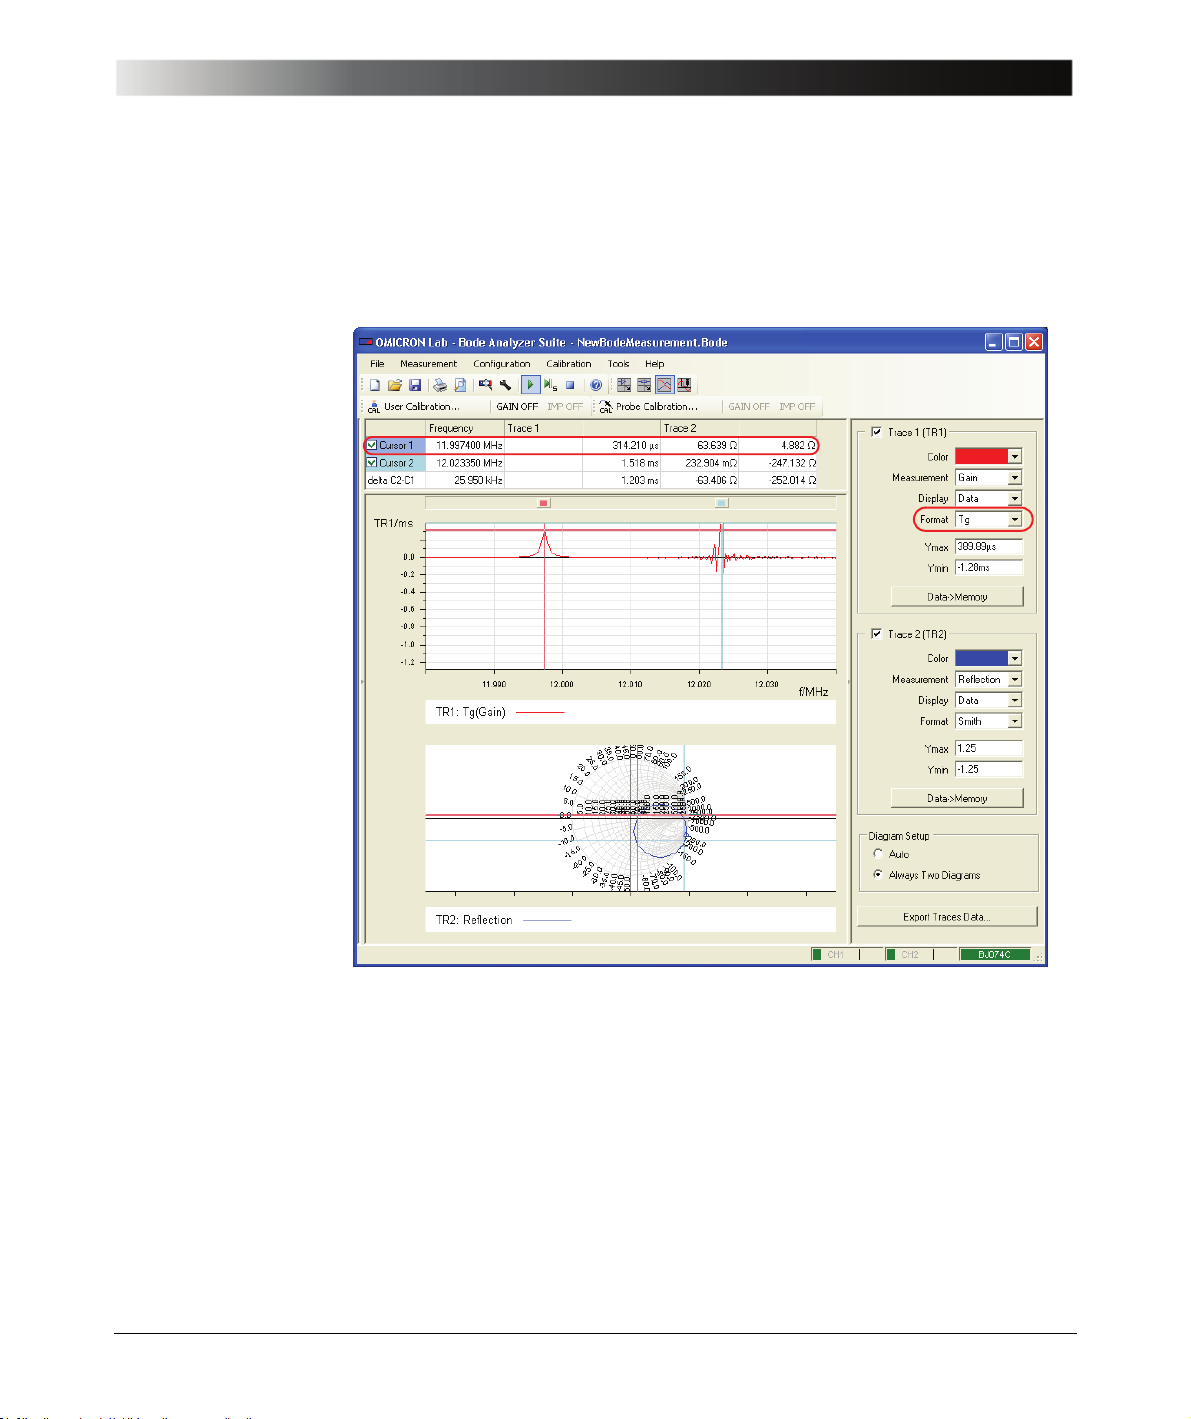
The following figure shows the group delay measured by Trace 1 at the
series resonance frequency marked by cursor 1.
Result: The group delay T
at the series resonance frequency of the quartz
g
filter is 314.2 μs. Due to the high attenuation at the parallel resonance
frequency it is not possible to measure the group delay at the quartz filter’s
parallel resonance.
Your result might be slightly different because even quartz filters show
variations in their electrical characteristics.
16.For the measurement of the series resistance of the quartz filter we will use
the Smith chart. The Smith chart displays the reflection coefficient (see (Eq.
4-3) on page 34) in the complex plane. The horizontal axis represents the
real component and the vertical axis the imaginary component of the DUT's
reflection coefficient. The central point of the Smith chart corresponds to the
55
Page 56
Bode 100 User Manual
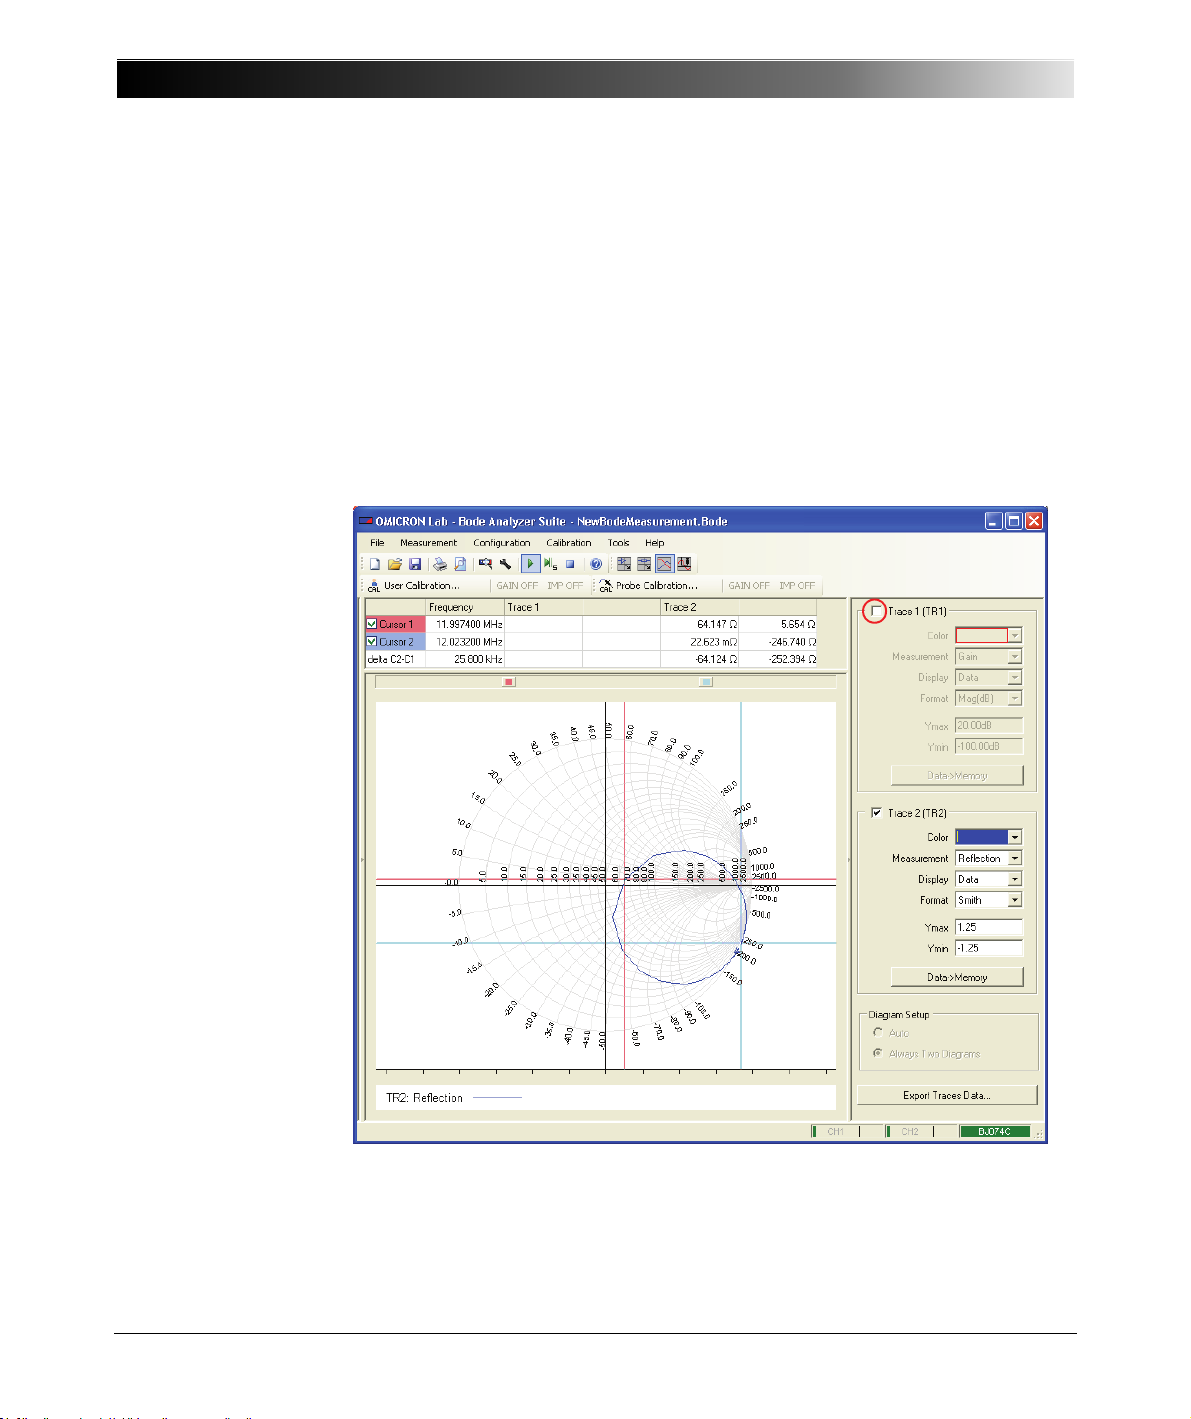
17.In the lower graph you see the Smith chart showing the reflection coefficient
case when the DUT’s impedance equals the reference resistance and,
consequently, the reflection coefficient is zero.
Additionally, the Smith chart contains circles with constant resistance ( )
and constant reactance ( ). This diagram format allows an easy "translation"
X
R
of any point of the reflection coefficient curve into the corresponding DUT’s
impedance. The cursor values displayed in the Smith chart format are the
real and imaginary components of the corresponding DUT’s impedance. For
more information on the Smith chart, refer to the relevant technical literature.
of the quartz filter. To display only this chart, clear the Trace 1 check box to
deactivate trace 1.
56
Since the output of the DUT (quartz filter) is connected to the channel 2 input,
the measured impedance is the quartz impedance plus the 50 Ω input
impedance of the Bode 100.
Page 57
For an idle quartz, the trace should be nearly symmetrical against the real
axis. The reason why it is not is as follows: We have used a cable to connect
the quartz filter to the Bode 100 and therefore we measure a phase shift of
the reflected voltage (twice the shift of the cable itself). We can remove this
unwanted phase shift by using the Impedance calibration. By calibrating the
Bode 100 we move the Impedance/Reflection reference plane to the end of
the cable connected to the input of the DUT.
5.2 Impedance Calibration
Now we perform the Impedance calibration. This type of calibration is also
described in 7.4 "Calibration in the Impedance/Reflection Mode" on page 83.
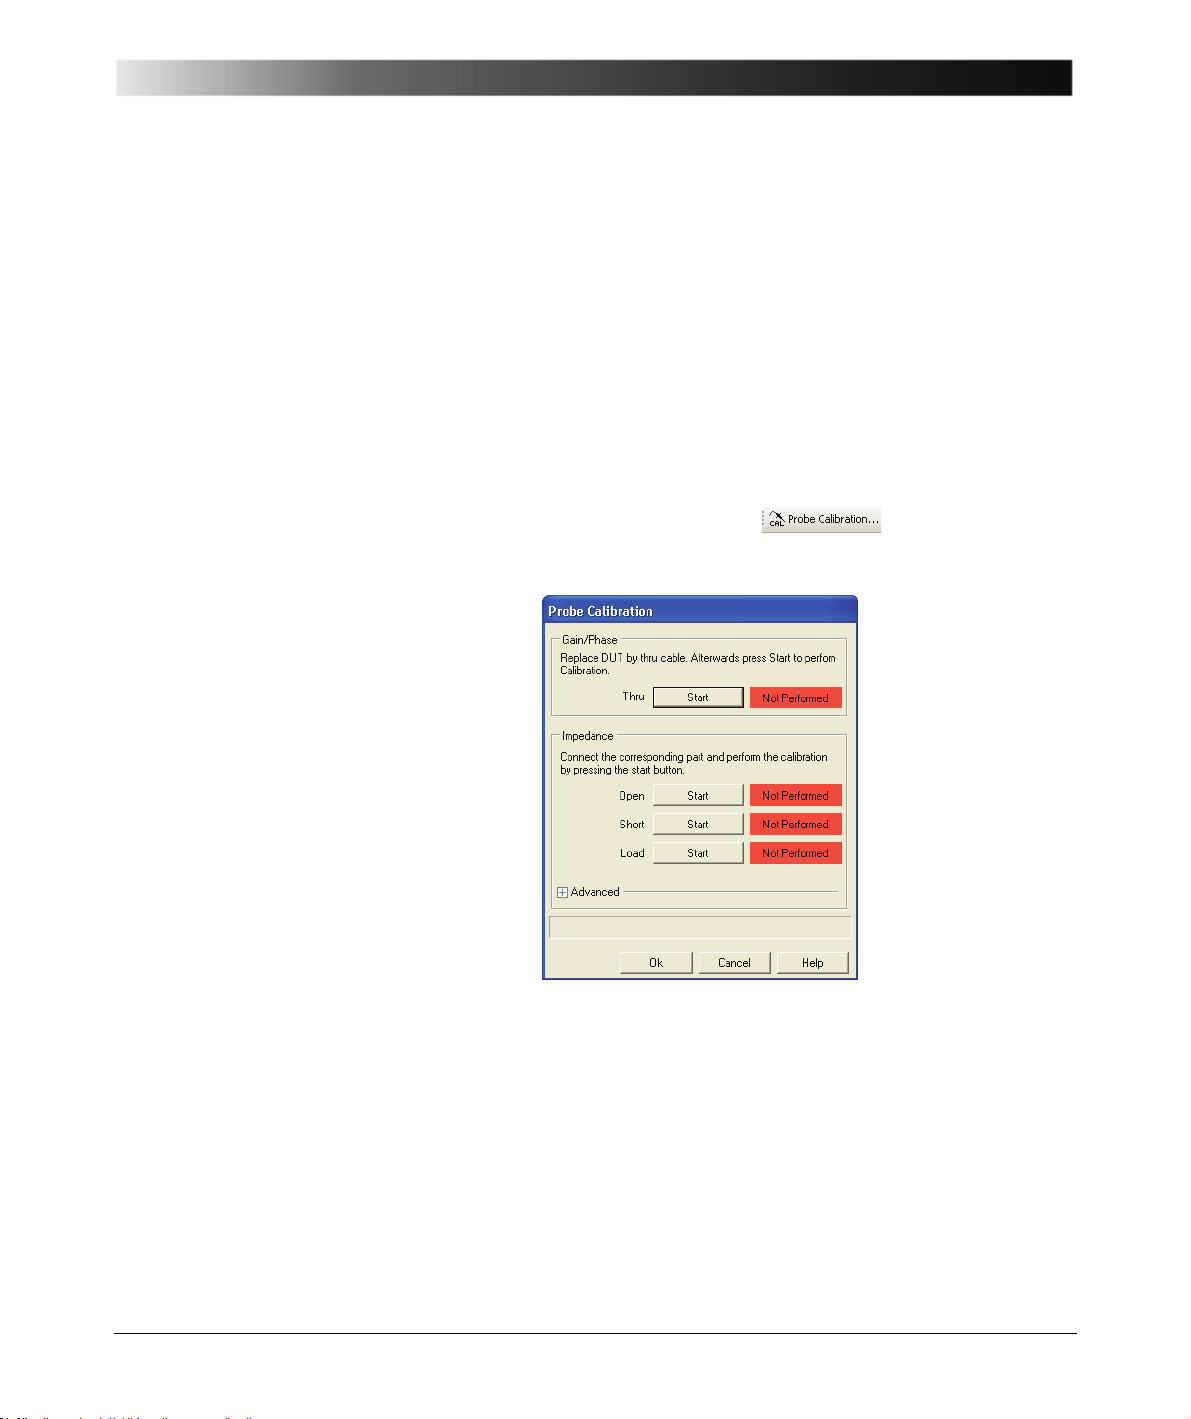
1. Click the Probe Calibration toolbar button to open the
calibration window.
Frequency Sweep Mode
57
Page 58
Bode 100 User Manual
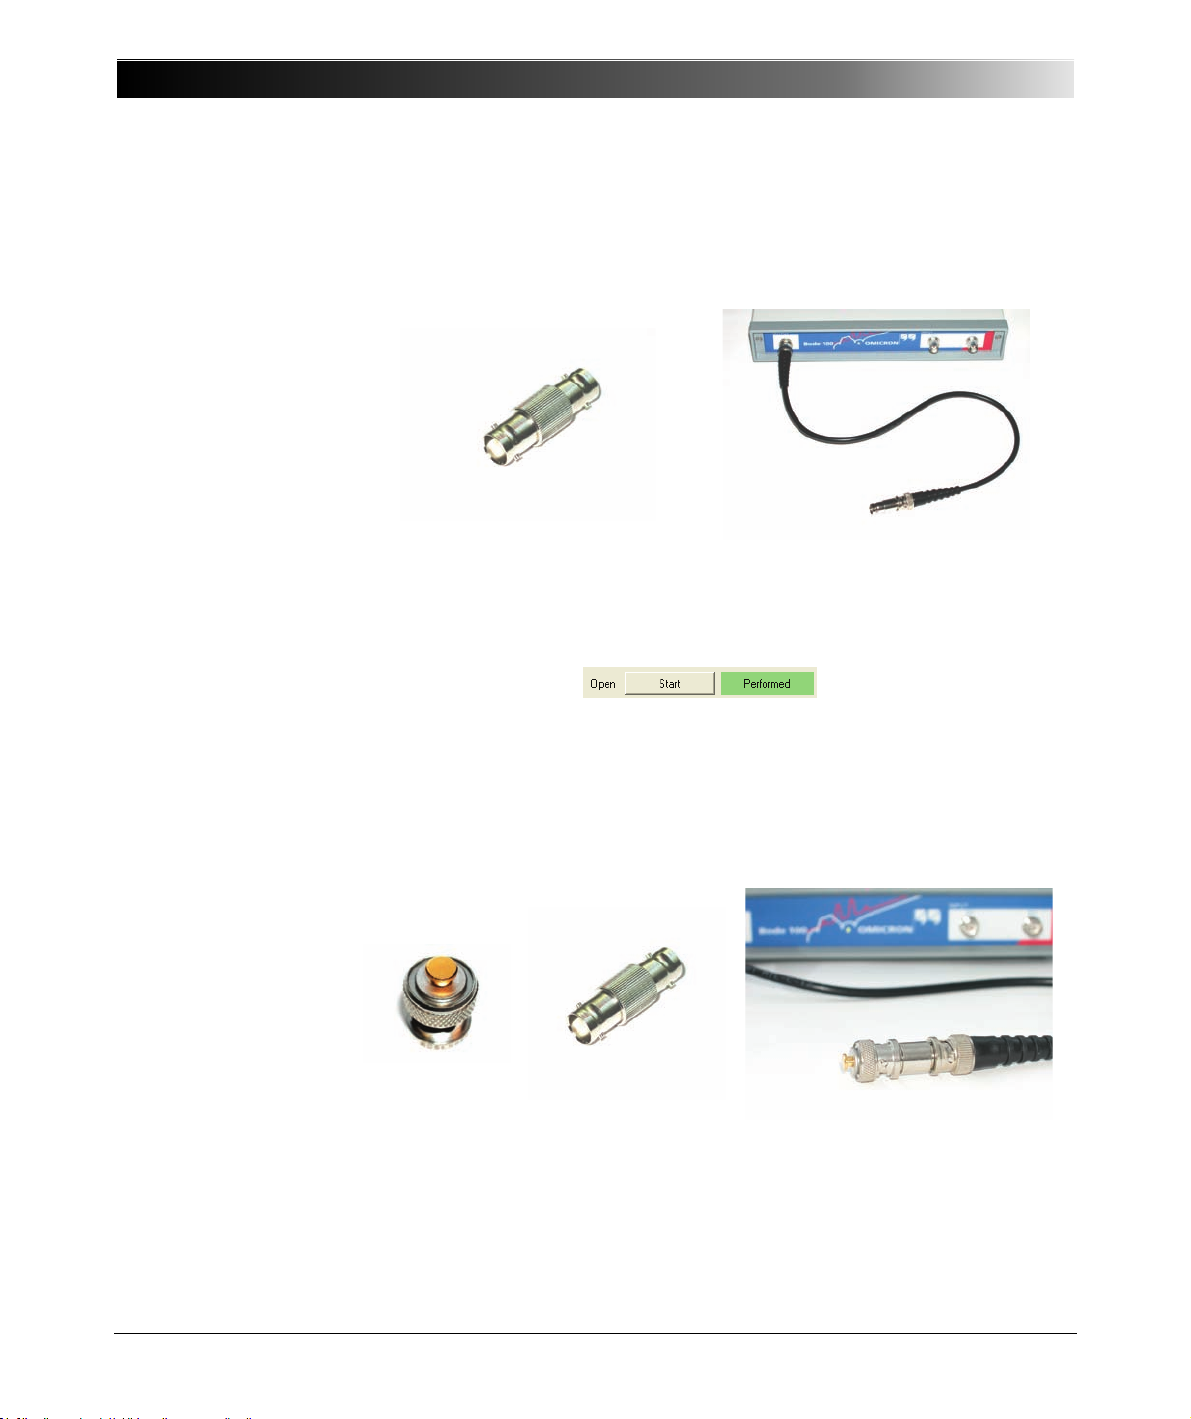
2. Connect the cable you want to use for the measurement to the OUTPUT
3. Click the Start button next to Open in the Impedance area of the calibration
connector of the Bode 100. Plug the BNC straight adapter on the other end
of the cable.
window. After the calibration has been finished, the field on the right displays
Performed on green background.
With the measurement settings the calibration may take about 35 seconds.
Hint: You can reduce the calibration time by setting fewer measurement
points, a wider receiver bandwidth, or by choosing the Probe Calibration.
4. Plug the BNC short circuit on the straight adapter connected to the cable.
58
Page 59
Frequency Sweep Mode
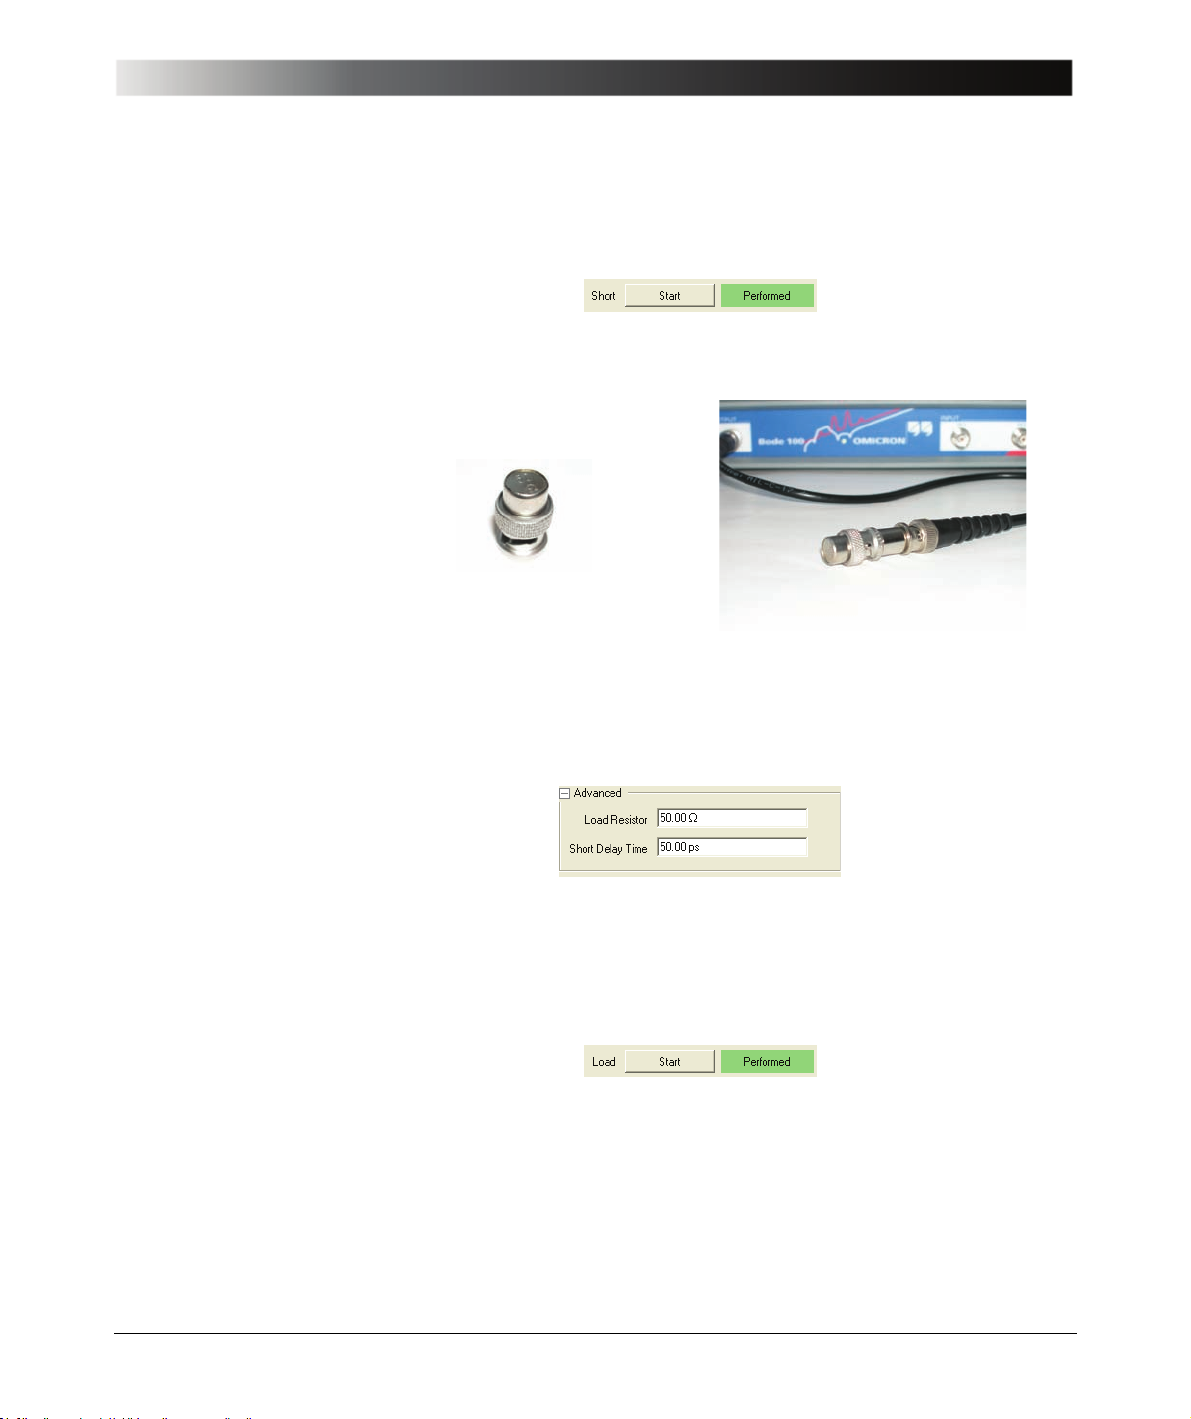
5. Click the Start button next to Short in the Impedance area of the calibration
window. After the calibration has been finished, the field on the right displays
Performed on green background.
6. Replace the BNC short circuit with the BNC 50 Ω load.
7. For very accurate measurements or if you use a load resistor different from
50 Ω, click the + symbol next to Advanced, and then enter the exact
resistance of the load resistor.
Hint: For more information on the advanced calibration settings, see
7.4 "Calibration in the Impedance/Reflection Mode" on page 83.
8. Click the Start button next to Load in the Impedance area of the calibration
window. After the calibration has been finished, the field on the right displays
Performed on green background.
59
Page 60
Bode 100 User Manual
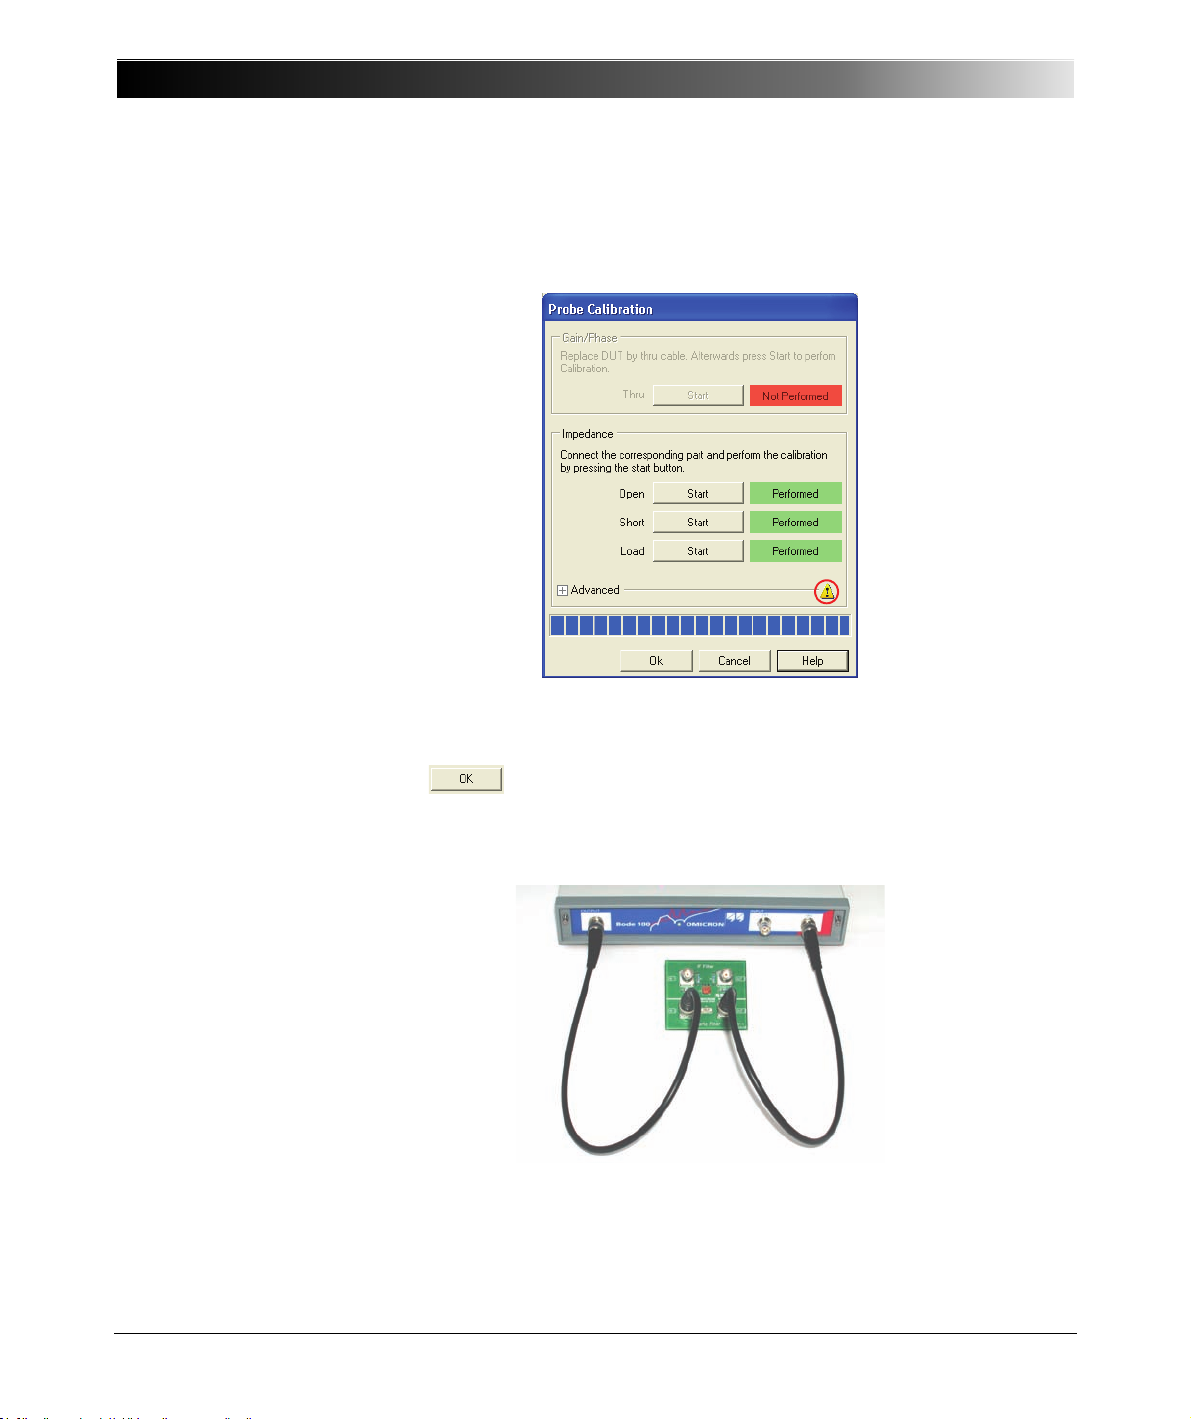
9. After the calibration has been finished, the calibration window looks like
shown below.
Hint: The warning symbol indicates that the load resistor and/or the short
delay time value differ from the factory settings.
10.Click . You have done the Impedance calibration in the
Frequency Sweep mode.
11.Reconnect the quartz filter to the Bode 100 as shown below.
60
Page 61
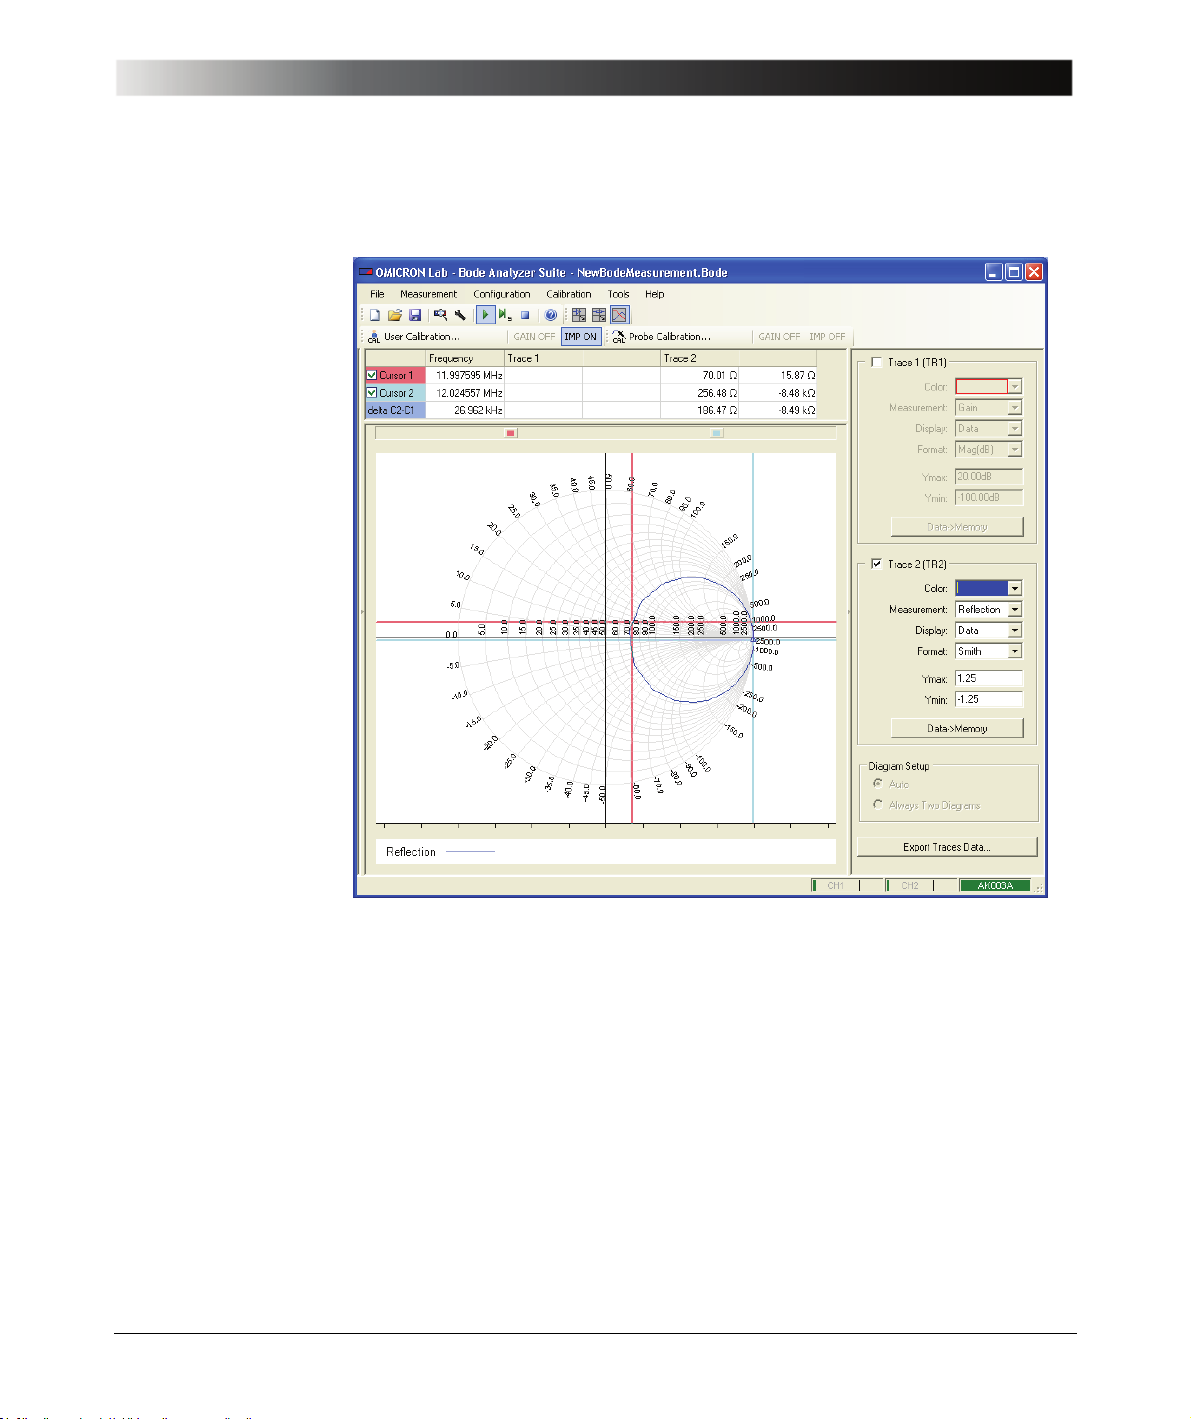
12.View the calibrated Smith chart.
Frequency Sweep Mode
13.Calculation of the series resistance at the series resonance frequency:
R
s
To calculate the series resistance of the quartz filter you need to subtract
50 Ω from the real part measured with cursor 1. The reason for this is that the
reflection measurement circuit "sees" the quartz filter in series with the 50 Ω
termination of the channel 2 input.
The Trace 2 columns of the table display the real and imaginary parts of the
measurement results at the frequencies marked by the cursors.
Result: = 70.01 Ω – 50 Ω = 20.01 Ω
R
s
Your result may slightly differ because every quartz filter and measurement
setup is different.
61
Page 62
Bode 100 User Manual
Frequency sweepers
have an easier time to
get the picture.
Congratulation! You learned h ow to u se the Frequency Sweep mode.
How to:
• Visualize measurement data in a graph
• Set configuration parameters like the input resistor and bandwidth
• Set sweep parameters like start and stop frequencies
• Use cursors to read single measurement points
• Calibrate and compensate for the cable
Go back to the Frequency Sweep mode window in 5 "Frequency Sweep Mode"
on page 43 and try things out.
62
Page 63
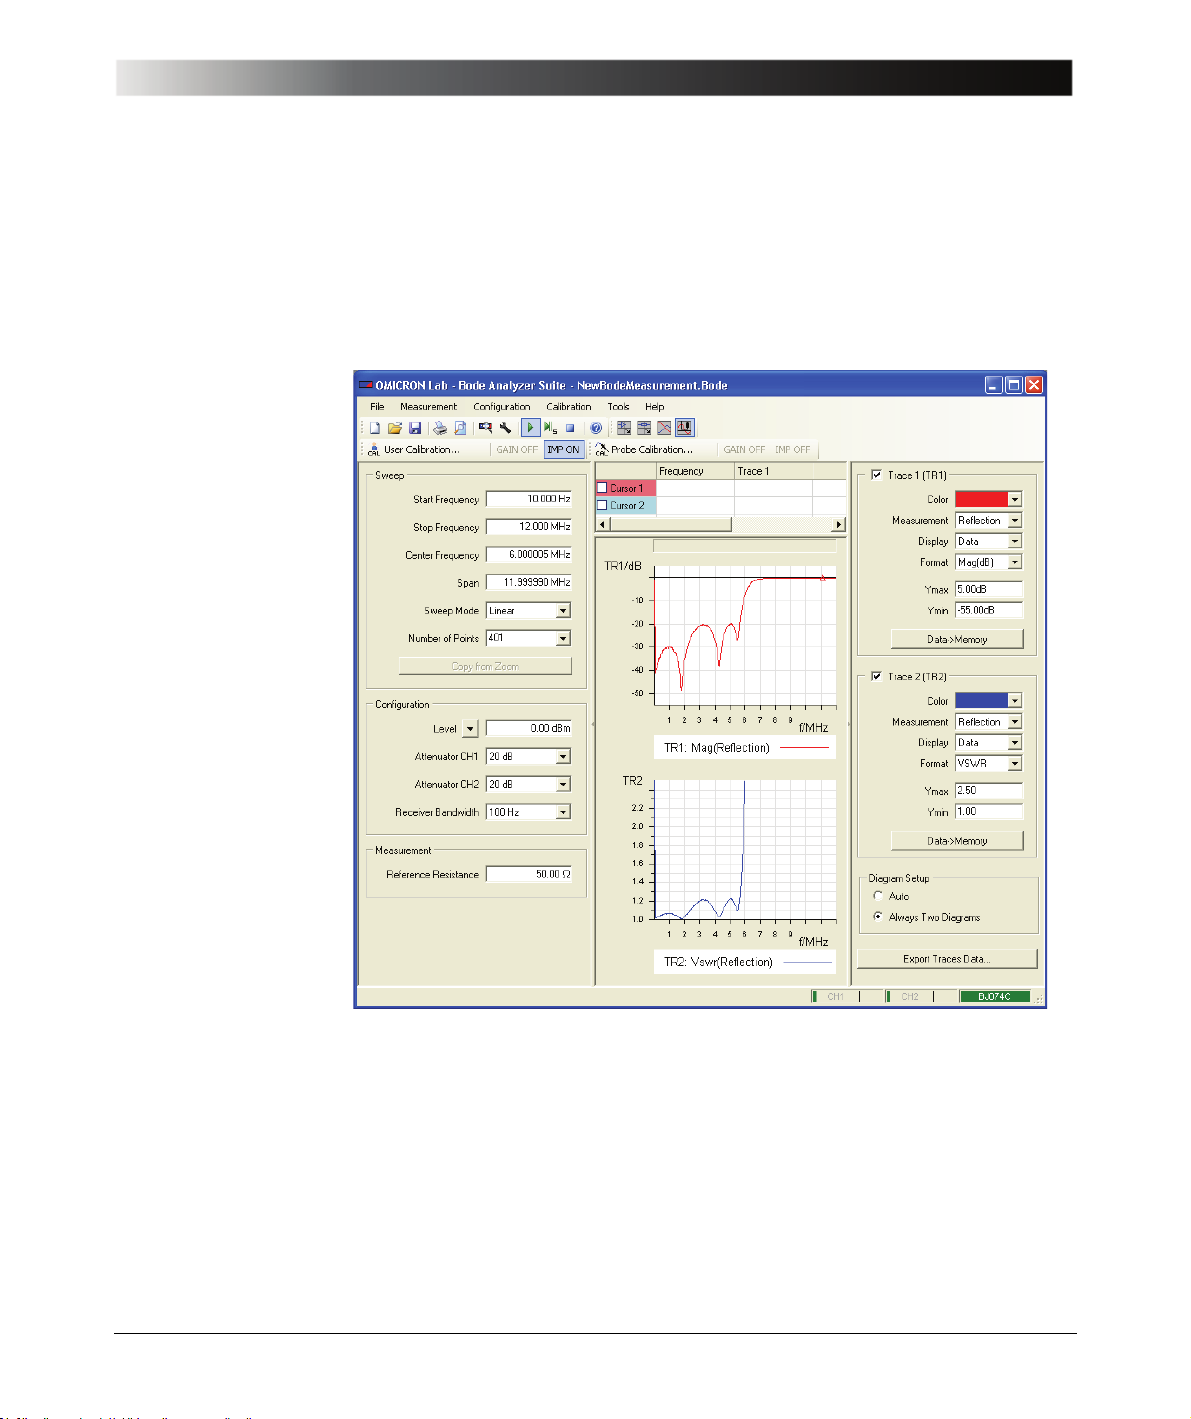
Figure 6-1:
Frequency Sweep
(External Coupler)
mode window
Frequency Sweep (External Coupler) Mode
6 Frequency Sweep (External Coupler)
Mode
Note: The window areas and screen elements in the Frequency Sweep
(External Coupler) mode are t he same as in t he Frequency Sweep mode. For
their description, see Figure 5-1: "Frequency Sweep mode window" on page 43.
63
Page 64
Bode 100 User Manual
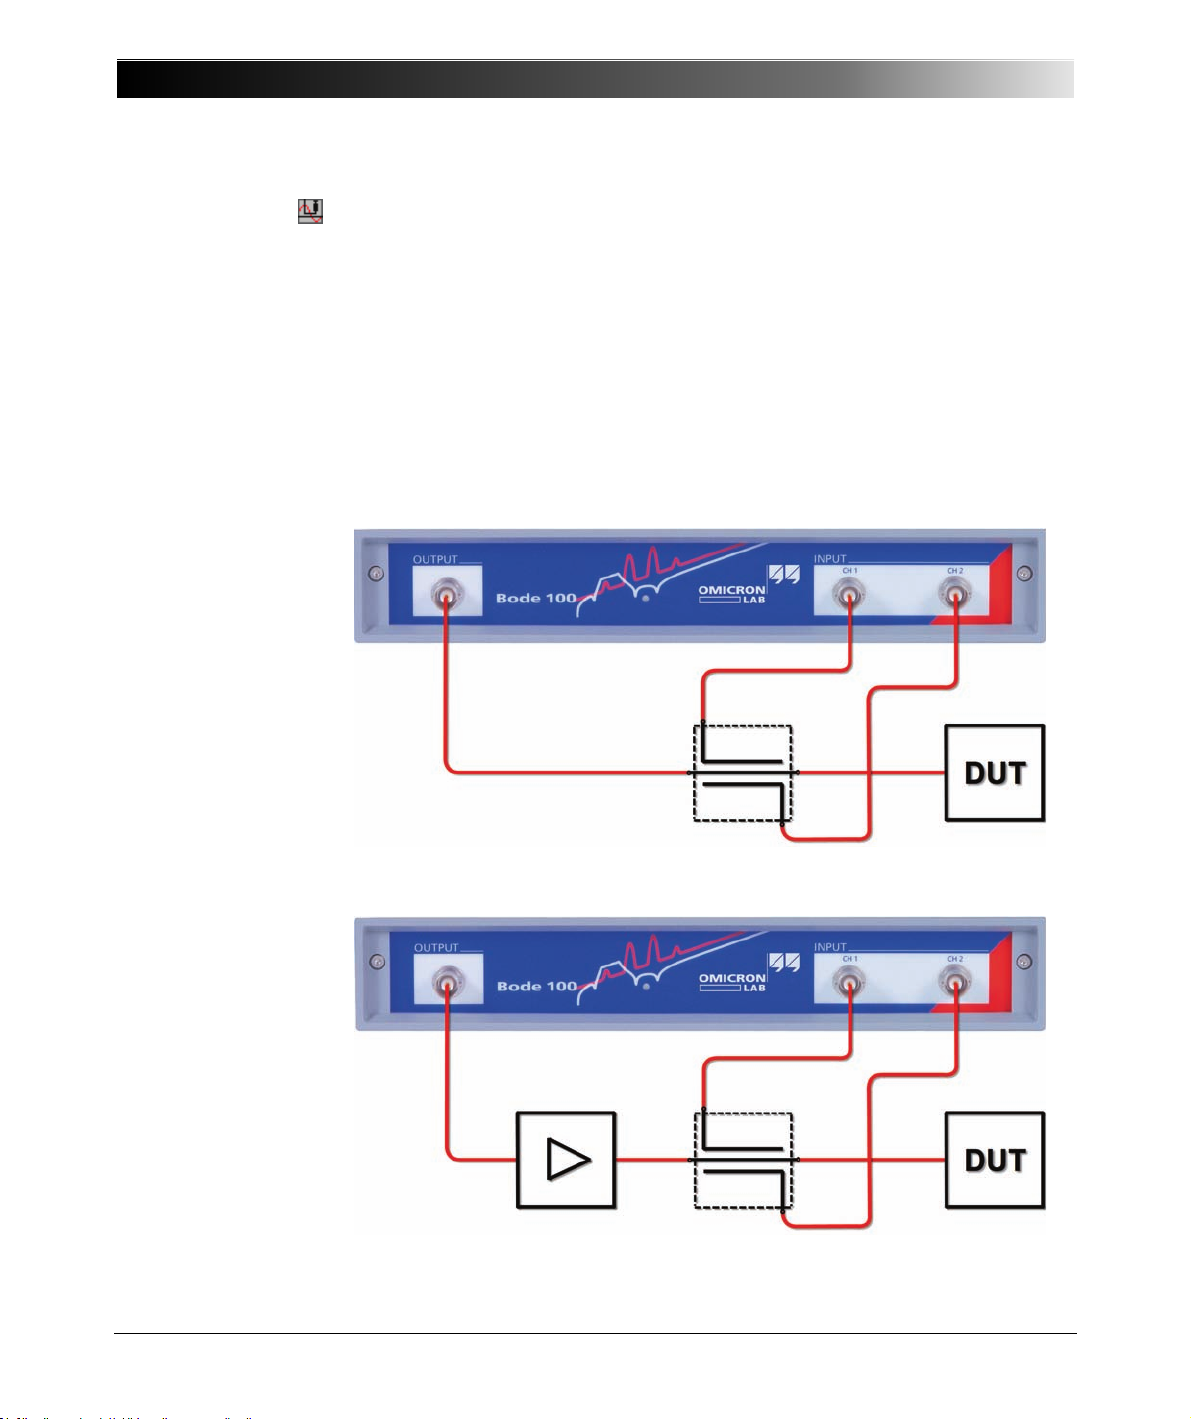
Figure 6-2:
Connecting external
coupler
In the Frequency Sweep (External Coupler) mode you can perform a
sequence of Impedance/Reflection measurements by using an external
directional coupler only or in combination with an external amplifier.
For some impedance measurement applications, it is beneficial to use external
couplers for an optimum adaptation of the Bode 100 to the test object (see
Figure 6-2: "Connecting external coupler" below). Further on, impedance
measurements on some test objects such as medium wave antenna systems
require higher signal levels than provided by the Bode 100. By using an external
coupler it is possible to utilize an external amplifier to boost the Bode 100 source
signal to the required output level (see Figure 6-3: "Connecting external coupler
and amplifier" below).
Figure 6-3:
Connecting external
coupler and amplifier
64
Page 65

Frequency Sweep (External Coupler) Mode
Hint: By using an external amplifier and an external coupler you can protect the
Bode 100 inputs from reverse power emitted by the DUT (e.g. radio waves
received by a broadcast antenna).
6.1 Example: Frequency Sweep (External Coupler) Measurement
Expected example duration: 30 minutes.
In this example you will learn step by step how to use the Frequency Sweep
(External Coupler) mode of the Bode 100.
How to:
• Connect an external coupler
• Set configuration parameters like the input resistor and bandwidth
• Calibrate and compensate the connection system
• Display reflection in VSWR format
• Display impedance in polar format
• Remove the effect of noise
Let’s examine the delivered IF filter when connected to the Bode 100 by a 50 Ω
directional coupler.
Questions:
• What is the VSWR of the IF filter within its passband?
• How does the impedance of the IF filter look in the polar format?
• What is the exact impedance and VSWR of the filter at its center frequency
of 10.7 MHz?
To find out t he answers, proceed as follows:
1. Connect the Bode 100 to the computer and start the Bode Analyzer Suite.
2. Click the Frequency Sweep (External Coupler) toolbar button to switch
to the Frequency Sweep (External Coupler) mod e.
3. Click the Device Configuration toolbar button to configure the
Frequency Sweep (External Coupler) mode.
65
Page 66
Bode 100 User Manual
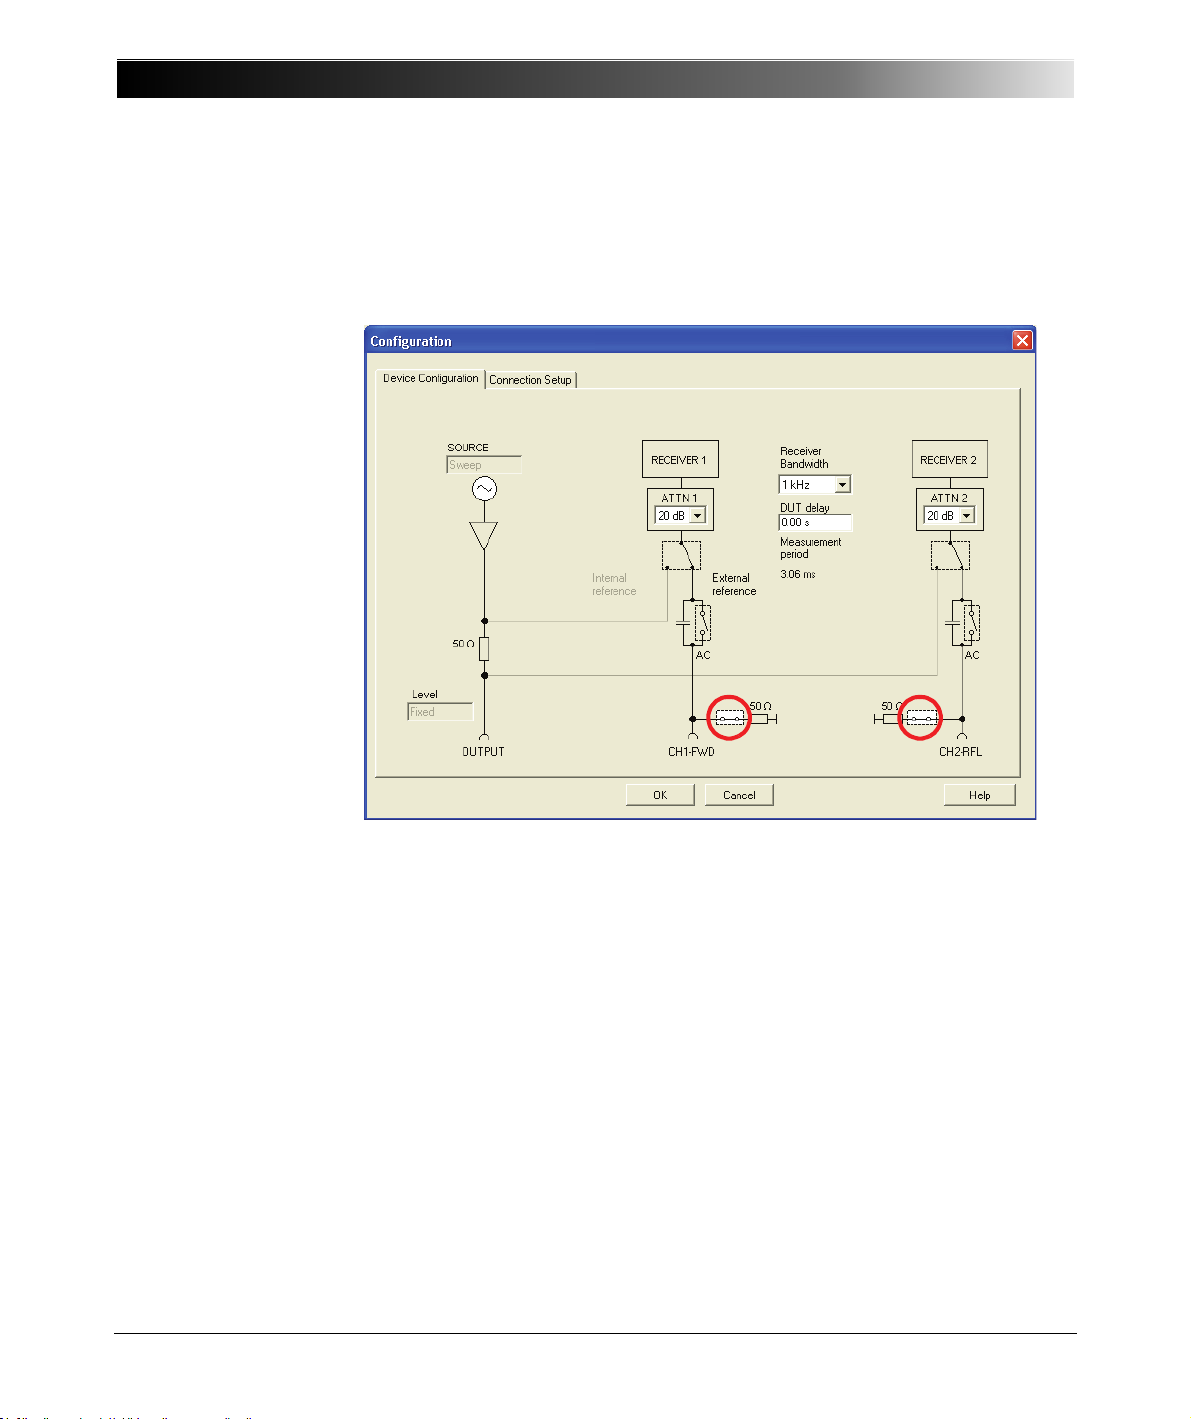
4. Set:
•CH1: 50Ω ON
•CH2: 50Ω ON
66
Hint: To match the impedance of the directional coupler, the input
resistances of the channel 1 and channel 2 are set to 50 Ω.
Page 67
Frequency Sweep (External Coupler) Mode
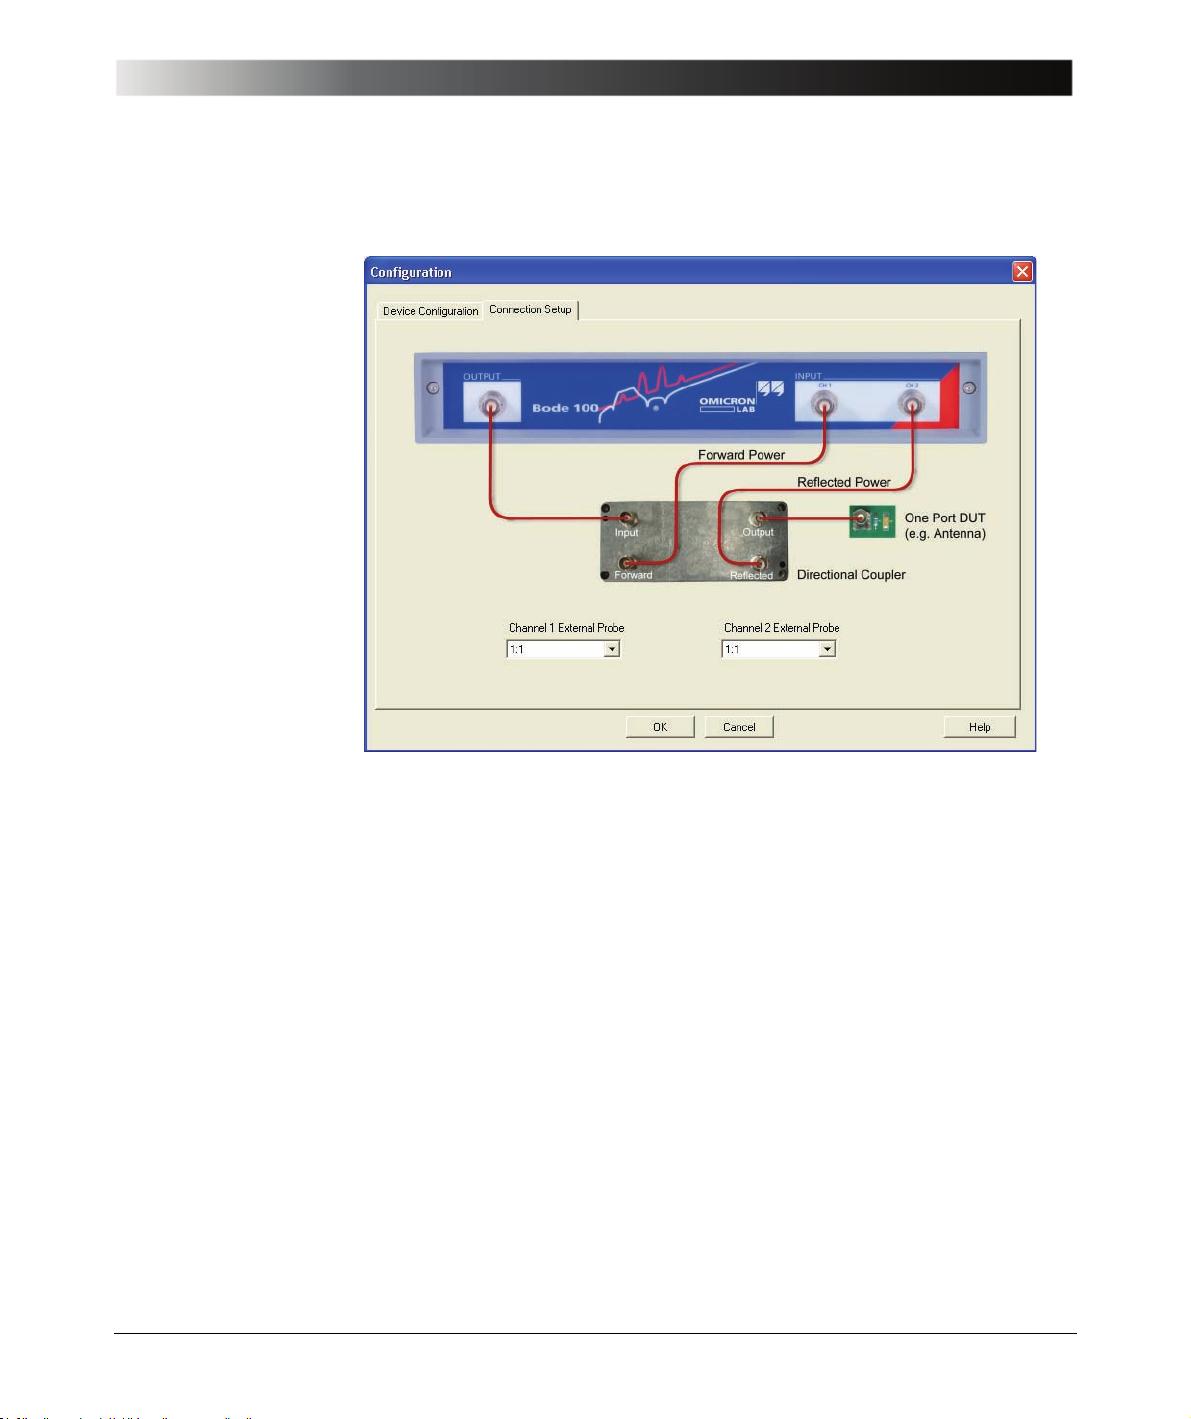
5. Click the Connection Setup tab.
The connection diagram shows how to connect the DUT as well as the
directional coupler to the Bode 100.
67
Page 68
Bode 100 User Manual
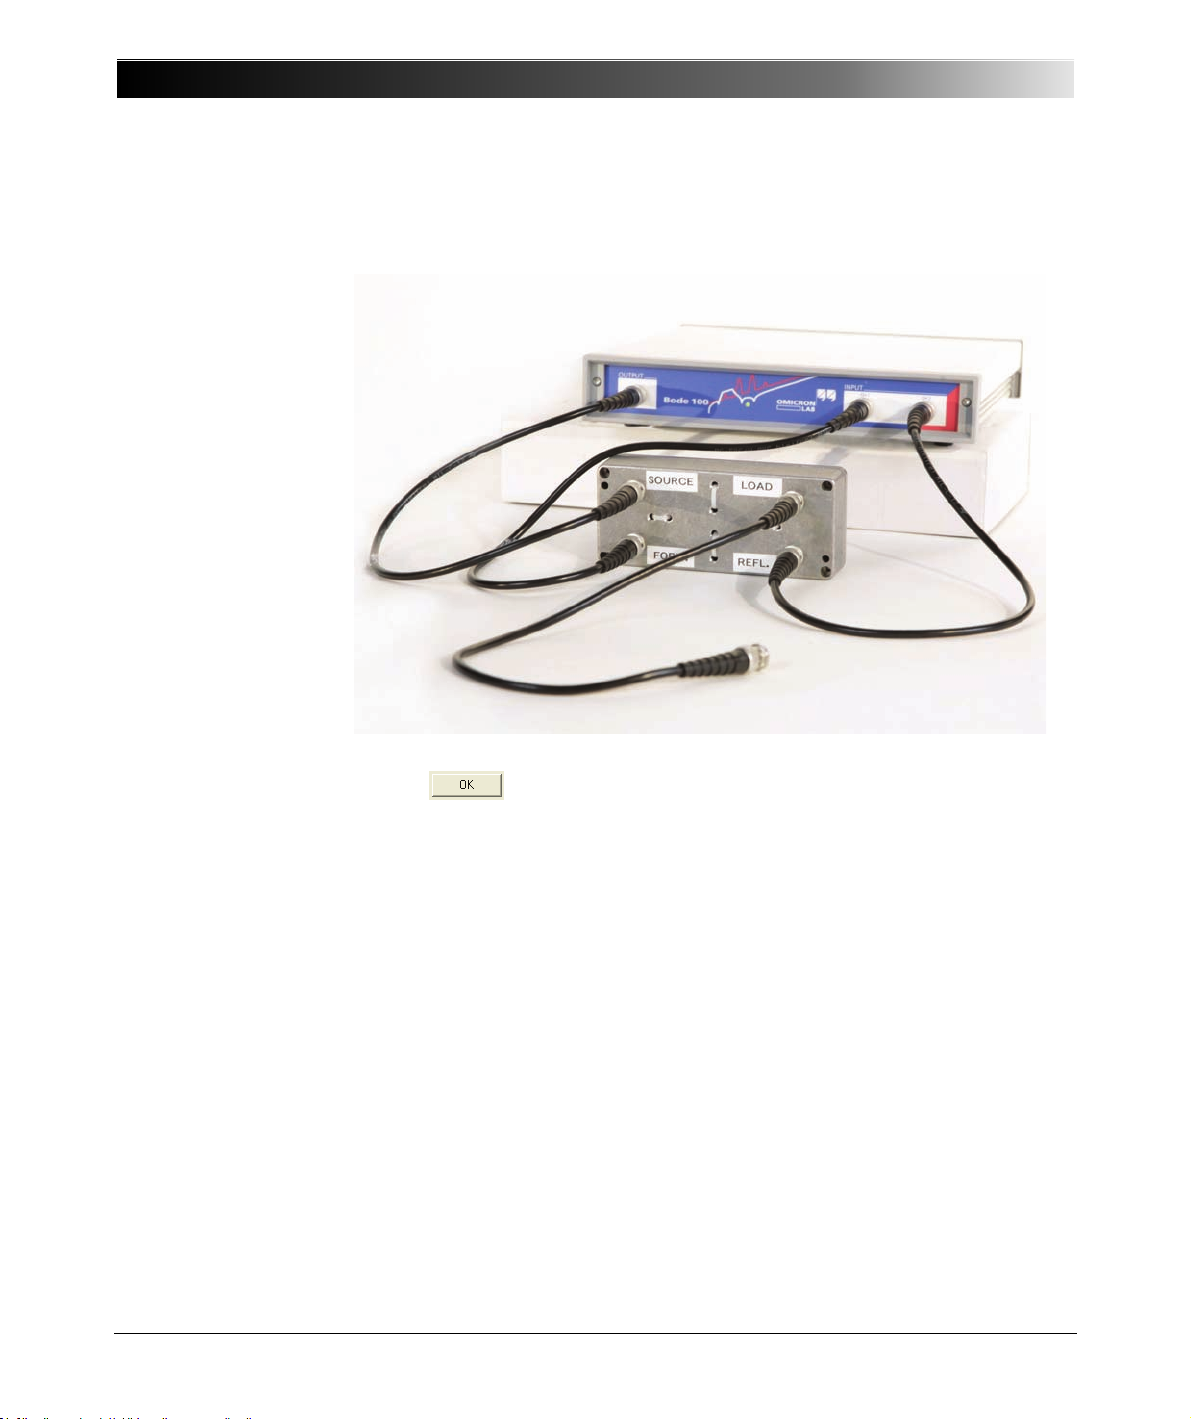
6. Connect the directional coupler to the Bode 100 as shown.
68
7. Click to close the Configuration window and to get back to the
Frequency Sweep (External Coupler) mode window.
Page 69
Frequency Sweep (External Coupler) Mode
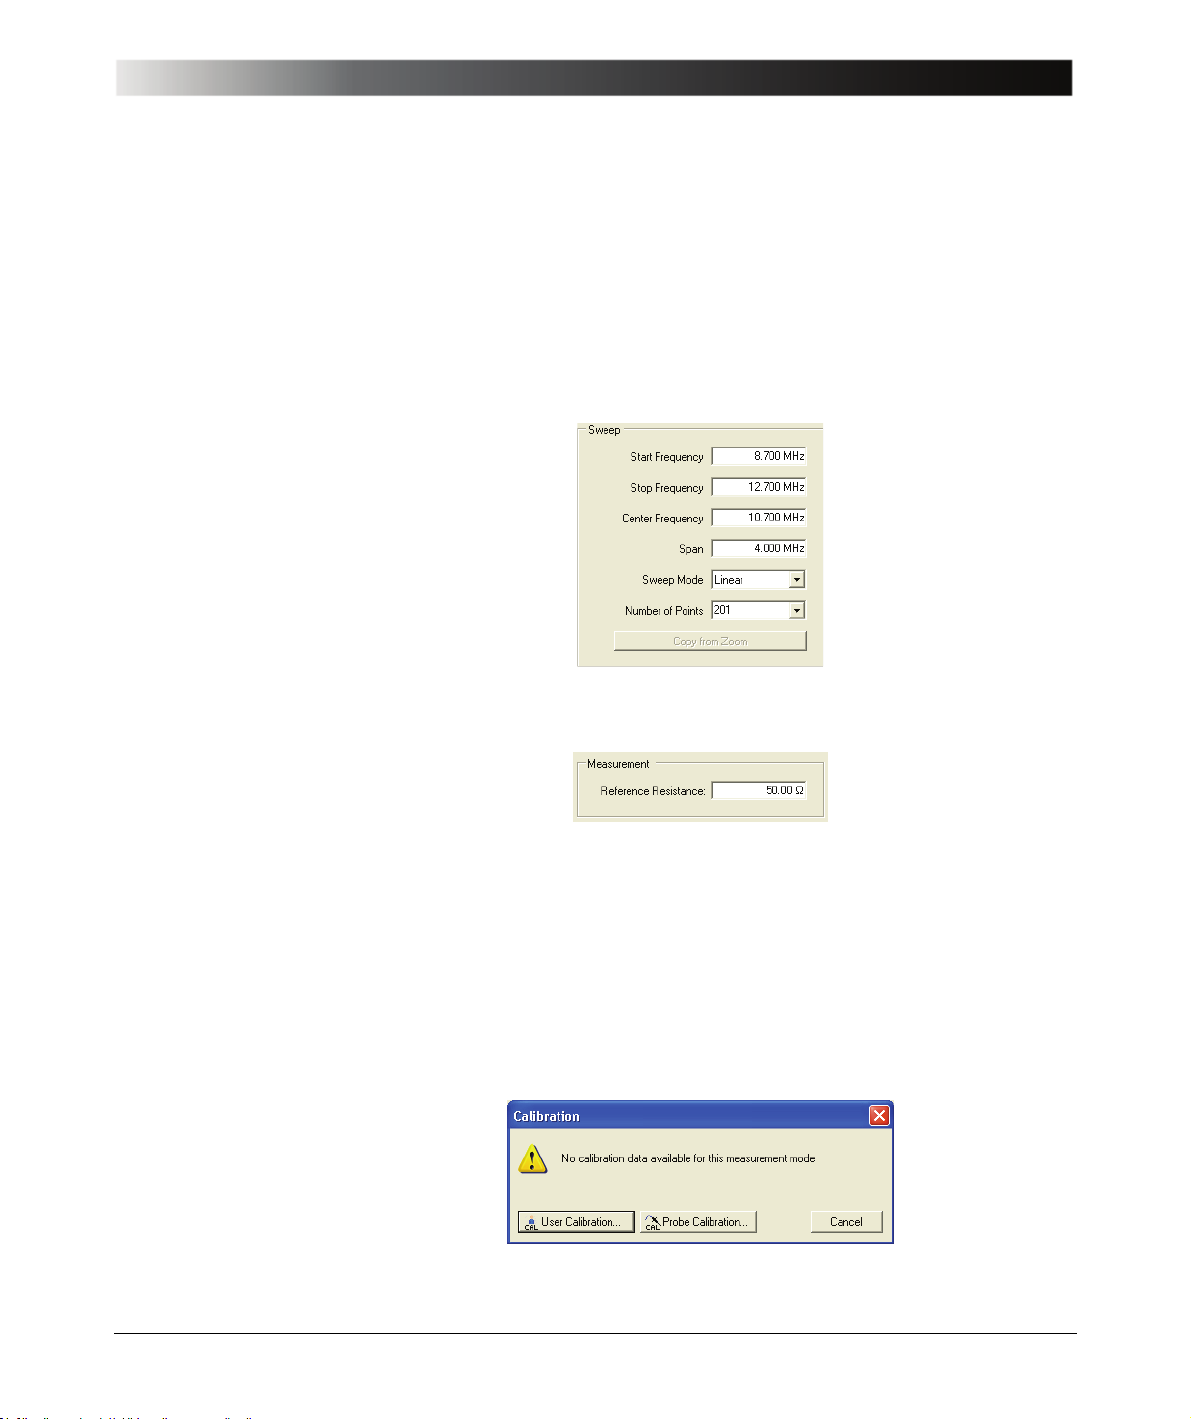
8. Set the sweep frequencies:
• Start frequency: 8.7 MHz
• Stop frequency: 12.7 MHz
• Number of points: 201
The other settings will be automatically calculated and the Sweep area of the
Frequency Sweep (External Coupler) mode window should now look like
below.
9. Set the referenc e re sistance.
Default: 50 Ω
The reference resistance is used to calculate the reflection coefficient and
the VSWR.
10.Calibrate the measurement setup as described in 7.6 "Calibration in the
Frequency Sweep (External Coupler) Mode" on page 91.
Hint: Due to the strongly varying parameters of directional couplers a
calibration is mandatory before performing a measurement. If you start a
measurement in the Frequency Sweep (External Coupler) mode with out
calibration, the following dialog box appears.
69
Page 70
Bode 100 User Manual
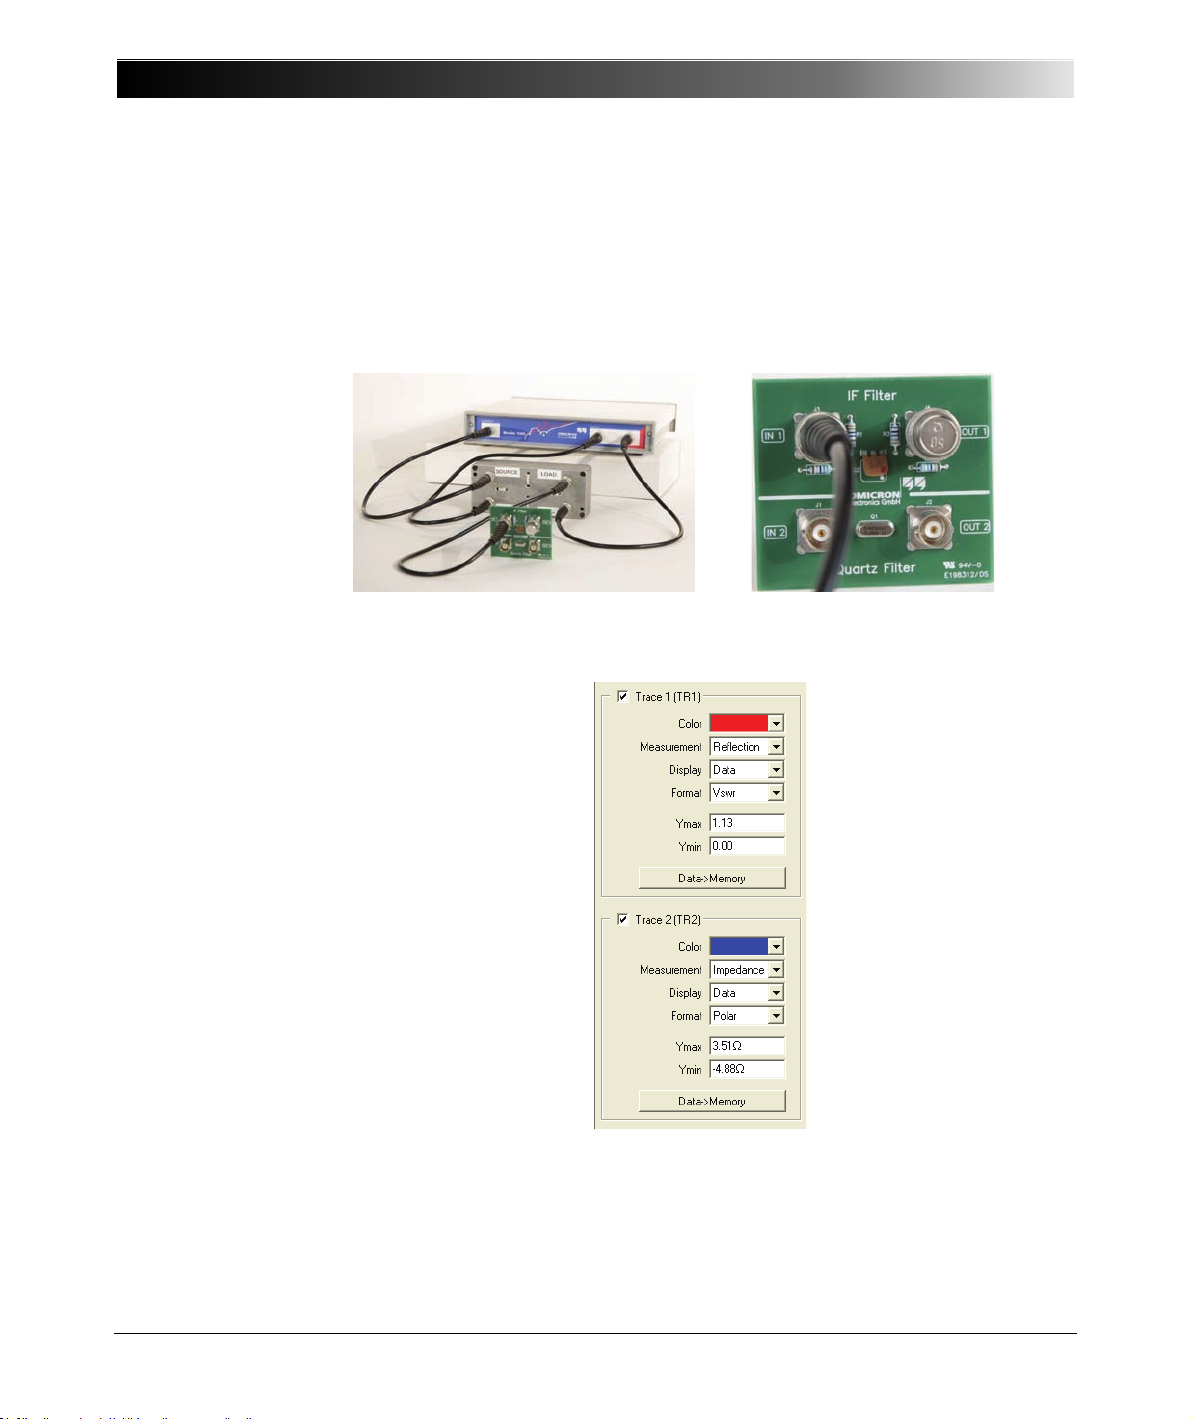
11.Connect the IF Filter to the Bode 100 and the 50 Ω load to the output of the
12.Activate both traces and set the parameters as shown below.
In this case, select the User Calibration or the Probe Cal ibration, and then
proceed as described in 7.6 "Calibration in the Frequency Sweep
(External Coupler) Mode" on page 91.
IF filter as shown below.
70
Page 71
Frequency Sweep (External Coupler) Mode
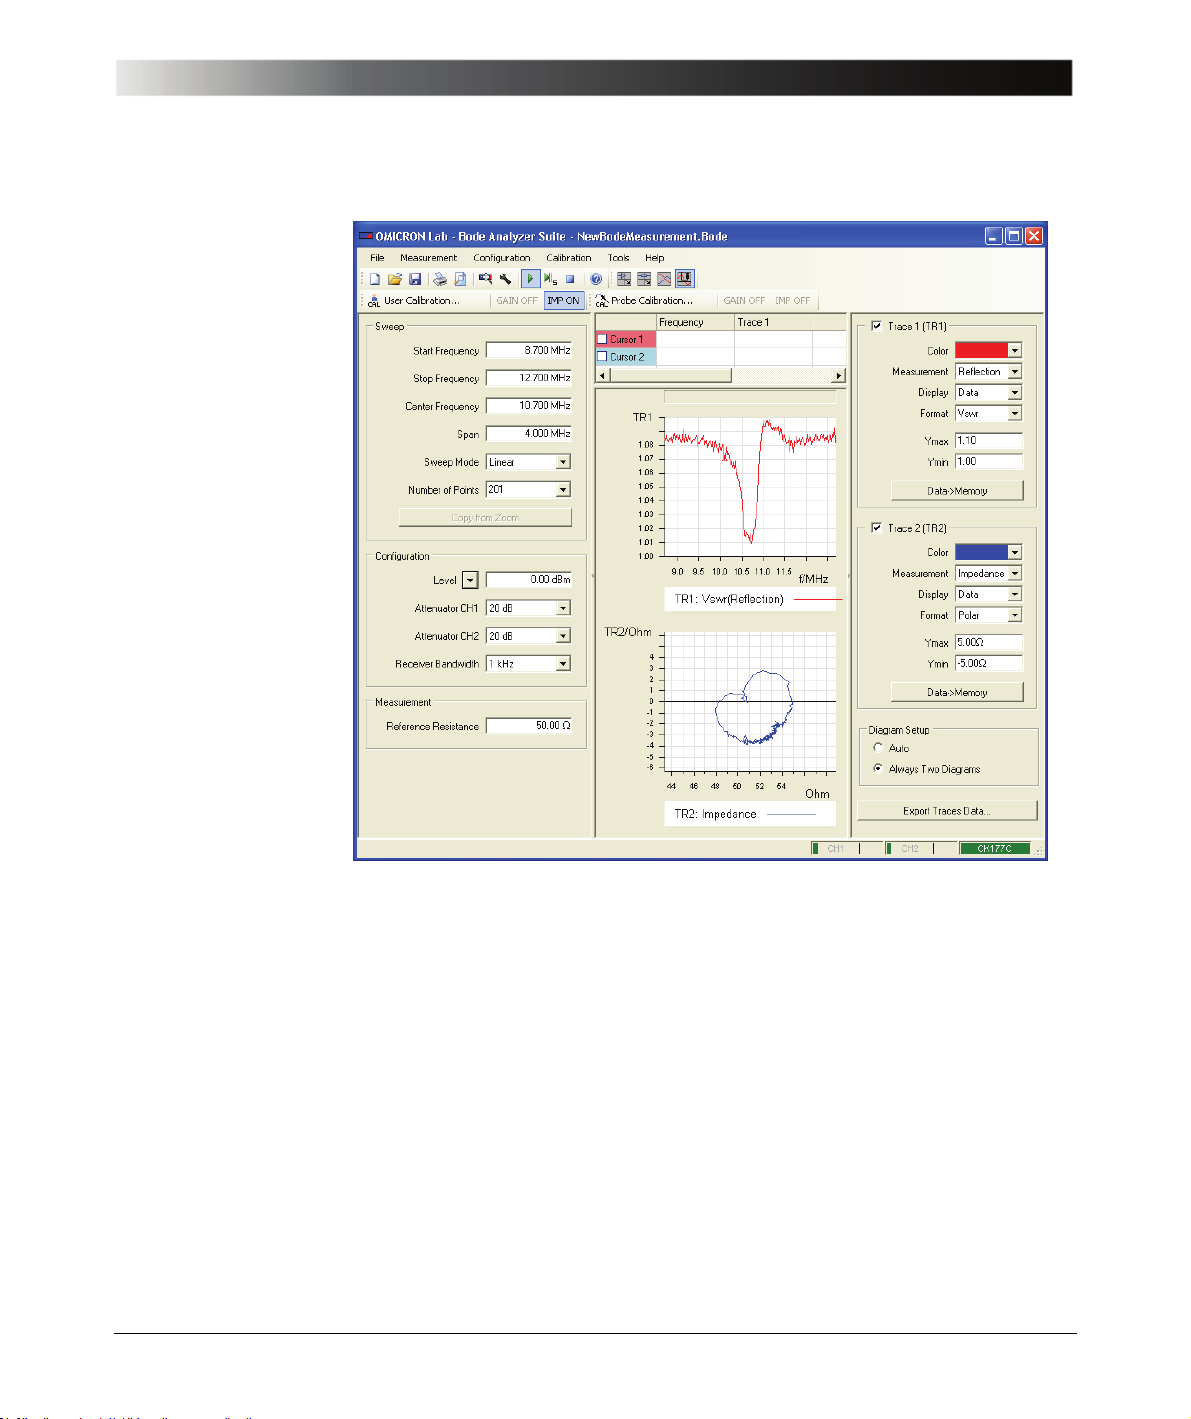
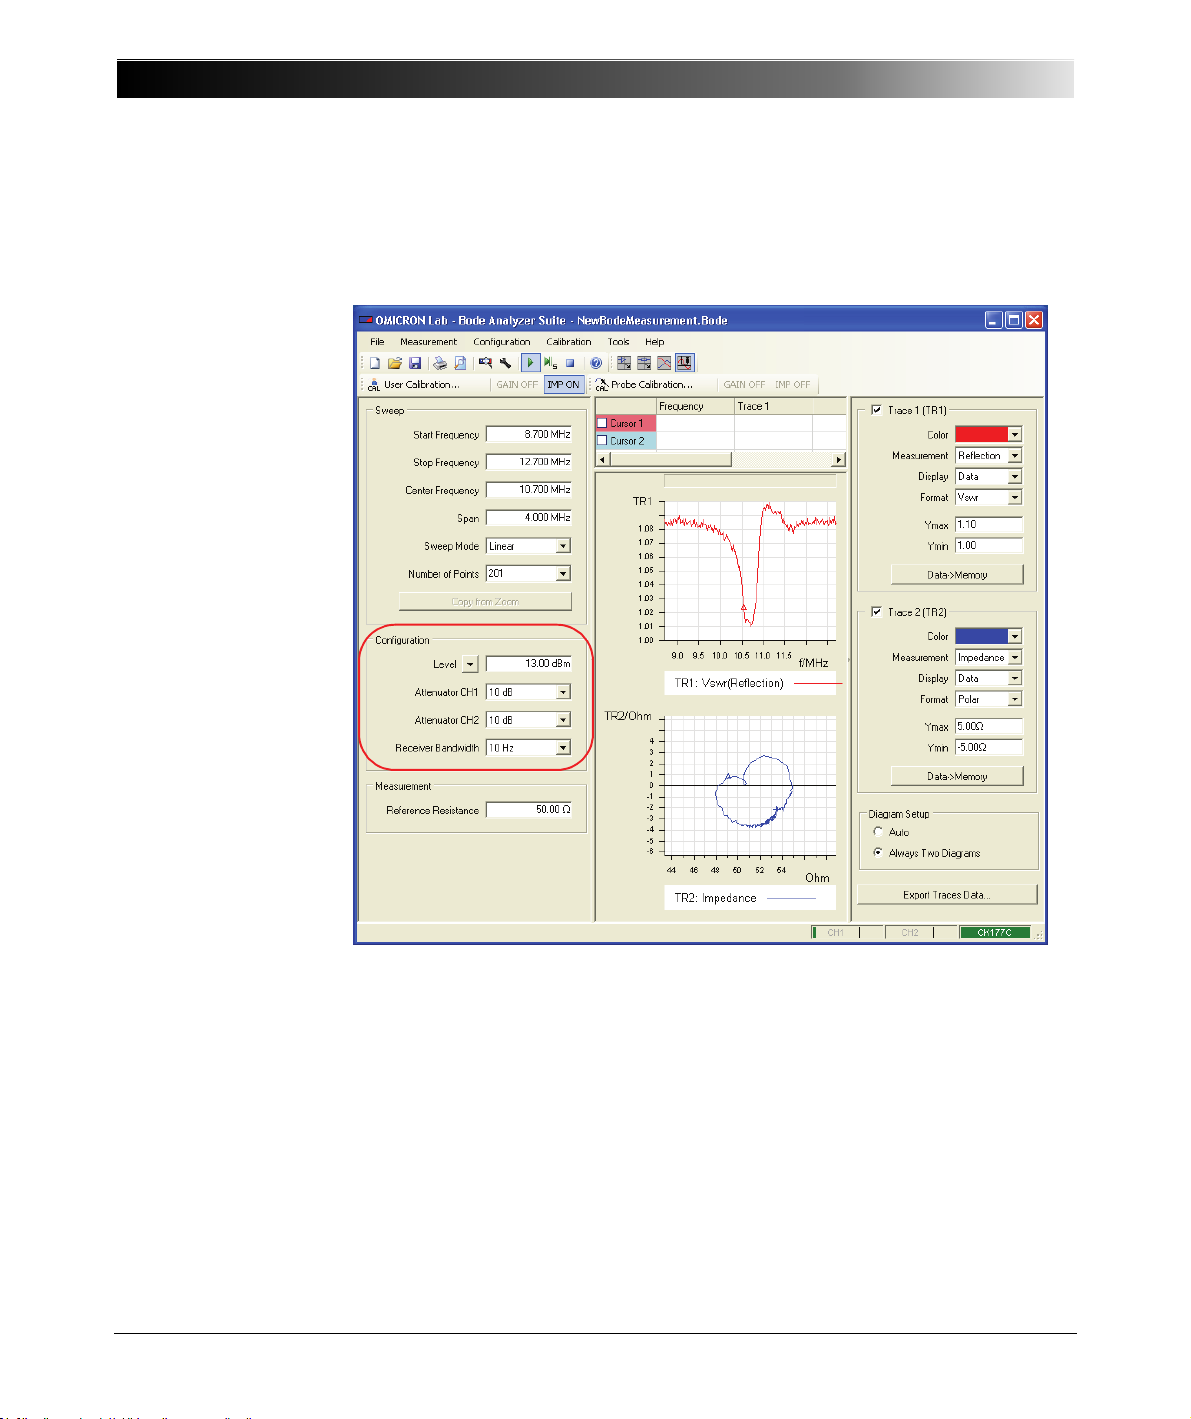
In the upper graph you see the reflection of the IF filter in VSWR format. Even
outside its passband the VSWR of the filter is quite good – this indicates that
the input impedance of the filter in the measured frequency range is very
close to 50 Ω in general. The lower graphs shows the impedance of the IF
filter in polar format, the so-called polar curve.
71
Page 72
Bode 100 User Manual
Hint: The effect of noise on the measurement results can be reduced by
narrowing the receiver bandwidth, by using less attenuation in the input
channels and by increasing the signal level of the Bode 100 source output.
72
Page 73
Frequency Sweep (External Coupler) Mode
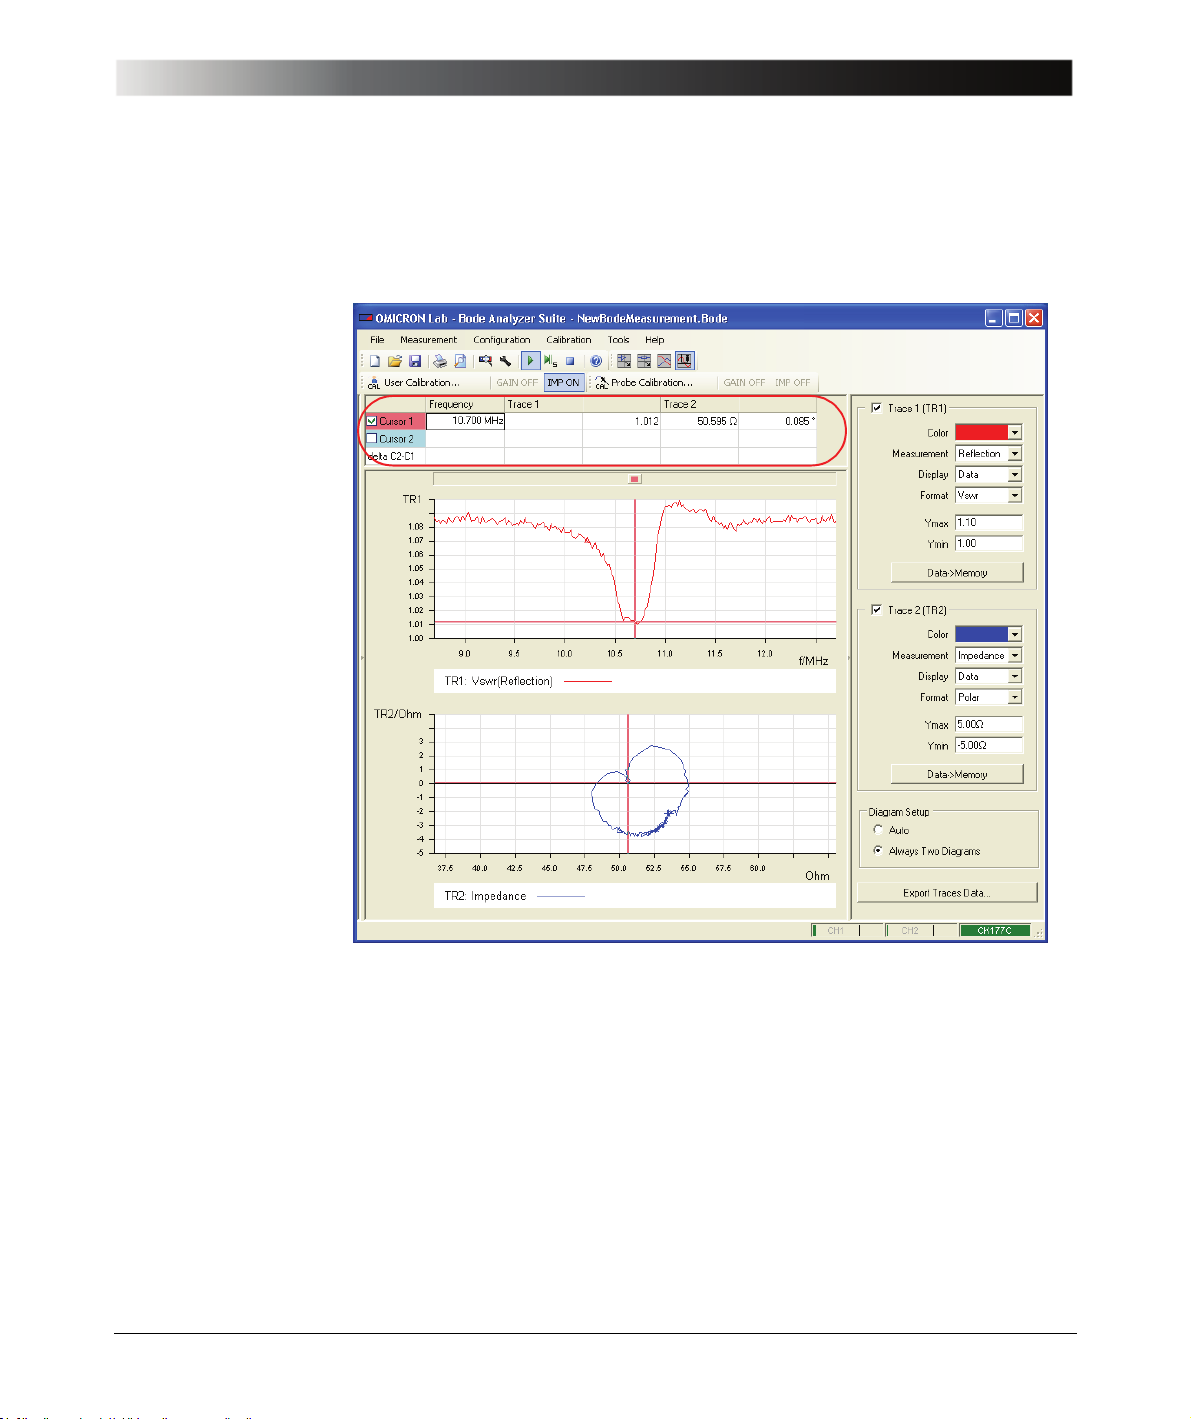
13.Select the Cursor 1 check box to activate the cursor, and then set the cursor
to the IF filter’s center frequency of 10.7 MHz by entering 10.7 MHz in the
respective box of the cursor spreadsheet.
Result: The VSWR of the IF filter at its center frequency is 1.012. The
impedance graph shows an impedance of 50.59 Ω and due to the very small
positive phase shift a nearly pure resistive behavior.
73
Page 74

Bode 100 User Manual
Sometimes external
couplers help to make a
match and to enhance
the power.
Congratulation! You learned how to use the Frequency Sweep (External Coupler)
mode.
How to:
• Connect an external coupler
• Set configuration parameters like the input resistor and bandwidth
• Calibrate and compensate the connection system
• Display reflection in VSWR format
• Display impedance in polar format
• Remove the effect of noise
Go back to the Frequency Sweep (External Coupler) window in 6 "Frequency
Sweep (External Coupler) Mode" on page 63 and try things out.
74
Page 75

7 Calibrating the Bode 100
The Bode 100 can compensate effects of the measurement setup like cables
and probes. Further on the overall accuracy may be improved by calibrating the
Bode 100 (e.g. if the operating temperature is outside the range specified in
12.5 "Environ men tal Requ ir em ents" on page 13 7) .
7.1 Calibration Methods
The Bode 100 supports two calibration methods: the Probe Calibration
optimized for measurements which require frequent changes of measurement
settings and the User Calibration for most accurate results.
Note: During startup, the Bode 100 executes an Internal Calibration algorithm.
During this calibration, internal attenuators and amplifiers are measured and
calibrated.
7.1.1 Probe Calibration
Calibrating the Bode 100
The Probe Ca libration of the Bode 100 allows you to change several
measurement parameters without the need of recalibration. During the
Probe Calibration, calibration factors are determined at factory defined
frequencies within the complete frequency range. The calibration factors for the
frequency points used by the current measurement settings are then obtained
by interpolation.
Hint: The Probe Calibration compensates effects of cables and broad-band
probes. If you want to compensate frequency selective probes or if your cable
length exceeds 10 m it is recommended to use the User Calibration (see
7.1.2 "User Calibration" on page 76).
The Probe Calibration allows changing the following parameters without the
need of recalibrating the Bode 100:
• Frequency values
• Sweep mode (linear/logarithmic)
• Number of measurement points (in the Frequency Sweep modes)
• Source level
• Attenuator 1 and attenuator 2
• Receiver bandwidth
•Zoom with & without the Copy from Zoom function
(see "Copy from Zoom" on page 107)
75
Page 76

Bode 100 User Manual
The Probe Ca libration will be switched off automatically if the following
parameters are changed:
• Reference mode (internal/external reference)
• Conversion ratio of external probes (see 9.4 "Using Probes" on page 125)
• Input resistance of channel 1 and/or channel 2 (low/high impedance)
Hint: Use the Probe Calibration if measurement parameters have to be
changed often during the measurements. You will save time because you do not
need to recalibrate the Bode 100 each time you changed the parameters.
7.1.2 User Calibration
The User Calibration is the most accurate calibration method available with the
Bode 100. The User Calibration is performed directly at the exact
measurement frequencies. In the Gain/Phase and Impedance/Reflection
measurement modes, the Bode 100 is calibrated at the source frequency. In the
Frequency Sweep modes, the calibration is performed at the exact frequencies
specified by the measurement points.
The User Calibration allows changing the following parameters without the
need of recalibrating the Bode 100:
• Source level
• Attenuator 1 and attenuator 2
• Receiver bandwidth
•Zoom without the Copy from Zoom function (see "Copy from Zoom" on
page 107)
The User Calibration will be switched off automatically if one of the following
parameters is changed:
• Frequency values
• Sweep mode (linear/logarithmic)
• Number of measurement points (in the Frequency Sweep modes)
• Reference mode (internal/external reference)
• Conversion ratio of external probes (see 9.4 "Using Probes" on page 125)
• Input resistance of channel 1 and/or channel 2 (low/high impedance)
•Zoom with the Copy from Zoom function (see "Copy from Zoom" on
page 107)
76
Page 77
7.1.3 Hierarchy of Calibration Methods
Table 7-1:
Calibration methods
Calibrating the Bode 100
Hint: Use the User Calibration for the highest accuracy of measurement
results or if you want to compensate for highly frequency selective components
in your measurement setup such as narrow-band measurement probes.
The following table gives an overview of the Bode 100 calibration methods.
Measurement Mode User Calibration Probe Calibration
Gain/Phase Calibrates at only one
frequency
(measurement frequency)
Impedance/Reflection
Frequency Sweep Calibrates at the exact
frequency points used for
the sweep
Frequency Sweep
(External Coupler)
Calibrates the complete
frequency range.
Calibration factor for the
measurement frequency
is calculated by linear
interpolation.
Calibrates the complete
frequency range.
Calibration factors for the
measurement frequencies
are calculated by linear
interpolation.
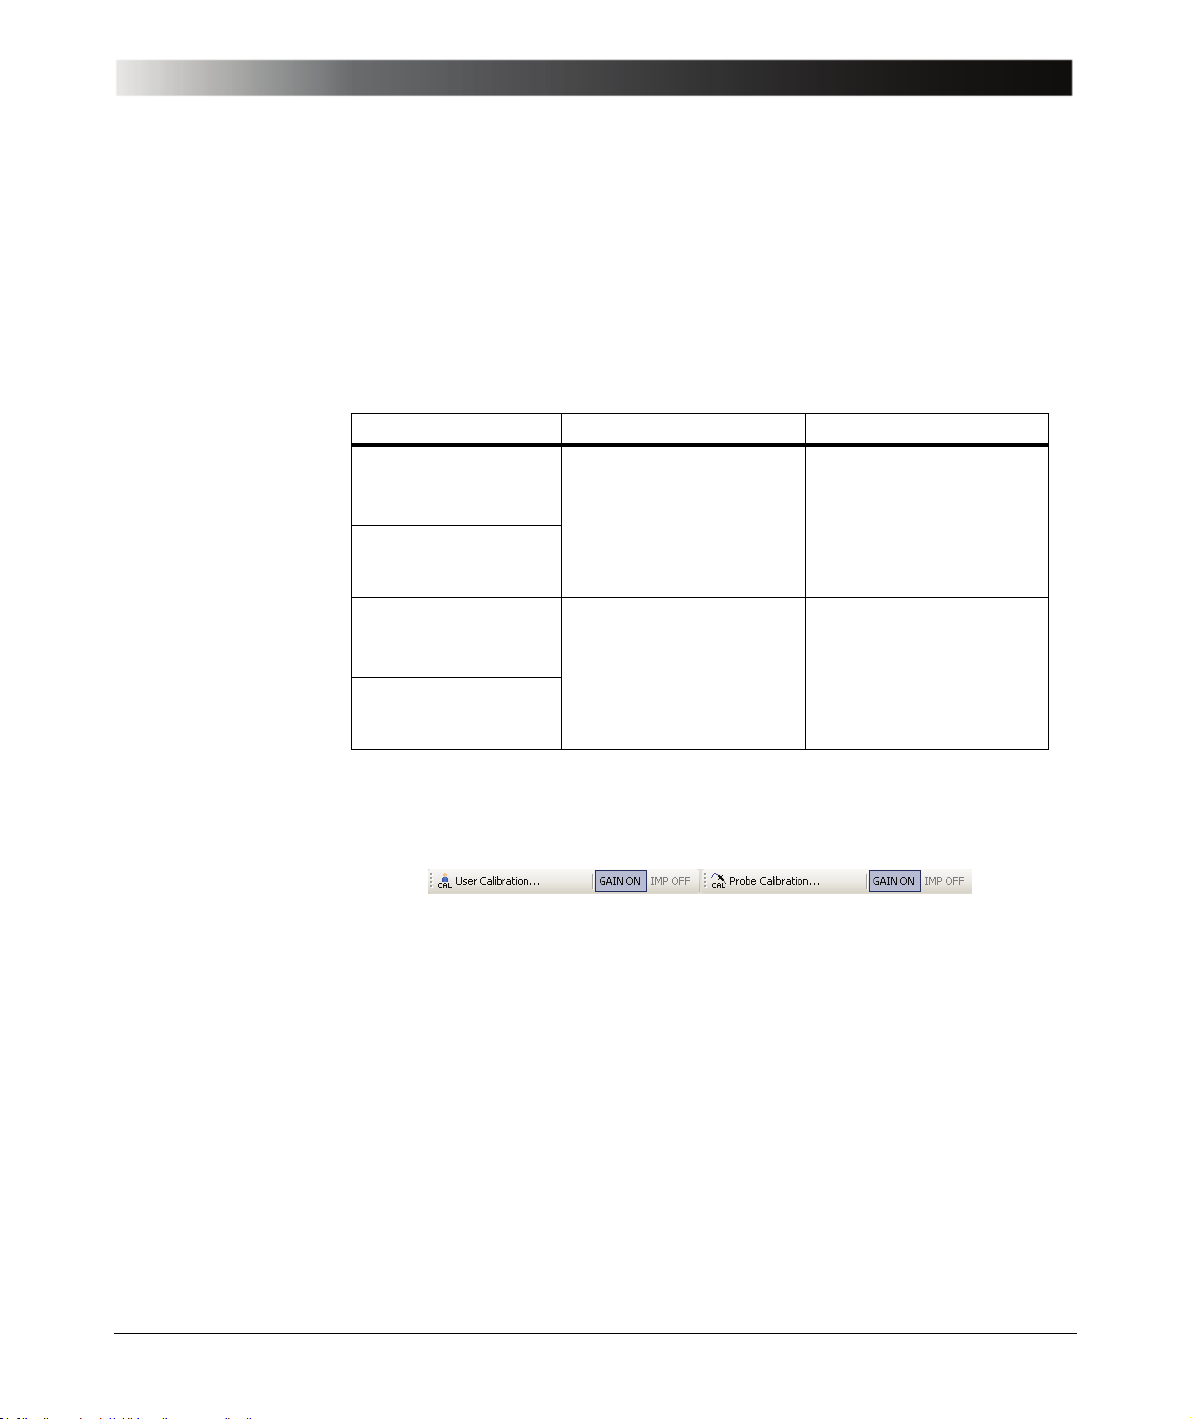
Figure 7-1:
Activating
User Calibration and
Probe Calibration
7.2 Calibration in the Gain/Phase Mode
You can activate the User Calibration and the Probe Calibration at the same
time as shown below.
If both the User Calibration and the Probe Calibration are activated, the more
accurate User Calibration is used. If measurement parameters are changed
and the User Calibration becomes void the Bode 100 switches automatically to
the Probe Calibration; the User Calibration remains switched off until the
Bode 100 is recalibrated.
(Internal Reference Connection)
For calibrat ing the Bode 100 in the Gain/Phase mode you find a practical
example in 3.3 "Example: Gain/Phase Measurement" on page 24.
Note: The Probe Calibration is performed in the same way as the
User Calibration.
77
Page 78
Bode 100 User Manual
7.3 Calibration in the Gain/Phase Mode
(External Reference Connection – CH1)
To compensate for the cable and connection setup effects in the Gain/Phase
mode, proceed as follows:
1. Connect the Bode 100 and start the Bode Analyzer Suite.
Select the Gain/Phase mode.
78
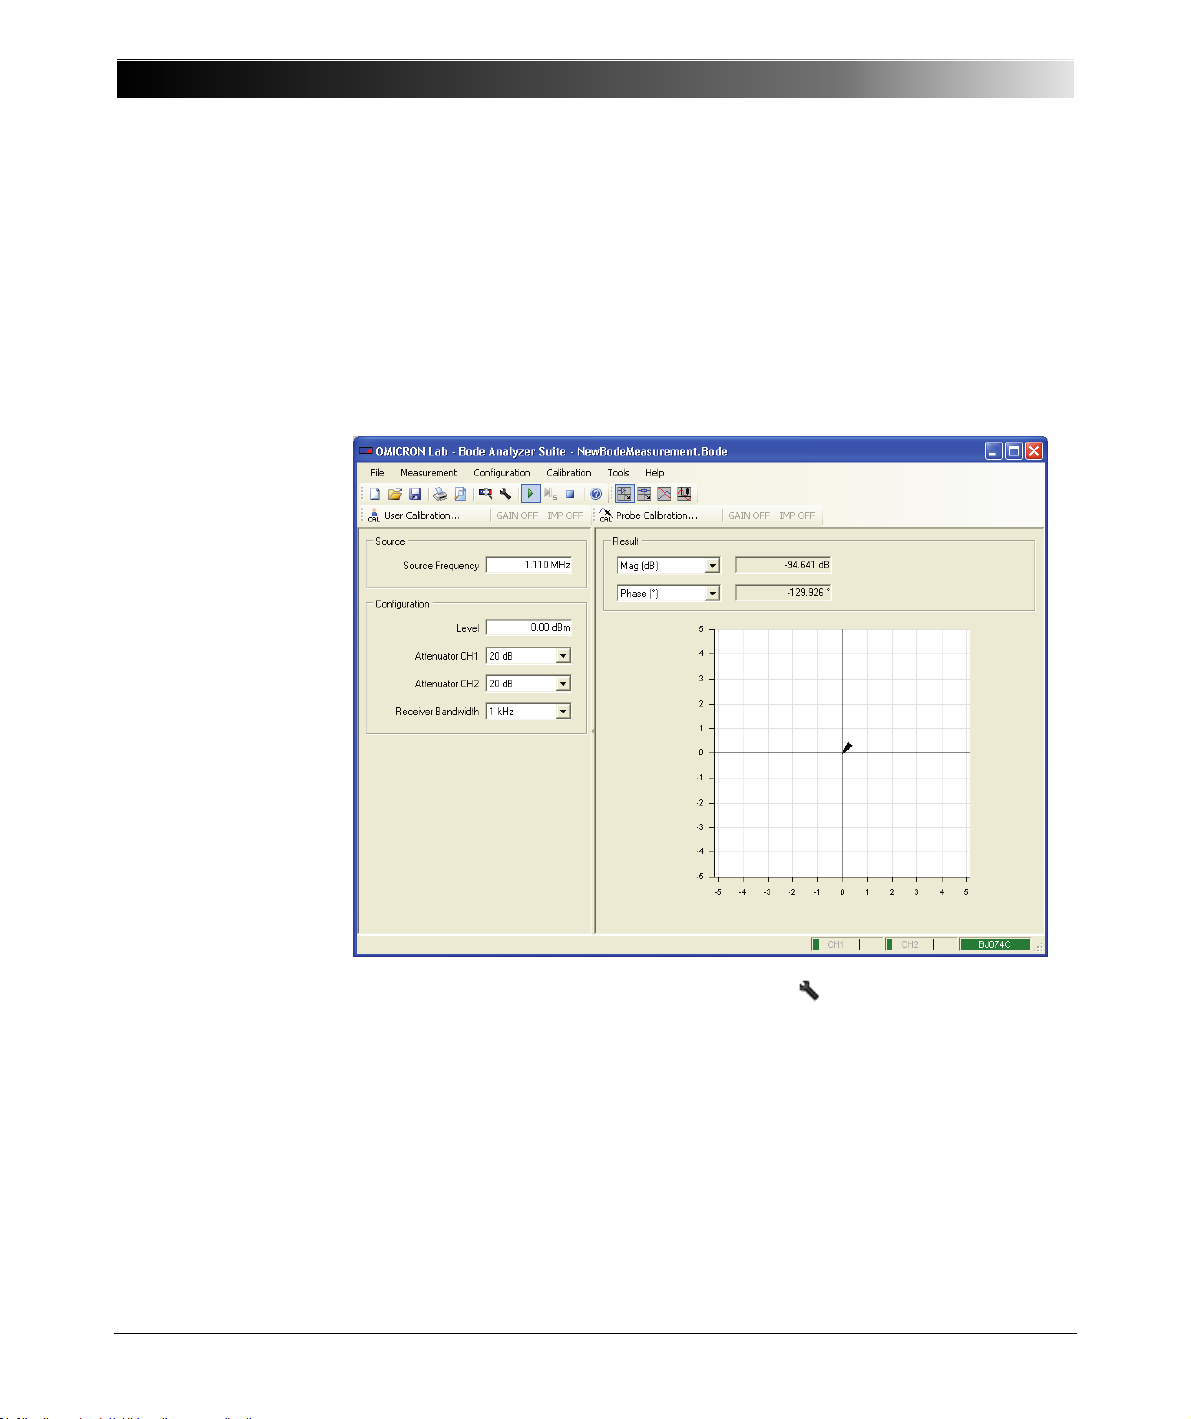
2. Click the Device Configuration toolbar button to open the
Configuration window.
In the Configuration window, set the parameters for your measurement. In
our example we have chosen the following settings.
Page 79
Calibrating the Bode 100
3. Set:
• External reference CH1 (Click the switch symbol .)
• CH1 and CH2: 50 Ω (Click the switch symbols.)
• SOURCE: 10.7 MHz
• Receiver bandwidth: 10 Hz
• ATTN 1: 20 dB
• ATTN 2: 20 dB
• Level: 0 dBm
79
Page 80
Bode 100 User Manual
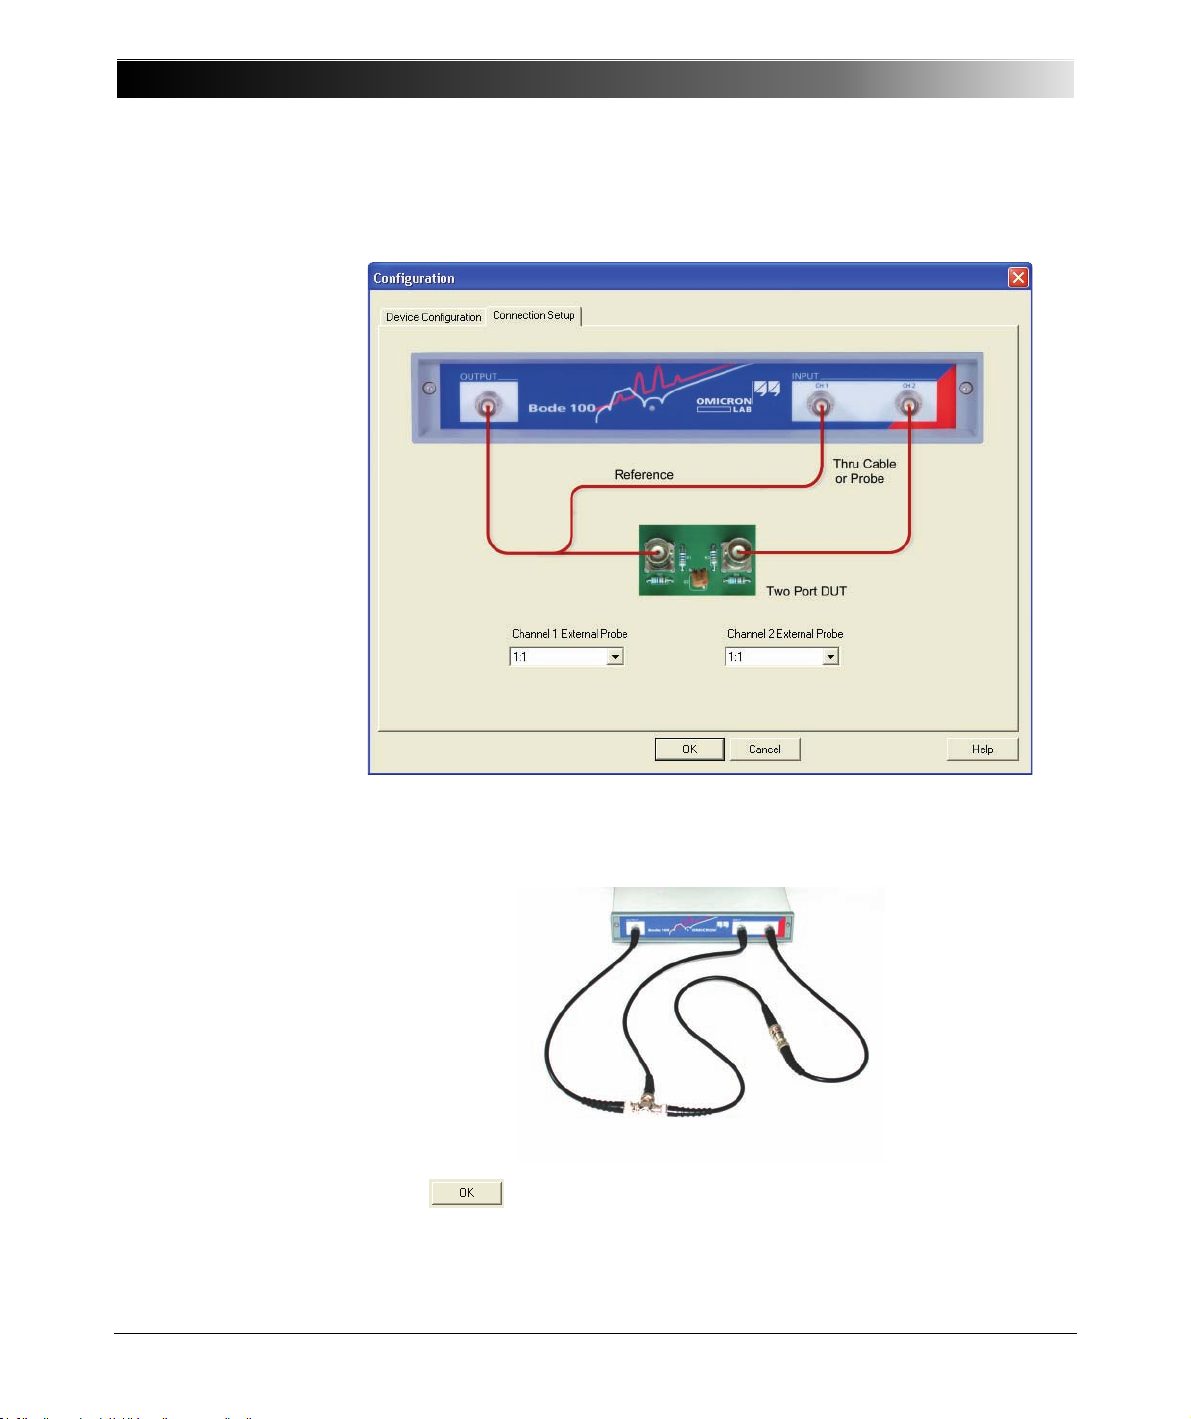
4. Click the Connection Setup tab.
80
The connection diagram shows how to connect the DUT to the Bode 100.
5. Connect the cables you want to use for the measurement as shown below.
6. Click to close the Configuration window.
7. Choose either the Probe Calibration or the User Calibration and click the
respective toolbar button.
Page 81
Calibrating the Bode 100
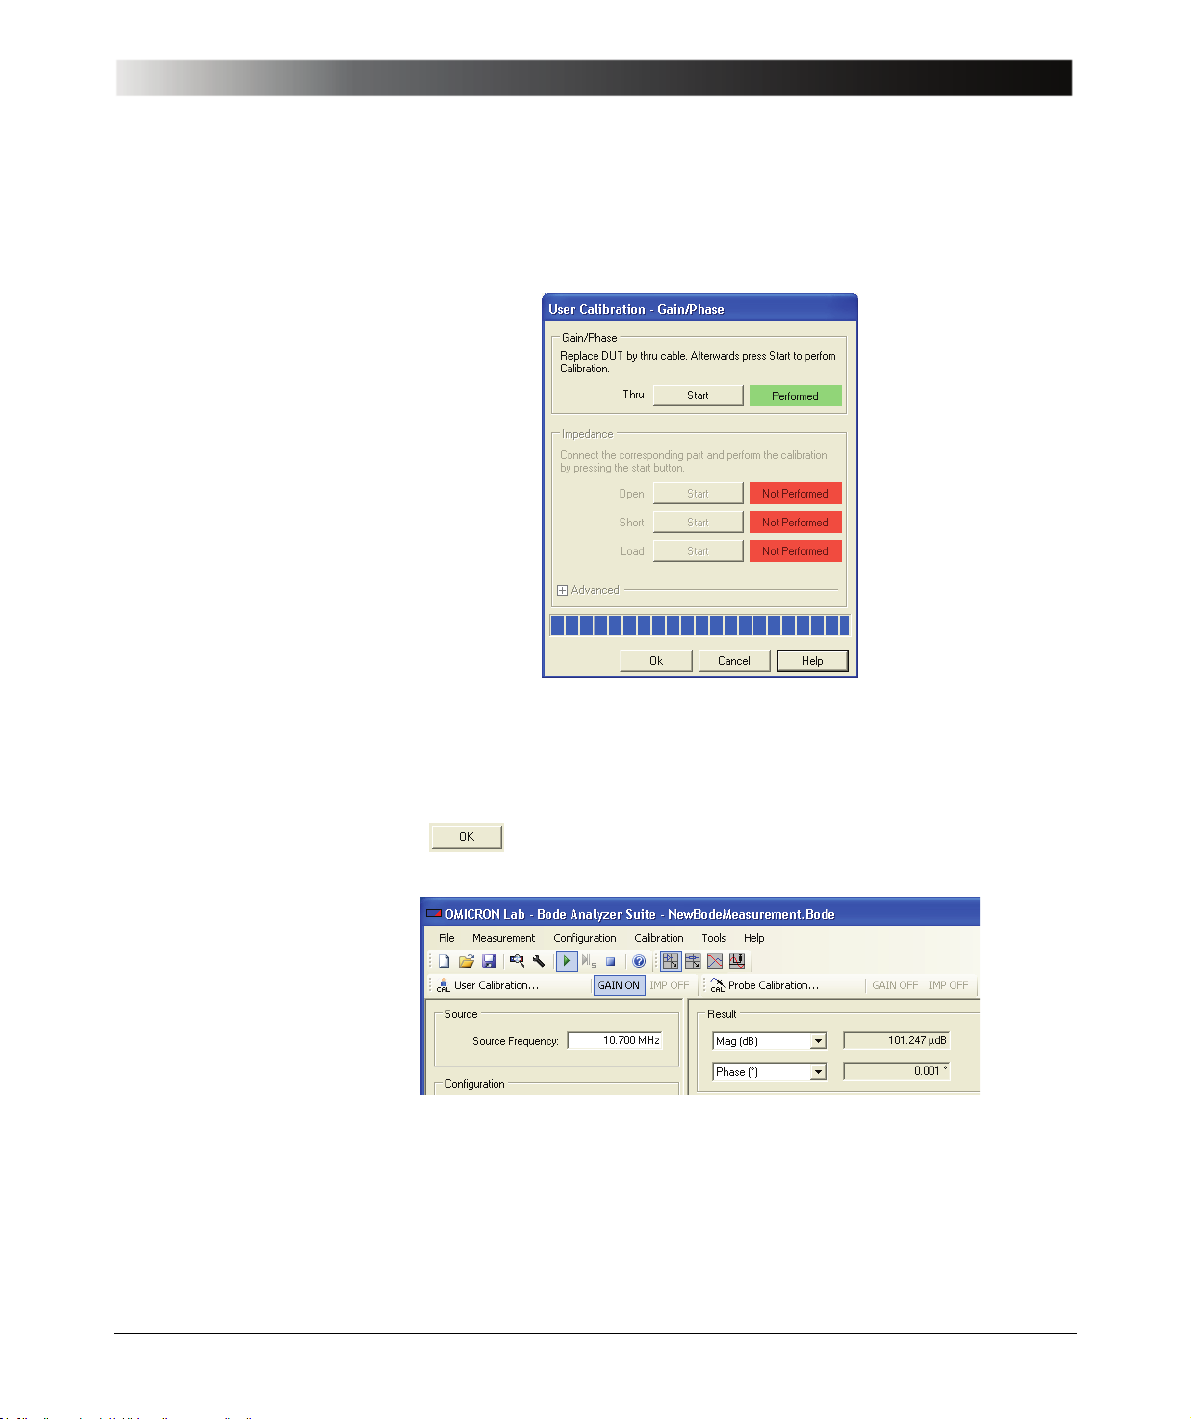
8. In the respective calibration window, click the Start button next to Thru to
calibrate the Bode 100.
Note: In the Gain/Phase mode, no Impedance calibration is possi bl e.
The Gain/Phase mode is now calibrated for the current specific
measurement setup. Refer to 7.1 "Calibration Methods" on page 75 to learn
in which cases you have to repeat the calibration if a parameter is changed.
9. Click .
In our case we read 101
close to zero your results may differ from this example. Nevertheless the
displayed values should be very small.
μdB (0.000101 dB) and 0.001º. Because we are
81
Page 82
Bode 100 User Manual
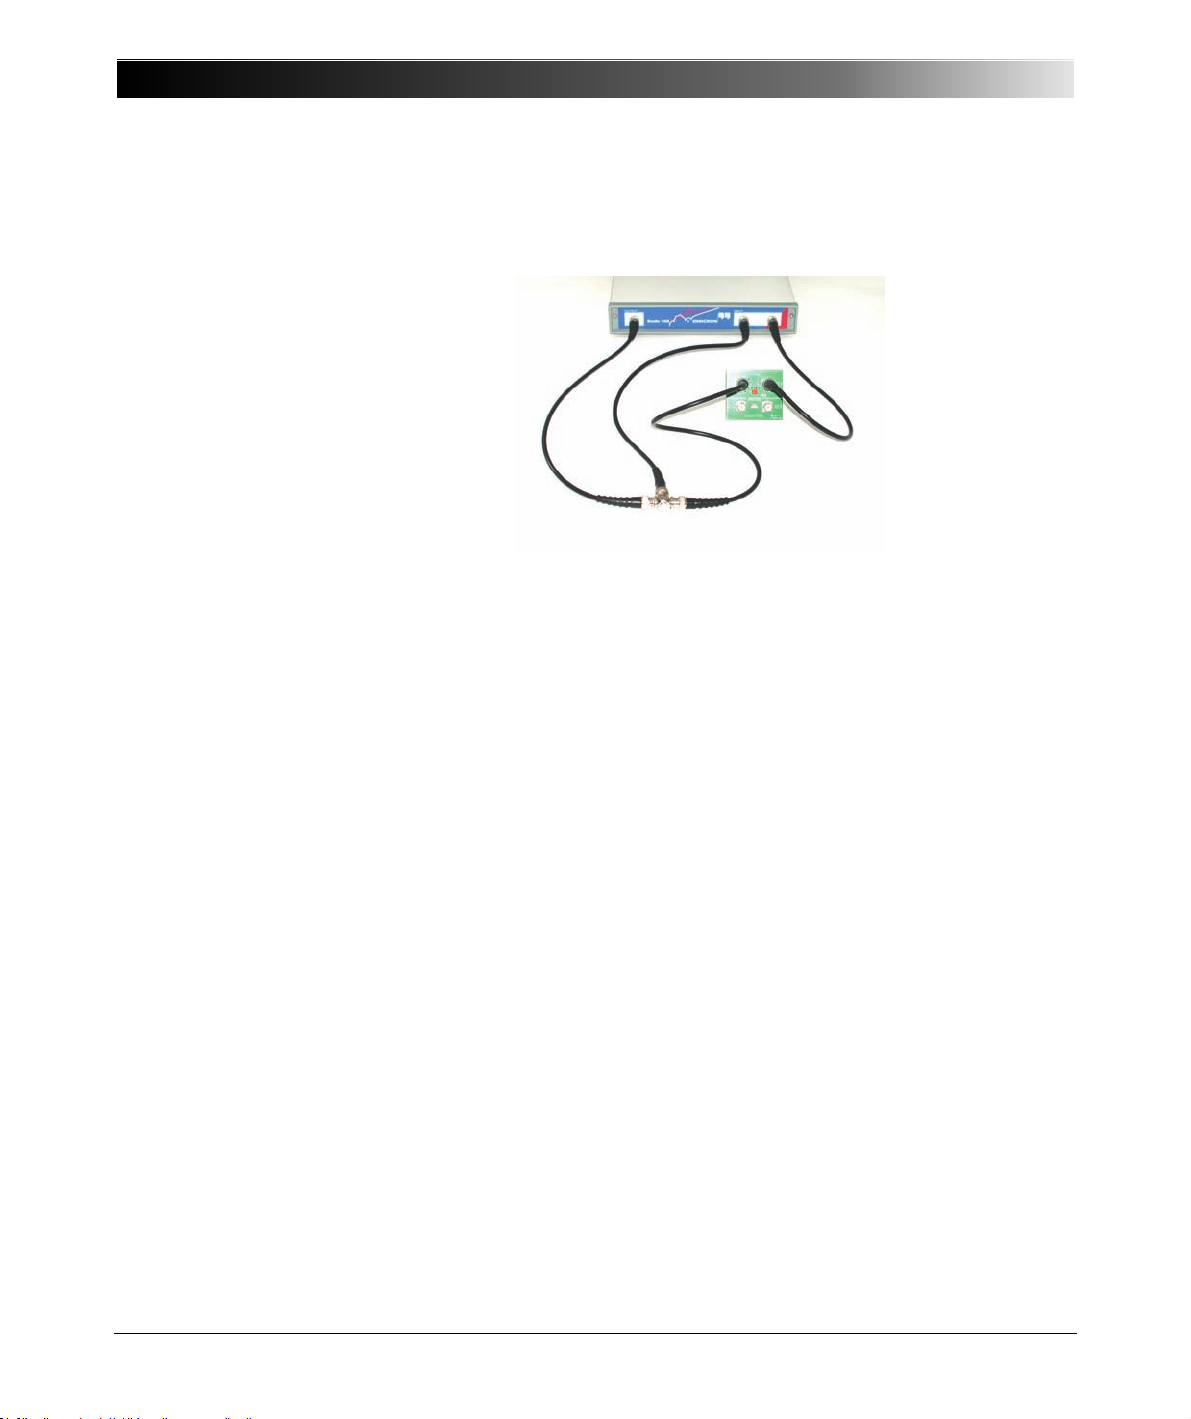
10.The calibration is done and you can replace the BNC straight adapter with
your DUT as shown below.
82
Page 83
Calibrating the Bode 100
7.4 Calibration in the Impedance/Reflection Mode
By calibrating the Bode 100 you can remove the effects of the connection setup
on the accuracy of the measurement results in the Impedance/Reflection
mode. Without calibration the reference plane of the impedance measurements
is at the BNC connector of the Bode 100 source output. Therefore if a DUT is
connected through a cable, the measured impedance is the combination of the
cable's impedance and the DUT's impedance. By calibrating the Bode 100 you
can move the reference plane for the impedance measurement to the end of the
connection cable and fully remove the influence of the cable.
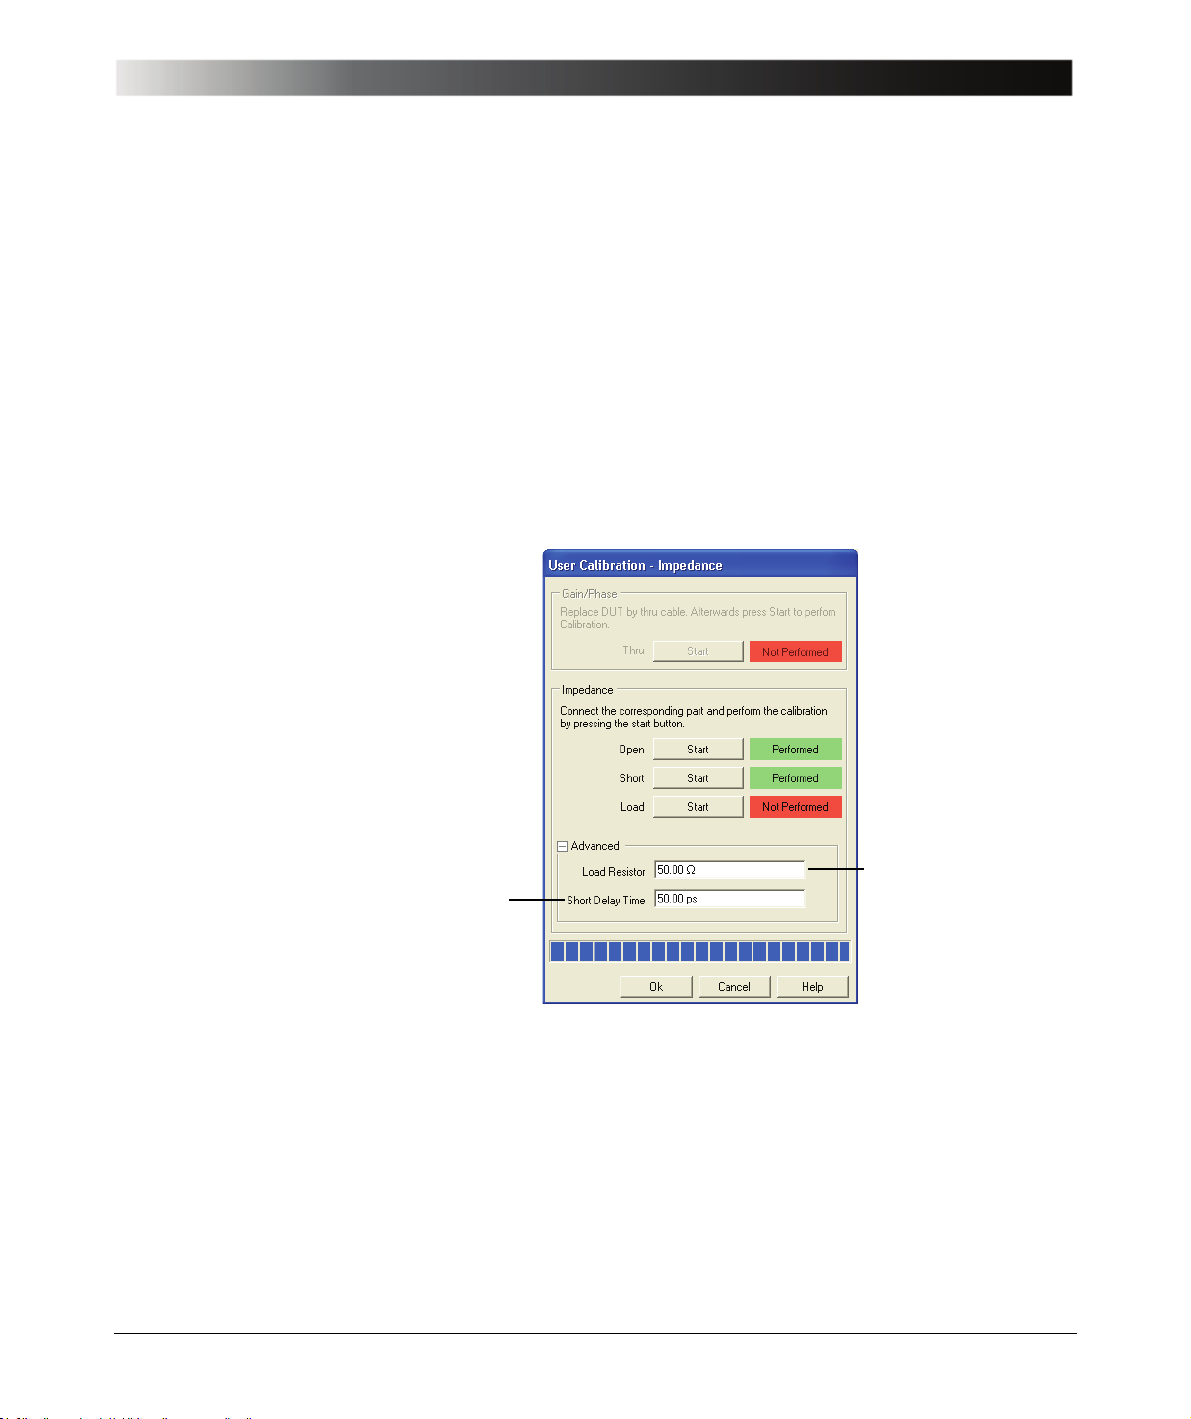
In the Impedance area of the calibration window, you can set the resistance of
the load resistor and the short delay time as shown below.
Enter the exact
Enter the delay time of
the short circuit used for
calibration
Factory setting valid for
the short circuit delivered
with the Bode 100: 50 ps
resistance of the load
used for calibration
Factory setting: 50
Ω
Hint: If the entered values of the load resistor and/or the short delay time differ
from the factory settings a yellow warning symbol appears after the Advanced
area has been collapsed.
Example: M eas ure t he i npu t im ped anc e of the IF f ilt er at th e BNC con nec tor of
the PCB (and not the impedance at the input of the cable connecting the filter).
Expected example duration: 20 minutes.
In this example you will learn step by step how to use the calibration of the
Bode 100 in the Impedance/Reflection mode.
83
Page 84
Bode 100 User Manual
How to:
• Eliminate the effect of the cable
• Connect the cable in the open, short and load condition
• Connect the DUT
Questions:
• What is the real part of the impedance in Ω?
• What is the reflection coefficient in dB?
To find out t he answers, proceed as follows:
1. Click the Impedance/Reflection toolbar button to switch to the
2. Click the Device Configuration toolbar button to open the
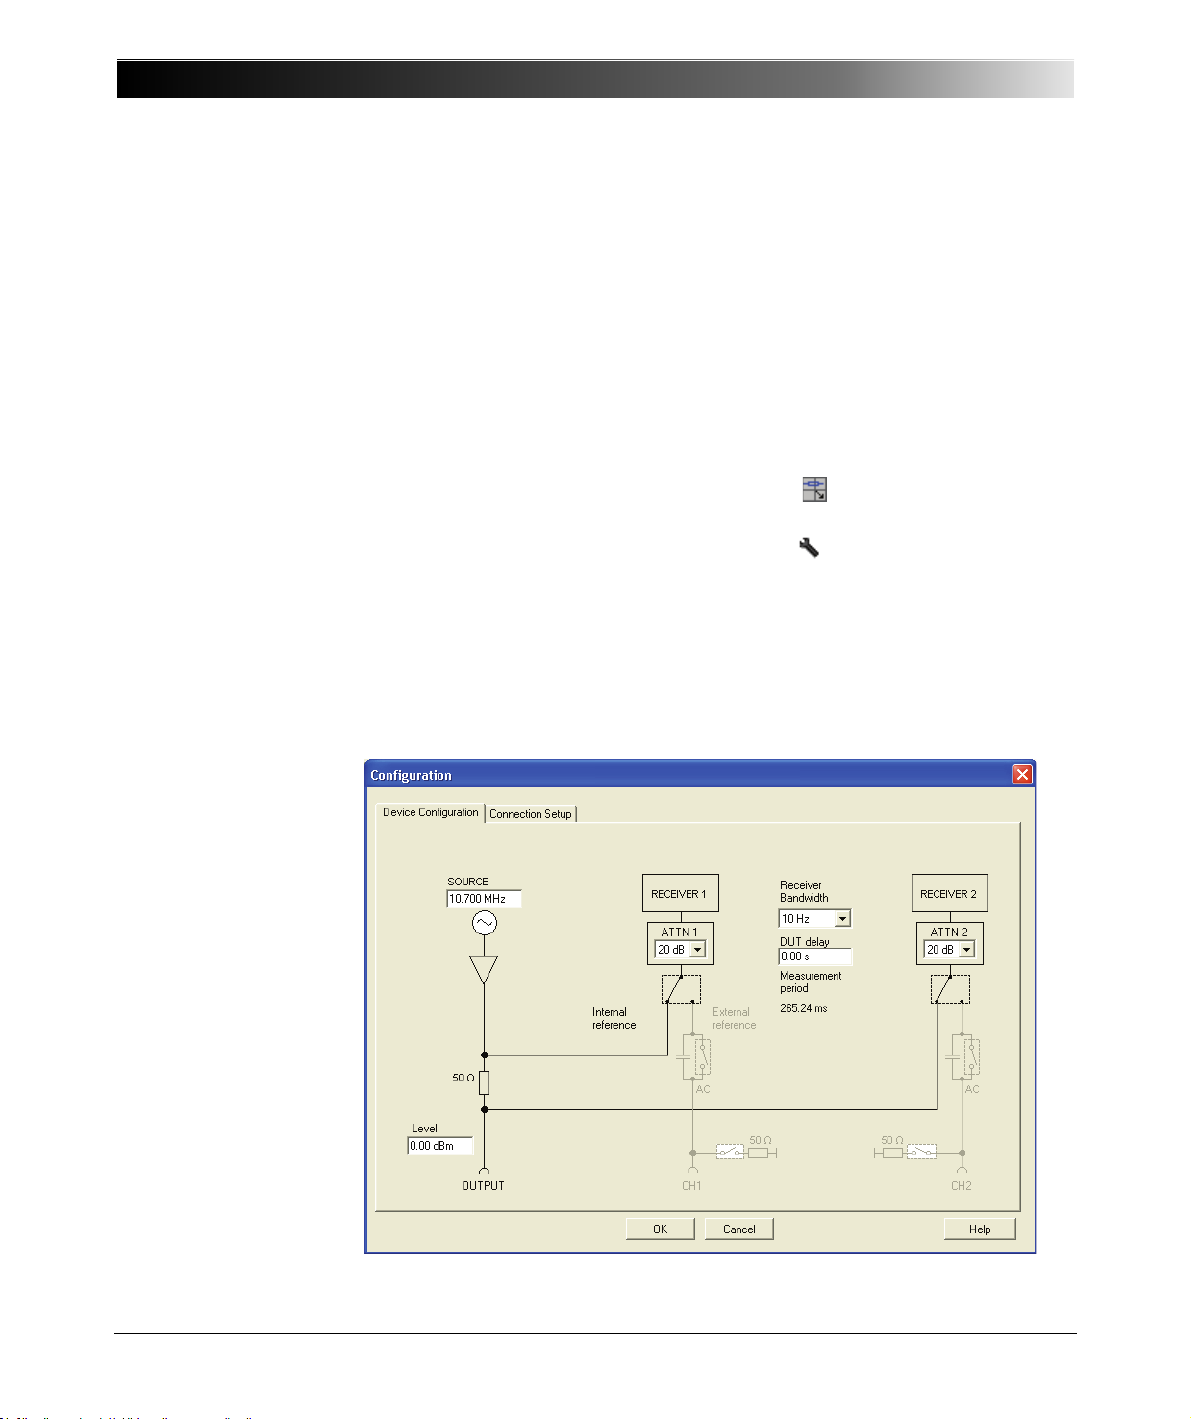
3. Because we want to test the 10.7 MHz IF filter, set:
• SOURCE: 10.7 MHz
• Receiver bandwidth: 10 Hz
Impedance/Reflection mode.
Configuration window.
• Level: 0 dB
84
Page 85
Calibrating the Bode 100
4. Click .
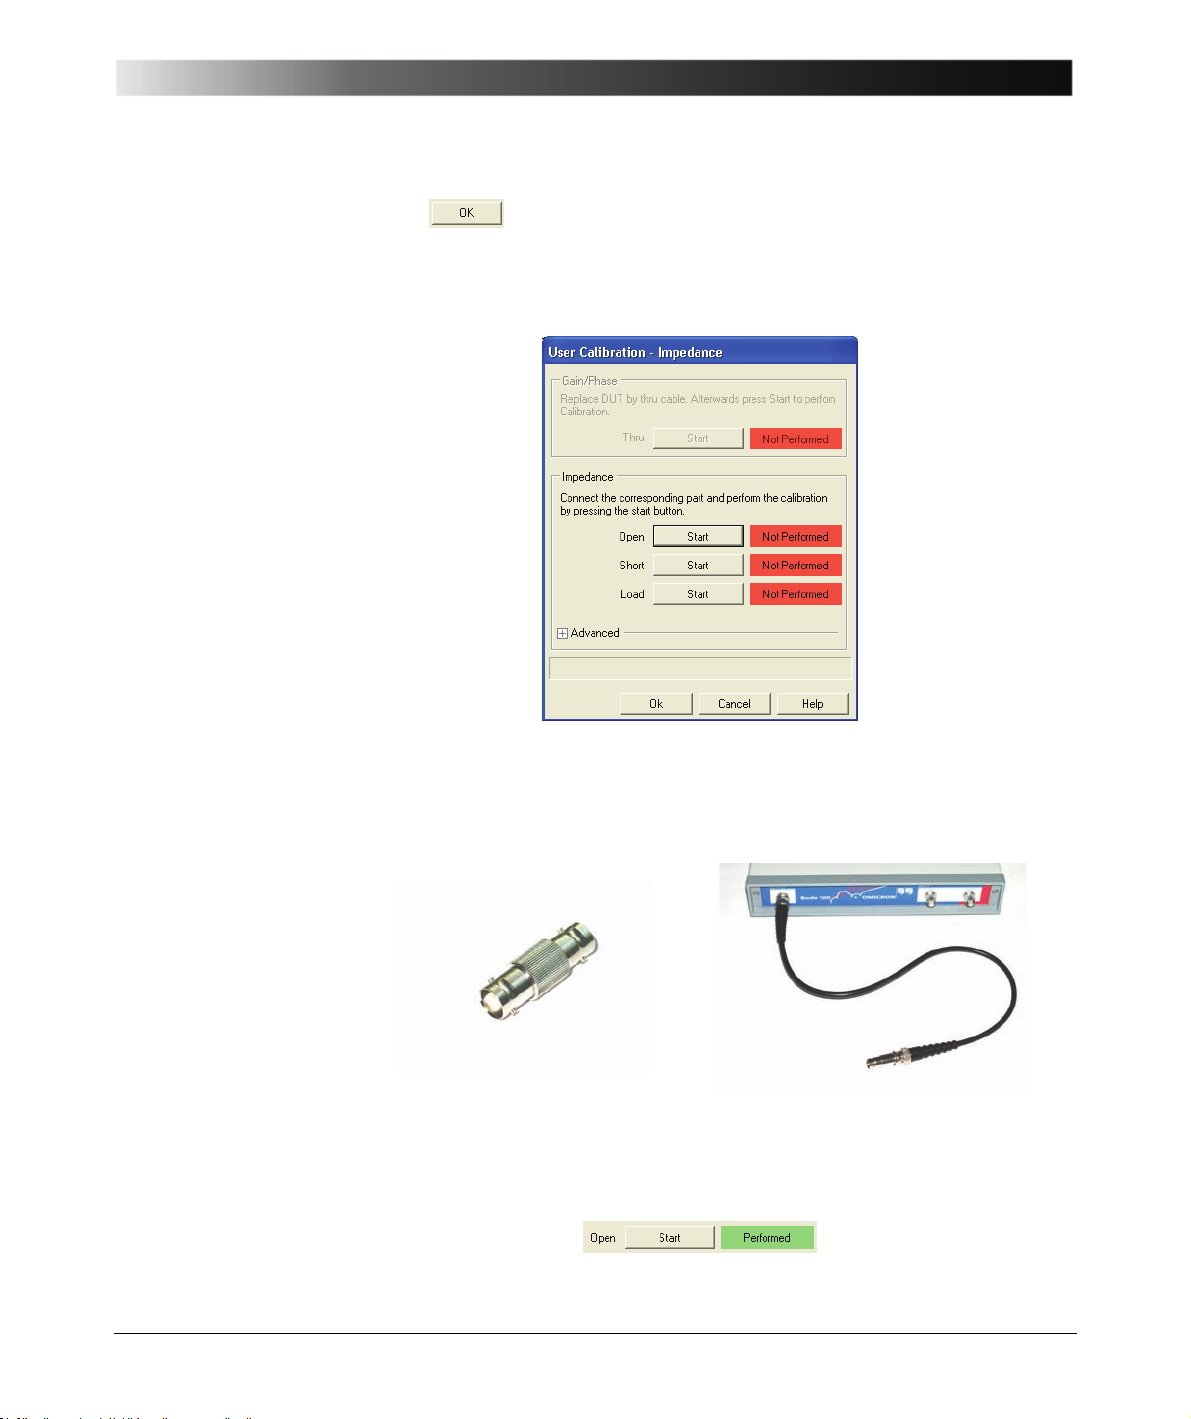
5. Choose either the Probe Calibration or the User Calibration and click the
respective toolbar button.
6. Connect the cable you want to use for the measurement to the OUTPUT
connector of the Bode 100. Plug the BNC straight adapter on the other end
of the cable to have the same reference plane for calibration.
7. Click the Start button next to Open in the Impedance area of the calibration
window. After the calibration has been finished, the field on the right displays
Performed on green background.
85
Page 86
Bode 100 User Manual
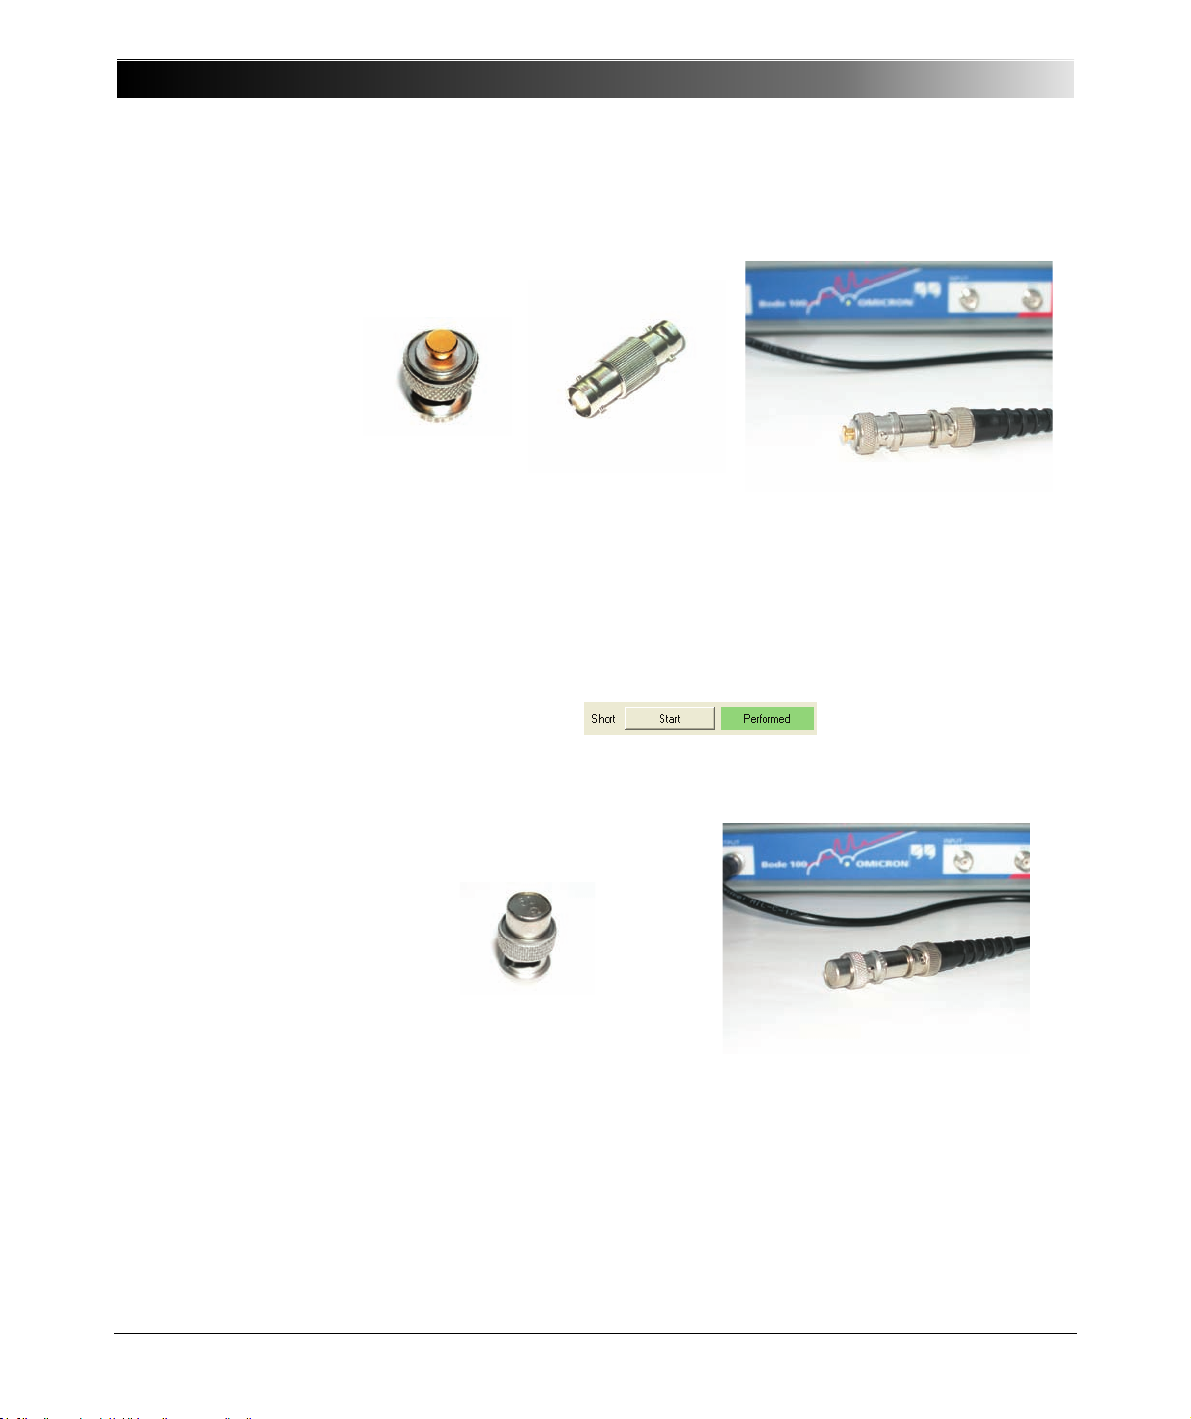
8. Plug the BNC short circuit on the straight adapter connected to the cable.
9. Click the Start button next to Short in the Impedance area of the calibration
Hint: If you use a short circuit other than the one delivered with your
Bode 100 you can enter the short delay by clicking the + symbol next to
Advanced and typing the short delay time.
window. After the calibration has been finished, the field on the right displays
Performed on green background.
10.Replace the BNC short circuit with the BNC 50 Ω load.
11.For very accurate measurements or if you use a load resistor different from
50 Ω, click the + symbol next to Advanced, and then enter the exact
resistance of the load resistor.
86
Page 87
Calibrating the Bode 100
12.Click the Start button next to Load in the Impedance area of the calibration
window. After the calibration has been finished, the field on the right displays
Performed on green background.
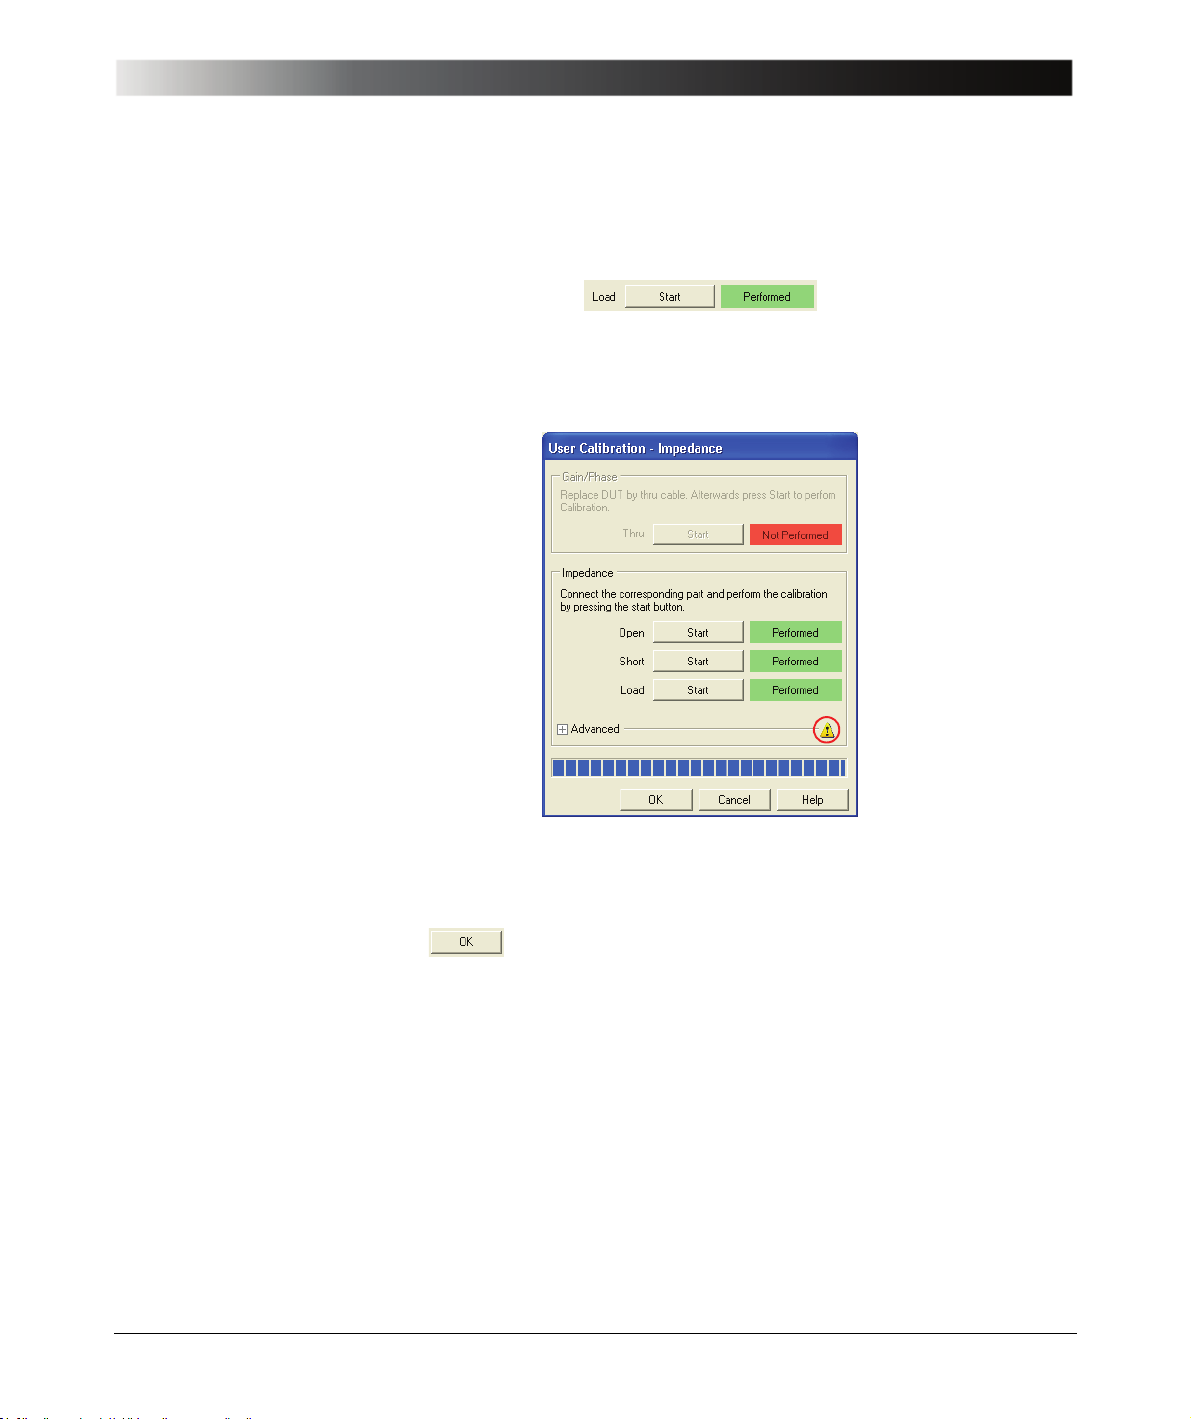
13.After the calibration has been finished, the calibration window looks like
shown below.
Hint: If the entered values of the load resistor and/or the short delay time
differ from the factory settings a yellow warning symbol appears after the
Advanced area has been collapsed.
14.Click . You have done the Impedance calibration.
87
Page 88
Bode 100 User Manual
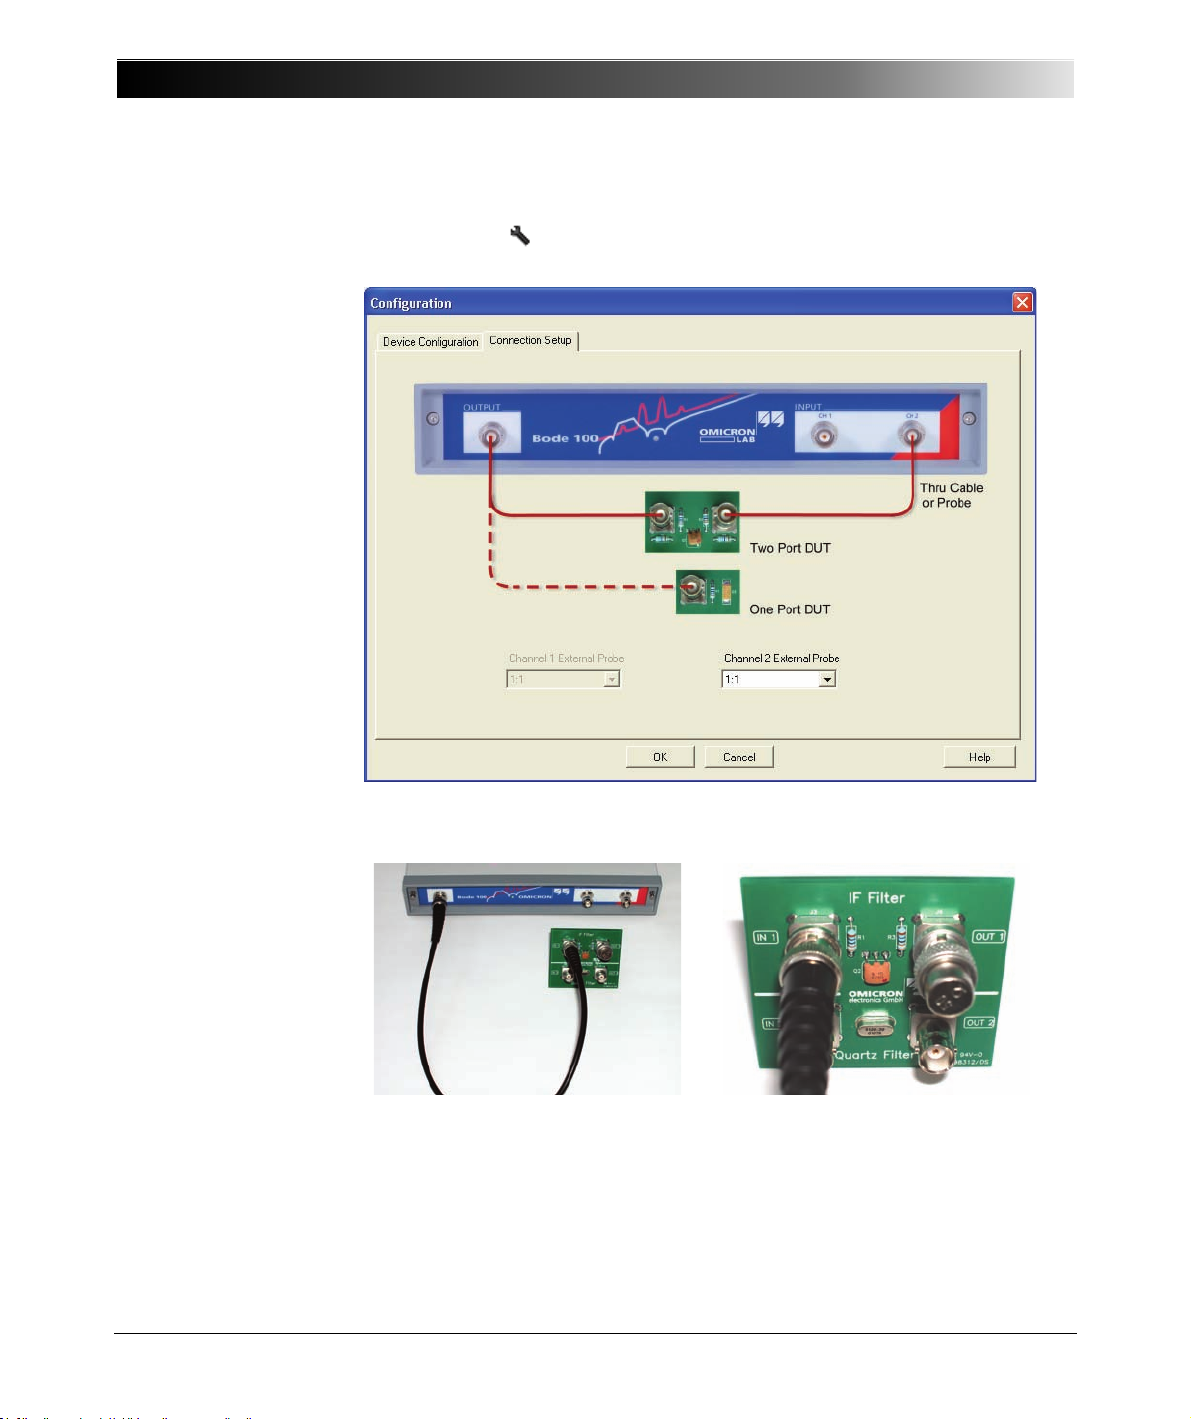
15.Open the Configuration window by clicking the Device Configuration
toolbar button to see how to connect your DUT to the Bode 100.
88
16.Connect the test object.
Note: The IF filter is a two-port device. To ensure that the impedance of the
filter is measured correctly, its output must be terminated. For measuring a
one-port device like a capacitor or an inductor, no termination resistor is
needed.
Page 89
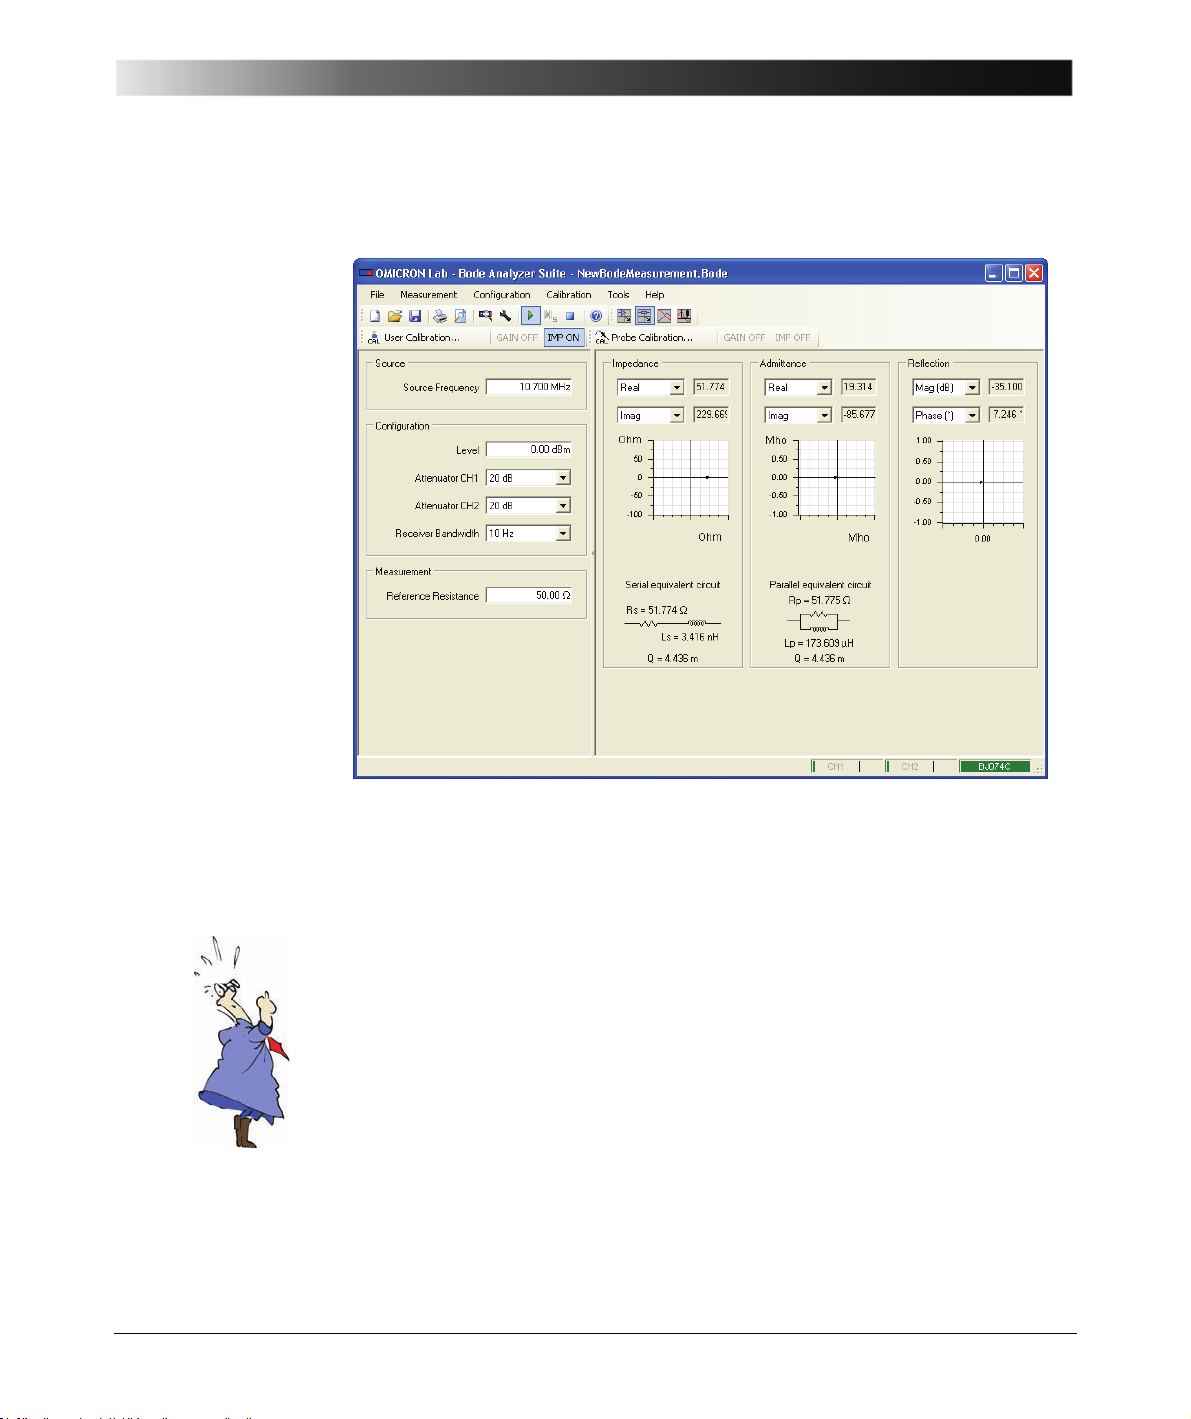
17.Read the results.
Calibrating the Bode 100
I had my first cable
problem when I was
born but luckily the
midwife solved that
problem.
Answers:
• The real part of the impedance is 51.8 Ω.
• The magnitude of the reflection coefficient is –35.1 dB.
Your results may differ because every IF filter and measurement setup is slightly
different.
Congratulation! You learned the calibration of the Bode 100 in the
Impedance/Reflection mode.
How to:
• Eliminate the effect of the cable
• Connect the cable in the open, short and load condition
• Connect the DUT
89
Page 90
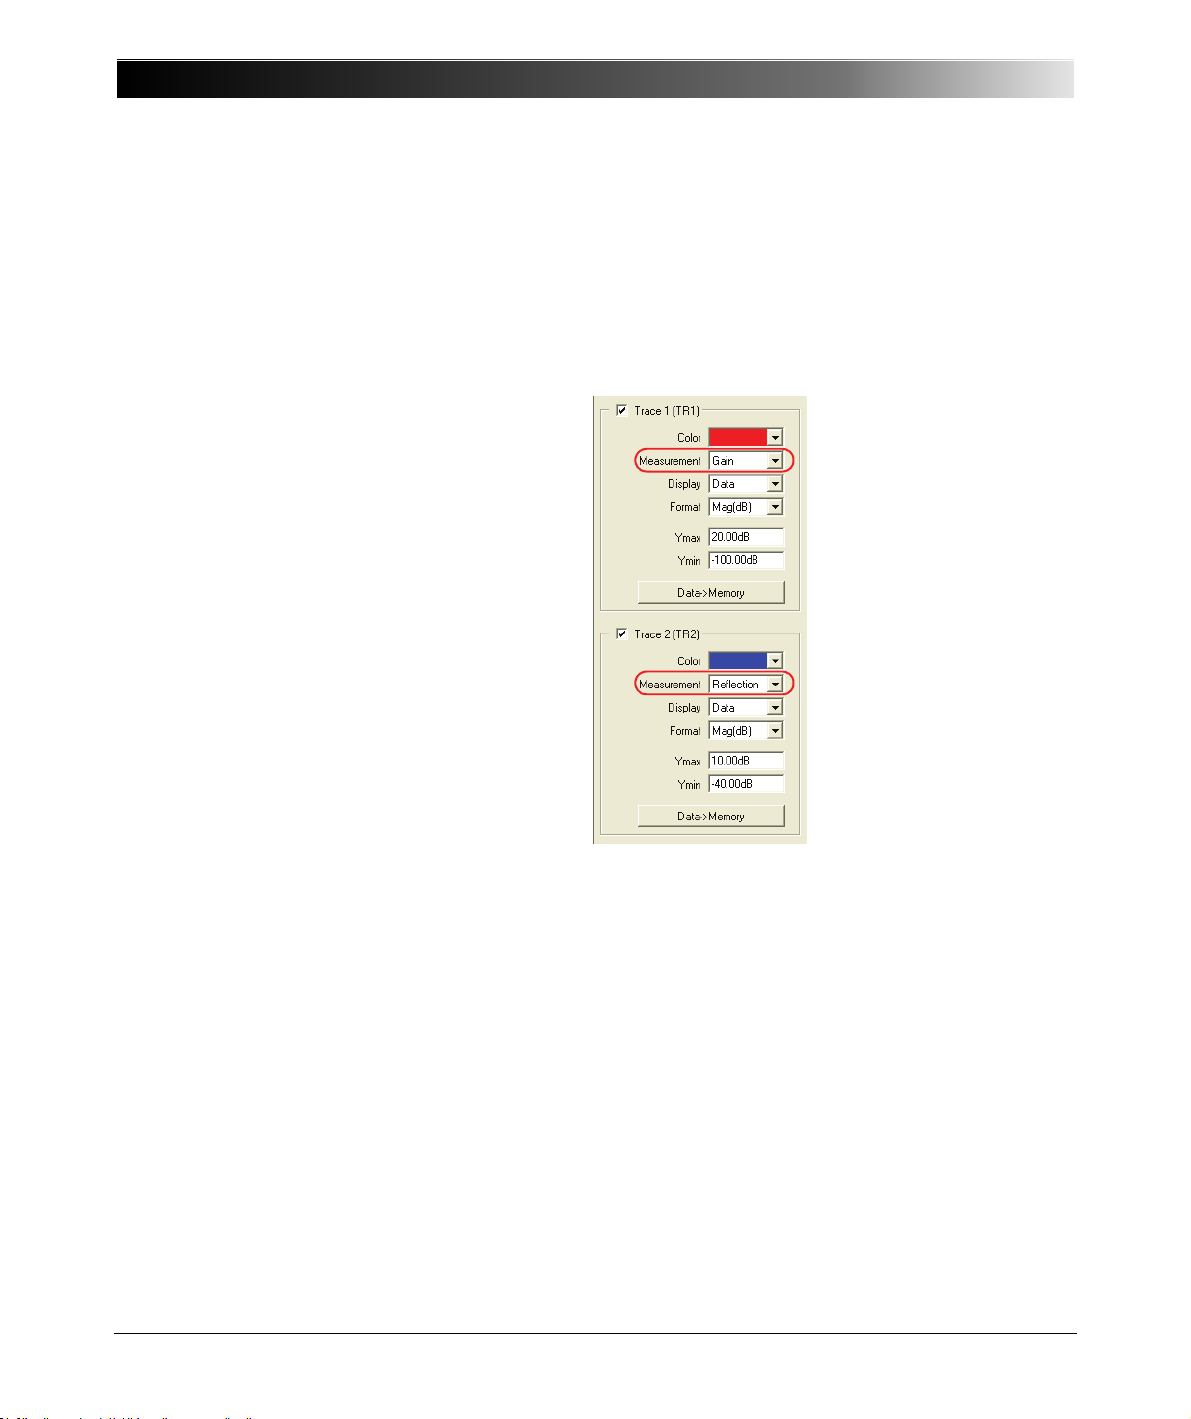
Bode 100 User Manual
7.5 Calibration in the Frequency Sweep Mode
In the Frequency Sweep mode, you can perform Gain/Phase and
Impedance/Reflection measurem ents. Ther efore bot h the Gain/Phase and the
Impedance calibration are available. The actually performed measurements
depend on the measurement type assigned to Trace 1 and Trace 2.
90
To perform the Gain/Phase calibration in the Frequency Sweep mode,
proceed as described in 3.3 "Example: Gain/Phase Measurement" on page 24.
For the Impedance calibration, see 5.2 "Impedance Calibration" on page 57.
Hints:
The calibration time for the User Calibration depends on the number of
measurement points and the selected receiver bandwidth.
The calibration time required for the Probe Calibration depends only on the
selected receiver bandwidth.
When working with the Bode 100 at frequencies below 10 Hz, the calibration can
be quite long.
Page 91
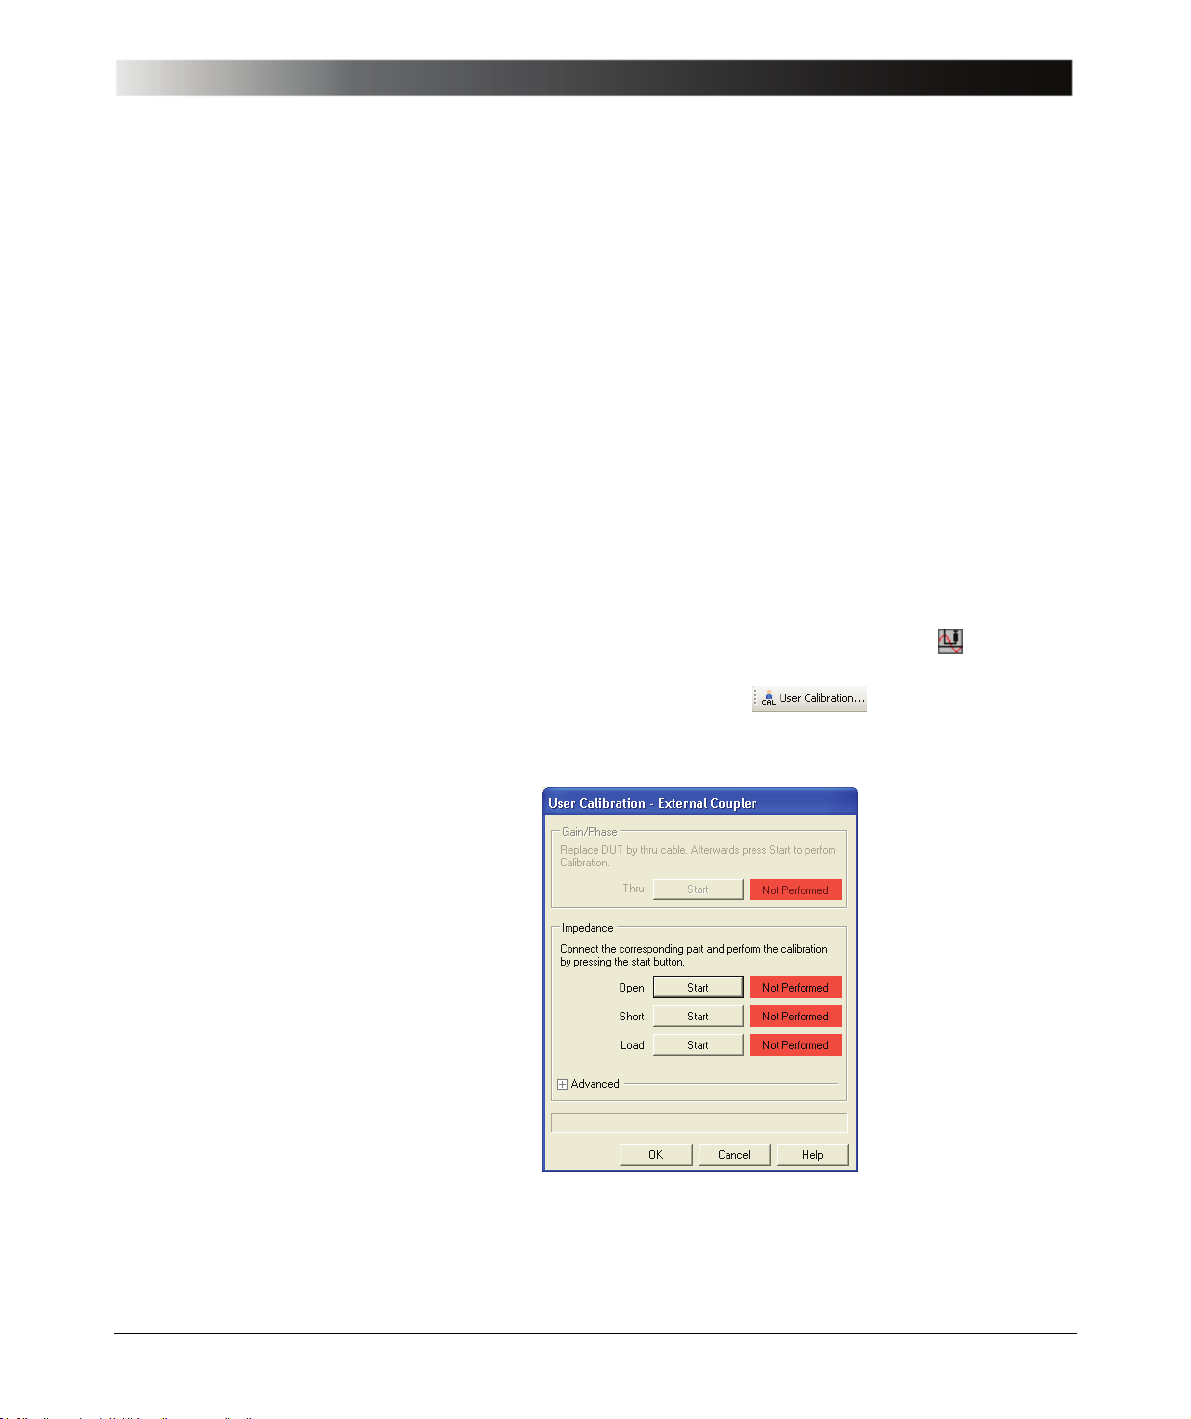
Calibrating the Bode 100
7.6 Calibration in the Frequency Sweep (External Coupler) Mode
By calibrating the Bode 100 in the Frequency Sweep (External Coupler)
mode you remove the effects of the connection setup including the external
coupler and, if used, the amplifier on the accuracy of the measurement results.
Due to the strongly varying parameters of directional couplers a calibration is
mandatory before performing a measurement.
In the Frequency Sweep (External Coupler) mode, you can perform only
Impedance/Reflection measurements. Therefore only the Impedance
calibration is available in this mode.
Hint: Some directional couplers show nonlinear behavior at the edges of their
passband. If your measurement frequency range is close to such nonlinearities,
we recommend to use the User Calibration to remove the nonlinear effects.
To calibrate the Bode 100 in the Frequency Sweep (External Coupler) mode:
1. Click the Frequen cy Sweep (External Coupler) toolbar button to switch
to the Frequency Sweep (External Coupler) mod e.
2. Click the User Calibration toolbar button to open the
calibration window.
91
Page 92
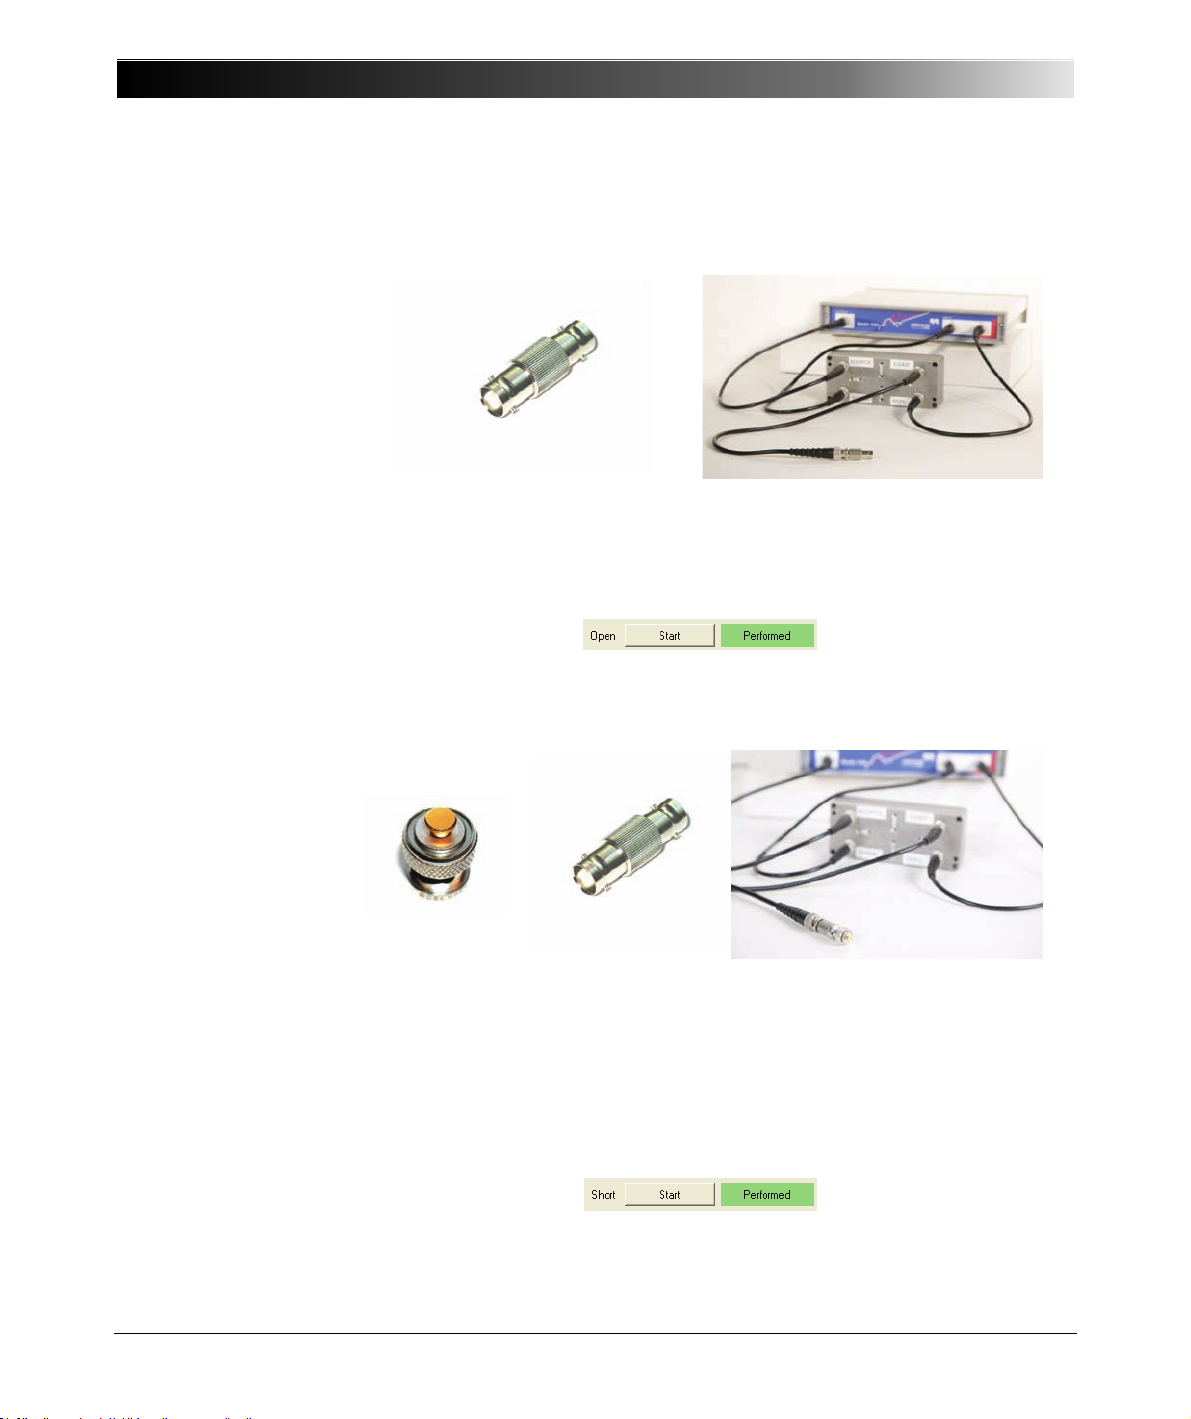
Bode 100 User Manual
3. Plug the BNC straight adapter on the end of the cable.
4. Click the Start button next to Open in the Impedance area of the calibration
window. After the calibration has been finished, the field on the right displays
Performed on green background.
5. Plug the BNC short circuit on the straight adapter connected to the cable.
6. Click the + symbol next to Advanced, and then enter the short delay time
(only if you use a short circuit other than the one delivered with your
Bode 100).
7. Click the Start button next to Short in the Impedance area of the calibration
window. After the calibration has been finished, the field on the right displays
Performed on green background.
92
Page 93
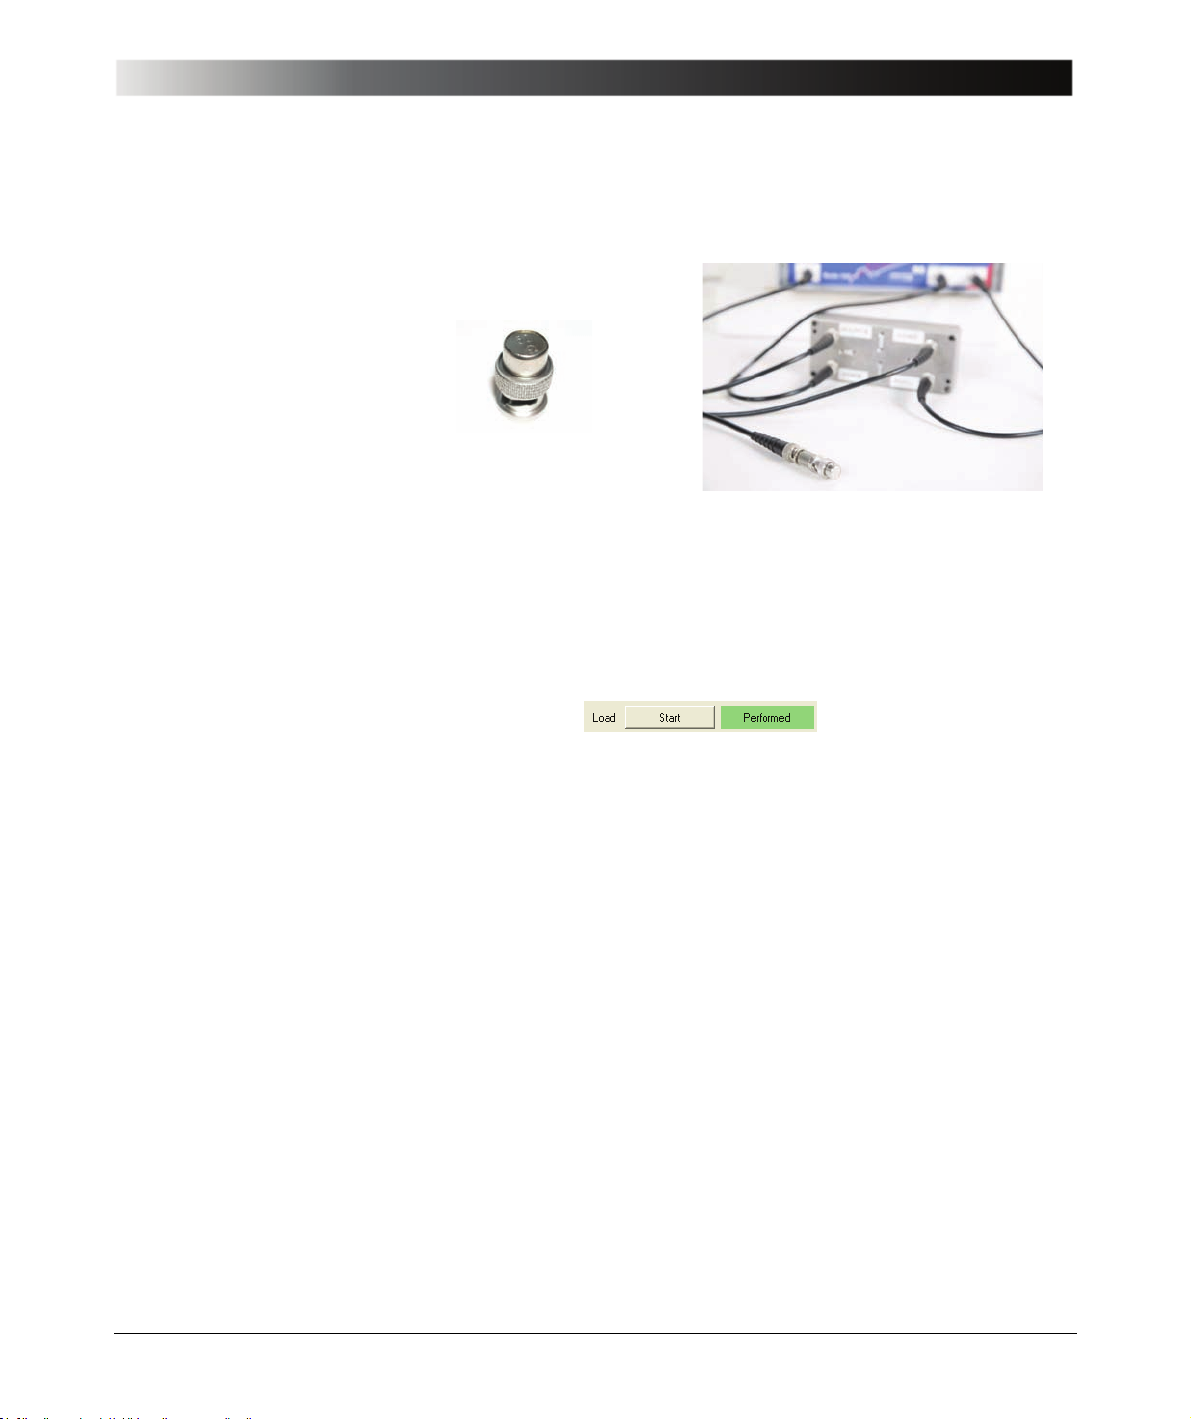
Calibrating the Bode 100
8. Replace the BNC short circuit with the BNC 50 Ω load.
9. For very accurate measurements or if you use a load resistor different from
50 Ω, enter the exact resistance of the load resistor in the respective box in
the Advanced area of the calibration window.
10.Click the Start button next to Load in the Impedance area of the calibration
window. After the calibration has been finished, the field on the right displays
Performed on green background.
93
Page 94
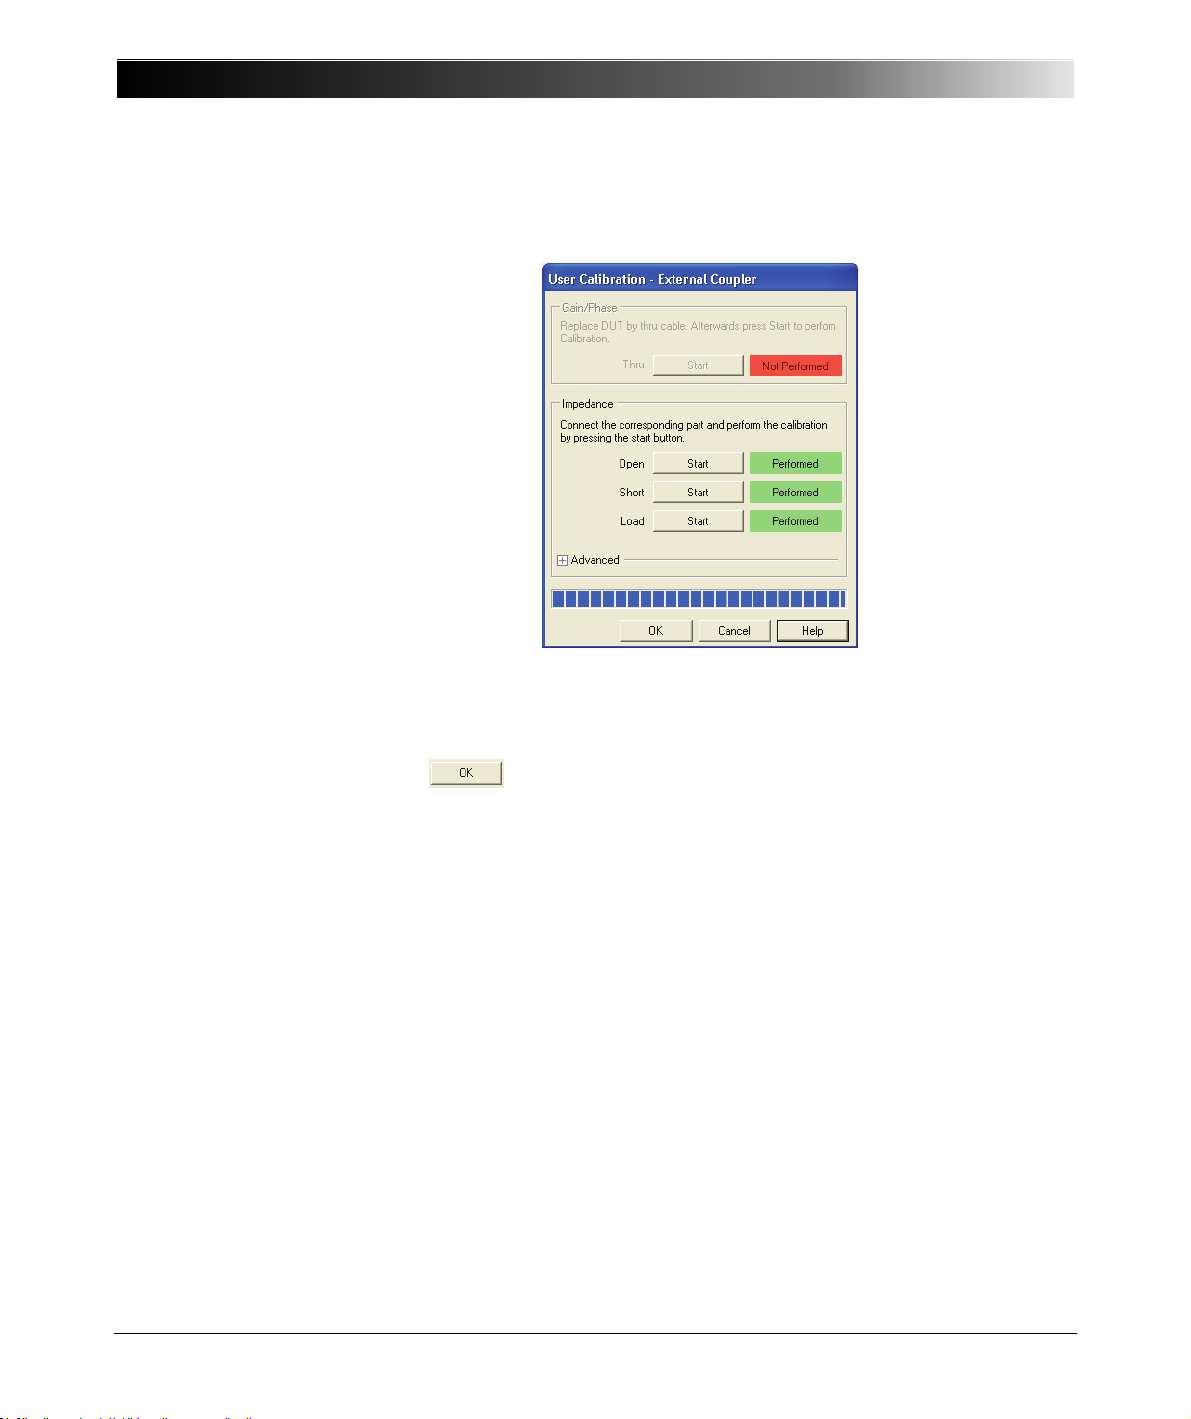
Bode 100 User Manual
11.After the calibration has been finished, the calibration window looks like
shown below.
Hint: A yellow warning symbol displayed close to Advanced indicates that
the short delay and/or the load resistance entered in the Advanced area
differ from the factory settings.
12.Click . You have done the Impedance calibration in the
Frequency Sweep (External Coupler) mode.
94
Page 95
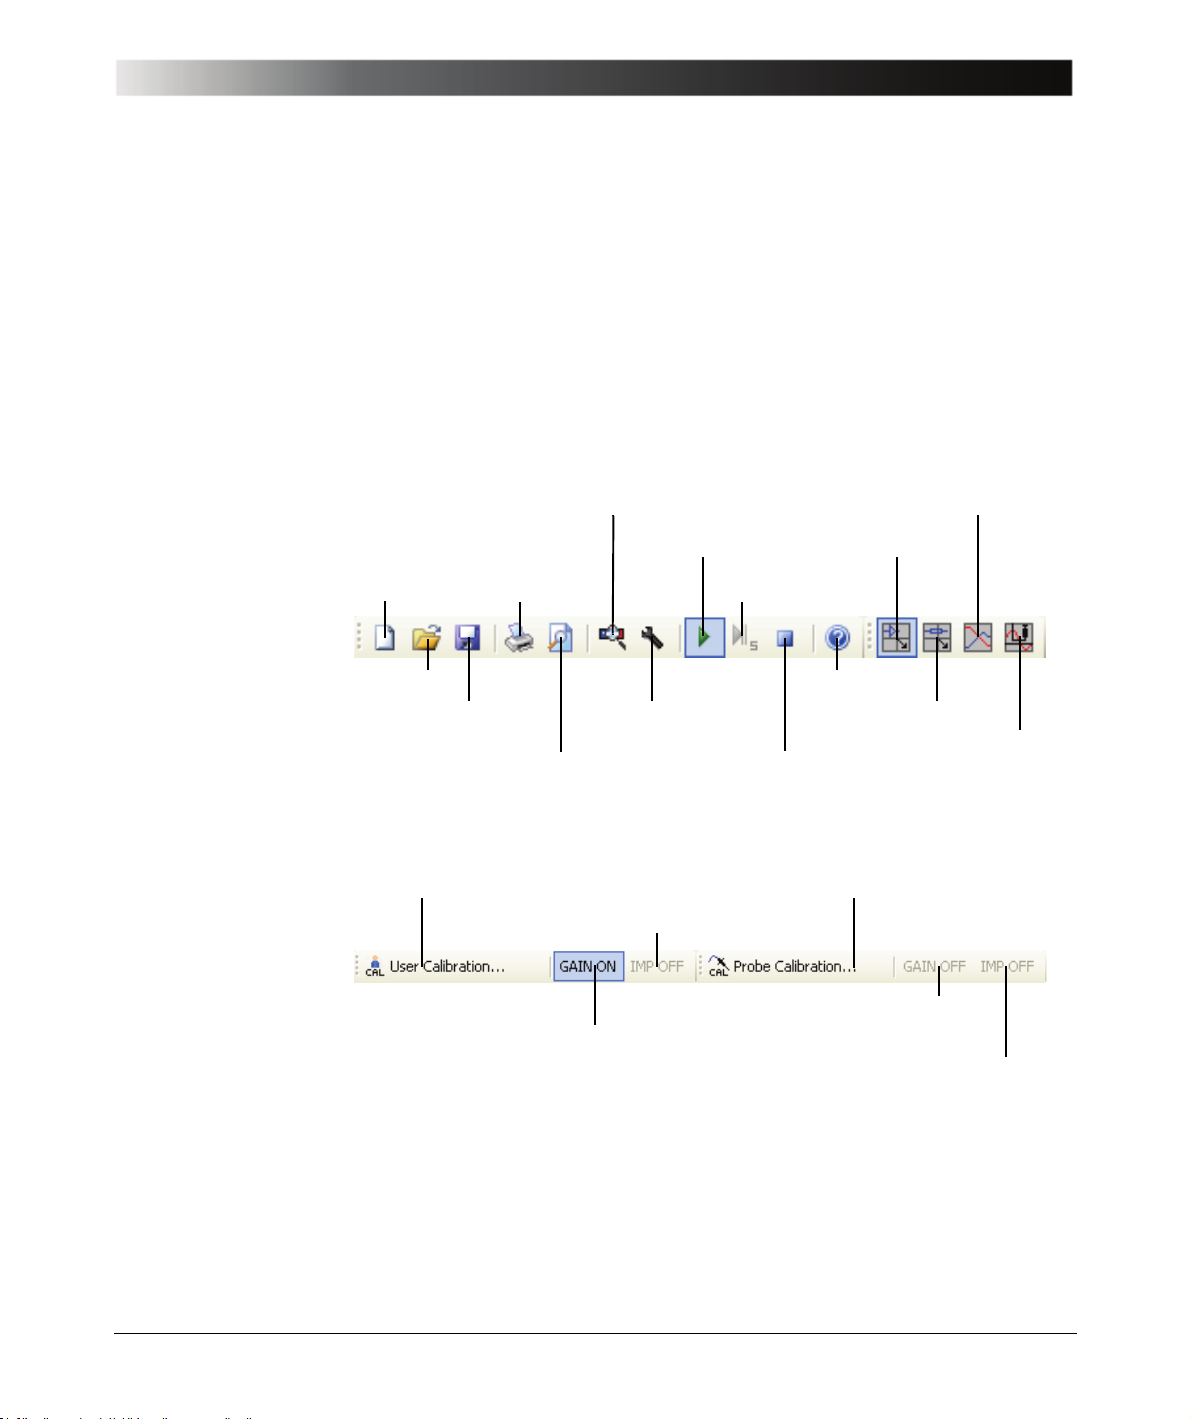
8 Common Functions
In this section you can find the Bode Analyzer Suite basics. The section
provides an overview of the toolbars, menus and commands common to all
measurement modes. Further on, this section explains how to change the
measurement range, how to export the data and how to store and load
configuration files.
8.1 Toolbars, Menus and Commands
Common Functions
Figure 8-1:
Toolbar
Figure 8-2:
Calibration toolbar
Search and Reconnect Device
Continuous Measurement
New Save
Open
Print
Print Preview
Start User Calibration Start Probe Calibration
Switch Gain/Phase calibration on/off
Device Configuration
Switch Impedance calibration on/off
Single Measurement
Contents
Impedance/Reflection
Stop Measurement
Switch Gain/Phase calibration on/off
Switch Impedance calibration on/off
Frequency Sweep
Gain/Phase
Frequency Sweep
(External Coupler)
95
Page 96
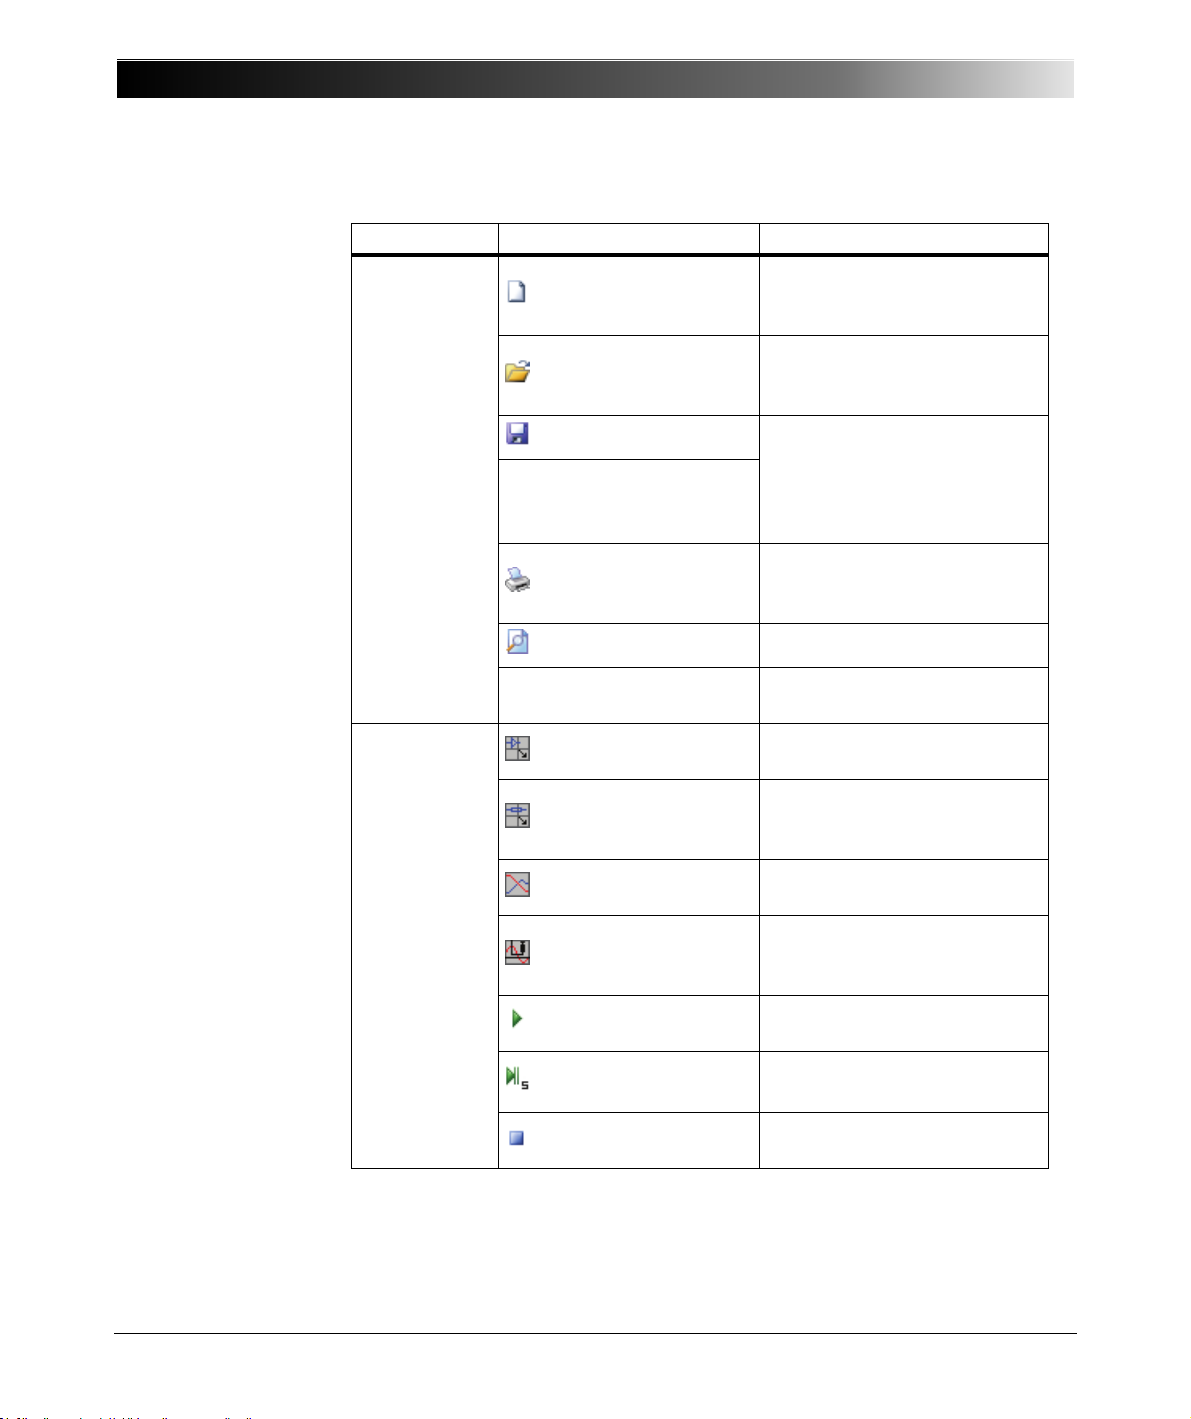
Bode 100 User Manual
Table 8-1:
Menus and commands
Menu Command Description
Opens the
New
NewBodeMeasurement.Bode
file containing default settings.
Opens a .Bode file containing
Open
saved settings and
measurement data.
Save
Saves the device configuration,
measurement settings ,
File
Save As
calibration and measurement
data and the graphical display
settings.
Print a report containing the
Print
diagram, measurement results,
and device configuration data.
Print Preview
Previews the print report.
Exit
Gain/Phase
Impedance/Reflection
Frequency Sweep
Measurement
Frequency Sweep
(External Coupler)
Continuous
Measurement
Single Measurement
Stop Measurement
1. Only available in the Frequency Sweep modes
Enables you to exit the
Bode Analyzer Suite.
Selects the Gain/Phase
measurement mode.
Selects the
Impedance/Reflection
measurement mode.
Selects th e Frequency Sweep
measurement mode.
Selects the Frequency Sweep
(External Coupler)
measurement mode.
Starts continuous
measurements.
Starts a single frequency
sweep measurement.
1
Stops measurement. The last
result remains di splayed.
96
Page 97
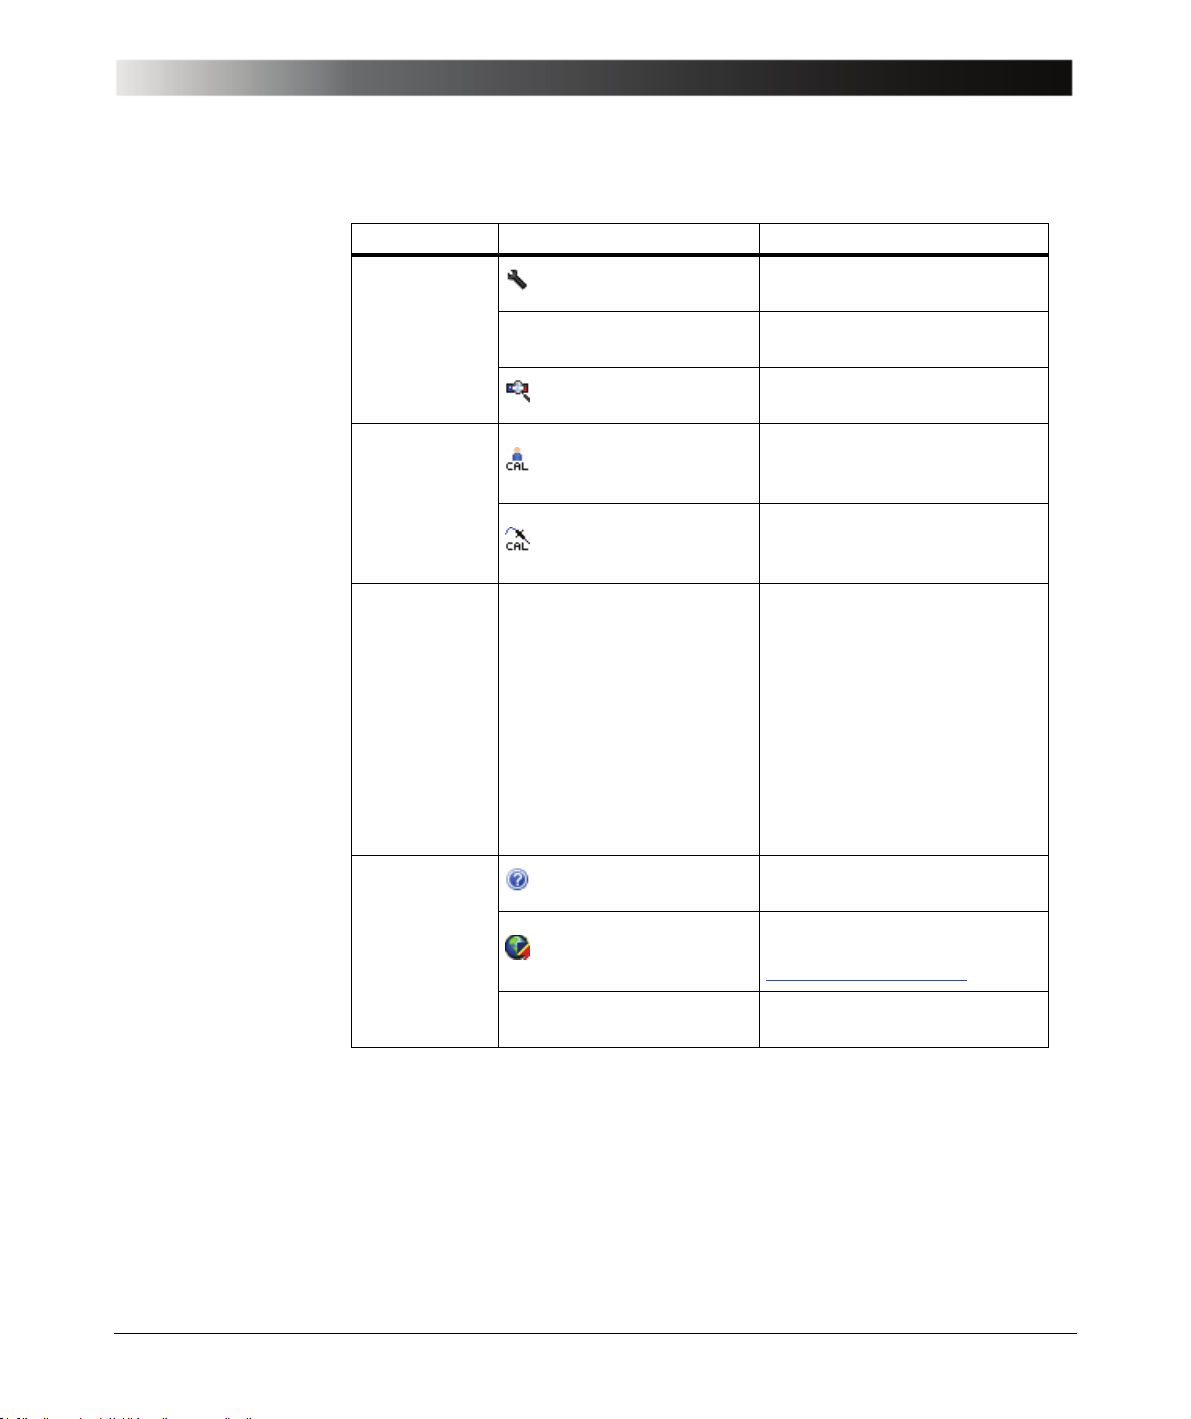
Menu Command Description
Device Configuration
Configuration
Calibration
Tools Options
Help
Connection Setup
Search and
Reconnect Device
User Calibration
Probe Calibration
Contents
Bode 100 Web site
About
Enables you to configure the
Bode 100.
Shows the connection of the
DUT to the Bode 100.
Reconnects the Bode 100 with
the computer.
Starts the User Calibration
(see 7 "Calibrating the
Bode 100" on page 75).
Starts the Probe Calibration
(see 7 "Calibrating the
Bode 100" on page 75).
Enables you to set the startup
configuration (see
8.3.1 "Loading and Saving the
Equipment Configuratio n" on
page 98), to select the
measurement range (see
8.2 "Setting the Measurement
Range" on page 98) and to set
the CSV export options (see
8.3 "File Operations" on
page 98).
Starts the Bode Analyzer Suite
Help.
Opens the OMICRON Lab
Web site
www.omicron-lab.com.
Displays the
Bode Analyzer Suite version.
Common Functions
97
Page 98
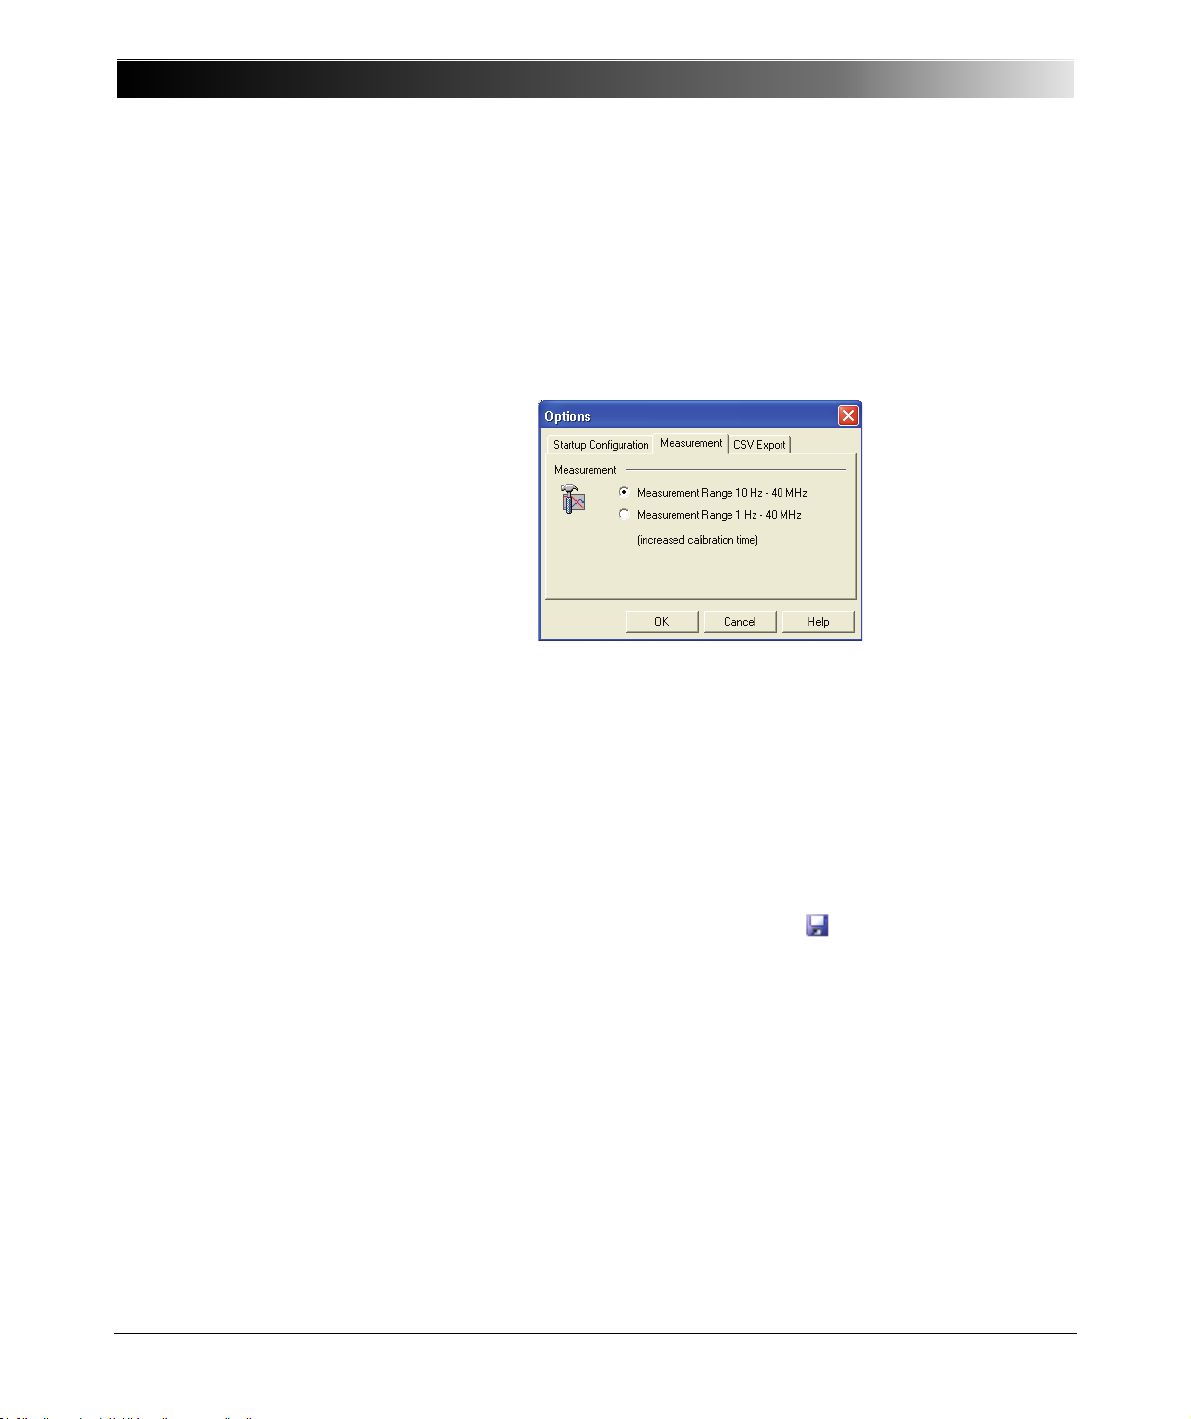
Bode 100 User Manual
8.2 Setting the Measurement Range
Figure 8-3:
Setting the
measurement range
With the Bode 100 you can perform measurements within 10 Hz…40 MHz
(default frequency range) and 1 Hz…40 MHz (extended frequency range). To
select the measurement range, click Options on the Tools menu, click the
Measurement tab, and then select the frequency range for your measurement.
8.3 File Operations
The Bode 100 supports the following file operations.
8.3.1 Loading and Saving the Equipment Configuration
You can store all settings of the Bode 100 including the device configuration,
measurement settings, calibration and measurement data and the graphical
display settings by clicking the Save toolbar button (see Table 8-1: "Menus
and commands" on page 96).
Hint: This functionality allows you to store multiple equipment configurations for
repetitive measurement tasks. With the equipment configurations stored, you
can load the respective files for each measurement instead of setting the
Bode 100 manually.
A saved file containing the Bode 100 settings has the .Bode extension. The file
is stored in XML format and can be viewed with standard Web browsers or a
simple text editor tool.
98
Page 99
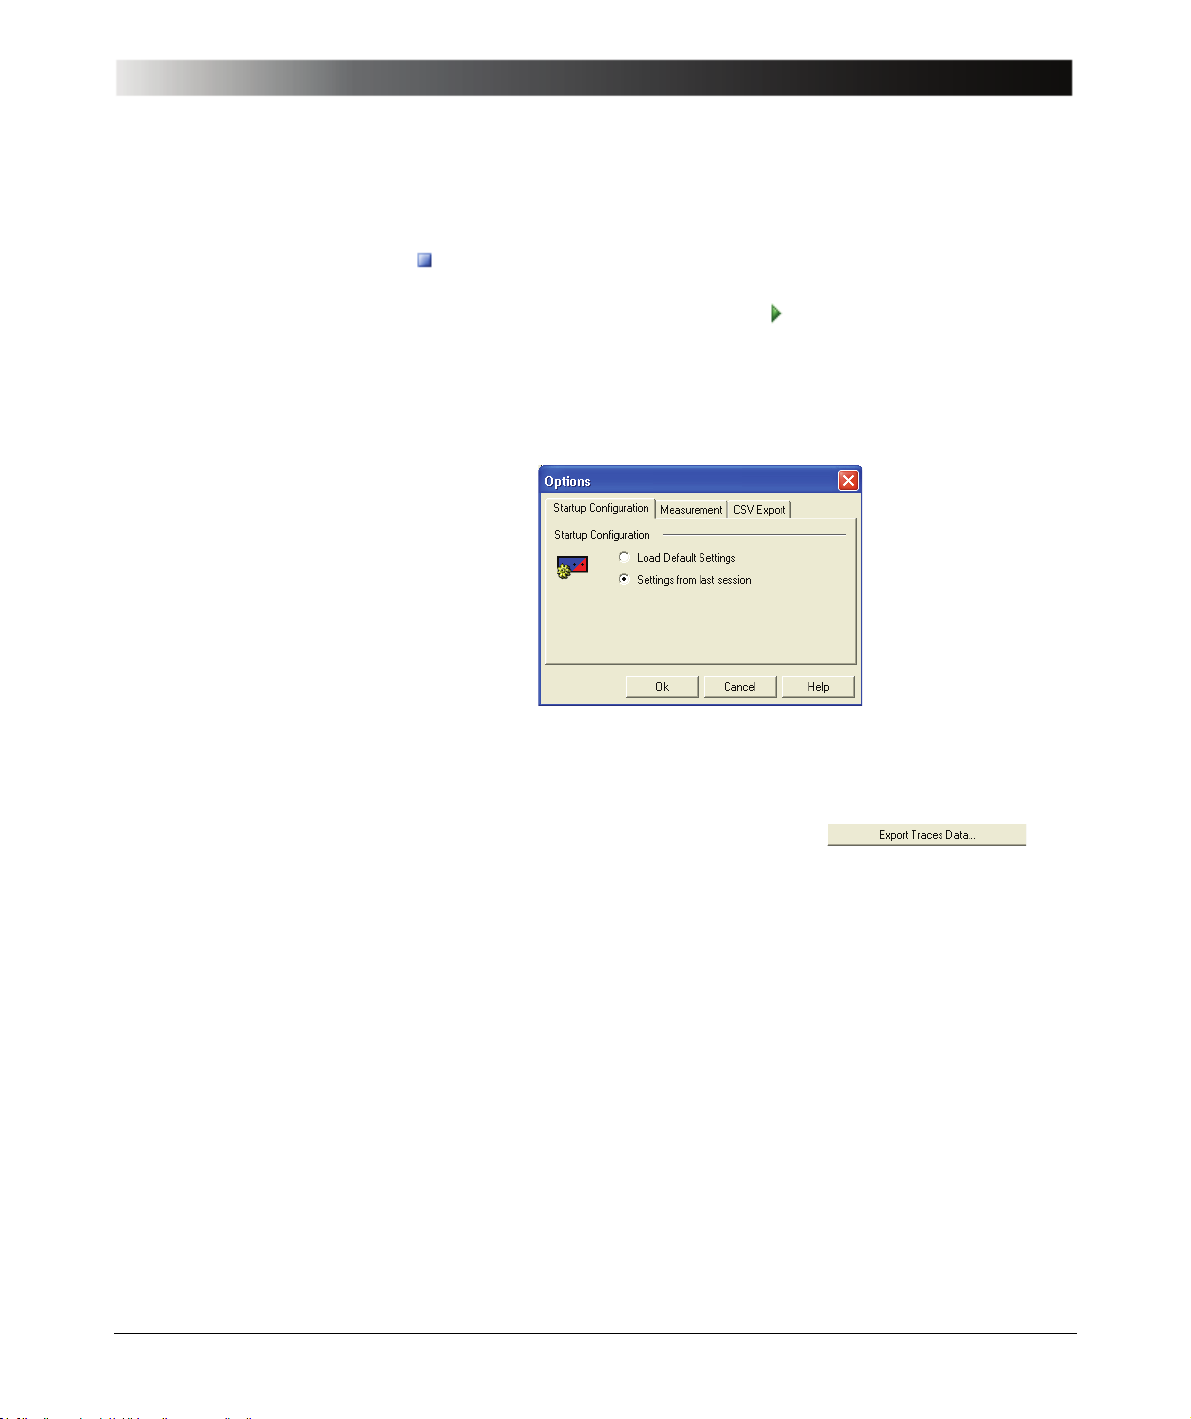
Figure 8-4:
Setting the startup
configuration
Common Functions
After loading a .Bode file the stored measurement data is displayed. To preserve
these values, the measurement is held (the Stop Measurement toolbar
button is activated). In this state you can change display options and use
cursors to read measurement data. To continue with your measurement, click
the Continuous Measurement toolbar button .
Hint: To ensure that the Bode 100 starts with the same configuration as in your
last session, click Options on the Tools menu, click the Startup Configuration
tab, and then select Settings from last session.
8.3.2 Exporting Measurement Data
In the Frequency Sweep and Frequency Sweep (External Coupler) modes,
you can export the measurement data by clicking the
button. In addition to the trace (measurement) data, all equipment settings are
exported into a comma separated .csv file. This file format can be easily
processed by standard spread-sheet analysis tools such as Excel
always contains the real and the imaginary part of the measured parameter (e.g.
gain). Additionally, the measurement data in the selected output format is
included.
Hint: If you have selected Settings from last session the calibration settings
of you last session are NOT loaded. This is done on purpose since your
measurement setup might have changed since you last used the Bode 100. If
you want to load measurement settings including the calibration data, use the
Bode 100 file functions (see 8.3.1 "Loading and Saving the Equipment
Configuration" on page 98). However, we recommend to recalibrate the
Bode 100 each time you start a new work session.
®
. The .csv file
99
Page 100
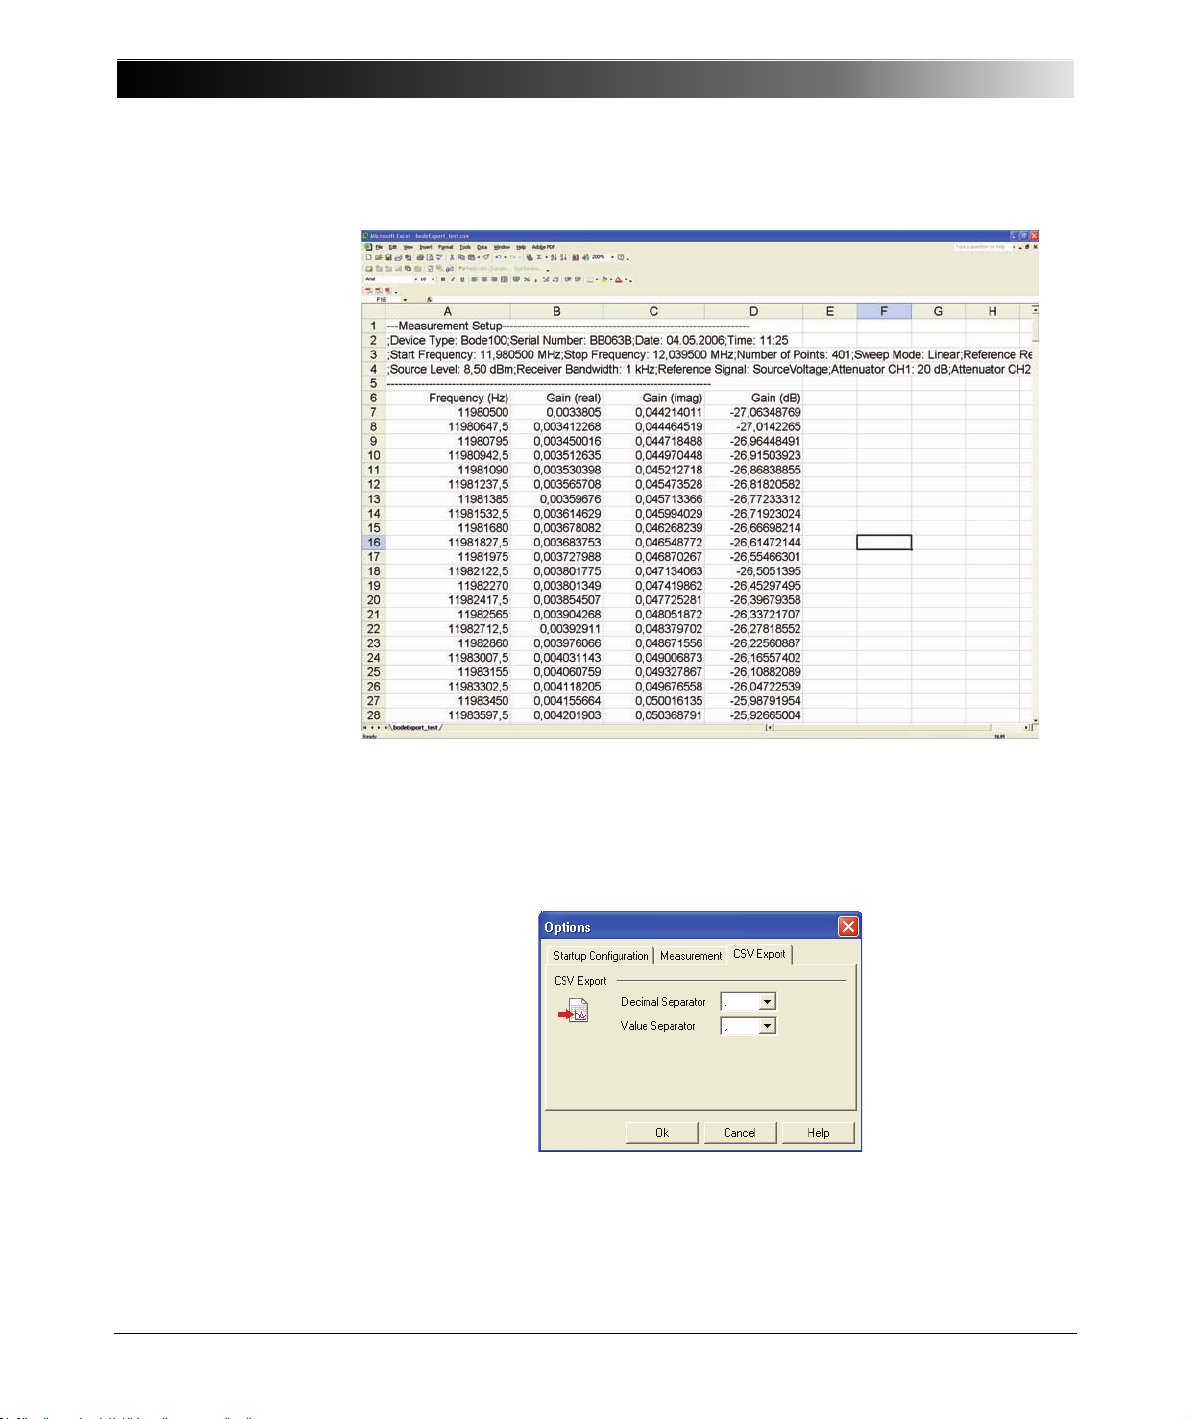
Bode 100 User Manual
Figure 8-5:
Displayed CSV file data
Figure 8-6:
Selecting the
separators
100
To adapt the .csv file to your requirements, you can choose between different
decimal and value separ at or s. To sele ct the sep ar ato rs you want to use, clic k
Options on the Tools menu, click the CSV Export tab, and then select the
decimal and value separators.
 Loading...