

Page 1
User ’s Guide
http://www.omega.com
e-mail: info@omega.com
V R 2 0 0
A P P L I C A TION SOFTW A R E
Data Viewer Instruction Manual
Page 2

OMEGAne t®On-Line Service Internet e-mail
h t t p : / / w w w.omega.com i n f o @ o m e g a . c o m
Servicing North America:
USA: One Omega Drive, Box 4047
ISO 9001 Certified Stamford, CT 06907-0047
Tel: (203) 359-1660 FAX: (203) 359-7700
e-mail: info@omega.com
Canada: 976 Bergar
Laval (Quebec) H7L 5A1
Tel: (514) 856-6928 FAX: (514) 856-6886
e-mail: info@omega.ca
For immediate technical or application assistance:
USA and Canada: Sales Service: 1-800-826-6342 / 1-800-TC-OMEGA
Customer Service: 1-800-622-2378 / 1-800-622-BEST
Engineering Service: 1-800-872-9436 / 1-800-USA-WHEN
TELEX: 996404 EASYLINK: 62968934 CABLE: OMEGA
Mexico and
Latin America: Tel: (001) 800-826-6342 FAX: (001) 203-359-7807
En Espan˜ol: (001) 203-359-7803 e-mail: espanol@omega.com
SM
SM
SM
Servicing Europe:
Benelux: Postbus 8034, 1180 LAAmstelveen, The Netherlands
Tel: (31) 20 6418405 FAX: (31) 20 6434643
Toll Free in Benelux: 0800 0993344
e-mail: nl@omega.com
Czech Republic: ul. Rude armady 1868, 733 01 Karvina-Hranice
Tel: 420 (69) 6311 8 9 9 FAX: 420 (69) 631111 4
Toll Free: 0800-1-66342 e-mail: czech@omega.com
France: 9, rue Denis Papin, 78190 Trappes
Tel: (33) 130-621-400 FAX: (33) 130-699-120
Toll Free in France: 0800-4-06342
e-mail: france@omega.com
Germany/Austria: Daimlerstrasse 26, D-75392 Deckenpfronn, Germany
Tel: 49 (07056) 3017 FAX: 49 (07056) 8540
Toll Free in Germany: 0130 11 21 66
e-mail: info@omega.de
United Kingdom: One Omega Drive, River Bend Technology Centre
ISO 9002 Cert i f i e d Northbank, Irlam, Manchester
M44 5EX, United Kingdom
Tel: +44 (0) 161 777-6611 FAX: +44 (0) 161 777-6622
Toll Free in United Kingdom: 0800-488-488
e-mail: info@omega.co.uk
It is the policy of OMEGA to comply with all worldwide safety and EMC/EMI regulations that
a p p l y. OMEGA is constantly pursuing certification of its products to the European New Appro a c h
D i rectives. OMEGA will add the CE mark to every appropriate device upon cert i f i c a t i o n .
The information contained in this document is believed to be correct, but OMEGA Engineering, Inc. accepts
no liability for any errors it contains, and reserves the right to alter specifications without notice.
WARNING: These products are not designed for use in, and should not be used for, patient-connected applications.
Page 3

Forward
Notes
Trademarks
Thank you for purchasing the VR200-SW Data Viewer for Windows95.
This manual describes the precautions, functions, the operating procedures in using this software
on Windows95. Please read this manual thoroughly beforehand to ensure proper use.
Afterwards, keep the manual in a safe place for quick reference whenever a question arises.
For information regarding the precautions, functions, and operating procedures of the View
Recorder VR100/VR200 and the operating procedures of Windows95, refer to the corresponding
manuals.
• The contents of this manual are subject to change without prior notice as a result of
improvements in the software’s performance and functions. Display contents illustrated in this
manual may differ slightly from what actually appear on your screen.
• Every effort has been made in the preparation of this manual to ensure the accuracy of its
contents. However, should you have any questions of find any errors, please contact OMEGA.
• The copy or reproduction of all or any part of the contents of this manual without OMEGA’s
permission is strictly prohibited.
• It is forbidden to use this software on two or more computers simultaneously. It is also
forbidden for two or more users to use this software.
• It is forbidden to lease or rent this software to a third person.
• OMEGA will not guarantee the condition of the software, except for physical damage to the
original disk, once the software packaging is removed.
• OMEGA will not be responsible for any damage caused directly or indirectly as a result of this
software.
• MS, MS-DOS is a registered trademark of Microsoft Corporation.
• Windows is a trademark of Microsoft Corporation.
• Lotus 1-2-3 is a registered trademark of Lotus-Development Corporation.
• Other product names are trademarks or registered trademarks of their corresponding companies.
All Rights Reserved, Copyright © 1998
1
Page 4

2
Page 5

Contents
Index
1
2
3
4
Forward.................................................................................................................................................. 1
Product Overview .................................................................................................................................4
VR200-SW Data Viewer Software ................................................................................................................ 4
Files Created by VR100 or VR200 ................................................................................................................ 4
System Requirements Necessary for Operation ............................................................................................ 4
Before Setup .......................................................................................................................................................................... 5
Setting up the Software .................................................................................................................................................... 6
Chapter 1 Displaying the Measured Data
1.1 Starting and Exiting the Software .........................................................................................................1-1
1.2 Opening a File.......................................................................................................................................1-2
1.3 Changing the Waveform Display Settings............................................................................................1-5
Setting the Details of the Waveform Display ....................................................................................1-5
Selecting the Waveform Display Zone Type ..................................................................................... 1-8
Setting Display Limits on the Displayed Waveform ....................................................................... 1-10
1.4 Changing the Time Axis Scale of the Waveform Display .................................................................1-11
1.5 Reading the Measured Value with the Cursor ....................................................................................1-13
Reading the Measured Value with the Cursor .................................................................................1-13
Appending User-defined Marks/Deleting Marks/Resetting Marks .................................................1-15
Copying Measured Data to the Clipboard........................................................................................1-17
1.6 Displaying Digital Values...................................................................................................................1-18
Displaying Digital Values ................................................................................................................ 1-18
Reading the Measured Value with the Cursor while Displaying Digital Values.............................1-19
Copying Measured Data to the Clipboard while Displaying Digital Values ................................... 1-20
1.7 Saving the Display Settings ................................................................................................................1-21
1.8 Opening TLOG Interval Timeout Data File .......................................................................................1-22
1.9 Displaying Information on TLOG Interval Timeout Data File ..........................................................1-24
Chapter 2 Converting the Displayed Data
2.1 Converting the Data Format..................................................................................................................2-1
2.2 File Format of the Converted Data .......................................................................................................2-3
Chapter 3 Printing the Measured Data with an External Printer
3.1 Setting up the Printer ............................................................................................................................3-1
3.2 Print Previewing....................................................................................................................................3-2
3.3 Printing the Displayed Waveform or Digital Values ............................................................................ 3-3
Chapter 4 Error Messages
4.1 Troubleshooting ....................................................................................................................................4-1
4.2 Error Messages and Corrective Actions ...............................................................................................4-2
Index
3
Page 6

Product Overview
VR200-SW Data Viewer Software
This VR200-SW Data Viewer Software consists of the following software.
• Beagle for VR
This software enables you to display, convert, and print the data saved to the floppy disk by
VR100 or VR200, on the PC. It is capable of displaying waveforms and digital values, making
cursor measurements, converting the measurement data to ASCII/Lotus/Excel formats, and
printing the measured data.
Files Created by VR100 or VR200
• Event File (xxx.dat)
File containing the event data sampled at the specified sampling interval.
The event data can be displayed, converted to a different data format, or printed using this
software.
• Display data file (xxx.dat)
File containing the data used to display the waveform on the LCD screen of the VR100 or
VR200.
The display data can be displayed, converted to a different data format, or printed using this
software.
• Information file (xxx.inf)
File containing event, power failure, and alarm information in ASCII format.
This file is opened for obtaining event, power failure, and alarm information with this software.
• Setting list file (xxx.lst)
File containing a list of settings in ASCII format. Not used by this software.
• Setting file (xxx.pnl, xxx.pns)
File containing setting values for the VR100 or VR200 in ASCII format. Not used by this
software.
System Requirements Necessary for Operation
• Personal computer
Personal computer on which Windows95 can run.
CPU: 80486DX4 or higher (Pentium 120 Mhz or higher recommended)
Memory: 16 MB of more (24 MB or more recommended)
•OS
Windows 95
• Floppy disk drive
3.5 inch 1.44 MB (MS-DOS compatible). Floppy disk also used in setting up this software.
• Hard disk
15 MB of free disk space or more
• Display
Display supported by Windows95 with analog RGB and 32000 colors or more (65536 colors or
more recommended).
• Printer
Printer supported by Windows95
• Mouse
Mouse supported by Windows95
4
Page 7

Before Setup
• Backing up the System Floppy Disk
• Procedure on Backing up the System Floppy Disk
Please make a back up floppy disk (2HD 1.44 MB) of the original system floppy disk which
you have purchased. From this point, use the backup floppy disk for setup and for other tasks.
Also, when setting up the software, set the floppy disk’s write protect switch to allow writing.
From the MS-DOS prompt in Windows or in DOS, type the command, “diskcopy a: a:” (when
the floppy disk drive is “a”) and execute the backup. Then, follow the instructions on the
screen.
5
Page 8
Setting up the Software
Operation
To setup the VR200-SW Data Viewer Software (Beagle for VR), start the setup program by
following the steps below.
1. Turn the computer on and start Windows95.
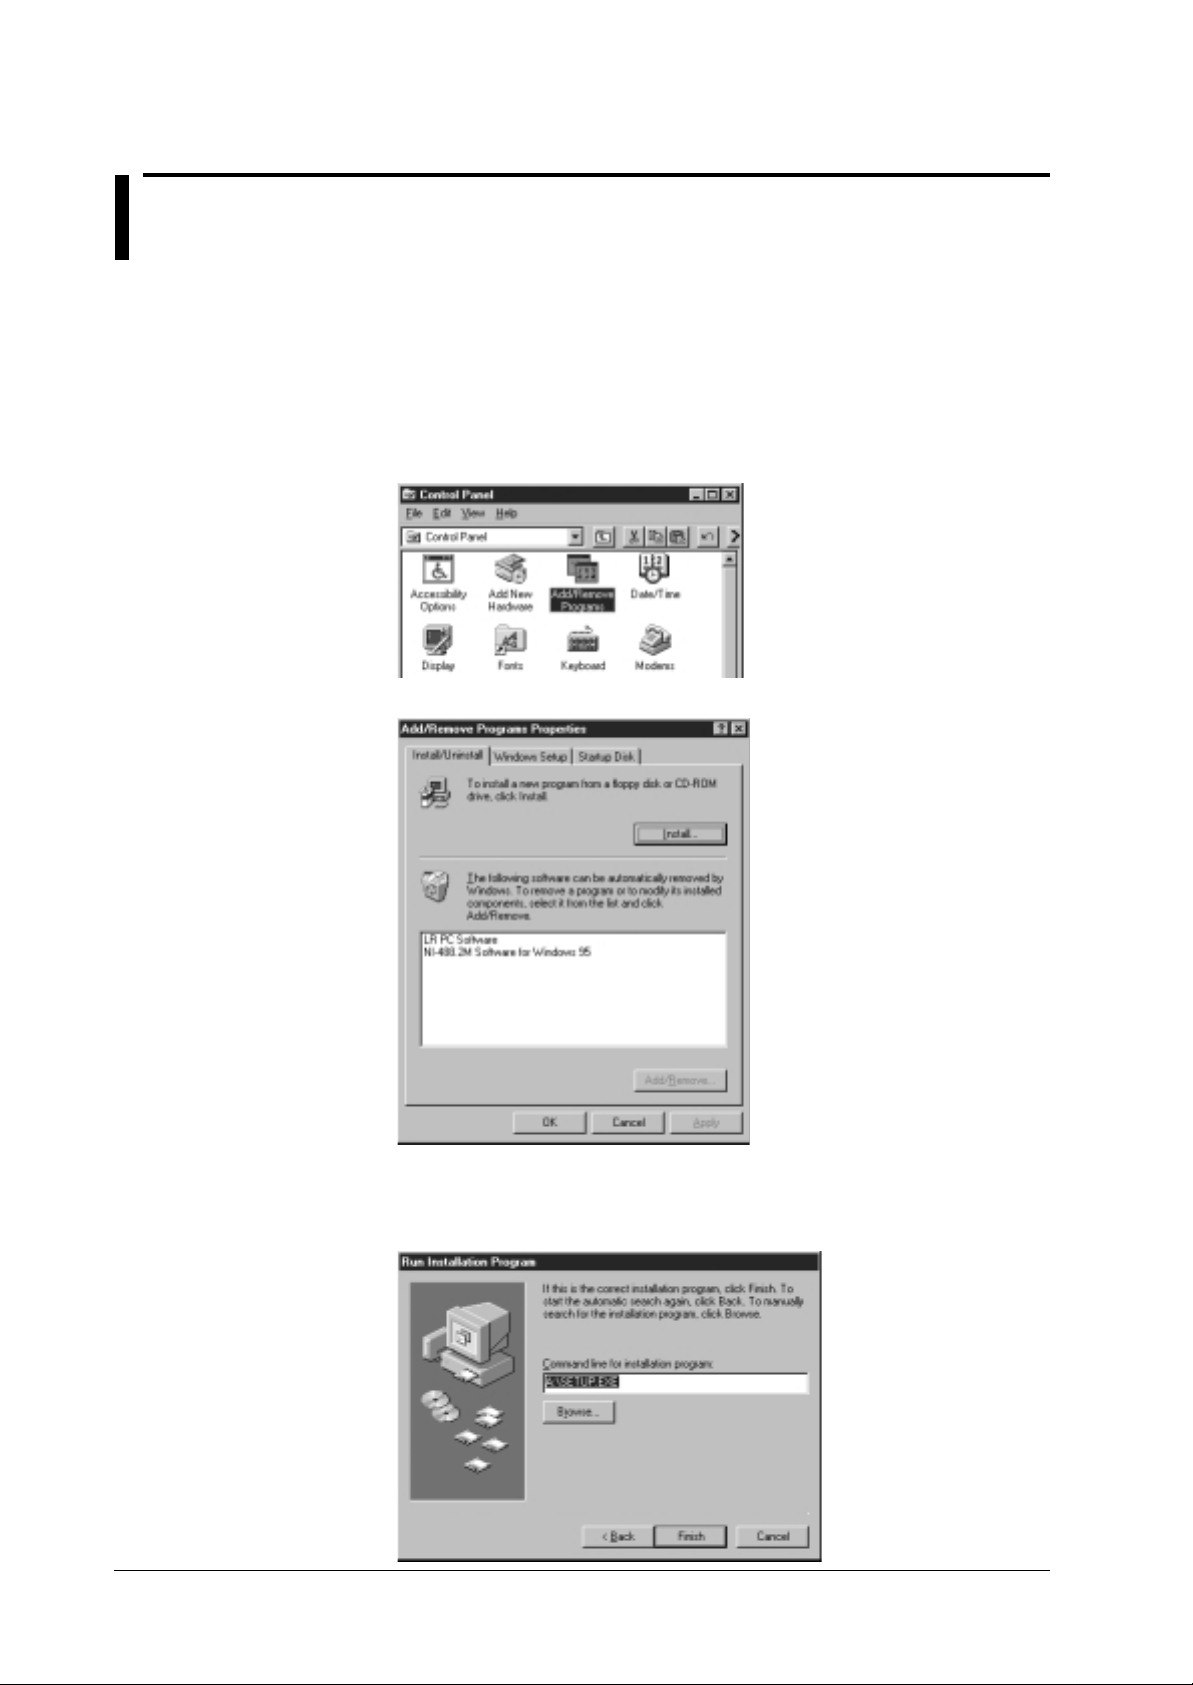
2. Click the “Start” button and point to “Settings.” Open the “Control Panel” and double click
“Add or Remove Programs.”
3. Click “Install” on “Install/Uninstall.” The installer starts.
4. Set the system floppy disk (backup copy) in the floppy disk drive and click “Next.”
5. Check that the “Command line for installation program” textbox is set to “a:\setup.exe” and
click “Finish.”
6
Page 9
Setting up the Software
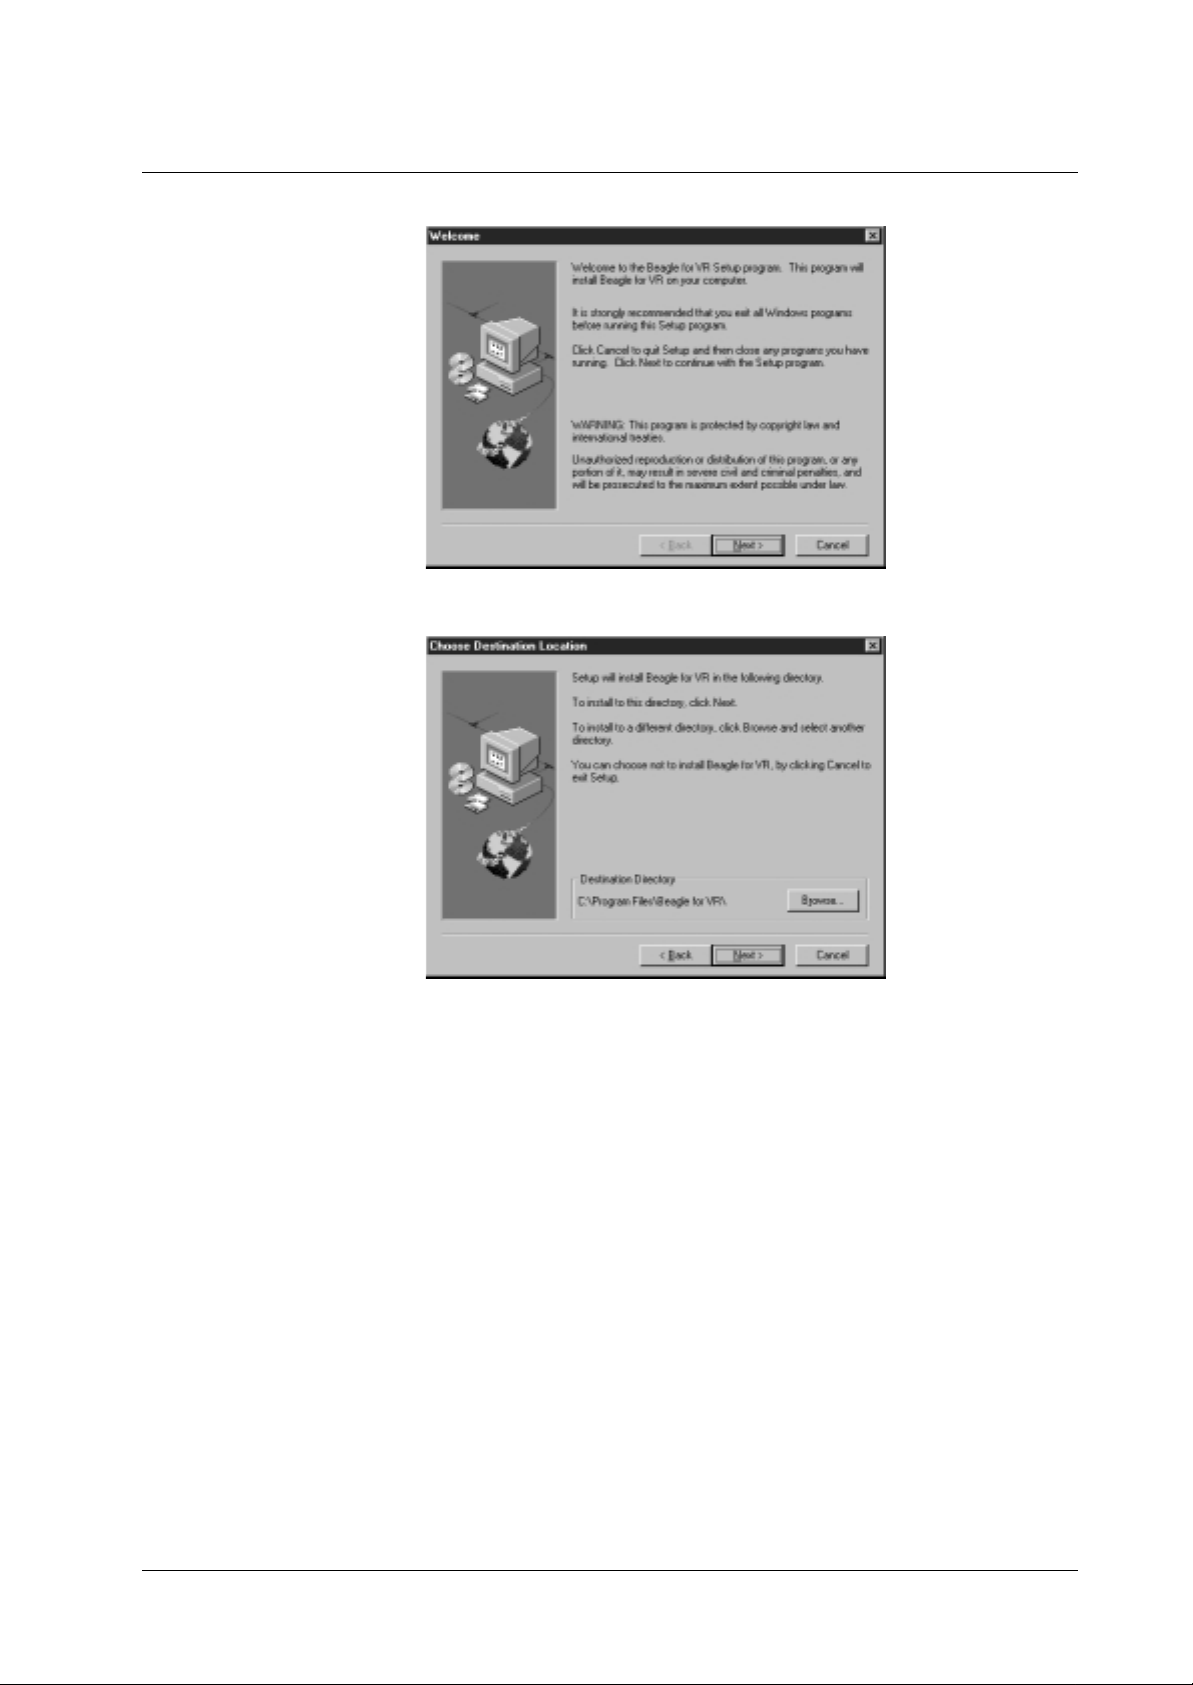
6. Follow the setup program instructions. Click “Next.”
7. The setup program asks where to install the software. If you wish to change the destination,
click “Browse...” and enter a new location. After setting the destination, click “Next.”
7
Page 10
Setting up the Software
Explanation
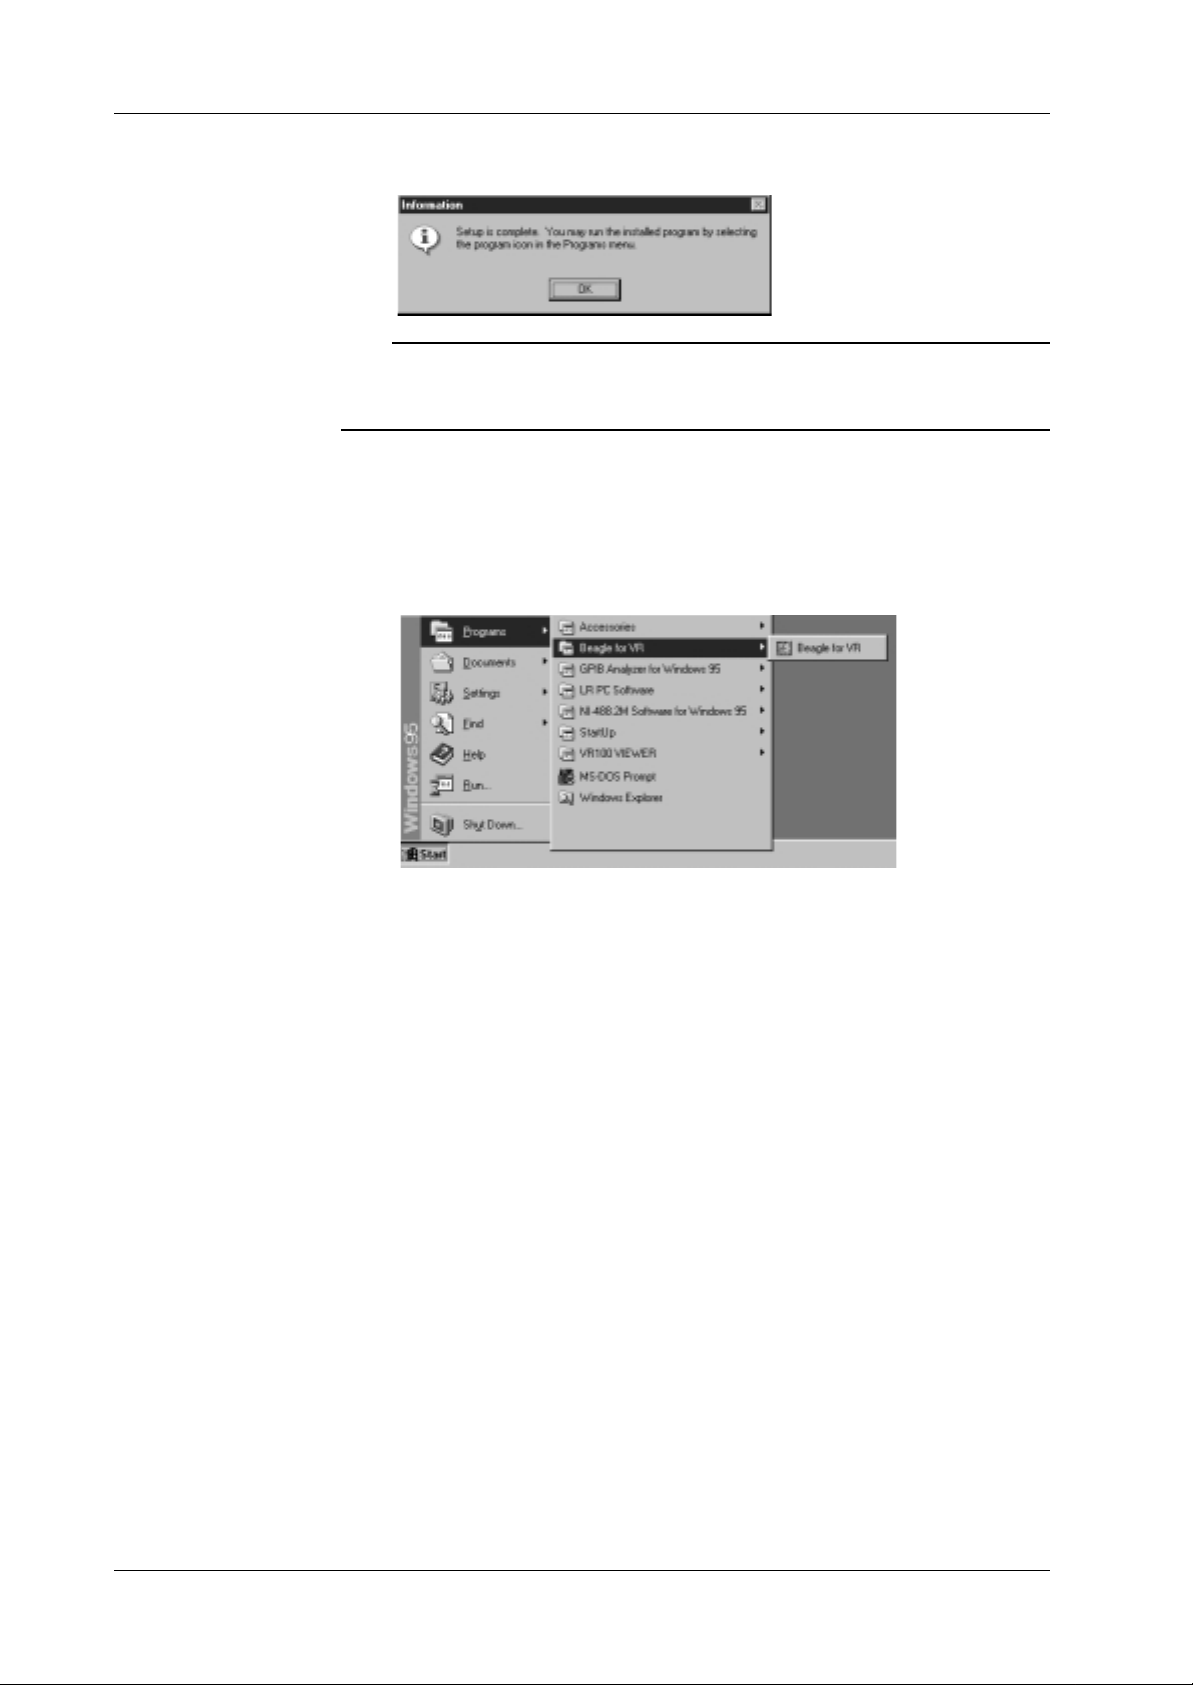
8. If the installation completes correctly, the following message is displayed. Click “OK.”
Note
The following folders are created when this software is setup correctly.
• Destination folder\Program: Contains the VR200-SW Data Viewer software
• Destination folder\Sample: Contains sample data files.
Creating the “Beagle for VR” folder
When this software is setup correctly, “Beagle for VR” folder is created automatically. This
“Beagle for VR” folder is automatically registered in the “Program” menu of the “Start” menu as
shown below.
8
Page 11
1
1.1 Starting and Exiting the Software
Status bar
Menu bar
Tool bar
Operation
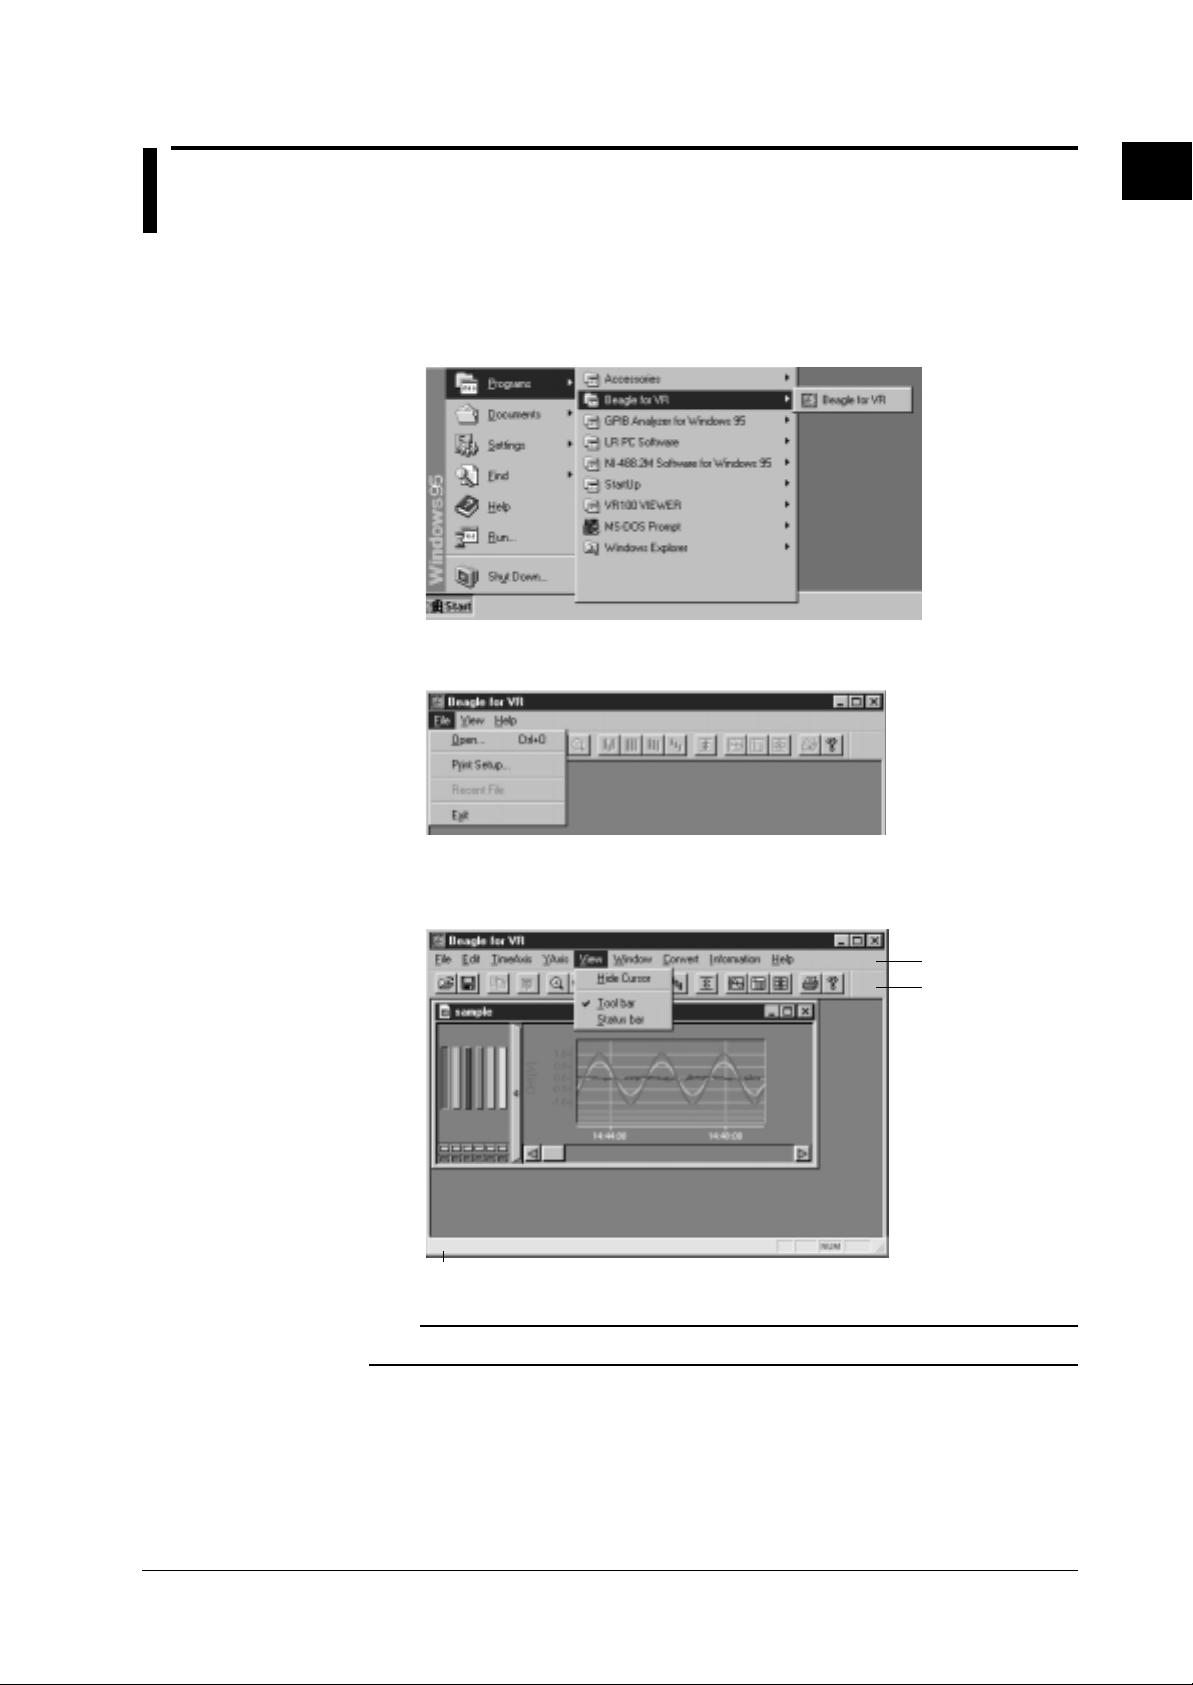
• Starting the software
Click the “Start” button, and point to “Programs.” Next, point to the “Beagle for VR” folder,
then click “Beagle for VR” to start the software.
• Exiting the software
Select either “File”- “Exit” from the menu bar or “Close” on the window.
Displaying the Measured Data
• Displaying the tool bar/status bar
To display the tool bar, select “View” then “Tool bar” from the menu bar.
To display the status bar, select “View” then “Status bar” from the menu bar.
Note
The tool bar and status bar are displayed upon starting the software.
1-1
Page 12
1.2 Opening a File
• Opening a File
After starting the software, the measured data can be read in and the waveform can be
displayed by following the steps below.
Operation
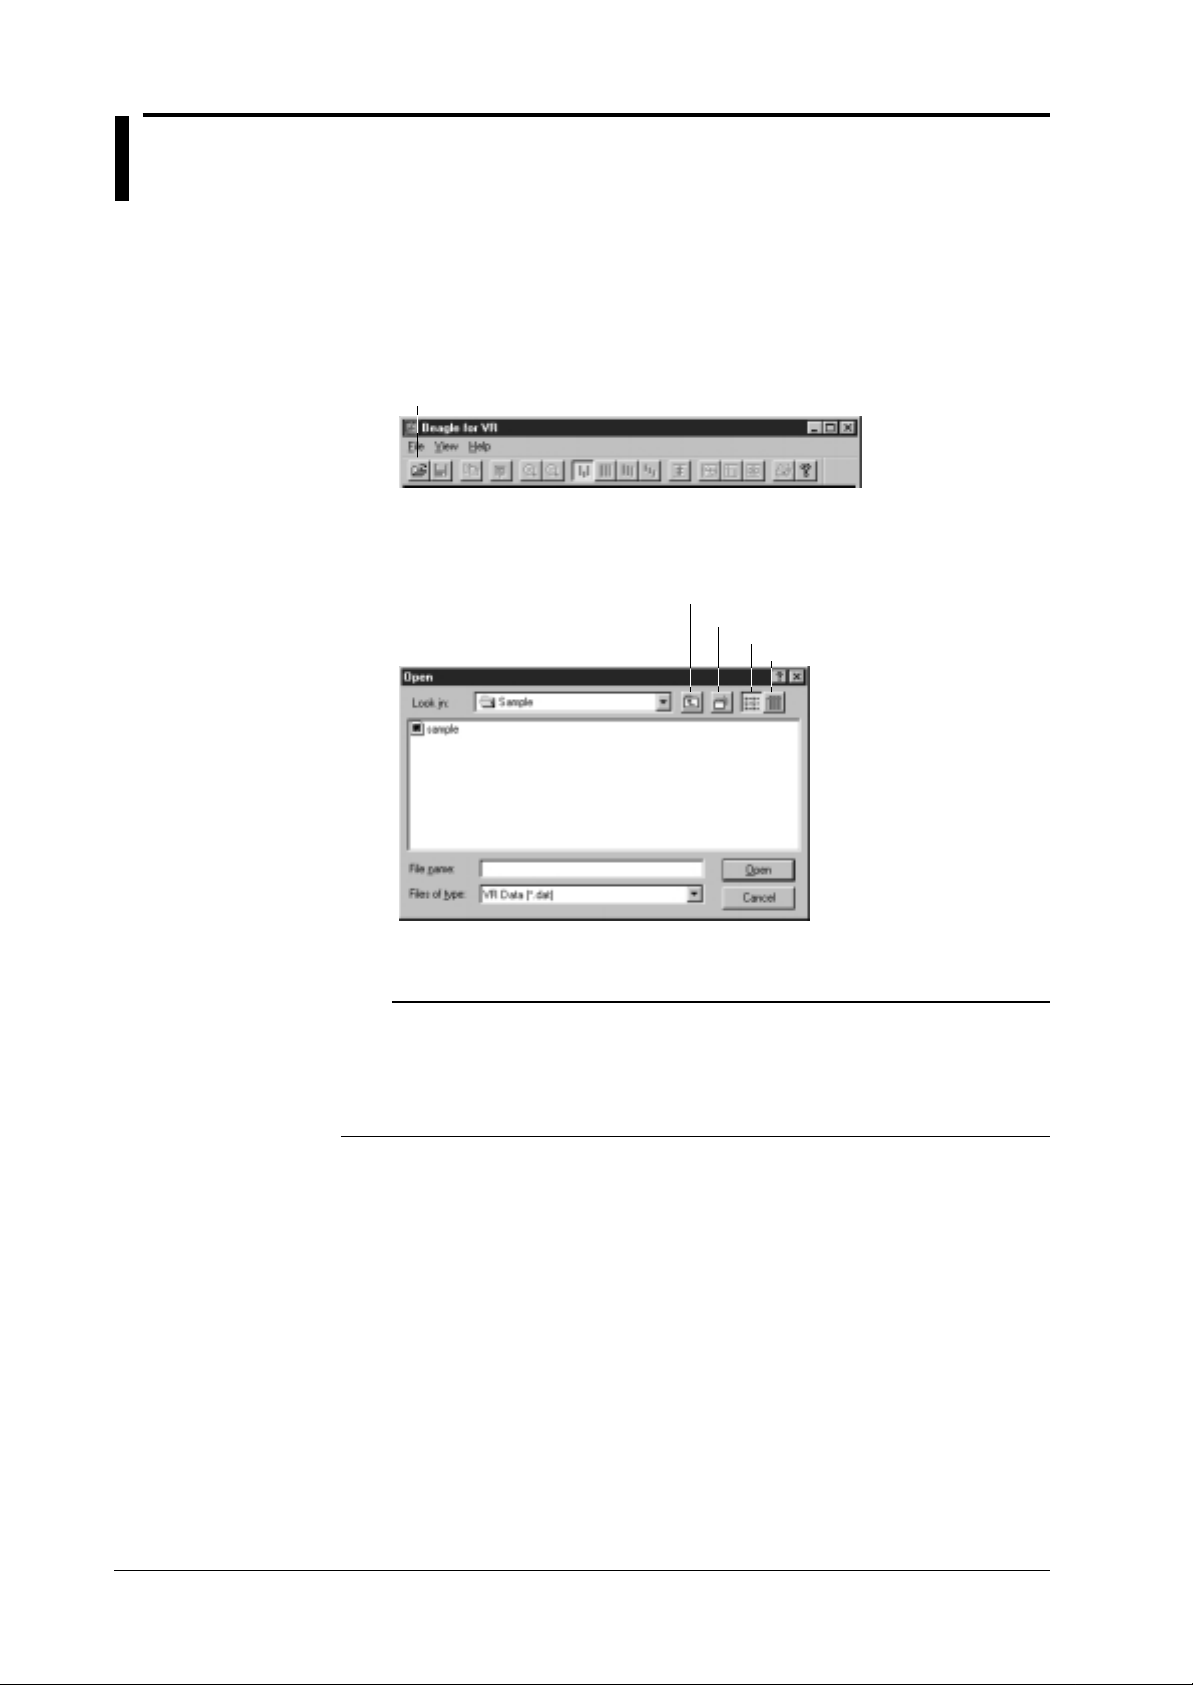
1. Select “File” then “Open” from the menu bar, or click the file open icon on the tool bar.
File open icon
2. Select the file to display from the “File name” list box.
Select a file with “.dat.” extension. Select the appropriate folder (location of the file) and the
file type as necessary.
Up One Level
Create New Folder
List
Details
3. Click “Open” and the waveform is displayed.
Note
• The number of files that can be opened simultaneously depends on the memory size and free disk space
on the PC.
• When saving files on the VR100 or VR200, if the data file name is set to auto-setting or auto-increment,
event files become “Exxx.dat” and display data files become “Dxxx.dat.”
• It is convenient to copy the data file from the floppy disk to the hard disk for use.
1-2
Page 13

1
Operation
Explanation
1.2 Opening a File
• Viewing the file information
You can view the file information of the displayed waveform by following the steps below.
Displaying the Measured Data
Select “Information” then “File information” from the menu bar. Information similar to the one
shown below is displayed.
When displaying an event file
:Event data
When displaying a display data file
:Display data
Display/enter comments
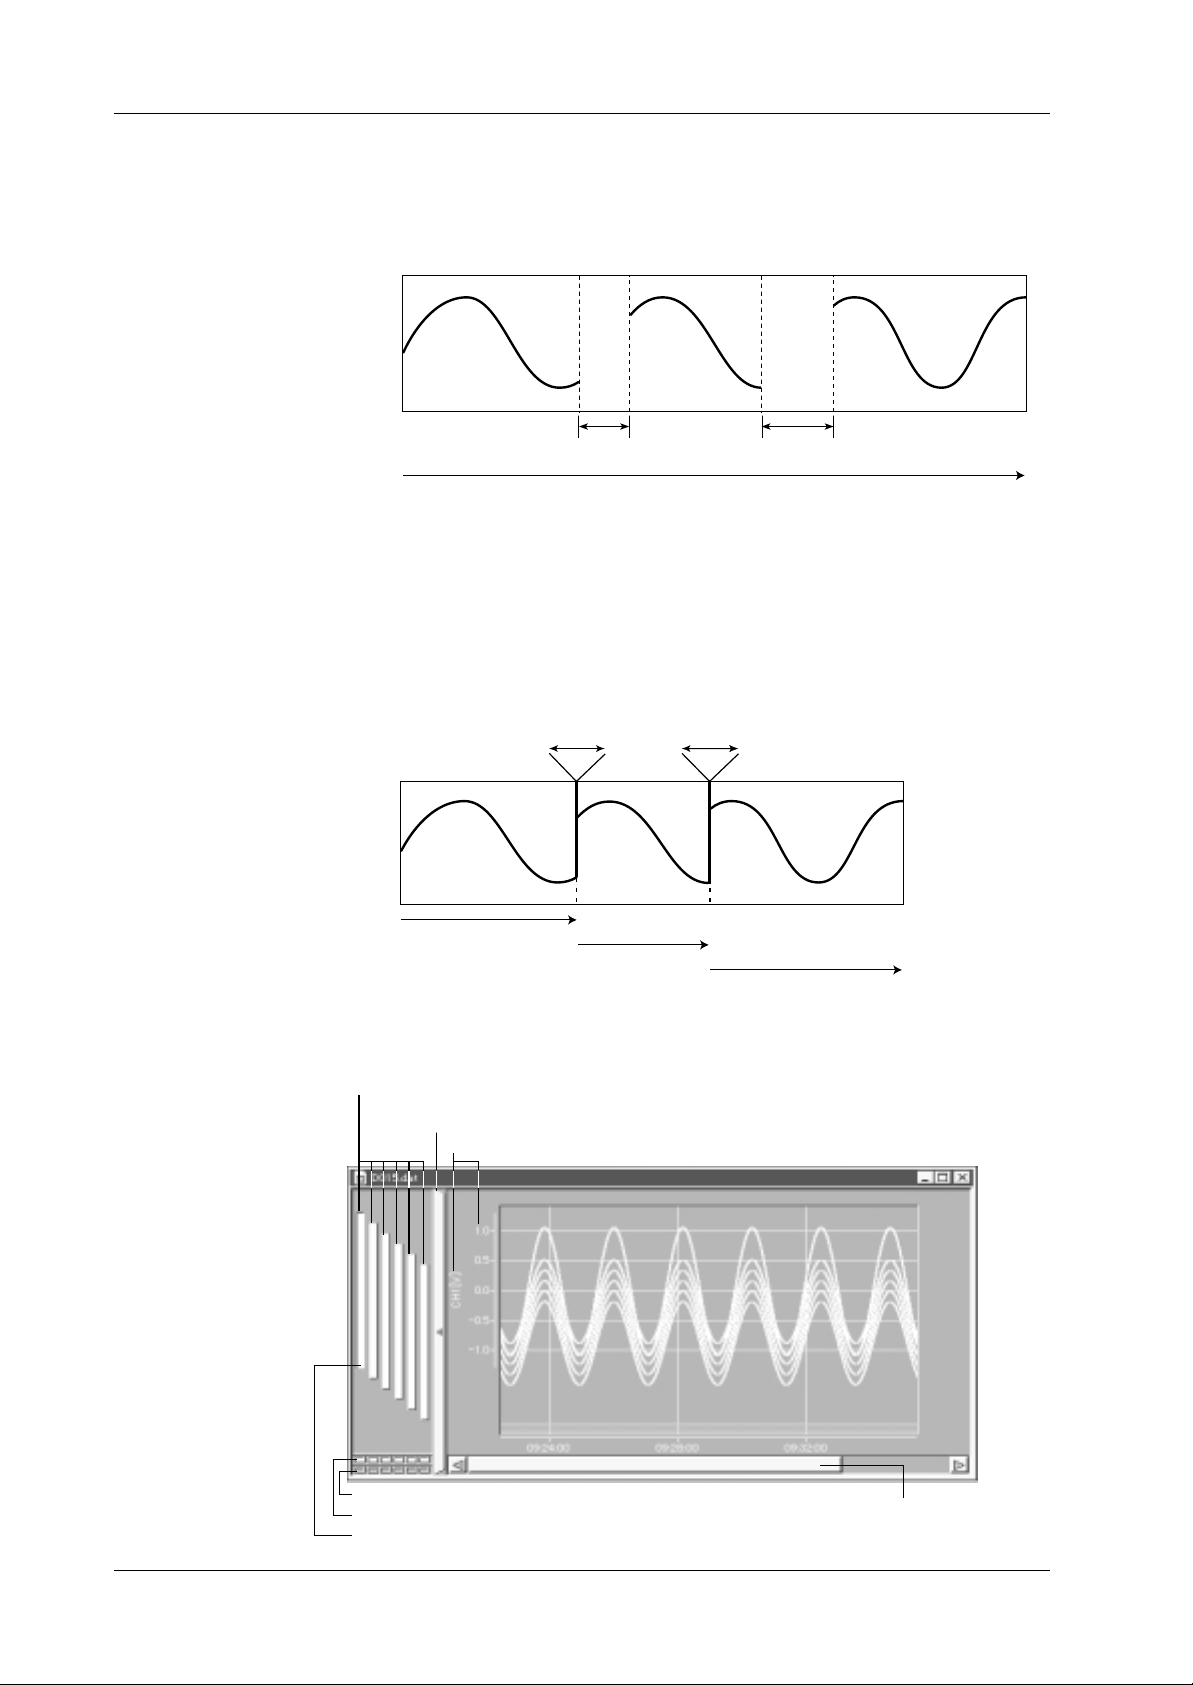
• Displaying event files containing power failure information data
• When displaying an event file containing power failure information data, the waveform data
is displayed with incorrect time information. (The time of the measurement before the power
failure is shifted by the amount of time of the power failure duration.)
• When displaying the waveform of an event file containing power failure information data,
the data indicating the power failure duration is displayed as one point with a value larger
than the range on the top edge of the waveform display area. This is displayed as one point
with a value larger than the range on the digital value display.
The case with two power failure information data
power failure power failure
Displayed with the time
shifted by the duration
of the power failure
Displayed with
the time shifted
by the duration
of the power
failure
Displayed with correct time
1-3
Page 14
e
1.2 Opening a File
• Displaying display data files containing power failure information data
• When the information file containing power information data exists in the same folder as the
display data file, the power failure duration is displayed with a blank section. (The measured
data is displayed with correct time information.)
The case with two power failure information data
power failure power failure
time
• When the information file containing power failure information data does not exists in the
same folder as the display data file, the data indicating the power failure duration is displayed
as one point with a value larger than the range on the top edge of the waveform display area.
This is displayed as one point with a value larger than the range on the digital value display.
(The measured data is displayed with incorrect time information. The time of the
measurement before the power failure is shifted by the amount of time of the power failure
duration.)
The case with two power failure information data
power failure power failure
Displayed with the time
shifted by the duration
of the power failure
Displayed with
the time shifted
by the duration
of the power
failure
Displayed with correct time
• Waveform display example
Click to select the active waveform (waveform for which tags, units, and scale ar
Click to zoom in or zoom out on the waveform display area.
Display of tag, unit, and scale of the active waveform
Alarm display On/Off (CH1, CH2, CH3, CH4, CH5, CH6)
Waveform display On/Off (CH1, CH2, CH3, CH4, CH5, CH6)
Waveform zone display
displayed. Ch1, CH2, CH3, CH4, CH5, CH6)
Scroll the displayed
waveform in the time
axis direction
1-4
Page 15
1
1.3 Changing the Waveform Display Settings
Setting the Details of the Waveform Display
While displaying the waveform, you can change the settings of the following items by following
the steps below.
• Waveform display On/Off, Alarm display On/Off
• Tag
• Unit
• Scale
Sets the display range in order to display the measured waveform with an appropriate scale.
• Zone
Sets the display position on the waveform display area (zone). When displaying multiple
waveforms, you can position each waveform so that it does not overlap.
• Trip Point
Sets the position of the horizontal line used to mark a certain value on the waveform display
area. Also, sets the display of this line On/Off.
• Display color
Sets the color of the displayed waveform.
Operation
1. Select “Yaxis” then “Detail...” from the menu bar.
Displaying the Measured Data
Note
When displaying the waveform from a data file saved on a VR100 or VR200 4CH input model, the settings
for CH5 and CH6 can not be changed
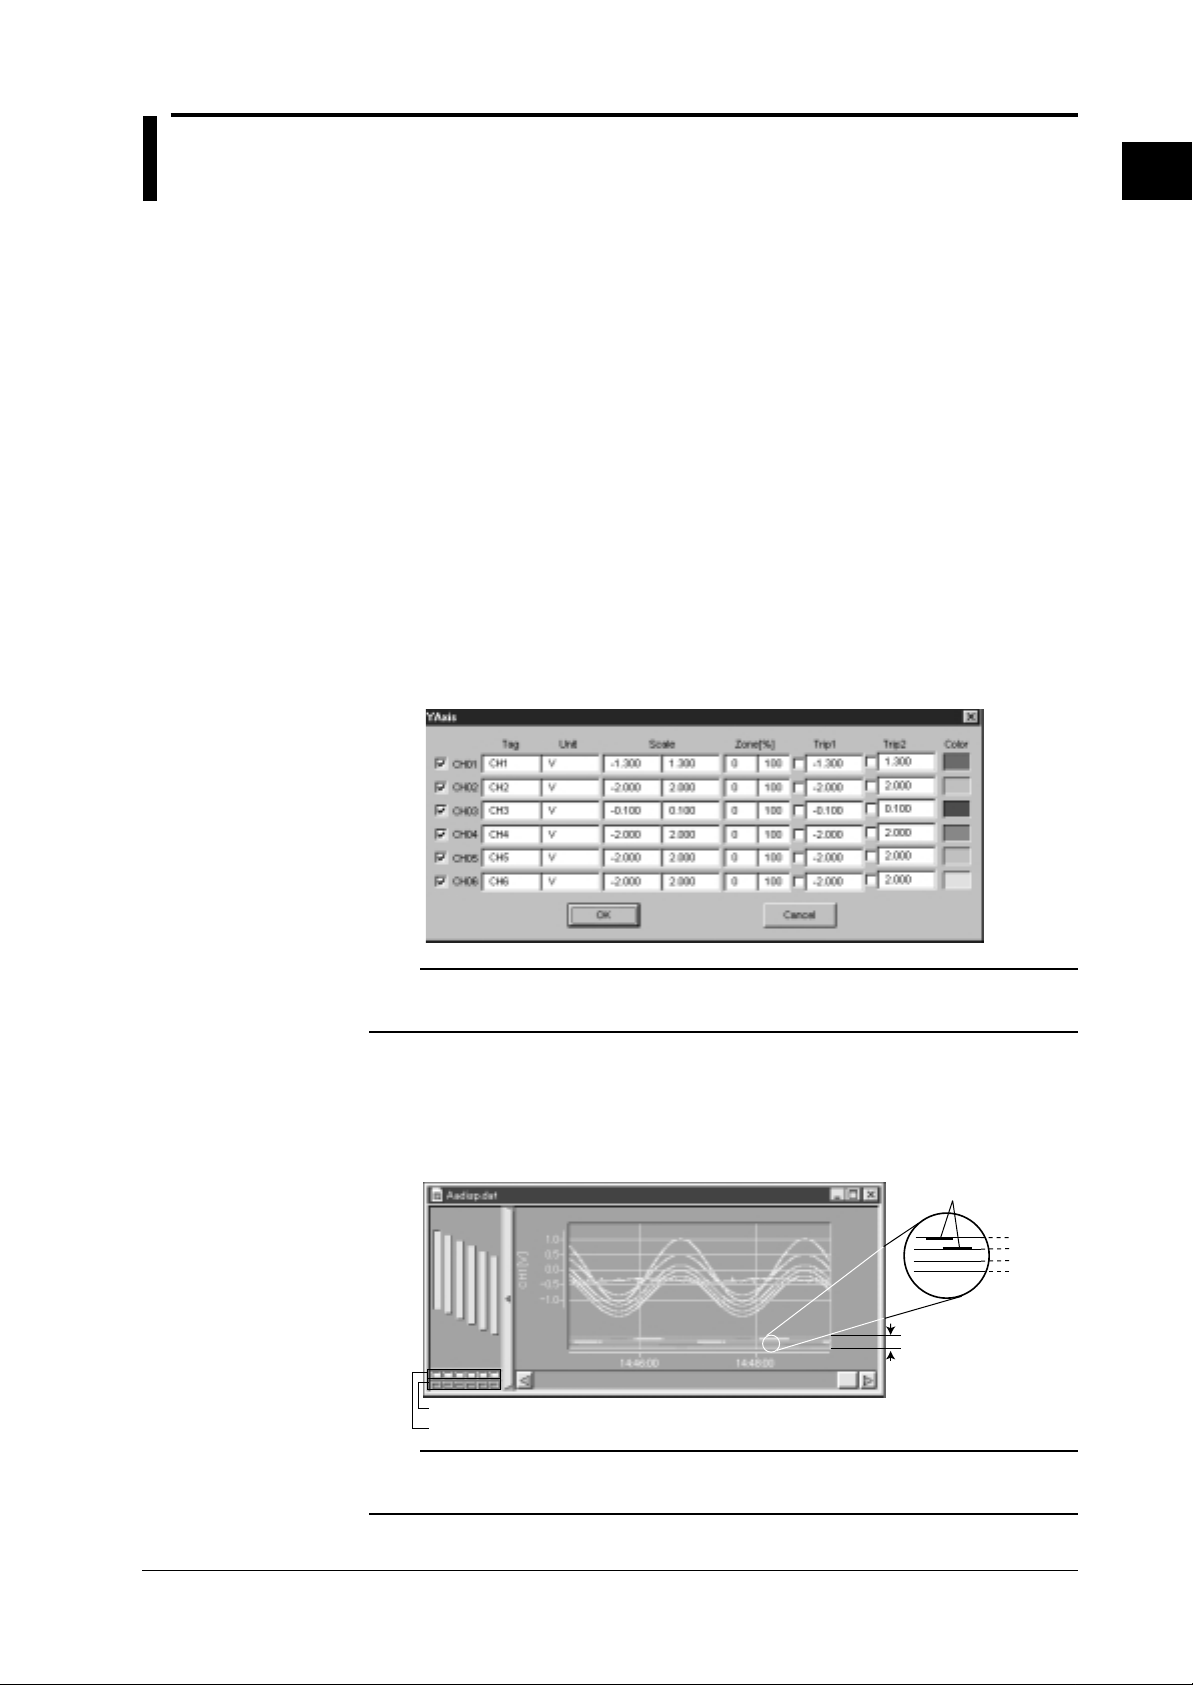
• Turning the waveform display On/Off, and alarm display On/Off
2. To turn the waveform display On/Off, click each checkbox for the channels, or click each
channel button on the lower left corner of the waveform display area.
3. To turn the alarm display On/Off, click each channel button on the lower left corner of the
waveform display area.
Alarm generation
Displays alarm
Alarm display On/Off (CH1, CH2, CH3, CH4, CH5, CH6)
Waveform display On/Off (CH1, CH2, CH3, CH4, CH5, CH6)
Note
Alarms (maximum of 4 alarms per channel) generated on the VR100 are displayed at the bottom of the
waveform display area with the same color as the waveform color for each channel.
Level 1
Level 2
Level 3
Level 4
1-5
Page 16

1.3 Changing the Waveform Display Settings
• Setting tags
4. Enter characters in the “Tag” text box for each channel.
• Setting units
5. Enter characters in the “Unit” text box for each channel.
• Setting the scale
6. Set the scale value for each channel. Text box on the left is the minimum value and the
text box on the right is the maximum value.
Note
Input range is from -999999 to 999999.
• Setting zones
7. Sets the zone for each channel in terms of percentages of the waveform display area. Text
box on the left is the minimum value and the text box on the right is the maximum value.
Note
• The input range for the minimum value is from 0 to 99 % and the input range for the maximum value is
from 1 to 100 %.
• The bottom of the display area is 0 % and the top is 100 %.
• Displaying trip point 1 and trip point 2
8. Click the “Trip1” and “Trip2” check boxes for each channel.
9. Input the display positions of trip point 1 and trip point 2 for each channel.
Note
• Trip points can be set to any value within the scale range for each channel.
• Trip point 1 is red and trip point 2 is yellow.
• The actual trip points displayed on the waveform display are the trip points for the active waveform.
• The display position of a trip point can be changed by dragging the trip point displayed on the right of the
waveform display area.
• Setting the color of the waveform
10. Click the “color” button for each channel.
1-6
11. Set the color.
12. Click “OK.”
13. Click “OK” on the “YAxis” dialog box.
The waveforms and trip points are displayed according to the settings.
Page 17

1
Explanation
Display of tag, unit, and scale of the active waveform
Click to zoom in or zoom out the waveform display area.
Trip point 1
Trip point 2
Click to select the active waveform
(waveform for which tags, units, and scale are displayed. Ch1, CH2, CH3, CH4, CH5, CH6)
Alarm display On/Off (CH1, CH2, CH3, CH4, CH5, CH6)
Waveform display On/Off (CH1, CH2, CH3, CH4, CH5, CH6)
Waveform zone display
Displays
alarm
Scroll the displayed waveform
in the time axis direction
1.3 Changing the Waveform Display Settings
• Waveform display example
Displaying the Measured Data
1-7
Page 18

1.3 Changing the Waveform Display Settings
Selecting the Waveform Display Zone Type
While displaying the waveform, you can select the waveform display zone type as shown, by
following the steps below.
• User zone: Displays according to the position of the zones specified in the “YAxis” “Detail” setting.
• Auto zone: Displays by dividing the waveform display area in equal parts according to the
number of waveforms being displayed.
• Full zone: Displays all waveforms in full zone.
• Slide zone: Displays each waveform by sliding the waveform from the top to bottom of the
waveform display area.
Operation
• To display using user zone: Point to “YAxis” - “Zone” then select “User Zone” from the
menu bar, or click the user zone icon on the tool bar.
• To display using auto zone: Point to “YAxis” - “Zone” then select “Auto Zone” from the
menu bar, or click the auto zone icon on the tool bar.
• To display using full zone: Point to “YAxis” - “Zone” then select “Full Zone” from the menu
bar, or click the full zone icon on the tool bar.
• To display using slide zone: Point to “YAxis” - “Zone” then select “Slide Zone” from the
menu bar, or click the slide zone icon on the tool bar.
User zone icon
Full zone icon
Slide zone icon
Auto zone icon
Explanation
• Example of the waveform display using user zone (when Zone is set to 20 to 80 %)
Zone:80%
100%
Zone:20%
• Example of the waveform display using auto zone (when number of displayed waveforms is 6)
1-8
Page 19

1
1.3 Changing the Waveform Display Settings
• Example of the waveform display using full zone
• Example of the waveform display using slide zone
Displaying the Measured Data
1-9
Page 20

Set to the minimum value of the scale
Set to the maximum value of the scale
1.3 Changing the Waveform Display Settings
Setting Display Limits on the Displayed Waveform
While displaying the waveform, you can set limits on the waveform display by following the
steps below. The display range of the waveform in the Y axis direction is limited to the minimum
and maximum scale values set in the “YAxis”- “Detail”. Measured values which are smaller than
the minimum are set to the minimum value and the measured values which are larger than the
maximum are set to the maximum value and displayed.
Operation
Select “YAxis” then “Limit” from the menu bar or click the limit icon on the tool bar.
Explanation
• Display example when limit is set on the displayed waveform
Limit icon
• Display example when limit is not set on the displayed waveform
1-10
Page 21

1
1.4 Changing the Time Axis Scale of the Waveform
Operation
Display
• Displaying the entire waveform
• Zooming in or zooming out on the waveform display by setting the scale factor
• Zooming in or Zooming out on the waveform display by selecting the scale factor
• Arbitrarily zooming in or zooming out on the waveform display
• Displaying the entire waveform
Displaying the Measured Data
While displaying the waveform, you can change the settings of the following items by following
the steps below.
The waveform is zoomed in or zoomed out in the time axis direction, to display the entire
waveform.
Set a desired scale factor to zoom in or zoom out on the waveform display in the time axis
direction.
Select the scale factor to zoom in or zoom out on the waveform display in the time axis
direction.
Waveform is zoomed in or zoomed out arbitrarily and displayed.
Select “TimeAxis” then “View All” from the menu bar to display the entire waveform.
• Zooming in or zooming out on the waveform display by setting the scale factor
1. Select “TimeAxis” then “Set Scale” from the menu bar.
To zoom in on the display
To zoom out on the display
2. When zooming in on the waveform display, enter the scale factor in the upper box and click
the upper radio button. When zooming out on the waveform display, enter the scale factor in
the lower box and click the lower radio button.
3. Click “OK.”
The waveform is displayed zoomed in or zoomed out in the time axis direction.
Note
• The range for zooming in on the waveform: 1 to 20 times (Integer values)
• The range for zooming out on waveform: 1/1 to 1/1000 times (Denominator: Integer values)
1-11
Page 22

1.4 Changing the Time Axis Scale of the Waveform Display
• Zooming in or zooming out on the waveform display by selecting the scale factor
Selecting “TimeAxis” then “XXX” (scale factor) from the menu bar zooms in or zooms out on
the waveform display in the time axis direction. (Selecting a scale factor larger than 1 results in
zooming in; a scale factor smaller than 1 results in zooming out.)
• Arbitrarily zooming in or Zooming out on the waveform
To zoom in on the waveform display, select “TimeAxis” then “Zoom In” from the menu bar or
click the zoom in icon on the tool bar. To zoom out on the waveform display, select
“TimeAxis” then “Zoom Out” from the menu bar or click the zoom out icon on the tool bar.
The waveform is displayed zoomed in or zoomed out in the time axis direction.
Zoom in icon
Zoom out icon
Explanation
• Scale factor for zooming in and zooming out on the waveform display
The waveform can be zoomed into or zoomed out of in the time axis direction by changing the
number of data* per line** on the time axis. The relation between the scale factor and the
number of data per line is as follows
Scale Relation between the number of data and line
1/1000 1000 data per line
1/500 500 data per line
1/200 200 data per line
1/100 100 data per line
1/50 50 data per line
1/20 20 data per line
1/10 10 data per line
1/5 5 data per line
1/2 2 data per line
1 1 data per line
2 1 data per every 2 lines
5 1 data per every 5 lines
10 1 data per every 10 lines
20 1 data per every 20 lines
* 1 data: 1 set of maximum and minimum data in the case of a display data file.
** 1 line: 1 vertical line on the screen
1-12
Page 23

1
1.5 Reading the Measured Value with the Cursor
Reading the Measured Value with the Cursor
While displaying the waveform, the measured data at the position specified by the cursor can be
read by following the steps below. There are two types of cursors: cursor A and cursor B. The
measured data at cursor A and cursor B and the difference between cursor A and cursor B can be
displayed.
Operation
1. In the waveform display area, set the mouse pointer to the position for reading the measured
data, click and drag the mouse to the position you wish to read to. The point where you first
clicked the mouse is cursor A and the point where you dragged the mouse to is cursor B.
2. Select “Window” then “Display Cursor Value” from the menu bar or click the display cursor
value icon on the tool bar. Cursor value dialog box opens and the time and the measured
values at the positions specified with the cursors are displayed. To make a fine adjustment in
the cursor position, click the arrows in the data number in the cursor value dialog box. The
cursor moves in units of 1 data.
Display cursor value icon
Displaying the Measured Data
Move the cursor in units of 1 data
Difference between the measured value
at cursor position A and the measured value
at cursor position B
Note
• To select the beginning to the end of the measured data, it is convenient to use “Edit” then “Select All”
from the menu bar.
• To clear the cursors from the waveform display area, select “View” then “Hide Cursor” from the menu
bar.
• In the case of event files, a value larger than the range is displayed when reading the measured data
during a power failure with the cursor. In the case of display data files, blank is displayed.
1-13
Page 24

1.5 Reading the Measured Value with the Cursor
Explanation
• Example displaying cursors
cursor A
cursor B
1-14
Page 25

1
1.5 Reading the Measured Value with the Cursor
Appending User-defined Marks/Deleting Marks/Resetting Marks
While displaying the waveform, you can add a mark at any desired position along the time axis by
following the steps below. Also, you can delete marks (trigger mark, event marks, user-defined
marks) displayed at the top of the waveform display area. Furthermore, you can reset the marks
to the condition saved with the VR100 or VR200 (only trigger mark and event marks are
displayed). The three types of marks are as follows:
• Trigger mark: Indicates the trigger point when the measurement was made with the VR100
or VR200.
• Event mark: Indicates the event marks added with the VR100 or VR200.
• User-defined mark: Marks added by the user with this software.
Operation
• Appending user-defined marks
1. Move the mouse cursor to the position you wish to add the user-defined mark and click the
mouse. Cursor is displayed.
2. Select “Edit” - “Append Mark...” from the menu bar or click the add user-defined mark icon
on the tool bar.
add user-defined mark icon
Displaying the Measured Data
3. Enter a label for the user-defined mark in the text box.
4. Click “OK.”
Above the waveform display area at the position where the cursor is displayed, the label for
the user-defined mark is displayed. You can display any number of marks by repeating steps
1 through 4.
Note
• You can not add an user-defined mark when the position of cursor A does not match that of cursor B.
• To rename a mark label, double click the mark you wish to rename, and carry out the steps from step 3.
Double click the mark you wish to rename
1-15
Page 26

1.5 Reading the Measured Value with the Cursor
• Deleting Marks
1. Set using cursor A and cursor B, the range in which you wish to delete the marks on the
waveform display area.
Refer to “Reading the Measured Value with the Cursor” (page 1-13) for instructions on
setting cursor A and cursor B.
2. Select “Edit” then “Delete Mark” from the menu bar.
Trigger mark, event marks, and user-defined marks in the specified range are deleted.
• Resetting Marks
Select “Edit” then “Reset Mark” from the menu bar.
Only trigger mark and event marks which were deleted are displayed. User-defined marks
are not displayed.
Explanation
• Example of Mark Display
Event mark User-defined mark
Trigger mark
1-16
Page 27

1
Copying Measured Data to the Clipboard
While displaying the waveform, you can copy the measured data in the range specified by the
cursor to the clipboard by following the steps below.
Operation
1. Set the range you wish to copy the measured data to the clipboard in the waveform display
area using cursor A and cursor B.
Refer to “Reading the Measured Value with the Cursor” (page 1-13) for instructions on
setting cursor A and cursor B.
2. Select “Edit” then “Copy” from the menu bar or click the copy icon on the tool bar. The
measured data is copied to the clipboard.
Copy icon
Note
• The maximum number of data that can be copied to the clipboard is 1000 data points. For display data
files, this constitutes 1000 sets of maximum and minimum data points.
• The number of channels copied to the clipboard is the number of all the channels saved in the data file.
(It does not depend on the On/Off condition of the waveform display.)
1.5 Reading the Measured Value with the Cursor
Displaying the Measured Data
Explanation
• Example of copying the event file to the clipboard
Date/time of measurement
CH1 Measured value
CH2 Measured value
CH6 Measured value
• Example of copying the display data to the clipboard
Measured value(CH1 min. value,CH1 max. value, ...
Date/time of measurement
CH1 min. value CH2 min. value
CH6 min. value, CH6 max. value)
CH1 max. value
CH2 max. value
Measured value
(CH1, ..., CH6)
Power failure
information data
Power failure information data
1-17
Page 28

1.6 Displaying Digital Values
Displaying Digital Values
The measured data can be displayed in digital value format by following the steps below.
Operation
Select “Window” then “Display Digital” or click the digital value display icon on the tool bar.
A separate window for displaying digital values opens, and the measured data is displayed in
digital value format.
Note
When the digital value display window is maximized and you wish to return to the waveform display,
select “Window” then “Display graph” or click the graph display icon on the tool bar.
Explanation
• Example of digital value display
Date/time of measurement
Data number
Ch1 min. value
Graph display icon
Digital value display icon
Ch1 max. value
1-18
Page 29

1
1.6 Displaying Digital Values
Reading the Measured Value with the Cursor while Displaying Digital Values
While displaying the digital values, you can read the measured data at the position specified with
the cursor by following the steps below. There are two types of cursors: cursor A and cursor B.
The measured data at cursor A and cursor B and the difference between cursor A and cursor B can
be displayed.
Operation
1. While displaying the digital values, set the mouse pointer to the Date[No.] item of the
measured data you wish to read, click and drag the mouse down to the next position. The
point where you first clicked the mouse is cursor A and the point where you dragged the
mouse to is cursor B.
Click at
cursor A
position
Drag to
cursor B
position
Displaying the Measured Data
2. Select “Window” then “Display cursor value” or click the cursor value display icon on the
tool bar. Cursor value dialog box opens and the time and the measured values at the
positions specified with the cursors are displayed. To make a fine adjustment in the cursor
position, click the arrows in the data number in the cursor value dialog box. The cursor
moves in units of 1 data.
Cursor value display icon
Move the cursor in units of 1 data
Difference between the measured value
at cursor position A and the measured value
at cursor position B
Note
• To select the beginning to the end of the measured data, it is convenient to use “Edit” then “Select All”
from the menu bar.
• To clear the cursor from the waveform display area, select “View” then “Hide Cursor” from the menu
bar.
• In the case of event files, a value larger than the range is displayed when reading the measured data
during the power failure with the cursor. In the case of display data files, blank is displayed.
1-19
Page 30

1.6 Displaying Digital Values
Copying Measured Data to the Clipboard while Displaying Digital Values
While displaying the waveform, you can copy the measured data in the range specified by the
cursor to the clipboard by following the steps below.
Operation
1. Set the range you wish to copy the measured data to the clipboard on the Data[No.] items
using cursor A and cursor B.
Refer to “Reading the Measured Value with the Cursor while Displaying Digital Values”
(page 1-19) for instructions on setting cursor A and cursor B.
2. Select “Edit” then “Copy” from the menu bar or click the copy icon on the tool bar. The
measured data is copied to the clipboard.
Copy icon
Note
• The maximum number of data that can be copied to the clipboard is 1000 data points. For display data
files, this constitutes 1000 sets of maximum and minimum data points.
Explanation
• Example of copying the event file to the clipboard
Date/time of measurement
CH1 Measured value
CH2 Measured value
CH6 Measured value
• Example of copying the display data to the clipboard
Measured value(CH1 min. value,CH1 max. value, ...
Date/time of measurement
CH1 min. value CH2 min. value
CH6 min. value, CH6 max. value)
CH1 max. value
CH2 max. value
Measured value
(CH1, ..., CH6)
Power failure
information data
1-20
Power failure information data
Page 31

1
1.7 Saving the Display Settings
While displaying the waveform or the digital values, you can save the display settings to a file by
following the steps below. There is only 1 file for saving the display settings.
Operation
Select “File” then “Save Display Settings” from the menu bar or click the save display settings
icon on the tool bar.
The display settings are saved to the file.
Save display settings icon
Note
• Extension “.vrv” is automatically added to the filename of which the waveform or the digital values is
displayed, as the destination filename.
• The items saved to the file are shown below.
Comment
Position of cursor A and cursor B
On/Off condition of the display waveform limit.
On/Off condition of the alarm display
YAxis detail items (On/Off condition of waveform display, tag, unit, scale, zone, trip point 1, trip point 2,
and color)
Mark information
• If you wish to display the data file as it was originally saved by the VR100 or VR200, delete the display
settings file “xxx.vrv” then reopen the data file.
Displaying the Measured Data
Explanation
• Display settings file
The display settings which are changed with this software are saved to the display settings file
“xxx.vrv.” When the data file which has had the display settings saved is reopened, it is
automatically displayed using the displayed settings. The display settings file can be overwritten
any number of times.
1-21
Page 32

1.8 Opening TLOG Interval Timeout Data File
If statistical computation (TLOG) is performed on the VR200 model with the computation
function, you will open the TLOG interval timeout data file containing the following information.
Start time of computation, unit and decimal point information on each channel.
TLOG interval timeout time and the measured/computed data at that time on each channel.
Stop time of computation and the measured/computed data at that time on each channel.
Operation
1. Select “File” then “Open...” from the menu bar, or click the file open icon on the tool bar.
File open icon
2. Select the filename from the “Filename:” list box. Select a file with “.tlg” extension. Also,
select the appropriate folder and file type as necessary.
Go up one folder
Create new folder
List files
3. Clicking “Open” displays the table.
Data Block
Computation start time
TLOG Interval Timeout Time
Computation stop time
Channel number
Note
The number of files that you can open simultaneously depends on the memory size and free disk space on
the personal computer.
It is convenient to copy the data file from the floppy disk to the hard disk and use the file on the hard disk.
1-22
Page 33

1
Explanation
1.8 Opening TLOG Interval Timeout Data File
Capabilities of the software
This software is capable of doing the following:
Convert data format (see chapter 2).
Print to an external printer (see chapter 3).
Display information from the TLOG interval timeout data file (see section 1.9).
Displaying the Measured Data
1-23
Page 34

1.9 Displaying Information on TLOG Interval
Timeout Data File
Displays computation start and stop times of the TLOG interval timeout data file currently being
displayed for each data block.
Operation
1. Select “Information” then “About the TLOG file...” from the menu bar. The information
about the TLOG interval timeout data file is displayed.
1-24
Page 35

2
2.1 Converting the Data Format
p
While displaying the waveform or the digital values, the measured data can be converted to 3
different data formats—ASCII, Lotus, or Excel format—by following the steps below.
Operation
1. Select “Convert” then “XXX” from the menu bar. (“XXX” is either ASCII, Lotus, or Excel
format.)
2. In the XXX conversion dialog box, enter the range for converting the data(start and end
points) and the step number(e.g. Entering “3” converts every 3 data). If you wish to convert
all the data in the specified range, enter “1” for the step number. Click all the check boxes
for the channels you wish to convert.
End point for converting
Start point for converting
Converting the Displayed Data
Convert Channel(s)
Destination filename
number
Ste
3. When changing the destination folder or the filename, click “File...”
Select or enter the destination filename in the “File name” text box. Select the folder or the
file type as necessary. Then, click “Save.”
4. Click “OK” in the XXX conversion dialog box.
The measured data is converted to the specified data format and saved to the file.
When changing the destination filename
Up One Level
Create New Folder
List
Details
Note
The data range to be converted with each XXX conversion dialog box is automatically set to the range
specified by cursor A and cursor B. (When the data range is not set with the cursor or when the cursor is
turned off (deleted), the data number for the start point is automatically set to 0 and the data number for the
end point is automatically set to the last number represented by -1.)
2-1
Page 36

2.1 Converting the Data Format
• ASCII conversion dialog box
• Lotus conversion dialog box
• Excel conversion dialog box
Note
• The destination filename automatically takes on the file name of the displayed waveform plus the
extension to distinguish the different data formats. Extensions are “.prn” for ASCII format, “.wj2”
(Version 2.0 or later) for Lotus format, and “.xls” (Version 4.0 or later) for Excel formats.
• For Lotus 1-2-3 and Excel, there is a limit on the number of data points that can be handled. This
software does not limit the number of data points that can be converted. Therefore, make sure to set the
number of data points equal to or less than the maximum data number allowed by these software. Also,
when the available memory is low, there are cases when the data can not be read even when the number
of data points is less than the limit.
2-2
Page 37

2
2.2 File Format of the Converted Data
Explanation
Converting the data according to the steps described in Section 2.1, data are created in the format
shown below.
• ASCII Conversion File
• Event file
Title
Start time for conversion
End time for conversion
Sampling interval
Data count
Channel number
"Date","Time","msec",unit
Date
Time Measured valueTime(msec)
Power failure information data
• Display data file
Title
Start time for conversion
End time for conversion
Sampling interval
Data count
Channel number
"Date","Time","msec",unit
Converting the Displayed Data
Time
Time(msec)Date
Measured value
Power failure information data
Note
• When converting an event file containing power failure information data, the waveform data does not get
converted with correct time information. (The time of the measurement before the power failure is
shifted by the amount of time of the power failure duration.)
When converting a display data file containing power failure information, it is converted with correct
time information.
• In the case of event files, the measurement data during the power failure is converted to a value larger
than the range. In the case of display data files, blanks are inserted for the duration of the power failure.
2-3
Page 38

2.2 File Format of the Converted Data
• Lotus Conversion File
This file has the format that can be read by Lotus 1-2-3.
• Event file
ABCDEFG
1
VR Series
2
Start Time
3
End Time
4
Sampling Interval
5
Data Count
6
7
Data.
8
09/14
9
09/14
10
09/14
11
09/14
12
09/14
13
09/14
• Display data file
Time
14:04:22
14:04:24
14:04:26
14:04:28
14:04:30
14:04:32
1996/09/14
1996/09/14
2.000 sec
6
Ch.
msec
0
0
0
CH1
V
-
-
-
0
0
0
0.663
0.574
0.489
14:04:22.000
14:04:32.000
CH2
V
-
0.574
-
0.489
-
0.395
CH3
V
-
0.003
-
0.003
0.004
CH4
V
0.004
0.005
0.005
ABCDEFG
1
VR Series
2
Start Time
3
End Time
4
Sampling Interval
5
Data Count
6
7
8
9
10
11
12
13
Data.
09/14
09/14
09/14
09/14
09/14
09/14
Time
13:59:58
13:59:59
14:00:00
14:00:01
14:00:02
14:00:03
1996/09/14
1996/09/14
1.000 sec
6
Ch.
msec
0
0
0
0
0
0
CH1
V
0.521
0.566
32.639
0.023
-
-
0.025
0.080
13:59:58.000
14:00:03.000
CH2
V
0.524
0.569
32.639
0.019
-
0.029
-
0.079
CH3
V
0.004
0.003
32.639
0.003
-
0.004
-
0.004
CH4
V
0.531
0.575
32.639
0.017
-
0.037
-
0.086
Note
• When converting an event file containing power failure information data, the waveform data does not get
converted with correct time information. (The time of the measurement before the power failure is
shifted by the amount of time of the power failure duration.)
When converting a display data file containing power failure information, it is converted with correct
time information.
• In the case of event files, the measurement data during the power failure is converted to a value larger
than the range. In the case of display data files, blanks are inserted for the duration of the power failure.
2-4
Page 39

2
• Excel Conversion File
This file has the format that can be read by Excel.
• Event file
2.2 File Format of the Converted Data
ABCDEFG
1
VR Series
2
Start Time
3
End Time
4
Sampling Interval
5
Data Count
6
7
Data.
8
09/14
9
09/14
10
09/14
11
09/14
12
09/14
13
09/14
• Display data file
Time
14:04:22
14:04:24
14:04:26
14:04:28
14:04:30
14:04:32
ABCDEFG
1
VR Series
2
Start Time
3
End Time
4
Sampling Interval
5
Data Count
6
7
8
9
10
11
12
13
Data.
09/14
09/14
09/14
09/14
09/14
09/14
Time
13:59:58
13:59:59
14:00:00
14:00:01
14:00:02
14:00:03
1996/09/14
1996/09/14
2.000 sec
6
Ch.
msec
0
0
0
CH1
V
-
-
-
0
0
0
1996/09/14
1996/09/14
1.000 sec
6
Ch.
msec
0
0
0
0
0
0
CH1
V
32.639
-
-
0.663
0.574
0.489
0.521
0.566
0.023
0.025
0.080
14:04:22.000
14:04:32.000
CH2
V
-
0.574
-
0.489
-
0.395
CH3
V
-
0.003
-
0.003
0.004
13:59:58.000
14:00:03.000
CH2
V
0.524
0.569
32.639
0.019
-
0.029
-
0.079
CH3
V
0.004
0.003
32.639
0.003
-
0.004
-
0.004
CH4
V
0.004
0.005
0.005
CH4
V
0.531
0.575
32.639
0.017
-
0.037
-
0.086
Converting the Displayed Data
Note
• When converting an event file containing power failure information data, the waveform data does not get
converted with correct time information. (The time of the measurement before the power failure is
shifted by the amount of time of the power failure duration.)
When converting a display data file containing power failure information, it is converted with correct
time information.
• In the case of event files, the measurement data during the power failure is converted to a value larger
than the range. In the case of display data files, blanks are inserted for the duration of the power failure.
2-5
Page 40

3
3.1 Setting up the Printer
You can set setup the printer by following the steps below.
Operation
1. Select “File” then “Printer Setup...” from the menu bar.
Note
If there is a file already opened, the menu shown above will also have a print menu.
2. Set the printer, orientation, and paper.
Printing the Measured Data with an External Printer
Explanation
To set the printer, follow the procedures according to the system configuration you are using.
3-1
Page 41

3.2 Print Previewing
You can preview the layout before printing by following the steps below.
Operation
1. Select “File” from the menu bar to display the file menu.
Print menu has been added to the file menu shown in Section 1.2.
2. Select “Print Preview.”
3. Click the appropriate buttons to operate the print preview.
Execute print
Show next page
Show previous page
Display 1 page only/2 pages simultaneously
Zoom in
Zoom out
Explanation
Close
Note
• Print preview begins with the first data in the file.
• There are cases when the actual print is slightly different from what is displayed in the print preview.
For information regarding the operation of the print preview, refer to the instruction manual for
your system.
3-2
Page 42

3
3.3 Printing the Displayed Waveform or Digital
Values
You can print the displayed waveform or the digital values by following the steps below.
Operation
1. Select “File” then “Print...” from the menu bar or click the print icon on the tool bar.
print icon
3. Set the printer, orientation, and paper.
Printing the Measured Data with an External Printer
Note
The range for printing is set using cursor A and cursor B, when displaying the waveform or the digital
values. For instructions on setting cursor A and cursor B when displaying the waveform, refer to “Reading
the Measured Value with the Cursor” (page 1-13). For instructions on setting cursor A and cursor B when
displaying the digital values, refer to “Reading the Measured Value with the Cursor while Displaying
Digital Values” (page 1-19).
3-3
Page 43

3.3 Printing the Displayed Waveform or Digital Values
Explanation
• Print example when displaying the waveform
• Print example when displaying the digital values
3-4
Page 44

4
4.1 Troubleshooting
When there is a message displayed on the screen, refer to Section 4.2 “Error Messages and Corrective Actions” (page 4-2).
Problem Possible cause/Corrective Action
Unable to read floppy disk. Check the format type of the floppy disk.
Unable to setup software Check that there is 15 MB or more free disk space.
Error Messages
4-1
Page 45

4.2 Error Messages and Corrective Actions
• Operation Confirmation Messages
Displayed when confirming an operation.
Message Explanation
Correct time can not be displayed because there is no Displayed when the information file (.inf) does not exist in the same folder as
information file. Continue? the data file.
Correct time can not be displayed because the display data Displayed when more than 10 power failure data existed when saving the
file contains more than 10 power failure data. Continue? measured data on VR100 or VR200.
Correct time can not be displayed because the event file Displayed when the event file contains power failure data. (The event file
contains power failure data. Continue? can not be displayed with correct time information.)
• Error messages
Shown in the following figure are displayed when attempting to set invalid values or when the instrument is in an abnormal
condition. If errors persist even after carrying out the corrective actions, please contact OMEGA Engineering.
Error Message Corrective Action
File open error. Check the data file that is being read.
File read error. Check the data file that is being read.
File write error. Floppy disk is protected or the disk is corrupt.
Insufficient memory. Check the amount of free disk space and delete unnecessary files.
Not OMEGA standard format. Check the data file that is being read.
Not VR100 measured data. Select a file saved by VR100 or VR200.
Invalid information in information file. Select a file saved by VR100 or VR200. (The file was not saved by VR100 or
Data created using external sampling signal. Data file created using external sampling signal can not be read.
No information file. If the information file (.inf) exists, copy the information file in the same
Memory allocation error. Exit the program immediately. Exit the program immediately.
VR200, or the file is corrupt.)
folder as the data file before opening.
4-2
Page 46

Index
Index
A Page
Alarm display ..................................................................... 1-5, 1-7
Alarm display On/Off........................................ 1-4, 1-5, 1-7, 1-21
Arrow button ..................................................................1-13, 1-19
ASCII
Conversion ..................................................................... 2-1, 2-2
Conversion file ...................................................................... 2-3
Auto zone .................................................................................. 1-8
Auto zone icon........................................................................... 1-8
B Page
Backup .......................................................................................... 5
C Page
Channel
Channel number .................................................................... 2-3
Number of .................................................................... 1-3, 1-17
Clipboard ........................................................................1-17, 1-20
Closing....................................................................................... 1-1
Color ......................................................................... 1-5, 1-6, 1-21
Comment .......................................................................... 1-3, 1-21
Control panel ................................................................................ 6
Conversion data ................................................................. 2-3~2-5
Number of ............................................................................. 2-3
Conversion start/end points ................................................2-1, 2-2
Converting data formats .....................................................2-1, 2-2
Copy ............................................................................... 1-17, 1-20
Copy icon .......................................................................1-17, 1-20
Cursor ........................................... 1-13~1-17, 1-19~1-21, 2-1, 3-3
Deleting ...................................................................... 1-13, 1-19
Cursor value display ???.................................................1-13, 1-19
Cursor value icon ??? ..................................................... 1-13, 1-19
D Page
Data conversion format
ASCII .................................................................................... 2-3
Excel...................................................................................... 2-5
Lotus...................................................................................... 2-4
Data count...........................................................................1-3, 2-1
Data file ........................................................... 1-2, 1-5, 1-17, 1-21
Data number ........................................................... 1-13, 1-19, 2-1
Data types .................................................................................. 1-3
Digital value display.......................................................1-18, 1-20
Digital value display icon ........................................................ 1-18
Display data ............................................................................... 1-3
Display data file............................................4, Chapter 1, 2-3~2-5
Display limit ............................................................................ 1-10
Display settings file ................................................................. 1-21
E Page
End point ............................................................................2-1, 2-2
Entire display........................................................................... 1-11
Error Messages .......................................................................... 4-2
Event data .................................................................................. 1-3
Event file ......................................................4, Chapter 1, 2-3~2-5
Event mark .....................................................................1-15, 1-16
Excel
Conversion ..................................................................... 2-1, 2-2
Conversion file ...................................................................... 2-5
Exiting the program ................................................................... 1-1
Extension .................................................................. 1-2, 1-21, 2-2
F Page
Index
File format
ASCII .................................................................................... 2-3
Excel...................................................................................... 2-5
Lotus...................................................................................... 2-4
File information ......................................................................... 1-3
File name .................................................................... 1-2, 1-3, 2-1
File open icon ............................................................................ 1-2
Folder............................................................... 8, 1-1, 1-2, 1-4, 2-1
Free disk space ........................................................... 1-2, 2-2, 4-1
Full zone .............................................................................1-8, 1-9
Full zone icon ............................................................................ 1-8
I page
Information file...................................................................... 4, 1-4
Installing ................................................................................... 6~8
Installing/Uninstalling .................................................................. 6
Installing/Uninstalling the program.............................................. 6
L Page
Limit ...............................................................................1-10, 1-21
Limit icon ................................................................................ 1-10
Lotus
Conversion ..................................................................... 2-1, 2-2
Conversion file ...................................................................... 2-4
M Page
Mark
Deleting ......................................................................1-15, 1-16
Event mark ................................................................. 1-15, 1-16
Information.......................................................................... 1-21
Resetting.....................................................................1-15, 1-16
Trigger mark...............................................................1-15, 1-16
User-defined mark......................................................1-15, 1-16
Memory size .............................................................................. 1-2
Menu bar.................................................................................... 1-1
Index-1
Page 47

Index
O Page
Opening ..................................................................................... 1-2
Operation confirmation message ............................................... 4-2
P Page
Power failure information ................................... 1-3, 1-4, 2-3~2-5
Power failure information data ............................... 1-17, 1-20, 2-3
Print .................................................................................... 3-3, 3-4
Print icon ................................................................................... 3-3
Print preview ............................................................................. 3-2
Printer setup............................................................................... 3-1
R Page
Range ..................................................................................1-3, 1-4
S Page
Sampling interval ...............................................................1-3, 2-3
Save display settings icon ??? ................................................. 1-21
Saving display settings ............................................................ 1-21
Scale ......................................................................... 1-5~1-7, 1-21
Scale factor setting .................................................................. 1-11
Scrolling ............................................................................. 1-4, 1-7
Select all .........................................................................1-13, 1-19
Selecting active waveforms ................................................1-4, 1-7
Setting the color, Color setting .................................................. 1-6
Slide zone ........................................................................... 1-8, 1-9
Slide zone icon .......................................................................... 1-8
Start and end time of measurement ........................................... 1-3
Start point ........................................................................... 2-1, 2-2
Starting/Exiting the program ..................................................... 1-1
Status bar ................................................................................... 1-1
Step ..................................................................................... 2-1, 2-2
System floppy disk ................................................................... 5, 6
System requirements .................................................................... 4
U Page
Unit .................................................................... 1-5~1-7, 1-21, 2-3
User zone ................................................................................... 1-8
User zone icon ........................................................................... 1-8
User-defined mark .......................................................... 1-15, 1-16
User-defined mark add icon ??? .............................................. 1-15
W Page
Waveform
Zoom in/zoom out ......................................................1-11, 1-12
Waveform display
Color..................................................................... 1-5, 1-6, 1-21
On/Off ........................................................... 1-4, 1-5, 1-7, 1-21
Scale ..................................................................... 1-4~1-7, 1-21
Tag........................................................................ 1-4~1-7, 1-21
Trip point.............................................................. 1-5~1-7, 1-21
Unit....................................................................... 1-4~1-7, 1-21
Zone...................................................................... 1-4~1-7, 1-21
Zone type........................................................................1-8, 1-9
Waveform display icon ........................................................... 1-18
Y Page
Y axis detail setting ............................................................1-5, 1-6
Z Page
Zone .......................................................................... 1-5~1-7, 1-21
Selecting type .................................................................1-8, 1-9
Setting ............................................................................1-8, 1-9
Zoom in .......................................................................... 1-11, 1-12
Zoom in icon ........................................................................... 1-12
Zoom in/zoom out on waveform display area ....................1-4, 1-7
Zoom out ........................................................................ 1-11, 1-12
Zoom out icon ......................................................................... 1-12
T Page
Tag ............................................................................ 1-5~1-7, 1-21
Time axis
Entire display ...................................................................... 1-11
Scale factor .......................................................................... 1-11
Selecting ..................................................................... 1-11, 1-12
Setting ................................................................................. 1-11
Zoom in/out ................................................................1-11, 1-12
Time axis scale factor .............................................................. 1-11
Title ........................................................................................... 2-3
Tool bar ..................................................................................... 1-1
Trigger mark ...................................................................1-15, 1-16
Trip point .................................................................. 1-5~1-7, 1-21
Troubleshooting......................................................................... 4-1
Index-2
Page 48

WARRANT Y/ DISCLAIMER
OMEGA ENGINEERING, INC. warrants this unit to be free of defects in materials and workmanship for a
period of 25 months f rom date of purchase. OMEGA Warranty adds an additional one (1) month grace
period to the normal two (2) year product war r a n t y to cover handling and shipping time. This
ensures that OMEGA’s customers receive maximum coverage on each product.
If the unit malfunctions, it must be re t u rned to the factory for evaluation. OMEGA’s Customer Serv i c e
D e p a rtment will issue an Authorized Return (AR) number immediately upon phone or written re q u e s t .
Upon examination by OMEGA, if the unit is found to be defective, it will be re p a i red or replaced at no
c h a rge. OMEGA’sWARRANTY does not apply to defects resulting from any action of the purc h a s e r, including but not limited to mishandling, improper interfacing, operation outside of design limits,
i m p roper re p a i r, or unauthorized modification. This WARRANTY is VOID if the unit shows evidence of
having been tampered with or shows evidence of having been damaged as a result of excessive corro s i o n ;
or current, heat, moisture or vibration; improper specification; misapplication; misuse or other operating
conditions outside of OMEGA’s c o n t rol. Components which wear are not warranted, including but not
limited to contact points, fuses, and triacs.
OMEGA is pleased to offer suggestions on the use of its various products. However,
OMEGA neither assumes responsibility for any omissions or errors nor assumes liability for any
damages that result from the use of its products in accordance with information provided by
OMEGA, either verbal or written. OMEGA warrants only that the parts manufactured by it will be
as specified and free of defects. OMEGA MAKES NO OTHER WARRANTIES OR
R E P R E S E N T ATIONS OF ANY KIND WHATSOEVER, EXPRESS OR IMPLIED, EXCEPT THAT OF TITLE,
AND ALL IMPLIED WARRANTIES INCLUDING ANY WARRANTY OF MERCHANTABILITY AND FITNESS FOR A P A R TICULAR PURPOSE ARE HEREBY DISCLAIMED. LIMITATION OF
L I A B I L I T Y : The remedies of purchaser set forth herein are exclusive, and the total liability of
OMEGA with respect to this or d e r , whether based on contract, war r a n t y , negligence,
indemnification, strict liability or otherwise, shall not exceed the purchase price of the
component upon which liability is based. In no event shall OMEGA be liable for
consequential, incidental or special damages.
CONDITIONS: Equipment sold by OMEGA is not intended to be used, nor shall it be used: (1) as a “Basic
Component” under 10 CFR 21 (NRC), used in or with any nuclear installation or activity; or (2) in medical
applications or used on humans. Should any Product(s) be used in or with any nuclear installation or
a c t i v i t y, medical application, used on humans, or misused in any way, OMEGA assumes no re s p o n s i b i l i t y
as set forth in our basic WA R R A N TY/DISCLAIMER language, and, additionally, purchaser will indemnify
OMEGA and hold OMEGA h a rmless from any liability or damage whatsoever arising out of the use of the
P roduct(s) in such a manner.
RETURN REQUEST S / INQUIRIES
Direct all warranty and repair requests/inquiries to the OMEGA Customer Service Department. BEFORE
RETURNING ANY PRODUCT(S) TO OMEGA, PURCHASER MUST OBTAIN AN AUTHORIZED RETURN
(AR) NUMBER FROM OMEGA’S CUSTOMER SERVICE DEPA RTMENT (IN ORDER TO AV O I D
PROCESSING DELAYS). The assigned AR number should then be marked on the outside of the return
package and on any correspondence.
The purchaser is responsible for shipping charges, freight, insurance and proper packaging to prevent
breakage in transit.
FOR WARRANTY RETURNS, please have the
following information available BEFORE
contacting OMEGA:
1 . P u rchase Order number under which the pro d-
uct was PURCHASED,
2. Model and serial number of the product under
warranty, and
3. Repair instructions and/or specific problems
relative to the product.
OMEGA’s policy is to make running changes, not model changes, whenever an improvement is possible. This affords our
customers the latest in technology and engineering.
OMEGA is a registered trademark of OMEGA ENGINEERING, INC.
© Copyright 1998 OMEGA ENGINEERING, INC. All rights reserved. This document may not be copied, photocopied, re p ro-
duced, translated, or reduced to any electronic medium or machine-readable form, in whole or in part, without the prior
written consent of OMEGA ENGINEERING, INC.
FOR NON-WARRANTY REPAIRS,
for current repair charges. Have the following
information available BEFORE contacting OMEGA:
1. Purchase Order number to cover the COST
of the repair,
2. Model and serial number of the product, and
3. Repair instructions and/or specific problems
relative to the product.
consult OMEGA
Page 49

W h e r e Do I Find Everything I Need for
P r ocess Measurement and Control?
OMEGA…Of Course!
T E M P E R AT U R E
Thermocouple, RTD & Thermistor Probes, Connectors, Panels & A s s e m b l i e s
Wi re: Thermocouple, RTD & Thermistor
Calibrators & Ice Point Refere n c e s
R e c o rders, Controllers & Process Monitors
I n f r a red Pyro m e t e r s
PRESSURE, STRAIN AND FORCE
Transducers & Strain Gauges
Load Cells & Pre s s u re Gauges
Displacement Tr a n s d u c e r s
I n s t rumentation & A c c e s s o r i e s
F L O W / L E V E L
Rotameters, Gas Mass Flowmeters & Flow Computers
Air Velocity Indicators
Turbine/Paddlewheel Systems
Totalizers & Batch Contro l l e r s
p H / C O N D U C T I V I T Y
pH Electrodes, Testers & A c c e s s o r i e s
Benchtop/Laboratory Meters
C o n t rollers, Calibrators, Simulators & Pumps
Industrial pH & Conductivity Equipment
D ATA ACQUISITION
Data Acquisition & Engineering Software
Communications-Based Acquisition Systems
Plug-in Cards for Apple, IBM & Compatibles
Datalogging Systems
R e c o rders, Printers & Plotters
H E AT E R S
Heating Cable
Cartridge & Strip Heaters
Immersion & Band Heaters
Flexible Heaters
Laboratory Heaters
E N V I R O N M E N TA L
MONITORING AND CONTROL
Metering & Control Instru m e n t a t i o n
R e f r a c t o m e t e r s
Pumps & Tu b i n g
A i r, Soil & Water Monitors
Industrial Water & Wastewater Tre a t m e n t
pH, Conductivity & Dissolved Oxygen Instru m e n t s
M3286/0299
 Loading...