

Page 1

Page 2
1
Page 3

CONTENTS
1. INTRODUCTION
1.1 Introduction
1.2 General Applications and Benefits
1.3 Identification
2. HARDWARE
3. SOFTWARE DESCRIPTION
3.1 Operating Software
3.2 TVS-1100 Software
3.3 Software Installation
3. ELECTRICAL AND SYSTEM REQUIREMENTS
4.1 Electrical and Safety Specifications
4.2 System Requirements
2
Page 4

SECTION 1: INTRODUCTION
1.1 Introduction
TVS-1100 is a hot wire anemometer system for measuring air temperature and
velocity using single sensor technology. The device is connected to a PC through
an USB port for communication between the software and the device. The
system is capable of measuring temperatures from –20 oC to 130 oC and flows
from 0 to 10000 ft/min. It can accommodate up to 32 channels. The standard
calibration is from 0 to 1200 lfm, the high speed calibration is from 0 to 10,000
lfm. The air temperature at which velocity is calibrated is from ambient to 85 oC.
An attempt to measure flows in temperatures higher than 85 oC, would give
erroneous data, even though it can read temperatures up to 120 oC.
1.2 General Applications and Benefits
Heat sink manufacturers, IC houses, board designers, and other electronic
manufacturers are increasingly becoming interested in evaluating the thermal
performance of their product under different airflow conditions. The reduction of
electronic component sizes and increase in their power dissipation has forced the
electronic community to be more aware of the thermal performance of their
products. The hotter the devices, the shorter their life span and the greater the
likelihood of a malfunction. The challenge in these units is the reduction in the
spacing between boards, thereby the requirement of small size sensors to
measure air flow measurement. Of utmost importance is the measurement of air
flow and temperature at the same point to minimize errors introduced as a result
of temperature gradients. The conventional hot wire systems measure these two
3
Page 5

quantities using two independent sensors and, in most situations this can
introduce errors in excess of 40% due to temperature gradients and radiation
coupling between the two sensors.
1.3 Identification
The TVS-1100 is identified by OE followed by 5 digits (i.e., OE12345) located on
the bottom of the unit.
4
Page 6
SECTION 2: HARDWARE DESCRIPTION
The device is housed in an electronic box that accepts commands from the
software through the USB communication port, and reports the data back to the
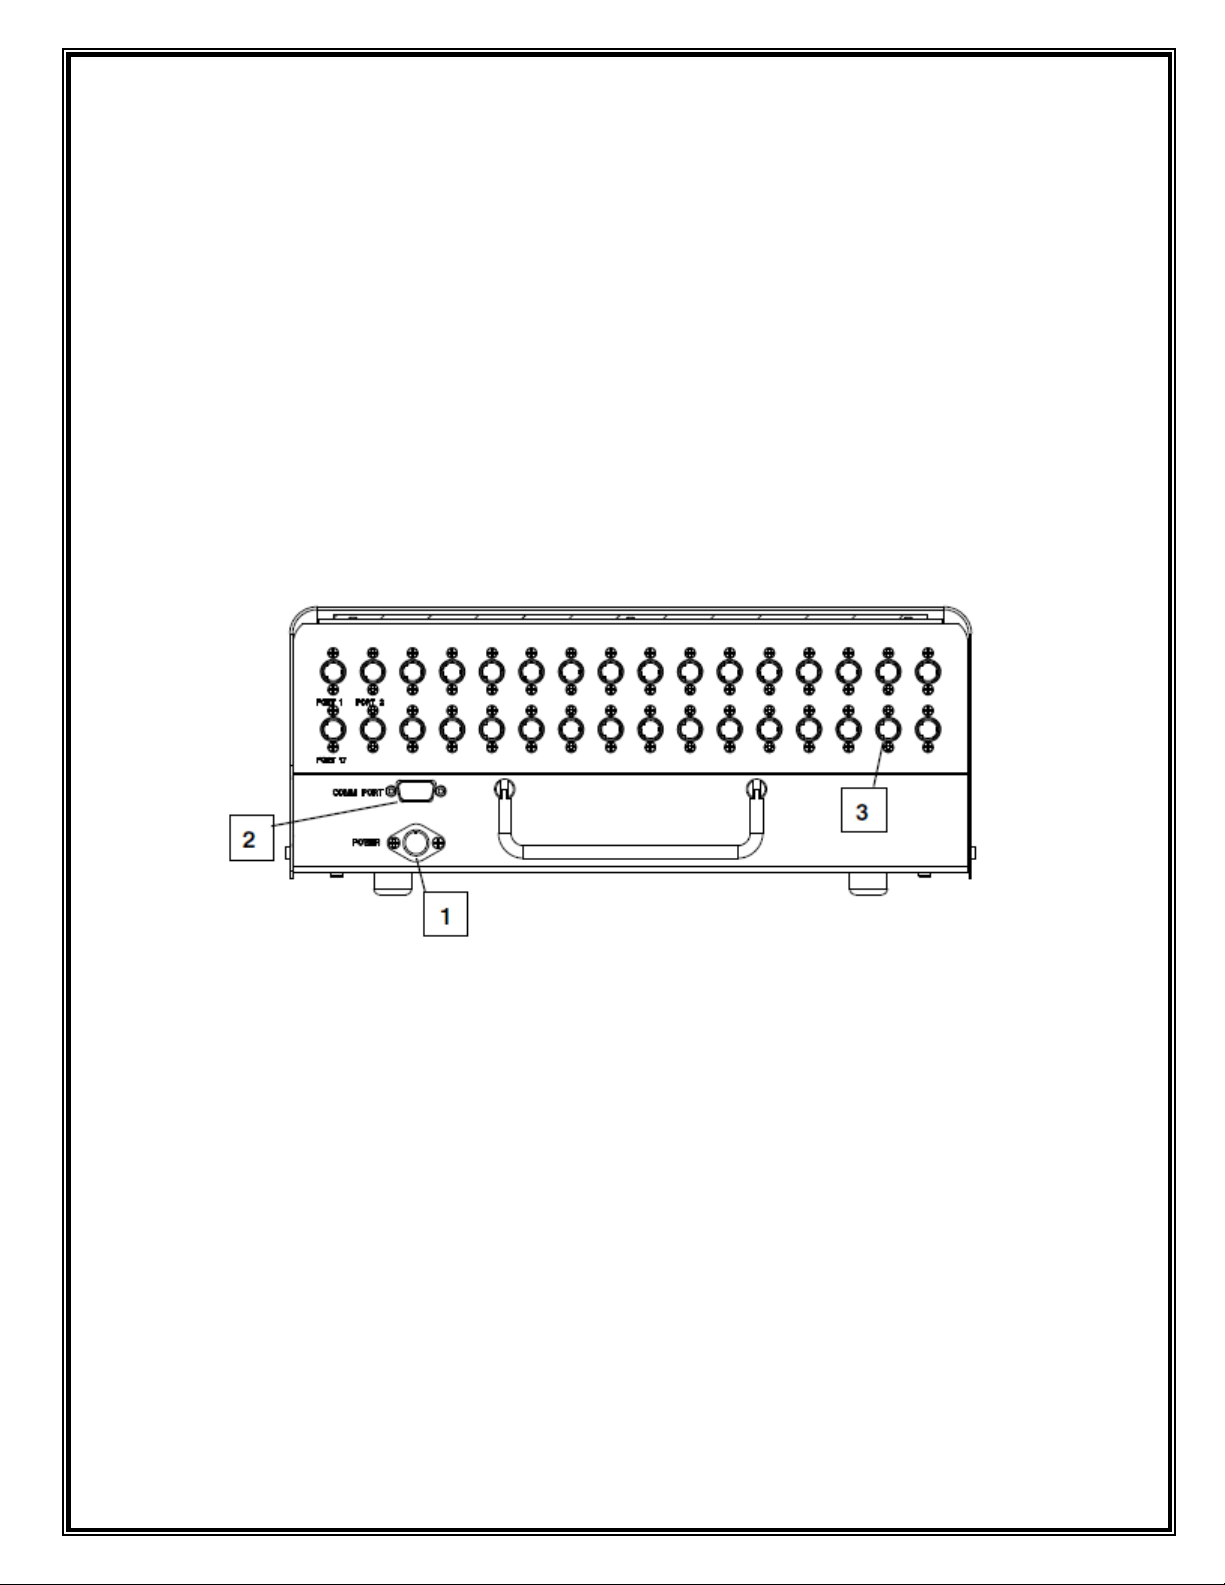
system. It includes the circuitry for temperature and velocity sensors. Figure 1
shows the rear view of the TVS-1100 box.
Note: Please read the Manual before operating the system.
Figure 1 - Rear view of the TVS-1100
The function and description of ports and connectors on the rear panel are as
follows:
1. Power – This is the location for connecting the power supply to the
system.The external power supply provided with the system plugs in here.
5
Page 7
2. USB Port (COM Port) – The TVS-1100 is attached to the serial port of the
PC with a straight cable through this port. TVS-1100 comes with a 6 feet
long standard USB cable.
3. Port# - Sensors are attached to the TVS-1100 through these ports. The
order of attachment is immaterial, since each individual sensor has a sensor
ID card that enables the system to find its calibration constants from a text
file located in the PC C directory using its serial identification number.
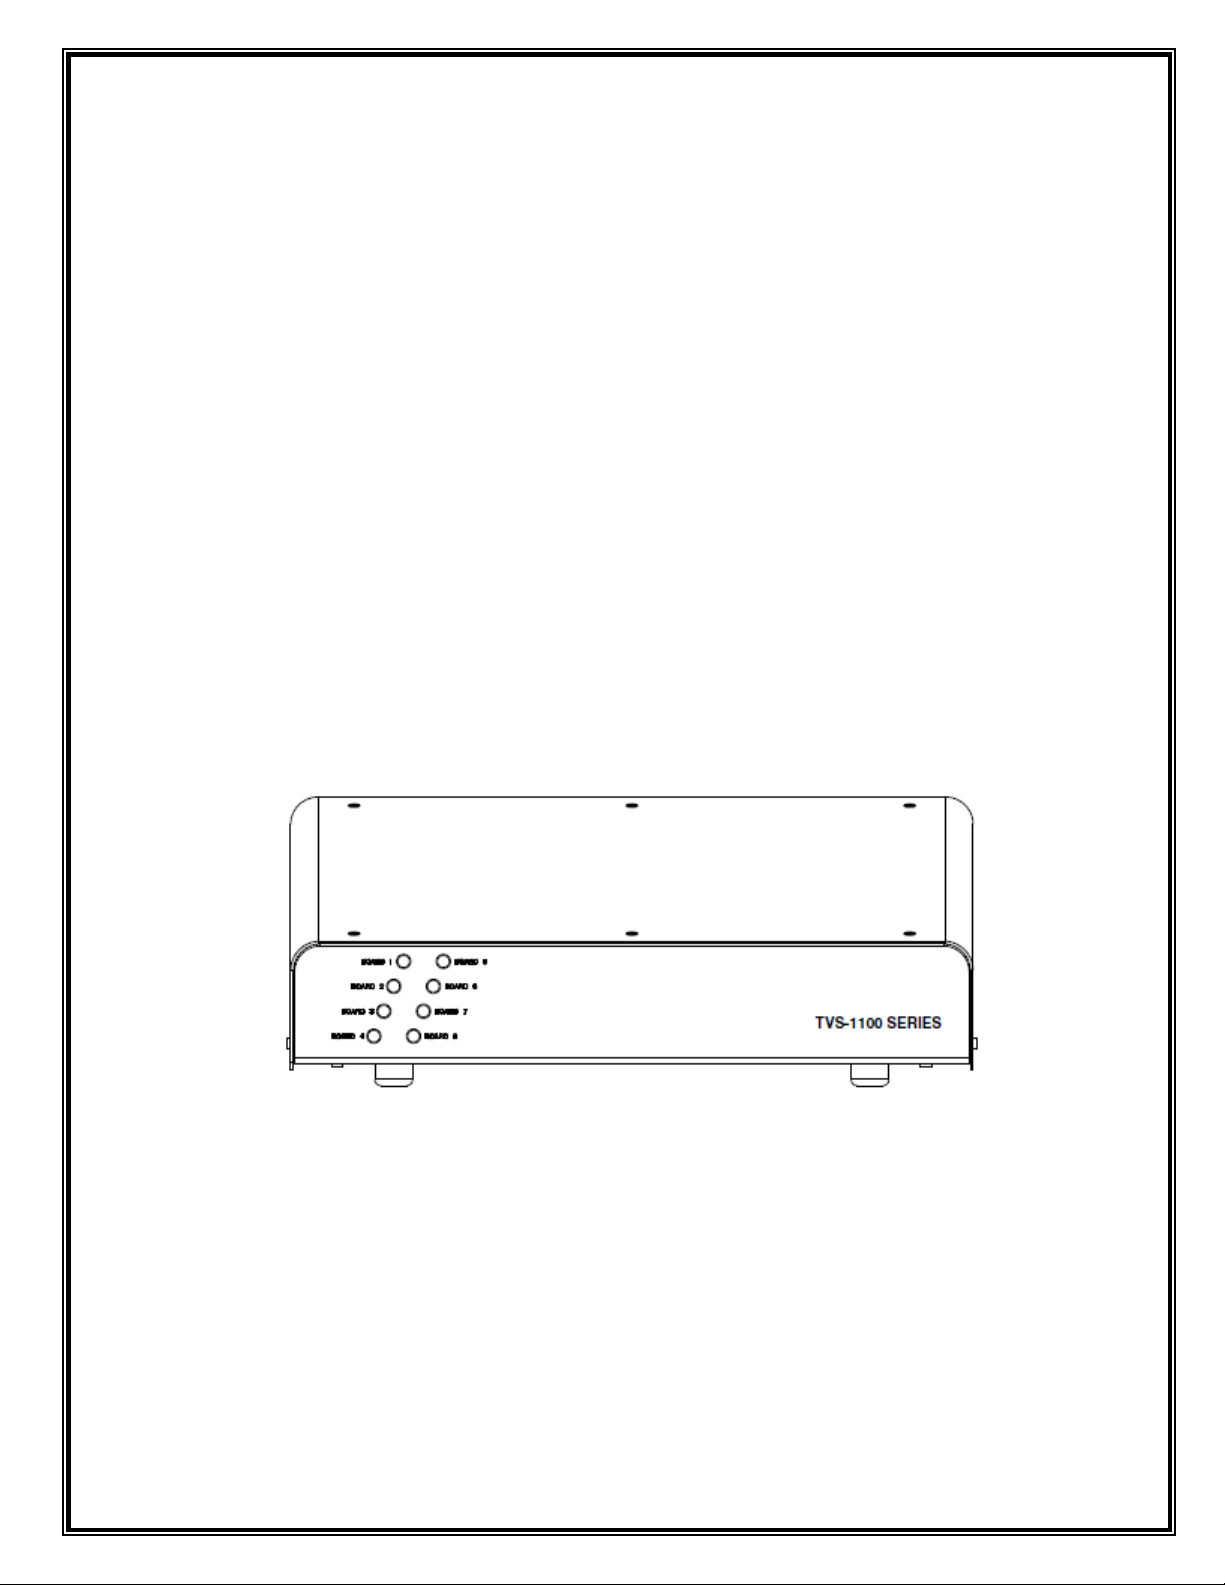
Figure 2 shows the front view of the TVS-1100. It has 8 LEDs associated with up
to 8 daughter cards. For every daughter card installed, there is one LED lit up.
Figure 2 - Front view of the TVS-1100
6
Page 8

SECTION 3: SOFTWARE DESCRIPTION
3.1 Introduction
TVS-1100 software is a graphical user interface that communicates with the
TVS-1100 box through the PC USB port. This software enables the user to set
the different parameters and run the software to acquire the data.
THEORY OF OPERATION:
Data acquisition is comprised of cycles dictated by the duration set by the user in
minutes. Each cycle consists of a selected number of temperature measurements
followed by a selected number of velocity measurements. The selected number
is set by the user. The cycles will continue until the time elapsed is greater than
the duration. The user has the option to check the availability of the sensors and
select which of those sensors he wants to collect data. Software also allows the
user to save temperature and velocity raw data into text files that can be opened
in ExcelTM using tab delimited. The software has different controls and is
described bellow:
3.2 TVS-1100 Software
Figure 3 and 4 show the TVS-1100 software user interface when it is running.
7
Page 9

1
4
5
6
7
8
9
10
14
17
18
19
20
21
22
23
24
25
26
27
28
29
35 36 37 38 39 40 41
11
12
13
16
30
2
3
15
Figure 3 - TVS-1100 User Interface
TVS-1100 software interface has three functional areas, Main Menu selection on
the left, display windows in the middle and status panel on the bottom. The user
interface elements are explained as follows:
[1] Windows Menu. The windows menu includes File, Edit, and Help. The
submenu of File includes,
File—Start: Select to start test.
File—Stop: Select to stop test.
File—Exit: Select to exit the software.
The submenu of Edit includes,
Edit—Cut: Cut content to clipboard.
Edit—Copy: Copy content to clipboard.
Edit—Paste: Paste content from clipboard.
8
Page 10

The submenu of Help includes,
Help—Show Context Help: Select to open context help window.
[2] System Setup: Push this button to display System Setup window.
[3] Run Button: Push this button to start the program.
[4] Stop Button: Push this button to stop the program.
[5] All Sensors: Push this button to display View All Sensors window (See
Figure 4).
[6] Sensors 1-8: Push this button to display Sensors 1-8 window (See Figure
5).
[7] Sensors 9-16: Push this button to display Sensors 9-16 window.
[8] Sensors 17-24: Push this button to display Sensors 17-24 window.
[9] Sensors 25-32: Push this button to display Sensors 25-32 window.
[10] Selected Sensors: Push this button to display View Selected Sensors
window (See Figure 6).
[11] Load Cal File: Push this button to reload the sensor calibration file.
[12] Save Settings: Push this button to save the system configuration to a text
file.
[13] Load Settings: Load system configuration from a previously saved text
file.
[14] Load Default: Push this button to load the default system configuration.
[15] Check Sensors: Push this button to display Check TVS Sensors window
(See Figure 7).
[16] Left Time (min): Display of left test time in minutes.
[17] Elapsed Time (min): Display of elapsed test time in minutes.
[18] Port Selection Window: Select or unselect Ports for air temperature and
velocity measurement, enter port description.
[19] Com Port: Select the communication port that connects to TVS-1100
instrument.
[20] Temperature Unit: Choose the unit for temperature.
[21] Velocity Unit: Choose the unit for velocity.
9
Page 11

[22] Overall Test Duration (Min): Enter the total test duration time in
1
4
5
6
7
8
9
10
14
17
18
19
20
21
22
23
24
25
31
32
33
34
35 36 37 38 39 40 41
11
12
13
16
2
3
15
minutes.
[23] Save Data: Select to save measurement data.
[24] Input Data File Location and Name (txt File): When you specify a file
name such as Test.txt. The software will automatically generate two files
to record data.
Test.txt for temperature data and velocity data
Test-Temperature.txt for temperature data
Figure 4 - TVS-1100 User Interface
[25] Sampling Mode: Enter the total test
[26] Easy Mode: In this mode, users can specify data output rate and sampling
rate.
10
Page 12

[27] Data Output Rate: Choose the time interval to average measurement and
update data. Displaying plots and tables will update data at this time rate.
Measurement data will be saved at this time rate too.
[28] Sampling Rate: Choose the sampling rate from the pull-down menu. The
menu will update its selections according to the total number of sensors
chosen. The more sensors is chosen, the smaller is the sampling rate.
[29] Temperature Measurement Duration (s): Set the duration in seconds
for temperature measurement per scan.
[30] Velocity Measurement Duration (s): Set the duration in seconds to
velocity measurement per scan.
[31] Fast Mode: In this mode, users can take the fast measurement of
temperature and velocity.
[32] Temperature Samples: Number of temperature measurements will be
taken per scan.
[33] Velocity Samples: Number of velocity measurements will be taken per
scan.
[34] Delay Between Measurements (s): Specify delay between two adjacent
scans.
[35] System Status: Display of system status information.
[36] Temperature Waiting: LED for temperature setting indication.
[37] Reading Air Temperature: LED for air temperature measuring indication.
[38] Velocity Waiting: LED for velocity setting indication.
[39] Reading Air Velocity: LED for air velocity measuring indication.
[40] Start/Stop: Click Start to initialize test. In the test, click Stop to end the
test.
[41] Time: Current date and time.
CAUTION: When the sensor is in velocity mode its temperature will be
in excess of 160 oC. Please take precaution not to touch the sensors
when they are running. Touching them can cause skin burning.
11
Page 13

1
3
4
5
2
6
1
3
4
5
2
6
Figure 5 - TVS-1100 User Interface
Figure 5 shows the View All Sensors window and the user interface elements
are explained as follows,
[1] Air Temperature Plot: Display air temperature measured by TVS-1100
sensors 1-16.
[2] Air Temperature/Velocity Plot Legend
[3] Air Velocity Plot: Displays air velocity measured by TVS-1100 sensor 1-16.
[4] Air Temperature Plot: Displays air temperature measured by TVS-1100
sensors 17-32.
[5] Air Temperature/Velocity Plot Legend
[6] Air Velocity Plot: Display air temperature measured by TVS-1100 sensor
17-32.
12
Page 14

1
4
7
8
2
11
3
5
6
10
9
12
13
Figure - 6 TVS-1100 User Interface
Figure 6 shows the View Sensors 1-8 window and the user interface elements
are explained as follows,
[1] Air Temperature Plot: Displays air temperature measured by TVS-1100
sensors.
[2] Air Temperature Plot Digital Display
[3] Export Plot: Push to export the Air Temperature Plot to a BMP file.
[4] Air Temperature Plot Control: Plot control to change X Scale/Y Scale
mode.
[5] Save T Summary: Push to save the content of Air Temperature
Summary table to a file.
[6] Air Temperature Summary: This table displays the summary of each
TVS-1100 sensor temperature reading and updates its results according to
Measurement Duration setting.
13
Page 15

[7] Air Velocity Plot: Displays air velocity measured by TVS-1100 sensors.
1
3
4
5
6
7
8
10
2
9
11
13
14
12
[8] Air Velocity Plot Digital Display
[9] Air Temperature/Velocity Plot Legend
[10] Export Plot: Push to export the Air Velocity Plot to a BMP file.
[11] Air Velocity Plot Control: Plot control to change X Scale/Y Scale mode.
[12] Save V Summary: Push to save the content of Air Velocity Summary
table to a file.
[13] Air Velocity Summary: This table displays the summary of each TVS
sensor velocity reading and updates its results according to Measurement
Duration setting.
NOTE: The View Sensors 9-16, View Sensors 17-24, View Sensors 25-
32 windows have same structures as View Sensors 9-16 window.
Figure 7 -TVS-1100 User interface
14
Page 16

Figure 7 shows the TVS-1100 software user interface when View Selected
Sensors in main menu is selected. The user interface elements are explained as
follows:
[1] Air Temperature Plot: Displays air temperature measured by TVS-1100
sensors.
[2] Air Temperature Plot Digital Display
[3] Export Plot: Push to export the Air Temperature Plot to a BMP file.
[4] Air Temperature Plot Control: Plot control to change X Scale/Y Scale
mode.
[5] Save T Summary: Push to save the content of Air Temperature
Summary table to a file.
[6] Air Temperature Summary: This table displays the summary of each
TVS sensor temperature reading and updates its results according to
Measurement Duration setting.
[7] Air Velocity Plot: Display air velocity measured by TVS sensors.
[8] Air Temperature/Velocity Plot Legend
[9] Air Velocity Plot Digital Display
[10] Export Plot: Push to export the Air Velocity Plot to a BMP file.
[11] Air Velocity Plot Control: Plot control to change X Scale/Y Scale mode.
[12] Select Sensor to Display: Click to select sensor to display in the plots,
you can select multiple sensors by push Ctrl Button.
NOTE: Maximum eight sensors can be selected at same time.
[13] Save V Summary: Push to save the content of Air Velocity Summary
table to a file.
[14] Air Velocity Summary: This table displays the summary of each TVS
sensor velocity reading and updates its results according to Measurement
Duration setting.
15
Page 17

1
4
2
3
Figure 8 -TVS-1100 User Interface
Figure 8 shows the TVS-1100 software user interface when Check Sensor in
main menu is selected. The user interface elements are explained as follows:
[1] Sensor Status: Displays the TVS-1100 sensor availability.
[2] Sensor Information: Displays the TVS-1100 sensor ID and serial number.
[3] Checking Sensors: Sensor checking progress indicator.
[4] Com Port Error Out: Displays Com port information.
3.3 Software Installation
In order to install the TVS-1100 software, please follow the following steps:
16
Page 18

1. Install the software by double clicking on TVS-1100
installer\Volume\setup.exe. It installs the TVS-1100 and supporting
files to your computer.
2. Install National Instruments serial communication driver by double clicking
onDrivers\NI-Serial 3.5\Setup.exe
Note: NI-Serial 3.5 Supports the following operating system:
Windows 2000; Windows XP; Windows Vista; Windows Vista x64.
NI-Serial 3.6 Supports the following operating system: Windows 7
64 bit; Windows 7 x86; Windows XP x86; Windows Server 2008 R2
(64-bit); Windows Vista x64; Windows Vista x86; Windows Server
2003 R2 (32-bit).
3. Install the USB driver by double clicking on Drivers\FTDI USB-RS232
driver \USB-RS232 driver.exe.
4. When you run TVS-1100 software for the first time, a window (see
Figure 9 will pop out asking for ATVS-2020 calibration data.txt file. You
have to load this file before using the TVS-1100.
17
Page 19

Figure 9 - Load Calibration File for TVS-1100
18
Page 20

SECTION 4: ELECTRICAL AND SYSTEM REQUIREMENTS
4.1 Electrical and Safety Specifications
Products destined for the North American market are furnished with a
cord set. Outside of North America, a detachable cord set compliant with
the local electrical safety and code requirements is necessary. The cord
set shall have a female fitting MAINS connector according to IEC 60320
and shall either meet the requirements of IEC 60799 or shall be rated for
maximum current ratings of the equipment (1.5 A). The length of the cord
set must be less than 3 meters long.
The system is powered by a DC power supply with the following
specifications:
Separable power supply
Input: 100-240 V, 1.5A, 60-50 HZ
Output: +5Vdc, 5A, +15Vdc, 2A, -15Vdc, 0.8A
The power supply provided should be used to maintain acceptable safety
of the unit. Contact Omega for repairs and replacement.
4.1.1 Description of Connectors
The DIN mount receptacle accepts DC voltages from the specified power
supply.
The sensor connectors receive voltages from sensors. The system will not
function properly with any other sensor other than the one supplied by
Omega.
19
Page 21

The DB9 connector is used with a straight cable to communicate with a PC
or laptop through the COM port.
4.1.2 Description of the Symbol
The above symbol indicates caution, risk of danger. Documentation
must be consulted where this symbol is marked. There are no user
serviceable parts inside. It is not recommended that the user open the
electronic box or the power supply unit.
4.2 System and Environmental Requirements
Environmental conditions:
This equipment is designed to be safe at least under the following conditions:
Indoor use
Altitude up to 2000 m.
Temperatures from 5 C to 40 C.
Maximum relative humidity, 80% for temperatures up to 31
linearly to 50% relative humidity at 40 oC.
Installation/overvoltage category: II
o
C decreasing
Pollution degree: 2
20
Page 22

Degree of protection to IEC 60529: IPK0
Equipment mobility: Portable
Connection to mains supply: Detachable cord set
Operating conditions : Continuous (duration of operation set by
operator through software)
Unit can be mounted in any orientation as long as it is securely mounted.
Connect the power supply to a grounding type receptacle.
The cord set is the disconnect device. Position the equipment to facilitate
disconnect from Mains as necessary.
The system does not require any cleaning or decontamination .
System requirements:
Use a PC or laptop with minimum of 512 MB of memory and an operating
systems windows 2000, XP, Vista, or 7. To maintain an acceptable level of
safety, the host computer should comply with the requirements of
UL/CSA/IEC 60950.
It is recommended that the sensors be calibrated on an annual basis.
21
Page 23

22
Page 24

23
Page 25

M-4621/0911
24
 Loading...