

Page 1
www.sensoscientific.com
© 2024 SensoScientific, Inc. A PST Brand | All Rights Reserved
USER GUIDE
OTA Wireless Data Logger
SensoTag Cellular
685 Cochran Street, Ste. #200, Simi Valley, CA 93065
Page 2

Environmental Monitoring Solutions
I. OTA WIRELESS DATA LOGGER .................................................................................................................. 3
II. GETTING TO KNOW YOUR DEVICE ............................................................................................................ 3
III. DISPLAY NOTIFICATIONS ......................................................................................................................... 4
IV. MODEL OVERVIEW ................................................................................................................................... 5
V. TECHNICAL SPECIFICATIONS .................................................................................................................... 6
VI. SETTING UP YOUR DEVICE ....................................................................................................................... 7
Step 1 – Installing and Removing a Probe ................................................................................................. 7
Step 2 – Power On/Off ............................................................................................................................. 7
Step 3 – Device Registration .................................................................................................................... 7
Step 4 – Start Recording .......................................................................................................................... 8
Step 5 – Stop Recording .......................................................................................................................... 8
VII. ADDITIONAL SETTINGS & DEVICE INFORMATION ...................................................................................... 9
Menu ...................................................................................................................................................... 9
View Configuration Information ................................................................................................................ 9
View Device Information .......................................................................................................................... 9
View Maximum, Minimum, & Average Values .......................................................................................... 10
Device Charging .................................................................................................................................... 10
VIII. PLATFORM ............................................................................................................................................ 11
Access Reporting ................................................................................................................................... 11
IX. CONTACT SALES / TECHNICAL SUPPORT ................................................................................................. 12
X. DOCUMENT INFORMATION ..................................................................................................................... 13
sensoscientific.com 2
Page 3
Environmental Monitoring Solutions
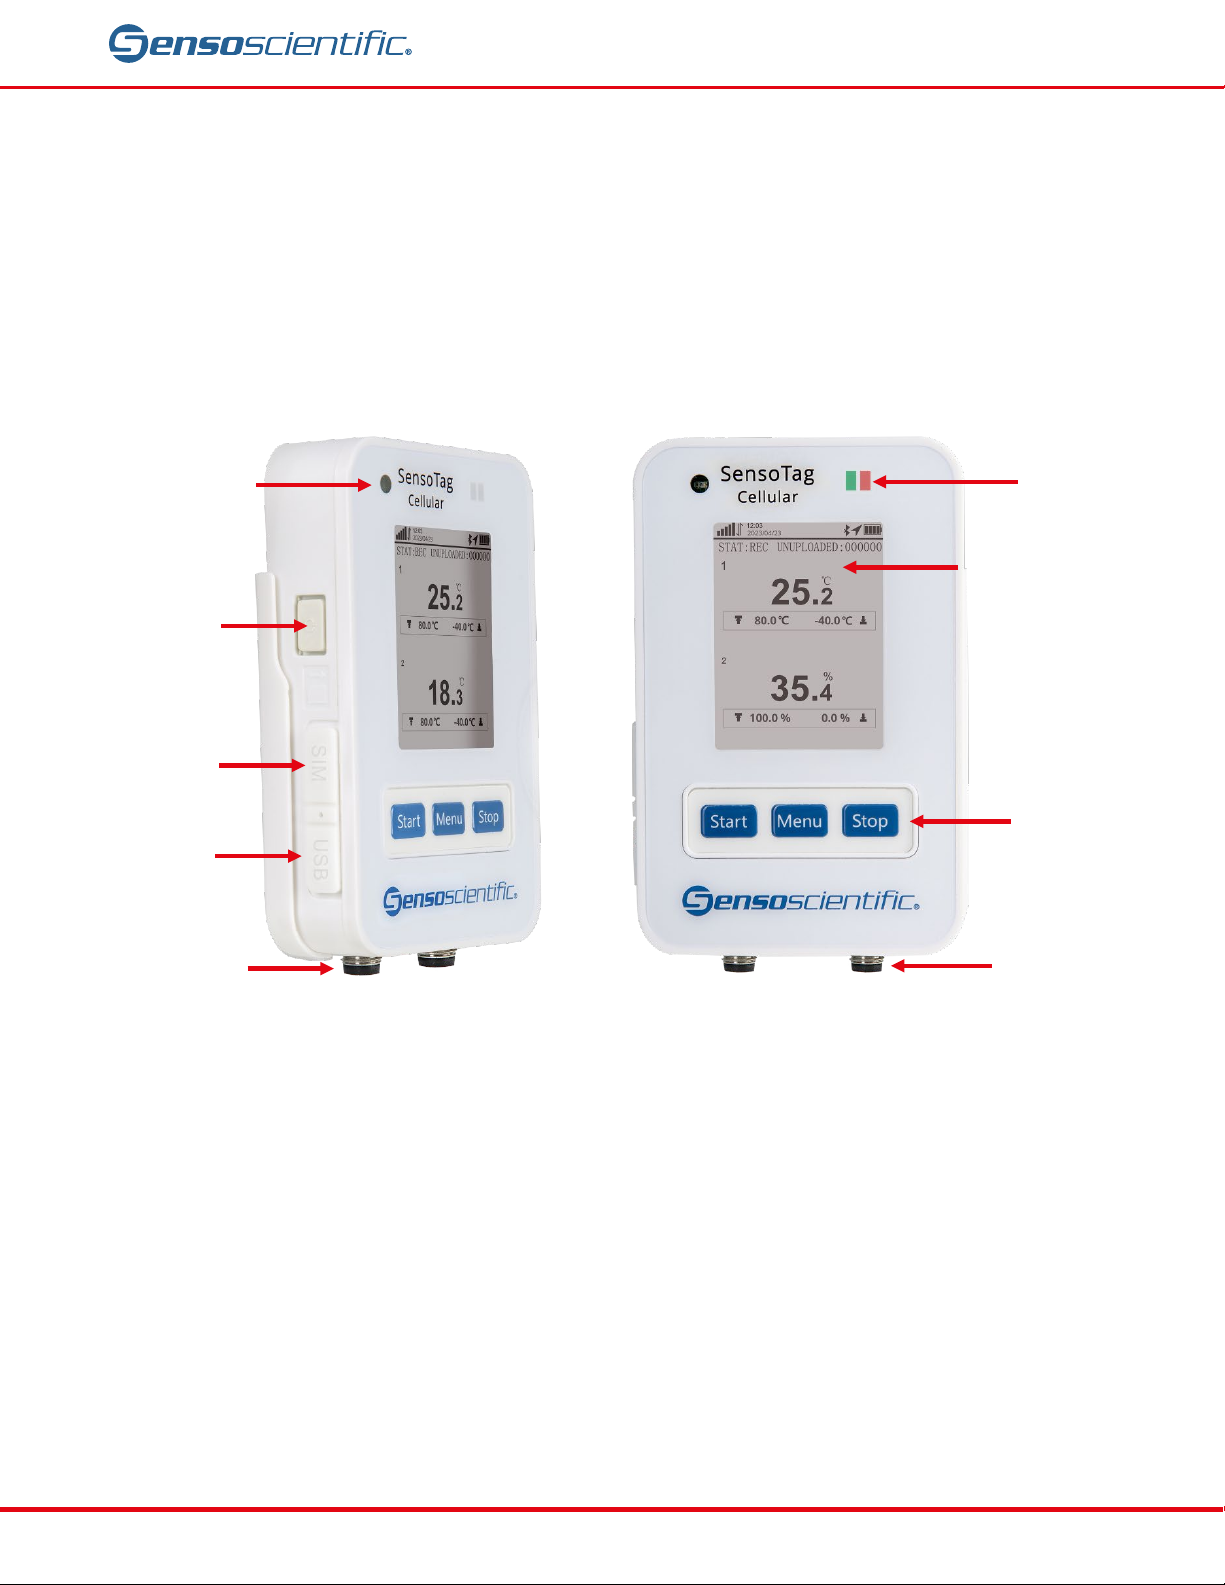
On/Off Button
LED Status
LCD Display
Push Buttons
Photosensitive
SIM Card Slot
M8 Connector
#1
USB Power Port
M8 Connector
#2
I. OTA WIRELESS DATA LOGGER
This wireless data logger uses Internet of Things technology to provide real-time monitoring, excursion alarms,
data recording, and data uploading for temperature and humidity. Data is stored in the SensoScientific Cloud for
remote data viewing. Through the cloud, you can receive alarms, view GPS and LBS positioning, generate
reports, and more.
II. GETTING TO KNOW YOUR DEVICE
sensor
sensoscientific.com 3
Figure II-1: SensoTag Cellular Node
Page 4
Environmental Monitoring Solutions
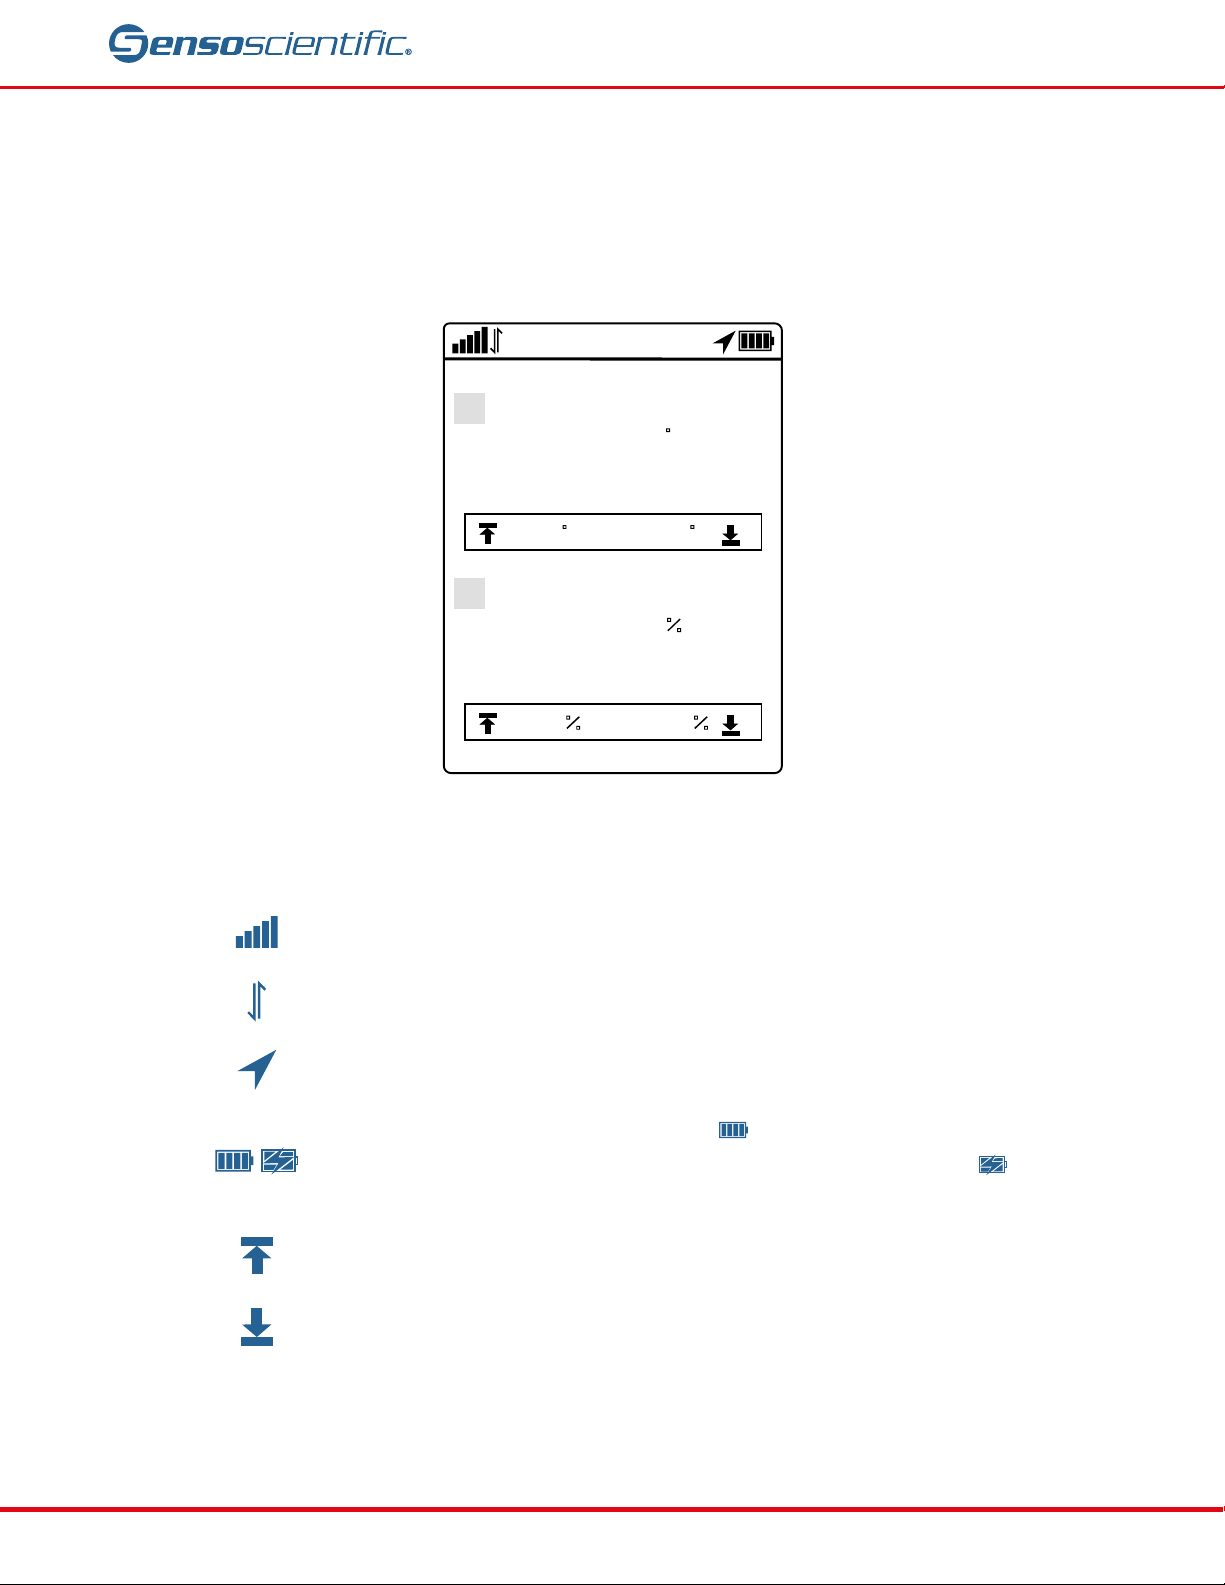
Data Transmission: Appears when data is being transferred to the cloud.
Upper Limit: Shows upper channel limit. If value is higher than upper limit,
Lower Limit: Shows lower channel limit. If value is lower than lower limit,
80.0
12:49:16
14/08/2024
STAT:STOP UNUPLOADED:000000
47
.0
F
F
-40.0
F
100.0
0.0
77
.0
T
H
III. DISPLAY NOTIFICATIONS
The display shows critical notifications essential for device operation. Below, you'll find descriptions and a legend
for each notification on the node.
Figure III-1: Node Display
Cellular Service: Indicates level of cellular service reception.
Each device can store up to 100,000 buffered readings.
GPS Signal: Appears when GPS and LBS are enabled.
Battery Status: When battery is in use, will display at High, Medium,
and Empty. When a USB power supply is attached, icon will change to
indicating battery is being charged.
color will change to red.
color will change to blue.
sensoscientific.com 4
Page 5
Environmental Monitoring Solutions
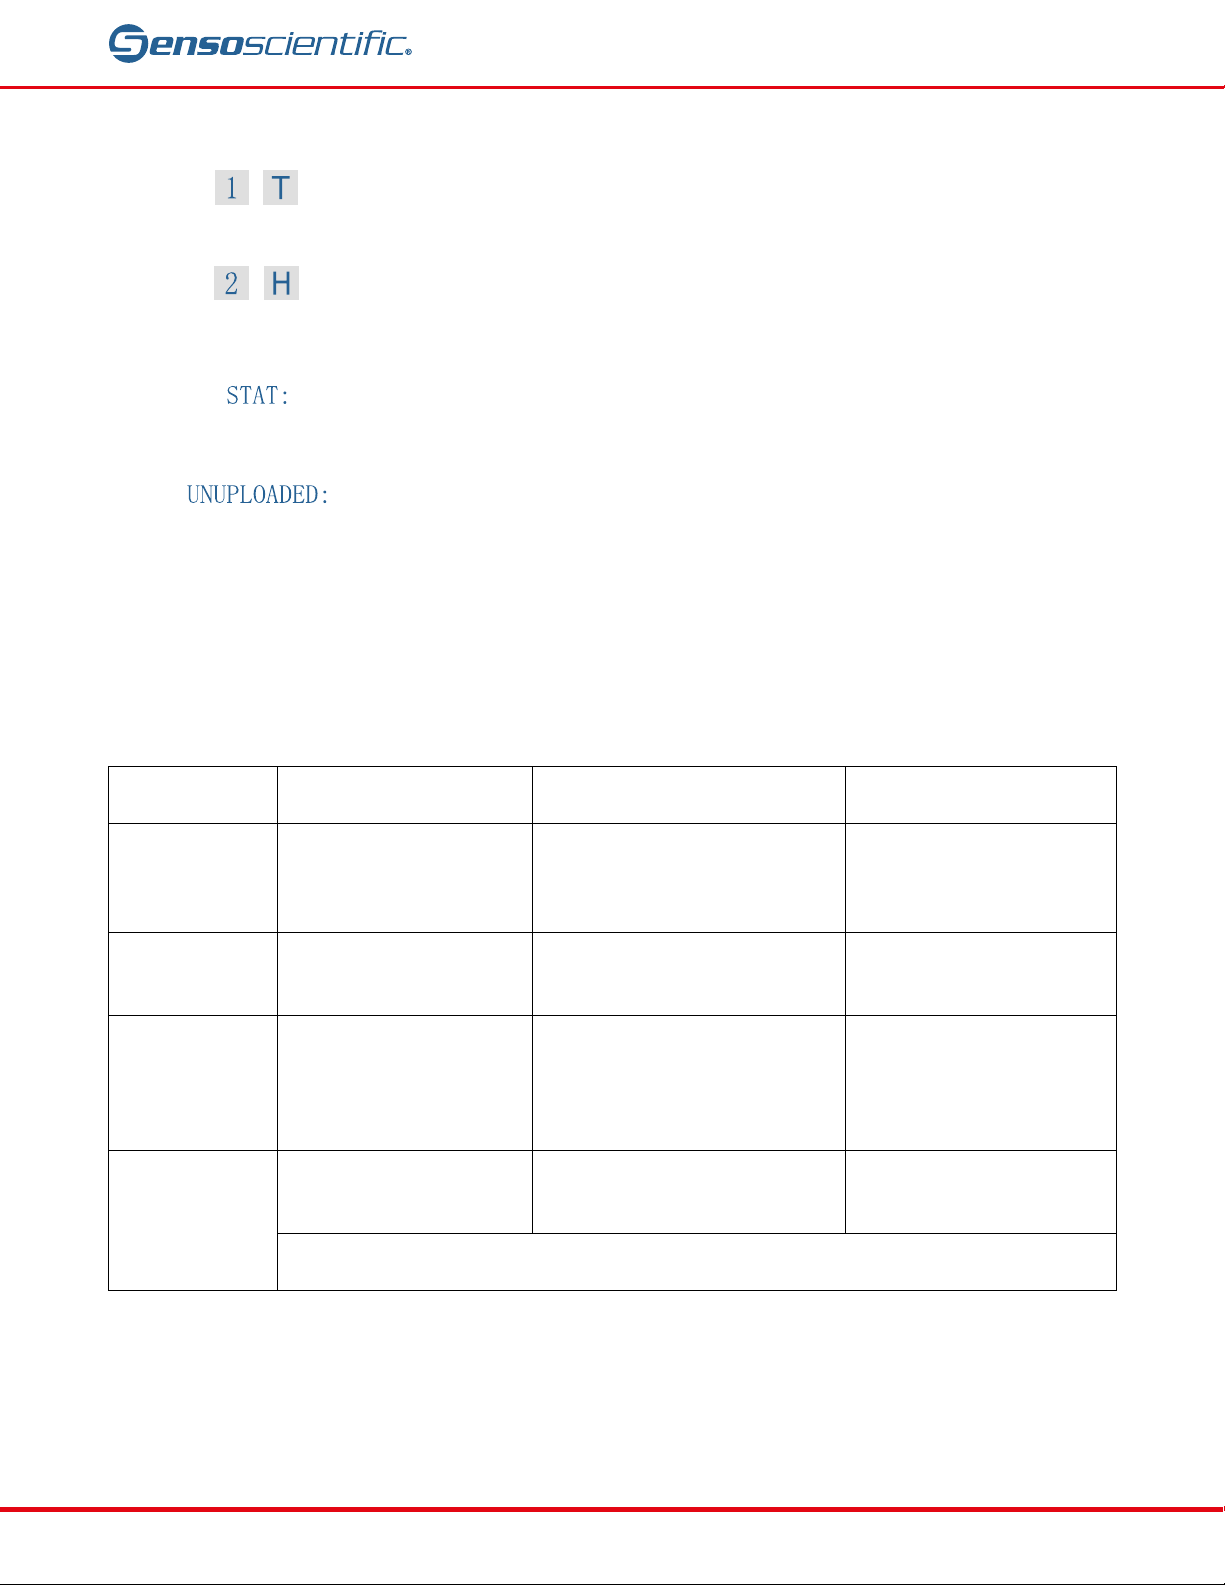
Channel 1 or T: Displays readings from the probe installed in M8 connector
Channel 2 or H: Displays readings from the probe installed in M8 connector
Stat: Indicates device status.
Unuploaded: Number of data values cached locally that have not been
Model
SensoTag-C-B11
SensoTag-C-B13
SensoTag-C-B80
One or Two
Measuring
Temperature: -40 to 80 ºC
Temperature: -196 to 150
±0.3 ºC (-20 to 40 ºC)
Gel Bottle Temperature
Digital Temperature and
Ultra Low Temperature
M8 Connector
#1. The symbol may be blank or show (T)emperature or (H)umidity,
depending on the device model.
#2. The symbol may be blank or show (T)emperature or (H)umidity,
depending on the device model.
STOP – Device is not recording data.
uploaded to cloud.
REC – Device is actively recording data.
Figure IIIII-2: Display Legend
IV. MODEL OVERVIEW
Below is information specific to each SensoTag Cellular model available for use.
Channel
Range
Accuracy Temperature: ±0.5 ºC
Sensor Type
Temperature
Probes
Temperature: -40 to 80 ºC
Sensor
One Temperature and Humidity
Probe
Humidity: 0 to 100%RH
Temperature: ±0.5 ºC
Humidity: ±5%RH
Humidity Sensor
One or Two Temperature
Probes
ºC
±0.5 ºC (-50 to 85 ºC)
±1 ºC (-100 to 150 ºC)
±2 ºC (Others)
Sensor
sensoscientific.com 5
Page 6
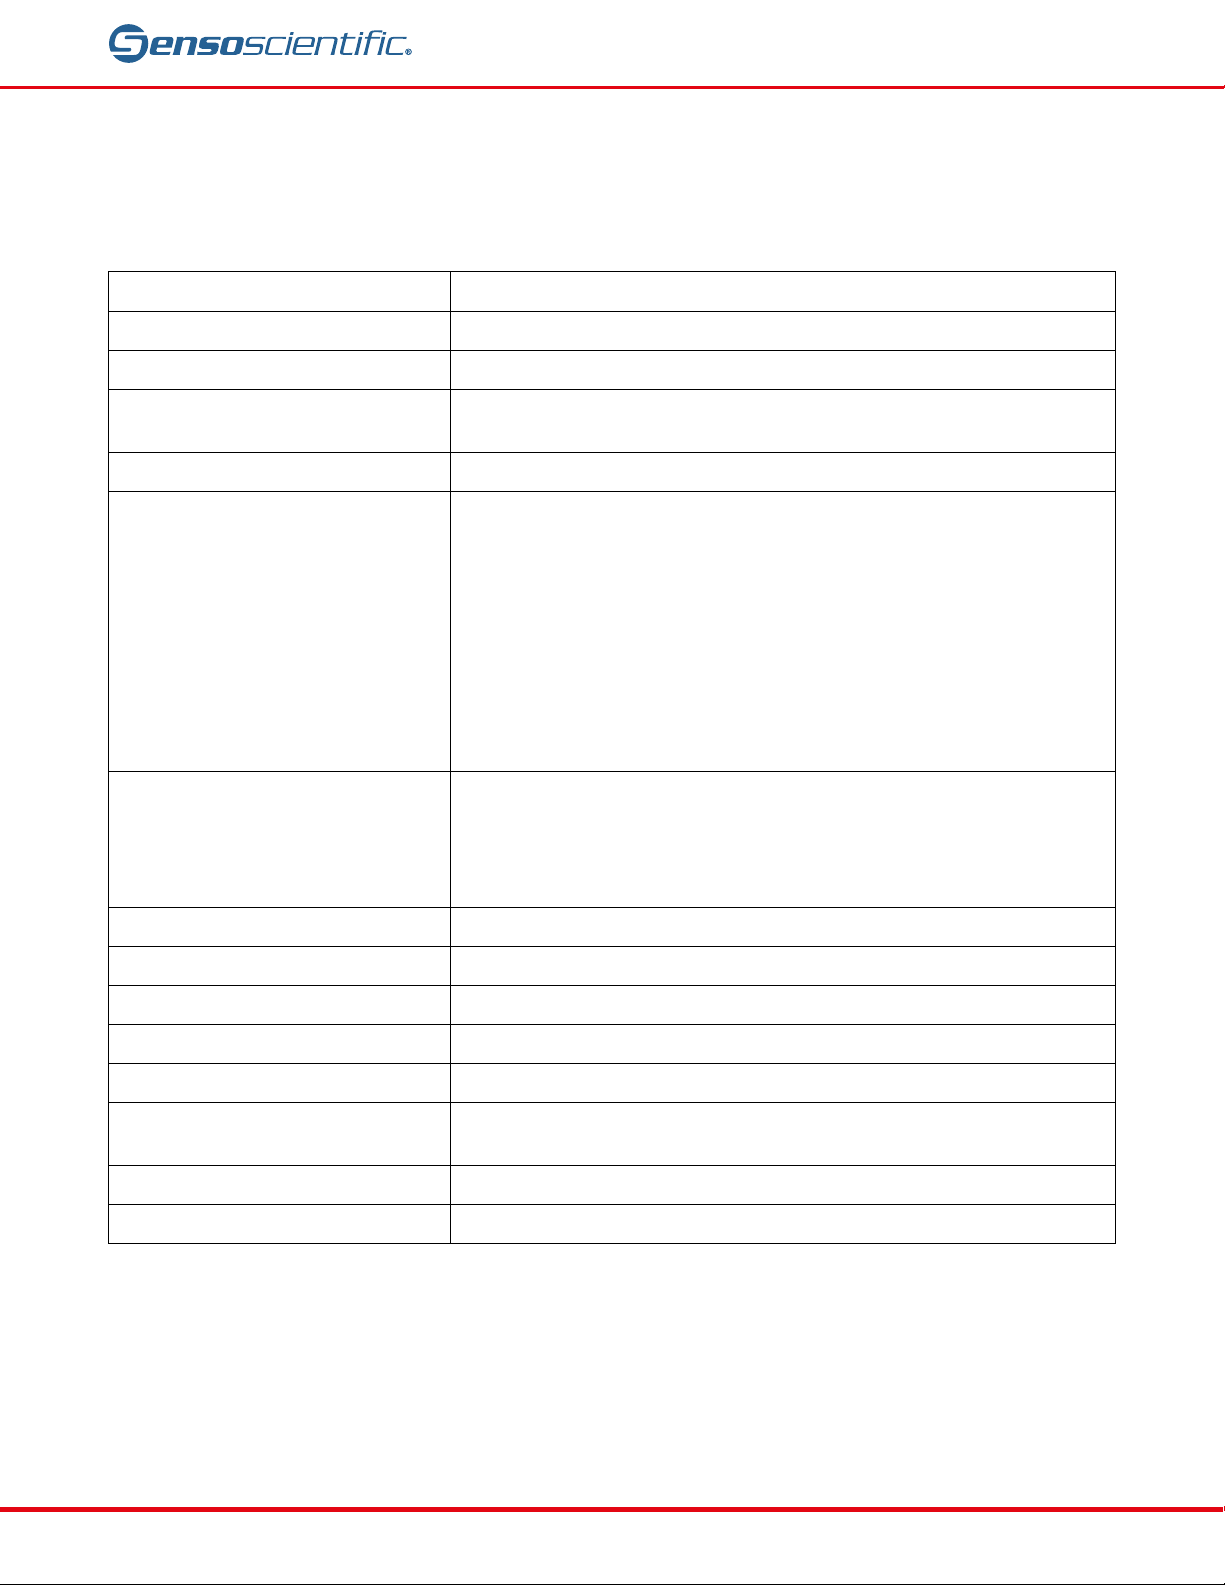
V. TECHNICAL SPECIFICATIONS
Power Input
5V/2A (DC)
Temperature Display Resolution
0.1ºC
Humidity Display Resolution
0.1%RH
Unlimited Cloud Memory;
On-transmitter Buffer Storage (100,000 Readings)
Data Storage Mode
Circular Storage
[1] Normal Recording Interval: 1 Min to 24 Hr Allowed
Upload Interval must be greater than or equal to Alarm Recording
Interval
)
[1] No Less Than 3 Months (@25 ºC, Upload Interval: 30 min, LBS
Positioning)
Indicator Light
Alarm Indicator, Charging Indicator
Screen
TFT Color Screen
Network Frequency Band
4 GHz
Alarm Modes
Local Alarm and 24/7 Alarm Notifications through the Cloud
Buttons
Power On/Off, Start, Menu, and Stop
GPS and LBS Positioning
Support
Waterproof Grade
IP64
Dimensions (L x W x H)
109mm x 69.4mm x 22.9 mm (4.29” x 2.73” x 0.86”)
Applies to all models (where applicable).
Memory
[2] Alarm Recording Interval: 1 Min to 24 Hr Allowed
Alarm Recording Interval must be less than or equal to Normal
(
Record, Upload and Alarm
Interval
Recording Interval
[3] Normal Upload Interval: 1 Min to 24 Hr Allowed, Defaulted to 15 Min
[4] Alarm Upload Interval: 1 Min to 24 Hr Allowed, Defaulted to 2 Min
Alarm
(
Environmental Monitoring Solutions
)
Positioning)
Battery Life
[2] No Less Than 14 Days (@25 ºC, Upload Interval: 30 min, LBS+GPS
Yes
sensoscientific.com 6
Page 7
Environmental Monitoring Solutions
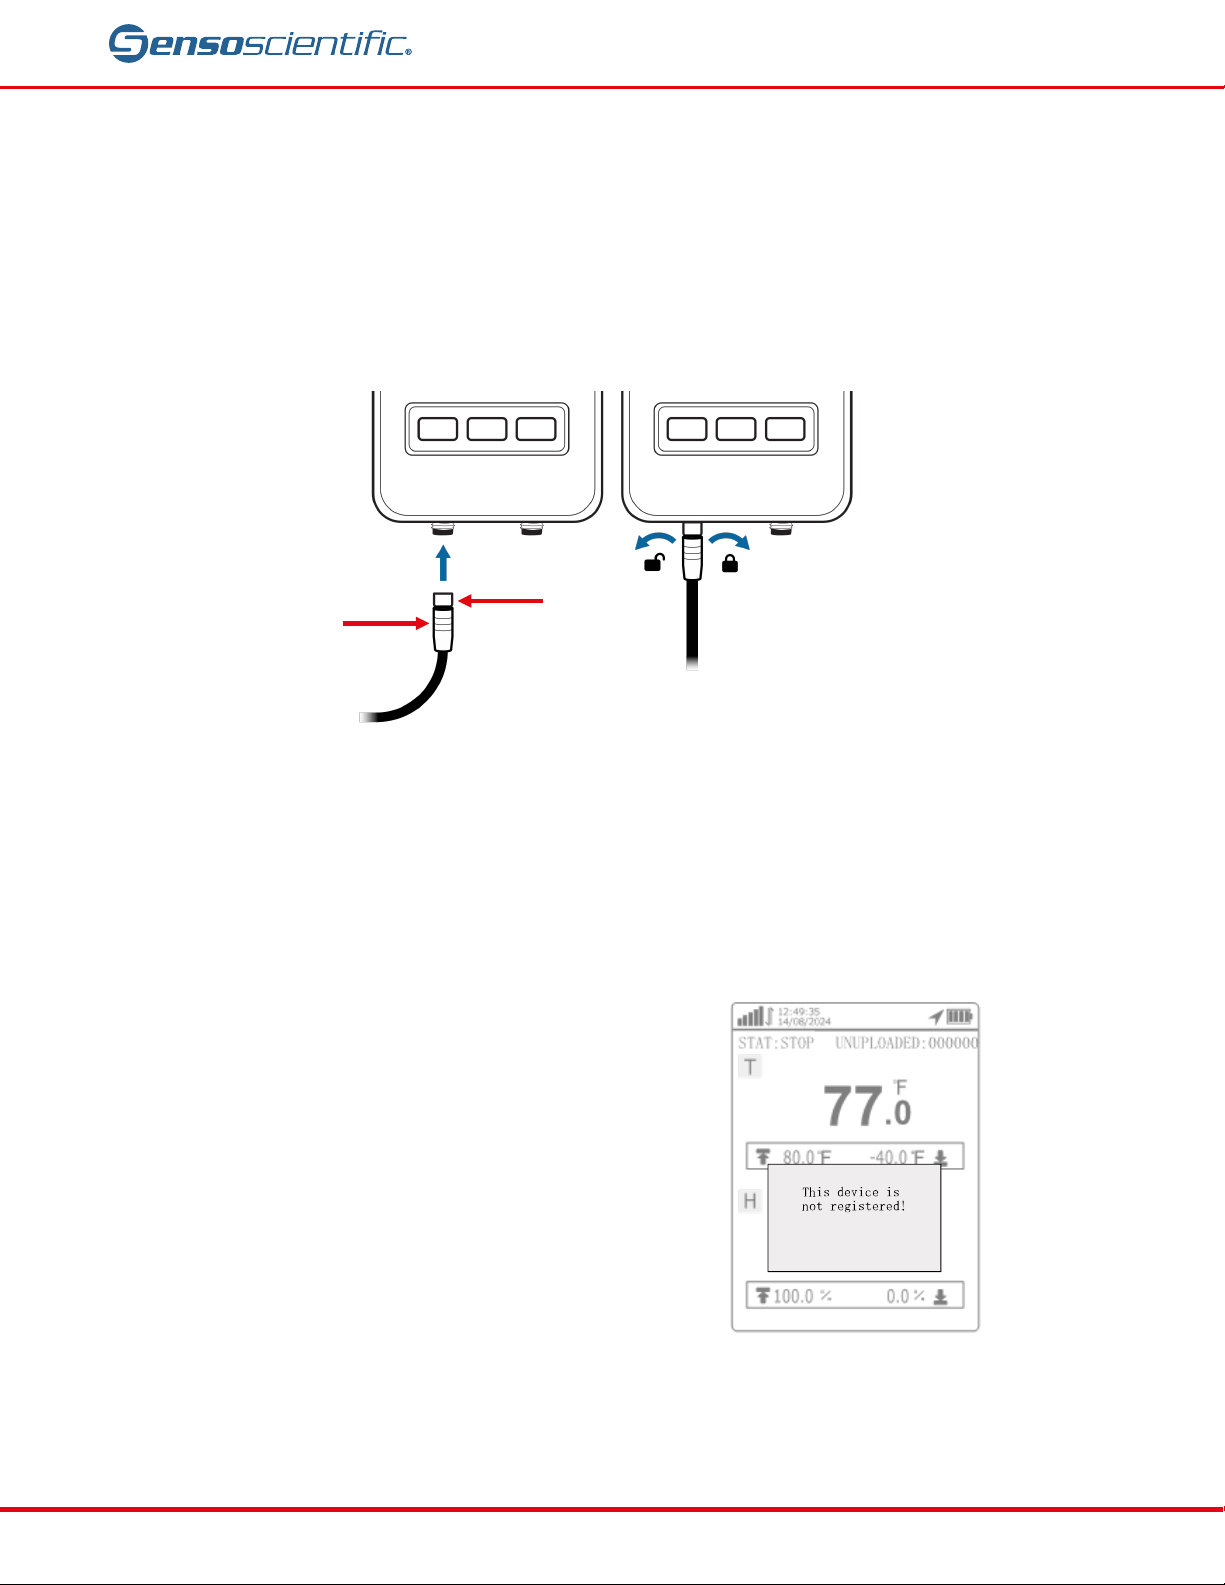
Once powered on, if the device is not registered but
Probe Female M8
Connector
Thumb
Screw
VI. SETTING UP YOUR DEVICE
Step 1 – Installing and Removing a Probe
Align the probe’s female M8 connector with the device’s M8 connector and insert it. Then, tighten the thumb
screw by rotating it clockwise to secure the connection.
and cannot be removed.
pull the plug away from the device.
To disconnect, loosen the thumb screw by turning it counterclockwise, and then gently
The thumb screw is permanently attached to the plug
Step 2 – Power On/Off
Press the on/off button for 3 seconds to turn the device on.
Step 3 – Device Registration
activated on the cellular network, the screen will
display “This device is not registered!”
If you experience any registration issues while
connecting or setting up, please reach out to
technical support.
1-800-279-3101
For support assistance, select option 4 when
prompted.
Figure VII-1: Probe Connector
sensoscientific.com 7
Figure VI-2: Device Not Registered
Page 8
Step 4 – Start Recording
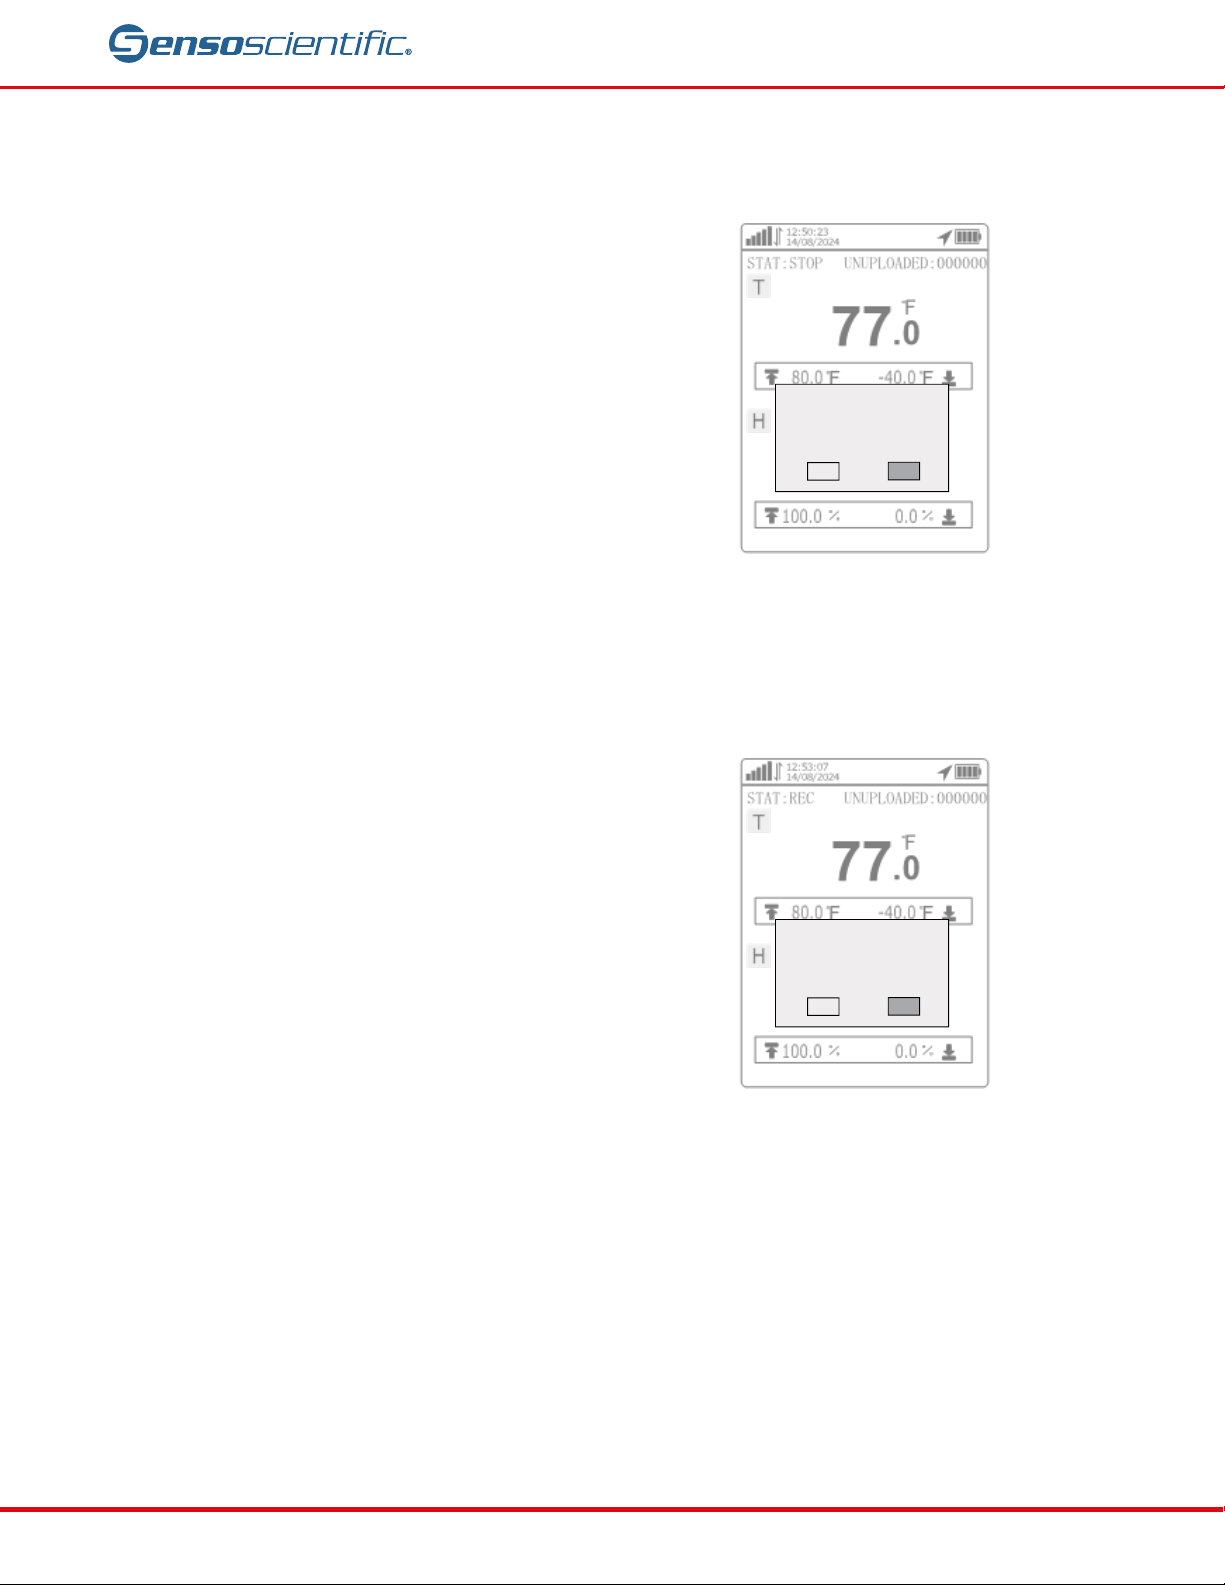
1. When the equipment is in an unmonitored
1. When the equipment is in monitored running
Yes
No
Start recording?
Yes
No
Stop recording?
Environmental Monitoring Solutions
running state, press the “Start” button for 3
seconds.
2. Click the “Start” button in the pop-up box to click
“Yes” and then click the “Menu” button to begin
recording.
Step 5 – Stop Recording
state, press the “Stop” button for 3 seconds.
2. Once recording has stopped, wait one minute
to ensure that the last sample is uploaded.
3. Click the “Start” button in the pop-up box to
click “Yes” and then click the “Menu” button
to end recording.
Figure VII-3: Start Recording
sensoscientific.com 8
Figure VII-4: Stop Recording
Page 9
VII. ADDITIONAL SETTINGS & DEVICE INFORMATION
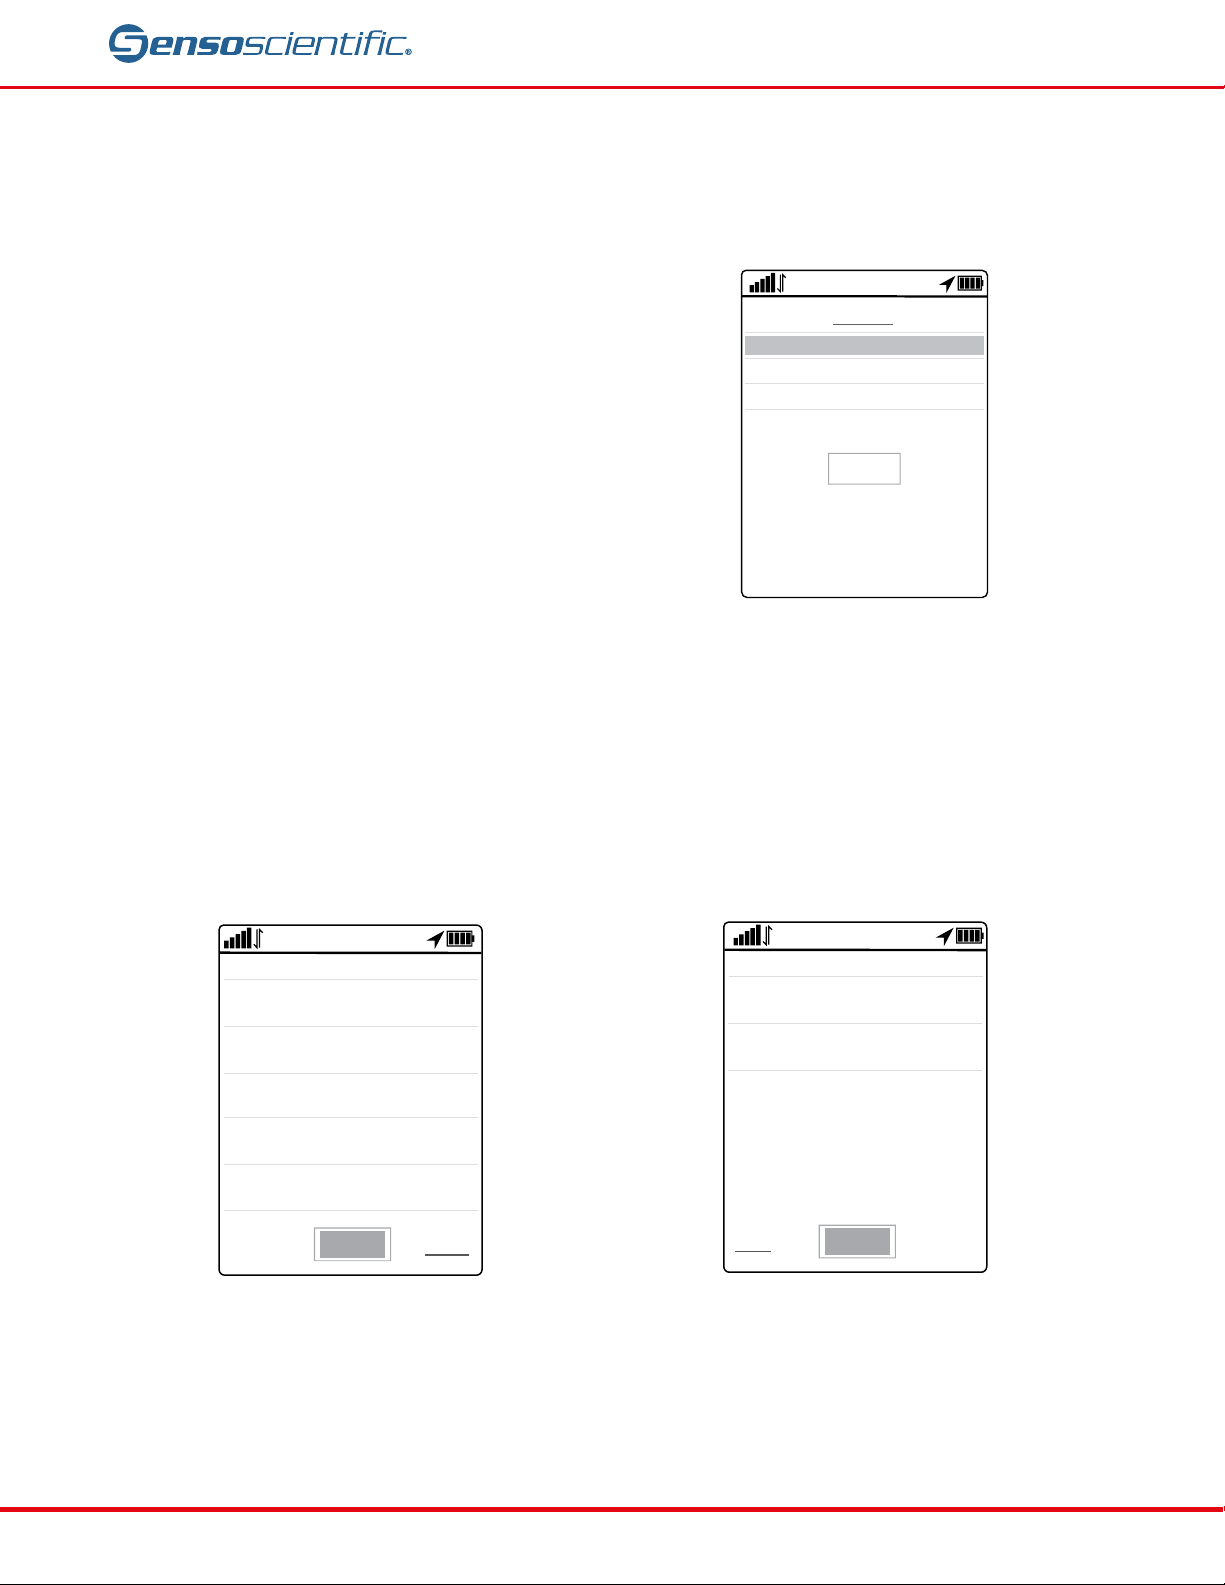
1. Press the “menu” button for 3 seconds to
12:55:29
14/08/2024
< Configuration
Back
Buzzer Alarm:
Disable
GPS Location:
Disable
<Pre
12:55:10
14/08/2024
< Configuration
Back
Normal recording interval:
5 Minute
Alarm recording interval
:
3 Minute
Normal upload interval
:
5 Minute
Alarm upload interval:
3 Minute
Delay Recording Time:
0 Minute
Next>
12:54:34
14/08/2024
MENU
1. Display Settings
2. Configuration
3. Device Information
Exit
Ver 1.00
>
>
>
Menu
Environmental Monitoring Solutions
enter the main menu page. The functions of
the buttons in the menu are as follows:
“Menu” button: confirm/select
“Start” button: switch up
“Stop” button: switch down
Figure VIIII-1: Menu
View Configuration Information
In the Configuration Settings, you can view recording, alarm, and upload intervals, buzzer alarm status, and GPS
location status.
Figure VIIII-2: Config Settings
View Device Information
Figure VIIII-3: Config Settings
sensoscientific.com 9
Page 10
Environmental Monitoring Solutions
1. Click the “Menu” button to view the
12:56:58
14/08/2024
< Device Information
Back
Device Name:
SensoTag-C-B80
GUID:
01234567890124567890
Offline Data Capacity:
100000
IMEI:
012345678901234
ICCID:
01234567890124567890
12:54:31
14/08/2024
STAT:STOP UNUPLOADED
:000000
100.0 0.0
T
H
77.0
F
77.0
F
77.0
F
MIN
MAX
AVG
MIN
MAX
AVG
46.8
46.8
46.8
80.0
F
-40.0
F
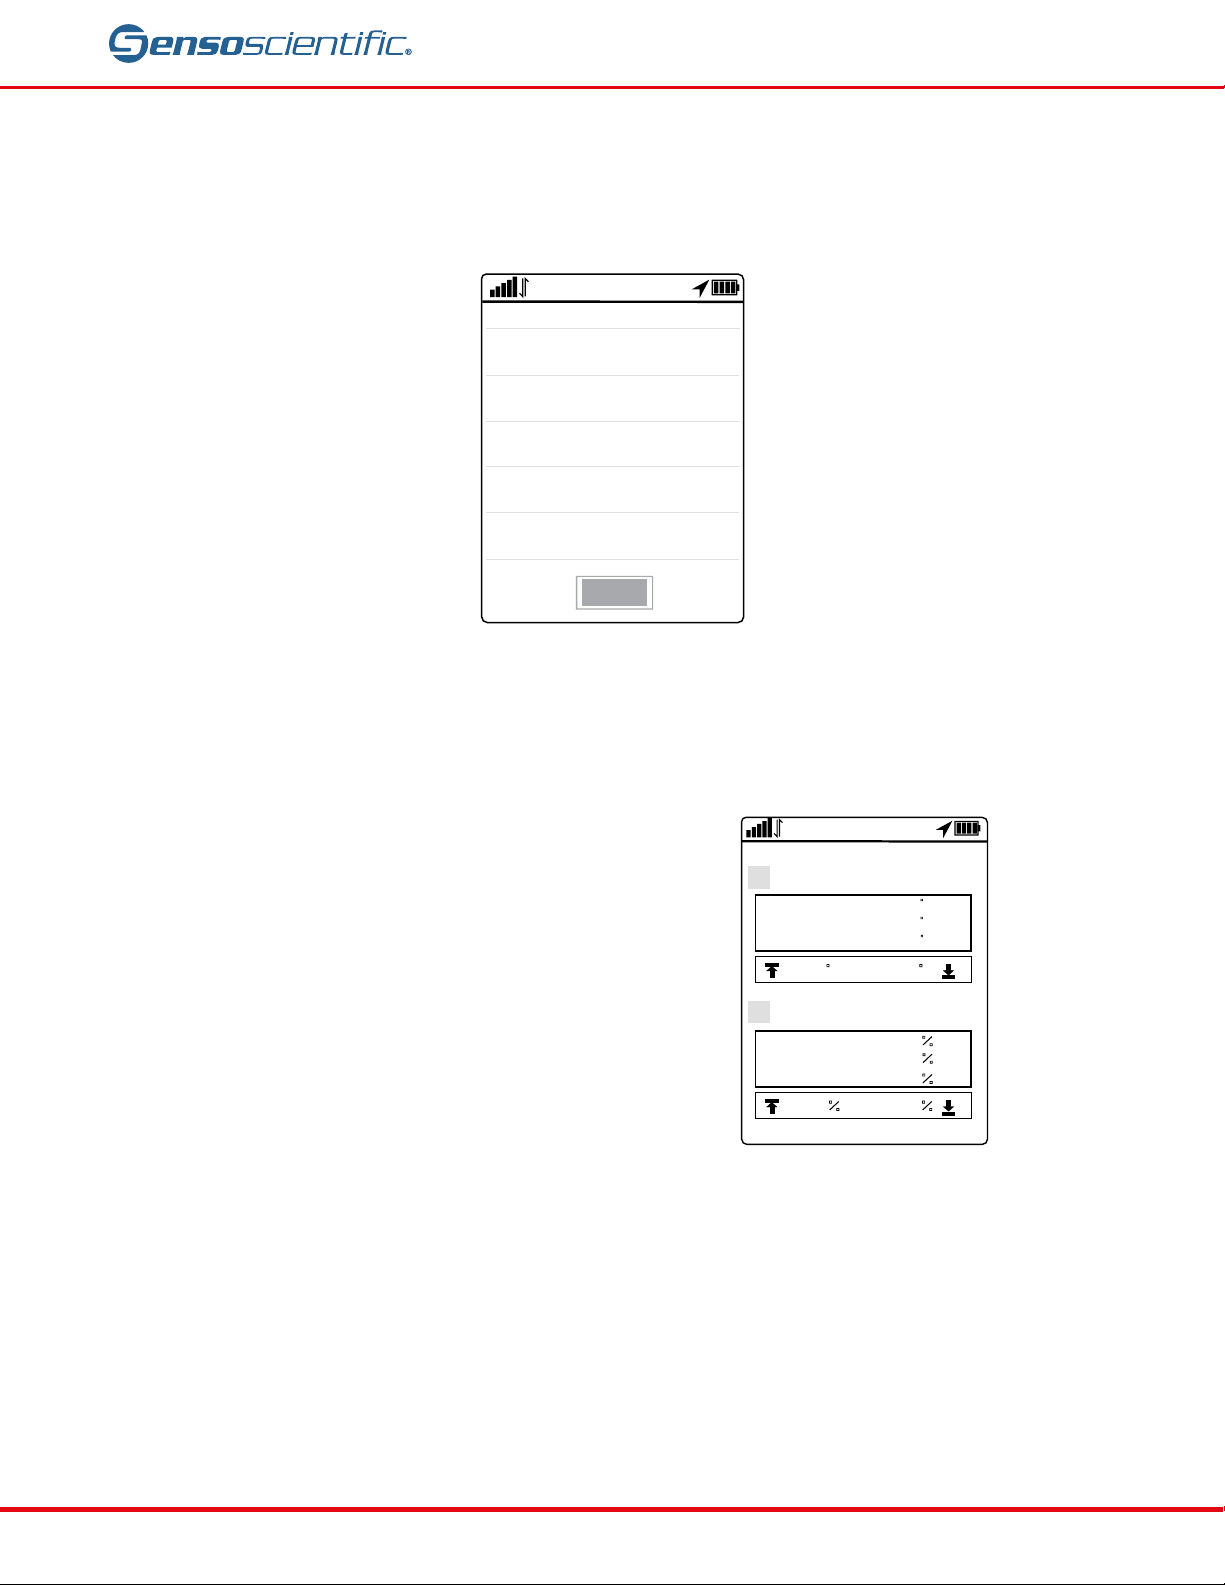
The Device Information section provides administrative details such as: device name, GUID, offline data capacity,
IMEI and ICCID.
View Maximum, Minimum, & Average Values
maximum, minimum, and average display
page.
Device Charging
Connect to the power adapter via USB cable. When charging, the charging indicator will flash. Once fully charged,
the charging indicator will remain solid.
sensoscientific.com 10
Figure VIIII-4: Device Information
Figure VIIII-5: Min and Max
Readings
Page 11

VIII. PLATFORM
cloud.sensoscientific.com
Trip data can be accessed by logging into the following platform:
Note: Usernames and passwords are case-sensitive
Access Reporting
Generate reports to review trip status and ensure readings are in-range.
1. Log in to SensoScientific Cloud platform
2. Select the “REPORT” tab in the main menu.
3. Select the “Cellular Trip Report” tab in the submenu.
4. Filter the report parameters and click the “Show Trips” button.
Trips with all values in-range will highlight as GREEN
Trips with out-of-range readings will highlight in RED.
Environmental Monitoring Solutions
sensoscientific.com 11
Page 12

Environmental Monitoring Solutions
IX. CONTACT SALES / TECHNICAL SUPPORT
Our technical support team is available Monday through Friday, between the hours of 8:00 AM and 5:00 PM
Pacific Standard Time. We also provide our clients with 24/7 support for emergency support requirements.
Phone:
800-279-3101
For support assistance, select option 4 when prompted. For sales inquiries, choose option 3 at the prompt.
Fax:
888-238-6002
E-Mail:
[email protected]
24/7 Priority Support:
This feature provides our clients a simple way to create support tickets to get in touch with technical support.
Navigate to HELP > Submit a Ticket in the SensoScientific cloud.
sensoscientific.com 12
Page 13
X. DOCUMENT INFORMATION
Version History
V1.0
JH / 08.20.2024
minor content adjustments made
Associated forms and procedures
Doc. No.
Document Title
Associate Records
SS7422004E
Version Modified by Description of Change
Environmental Monitoring Solutions
Doc. No. Document Title
DOCUMENT END
sensoscientific.com 13
-US_1.1/2024-08
 Loading...