

Page 1
Flame Miniature Spectrometer
User Manual
Amy to r
For Products: FLAME-S, FLAME-T
Document: 225-00000-000-11-201604
Page 2

Ocean Optics, Inc.
830 Douglas Ave.
Dunedin, FL 34698
USA
Manufacturing & Logistics
4301 Metric Dr.
Winter Park, FL 32792
USA
Ocean Optics Asia
666 Gubei Road
Kirin Tower Suite 601B
Changning District
Shanghai
PRC, 200336
Sales & Support
Geograaf 24
6921 EW Duiven
The Netherlands
Manufacturing & Logistics
Maybachstrasse 11
73760 Ostfildern
Germany
AMERICAS & WORLD HEADQUARTERS
Phone: +1 727-733-2447
Fax: +1 727-733-3962
Sales: info@oceanoptics.com
Orders: orders@oceanoptics.com
Support: techsupport@oceanoptics.com
EUROPE, MIDDLE EAST & AFRICA
Phone: +31 26-319-0500
Fax: +31 26-319-0505
Email: info@oceanoptics.eu
Germany : +49 711-341696-0
UK : +44 1865-811118
France : +33 442-386-588
ASIA
Phone: +86 21-6295-6600
Fax: +86 21-6295-6708
Email: asiasales@oceanoptics.com
Japan & Korea: +82 10-8514-3797
Copyright © 2015 Ocean Optics, Inc.
All rights reserved. No part of this publication may be reproduced, stored in a retrieval system, or transmitted, by any means,
electronic, mechanical, photocopying, recording, or otherwise, without written permission from Ocean Optics, Inc.
Trademarks
All products and services herein are the trademarks, service marks, registered trademarks or registered service marks of their
respective owners.
Limit of Liability
Every effort has been made to make this manual as complete and as accurate as possible, but no warranty or fitness is implied. The
information provided is on an “as is” basis. Ocean Optics, Inc. shall have neither liability nor responsibility to any person or entity
with respect to any loss or damages arising from the information contained in this manual.
www.oceanoptics.com
Page 3

Table of Contents
About This Manual ......................................................................................................... v
Document Purpose and Intended Audience .............................................................................. v
Document Summary .................................................................................................................. v
Product-Related Documentation ............................................................................................... vi
Document Version ..................................................................................................................... vi
Patent Pending Notice ................................................................................................... vi
Warranty ........................................................................................................................ vii
ISO Certification ............................................................................................................ vii
Compliance ................................................................................................................... vii
Chapter 1: Introduction ..................................................................... 1
Product Introduction ...................................................................................................... 1
Product Features ....................................................................................................................... 2
Typical Applications ................................................................................................................... 3
Product Versions ....................................................................................................................... 6
Chapter 2: Installation and Setup ..................................................... 9
What’s In the Box ................................................................................................ .......... 9
Flame Installation ................................................................................................ .......... 9
Software Installation .................................................................................................................. 10
About OceanView ...................................................................................................................... 11
Hardware Setup ......................................................................................................................... 11
Hardware Features .................................................................................................................... 13
Flame LEDs .......................................................................................................................... 13
Change the Slit ...................................................................................................................... 13
Accessories ................................................................................................................... 14
Cables and Connectors ............................................................................................................. 14
DB15 Connector Cable (FLAME-CBL-DD4P-DB15P) .......................................................... 15
PAK50 Connector Cable (FLAME-CBL-DD4P-PAK50P) ..................................................... 16
Breakout Box (HR4-BREAKOUT) ............................................................................................. 16
Interchangeable Slits ................................................................................................................. 16
Light Sources, Cuvette Holders and Other Accessories ........................................................... 17
Measurement Techniques – Typical Set-ups ................................................................. 17
Absorbance ............................................................................................................................... 17
225-00000-000-11-201604 i
Page 4

Table of Contents
Common UV-Vis Applications ............................................................................................... 18
Reflectance & Transmission ...................................................................................................... 18
Common UV-Vis Reflectance Applications ........................................................................... 18
Common UV-Vis Transmission Applications ........................................................................ 18
Fluorescence ............................................................................................................................. 19
Common Fluorescence Applications .................................................................................... 19
Irradiance ................................................................................................................................... 20
Common Irradiance Applications .......................................................................................... 21
Chapter 3: Flame Operation with OceanView .................................. 23
Overview ....................................................................................................................... 23
Launch OceanView ....................................................................................................... 23
OceanView Main Screen ............................................................................................... 24
Connect the Flame in OceanView ............................................................................................. 25
Set Acquisition Parameters ....................................................................................................... 25
Quick View and Device Response ............................................................................................ 26
Continuous and Single Acquisitions .......................................................................................... 26
Save Data .................................................................................................................................. 27
Saved Data Panel ...................................................................................................................... 27
Projects and Methods ................................................................................................................ 28
Spectroscopy Application Wizards ............................................................................................ 29
Dark and Reference Measurements ......................................................................................... 29
Schematic View ......................................................................................................................... 30
Chapter 4: Troubleshooting .............................................................. 31
Overview ....................................................................................................................... 31
Microsoft Windows Operating Systems ................................................................................ 32
Apple Mac OSX Operating Systems ..................................................................................... 33
Linux Operating Systems ...................................................................................................... 33
Chapter 5: How the Flame Spectrometer Works ............................. 37
Overview ....................................................................................................................... 37
Chapter 6: Technical Specifications ................................................. 45
Mechanical Diagram ...................................................................................................... 48
Electrical Pinout ............................................................................................................. 49
DD4 Accessory Connector Pinout Diagram .............................................................................. 49
SPI ......................................................................................................................................... 52
I2C ......................................................................................................................................... 52
ii 225-00000-000-11-201604
Page 5

Table of Contents
CCD Overview ............................................................................................................... 52
CCD Detector ............................................................................................................................ 52
CCD Well Depth ........................................................................................................................ 53
Signal Averaging ....................................................................................................................... 53
Internal Operation ...................................................................................................................... 54
Pixel Definition ...................................................................................................................... 54
CCD Detector Reset Operation ................................................................................................. 55
Timing Signals ............................................................................................................... 55
Strobe Signals ........................................................................................................................... 55
Single Strobe ......................................................................................................................... 55
Continuous Strobe ................................................................................................................ 56
Synchronous Continuous Strobe .......................................................................................... 56
External Triggering ........................................................................................................ 56
Triggering Modes ....................................................................................................................... 57
Normal ................................................................................................................................... 57
External Synchronous Trigger Mode .................................................................................... 57
External Hardware Level Trigger Mode ................................................................................ 57
External Hardware Edge Trigger Mode ................................................................................ 57
Chapter 7: Calibration ....................................................................... 59
Overview ....................................................................................................................... 59
Wavelength Calibration.................................................................................................. 59
About Wavelength Calibration ................................................................................................... 59
Calibrating the Spectrometer Wavelength ................................................................................. 60
Preparing for Calibration ....................................................................................................... 60
Calibrating the Wavelength of the Spectrometer .................................................................. 60
Irradiance Calibrations ................................................................................................... 63
Chapter 8: Firmware and Advanced Communications ................... 65
FLAME-S Firmware ....................................................................................................... 65
Hardware Description ................................................................................................................ 65
USB Information ........................................................................................................................ 65
Instruction Set ............................................................................................................................ 65
Command Syntax .................................................................................................................. 65
USB Command Summary ......................................................................................................... 66
USB Command Descriptions ................................................................................................ 67
Flame –S Serial Port Interface Communications and Control Information ............................... 81
Hardware Description ............................................................................................................ 81
Instruction Set ....................................................................................................................... 82
Command Descriptions ......................................................................................................... 84
FLAME-T Firmware ....................................................................................................... 91
Hardware Description ................................................................................................................ 91
225-00000-000-11-201604 iii
Page 6

Table of Contents
Spectral Memory Storage ..................................................................................................... 91
USB Information ........................................................................................................................ 91
Instruction Set ............................................................................................................................ 91
Command Syntax .................................................................................................................. 91
USB Command Summary ......................................................................................................... 92
USB Command Descriptions ................................................................................................ 93
Flame –T Serial Port Interface Communications and Control Information ................................ 106
Hardware Description ............................................................................................................ 106
Spectral Memory Storage ..................................................................................................... 106
Instruction Set ....................................................................................................................... 106
Command Summary ............................................................................................................. 106
Command Descriptions ......................................................................................................... 108
Examples .............................................................................................................................. 116
Index ................................................................................................... 117
iv 225-00000-000-11-201604
Page 7

Chapter
Description
Chapter 1: Introduction
Introduces the product features. Contains descriptive
information about the Flame Spectrometer. It also provides a
list of system requirements, typical applications, and product
versions.
Chapter 2: Installation and Setup
Provides installation instructions, including how to set up the
Flame with OceanView. Also includes package contents and
typical set-ups for different measurement techniques.
Chapter 3: Flame Operation with
OceanView
Describes how to use the Flame with OceanView software,
including how to connect, acquire, save and other basic
features.
Chapter 4: Troubleshooting
Contains recommended steps to isolate and correct common
problems.
Chapter 5: How the Flame
Spectrometer Works
Describes how the Flame operates, illustrating the various
parts and functions.
Chapter 6: Technical
Specifications
Contains technical specifications and connector pinouts for the
Flame Spectrometer.
Chapter 7: Calibration
Provides instructions for calibrating the Flame Spectrometer.
Chapter 8: Firmware and
Advanced Communications
Contains a description of firmware commands.
About This Manual
Document Purpose and Intended Audience
Thank you for choosing Ocean Optics! We hope that you’ll be delighted with your decision. This
document provides the users of Flame Spectrometers with instructions for setting up,
calibrating and performing experiments with their spectrometer. It also contains detailed
technical specifications and information about firmware and hardware integration. If you can’t
find what you’re looking for in this document, please do not hesitate to contact us at
techsupport@oceanoptics.com or via www.oceanoptics.com.
Document Summary
225-00000-000-11-201604 v
Page 8
About This Manual
Document for…
Document Location
OceanView software
http://oceanoptics.com/wp-content/uploads/OceanViewIO.pdf
SpectraSuite software
http://oceanoptics.com///wp-content/uploads/SpectraSuite.pdf
HR-4 Breakout Box
http://oceanoptics.com/wp-content/uploads/HR-4-Breakout-Box.pdf
External triggering
http://oceanoptics.com/wp-content/uploads/External-TriggeringOptions_Firmware3.0andAbove.pdf
Replacing the slit
http://oceanoptics.com/wp-content/uploads/INTSMA-Slit.pdf
Device driver issues
http://oceanoptics.com///wp-content/uploads/Correcting-Device-Driver-Issues.pdf
Document Number
Version
225-00000-000-11-201503
First release
225-00000-000-11-201503b
Updates technical specifications, troubleshooting instructions, and
other minor issues.
225-00000-000-11-201504
Updates the Electrical pinout information
225-00000-000-11-201505
Adds information for the Performance Charts.
225-00000-000-11-201505
Updates the specificaitons.
225-00000-000-11-201604
Updates the specifications and triggering information
Product-Related Documentation
You can access documentation for Ocean Optics products by visiting our website at
http://www.oceanoptics.com. Select Support Technical Documents, then choose the
appropriate document from the available drop-down lists.
Ocean Optics offers a Glossary of spectroscopy terms to help you further understand your
state-of-the-art products and how they function, located at: http://oceanoptics.com/glossary/.
Document Version
Patent Pending Notice
The Flame spectrometer is covered by Patents Pending. Any violation of Ocean Optics
intellectual property will be prosecuted.
vi 225-00000-000-11-201604
Page 9

About This Manual
Warranty
Our 3-Year Warranty covers Ocean Optics miniature fiber-optic spectrometers, spectral sensors,
light sources and sampling accessories – regardless of the application – from manufacturing
defects. It also covers fibers and probes for a full 12 months:
http://oceanoptics.com/services/exclusive-3-year-warranty/.
This comprehensive warranty ensures you of the highest level of craftsmanship and reliability
for years to come. No other manufacturer offers such a solid guarantee of quality and reliability.
The Ocean Optics 3-Year Warranty applies to Ocean Optics equipment (excluding OEM
configurations) purchased on or after July 1, 2010. The warranty covers parts and labor needed
to repair manufacturing defects that occur during the warranty period. We also will cover the
costs of shipping warranty-related repairs from our customers to Ocean Optics and from us to
our customers.
ISO Certification
Ocean Optics, the industry leader in miniature photonics, has been certified for ISO 9001:2008
certification applicable to the design and manufacture of electro-optical equipment since 2009.
Compliance
This is a Class A product. In a domestic environment this product may
cause radio interference in which case the user may be required to take
adequate measures.
WARNING
225-00000-000-11-201604 vii
Page 10

About This Manual
FCC COMPLIANCE
This equipment has been tested and found to comply with the limits for
a Class A digital device, pursuant to Part 15 of the FCC Rules. These
limits are designed to provide reasonable protection against harmful
interference when the equipment is operated in a commercial
environment. This equipment generates uses and can radiate radio
frequency energy and, if not installed and used in accordance with the
instruction manual, may cause harmful interference to radio
communications. Operation of this equipment in a residential area is
likely to cause harmful interference in which the user will be required
to correct the interference at his own expense.
WARNING: The authority to operate this equipment is conditioned
by the requirement that no modifications will be made to the
equipment unless the changes or modifications are expressly approved
by the manufacturer.
viii 225-00000-000-11-201604
Page 11
Chapter 1
Introduction
Product Introduction
The Flame Spectrometer is the latest generation of Ocean Optics’ ubiquitous Czerny-Turner
design. With the release of the world’s first miniature spectrometer in 1993, Ocean Optics
helped to make spectroscopy portable, inexpensive and flexible in a way that was never before
possible. Researchers, educators and OEM manufacturers embraced the technology and have
used it in ways we never thought possible.
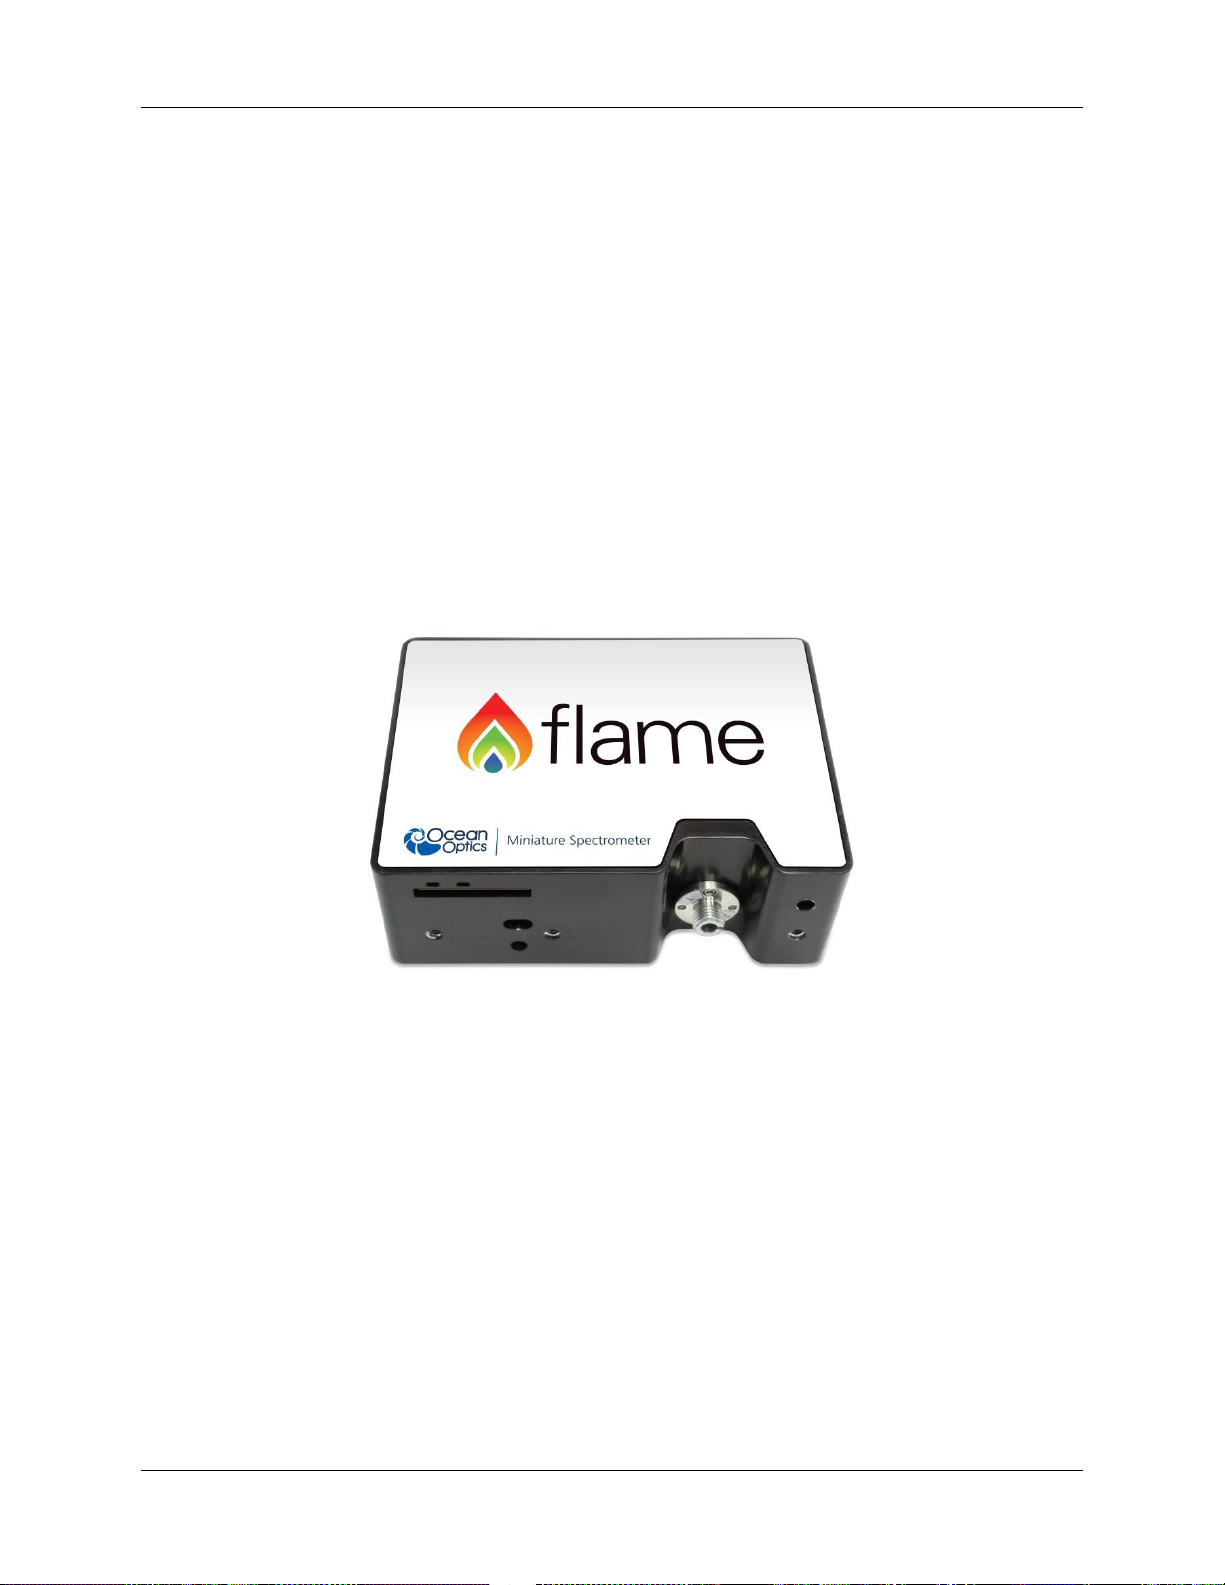
Flame Spectrometer
Now, fueled by our passion for solving problems, and inspired by the feedback of our customers
we have reinvented our core miniature spectrometer platform to meet the most demanding
challenges of today’s applications. Flame combines our heritage, creativity and insight in a way
that delivers the power of miniature, modular spectroscopy without compromise.
Flame is built using industry leading manufacturing techniques that help deliver high thermal
stability and low unit to unit variation without compromising the flexibility and configurability
that are the hallmark of the design. New features such as interchangeable slits, indicator LEDs
and simpler device connectors deliver more freedom and less frustration.
Whether you are an educator looking for an instrument to teach students the basic principles of
spectroscopy, a research lab looking to make a breakthrough, a scientist working in the field to
study the world around us or an engineer working to integrate a spectrometer into an OEM
system, the Flame will provide you with the performance and features you need to make your
UV-Vis spectroscopy application successful.
225-00000-000-11-201604 1
Page 12

1: Introduction
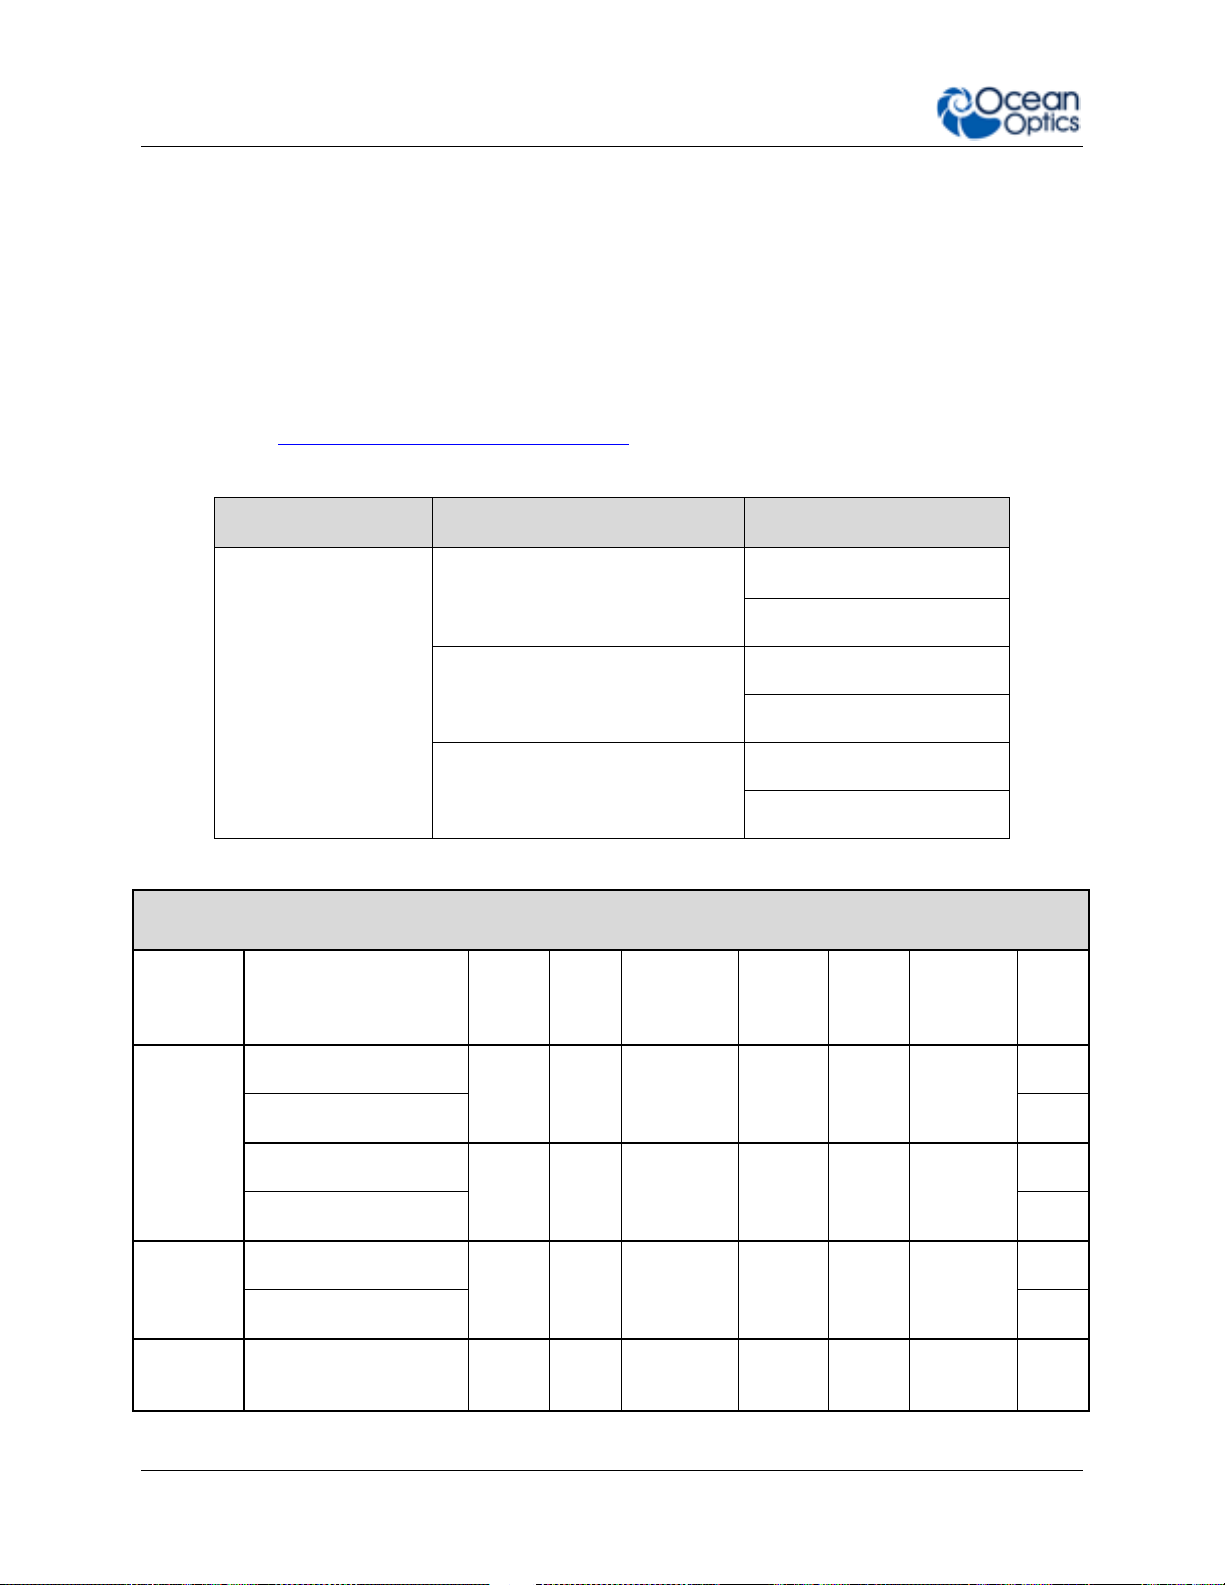
Key Feature
Best For…
Example Applications
UserInterchangeable
Slits
Users who wish to vary resolution and
throughput during measurements, or
switch from absorbance to
fluorescence in minutes
Life science and other labs using a wide
variety of biological samples
Indicator LEDs
Convenient visual reference for
spectrometer operation and status
Teaching and general lab use
Thermal Stability
Applications that require repeatable
results in industrial and other
environments with varying
temperatures and conditions
LED binning and light metrology,
process monitoring
Reduced Unit to
Unit Variation
OEM applications such as uncalibrated
sensitivity and other measurement
needs where users benefit from low
variance
OEM manufacturers of analytical
instrumentation
Product Features
Incredibly configurable, with over 1 billion possible off-the-shelf configurations across
the wavelength range 190-1100nm. Balanced throughput, resolution and range to
optimize the spectrometer for your application.
Works seamlessly with Ocean Optics’ large range of light sources, accessories and
software
Easy to use. Plug and play via the micro-USB connection.
User-interchangeable slit allows you to vary the resolution and throughput of the
spectrometer on demand. In seconds, go from high resolution to high throughput using
the same spectrometer.
Indicator LEDs show the power and data transfer status of the spectrometer at all times.
Compact and lightweight. The “go anywhere” spectrometer for the lab and in the field.
The introduction of new, high-tech manufacturing methods has dramatically improved
optical alignment accuracy resulting in improved unit-to-unit performance and
reproducibility.
High thermal stability allows for accurate and repeatable measurements in demanding
environments.
Choice of USB or RS-232 serial communications supported by drivers and software that
make it easy to integrate into almost any system.
8 GPIO pins and the ability to provide power to external devices through the 40-pin
connector.
2 225-00000-000-11-201604
Page 13

1: Introduction
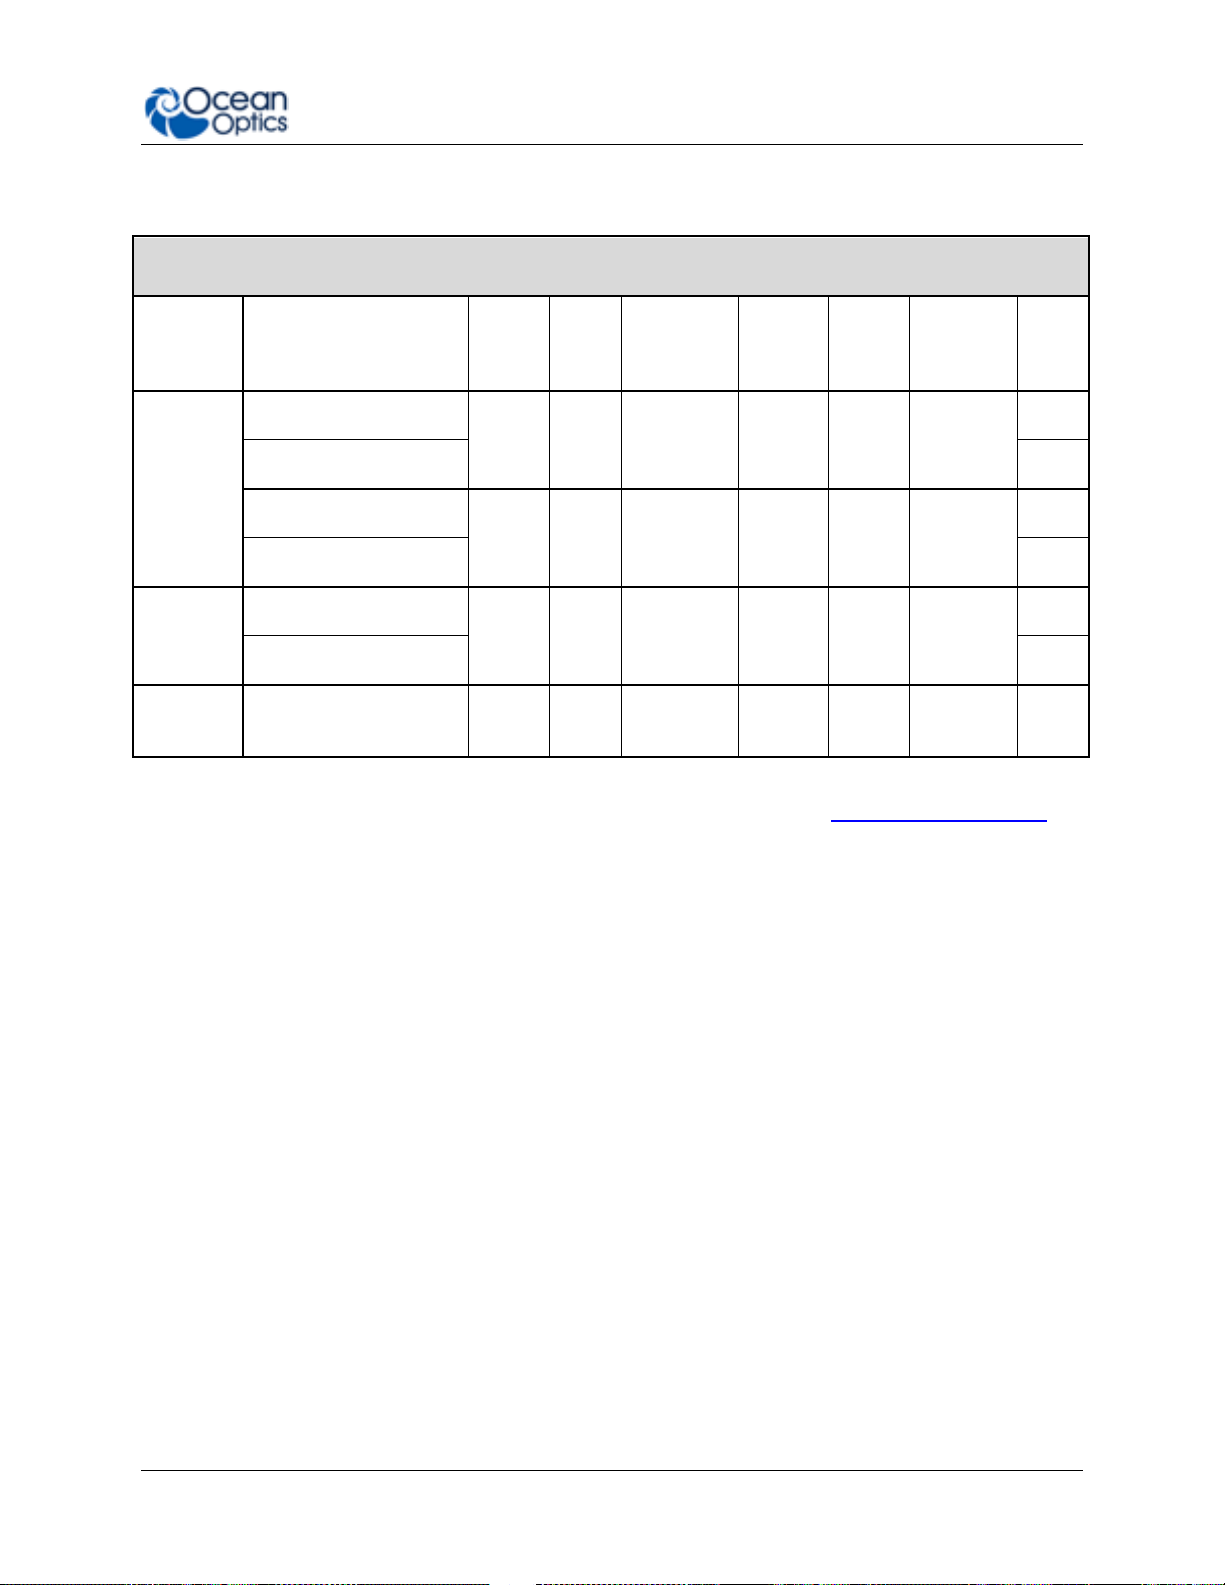
Key Feature
Best For…
Example Applications
Configurability
Optimizing your spectrometer for
application-specific requirements;
adjusting range, throughput and
resolution and adding features such as
filters as required
Laser characterization, low signal
fluorescence and optimizing for specific
absorbance bands
Plug & Play
Operation
Users that want the convenience of
simple, fast operation via the micro
USB connection; lets users take the
measurement to the sample
Remote sensing measurements in the
field, including air and water quality
monitoring and solar irradiance
Ease of
Integration
OEMs and developers who need to
integrate a spectrometer as part of a
system via USB or RS-232
Engineering labs, developers, OEM
manufacturers; works with LabVIEW
and other design platforms
Application Area
Examples
Light Laser LED
Laser Characterization
LED Measurement
Light Metrology Measurement
Research and Education
Applied Research
Basic Research
Teaching Labs for Physics, Chemistry, Biomed
Life Sciences
Biotechnology
Medical Diagnostics
Protein and Nucleic Acid Analysis
Materials Identification
Biomaterial Analysis
Metallurgical Analysis
Polymer Analysis
Semiconductor Materials Analysis
Typical Applications
225-00000-000-11-201604 3
Page 14

1: Introduction
Application Area
Examples
Semiconductors Processing and Thin Film
Metrology
Plasma Monitoring
Process Endpoint Detection
Thickness Measurement
Farm to Table Technologies
Agricultural Measurements and Monitoring
Food and Beverage Quality Control
Food Safety
Energy Technologies
Biofuels Analysis
Mining and Exploration
Oil and Petroleum Analysis
Photovoltaic Analysis
Solar Simulators
Anti-Counterfeit
Testing and Qualification
Product Identification and Authentication
Quality Control and Process Monitoring
Defect Identification
Raw Material Inspection
Verification Testing
Environmental Monitoring
Air and Water Quality Analysis
Remote Sensing
Volcanic Research
You can find more information about applications of UV-Vis spectroscopy and the Flame at
www.oceanoptics.com.
4 225-00000-000-11-201604
Page 15
1: Introduction
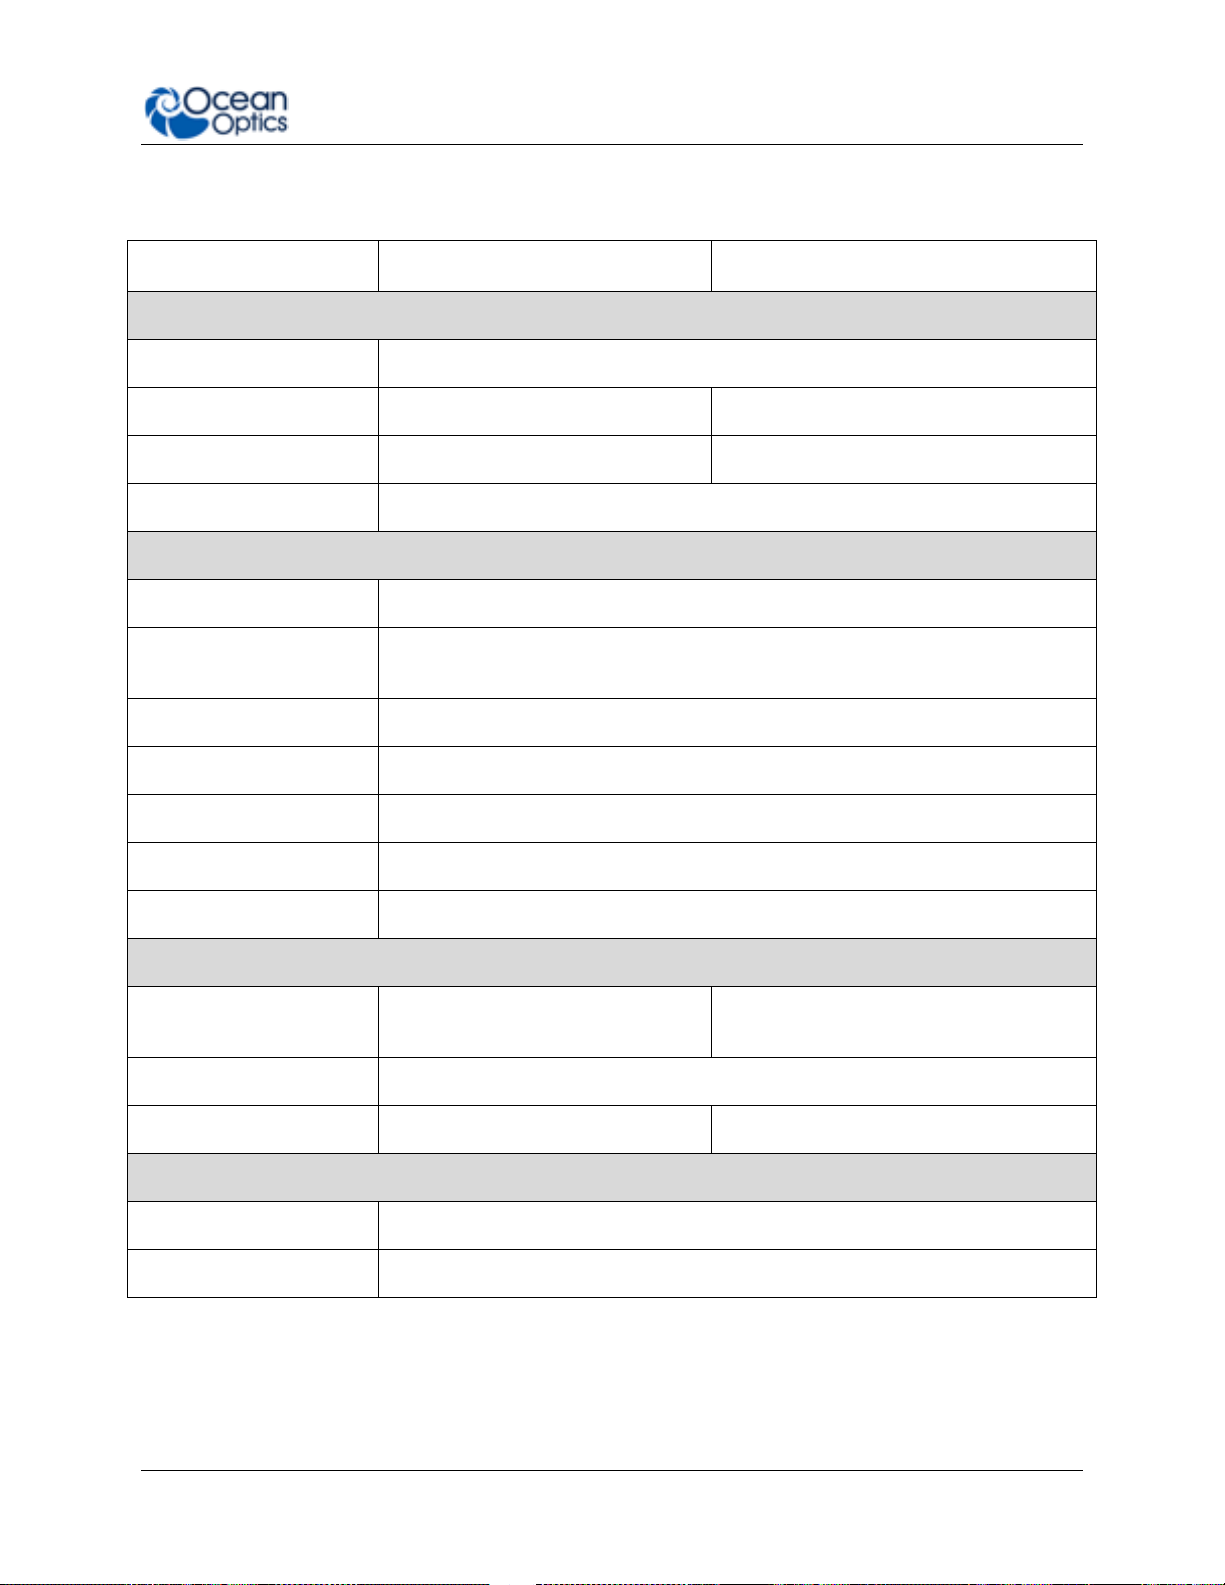
Specification
FLAME-S
FLAME-T
SPECTROSCOPIC
Optical resolution
~0.1-10.0 nm FWHM (configuration dependent)
Signal-to-noise ratio
250:1
300:1
Integration time
10 µs – 65 seconds
3.8 ms – 10 seconds
Corrected linearity
>99.8%
ELECTRONIC
A/D resolution
16 bit
Power requirement
(spectrometer functions)
250 mA @ +5 VDC
Inputs/Outputs
8 x digital user programmable GPIOs
Trigger modes
4 modes
Strobe functions
Yes
Gated delay feature
Yes
Connectors
Micro-USB and JAE DD4 40-pin connector
DETECTOR
Detector
Sony ILX511B linear silicon CCD
array
Toshiba TCD1304AP linear CCD array
Detector range
190–1100 nm
Pixels
2048 pixels
3648 pixels
PHYSICAL
Dimensions
88.9 mm x 63.5 mm x 31.9 mm
Weight
265 g
Specifications Summary
225-00000-000-11-201604 5
Page 16
1: Introduction
Spectrometer Family?
Detector Type?
Preconfigured or Custom?
FLAME-
S- (Sony ILX511B)
UV-VIS, VIS-NIR, XR
CUSTOM
T- (Toshiba TCD1304AP)
UV-VIS, VIS-NIR, XR
CUSTOM
F- (Hamamatsu S11639)
UV-VIS, VIS-NIR, XR
CUSTOM
FLAME-S Preconfigured Models (Sony ILX511B Detector)
Model
Range
(nm)
Std
Slit
(μm)
Resolution
std slit
(nm)
Grating
#
Mirror
Type
Filters &
Detector
Options*
Lens
General
Purpose
FLAME-S-UV-VIS
200850
25
~1.5
1
Al
OSF
200-850
no
FLAME-S-UV-VIS-ES
L2
FLAME-S-VIS-NIR
3501000
25
~1.5
3
Al
OSF
350-1000
no
FLAME-S-VIS-NIR-ES
L2
Extended
Range
FLAME-S-XR1
2001025
25
~2
31
Al
OSF
200-1100
no
FLAME-S-XR1-ES
L2
Irradiance
FLAME-S-RAD
3601000
50
~3 2 Al
UV
Window
no
Product Versions
Many variants of the Flame Spectrometer exist. Ocean Optics offers both preconfigured units as
well as custom-configured units, enabling you to order a customized spectrometer optimized for
your application. You can tell which kind of spectrometer you have by looking at the product
code, located on the bottom of your spectrometer.
You can find more information about the various components and possible configuration options
in Chapter 5: How the Flame Spectrometer Works.
Product Code Taxonomy
Preconfigured Models
6 225-00000-000-11-201604
Page 17
1: Introduction
FLAME-T Preconfigured Models (Toshiba TCD1304TP Detector)
Model
Range
(nm)
Std
Slit
(μm)
Resolution
std slit
(nm)
Grating
#
Mirror
Type
Filters &
Detector
Options*
Lens
General
Purpose
FLAME-T-UV-VIS
200850
25
~1.5
1
Al
OSF
200-850
no
FLAME-T-UV-VIS-ES
L2
FLAME-T-VIS-NIR
3501000
25
~1.5
3
Al
OSF
350-1000
no
FLAME-T-VIS-NIR-ES
L2
Extended
Range
FLAME-T-XR1
2001025
25
~2
31
Al
OSF
200-1100
no
FLAME-T-XR1-ES
L2
Irradiance
FLAME-T-RAD
3601000
50
~3 2 Al
UV
Window
no
For more information and specifications on preconfigured models, see www.oceanoptics.com.
225-00000-000-11-201604 7
Page 18

1: Introduction
8 225-00000-000-11-201604
Page 19

Installation and Setup
What’s In the Box
Packing List
The packing list is inside a plastic bag attached to the outside of the shipment box (the
invoice arrives separately). It lists all items in the order, including customized
components in the spectrometer (such as the grating, detector collection lens, and slit).
The packing list also includes the shipping and billing addresses, as well as any items on
back order.
Flame Spectrometer
Your Flame spectrometer arrives pre-calibrated and ready to plug and play.
Chapter 2
Micro USB Cable
Use this cable (CBL-MICROTOA-USB) to connect your spectrometer to a computer
running on a Windows, Mac or Linux operating system.
Wavelength Calibration Data Sheet
Each spectrometer is shipped with a Wavelength Calibration Data Sheet that contains
information unique to your spectrometer. OceanView reads this calibration data from
your spectrometer when it interfaces to a computer via the USB port.
Note
Please save the Wavelength Calibration Data Sheet for future reference.
Flame Installation
The following procedure provides general instructions for getting your new Flame spectrometer
up and running.
225-00000-000-11-201604 9
Page 20
2: Installation and Setup
Caution
Be sure to install the software BEFORE connecting the spectrometer to your PC.
The software installs the drivers required for spectrometer installation. If you do
not install the software first, the system will not properly recognize the
spectrometer.
If you have already connected the Flame to a computer running on a Windows
platform prior to installing the operating software, consult Chapter 4:
Troubleshooting for information on correcting a corrupt Flame installation.
► Procedure
Use the following procedure to get your system up and running quickly. See Hardware
Setup for more detailed information.
1. Install your spectroscopy operating software by following the installation wizard
prompts. See Software Installation for more in-depth information.
2. Locate the micro USB cable provided with the spectrometer. Connect the spectrometer
to the USB port on your computer using this cable.
3. Take measurements. Refer to your spectrometer operating software manual for
information on the software user interface.
Software Installation
Use OceanView version 1.5 and above for Flame. Flame can be used with SpectraSuite, but will
appear as a USB2000+ Spectrometer in the software. You can use OceanView or SpectraSuite
on the following operating systems.
Caution
Be sure that you download the correct software package for your computer
version (32 or 64-bit). See the Frequently Asked Questions in Chapter 4:
Troubleshooting for more information on determining your computer version.
10 225-00000-000-11-201604
Page 21
2: Installation and Setup
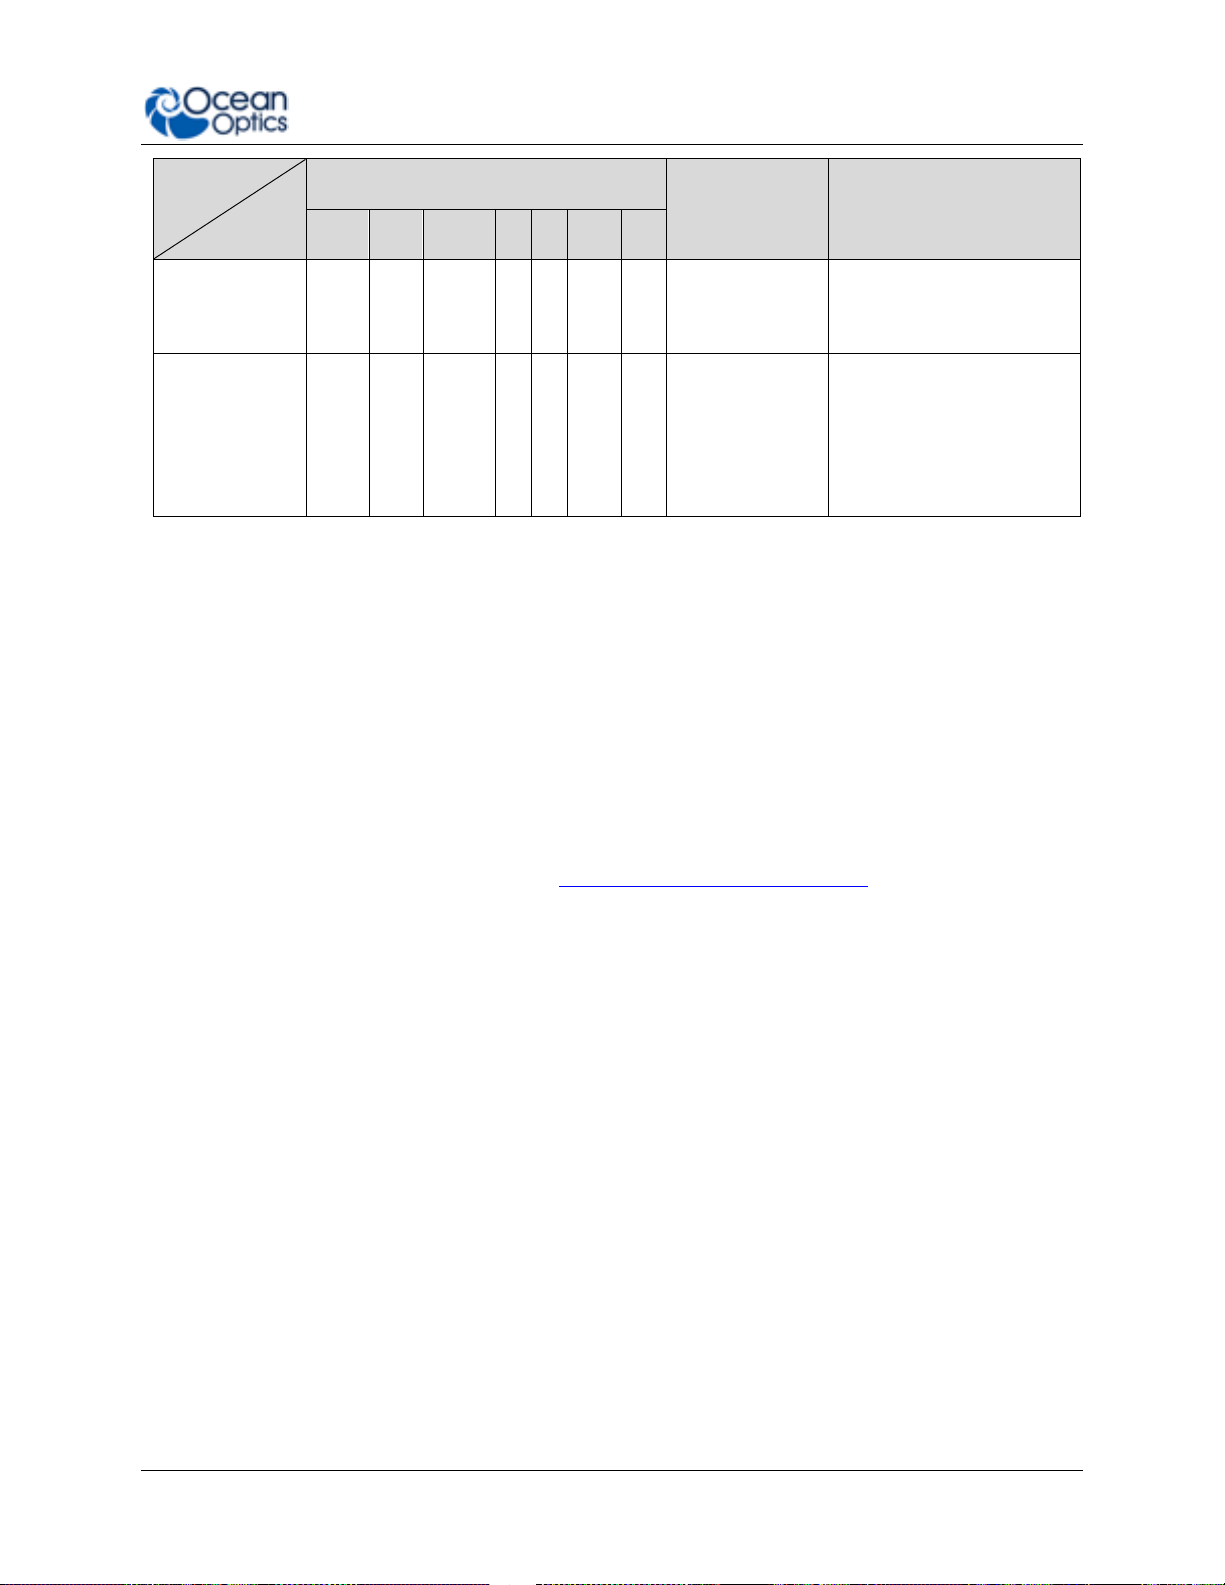
Software
OS
Windows
Apple
Linux
2000
XP
Vista
7 8 8.1
10
OceanView
√ √ √ √ √
√
OS X Version
10.5 or later on
Intel processor
Any version released for
an x86 or amd64 platform
since 2010
SpectraSuite
√ √ √
√
OS X Version
10.0 or later
Red Hat 9 or later,
Fedora (any version),
Debian 3.1 or later
(Sarge), SUSE (9.0 or
later), Centos (any
version), and Ubuntu
About OceanView
OceanView is the latest generation of operating software for all Ocean Optics spectral devices.
It is a Java-based spectroscopy software platform that operates on Windows, Macintosh and
Linux operating systems. The software can control any Ocean Optics USB device.
OceanView is a user-customizable, advanced acquisition and display program that provides a
real-time interface to a variety of signal-processing functions. With OceanView, you have the
ability to perform spectroscopic measurements (such as absorbance, reflectance, and emission),
control all system parameters, collect and display data in real time, and perform reference
monitoring and time acquisition experiments. Consult the OceanView manual for hardware
requirements when using OceanView (see Product-Related Documentation).
Hardware Setup
The Flame Spectrometer connects to a computer via the USB port or serial port. When
connected through a USB 2.0 or 1.1 port, the spectrometer draws power from the host
computer, eliminating the need for an external power supply. The Flame, like all Ocean Optics
USB devices, can be controlled by our OceanView software (see Product-Related
Documentation).
225-00000-000-11-201604 11
Page 22
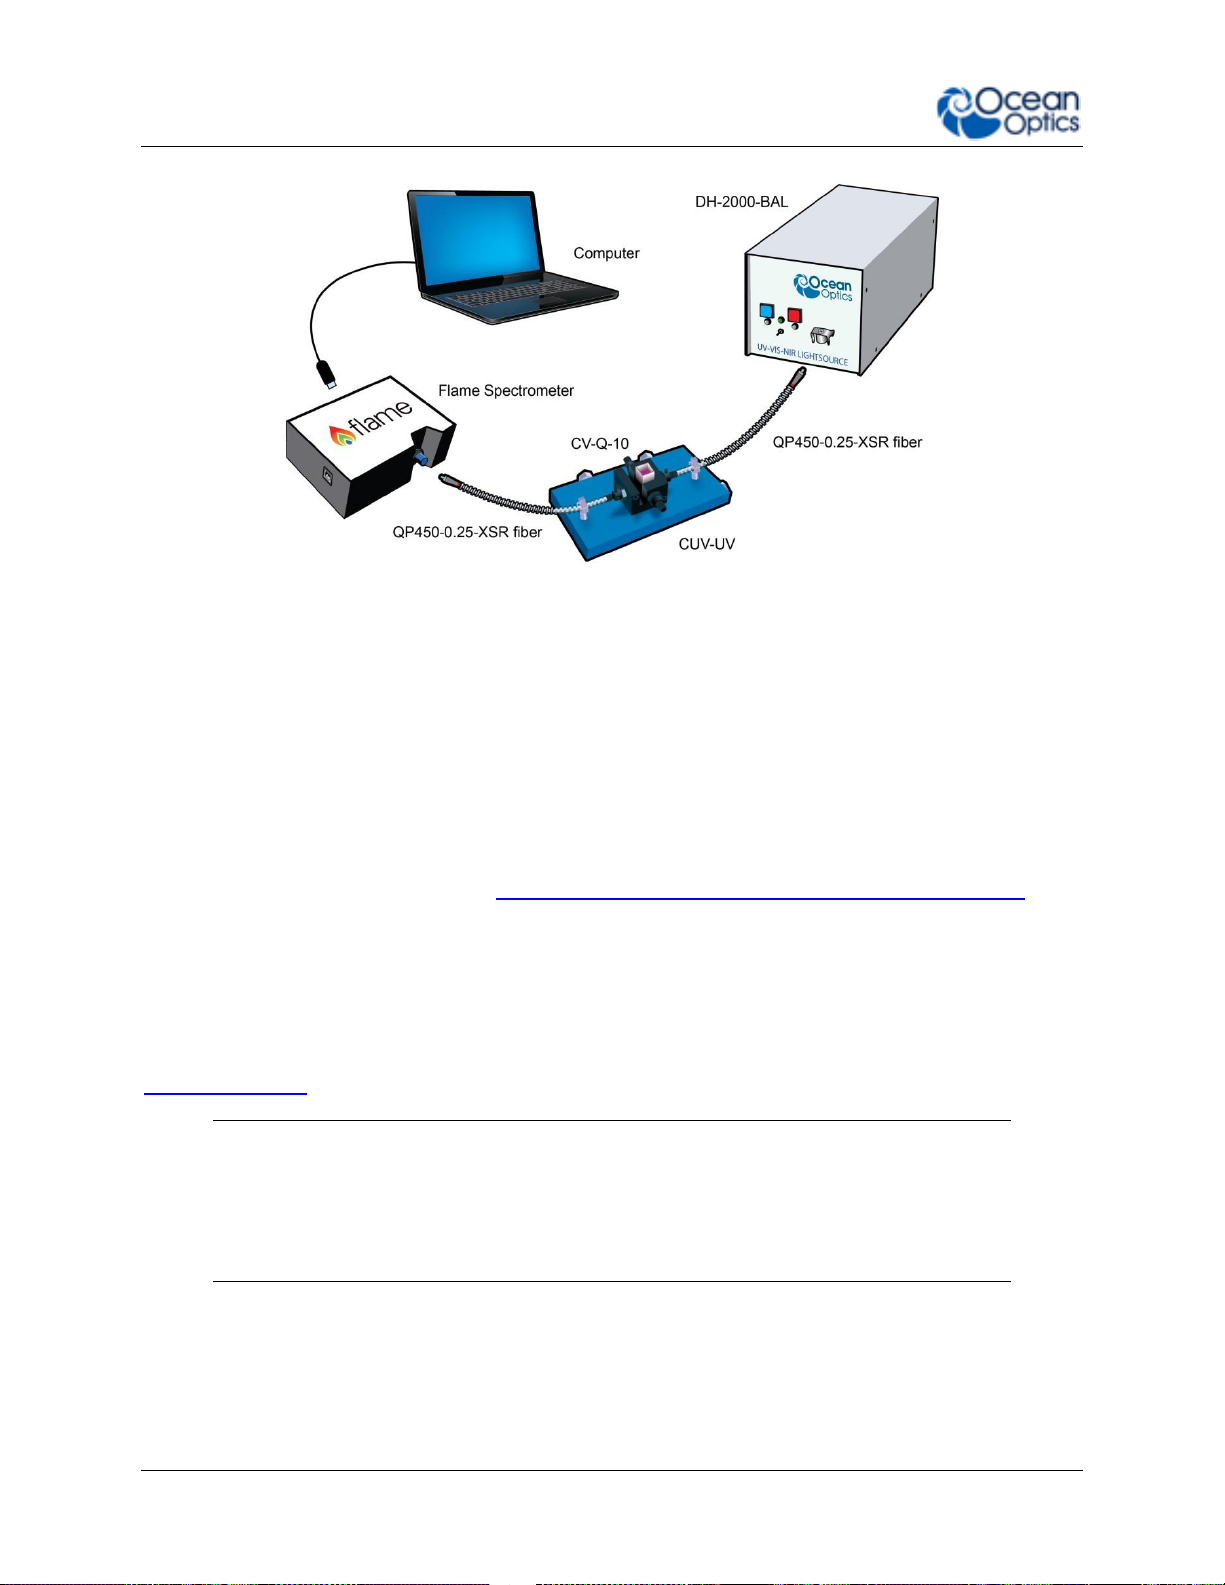
2: Installation and Setup
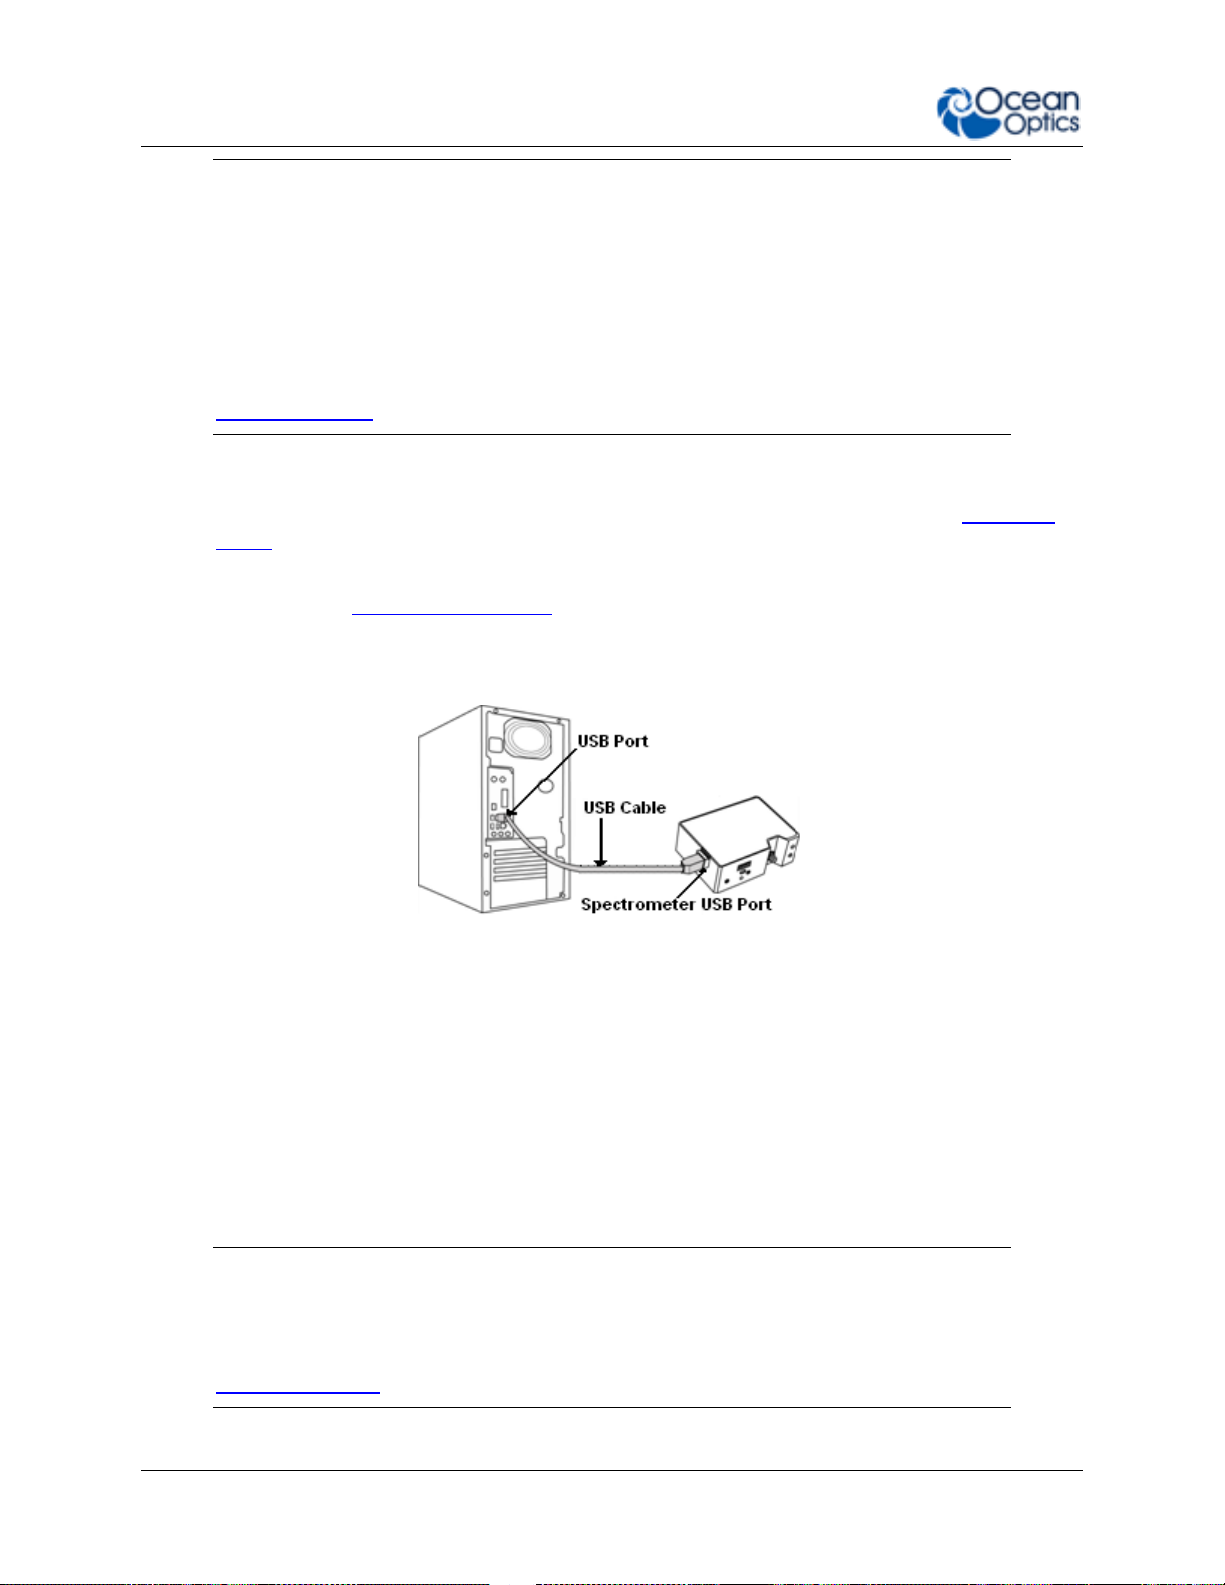
Ocean Optics Flame Fiber Optic Spectrometer Typical Set-up
Follow the steps below to connect the Flame to a computer via the USB port:
1. Install the spectrometer operating software on the destination computer.
2. Locate the USB cable (CBL-MICROTOA-USB) provided with the Flame.
3. Insert the micro connector end of the cable into the side of the Flame and the larger
end of the cable into the USB port of the computer.
4. Connect any spectroscopy accessories. To find operating instructions for Flame-
compatible products (such as light sources, sampling chambers, and probes), consult
the Ocean Optics website at http://oceanoptics.com/support/technical-documents/.
5. Attach the fiber to the fiber optic connector on the spectrometer.
If you installed the spectrometer operating software prior to connecting the Flame, the software
automatically installs the Flame drivers. If the drivers do not successfully install (or if you
connected the Flame to the computer before installing the software), consult Chapter 4:
Troubleshooting.
Note
The Flame driver appears as USB2000+ to your computer since a common driver
is used to ensure backwards and forwards compatibility. This does not affect
functionality.
12 225-00000-000-11-201604
Page 23
2: Installation and Setup
LED
Steady
Flashing
red
Unit is on
N/A
green
Unit is ready
Unit is acquiring data
Hardware Features
Flame LEDs
The Flame features two indicator lights that operate as shown below:
Note that LEDs can be turned off in OceanView or by using a firmware command.
Change the Slit
The Flame allows you to change your spectrometer’s slit to match your application
requirements. Note that a filter must be ordered for each slit (if your application requires a
filter). There’s no need to calibrate your spectrometer when changing the slit, just install and
start measuring!
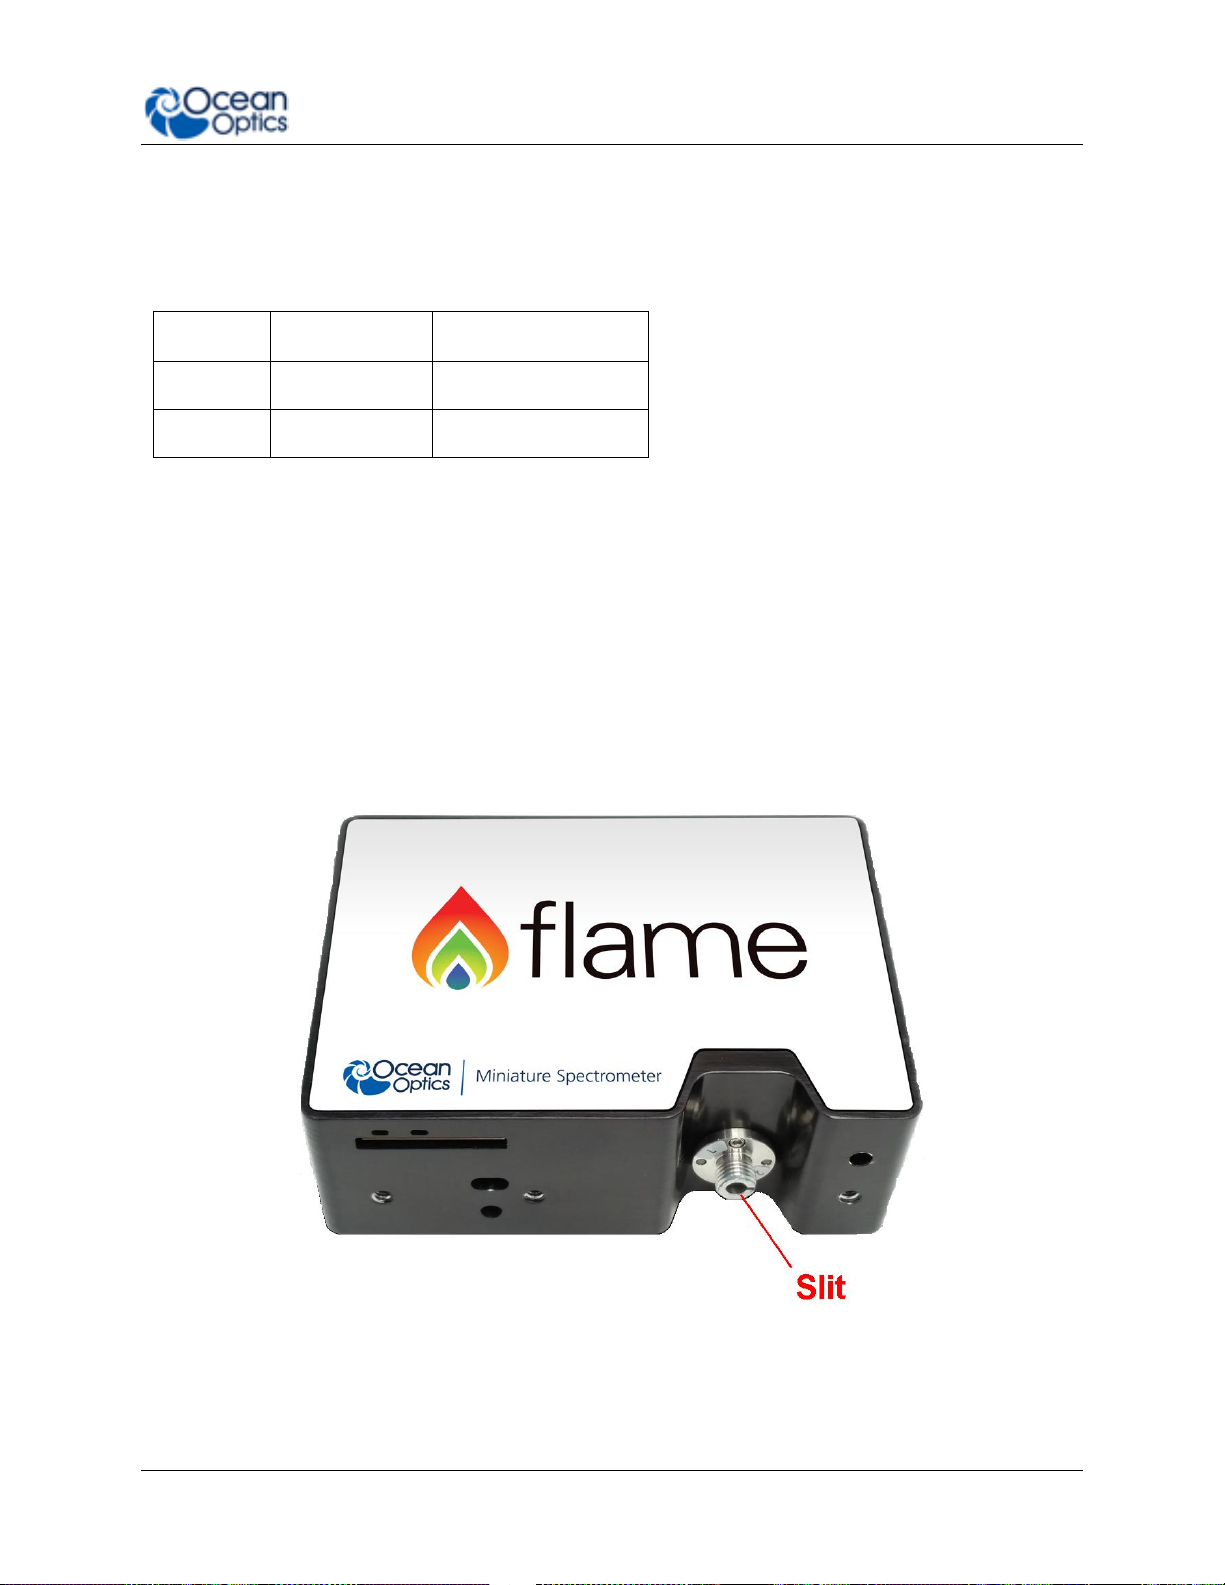
► Procedure
1. Find the SMA connector. If a fiber is attached, remove it.
2. Use the Allen key to remove the 2 the screws attaching the slit to the spectrometer.
3. Pull the slit out of the spectrometer.
225-00000-000-11-201604 13
Page 24
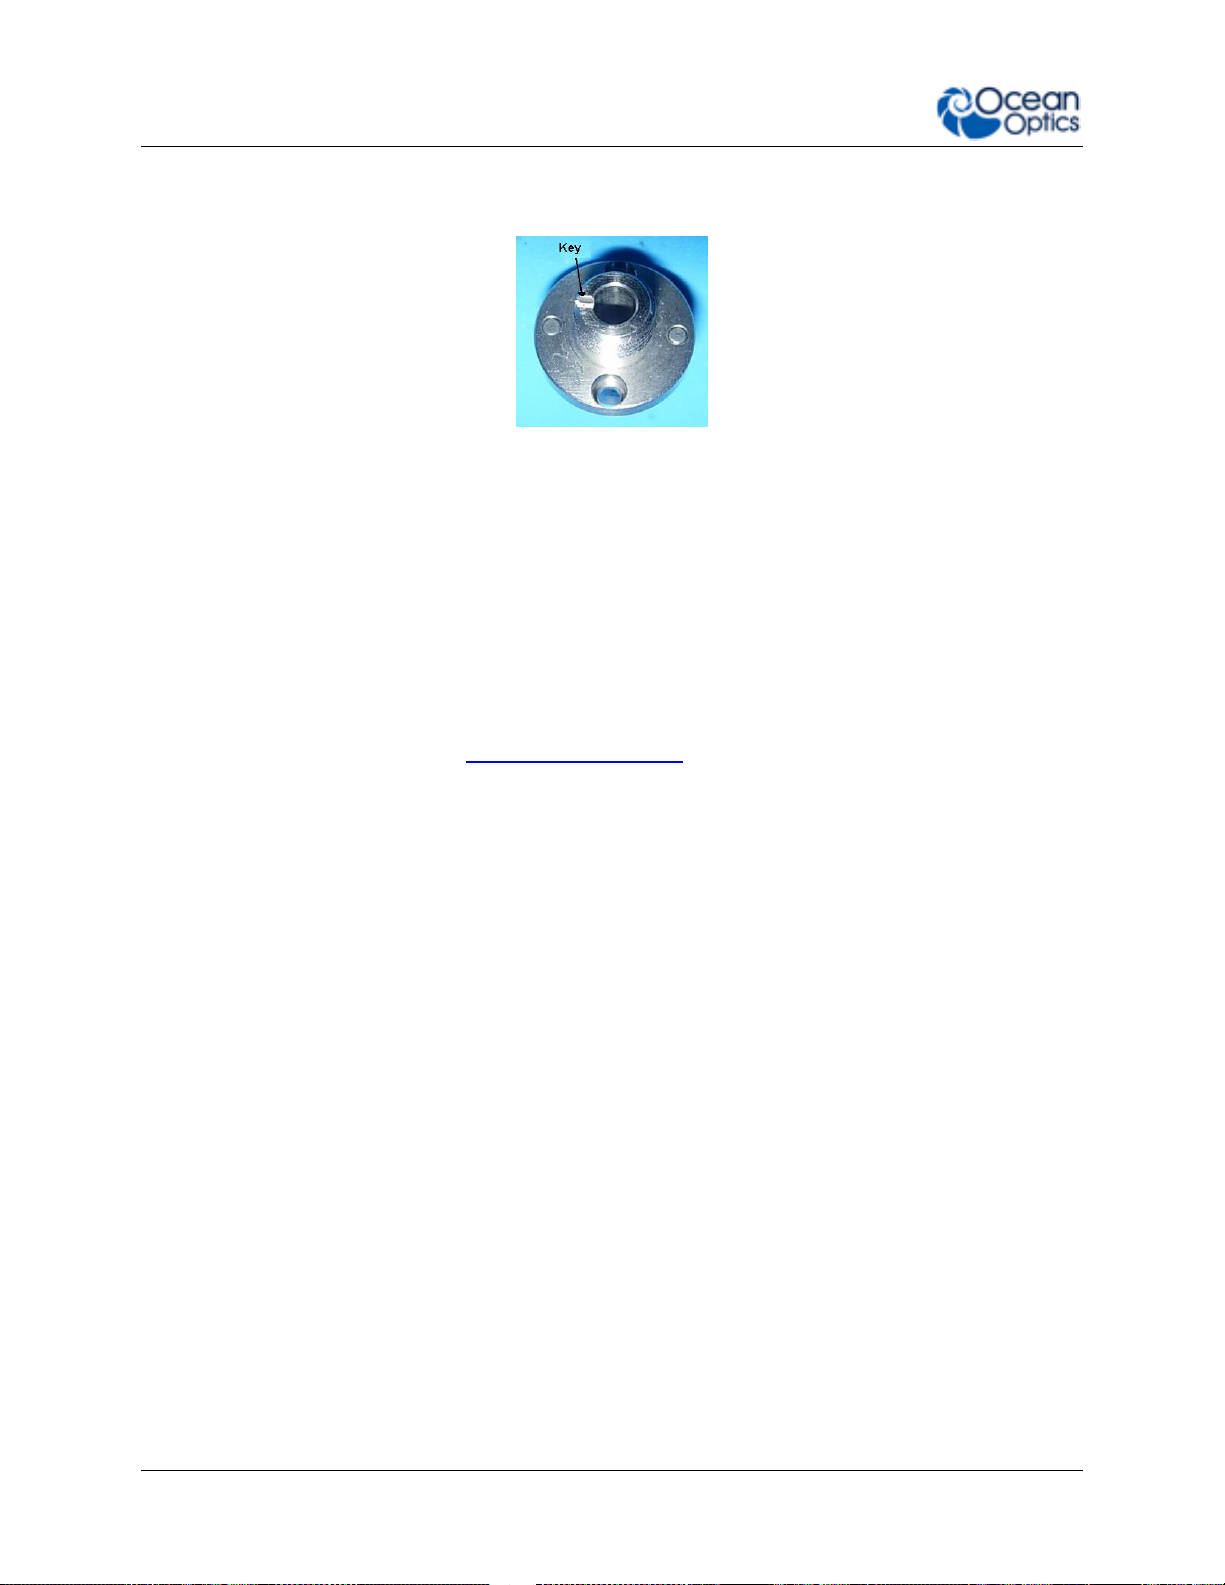
2: Installation and Setup
4. Put the new INTSMA slit connector into the spectrometer; with the key of the connector
on the left side.
5. Install the 2 screws again. Use the Allen key to tighten the screws carefully (do not
over-tighten).
6. If necessary, connect the fiber again.
Accessories
Ocean Optics provides a range of standard cables and accessories that connect the Flame to
our large range of sampling and light source accessories. Items specifically designed for the
Flame are described here; they are not provided with the Flame spectrometer and must be
purchased separately. Visit us at www.oceanoptics.com for a complete list of products available
for all of your spectroscopy needs.
Cables and Connectors
Cables are available to connect your Flame Spectrometer to accessories:
Accessory cable for light sources and other accessories (DB15 Connector Cable)
Accessory cable for HR-type connector (PAK50 Connector Cable)
Breakout board (DD4 -BREAKOUT-BOARD ) This breaks out the 40 pin DD4 connector to
a set of header pins that can be used to wire each pin, as required.
14 225-00000-000-11-201604
Page 25

2: Installation and Setup
15 PIN
DD4
Name
1 4 Single Strobe
2 3 Continuous Strobe
3
40
Vusb
4 2 External Trigger In
5 2 External Trigger In
6 7 GPIO 1
7
NC
Reserved (NC)
8 2 External Trigger In
9 8 GPIO 2
10 1 Ground
11
22
I2C SDA
12
21
I2C SCL
13 5 Lamp Enable
14
NC
Reserved (NC)
15
11
GPIO 4
DB15 Connector Cable (FLAME-CBL-DD4P-DB15P)
This cable connects the Flame to existing Ocean Optics accessories that use a DB-15HD
connector. These include the PX-2, LLS and HL-2000-FHSA light sources.
DD4-DB15 Pin Connections
225-00000-000-11-201604 15
Page 26

2: Installation and Setup
PAK50P
DD4
Name
PAK50P
DD4
Name
1
25
RS232 Rx
16
11
GPIO 4
2
24
RS232 Tx
17 4 Single Strobe
3 8 GPIO 2
18
12
GPIO 5
4
40
VUSB
19
16
SPI CLK
5 1 GND
20 3 Continuous Strobe
6
21
I2C SCL
21
18
SPI CS
7 6 GPIO 0
22
13
GPIO 6
8
22
I2C SDA
23
28
Reserved (do not connect)
9 7 GPIO 1
24
NC
Reserved (NC)
10 2 External Trigger In
25 5 Lamp Enable
11 9 GPIO 3
26
14
GPIO 7
12
40
VUSB
27
10
GND
13
17
SPI MOSI
28
NC
Reserved (NC)
14
40
VUSB
29
15
GND
15
19
SPI MISO
30
NC
Reserved (NC)
For the DD4, connect shield to connector case, if shield is included.
PAK50 Connector Cable (FLAME-CBL-DD4P-PAK50P)
This cable connects the Flame to the Breakout Box.
DD4P to PAK50P 30-Pin Connections
Breakout Box (HR4-BREAKOUT)
The Breakout Box is a passive module that separates the signals from the Flame’s DD4 40-pin
connector to an array of standard connectors and headers, enabling functionality with a wide
range of accessories. In addition to the accessory connector, the breakout box features a circuit
board based on a neutral breadboard pattern that allows custom circuitry to be prototyped on
the board itself. See Product-Related Documentation to access the manual for the Breakout
Box.
Interchangeable Slits
The Flame offers the capability of changing the slit size to match your measurement needs. You
can order additional replacement slits either individually or as a kit (in various widths from 5 µm
to 200 µm). See Change the Slit and Chapter 5: How the Flame Spectrometer Works for more
information.
16 225-00000-000-11-201604
Page 27
2: Installation and Setup
Light Sources, Cuvette Holders and Other Accessories
Ocean Optics supplies a large range of accessories for use with our spectrometers. Visit us at
www.oceanoptics.com for a complete list of products available for all of your spectroscopy
needs.
Fibers
Light Sources
Integrated Sampling Systems
Cuvettes, including microfluidic cuvettes
Filter Holders & Filters including Low Pass, Band Pass and High Pass
Measurement Techniques – Typical Set-ups
The Flame, in conjunction with Ocean Optics light sources and sampling accessories, can be
used for many different measurement techniques. One of the key advantages of modular fiber
optic spectroscopy is that you can change components of the system without having to buy a
whole new system. Here, we show a range of typical UV-Vis set ups for basic spectroscopy
techniques. You’ll find lots more information about measurement techniques at
www.oceanoptics.com/measurementtechnique.
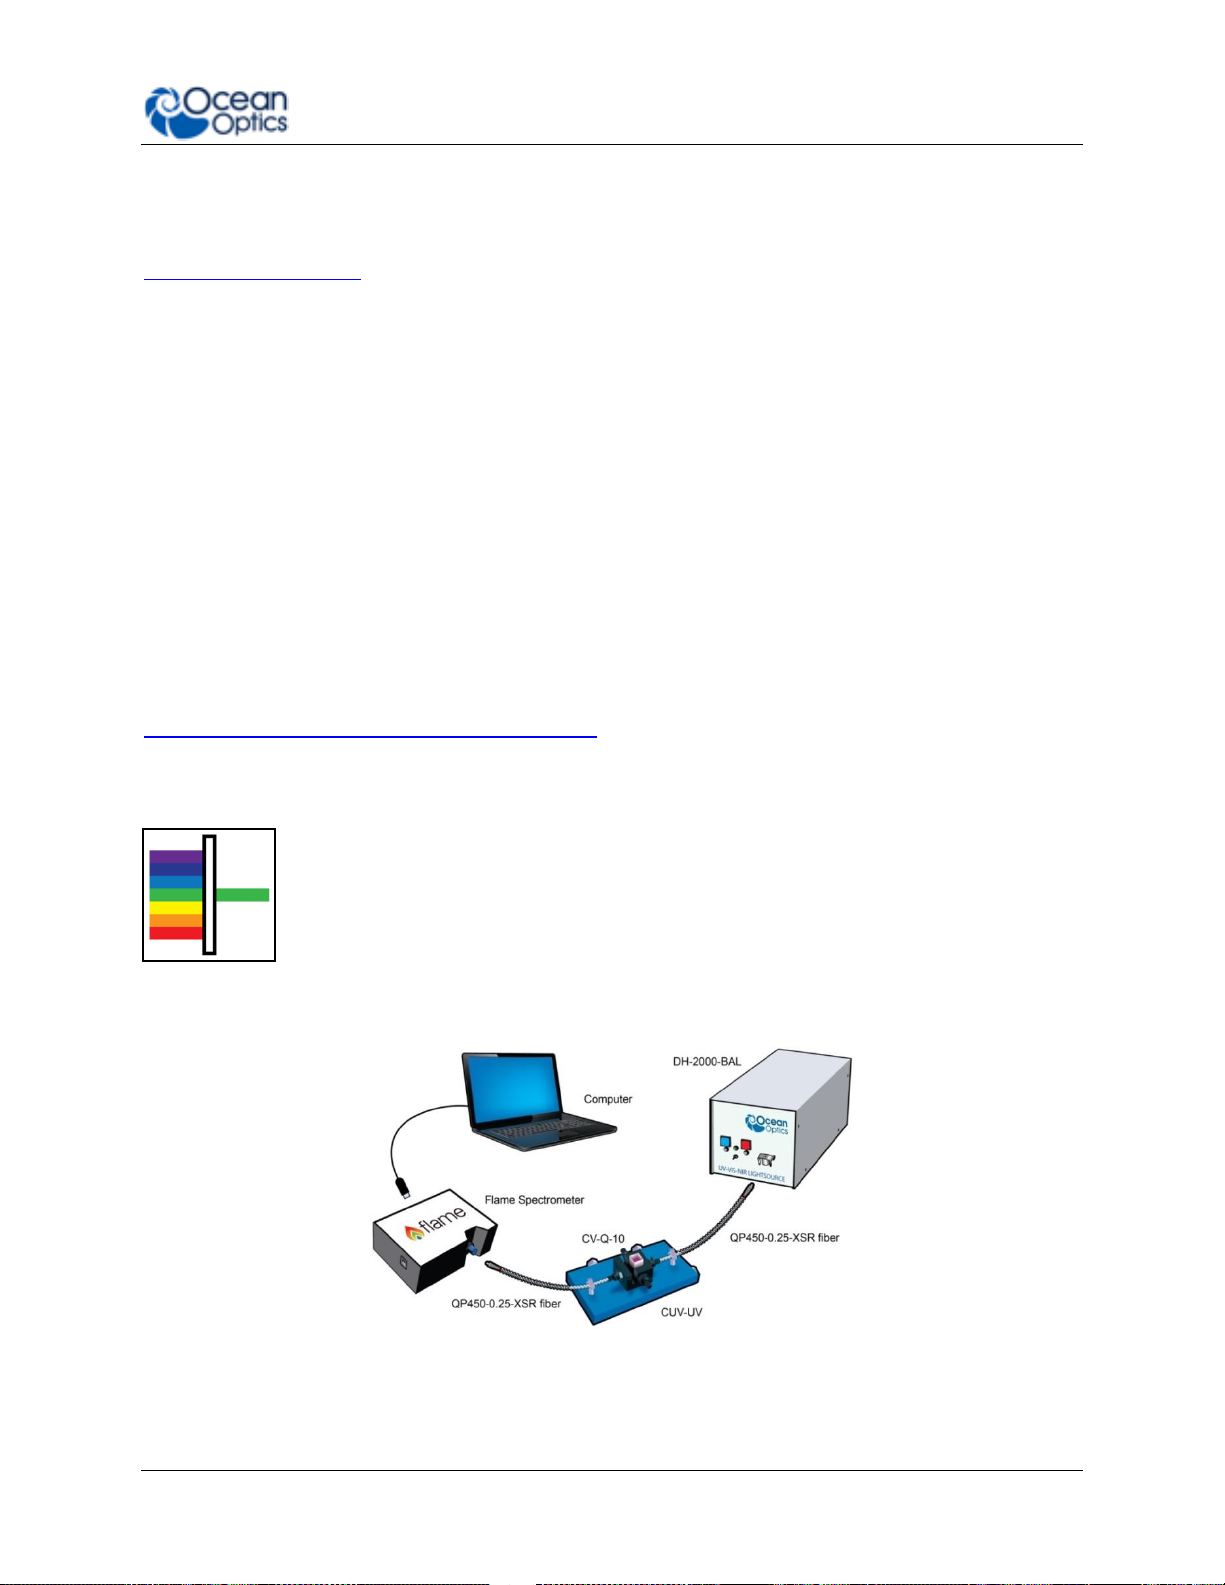
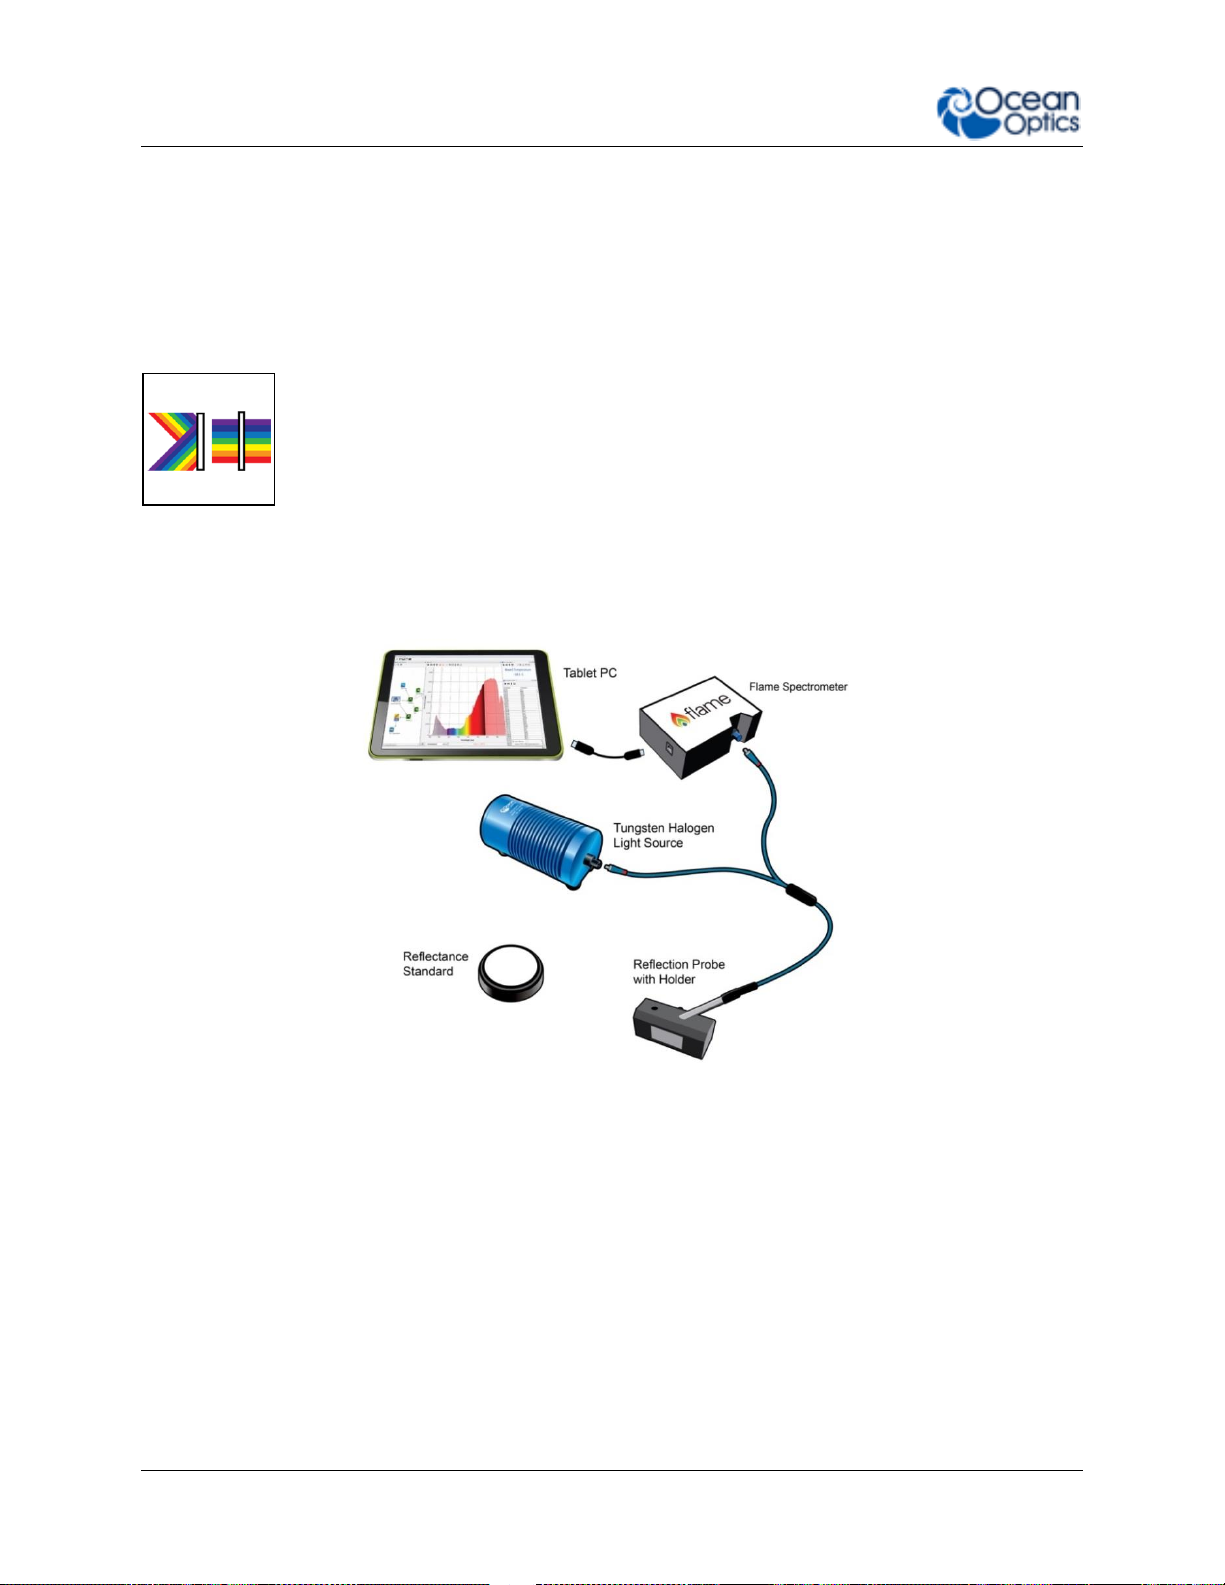
Absorbance
Absorbance is typically a relative measurement, comparing the spectrum from
the sample to that of a reference. Absorbance is commonly used for
concentration measurements and for identifying components in mixtures. The
absorbance measurement scales the response logarithmically. Connect the Flame
to our cuvette accessories via the SMA Adaptor accessory to take a liquid sample
Absorbance measurement, or mount it directly against the sample with a light
source on the opposite side for solid sampling.
Typical Absorbance Set Up
225-00000-000-11-201604 17
Page 28
2: Installation and Setup
Common UV-Vis Applications
Quantification of DNA & proteins in life science samples
Concentration of solutions & gaseous samples
Identification of trace gases in a mixture
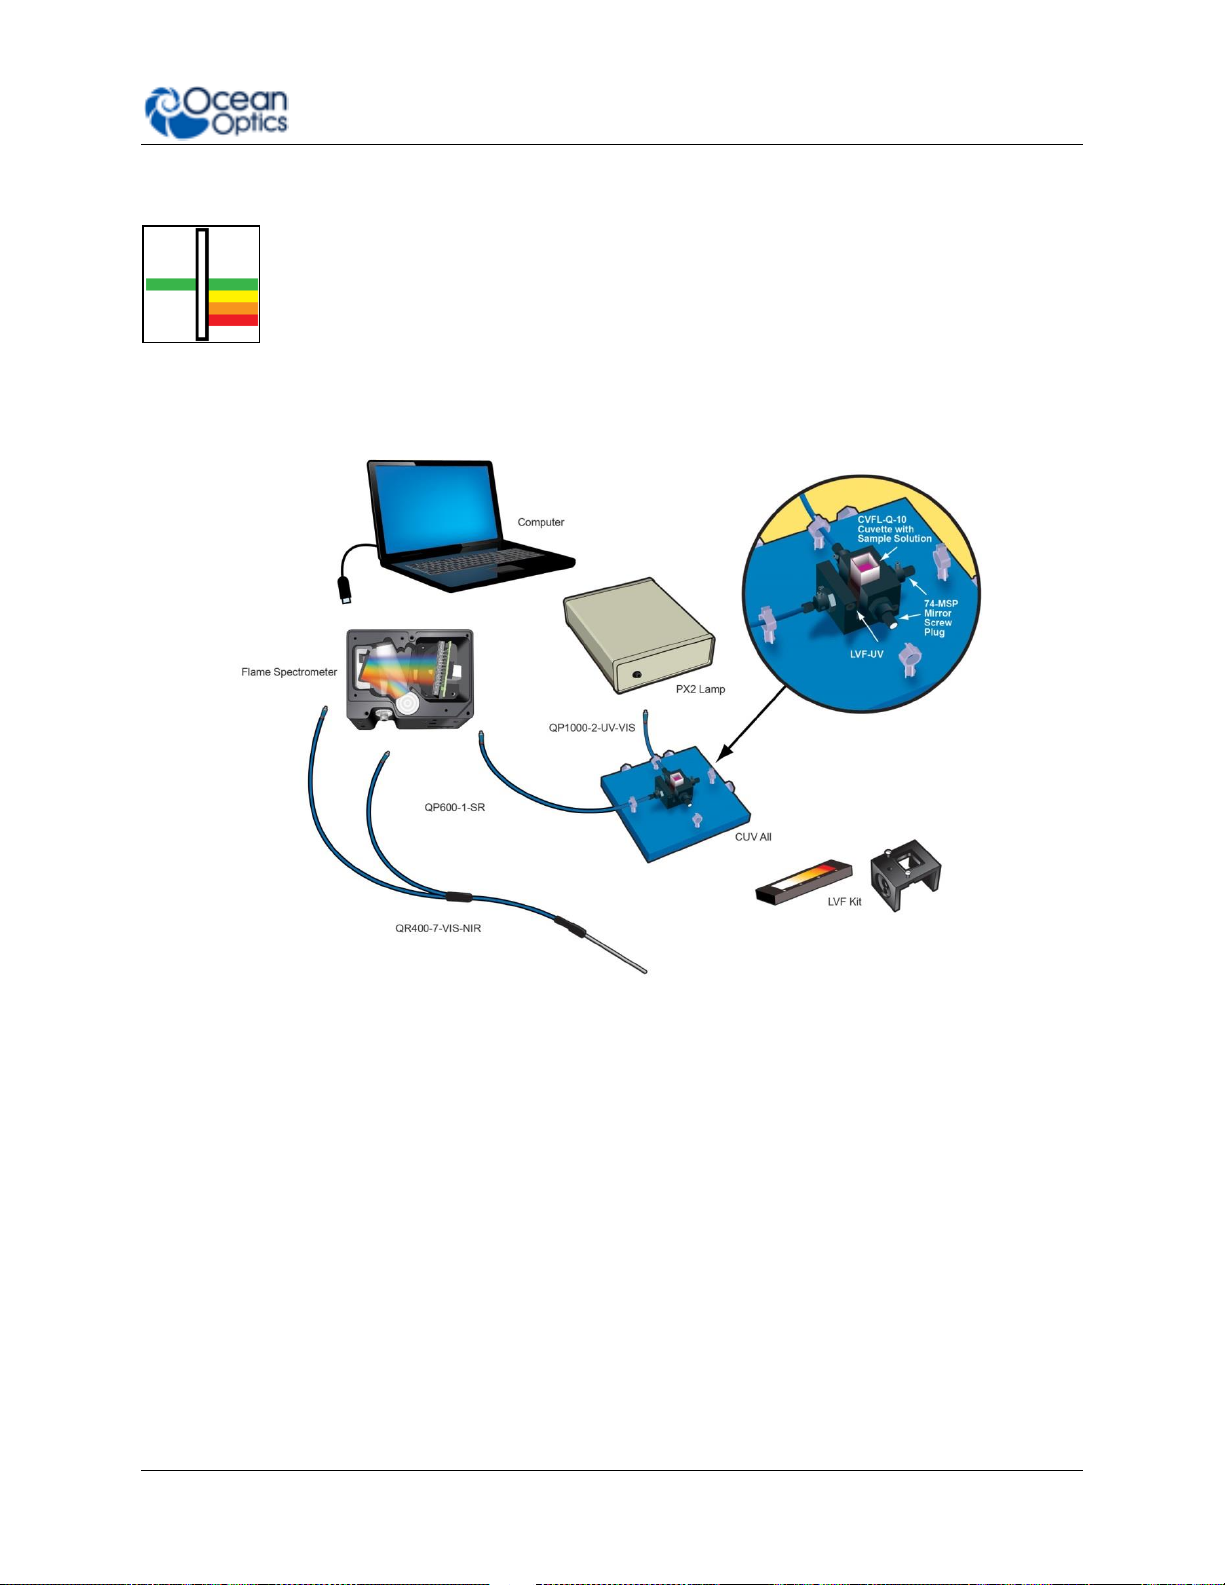
Reflectance & Transmission
Reflectance spectroscopy compares the relative level of light reflected off a
sample compared with a reference (given as a percentage of the reference
spectrum at each wavelength). A reflectance standard is used to set the
reference level of 100%. Transmission is similar but compares the light
transmitted through a sample, relative to a reference, rather than reflected off it.
Typically Reflectance uses a fiber optic probe attached to a light source and a
spectrometer, but measurements can be done easily with the Flame, both in
free-space or with the SMA Adaptor accessory. Transmission setups are usually
the same as Absorbance setups.
A Reflectance Set Up with Probe, Reflectance Standard and Probe Holder
Common UV-Vis Reflectance Applications
Diffuse and Specular Color Measurements
Process control for Surface quality of metals
Thin film and semiconductor metrology
Common UV-Vis Transmission Applications
Turbidity measurements of chemical solutions
Measuring the transmission efficiency of optics and glass
18 225-00000-000-11-201604
Page 29
2: Installation and Setup
Fluorescence
Fluorescence is a technique where a sample is excited with a light source and
fluorescent light emitted from the sample at a higher wavelength is measured by
the spectrometer. Typically the excitation source is applied at 90º to the sample
to minimize light from the excitation source reaching the spectrometer. Similarly
filters are used to block lower wavelength light from reaching the detector.
Spectrometers used for fluorescence typically have a large slit, sacrificing
resolution for throughput sensitivity.
Typical Fluorescence Set Up with an LED Excitation Source at 90º
Common Fluorescence Applications
Identifying proteins using fluorophores
NADH fluorescence
Remote sensing of chlorophyll
Medical diagnosis of tumors and tissue types
Detection of anti-counterfeiting tags
225-00000-000-11-201604 19
Page 30
2: Installation and Setup
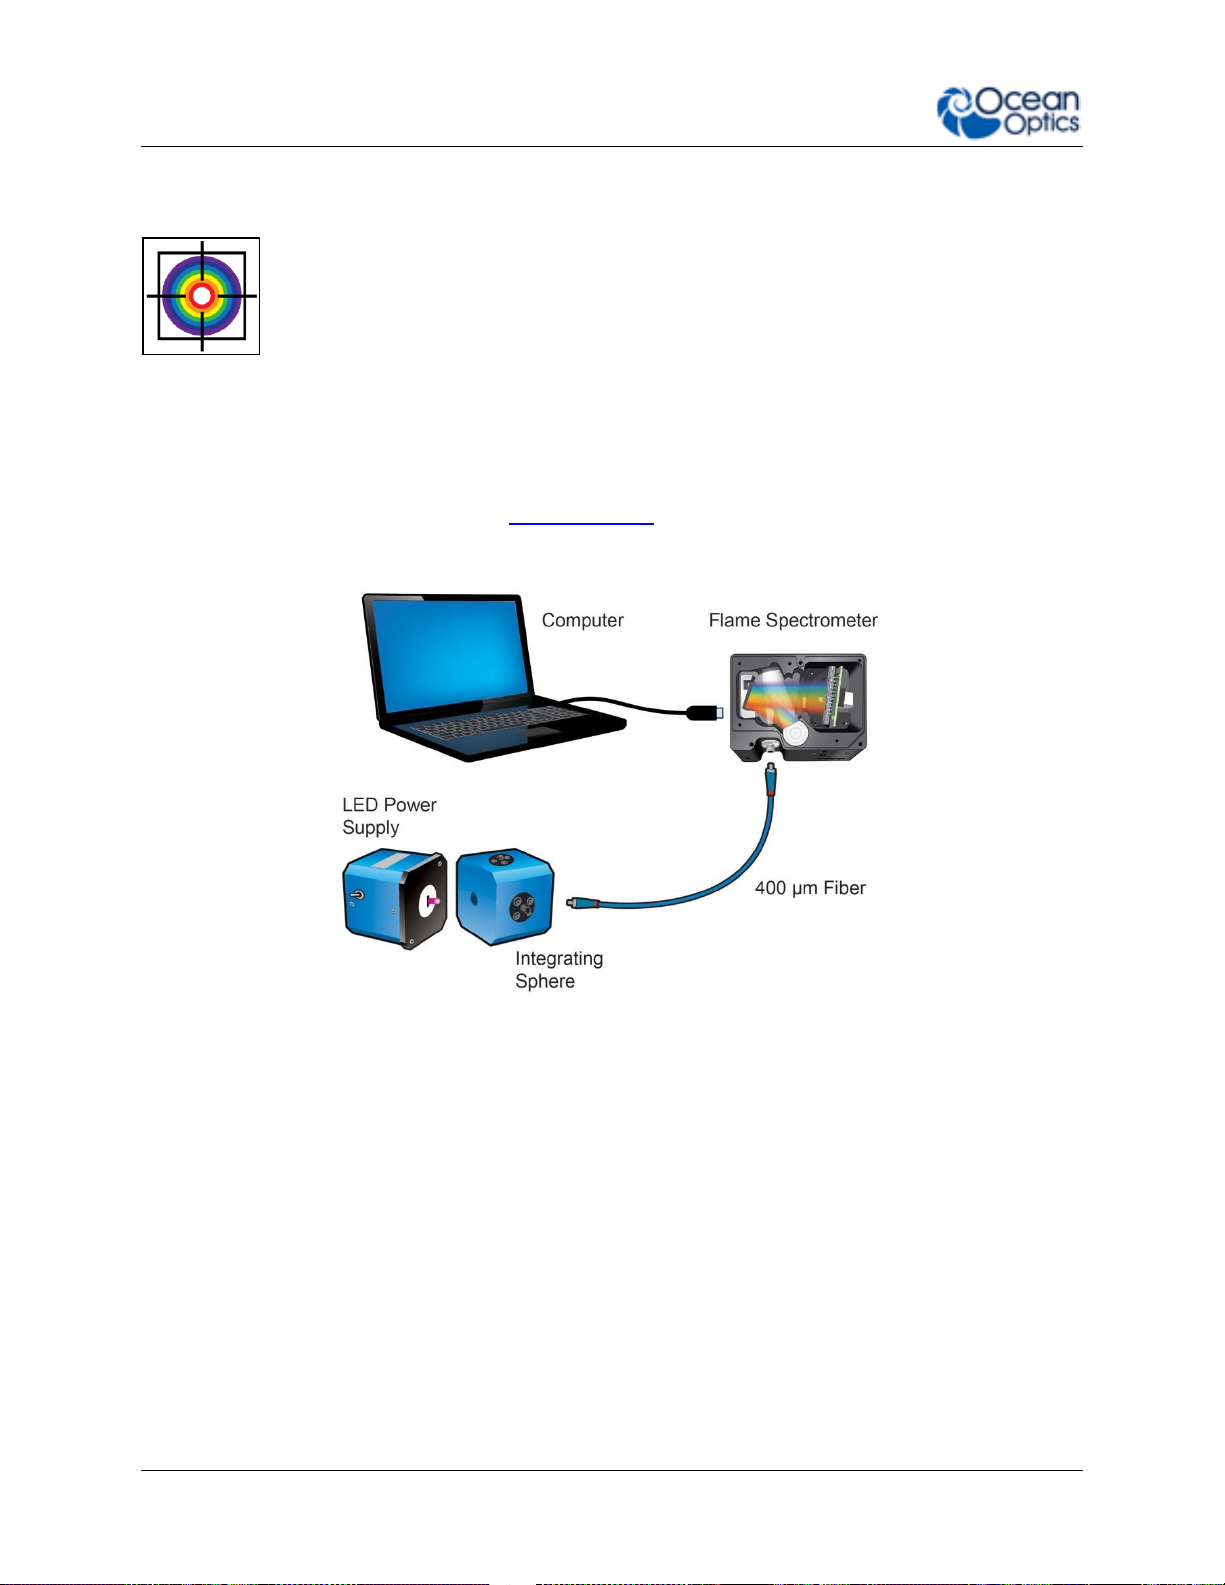
Irradiance
Irradiance is the technique of measuring the total energy of light at a
given wavelength, either relative to the spectral output of a known source
(relative irradiance) or in absolute units of power or energy (absolute
irradiance). This is used widely in light metrology, color measurement and
environmental science. Absolute irradiance measurements require an
irradiance-calibrated spectral device. This can be done in the factory for
some configurations or by using a calibration lamp in the lab or field.
Every time a set-up is changed, the device used must be recalibrated.
For a more detailed explanation of how to calibrate a device see Chapter 6:
Calibration, or contact Ocean Optics. Use the front-mounted diffuser and SMA
adapter accessories for irradiance measurements with the Flame.
Typical Relative Irradiance Set-up for Measuring Light Power Output of an LED
Using and Integrating Sphere
20 225-00000-000-11-201604
Page 31

2: Installation and Setup
Typical Set-up for an Absolute Irradiance Measurement Using Field Calibration with
a Calibrated Light Source
Common Irradiance Applications
Measuring the radiant output of lamps and LEDs
Measuring color using relative irradiance
Measuring the color rendering index (CRI)
Measuring UV exposure for health and safety
225-00000-000-11-201604 21
Page 32

2: Installation and Setup
22 225-00000-000-11-201604
Page 33

Chapter 3
Flame Operation with OceanView
Overview
The following information enables you to perform the basics of acquiring and saving data with
your Flame Spectrometer and OceanView software. More detailed information about OceanView
is in the OceanView Manual (see Product-Related Documentation).
Launch OceanView
Once you have installed your software and connected your spectrometer, you are ready to
display your measurement data using OceanView. Launching OceanView differs, depending on
your operating system and where you have placed your OceanView program files.
For PCs running Microsoft Windows, the default location is Start | Programs | Ocean Optics |
OceanView | OceanView.
For Mac computers, the default location is the Applications folder.
When you first start OceanView, the Welcome Screen appears.
The OceanView Welcome Screen (Version 1.5)
225-00000-000-11-201604 23
Page 34

3: Operation
1. Acquisition Group Window
Use to set acquisition parameters such as integration time. Controls
the spectrometer acquisition.
2. Schematic View
Schematic view graphically displays the flow of information from the
spectrometer to the view. Use nodes to mathematically modify the
data to create processed measurements (methods). This function is
extremely flexible and incredibly powerful.
3. View Display
Display your data, view, save and display controls, as well as other
features such as peak finder and quick dark & reference.
4. Global Controls
Control all spectrometers synchronously, save projects, and start a
new application wizard.
5. Saved Data
Displays data saved in the active save file path. Preview data, store
notes and load overlays directly to the active view. Click to open.
Quick View - Displays the spectrum in Quick View mode showing raw, unprocessed data.
This is uncorrected for instrument response vs. wavelength. Quick View shows you a live
shot of what the Flame is “seeing.” From Quick View you can launch application wizards or
construct your own method.
Load a Saved Project - Loads a previously saved project. Click Restore Last Session to
reload the schematic and views as they were when the software was last closed.
Spectroscopy Application Wizards – Use this function to set up a measurement using
simple step-by-step wizards. A large range of applications is available.
OceanView Main Screen
No matter what route you take on start up, you will soon end up on the OceanView main
screen. This is where you can set and view acquisitions, save and load data and save projects.
24 225-00000-000-11-201604
Page 35

3: Operation
Connect the Flame in OceanView
The Flame should automatically appear when you start OceanView and should be acquiring with
the default acquisition parameters. If you do not see a signal or the Flame icon on the
schematic you may need to rescan for spectrometers.
► Procedure
To rescan for attached devices,
1. Click on the Device Manager icon ( ).
2. Click Rescan. The spectrometer should automatically connect.
Set Acquisition Parameters
Set Acquisition parameters in the Acquisition Group Window to control the spectrometer. This
window may be minimized when you first start OceanView. You can either expand or open a
new window from the menu (Window | Acquisition Group). An active acquisition is required for
the Acquisition window to appear. Functions available to control in the Acquisition window
include the following:
Integration Time – Sets the integration time, the time over which the detector
captures incident light. At the end of the integration time the accumulated signal is read
from the detector by the electronics.
Averaging – Signal, especially at low levels, is often significantly impacted by noise.
Averaging several spectra together reduces the impact of noise and provides a cleaner
result. However, at long integration times, averaging can increase the total time of a
measurement significantly.
225-00000-000-11-201604 25
Page 36

3: Operation
Boxcar – Boxcar is a form of averaging across pixels. It applies a rolling average to
multiple adjacent pixels to help smooth the spectral response and reduce the impact of
noise.
Electric Dark Correction (on/off) – There are pixels on the detector that are kept
deliberately dark. Dark correction subtracts the signal from these dark pixels to reduce
the impact of thermal noise, which produces a baseline signal from the detector.
Non Linearity Correction (on/off) – Detectors do not have a completely linear
response. As they approach saturation, typically their efficiency reduces.
Stray Light Correction – An advanced user option that allows you to set a 1 or 2-term
polynomial correction for stray light correction.
Trigger Modes – Sets triggering mode. For more information on triggering see External
Triggering.
Strobe/ Lamp (on/off) – Use this function to turn an attached light source on or off.
GPIO Controls – Can be used to control compatible accessories or custom hardware.
Can be set to three states, on, off and alternate.
Controls that appear in this window depend on the spectrometer model. You can add and
remove acquisition controls from this window.
Quick View and Device Response
In Quick View mode (formerly Scope mode) the spectra that are displayed have an arbitrary
y-axis given in counts. This is the raw signal from the detector and is proportional to the
voltage induced by the light falling on the detector.
It is very important to realize that this is uncalibrated data and that a counts signal
does not represent a particular power or energy from one wavelength to the next.
Because the response of the detector is linear, twice the counts at a particular
wavelength do indicate that the amount of light at that wavelength has “doubled”
(relative to another wavelength). However, a small peak relative to a big peak does not
indicate that there is less or more light at a particular wavelength relative to another in
absolute terms. To understand the true relationship you need to do a relative
measurement (including relative irradiance), or if you want a quantified result, an
absolute irradiance measurement.
The relative efficiency of converting light to detector signal varies significantly across the range
of a spectrometer. Many things impact this including the responsiveness of the detector
(quantum efficiency) and the efficiency of optical components. Each configuration of a spectral
device has a unique response curve, referred to as the instrument response.
Continuous and Single Acquisitions
There are two sets of controls for taking or pausing acquisitions. The set on the Acquisition
group window allows you to control each device individually. The set on the top bar is a global
control that will allow you to start and pause all devices currently attached.
26 225-00000-000-11-201604
Page 37

3: Operation
Aquire data continuously
Take a single acquisition and then pause
Pause all acquisitions.
Configure Saving, set saving parameters and file type, file directory and file naming convention.
Once selected, the file directory will persist until changed.
Start saving data. Turns red when save is active. If saving data continuously, click when red to
stop saving. Will only activate saving for acquisitions attached to that particular view.
Global Save. Activates all configured saves across all views. Use to save data from multiple
devices at the same time.
Save Data
By default OceanView will save data as a single “snapshot” acquisition. By configuring the save
you can set the save behavior to fit your measurement needs, from single snap shots to a
continuous stream of data over time.
Saved Data Panel
The saved data panel lets you see your data as it is saved and preview data. It also makes it
simple to add overlays of saved data to your screen.
225-00000-000-11-201604 27
Page 38

3: Operation
1. Saved Files
List of saved files currently in the saved directory. Arrange by name or date.
2. Preview
Shows a preview of the saved spectra, time series or appended series saved data
can be stepped through acquisition by acquisition using the controls above the
saved files list.
3. File Path
Set the file directory.
4. Overlay
Set the previewed spectra as an overlay on the active view.
5. Notes
Enter notes about the saved spectra. Notes are saved with the same file name as
a separate .tsv file. These can be viewed or edited with any text viewer such as
notepad.
Click to save a project. Alternatively select File | Save Project from the menu. Saves all view
and schematic parameters to a single ASCII file.
Load a project or method.
Saved Data Panel
Projects and Methods
OceanView makes it easy to save and load projects and methods. We define a project as a
measurement set up made with a particular spectral device. If the software cannot find the
device, it will load this as a method and prompt the user to select a substitute device from
those selected.
28 225-00000-000-11-201604
Page 39

3: Operation
Click this button to set up a measurement using simple step by step wizards. A large range
of applications is available.
Quick Reference – click to take a reference and set up a new view. After clicking it will prompt
the user to take a dark.
Quick Dark – click to take a dark measurement and sets up a new Quick View minus dark view.
Spectroscopy Application Wizards
Application Wizard Window
Dark and Reference Measurements
Dark and reference measurements are commonly used in spectroscopy.
Dark Measurements – subtract a background signal from the spectrum. This can be
considered the removal of a constant error. Typically this is done when the light source
is off to remove any background from the ambient environment, hence the name dark.
Reference Measurements – make the signal relative to the reference. Consider this a
normalization of the signal against a reference. Typically this is taken with a reference
sample and the light source turned on. This lets you look at the relative spectral change
compared to a reference sample.
Most often you will set up your measurement with the reference and dark through the
application wizards. The wizards will prompt you to take your reference and darks. Alternatively
you can use the quick dark and quick reference features. Once a dark and/or reference
measurement has been set, you can update it with the controls on the top bar of the view.
225-00000-000-11-201604 29
Page 40

3: Operation
Reference – click to update the stored reference measurement.
Dark – click to update the stored dark measurement.
Devices – Each spectrometer will appear as a separate device. Right click to open a
menu that can generate an acquisition, control a TEC (if applicable) and add other
device controls.
Acquisitions – A spectrometer can output one acquisition per detector channel. Right
click to open menu.
Nodes – These are the building blocks of the schematic view. They are all various
functions that take data in and provide an output. To make a node, right click on the
schematic background. Each node can be configured by double clicking on the node.
To join nodes press ctrl, click and drag (windows).
Views – Are a type of window that displays data. To generate a new view right click on
the schematic background.
Schematic View
The schematic view is a graphical interface that allows you to move from device through to
processed data. There are a few basic components to consider.
More information about schematic view including detailed descriptions of the available nodes
can be found in the
OceanView Installation and Operation Manual
(see Product-Related
Documentation and in the help section of the OceanView software.
30 225-00000-000-11-201604
Page 41

Chapter 4
Troubleshooting
Overview
Sometimes things don’t quite go to plan; hopefully you’ll find some answers below. If not, don’t
hesitate to contact us and our Tech Support team will leap into action. Some typical questions
are answered here. For more information, consult the FAQs on the Ocean Optics website at
http://oceanoptics.com/faq/.
I connected the USB cable and started OceanView but I don’t see
my spectrometer attached.
Use the Rescan button in the Device Manager to rescan for attached devices.
I am having trouble installing the drivers, what should I do?
Hardware device driver installation is usually seamless on Microsoft Windows operating systems
and should happen in the background when you connect your spectrometer to a computer with
the software installed. However, some Windows systems require a bit more care when
connecting your spectrometer for the first time.
225-00000-000-11-201604 31
Page 42

4: Troubleshooting
If your spectrometer is not recognized by OceanView on your computer, you need to manually
install the spectrometer drivers. See your OceanView manual for this procedure. Also consult
the
Correcting Device Driver Issues
document (see Product-Related Documentation).
How do I know my spectrometer has power?
The red LED on the spectrometer should be on steadily if the unit is receiving power.
How do I know my spectrometer is transmitting data?
The green LED on the spectrometer flashes when transmitting data.
I’m installing OceanView but I need a product key; where can I find
this?
The product key was sent to the contact e-mail on the sales order when you purchased your
OceanView license. Contact info@oceanoptics.com for more information. You’ll need your sales
order number, quotation number, the serial number of the spectrometer that was purchased
with the software, and, if known, the e-mail address under which your product key was created
to recover your key.
I connected the Flame to the computer before installing my
spectroscopy operating software to install the drivers. What do I
do now?
The steps to take to resolve this issue differ, depending on your computer’s operating system.
Microsoft Windows Operating Systems
If you connected your Ocean Optics Flame device to the computer prior to installing your Ocean
Optics software application on a Windows platform, you may encounter installation issues that
you must correct before your Ocean Optics device will operate properly.
Follow the applicable steps below to remove the incorrectly installed device, device driver, and
installation files.
Note
If these procedures do not correct your device driver problem, you must obtain
the
Correcting Device Driver Issues
http://oceanoptics.com/wp-content/uploads/Correcting-Device-Driver-Issues.pdf.
document from the Ocean Optics website:
32 225-00000-000-11-201604
Page 43

4: Troubleshooting
Remove the Unknown Device from Windows Device Manager
► Procedure
1. Open Windows Device Manager. Consult the Windows operating instructions for your
computer for directions, if needed.
2. Locate the Universal Serial Bus Devices option and expand the Universal Serial
Bus Devices selection by clicking on the "+" sign to the immediate left.
Note
Improperly installed USB devices can also appear under the Universal Serial Bus
Controller option. Be sure to check this location if you cannot locate the unknown
device.
3. Locate the unknown device (marked with a large question mark). Right-click on the
Unknown Device listing and select the Uninstall or Remove option.
4. Click the OK button to continue. A warning box appears confirming the removal of the
Unknown Device. Click the OK button to confirm the device removal.
5. Disconnect the Flame from your computer.
6. Replug the spectrometer into your computer.
The system should now able to locate and install the correct drivers for the USB device.
Apple Mac OSX Operating Systems
Since there are no device files for the Flame Spectrometer in a Mac operating system, you
should not encounter any problems if you installed the spectrometer before the spectrometer
operating software.
Linux Operating Systems
For Linux operating systems, all you need to do is install the spectrometer operating software,
then unplug and replug in the spectrometer. Technically, the driver files for Linux simply give
nonprivileged users permission to use newly connected hardware. There isn’t any long-term
harm to plugging in the device before installing the software.
I have both SpectraSuite and OceanView installed. Will my
spectrometer work with both?
Yes. There should be no driver issues with Windows 64-bit, Mac, and Linux operating systems
since they all use the winusb driver. For Windows 32-bit systems, you will need to swap the
drivers when switching software since OceanView uses the winusb driver, while SpectraSuite
uses the ezusb driver.
225-00000-000-11-201604 33
Page 44

4: Troubleshooting
How do I determine whether my Windows computer is 32-bit or 64bit?
Errors can occur if you download the wrong version of software (for 32-bit or 64-bit
computers). To verify your computer version for most Windows computers, go to the
Properties window (under Computer or My Computer). If no version is listed, then your system
is a 32-bit. For more information see the Microsoft Frequently Asked Questions at
http://windows.microsoft.com/en-us/windows/32-bit-and-64-bit-windows#1TC=windows-7.
How do I check the configuration of my spectrometer?
Check the label on the bottom of your spectrometer. You can also check your configuration
using your spectrometer operating software.
For OceanView: Open the Schematic window and double click the spectrometer icon.
For SpectraSuite: Click the plus (+) icon next to the spectrometer to open properties and
configuration.
Product Upgrades, Repairs and Servicing
Occasionally, you may find that you need Ocean Optics to make a change or an upgrade to
your system. To facilitate these changes, you must first contact Customer Support and obtain a
Return Merchandise Authorization (RMA) number. Please contact Ocean Optics for specific
instructions when returning a product.
Repairs
Sometimes accidents happen! If you need to return your Ocean Optics Product for repair, here
is what to do:
► Procedure
1. Contact us to speak to an Ocean Optics representative about the problem. If it is
determined that the product must be returned, the representative will issue an RMA
number.
2. Package your product, ideally in the original packaging, and return it to Ocean Optics,
along with the RMA number that you received.
Note
For RMA returns under warranty we will organize and pay for shipping both
ways. For accidental damage, you only pay to have the product delivered to your
closest Ocean Optics or OOI Distributor Office.
34 225-00000-000-11-201604
Page 45

4: Troubleshooting
Upon careful examination, we’ll advise you with an estimate. When your product is ready, it will
be returned to you.
Servicing
To keep your instrument in tip top shape we recommend yearly wavelength recalibration. You
can do this yourself if you have appropriate tools or we can do this for you. Contact your local
representative to find out more about service availability and cost. We offer the following
services:
Wavelength Calibration
Absolute Irradiance Calibrations
225-00000-000-11-201604 35
Page 46

4: Troubleshooting
36 225-00000-000-11-201604
Page 47

Chapter 5
How the Flame Spectrometer
Works
Overview
This section provides an overview of the Flame spectrometer and how it works from light
entering the slit through to the transmission of the spectrum over USB. It also provides an
overview of all the different possible configurations that are possible, designed to help you
optimize your spectrometer for specific applications.
You’ll find more useful information, including a glossary of spectroscopy and spectrometer
terms, on our website at www.oceanoptics.com.
Flame Open Bench
225-00000-000-11-201604 37
Page 48

5: How the Flame Spectrometer Works
Slit
Description
Pixel Resolution
INTSMA-5
5-µm wide x 1-mm high
~3.0 pixels
INTSMA-10
10-µm wide x 1-mm high
~3.2 pixels
INTSMA-25
25-µm wide x 1-mm high
~4.2 pixels
INTSMA-50
50-µm wide x 1-mm high
~6.5 pixels
INTSMA-100
100-µm wide x 1-mm high
~12 pixels
INTSMA-200
200-µm wide x 1-mm high
~24 pixels
INTSMA-000
Interchangeable bulkhead with no slit
NA
INTSMA-KIT
Interchangeable SMA Kit connectors; 5µm; 10µm; 25µm;
50µm; 100µm and 200µm
NA
1. Fiber Optic Connector: Light from a fiber enters the optical bench through the SMA
905 Connector. The SMA 905 bulkhead provides a precise location for the end of the
optical fiber, slit, absorbing filter and fiber clad mode aperture. While we supply SMA
connectors as standard, FC connectors are also available. See #2 for available options.
2. Interchangeable Slit: Light passes through the installed slit, which acts
as the entrance aperture. Slits come in various widths from 5 µm to 200
µm. The slit is fixed in the SMA 905 bulkhead to sit against the end of
a fiber. Smaller slit sizes achieve the best optical resolution while larger
slits have higher light throughput. Slit size is labeled as shown.
Ocean Optics also offers a range of FC connector slits in the same wavelengths, with the
product code INTFC-XXX. An INTFC-KIT is also available. Note that these items are
made to order and have a longer lead time. Contact an Ocean Optics Application Sales
Engineer for more details.
► Procedure
To calculate the optical resolution for your spectrometer,
1. Find the number of pixels for your detector.
2. Divide the range of the spectrometer by the number of pixels.
3. Multiply this number by the pixel resolution from the table above.
For example: Resolution of the Flame-S with a 50 µm slit and 650 nm range
650/2048 x 6.5 = 2.1 nm
38 225-00000-000-11-201604
Page 49

5: How the Flame Spectrometer Works
Item Code
Description
Dot 1
Dot 2
OF1-BG28
Bandpass filter, transmits >325 and <500 nm
blue
red
OF1-WG305
Longpass filter; transmits light >305 nm
black
white
OF1-U325C
Bandpass filter, transmits >245 and <390 nm
white
green
OF1-GG375
Longpass filter; transmits light >375 nm
red
black
OF1-GG395
Longpass filter; transmits light >395 nm
white
red
OF1-CGA420
Longpass filter; transmits light >420 nm
orange
white
OF1-GG475
Longpass filter; transmits light >475 nm
green
green
OF1-OG515
Longpass filter; transmits light >515 nm
pink
yellow
OF1-OG550
Longpass filter; transmits light >550 nm
orange
orange
OF1-OG590
Longpass filter; transmits light >590 nm
red
pink
OF1-RG695
Longpass filter; transmits light >695 nm
white
blue
OF1-RG830
Longpass filter; transmits light >830 nm
black
blue
OF1-CGA1000
Nonfluorescing longpass filter, transmits >1000 nm
red
green
OF1-CGA760
Nonfluorescing longpass filter, transmits >760 nm
blue
black
OF1-CGA780
Nonfluorescing longpass filter, transmits >780 nm
white
yellow
OF1-CGA830
Nonfluorescing longpass filter, transmits >830 nm
green
orange
OF1-CGA475
Nonfluorescing longpass filter, transmits >475 nm
yellow
pink
3. LongPass Absorbing Filter (optional): If selected, an absorbing filter
is installed between the slit and the aperture in the SMA 905 bulkhead.
The filter is used to limit bandwidth of light entering spectrometer or to
balance color. Filters are installed permanently. A filter is for a specific slit.
If you anticipate needing the filter with multiple slit sizes, then you must
specify this at the time you order. You will know which filter is installed in each slit
because of the color-coded dots on the outside as shown in the figure and described in
the table below.
4. Collimating Mirror (specify Standard or SAG+): The collimating mirror is matched
to the 0.22 numerical aperture of our standard optical fibers. Light reflects from this
mirror, as a collimated beam, toward the grating. You can opt to install a standard
mirror or a NIR-enhancing but UV absorbing SAG+ mirror.
SAG+ mirrors are often specified for fluorescence. These mirrors absorb nearly all UV
light, which reduces the effects of excitation scattering in fluorescence measurements.
Unlike typical silver-coated mirrors, the SAG+ mirrors won’t oxidize. They have excellent
reflectivity — more than 95% across the VIS-NIR.
Specify standard or SAG+ mirrors when ordering your spectrometer.
225-00000-000-11-201604 39
Page 50

5: How the Flame Spectrometer Works
Grating
Number
Intended Use
Groove Density
Spectral Range
Blaze Wavelength
Best Efficiency
(>30%)
1
UV
600
650 nm
300 nm
200-575 nm
2
UV-VIS
600
650 nm
400 nm
250-800 nm
3
VIS-Color
600
650 nm
500 nm
350-850 nm
4
NIR
600
625 nm
750 nm
530-1100 nm
5
UV-VIS
1200
300 nm
Holographic UV
200-400 nm
6
NIR
1200
200-270 nm
750 nm
500-1100 nm
7
UV-VIS
2400
100-140 nm
Holographic UV
200-500 nm
9
VIS-NIR
1200
200-270 nm
Holographic VIS
400-800 nm
10
UV-VIS
1800
100-190 nm
Holographic UV
200-635 nm
11
UV-VIS
1800
120-160 nm
Holographic VIS
320-720 nm
Reflectance vs. Wavelength for Aluminum, Gold, and Silver Mirrors
By Bob Mellish in Wikipedia
5. Grating and Wavelength Range (specify grating and starting wavelength): We
install the grating on a platform that we then rotate to select the starting wavelength
you have specified. Then we permanently fix the grating in place to eliminate
mechanical shifts or drift.
Use our online Range and Resolution Calculator to find out how your grating choice
affects spectral range and optical resolution by viewing the grating efficiency curves.
The available gratings are summarized below:
40 225-00000-000-11-201604
Page 51

5: How the Flame Spectrometer Works
Grating
Number
Intended Use
Groove Density
Spectral Range
Blaze Wavelength
Best Efficiency
(>30%)
12
UV-VIS
2400
50-120 nm
Holographic VIS
260-780 nm
14
NIR
600
625 nm
1000 nm
650-1100 nm
31
UV-NIR
500
200-1025 nm
250 nm
200-450 nm
Grating efficiency curves are available to view by using our online range and resolution
calculator at www.oceanoptics.com/product-category/modular-
spectrometers/.
Gratings Showing Light Diffracted into its Constituent Wavelengths
6. Focusing Mirror (specify standard or SAG+): This mirror focuses first-order spectra
on the detector plane. Both the collimating and focusing mirrors are made in-house to
guarantee the highest reflectance and the lowest stray light possible. You can opt to
install a standard or SAG+ mirror. As with the collimating mirror, the mirror type needs
to be specified when ordering.
7. Detector Collection Lens (optional): This cylindrical lens is fixed to the detector to
focus the light from the tall slit onto the shorter detector elements. It increases lightcollection efficiency and reduces stray light. It also is useful in a configuration with a
large-diameter fiber and slit for low light-level applications such as fluorescence.
Preconfigured Flame spectrometers with a collector lens are available – look for –ES at
the end of the name.
8. Detector: There are two choices of detector available for the flame. We offer a 2048-
element FLAME-S (Sony ILX511B) or a 3648 element FLAME-T (Toshiba
TCD1304AP) linear CCD array. These both have an effective range of 190-1100 nm. The
optics split the light into its component wavelengths which fall across the different
225-00000-000-11-201604 41
Page 52

5: How the Flame Spectrometer Works
Specification
S Type (FLAME-S)
T Type (FLAME-T)
Detector
Sony ILX511B linear
silicon CCD array
Toshiba TCD1304AP linear
silicon CCD array
Strengths
Strong response <
350nm, good for UV
measurements.
Fast data output rate.
Larger pixel size
improves sensitivity
Slightly higher SNR due
to well depth
Larger number of pixels
can offer better resolution
with small slits.
Electronic shutter
Watch for
N/A – Offers strong allaround performance
Signal lag at low
integration times
Signal may bleed to
neighboring pixels at high
intensities (blooming)
Higher minimum
integration time
pixels. Each pixel responds to the wavelength of light that strikes it. The detector
outputs an analog signal from each pixel that is converted via the ADC into a digital
signal. The driver electronics process this signal and send the spectrum via the USB
connection to the software. The best choice of detector will depend on the application.
Detector Specifications
See Chapter 6: Technical Specifications for more detailed detector specifications.
9. OFLV Variable Longpass Order-sorting Filter (optional): Our proprietary filters
precisely block second- and third-order light from reaching specific detector elements.
Light reflected off the grating can propagate 2nd and 3rd order effects at whole multiples
of the incident light. While these signals are weak, they may cause stray light that
reduces the accuracy of the spectrometer response. Order sorting filters reject this stray
light only allowing the desired wavelength through to the detector. Order sorting filters
are combined with detector window upgrades. The full range available is listed below.
These must be specified at the time of ordering.
Detector Window Upgrades (optional): The standard BK7 glass window on the
detector begins to absorb light around 340nm. For applications in the UV, below 360nm,
we recommend the detector window upgrade. This replaces the BK-7 glass with Quartz.
Typically these are used in conjunction with an order sorting filter to block the impact of
2nd and 3rd order effects at higher wavelengths.
42 225-00000-000-11-201604
Page 53

5: How the Flame Spectrometer Works
Detector
Description
Spectrometer
DET2B-200-535
Sony ILX511B detector, installed, with Custom OFLV Coated
Window Assembly for Grating#5 and Grating#5U, S-bench
FLAME-S
DET2B-200-850
Sony ILX511 detector, installed, with 200 – 850 nm variable
longpass filter and UV2 quartz window; best for UV-VIS
systems configured with Grating #1 or #2
FLAME-S
DET2B-200-1100
Sony ILX511 detector, installed, with 200 – 850 nm variable
longpass filter and UV2 quartz window; best for UV-VIS
systems configured with XR-1 grating
FLAME-S
DET2B-350-1000
Sony ILX511 detector, installed, with 350 – 1000 nm variable
longpass filter; best for VIS systems configured with Grating
#2 or #3
FLAME-S
DET2B-UV
Sony ILX511 detector, installed, with UV2
quartz window; best for systems configured for <360nm
FLAME-S
DET2B-VIS
Sony ILX511 detector, installed, with VIS BK7 window; best
for systems configured for >400nm
FLAME-S
DET4-200-535
Toshiba TCD1304AP detector, installed, with Custom OFLV
Coated Window Assembly for Grating#5 and Grating#5U, Sbench
FLAME-T
DET4-200-850
Toshiba TCD1304AP detector, installed, with 200 – 850 nm
variable longpass filter and UV2 quartz window; best for
systems configured with Grating #1 or #2
FLAME-T
DET4-200-1100
Toshiba TCD1304AP detector, installed, with 200 – 850 nm
variable longpass filter and UV4 quartz window: best for
systems configured with XR-1 grating
FLAME-T
DET4-350-1000
Toshiba TCD1304AP detector, installed, with 350 – 1000 nm
variable longpass filter; best for VIS systems configured with
Grating #2 or #3
FLAME-T
DET4-UV
Toshiba TCD1304AP detector, installed, with UV4 quartz
window; best for systems configured for <360 nm
FLAME-T
DET4-VIS
Toshiba TCD1304AP detector, installed, with VIS BK7 quartz
window: best for systems configured for >400 nm
FLAME-T
Available Order-Sorting and Detector Window Options
225-00000-000-11-201604 43
Page 54

5: How the Flame Spectrometer Works
44 225-00000-000-11-201604
Page 55

Specification
FLAME-S
FLAME-T
Optical and Spectroscopic
Integration Time
10 µs – 65 seconds
3.8 ms to 10 seconds
Dynamic Range for single
acquisition1
1300:1
Dynamic Range of
system2
2 x 10⁸
3.4 x 10⁶
Signal-to-Noise (single
acquisition)
250:1
300:1
Resolution (FWHM)
0.1 – 10.0 nm (configuration dependent)
Scan rate (max) 3
400 Hz
260 Hz
Spectrometer Channels
One
Thermal Stability
0.02 nm/°C for 650 nm range, 0.06 pixels/°C
Triggering
4 modes
Triggering Jitter
21 nanoseconds
Detector
Type
Sony ILX511B CCD
Toshiba TCD1304AP CCD
Detector range
190–1100 nm
Pixels
2048 pixels
3648 pixels
Pixel size
14 µm x 200 µm
8 µm x 200 µm
Electronic shutter
No
Yes
Pixel well depth
~62,500 electrons
~100,000 electrons
Readout noise (single
dark spectrum)
50 counts RMS, 300 counts peak-to-peak
Chapter 6
Technical Specifications
225-00000-000-11-201604 45
Page 56

6: Technical Specifications
Specification
FLAME-S
FLAME-T
Corrected linearity
>99.8%
Filters (optional)
2nd and 3rd order rejection, long pass
Electrical
Power requirement
(spectrometer functions)
250 mA at +5 VDC
Supply voltage
4.75 – 5.25 V
Power-up time
~2s
Connectors
Micro-USB and JAE DD4 (DD4RA40JA1) 40-pin connector
Micro-USB Absolute
Maximum Ratings:
V
CC
+ 5.5 VDC
DD4 Absolute Maximum
Ratings:
VCC (Pin 40)
Voltage on any pin (other
than input power)
+ 5.5 VDC
+4VDC
Interface:
USB
RS-232
USB 2.0, 480 Mbps
2-wire RS-232
Mechanical
Spectrometer Design
Asymmetric crossed Czerny-Turner
Input Fiber Connector
SMA 905 or FC
Gratings
15 different gratings. See Chapter 5: How the Flame Spectrometer Works
for more information.
Entrance Slit
5, 10, 25, 50, 100, or 200 μm slits. (Slits are optional. In the absence of a
slit, the fiber acts as the entrance slit.)
Physical Dimensions
88.9 mm x 63.5 mm x 31.9 mm
Weight
265 g
Environmental
Temperature:
Storage
-30 to +70 C
0 to 50 C
46 225-00000-000-11-201604
Page 57

6: Technical Specifications
Specification
FLAME-S
FLAME-T
Operation
Humidity
0% - 90% noncondensing
Compliance4
Electrical
CE, FCC, CISPR 11:2010, EMC 2004/108/EC and EN 61326-1:2013
Material
RoHS
Shock
IEC 60068-2-64
Vibration
IEC 60068-2-31
Manufacturing
ISO:9001
1
Dynamic range for a single acquisition is a measure of the ratio of full signal to noise.
2
Dynamic range of the system is the range of the detectable light level and can be thought of as the
maximum detectable light level at the minimum integration time divided by the minimum detectable
light level at the maximum integration time.
3
Scan rate is dependent on the operating computer and not the spectrometer. These figures assume a
non real-time operating system.
4
Contact info@oceanoptics.com to obtain copies of certifications
225-00000-000-11-201604 47
Page 58

6: Technical Specifications
Mechanical Diagram
Figure 1: Flame Outer Dimensions
48 225-00000-000-11-201604
Page 59

6: Technical Specifications
Pin #
Function
Voltage
Level
Description
1
Ground
N/A
Ground
2
Trigger
5 or 3.3 V
The TTL trigger signal.
3
Continuous Strobe
5 V
TTL output signal used to pulse a strobe that is divided
down from the Master Clock signal.
4
Single Strobe
5 V
TTL output pulse used as a strobe signal, which has a
programmable delay relative to the beginning of the
spectrometer integration period.
5
Lamp Enable
5 V
A TTL signal that is driven Active HIGH when the Lamp
Enable command is sent to the Flame.
6
GPIO 0
2.5 V
General Purpose Software Programmable Digital
Inputs/Output*
Electrical Pinout
The Flame features a 40-pin Accessory Connector, located on the front of the unit as shown:
Location of Flame Accessory Connector
DD4 Accessory Connector Pinout Diagram
When facing the 40-pin Accessory Connector on the front of the vertical wall of the Flame, pin
number 1 is on the right.
Listed below is the pin description for the Flame Accessory Connector located on the front
vertical wall of the unit. The Flame will include a JAE DD4 receptacle, part number
DD4RA40JA1. Most accessories that plug into the Flame will include a JAE DD4 plug, part
number DD4PA40MA1. There is also a vertical connector, JAE part number DD4BA40WA1.
225-00000-000-11-201604 49
Page 60

6: Technical Specifications
Pin #
Function
Voltage
Level
Description
7
GPIO 1
2.5 V
General Purpose Software Programmable Digital
Inputs/Output*
8
GPIO 2
2.5 V
General Purpose Software Programmable Digital
Inputs/Output*
9
GPIO 3
2.5 V
General Purpose Software Programmable Digital
Inputs/Output*
10
Ground
2.5 V
General Purpose Software Programmable Digital
Inputs/Output*
11
GPIO 4
2.5 V
General Purpose Software Programmable Digital
Inputs/Output*
12
GPIO 5
2.5 V
General Purpose Software Programmable Digital
Inputs/Output*
13
GPIO 6
2.5 V
General Purpose Software Programmable Digital
Inputs/Output*
14
GPIO 7
2.5 V
General Purpose Software Programmable Digital
Inputs/Output*
15
Ground
N/A
Ground
16
SPI Master Clock
3.3 V
Master clock. See SPI below.
17
SPI Master MOSI
3.3 V
The SPI Master Out Slave In (MOSI) signal for
communications to other SPI peripherals. See SPI below.
18
SPI Master CS
3.3 V
TTL output signal used to pulse a strobe that is divided
down from the Master Clock signal. See SPI below.
19
SPI Master MISO
3.3 V
The SPI Master In Slave Out (MISO) signal for
communications to other SPI peripherals. See SPI below.
20
Ground
N/A
Ground
21
I2C Master Clock
3.3 V
I2C Master Clock. See I2C below.
22
I2C Master Data
3.3 V
I2C Master Data. See I2C below.
23
Ground
N/A
Ground
24
RS232 TX
-6 to +6 V
RS232 Transmit signal – for communication with PC
connect
25
RS232 RX
N/A
RS232 Receive signal – for communication with PC connect
50 225-00000-000-11-201604
Page 61

6: Technical Specifications
Pin #
Function
Voltage
Level
Description
26
Reserved
N/A
Reserved
27
Reserved
N/A
Reserved
28
Reserved
N/A
Do not connect
29
Reserved
N/A
Reserved
30
Reserved
N/A
Reserved
31
Reserved
N/A
Reserved
32
Reserved
N/A
Reserved
33
Reserved
N/A
Reserved
34
Reserved
N/A
Reserved
35
Reserved
N/A
Reserved
36
Reserved
N/A
Reserved
37
Reserved
N/A
Reserved
38
5V Out
5 V
The input power pin from the Flame.
39
Ground
N/A
Ground
40
5V In
N/A
The input power pin to the Flame. Additionally when
operating via a Universal Serial Bus (USB) this is the USB
power connection (+5V) which can be used to power other
peripherals (Care must be taken to insure that the peripheral
complies with USB Specifications). The entire assembly
should not draw more than 500 mA.
NOTE: Do not connect both USB power and Auxiliary power
(as an input) at the same time.
*See the Caution below.
Do not connect the GPIO pins to 5V. The GPIOs are not 5V tolerant and will be
damaged if connected to 5V. The maximum voltage is 4V for the 3.3V logic pins
and 3V for the 2.5V logic pins.
225-00000-000-11-201604 51
Caution
Page 62

6: Technical Specifications
SPI
The Flame has the ability to function as a SPI master through the SPI port, which comprises the
SPI Master Clock, SPI Master MOSI, SPI Master CS, and SPI Master MISO pins. To send
messages over the SPI port, use the
send or receive any SPI data without direction from its host PC.
General SPI Input/Output
message. The Flame does not
Because SPI is a full-duplex transaction, the
writes at the same time. For instance, a four byte write will return four bytes of dummy read
data, and a four byte read requires four bytes of dummy write data:
MOSI data is established just prior to the rising edge of the SPI clock
MISO data is sampled just after a falling edge of the SPI clock.
General SPI Input/Output
message both reads and
I2C
The Flame has the ability to function as an I2C master through the I2C port, which comprises
the I2C-SDA, and I2C-SCL pins. To send messages over the I2C port, use the General I2C
Write and General I2C Read messages. Note that the Flame does not send or receive any I2C
data without direction from its host PC. The I2C lines are pulled up internally to 3.3V by 2K
resistors.
CCD Overview
CCD Detector
The detector used for the Flame is a charge transfer device (CCD) that has a fixed well depth
(capacitor) associated with each photodetector (pixel).
Charge transfer, reset and readout initiation begin with the integration time clock going HIGH.
At this point, the remaining charge in the detector wells is transferred to a shift register for
serial transfer. This process is how the array is read.
The reset function recharges the photodetector wells to their full potential and allows for nearly
continuous integration of the light energy during the integration time, while the data is read out
through serial shift registers. At the end of an integration period, the process is repeated.
When a well is fully depleted by leakage through the back-biased photodetector, the detector is
considered saturated and provides the maximum output level. The CCD is a depletion device
and thus the output signal is inversely proportional to the input photons. The electronics in the
Flame invert and amplify this electrical signal.
52 225-00000-000-11-201604
Page 63

6: Technical Specifications
Large-well CCDs
Small-well CCDs
Low photon noise
Medium photon noise that can be averaged out
Low optical sensitivity
High optical sensitivity
High power consumption
Low power consumption
>10 MHz operating speeds
Moderate operating speeds (~2 MHz)
CCD Well Depth
We strive for a large signal-to-noise (S:N) in optical measurements so that small signal
variations can be observed and a large dynamic range is available. The S:N in photon noiselimited systems is defined and measured as the square root of the number of photons it takes
to fill a well to saturation. In the Flame, the well depth of the CCD pixels is about 160,000
photons, providing a S:N of 400:1 (S:N can also be measured as the saturation voltage divided
by near-saturation RMS noise). There is also a fixed readout noise component to all samples.
The result is a system with a S:N of ~275:1.
There are two ways to achieve a large S:N (e.g., 6000:1) in CCD detectors where photon noise
is predominant.
1. Use a large-well device that integrates to saturation over a long period of time until the
photon noise is averaged out by the root of n multiples of a defined short t.
2. Use a small-well device that integrates to saturation at one short t and then signal
average mathematically n times.
Theoretically, both approaches achieve the same results, though there are large differences in
actual operation. Traditional spectroscopic instruments use large-well devices and 16-bit ADCs
to achieve the defined S:N. The Flame uses a small-well device and utilizes signal averaging to
achieve the same S:N. A brief comparison of large and small-well devices is shown in the table
below.
Well Depth Comparison
Signal Averaging
Signal averaging is an important tool in the measurement of spectral structures. It increases the
S:N and the amplitude resolution of a set of samples. The types of signal averaging available in
our software are time-based and spatial-based.
When using the time-base type of signal averaging, the S:N increases by the square root of the
number of samples. Signal averaging by summing is used when spectra are fairly stable over
the sample period. Thus, a S:N of 2500:1 is readily achieved by averaging 100 spectra.
225-00000-000-11-201604 53
Page 64

6: Technical Specifications
Pixel
Description
Pixel
Description
0–11
Not usable
1–5
Not usable
12–29
Optical black pixels
6–18
Optical black pixels
30–31
Not usable
19–21
Transition pixels
32–2079
Optical active pixels
22–3669
Optical active pixels
2080–2085
Not usable
3670–3681
Not usable
Spatial averaging or pixel boxcar averaging can be used to improve S:N when observed spectral
structures are broad. The traditional boxcar algorithm averages n pixel values on each side of a
given pixel.
Time-based and spatial-based algorithms are not correlated, so therefore the improvement in
S:N is the product of the two processes.
In review, large-well devices are far less sensitive than small-well devices and thus, require a
longer integration time for the same output. Large-well devices achieve a good S:N because
they integrate out photon noise. Small-well devices must use mathematical signal averaging to
achieve the same results as large-well devices, but small-well devices can achieve the results in
the
same period of time
. This kind of signal averaging was not possible in the past because
analog-to-digital converters and computers were too slow.
Large-well devices consume large amounts of power, resulting in the need to build thermoelectric
coolers to control temperature and reduce electronic noise. Then, even more power is required for
the temperature stabilization hardware. But small-well devices only need to use signal averaging to
achieve the same results as large-well devices, and have the advantages of remaining cool and
less noisy.
Internal Operation
Pixel Definition
A series of pixels in the beginning of the scan have been covered with an opaque material to
compensate for thermal induced drift of the baseline signal. As the Flame warms up, the baseline
signal will shift slowly downward a few counts depending on the external environment. The
baseline signal is set at the time of manufacture. If the baseline signal is manually adjusted, it
should be left high enough to allow for system drift. The following is a description of all of the
pixels, both as they exist on the hardware device and as they are actually read from the device via
USB:
Pixels on the FLAME-S Pixels on the FLAME-T
54 225-00000-000-11-201604
Page 65

6: Technical Specifications
Pixel
Description
0–17
Optical black pixels
18–19
Not usable
20-2047
Optical active pixels
Pixels Read from the Flame-S via USB
It is important to note that the Flame-S only digitizes the first 2048 pixels. For Flame-T, Ocean
Optics software displays 3648 pixels starting at pixel 1 above. In RS232 interface mode, the
USB4000 transmits out the first 3670 pixels.
CCD Detector Reset Operation
At the start of each integration period, the detector transfers the signal from each pixel to the
readout registers and resets the pixels. The total amount of time required to perform this
operation is ~8 9s. The user needs to account for this time delay when the pixels are
optically inactive, especially in the external triggering modes.
Timing Signals
Strobe Signals
Single Strobe
The Single Strobe signal is a programmable TTL pulse that occurs at a user-determined time
during each integration period. This pulse has a user-defined High Transition Delay and Low
Transition Delay. The pulse width of the Single Strobe is the difference between these delays.
It is only active if the Lamp Enable command is active.
Synchronization of external devices to the spectrometer's integration period is accomplished
with this pulse. The Strobe Delay is specified by the Single Strobe High Transition Delay
(SSHTD) and the Pulse Width is specified by the Single Strobe Low Transition Delay (SSLTD)
minus the Single Strobe High Transition Delay ( PW = SSLTD – SSHTD). Both values are
programmable in 500ns increments for the range of 0 to 65,535 (32.7675ms).
The timing of the Single Strobe is based on the Start of Integration (SOI). SOI occurs on the
rising edge of ROG which is used to reset the Sony ILX511 detector. In all trigger modes using
an External Trigger, there is a fixed relationship between the trigger and the SOI. In the Normal
mode and Software Trigger mode, the SOI still marks the beginning of the Single Strobe, but
due to the nondeterministic timing of the software and computer operating system, this timing
will change over time and is not periodic. That is, at a constant integration time, the Single
Strobe will not be periodic, but it will indicate the start of the integration. The timing diagram
for the Single Strobe in External Hardware Trigger mode is shown below:
225-00000-000-11-201604 55
Page 66

6: Technical Specifications
The Trigger Delay (TD) is another user programmable delay which specifies the time in 500ns
increments that the SOI will be delayed beyond the normal Start of Integration Delay (SOID).
An example calculation of the Single Strobe timing follows:
If the TD = 1ms, SSHTD = 50ms, and SSLTD = 70ms then, the rising edge of the Single Strobe
will occur approximately 51.82ms (1ms + 50ms + 8.2us) after the External Trigger Input goes
high and the Pulse Width will be 20ms (70ms – 50ms).
Continuous Strobe
The Continuous Strobe signal is a programmable frequency pulse-train with a 50% duty cycle.
It is programmed by specifying the desired period whose range is 2us to 60s. This signal is
continuous once enabled, but is not synchronized to the Start of Integration or External Trigger
Input. The Continuous Strobe is only active if the Lamp Enable command is active.
Synchronous Continuous Strobe
In Synchronous mode, the strobe will always be the same integer number of pulses per
integration period, and deterministic from the start of integration. Setting the strobe period to
greater than the ((integration time/2)-strobe offset) will result in nonguaranteed behavior
(there is no time to do a single pulse).
If the application requires more than one pulse per integration period, ensure the continuous
strobe and integration period are synchronized. The integration time must be set so that an
equal number of strobe events occurs during any given integration period.
External Triggering
The Flame Spectrometer has several ways of acquiring data. In the Normal/Free-Run mode, the
spectrometer is “free running.” That is, the spectrometer is continuously scanning, acquiring,
and transferring data to your computer, according to parameters set in the software. In this
mode, there is no way to synchronize the scanning, acquisition, and transfer of data with an
external event. However, trigger pulses for synchronizing an external event with the
spectrometer are available.
Each trigger mode involves connecting an external triggering device to the spectrometer and
then applying an external trigger to the spectrometer before the software receives the data.
The length of the integration time and the source for the integration clock depend upon the
mode chosen. All other acquisition parameters are set in the software.
You can trigger the Flame using a variety of External Triggering options through the 40-pin
Accessory Connector on the spectrometer. See the External Triggering Options document
located at http://oceanoptics.com/wp-content/uploads/External-Triggering-
Options_Firmware3.0andAbove.pdf. The triggering document contains further instructions for
configuring External Triggering options for the Flame.
56 225-00000-000-11-201604
Page 67

6: Technical Specifications
Triggering Modes
The Flame supports three triggering modes, (plus Normal mode), which are set with the Trigger
Mode command. Detailed information of each triggering mode follows. Also refer to the External
Triggering Options document located on our website at http://oceanoptics.com/wp-
content/uploads/External-Triggering-Options_Firmware3.0andAbove.pdf. The following
paragraphs describe these modes.
Normal
In the Normal (Free-run) mode, the spectrometer will acquire back-to-back spectra based on
the integration period specified. After the Integration Cycle completes, the data is read out of
the detector and written into an internal FIFO where it is available for reading. In parallel to
this read/write operation, another integration is occurring. If the data from the FIFO is
completely read before the parallel integration completes, a back-to-back operation will
occur. If the data is not read (FIFO Empty) in this time period, the FPGA will generate an Idle
Cycle which is equivalent to one integration period and the data from the detector is
discarded. After the Idle Cycle has completed, the FIFO Empty status is checked. If the FIFO is
empty and a new spectrum is requested by the software, a new acquisition will begin. If either
condition is false, additional Idle Cycles will be generated until both conditions are true.
For the Flame-S and Flame-T, this is also referred to as the nonbuffering mode because only
one spectrum is stored within the FPGA and not multiple spectra. In this scenario, ReadEnable
is generated by the software/firmware to initiate each new acquisition. Since only one spectrum
is stored at a time in the FPGA, a new integration cannot be started until the FIFO data has
been fully retrieved by the software.
External Synchronous Trigger Mode
In the External Synchronous Trigger mode, two external triggers are required to complete a
data acquisition. The first rising edge starts the integration period and the second rising edge
stops the integration and starts the next. Thus the integration time is the period between the
two external trigger pulses. After the integration period, the spectrum is retrieved and available
to the user. As in normal mode, no further spectra are acquired until the original spectrum is
read by the user.
External Hardware Level Trigger Mode
In the External Hardware Level Trigger mode, a rising edge detected by the spectrometer from
the External Trigger input starts the integration period specified through the software interface.
After the integration period, the spectrum is retrieved and is ready to be read by the user. As
long as the trigger level remains active in a logic one state, back-to-back acquisitions can occur,
as in the Normal mode, until the trigger transitions to an inactive level. As in normal mode, no
further spectra are acquired until the original spectrum is read by the user.
External Hardware Edge Trigger Mode
In the External Hardware Edge Trigger mode, a rising edge detected by the spectrometer from
the External Trigger input starts the integration period specified through the software interface.
225-00000-000-11-201604 57
Page 68

6: Technical Specifications
After the integration period, the spectrum is retrieved and is ready to be read by the user. If
another trigger is sent a new integration cycle will begin. If a spectrum request is not received
before the integration cycle has ended then that data will be deleted and a new trigger and
spectrum request is required. Only one acquisition will be performed for each External Trigger
pulse, no matter what the pulse’s duration is. No further spectra are acquired until the original
spectrum is read by the user.
See DD4 Accessory Connector Pinout Diagram to locate the pins to set up triggering.
58 225-00000-000-11-201604
Page 69

Chapter 7
Calibration
Overview
This chapter provides information for performing your own wavelength calibration and
irradiance calibration.
An EEPROM flash memory chip in each Flame contains wavelength calibration coefficients,
linearity coefficients, and a serial number unique to each individual spectrometer. The
spectrometer operating software application reads these values directly from the spectrometer,
enabling the ability to “hot-swap” spectrometers between computers without entering the
spectrometer coefficients manually on each computer.
USB Programmer software is freely available from Ocean Optics:
http://oceanoptics.com/support/software-downloads/. This software can be used to
write calibration coefficients to the spectrometer and reload firmware if the spectrometer
becomes corrupted.
Wavelength Calibration
This section describes how to calibrate the wavelength of your spectrometer. Though each
spectrometer is calibrated before it leaves Ocean Optics, the wavelength for all spectrometers
will drift slightly as a function of time and environmental conditions. Ocean Optics recommends
periodically recalibrating the Flame.
About Wavelength Calibration
You are going to be solving the following equation, which shows that the relationship between
pixel number and wavelength is a third-order polynomial:
Where:
= I +
p
= the wavelength of pixel p
C1 p
+
C2 p
2
+
C3 p
3
I
= the wavelength of pixel 0
C
= the first coefficient (nm/pixel)
1
C
= the second coefficient (nm/pixel2)
2
225-00000-000-11-201604 59
Page 70

7: Calibration
C3 = the third coefficient (nm/pixel3)
You will be calculating the value for I and the three Cs.
Calibrating the Spectrometer Wavelength
Preparing for Calibration
To recalibrate the wavelength of your spectrometer, you need the following components:
A light source capable of producing spectral lines
Note
Ocean Optics’ HG-1 Mercury-Argon lamp is ideal for recalibration. If you do not
have an HG-1, you need a light source that produces several (at least 4-6)
spectral lines in the wavelength region of your spectrometer.
A Flame spectrometer
An optical fiber (for spectrometers without a built-in slit, a 50-m fiber works best)
A spreadsheet program (Excel or Quattro Pro, for example) or a calculator that performs
third-order linear regressions
Note
If you are using Microsoft Excel, choose Tools | Add-Ins and check
AnalysisToolPak and AnalysisTookPak-VBA.
Calibrating the Wavelength of the Spectrometer
► Procedure
Perform the steps below to calibrate the wavelength of the spectrometer:
1. Place the spectrometer operating software into Quick View (Scope) mode and take a
spectrum of your light source. Adjust the integration time (or the A/D conversion
frequency) until there are several peaks on the screen that are not off-scale.
2. Move the cursor to one of the peaks and position the cursor so that it is at the point of
maximum intensity.
3. Record the pixel number that is displayed in the status bar or legend (located beneath
the graph). Repeat this step for all of the peaks in your spectrum.
4. Use the spreadsheet program or calculator to create a table like the one shown in the
following figure. In the first column, place the exact or true wavelength of the spectral
lines that you used.
60 225-00000-000-11-201604
Page 71

7: Calibration
True Wavelength (nm)
Pixel #
Pixel # 2
Pixel # 3
Predicted
Wavelength
Difference
253.65
296.73
302.15
313.16
334.15
365.02
404.66
407.78
435.84
546.07
576.96
579.07
696.54
706.72
727.29
738.40
751.47
175
296
312
342
402
490
604
613
694
1022
1116
1122
1491
1523
1590
1627
1669
30625
87616
97344
116964
161604
240100
364816
375769
481636
1044484
1245456
1258884
2223081
2319529
2528100
2647129
2785561
5359375
25934336
30371328
40001688
64964808
117649000
220348864
230346397
334255384
1067462648
1389928896
1412467848
3314613771
3532642667
4019679000
4306878883
4649101309
253.56
296.72
302.40
313.02
334.19
365.05
404.67
407.78
435.65
546.13
577.05
579.01
696.70
706.62
727.24
738.53
751.27
0.09
0.01
-0.25
0.13
-0.05
-0.04
-0.01
0.00
0.19
-0.06
-0.09
0.06
-0.15
0.10
0.06
-0.13
0.19
Independent
Variable
Dependent
Variables
Values Computed
from the Regression
Output
In the second column of this worksheet, place the observed pixel number. In the third
column, calculate the pixel number squared, and in the fourth column, calculate the
pixel number cubed.
225-00000-000-11-201604 61
5. Use the spreadsheet or calculator to calculate the wavelength calibration coefficients. In
the spreadsheet program, find the functions to perform linear regressions.
If using Quattro Pro, look under Tools | Advanced Math
If using Excel, look under Analysis ToolPak
6. Select the true wavelength as the dependent variable (Y). Select the pixel number, pixel
number squared, and the pixel number cubed as the independent variables (X). After
executing the regression, you will obtain an output similar to the one shown below.
Numbers of importance are noted.
Regression Statistics
Multiple R 0.999999831
R Square 0.999999663 R Squared
Adjusted R Square 0.999999607
Standard Error 0.125540214
Observations 22
Intercept
Coefficients Standard Error
Intercept 190.473993 0.369047536 First coefficient
X Variable 1 0.36263983 0.001684745
Page 72

7: Calibration
X Variable 2-1.174416E-05 8.35279E-07
X Variable 3-2.523787E-09 2.656608E-10 Second coefficient
Third coefficient
7. Record the Intercept, as well as the First, Second, and Third Coefficients. Additionally,
look at the value for R squared. It should be very close to 1. If not, you have most likely
assigned one of your wavelengths incorrectly.
Keep these values at hand.
Saving the New Calibration Coefficients: USB Mode
Ocean Optics programs wavelength calibration coefficients unique to each Flame onto an
EEPROM memory chip in the Flame.
You can overwrite old calibration coefficients on the EEPROM if you are using the Flame via the
USB port.
► Procedure
To save wavelength calibration coefficients using the USB mode, perform the following
steps:
1. Ensure that the Flame is connected to the computer and that you have closed all other
applications.
2. Point your browser to http://www.oceanoptics.com/technical/softwaredownloads.asp
and scroll down to Microcode. Select USB EEPROM Programmer.
3. Save the setup file to your computer.
4. Run the Setup.exe file to install the software. The Welcome screen appears.
5. Click the Next button. The Destination Location screen appears.
6. Accept the default installation location, or click the Browse button to specify a
directory. Then, click the Next button. The Program Manager Group screen appears.
7. Click the Next button. The Start Installation screen appears.
8. Click the Next button to begin the installation. Once the installation finishes, the
Installation Complete screen appears.
9. Click the Finish button and reboot the computer when prompted.
10. Navigate to the USB EEPROM Programmer from the Start menu and run the
software.
11. Click on the desired Flame device displayed in the left pane of the USB Programmer
screen.
12. Double-click on each of the calibration coefficients displayed in the right pane of the USB
Programmer screen and enter the new values acquired in Steps 5 and 6 of the
Calibrating the Wavelength of the Spectrometer section in this appendix.
13. Repeat Step 12 for all of the new values.
62 225-00000-000-11-201604
Page 73

7: Calibration
14. Click on the Save All Values button to save the information, and then Exit the USB
Programmer software.
The new wavelength calibration coefficients are now loaded onto the EEPROM memory chip on
the Flame.
Irradiance Calibrations
Irradiance calibrations and relative irradiance calibrations are about quantifying the spectra, by
translating the signal (incident number of photons) to a calibration. This can be either absolute
(an atomic emission light source of known output power) or relative (corrected for instrument
response function but not absolute units). It can be considered a measurement technique and
is used widely in remote sensing, light metrology and anywhere where you wish to characterize
the incident light source. Irradiance calibrations are not required for many techniques because
these measure the relative signal changes with respect to the sample and not the light source.
You can find out more about irradiance calibration techniques at
http://oceanoptics.com/measurementtechnique/irradiance/.
OceanView has wizards that will step you through absolute irradiance and relative calibrations
and more information on these is located in the OceanView manual (see Product-Related
Documentation).
225-00000-000-11-201604 63
Page 74

7: Calibration
64 225-00000-000-11-201604
Page 75

Chapter 8
Firmware and Advanced
Communications
FLAME-S Firmware
The Flame is a microcontroller-based Miniature Fiber Optic Spectrometer that can communicate
via the Universal Serial Bus or RS-232. This section contains the necessary command
information for controlling the Flame via the USB interface command. This information is mainly
relevant to those who don’t wish to use Ocean Optics OmniDriver or SeaBreeze device drivers,
or to those who wish to communicate via RS-232.
Hardware Description
The Flame utilizes a Cypress CY7C68013 microcontroller that has a high speed 8051 combined
with an USB2.0 ASIC. Program code and data coefficients are stored in external E2PROM that
are loaded at boot-up via the I2C bus. The microcontroller has 16K of internal SRAM and 64K of
external SRAM. Maximum throughput for spectral data is achieved when data flows directly
from the external FIFO’s directly across the USB bus. In this mode the 8051 does not have
access to the data and thus no manipulation of the data is possible.
USB Information
Ocean Optics Vendor ID number is 0x2457 and the Product ID is 0x101E.
Instruction Set
Command Syntax
The list of the commands is shown in the following table followed by a detailed description of
each command. The length of the data depends on the command. All commands are sent to
the Flame through End Point 1 Out (EP1). All spectra data is acquired through End Point 2 In
and all other queries are retrieved through End Point 1 In (EP1). The endpoints enabled and
their order is:
225-00000-000-11-201604 65
Page 76

8: Firmware and Advanced Communications
Pipe #
Description
Type
Hi Speed Size
(Bytes)
Full Speed
Size (Bytes)
Endpoint
Address
0
End Point 1 Out
Bulk
512
64
0x01
1
End Point 2 In
Bulk
512
64
0x82
2
End Point 6 In
Bulk
512
64
0x86
3
End Point 1 In
Bulk
512
64
0x81
EP1
Command
Byte Value
Description
0x01
Initialize Flame
0x02
Set Integration Time
0x03
Set Strobe Enable Status
0x04
Set Shutdown Mode
0x05
Query Information
0x06
Write Information
0x09
Request Spectra
0x0A
Set Trigger Mode
0x0B
Query number of Plug-in Accessories Present
0x0C
Query Plug-in Identifiers
0x0D
Detect Plug-ins
0x12
LED Status
0x60
General I2C Read
Flame-S Endpoints
USB Command Summary
66 225-00000-000-11-201604
Page 77

8: Firmware and Advanced Communications
EP1
Command
Byte Value
Description
0x61
General I2C Write
0x62
General SPI I/O
0x6A
Write Register Information*
0x6B
Read Register Information
0x6C
Read PCB Temperature
0x6D
Read Irradiance Calibration Factors
0x6E
Write Irradiance Calibration Factors
0xFE
Query Information
*Writing bit 0 of register 0xB5 to ‘1’ will enable synchronous continuous strobe mode.
‘0’ is default and is asynchronous cont. strobe mode. A delay after the start of
integration, but before the first rising edge of synchronous continuous strobe can be
inserted up to 65535 µsec. This is done by writing the value in microseconds to
register 0xB6. Default is 0x00.
Byte 0
Byte 1
Byte 2
…
Byte n-1
Command
Byte
Command
Specific
Command
Specific
…
Command
Specific
Parameter
Default Value
Trigger Mode
0 – Normal Trigger
USB Command Descriptions
A detailed description of all Flame commands follows. While all commands are sent to EP1 over
the USB port, the byte sequence is command dependent. The general format is the first byte is
the command value and the additional bytes are command specific values.
Initialize Flame
Initializes certain parameters on the Flame and sets internal variables based on the USB
communication speed the device is operating at. This command should be called at the start of
every session; however, if the user does not call it, it will be executed on the first Request Scan
command. The default values are set as follows:
225-00000-000-11-201604 67
Page 78

8: Firmware and Advanced Communications
Byte 0
0x01
Byte 0
Byte 1
Byte 2
Byte 3
Byte 4
0x02
LSWLSB
LSW-MSB
MSW-LSB
MSW-MSB
Data Byte = 0 Lamp Enable Low/Off
Data Byte = 1 Lamp Enable HIGH/On
Byte 0
Byte 1
Byte 2
0x03
Data byte LSB
Data Byte MSB
Data Byte = 0 Shutdown everything but the FX2
Data Byte = !0 Power up entire Spectrometer
Byte Format
Set Integration Time
Sets the Flame integration time in microseconds. The value is a 32-bit value whose acceptable
range is 1,000µs – 65,535,000µs. If the value is outside this range the value is unchanged. For
integration times less than 655,000us, the integration counter has a resolution of 10us. For
integration times greater than this the integration counter has a resolution of 1ms.
Byte Format
MSW & LSW: Most/Least Significant Word
MSB & LSB: Most/Least Significant Byte
Set Strobe Enable Status
Sets the Flame Lamp Enable line (J2 pin 4) as follows. The Single Strobe and Continuous Strobe
signals are enabled/disabled by this Lamp Enable Signal.
Byte Format
Set Shutdown Mode
Sets the Flame shutdown mode. When shutdown, the internal FX2 microcontroller is
continuously running however all other functionality is disabled. In this power down mode the
current consumption is reduced to 250mA (operating current for the FX2 microcontroller). When
shutdown is active (active low), the external 5V signal (V5_Switched pin 3) is disabled in
addition to all other signals except I2C lines.
68 225-00000-000-11-201604
Page 79

8: Firmware and Advanced Communications
Byte 0
Byte 1
Byte 2
0x04
Data byte LSB
Data Byte MSB
Configuration Index - Description
0 – Serial Number
1 – 0th order Wavelength Calibration Coefficient
2 – 1st order Wavelength Calibration Coefficient
3 – 2nd order Wavelength Calibration Coefficient
4 – 3rd order Wavelength Calibration Coefficient
5 – Stray light constant
6 – 0th order non-linearity correction coefficient
7 – 1st order non-linearity correction coefficient
8 – 2nd order non-linearity correction coefficient
9 – 3rd order non-linearity correction coefficient
10 – 4th order non-linearity correction coefficient
11 – 5th order non-linearity correction coefficient
12 – 6th order non-linearity correction coefficient
13 – 7th order non-linearity correction coefficient
14 – Polynomial order of non-linearity calibration
15 – Optical bench configuration: gg fff sss
gg – Grating #, fff – filter wavelength, sss – slit size
16 – Flame configuration: AWL V
A – Array coating Mfg, W – Array wavelength (VIS, UV, OFLV), L – L2 lens
installed, V – CPLD Version
17 – Reserved
18 – Reserved
19 – 29 User Configured
Byte Format
Query Information
Queries any of the 20 stored spectrometer configuration variables. The Query command is sent
to End Point 1 Out and the data is retrieved through End Point 1 In. When using Query
Information to read EEPROM slots, data is returned as ASCII text. However, everything after
the first byte that is equal to numerical zero will be returned as garbage and should be ignored.
The 20 configuration variables are indexed as follows:
225-00000-000-11-201604 69
Page 80

8: Firmware and Advanced Communications
Byte 0
Byte 1
0x05
Configuration
Index
Byte 0
Byte 1
Byte 2
Byte 3
…
Byte 16
0x05
Configuration Index
ASCII byte 0
ASCII byte 1
…
ASCII byte 14
Byte 0
Byte 1
Byte 2
Byte 3
…
Byte 16
0x06
Configuration Index
ASCII byte 0
ASCII byte 1
…
ASCII byte 14
Byte 0
0x09
Byte Format
Return Format (EP1)
The data is returned in ASCII format and read in by the host through End Point 1.
Write Information
Writes any of the 19 stored spectrometer configuration variables to EEPROM. The 19
configuration variables are indexed as described in the Query Information. The information to
be written is transferred as ASCII information.
Byte Format
Request Spectra
Initiates spectra acquisition. The Flame will acquire a complete spectrum (2048 pixel values).
The data is returned in bulk transfer mode through EP2. The table below provides the pixel
order overview for the 2 different speeds. The pixel values are decoded as described below.
Byte Format
Return Format
The format for the returned spectral data is dependent upon the USB communication.
The format for both High Speed (480 Mbps) and Full Speed (12Mbps) is shown below.
All pixel values are 16 bit values which are organized in LSB | MSB order. There is an
additional packet containing one value that is used as a flag to insure proper
synchronization between the PC and Flame.
70 225-00000-000-11-201604
Page 81

8: Firmware and Advanced Communications
Packet #
End Point
# Bytes
Pixels
0
EP2In
512
0-255
1
EP2In
512
256-511
2
EP2In
512
512-767
3
EP2In
512
768-1023
4
EP2In
512
1024-1279
5
EP2In
512
1280-1535
…
EP2In
512 7
EP2In
512
1792–2048
8
EP2In
1
Sync Packet
Byte 0
Byte 1
Byte 2
Byte 3
Pixel 0 LSB
Pixel 0 MSB
Pixel 1 LSB
Pixel 1 MSB
Byte 510
Byte 511
Pixel 255 LSB
Pixel 255 MSB
Byte 0
0x69
USB High Speed (480Mbps) Packet Format
The data is read from EP2In. The packet format is described below.
The format for the first packet is as follows (all other packets except the synch packet
has a similar format except the pixel numbers are incremented by 256 pixels for each
packet).
Packet 0
…
Packet 15 – Synchronization Packet (1 byte)
225-00000-000-11-201604 71
Page 82

8: Firmware and Advanced Communications
Packet #
End Point
# Bytes
Pixels
0
EP2In
64
0-31
1
EP2In
64
32-63
2
EP2In
64
64-95
…
EP2In
64
63
EP2In
64
2016-2047
64
EP2In
1
Sync Packet
Byte 0
Byte 1
Byte 2
Byte 3
Pixel 0 LSB
Pixel 0 MSB
Pixel 1 LSB
Pixel 2 MSB
Byte 62
Byte 63
Pixel 31 LSB
Pixel 31 MSB
Byte 0
0x69
USB Full Speed (12Mbps) Packet Format
In this mode all data is read from EP2In. The pixel and packet format is shown below.
Packet 0
…
Packet 64 – Synchronization Packet (1 byte)
Autonulling
Slot 0x11 (17) contains autonulling information that has a scaling term used to adjust the
magnitude of the entire spectrum. This can be read out by sending bytes 0x05 11 to the lowspeed out endpoint (0x01) and then reading out 17 bytes from the low-speed in endpoint
(0x81). The bytes of use are Byte offset 6 and 7. The 17 bytes will be formatted as follows:
0x05 11 XX XX XX XX SS SS XX XX XX XX XX XX XX XX XX
72 225-00000-000-11-201604
Page 83

8: Firmware and Advanced Communications
Data Value = 0 Normal (Free running) Mode
Data Value = 1 External Hardware Level Trigger Mode
Data Value = 2 External Synchronization Trigger Mode
Data Value = 3 External Hardware Edge Trigger Mode
Byte 0
Byte 1
Byte 2
0x0A
Data Value LSB
Data Value MSB
Byte 0
0x0C
Where:
XX = reserved bytes (most are either unused or are only used internally to the device)
SS = saturation level of the device as two bytes (LSB followed by MSB).
These need to be assembled into a single 16-bit value. Any time that a spectrum is read from
the spectrometer, each pixel’s intensity value should be multiplied by (65535.0/saturation_level)
to set the scale appropriately.
The contents of slot 0x11 are set at the factory and should not be altered.
Set Trigger Mode
Sets the Flame Trigger mode to one of four states. If an unacceptable value is passed then the
trigger state is unchanged (refer to the External Triggering Options Instructions for a description
of the trigger modes).
Byte Format
Query Number of Plug-in Accessories
To query the number of preset plug-in accessories, use the Query Plug-in Identifiers command
0x0C (below), matching plug-in IDs to the known IDs.
Query Plug-in Identifiers
Queries the Plug-in accessories identifiers. This command returns 7 bytes with the last byte
always being zero at this point. Each of the first 6 bytes correspond to Ocean Optics compatible
devices which responded appropriately for I2C addresses 2 through 7 respectively. The I2C
addresses are reserved for various categories of devices and the value for each category is
shown below. I2C addresses 0-1 are reserved for loading program code from EEPROMS
Byte Format
225-00000-000-11-201604 73
Page 84

8: Firmware and Advanced Communications
Byte 0
Byte 1
…
Byte 5
Byte 6
Value @ I2C address 2
Value @ I2C address 3
…
Value @ I2C address 7
0x00
Byte 0
0x0D
Data Byte = 0 LEDs Off
Data Byte = 1 LEDs On
Byte 0
Byte 1
0x12
Data byte
Byte 0
Byte 1
Byte 2
0x60
I2C Address
Bytes to Read
Return Format
The data is returned in Binary format and read in by the host through End Point 7.
Detect Plug-ins
Reads all of the plug-in accessories that are plugged into the I2C bus. No data values are
returned.
Byte Format
LED Status
Sets the Flame LEDs as follows.
Byte Format
General I2C Read
Performs a general purpose read on the I2C pins for interfacing to attached peripherals. The
time to complete the command is determined by the amount of data transferred and the
response time of the peripheral. The I2C bus runs at 400KHz. The maximum number of bytes
that can be read is 61.
Command Byte Format
74 225-00000-000-11-201604
Page 85

8: Firmware and Advanced Communications
Byte 0
Byte 1
Byte 2
Byte 3
…
Byte N+3
I2C Results
I2C Address
Bytes to Read
Data Byte 0
…
Data byte N
I2C Result Value
Description
0
I2C bus Idle
1
I2C bus Sending Data
2
I2C bus Receiving Data
3
I2C bus Receiving first byte of string
5
I2C bus in waiting for STOP condition
6
I2C experienced Bit Error
7
I2C experience a Not Acknowledge (NAK) Condition
8
I2C experienced successful transfer
9
I2C bus timed out
Byte 0
Byte 1
Byte 2
Byte 3
…
Byte N+3
0x61
I2C Address
Bytes to
Write
Data Byte 0
…
Data byte N
Byte 0
I2C Results
Return Byte Format
General I2C Write
Performs a general purpose write on the I2C pins for interfacing to attached peripherals. The
time to complete the command is determined by the amount of data transferred and the
response time of the peripheral. In all I2C communications, the first byte of the transaction
consists of a 7 bit address and a read/write bit. The “address” that is passed as the second
byte of the I2C write command is this 7 bit address, which will be shifted 1 bit left and
appended with the R/W bit to form the first byte of the I2C write transaction. The I2C bus runs
at 400KHz. The results codes are described above.
Command Byte Format
Return Byte Format
225-00000-000-11-201604 75
Page 86

8: Firmware and Advanced Communications
Byte 0
Byte 1
Byte 2
Byte 3
…
Byte N+2
0x62
# of Bytes (N)
Write Byte 0
Write Byte 1
…
Write Byte
N
Byte 0
Byte 1
Byte 2
…
Byte N+1
# of Bytes (N)
Read Byte 0
Read Byte 1
…
Read Byte N
Byte 0
Byte 1
Byte 2
Byte 3
0x6A
Register
Value
Data Byte LSB
Data Byte
MSB
General SPI Input/Output
Performs a general-purpose write and read on the SPI bus for interfacing to attached
peripherals. The time to complete the command is determined by the amount of data
transferred and the response time of the peripheral. Wait at least 10 ms after sending a Write
command before reading the Return value. The SPI bus runs at ~125KHz Clock. The maximum
number of bytes that can be written or read is 61. During this transfer the SPI Chip Select
signal is driven to an active LOW TTL level. Data is transmitted out the MOSI (Master Out Slave
In) line on the rising edge of the clock signal. Data is also latched in the from the MISO line on
the falling edge of the clock signal.
Command Byte Format
Return Byte Format
Write Register Information
Most all of the controllable parameters for the Flame are accessible through this command
(e.g., GPIO, strobe parameters, etc.). A complete list of these parameters with the associate
register information is shown in the table below. Commands are written to End Point 1 Out
typically with 4 bytes (some commands may require more data bytes). All data values are 16 bit
values transferred in LSB | MSB order. This command requires 100us to complete; the calling
program needs to delay for this length of time before issuing another command. In some
instances, other commands will also write to these registers (i.e., integration time), in these
cases the user has the options of setting the parameters through 2 different methods.
Byte Format
76 225-00000-000-11-201604
Page 87

8: Firmware and Advanced Communications
Register
Address
Description
Default
Value
Min
Value
Max
Value
Time Base
0x00*
Master Clock Counter Divisor
24 1 0xFFFF
48MHz
0x04
FPGA Firmware Version (Read Only)
0x08
Continuous Strobe Timer Interval Divisor
48000
0
0xFFFF
Continuous
Strobe Base
Clock
(see Register
0x0C)
0x0C
Continuous Strobe Base Clock Divisor
4800
0
0xFFFF
48MHz
0x0C
Continuous Strobe LSB Register
4800
0
0xFFFF
48MHz
0x10*
Integration Period Base Clock Divisor
480 0 0xFFFF
48MHz
0x10*
Integration Period LSB Register
480 0 0xFFFF
1KHz
0x14
Set base_clk or base_clkx2
0: base_clk
1: base_clkx2
0 0 1
N/A
0x18*
Integration Clock Timer Divisor
600 0 0xFFFF
Integration
Period Base
Clock
(see Register
0x10)
0x18*
Integration Period MSB Register
0x20
Reserved
0x28
Hardware Trigger Delay – Number of Master
Clock cycles to delay when in External
Hardware Trigger mode before the start of the
integration period
0 0 0xFFFF
0x28
Hardware Trigger Delay – Delay the start of
integration from the rising edge of the trigger in
500ns increments
0 0 0xFFFF
225-00000-000-11-201604 77
Page 88

8: Firmware and Advanced Communications
Register
Address
Description
Default
Value
Min
Value
Max
Value
Time Base
0x2C&*
Trigger Mode
0 = Free Running
1 = External Hardware Level Trigger
1 = External Synchronization Trigger
3 = External Hardware Edge Trigger
0 0 4
N/A
0x30
Reserved
0x38
Single Strobe High Clock Transition Delay
Count
1 0 0xFFFF
2MHz
0x3C
Single Strobe Low Clock Transition Delay
Count
5 0 0xFFFF
2MHz
0x40
Lamp Enable
0 0 1
N/A
0x48
GPIO Mux Register
0: pin is GPIO pin
1: pin is alternate function
0 0 0x03FF
N/A
0x50
GPIO Output Enable
1: pin is output
0: pin is input
0 0 0x03FF
N/A
0x54
GPIO Data Register
For Output: Write value of signal
For Input: Read current GPIO state
0 0 0x03FF
N/A
0x58
Reserved
0x5C
Offset Value
0 0 0xFFFF
N/A
0x60
Offset Control
Bit 0 = Enable Auto-Nulling
Bit 1 = Enable Auto-Nulling Saturation
0 0 0xFFFF
N/A
0x64
FPGA Programmed (Read Only)
0x5501
N/A
N/A
N/A
0x68
Maximum Saturation Level
0x55F0
0
0xFFFF
N/A
78 225-00000-000-11-201604
Page 89

8: Firmware and Advanced Communications
Register
Address
Description
Default
Value
Min
Value
Max
Value
Time Base
0xB5
Synchronous continuous strobe
Bit 0:
Bit 0 = Asynchronous Continuous Strobe
Bit 1 = Synchronous Continuous Strobe
0x00
0x00
0xFF
N/A
0xB6
Synchronous strobe delay
Value = delay form start of integration of first
rising edge (µsec)
0x00
0x00
0xFF
N/A
Byte 0
Byte 1
0x6B
Register
Value
Byte 0
Byte 1
Byte 2
Register Value
Value LSB
Value MSB
Notes:
* - User should not change these values because spectrometer performance can be affected. This information is included
just for completeness
& - These values are controlled by other command interfaces to the Flame (i.e., Set integration time command).
Read Register Information
Read the values from any of the registers above. This command is sent to End Point 1 Out and
the data is retrieved through End Point 1 In.
Byte Format
Return Format (EP1In)
Read PCB Temperature
Read the Printed Circuit Board Temperature. The Flame contains a DS1721 temperature sensor
chip which is mounted to the underside of the PCB. This command is sent to End Point 1 Out
and the data is retrieved through End Point 1 In. The value returned is a signed 16-bit A/D
conversion value, which is equated to temperature by:
Temperature (oC) = .003906 * ADC Value
225-00000-000-11-201604 79
Page 90

8: Firmware and Advanced Communications
Byte 0
0x6C
Byte 0
Byte 1
Byte 2
Read Result
ADC Value LSB
ADC Value MSB
Byte 0
Byte 1
Byte 2
0x6D
EEPROM Address LSB
EEPROM Address MSB
Byte 0
Byte 1
…
Byte 59
Byte 0
Byte 1
…
Byte 59
Byte 0
Byte 1
Byte 2
Byte 3
…
Byte 62
0x6E
EEPROM Address LSB
EEPROM Address MSB
Byte 0
…
Byte 59
Byte Format
Return Format (EP1In)
If the operation was successful, the Read Result byte value will be 0x08. All other values
indicate the operation was unsuccessful.
Read Irradiance Factors
Reads 60 bytes of data, which is utilized for Irradiance Calibration information from the desired
EEPROM memory address.
Byte Format
Return Byte Format
Write Irradiance Factors
Write 60 bytes of data, which is utilized for Irradiance Calibration information to the desired
EEPROM memory address.
Byte Format
Query Status
Returns a packet of information containing the current operating information. Packet structure
is given below:
80 225-00000-000-11-201604
Page 91

8: Firmware and Advanced Communications
Byte 0
0xFE
Byte
Description
Comments
0-1
Number of Pixels - WORD
LSB | MSB order
2-5
Integration Time - WORD
Integration time in s – LSW | MSW. Within each word
order is LSB | MSB
6
Lamp Enable
0 – Signal LOW
1 – Signal HIGH
7
Trigger Mode Value
8
Spectral Acquisition Status
9
Packets In Spectra
Returns the number of Packets in a Request Spectra
Command.
10
Power Down Flag
0 – Circuit is powered down
1 – Circuit is powered up
11
Packet Count
Number of packets loaded into End Point Memory
12
Reserved
13
Reserved
14
USB Communications
Speed
0 – Full Speed (12Mbs)
0x80 – High Speed (480 Mbps)
15
Reserved
Byte Format
Return Format
The data is returned in Binary format and read in by the host through End Point 1 In. The
structure for the return information is as follows:
Flame –S Serial Port Interface Communications and Control
Information
The Flame is a microcontroller-based Miniature Fiber Optic, which can communicate via the
Universal Serial Bus or RS-232. This document contains the necessary command information for
controlling the Flame via the RS-232 interface.
Hardware Description
The Flame utilizes a Cypress FX2 microcontroller, which has a high speed 8051, combined with
an USB ASIC. Program code and data coefficients are stored in external E2PROM, which are
loaded at boot-up via the I2C bus.
225-00000-000-11-201604 81
Page 92

8: Firmware and Advanced Communications
Letter
Description
A
Adds scans
B
Set Pixel Boxcar
C
D E F
***Non functional but follows SAD500 command format***
G
Set Data Compression
H
***Non functional but follows SAD500 command format***
I
Sets integration time
J
Sets Lamp Enable Line
K
Changes baud rate
L
Clear Memory
M
Set Data Storage Mode
N
Instruction Set
Command Syntax
The list of the commands is shown in the following table along with the microcode version
number they were introduced with. All commands consist of an ASCII character passed over the
serial port, followed by some data. The length of the data depends on the command. The
format for the data is either ASCII or binary (default). The ASCII mode is set with the “a”
command and the binary mode with the “b” command. To insure accurate communications, all
commands respond with an ACK (ASCII 6) for an acceptable command or a NAK (ASCII 21) for
an unacceptable command (i.e. data value specified out of range).
In the ASCII data value mode, the Flame “echoes” the command back out the RS-232 port. In
binary mode all data, except where noted, passes as 16-bit unsigned integers (WORDs) with
the MSB followed by the LSB. By issuing the “v command” (Version number query), the data
mode can be determined by viewing the response (ASCII or binary).
In a typical data acquisition session, the user sends commands to implement the desired
spectral acquisition parameters (integration time, etc.). Then the user sends commands to
acquire spectra (S command) with the previously set parameters. If necessary, the baud rate
can be changed at the beginning of this sequence to speed up the data transmission process.
RS232 Command Summary
82 225-00000-000-11-201604
Page 93

8: Firmware and Advanced Communications
Letter
Description
O P
Partial Pixel Mode
Q R S
Starts spectral acquisition with previously set parameters
T
Sets trigger mode
U
V W
Query scans in memory
X Y Z
Read out Scan from memory
A
Set ASCII mode for data values
b
Set binary mode for data values
k
Sets Checksum mode
o
Oxygen (USB-LS-450) related commands
t
Temperature in hundredths of degrees C
u
Set Oxygen Calibration Coefficients
v
Provides microcode version #
x
Sets calibration coefficients
y
Sets 16-bit timer operation
?
Queries parameter values
+
Reads the plugged-in accessories
_
USB2000 Identifier
225-00000-000-11-201604 83
Page 94

8: Firmware and Advanced Communications
Command Syntax:
A{DATA WORD}
Response:
ACK or NAK
Range:
1-5000
Default value:
1
Command Syntax:
B{DATA WORD}
Response:
ACK or NAK
Range:
0-15
Default value:
0
Command Syntax:
G{DATA WORD}
Response:
ACK or NAK
Range:
0 – Compression off
!0 – Compression on
Default value:
0
Command Descriptions
A detailed description of all Flame commands follows. The {} indicates a data value which is
interpreted as either ASCII or binary (default). The default value indicates the value of the
parameter upon power up.
Add Scans
Sets the number of discrete spectra to be summed together. Since the Flame has the ability to
return 32 bit values, overflow of the raw 16 bit ADC value is not a concern.
Pixel Boxcar Width
Sets the number of pixels to be averaged together. A value of n specifies the averaging of n
pixels to the right and n pixels to the left. This routine uses 32-bit integers so that intermediate
overflow will not occur; however, the result is truncated to a 16-bit integer prior to transmission
of the data. This math is performed just prior to each pixel value being transmitted out. Values
greater than ~3 will exceed the idle time between values and slow down the overall transfer
process.
Set Data Compression
Specifies whether the data transmitted from the Flame should be compressed to speed data
transfer rates.
84 225-00000-000-11-201604
Page 95

8: Firmware and Advanced Communications
Command Syntax:
I{16 bit DATA WORD}
Response:
ACK or NAK
Range:
1 - 65000
Default value:
10
Command Syntax:
i{32 bit DATA WORD}
Response:
ACK or NAK
Range:
1000 – 65,000,000
Default value:
10,000
Command Syntax:
J{DATA WORD}
Value:
0 = Light source/strobe off—Lamp Enable low
1 = Light source/strobe on—Lamp Enable high
Response:
ACK or NAK
Default value:
0
Command Syntax:
K{DATA WORD}
Value:
0=2400 1=4800 2=9600
3=19200 4=38400 5=Not Supported 6=115,200
Response:
See below
Default value:
2
Integration Time (16 bit)
Sets the Flame’s integration time, in milliseconds, to the value specified.
Integration Time (32 bit)
Sets the Flame’s integration time, in microseconds, to the value specified.
Lamp Enable
Sets the Flame’s Lamp Enable line to the value specified
Baud Rate
Sets the Flame’s baud rate.
When changing baud rates, the following sequence must be followed:
225-00000-000-11-201604 85
Page 96

8: Firmware and Advanced Communications
If a deviation occurs at any step, the previous baud rate is utilized.
Command Syntax:
L{DATA WORD}
Value:
0= Clear spectral memory
1= Clear spectral memory
Response:
ACK or NAK
Default value:
N/A
Command Syntax:
M{DATA WORD}
Value:
0= Scans transmitted through the serial port
1= Scans stored in spectral memory and not transmitted
Response:
ACK or NAK
Default value:
0
1. Controlling program sends K with desired baud rate, communicating at the old baud rate
2. The Flame responds with ACK at old baud rate, otherwise it responds with NAK and the
process is aborted
3. Controlling program waits longer than 50 milliseconds
4. Controlling program sends K, followed by the desired baud rate.
For example, to change the baud rate from 9600 to 115,200 in ASCII mode:
At 9600 baud, send “K6<enter>”
You will receive an ACK at 9600 baud
Send “K6<enter>” at 115200. (Note that the “K” is not echoed back, but the “6” is)
You will receive two ACK characters and the prompt at 115200 baud.
4. The Flame responds with ACK at new baud rate, otherwise it responds with NAK and old
baud rate is used
Clear Memory
Clears the spectral data memory based on the valued specified. Clearing memory is immediate
since only pointer values are reinitialized.
Caution: All stored spectra are lost when the Clear memory command is executed.
Data Storage Mode
Sets the data storage mode for future spectral acquisitions.
86 225-00000-000-11-201604
Page 97

8: Firmware and Advanced Communications
Command Syntax:
P{DATA WORD}
Value:
Description
0 = all 2048 pixels
1 = every nth pixel with no averaging
2 = N/A
3 = pixel x through y every n pixels
4 = up to 10 selected pixels
between 0 and 2047 (denoted p1, p2,
… p10)
5 = up to 10 pixel ranges between 0 and
2047 (denoted r1start, r1end, r2start,
r2end, …r10start, r10end)
Example
P 0 (spaces for clarity only)
P 1<Enter>
N<Enter>
P 2 N/A
P3<Enter>
x<Enter>
y<Enter>
n<Enter>
P 4<Enter>
n<Enter>
p1<Enter>
p2<Enter>
p3<Enter> …
p10<Enter>
P5<Enter>
n<Enter>
r1start<Enter>
r1end<Enter>
r2start<Enter>
r2end<Enter>…?
Response:
ACK or NAK
Default value:
0
Since most applications only require a subset of the spectrum, this mode can greatly reduce
the amount of time required to transmit a spectrum while still providing all of the desired
data. This mode is helpful when interfacing to PLCs or other processing equipment.
Pixel Mode
Specifies which pixels are transmitted. While all pixels are acquired on every scan, this
parameter determines which pixels will be transmitted out the serial port.
Spectral Acquisition
Acquires spectra with the current set of operating parameters. When executed, this command
determines the amount of memory required. If sufficient memory does not exist, an ETX (ASCII
3) is immediately returned and no spectra are acquired. An STX (ASCII 2) is sent once the data
is acquired and stored. If the Data Storage Mode value is 0, then the data is transmitted
immediately.
225-00000-000-11-201604 87
Page 98

8: Firmware and Advanced Communications
Command Syntax:
S
Response:
If successful, STX followed by data
If unsuccessful, ETX
Command Syntax:
T{DATA WORD}
Value:
0 = Normal (Free running) Mode
1 = Software Trigger Mode
2 = External Hardware Level Trigger Mode
3 = External Synchronization Trigger Mode
4 = External Hardware Edge Trigger Mode
Response:
ACK or NAK
Default value:
0
Command Syntax:
W{DATA WORD 1}{DATA WORD 2}
Value:
Data Word 1 – FPGA Register address
Data Word 2 – FPGA Register Value
Response:
ACK or NAK
Default value:
N/A
The format of returned spectra includes a header to indicate scan number, channel number,
pixel mode, etc. The format is as follows:
WORD 0xFFFF – start of spectrum
WORD Data size flag (0Data is WORD’s, 1Data is DWORD’s)
WORD Number of Scans Accumulated
WORD Integration time in milliseconds
WORD FPGA Established Baseline value (MSW)
WORD FPGA Established Baseline value (LSW)
WORD pixel mode
WORDs if pixel mode not 0, indicates parameters passed to the Pixel Mode command (P)
(D)WORDs spectral data depending on Data size flag
WORD 0xFFFD – end of spectrum
Trigger Mode
Sets the Flame’s external trigger mode to the value specified.
Set FPGA Register Value
Sets the appropriate register within the FPGA. The list of register setting is in the USB command
set information. This command requires two data values, one to specify the register and the
next to specify the value.
88 225-00000-000-11-201604
Page 99

8: Firmware and Advanced Communications
Command Syntax:
aA
Response:
ACK or NAK
Default value
N/A
The command requires that the string “aA” be sent without any CR or LF. This is an
attempt to insure that this mode is not entered inadvertently.
A legible response to the Version number query (v command) indicates the Flame is in
the ASCII data mode.
Command Syntax:
bB
Response:
ACK or NAK
Default value
Default at power up – not changed by Q command
The command requires that the string “bB” be sent without any CR or LF. This is an
attempt to insure that this mode is not entered inadvertently.
Command Syntax:
k{DATA WORD}
Value:
0 = Do not transmit checksum value
!0 = transmit checksum value at end of scan
Response:
ACK or NAK
Default value:
0
ASCII Data Mode
Sets the mode in which data values are interpreted to be ASCII. Only unsigned integer values
(0 – 65535) are allowed in this mode and the data values are terminated with a carriage return
(ASCII 13) or linefeed (ASCII 10). In this mode the Flame “echoes” the command and data
values back out the RS-232 port.
Binary Data Mode
Sets the mode in which data values are interpreted to be binary. Only 16 bit unsigned integer
values (0 – 65535) are allowed in this mode with the MSB followed by the LSB
Checksum Mode
Specifies whether the Flame will generate and transmit a 16-bit checksum of the spectral data.
This checksum can be used to test the validity of the spectral data, and its use is recommended
when reliable data scans are required.
Version Number Query
Returns the version number of the code running on the microcontroller. A returned value of
1000 is interpreted as 1.00.0.
225-00000-000-11-201604 89
Page 100

8: Firmware and Advanced Communications
Command Syntax:
v
Response:
ACK followed by {DATA WORD}
Default value
N/A
Command Syntax:
x{DATA WORD}{ASCII STRING}
Value:
DATA WORD Index description
0 – Serial Number
1 – 0th order Wavelength Calibration Coefficient
2 – 1st order Wavelength Calibration Coefficient
3 – 2nd order Wavelength Calibration Coefficient
4 – 3rd order Wavelength Calibration Coefficient
5 – Stray light constant
6 – 0th order non-linearity correction coefficient
7 – 1st order non-linearity correction coefficient
8 – 2nd order non-linearity correction coefficient
9 – 3rd order non-linearity correction coefficient
10 – 4th order non-linearity correction coefficient
11 – 5th order non-linearity correction coefficient
12 – 6th order non-linearity correction coefficient
13 – 7th order non-linearity correction coefficient
14 – Polynomial order of non-linearity calibration
15 – Optical bench configuration: gg fff sss
gg – Grating #, fff – filter wavelength, sss – slit size
16 – Flame configuration: AWL V
A – Array coating Mfg, W – Array wavelength (VIS, UV, OFLV), L – L2 lens
installed, V – CPLD Version
17 – Reserved
18 – Reserved
19 – Reserved
Response:
ACK or NAK
Calibration Constants
Writes one of the 16 possible calibration constant to EEPROM. The calibration constant is
specified by the first DATA WORD which follows the x. The calibration constant is stored as an
ASCII string with a max length of 15 characters. The string does not check to see if it makes
sense.
90 225-00000-000-11-201604
 Loading...