

Page 1
DTS
TM
Near Infrared Spectrometers
Operator’s Manual
30 Upton Drive
Wilmington MA 01887
Telephone (978) 284-6000
Fax (978) 284-6060
www.polychromix.com
Document Number 04-91-0201-00 Rev. A
Page 2

Notices:
This product is covered by a limited warranty. A copy of the warranty is
included in this manual.
Using the equipment in a manner not specified by this manual may impair the
protection provided by the equipment.
Information in this document is subject to change without notice and does not
represent a commitment on the part of Polychromix Inc. No responsibility is
assumed by Polychromix Inc. for the use of this software, hardware or other
rights of third parties resulting from its use.
The software described in this document is furnished under a license
agreement and may be used or copied only in accordance with the terms of
the agreement. The user may make a single copy of the software for archival
purposes.
Polychromix products are covered by the following US patents: 5,757,536;
6,329,738; 6,664,406; 6,724,125. Additional patents pending.
DTSTM, DTS-1700TM, DTS-2500TM, DTS-NBTM and SpectralCodeTM are
trademarks of Polychromix, Inc. Spectralon is a registered trademark of
Labsphere, Inc.
All other brands and products mentioned are trademarks or registered
trademarks of their respective holders.
Copyright, 2005 by Polychromix, Inc. All rights reserved. No part of this
document may be reproduced in any form or by any means, electronic or
mechanical, including photocopying without written permission from
Polychromix, Inc.
Page 3

Warranty
Polychromix, Inc. (Polychromix or Seller) warrants that its products will be free from
defects in materials and workmanship under normal use and service in general
process conditions for the effective period set out below. This warranty and its
remedies are in lieu of all other warranties expressed or implied, oral or written, either
in fact or by operation of law, statutory or otherwise, including warranties of
merchantability and fitness for a particular purpose, which Polychromix specifically
disclaims. Polychromix shall have no liability for incidental or consequential damages
of any kind arising out of the sale, installation, or use of its products.
Polychromix’s obligation under this warranty shall not arise until Buyer notifies
Polychromix of the defect. Polychromix’s sole responsibility under this warranty is, at
its option, to replace or repair any defective component part of the product within the
warranty period.
Except in the case of an authorized distributor or seller, authorized in writing by Seller
to extend this warranty to the distributor’s customers, the warranty herein applies only
to Buyer as the original purchaser from Seller and may not be assigned, sold, or
otherwise transferred to a third party.
No warranty is made with respect to used, reconstructed, refurbished, or previously
owned Products, which will be so marked on the sales order and will be sold “As Is”.
BUYER’S SOLE AND EXCLUSIVE REMEDY UNDER THIS WARRANTY IS THAT
THE SELLER EITHER AGREES TO REPAIR OR REPLACE, AT SELLER’S SOLE
OPTION, ANY PART OR PARTS OF SUCH PRODUCTS THAT UNDER PROPER
AND NORMAL CONDITIONS OF USE, PROVE(S) TO BE DEFECTIVE WITHIN
THE APPLICABLE WARRANTY PERIOD. ALTERNATELY, SELLER MAY AT ANY
TIME, IN ITS SOLE DISCRETION, ELECT TO DISCHARGE ITS WARRANTY
OBLIGATION HEREUNDER BY ACCEPTING THE RETURN OF ANY DEFECTIVE
PRODUCT PURSUANT TO THE TERMS SET FORTH HEREIN AND REFUNDING
THE PURCHASE PRICE PAID BY BUYER.
Place of Service
Seller shall use its best efforts to assist buyer to resolve all warranty related issues
through Polychromix customer and technical support as soon as reasonably
practicable after notification by the Buyer of a possible defect. However, the Seller
reserves the right to require the Buyer return the Product to Seller’s production
facility, transportation charges prepaid, when necessary, to provide proper warranty
service.
Polychromix DTSTM Near-Infrared Spectrometer iii
Operator’s Manual
Document Number 04-91-0201-00 Rev A
Page 4

Warranty
Effective Date
The effective date of this warranty shall begin on the date of shipment/date of
invoice, whichever is later. Products are warranted to be free from defects in
materials and workmanship for parts and labor for 1 year with the exceptions
indicated below:
Limitations
Products are warranted to be free from defects in materials and workmanship for
parts and labor for 1 year with the following exceptions:
• Any components of the system that are in direct contact with corrosive materials
are warranted to be free from defects in materials and workmanship at time of
delivery but cannot be further warranted due to the unknown nature of the use of
the product.
• Consumable items such as lamps, cuvettes and optical filters are excluded from
this warranty. If a lamp undergoes a catastrophic failure (e.g., no light at all)
within 90 days of shipment from the factory, it will be replaced at no charge.
• Loss, damage, or defects resulting from transportation to the Buyer’s facility,
improper or inadequate maintenance by Buyer, software or interfaces supplied
by the buyer, unauthorized modification or operation outside the environmental
specifications for the instrument, use by unauthorized or untrained personnel or
improper site maintenance or preparation.
• The sole and exclusive warranty applicable to software and firmware products
provided by Seller for use with a processor internal or external to the Product will
be as follows: Seller warrants that such software and firmware will conform to
Seller’s program manuals or other publicly available documentation made
available by Seller current at the time of shipment to Buyer when properly
installed on that processor, provided however that Seller does not warrant the
operation of the processor or software or firmware will be uninterrupted or errorfree.
• Products that have been altered or repaired by individuals other than
Polychromix personnel or its duly authorized representatives, unless the
alteration or repair has been performed by an authorized factory trained service
technician in accordance with written procedures supplied by Polychromix.
• Products that have been subject to misuse, neglect, accident, or improper
installation.
The warranty herein applies only to Products within the country of original delivery.
Products transferred outside the country of original delivery, either by the Seller at the
direction of the Buyer or by Buyer’s actions subsequent to delivery, may be subject to
additional charges prior to warranty repair or replacement of such Products based on
the actual location of such Products and Seller’s warranty and/or service surcharges
for such location(s).
The warranty period for data processing equipment, including data storage devices,
processors, printers, terminals, communication interfaces, tape drives, and/or all
similar devices, is in all cases limited to ninety (90) days from the date of shipment to
Buyer.
Repaired products are warranted for 90 days with the above exceptions.
iv Polychromix DTSTM Near-Infrared Spectrometer
Operator’s Manual
Document Number 04-91-0201-00 Rev A
Page 5

License Agreement
IMPORTANT - READ THE FOLLOWING TERMS AND CONDITIONS BEFORE USING THIS
SOFTWARE. OPERATING THE SOFTWARE ON THE EQUIPMENT INDICATES YOUR ACCEPTANCE
OF THESE TERMS AND CONDITIONS.
Polychromix, (hereinafter “Polychromix”) provides this Licensed Program, as defined below, to you, the
end user (hereinafter referred to as “Licensee”), and you, Licensee, accept the Licensed Program on the
following terms and conditions:
1) DEFINITIONS. As used herein, “Licensed Program” means the computer software and
accompanying documentation provided with the System; and “System” means a spectrometer and
accompanying equipment supplied by Polychromix to you, Licensee.
2) GRANT OF LICENSE. Polychromix grants to you, Licensee, a nonexclusive, non-transferable
LICENSE to use a copy of the Licensed Program with a single spectrometer in accordance with this
license agreement.
3) OWNERSHIP OF THE LICENSED PROGRAM. Polychromix owns and will retain all title, copyright,
trademark and other proprietary rights in and to the Licensed Program. This LICENSE is not a sale of
the Licensed Program or any copy of it. You, the Licensee, obtain only such rights as are provided in
this Agreement. You understand and agree as follows: You may use the Licensed Program on a
single system. You may make one backup copy of the Licensed Program for archival purposes as
permitted by the United States Copyright Act. You must reproduce and include the copyright notice
with the backup copy. You may not reverse compile, reverse assemble, reverse engineer, modify,
incorporate it in whole or in part in any other product or create derivative works based on all or any
part of the Licensed Program. You may not remove any copyright, trademark, proprietary rights,
disclaimer or warning notice included on or embedded in any part of the Licensed Program. You may
not sell, license, sublicense, assign, rent, or otherwise transfer the Licensed Program without the
written permission of Polychromix. Polychromix will not withhold permission to transfer the LICENSE
as long as you permanently transfer the Licensed Program (including all components and archival
copies, if any) in conjunction with the System with which it was acquired, and the person who wishes
to obtain the System and the LICENSE agrees to the terms and conditions of this Agreement. You
may not use the Licensed Program in any country other than that in which it was obtained or
otherwise export the Licensed Program.
4) TERM. The term of this LICENSE will continue until Polychromix provides written consent to
assignment or transfer of this LICENSE or until Polychromix terminates this LICENSE as provided
herein. Polychromix may terminate this LICENSE by giving the buyer written notice specifying any
failure or default in the performance of any provisions of this LICENSE if the buyer fails to cure said
failure or default within 30 days after such notice. Upon termination of this License, you will promptly
return to Polychromix or destroy all copies of the Licensed Program.
5) LICENSEE’S RESPONSIBILITIES FOR SELECTION AND USE OF THE LICENSED PROGRAM
AND THE SYSTEM . The Spectrometer and the Licensed Program when used together is a tool that
Polychromix hopes you will find useful in your efforts to test and analyze chemicals. HOWEVER,
POLYCHROMIX DOES NOT WARRANT THAT THE SYSTEM AND/OR THE LICENSED PROGRAM
IS SUITABLE FOR ANY SPECIFIC TASK OR IS ACCURATE TO ANY SPECIFIC DEGREE. You
are responsible for the supervision, management and control of the use of the System and the
Licensed Program, and output thereof, including, but not limited to: (a) selection of the System and
the Licensed Program to achieve your intended results; (b) determining the appropriate uses of the
System and the Licensed Program in your business; (c) establishing adequate independent
procedures for testing the accuracy of the System and the Licensed Program; and (d) establishing
adequate backup to obtain accurate data and prevent the loss of data in the event of a malfunction of
the System or the Licensed Program.
Polychromix DTSTM Near-Infrared Spectrometer v
Operator’s Manual
Document Number 04-91-0201-00 Rev A
Page 6

License Agreement
6) LIMITED WARRANTY. Subject to the other provisions in this Agreement, Polychromix warrants that,
for a period of 1 year from receipt by you, the Licensed Program will conform in all material respects
to the user documentation furnished to the buyer. Polychromix’s sole responsibility under this
warranty will be, at its option, (1) to use reasonable efforts to correct documented errors in said
Licensed Program that are reported to it within the foregoing warranty period or (2) to refund the fees
paid for the LICENSE to the Licensed Program if not sold with the spectrometer as a package.
Polychromix does not warrant that the Licensed Program will be error free, nor that all program errors
will be corrected. All requests for warranty assistance shall be directed to Customer Service,
Polychromix, Inc, 30 Upton Dr., Wilmington MA 01887 USA. Asserted errors must be documented by
the buyer to Polychromix, detailing the error, describing how to recreate the error, and including, if
available, sample output.
EXCEPTIONS. Polychromix’s warranty does not apply insofar as: (a) any Licensed Program is
subjected to misuse, neglect, accident or exposure to environmental conditions beyond those
specified by the documentation; (b) claims result from acts or omissions caused by persons other
than Polychromix or from products, material or software not provided by Polychromix; or (c) you use a
version of the Licensed Program that does not include all required updates provided by Polychromix.
NO OTHER WARRANTIES. THE EXPRESSED WARRANTY SET FORTH IN THIS ARTICLE 6 IS
THE ONLY WARRANTY GIVEN BY POLYCHROMIX WITH RESPECT TO THE LICENSED
PROGRAM, EITHER BY ITSELF OR IN CONJUNCTION WITH THE SYSTEM; POLYCHROMIX
MAKES NO OTHER WARRANTIES, EXPRESSED, IMPLIED OR ARISING BY CUSTOM OR
TRADE USAGE, AND SPECIFICALLY DISCLAIMS THE IMPLIED WARRANTIES OF
NONINFRINGEMENT, MERCHANTABILITY OR OF FITNESS FOR ANY PARTICULAR PURPOSE.
SAID EXPRESS WARRANTY SHALL NOT BE ENLARGED OR OTHERWISE AFFECTED BY
POLYCHROMIX’S RENDERING OF TECHNICAL OR OTHER ADVICE OR SERVICE IN
CONNECTION WITH THE SYSTEM OR THE LICENSED PROGRAM. POLYCHROMIX SHALL
NOT BE HELD RESPONSIBLE FOR THE PERFORMANCE OF OR OUTPUT OBTAINED FROM
THE LICENSED PROGRAM AND/OR THE SYSTEM NOR FOR ANY LIABILITY TO ANY PARTY
ARISING OUT OF USE THEREOF OR USE OF ITEMS DESIGNED WITH THE SYSTEM OR THE
LICENSED PROGRAM.
7) LIMITATIONS ON REMEDIES. Polychromix’s liability in contract, tort or otherwise arising out of or in
connection with use of the Licensed Program and/or the System, any output thereof, and/or this
Agreement shall not exceed the amounts that Licensee has paid Polychromix or its authorized
distributor hereunder. An essential purpose of the limitation on remedies provided in this paragraph
is the allocation of risks between Licensee and Polychromix. IN NO EVENT SHALL POLYCHROMIX
BE LIABLE FOR SPECIAL, INCIDENTAL, TORT, CONSEQUENTIAL OR ANALOGOUS
DAMAGES (INCLUDING, WITHOUT LIMITATION, ANY DAMAGES RESULTING FROM LOSS OF
USE, LOSS OF DATA, LOSS OF PROFITS, LOSS OF GOODWILL, OR LOSS OF BUSINESS)
ARISING OUT OF OR IN CONNECTION WITH THE PERFORMANCE OF THE LICENSED
PROGRAM AND/OR THE PERFORMANCE OF THE SYSTEM AND/OR POLYCHROMIX’S
PERFORMANCE OF SERVICES, EVEN IF POLYCHROMIX HAS BEEN ADVISED OF THE
POSSIBILITY OF SUCH DAMAGES.
8) U.S. GOVERNMENT RESTRICTED RIGHTS. If the buyer is a government agency, you
acknowledge that the Licensed Program was developed at private expense and that the computer
software component is provided to you subject to RESTRICTED RIGHTS. Notwithstanding any other
lease or license agreement that may pertain to, or accompany the delivery of, this restricted computer
software, the rights of the government regarding its use, duplication, reproduction or disclosure by the
Government is subject to the restrictions set forth in subparagraph (c)(1)(ii) of the rights in Technical
Data and Computer Software clause of DFARS 252.227-7013, and subparagraphs (c)(1) and (2) of
the Commercial Computer Software -- Restricted Rights clause at FAR 52.227-19.
Contractor/manufacturer is Polychromix 30 Upton Dr. Wilmington MA 01887.
9) GENERAL. The terms of this LICENSE shall be construed in accordance with the substantive laws
of the Commonwealth of Massachusetts. Without limiting the generality of the foregoing, this
Agreement and such relations shall not be governed by the United Nations Convention on Contracts
for the International Sale of Goods even if such Convention would otherwise be applicable in some
respect to this license of software. The English language text of this Agreement shall be the
authorized text for all purposes.
If you have any questions about this Agreement, you may contact Customer Service, Polychromix at (978)
284-6000.
YOU ACKNOWLEDGE THAT YOU HAVE READ THIS LICENSE AGREEMENT, UNDERSTAND IT AND
AGREE TO BE BOUND BY ITS TERMS AND CONDITIONS. YOU FURTHER AGREE THAT IT IS THE
COMPLETE AND EXCLUSIVE STATEMENT OF THE LICENSE AGREEMENT BETWEEN YOU AND
POLYCHROMIX WHICH SUPERSEDES ANY PROPOSAL, OR PRIOR AGREEMENT, ORAL OR
WRITTEN, AND ANY OTHER COMMUNICATIONS BETWEEN YOU AND POLYCHROMIX RELATING
TO THE SUBJECT MATTER OF THIS LICENSE AGREEMENT.
Copyright © Polychromix, Inc. 2005.
vi Polychromix DTSTM Near-Infrared Spectrometer
Operator’s Manual
Document Number 04-91-0201-00 Rev A
Page 7

Table of Contents
Warranty......................................................................................................iii
License Agreement......................................................................................v
Table of Contents.......................................................................................vii
1 Introduction.........................................................................................1-1
1.1 Overview......................................................................................1-1
1.2 Description of the Spectrometer...................................................1-3
1.3 Hardware connections..................................................................1-3
1.4 Overview of the Manual................................................................1-3
2 Installation...........................................................................................2-1
2.1 Overview......................................................................................2-1
2.2 Unpacking the Spectrometer........................................................2-2
2.3 Environmental Considerations......................................................2-2
2.4 Interfacing the Spectrometer to the Sample Holder and the Source2-3
2.5 Connecting the Spectrometer to the Computer.............................2-5
2.5.1 For Computers with the Windows Me Operating System..2-5
2.5.2 For Computers with the Windows 2000 Operating System 2-6
2.5.3 For Computers with the Windows XP Operating System..2-7
2.6 Installing the Polychromix DTS SpectralCode Software................2-8
2.6.1 For Computers with the Windows Me/2000/XP Operating
Systems.......................................................................................2-8
3 Quick Start...........................................................................................3-1
4 The SpectralCode Application Program............................................4-1
4.1 Introduction...................................................................................4-1
4.2 General Layout of the SpectralCode Window...............................4-2
4.3 The Menu Bar...............................................................................4-2
4.3.1 The File Menu...................................................................4-2
4.3.2 The Settings Menu............................................................4-3
4.3.3 The Data Collection Menu................................................4-4
Polychromix DTSTM Near-Infrared Spectrometer vii
Operator’s Manual
Document Number 04-91-0201-00 Rev A
Page 8

Table of Contents
4.3.4 Spectrum Manipulation.....................................................4-5
4.3.5 Help..................................................................................4-5
4.4 Tool Bars......................................................................................4-5
4.4.1 Upper Tool Bar.................................................................4-6
4.4.2 Lower Tool Bar.................................................................4-7
4.5 The Spectral Region.....................................................................4-8
4.6 The PlotLegend Dialog Box..........................................................4-8
4.7 MultiScan...................................................................................4-11
5 Collecting Spectra and Manipulating Data........................................5-1
5.1 Overview......................................................................................5-1
5.2 Collecting Spectra........................................................................5-1
5.2.1 Collecting the Background Spectrum................................5-1
5.2.2 Collecting a Transmittance Spectrum...............................5-3
5.3 Performing Mathematical Manipulations on the Spectra...............5-6
5.4 Saving and Retrieving Spectra .....................................................5-7
5.5 The Light Meter............................................................................5-9
6 Measuring the Spectrum of a Sample................................................6-1
6.1 Overview......................................................................................6-1
6.2 Using a Cuvette and Sample Holder.............................................6-2
6.2.1 The Cuvette......................................................................6-2
6.2.2 The Sample......................................................................6-2
6.2.3 Collecting a Spectrum.......................................................6-3
6.2.4 Standards.........................................................................6-3
6.2.5 Sample Related Spectra Issues........................................6-3
6.2.6 Quantitative Measurements..............................................6-4
6.3 Using an Integrating Sphere.........................................................6-5
6.3.1 The Sample......................................................................6-5
6.3.2 Collecting a Reflectance Spectrum...................................6-5
6.3.3 Standards.........................................................................6-5
6.4 Spectrum Averaging.....................................................................6-6
7 Maintenance and Troubleshooting....................................................7-1
7.1 Overview......................................................................................7-1
7.2 Maintenance.................................................................................7-1
7.3 Troubleshooting............................................................................7-2
7.3.1 Introduction.......................................................................7-2
7.3.2 If the Spectrum is Noisy....................................................7-3
7.3.3 There is no Signal.............................................................7-3
7.3.4 The Signal Intensity is not Constant..................................7-4
7.3.5 The Wavelength for a Peak has Shifted............................7-4
Appendix A Specifications .................................................................................. A1
Index............................................................................................................I1
viii Polychromix DTSTM Near-Infrared Spectrometer
Operator’s Manual
Document Number 04-91-0201-00 Rev A
Page 9
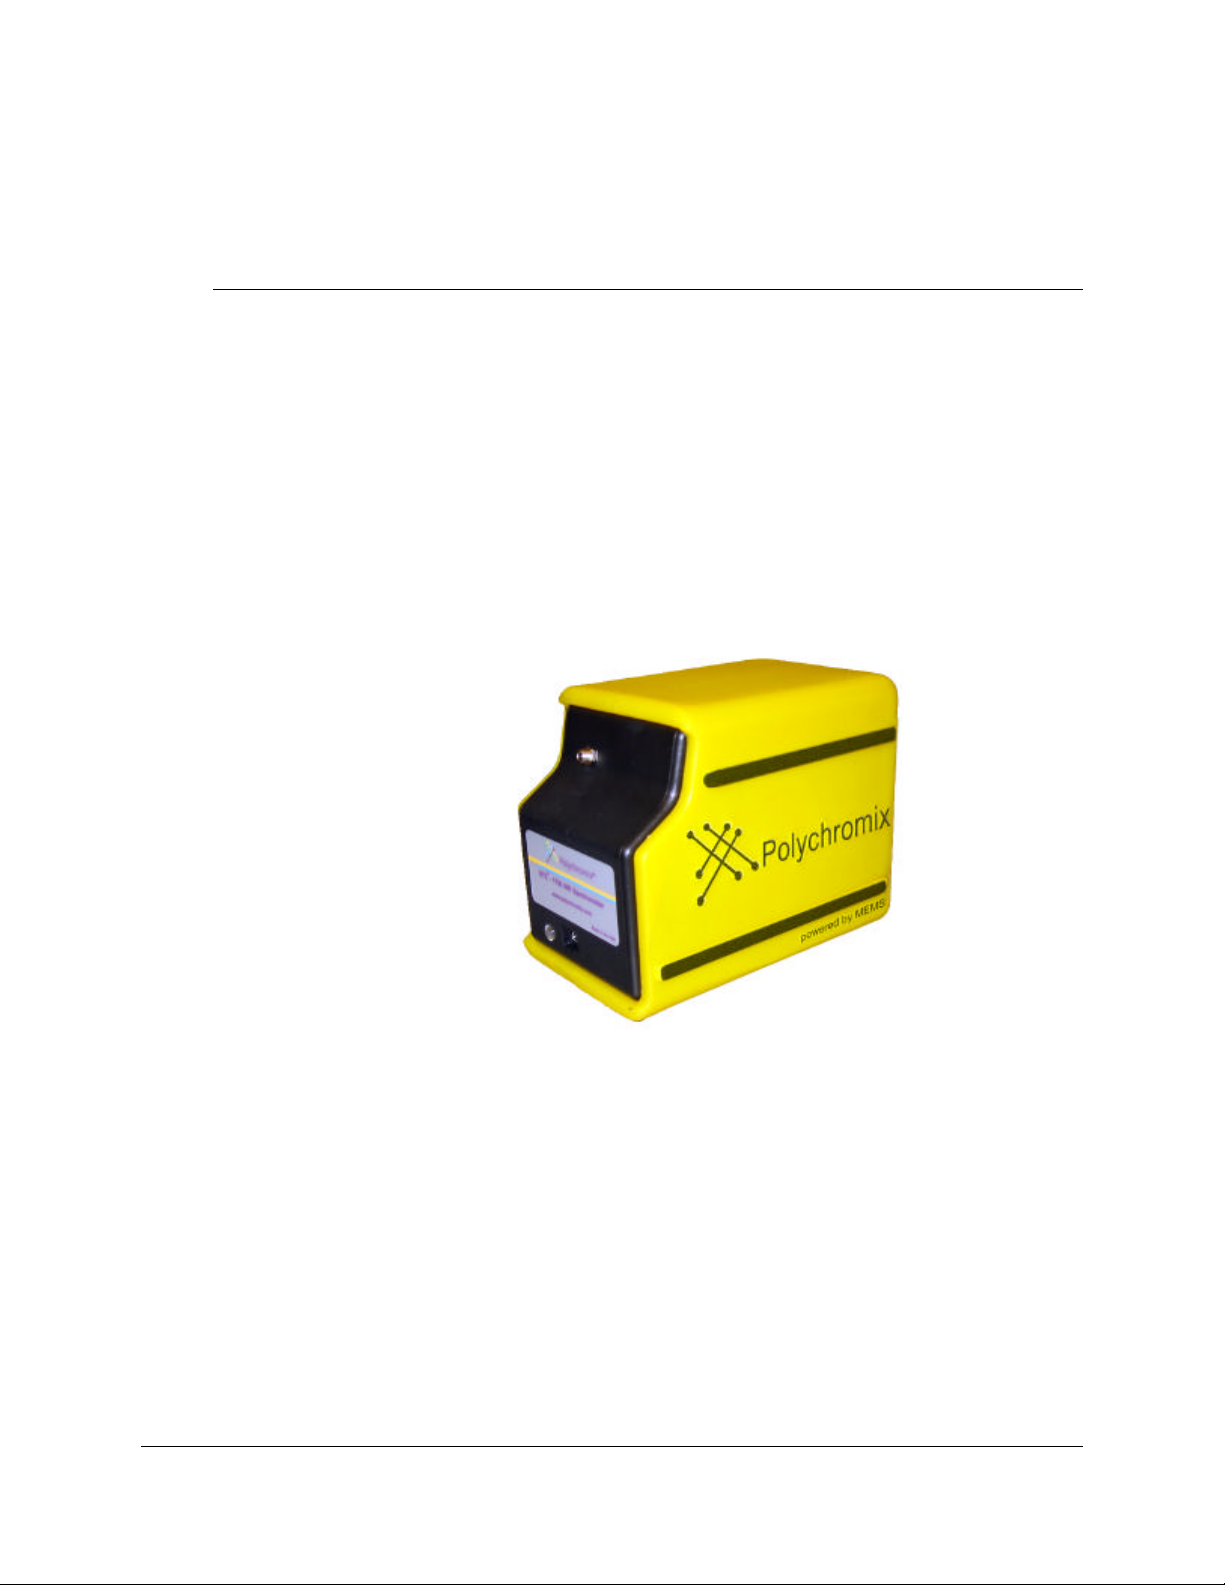
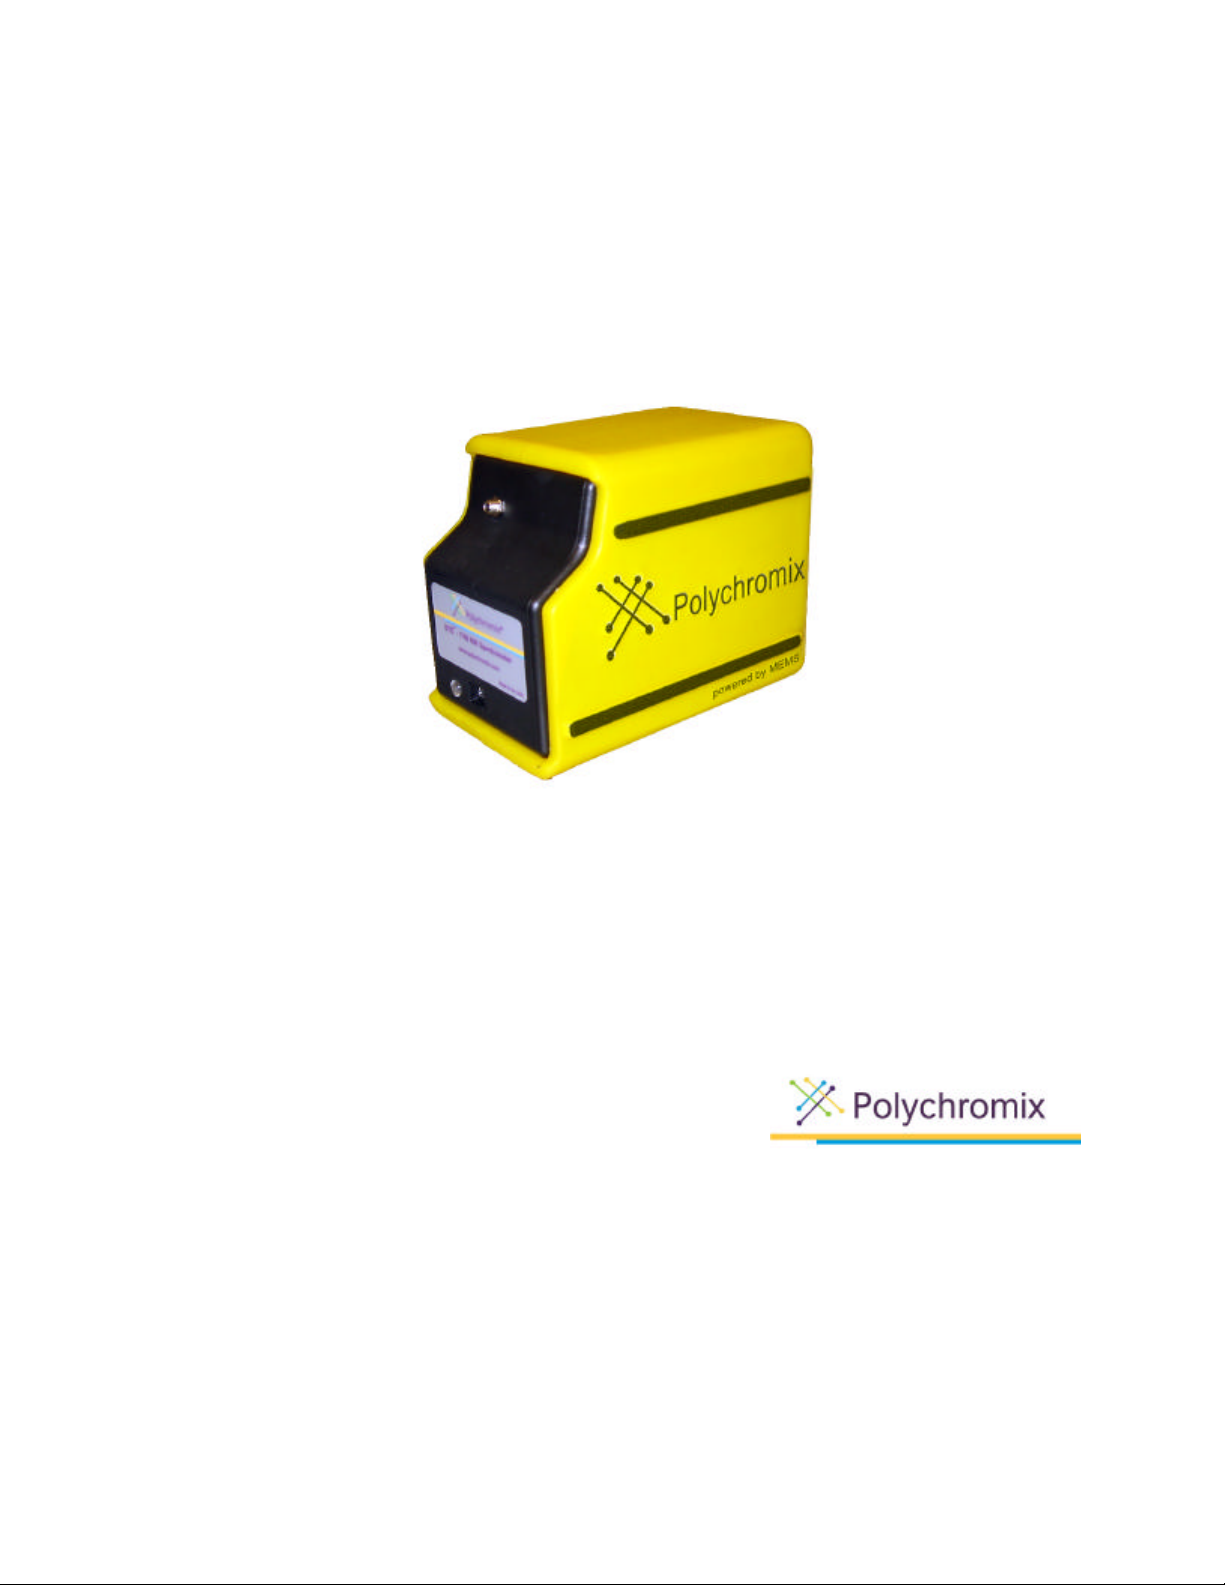
1 Introduction
1.1 Overview
The Polychromix DTS
innovative, self- contained instrument that is incorporated into a system that
includes a VIS-NIR light source and a cuvette holder or an integrating sphere.
Figure 1-1: The Polychromix DTS
TM
Near-Infrared Spectrometer (Figure 1-1) is an
TM
Near-Infrared Spectrometer
Polychromix DTSTM Near-Infrared Spectrometer 1-1
Operator’s Manual
Document Number 04-91-0201-00 Rev A
Page 10

Chapter 1
Three versions of the spectrometer are available:
• DTS™-1700 which covers the 900 - 1700 nm region
• DTS™-2500 which covers the 1700 - 2500 nm region
• DTS™-NB which covers the 1100 - 1300 nm region
Operation of the three systems is identical, except for the wavelength range
that each spectrometer covers.
The spectrometer provides the user with a number of important benefits
including:
• Rapid data acquisition - A spectrum can be acquired in 1 second.
• A minimum power requirement - The spectrometer is driven by a standard
USB port of a personal computer.
• Rugged design - There are no moving parts.
• The performance is unaffected by stray light
• The system is compact and lightweight.
The spectrometer is typically employed as a part of a system that includes a
source and a sample holder (a cuvette holder or a reflectance sphere) as
shown in Figure 1-2. As an example, the spectrometer can be used with the
Ocean Optics HL-2000 Tungsten Halogen Light Source and the Ocean
Optics CUV-UV Holder for 1-cm cuvettes or the Ocean Optics ISP-REF
Integrating Sphere. The source and cuvette holder or reflectance sphere are
acquired separately (e.g. Ocean Optics, Inc., Dunedin FL,
www.oceanoptics.com). As an alternative, the spectrometer can be directly
connected to the source to obtain the spectrum provided by the source).
SOURCE
Figure 1-2: Typical Optical System
SAMPLE
SPECTROMETER
The Polychromix DTS Near-Infrared Spectrometer can be used in a broad
range of applications including
• Portable Field Measurements
• Laboratory Analyses
• Industrial Process Control
1-2 Polychromix DTSTM Near-Infrared Spectrometer
Operator’s Manual
Document Number 04-91-0201-00 Rev A
Page 11

1.2 Description of the Spectrometer
The mode of operation of the detector involves the dispersion of the spectrum
using a standard fixed grating. Each spectral component from the fixed
grating is then imaged onto a pixel region of a microelectromechanical
(MEMS) micro-diffraction grating which is programmed to selectively filter the
light that is directed to a single InGaAs detector. Digital transform encoding is
employed; in this system, a series of 100 pixels are actuated in a sequence of
100 filter masks. Each mask consists of a combination of 50 pixels that are
“on” and 50 pixels that are “off”, thereby providing a 50 % optical throughput,
and sharing an advantage that is employed in Fourier transform infra-red
spectroscopy.
1.3 Hardware connections
The Polychromix DTS™ has two input connectors: (1) a FSMA receptacle
which accepts a fiber optic cable with a standard SMA-905 connector and (2)
a USB mini-B port which connects to a USB host via a standard USB cable.
Introduction
1.4 Overview of the Manual
This manual consists of the following information:
• Chapter 2 Installation – Describes the receipt of the instrument,
interfacing it to other components of the system and environmental
considerations.
• Chapter 3 Quick Start – Presents a sample experiment to demonstrate
that the spectrometer is operating properly.
• Chapter 4 The SpectralCode Application Program – Includes a
detailed description of the operating program.
• Chapter 5 Collecting Spectra and Manipulating Data – Describes how
the SpectralCodeTM operating program is employed to collect and process
spectroscopic data.
• Chapter 6 Measuring the Spectrum of a Sample – Discusses how data
is collected using the spectrometer and discusses sample handling.
• Chapter 7 Maintenance and Troubleshooting – Presents information
about routine operations to optimize the utility of the spectrometer.
An appendix that lists the spectrometer specifications is included.
Polychromix DTSTM Near-Infrared Spectrometer 1-3
Operator’s Manual
Document Number 04-91-0201-00 Rev A
Page 12

Page 13

2 Installation
2.1 Overview
This chapter describes the steps required to install the Polychromix DTSTM
NIR Spectrometer in your laboratory and verify that the system is operating in
acceptable manner. It includes the following information:
• Unpacking the spectrometer (Section 2.2)
• Environmental considerations (Section 2.3)
• Connecting the system to other components in the system (Section 2.4)
• Loading the software (Section 2.5 and 2.6)
Please refer to the documentation provided with other components of the
system including the light source and sample holder for additional
information.
Polychromix DTSTM Near-Infrared Spectrometer 2-1
Operator’s Manual
Document Number 04-91-0201-00 Rev A
Page 14

Chapter 2
2.2 Unpacking the Spectrometer
The Polychromix DTS spectrometer is packed in a single carton. When you
receive the shipment, examine the carton for external damage. If damage is
observed, make certain that the damage is reported on the shipping receipt
and contact Polychromix for further information.
The following items are shipped with the spectrometer:
a) Spectrometer Module
b) USB Interface Cable
c) CD Containing the Operating Program and Manual
If any parts are missing, contact the shipper and Polychromix for further
information.
NOTE: If there appears to be any damage to the spectrometer, do not
continue the installation. Instead, contact Polychromix for more
information.
2.3 Environmental Considerations
The spectrometer should be placed on a sturdy table or laboratory bench in a
facility where the temperature is between 5oC and 40oC (41oF and 104oF),
and the relative humidity is between 0 and 80%.
NOTE: Do not place the spectrometer near a heating or cooling source
(e.g. avoid placing it near a window or an air conditioning duct).
While the system is not subject to stray light, we recommend that the sample
should not be placed in the general vicinity of a strong light, or a location in
which the light intensity can change dramatically. General laboratory lighting
conditions are acceptable.
2-2 Polychromix DTSTM Near-Infrared Spectrometer
Operator’s Manual
Document Number 04-91-0201-00 Rev A
Page 15
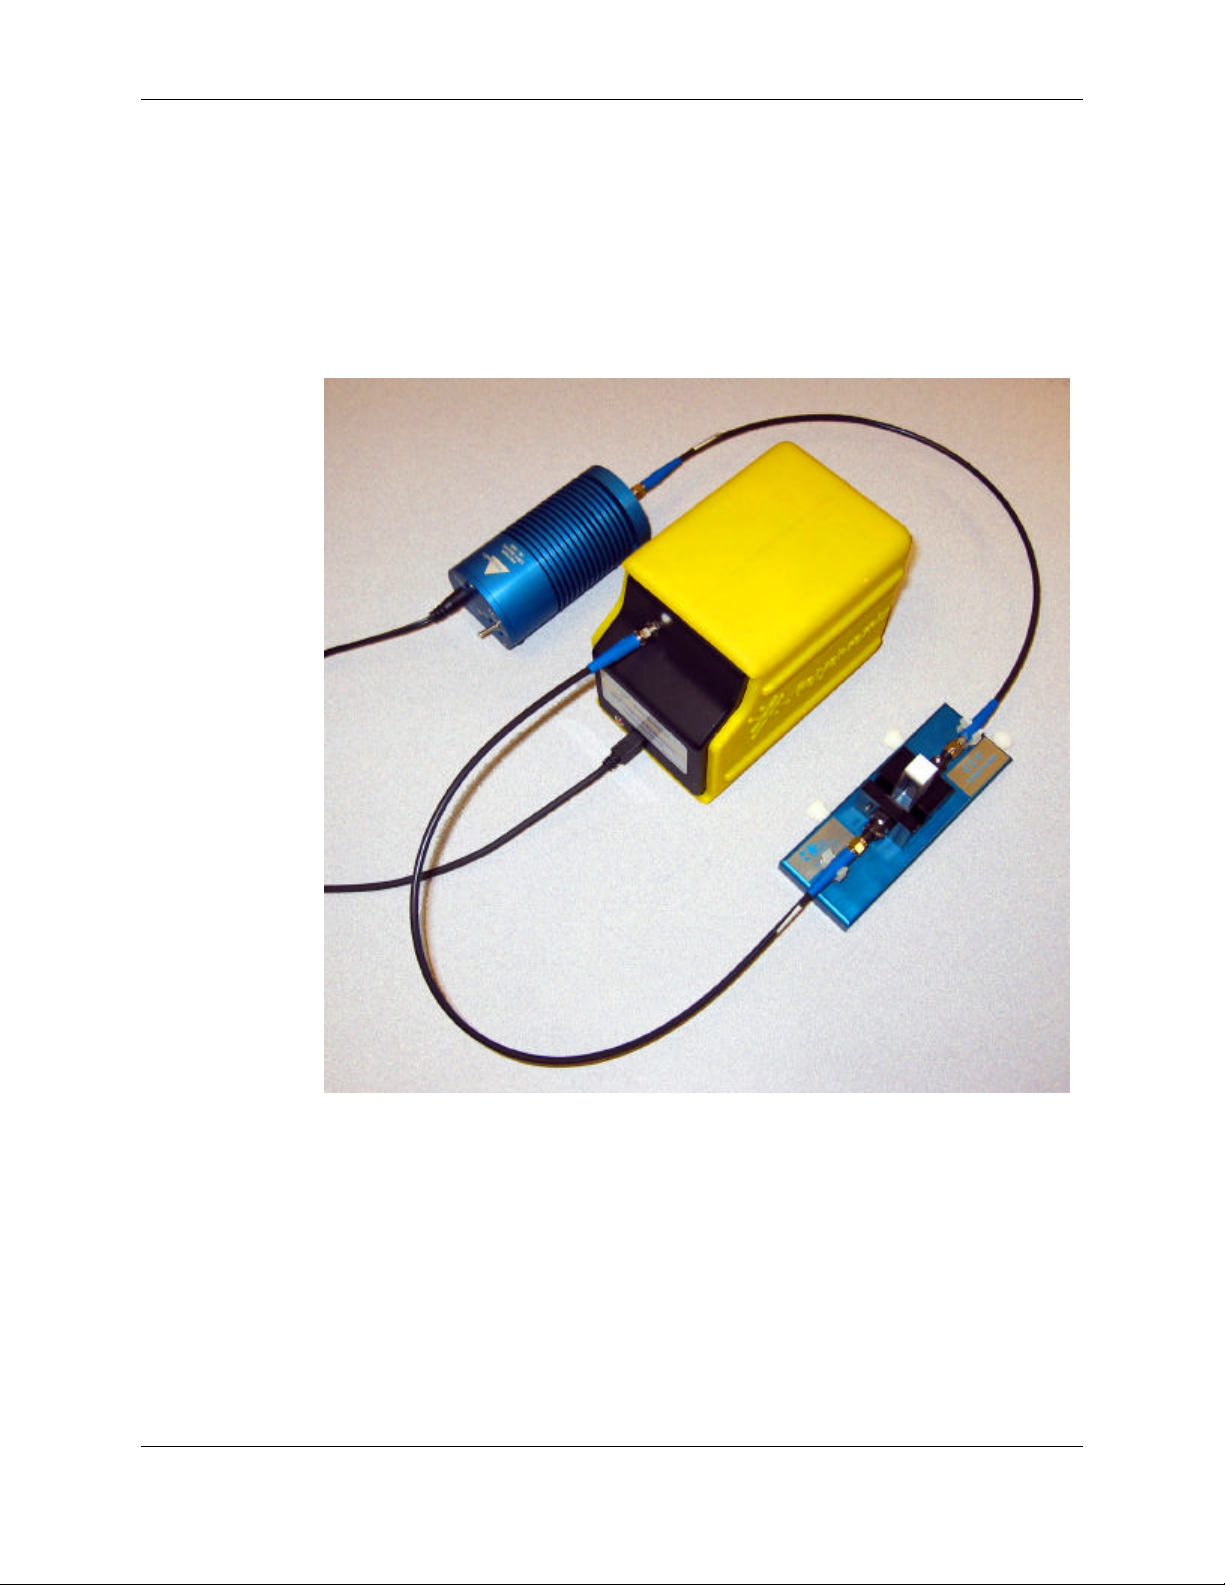
2.4 Interfacing the Spectrometer to the Sample
Holder and the Source
The spectrometer is typically used with the Ocean Optics HL-2000 Tungsten
Halogen Light Source and the Ocean Optics CUV-UV Holder for 1-cm2
cuvettes or the Ocean Optics ISP-REF Integrating Sphere as shown in Figure
2-1 and Figure 2-2.
Installation
Figure 2-1: Polychromix DTS Spectrometer with Source and Cuvette Holder
Polychromix DTSTM Near-Infrared Spectrometer 2-3
Operator’s Manual
Document Number 04-91-0201-00 Rev A
Page 16
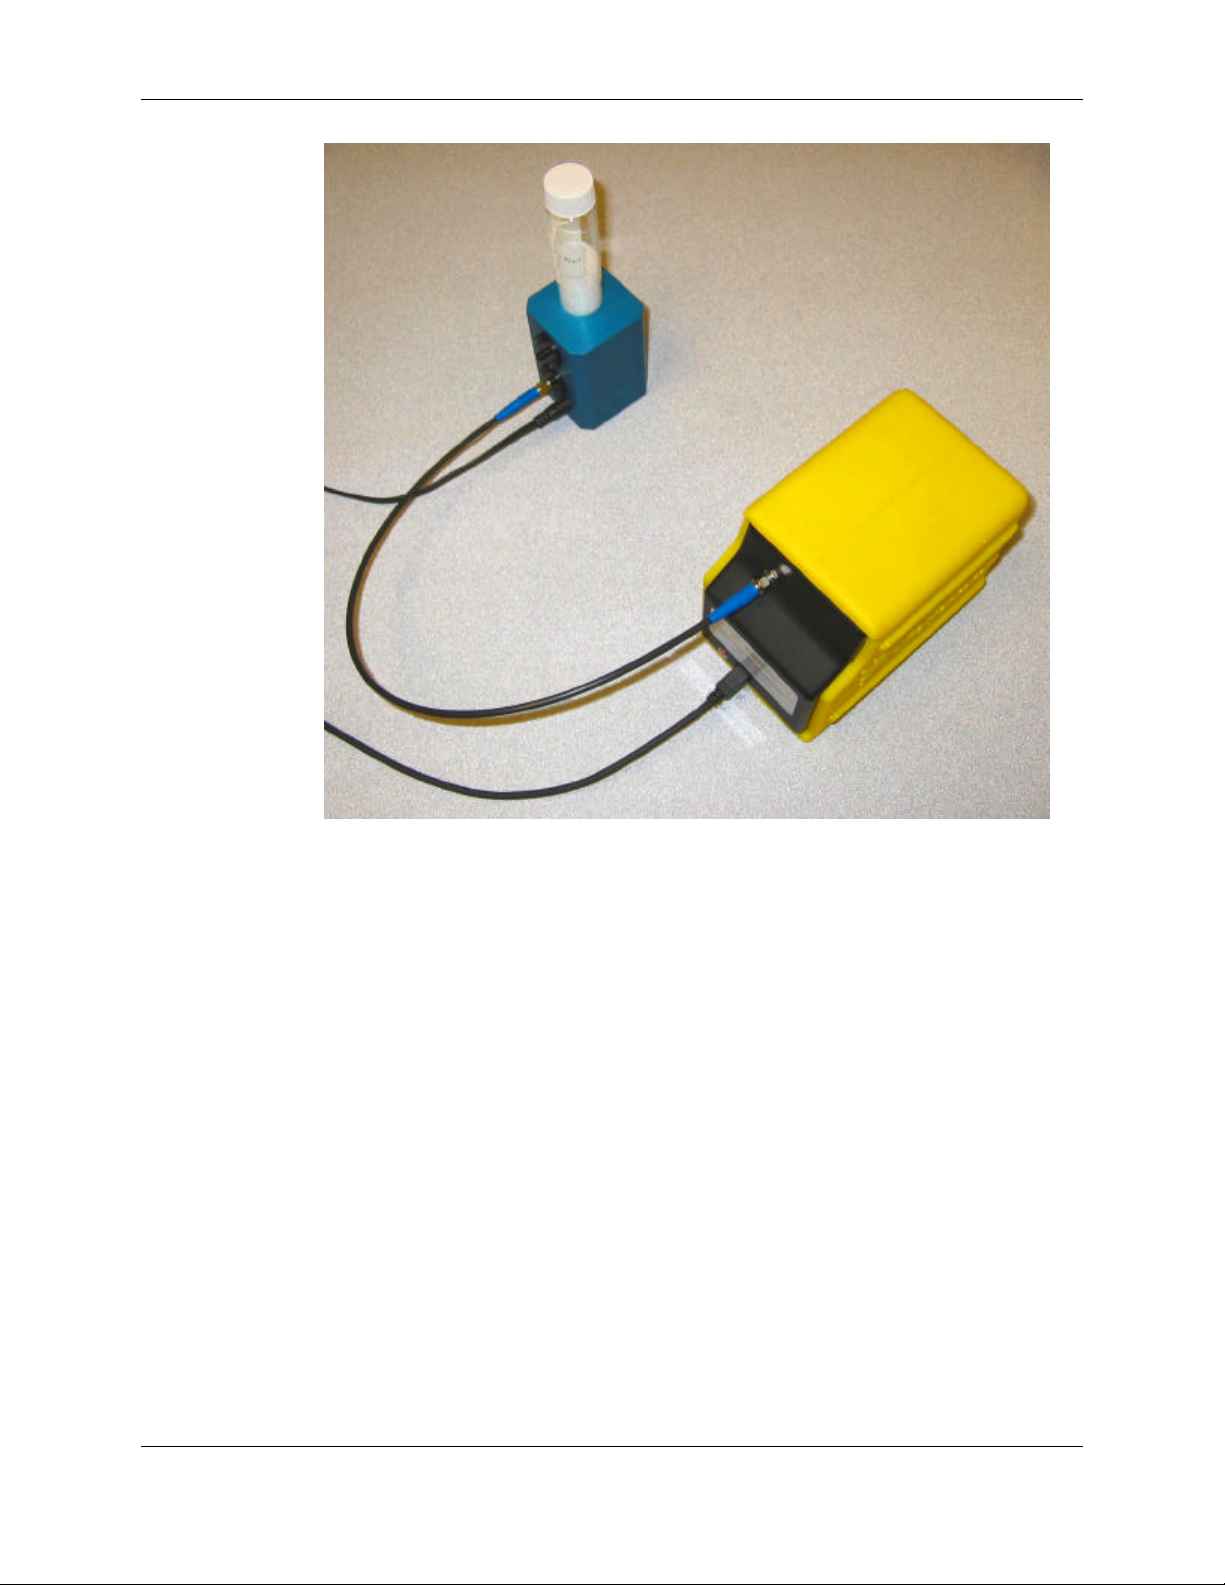
Chapter 2
Figure 2-2: Polychromix DTS NIR Spectrometer with Ocean Optics Integrating
Sphere
For additional information about the source, the cuvette holder and the
integrating sphere, refer to the documentation provided with these
components. As an alternative, the spectrometer can be directly connected to
the source to obtain the spectrum provided by the source.
The sample holder and spectrometer are interfaced by a 600 µm core low OH
fiber optic cable with a standard SMA-905 connector that is provided with the
system. When the system is positioned on the table, take care that the cables
are not bent with a small radius; we suggest that all bends have a radius of at
least 10 cm. Once the system is laid out, tape the fiber optic cables to the
laboratory bench so that they are firmly fixed in position to avoid variations in
intensity.
2-4 Polychromix DTSTM Near-Infrared Spectrometer
Operator’s Manual
Document Number 04-91-0201-00 Rev A
Page 17
Installation
2.5 Connecting the Spectrometer to the Computer
NOTE: Administrative access is required to install the spectrometer
hardware and Polychromix SpectralCode Software.
Figure 2-3: Security Dialog Box
Connect the USB cable that is supplied with the spectrometer to an available
USB port on the computer. The operating system should detect new
hardware.
NOTE: Two hardware devices must be installed for your spectrometer
to function properly: USB -> Serial and USB Serial Port.
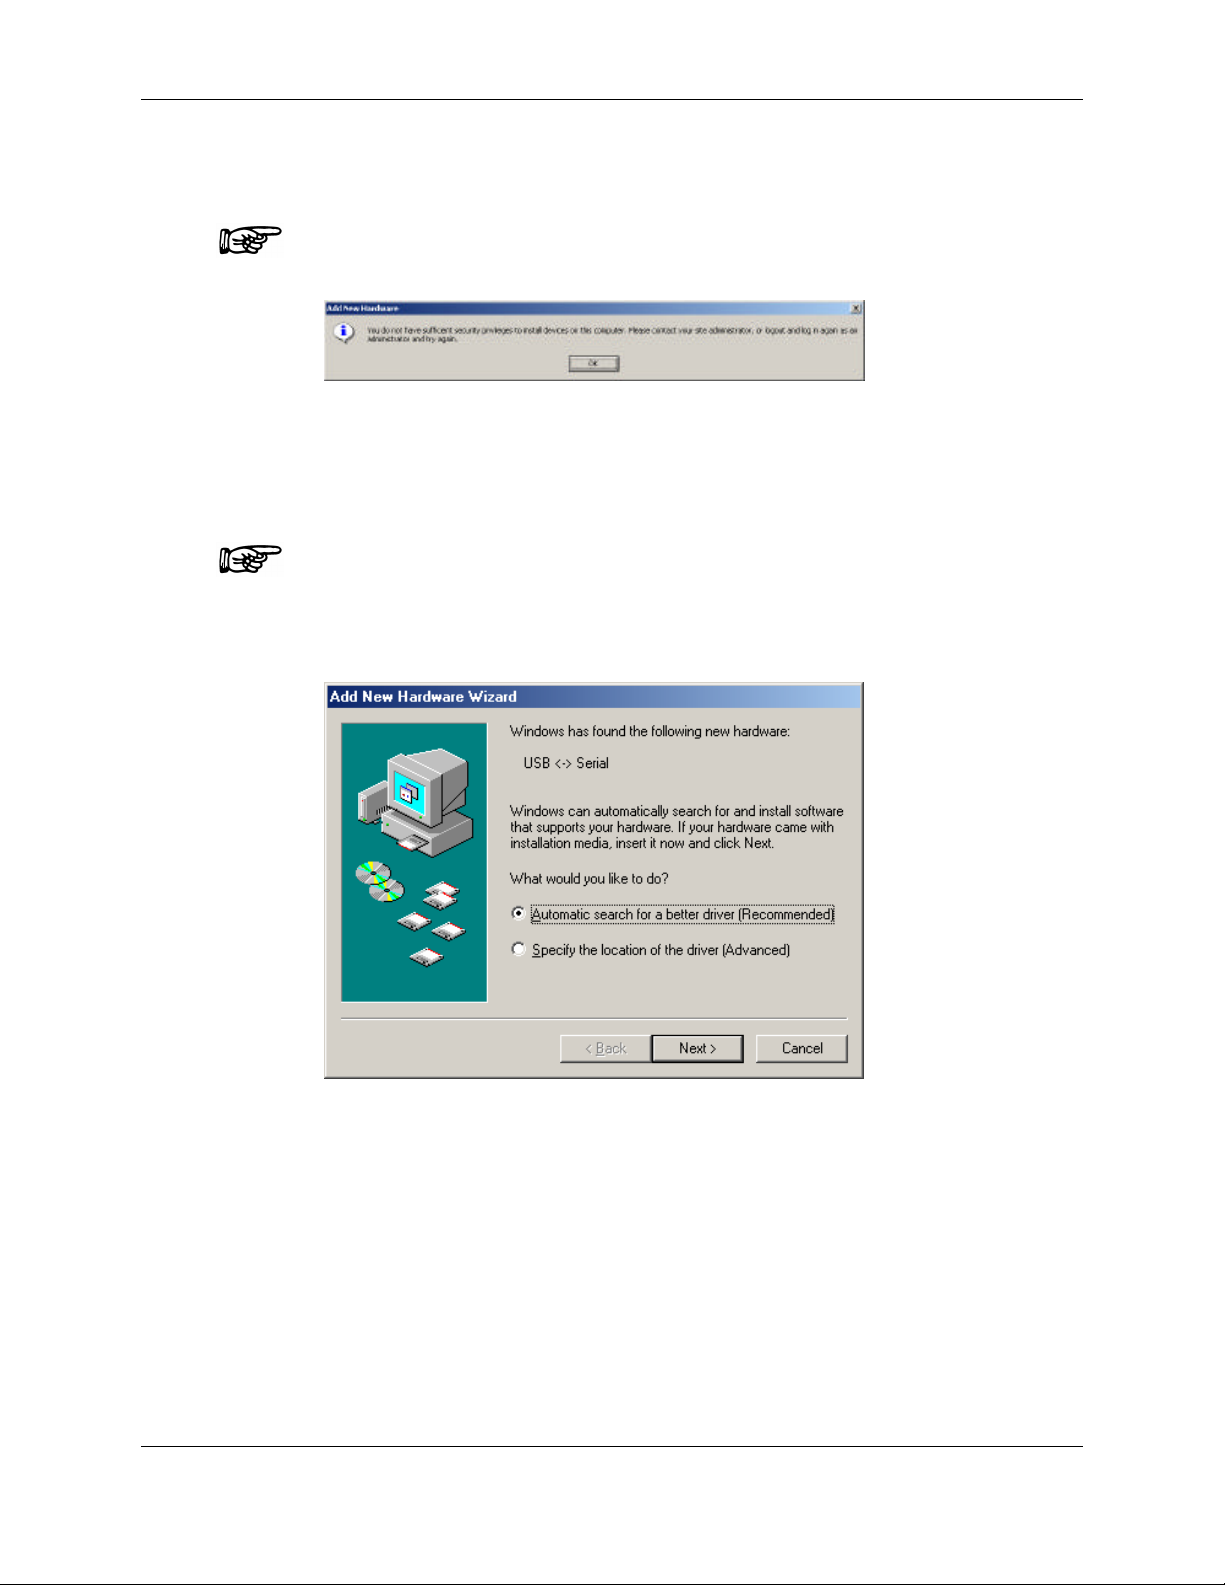
2.5.1 For Computers with the Windows Me Operating System
Figure 2-4: Add New Hardware Dialog Box
a) Add New Hardware Wizard dialog box will be presented.
b) Insert the Polychromix distribution CD.
c) Select Automatic search and press Next to search for a recommended
driver.
d) Select Finish to complete the installation.
e) Repeat the above procedure for the USB Serial Port.
Polychromix DTSTM Near-Infrared Spectrometer 2-5
Operator’s Manual
Document Number 04-91-0201-00 Rev A
Page 18
Chapter 2
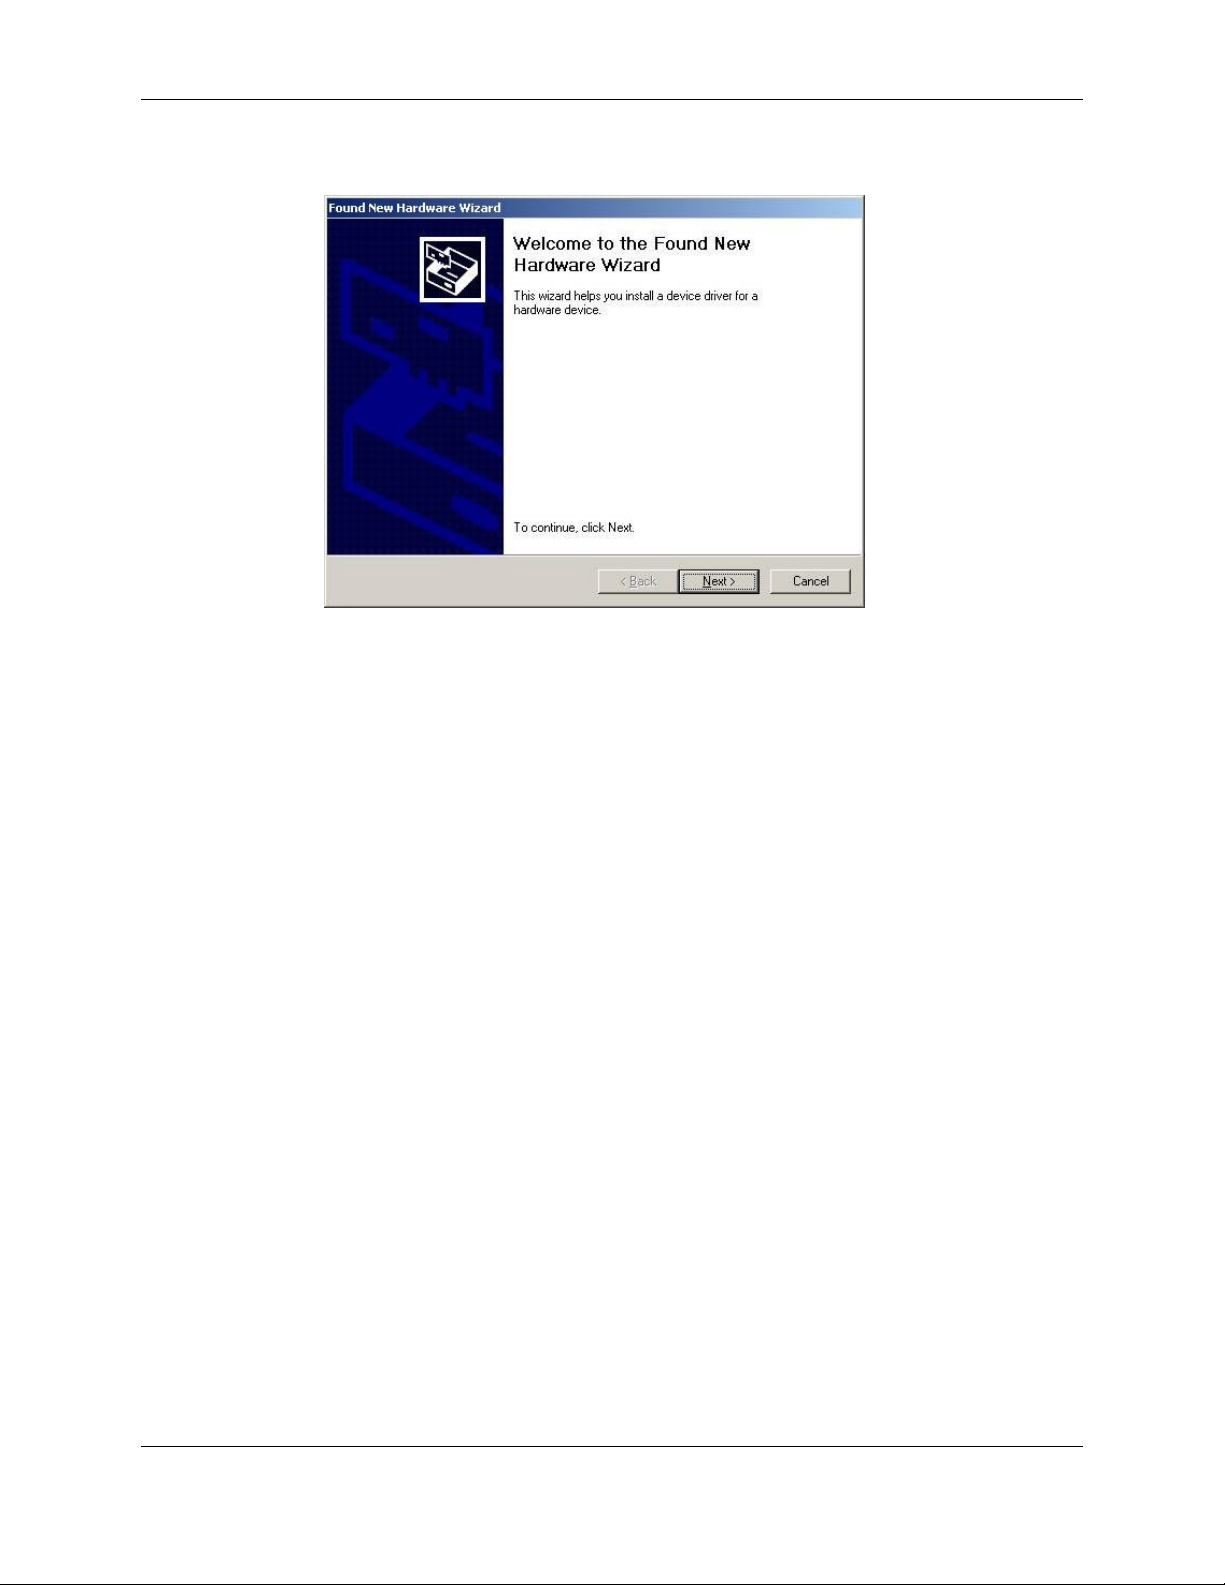
2.5.2 For Computers with the Windows 2000 Operating System
Figure 2-5: Found New Hardware Dialog Box
a) Press Next to present the Welcome to the Found New Hardware Wizard
dialog box.
b) Press Next to present the Install Hardware Device Drivers (USB-Serial)
dialog box.
c) Select the Search for a suitable driver for my device option, and press
Next.
d) The computer will present the Locate Driver Files dialog box. Check
Specify a Location and press Next.
e) A dialog box will be presented to select the location of the driver files.
Insert the Polychromix distribution CD and select the \Drivers\USB
directory, then press Open and finally press OK.
f) The computer will present the message Driver Files Search Results –
Windows found a device for this device. Press Next.
g) The computer will present the message Completing the Found New
Hardware Wizard. Press Finish.
h) Repeat the above procedure for the USB Serial Port.
2-6 Polychromix DTSTM Near-Infrared Spectrometer
Operator’s Manual
Document Number 04-91-0201-00 Rev A
Page 19

2.5.3 For Computers with the Windows XP Operating System
Figure 2-6: New Hardware Dialog Box
Installation
a) Select No, not this time and press Next. The display will present a display
to choose between automated installation or installation from a user
selected location and prompt you to insert the CD provided with the
device (Figure 2-4).
b) Insert the Polychromix distribution CD, select the Install the software
automatically option and press Next.
c) A dialog box will be presented to select the location of the driver files.
Select the \DRIVERS\USB\ directory, then press Open and finally press
OK.
d) The computer will present the message Driver Files Search Results –
Windows found a device for this device. Press Next.
e) The computer will present the message Completing the Found New
Hardware Wizard. Press Finish.
f) Repeat the above procedure for the USB Serial Port.
Polychromix DTSTM Near-Infrared Spectrometer 2-7
Operator’s Manual
Document Number 04-91-0201-00 Rev A
Page 20

Chapter 2
2.6 Installing the Polychromix DTS SpectralCode
2.6.1 For Computers with the Windows Me/2000/XP Operating Systems
Software
NOTE: Microsoft .NET v1.1 is required for the Polychromix DTS
SpectralCode Software to function. The installation software is included
on the distribution CD and will present the installation dialog if required.
Figure 2-7: .Net Installation Dialog Box
a) Use Windows Explorer to access the Polychromix DTS SpectralCode
Software on the distribution CD.
b) Select Setup (or setup.exe).
Figure 2-8: .Software Setup Dialog Box
c) Follow the installation instructions. It is suggested that you select the
default options for installation.
Once the DTS software has been installed, the software can be run by
selecting the Polychromix SpectralCode icon on the desktop or via the Start
Menu (Programs/Polychromix Spectral Code/Polychromix Spectral Code).
2-8 Polychromix DTSTM Near-Infrared Spectrometer
Operator’s Manual
Document Number 04-91-0201-00 Rev A
Page 21

3 Quick Start
NOTE: The experiment described below is provided to allow the
operator to verify that the spectrometer is functioning properly. A
detailed discussion of the program is presented in Chapter 4.
a) Start the program to present the Polychromix SpectralCode window
(Figure 3-1). The wavelength range on the horizontal axis is dependent
on the particular spectrometer that is employed. In this manual, all
windows have been collected for the DTS-1700. If the DTS-2500 is
employed, the range will be 1700-2500 nm and if the DTS-NB is
employed, the range will be 1100-1350 nm.
Figure 3-1: The Polychromix SpectralCode Window
NOTE: If the legend No Device Found is presented in the left corner of
the status line, it is probable that the USB cable has not been plugged
in or the drivers are not properly installed. Close the program, reconnect the cable, check that the drivers are installed and then restart
the program.
Polychromix DTSTM Near-Infrared Spectrometer 3-1
Operator’s Manual
Document Number 04-91-0201-00 Rev A
Page 22

Chapter 3
b) Turn on the source and allow it to warm up for a few minutes.
c) Verify that the button is depressed and press the
button. A background scan of air will be collected (Figure 3-2).
Figure 3-2: Background Spectrum of Air
NOTE: If the detector is saturated, a warning will be presented
prompting the user to adjust the level using the light meter mode
(Section 5.5).
If you are using a cuvette holder:
a) Place a sample (e.g. 1 cm2 cuvette with water or a piece of polystyrene) in
the light path.
b) Press the (absorbance) button and then press the
button. The spectrum will be collected and displayed (Figure 3-3). The
shape of the spectrum will depend on the wavelength range of the
spectrometer and the sample that is employed. At this juncture, the
critical point is that the spectrum is different than the background
spectrum collected above.
3-2 Polychromix DTSTM Near-Infrared Spectrometer
Operator’s Manual
Document Number 04-91-0201-00 Rev A
Page 23

Quick Start
Figure 3-3: Absorbance Spectrum of Polystyrene
If you are using an integrating sphere:
a) Set the scan count to 8 using the field adjacent to the button.
b) Place a reflectance reference on the integrating sphere (e.g. Spectralon
TM
or roughened gold).
c) Verify that the button is depressed and press the
button. A background spectrum will be collected.
d) Place a vial filled with a solid (e.g. sugar) over the opening of the
integrating sphere.
e) Press the button and then press the button. The
spectrum will be collected and displayed (Figure 3-4). The shape of the
spectrum will depend on the wavelength range of the spectrometer and
the sample that is employed. At this juncture, the critical thing is to view a
spectrum that is different than the background spectrum collected above.
Polychromix DTSTM Near-Infrared Spectrometer 3-3
Operator’s Manual
Document Number 04-91-0201-00 Rev A
Page 24

Chapter 3
Figure 3-4: Reflectance Spectrum of Sugar Referenced to Gold
3-4 Polychromix DTSTM Near-Infrared Spectrometer
Operator’s Manual
Document Number 04-91-0201-00 Rev A
Page 25

4 The SpectralCode
Application Program
4.1 Introduction
The Polychromix DTS spectrometer is controlled by the SpectralCode
application program and all data is presented on the main window (Figure
4-1) which is presented when the program is opened.
Figure 4-1: Polychromix SpectralCode Main Window
Polychromix DTSTM Near-Infrared Spectrometer 4-1
Operator’s Manual
Document Number 04-91-0201-00 Rev A
Page 26

Chapter 4
4.2 General Layout of the SpectralCode Window
The window includes the following:
• the Menu bar (Section 4.3)
• the Button bar (Section 4.4)
• the Spectral region (Section 4.5)
In general, the program conforms to standard Windows conventions. For
sake of brevity, features that are common to other windows programs (e.g.
the dialog box for saving a spectrum is similar to that used for saving files in
other programs) are not described.
If desired, the user can place the PlotLegend window (Figure 4-2) on the
main window. This sub-window lists the contents and status of the various
storage registers that are in use. A detailed discussion of the sub-window is
presented in Section 4.6.
Figure 4-2: The Plot Legend Window
4.3 The Menu Bar
4.3.1 The File Menu
The File menu (Figure 4-3) is used to access a variety of data storage and
retrieval functions.
Figure 4-3: The File Menu
4-2 Polychromix DTSTM Near-Infrared Spectrometer
Operator’s Manual
Document Number 04-91-0201-00 Rev A
Page 27

The SpectralCode Application Program
Open File - Accesses a standard Windows dialog box to open an existing
data file and presents the spectrum.
Save File - Presents a standard Windows dialog box to save the active
spectrum. The file is saved as a comma separated Windows Excel file and
can be used for further data processing and/or presentation. If you want to
open the file in Excel, select All Files for the Files of Type field on the Open
dialog box.
The format of the file name is x_yyyymmdd_hhmmss.csv, where x can be
any alphanumeric information you wish to assign, yyyymmdd indicates the
date of collection and hhmmss indicates the time of collection. As an
example, a typical file name might be sugar_20050504_081245, which was
collected at 8:12:45 AM on May 5, 2005. In this instance, the operator
entered the file name sugar; the date and time information is automatically
added to the file name.
Print Plot - Presents a dialog box to enter the name of the spectrum and any
comments that you want to annotate to the spectrum. After entering the
desired information, the annotated plot can be printed by pressing the printer
icon in the upper left corner of the window. The plot is printed by the printer
that is indicated as the default printer in Windows.
Copy - Copies the present window for pasting into another application (e.g. a
word processor). A printer compatible plot is presented.
Exit - Closes the program.
4.3.2 The Settings Menu
The Settings menu (Figure 3-4) is used to change the nature of the window to
meet the specific desires of the user.
Figure 4-4: The Settings Menu
Toolbars - Used to indicate if the Data Collection and Spectral Manipulation
tool bars should be presented in the window. A detailed discussion of the
toolbars is presented in Section 4.4).
Screen Colors - Used to change the color of various elements of the main
window including the background, the chart grid, the axes and the axes
labels. Each selection presents the standard Windows color palette.
Plot Legend - Presents/removes the PlotLegend window (see Section 4.6).
Polychromix DTSTM Near-Infrared Spectrometer 4-3
Operator’s Manual
Document Number 04-91-0201-00 Rev A
Page 28

Chapter 4
4.3.3 The Data Collection Menu
The Data Collection menu (Figure 4-5) is used to indicate the type of data
acquisition that is to be performed.
Figure 4-5: The Data Collection Menu
Get Scan - Initiates the scan.
Scan Type - Indicates the type of scan to be collected. The options are
Background, Absorbance, Transmittance, Reflectance and Light Meter. A
Background scan must be collected before an Absorbance, Transmittance or
Reflectance scan can be collected.
Scans to Avg. - presents a dialog box to indicate the number of scans that
are to be collected and averaged to obtain the desired spectrum (the range is
1-999). This feature can be used to reduce noise in the reported spectrum.
When the scans are collected, they will be run on a continuous basis until the
data collection process is complete.
Autoscale - Expands/contracts the vertical axis so that the minimum and
maximum intensity of the spectrum are at the minimum and maximum of the
plot.
Overlay - Indicates that the present spectrum (spectra) should not be erased
when a new scan is initiated.
Data Points – Indicates that the actual data points should be presented on
the spectra as dots.
Multiscan - Accesses a dialog box that initiates multiple timed spectral
measurements and recording (Section 4.7).
Continuous Scan - If this is selected, the spectrometer will collect spectra on
a continuous basis until the Cancel button is pressed.
Light Meter - Starts a time scan of the intensity over all wavelengths with all
MEMS pixels set to maximum throughput (see Section 5.5).
4-4 Polychromix DTSTM Near-Infrared Spectrometer
Operator’s Manual
Document Number 04-91-0201-00 Rev A
Page 29

4.3.4 Spectrum Manipulation
The Spectrum Manipulation menu (Figure 4-6) is used to access post-run
processing of spectral data.
Figure 4-6: Spectrum Manipulation Menu
Save to Reg. - The manipulated data will be saved to a new register.
4.3.5 Help
The Help menu (Figure 4-7) provides access to the on-line help file and the
version number.
The SpectralCode Application Program
Figure 4-7: The Help Menu
Help - Accesses the on-line help file
About - Presents a dialog box with the serial number of the spectrometer, the
version number of the firmware, the version number of the application
program and related information.
4.4 Tool Bars
Two tool bars are presented in the window (Figure 4-8). The upper toolbar is
used for data acquisition and contains the commands presented on the Data
Collection menu while the lower toolbar includes commands for Spectrum
Manipulation.
Figure 4-8: The Toolbars
Polychromix DTSTM Near-Infrared Spectrometer 4-5
Operator’s Manual
Document Number 04-91-0201-00 Rev A
Page 30

Chapter 4
ndicates that a transmission scan is desired. If an absorbance
4.4.1 Upper Tool Bar
Initiates the selected operation. When the scan is started, the
legend changes to STOP and the sphere is RED.
The number drop down field indicates the number of times that
the operation should be performed and averaged. As an
alternative, the number can be entered via the keyboard. The
range is 1-999.
Indicates that a background scan is desired.
I
spectrum is presented on the screen, it will convert the
spectrum to a transmittance spectrum.
Indicates that an absorbance scan is desired. If a
transmittance spectrum is presented on the screen, it will
convert the spectrum to an absorbance spectrum.
Indicates that a reflectance spectrum is desired.
Indicates that a Light meter measurement is desired (see
Section 5.5).
Indicates that spectra should be collected on a repetitive basis.
Data collection is initiated upon selecting this option, and is
terminated by pressing the Stop button.
Indicates that Multiple scans are desired (see Section 4.7).
4-6 Polychromix DTSTM Near-Infrared Spectrometer
Operator’s Manual
Document Number 04-91-0201-00 Rev A
Page 31

Indicates that the spectrum should be auto scaled.
Indicates that spectra should be overlaid on the display.
Indicates that each data point should be shown on the
spectrum.
4.4.2 Lower Tool Bar
The SpectralCode Application Program
Presents a dialog box to allow the user to
move the spectrum to another register (see
Section 4.6 for details).
The first and third fields are used to indicate
the spectra to be manipulated and the
second field is used to indicate the desired
operator (+, -, /). The drop down menus will
list all absorbance, transmittance, and
reflectance spectra in the various registers
(except register 0).
Performs the desired manipulation. The
new spectrum will be the active spectrum
(register 0) and can be moved in the same
manner as a spectrum indicated above.
Polychromix DTSTM Near-Infrared Spectrometer 4-7
Operator’s Manual
Document Number 04-91-0201-00 Rev A
Page 32

Chapter 4
4.5 The Spectral Region
The spectral region presents the data that was collected.
If desired, one can expand (zoom) a region of the spectrum by placing the
mouse on one corner of the desired region to be enlarged, clicking the left
button and dragging the mouse to the opposite corner and then releasing the
mouse button. To return to the auto-scaled plot, click the right button on the
mouse.
The Autoscale command (Section 4.4) can be used to expand/contract the
spectrum so that it appears full scale in the spectral region.
The colors of each element of the window can be selected as described in
Section 4.3.2 and the color of the active spectrum can be selected as
described in Section 4.4.
The bottom line of the window is a status bar and provides information to the
operator.
• The left field indicates the Com Port that is employed for the
spectrometer. If the spectrometer is not connected, the legend No Device
Found will be presented.
• The center field is used if the multiple scan feature is employed. The
number of remaining scans and the time until the next scan will be
indicated.
• The right field will indicate the position of the cursor if the mouse is in the
spectral region (e.g. X:1356.2, Y:0.02433).
4.6 The PlotLegend Dialog Box
The PlotLegend dialog box is used to indicate the status of the active
registers. Figure 4-9 shows the dialog box when the instrument is started.
Figure 4-9: The Plot Legend Dialog Box
4-8 Polychromix DTSTM Near-Infrared Spectrometer
Operator’s Manual
Document Number 04-91-0201-00 Rev A
Page 33

The SpectralCode Application Program
After a spectrum is collected, the PlotLegend dialog box will be updated as
shown in Figure 4-10. The green traffic light indicates that the spectrum is
displayed (the color of the traffic light in the PlotLegend window indicates the
status of the register as described below) and the B in the right box indicates
that the scan is a Background scan. The final box indicates the color of the
spectrum; if desired, you can change the color by clicking on the box.
Figure 4-10: The Plot Legend Dialog Box after a Background Scan
To move the background scan to register 1, press the key to present
the RegOverwrite dialog box (Figure 4-11) and press OK. If a register(s) is
occupied, the display will list all of the occupied register(s) and the lowest
unoccupied register. The user may select any register to overwrite by clicking
on it. By default, the next unoccupied register is initially selected.
Figure 4-11: The RegOverwrite Dialog Box
The dialog box will appear as shown in Figure 4-12. The red circle for register
0 indicates that the register is not displayed.
Figure 4-12: The Plot Legend Dialog Box after Moving the Background Scan
Polychromix DTSTM Near-Infrared Spectrometer 4-9
Operator’s Manual
Document Number 04-91-0201-00 Rev A
Page 34

Chapter 4
If the user now performs a transmittance scan, that scan will be placed in
register 0 and can be moved with the key to register 2 (Figure 4-13).
Figure 4-13: The Plot Legend Dialog Box after Collecting a Transmittance Scan
and moving it.
The color of the traffic light in the PlotLegend dialog box indicates the display
status of the register.
Red - The contents of the register are not displayed.
Yellow – The contents of the register can be displayed if the appropriate
spectral type is active (e.g. a reflectance scan cannot be displayed if the
absorbance mode is active, but could be displayed if the active mode was
changed to reflectance).
Green - The contents of the register are displayed.
To change the display state:
• To display a register that is not currently displayed, click on the traffic light
until it turns green.
• To turn off a register that is currently displayed, click on the traffic light
until it turns red.
The highlighted scan in the Plot Legend dialog box (which is indicated with a
gray background) can be renamed as desired by typing in the desired name.
4-10 Polychromix DTSTM Near-Infrared Spectrometer
Operator’s Manual
Document Number 04-91-0201-00 Rev A
Page 35

4.7 MultiScan
The spectrometer can be used to schedule scans at user specified times via
the SCMultiScan dialog box (Figure 4-14).
The SpectralCode Application Program
Figure 4-14: The SCMultiScan Dialog Box
To schedule a series of spectra, indicate the number of spectra to be saved,
the number of scans to be averaged for a single spectrum, the time between
spectra and the file name root (e.g. sugar). The date and time will be
automatically added to the file name in the same manner as before. Any
comments will be included in the file.
If the Single File radio button is selected, all data will be stored in a single
data file, while if the Multiple Files radio button is selected, each spectrum will
be stored as a separate data file.
Polychromix DTSTM Near-Infrared Spectrometer 4-11
Operator’s Manual
Document Number 04-91-0201-00 Rev A
Page 36

Chapter 4
When the Start button is pressed, the first scan will be initiated. The status
line will indicate the number of scans remaining and the time before the next
spectrum.
4-12 Polychromix DTSTM Near-Infrared Spectrometer
Operator’s Manual
Document Number 04-91-0201-00 Rev A
Page 37

5 Collecting Spectra
and Manipulating
Data
5.1 Overview
This chapter demonstrates how the operator uses the Polychromix
SpectralCode application software program to collect spectra, manipulate
data, and store and retrieve data. The material in this chapter should be used
in conjunction with Chapter 6, which describes sample handling and related
issues.
NOTE: The general approach for collecting spectra and manipulating
data using SpectralCode is identical for all types of data (absorbance,
transmittance and reflectance). For the sake of brevity, only the
collection and processing of transmittance spectra are presented.
5.2 Collecting Spectra
5.2.1 Collecting the Background Spectrum
To Collect the Background Spectrum:
a) Place the blank in the sample compartment (e.g. an empty cuvette)
b) Press the button
c) Press the button to collect the spectrum (Figure 5-1).
Polychromix DTSTM Near-Infrared Spectrometer 5-1
Operator’s Manual
Document Number 04-91-0201-00 Rev A
Page 38

Chapter 5
Figure 5-1: The Background Spectrum
NOTE: If the background spectrum is too noisy, repeat this operation
and increase the number of scans to be averaged using the field that is
adjacent to the scan button. If the background scan is an averaged
scan, it is common practice (but not necessary) to use the same
number of scans for the collection of the transmission spectrum.
d) After you have obtained a suitable background spectrum, use the
key to move it into Register 1 in the PlotLegend dialog box (Figure 5-2).
Figure 5-2: The Plot Legend Dialog Box
NOTE: If you are collecting data on a continuous basis or on a timed
basis, the Stop button can be used to stop the operation.
5-2 Polychromix DTSTM Near-Infrared Spectrometer
Operator’s Manual
Document Number 04-91-0201-00 Rev A
Page 39

Collecting Spectra and Manipulating Data
5.2.2 Collecting a Transmittance Spectrum
To collect a Transmittance spectrum:
a) Place the sample in the system.
b) Press the button. The background spectrum in the spectral region
of the window will be erased and the vertical axis will be labeled
Transmission % (for an absorbance spectrum, the vertical axis will be
labeled Absorbance).
c) Press the button to obtain the spectrum. The display will look
like Figure 5-3.
NOTE: If you are collecting data on a continuous basis or on a timed
basis, the Stop button can be used to stop the operation.
Figure 5-3: Transmission Spectrum of Polystyrene
The transmission spectrum stored in register 0 is the spectrum that was just
collected. It is indicated with a green light and the letter T, while the
background spectrum collected above is in register 1 and is indicated by the
letter B.
Polychromix DTSTM Near-Infrared Spectrometer 5-3
Operator’s Manual
Document Number 04-91-0201-00 Rev A
Page 40

Chapter 5
If the transmittance spectrum in register 0 is acceptable and you want to
collect data from another sample; press the key and move the
spectrum into register 2 or save it as a file. The updated PlotLegend dialog
box will appear as shown in Figure 5-4.
Figure 5-4: Plot Legend after Moving the Transmission Spectrum
If you want to save a spectrum, make sure that it is displayed in the spectral
region, as only displayed spectra can be saved.
NOTE: If you press the scan key again without moving the data, the data
in register 0 will be overwritten.
If desired, you can copy the data in register 0 to an existing register and
overwrite the data in that register. This feature might be used if you noted that
there was an error in the data in register 2 and wanted to repeat the scan.
If you want to overlay spectra, press the key. An example of the
overlay of two transmission spectra is shown in Figure 5-5 (the pale blue
spectrum in Register 1 is from polystyrene and the dark blue spectrum in
Register 2 is polymethylmethacrylate. Only the newest spectrum will be the
active spectrum in the register (i.e. it can be saved).
5-4 Polychromix DTSTM Near-Infrared Spectrometer
Operator’s Manual
Document Number 04-91-0201-00 Rev A
Page 41

Collecting Spectra and Manipulating Data
Figure 5-5: Overlaid Transmission Spectra
A spectrum can be named by highlighting it in the PlotLegend dialog box and
typing the desired name.
If you want to save a spectrum, make sure that it is the most recently
displayed in the spectral region, as only the most recently displayed spectrum
can be saved.
Polychromix DTSTM Near-Infrared Spectrometer 5-5
Operator’s Manual
Document Number 04-91-0201-00 Rev A
Page 42

Chapter 5
5.3 Performing Mathematical Manipulations on the
Spectra
The Polychromix SpectralCode application software program provides the
ability to perform a variety of mathematical operations on spectra stored in
the registers, including the addition, subtraction or division of two spectra. In
this section, we will describe how to divide one spectrum by another. The
general principle for all operations is identical.
To perform a mathematical operation:
a) Ensure that the spectra on which the processing is to be performed have
been transferred to registers 1 and higher (data in register 0 cannot be
processed via this procedure).
b) Go to the bottom tool bar (Figure 5-6) and open the first field to present a
list of the registers that contain data available for processing.
Figure 5-6: Mathematical Processing Fields
c) Select the desired register and open the second field, which presents a
list of the available operators (+, -, /).
d) Select the desired operator and open the third field, which again presents
a list of the registers that contain available data.
e) Select the desired register. A typical operation might be 1/2, indicates that
spectrum 1 should be divided by spectrum 2.
f) Press the button to perform the operation. The result will be displayed
in the spectral area and will be indicated in the PlotLegend dialog box as
Math Result (Figure 5-7). This spectrum can be moved or renamed in the
same manner as any other spectrum.
Figure 5-7: Result of a Mathematical Operation
5-6 Polychromix DTSTM Near-Infrared Spectrometer
Operator’s Manual
Document Number 04-91-0201-00 Rev A
Page 43

Collecting Spectra and Manipulating Data
5.4 Saving and Retrieving Spectra
The active spectrum can be saved by selecting the Save File command on
the File menu and indicating the desired storage location. Data is saved as a
.csv file (comma separated values). If the spectrum was obtained by
averaging a number of scans, the averaged spectrum will be saved (but not
the individual scans).
The saved spectrum can be retrieved by selecting the Open File command
on the File menu and selecting the desired file. As an alternative, the file can
be opened in Microsoft Excel in a tabular format for customized data
processing and presentation as well as in many other applications.
If data is collected on a time scan basis using the SCMultiScan dialog box
(see Section 4.7), the Save options field can be used to store each spectrum
on an automated basis as it is being collected and the Excel spreadsheet will
display a column for each spectrum. As an alternative, if you select the
Multiple Files radio button, each set of scans will be given a separate file.
A part of an Excel spreadsheet for a single spectrum is shown in Figure 5-8
and a part of a spreadsheet for multiple spectra is presented in Figure 5-9
(see Section 4.7).
Wavelength (nm) Absorbance 5/26/2005 11:56:51 Abs Polystyrene
0
936.9 0.03506013
944.7 0.03423788
952.4 0.03391358
960.2 0.03462744
967.9 0.03427535
975.7 0.03541862
983.4 0.03574646
991.1 0.0360106
998.8 0.03682216
1006.6 0.03748415
1014.3 0.03631843
1022 0.03653189
1029.7 0.03704398
1037.5 0.03592357
1045.2 0.03496345
1052.9 0.03526047
1060.6 0.03398799
1068.3 0.0326819
1076 0.03347766
1083.7 0.0337929
1091.4 0.03389158
1099.1 0.03401419
1106.8 0.03735034
1114.5 0.04052372
1122.2 0.04250975
1129.9 0.04695749
1137.5 0.04944238
1145.2 0.04932098
Figure 5-8: Spectroscopic Data in Excel Spreadsheet - Single Spectrum
Polychromix DTSTM Near-Infrared Spectrometer 5-7
Operator’s Manual
Document Number 04-91-0201-00 Rev A
Page 44

Chapter 5
Wavelength (nm) Absorbance 5/26/2005 13:31:36 Abs Muti-scan Test File
936.9 0.09025412 0.090592 0.090402 0.090459 0.09025057
944.7 0.08943115 0.089006 0.088848 0.089381 0.0894325
952.4 0.08780692 0.087835 0.087834 0.087979 0.08778944
960.2 0.08811077 0.088223 0.087686 0.088082 0.08816743
967.9 0.08733211 0.087411 0.08746 0.087631 0.08730432
975.7 0.0874955 0.087252 0.087432 0.087495 0.08727504
983.4 0.08811556 0.087986 0.08792 0.087986 0.08787344
991.1 0.08811787 0.088511 0.088154 0.088253 0.08801024
998.8 0.08659166 0.086658 0.086628 0.086726 0.08685371
1006.6 0.08725458 0.087219 0.087082 0.087205 0.08717126
1014.3 0.08846609 0.088375 0.088372 0.088423 0.08837023
1022 0.08773003 0.087792 0.087779 0.087797 0.08786082
1029.7 0.08703371 0.087194 0.086977 0.087162 0.0870512
1037.5 0.08632153 0.086383 0.086266 0.086541 0.08639798
1045.2 0.08746875 0.087413 0.087481 0.087402 0.0874313
1052.9 0.08707132 0.087134 0.08711 0.087155 0.08702853
1060.6 0.08575796 0.085668 0.085668 0.085744 0.08570843
1068.3 0.08560116 0.085949 0.085886 0.085859 0.08597612
1076 0.08530499 0.085306 0.085297 0.08545 0.08536568
1083.7 0.08482784 0.084715 0.084817 0.084837 0.08482236
1091.4 0.08510091 0.085198 0.084983 0.085085 0.08498126
1099.1 0.08650035 0.086497 0.086545 0.086356 0.08647406
1106.8 0.08698642 0.087085 0.086858 0.086988 0.08698384
1114.5 0.0939277 0.093941 0.093886 0.093763 0.09399594
0 0.177612 0.344798 0.511983 0.679168493
Figure 5-9: Spectroscopic Data in Excel Spreadsheet – Multiple Spectra
The saved data files are in “Comma Separated Variable” format. All
alphanumeric values are stored in ASCII format and separated by commas.
Each row is terminated with a carriage return and linefeed (ascii value 13 and
10).
Row 1 - Always has 6 entries. These are Horizontal Axis Type, Vertical Axis
type, Date, Time, Scan type, and Comments.
Row 2 - Has as many entries as there are saved spectra plus 1. The first
entry is blank, the second entry is the time (in minutes from the start of the
session) of the first recorded spectrum. The remaining entries are the times
of the remaining spectra in the file.
Row 3 and higher - Row 3 and all data after comprise a table in which the first
column is wavelength and each column thereafter (to the right) is one of the
recorded spectra.
Each row has as many entries as there are saved spectra plus 1. The first
entry is the wavelength of the row. The second entry is the value of the
spectrum (e.g. absorbance, transmittance) of the first spectrum at the
wavelength represented by the first entry. Similarly, the third entry in the row
is the value of the spectrum for the second recorded spectrum. This follows
until the last recorded spectrum.
5-8 Polychromix DTSTM Near-Infrared Spectrometer
Operator’s Manual
Document Number 04-91-0201-00 Rev A
Page 45

5.5 The Light Meter
The Light Meter option is provided to allow the user to monitor a source.
When this function is selected, the spectrometer will present a time-based
record of the intensity summed over all wavelengths (all MEMS pixels set to
maximum throughput). A typical output is shown in Figure 5-10. The value in
the lower right corner of the status line is the instantaneous value of the
current (not the position of the cursor).
Collecting Spectra and Manipulating Data
Figure 5-10: Typical Light Meter Output
During light meter data collection, the left mouse button will freeze the plot
but data will continue to be collected. To update the plot, press the right
mouse button.
The light meter is often used to optimize the signal level. Ideally, the signal
from the source should be adjusted, when possible, to just below saturation
of the detector, which occurs at 1,500 nA.
Polychromix DTSTM Near-Infrared Spectrometer 5-9
Operator’s Manual
Document Number 04-91-0201-00 Rev A
Page 46

Page 47

6 Measuring the
Spectrum of a
Sample
6.1 Overview
The Polychromix DTS spectrometer is typically used to measure the
spectrum of a liquid using a cuvette and a sample holder and a solid using an
integrating sphere or reflectance probe. This chapter describes the general
approach to collecting data and presents a series of suggestions to optimize
the quality of data that is obtained.
Since the spectrometer can measure the spectrum of a broad range of
samples in a large number of applications, the information presented in this
chapter is somewhat general in nature. The analyst will likely find specific
information about sampling and collecting spectra for the specific sample in
the general scientific literature.
Polychromix DTSTM Near-Infrared Spectrometer 6-1
Operator’s Manual
Document Number 04-91-0201-00 Rev A
Page 48

Chapter 6
6.2 Using a Cuvette and Sample Holder
6.2.1 The Cuvette
A cuvette and a sample holder are used when the spectrum of a liquid is to
be obtained. The standard cuvette has a 1 cm path length (although other
lengths may be used) and requires approximately 2 mL of sample. If the
available sample is less than 2 mL, a number of smaller cuvettes are
available and an adapter can be used to reproducibly position the cuvette.
NOTE: It should be noted that the absorbance of a sample is
proportional to path length, and using a smaller cuvette will be
beneficial for samples with large absorbance values.
The cuvette is an integral part of the optical system, and should be handled
with care. The following points should be noted to ensure the fidelity of
collected spectra:
• Always place the cuvette in the light path so that the same wall plane
faces the incoming light to ensure a constant path length.
• Do not get fingerprints on the optical faces of the cuvette. If you
accidentally touch an optical surface, wipe it off with a lint free tissue
saturated with methanol and allow the methanol to evaporate.
• If an optical surface of the cuvette is scratched, chipped or becomes
cloudy, position the cuvette in the sample holder so that the light does not
go through that surface.
6.2.2 The Sample
The sample should be dissolved in a suitable solvent and should be
homogeneous. Spectroscopic grade or other highly purified solvents should
be used whenever possible. If the source of the solvent is changed, verify
that the new solvent and the old solvent are equivalent and collect a new
background spectrum.
If the sample contains particulate matter, make sure that it is filtered to
remove the solid material.
If there are air bubbles in the sample, remove them before taking a
measurement. Air bubbles are occasionally observed in aqueous samples
that have been allowed to sit undisturbed for a period of time.
6-2 Polychromix DTSTM Near-Infrared Spectrometer
Operator’s Manual
Document Number 04-91-0201-00 Rev A
Page 49

6.2.3 Collecting a Spectrum
To collect a spectrum:
a) Place a cuvette containing the reference sample in the sample holder and
collect the background spectrum as described in Section 5.2.1.
The reference sample should contain everything in the sample except the
compound(s) of interest. As an example, if the sample is dissolved in
methanol:water (1:1), that solvent should be used as the reference
sample. Similarly, if the sample is dissolved in a buffer, the buffer should
be used as the reference sample.
NOTE: If appropriate, the background spectrum can be taken using an
empty cuvette.
b) Remove the reference sample, place the sample in the sample holder
and collect the transmittance or absorbance spectrum as described in
Section 4.2. A plot of Transmission vs. Wavelength or Absorbance vs.
Wavelength will be presented.
Measuring the Spectrum of a Sample
6.2.4 Standards
The spectrum of a standard should be collected on a periodic basis (in many
laboratories, a sheet of a polymer is employed as a standard). The standard
should have a number of absorbance bandsspread across the spectral
region. When the spectrum of a standard is collected, the analyst should
check that the intensity of the bands and the wavelength remains constant
over time.
If difficulties are observed with the system, the spectrum of a standard should
be collected and compared to spectra that have been previously collected
using the same conditions.
6.2.5 Sample Related Spectra Issues
If the instrument appears to be working in an acceptable manner (e.g. the
spectra of the standard is acceptable) and unacceptable sample spectra are
obtained, it is probable that the difficulty is related to the sample. Typical
sample related issues are indicated in Table 6-1. General instrument
troubleshooting is discussed in Chapter 7.
Polychromix DTSTM Near-Infrared Spectrometer 6-3
Operator’s Manual
Document Number 04-91-0201-00 Rev A
Page 50

Chapter 6
6.2.6 Quantitative Measurements
Table 6-1: Sample Related Issues
Problem Cause Solution
The absorbance is
weak or % T is very
The sample is too dilute
or too thin
Prepare a more
concentrated sample
high (noisy spectrum)
Use Spectrum
Averaging to reduce
noise (Section 6.4)
The absorbance is too
strong or % T is near
The sample is too
concentrated or thick
Dilute the sample or
use a thinner cuvette
zero
Intensity of peaks
change
Spectrum does not
compare to spectrum in
Sample Decomposition Use a thermostated
cuvette holder
Interaction between
Replace solvent
sample and solvent
another solvent
The transmission (T) of a sample is defined by equation 6-1.
T = P/P
o
6-1
where: P is the power of the light that is transmitted by the sample
Po is the power of the light incident on the sample
The absorbance (A) of a sample is the logarithm (base 10) of the reciprocal of
the transmittance (equation 6-2).
A = -log T = log (1/T) 6-2
Beer’s Law (equation 6-3), can be used to determine the concentration of the
compound of interest.
A = e x c x l 6-3
where: A is the absorbance
e is the molar absorbance coefficient, which is a constant for a
compound in a given solvent at a given temperature
c is the concentration of the compound
l is the path length.
6-4 Polychromix DTSTM Near-Infrared Spectrometer
Operator’s Manual
Document Number 04-91-0201-00 Rev A
Page 51

6.3 Using an Integrating Sphere
An integrating sphere is normally used when the analyst wants to obtain the
spectrum of the surface of a solid or a turbid solution. The sample is placed
on the orifice of the sphere and is an integral part of the optical pathway.
6.3.1 The Sample
The following points regarding sample handling should be noted to ensure
the fidelity of collected spectra:
• Do not get fingerprints on the surface of the sample. If you accidentally
touch the surface, wipe it off with a lint free tissue saturated with methanol
and allow the methanol to evaporate.
• If a sample is contained in a bottle (flask, etc.) make certain that the
surface through which the infrared radiation passes is clean and is not
scratched, chipped or cloudy.
• If the sample is believed to be homogeneous, collect spectra at a few
positions on the sample to ensure that you are viewing a representative
sample.
Measuring the Spectrum of a Sample
• If the sample contains imperfections due to handling (e.g. scratches on a
piece of plastic) avoid the areas containing the imperfections.
6.3.2 Collecting a Reflectance Spectrum
To collect a spectrum:
a) Collect the background scan of an appropriate high reflectance material
such as “Spectralon” polymer or roughened gold as described in Section
5.2.
b) Place the sample on the integrating sphere and measure the reflectance.
6.3.3 Standards
The spectrum of a standard should be collected on a periodic basis. The
standard should have a number of absorbance bands spread across the
spectral region. When the spectrum of a standard is collected, the analyst
should check that the intensity of the bands and the wavelength remains
constant over time.
If difficulties are observed with the system, the spectrum of a standard should
be collected and compared to spectra that have been previously collected
using the same conditions.
Polychromix DTSTM Near-Infrared Spectrometer 6-5
Operator’s Manual
Document Number 04-91-0201-00 Rev A
Page 52

Chapter 6
6.4 Spectrum Averaging
If the spectrum is noisy, it may be possible to reduce the noise by increasing
the number of scans. As an example, Figure 6-1 presents a single reflectance
spectrum (blue) and the average of 16 spectra (black) taken from an aspirin
tablet. It is clear that the noise is reduced by averaging: as an example, see
the region from ca 1430 nm to 1630 nm. As a rough rule of thumb, the noise
reduction obtained by averaging spectra is approximately equal to the square
root of the number of scans that are averaged.
Figure 6-1: Spectral Averaging
6-6 Polychromix DTSTM Near-Infrared Spectrometer
Operator’s Manual
Document Number 04-91-0201-00 Rev A
Page 53

7 Maintenance and
Troubleshooting
7.1 Overview
The Polychromix DTS Spectrometer is a rugged instrument that is designed
for use in a laboratory or field application with a minimum amount of
maintenance. Since it is normally used with an integrating sphere or a source
and cuvette holder, we describe the maintenance and troubleshooting with
respect to the entire system.
The user should refer to the documentation provided with the integrating
sphere or source and sample holder, as it is very possible that the problem is
in one of these components, rather than the spectrometer.
7.2 Maintenance
The Polychromix DTS Spectrometer requires a minimum amount of
maintenance.
NOTE: There are no user replaceable parts inside the spectrometer and
it should not be disassembled by the user.
NOTE: If the USB cable or fiber optic cable is removed from the
spectrometer, place a piece of tape across the opening or cap it so that
dust and other foreign material cannot enter the spectrometer
If necessary, the unit can be wiped clean with a damp cloth.
The lamp in the source should be replaced on a periodic basis as described
in the documentation provided with the source. Typically, the lamp life is
1000-2000 hours, but this time is dependent on the lamp and the degree of
noise that can be tolerated in the spectrum.
Polychromix DTSTM Near-Infrared Spectrometer 7-1
Operator’s Manual
Document Number 04-91-0201-00 Rev A
Page 54

Chapter 7
7.3 Troubleshooting
7.3.1 Introduction
Since the Polychromix DTS spectrometer is employed in a system that
includes a source and a sample holder or integrating sphere, all
troubleshooting activities should include all components of the system.
Troubleshooting can be simplified by a consideration of the following
guidelines:
• In almost all cases, there is a single cause for the problem. As an
example, a noisy spectrum can be due to:
a) The lamp is weak
b) The fiber optic cable does not make good contact with the
spectrometer or the sample holder (integrating sphere).
c) An internal defect in the spectrometer
• A fundamental knowledge of the role of each component of the system is
extremely useful in diagnosing the problem.
• The availability of spare parts to substitute into the system is extremely
useful.
• If any aspect of the analytical conditions is to be changed, run a “before
and after” test to verify that the effect of the change is well understood.
Do not consider any change as trivial. As an example, if you change the
supplier of a solvent, verify that the change has no effect on the analysis.
• Run a standard (or a series of standards) on a periodic basis to verify that
the system is performing properly. When abnormal data is obtained,
collect the spectrum of a standard and compare the spectrum to one that
was previously obtained.
• If an error message is presented, press the Continue button indicated on
the Error Message dialog box. If this does not remedy the problem, turn
off the spectrometer, disconnect the USB cable and then reinstall the
cable.
7-2 Polychromix DTSTM Near-Infrared Spectrometer
Operator’s Manual
Document Number 04-91-0201-00 Rev A
Page 55

Maintenance and Troubleshooting
7.3.2 If the Spectrum is Noisy
Cause Comment Solution
Lamp is weak The lamp has a finite
lifetime
The absorbance is weak or
% T is very high (noisy
The sample is too dilute or
too thin
spectrum)
Use Spectrum Averaging
The absorbance is too
strong
The sample is too
concentrated or thick
Cable is loose Check all cables for good
Fiber optic cable is
Replace fiber optic cable
defective
Transient internal
Remove USB cable and
spectrometer fault
Defect in Spectrometer Contact Polychromix or its
Replace the lamp
Prepare a more
concentrated sample
to reduce noise (Section
5.4)
Dilute the sample or
reduce its thickness
contact
re-insert
local representative
7.3.3 There is no Signal
Cause Comment Solution
USB cable is loose Check cables for good
contact
Light not on. Check light
Sample not appropriate Check light meter
Transient internal
spectrometer fault
Defect in Spectrometer Contact Polychromix or its
Remove USB cable and
re-insert
local representative
Polychromix DTSTM Near-Infrared Spectrometer 7-3
Operator’s Manual
Document Number 04-91-0201-00 Rev A
Page 56

Chapter 7
7.3.4 The Signal Intensity is not Constant
Fiber optic cable has
shifted in position
Lamp is not stable Defective lamp Replace the lamp
Sample is not
homogeneous
(Cuvette)
Sample is not
homogeneous
(Integrating Sphere)
Sample is decomposing Replace sample
Cuvette is scratched Always place cuvette in
Defect in Spectrometer Contact Polychromix or its
Cause Comment Solution
Tape fiber optic cable to
bench
Mix sample and filter if
necessary to remove
particulate matter
Move integrating sphere to
a different region of the
sample
Replace cuvette
sample holder with same
plane facing the source
representative
7.3.5 The Wavelength for a Peak has Shifted
Cause Comment Solution
The background spectrum
is not valid
Sample is not
homogeneous
Defect in Spectrometer Contact Polychromix or its
Run a new background
Spectrum
Find another region of the
sample
local representative
7-4 Polychromix DTSTM Near-Infrared Spectrometer
Operator’s Manual
Document Number 04-91-0201-00 Rev A
Page 57

850 nm filter
Single InGaAs with 2
Appendix A Specifications
Specifications DTS™ 1700 DTS™ 2500 DTS™ NB
Spectral Range 0.9-1.7 microns 1.7-2.5 microns 1.1-1.35 microns
Absolute Wavelength
Resolution
Pixel Spacing 8 nm 8 nm 2 nm
Optical Resolution 12 nm 22 nm 4 nm
Stray Light <0.01% transmission of 10mm water at 1405 nm using Halogen lamp &
±0.6nm fixed temperature (with parabolic fit)
Dynamic Range 10,000 single acquisition with optimum light levels
Photometric Stability <0.05% over 6 hrs.
Measurement time <10 msec per spectral mask: ,<1 sec. per spectrum
Input fiber
Module Size
Weight 1.8 Kg (4 lbs.)
Hardware Interface mini USB for both power and communications.
A/D Converter 24 bit
Power consumption 0.75W 1.25W 0.75W
Supply Requirement 5 Volts DC, 400mA
Detector
Software included: SpectralCode™ Contact Polychromix for: “my instrument” or Labview
Operating Systems Windows Me, 2000, & XP
Operating Environment
Storage Temp Range -40 to +60°C
for optimum performance internal slit needs ≥500 um diameter low OH
fiber with SMA-905 connector.
105 x 85 x 145mm (4.2x3.3x5.7”)
Single InGaAs
stage cooler
5 to 40°C and 0 to 80% RH
Single InGaAs
Polychromix DTS TM Near-Infrared Spectrometer A-1
Operator’s Manual
Document Number 04-91-0201-00 Rev A
Page 58

Page 59

Index
A
About Command 4-5
Absorbance 6-4
Abs Tool 4-6
Autoscale Command 4-4
B
Background Spectra Collecting 5-1
Beer’s Law 6-4
Benefits of System 1-2
Bkg Tool 4-6
C
CD 2-2
Components shipped with
Spectrometer 2-2
Com Port Indicator 4-8
Collecting Spectra 5-1
Background Spectra 5-1
Continuous Scan Command 4-4
Copy Command 4-3
Cursor Position 4-8
Cuvettes 6-2
F
Fiber Optic Cable 2-2
File Menu 4-2
G
Get Scan Command 4-4
H
Help Command 4-5
Help Menu 4-5
I
InGaAs Detector 1-3
Installation 2-1
Integrating Sphere 1-2
Interfacing to 2-4
Interfacing
Computer 2-5
Integrating Sphere 2-4
Sample Holder and
Source 2-2
Introduction 1-1
L
D
Data Collection Menu 4-4
Data Points Command 4-4
Description of Spectrometer 1-3
E
Environmental Considerations 2-2
Exit Command 4-3
Polychromix DTS TM Near-Infrared Spectrometer I-1
Operator’s Manual
Maintenance and Troubleshooting
License Agreement vii
Light Meter Command 4-4
Lower Tool Bar 4-7
M
Maintenance 7-1
Mathematical Manipulation 5-6
Measuring Spectrum of a
Sample 6-1
Page 60

Index
With a Cuvette 6-2
With an Integrating
Sphere 6-5
MEMS Diffraction Grating 1-3
Menu Bar 4-2
Micro-diffraction Grating 1-3
Multiple Files Command 4-11
Multiscan
Command 4-4
Dialog Box 4-11
N
Noisy Spectrum 7-3
No Signal 7-3
O
Open File Command 4-3
Overlay Command 4-4, 5-5
P
Personal Computer
Interfacing to 2-4
with Windows 2000 2-5
with Windows XP 2-6
Plot Legend Command 4-4
Plot Legend Dialog Box 4-8
Power Meter 5-9
Print Plot Command 4-3
Q
Quantitative Measurements 6-4
Quick Start 3-1
R
Refl. Tool 4-6
Reg. Overwrite Dialog Box 4-9
Retrieving Spectra 5-7
S
Sample 6-2
Sample Holder
Interfacing 2-3
Save File Command 4-3
Save to Reg. Command 4-5
Saving Spectra 5-7
Scan Tool 4-6
Scans to Avg. Command 4-4
Scan Type Command 4-4
Screen Colors Command 4-3
Settings Menu 4-3
Signal Intensity Not Constant 7- 4
Single File Command 4-11
Source 1-2
Interfacing to 2-2
Specifications A-1
SpectralCode Software
Installation 2-7
Spectral Region 4-8
Spectrum Averaging 6-6
Spectrum Manipulation Menu 4-5
Standards 6-3, 6-5
System Benefits 1-2
System Description 1-3
T
Tool Bars 4-5
Toolbars Command 4-3
Transmission 6-4
Troubleshooting 7-2
Noisy Spectrum 7-3
No Signal 7-3
Signal Intensity Not
Constant 7-4
Wavelength Shifted 7-4
U
Unpacking the Spectrometer 2-2
Upper Tool Bar 4-6
USB Cable 2-2
User Interaction Scheme 4-1
Layout 4-2
V
Versions 1-2
W
Warranty iii
Wavelength Ranges 1-2
Wavelength Shifted 7-4
I-2 Polychromix DTS TM Near-Infrared Spectrometer
Operator’s Manual
Maintenance and Troubleshooting
 Loading...