

Page 1

1005r Server Maintenance and Diagnostics
CallPilot
Release 4.0
Document Number: 555-7101-512
Document Version: Standard 1.10
June 2007
Page 2

Copyright © 2007 Nortel Networks.
All Rights Reserved.
The information in this document is subject to change without notice. The
statements, configurations, technical data, and recommendations in this
document are believed to be accurate and reliable, but are presented
without express or implied warranty. Users must take full responsibility
for their applications of any products specified in this document. The
information in this document is proprietary to Nortel Networks.
The process of transmitting data and call messaging between the CallPilot
server and the switch or system is proprietary to Nortel Networks. Any
other use of the data and the transmission process is a violation of the user
license unless specifically authorized in writing by Nortel Networks prior
to such use. Violations of the license by alternative usage of any portion of
this process or the related hardware constitutes grounds for an immediate
termination of the license and Nortel Networks reserves the right to seek
all allowable remedies for such breach.
Standard 1.10
Trademarks
*Nortel Networks, the Nortel Networks logo, the Globemark, and Unified
Networks, BNR, CallPilot, DMS, DMS-100, DMS-250, DMS-MTX,
DMS-SCP, DPN, Dualmode, Helmsman, IVR, MAP, Meridian, Meridian
1, Meridian Link, Meridian Mail, Norstar, SL-1, SL-100, Succession,
Supernode, Symposium, Telesis, and Unity are trademarks of Nortel
Networks.
3COM is a trademark of 3Com Corporation.
ADOBE is a trademark of Adobe Systems Incorporated.
ATLAS is a trademark of Quantum Corporation.
BLACKBERRY is a trademark of Research in Motion Limited.
2 CallPilot
Page 3

June 2007
CRYSTAL REPORTS is a trademark of Seagate Software Inc.
EUDORA is a trademark of Qualcomm.
eTrust and InoculateIT are trademarks of Computer Associates Think Inc.
DIRECTX, EXCHANGE.NET, FRONTPAGE, INTERNET
EXPLORER, LINKEXCHANGE, MICROSOFT, MICROSOFT
EXCHANGE SERVER, MS-DOS, NETMEETING, OUTLOOK,
POWERPOINT, VISUAL STUDIO, WINDOWS, WINDOWS MEDIA,
and WINDOWS NT are trademarks of Microsoft Corporation.
GROUPWISE and NOVELL are trademarks of Novell Inc.
LOGITECH is a trademark of Logitech, Inc.
MCAFEE and NETSHIELD are trademarks of McAfee Associates, Inc.
MYLEX is a trademark of Mylex Corporation.
NETSCAPE COMMUNICATOR is a trademark of Netscape
Communications Corporation.
NOTES is a trademark of Lotus Development Corporation.
NORTON ANTIVIRUS and PCANYWHERE are trademarks of
Symantec Corporation.
QUICKTIME is a trademark of Apple Computer, In.
RADISYS is a trademark of Radisys Corporation.
SLR4, SLR5, and TANDBERG are trademarks of Tandberg Data ASA.
SYBASE is a trademark of Sybase, Inc.
TEAC is a trademark of TEAC Corporation
US ROBOTICS, the US ROBOTICS logo, and SPORTSTER are
trademarks of US Robotics.
1005r Server Maintenance and Diagnostics 3
Page 4
WINZIP is a trademark of Nico Mark Computing, Inc.
XEON is a trademark of Intel, Inc.
All other trademarks and registered trademarks are the property of their
respective owners.
Information for Japan
Japan Denan statement
The following applies to server models 703t and 1002rp:
Standard 1.10
Warning
Please be aware of the following while installing the equipment:
x Please use the connecting cables, power cord, and AC adaptors
shipped with the equipment or specified by Nortel to be used with the
equipment. If you use any other equipment, it may cause failures,
malfunctioning or fire.
x
Power cords shipped with this equipment must not be used with any
other equipment. If the above guidelines are not followed, it may lead
to death or severe injury.
㩷
ᧄຠ䉕ో䈮䈗↪㗂䈒䈢䉄䇮એ䈱䈖䈫䈮䈗ᵈᗧ䈒䈣䈘䈇䇯㩷
䃂㩷ធ⛯䉬䊷䊑䊦䇮㔚Ḯ䉮䊷䊄䇮㪘㪚䉝䉻䊒䉺䈭䈬䈱ㇱຠ䈲䇮ᔅ䈝ຠ䈮ห䈘䉏䈩䈍䉍䉁䈜㩷
ઃຠ䉁䈢䈲ᜰቯຠ䉕䈗↪䈒䈣䈘䈇䇯ઃຠ䊶ᜰቯຠએᄖ䈱ㇱຠ䉕䈗↪䈮䈭䉎䈫
㓚䉇േ⦟䇮Ἣἴ䈱ේ࿃䈫䈭䉎䈖䈫䈏䈅䉍䉁䈜䇯㩷
䃂㩷ห䈘䉏䈩䈍䉍䉁䈜ઃዻ䈱㔚Ḯ䉮䊷䊄䉕ઁ䈱ᯏེ䈮䈲↪䈚䈭䈇䈪䈒䈣䈘䈇䇯 㩷 㩷 㩷 㩷 㩷 㩷 㩷
⸥ᵈᗧ㗄䉕䉌䈭䈇䈫䇮ᱫ䉇ᄢᕋᚒ䈭䈬り䈱ේ࿃䈫䈭䉎䈖䈫䈏䈅䉍䉁䈜䇯㩷
Japan VCCI statement
The following applies to server models 703t, 201i, and 1002rp:
(VCCI)
A
4 CallPilot
Page 5

June 2007
This is a Class A product based on the standard of the Voluntary Control
Council for Interference by Information T echnology Equipment (VCCI). If
this equipment is used in a domestic environment, radio disturbance may
occur, in which case, the user may be required to take corrective action.
1005r Server Maintenance and Diagnostics 5
Page 6

Standard 1.10
6 CallPilot
Page 7

Publication history
June 2007
April 2007
April 2007
January 2007
December 2006
October 2006
CallPilot 4.0, Standard 1.10 of the 1005r Server
Maintenance and Diagnostics guide is issued for
general release.
CallPilot 4.0, Standard 1.09 of the 1005r Server
Maintenance and Diagnostics guide is issued for
general release.
CallPilot 4.0, Standard 1.08 of the 1005r Server
Maintenance and Diagnostics guide is issued for
general release.
CallPilot 4.0, Standard 1.07 of the 1005r Server
Maintenance and Diagnostics guide is issued for
general release.
CallPilot 4.0, Standard 1.06 of the 1005r Server
Maintenance and Diagnostics guide is issued for
general release.
CallPilot 4.0, Standard 1.05 of the 1005r Server
Maintenance and Diagnostics guide is issued for
general release.
1005r Server Maintenance and Diagnostics 7
Page 8

Publication history Standard 1.10
8 CallPilot
Page 9

Task List
To run the startup test ..................................................................... 27
To run the POST ............................................................................. 29
To determine why the server fails to boot to Windows.................... 35
To determine why CallPilot fails to come into service ..................... 35
To use the operating system Event Viewer..................................... 43
To run the ipconfig command from Windows .................................. 47
To run the ping command from Windows........................................ 49
To run the tracert command from Windows .................................... 50
To run the arp command from Windows ......................................... 52
To run the nbtstat command from Windows.................................... 54
To run the chkdsk utility from Windows........................................... 57
To investigate using the Alarm Monitor ........................................... 64
To investigate using the Event Browser .......................................... 66
To view the state of a hardware component .................................. 75
To start or stop a component .......................................................... 78
To run a diagnostic test ................................................................... 81
To view the last diagnostics result .................................................. 83
To view or work with multimedia channel states ............................. 85
To view or work with call channel states ......................................... 87
To access the Diagnostics Tool ...................................................... 91
To enable startup diagnostics ......................................................... 91
To disable startup diagnostics ......................................................... 91
To access the PEP Maintenance utility ........................................... 93
To view a list of all installed PEPs................................................... 93
To access the session trace tool ..................................................... 94
To find a session ............................................................................. 95
To access the CallPilot System Monitor.......................................... 97
To remove the front bezel ............................................................. 104
To replace the front bezel.............................................................. 105
To remove the server cover .......................................................... 106
To replace the server cover........................................................... 107
To remove the processor air duct.................................................. 108
To replace the processor air duct.................................................. 109
To hot-swap a power supply ......................................................... 110
To replace a SCSI hard drive ........................................................ 112
To replace the four-fan assembly.................................................. 116
To replace a dual NIC card ........................................................... 119
1005r Server Maintenance and Diagnostics 9
Page 10

Task List Standard 1.08
To replace the DVD combo drive .................................................. 127
To replace the DIMM cards ........................................................... 130
To replace the software feature key .............................................. 133
To verify the RAID firmware version.............................................. 137
To upgrade or downgrade the RAID firmware............................... 138
To configure an LSI320-1 RAID system........................................ 140
To perform a consistency check.................................................... 143
To split the RAID ........................................................................... 145
To synchronize the RAID after a successful PEP installation ....... 147
To synchronize the RAID after an unsuccessful PEP installation . 147
To replace the RAID card .............................................................. 150
To replace an MPB96 board ......................................................... 162
To add two MPB96 boards ............................................................ 171
To display the Nortel CallPilot Image Menu .................................. 183
To upgrade the BIOS and system board firmware ........................ 184
To view system event logs ............................................................ 189
To save system event logs to a USB media drive ......................... 190
To clear system event logs............................................................ 190
10 CallPilot
Page 11

Contents
1 How to get Help 15
2 Outlining maintenance and diagnostics activities 17
1005r server features. . . . . . . . . . . . . . . . . . . . . . . . . . . . . . . . . . . . . . . . . . 18
Maintenance and diagnostics overview . . . . . . . . . . . . . . . . . . . . . . . . . . . 22
3 Troubleshooting your CallPilot system 25
Startup diagnostics overview . . . . . . . . . . . . . . . . . . . . . . . . . . . . . . . . . . . 26
Basic hardware check . . . . . . . . . . . . . . . . . . . . . . . . . . . . . . . . . . . . . . . . . 27
Power-On Self-Test diagnostics . . . . . . . . . . . . . . . . . . . . . . . . . . . . . . . . . 30
Interpreting BIOS error messages. . . . . . . . . . . . . . . . . . . . . . . . . . . . . . . . 32
What to do when the server fails to boot into service. . . . . . . . . . . . . . . . . 36
Interpreting hard drive LEDs . . . . . . . . . . . . . . . . . . . . . . . . . . . . . . . . . . . 38
Performing a hardware shutdown . . . . . . . . . . . . . . . . . . . . . . . . . . . . . . . . 39
4 Using Windows online diagnostic tools 41
Overview. . . . . . . . . . . . . . . . . . . . . . . . . . . . . . . . . . . . . . . . . . . . . . . . . . . 42
Viewing event logs . . . . . . . . . . . . . . . . . . . . . . . . . . . . . . . . . . . . . . . . . . . 43
Using TCP/IP diagnostic tools . . . . . . . . . . . . . . . . . . . . . . . . . . . . . . . . . . 48
Using the chkdsk utility . . . . . . . . . . . . . . . . . . . . . . . . . . . . . . . . . . . . . . . 58
5 Monitoring server hardware 61
ISM overview . . . . . . . . . . . . . . . . . . . . . . . . . . . . . . . . . . . . . . . . . . . . . . . 62
6 Monitoring multimedia hardware 63
Understanding fault management . . . . . . . . . . . . . . . . . . . . . . . . . . . . . . . . 64
Alarm Monitor . . . . . . . . . . . . . . . . . . . . . . . . . . . . . . . . . . . . . . . . . . . . . . 66
Event Browser. . . . . . . . . . . . . . . . . . . . . . . . . . . . . . . . . . . . . . . . . . . . . . . 68
Channel and Multimedia Monitors . . . . . . . . . . . . . . . . . . . . . . . . . . . . . . . 70
The Maintenance screen . . . . . . . . . . . . . . . . . . . . . . . . . . . . . . . . . . . . . . . 71
1005r Server Maintenance and Diagnostics 11
Page 12

Contents Standard 1.10
Viewing component states . . . . . . . . . . . . . . . . . . . . . . . . . . . . . . . . . . . . . 75
Starting and stopping components . . . . . . . . . . . . . . . . . . . . . . . . . . . . . . . 78
Running integrated diagnostics. . . . . . . . . . . . . . . . . . . . . . . . . . . . . . . . . . 82
Viewing the last diagnostics result . . . . . . . . . . . . . . . . . . . . . . . . . . . . . . . 85
Working with the Multimedia Monitor . . . . . . . . . . . . . . . . . . . . . . . . . . . 87
Working with the Channel Monitor . . . . . . . . . . . . . . . . . . . . . . . . . . . . . . 89
7 Using CallPilot system utilities 91
Overview. . . . . . . . . . . . . . . . . . . . . . . . . . . . . . . . . . . . . . . . . . . . . . . . . . . 92
Diagnostics Tool . . . . . . . . . . . . . . . . . . . . . . . . . . . . . . . . . . . . . . . . . . . . . 93
PEP Maintenance utility . . . . . . . . . . . . . . . . . . . . . . . . . . . . . . . . . . . . . . . 95
Session Trace . . . . . . . . . . . . . . . . . . . . . . . . . . . . . . . . . . . . . . . . . . . . . . . 96
CallPilot System Monitor . . . . . . . . . . . . . . . . . . . . . . . . . . . . . . . . . . . . . . 99
8 Replacing basic chassis components 105
Removing and replacing the front bezel . . . . . . . . . . . . . . . . . . . . . . . . . . 106
Removing and replacing the server cover. . . . . . . . . . . . . . . . . . . . . . . . . 108
Removing and replacing the processor air duct . . . . . . . . . . . . . . . . . . . . 110
Replacing the power supply . . . . . . . . . . . . . . . . . . . . . . . . . . . . . . . . . . . 112
Replacing a hard drive . . . . . . . . . . . . . . . . . . . . . . . . . . . . . . . . . . . . . . . 114
Replacing the four-fan assembly . . . . . . . . . . . . . . . . . . . . . . . . . . . . . . . 118
Replacing the dual NIC card. . . . . . . . . . . . . . . . . . . . . . . . . . . . . . . . . . . 120
Replacing the DVD combo drive . . . . . . . . . . . . . . . . . . . . . . . . . . . . . . . 129
Replacing memory DIMMs . . . . . . . . . . . . . . . . . . . . . . . . . . . . . . . . . . . 132
Replacing the software feature key. . . . . . . . . . . . . . . . . . . . . . . . . . . . . . 135
9 RAID operations 137
Outlining RAID functions . . . . . . . . . . . . . . . . . . . . . . . . . . . . . . . . . . . . 138
Verifying the RAID firmware. . . . . . . . . . . . . . . . . . . . . . . . . . . . . . . . . . 139
Configuring RAID using LSI320-1 controller and Ctrl+M . . . . . . . . . . . 142
Verifying consistency on the drives . . . . . . . . . . . . . . . . . . . . . . . . . . . . . 145
RAID splitting. . . . . . . . . . . . . . . . . . . . . . . . . . . . . . . . . . . . . . . . . . . . . . 147
Replacing the RAID card . . . . . . . . . . . . . . . . . . . . . . . . . . . . . . . . . . . . . 151
10 Replacing or adding voice processing boards 161
M1/CS1000 switch connectivity. . . . . . . . . . . . . . . . . . . . . . . . . . . . . . . . 162
12 CallPilot
Page 13

June 2007 Contents
Locating the voice processing boards. . . . . . . . . . . . . . . . . . . . . . . . . . . . 163
DSP numbering and location . . . . . . . . . . . . . . . . . . . . . . . . . . . . . . . . . . 164
Replacing an MPB96 board . . . . . . . . . . . . . . . . . . . . . . . . . . . . . . . . . . . 165
Upgrading to high capacity. . . . . . . . . . . . . . . . . . . . . . . . . . . . . . . . . . . . 175
11 Maintaining the BIOS and system board firmware 185
Configuring the 1005r BIOS and firmware . . . . . . . . . . . . . . . . . . . . . . . 186
BIOS settings . . . . . . . . . . . . . . . . . . . . . . . . . . . . . . . . . . . . . . . . . . . . . . 190
Using system event logs . . . . . . . . . . . . . . . . . . . . . . . . . . . . . . . . . . . . . . 193
Maintaining the onboard video and network cards. . . . . . . . . . . . . . . . . . 196
Index 197
1005r Server Maintenance and Diagnostics 13
Page 14

Contents Standard 1.10
14 CallPilot
Page 15

Chapter 1
How to get Help
This chapter explains how to get help for Nortel products and services.
Getting Help from the Nortel Web site
The best way to get technical support for Nortel products is from the Nortel
Technical Support Web site:
www.nortel.com/support
This site provides quick access to software, documentation, bulletins, and
tools to address issues with Nortel products. From this site, you can:
download software, documentation, and product bulletins
search the Technical Support Web site and the Nortel Knowledge Base
for answers to technical issues
sign up for automatic notification of new software and documentation for
Nortel equipment
open and manage technical support cases
Getting Help over the phone from a Nortel Solutions Center
If you do not find the information you require on the Nortel Technical
Support Web site, and you have a Nortel support contract, you can also get
help over the phone from a Nortel Solutions Center.
In North America, call 1-800-4NORTEL (1-800-466-7835).
Outside North America, go to the following Web site to obtain the phone
number for your region:
1005r Server Maintenance and Diagnostics 15
Page 16

How to get Help Standard 1.10
www.nortel.com/callus
Getting Help from a specialist by using an Express Routing Code
To access some Nortel Technical Solutions Centers, you can use an Express
Routing Code (ERC) to quickly route your call to a specialist in your Nortel
product or service. To locate the ERC for your product or service, go to:
www.nortel.com/erc
Getting Help through a Nortel distributor or reseller
If you purchased a service contract for your Nortel product from a
distributor or authorized reseller, contact the technical support staff for that
distributor or reseller.
16 CallPilot
Page 17

Chapter 2
Outlining maintenance and diagnostics activities
In this chapter
1005r server features 18
Maintenance and diagnostics overview 22
1005r Server Maintenance and Diagnostics 17
Page 18

Outlining maintenance and diagnostics activities Standard 1.10
1005r server features
Note: To comply with the EU (European Union) RoHS directive, some
of the part numbers now contain an E5 or E6 suffix. For example, part
number NTRH2014 is now NTRH2014E6. The part numbers in this
guide do not contain a suffix.
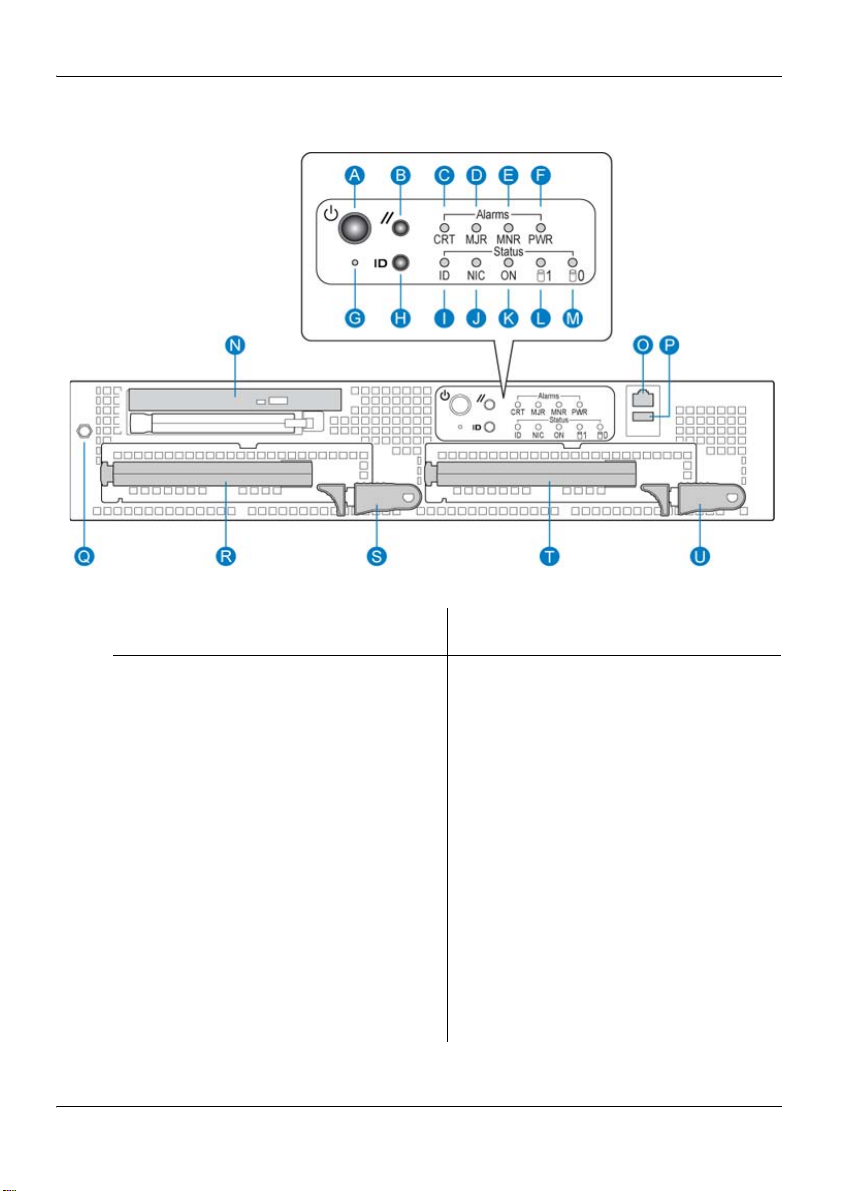
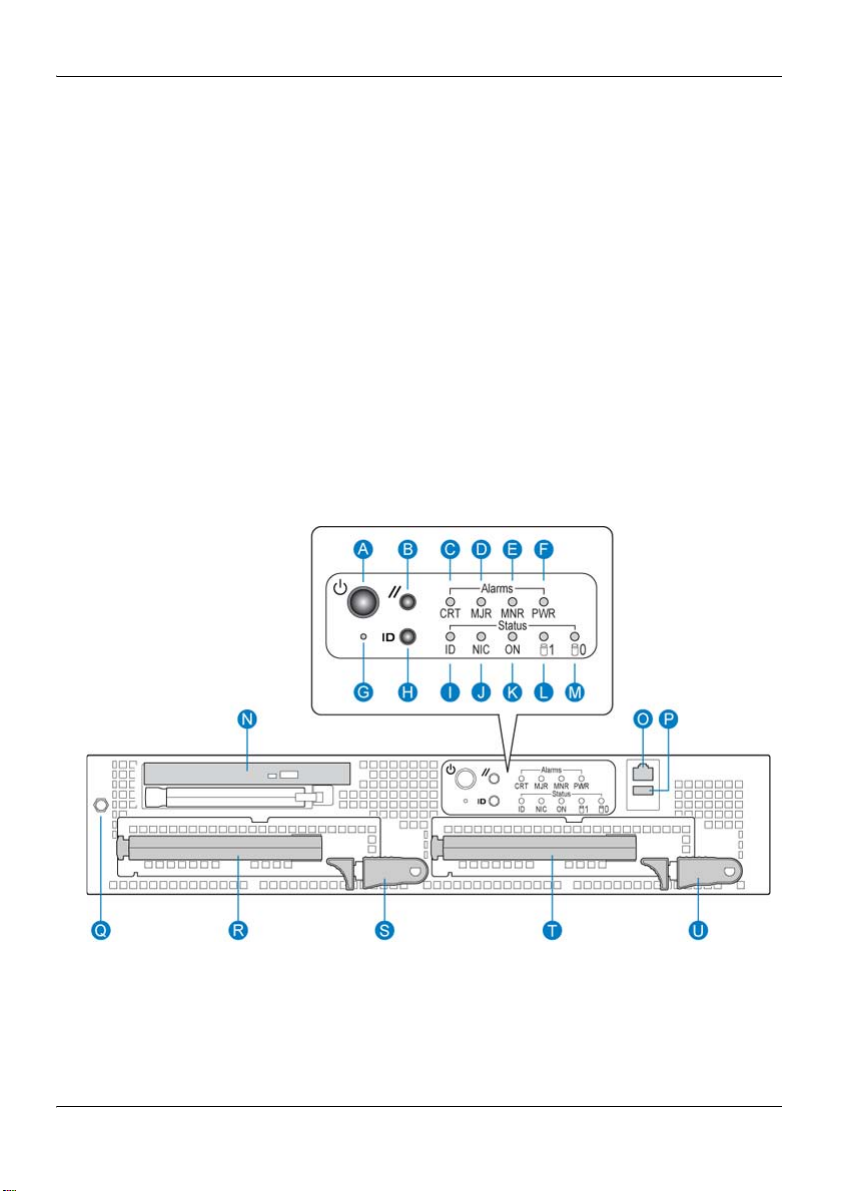
Front control panel and features
The following diagram shows the front view of the 1005r server chassis
with the bezel cover removed. When the bezel cover is on, the DVD
connections, controls, alarm LEDs, and status LEDs are visible. With the
bezel cover removed, both hard drives, the peripheral DVD/CD/CDRW
drive, the antistatic connection, and the front serial port are accessible.
18 CallPilot
Page 19
June 2007 Outlining maintenance and diagnostics activities
Figure 1: Front panel controls
Label Control or feature Label Control or feature
A Power switch L HDD1 activity
B Reset switch M HDD0 activity
C Critical alarm LED N DVD/CD/CDRW LED and
eject button
D Major alarm LED O Front connection to comm
2 serial port
E Minor alarm LED P USB 2
F Power alarm LED Q Electrostatic discharge
(ESD) connection
G NMI switch (not used) R Hard drive 1 pull handle
1005r Server Maintenance and Diagnostics 19
Page 20
Outlining maintenance and diagnostics activities Standard 1.10
Label Control or feature Label Control or feature
H ID switch S Hard drive 1 release lever
I ID LED T Hard drive 0 pull handle
J NIC activity LED U Hard drive 0 release lever
K Status LED
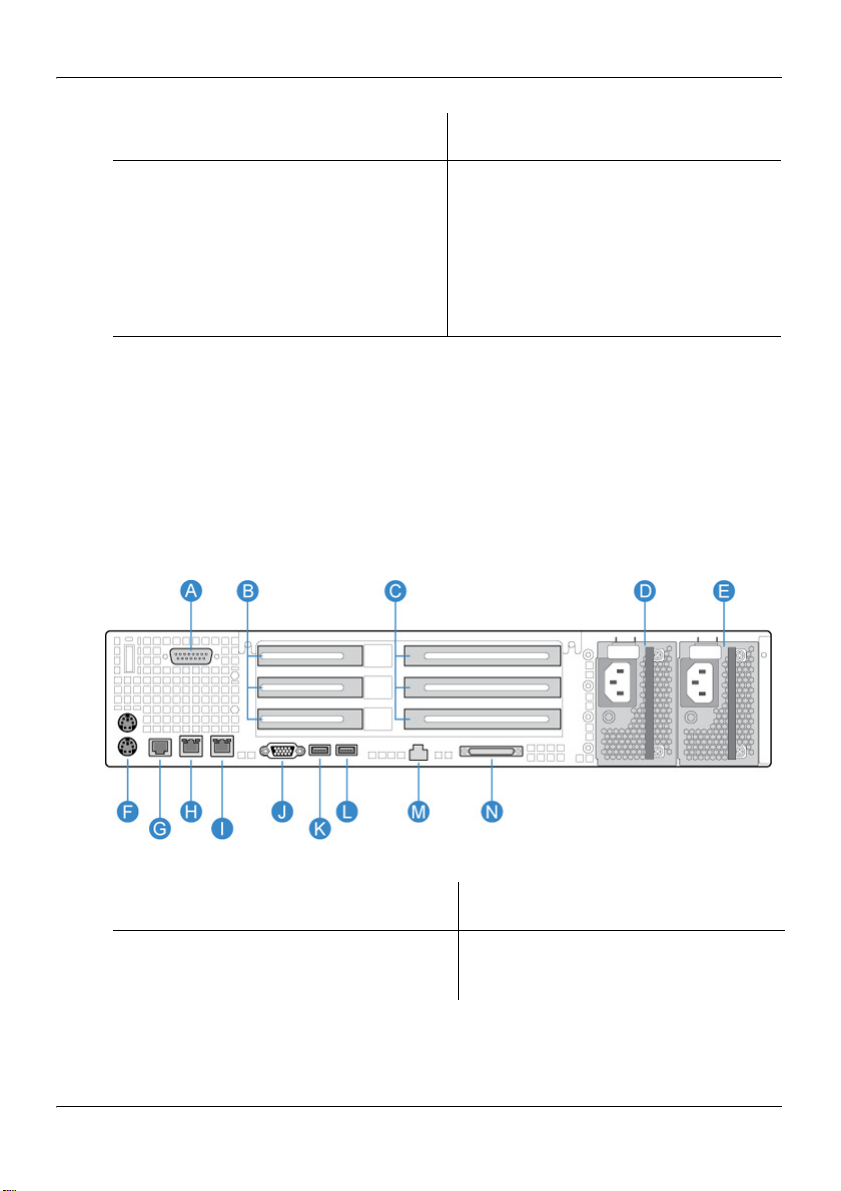
Back panel controls and features
The following diagram shows the back panel controls. The features on
the right are the AC power supply banks. The PCI card brackets are in
the middle of the back panel while the connectors and ports are along the
bottom and left side.
Figure 2: Back panel controls and features
Label Control or feature Label Control or feature
A DB15 Telco alarm
H RJ45 NIC 1 connector
connector (not used)
20 CallPilot
Page 21

June 2007 Outlining maintenance and diagnostics activities
Label Control or feature Label Control or feature
B PCI low-profile card
I RJ45 NIC 2 connector
brackets. Numbered (1, 2, 3)
from top to bottom.
C PCI full-size card brackets.
J Video connector
Numbered (1, 2, 3) from top
to bottom.
DPower supply 1 KUSB 1
EPower supply 2 L USB 0
F PS/2 mouse and keyboard
connectors
G Rear connection to comm 2
M Server management LAN
port
N External SCSI tape drive
serial port
1005r Server Maintenance and Diagnostics 21
Page 22

Outlining maintenance and diagnostics activities Standard 1.10
Maintenance and diagnostics overview
The maintenance and diagnostic activities discussed in this guide are
divided into two groups of activities:
troubleshooting and diagnostics (identifying the cause of system
problems and resolving them)
performing hardware maintenance
This guide is for administrators, technicians, and engineers responsible
for maintaining a CallPilot server. This guide assumes that you have
basic computing skills and are familiar with the necessary safety
procedures.
If you cannot resolve your system problems with the resources described
in this guide, you can also refer to the Troubleshooting Guide (555-7101-
501).
Note: Nortel continually updates the Troubleshooting Guide. It is
available from the Partner Information Center (PIC) at
www.nortel.com/pic.
For information about restarting, shutting down, and powering up the
CallPilot server, see the Installation and Configuration Task List (555-
7101-210). You can be asked to perform one or more of these tasks while
maintaining your server.
Your CallPilot server comes preinstalled with the Windows operating
system and CallPilot server software. If your CallPilot server no longer
functions because of a software problem, you may need to reinstall the
CallPilot software or rebuild the system.
Note: If you load the firmware on the server, both power supplies and
hard drives must be connected and the hard drives must be online. If a
failure occurs on any of these components it is not reported by the server
LEDs or by ISM.
22 CallPilot
Page 23

June 2007 Outlining maintenance and diagnostics activities
Replacement parts
Before replacing any parts on your server, refer to the Nortel product
catalog for the part codes.
CAUTION
.
The use of parts that are not supplied by Nortel can cause
serious system problems or void your Nortel warranty.
Preparing for maintenance activities
Before you proceed with hardware maintenance activities, review the
1005r Server Hardware Installation (555-7101-228) guide for the
following information:
required tools and equipment
recommended safety precautions for electrostatic discharge,
handling cards, and handling your server
Risk of system damage
1005r Server Maintenance and Diagnostics 23
Page 24
Outlining maintenance and diagnostics activities Standard 1.10
Reference documents
CallPilot Customer Documentation Map
Fundamentals
CallPilot Fundamentals Guide (555-7101-010)
Planning and Engineering
Planning and Engineering Guide (555-7101-101)
Network Planning Guide (555-7101-102)
Data Networking for Voice over IP Guide (553-3001-160)
Installation and Configuration
Upgrade and Platform Migration Guide (555-7101-207)
Installation and Configuration Task List Guide (555-7101-210)
Server Installation Guides
201i Server Hardware Installation Guide (555-7101-220)
703t Server Hardware Installation Guide (555-7101-226)
1002rp Server Hardware Installation Guide (555-7101-205)
1005r Server Hardware Installation Guide (555-7101-228)
Configuration and Testing Guides
Meridian 1 and CallPilot Server Configuration Guide (555-7101-222)
T1/SMDI and CallPilot Server Configuration Guide (555-7101-224)
Succession 1000 System and CallPilot Server Configuration Guide (555-7101-510)
Unified Messaging Software Installation
Desktop Messaging and MyCallPilot Installation Guide (555-7101-505)
Administration
Administrator's Guide (555-7101-301)
Software Administration and Maintenance Guide (555-7101-202)
Desktop Messaging and MyCallPilot Administration Guide (555-7101-503)
Meridian Mail to CallPilot Migration Guide (555-7101-801)
Application Builder Guide (555-7101-325)
Reporter Guide (555-7101-310)
Maintenance
Troubleshooting Guide (555-7101-501)
Server Maintenance and Diagnostics
201i Server Maintenance and Diagnostics Guide (555-7101-119)
703t Server Maintenance and Diagnostics Guide (555-7101-227)
1002rp Server Maintenance and Diagnostics Guide (555-7101-206)
1005r Server Maintenance and Diagnostics Guide (555-7101-512)
Symposium, M1/Succession 1000, and Voice Processing Guide (297-2183-909)
End User Information
End User Cards End User Guides
Unified Messaging Quick Reference Card
Unified Messaging Wallet Card
A-Style Command Comparison Card
S-Style Command Comparison Card
Menu Interface Quick Reference Card
Alternate Command Interface Quick Reference Card
Multimedia Messaging User Guide
Speech Activated Messaging User Guide
Desktop Messaging User Guide for Microsoft Outlook
Desktop Messaging User Guide for Lotus Notes
Desktop Messaging User Guide for Novell Groupwise
Desktop Messaging User Guide for Internet Clients
MyCallPilot User Guide
24 CallPilot
Page 25

Chapter 3
Troubleshooting your CallPilot system
In this chapter
Startup diagnostics overview 26
Basic hardware check 27
Power-On Self-Test diagnostics 30
Interpreting BIOS error messages 32
What to do when the server fails to boot into service 36
Interpreting hard drive LEDs 38
Performing a hardware shutdown 39
1005r Server Maintenance and Diagnostics 25
Page 26

Troubleshooting your CallPilot system Standard 1.10
Startup diagnostics overview
This section contains procedures for interpreting the startup diagnostics
on the 1005r server.
Types of startup diagnostics
The following types of startup diagnostics are available on the server:
basic hardware check (front panel LEDs)
Power-On Self-Test (POST) diagnostics
SCSI hard drive controller diagnostics or RAID controller
diagnostics
These diagnostics are available at initial system startup or after any
1005r server reset.
26 CallPilot
Page 27
June 2007 Troubleshooting your CallPilot system
Basic hardware check
This section describes some basic checks that you can do when you start
up the server.
To run the startup test
1 Ensure system is powered down and AC cords are disconnected.
Wait five seconds before turning on the power again.
2 Apply AC power to the server by plugging in the first AC cord and
then the second AC cord. Observe the front panel display.
Figure 3: 1005r front panel.
Result: All the LEDs on the front panel illuminate for a fraction of a
second.
Note: The back panel LEDs on each power supply start blinking
green when the AC power is applied and then turn solid green after
1005r Server Maintenance and Diagnostics 27
Page 28

Troubleshooting your CallPilot system Standard 1.10
a couple of seconds. When the AC power is removed from one
power supply, it’s LED turns amber. If there is a hardware problem
with the power supply or it is not functioning properly, the power
supply LED is red.
Note: Refer to “Front control panel and features” on page 18 for
details of the front panel.
3 Check that all the alarm LEDs (C to F) are illuminated amber. If not,
refer to the following table for functional descriptions of fault LEDs.
Table 1: Alarm fault LEDs
LED Functional description
CRT A critical system fault is an error or event with a fatal system
impact. The system cannot continue to operate.
MJR A major system fault is an error or event with a discernible
impact on system operation. The system can continue to
operate but with reduced performance or features.
MNR A minor system fault is an error or event with little impact on
system operation. The system continues to operate.
PWR A power supply fault indicates that one of the power supplies
is not providing power. The MJR LED is also lit.
4 Boot the system by pressing the power button on the front of the
CallPilot 1005r server.
5 Observe the following server actions:
The hard drives (R and T) spin up, and the amber hard drive
activity LEDs on the front panel display (HDD0 and HDD1)
extinguish, and then flash with activity.
The DVD combo LED illuminates temporarily as the system
checks the DVD combo drive (N).
6 Check the monitor for any error messages as the server counts
RAM and completes a POST.
28 CallPilot
Page 29

June 2007 Troubleshooting your CallPilot system
For more information about POST, see “Power-On Self-Test
diagnostics” on page 30.
1005r Server Maintenance and Diagnostics 29
Page 30

Troubleshooting your CallPilot system Standard 1.10
Power-On Self-Test diagnostics
The Power-On Self-Test (POST) is a system diagnostic program (stored
in the BIOS (Basic Input/Output)) that runs each time the 1005r server
starts. The function of the POST is to test system components and
display status messages.
To run the POST
1 Power up the CallPilot server and monitor.
Result: After a few seconds, the POST begins to run.
After the memory test, various screen prompts and messages
appear. The screen prompts can be accompanied by a single beep.
2 Observe the screen for any error messages and listen for POST
beep codes. When the POST is complete, the server beeps once.
If the server halts before the POST is finished, the server emits a
beep code indicating that a fatal system error requires immediate
attention. For more information, see “Interpreting POST
diagnostics” on page 30.
If the POST can display a message on the monitor, the server emits
two beeps as the message appears.
Record the message that appears on the monitor and the beep
code that you hear. This information is useful if you need assistance
from your technical support representative.
Interpreting POST diagnostics
This section provides an explanation of the POST diagnostic codes.
30 CallPilot
Page 31

June 2007 Troubleshooting your CallPilot system
POST beep codes
If an error occurs before video initialization, the POST emits beep codes
that indicate errors in hardware, software, or firmware.
A beep code is a series of separate tones, each equal in length.
ATTENTION
If your system emits POST beep codes, record the beep
code sequence and then call Nortel technical support before
attempting to correct the problem. Ensure you have the
required system information. Some POST beep codes are
fatal and can require that you replace the server.
Table 2: POST beep codes
Beep count Description
1, 2, or 3 Memory error.
4 – 7 or 9 – 11 A fatal error indicates a possible serious system problem
occurred.
8 A problem with the onboard video card occurred
indicating a fault on the server board.
1005r Server Maintenance and Diagnostics 31
Page 32

Troubleshooting your CallPilot system Standard 1.10
Interpreting BIOS error messages
When a recoverable error occurs during the POST, an error message
appears describing the problem.
ATTENTION
If BIOS error messages appear, record the error messages
and then call Nortel technical support before attempting to
correct the problem.
BIOS error messages
BIOS error messages appear on the video monitor. Refer to the following
table for a description of the messages.
Table 3: BIOS error messages
Error message Description
GA20 Error An error occurred with Gate A20 when
Pri Master HDD Error
Pri Slave HDD Error
Sec Master HDD Error
Sec Slave HDD Error
switching to protected mode during the
memory test.
Could not read sector from
corresponding drive.
ATAPI Incompatible Drive
Pri Master Drive
Pri Slave Drive
Sec Master Drive
Sec Slave Drive
32 CallPilot
The corresponding drive is not an
ATAPI (Advanced Technology
Attachment Packet Interface) device.
Run Setup to make sure the device is
selected correctly.
Page 33

June 2007 Troubleshooting your CallPilot system
Error message Description
A: Drive Error No response from the disk drive.
CMOS Battery Low The battery is losing power. Replace
the battery soon.
CMOS Display Type Wrong The display type is different from that
stored in CMOS. Check Setup to make
sure the type is correct
CMOS Checksum Bad The CMOS checksum is incorrect.
CMOS memory can be corrupted. Run
Setup to reset the values.
CMOS Settings Wrong The CMOS values are not the same as
the last boot. Either these values are
corrupted or the battery failed.
CMOS Date/Time Not Set The time or date values stored in
CMOS are invalid. Run Setup to set the
correct values.
DMA Error An error occurred during the read/write
test of the DMA (Direct Memory
Access) controller.
FDC Failure An FDC Failure error occurred while
trying to access the diskette drive
controller.
HDC Failure An error occurred trying to access the
hard disk controller.
Checking NVRAM.... The NVRAM (Non-Volatile Random
Access Memory) is being checked to
see if it is valid.
1005r Server Maintenance and Diagnostics 33
Page 34

Troubleshooting your CallPilot system Standard 1.10
Error message Description
Update OK! The NVRAM is invalid and has been
updated.
Updated Failed The NVRAM is invalid and cannot be
updated.
Keyboard Error An error in the keyboard connection.
Make sure the keyboard is connected
properly.
KB/Interface Error The keyboard interface test failed.
Memory Size Decreased The memory size has decreased since
the last boot. If you have not removed
any memory, then the memory can be
faulty.
Memory Size Increased The memory size has increased since
the last boot. If you have not added any
memory, there is a problem with the
system.
Memory Size Changed The memory size has changed since the
last boot. If you did not add or remove
any memory, then the memory can be
faulty.
No Boot Device Available. The system did not find a device to
boot from.
Off Board Parity Error A parity error occurred on an offboard
card. This error is followed by the card
address.
On Board Parity Error A parity error occurred in onboard
memory. This error is followed by the
card address.
34 CallPilot
Page 35

June 2007 Troubleshooting your CallPilot system
Error message Description
Parity Error A parity error occurred in onboard
memory at an unknown address.
NVRAM / CMOS / PASSWORD
cleared by Jumper
NVRAM, CMOS, and passwords have
been cleared. Power the system down
and remove the jumper.
<CTRL_N> Pressed The CMOS is ignored and NVRAM is
cleared. You must enter Setup.
1005r Server Maintenance and Diagnostics 35
Page 36

Troubleshooting your CallPilot system Standard 1.10
What to do when the server fails to boot into service
This section suggests tasks you can perform to determine why the server
fails the bootup cycle.
To determine why the server fails to boot to
Windows
If CallPilot fails to boot to Windows, follow these steps:
1 Make a note of any diagnostic codes.
2 Press the power switch to restart the server.
3 View the diagnostic codes for failures during the boot sequence.
4 Retrieve the system event log. Refer to “To save system event logs
to a USB media drive” on page 194.
5 Refer to the Troubleshooting Guide (555-7101-501) for other
suggestions. If you still cannot determine the cause of the startup
failure, call your Nortel technical support representative.
To determine why CallPilot fails to come into
service
If CallPilot fails to come into service, follow these steps:
1 Make a note of any diagnostic codes.
2 Press the power switch to restart the server.
3 View the diagnostic codes for failures during the boot sequence.
4 View the event logs. For instructions, see “Viewing event logs” on
page 43.
36 CallPilot
Page 37

June 2007 Troubleshooting your CallPilot system
5 Refer to the Troubleshooting Guide (555-7101-501) for other
suggestions. If you still cannot determine the cause of the startup
failure, call your Nortel technical support representative.
1005r Server Maintenance and Diagnostics 37
Page 38

Troubleshooting your CallPilot system Standard 1.10
Interpreting hard drive LEDs
Refer to L and M in Figure 3 on page 27 for the location of the hard drive
LEDs for drive 0 and drive 1.
LED color Hard drive status
Green/blinking green Normal
Amber Critical but recoverable condition.
Often during a controlled condition
such as a RAID split.
Red Failure. This LED color is a major
event, and the server must be attended
to immediately.
38 CallPilot
Page 39

June 2007 Troubleshooting your CallPilot system
Performing a hardware shutdown
If you cannot shut the server down using Windows, press the power
switch on the front panel and hold it in for more than 1 second. The
server saves all system data and then powers off.
1005r Server Maintenance and Diagnostics 39
Page 40

Troubleshooting your CallPilot system Standard 1.10
40 CallPilot
Page 41

Chapter 4
Using Windows online diagnostic tools
In this chapter
Overview 42
Viewing event logs 43
Using TCP/IP diagnostic tools 48
Using the chkdsk utility 58
1005r Server Maintenance and Diagnostics 41
Page 42

Using Windows online diagnostic tools Standard 1.10
Overview
This section describes how to access the run-time online diagnostic tools
provided by the Windows server software. Use the following tools when
a serious problem prevents the use of the CallPilot diagnostic tools that
are available in CallPilot Manager:
Windows Event Viewer
TCP/IP diagnostics
chkdsk utility
CAUTION
.
Do not run any utilities that are not documented in this guide.
Risk of software corruption
42 CallPilot
Page 43

June 2007 Using Windows online diagnostic tools
Viewing event logs
If one or more messages appear on the monitor during the server startup
cycle, use the following diagnostic tools to determine what event or fault
occurred.
Hardware system event log
Windows Event Viewer on the 1005r server
CallPilot Event Browser or Alarm Monitor in CallPilot Manager
Note: The Event Browser and Alarm Monitor include online Help for
events to help you resolve the problem. If you cannot log on to the
CallPilot system using a Web browser due to server problems, then use
the Windows Event Viewer.
You can view the Hardware system event log from ISM, or by booting
from the CallPilot image DVD and selecting the system event log from
the menu.
If the server does not boot up, use the Nortel CallPilot Image Utilities on
the DVD to view system event logs. Refer to “Using system event logs”
on page 193.
1005r Server Maintenance and Diagnostics 43
Page 44

Using Windows online diagnostic tools Standard 1.10
Types of Windows event logs
Three types of event logs are available from the Windows Event Viewer,
as follows:
Log type Description
System Logs events by Windows components, including
RRAS or other Windows services.
Security Logs security events, such as logons, logoffs, and
illegal access. This option is available to users with
Administrative access.
Application Logs events by application, such as database file
errors.
44 CallPilot
Page 45

June 2007 Using Windows online diagnostic tools
To use the operating system Event Viewer
1 Click Start > Programs > Administrative Tool s > Event Viewer.
Result: The Event Viewer window appears.
Figure 4: Event Viewer
1005r Server Maintenance and Diagnostics 45
Page 46

Using Windows online diagnostic tools Standard 1.10
2 To view a log, click the name of the log in the left pane of the
window.
The following illustration shows an example of the Application log.
Figure 5: Application log
The following illustration shows an example of the System log.
46 CallPilot
Page 47

June 2007 Using Windows online diagnostic tools
Figure 6: System log
Note: The Security log, which is available to administrators, is not
shown.
3 Look for error codes flagged with or that have occurred
since the last startup.
Note: Each error is date- and time-stamped. indicates major or
critical errors. indicates minor errors, and indicates
ii
information.
4 Double-click an error to determine the cause of the error.
Result: An Event detail dialog box appears detailing the description
of the error. Use the description to help determine how to resolve
errors.
Note: If the error persists or the error description does not suggest
a solution, contact your Nortel support representative.
5 Click Close.
Result: The Event Viewer reappears.
6 Click Log > Exit.
Result: The Event Viewer closes.
1005r Server Maintenance and Diagnostics 47
Page 48

Using Windows online diagnostic tools Standard 1.10
Using TCP/IP diagnostic tools
This section describes the following TCP/IP diagnostic tools that are
available for the network adapter:
ipconfig
ping
tracert
arp
nbtstat
netstat
These utilities help you to verify network connectivity, test the network
interface, and isolate any configuration problems.
The ipconfig command
The ipconfig command displays IP configuration information.
ipconfig default
If you run the command without flags, it displays the IP address, subnet
mask, and default gateway for each adapter bound to TCP/IP.
48 CallPilot
Page 49

June 2007 Using Windows online diagnostic tools
ipconfig command syntax
The ipconfig command uses the following syntax:
ipconfig /[ ]
The following flags are available for the ipconfig command.
Table 4: ipconfig command extensions
Flag Description
/? Displays Help information.
/all Displays full configuration information.
/release Releases the IP address for the specified adapter.
/renew Renews the IP address for the specified adapter.
To run the ipconfig command from Windows
1 Click Start > Programs > Accessories > Command Prompt.
Result: The Command Prompt dialog box appears.
2 Type ipconfig <parameters>.
Example: ipconfig /all
3 Press Enter.
Result: The system runs the ipconfig utility.
4 Type Exit to exit the Command Prompt dialog box and return to
Windows.
1005r Server Maintenance and Diagnostics 49
Page 50

Using Windows online diagnostic tools Standard 1.10
The ping command
The ping command sends an echo request to a specified host. Use this
command to verify network connectivity to the remote device.
Ping command syntax
The ping command uses the following syntax:
ping [-t] [-a] [-n count] [-l size] [-f] [-i TTL]
[-v TOS] [-r count] [-s count]
[[-j host-list] | [-k host-list]]
[-w timeout] destination-list
Table 5: ping command extensions
Parameter Description
-t Pings the specified host until interrupted.
-a Resolves addresses to host names.
-n count Specifies the number of echo requests to send.
-l size Sends buffer size.
-f Sets Don’t Fragment flag in packet.
-i TTL Specifies the Time To Live.
-v TOS Specifies the Type Of Service.
-r count Specifies the number of Record route for count hops.
-s count Specifies the number of Time stamp for count hops.
-j host-list Specifies the Loose source route along host list.
-k host-list Specifies the Strict source route along host list.
-w timeout Specifies the Timeout in milliseconds to wait for each
reply.
50 CallPilot
Page 51

June 2007 Using Windows online diagnostic tools
To run the ping command from Windows
1 Click Start > Programs > Accessories > Command Prompt.
Result: The Command Prompt dialog box appears.
2 Type ping <destination IP address> (for example, ping
200.286.32.0) or ping <computer name>.
3 Press Enter.
Result: The system displays the ping results.
4 Type Exit to exit the Command Prompt dialog box and return to
Windows.
The tracert command
This utility determines the route taken to a destination.
How tracert works
The tracert utility follows several steps to complete its task:
Tracert sends Internet Control Message Protocol (ICMP) echo
packets with varying Time-To-Live (TTL) values to the destination.
Each router along the path must decrement the TTL on a packet by
at least 1 before forwarding it, so the TTL is effectively a hop count.
When the TTL on a packet reaches 0, the router sends back an
ICMP Time Exceeded message to the source system.
Tracert determines the route by sending the first echo packet with a
TTL of 1, and incrementing the TTL by 1 each subsequent
transmission until the target responds or the maximum TTL is
reached.
Tracert then examines the ICMP Time Exceeded messages sent
back by intermediate routers.
1005r Server Maintenance and Diagnostics 51
Page 52

Using Windows online diagnostic tools Standard 1.10
Tracert syntax
The tracert command uses the following syntax:
tracert [-d] [-h maximum_hops] [-j host_list]
[-w timeout] [target_name]
Tracert parameters
The following table shows the tracert parameters.
Table 6: Tracert parameters
Parameter Description
-d Specifies not to resolve addresses to host names.
-h maximum_hops Specifies the maximum number of hops to search
for the target.
-j host-list Specifies a loose source route along the host list.
-w timeout Waits the number of milliseconds specified by the
timeout for each reply.
target_name Specifies the name of the target host.
To run the tracert command from Windows
1 Click Start > Programs > Accessories > Command Prompt.
Result: The Command Prompt dialog box appears.
2 Type the following command:
tracert [-d] [-h maximum_hops] [-j host_list] [-w timeout]
[target_name]
Example: tracert 200.286.0.32
3 Press Enter.
52 CallPilot
Page 53

June 2007 Using Windows online diagnostic tools
Result: The system runs the tracert utility.
4 Type Exit to exit the Command Prompt dialog box and return to
Windows.
The arp command
The arp command displays and modifies the IP-to-physical address
translation tables used by Address Resolution Protocol (ARP).
ARP command syntax
The ARP command uses the following syntax:
arp -s inet_addr eth_addr [if_addr]
arp -d inet_addr [if_addr]
arp -a [inet_addr] [-N if_addr]
ARP command parameters
Table 7: ARP command parameters
Parameter Description
-a Displays current arp entries by interrogating the current
protocol data. If inet_addr is specified, the IP and
physical addresses for the specified computer appear. If
more than one network interface uses arp, entries for
each arp table appear.
-g Same as -a.
inet_addr Specifies an Internet address.
if_addr Specifies the Internet address of the interface where the
address translation table can be modified. If not present,
the first applicable interface is used.
eth_addr Specifies a physical address.
1005r Server Maintenance and Diagnostics 53
Page 54

Using Windows online diagnostic tools Standard 1.10
Parameter Description
-N if_addr Displays the arp entries for the network interface
specified by if_addr.
-d Deletes the host specified by inet_addr.
-s Adds the host and associates the Internet address
inet_addr with the physical address eth_addr. The
physical address is given as six hexadecimal bytes
separated by hyphens. The entry is permanent.
To run the arp command from Windows
1 Click Start > Programs > Accessories > Command Prompt.
Result: The Command Prompt dialog box appears.
2 Type arp with the required parameters (for example, arp -g
200.286.0.32).
3 Press Enter.
Result: The system runs the arp command.
4 Type Exit to exit the Command Prompt dialog box and return to
Windows.
The nbtstat command
The nbtstat command displays protocol statistics and current TCP/IP
connections using NBT.
Nbtstat command syntax
The nbtstat command uses the following syntax:
nbtstat [-a remotename] [-A IP address] [-c] [-n]
[-R] [-r] [-S] [-s] [interval]
54 CallPilot
Page 55

June 2007 Using Windows online diagnostic tools
nbstat command parameters
Table 8: nbstat command parameters
Parameter Description
-a remotename Lists the remote computer name table using its name.
-A IP address Lists the remote computer name table using its IP
address.
-c Lists the contents of the NetBIOS name cache giving
the IP address of each name.
-n Lists local NetBIOS names. Registered indicates that
the name is registered by broadcast (Bnode) or WINS
(other node types).
-R Reloads the LMHOSTS file after purging all names
from the NetBIOS name cache.
-r Lists name resolution statistics for Windows
networking name resolution Windows computer
configured to use WINS, this option returns the
number of names resolved and registered through
broadcast or through WINS.
-S Displays both client and server sessions, listing the
remote hosts by IP address.
-s Displays both client and server sessions and attempts
to convert the remote host IP address to a name using
the HOSTS file.
interval Displays selected statistics, pausing interval seconds
between each display. Press Ctrl+C to stop displaying
statistics. Without this parameter, nbtstat prints the
current configuration information once.
1005r Server Maintenance and Diagnostics 55
Page 56

Using Windows online diagnostic tools Standard 1.10
To run the nbtstat command from Windows
1 Click Start > Programs > Accessories > Command Prompt.
Result: The Command Prompt dialog box appears.
2 Type nbtstat with the required parameters.
3 Press Enter.
Result: The system runs the nbtstat utility.
4 Type Exit to exit the Command Prompt dialog box and return to
Windows.
56 CallPilot
Page 57

June 2007 Using Windows online diagnostic tools
The netstat command
The netstat command displays current TCP/IP network connections and
protocol statistics.
Netstat command syntax
The netstat command uses the following syntax:
netstat [-a] [-e] [-n] [-s] [-p proto] [-r] [interval]
netstat command parameters
Table 9: netstat command parameters
Parameter Description
-a Displays all connections and listening ports.
-e Displays Ethernet statistics. This can be combined with
the -s option.
-n Displays addresses and port numbers in numeric form.
-s Displays statistics for each protocol.
-p proto Shows connections for the protocol specified by proto.
Proto can be tcp or udp. If used with the -s option, proto
can be tcp, udp, or ip.
-r Displays the contents of the routing table.
interval Redisplays selected statistics, pausing between each
display. Press Ctrl+C to stop redisplaying.
1005r Server Maintenance and Diagnostics 57
Page 58

Using Windows online diagnostic tools Standard 1.10
Using the chkdsk utility
The chkdsk utility checks a specified disk on the server and displays a
status report. You can run the utility on drives C, D, E, or F. It is an
online utility, but it reduces system performance while it runs.
The chkdsk utility checks for errors at the Windows file system level.
CallPilot can be affected by errors at both the Windows and CallPilot file
system levels. The chkdsk utility does not detect CallPilot file system
level errors.
Note: A version of this utility, called autocheck, automatically runs
during Windows startup. Output from this utility appears on the blue
startup screen.
Chkdsk utility syntax
The chkdsk utility uses the following syntax:
chkdsk [drive:][path]filename] [/F] [/V] [/R]
Chksdsk utility parameters
Table 10: Chksdsk utility parameters
Parameter Description
drive: Drive letter of the drive that you want to check.
filename Names of files to check for fragmentation.
/F Optional parameter to fix errors on the disk.
/V Optional parameter to display the full pathname of
every file on the disk.
/R Optional parameter to locate bad sectors and to
recover readable information.
58 CallPilot
Page 59

June 2007 Using Windows online diagnostic tools
To run the chkdsk utility from Windows
1 Click Start > Programs > Accessories > Command Prompt.
Result: The Command Prompt dialog box appears.
2 Type chkdsk <drive letter:> (for example, chkdsk c:).
3 Press Enter.
Result: The system runs the chkdsk utility.
4 Type Exit to exit the Command Prompt dialog box and return to
Windows.
1005r Server Maintenance and Diagnostics 59
Page 60

Using Windows online diagnostic tools Standard 1.10
60 CallPilot
Page 61

Chapter 5
Monitoring server hardware
In this chapter
ISM overview 62
1005r Server Maintenance and Diagnostics 61
Page 62

Monitoring server hardware Standard 1.10
ISM overview
Intel Server Manager (ISM) is a server management tool installed on
your 1005r server. Use ISM to monitor hardware health and server
performance. Set up the following types of tasks using ISM:
Monitor the hardware sensors on the managed server.
Monitor the performance of the server using data collected from the
operating system.
Receive alert messages when the sensor values are out of range, or
when a performance threshold is reached.
Refer to the Help files in the ISM screen for more information.
62 CallPilot
Page 63

Chapter 6
Monitoring multimedia hardware
In this chapter
Understanding fault management 64
Alarm Monitor 66
Event Browser 68
Channel and Multimedia Monitors 70
The Maintenance screen 71
Viewing component states 75
Starting and stopping components 78
Running integrated diagnostics 82
Viewing the last diagnostics result 85
Working with the Multimedia Monitor 87
Working with the Channel Monitor 89
1005r Server Maintenance and Diagnostics 63
Page 64

Monitoring multimedia hardware Standard 1.10
Understanding fault management
Fault management is a subsystem within CallPilot that detects and
notifies you of potential or real hardware problems with the multimedia
hardware. CallPilot monitors events in the multimedia hardware and
raises an alarm when a fault occurs.
Event processing
An event is any change in system configuration or operational state. An
event is also any action taken by the system that requires user
notification such as a faulty MPB96 card switching to disabled status.
All events are reported to the fault management server. The fault
management server lets the CallPilot server listen and respond to its
clients. The interaction is called event processing and the server detects
hardware faults in the multimedia hardware.
Alarm notification
Alarms are warnings generated by events. Alarms communicate the same
information as events. However, alarms are reported in the Alarm
Monitor instead of the Event Browser and are managed differently than
events.
When an alarm appears in the Alarm Monitor, you must investigate the
problem, isolate it, and then fix the cause of the problem. When you fix
the problem, the alarm is cleared from the Alarm Monitor.
Component dependencies
The status of some components is dependent on the operational status of
other components. If a component fails or is stopped, the dependent
components go out of service.
64 CallPilot
Page 65

June 2007 Monitoring multimedia hardware
Note: The components in your system are based on your CallPilot server
type and switch type. Disregard dependencies for components not in
your system.
Component Dependent components
Media bus All MPBs, all multimedia channels, and all call
channels.
MPB board All multimedia and call channels associated with the
MPB board.
Time switch All multimedia and call channels associated with the
same MPB as the time switch.
MPB96 All multimedia channels on the MPB96 card.
DS30X All DS30X channels associated with the DS30X link.
Detecting hardware problems
Typically, you first become aware of a hardware problem when an alarm
is raised. All hardware faults produce an alarm (or series of alarms,
depending on the problem) in the Alarm Monitor.
Other indications of a hardware problem include the following:
user complaints
call processing difficulties, such as busy signals, static, dropped
calls, connection problems, and cross talk (hearing other
conversations)
system administrator logon difficulties
alert icons on the Maintenance screen
1005r Server Maintenance and Diagnostics 65
Page 66

Monitoring multimedia hardware Standard 1.10
Alarm Monitor
Use the Alarm Monitor to investigate one or more raised alarms.
About alarms
Alarms are warnings generated by events. Alarms communicate the same
information as events. However, alarms are reported in the Alarm
Monitor instead of the Event Browser and are managed differently than
events:
Alarms appear in the Alarm Monitor for Minor, Major, and Critical
events (not Information events). All events can be reported in the
Event Browser (depending on the filtering criteria defined in the
Event Browser).
The first time an event occurs, it generates an alarm that appears in
the Alarm Monitor. If the same event continues to occur, a new
alarm is not generated. Instead, the time and date assigned to the
original generated alarm is updated.
Alarms can be cleared from the Alarm Monitor, but the event that
generated the alarm is not cleared from the event log or the Event
Browser.
Each alarm in the Alarm Monitor has Help text that often provides a
solution to the problem. If the solution is not apparent, use the Event
Browser or the Maintenance screen to further investigate the problem.
To investigate using the Alarm Monitor
1 Run CallPilot Manager and log on.
2 In CallPilot Manager, click System > Alarm Monitor.
66 CallPilot
Page 67

June 2007 Monitoring multimedia hardware
Result: The Alarm Monitor screen appears.
Figure 7: Alarm monitor screen
3 Click the Event Code for the first Critical or Major alarm.
Result: A description of the event appears in a new Web browser
window.
4 Review the description and recovery action.
5 Repeat steps 3 and 4 for more alarms, if necessary.
6 If the solution to the problem is not apparent, make a note of the
event codes and continue the investigation by using the Event
Browser (see “Event Browser” on page 68).
1005r Server Maintenance and Diagnostics 67
Page 68

Monitoring multimedia hardware Standard 1.10
Event Browser
Use the Event Browser to investigate a series of events that occurred
around the time an alarm was raised. The event listing can help you
determine the root cause of a problem.
About events
The Event Browser displays events that are recorded in the server log.
Each event identifies the time the event occurred, the object that
generated the event, and the cause of the event.
Events are classified as Information, Minor, Major, or Critical. By
default, the Event Browser displays the latest 100 critical events.
To investigate using the Event Browser
1 Run CallPilot Manager and log on.
2 In CallPilot Manager, click System > Event Browser.
68 CallPilot
Page 69

June 2007 Monitoring multimedia hardware
Result: The Event Browser screen appears.
Figure 8: Event Browser screen
3 Click an event that appears to be related to the problem, or click an
event that occurred near the time the alarm was raised.
Result: A description of the event appears in a new Web browser
window.
4 View the description and recovery action.
5 Repeat steps 3 and 4 for more events, if necessary.
6 If the solution to the problem is not apparent, contact your Nortel
technical support representative.
Note: For information about how to use the Event Browser, see the
CallPilot Manager online Help.
1005r Server Maintenance and Diagnostics 69
Page 70

Monitoring multimedia hardware Standard 1.10
Channel and Multimedia Monitors
The Channel Monitor shows the status of call channels. The call
channels are the connections between the server and the switch that carry
the call signals to CallPilot.
The Multimedia Monitor shows the status of multimedia channels. The
multimedia channels are the DSP ports that process the calls. They are
the voice, fax, and speech recognition channels.
Disabling call channels
If you must take the CallPilot system out of service to perform software
or hardware maintenance, Nortel recommends that you disable all call
channels first. There are two ways to disable the call channels:
Courtesy stop the channels (preferred method).
When you courtesy stop call channels, CallPilot waits until the
channels are no longer active before disabling them, instead of
suddenly terminating active calls.
Stop the channels.
When you stop channels, you suddenly disable them and terminate
all active calls.
70 CallPilot
Page 71

June 2007 Monitoring multimedia hardware
The Maintenance screen
Use the Maintenance screen in CallPilot Manager to do the following:
Obtain general information about components.
View component states.
Start and stop components.
Run integrated diagnostic tests.
View the results of the last diagnostic test run against a component.
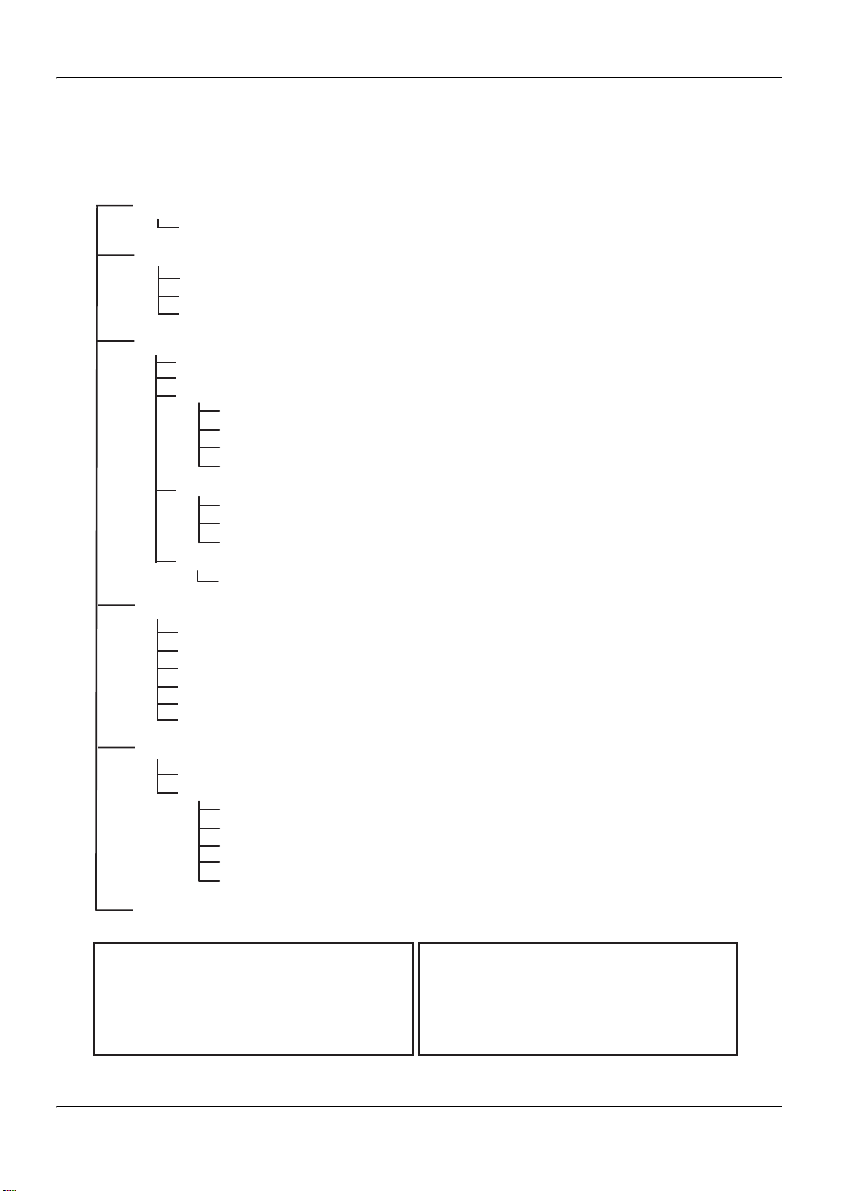
What the Maintenance screen provides
The Maintenance screen identifies the server platform and switch
connectivity type. It also provides a navigation tree that, when expanded,
lists the physical and logical hardware components down the left side of
the screen. To list the server hardware components, click the plus sign
(+) at the top of the tree. To list the subcomponents for each component,
click the plus sign (+) beside the component.
Note: The components that are listed on the Maintenance screen are
based on the CallPilot server type and the switch that is connected to
CallPilot. The examples in this chapter are for illustration purposes and
may not appear exactly the same as your system.
Figure 9 on page 72 shows a partially expanded tree for the 1005r server.
1005r Server Maintenance and Diagnostics 71
Page 72

Monitoring multimedia hardware Standard 1.10
Figure 9: Partially expanded tree for 1005r
When you click a component, the screen refreshes to show the details
about that component. Details are divided into the sections described in
the following table.
72 CallPilot
Page 73

June 2007 Monitoring multimedia hardware
Table 11: Component sections
Section Description
General This section shows general technical information about
the selected component. This typically includes the
following details:
the name, class, type, series, or version of a
component
various capabilities of a component (for example,
whether a component is removable)
Note: This section does not appear for all components.
Maintenance This section shows the state of the selected component.
Use this section to start and stop a component before
running a diagnostic test.
For more information about working with component
states, see the following sections:
“Viewing component states” on page 75
“Starting and stopping components” on page 78
Diagnostics Use the Diagnostics section to run one or more
diagnostic tests, or to view the results of the last
diagnostic tests that were run on the selected
component.
For more information about running diagnostics, see the
following sections:
“Running integrated diagnostics” on page 82
“Viewing the last diagnostics result” on page 85
1005r Server Maintenance and Diagnostics 73
Page 74

Monitoring multimedia hardware Standard 1.10
Maintenance activities for each component
The following table identifies the maintenance activities you can perform
for each component that is listed in the component tree.
Table 12: Maintenance activities
Component
Start /
stop?
Courtesy
stop?
Diagnostics
available?
Replaceable
?
Media Bus Yes No Yes No
MPB96 board Yes No Yes Yes
Time Switch No No No No
DSPs (embedded
MPB boards)
Ye s N o Ye s No
(embedded)
Multimedia channels Yes Yes Yes No
Call channels Yes Yes No No
DS30X link Yes No No No
Note: The MGate card and DS30X cable are replaceable. If you are
having problems with the DS30X link, determine if either one or both of
these items are causing the problem and need to be replaced.
74 CallPilot
Page 75

June 2007 Monitoring multimedia hardware
Viewing component states
View a component state to determine the general condition of the
component, including whether the component is disabled or off duty.
The component state is shown in the Maintenance section of the
Maintenance screen.
Component states
You can determine the state of a component by looking at the State box
in the Maintenance section.
State Description
Active The component is working and currently involved in
processing a call.
Disabled The diagnostic failed.
Idle The component is working but not currently
involved in processing a call.
InTest A diagnostic is running on the resource or device.
Loading The component has started and takes it out of the Off
Duty state.
This state occurs quickly and is immediately
followed by Idle.
Local (Red) Alarm A Receive Loss of Synchronization error occurred
on incoming data over a T1 link and lasted more than
2.5 seconds. This condition exists until
synchronization is recovered and remains recovered
for 12 seconds.
No resources The hardware required for the component to operate
is not installed or is not operating properly.
1005r Server Maintenance and Diagnostics 75
Page 76

Monitoring multimedia hardware Standard 1.10
State Description
Not Configured The device is not configured in CallPilot.
For example, a DSP is not being used because it was
not allocated in the Configuration Wizard.
Off Duty The component has been stopped.
Remote Off Duty The component has been taken out of service at the
switch.
Remote (Yellow)
Alarm
Shutting Down The component is in the process of stopping.
Uninitiated The call processing component has not initialized the
Alert icons
If one of the following icons appears next to a component in the tree,
then the component or one of its subcomponents is experiencing a
problem:
Icon Description
A red alarm exists at the receiving device. This alarm
is sent by the receiving T1 device to CallPilot, and it
remains in effect until the red alarm is cleared at the
receiving device.
This state occurs quickly and is immediately
followed by Off Duty.
resource.
A problem exists with a subcomponent of the selected
component. Expand the tree to locate the subcomponent with the
problem.
A problem exists with the selected component.
76 CallPilot
Page 77

June 2007 Monitoring multimedia hardware
To view the state of a hardware component
1 Run CallPilot Manager and log on.
2 In CallPilot Manager, click Maintenance > Maintenance Admin.
Result: The Maintenance screen appears.
3 Click the plus signs (+) beside the CallPilot server to expand the
component tree.
4 Continue clicking the plus sign (+) until the component you want to
work with is visible.
5 Click the hardware component you want to work with.
Result: The Maintenance screen refreshes to show details about
the component.
6 Scroll down to the Maintenance section.
7 View the state of the selected component in the State box.
1005r Server Maintenance and Diagnostics 77
Page 78

Monitoring multimedia hardware Standard 1.10
Starting and stopping components
When you stop a component, you take it out of service and prevent it
from operating. You must stop a component before you can replace it (if
the component is replaceable) or run a diagnostic test on it.
To bring an out-of-service component back into service, you must start
it.
Start and stop components from the Maintenance section on the
Maintenance screen.
ATTENTION
Nortel recommends that, if possible, you courtesy stop a
component. Courtesy stop is available at the individual
channel level.
To courtesy stop CallPilot, use the following:
Multimedia Monitor - to courtesy stop a range of
multimedia channels
Channel Monitor - to courtesy stop a range of call
(DS30X, also known as DS0) channels
78 CallPilot
Page 79

June 2007 Monitoring multimedia hardware
Stop versus courtesy stop
The following two methods of taking a component out of service allow
you to choose how active calls are affected.
Courtesy stop
A courtesy stop takes the component out of service after the component
finishes processing the active calls.
If the component is currently processing a call, the call is not
dropped; the component remains active until the call is finished.
If the component is not currently in use, it is taken out of service
immediately.
Courtesy stop is the preferred method for taking a component out of
service.
Stop
A stop takes the component out of service immediately, regardless of
whether the component is currently processing calls. All active calls are
dropped. Typically, you perform a stop only when severe problems that
are affecting a large number of incoming calls occur or if your
organization determines a special need for it.
Components that you can start and stop
Only the following components can start and stop.
Note: If you want to start or stop more than one or two multimedia
(DSP) or call (DS30X) channels, use the Multimedia Monitor or
Channel Monitor.
Component Effect of stopping
Media Bus Takes all call processing resources out of
service.
1005r Server Maintenance and Diagnostics 79
Page 80

Monitoring multimedia hardware Standard 1.10
Component Effect of stopping
MPB board Takes all call processing resources on the
selected board out of service.
Time switch You cannot perform maintenance administration
on the time switch.
Multimedia Channel Takes the selected multimedia channel out of
service.
Channels Takes the selected DS30X channel out of
service.
DS30X link Takes the selected DS30X link out of service.
To start or stop a component
1 Run CallPilot Manager and log on.
2 In CallPilot Manager, click Maintenance > Maintenance Admin.
Result: The Maintenance screen appears.
3 Click the plus sign (+) beside the CallPilot server to expand the
component tree.
4 Continue clicking the plus signs (+) until the component you want to
work with is visible.
5 Click the hardware component that you want to start or stop.
80 CallPilot
Page 81

June 2007 Monitoring multimedia hardware
Result: The Maintenance screen refreshes to show details about
the component.
6 Scroll down to the Maintenance section.
7 Click Courtesy Stop or Start as required.
Button Description
Start If the selected component is out of service, click
this button to put it into service.
Courtesy
Stop
Click this button to take the selected component out
of service. CallPilot waits for calls to be completed
before disabling the component.
ATTENTION
If you are courtesy stopping all components (that is,
you are taking the entire system down), ensure that
you inform all administrators, desktop messaging
users, and Web messaging users so that they can
log off their sessions before you proceed.
The system asks you to confirm the courtesy stop.
If you click OK, the component is put out of service
after all calls are finished.
Stop Click this button to take the selected component out
of service immediately. All calls that are in progress
are disconnected immediately.
ATTENTION
If you are stopping all components (that is, you are
taking the entire system down), ensure that you
inform all administrators, desktop messaging users,
and Web messaging users so that they can log off
their sessions before you proceed.
1005r Server Maintenance and Diagnostics 81
Page 82

Monitoring multimedia hardware Standard 1.10
Running integrated diagnostics
Run diagnostic tests from the Diagnostics section on the Maintenance
screen in the following circumstances:
You want to ensure that a component is operating properly after
installing or reinstalling it.
The CallPilot server is having trouble processing incoming calls and
you are hoping that diagnostic results can tell you why.
Problems include static, dropped calls, and cross talk (hearing
another conversation).
Before you begin
ATTENTION
Take the component out of service before you run the
diagnostic test. See “Starting and stopping components”
on page 78.
Components with diagnostic tests available
The following table identifies the components on which you can run
diagnostics.
Component Diagnostics available? Replaceable?
Media Bus No No
MPB96 board Yes Yes
Time switch No No
Multimedia channels Yes No
Channels No No
82 CallPilot
Page 83

June 2007 Monitoring multimedia hardware
Component Diagnostics available? Replaceable?
DS30X link (cable) Yes Yes
Diagnostic tests available for each component
The diagnostic tests that are available for each component are listed in
the Diagnostic section of the Maintenance screen. To view the list of
diagnostic tests for a particular component, click the component in the
component tree.
If a diagnostic test fails or cannot be run
If a warning message appears, you cannot run the diagnostic test because
a prerequisite condition has not been met. If a diagnostic test fails, a
message appears in a new browser window.
In both cases, check the Alarm Monitor to determine the reason and the
appropriate action to take.
If the Alarm Monitor and Event Browser do not provide a solution to a
hardware problem, you may need to replace or service a component. If
the problem is with a component that is not replaceable because it is not
a physical entity (such as the Time Switch), you must either replace its
parent component or contact your Nortel technical support
representative, depending on the component.
To run a diagnostic test
ATTENTION
1005r Server Maintenance and Diagnostics 83
Nortel recommends that you courtesy stop rather than stop
a component if possible. For instructions, see “Starting and
stopping components” on page 78.
Page 84

Monitoring multimedia hardware Standard 1.10
1 Run CallPilot Manager and log on.
2 In CallPilot Manager, click Maintenance > Maintenance Admin.
Result: The Maintenance screen appears.
3 Click the plus sign (+) beside the CallPilot server to expand the
component tree.
4 Continue clicking the plus signs (+) until the component you want to
work with is visible.
5 Click the hardware component for which you want to run diagnostics
with.
Result: The Maintenance screen refreshes to show details about
the component.
6 Scroll down to the Maintenance section, and ensure that the
component is out of service.
7 Scroll down to the Diagnostics section.
8 Select the check box for each diagnostic that you want to run.
Note: If you want to run all of the diagnostics, select the Diagnostic
Description check box at the top of the list.
9 Click Run.
Result: A new Web browser window appears with the progress and
results of the diagnostics.
Note: The Diagnostic Results box in the Diagnostics section
appears when you click Get Last Result.
84 CallPilot
Page 85

June 2007 Monitoring multimedia hardware
Viewing the last diagnostics result
You can review the results of diagnostics by clicking the Get Last Results
button for a component.
To view the last diagnostics result
ATTENTION
Nortel recommends that you courtesy stop rather than stop
a component if possible. For instructions, see “Starting and
stopping components” on page 78.
1 Run CallPilot Manager and log on.
2 In CallPilot Manager, click Maintenance > Maintenance Admin.
Result: The Maintenance screen appears.
3 Click the plus sign (+) beside the CallPilot server to expand the
component tree.
4 Continue clicking the plus signs (+) until the component you want to
work with is visible.
5 Click the hardware component for which you want to run diagnostics
with.
Result: The Maintenance screen refreshes to show details about
the component.
6 Scroll down to the Diagnostics section.
7 Select the check box for each diagnostic for which you want to
review results.
8 Click Get Last Result.
Result: The results appear in the Diagnostic Results box with the
following information:
diagnostic title
1005r Server Maintenance and Diagnostics 85
Page 86

Monitoring multimedia hardware Standard 1.10
diagnostic result: pass or fail
the date and time the test was completed
86 CallPilot
Page 87

June 2007 Monitoring multimedia hardware
Working with the Multimedia Monitor
The Multimedia Monitor shows the status of multimedia channels. The
multimedia channels are the DSP ports that process the calls. They are
the voice, fax, and speech recognition channels.
To view or work with multimedia channel states
1 Run CallPilot Manager and log on.
2 In CallPilot Manager, click Maintenance > Multimedia Monitor.
Result: The Multimedia Monitor screen appears, showing the
channels associated with each DSP.
Figure 10: Multimedia Monitor screen
Note: For an explanation of the channel states, see the CallPilot
Manager online Help.
1005r Server Maintenance and Diagnostics 87
Page 88

Monitoring multimedia hardware Standard 1.10
3 Do one of the following:
IF you want to stop or start THEN
all of the channels
associated with a DSP
select the check box to the left of the
DSP that you want to stop or start.
Repeat this step for each DSP.
only one or several
channels that are
associated with a DSP
4 Click Courtesy Stop or Start as required.
Result: If you click Courtesy Stop or Start, you are asked to confirm
the Courtesy Stop or Start. Click OK.
The selected channels change to off-duty or on-duty status,
according to the action you chose.
Note: If the buttons are not available, wait a few seconds for the
screen to refresh.
select the check box for each
channel that you want to stop or
start.
88 CallPilot
Page 89

June 2007 Monitoring multimedia hardware
Working with the Channel Monitor
The Channel Monitor shows the status of call channels. The call
channels are the connections between the server and the switch that carry
the call signals to CallPilot.
To view or work with call channel states
1 Run CallPilot Manager and log on.
2 In CallPilot Manager, click Maintenance > Channel Monitor.
Result: The Channel Monitor screen appears, showing the DS30X
(also known as DS0) channels associated with each DS30X link.
Figure 11: Channel Monitor screen
Note: For an explanation of the channel states, see the CallPilot
Manager online Help.
1005r Server Maintenance and Diagnostics 89
Page 90

Monitoring multimedia hardware Standard 1.10
3 Do one of the following:
IF you want to stop or start THEN
all of the channels associated with
a DS30X link
select the check box to the left of the
DS30X link that you want to stop or
start.
Repeat this step for each DS30X
link.
only one or several channels that
are associated with a DS30X link
select the check box for each
channel that you want to stop or
start.
4 Click Courtesy Stop or Start as required.
Result: If you click Courtesy Stop or Start, you are asked to confirm
the Courtesy Stop or Start. Click OK.
The selected channels change to off-duty or on-duty status,
according to the action you chose.
Note: If the buttons are not available, wait a few seconds for the
screen to refresh.
90 CallPilot
Page 91

Chapter 7
Using CallPilot system utilities
In this chapter
Overview 92
Diagnostics Tool 93
PEP Maintenance utility 95
Session Trace 96
CallPilot System Monitor 99
1005r Server Maintenance and Diagnostics 91
Page 92

Using CallPilot system utilities Standard 1.10
Overview
The following table lists the CallPilot system utilities.
Utility Description
Diagnostics Tool Allows CallPilot startup diagnostics to be
enabled or disabled (turned on or off).
PEP Maintenance Displays a list of installed PEPs and enables PEP
removal.
Session Trace Displays detailed information about the activity
in a user’s mailbox and the state of the message
waiting indicator (MWI).
CallPilot System
Monitor
Displays the following information:
the status of all CallPilot channels
the status of all CallPilot services
Note: This status is more accurate than the
status provided in the Services Control Panel.
particulars about the CallPilot system, such
as names, keycodes, serial numbers, IP
addresses, and system numbers
Accessing the system utilities
You can access all CallPilot utilities from the CallPilot server in the
Start
> Programs > CallPilot > System Utilities menu.
92 CallPilot
Page 93

June 2007 Using CallPilot system utilities
Diagnostics Tool
Use the Diagnostics Tool to enable or disable CallPilot startup
diagnostics. CallPilot startup diagnostics automatically identify
hardware problems that can exist when the system and its services are
started. When you disable startup diagnostics, you can save time during
system maintenance operations where restarts or call processing services
restarts are required. There are three recommended steps:
Use the Diagnostics Tool to turn off CallPilot startup diagnostics.
Perform system maintenance.
Use the Diagnostics Tool to turn on CallPilot startup diagnostics.
To access the Diagnostics Tool
On the Windows desktop, click Start > Programs > CallPilot > System
Utilities > Diagnostic Tool.
Result: The Diagnostics Tool dialog box appears.
To enable startup diagnostics
From the Diagnostics Tool dialog box, select Configuration >
Maintenance Startup Diag > Enable.
To disable startup diagnostics
ATTENTION
1005r Server Maintenance and Diagnostics 93
Nortel recommends that you leave the startup
diagnostics turned on. When you disable CallPilot
startup diagnostics, you prevent CallPilot from
automatically identifying hardware problems that can
exist when the system and its services are started (for
example, DSP, time switch, or Media Bus).
Page 94

Using CallPilot system utilities Standard 1.10
On the Diagnostics Tool dialog box, select Configuration >
Maintenance Startup Diag > Disable.
94 CallPilot
Page 95

June 2007 Using CallPilot system utilities
PEP Maintenance utility
The PEP Maintenance utility displays a list of all installed PEPs on the
server and lets you uninstall PEPs. For information about installing or
uninstalling PEPs, see the Installation and Configuration Task List (555-
7101-210).
To access the PEP Maintenance utility
From the Windows desktop, click Start > Programs > CallPilot>
System Utilities > PEP Maintenance Utility.
Result: The DMI Viewer dialog box appears.
To view a list of all installed PEPs
1 Click the component for which you want to display the PEP list.
2 Click Show PEPs.
Result: A list of all installed PEPs appears in the left pane.
3 If you want to review the readme file associated with a PEP, click the
PEP, and then click Read.
Result: The readme file appears in Notepad.
1005r Server Maintenance and Diagnostics 95
Page 96

Using CallPilot system utilities Standard 1.10
Session Trace
The Session Trace tool displays detailed information about the activity in
a user’s mailbox and the state of the message waiting indicator (MWI).
The session information includes:
voice messaging
call answering
express messaging activity (messages composed and sent or left in a
mailbox)
the number of messages played or unplayed at the beginning,
middle, and end of a session
messages and personal distribution lists restored to a mailbox
the last change to the MWI (turned on or off, or untouched)
This session information lets an administrator or technician study the
state of a user’s mailbox and the MWI, and to use that information to
follow user complaints. For example, a user can complain that the MWI
was on, but no voice messages were in the mailbox when the user logged
on. The session information can tell the administrator why the MWI was
turned on.
To access the session trace tool
From the Windows desktop, click Start > Programs > CallPilot >
System Utilities > Session Trace Tool.
Result: The MCE Session Trace dialog box appears.
96 CallPilot
Page 97

June 2007 Using CallPilot system utilities
To find a session
1 From the Session Type list, choose the type of session. To d i s p l ay a
list of all session types, select All Session Types.
2 Enter as much information in the search criteria boxes to identify the
session you want to view. To display a list of all users for the
selected session type, leave the search criteria boxes blank.
3 Click Search to initiate the search.
a. If you did not enter any user information, a list of users
matching the session type appears at the bottom of the window.
To select a user from the list, double-click the user name to
display session type information.
b. If you selected All Session Types for a user, the session type
information appears in the right of the window.
4 Double-click the session type to display the session information.
1005r Server Maintenance and Diagnostics 97
Page 98

Using CallPilot system utilities Standard 1.10
Result: The session type information appears at the bottom of the
window. The following example shows Call Answering session type
information.
Figure 12: Call Answering session
98 CallPilot
Page 99

June 2007 Using CallPilot system utilities
CallPilot System Monitor
The System Monitor consists of three tabs, as described in the following
table.
Table 13: System Monitor tabs
Tab Description
Channel Monitor Shows the status of all CallPilot services, multimedia
channels, and call channels (DS30X channels).
System Info Displays details about the CallPilot system, such as
features purchased, keycode, serial number, and
CallPilot server IP addresses.
Legend/Help Provides a description of icons and terminology
displayed in the System Monitor window.
System Monitor is a nondestructive tool that does not alter the behavior
of any CallPilot components.
To access the CallPilot System Monitor
On the Windows desktop, click Start ➝ Programs ➝ CallPilot ➝
System Utilities
Result: The CallPilot System Monitor window appears. By default,
the Channel Monitor tab appears at the top. Click the other tabs to
view the information on those tabs.
Channel Monitor tab
The following is an example of the Channel Monitor tab when connected
to a Meridian 1.
1005r Server Maintenance and Diagnostics 99
➝ System Monitor.
Page 100

Using CallPilot system utilities Standard 1.10
Figure 13: Channel Monitor with M1
CallPilot services
The Service Name pane shows the status of services from a CallPilot
perspective. The Windows Services Control Panel can show that a
service is running, but it may not be fully running or in service from a
CallPilot perspective. Refer to the Channel Monitor tab in the Systems
Monitor for the true status.
The services listed under Service Name can be either running or in full
service when CallPilot is functioning optimally. If any CallPilot services
are stopped, investigate the cause of this. Call Nortel technical support
for assistance.
Note: While you can investigate any stopped services, some services are
not critical. CallPilot can continue to handle call processing even with
some services stopped.
100 CallPilot
 Loading...