

Page 1

EXPRESS5800
()
■■■■■■■
■■■■■■■
■■■■■■■
■■■■■■■
■■■■■■■
■■■■■■■
ESMPRO Management Suite
User’s Guide
■■■■■■■
■■■■■■■
■■■■■■■
■■■■■■■
■■■■■■■
■■■■■■■
■■■■■■■
■■■■■■■
Page 2

xxx
Page 3

EXPRESS5800
()
■■■■■■■
■■■■■■■
■■■■■■■
■■■■■■■
■■■■■■■
■■■■■■■
ESMPRO Management Suite
User’s Guide
■■■■■■■
■■■■■■■
■■■■■■■
■■■■■■■
■■■■■■■
■■■■■■■
■■■■■■■
■■■■■■■
Page 4

Proprietary Notice and Liability Disclaimer
The information disclosed in this document, including all designs and related materials, is
the valuable property of NEC Solutions (America), Inc. and/or its licensors. NEC Solutions
(America), Inc. and/or its licensors, as appropriate, reserve all patent, copyright and other
proprietary rights to this document, including all design, manufacturing, reproduction, use,
and sales rights thereto, except to the extent said rights are expressly granted to others.
The NEC Solutions (America), Inc. product(s) discussed in this document are warranted in
accordance with the terms of the Warranty Statement accompanying each product.
However, actual performance of each product is dependent upon factors such as system
configuration, customer data, and operator control. Since implementation by customers of
each product may vary, the suitability of specific product configurations and applications
must be determined by the customer and is not warranted by NEC Solutions (America), Inc.
To allow for design and specification improvements, the information in this document is
subject to change at any time, without notice. Reproduction of this document or portions
thereof without prior written approval of NEC Solutions (America), Inc. is prohibited.
Trademarks
ESMPRO is a trademark of NEC Corporation
Linux is a registered trademark of Linus Torvalds, Inc.
Red Hat is registered trademark of Red Hat, Inc.
Windows and Windows 2000 are registered trademarks of Microsoft Corporation.
All product, brand, or trade names used in this publication are the trademarks or registered
trademarks of their respective trademark owners.
PN: 456-01534-005 January 2003
Copyright 2001, 2002, 2003
NEC Solutions (America), Inc
10850 Gold Center Drive, Suite 200,
Rancho Cordova, CA 95670
All Rights Reserved
Page 5

Contents
Proprietary Notice
Introducing ESMPRO
Functions And Features......................................................................................................1-2
Configuration .....................................................................................................................1-3
System Requirements......................................................................................................... 1-4
Components........................................................................................................................1-7
Services..............................................................................................................................1-8
Starting/Stopping Services...............................................................................................1-10
Operation Window
Views and Menus...............................................................................................................2-2
Starting ESMPRO............................................................................................................ 2-10
Detecting the Agents with AutoDiscovery.......................................................................2-11
Customizing the Operation Window................................................................................2-19
Advanced Configuration.................................................................................................. 2-28
Using the MIB Browser...................................................................................................2-36
Data Viewer
Starting the Data Viewer....................................................................................................3-2
Collecting Data...................................................................................................................3-3
Printing Data....................................................................................................................3-10
Setting Local Polling........................................................................................................ 3-13
Thresholds........................................................................................................................3-15
Graph Viewer................................................................................................................... 3-25
Remote Shut Down..........................................................................................................3-30
Remote Wake Up............................................................................................................. 3-31
Setting the Polling Interval...............................................................................................3-33
Data Viewer Menu Bar ....................................................................................................3-33
Alert Viewer
Accessing the Alert Viewer................................................................................................4-2
Message Notification ......................................................................................................... 4-2
Alert Message Details........................................................................................................4-3
Filtering Messages ............................................................................................................. 4-5
Sorting Messages ............................................................................................................... 4-6
Finding Alert Messages......................................................................................................4-6
Forwarding Alert Messages...............................................................................................4-7
Setting Notification Options...............................................................................................4-7
Configuring the Alert Viewer..........................................................................................4-11
Alert Viewer Menu Bar.................................................................................................... 4-12
Alert Viewer ToolBar.......................................................................................................4-14
Contents iii
Page 6

Alert Manager
Starting Alert Manager.......................................................................................................5-3
Alert Manager Description.................................................................................................5-4
Setup Outline......................................................................................................................5-5
Base Settings and Destinations...........................................................................................5-6
Setting Up at the Agent Outline .......................................................................................5-18
Set up from ESMPRO Manager.......................................................................................5-23
The Agents
Collecting Information .......................................................................................................6-2
Launching the Agent ..........................................................................................................6-3
Changing Agent Settings....................................................................................................6-3
Settings for the Agent for NetWare....................................................................................6-3
Agent for Windows NT / 2000...........................................................................................6-4
Logging - Windows NT....................................................................................................6-21
DMI Agents......................................................................................................................6-21
ESMPRO Agent for Linux
Agent for Linux 6.2 and 7.0 ...............................................................................................7-2
Agent for Linux 7.1..........................................................................................................7-28
WebAccess
Configuration......................................................................................................................8-2
System Requirements.........................................................................................................8-2
Installing WebAccess.........................................................................................................8-3
Running WebAccess...........................................................................................................8-8
ESMPRO for Unicenter TNG
Installing ESMPRO for Unicenter TNG.............................................................................9-3
Running ESMPRO for Unicenter TNG the first time.........................................................9-5
Troubleshooting..................................................................................................................9-9
Other Documents..............................................................................................................9-10
ESMPRO OpenView Integration Service
Getting Started..................................................................................................................10-3
Using ESMPRO OpenView Integration Service..............................................................10-4
Installation........................................................................................................................10-7
Configuration....................................................................................................................10-9
Services...........................................................................................................................10-12
Tivoli Integration
Systems Operation............................................................................................................11-2
System Requirements.......................................................................................................11-2
Installation........................................................................................................................11-3
Configuration....................................................................................................................11-4
iv Contents
Page 7

Express5800/ft Server (Windows 2000 Operating System)
Introduction......................................................................................................................12-2
Express5800/ft Maintenance............................................................................................12-3
Monitoring ft Server Using Data Viewer.........................................................................12-4
Starting the Data Viewer..................................................................................................12-5
Monitoring ft Server using the ft Server Utility............................................................. 12-37
Express5800/ft Server (Linux Operating System)
Introduction......................................................................................................................13-2
Express5800/ft Maintenance............................................................................................13-3
Monitoring ft Server Using ESMPRO Manager.............................................................. 13-4
Monitoring ft Server using ESMPRO Agent ................................................................. 13-27
Index
Contents v
Page 8

Page 9

Introducing ESMPRO
! Functions And Features
! Configuration
! System Requirements
! Components
! Services
! Starting/Stopping Services
1
Page 10

ESMPRO, hereafter referred to as ESMPRO, lets a system administrator
manage remote servers across a network. ESMPRO monitors server hardware
and software configurations, failures, and performance. With log data collected
by ESMPRO, a system administrator can track long-term and short-term
performance, monitor server usage, create graphs to record trends, and check
server failure rates. The administrator can use the information collected to create
more efficient data routing procedures and optimize server usage.
Functions And Features
ESMPRO offers many functions and features for managing remote servers
across a network. These features help the system administrator perform daily
system operation, system extension, and transfer tasks. Some features of
ESMPRO Manager include:
! Hardware and software server configuration
Hardware resources mounted in servers, such as the CPU, memory,
disks, disk arrays, and LAN boards.
Software resources, such as operating system information and drivers
running on each server.
! Server failures
On-screen real-time displays provide the system administrator with
the failure type, location, cause, and suggested corrective action.
Failure data includes hardware failure information such as system
board temperature, memory failure, crashes, and software failure
information.
! Performance
ESMPRO monitors server performance and displays server usage on
the screen and displays information, such as the rate of CPU load,
memory usage, disk usage, and LAN traffic. Usage threshold values
can help the system administrator monitor and prevent server
overloads.
! Maintenance functions (Express5800/ft Server)
ESMPRO provides several unique maintenance functions for the
Express5800/ft Server. These include switching system modules Off
and On and updating firmware in the Express5800/ft Server. Many
maintenance functions may be executed in the online state in which
the system continues normal operation. Express5800/ft Server is
described in Chapter 12 of this guide.
1-2 Introducing ESMPRO
Page 11

Configuration
ESMPRO consists of a Manager program that runs on a Windows NT 4.0,
Windows 2000, Windows Me, Windows 95 or Windows 98 and an Agent
program that runs on servers you want to manage.
! The Manager collects hardware, software, and firmware information from
Agents connected to the network. The Manager displays Agent
information, failures, and error logs on the screen.
! The Agent monitors server hardware, software, and firmware and
transmits the information over the network to the Manager using SNMP
(Simple Network Management Protocol) or DMI (Desktop Management
Interface). The Agent lets you view system settings and reset some
ESMPRO thresholds locally.
Each managed server must have the Agent installed and running. Using SNMP,
the Agent sends data across the network to the Manager, which collects the
server information. The following figure shows a sample Manager/Agent
Configuration.
Using SNMP, ESMPRO Manager manages the running ESMPRO Agent on the
managed server on the network. Using DMI, it manages ESMPRO Agents
supporting DMI in addition to the other DMI Agents (such as Intel LANDesk
Client Manager).
Introducing ESMPRO 1-3
Page 12
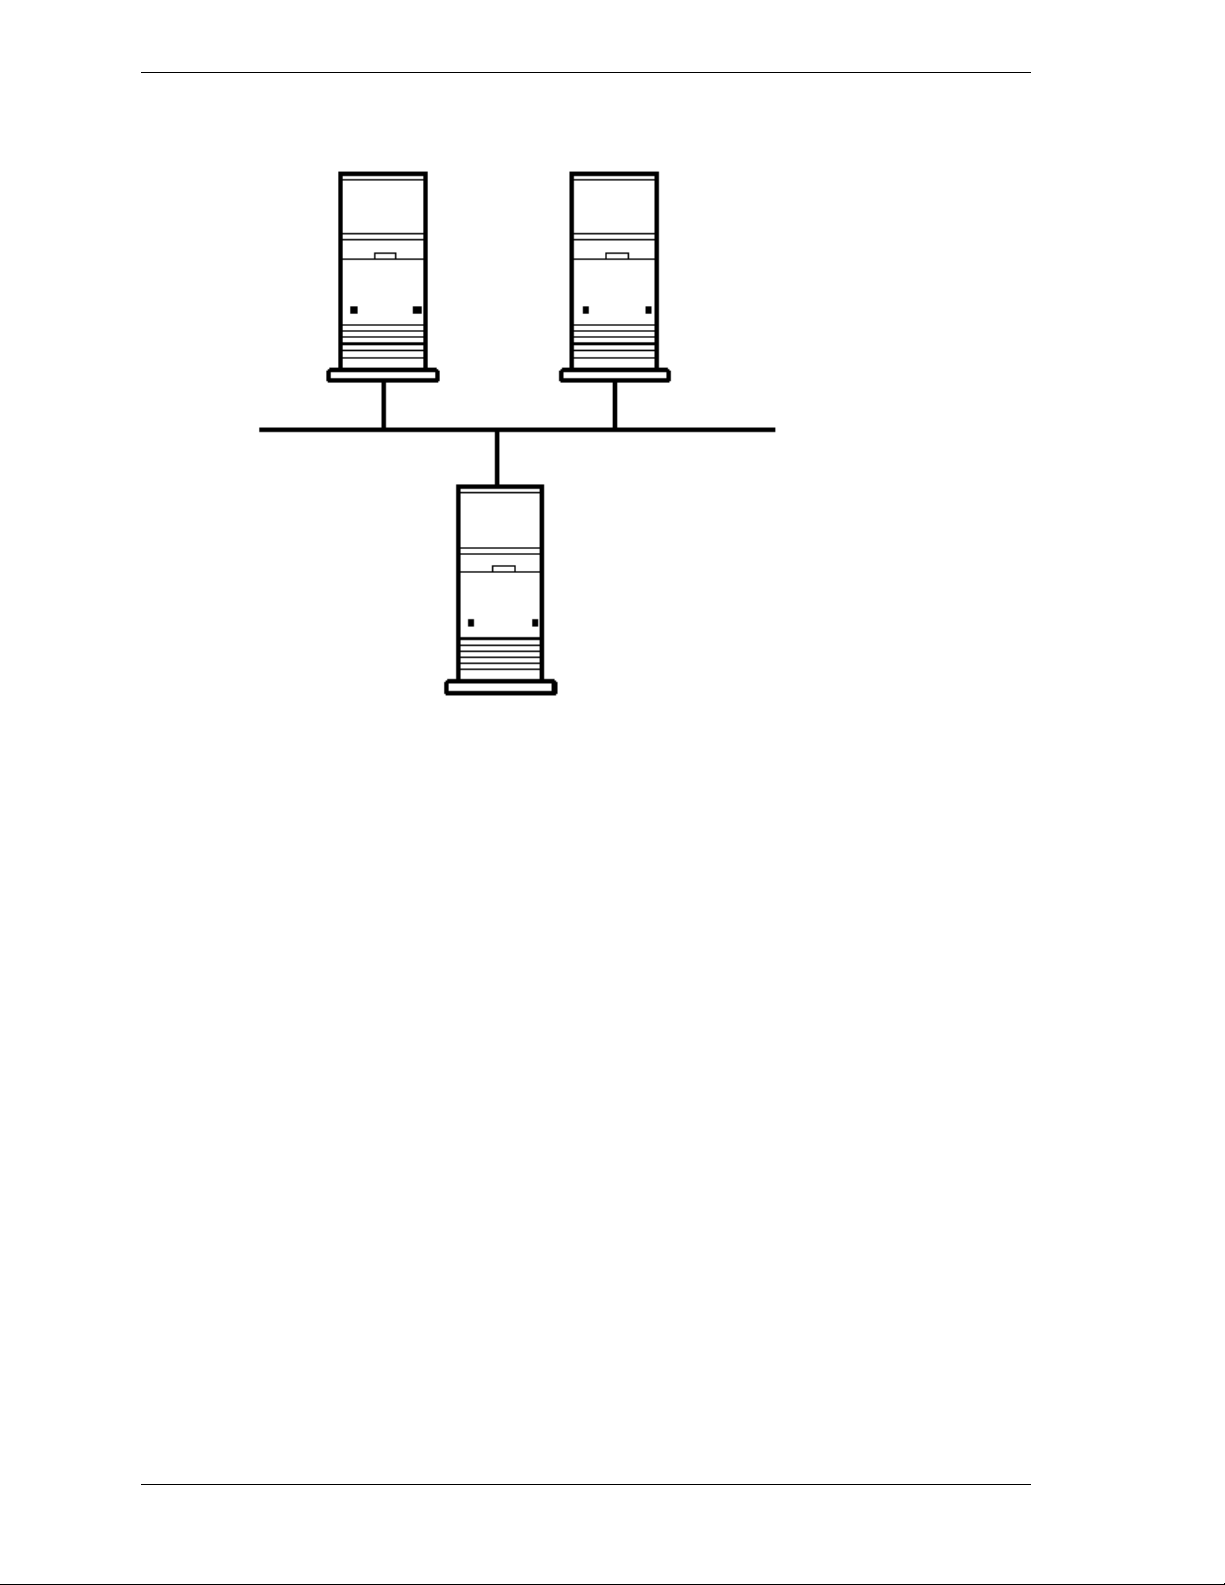
Windows NT 4.0, Windows 2000, NetWare 4.2, 5.1
[Agent] [Agent]
[Manager]
Windows NT 4.0, Windows 2000, Windows 95, Windows 98
Manager/Server Configuration
System Requirements
ESMPRO requires the following hardware and software:
! Manager Hardware
Intel/Windows system
Memory : 20 megabytes (MB) of free memory
Hard Disk Space: 75MB (65MB is required for installing the
program). Also, 10MB is required at installation for creating work
file, in the directory shown by environment variable TEMP.
If environment variable TEMP has not been set, work file will be
created in the appropriate directory, usually in the system directory.
Additional Storage Space: When operating ESMPRO, the following
files are created.
1) Automatic Data Collection
Approximately 40KB per collection
2) Alert information
Approximately 500 bytes per alert
1-4 Introducing ESMPRO
Page 13

3) Others
Approximately 10MB as the management area per server
registered in the Operation Window.
Network Interface Card
Display: a high-resolution monitor. (Some dialog boxes do not fit on
a display set to 640 x 480 resolution; 800 x 600 resolution is
recommended).
! Manager Software
Operating System : Windows NT 4.0 (Service Pack 3 or later),
Windows 2000, Windows 95 or Windows 98
NT File System (when the Manager is installed on a Windows NT or
Windows 2000 system)
Communications Protocol: TCP/IP (comes standard with Windows
NT, Windows 2000, Windows 95 and Windows 98).
! Agent Hardware
Express5800 series server
! Agent Software (Windows NT/2000)
Operating System : Windows NT 4.0 (Service Pack 3 or later), or
Windows 2000
Communications Protocol : TCP/IP (comes standard with Windows
NT and Windows 2000)
SNMP installed with a community defined
! Agent Software (NetWare)
Operating System : NetWare 4.2, NetWare 5.1
Communication Protocol : IPX or TCP/IP
SNMP loaded with a community defined
Introducing ESMPRO 1-5
Page 14

! ESMPRO for WebAccess Hardware
Intel/Windows system
Memory : 16MB
Hard Disk space : 10MB
! ESMPRO for WebAccess Software
Web Server
Operating System : Windows NT 4.0
Internet Information Server 2.0
ESMPRO Manager
! ESMPRO OpenView Integration Service Hardware
Intel/Windows system
Memory : 2 megabytes (MB) of free memory
Hard Disk space : 2MB
! ESMPRO OpenView Integration Serviced Software
Operating System : Windows NT 4.0
ESMPRO Manager
HP OpenView NNM for Windows NT version 5.02 or higher.
! ESMPRO Unicenter TNG Integration Service Hardware
Intel/Windows system
Memory : 2 megabytes (MB) of free memory
Hard Disk space : 2MB
! ESMPRO Unicenter TNG Integration Serviced Software
Operating System : Windows NT 4.0
ESMPRO Manager
CA Unicenter TNG version 2.2 or higher / CA Unicenter TNG
Framework version 2.2 or higher.
1-6 Introducing ESMPRO
Page 15

Components
ESMPRO Management Suite is composed of the following applications, tools
and services:
Operation Window
This is the main application that starts when you run the Manager. From here,
you create network maps that reflect the abstract, logical structure or actual
physical location of the networks, sub-networks and servers they represent.
The Manager periodically polls servers in the network and displays them as
icons in the Operation Window. These servers can be servers running Agent
software, as well as servers, hubs, personal computers, and routers in the
network. The color of each icon reflects the status of the server.
Data Viewer
The Data Viewer extends your view down to the component level by displaying
detailed information on a server's hardware and software components.
Graph Viewer
From the Data Viewer, you can open a Graph Viewer that plots statistical and
performance data from the servers.
Alert Viewer
The Alert Viewer displays alert messages that originate in the servers.
MIB Browser
Use the MIB Browser to display, plot, or tabulate the values of data items
defined in the servers SNMP MIB.
Alert Manager
This application lets you determine how ESMPRO responds to alert messages
and Agent events, including whether additional alert messages should be
generated.
Manager Services
Though you do not deal directly with these services, they start automatically
when you start ESMPRO Manager and run in the background to implement
Manager functions.
Introducing ESMPRO 1-7
Page 16

Services
ESMPRO Agent Services:
On a Windows NT system, Agent services can be stopped and started by the
Services icon in the Control Panel.
In Windows 95, the only way to see which services are running is to press
[Ctrl][Alt][Delete] and view the Close Programs dialog box. You can stop
services from this dialog box, but you can’t start them.
The following services are started by the operating system when an ESMPRO
managed server (running Agent software) is started.
1. Alert Manager ALIVE(S) Service
Sends alert messages using the server management board in the managed
server.
2. Alert Manager Main Service
When the Alert Manager is configured, this service dispatches an alert
message to a predefined destination (such as the ESMPRO Manager, pager,
email or pop-up message at the server). It also sends alert messages to the
NT event log if the Alert Manager is configured to do so.
3. Alert Manager Socket(S) Service
Sends an alert via TCP/IP in-band and out-of-band.
4. ESM Common Service
Monitors environmental sensors and hardware for errors and sends an alert
message when it detects an error.
5. ESM FS (File System) Service
Monitors the drives and keeps track of the free space.
6. ESM LAN Service
Monitors LAN traffic and sends an alert message when the number of errors
exceeds the threshold.
7. ESM Storage Service
Monitors storage devices such as the SCSI and IDE devices and sends an
alert message when the number of errors exceeds the threshold.
8. SNMP Service
The agent has its own MIB enhancement to the standard Windows NT
SNMP service to implement information management.
1-8 Introducing ESMPRO
Page 17

ESMPRO Manager Services:
The following services are started by the operating system when the ESMPRO
management station (running ESMPRO Manager software) is started.
1. Alert Manager ALIVE(R) Service
Receives out-of-band notification by way of the server management board.
2. Alert Manager Main Service
A main module to deal with schedule management of Alert transfer (Pager,
Fax, E-mail, etc.).
3. Alert Manager Socket(R) Service
Receives the highly reliable Trap (using TCP/IP).
4. ESM Alert Service
Receives SNMP Traps and stores them in the Alert log file which is
displayed in the Alert Viewer.
5. ESM Command Service
A service for periodic Autodiscovery running in the background.
Background Autodiscovery will not be available without this. However, the
foreground AutoDiscovery is available.
6. ESM Remote Map Service
A service to provide consistency of colors of the icons (rmap icon) which
represent the Remote Manager. The color of rmap icon will not change
without this.
7. ESM Base Service
Essential service of ESMPRO, it manages configuration information and the
sending and receiving of SNMP packets.
Introducing ESMPRO 1-9
Page 18

Starting/Stopping Services
Use the Service Control window to start and stop services related to ESMPRO.
This function is only available in Windows NT.
To launch the Service Control window, select Start/Settings/Control Panel.
Click on the Services icon.
Service column - List of services on your system.
Status column - If the service is currently running you will see Started in the
Status column.
Startup column - Indicates if the service is launched automatically when the
operating system starts (Automatic) or if the service needs to be launched
manually (Manual). Disabled indicates the service is turned off.
Starting and Stopping Services
To start a service manually, select the service and click on Start. The status
changes to Started.
To start or stop a service automatically at start-up, select the service and click on
Startup.
Select Automatic if you want to start the service whenever the operating system
starts up. If you select Manual, you can start the service at the Services window
any time with the Start button.
1-10 Introducing ESMPRO
Page 19

Operation Window
! Views and Menus
! Starting ESMPRO
! Detecting the Agents with AutoDiscovery
! Customizing the Operation Window
! Advanced Configuration
! Using the MIB Browser
2
Page 20
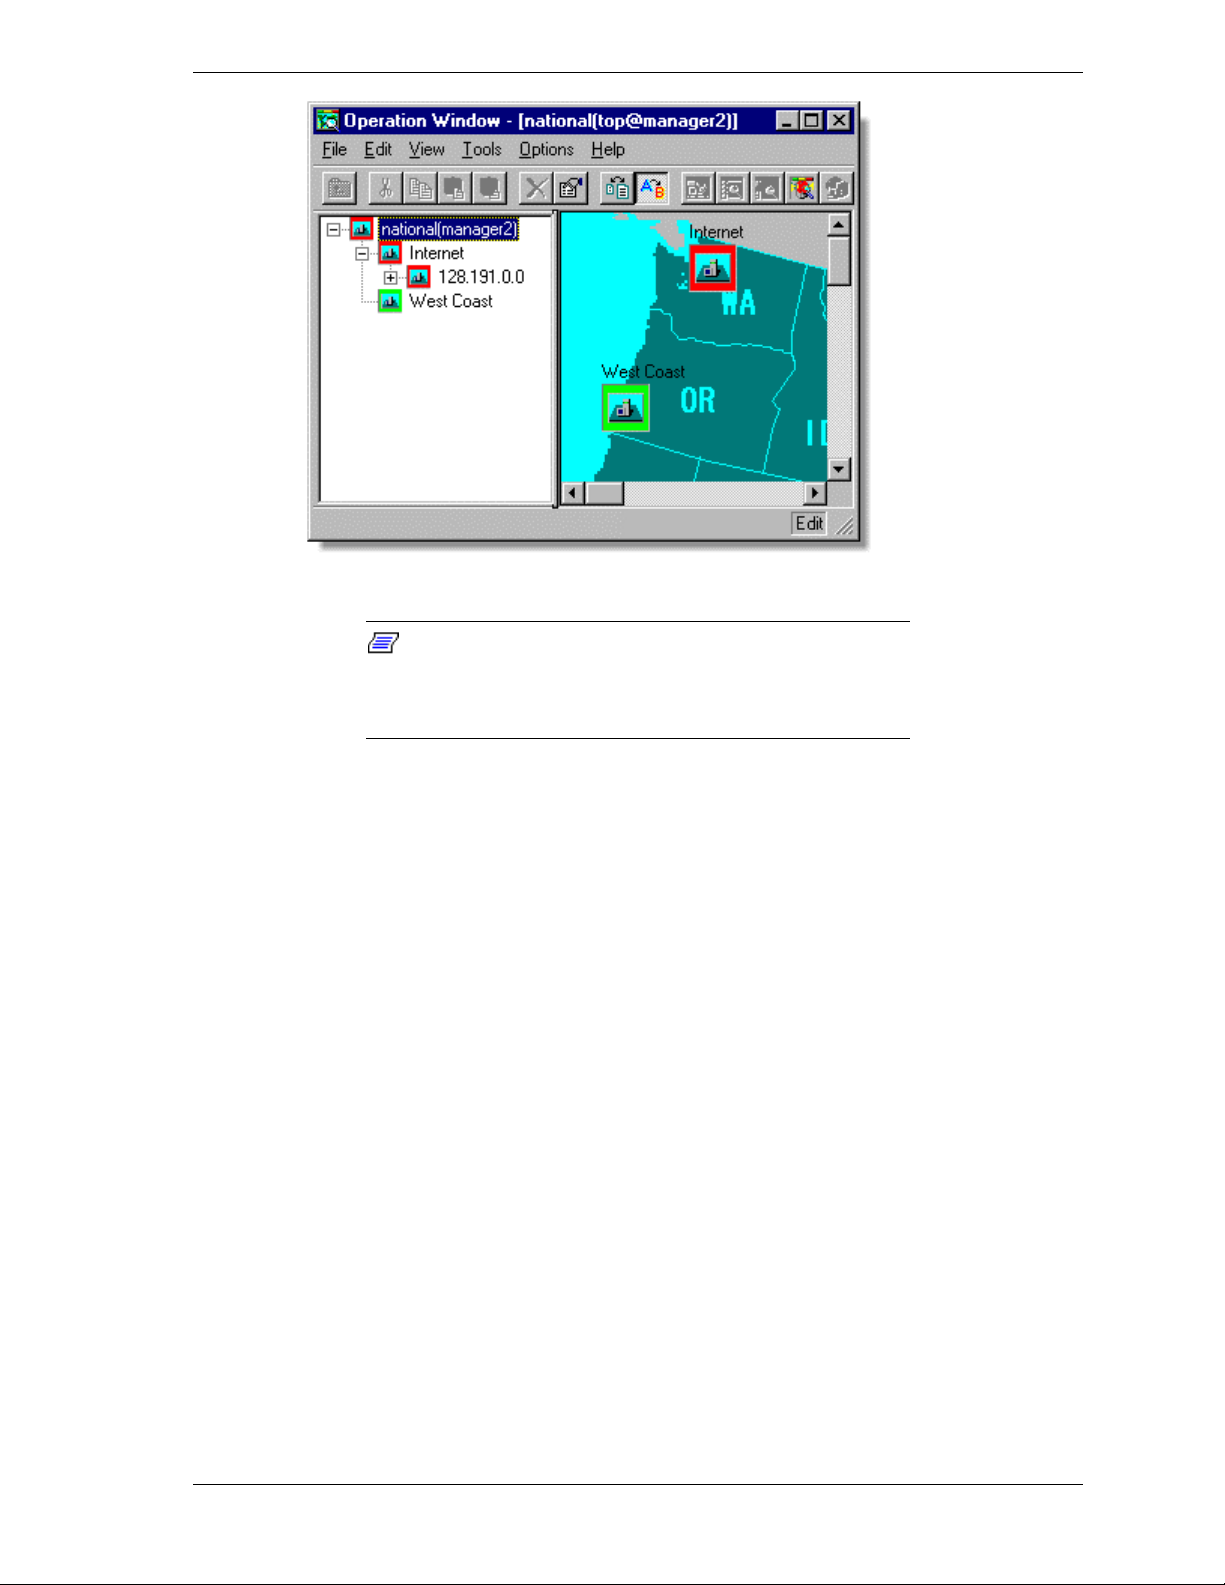
The Operation Window displays when you start the ESMPRO Manager. The left
side of the screen contains a list of icons that represent servers in the network.
The right side contains additional details on the highlighted icon.
You can configure the Operation Window in a variety of ways. Typically in the
top level, the servers are shown against a map. The color of the icons indicates
their status. At a quick glance, you can determine the location where a server
has failed.
Views and Menus
Servers running Agent software are displayed as icons in the Tree and
Information Views. The background color of the icons indicates their status. At
a quick glance, you can determine which servers have failed and their locations.
2-2 Operations Window
Page 21
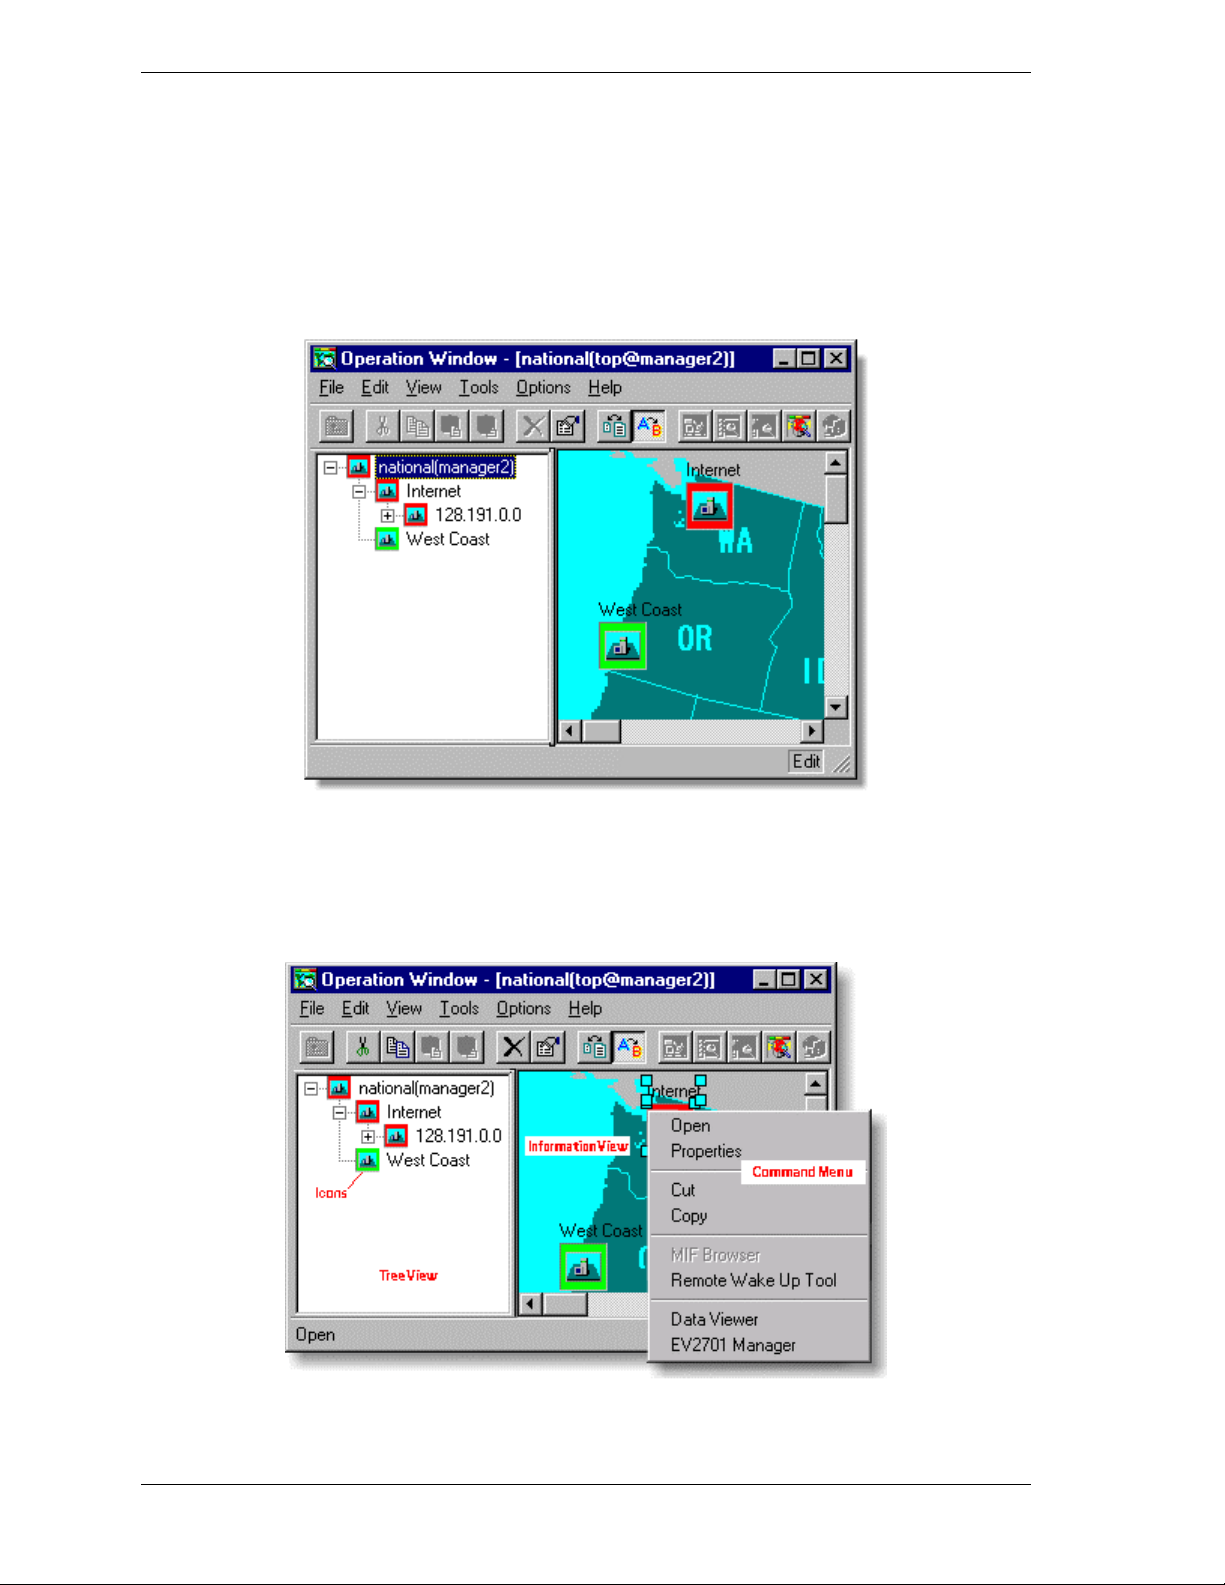
Tree View - The left side of the screen is the Tree View and contains a list of
icons which represent servers in the network. The Tree View also displays
Neighbor Managers if any are registered. Click on the plus and minus symbols
to expand and contract the list.
Information View - The right side of the screen contains additional details for
the icon highlighted in the Tree View.
Command Menu - provides quick access to ESMPRO functions. To display the
Command menu, click with the right mouse button.
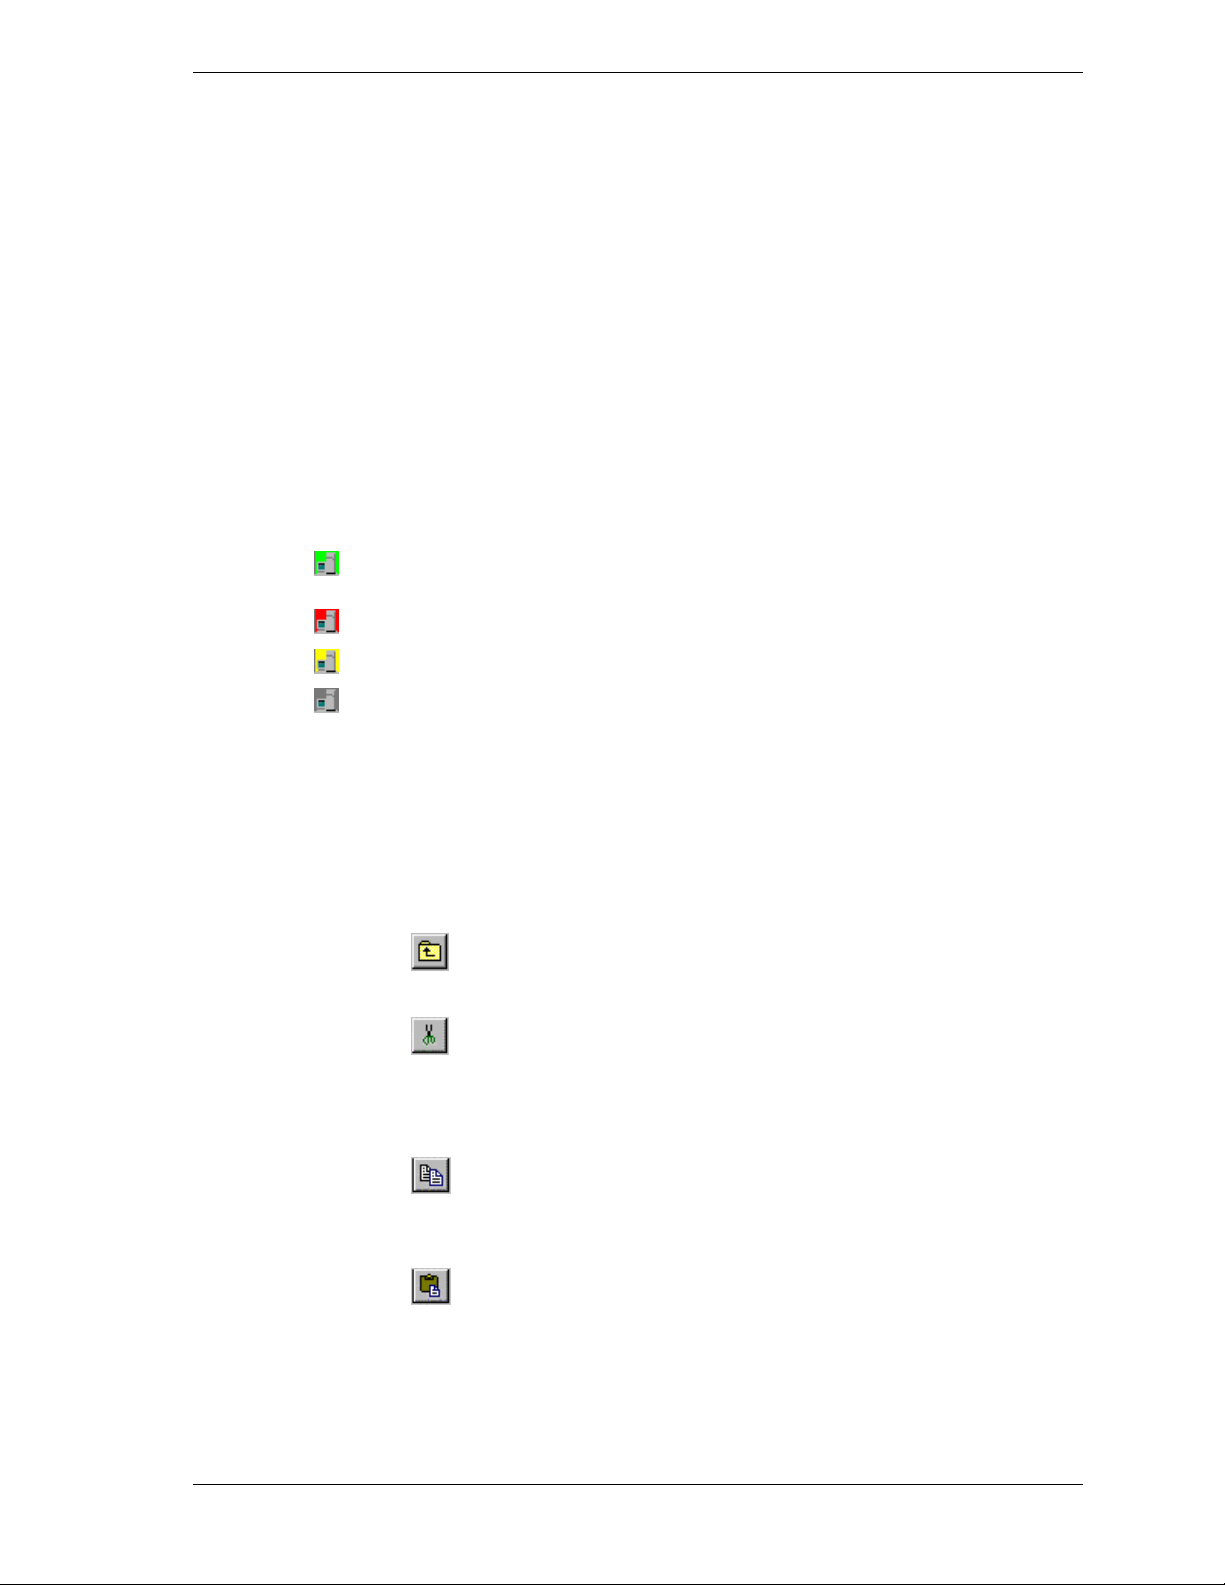
Status Colors in the Default Configuration
The following table shows the status colors default configuration. The default
color codes are green (normal status), red (abnormal), yellow (warning), and
gray (unknown).
Icon Color Status Description
Green Normal All components in the Agent are operating
normally.
Red Abnormal A major error occurred in the Agent.
Yellow Warning A minor error occurred in the Agent.
Toolbar
Gray Unknown The Agent cannot be monitored or
identified because the Agent was not
started, Agent software is not set up, or the
server is down.
The toolbar at the top of the window provides easy access to many functions at
the press of a button.
Upper Map -Clicking on this icon selects the parent icon in
the Tree View for the highlighted child icon.
Cut - surrounds the selected icon with a red bounding box and
stores the icon and its attribute information. Selecting Paste
deletes the old icon and pastes the new icon on the screen.
Note: Enable Edit in the Options Menu must be checked.
Copy - Copy saves the selected icon and its attributes to the
Clipboard. Note: Enable Edit in the Options Menu must be
checked.
Paste - pastes the icon stored on the Clipboard onto the
current map. Note: Enable Edit in the Options Menu must be
checked.
Operations Window 2-3
Page 22
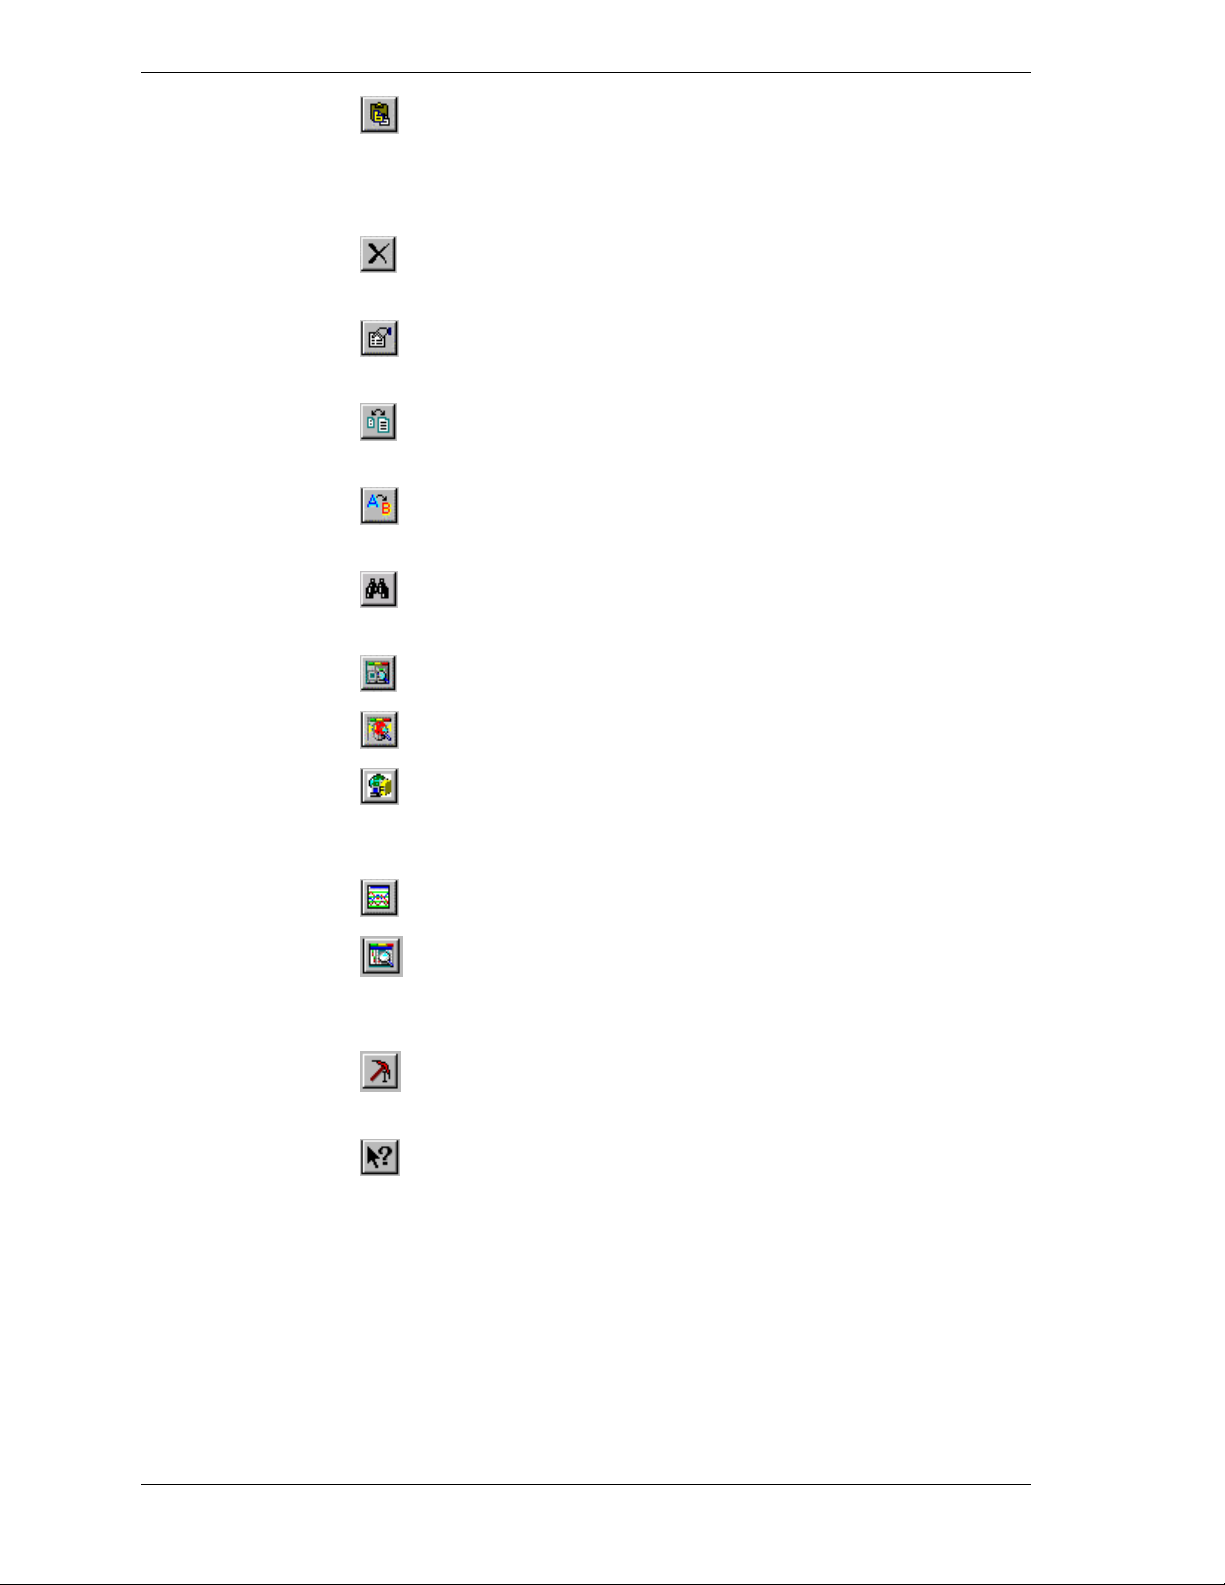
Paste With a New Name - pastes the contents of the icon
saved in the Clipboard on the selected network map. All
properties except the component name are saved. Note:
Enable Edit in the Options Menu must be checked.
Delete - deletes the selected icon. Note: Enable Edit in the
Options Menu must be checked.
Properties - displays the properties for the selected
component.
Shrink to Fit - reduces the map or icons to fit in the Map or
Information View.
Alias - displays the alternate name for every server. If a server
does not have an alternate name, the server name is displayed.
Search - Displays the Search dialog box where you can search
for a specific component.
Data Viewer - starts the Data Viewer.
Alert Viewer - starts the Alert Viewer
SMS - launches the Microsoft System Management Software
(SMS) program for managing and troubleshooting networked
PCs.
MIB Browser - displays the MIB Browser.
MIF Browser - displays the MIF Browser. For this icon to be
active, ESMPRO MIB must be set on the Function tab in the
Properties tab.
User-defined icon - executes a program of your choosing. (To
configure this button, click on Options/Customize/Tools.)
Help - accesses context sensitive help within the window. To
use this tool, click on the help icon. (The cursor will change to
a question mark.) Click on another icon or menu item to
display a help message for that item. To cancel help when the
cursor looks like a question mark, click on the help icon again.
2-4 Operations Window
Page 23
Menu Bar
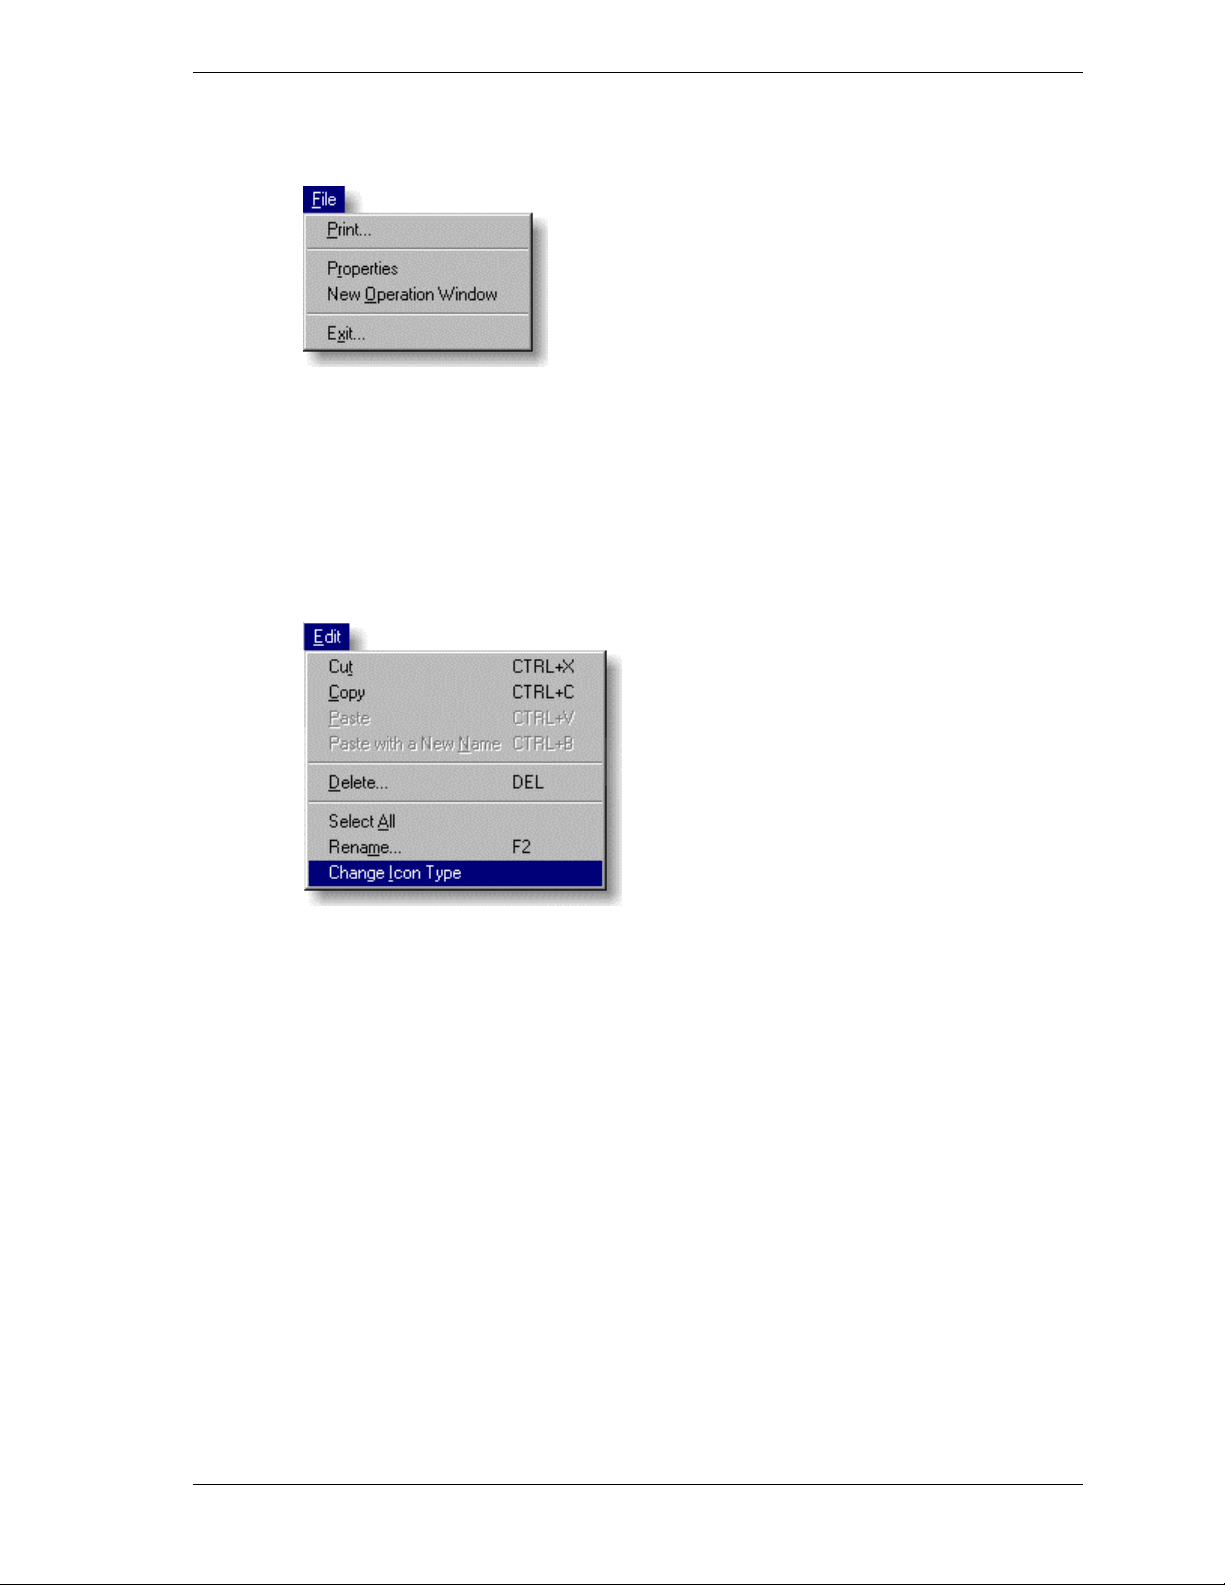
File Menu
Print - Prints the network map.
Properties - Displays the current information collected during AutoDiscover.
The Properties window displays.
New Operation Window - Opens another Operation Window.
Exit - Closes the Operation Window and exits the program.
Edit Menu
Cut - Surrounds the selected icon with a red bounding box and stores the icon
and its attribute information in the Clipboard. When you select Paste, the old
icon is deleted and the new icon is pasted on the screen. Selecting Cancel aborts
the cut operation.
Copy - Saves the selected icon to the Clipboard. The Paste operation pastes the
contents of the Clipboard to the map.
Paste - Copies the icon stored on the Clipboard to the map. Once you paste the
icon, all attribute information is restored, including the IP Address, Host Name,
and SNMP community.
Paste With a New Name - Copies the icon information in the Clipboard to the
screen and allows you to apply a new name.
Delete - Deletes the highlighted icon.
Select All - Selects all icons in the current map.
Rename - Lets you change the name of the selected icon.
Operations Window 2-5
Page 24
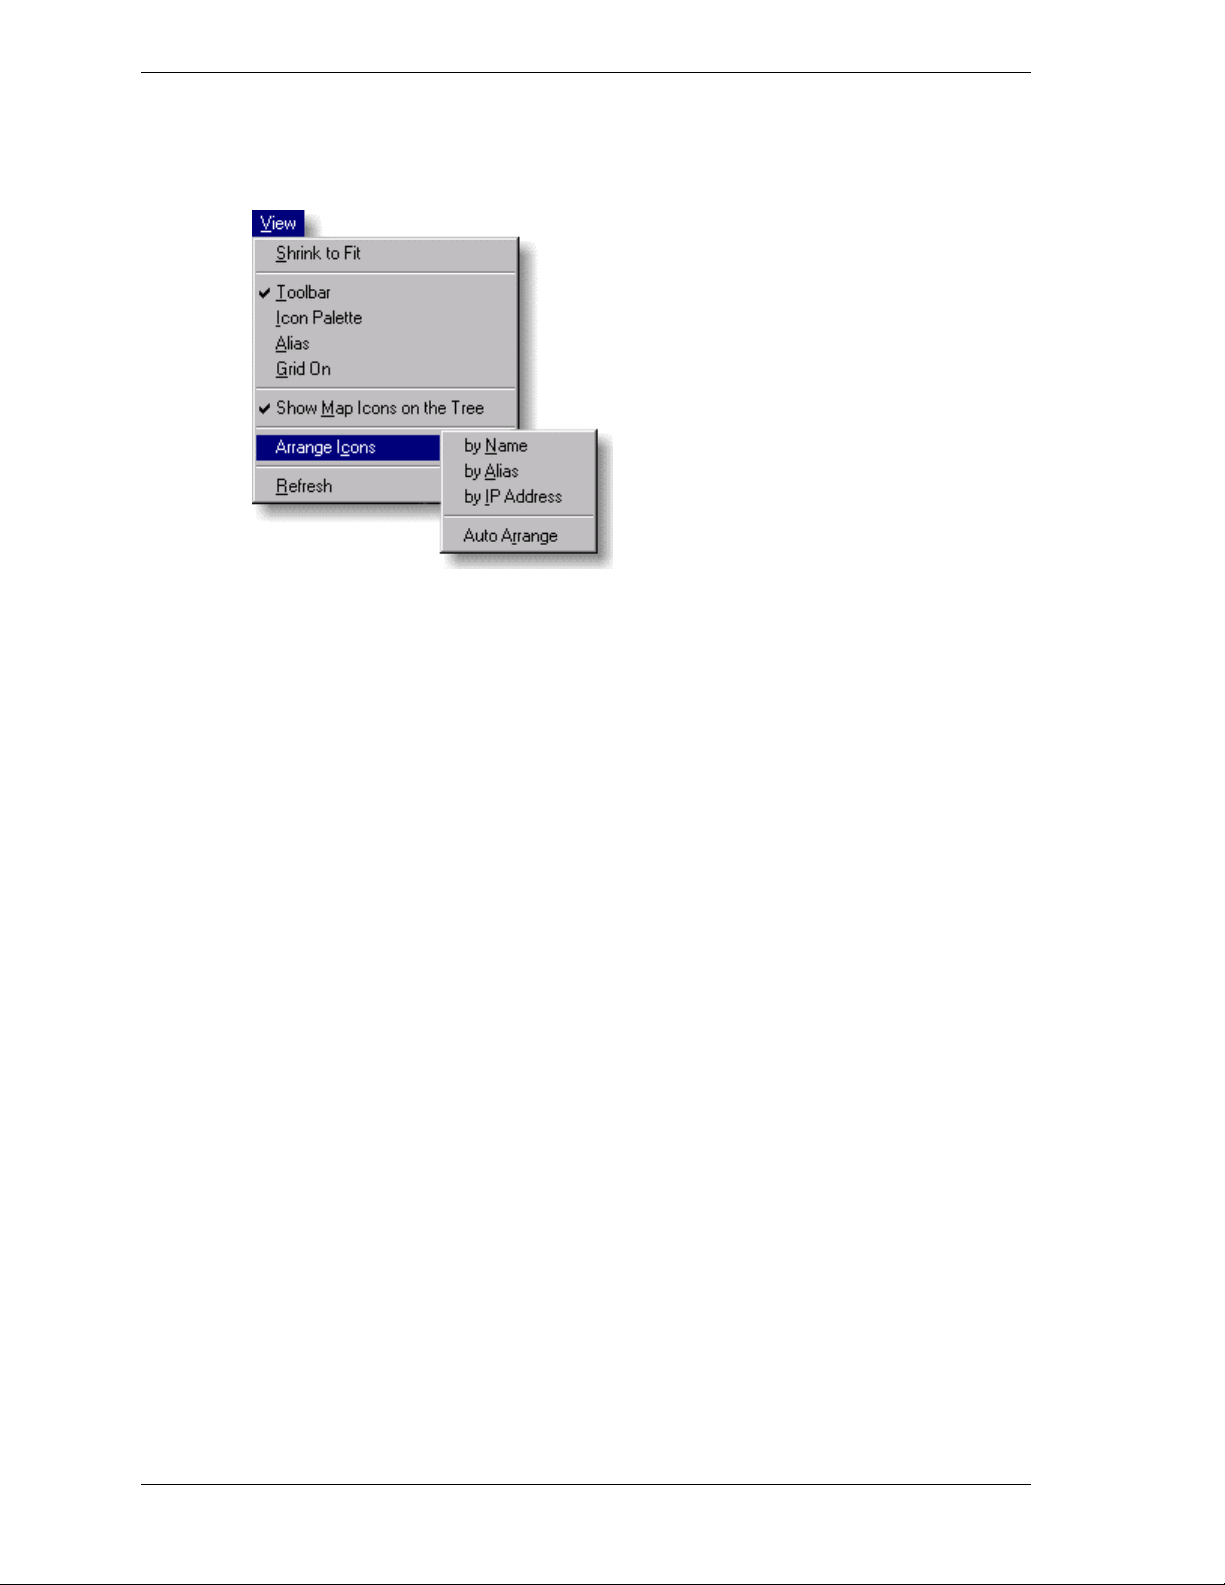
View Menu
Change Icon Type - Lets you change the image of the selected icon. Note: You
cannot change a map icon to a server icon or a server icon to a map icon.
Shrink to Fit - Automatically reduces or enlarges the map or icons to fit in the
Map or Information View.
Toolbar - The Toolbar appears on the screen when this item is checked.
Icon Palette - Displays the Icon Palette where you can add icons to the map. (If
this menu item is grayed out, check Enable Edit in the Options Menu.).
Alias - The alternate name for hosts are displayed when this item is checked.
The alias is defined on the Properties window.
Grid On - Displays a grid on the network map.
Show Map Icons on the Tree - When checked, only map icons display in the
Tree View.
Arrange Icons - Icons are arranged in the Map View by name, alias, and IP
Address.
by name - arranges the icons by name
by alias - arranges the icons by alias. Icons without aliases are arranged by
name.
by IP Address - Icons are arranged by IP address. Icons without an IP
address are placed after the sorted icons.
Auto Arrange - When checked, icons in the Map View are aligned to the
grid. (The grid is configured under Options/Customize/Grid. To view the
grid, select View/Grid On.)
Refresh - Redraws the screen.
2-6 Operations Window
Page 25
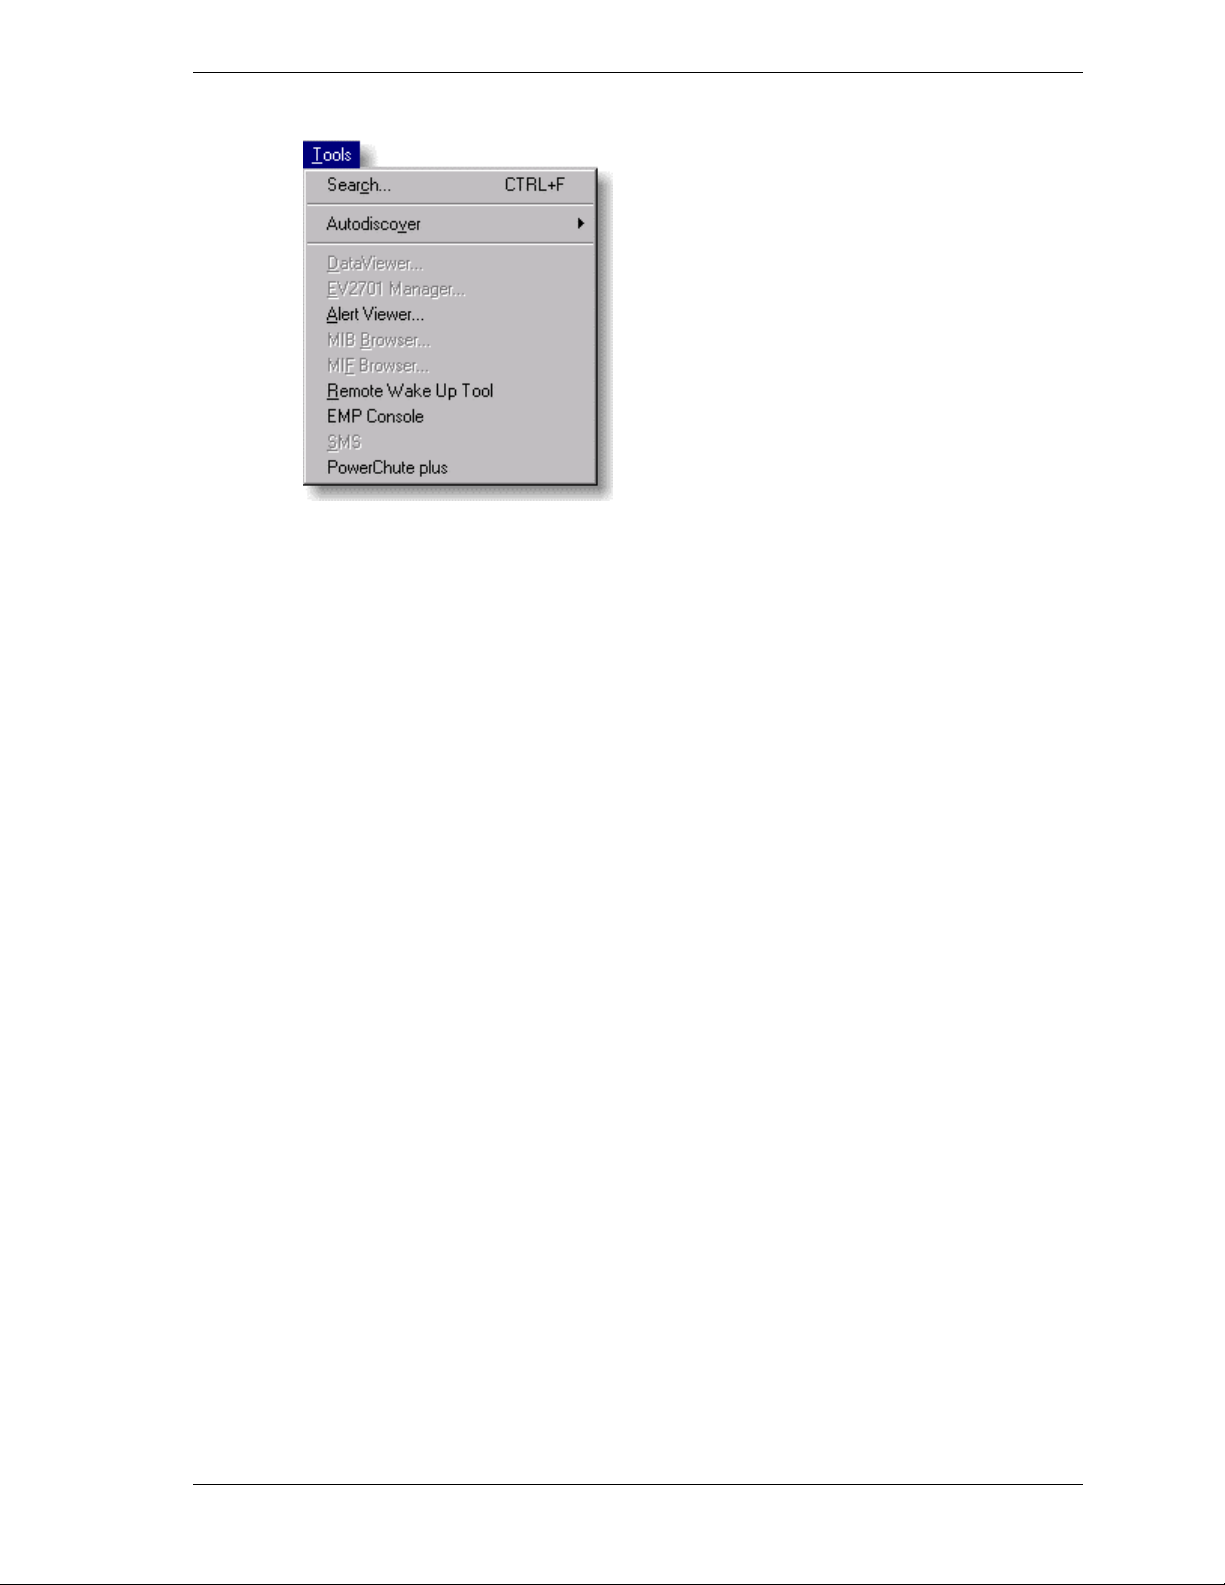
Tools Menu
Search - Displays the Search dialog box where you can search for a specific
component.
AutoDiscover - Detects Agents in the network and displays them as icons on
the Map View. AutoDiscover can be run in the foreground or in the background.
Data Viewer - Starts the Data Viewer for the selected icon.
Alert Viewer - Starts the Alert Viewer which displays a list of alert messages.
MIB Browser - Starts the MIB Browser.
MIF Browser - Starts the MIF Browser.
Remote Wake Up Tool - Starts the Remote Wake Up Tool.
SMS - Starts the SMS program, if installed.
PowerChute Plus - Launches the PowerChute Plus application, if installed.
Operations Window 2-7
Page 26
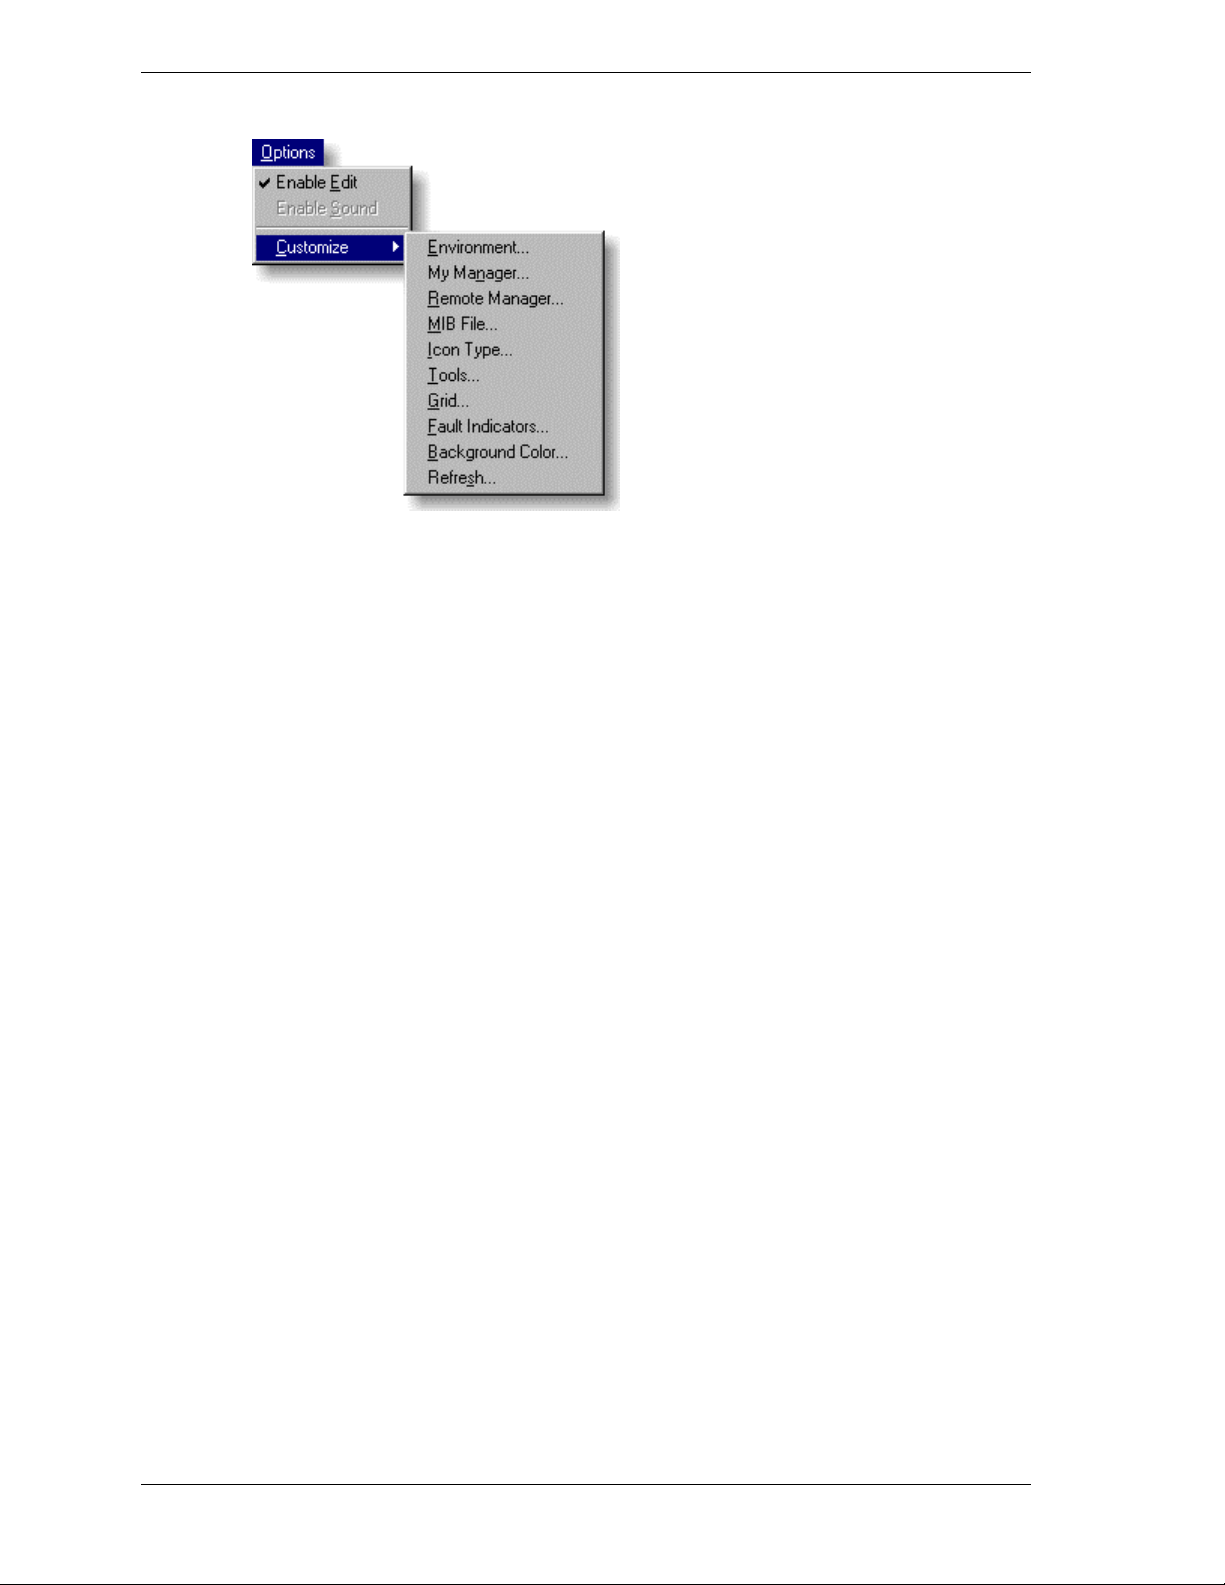
Options Menu
Enable Edit - When checked, allows you to edit the network map and other
customized items.
Enable Sound - When checked, sound files play when you open the network
map or when the Alert Viewer finds an error. (Sound files for the network are
defined on the Properties window. Sound files for alert messages are defined in
the Alert Viewer.)
(under Customize:)
Environment - Parameters regarding the Operation Window.
My Manager - Settings for the inter-community communications. (My
Manager displays.)
Remote Manager - Parameters regarding the inter-community communication.
(Neighbor Manager displays.)
MIB File - Customize the MIB file.
Icon Type - Creates or modifies icon types that appear in the icon palette.
Tools - Allows you to add, edit, or delete a toolbar button or menu item.
Grid - Sets the distance between grid lines.
Fault Indicators - Specifies the background color of the icon.
Background Color - Specifies the background color of the map.
Refresh - Checks the status of the icons periodically.
2-8 Operations Window
Page 27

Help Menu
Help Topics - Opens the help file.
About Operation Window - Displays the revision number of the Operations
Window and copyright information.
Operations Window 2-9
Page 28
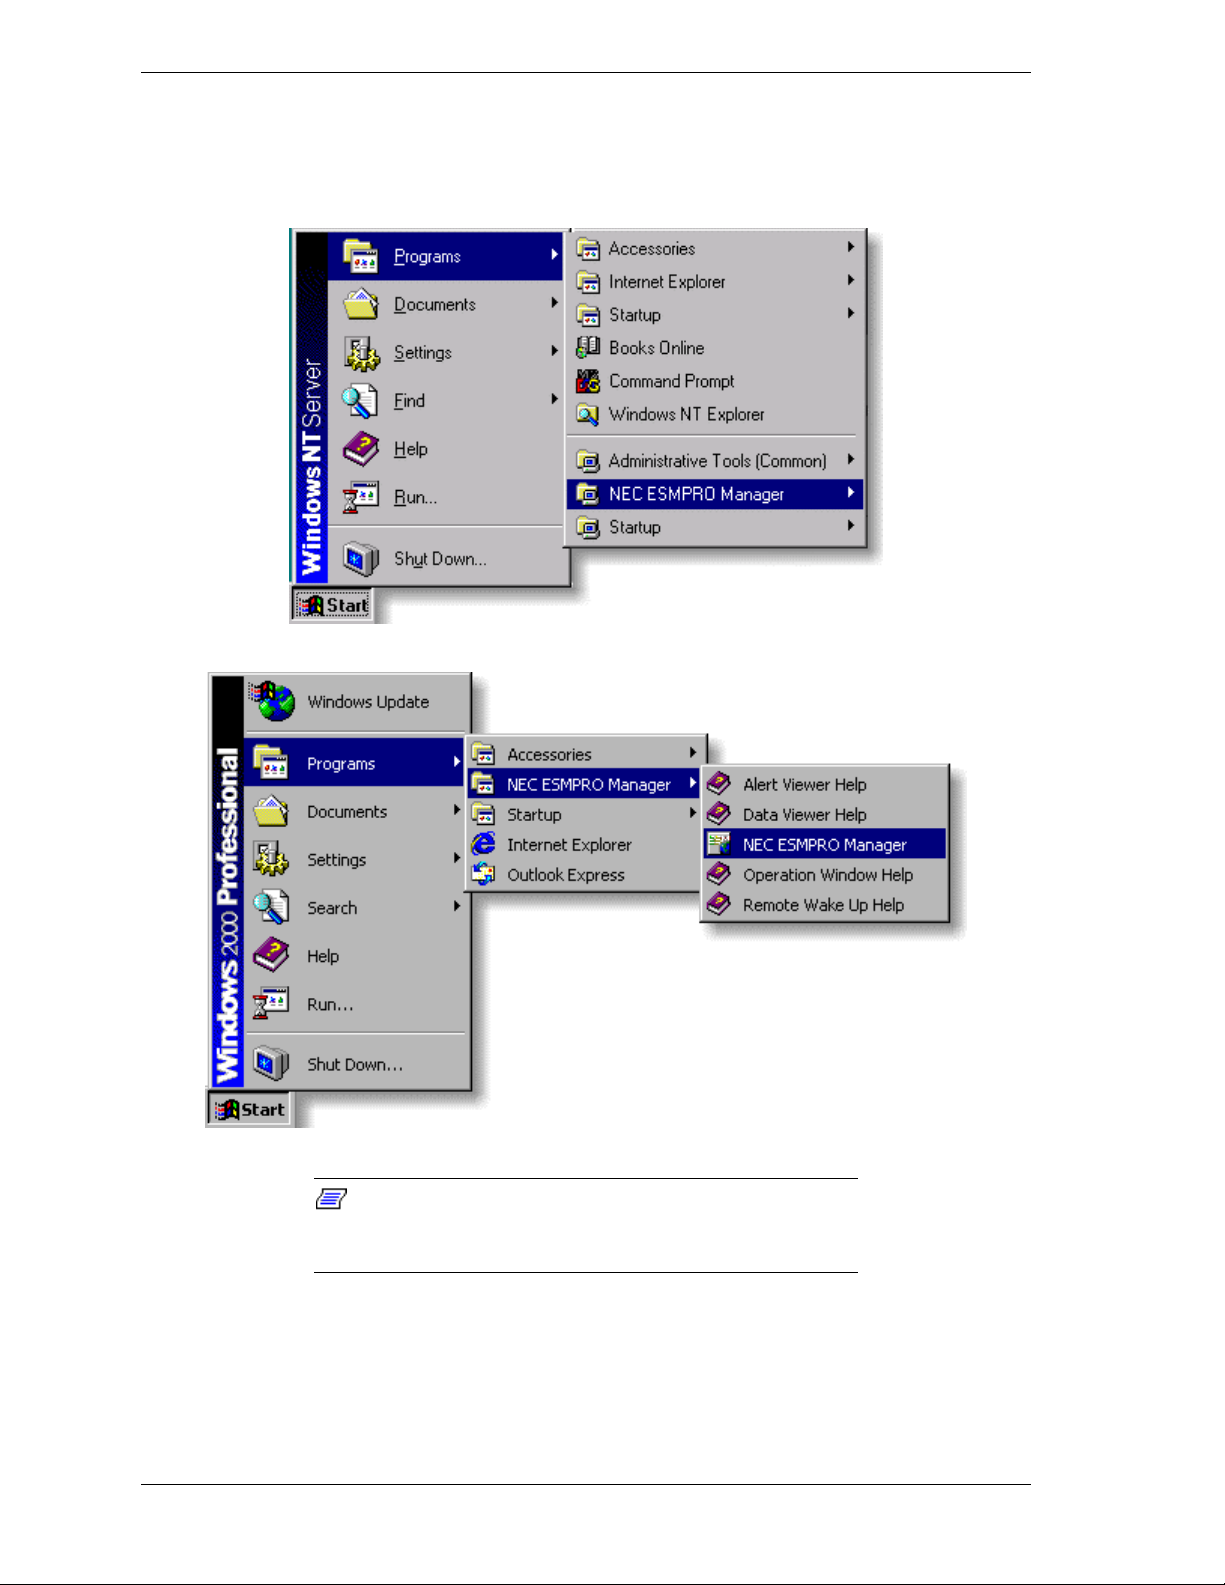
Starting ESMPRO
To start the ESMPRO Manager, click on ESMPRO Manager from the Start
menu. The Operation Window displays.
Windows NT 4.0/ Windows 95/Window 98
Windows 2000
Note: To start ESMPRO Manager automatically when
Windows NT starts, copy the ESMPRO Manager icon to the
Startup group
The Operation Window looks similar to the next figure. Alert Viewer also starts
and is minimized on the desktop.
2-10 Operations Window
Page 29
Operation Window
Note: To start ESMPRO Manager automatically when
Windows starts, add ESMPRO Manager icon to the Startup
group. (Click on Start/Settings/Taskbar. Select the Start
Menu Program tab).
Detecting the Agents with AutoDiscovery
ESMPRO Manager detects servers in the network as well as other devices such
as routers and personal computers. When servers are found, the Manager
registers them as icons in the Operation Window.
This process of finding servers and registering them in the Operation Window is
called AutoDiscovery. After you install ESMPRO and start the Operation
Window for the first time, you will be asked to start AutoDiscovery.
The following topics will show you how to start AutoDiscovery for the first
time, how to start AutoDiscovery manually at any time, and how to set
AutoDiscovery to run in the background periodically.
Starting AutoDiscovery for the First Time
Initiate AutoDiscovery as follows:
1. Ensure that the SNMP service is running on the Agents.
2. Open the map where you want Agents registered automatically.
3. From the Tools Menu, select AutoDiscovery/Foreground. The
AutoDiscovery screen displays.
4. Select (a network) TCP/IP Hosts. The Address screen displays
Operations Window 2-11
Page 30

5. Enter the network address and network mask for the network you want to
find. Also enter the value set for the Windows NT server to be detected in
the SNMP Community field. The default is public.
! If you are entering more than one SNMP community name, separate the
names with commas, as in public, xxx.
! If Class A (255.0.0.0) or Class B (255.255.0.0) is specified, the number
of addresses becomes enormous and the AutoDiscovery detection takes
a very long time. If the network in use is Class B, we recommend that
you modify the network address and network mask appropriately and
carry out a partial detection.
! If you want to access the details of AutoDiscovery, press the Details
button and check the following items.
Update properties. To update a server’s properties already set, check
this item.
Discover DMI Agent. To detect DMI agents, check this item.
Restrict the objects. To AutoDiscovery ESMPRO Agents only,
check this item.
Refer to on-line help for more details.
6. Press the Start button. AutoDiscovery is initiated.
7. When AutoDiscovery is finished, press Close. Any Agents detected will
appear on the map as icons.
Note: It is also possible to detect Agents periodically in
the background by specifying the SNMP community name
and the discovery interval in Aut oDis c o very/Background on
Tools Menu.
Starting AutoDiscovery Manually
To start AutoDiscovery manually:
1. Ensure that the SNMP service and SNMP trap service are running on the
Agents. SNMP trap service should not be running on the Manager.
2. Select an icon in the Tree View that represents a network. (In other words,
don’t select a server icon. Select the parent agent.) Agents detected in this
procedure will be placed below this parent icon and also in the Information
View.
3. In the Options Menu, make sure Enable Edit is checked.
4. From the Tools Menu, select AutoDiscovery/Foreground.
2-12 Operations Window
Page 31

Selecting Foreground will run AutoDiscovery now. Use Background to set
up the Manager to rediscover the Agents at specified intervals while running
in the background.
5. Select TCP/IP Hosts or NetWare Servers.
6. Continue with instructions for servers running TCP/IP (next section) and
NetWare.
TCP/IP Hosts
If you followed steps 1 through 5 above, the AutoDiscover (TCP/IP Hosts)
dialog box appears as shown below.
Note: If you receive the message The Network Address
is not set, you may have selected a server icon. Go up in the
Tree View and select a network icon.
Operations Window 2-13
Page 32

The Map list box displays networks and servers that are displayed in the tree
view of the Operation Window. The following information is also provided:
Status - This column indicates whether or not AutoDiscover has been
performed. Not yet indicates that the server appears in the Operation Window
but AutoDiscovery has not yet run and so has not yet auto discovered it.
Discovering indicates that AutoDiscover is running. Done means that
AutoDiscover is finished. Clicking the Start button will start AutoDiscover
again. Interrupted indicates that AutoDiscover has been interrupted. Click the
Start button to begin AutoDiscover again.
Map - Name of the server or network as it appears on the map.
Network Address - Network address of the target network. This can be set by
clicking the Address button. Setting the address is detailed in the next section.
Network Mask - Network mask of the target network. This can be set by
clicking the Address button. Setting the address is detailed in the next section.
Start and End Addresses - Defines the range of addresses to be discovered.
This can be set by clicking the Address button. Setting the address is detailed in
the next section.
Setting the Addresses
1. Click on the Address button in the AutoDiscover window. Address window
displays. The Address window enables you to specify network address,
network mask, or specify a range of IP addresses to be discovered.
2. If you know the network address, select the Address and Mask bullet. Then
enter the network IP address (for example 127.123.137.55) and network
mask (for example, 255.255.255.0) for the network you want to discover.
You may also enter a range of network addresses. Select the Range bullet
and enter first address to search for in the Start Address field. Enter the last
address in the End Address field.
2-14 Operations Window
Page 33

3. Click OK to return to the AutoDiscover TCP/IP window. If you followed the
steps above, you should see on your screen the AutoDiscover (TCP/IP
Hosts) dialog box.
Setting the SNMP Community
4. Enter the Community to be searched in the SNMP Community field. To be
detected the managed server and ESMPRO Manager must be in the same
community. The default is public.
If you are entering more than one SNMP community name, separate the
names with commas, as in public, xxx. If Class C (255.255.255.0) is
specified for Network Mask, the time-out period is about 150 seconds. If
Class A (255.0.0.0) or Class B (255.255.0.0) is specified, the number of
addresses becomes enormous and the automatic detection takes a very long
time. If the network in use is Class B, we recommend that you enter the
network address and network mask and carry out a partial detection.
Entering the Details
5. Click the Details button to specify advanced settings for AutoDiscovery and
set the following parameters.
ICMP ECHO Timeout - The amount of time ESMPRO waits for a
response to ICMP ECHO. Enter a number from 1 to 60 seconds.
ICMP ECHO Retry - The number of times ICMP ECHO will be resent
when there is no response. Enter a number from 0 to 10.
SNMP Retry - The number of times the SNMP packet is resent when there
is no response from the community. Enter a number from 0 to 10.
Start time - If you want AutoDiscover to begin at a future time, specify the
start time. When this field is 0, AutoDiscover begins immediately when you
click on OK on the AutoDiscover Background window.
Update Properties - If servers are already displayed in the Information
View, their names, attributes, and icon types are updated when this box is
checked.
Discover DMI Agents - Check this box to AutoDiscover LANDesk Client
Manager systems or Express5800 servers with DMI agents.
Operations Window 2-15
Page 34

Restrict the objects (server) - When checked, only servers running
ESMPRO Agent software are discovered and registered in the Information
View. For example, when this box is checked routers and personal
computers will not be registered in the Information View.
Restrict the objects (client) - When checked, only clients running
ESMPRO Manager are auto discovered.
Register on Temporary Map - When checked, newly discovered
components are distinguished from components already discovered.
6. Click OK to close the Details window and save your settings. Then click
Close to close the AutoDiscover window.
2-16 Operations Window
Page 35

AutoDiscover for NetWare Servers
1. Select a NetWare icon in the Operation Window and select
Tools/AutoDiscover/Foreground/NetWare Servers. The following dialog
box displays.
2. In the SNMP Community field, enter the value set for the NetWare Server
you want to find in the SNMP Community field. The default value is public.
3. Click on Details. The Details of AutoDiscover window figure displays.
4. Click OK to close the Details button.
5. Click on the Start button on the AutoDiscover (NetWare Servers) dialog
box.
6. When automatic discovery is finished, click on Close. Any systems detected
appear on the map in the Operations Window as icons. In the future you may
want to detect systems periodically in the background by specifying the
SNMP community name and the interval in AutoDiscover/Background on
Tools Menu.
Operations Window 2-17
Page 36

Detecting the Agents Automatically
To set up AutoDiscover to run periodically, do the following:
1. From the menu bar, select Tools/AutoDiscover/Background. The following
figure displays.
2. Select Enable Autodiscovering.
3. Enter the SNMP Community for the server to be detected. The default is
public. If you are entering more than one SNMP community name, separate
the names with commas, as in public, xxx.
4. Enter the interval at which ESMPRO Manager will try to detect the network.
Once you click on OK, AutoDiscover begins immediately. After
AutoDiscover is finished, it will begin again at the interval set here. When
the interval is 0, AutoDiscover is performed only once.
5. Click on Details. The Details of AutoDiscover window figure displays. Set
the parameters for your servers following the field descriptions previously
described in the section AutoDiscovery TCP/IP, Entering the Details.
6. Click on OK to close the Details window and save your settings.
7. Click on OK on the Background AutoDiscover window.
2-18 Operations Window
Page 37

Customizing the Operation Window
When you start the ESMPRO Manager for the first time, the Operation Window
will look similar to the following:
The Internet and NetWare Server icons always appear in the Tree View. After
you run AutoDiscover, servers running Windows NT are listed under the
Internet icon. Servers running NetWare are listed under the NetWare Server
icon.
Cluster and Rack mount icons may or may not be included in your view. Under
the Cluster icon are listed servers that belong to a specific cluster. Under the
Rackmount icon are servers that belong to a specific rack.
Expand the Tree View by clicking on the + sign next to an icon.
The Operation Window may be customized by:
! Adding a map to the background in the Information to give the viewer an
idea of the geographic location of the servers.
! Changing the names of the icons in the Tree and Information Views to
reflect your network.
! Changing Agent Properties
! Adding an icon manually.
Operations Window 2-19
Page 38

Adding a Map
To display a map or other graphic in the background of the Information View,
specify a graphics (.bmp) file in the background field of the Properties window.
To add a background graphic, perform the following procedure.
1. Click on an icon in the Tree View in the location you want to add the map.
This is typically the top most level.
2. Select Properties from the File Menu. The Properties screen displays as
shown in the next figure.
3. Select Background. (Double click on Background.)
4. To make a selection from the available bitmaps, click on the Browse button.
The Graphic-File Selection dialog box appears.
2-20 Operations Window
Page 39

5. Select a graphics file and click on OK.
6. If you don't see your graphics file in the list, click on Add and use the drop
down list in the Open dialog box to access directories on your computer for
bitmap files to add to ESMPRO.
7. Select OK to return to the Properties window. At the Properties window,
click OK again. The graphic you selected now appears in the Information
View.
Changing Icon Names
In this procedure, you will change the name of the managed server. This step is
not mandatory, but it will make your Tree and Information Views easier to use.
1. In the Tree View, click on an icon below the My Manager icon. (For
example, Internet or NetWare Server.)
2. Select Properties from the File Menu. The following figure displays.
Operations Window 2-21
Page 40

3. Enter a name in the Name field.
The name field allows up to 63 characters but does not allow spaces.
(hyphens and underscores are OK.) This name must be unique among all
servers on the Operation Window.
To add an alias, double click on Alias. The alias can be more than one word
and need not be unique.
(Other fields on the Properties window are described in the next section
Changing Icon Properties).
4. Select OK to return to the Operation Window.
5. If you specified an Alias, you can view the aliases by selecting Alias in the
View Menu.
2-22 Operations Window
Page 41

Changing Icon Properties
After icons are added during AutoDiscover, you may want to view and edit their
properties.
1. Display the command menu by clicking on the icon with the right mouse
button. The command menu differs, depending on the available functions for
the icon.
2. Select Properties from the command menu. The following figure displays.
Note: Parameters displayed on the Properties window
differ depending on the icon selected. For example, only the
Basic tab displays for top-level icons.
Operations Window 2-23
Page 42

3. Make changes in the Properties window. Fields are described below.
Properties Basic Tab
Name – The name of this server or network. The top-most level is
automatically assigned the name "top" and cannot be changed.
Icon Type Name - The icon that represents the server or network. To
change to another icon, see Changing the Icon’s Image located in the
Advanced Configuration section of this chapter.
Note: To edit the following items, double click on the
item and make your entries in the dialog boxes that appear.
Not all fields described below appear for all icons.
Alias - The alias is displayed in the map view instead of the name when
Alias is checked in the View menu.
Network Address - For network icons, specify the address of the network.
(for example, 10.0.0.1).
Network Mask - For network icons, specify the mask of the network. (for
example, 255.255.255.0).
Administrator – The contact information for the network manager
responsible for the equipment. This entry includes name, email address, and
phone number.
IP Address - The TCP/IP address assigned by the network administrator.
IPX Address - The NetWare server address specified or assigned during
NetWare installation.
SNMP Community Name (get) - The community specified during SNMP
installation where alert messages are sent.
SNMP Community Name (set) - The community defined during SNMP
installation where alert messages are sent.
OS Type - Operating system.
Hardware Type - Equipment type and part number.
Manager –The contact information for the manager responsible for the
equipment. Can include name, email address, and phone number.
Location - The location of the server or network such as a building name or
floor number. This field is optional.
Sound - The name of the wav (sound) file that plays when you double click
on a network or server icon or when the Alert Viewer receives an error from
that network or server. Make sure Options/Enable Sound is checked and a
sound device is installed.
Background - The graphic file that displays in the background of the
Information View in the Operation Window.
2-24 Operations Window
Page 43

Properties Function Tab
RWU (Remote Wake Up) MAC Address - MAC address of the target
system. This field is required when using the Remote Wake Up function.
RWU (Remote Wake Up) IP Broadcast Address - IP broadcast address of
the network where the target system is connected. This field is required
when using the Remote Wake Up function.
ESMPRO MIB - When the value is ON, this field indicates the ESMPRO
Agent is installed on the server. If both ESMPRO MIB and DMI are OFF or
blank, ESMPRO MIB is assumed to be ON.
DMI - Indicates that the Agent supports DMI. This value is turned on
automatically when you select Discover DMI Agents in the AutoDiscover
[TCP/IP Hosts] dialog box (Details button). When set to ON, the MIF
Browser is enabled. Also, when DMI is ON, you may also want to set Watch
DMI Event to ON at the WatchState tab.
Properties WatchState Tab
Watch Server Status - Indicates whether or not the server is monitored
periodically. When set ON, the server is monitored at the rate specified in
the next field: Server Status Polling Interval. If this item is left unchecked,
the Agent is not monitored and its icon appears green indicating a normal
status.
Operations Window 2-25
Page 44

Server Status Polling Interval (min) - The status of the server is updated at
the interval specified here. The unit is minutes and the interval must be a
whole number. The smallest interval you can enter is 1 minute. If left blank
or set to 0, the interval is 1 minute.
Watch DMI Event - Indicates whether or not the server is monitored
periodically for DMI events. When set to ON, DMI events are monitored at
the rate specified in the previous field: Server Status Polling Interval. DMI
events are displayed in the Alert Viewer. To be valid, you must set DMI to
ON at the Function tab.
If this item is OFF, the Agent is not monitored and its icon appears green
indicating a normal status.
Detect Server Down - Set this item if you want to be notified by alert
message when the monitored server doesn’t respond to the Manager. If this
item is set ON, the Watch Server Status field must also be set ON.
2-26 Operations Window
Page 45

Manually Adding, Deleting, and Moving Icons
Adding an icon
1. From the View Menu, select the Icon Palette. If it is already running, press
[Alt] [Tab] to access it.
2. Click on the icon in the palette that best represents the Agent. If none of the
icons are suitable, you can modify the standard ones or create your own.
3. If you're adding only one icon, ensure that Once is selected. To add more
than one icon, select Continuance.
4. Move your cursor to the Information View. Notice that the cursor looks like
a square view finder. Press the mouse button to deposit the icon.
5. The Properties window immediately appears. Enter the appropriate
information for the server or map being created. Use the on-line help for a
description of the fields.
6. When you finish, press OK and close the Properties window. The icon is
automatically added to the Tree View.
7. If you selected Continuance in step #3, press the mouse button to deposit
another icon. When you're finished adding icons, click on the arrow in the
Icon Palette.
Operations Window 2-27
Page 46

Deleting an icon
Select the icon and choose Delete from the Edit Menu. If your attempt is denied,
make sure that Enable Edit is selected in the Options Menu.
Moving an icon
Move an icon in the Information View by dragging on it with the mouse.
Advanced Configuration
Here are additional ways you can customize the Operation Window.
! Changing the default status colors
! Changing an Icon's Image
! Creating an Icon Type
! Changing the Command Menu that appears when you click on the right
mouse button.
! Setting up Inter-Manager Communication
! Using the MIB Browser.
Changing Default Status Colors
You can view and change the status colors by selecting
Options/Customize/Fault Indicators from the menu bar. A screen similar to the
following appears. It shows you the current color code for normal, abnormal,
warning and unknown status. The default color code (as shown in the next
figure) is green (normal status), red (an error occurred), yellow (a warning
message was issued), and gray (server status is unknown).
To change the default colors:
1. Click on the Change button. The following screen displays.
2. Click on a color in the Basic or Custom Colors section.
3. Click on OK.
2-28 Operations Window
Page 47

Changing the Icon's Image
You can only change a map icon to another map icon or change a server icon to
another server icon. You can determine which is a map icon and which is a
server icon from the Icon Type window. Icons under Map (city, factory,
building and floor) are map icons. Full tower is a server and appears under the
server icon. A floor icon can change to a building icon but cannot be changed to
a full tower icon.
1. Highlight the icon you want to change in the Information View.
2. Ensure that Icon Palette is selected in the View Menu.
3. Select Change Icon Type from the Edit Menu.
4. Ensure that the Icon Palette is visible. You may have to press [ALT][TAB]
to display it again.
5. Click on an icon in the Icon Palette. The old icon changes to the new one
selected.
Creating an Icon Type
You can create your own icon types and add them to the Icon Palette.
1. From the Options Menu, select Customize and Icon Type.
2. Highlight an icon.
Operations Window 2-29
Page 48

Icons are listed hierarchically and by type. The new icon type will be placed
under the one you highlight here.
There are several factors to consider when deciding where to add icons. First
of all, the Properties window for the new icon will be based on the parent
icon. Secondly, the icon's image can be changed later once they have been
added to the map, but they can only be changed to another icon in the same
group (that is, map or server).
3. Click on Add.
4. Enter a name for the new icon.
5. Click on Edit. The Icon Types Properties window displays. (See the next
figure). Select the Bitmap tab.
2-30 Operations Window
Page 49

6. You can select one of the graphics and select OK. To specify your own
bitmap, click on the Add button. Then enter the drive, path and filename for
your bitmap.
7. Select Open and the new bitmap file appears in the window with the existing
bitmaps. The icon appears in the Icon Palette when the Operation Window is
restarted
Changing the Command Menu
These procedures will show you how to edit the Command (right mouse button)
menu for an icon type. Once these changes are made to the icon type, new icons
created with the icon type have the new Command menu. Command menus for
icons created previously remain unchanged.
Command Menu
Operations Window 2-31
Page 50

1. From the Options Menu, select Customize and Icon Type.
2. Highlight the icon type you want to change.
3. Click on Edit. The Icon Type Properties window displays. (See next figure.)
On the Command tab, the Menu Item list shows you all the items that appear
in the Command menu for this icon type.
2-32 Operations Window
Page 51

To add an item to the Command menu:
1. Click on Add.
2. In the Text field, enter the new text you want to appear in the Command
menu.
3. Enter the command that starts the program in the Command field.
4. Enter any arguments needed to run the program in the Argument field. (This
field is optional.)
5. If you select Action for Double Click, the item highlighted in the Menu Item
list will run when you double click on this icon type in the Information
View. For example, if you highlight Properties in the list and check the box
Action for Double Click, then anytime you double click on a city icon in the
Information View, the Properties dialog box will display.
6. Items in the Command Menu will appear in the order in which they appear
here in the Menu Item list. If you want to change the order, highlight an item
and then move it by clicking on the Up or Down buttons.
To delete an item from the Command menu:
1. Click on the Menu Item.
2. Click on Remove. Items that you have added can be deleted with the
Remove button. Standard items like Open and Properties can be eliminated
by checking the Invisible check box.
Setting Up Inter-Manager Communication
These settings define the exchange of information between Managers on maps
and agents registered in the remote manager.
To establish the inter-Manager communication, you must specify the following.
! My Manager
! Neighbor Managers
! Routing
! Access rights
! Notification options.
My Manager
Inter-Manager communication requires that each Manager have a unique name.
Define My Manager as follows.
1. From the Options Menu of the Operation Window, select Customize and
then My Manager.
Operations Window 2-33
Page 52

2. Set parameter for each field. Details are available in the on-line help.
Neighbor Managers
The Neighbor Manager communicates directly with My Manager. The setting
for the Neighbor Manager allows managers not registered as Neighbor
Managers to communicate via the Neighbor Manager. Define the Neighbor
Manager as follows.
1. From the Options Menu, select Customize/Remote Manager.
2. Select Neighbor Manager.
3. Click on the Add or Properties button. The following window appears.
4. Enter the appropriate information in each field. Field details are available
from the on-line help.
2-34 Operations Window
Page 53

Routing
Inter-Manager communication to managers not directly connected (not
neighboring) requires routing tables. Set up routing paths as follows.
1. From the Options Menu, select Customize/Remote Manager.
2. Select the Routing tab and press the Add or Properties button.
3. Set the parameters for each field. Help is available from on-line help.
Access Rights
Defines read-only access or read/write access for inter-Manager communication
from a specific Manager.
1. From the Options Menu, select Customize/Remote Manager.
2. Select the Access Permission tab and press the Add or Properties button.
3. Enter the appropriate information in each field. Details about field entries
are available in the On-line help.
Notification Options
Define notification options as follows.
1. From the Options Menu, select Customize/Remote Manager.
2. Select the Notification Event tab and press the Add or Properties button.
Operations Window 2-35
Page 54

3. Fill in the appropriate information for each field. Details on field entries is
available in the on-line help.
Using the MIB Browser
The MIB Browser allows you to monitor server variables at specified time
intervals.
1 Select MIB Browser from the Tools Menu or press MIB Browser icon on
the Toolbar
2 Select the destination Agent from the Manager Name and Component drop-
down lists.
The Manager Name refers to the name specified in the My Manager window
(From the menu bar, select Options/Customize/My Manager). Component is
the type of device being managed, where host specifies a computer system.
The field adjacent to Component specifies the name of the component being
managed, for example, the name of a server.
3 Specify the MIBs to be retrieved. You can specify several OIDs at one time.
When the OID is not the last one in the directory, all entries under the OID
are also selected.
4 Set the interval of retrieval. When interval is 0, the MIB Browser retrieves
just once.
5 Leave the output style on Text. Other selections in the list are future
enhancements and are not available now.
6 Press to start collection.
2-36 Operations Window
Page 55

Note: When the version of the MSVCRT40.DLL file
which is in the Windows\System directory is different
between Managers engaged in inter-Manager
communication, the retrieved time is sometimes not correct.
If this occurs, please replace MSVCRT40.DLL so that all
versions of the file are the same.
Installing a Vendor Extension MIB
The Operation Window allows you to install a vendor extension MIB.
1. From the menu bar, select Options/Customize/MIB File. The following
figure displays.
2. In the MIB File Operation window, click on the Browse button to search the
directory for the MIB file you wish to install.
3. Highlight the MIB File and click on the Open button. This returns you to the
MIB File Operation window where you will see the new MIB File in the
Embedded MIB list.
The new MIB is now accessible in the MIB Browser via the Enterprise button.
Click on the Enterprise button and the new MIB appears in the left most list of
MIBs.
Operations Window 2-37
Page 56

2-38 Operations Window
Page 57

Data Viewer
! Starting the Data Viewer
! Collecting Data
! Printing Data
! Setting Local Polling
! Thresholds
! Graph Viewer
! Remote Shut Down
3
! Remote Wake Up
! Setting the Polling Interval
! Data Viewer Menu Bar
Page 58

The Data Viewer lets you check hardware and software features on servers and
desktops that are monitored by ESMPRO Manager.
The left pane contains a directory of categories for the server or desktop. Click
on + to expand the directory and - to contract it. Highlighting a category
displays information in the right pane.
In the tree view you may see one or two major folders labeled (ESMPRO MIB)
and (DMI). Folders under ESMPRO MIB contain information from the SNMP
agent. If there is also DMI agent software on that server, you will see another
major folder labeled (DMI) which contains information from the DMI agent.
If the tree view is empty, or if you don't see the ESMPRO MIB or DMI folders,
return to the Operation Window and make sure that ESMPRO MIB and DMI
are checked in the Properties dialog box. (Right click on the server icon on the
Operations Window and select Properties.)
Starting the Data Viewer
To start the Data Viewer:
1. From the ESMPRO Manager Operation Window, select an Agent icon.
2. Select any one of the following:
! Data Viewer from the Tools menu
! Data Viewer icon in the toolbar
3-2 Data Viewer
Page 59

! Data Viewer from the Command menu (displays when you right click on
the server or desktop icon).
Note: If the Data Viewer icon is grayed out or if it
doesn't appear in the Command menu, the icon you selected
was detected as a system on the network but is not running
Agent software. If the Agent software was installed, check
the addresses of the destination traps on the server. Also,
be sure the trap service is running on the server.
At times it may appear that your system is hung while discovering a new Data
Viewer tree for your server. The discovery process is still active, but due to the
traffic on your network or resource limitations on the Managers workstation, the
system appears to have slowed down or hung. Do not reboot the system. As long
as you don't have an error message the system is still working.
Collecting Data
While the Data Viewer is running, data from a server is periodically collected
and displayed on the numerous Data Viewer screens. In addition, if you want to
save the data for future use, you must go to the Tools menu and set up automatic
data collection and the Statistical Data Saving Mode. These steps are described
in the following sections.
Setting up Automatic Data Collection
To set up automatic data collection, do the following:
1. Select Automatic Data Collection Setting from the Tools Menu.
2. Verify your Agent is in the Collecting Servers list.
To add a server, highlight one or more servers in the All Servers list. Then click
on the Add button.
Data Viewer 3-3
Page 60

3. Specify collection cycles by selecting a frequency, day, month, and time.
When the frequency is every month, you can set the day of the month and
hour.
When the frequency is every week, you can set the day of the week and
hour.
When the frequency is every day, you can set the hour.
When the frequency is every hour, you can set minutes.
When the frequency is every 30 minutes, you can set minutes.
4. Enter a value of up to 100 in the Overwrite Data Older than field to specify
how many days the data is saved before being overwritten with new data.
5. Press OK to accept the settings and start data collection.
The server icon in the Information View of the Operation Window changes
to show a graph within the icon. This indicates that the Manager is storing
statistical data on the server. For example, you may see these icons in the
Information View when their parent icon is selected in the Tree View.
3-4 Data Viewer
Page 61

data is being stored
data is not being stored
Proceed to the next section and indicate the file format in the Statistical Data
Saving Mode window for the saved data.
Statistical Data Saving Mode
From the Tools menu, select Statistical Data Saving Mode. The following figure
displays. Indicate a file format for the saved data.
Local File - Saves the statistical data in a text file. The name of the file is the
name of the server and the extension is .DAT. You can find the file in the
directory: \Program Files\ESMPRO\ ESMWORK\ESM.
ODBC - Saves the statistical data in a database that supports Open Database
Connectivity (ODBC) interface. To use this mode, set up your database software
to use the same Data Source Name as you entered here.
No matter which format you use, before data is stored you must set up automatic
data collection as described in the previous section.
Setting Up the ODBC Interface
In this procedure you will specify ODBC data collection in ESMPRO and enter
matching information in the database.
1. From the Data Viewer, select Statistical Data Saving Mode from the Tools
menu.
2. Select ODBC and enter an ODBC Data Source Name.
3. Click OK to save the setting and close the window.
Error! Bookmark not defined.
Data Viewer 3-5
Page 62

Next, set up your data base for ODBC collection as follows:
1. Install and configure the ODBC drive for your particular database.
2. Set the environment in ODBC using the same Data Source Name you
entered on the Statistical Data Saving Mode screen in ESMPRO.
3. In your database manager software, create a database template or table with
the following fields.
DataName - Saves the data name collected, for example, ABC Network
Board.
DataKind - Stores the data type collected, for example, Total Send Packets.
GetTime - Stores the date and time (timestamp) of data collection in a
DateTime field.
GetValue - Saves integer data collected.
DataType - Saves the data type that was collected as an integer, for
example, absolute value data. When the data value is 1, the data type is
registered as percentage. Otherwise, the data type is registered as an absolute
value.
4. Save the database.
5. Enter the name of this database into your ODBC driver's settings where
appropriate.
Types of Data Collected
When automatic data collection is set up, the Data Viewer stores the following
data in files or in a database.
! IIS
! Miscellaneous
! Network Information
! Storage Information
! System Board (CPU and memory information)
IIS Information
IIS FTP: Total Bytes Received
IIS FTP: Total Bytes Sent
IIS FTP: Total Files Received
IIS FTP: Total Files Sent
IIS FTP: Current Anonymous Users
IIS FTP: Current NonAnonymous Users
IIS FTP: Total Anonymous Users
3-6 Data Viewer
Page 63

IIS FTP: Total NonAnonymous Users
IIS FTP: Max Anonymous Users
IIS FTP: Max NonAnonymous Users
IIS FTP: Current Connections
IIS FTP: Max Connections
IIS FTP: Connection Attempts
IIS FTP: Logon Attempts
IIS HTTP: Total Bytes Received
IIS HTTP: Total Bytes Sent
IIS HTTP: Total Files Sent
IIS HTTP: Current Anonymous User
IIS HTTP: Current NonAnonymous User
IIS HTTP: Total Anonymous User
IIS HTTP: Total NonAnonymous User
IIS HTTP: Max Anonymous User
IIS HTTP: Max NonAnonymous User
IIS HTTP: Current Connections
IIS HTTP: Max Connections
IIS HTTP: Connection Attempts
IIS HTTP: Logon Attempts
IIS HTTP: Total Gets
IIS HTTP: Total Posts
IIS HTTP: Total Heads
IIS HTTP: Total Others
IIS HTTP: Total BGI Requests
IIS HTTP: Total Not Found Errors
IIS GOPHER: Total Bytes Received
IIS GOPHER: Total Bytes Sent
IIS GOPHER: Total Files Sent
IIS GOPHER: Total Directory Sent
IIS GOPHER: Total Searches Done
IIS GOPHER: Current Anonymous Users
IIS GOPHER: Current NonAnonymous Users
IIS GOPHER: Total Anonymous Users
IIS GOPHER: Total NonAnonymous Users
IIS GOPHER: Max Anonymous Users
IIS GOPHER: Max NonAnonymous Users
IIS GOPHER: Current Connections
IIS GOPHER: Max Connections
IIS GOPHER: Connection Attempts
IIS GOPHER: Logon Attempts
IIS GOPHER: Aborted Connections
Data Viewer 3-7
Page 64

Network Information
Received Total Octets
Received Total Packets
Received Unicast Packets
Received Non-Unicast Packets
Received Packets Disposed
Received Error Packets
Received Undefined Protocols
Transmitted Total Octets
Transmitted Total Packets
Transmitted Unicast Packets
Transmitted Non-Unicast Packets
Transmitted Packets Disposed
Transmitted Error Packets
Transmitted Queue length
Received Alignment Errors
Received FCS Errors
Received Excessive Frames
Received Additional Errors
Transmitted Carrier Sense Errors
Transmitted Late Collisions
Transmitted Excess Collisions
Transmitted Multi-Collision Frames
Transmitted Single-Collision Frames
Transmitted Delayed Frames
Transmitted Additional Errors
Line Errors
Burst Errors
AC Errors
Abort Transmitted Errors
Internal Errors
Lost Frame Errors
Frame Copied Errors
Token Errors
Frequency Errors
Transmitted total bytes
Received total bytes
Total transmit errors
Total receive errors
Total host errors
Total wire errors
3-8 Data Viewer
Page 65

Storage Information
IDE Hardware Reset Errors
IDE Software Reset Errors
IDE Time Out Errors
IDE Invalid Interrupt error
SCSI Time-Out Errors
SCSI Controller Errors
Device Read Error
Device Write error
Device seek error
Device track Errors
Device format Errors
Defect List Errors
Device Parity Errors
Device Phase Errors
Device Misc Error
Device Recovered Seek Errors
Device Recovered Track Errors
Device Recovered Data with ECC
Device Recovered Data without ECC
Device Recovered Misc Errors
Device Used Spare Blocks
Device Read Sectors
Device Write Sectors
IDE Over-Run Errors
IDE Controller Errors
SCSI Selection Time-Out Errors
SCSI Medium Errors
SCSI Hardware Errors
SCSI Command Reject Errors
SCSI Recovered Errors
Used Capacity (KB)
Used Clusters
Free Logical Drive Size (KB)
System Board (CPU and memory information)
CPU load (%)
Rate of CPU load - 1 min
Rate of CPU load - 5 min
Rate of CPU load - 30 min
Rate of CPU load - 1 hour
Rate of CPU load - 1 day
Rate of CPU load - 1 week
Rate of each CPU load - 1 min
Rate of each CPU load - 5 min
Rate of each CPU load - 30 min
Rate of each CPU load - 1 hour
Data Viewer 3-9
Page 66

Rate of each CPU load - 1 day
Rate of each CPU load - 1 week
User Mode (%)
Privileged Mode (%)
Correctable Error
Uncorrectable Error
Physical Memory Available (KB)
Physical Memory Currently Used (KB)
Physical Memory Currently Used (%)
Page File Available (KB)
Page File Currently Used (KB)
Page File Percent Used (%)
Miscellaneous
The following data is also collected during automatic data collection. When you
select All as the report type, all the data listed on this page as well the
miscellaneous data listed here is printed.
Number of processes
Number of threads
Temperature (F)
Voltage (mV)
Fan speed
Printing Data
In this section, you will learn how to print the data stored through Automatic
Data Collection.
1. To print statistical data, select Print Statistical Data from the Tools Menu.
2. Select a form in the Form Name field on the Print Statistical Data screen.
Data to be printed in the report is indicated with icons in the Optional
Statistical Items list box.
Indicates that the data will be represented by text.
Indicates the data will be shown as a graph. When Graph is selected,
then Graph Type indicates either Line or Step.
Text and graph are printed on separate sheets.
3-10 Data Viewer
Page 67

3. Make changes to the list of Statistical Items if desired.
To include data in the report, highlight it and check Text or Graph or both. If
you select Graph, you can also select Line or Step for the graph type.
To remove data from the report, highlight it and make sure Text and Graph
are unchecked.
4. Select Print.
Creating a New Report Form
1. Select on the Print Statistical Data screen.
Data Viewer 3-11
Page 68

2. Enter the name of the new form and select OK.
3. In this step, you will select the data you want to appear on the form and
indicate whether you want it to appear as text or graph or both.
Highlight the data you want to see on the report. Click on Text or Graph or
both to indicate whether you want the data it to appear as text or in a graph.
An icon appears next to the data item in the list.
If you chose Graph, select Line or Step.
4. Select OK.
Copying a Form
1. Select the form you want to copy in the Form Name field in the Print
Statistical Data screen.
2. Select .
3. Enter the name of the new form.
4. Highlight the data you want on the report. Click on text or graph or both.
If you chose Graph, select the Line or Step.
5. Select OK.
3-12 Data Viewer
Page 69

Deleting a Form
1. Select a report form in the Form Name field in the Print Statistical Data
screen.
2. Select .
Setting Local Polling
The Local Polling window allows you to monitor data that has an Integer
attribute. The first column displays the status. A pair of glasses in the Mode
column shows that Enable Polling has been checked. (More on this setting
later.) Use these instructions to set or change the monitoring data and threshold
levels.
Data Viewer 3-13
Page 70

Configuring Local Polling
1. From the Tree View in the Data Viewer, select Local Polling. The Local
Polling screen displays.
2. Select a row in the Polling Target list and click on the Configure button. The
next figure displays.
3. Specify the OID in Item field. OIDs are selectable from the Browse button.
Note that not all OIDs that are displayed with the Browse button are
available.
Note: In Item field, enter OID including Index.
When entering using the Browse button, where Index needs
to be specified is shown by "Transmitted Error
Packets.[%index%]" in the comment column.
When these OIDs are selected, character strings ending with
"." such as "1.3.6.1.2.1.10." are set in the item field. Enter
the index value after".".
4. Check the Enable Polling check box.
5. Set duration and interval. When duration is 0, polling is continuous.
6. Set threshold limits and reset values for the OID. In addition to the text entry
boxes, you can set the threshold using the sliding bars to the right.
7. Check Enable Sending Trap. This issues a trap corresponding to the current
threshold settings.
8. Click on OK. You will see the OID listed in the Local Polling window. If
you checked Enable Polling, a pair of glasses icon appears in the Mode
column.
3-14 Data Viewer
Page 71

Deleting an Item in the Local Polling List
1. Select a row in the Polling Target list and select the Reset button.
Thresholds
Thresholds determine the status of the monitored servers and generate alert
messages that appear in the Alert Viewer.
Threshold limits are set in the Data Viewer and in the Agent. In the Data
Viewer, begin by clicking on the threshold button next to the parameter you
want to set. The instructions in the following paragraphs show you how to enter
limits and reset values in the dialog boxes.
You can also set these thresholds in the Agent.
Data Viewer 3-15
Page 72

Threshold Limits
When a parameter exceeds the threshold limit an alert message appears in the
Alert Viewer. The corresponding icons in the Data Viewer and Operation
Window turn red or yellow to show the warning or abnormal alert status. (The
default colors red, yellow, and green are assumed here.)
The alert status returns to normal when the parameter falls below the reset value.
A recover message appears in the Alert Viewer and the icons in the Data Viewer
and Operation Window return to green.
Fatal and Warning Limits
Most parameters have two limits (Fatal and Warning or Major and Minor) and a
reset value for each limit. When the parameter exceeds the Warning limit, a
warning alert message (such as, CPU Load Warning) appears in the Alert
Viewer. The Agent's icon in the Operation Window and the appropriate folder
icon in the Data Viewer turn yellow to indicate the abnormal status.
The status continues to be Abnormal until it falls below the Warning Reset
value when the status returns to normal. A warning recover message (such as
CPU Warning Recover) appears in the Alert Viewer and the icons in the Data
Viewer and Operation Window return to green.
The Fatal limit is similar. As the parameter increases and reaches the fatal limit,
an error message displays in the Alert Viewer (such as, CPU Load Error). Icons
in the Data Viewer and Operation Window change to red to indicate the warning
status.
When the parameter falls below the Fatal reset, the status is reset from Warning
to Abnormal and an Error Recover message displays in the Alert Viewer. Icons
change to yellow since the parameter still exceeds the Warning limit. Status is
normal when the value falls below the Warning reset value.
3-16 Data Viewer
Page 73

System Shutdown
ESMPRO Manager automatically shuts down a managed server when a fatal or
major threshold is exceeded for temperature or voltage.
If the default threshold is changed to a value within its normal operation range,
you may see the following message:
Your designated threshold value makes the current temperature an
abnormal value. Therefore the server is going to shutdown. Do you
really want to launch this process?
You can cancel the shutdown by selecting Cancel within 60 seconds. Shutdown
is aborted and you can modify Agent settings if necessary.
Setting Threshold Limits
You can set threshold limits for:
! Server temperature (Enclosure folder)
! Voltage (Enclosure folder)
! Rate of CPU load (System folder: CPU Information and Total CPU
Information)
! Number of SCSI errors (Storage folder: SCSI Specific or SCSI Errors)
! Number of IDE errors (Storage folder)
! Number of hard disk errors (Storage folder)
! Used Capacity, that is, the percentage of disk used (File System folder:
General screen)
! Used Spare Blocks (Storage, General).
Temperature Thresholds
Threshold limits for temperature are specified on the following screens. You
access these screens by selecting the threshold button on the temperature screen
in the Enclosure folder.
You can set two upper limits (Major Upper and Minor Upper) and two lower
limits (Major Lower and Minor Lower) as well as reset values for all four limits.
Data Viewer 3-17
Page 74

1 Check Enable Threshold to make these settings effective now. Leaving it
unchecked stores your settings for future use and no alert messages for
temperature will be sent.
2 Set major and minor limits and reset values in the text entry fields or on the
sliding bar. The Upper Threshold block is for high temperature limits. Low
temperature limits and reset values are defined in the Lower Threshold
block.
3 Click on OK.
You can also increase and decrease values by clicking on the buttons.
3-18 Data Viewer
Page 75
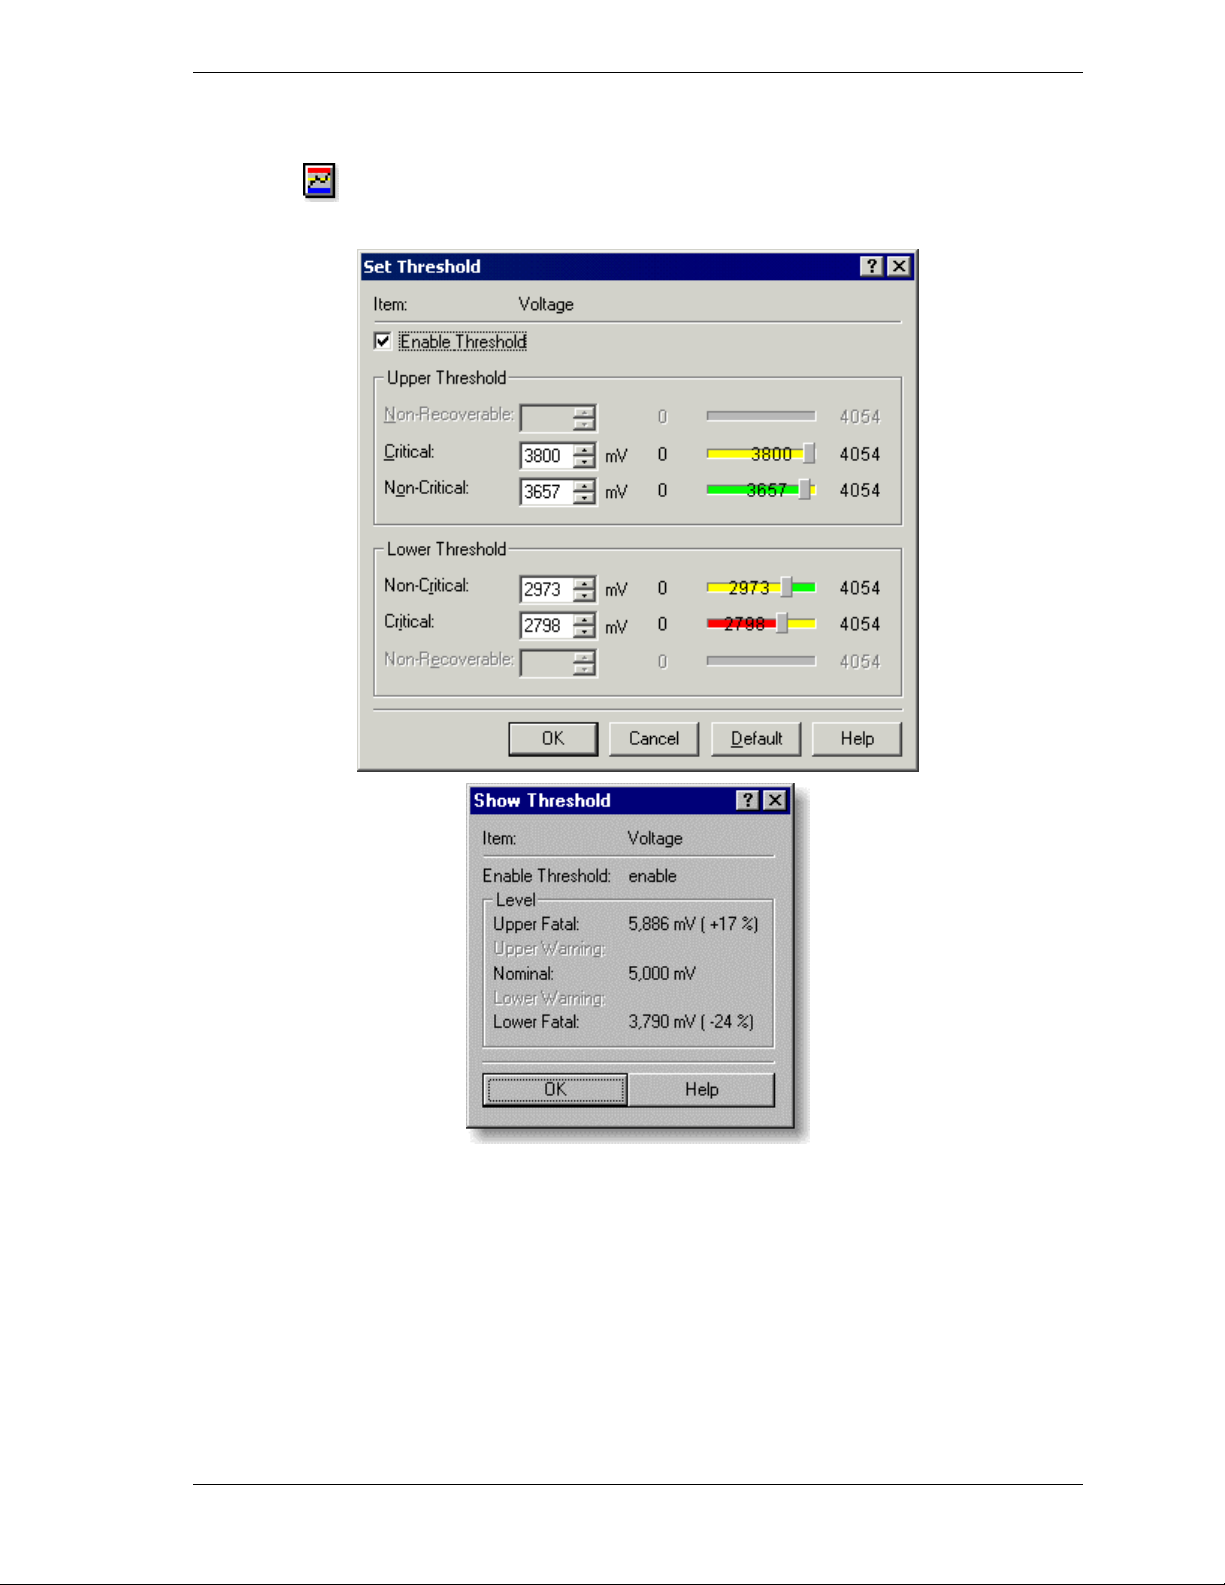
Voltage Thresholds
To set voltage threshold limits, select the threshold button on the voltage
screen in the Enclosure folder.
Data Viewer 3-19
Page 76

CPU Load Thresholds
To set threshold limits for CPU load, select the threshold button on one of
the CPU screens in the System folder.
You can set two limits (major and minor) and two resets. Enter these values in
the text entry fields or use the sliding bar.
1. Check Enable Threshold to make these settings effective now. Leaving it
unchecked stores your settings for future use and no alert messages for CPU
load thresholds will be sent.
2. Set the monitoring interval. This determines how often the parameter is
monitored.
3. Set Major and Minor limits and reset values in the text entry fields or on the
sliding bar.
4. Click on OK.
3-20 Data Viewer
Page 77

SCSI Errors
When the number of errors reaches the threshold limit, the Agent changes the
status of the device and sends an alert message to the Manager. Alert messages
are displayed in the Alert Viewer.
SCSI Specific or SCSI Errors screen in the Storage folder.
1. Check Enable Threshold to make these settings effective now. Leaving it
2. Select the type of error in the list.
3. Enter the number of fatal (and warning) limits in the Fatal (or Warning)
4. Click on OK.
To set threshold limits for SCSI errors, select the threshold button on the
unchecked stores your settings for future use and no alert messages for SCSI
errors will be sent.
fields. This is the number of errors that generate a fatal (or warning) alert
message and changes the status of the monitored Agent to Abnormal or
Warning.
Data Viewer 3-21
Page 78

IDE Errors
When the number of errors reaches the threshold limit, the Agent changes the
status of the device and sends an alert message to the Manager. Alert messages
are displayed in the Alert Viewer.
To set threshold limits for IDE errors, select the threshold button on one of
the IDE screens in the Storage folder.
1. Check Enable Threshold to make these settings effective now. Leaving it
unchecked stores your settings for future use and no alert messages for IDE
errors will be sent.
2. Select the type of error in the list.
3. Enter the number of fatal (and warning) limits in the Fatal (or Warning)
fields. This is the number of errors that generate a fatal (or warning) alert
message and changes the status to Abnormal or Warning.
4. Click on OK.
Hard Disk
When the number of errors reaches the threshold limit, the Agent changes the
status of the Agent and sends an alert message to the Manager. Alert messages
are displayed in the Alert Viewer.
To set threshold limits for hard disk errors, select the threshold button on
the hard disk screen in the Storage folder.
3-22 Data Viewer
Error! Bookmark not defined.
Page 79

1. Check Enable Threshold to make these settings effective now. Leaving it
unchecked stores your settings for future use and no alert messages for hard
disk errors will be sent.
2. Enter the number of fatal (and warning) limits in the Fatal (or Warning)
fields. This is the number of errors that generate a fatal (or warning) alert
message and changes the status to Abnormal or Warning.
3. Click on OK.
Error! Bookmark not defined.
Data Viewer 3-23
Page 80

Used Capacity Thresholds
To set threshold limits for used capacity, select the threshold button on the
General screen of a drive in the File System folder.
When the amount of used disk capacity reaches the threshold limit, the Agent
changes the status of the device and sends an alert message to the Manager.
For used capacity, you can set two limits (major and minor) and two resets.
Enter these values in the text entry fields or use the sliding bar.
1. Check Enable Threshold to make these settings effective now. Leaving it
unchecked stores your settings for future use and no alert messages for used
capacity will be sent.
2. Select the units you prefer (percentage or bytes). If you choose bytes, select
kilobytes (KB) or megabytes (MB).
3. Set Fatal and Warning limits and reset values in the text entry fields or on
the sliding bar. (More on using the sliding bar.)
4. Click on OK.
3-24 Data Viewer
Page 81

Graph Viewer
The Data Viewer creates real-time graphs in the Graph Viewer using
information as it is collected from the Agent.
Graphs can be created wherever you see the graph button on the Data
Viewer screen.
Click on the graph icon next to the parameter you want to graph. The Graph
Viewer displays as shown below.
When the Graph Viewer starts, the graph area is initially clear. As data
collection begins, the measured parameter is plotted starting from the right. As
time goes on, plotted data moves to the left. The newest data always appears on
the right.
Data Viewer 3-25
Page 82

The vertical axis represents the parameter value and the horizontal axis
represents time. To view the legend, make sure Explanatory Notes is checked in
the View Menu.
Adding Graph Data
To graph additional parameters on the graph:
1. Select Add Graph Lines from the Edit Menu or the toolbar.
2. On the Add Graph Data screen, select the graph data and line color and
style.
3. Click on Add.
Editing Graph Data
To edit data on the graph:
1. Select Edit Graph Lines from the Edit Menu or the toolbar.
2. On the Edit Graph Data screen, select the line color, style, and scale. Your
choices are displayed in the Preview area.
3. Click on OK.
3-26 Data Viewer
Page 83

To delete a line:
1. Select the line you want to delete in the Line Style column.
2. Select Delete Graph Line from the Edit Menu or the toolbar.
Modifying the Graph Viewer
For your convenience, there are several ways to modify the appearance of the
Graph Viewer.
From the View Menu, you can choose to display the toolbar, status bar, and
explanatory notes. (Explanatory Notes is the frame at the bottom of the window
that displays line style, scale, and a short description of the graph data.)
To set up other parameters like data collection rates, axis labels and grid style,
select Options/Graph from the menu bar. The following figure displays.
Data Viewer 3-27
Page 84

General Settings
The General tab lists data collection and storage parameters.
! Update Time Span - Data is collected and displayed at the time interval
specified here.
! Storing Term - The graph contains data collected over this amount of
time. The graph can span no more than 2 hours.
! Automatic Collapse Storing Term - When checked, the Storing Term is
automatically shortened when system resources are low.
Style Tab
On the Style tab set the grid options, like axis labels and grid style (linear or
step).
The Preview area shows what the graph might look like based on the current
settings in this window.
Graph Style - Select line graph or step graph by clicking on the buttons in the
Graph Style box.
Horizontal Grid - Check this box to display horizontal grid lines.
Division - The interval between horizontal labels and grid lines.
Automatic - When checked creates labels for the horizontal axis. To specify
horizontal labels yourself, leave this box unchecked and fill in the Minimum and
Maximum fields.
3-28 Data Viewer
Page 85
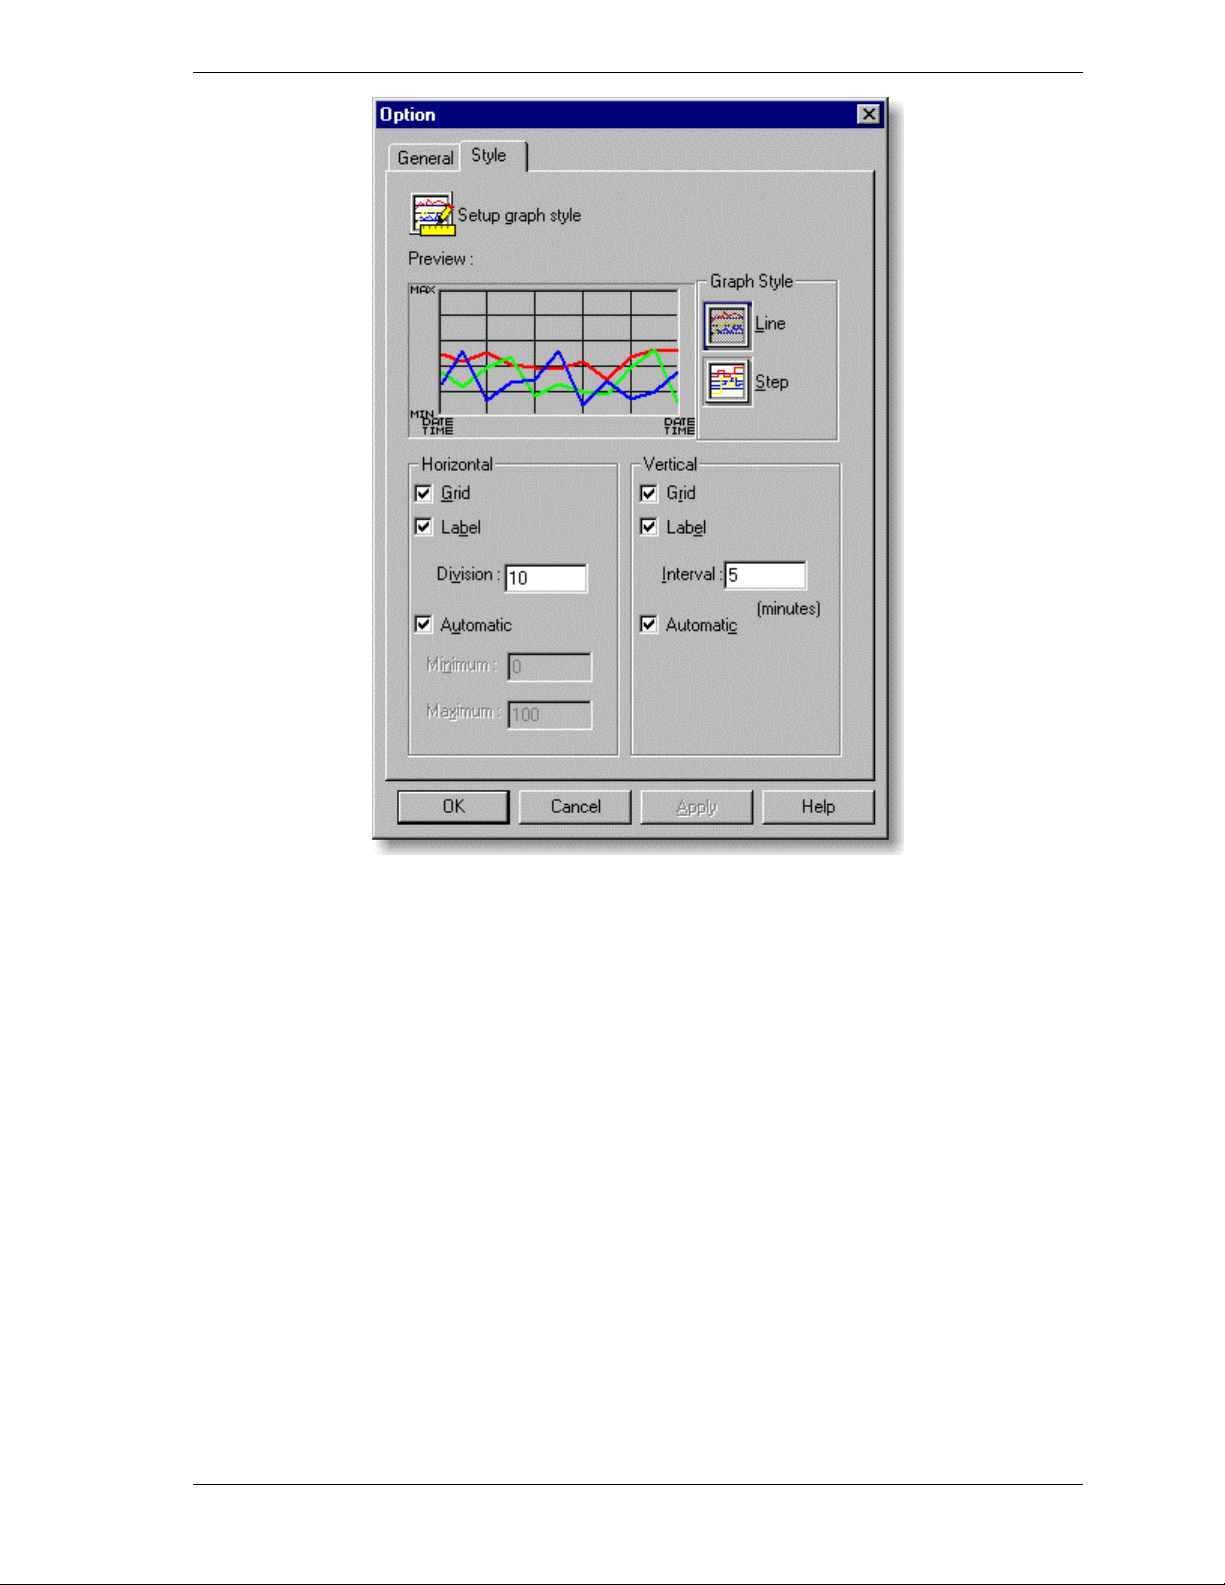
Minimum - The minimum value for the horizontal axis.
Vertical Label - Check this box to display labels on the vertical grid.
Interval - The interval between vertical labels and grid lines.
Automatic - Check this box if you want the Graph Viewer to determine
minimum and maximum settings for the vertical axis.
Data Viewer 3-29
Page 86

Remote Shut Down
You can shut down a remote server from the ESMPRO Manager through the
Data Viewer. Before this feature can be used, do the following:
NetWare Servers
If you want NetWare to start automatically after start up, you must edit the
autoexec.bat file in the root directory of the server's DOS partition. Add a
command to change the directory to the NetWare server directory and launch
the server command. For example, if the name of the NetWare server directory
is nwserver, the following lines should be added to the autoexec.bat file.
cd \nwserver
server
Windows NT Servers
Make sure the Permit Remote Shutdown/Reboot is checked on the General tab
of the Agent on the remote server you want to shut down remotely.
To shut down or reboot the server:
1. From the Data Viewer, select Remote Shut Down from the Tools menu.
The following screen displays.
3-30 Data Viewer
Page 87
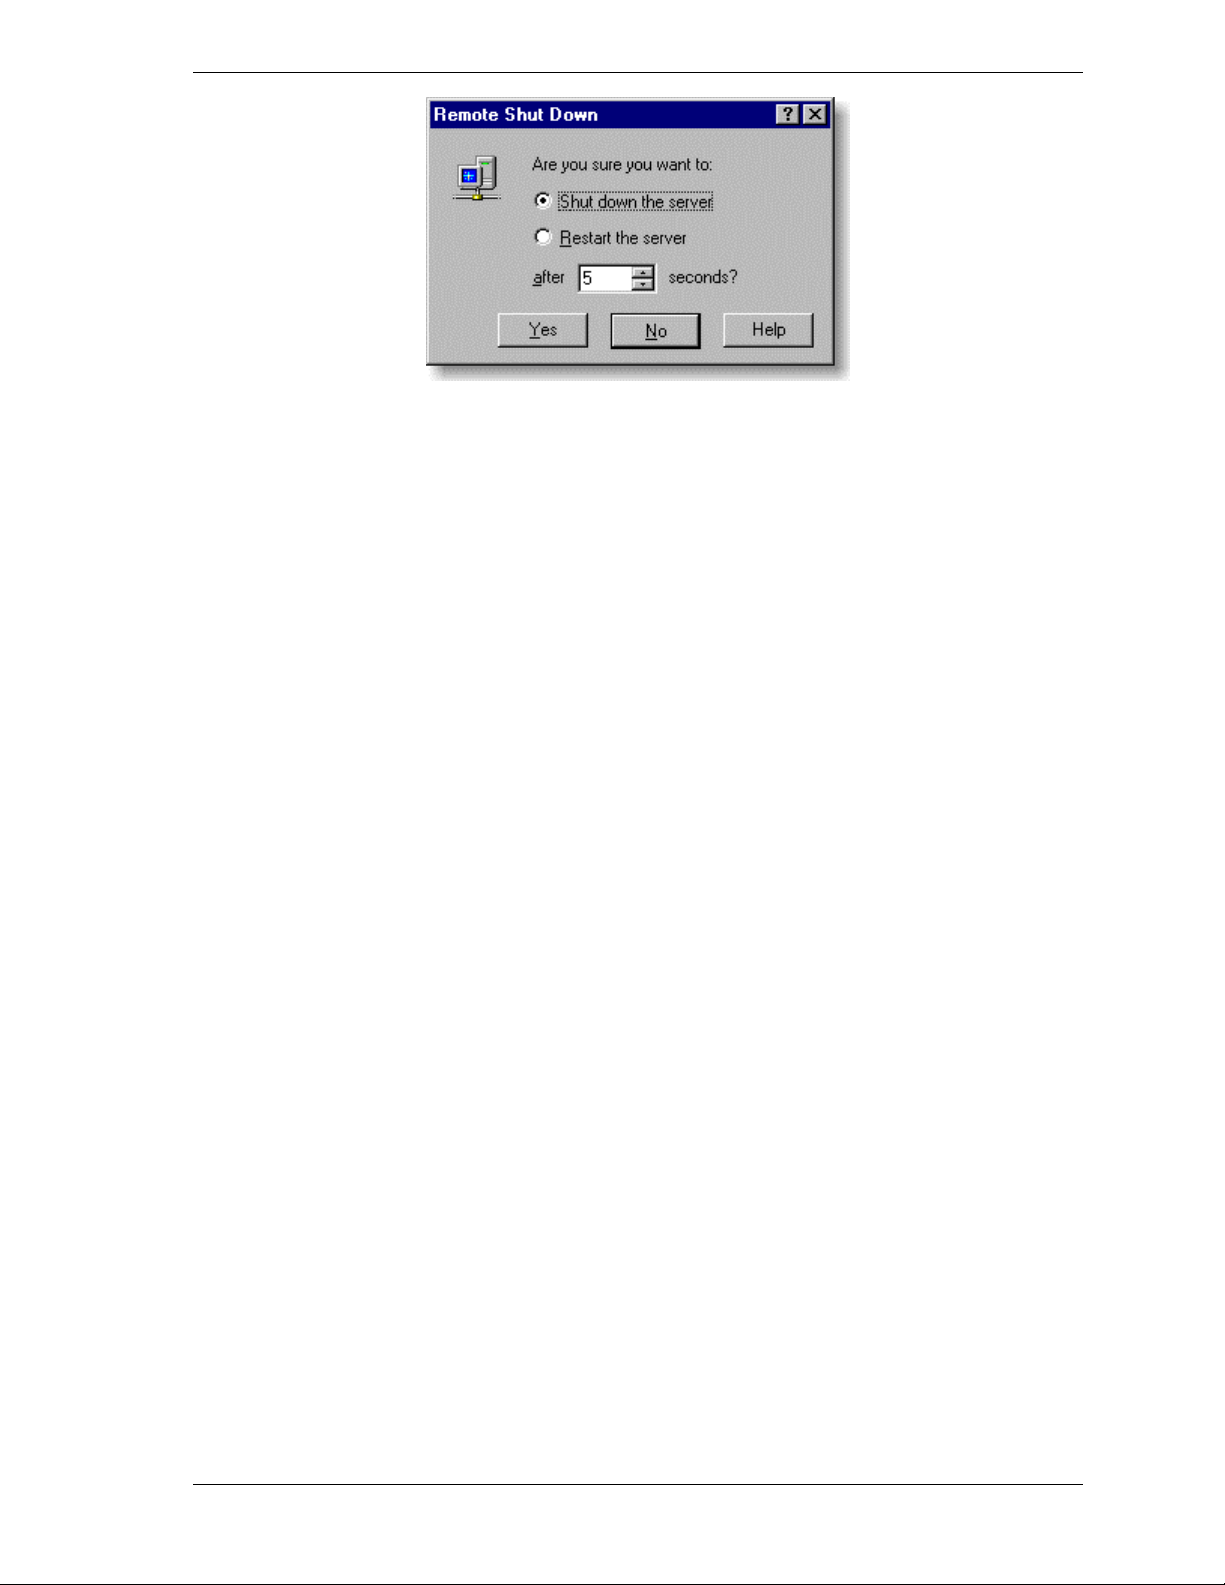
2. To shut down the server, select the first bullet and click on Yes.
To reboot the server, select the second bullet and enter a time delay. When
the managed server receives the command to restart, it will first display a
pop-up message to alert the operator. The restart operation can be canceled
from the pop-up message. If there is no response to the pop-up message, the
managed server restarts. The time delay you specify here on the Remote
Shut Down dialog box is the amount of time the pop-up message appears on
the screen of the managed server before it restarts.
Remote Wake Up
From the Data Viewer, you can wake up a system remotely by sending a Magic
Packet.
Setup
1. On the target system, run the BIOS setup utility and enable the Remote
Wake Up function.
2. In this step you will register the target system in the Operation Window at
the Manager machine. Open the Properties dialog box for the target system.
(Right click on the icon.) In the Properties dialog box set the MAC address
of the target system on the Function tab and the IP broadcast address of the
network where the target system belongs on the Basic tab.
Using Remote Wakeup
Once the steps above are finished, the function is ready to use.
1. Select Remote Wake Up from the Command menu of the icon of the target
system.
Data Viewer 3-31
Page 88
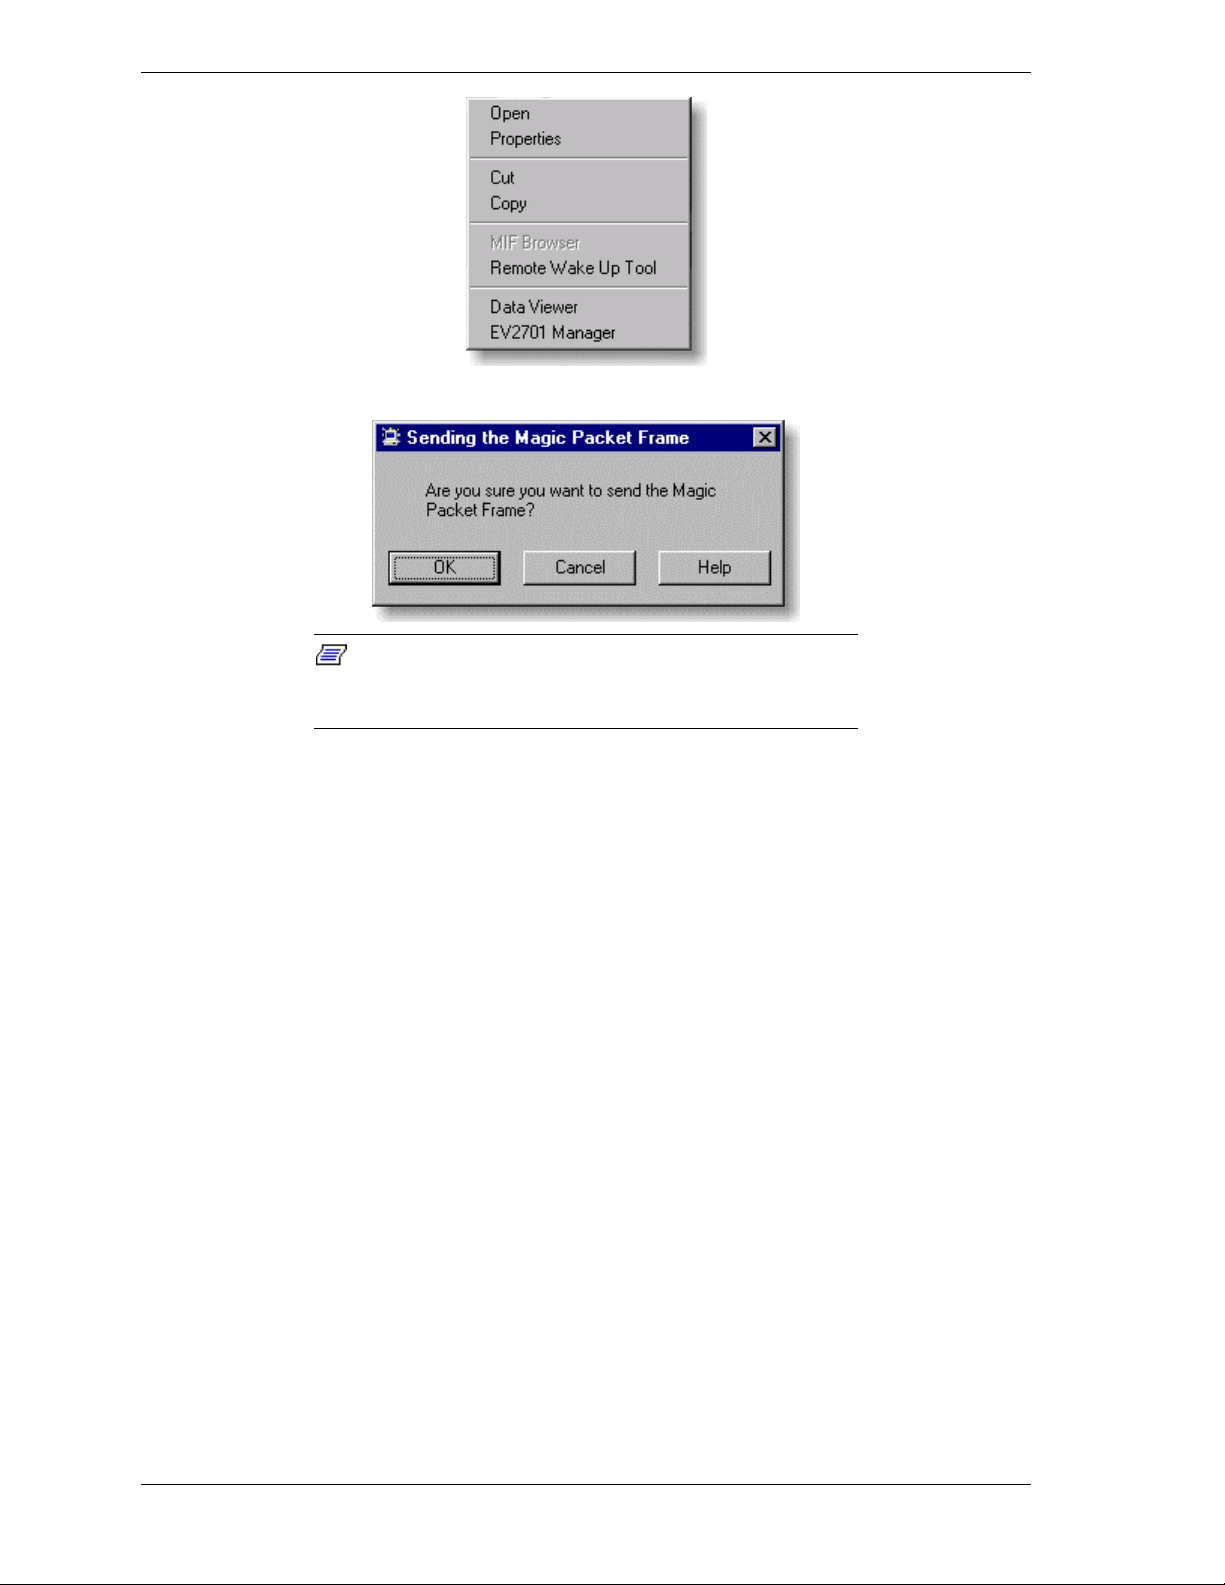
2. Click on OK in the confirmation dialog box.
Note: When using Remote Wake Up via router, the
router must be able to forward broadcast packets
transparently to the appropriate network.
3-32 Data Viewer
Page 89

Setting the Polling Interval
This screen determines how often server information is polled.
Select Set Polling Interval from the Tools Menu. The following screen displays.
Settings
In the My Manager field, enter the polling interval for all servers registered as
My Manager. In the field marked Neighbor Manager, enter the polling interval
for all servers registered as a Neighbor Manager. When 0 is specified, the Data
Viewer will poll the server once when the Data Viewer starts.
(The server designated as My Manager is specified under
Options/Customize/My Manager. The Neighbor Manager is defined in the
Operations Window by clicking on Options /Customize /Remote Manager,
Neighbor Manager tab.)
This setting takes effect when the Data Viewer is restarted.
Data Viewer Menu Bar
File Menu
New Data Viewer - Opens another Data Viewer window.
Print - Prints detailed information on the component selected in the Tree View.
Print All - Prints all information on the selected server.
Exits - Closes the Data Viewer
Data Viewer 3-33
Page 90

Edit Menu
Copy - Copies the component information shown in the Information View to the
Windows clipboard. (This item is not available when folders are displayed in the
Information View.)
Copy All - Copies all information on the selected server to the Windows
clipboard.
View Menu
Toolbar - When Toolbar is checked, the Toolbar appears at the top of the
Toolbar. Click on the item to check and uncheck it.
Status Bar - When this item is checked, the Status Bar appears at the bottom of
the Data Viewer.
Split - This lets you adjust the vertical border between the left and right panes
(that is, between the Tree and Information View). To move the border, click on
Split and drag the border.
Large Icons - Large Icons and Details determine how much detail is shown in
the Information View. When Large Icons is checked, icons (folders) appear in
the Information View. If you prefer to view details for the selected components,
select Details.
Details - When Details is checked, details for the selected component appear in
the Information View.
Picture - Selecting Picture and Top from the menu places the header at the top
of the Information View. Picture/Bottom places the header at the bottom of the
Information View. Picture/Hide eliminates the header.
3-34 Data Viewer
Page 91

Refresh - Updates the Information and Tree Views.
Reconstruct Tree - Updates the Tree View.
Tools Menu
Automatic Data Collection Setting - Saves data collected by the Data Viewer.
Statistical Data Saving Mode - Allows you to specify the type of file used for
storing statistical data.
Print Statistical Data - Allows you to configure print forms and print reports.
Remote Shut Down - Shuts down or reboots a remote server.
Polling Interval Setting - Displays the Polling Interval Setting dialog box
where you specify how often server information is polled.
Help Menu
Help Topics - Displays on-line help
About Data Viewer - Displays revision information
Data Viewer 3-35
Page 92

Page 93

Alert Viewer
! Accessing the Alert Viewer
! Message Notification
! Alert Message Details
! Filtering Messages
! Sorting Messages
! Finding Alert Messages
! Forwarding Alert Messages
4
! Setting Notification Options
! Configuring the Alert Viewer
! Alert Viewer Menu Bar
! Alert Viewer ToolBar
Page 94

The Alert Viewer displays failures, warnings, and informational messages
issued by servers running Agent software. New alert messages are added to the
list as ESMPRO Manager receives them.
Accessing the Alert Viewer
The Alert Viewer starts automatically whenever the Operation Window starts. If
the Alert Viewer is running, display it by pressing [Alt][Tab] or click on the
Alert Viewer button on the Windows status bar at the bottom of the screen.
If the Alert Viewer window has been closed, you can start it from the
Operation Window by clicking on the Alert Viewer button on the toolbar or
selecting it from the Tools pull down menu.
Message Notification
When a new alert message arrives at the Manager, you may hear a beep and see
a notification message similar to the next figure.
Alert Viewer must be running to receive notification messages. If you close the
Alert Viewer window, it continues to collect alert messages, but you won’t be
notified of new messages through pop-up messages or beeping.
4-2 Alert Viewer
Page 95

If your system has audio capability, you can specify different sounds for the
different alert levels. Otherwise, the system sounds a beep through the internal
speaker.
If you don’t want to see any more of these pop-up notification messages for any
alert message, click on the checkbox Do not display a further notification
message. To receive notification messages again, go to the Alert Viewer and
click on Options in the Tools menu. Highlight the button Display a notification
message.
Alert Message Details
There are a number of ways to get more information about an alert message.
From the Alert Viewer
From the Alert Viewer, double click on the alert message. The Details window
displays. An alternate method is to highlight the alert message and select Open
Folder icon from the toolbar. The Details window (shown in the next figure)
displays the details of the alert message, including corrective action to take.
You can also find more information about the alert condition in the Data Viewer
which is started by highlighting the alert message and then selecting Invoke
from the Tools Menu.
From the Notification Message
If you have a notification message on your screen, select the Alert Log button to
display the Details window without going to the Alert Viewer.
Selecting the Invoke button starts the Data Viewer. If you don’t want further
information at this time, select Close.
Alert Viewer 4- 3
Page 96

Once the Details window appears, the message is automatically marked as Read
in the Alert Viewer. (The symbol in the Read/Unread column changes to an
opened envelope.)
You can also mark messages as Read or Unread from the Edit Menu in the Alert
Viewer. Simply highlight the message and select Mark as Read or Mark as
Unread.
4-4 Alert Viewer
Page 97
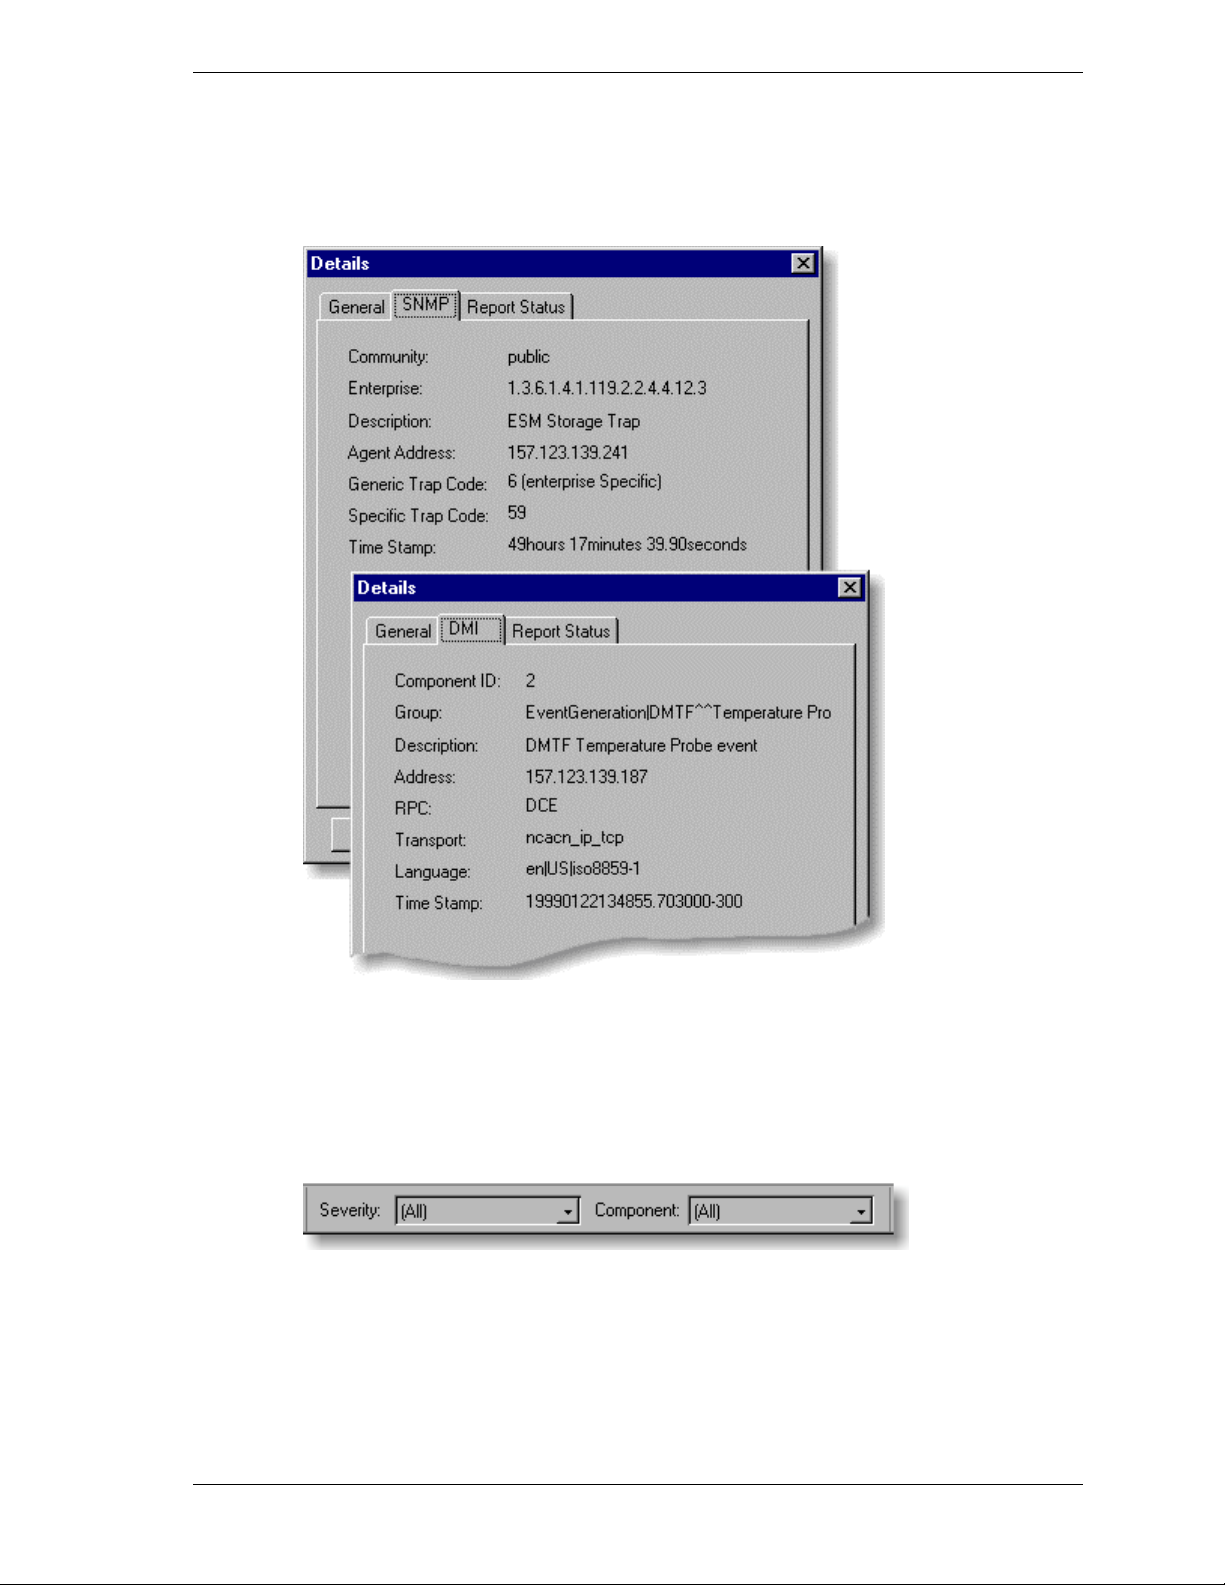
SNMP & DMI tabs
Depending on the Agent, the center tab on the Display window shows either
SNMP or DMI trap information.
Filtering Messages
Messages in the Alert Viewer can be restricted according to the severity and
component specified in the Filter Bar. (Filter Bar must be checked in the View
Menu to appear on the screen.)
The Filter Bar can be moved anywhere on the screen by dragging it with the
mouse.
Alert Viewer 4- 5
Page 98

Sorting Messages
There are two ways to sort messages in the Alert Viewer:
Method 1
Click on the column titles. Clicking once sorts the column in ascending order.
Clicking again sorts the column in descending order.
Method 2
1. From the View menu, select Sort.
2. From the drop down Sort items by list, select the sort criteria to use. You can
use any of the Alert Viewer columns as your sort criteria.
3. Select the circle next to Ascending or Descending to specify the order in
which the messages should appear.
4. Select OK to sort the alert messages or Cancel to abort.
Finding Alert Messages
You can search for alert messages by specifying severity, component, or type.
1. From the Tools menu, select Find.
2. In the dialog box that appears, enter the search criteria you want to use.
3. Click on the Find Next button. The next alert that matches the criteria is
highlighted in the Alert Viewer. (Double click on the line to see the Details
screen.)
4-6 Alert Viewer
Page 99

Forwarding Alert Messages
You can be notified of alert messages and system events through various
reporting devices, such as pagers and Internet e-mail. Configuring the Alert
Manager in the Agent or the Manager to send a message when specific types of
alert messages are generated does this. For example, the Alert Manager can beep
your pager when network alert messages arise.
Configuring the Alert Manager is explained starting on page. To get to the Alert
Manager from the Alert Viewer, select Report Setting from the Tools menu.
Setting Notification Options
You can set up the Alert Viewer to do the following:
! Play a sound file or display a notification message when alert messages
arrive
! Filter alert messages by severity
! Select the icon style for the Summary column
! Determine the number of error messages stored.
Click on Tools/Options in the menu bar. The Options screen displays.
Alert Viewer 4- 7
Page 100

General Tab
Don't display a notification message - If you don't want to receive any
notification pop-up messages when alert messages arrive at the Alert Viewer,
select this first bullet. Alert messages still appear in the Alert Viewer. This
checkbox has the same effect as the Do not display a further notification
message on the notification message.
Display a notification message - When this selection is indicated, alert pop-up
messages appear when new alert messages arrive at the Manager even when the
Alert Viewer is minimized.
If this box is checked, specify which alert levels generate notification messages.
For example, you may only want to be notified of major alert messages. If no
boxes are checked, messages of all severity levels are displayed.
Information check box - When this box is checked, you receive notification
messages when information alert messages arrive. When unchecked,
information alert messages are displayed in the Alert Viewer even though they
don't generate notification messages.
Minor check box - When this box is checked, you receive notification messages
when minor alert messages arrive. When unchecked, minor alert messages are
displayed in the Alert Viewer even though they don't generate notification
messages.
Major check box - When this box is checked, you receive notification messages
when major alert messages arrive. When unchecked, major alert messages are
displayed in the Alert Viewer even though they don't generate notification
messages.
Unknown check box - When this box is checked, you receive notification when
alert messages of an Unknown status arrive. When unchecked, alert messages
indicating an Unknown status are displayed in the Alert Viewer even though
they don't generate notification messages.
Play A Sound - When this box is checked, a sound file will play when an alert
message arrives. If your workstation cannot play sound files, it will beep
instead. The sound file that plays is defined on the Alert Types tab.
Always center notification message dialog - Centers the notification message
on the screen.
Display received time on title - Displays in the title bar of the notification
message the time when ESMPRO Manager received the alert message.
Maximum notification dialogs - The number of pop-up messages that can
appear on the screen at one time. (The maximum is 40 messages.)
Use standard icons for alert list - When this box is checked, icons displayed in
the Summary column of the Alert Viewer are Windows standard icons, such as:
information, minor, major
4-8 Alert Viewer
 Loading...