

Page 1

User Manual
BridgeVIEW User Manual
May 1998 Edition
Part Number 321294C-01
Page 2

Internet Support
E-mail: support@natinst.com
FTP Site: ftp.natinst.com
Web Address: http://www.natinst.com
Bulletin Board Support
BBS United States: 512 794 5422
BBS United Kingdom: 01635 551422
BBS France: 01 48 65 15 59
Fax-on-Demand Support
512 418 1111
Telephone Support (USA)
Tel: 512 795 8248
Fax: 512 794 5678
International Offices
Australia 03 9879 5166, Austria 0662 45 79 90 0, Belgium 02 757 00 20, Brazil 011 288 3336,
Canada (Ontario) 905 785 0085, Canada (Québec) 514 694 8521, Denmark 45 76 26 00,
Finland 09 725 725 11, France 01 48 14 24 24, Germany 089 741 31 30, Hong Kong 2645 3186,
Israel 03 6120092, Italy 02 413091, Japan 03 5472 2970, Korea 02 596 7456, Mexico 5 520 2635,
Netherlands 0348 433466, Norway 32 84 84 00, Singapore 2265886, Spain 91 640 0085, Sweden 08 730 49 70,
Switzerland 056 200 51 51, Taiwan 02 377 1200, United Kingdom 01635 523545
National Instruments Corporate Headquarters
6504 Bridge Point Parkway Austin, Texas 78730-5039 USA Tel: 512 794 0100
© Copyright 1996, 1998 National Instruments Corporation. All rights reserved.
Page 3

Important Information
Warranty
The media on which you receive National Instruments software are warranted not to fail to execute programming
instructions, due to defects in materials and work man ship, for a peri od of 90 d ays from da te o f sh ipm ent, as evi denced
by receipts or other documentation. National Instruments will, at its option, repair or replace software media that do not
execute programming instructions if National Instruments receives noti ce of su ch defect s d uring th e warranty perio d.
National Instruments does not warrant that the op eration of t he soft ware shall b e uni nterrup ted or erro r free.
A Return Material Authorization (RMA) number must b e ob tain ed fro m th e facto ry an d clearl y mark ed on t he outsi de
of the package before any equipment will be a ccepted for warranty work. National Instruments will pay the shipping c osts
of returning to the owner parts which are covered by warran ty.
National Instruments believes that the information in this manual is accurate. The document has been c arefully reviewed
for technical accuracy. In the event that technical or typographical errors exist, National Instruments reserves the right to
make changes to subsequent editions of th is do cume nt with ou t p rio r no ti ce to hold ers o f thi s ed itio n. The read er sh ou ld
consult National Instruments if errors are suspected. In no event shall National Instruments be liable for any damages
arising out of or related to this docume nt o r th e in form ati on con tai ned in i t.
XCEPT AS SPECIFIED HEREIN
E
SPECIFICALLY DISCLAIMS ANY WARRANTY OF MERCHANTABILITY OR FITNESS FOR A PARTICULAR PURPOSE
RIGHT TO RECOVER DAMAGES CAUSED BY FAULT OR NEGLIGENCE ON THE PART OF NATIONAL INSTRUMENTS SHALL BE
LIMITED TO THE AMOUNT THERETOFORE PAID BY THE CUSTOMER
DAMAGES RESULTING FROM LOSS OF DATA, PROFITS, USE OF PRODUCTS, OR INCIDENTAL OR CONSEQUENTIAL DAMAGES
EVEN IF ADVISED OF THE POSSIBILITY THEREOF
regardless of the form of action, whether in contract or tort , incl udin g n egli gen ce. An y action against National
Instruments must be brought within one year after the cause of action accrues. National Instruments shall not be liable for
any delay in performance due to causes beyond its reason able control . T he wa rranty pro vided herein does n ot cove r
damages, defects, malfunctions, or service failures caused by own er’s fai lure to fol low the Nati onal In st rume nts
installation, operation, or maintenan ce in structi on s; ow ner’s modi ficat io n o f th e pro du ct; ow ner’s ab use, m isus e , o r
negligent acts; and power failure or surges, fire, flood, accident, actions of third pa rties, or other events outside reasonable
control.
ATIONAL INSTRUMENTS MAKES NO WARRANTIES, EXPRESS OR IMPLIED, AND
, N
. This limitation of the liability of Nati onal In st rum ent s will appl y
Copyright
Under the copyright laws, this publication may not be reproduced or transmitted in any form, electronic or mechanical,
including photocopying, recording, storing in an information retrieval system, or translating, in whole or in part, without
the prior written consent of National Instruments Corporation.
USTOMER’S
. C
ATIONAL INSTRUMENTS WILL NOT BE LIABLE FOR
. N
,
Trademarks
BridgeVIEW™, LabVIEW™, National Instruments™, natinst.com™, and NI-DAQ™ are trademarks of National
Instruments Corporation.
Product and company names listed are trademarks or trade names of their respective companies.
WARNING REGARDING MEDICAL AND CLINICAL USE OF NATIONAL INSTRUMENTS PRODUCTS
National Instruments products are not designed with com ponent s and tes ting inten ded to ensure a l evel of reliab ilit y
suitable for use in treatment and diagnosis of humans. Applications of National Instruments products invol ving m edical
or clinical treatment can create a potential for accidental injury caused by product failure, or by errors on the part of the
user or application designer. Any use or application of National Instruments products for or involving medical or clinical
treatment must be performed by properly trained and qualified medical personnel, and all traditional medical safeguards,
equipment, and procedures that are appropriate in the particular situation to prevent serious injury or death should always
continue to be used when National Instruments products are being used . National Instrum ents product s are NOT intended
to be a substitute for any form of established process, procedure, or equipment used to monitor or safeguard human health
and safety in medical or clinical treatment.
Page 4

Contents
About This Manual
Organization of This Manual...............................................................................................xix
BridgeVIEW Concepts..........................................................................................xix
G Tutorial ...............................................................................................................xx
Appendices, Glossary, and Index..........................................................................xxi
Conventions Used in This Manual......................................................................................xxii
Related Documentation........................................... ...........................................................xxiii
Customer Communication.................................................................................................xxiii
Chapter 1
Introduction
Welcome to BridgeVIEW....................................................................................................1-1
Required System Configuration............................................................................1-2
Installation............................ .................................................................................1-2
What Is BridgeVIEW?.........................................................................................................1-3
How Does BridgeVIEW Work? ..........................................................................................1-3
G Programming.....................................................................................................1-4
Tag Configuration .................................................................................................1-5
Alarms ...................................................................................................................1-6
Events....................................................................................................................1-7
Historical Data Logging and Extraction................................................................1-7
Security..................................................................................................................1-7
What Is the BridgeVIEW System Architecture?.................................................................1-8
User HMI Application...........................................................................................1-8
BridgeVIEW Engine .............................................................................................1-9
Device Servers.......................................................................................................1-9
Where Should I Start?........................................................................................................1-10
P
I
ART
BridgeVIEW Concepts
Data Type................................................................................................1-5
General....................................................................................................1-5
Connection.............................................................................................. 1-6
Scaling.....................................................................................................1-6
Operations...............................................................................................1-6
© National Instruments Corporation v BridgeVIEW User Manual
Page 5

Contents
Chapter 2
BridgeVIEW Environment
What Is G?...........................................................................................................................2-1
How Does G Work? ........................................................... .................................................2-1
Virtual Instruments ...............................................................................................2-2
Front Panel.............................................................................................. 2-2
Block Diagram........................................................................................2-3
Icon/Connector .......................................................................................2-3
Tools Palette..........................................................................................................2-4
Controls Palette.....................................................................................................2-5
Functions Palette...................................................................................................2-5
Controls and Indicators.........................................................................................2-6
Numeric ..................................................................................................2-6
Boolean...................................................................................................2-7
String ......................................................................................................2-7
Tag..........................................................................................................2-8
BridgeVIEW Environment Project Menu.........................................................................2-10
What Is the BridgeVIEW Engine Manager?.....................................................................2-12
What Are System Errors and Events?............................................................................... 2-15
What Is the Tag Browser?................................................................................................. 2-16
What Is the Tag Monitor?.................................................................................................. 2-18
How Do You Access Online Help?...................................................................................2-23
Simple/Complex Help View...............................................................................2-23
Links to Online Help Files..................................................................................2-24
Chapter 3
Tag Configuration
What Is a Tag?.....................................................................................................................3-1
Tag Attributes .......................................................................................................3-1
General Attributes................................................................................... 3-2
Connection Attributes............................................................................. 3-2
Operation Attributes ...............................................................................3-2
Scaling Attributes ...................................................... .............................3-2
Alarm Attributes.....................................................................................3-3
Static vs. Dynamic Attributes ...............................................................................3-3
BridgeVIEW User Manual vi © National Instruments Corporation
Page 6

Contents
What Is the Tag Configuration Editor?................................................................................3-3
How Do You Create a Tag? ..................................................................................3-5
How Do You Edit a Tag?......................................................................................3-5
How Do You Delete a Tag? ..................................................................................3-5
What are Network Tags?.......................................................................................3-6
How Do You Add Network Tags?........................................................................3-7
How Do You Set Default Values for Tag Configuration Fields? .........................3-7
How Do You Use Spreadsheet Files for Tag Configuration?...............................3-8
How Do You Configure Tags?..........................................................................................3-10
Data Type ............................................................................................................3-10
Analog Tags..........................................................................................3-10
Discrete Tags.........................................................................................3-10
Bit Array Tags.......................................................................................3-10
String Tags............................................................................................3-11
General ................................................................................................................3-11
Connection...........................................................................................................3-12
I/O Group Configuration.......................................................................3-14
I/O Group Configuration Options...........................................3-15
Server Configuration Options.................................................3-16
Item Configuration................................................................................3-18
Item Configuration Options—Configuring
Item Names..........................................................................3-18
Item Configuration Options—Configuring
Item Resources.....................................................................3-18
What Is a Memory Tag?........................................................................3-19
When Should You Use a Memory Tag?.................................3-19
How Do You Automatically Generate Tags
from Server Information? ..................................................................3-20
How Do You Connect a Tag to an OPC Server?..................................3-21
How Do You Connect a Tag to a DDE Server? ...................................3-21
How Do You Define a Group of Tags for Alarming? ..........................3-21
Operations............................................................................................................3-22
What Is Deadband?...............................................................................3-24
How Do You Use Deadband to Increase Engine Throughput? ............3-2 4
How Do You Configure a Tag to Log Its Data or Events?...................3-25
How Do You Set Initial Tag Value at Startup? ....................................3-25
Scaling................................................................................................................. 3-25
Analog Tags..........................................................................................3-27
Example—Linear Scaling......................................................3-27
Example—Square Root Scaling ............................................3-28
How Do You Assign Units to an Analog Tag?.....................................3-28
Discrete Tags.........................................................................................3-28
Bit Array Tags.......................................................................................3-29
© National Instruments Corporation vii BridgeVIEW User Manual
Page 7

Contents
Alarms.................................................................................................................3-31
How Do You Configure Alarms for a Tag?.........................................3-34
What Is Alarm Deadband on Analog Tags?......................................... 3-36
How Do You Keep an Alarm Unacknowledged
after the Alarm Returns to Normal? ..................................................3-37
How Do You Configure Other Engine Parameters? ......................................................... 3-44
How Do You Turn on Historical and Event Logging at Startup?....................... 3-44
How Do You Set the File Paths for Historical and Events Files?.......................3-44
How Do You Configure Shifts?..........................................................................3-44
How Do You Configure Engine Parameters?.....................................................3-44
How Do You Launch Server Configuration Utilities
from the Tag Configuration Editor?.................................................................3-46
How Do You Access or Change Tag Configuration Information
in Your Application?......................................................................................................3-46
Chapter 4
Human Machine Interface
What Is an HMI?.................................................................................................................4-1
How Do You Build an HMI? ..............................................................................................4-2
Front Panel Objects...............................................................................................4-3
HMI G Wizard ......................................................................................................4-3
Generate the Block Diagram ..................................................................4-8
Front Panel Object and Wizard Subdiagram Association ...................... 4-8
How Do You Customize Front Panel Objects? ..................................................4-12
Control Editor.......................................................................................4-12
Importing Graphics............................................................................... 4-13
How Do You Configure Front Panel
Objects Programmatically?............................................................ .... 4-15
How Do You Monitor and Control Tags?.........................................................................4-16
Tag Data Type.....................................................................................................4-17
Tags VIs and Alarms and Events VIs................................................................. 4-20
How Do the Tags, and Alarms and Events VIs
Affect Startup/Shutdown?..................................................................4-24
Analog Tags ...........................................................................3-34
Discrete Tags..........................................................................3-35
Bit Array Tags........................................................................3-35
String Tags .............................................................................3-36
Auto Ack on Normal..............................................................3-37
User Must Ack .......................................................................3-38
BridgeVIEW User Manual viii © National Instruments Corporation
Page 8

General Principles of G HMI Programming......................................................................4-25
How Do You Implement Event-Driven Programming in G?..............................4-25
How Do You Implement Polled Programming in G?.........................................4-27
How Do You Initialize and Shut Down Multiple-Loop Applications?...............4-28
How Do You Display Real-Time Trends?..........................................................4-29
How Can You Use Tag Attributes to Configure HMI Indicator
Attributes Programmatically? ..........................................................................4-31
Chapter 5
Alarms and Events
What are Alarms and Events?.............................................................................................. 5-1
Alarm States ..........................................................................................................5-1
Alarm Limit...........................................................................................................5-1
Alarm Priority........................................................................................................5-2
Alarm Summary ....................................................................................................5-2
Event History.........................................................................................................5-2
How Do You Display Alarm Summary Information?......................................................... 5-2
How Do You Display Event History Information?.............................................................5-6
How Do You Acknowledge Alarms? .................................................................................5-6
How Do You Configure Logging and Printing of Alarms and Events?............................5-10
How Do You Log Alarms and Events?...............................................................5-12
How Do You Print Alarms and Events?..............................................................5-13
How Do You View Alarms and Events?.............................................................5-14
Contents
Chapter 6
Historical Data Logging and Extraction
What Is a Trend?..................................................................................................................6-1
Real-Time Trend ...................................................................................................6-1
Historical Trend.............................................................. .......................................6-1
What Is Citadel?........................................... ........................................................................6-1
How Do You Log Historical Data? .....................................................................................6-2
How Do You Configure Historical Logging?.......................................................6-3
How Do You Extract and View Data from Historical Log Files?.......................................6-4
Historical Data VIs................................................................................................6-4
Historical Trend Viewer (HTV)............................................................................6-9
How Do You Select the Tags to Display? ............................................6-10
How Do You Change the Time Axis?..................................................6-10
Panning Buttons......................................................................6-11
Manual Changes ................................................. ... .................6-11
How Do You Change the Timespan of Data Displayed? .....................6-12
How Do You View the Value of a Tag at
a Specific Point in Time? ...................................................................6-12
© National Instruments Corporation ix BridgeVIEW User Manual
Page 9

Contents
How Do You Change the Y Axis? .......................................................6-12
How Do You Change the Plot Colors and Style in the Trend? ............ 6-13
How Do You Zoom In on the Trend?...................................................6-13
How Do You Export Data to a Spreadsheet?.......................................6-13
How Do You Get Online Help for the HTV?.......................................6-13
How Do You Set Tag, Time, and Color Preferences?..........................6-13
How Do You View New Data Automatically After
It Has Been Logged to Citadel?......................................................... 6-14
How Do You Incorporate the HTV into Your HMI Application? ....... 6-14
Chapter 7
Advanced Application Topics
How Do You Build an HMI with Multiple Panels?............................................................ 7-1
Front Panel Buttons...............................................................................................7-1
Panel G Wizard.....................................................................................................7-1
How Do You Use the Panel G Wizard? .................................................7-2
How Do You Configure Security with the Panel G Wizard?................. 7-3
How Do You Configure When a Button Will Be Polled?......................7-3
VI Server Functions..............................................................................................7-5
How Do You Control Panel Size?..........................................................7-6
How Do You Control Panel Visibility?.................................................. 7-7
BridgeVIEW System Control.............................................................................................. 7-7
System VIs............................................................................................................ 7-7
How Do You Start or Stop the BridgeVIEW Engine
from Your Application?........................................................ ...............7-8
How Do You Start or Stop Historical Logging from
Your Application?................................................................................7-8
How Do You Start or Stop Event Logging
from Your Application?.......................................................................7-8
How Do You Start or Stop Event Printing
from Your Application?.......................................................................7-8
Tag Attributes VIs............................... ................................................................................7-9
BridgeVIEW Security ....................................................................................................... 7-13
Environment Security ....................................... ..................................................7-13
How Do You Log In and Out? ............................................................. 7-15
How Do You Find Your Access Level?...............................................7-15
How Do You Find Your Environment Privileges? ..............................7-15
How Do You Change Your Password?................................................7-16
How Do You Check a User’s Privileges?.............................................7-16
How Do You Prompt the Operator to Log In
to Your Application? .........................................................................7-16
BridgeVIEW User Manual x © National Instruments Corporation
Page 10

Chapter 8
Servers
What Are BridgeVIEW Device Servers? ............................................................................8-1
How Do You Install and Configure a Device Server?......................................................... 8-2
How Do You Use OPC Servers with BridgeVIEW?...........................................................8-5
How Do You Use DDE Servers with BridgeVIEW? ..........................................................8-9
How Do You View BridgeVIEW Server Configuration?...................................................8-9
How Do You Develop an IA Device Server?....................................................................8-12
Contents
How Do You Programmatically Log an Operator In
to Your Application?..........................................................................7-17
How Do You Programmatically Log an Operator Out
of Your Application?..................................... ... ..................................7-17
How Do You Identify the Current Operator? .......................................7-17
How Do You Restrict Access to the BridgeVIEW Environment? .......7-17
How Do You Create and Modify User Accounts? ...............................7-17
How Do You Modify the List of Available User
Access Levels?...................................................................................7-19
How Do You Export a List of Users to a File?.....................................7-19
How Do You Export Users to Another Computer
on the Network? .................................................................................7-20
How Do You Import a List of Users from a File?................................7-20
How Do You Import Users from Another Computer
on the Network? .................................................................................7-21
How Do You Modify a User’s BridgeVIEW
Environment Privileges?..................................... ...............................7-22
Operator Interface Security .................................................................................7-22
How Do You Limit User Access to HMI Objects? ..............................7-23
Installing and Configuring the NI-DAQ OPC Server ...........................................8-3
Installing and Configuring Device Servers from
the BridgeVIEW Device Servers CD.................................................................8-4
Registering Simulation Servers.............................................................................8-4
Using Remote OPC Servers ..................................................................................8-7
Registered Server Device and Item Parameters ..................................................8-11
© National Instruments Corporation xi BridgeVIEW User Manual
Page 11

Contents
Chapter 9
Creating VIs
What is a Virtual Instrument?.............................................................................................. 9-1
How Do You Build a VI?....................................................................................................9-1
What is a SubVI?...............................................................................................................9-12
How Do You Debug a VI?................................................................................................ 9-21
P
II
ART
G Tutorial
VI Hierarchy ....................................... ..................................................................9-1
Controls, Constants, and Indicators ......................................................................9-2
Terminals .............................................................................................................. 9-3
Wires.....................................................................................................................9-3
Tip Strips ................................................................................................9-4
Wire Stretching................................... ....................................................9-5
Selecting and Deleting Wires ................................................................. 9-5
Bad Wires ...............................................................................................9-6
VI Documentation.................................. ...............................................................9-9
Hierarchy Window..............................................................................................9-12
Search Hierarchy ..................................................................................9-14
Icon and Connector.............................................................................................9-14
Opening, Operating, and Changing SubVIs........................................................9-19
Chapter 10
Customizing VIs
Set Window Options...........................................................................................10-1
SubVI Node Setup ..............................................................................................10-1
Chapter 11
Loops and Charts
What is a Structure?...........................................................................................................11-1
Charts.................................................................................................................................11-2
Chart Modes........................................................................................................11-2
Faster Chart Updates...........................................................................................11-3
Overlaid Versus Stacked Plots............................................................................ 11-3
While Loops ......................................................................................................................11-4
Mechanical Action of Boolean Switches............................................................11-7
Timing................................................................................................................. 11-9
Preventing Code Execution in the First Iteration..............................................11-10
BridgeVIEW User Manual xii © National Instruments Corporation
Page 12

Shift Registers..................................................................................................................11-11
Using Uninitialized Shift Registers...................................................................11-15
For Loops.........................................................................................................................11-20
Numeric Conversion............................................... ...........................................11-21
Chapter 12
Case and Sequence Structures and the Formula Node
Case Structure....................................................................................................................12-2
Sequence Structures...........................................................................................................12-5
Formula Node ..................................................................................................................12-11
Artificial Data Dependency .............................................................................................12-15
Chapter 13
Front Panel Object Attributes
Chapter 14
Arrays, Clusters, and Graphs
Arrays.................................................................................................................................14-1
How Do You Create and Initialize Arrays? ........................................................14-1
Array Controls, Constants, and Indicators............................................14-2
Auto-Indexing......................................................................................................14-2
Using Array Functions ........................................................................................14-9
Build Array ...........................................................................................14-9
Initialize Array.................................................................................... 1 4-10
Array Size ...........................................................................................14-11
Array Subset........................................................................................14-12
Index Array .........................................................................................14-13
Efficient Memory Usage: Minimizing Data Copies..........................................14-16
What is Polymorphism?...................................................................................................14-17
Clusters ............................................................................................................................14-17
Graphs..............................................................................................................................14-18
Customizing Graphs..........................................................................................14-18
Graph Cursors.....................................................................................14-19
Graph Axes .........................................................................................1 4-20
Data Acquisition Arrays....................................................................................14-20
Intensity Plots ..................................................................................................................14-23
Contents
Chapter 15
Application Control
What is the VI Server? ........................................................................................15-2
© National Instruments Corporation xiii BridgeVIEW User Manual
Page 13

Contents
Chapter 16
Program Design
Use Top-Down Design......................................................................................................16-1
Make a List of User Requirements .....................................................................16-1
Design the VI Hierarchy..................................................................................... 16-1
Create the Program..............................................................................................16-3
Plan Ahead with Connector Panes ....................................................................................16-3
SubVIs with Required Inputs.............................................................................. 16-4
Good Diagram Style..........................................................................................................16-4
Watch for Common Operations..........................................................................16-4
Use Left-to-Right Layouts.................................................................................. 16-5
Check for Errors..................................................................................................16-5
Watch Out for Missing Dependencies................................................................16-7
Avoid Overuse of Sequence Structures ..............................................................16-8
Study the Examples.............................................................................................16-8
Appendix A
HMI Function Reference
Appendix B
Citadel and Open Database Connectivity
Appendix C
Customer Communication
Glossary
Index
Figures
Figure 1-1. BridgeVIEW Architecture ..........................................................................1-8
Figure 2-1. Engine Manager Display........................................................................... 2-12
Figure 2-2. Engine Manager with System Events Displayed......................................2-14
Figure 2-3. Tag Browser Utility ..................................................................................2-16
Figure 2-4. Tag Monitor Utility ...................................................................................2-19
Figure 2-5. Status Details Dialog Box.........................................................................2-21
BridgeVIEW User Manual xiv © National Instruments Corporation
Page 14

Contents
Figure 2-6. Select Tags to Monitor Dialog Box...........................................................2-22
Figure 2-7. Write to Tag dialog box.............................................................................2-22
Figure 2-8. Tag Monitor Preferences Dialog Box .......................................................2-23
Figure 3-1. Tag Configuration Editor ............................................................................3-4
Figure 3-2. Flowchart of Server/Client Interaction........................................................3-6
Figure 3-3. Select Tags for Network Import Dialog Box ..............................................3-7
Figure 3-4. General Attributes Dialog Box..................................................................3-12
Figure 3-5. Tag Connection Dialog Box......................................................................3-14
Figure 3-6. I/O Group Configuration Dialog Box ....................................................... 3-17
Figure 3-7. Tag Operations Dialog Box.......................................................................3-24
Figure 3-8. Analog Tag Scaling Dialog Box ...............................................................3-29
Figure 3-9. Scaling for Discrete Tag Configuration ....................................................3-30
Figure 3-10. Scaling for Bit Array Tag Configuration ..................................................3-31
Figure 3-11. Alarms for Analog Tag Configuration......................................................3-36
Figure 3-12. Alarms for Discrete Tag Configuration.....................................................3-37
Figure 3-13. Alarms for Bit Array Tag Configuration...................................................3-38
Figure 4-1. HMI G Wizard Dialog Box......................................................... ... .............4-6
Figure 4-2. Control Dialog Box...................................................................................4-11
Figure 4-3. Monitor Tag Value and Alarm VI.............................................................4-26
Figure 4-4. Process View Display VI ..........................................................................4-28
Figure 4-5. Two Trend Display VI ..............................................................................4-30
Figure 4-6. Initializing the Waveform Chart Indicator
for a Real-Time Trend Display .................................................................4-30
Figure 4-7. Using the Tag Attributes VIs to Initialize
Front Panel Indicators, Frame 0 ................................................................4-32
Figure 4-8. Using the Tag Attributes VIs to Initialize
Front Panel Indicators, Frame 1 ................................................................4-33
Figure 5-1. Event Configuration Dialog Box...............................................................5-10
Figure 6-1. Historical Logging Configuration Dialog Box............................................6-3
Figure 6-2. Historical Trend Viewer..............................................................................6-9
Figure 6-3. Select Tags Dialog Box.............................................................................6-10
Figure 7-1. Panel G Wizard ...........................................................................................7-2
Figure 7-2. Access Levels Dialog Box ........................................................................7-14
Figure 7-3. Privileges Dialog Box ...............................................................................7-15
Figure 7-4. Edit User Accounts Dialog Box ................................................................7-17
Figure 7-5. Add a User Account..................................................................................7-17
Figure 7-6. Using the Security Monitor VI to Control Visibility ................................7-22
© National Instruments Corporation xv BridgeVIEW User Manual
Page 15

Contents
Tables
Figure 8-1. Server Browser............................................................................................8-6
Figure 8-2. View Server Information Dialog Box.........................................................8-7
Figure 8-3. Browse OPC Servers on Network Dialog Box...........................................8-8
Figure 8-4. Server Browser..........................................................................................8-11
Figure 8-5. View Server Information Dialog Box.......................................................8-12
Table 2-1. BridgeVIEW Project Menu Items ............................................................2-10
Table 2-2. Engine Manager Field Descriptions .........................................................2-13
Table 2-3. Tag Browser Field Descriptions ..............................................................2-17
Table 2-4. Tag Monitor Utility Field Descriptions ...................................................2-20
Table 3-1. General Configuration Attributes ............................................................ 3-12
Table 3-2. Connection Configuration Attributes .......................................................3-15
Table 3-3. I/O Group Configuration Attributes .........................................................3-17
Table 3-4. Operations Configuration Attributes ........................................................3-25
Table 3-5. Scaling Configuration Attributes .............................................................3-27
Table 3-6. Bit Array Scaling Examples...................................................................... 3-32
Table 3-7. Alarms Configuration Attributes ............................................................3-33
Table 3-8. Events with Alarm Deadband = 0.0% ......................................................3-38
Table 3-9. Events with Alarm Deadband = 1.0% ......................................................3-39
Table 3-10. Configuration Settings for Activity 3-1 ................................................... 3-42
Table 3-11. Configuration Modifications for Activity 3-1...........................................3-43
Table 3-12. Configurable Memory Allocation Parameters ......................................... 3-47
Table 4-1. HMI G Wizard Operations .........................................................................4-4
Table 5-1. Tag Configuration Editor Event Configuration Selections ......................5-10
Table 5-2. Event Configuration, Log, and Print Format Selections ..........................5-12
Table 6-1. Parameters You Can Configure for Historical Logging ............................ 6-3
Table 6-2. Panning Button Functions.........................................................................6-11
Table 7-1. BridgeVIEW Environment Privileges ....................................................7-12
Table 7-2. Abbreviations Used to Enable Privileges for a User ...............................7-19
Table B-1. Data Transform Commands .......................................................................B-5
BridgeVIEW User Manual xvi © National Instruments Corporation
Page 16

Activities
Activity 2-1. Open and Run a VI......................................................................................2-8
Activity 3-1. Configure a Tag, and View the Tag Configuration
Activity 4-1. Use the HMI G Wizard ...............................................................................4-8
Activity 4-2. Import a Graphic Image into BridgeVIEW...............................................4-13
Activity 4-3. Read a Tag .................................................................................................4-20
Activity 5-1. Build an Alarm Summary Display..............................................................5-3
Activity 5-2. Acknowledge Alarms in the Alarm Summary Display...............................5-7
Activity 6-1. Use the Historical Data VIs.........................................................................6-6
Activity 6-2. Use the Historical Trend Viewer...............................................................6-15
Activity 7-1. Use the Panel G Wizard ..............................................................................7-3
Activity 7-2. Use Tag Attributes.....................................................................................7-10
Activity 7-3. Apply Security to the Alarm Summary Display .......................................7-23
Activity 9-1. Create a VI...................................................................................................9-6
Activity 9-2. Document a VI ..........................................................................................9-10
Activity 9-3. Create an Icon and Connector...................................................................9-16
Activity 9-4. Call a SubVI..............................................................................................9-19
Activity 9-5. Debug a VI in BridgeVIEW......................................................................9-21
Contents
Parameters and Tag Values.......................................................................3-40
Activity 10-1. Use Setup Options for a SubVI .................................................................10-2
Activity 11-1. Experiment with Chart Modes .................................................................11-3
Activity 11-2. Use a While Loop and a Chart .................................................................11-4
Activity 11-3. Change the Mechanical Action of a Boolean Switch...............................11-8
Activity 11-4. Control Loop Timing................................................................................11-9
Activity 11-5. Use a Shift Register................................................................................11-13
Activity 11-6. Create a Multiplot Chart and Customize Your Trends...........................11-17
Activity 11-7. Use a For Loop.......................................................................................11-22
Activity 12-1. Use the Case Structure .............................................................................12-2
Activity 12-2. Use a Sequence Structure.........................................................................12-5
Activity 12-3. Use the Formula Node............................................................................12-13
Activity 14-1. Create an Array with Auto-Indexing........................................................14-3
Activity 14-2. Use Auto-Indexing on Input Arrays.........................................................14-7
Activity 14-3. Use the Build Array Function ................................................................14-15
Activity 14-4. Use the Graph and Analysis VIs ............................................................14-20
© National Instruments Corporation xvii BridgeVIEW User Manual
Page 17

About This Manual
The BridgeVIEW User Manual contains the information you need to get
started with the BridgeVIEW software package. This manual explains the
BridgeVIEW environment, tag configuration, human machine interfaces,
alarms and events, and historical data logging and extraction. This manual
also reviews the concepts of G programming.
Throughout both sections of this manual, there are activities that teach
you what you need to know to build your own virtual instruments, and
ultimately, your own SCADA system. This manual assumes that you
know how to operate your computer and that you are familiar with its
operating system.
Organization of This Manual
This manual is divided into two parts. Part I, BridgeVIEW Concepts,
introduces you to the basic BridgeVIEW concepts, and includes Chapters 1
through 8. Part II, G Tutorial, describes the G programming language, and
how it works within BridgeVIEW, and includes Chapters 9 through 15.
We encourage you to work through all the activities in this manual before
you begin building your applications. You should save all of the VIs you
create with the BridgeVIEW activities in the
directory. To view the VI(s) for an activity that you have not completed
yourself, see the
solutions to the activities from the BridgeVIEW Concepts section of this
manual, and the
solutions to the activities in the G Tutorial section of this manual.
BridgeVIEW\Activity\Solutions
BridgeVIEW\Activity\Solution
BridgeVIEW\Activity
directory for the
directory for the
BridgeVIEW Concepts
Part I, BridgeVIEW Concepts, contains the following chapters.
• Chapter 1, Introduction, describes the unique BridgeVIEW approach
to Human Machine Interface (HMI) and Supervisory Control and
Data Acquisition (SCADA). It also contains system configuration,
installation instructions and basic information that explains how
to start using BridgeVIEW to develop industrial automation
applications.
• Chapter 2, BridgeVIEW Environment, describes the BridgeVIEW
environment. It explains the basic concepts behind G, the
© National Instruments Corporation xix BridgeVIEW User Manual
Page 18

About This Manual
programming language upon which BridgeVIEW is built, the
BridgeVIEW Engine Manager, system errors and events, the Tag
Monitor utility, and the Tag Browser utility. This chapter also explains
how to access online help for BridgeVIEW and provides an activity
that illustrates how to examine the front panel and block diagram of a
virtual instrument (VI).
• Chapter 3, Tag Configuration, explains tags, the Tag Configuration
Editor, and how you edit tags within the BridgeVIEW system.
• Chapter 4, Human Machine Interface, explains what a Human
Machine Interface (HMI) is and how you can monitor and control tags
from your HMI.
• Chapter 5, Alarms and Events, introduces the basic concepts of alarms
and events, and explains how to view, acknowledge, and configure
them within the BridgeVIEW system.
• Chapter 6, Historical Data Logging and Extraction, explains the
concept of a trend, how to log and extract historical data, and how to
use the Historical Trend V iewer (HTV), a utility that displays historical
data that has been logged to disk with BridgeVIEW.
• Chapter 7, Advanced Application Topics, explains the advanced topics
you need to understand to make optimum use of BridgeVIEW for
developing applications. The advanced topics covered in this chapter
are the Panel G Wizard, BridgeVIEW System Control, Tag Attributes
VIs, and BridgeVIEW Security.
• Chapter 8, Servers, explains how to use servers with BridgeVIEW.
BridgeVIEW supports several types of servers including OPC Serv ers,
DDE Servers, and IA Device Servers.
G Tutorial
Part II, G Tutorial, contains the following chapters.
• Chapter 9, Creating VIs, introduces the basic concepts of virtual
instruments and provides activities that explain how to create the icon
and connector, how to use a VI as a subVI, ho w to use the VI Setup…
option, and how to use the SubVI Node Setup… option.
• Chapter 10, Customizing VIs , introduces the basic concepts used for
customizing VIs.
• Chapter 11, Loops and Charts, introduces structures and explains
the basic concepts of charts, the While Loop, and the For Loop.
BridgeVIEW User Manual xx © National Instruments Corporation
Page 19

• Chapter 12, Case and Sequence Structures and the Formula Node,
introduces the basic concepts of Case and Sequence structures, and
provides activities that explain how to use the Case structure, how
to use the Sequence structure, and what sequence locals are and
how to use them.
• Chapter 13, Front Panel Object Attributes, describes objects called
attribute nodes, which are special block diagram nodes that control the
appearance and functional characteristics of controls and indicators.
• Chapter 14, Arrays, Clusters, and Graphs, introduces the basic
concepts of polymorphism, arrays, clusters, and graphs and provides
activities that explain auto-indexing and the Graph and Analysis VIs.
• Chapter 15, Application Control, introduces the VI Server and
provides an activity that explains how to use it within BridgeVIEW.
The VI Server allows you to control when a VI is loaded into memory,
run, and unloaded from memory.
• Chapter 16, Program Design, suggests some techniques to use when
creating programs and offers programming style recommendations.
Appendices, Glossary, and Index
• Appendix A, HMI Function Reference, describes error handling
for BridgeVIEW VIs and contains an explanation of the VIs in the
BridgeVIEW VI library. In this appendix, the VIs are arranged
alphabetically, first by VI Library name (Alarms and Events,
Historical Data, System, Tags, and Tag Attributes), then by VI name.
• Appendix B, Citadel and Open Datab ase Connectivity, describes the
Citadel database and the Open Database Connectivity (ODBC) driver ,
and includes several examples of how to use it.
• Appendix C, Customer Communication, contains forms to help
you gather the information necessary to help us solve your
technical problems, and a form you can use to comment on
the product documentation.
• The Glossary contains an alphabetical list of terms used in this
manual, including abbreviations, acronyms, metric prefixes,
mnemonics, and symbols.
• The Index contains an alphabetical list of key terms and topics in
this manual, including the page where you can find each one.
About This Manual
© National Instruments Corporation xxi BridgeVIEW User Manual
Page 20

About This Manual
Conventions Used in This Manual
The following conventions are used in this manual:
bold Bold text denotes a parameter, menu name, palette name, menu item,
return value, function panel item, or dialog box button or option.
italic Italic text denotes mathematical variables, emphasis, a cross reference,
or an introduction to a key concept.
bold italic Bold italic text denotes an activity objective, note, caution, or warning.
monospace
monospace bold
monospace italic
<> Angle brackets enclose the name of a key on the keyboard—for example,
- A hyphen between two or more key names enclosed in angle brackets
<Control> Key names are capitalized.
» The » symbol leads you through nested menu items and dialog box options
Text in this font denotes text or characters that you should literally enter
from the keyboard. Sections of code, programming examples, and syntax
examples also appear in this font. This font also is used for the proper
names of disk drives, paths, directories, programs, subprograms,
subroutines, device names, variables, filenames, and extensions, and
for statements and comments taken from program code.
Bold text in this font denotes the messages and responses that the computer
automatically prints to the screen. This font also emphasizes lines of code
that are different from the other examples.
Italic text in this font denotes that you must enter the appropriate words or
values in the place of these items.
<PageDown>.
denotes that you should simultaneously press the named keys—for
example, <Control-Alt-Delete>.
to a final action. The sequence File»Page Setup»Options»Substitute
Fonts directs you to pull down the File menu, select the Page Setup item,
select Options, and finally select the Substi tute Fonts option from the last
dialog box.
paths Paths in this manual are denoted with backslashes (\) to separate drive
names, directories, and files, as in
BridgeVIEW User Manual xxii © National Instruments Corporation
C:\dir1name\dir2name\filename
.
Page 21

This icon to the left of bold text denotes the beginning of an activity, which
contains step-by-step instructions you can follow to learn more about
BridgeVIEW.
This icon to the left of bold text denotes the end of an activity, which
contains step-by-step instructions you can follow to learn more about
BridgeVIEW.
This icon to the left of bold italicized text denotes a note, which alerts you
to important information.
Abbreviations, acron yms, metric pref ixes, mnemonics , symbols, and terms
are listed in the Glossary.
Related Documentation
The following documents contains information that you might find helpful
as you read this manual:
• G Programming Reference Manual
• BridgeVIEW Online Reference, available online by selecting
Help»Online Reference
About This Manual
Customer Communication
National Instruments wants to receive your comments on our products
and manuals. We are interested in the applications you develop with our
products, and we want to help if you have problems with them. To make it
easy for you to contact us, this manual contains comment and configuration
forms for you to complete. These forms are in Appendix C, Customer
Communication, at the end of this manual.
© National Instruments Corporation xxiii BridgeVIEW User Manual
Page 22

BridgeVIEW Concepts
This section contains information about the BridgeVIEW environment, tag
configuration, Human Machine Interface, alarms and events, historical data
logging and extraction, servers, and advanced application topics such as
system control and security.
Part I, BridgeVIEW Concepts, contains the following chapters.
• Chapter 1, Introduction, describes the unique BridgeVIEW approach
to Human Machine Interface (HMI) and Supervisory Control and
Data Acquisition (SCADA). It also contains system configuration,
installation instructions and basic information that explains how
to usestart using BridgeVIEW to develop industrial automation
applications.
• Chapter 2, BridgeVIEW Environment, describes the BridgeVIEW
environment. It explains the basic concepts behind G, the
programming language upon which BridgeVIEW is built, the
BridgeVIEW Engine Manager, system errors and even ts, th e Tag
Monitor utility, and the Tag Browser utility. This chapter also explains
how to access online help for BridgeVIEW and provides an activity
that illustrates how to examine the front panel and block diagram of a
virtual instrument (VI).
• Chapter 3, Tag Configuration, explains tags, the Tag Configuration
Editor, and how you edit tags within the BridgeVIEW system. Before
you can run a BridgeVIEW application, you must specify a tag
configuration.
• Chapter 4, Human Machine Interface, explains what a Human
Machine Interface (HMI) is and how you can monitor and control tags
from your HMI.
• Chapter 5, Alarms and Events, introduces the basic concepts of alarms
and events, and explains how to view, acknowledge, and configure
them within the BridgeVIEW system.
Part I
Page 23

Part I BridgeVIEW Concepts
• Chapter 6, Historical Data Logging and Extraction, explains the
concept of a trend, how to log and extract historical data, and how to
use the Historical Trend V iewer (HTV), a utility that displays historical
data that has been logged to disk with BridgeVIEW.
• Chapter 7, Advanced Application Topics, explains BridgeVIEW
Environment Securitythe advanced topics you need to understand to
make optimum use of BridgeVIEW for developing applications. The
advanced topics covered in this chapter are the Panel G Wizard,
BridgeVIEW System Control, Tag Attributes VIs, and BridgeVIEW
Security.
• Chapter 8, Servers, explains how to use servers with BridgeVIEW.
BridgeVIEW supports several types of servers including OPC Serv ers,
DDE Servers, and IA Device Servers.
BridgeVIEW User Manual I-2 © National Instruments Corporation
Page 24

Introduction
This chapter describes the unique BridgeVIEW approach to
Human Machine Interface (HMI) and Supervisory Control and Data
Acquisition (SCADA). It also contains system configuration, installation
instructions, and basic information that explains how to start using
BridgeVIEW to develop industrial automation applications. This chapter
refers you to other chapters or manuals for more information.
Welcome to BridgeVIEW
BridgeVIEW adds real-time process monitoring, historical trending, alarm
and event reporting, online configuration tools and PLC connectivity to a
premiere graphical development environment, G.
BridgeVIEW makes use of an intuitive graphical user interface combined
with a powerful graphical programming language, G, that enables you to
perform data acquisition and analysis, create an operator interface or
Human Machine Interface (HMI), and develop adv anced supervisory
control applications.
1
BridgeVIEW provides the following features for the development of your
Industrial Automation applications.
• Graphical human-machine interface (HMI)
• Easy-to-use, fill in the blank configuration utilities
• Graphical programming tools
• Real-Time Database (RTDB)
• Historical data collection and trending (Citadel)
• Alarm and event reporting and logging
• Security
• Connectivity to PLC and industrial device networks
• OPC Server Support
© National Instruments Corporation 1-1 BridgeVIEW User Manual
Page 25

Chapter 1 Introduction
Required System Configuration
BridgeVIEW is distributed on a CD-ROM that includes the complete
BridgeVIEW 2.0 release.
The Windows 95/NT version of BridgeVIEW runs on any system that
supports Windows 95 or W indows NT 4.0. A minimum of 24 MB of RAM
is required for this version to run effectively. We recommend 32 MB of
RAM and at least 30 MB of swap space available on your system.
Note
Installation
The standard BridgeVIEW installation requires approximately 110 MB of disk
space. A full installation requires approximately 150 MB. If you plan to install the
NI-DAQ Server as well, an additional 30 MB of disk space is required.
Complete the following steps to install BridgeVIEW.
1. Insert the CD in your CD-ROM drive.
2. Run the BridgeVIEW installer.
a. If you have Windows 95 or Windows NT 4.0 and your system
uses the AutoPlay feature, the Welcome to BridgeVIEW screen
appears a short time after you insert the CD.
b. If you have a system not using AutoPlay, run the following
program:
X
:\bvsetup.exe
X
where
is the letter of your CD-ROM drive.
3. Choose an installation. The installer offers several installation types:
Standard, Full, Minimum, and Custom. The Standard installation
requires approximately 110 MB. The Full installation, which also
includes Data Acquisition, GPIB, and VISA libraries and examples,
requires approximately 150 MB of disk space. The Standard
installation is recommended.
4. After selecting an installation, follow the instructions that appear on
your screen.
Note
If you plan to use National Instruments Data Acquisition (DAQ) devices, VISA, or
GPIB instrumentation, you can perform either the Full installation, which installs
all necessary drivers and example programs, or the Custom installation, in which
you select the items to install.
After you have installed BridgeVIEW completely, it is ready to run.
You migh t need to re-boo t your machine after installation so that updated
system, DAQ, VISA, or GPIB drivers can be loaded properly.
BridgeVIEW User Manual 1-2 © National Instruments Corporation
Page 26

What Is BridgeVIEW?
BridgeVIEW is a software package specifically targeted at industrial
automation applications. BridgeVIEW provides configurable solutions for
common HMI and SCADA functions while leveraging the flexibility of
graphical programming. BridgeVIEW is built around the Gprogramming
language, created by National Instruments Corporation.
With BridgeVIEW, you can acquire data and control one or more
distributed devices in an overall facility. BridgeVIEW can change set points
or send control instructions to the individual devices while monitoring the
entire system. It also can gather information like alarms and measurement
points from these devices.
Common devices used for data acquisition include Programmable Logic
Controllers (PLCs), plug-in Data Acquisition boards, and other distributed
Input/Output (I/O) modules. BridgeVIEW device servers communicate
with these non-plug-in devices through RS-232, RS-485, TCP/IP, DDE,
netDDE, direct I/O, or other proprietary interfaces. BridgeVIEW device
servers provide the necessary protocol software to communicate with
thesedevices. BridgeVIEW also operates directly with OPC servers.
Chapter 1 Introduction
How Does BridgeVIEW Work?
BridgeVIEW uses a combination of tags, events, and data. A tag is a
connection to a real-world I/O point, while an event is anything that
happens to a tag or to the BridgeVIEW Engine in general. The
BridgeVIEW Engine communicates with device servers on one end,
andwith your HMI application at the other end. The BridgeVIEW
Enginemaintains a Real-Time Database (RTDB) of tag information and
logs historical data and events. You can build your HMI to interface with
the BridgeVIEW Engine using virtual instruments (VIs) to read and write
tag values, view alarm information and trend data. A virtual instrument is
a BridgeVIEW function, written in the graphical programming language G.
For more information about G, see any of the chapters in the G Tutorial
section of this manual.
Start by configuring all the tags in your system with the Tag Configuration
Editor. Then, you can launch the BridgeVIEW Engine, which reads your
configuration file and starts monitoring tags, logging data and events. You
can create your HMI application to display tag values, trends, and alarms.
You also can acknowledge alarms and control output tags. You can build
the HMI using BridgeVIEW VIs to read and write tag values, view alarm
© National Instruments Corporation 1-3 BridgeVIEW User Manual
Page 27

Chapter 1 Introduction
G Programming
information, acknowledge alarms, view real-time trends and retrieve
historical data. For more information about how to get started with
BridgeVIEW, see the Where Should I Start? section at the end of this
chapter.
G is the easy-to-use graphical data flow programming language
BridgeVIEW is based upon. G simplifies scientific computation,
processmonitoring and control, test and measurement, and a wide
varietyof other applications.
G was first introduced by National Instruments as the programming
language behind LabVIEW, the program development application used
commonly for test and measurement purposes. BridgeVIEW has taken all
the functionality of G and enhanced it for your industrial automation needs.
The G Tutorial section of this manual covers the functionality of G that you
need to get started with most BridgeVIEW applications. For a more
extensive explanation of BridgeVIEW functionality, see the
GProgramming Reference Manual.
The basic concepts of G that are covered in this manual are as follows:
• VIs—Virtual instruments (VIs) have three main parts: the front panel,
the block diagram, and the icon/connector. The front panel specifies
the user interface of the VI. The block diagram consists of the
executable code that you create using nodes, terminals, and wires.
With the icon/connector, you can use a VI as a subVI in the block
diagram of another VI. For more information about VIs, refer to
Chapter9, CreatingVIs, and Chapter10, Customizing VIs.
• Loops and Charts—G has two structures to repeat execution of a
sub-diagram—the While Loop and the For Loop. Both structures are
resizable boxes. You place the subdiagram to be repeated inside the
border of the loop structure. The While Loop executes as long as the
value at the conditional terminal is TRUE. The For Loop executes a set
number of times. Charts are used to display real-time trend information
to the operator. For more information about loops and charts, refer to
Chapter11, Loops and Charts.
• Case and Sequence Structures—The Case structure is a conditional
branching control structure, which executes a subdiagram based on
certain input. sequence structure is a program control structure that
executes its subdiagrams in numeric order. For more information about
Case or Sequence structures, refer to Chapter12, Case and Sequence
Structures and the Formula Node.
BridgeVIEW User Manual 1-4 © National Instruments Corporation
Page 28

Tag Configuration
Chapter 1 Introduction
• Attribute Nodes—Attribute nodes are special block diagram nodes that
you can use to control the appearance and functional characteristics of
controls and indicators. For more information about attribute nodes,
refer to Chapter13, Front Panel Object Attributes.
• Arrays, Clusters and Graphs—An array is a resizable collection of
data elements of the same type. A cluster is a statically sized collection
of data elements of the same or different types. Graphs commonly are
used to display data. For more information about arrays, clusters, and
graphs, refer to Chapter14, Arrays, Clusters, and Graphs.
• VI Server—The VI Server allows you to control when a VI is loaded
into memory, run, and unloaded from memory. For more information
about VI Control VIs, refer to Chapter15, Application Control.
A tag value is acquired and/or controlled by a device server that
communicates with the BridgeVIEW Engine and can be read or set by
aVIin your HMI application. Tags can be of the following types: input,
output, Input/Output, or memory. You can configure tags through the
TagConfiguration Editor. A tag configuration consists of its data type,
connection, scaling, operations, and alarms settings. For more information
about this topic, refer to Chapter3, Tag Configuration.
Data Type
A tag datatype can be analog, discrete, bit array, or string. Analog tags
have continuous values with a specified range (such as 0.0 to 100.0).
Discrete tags have values that are either ON (1) or OFF (0). Bit array tags
are comprised of up to 32 bits, each of which can have an ON (1) or OFF(0)
state. String tags consist of ASCII characters or binary data and can be of
any length.
General
General includes the following tag attributes:
•Tag name
• Tag description
• Tag group
• Length (for bit array and string tags)
© National Instruments Corporation 1-5 BridgeVIEW User Manual
Page 29

Chapter 1 Introduction
Connection
Connection includes the following tag attributes:
• Access rights (input only, output only, Input/Output, or memory)
•Server name
• I/O group name
• Item name
• Access path (for OPC servers)
Scaling
Scaling controls the type of scaling to perform on a tag when
communicating with a device server, and the expected engineering
rangeand units for the tag.
Operations
You can specify how the BridgeVIEW Engine updates the Real-Time
Database (RTDB), when it logs the tag data to disk, if it logs events
associated with the tag, and what value exists in the database at startup.
Theoperations that can be performed on a tag are as follows:
• Updating the Real-Time Database
• Historical logging
• Event logging
• Event printing
Alarms
An alarm is an abnormal process condition. For example, an analog
tagcanbe configured to be in a HI alarm state when its value is greater
than25.You can set alarm limits for a tag in the Tag Configuration Editor.
Each alarm limit has a priority associated with it to determine the severity
of the alarm.
BridgeVIEW User Manual 1-6 © National Instruments Corporation
Page 30

Events
An event is something that happens within the BridgeVIEW system.
Events can be divided into two groups: those that pertain to individual
tagsand those that pertain to the overall BridgeVIEW system. Events
pertaining to tags include the following:
• A tag going in or out of alarm
• An operator changing the value of a tag
• An operator acknowledging an alarm
Events pertaining to the system include the following:
• The launching or shutting down of the Engine
• A new operator logging on
• An error from a server
The Engine also maintains alarm summary and event history information
pertaining to tags. This information can be viewed by the user’s HMI and/or
be logged to disk.
Historical Data Logging and Extraction
You can extract data from the historical database to view the trend of tag
data over time. The BridgeVIEW Engine manages logging data to the
Citadel Historical Database. A trend is a view of data over time. Trends can
be real-time (current data) or historical (logged data). You can view logged
data with a user interface (HMI) or with the Historical Trend Viewer
(HTV). For more information about historical data logging and extraction
or the Citadel Historical Database, see Chapter6, Historical Data Logging
andExtraction, or AppendixB, Citadel and Open Database Connectivity.
Chapter 1 Introduction
Security
Environment security is built into BridgeVIEW and determines access to
certain parts of the BridgeVIEW environment. BridgeVIEW security is
broken into two general categories:
• BridgeVIEW Environment Access Privileges
• Operator Interface Security
© National Instruments Corporation 1-7 BridgeVIEW User Manual
Page 31

Chapter 1 Introduction
What Is the BridgeVIEW System Architecture?
The BridgeVIEW system contains three sets of processes: the user HMI
Application, the BridgeVIEW Engine, and industrial automation device
servers, as shown in Figure 1-1. These processes interact through a
client-server relationship.
HMIs
Real-Time Database
Servers
PLC DAQ OPC Other (including DDE)
Figure 1-1.
VIs
Tags
BridgeVIEW
Engine
BridgeVIEW Architecture
• EU Scaling
• Alarming
• Event/Alarm Logging
• T rending
The BridgeVIEW Engine, with any device servers, runs as a separate
process independent of your HMI application. Your HMI application is
built as a collection of VIs developed using the G programming language.
BridgeVIEW maintains a high performance Real-Time Database in
the BridgeVIEW Engine that provides information to client applications.
The BridgeVIEW Engine also performs other functions including
the following:
• Data acquisition, engineering unit (EU) scaling, and alarm processing
• Alarm and event logging
• Historical data collection and trending
EU scaling converts the Raw Range value from the device server to the
engineering value used in the user application and vice versa.
User HMI Application
The end user of the BridgeVIEW system sees and interacts with an
HMI. The HMI application is a collection of VIs that you build with the
G programming language in BridgeVIEW. You build VIs that interact
BridgeVIEW User Manual 1-8 © National Instruments Corporation
Page 32

BridgeVIEW Engine
Chapter 1 Introduction
withthe BridgeVIEW Engine to read and write tag values, acknowledge
alarms, access historical data, and read and write tag attributes.
BridgeVIEW makes development of operator graphic displays easy and
fast. Floating palettes provide controls and functions necessary to develop
effective HMI and SCADA applications. The Controls palette provides a
number of predefined objects, selected from the automation symbol library,
for building your HMI. The Functions palette provides a set of functions
and VIs you can use for I/O, analysis, historical data, and networking.
The BridgeVIEW Engine is the heart of the BridgeVIEW System. It runs as
a separate process, independent of your HMI application. This minimizes
interference between the Engine and your HMI. The BridgeVIEW Engine
maintains the Real-Time Database of all tag values and alarm states. It
reads values from the various device servers. These values are scaled and
compared with their alarm limits. If a tag is in an alarm state, the Engine
generates appropriate events and logs them to disk.
The Real-TimeDatabase (RTDB) is an in-memory snapshot of the state of
all tags in the system. If a tag value changes more than its update deadband,
or its alarm state changes, the RTDB is updated. Along with tag values, the
RTDB also stores status, date, time, and alarm information.
Device Servers
A device server is the application that communicates with the I/O devices
such as PLCs and plug-in cards. Several National Instruments device
servers are written to a National Instruments standard client/server
Application Programming Interface (API) for the BridgeVIEW
Engine.BridgeVIEW also communicates with OPC and DDE Servers.
There aredifferent servers for different device manufacturers and
communication networks.
The device servers that support the BridgeVIEW Engine are stand-alone
programs launched by the BridgeVIEW Engine, and thereafter run in the
background, reading selected input items and writing them on demand.
Each server either is configured by BridgeVIEW when tags are created,
orhas a specific configuration utility that determines communication
parameters, I/O poll rates, and device addresses. A server completes
operation only when the BridgeVIEW Engine shuts down.
Input items are polled by servers at a rate determined by the BridgeVIEW
I/O groupconfiguration. For each input item, the device server passes
© National Instruments Corporation 1-9 BridgeVIEW User Manual
Page 33

Chapter 1 Introduction
the value, the timestamp of when the item was sampled, and status
information to the BridgeVIEW Engine. Output items are written on
demand only when the BridgeVIEW Engine passes a new output
value to the server.
The device server monitors the items and encapsulates all device and
hardware-specific details, thereby providing a hardware- and
software-independent layer to the user HMI and SCADA application.
For more information about device servers, see Chapter 8, Servers.
Where Should I Start?
The following table lists what is included in the different installation types.
Installation
Type
Minimum Ta g Configuration Editor, basic security tools,
Standard Ta g Configuration Edito r, all security tools,
Includes
core VI libraries
Historical Trend Viewer, Tag Browser, Tag
Monitor, core VI libraries, adva nced analysis
libraries, online help, activities, and graphics files
Full Ta g Configuration Edito r, all security tools,
Historical Trend Viewer, Tag Browser,
Tag Monitor, core VI libraries, advanced
analysis libraries, online help, activities,
graphics files, Instrument Wizard, DAQ, GPIB,
and VISA libraries
Custom Select which utilities and libraries to install.
We recommend that you work through the activities in this manual.
These activities comprehensively illustrate how BridgeVIEW works.
If you are new to the G pro gramming lan guage, begin with the activities
in Chapters 9 through 16, and then continue with those in Chapters 2
through 8. If you are an experienced G programmer, begin with Chapter 2
and continue through the entire manual so that you might learn the
important BridgeVIEW concepts, and review any G programming
techniques that you might be familiar with already.
Save all of the VIs you create with the BridgeVIEW activities in the
BridgeVIEW\Activity
BridgeVIEW User Manual 1-10 © National Instruments Corporation
directory. There is also a Solution directory
Page 34

Chapter 1 Introduction
BridgeVIEW\Activity\Solutions
(
) that contains the completed VIs
for each activity in this manual. You can view the VI for an activity that
you have not completed yet, or use the VIs in this directory as a means
of verifying your work.
Another good place to start is the Examples
readme.vi
, at the top level of this directory, to browse through the
directory. Use the VI called
available examples.
If you are going to use device servers, including OPC servers, read
Chapter 8, Servers, which contains important information about servers,
including what you need to develop your own device servers.
© National Instruments Corporation 1-11 BridgeVIEW User Manual
Page 35

BridgeVIEW Environment
This chapter describes the BridgeVIEW environment. It explains
thebasicconcepts behind G, the programming language upon which
BridgeVIEW isbuilt, the BridgeVIEW Engine Manager, system errors
andevents, the Tag Monitor utility, and the Tag Browser utility. This
chapter also explains how to access online help for BridgeVIEW and
provides an activity that illustrates how to examine the front panel
andblock diagram of a virtual instrument (VI).
What Is G?
G is a programming language, much like various commercial C or BASIC
development languages. However, G is different from those applications
inone important respect. Other programming languages are text-based
languages that create lines of code, while G is a graphical programming
language that creates programs in block diagram form.
You can use G with little programming experience. G engineers and
programmers rely on graphical symbols and data flow rather than textual
language to describe programming actions. Data flow is a programming
system in which nodes execute when they have received all required input
data, and produce output automatically when they have executed.
2
G has extensive libraries of functions and subroutines for most
programming tasks. BridgeVIEW includes conventional program
development tools for G, so you can set breakpoints, animate program
execution to see how data passes through the program, and single-step
through the diagram to make debugging and program development easier.
How Does G Work?
G includes libraries of functions and development tools designed
specifically for HMI development, data acquisition, and instrument
control. G programs are called virtual instruments (VIs) because their
appearance and operation imitate actual instruments. However, they are
analogous to functions in conventional programming languages.
© National Instruments Corporation 2-1 BridgeVIEW User Manual
Page 36

Chapter 2 BridgeVIEW Environment
Virtual Instruments
VIs have both an interactive user interface and a source code equivalent,
and accept parameters from higher-level VIs. VIs have three main parts:
• The front panel
• The block diagram
• The icon/connector
With these features, G promotes and adheres to the concept of modular
programming. You divide an application into a series of tasks, which
youcan divide again until a complicated application becomes a series
ofsimple subtasks. You build a VI to accomplish each subtask and then
combine those VIs on another block diagram to accomplish the larger task.
Finally, your top-level VI contains a collection of subVIs that represent
application functions.
Because you can execute each subVI by itself, apart from the rest of the
application, debugging is much easier. Furthermore, many low-level
subVIs often perform tasks common to several applications, so you can
develop a specialized set of subVIs and reuse them in different applications.
For more information about VIs, see Chapter9, CreatingVIs, and
Chapter10, Customizing VIs, in this manual, or refer to the
GProgramming Reference Manual.
Front Panel
VIs contain an interactive user interface, which is called the front panel,
because it simulates the panel of a physical device. The front panel can
contain knobs, push buttons, graphs, and other controls and indicators.
Youinput data using a keyboard, mouse, touch screen, or other device
andthen view the results on the computer screen.
The front panel contains a toolbar of command buttons and status indicators
that you use for running and debugging VIs. It also contains font options
and alignment and distribution options for editing VIs. Pictures of the front
panel toolbar, and its buttons, are shown below.
Run button—Runs the VI.
Continuous Run button—Runs the VI over and over; useful for
debugging.
BridgeVIEW User Manual 2-2 © National Instruments Corporation
Page 37

Chapter 2 BridgeVIEW Environment
Stop button—Aborts VI execution.
Pause/Continue button—Pauses VI execution/Continues VI execution.
Font ring—Sets font options, including font type, size, style, and color.
Alignment ring—Sets alignment options, including vertical, top edge, left,
and so on, for two or more objects.
Distribution ring—Sets distribution options, including gaps,
compression, and so on, for two or more objects.
Reorder ring—Allows you to restack overlapping objects by moving a
selected object above or below the others.
Block Diagram
VIs are executed from a block diagram, which you construct in G. The
block diagram supplies a pictorial solution to a programming problem.
Theblock diagram contains the source code for the VI.
The block diagram toolbar contains additional options that are not included
on the front panel toolbar. Use these additional options for debugging VIs.
The block diagram toolbar is shown below.
Highlight Execution button—Displays data as it passes through wires.
Step Into button—Steps into loops, subVIs, and so on.
Step Over button—Begins single stepping, steps over a loop, subVI,
andso on.
Step Out button—Completes execution of loops, VIs, block diagrams,
andso on.
Icon/Connector
VIs use a hierarchical and modular structure. You can use them as top-level
programs, or as subprograms within other programs. A VI within another
VI is called a subVI. The icon/connector pane of a VI works like a
graphical parameter list so that other VIs can pass data to it as a subVI.
© National Instruments Corporation 2-3 BridgeVIEW User Manual
Page 38

Chapter 2 BridgeVIEW Environment
Tools Palette
BridgeVIEW has a floating Tools palette, which you can use to edit and
debug VIs. You use the <Tab> key to tab through the commonly used tools
on the palette. If you have closed the Tools palette, select Windows»Show
Tools Palette to display the palette. A shortcut for bringing up the Tools
palette is to right click while pressing the <Shift> key. The following
illustration shows the Tools palette.
Operating tool—Places Controls and Functions palette items on the front
panel and block diagram.
Positioning tool—Positions, resizes, and selects objects.
Labeling tool—Edits text and creates free labels.
Wiring tool—Wires objects together in the block diagram.
Object pop-up menu tool—Brings up a pop-up menu for an object.
Scroll tool—Scrolls through the window without using the scrollbars.
Breakpoint tool—Sets breakpoints on VIs, functions, loops, sequences,
and cases.
Probe tool—Creates probes on wires.
Color Copy tool—Copies colors for pasting with the Color tool.
Color tool—Sets foreground and background colors.
Note
BridgeVIEW User Manual 2-4 © National Instruments Corporation
You can pop up on an object by clicking on it with the right mouse button.
Page 39

Controls Palette
Chapter 2 BridgeVIEW Environment
The Controls palette consists of a graphical, floating palette that opens
when you launch BridgeVIEW. You use this palette to place controls
andindicators on the front panel of a VI. Each top-level icon contains
subpalettes. If the Controls palette is not visible, you can open it by
selecting Windows»Show Controls Palette from the front panel menu.
You also can right-click, or pop up, on an open area in the front panel to
access a temporary copy of the Controls palette. The Controls palette is
available only when the front panel is the active window. The following
illustration displays the top-level of the Controls palette.
Functions Palette
The Functions palette consists of a graphical, floating palette that opens
automatically when you switch to the block diagram. You use this palette
to place nodes (constants, indicators, VIs, and so on) on the block diagram
of a VI. Each top-level icon contains subpalettes.
If the Functions palette is not visible, you can select Windows»Show
Functions Palette from the block diagram menu to display it. You can
alsopop up on an open area in the block diagram to access the Functions
palette. The Functions palette is available only when the block diagram is
the active window. The following illustration displays the top-level of the
Functions palette.
© National Instruments Corporation 2-5 BridgeVIEW User Manual
Page 40

Chapter 2 BridgeVIEW Environment
Controls and Indicators
Controls
orgraphs in traditional programming languages. BridgeVIEW contains
avariety of controls and indicators that you can choose according to the
kind of values or quantities you want to evaluate or display.
indicators
and
in G are similar to input and output parameters
You can configure all the controls and indicators using options from their
pop-up menus. Popping up on individual components of controls and
indicators displays menus for customizing those components. To access
thepop-up menu, right-click on any object that has a pop-up menu.
The primary data types you use in BridgeVIEW applications
—
numeric,
Boolean, string, and tag, are described in the following sections.
Numeric
You use numeric controls to enter numeric quantities, while numeric
indicators display numeric quantities. The two most commonly used
numeric objects are the digital control and the digital indicator, shown
below. You can find these controls and indicators in the
subpalette of the
BridgeVIEW User Manual 2-6 © National Instruments Corporation
Controls
palette.
Numeric
Page 41

Chapter 2 BridgeVIEW Environment
Label
Increment Buttons
Label
Digital Control
Digital Indicator
Boolean
You use Boolean controls and indicators for entering and displaying
Boolean (TRUE/FALSE) values. Boolean objects simulate switches,
buttons, and LEDs. The most commonly used Boolean objects are
the vertical switch and the round LED, shown below, found in the
Boolean subpalette.
String
You use string controls and indicators for entering and displaying ASCII
characters. You can use strings for simple text messages displayed to the
user and for character streams sent to serial devices, instruments, or files.
You can find the string control and indicator in Controls»String
Table Tags. You can enter or change text inside a string control using
the Operating tool or the Labeling tool. Enlarge string controls and
indicators by dragging a corner with the Positioning tool.
If you want to minimize space that a front panel string control or indicator
occupies, select Show»Scrollbar. If this option is dimmed, you must
increase the vertical size of the window to make it available.
© National Instruments Corporation 2-7 BridgeVIEW User Manual
Page 42

Chapter 2 BridgeVIEW Environment
Tag
You use tag controls and indicators for entering and displaying tag names
or group names contained in the loaded tag configuration (
You can find tag controls and indicators in Controls»String Table Tags.
For more information about the tag data type, see the section Tag Data
Type, in Chapter 4, Human Machine Interface.
Activity 2-1. Open and Run a VI
Your objective is to familiarize yourself with the basic concepts of virtual
instruments. You will open, examine, and operate the front panel and
block diagram of a VI.
1. Select File»Open, and open
.scf
) file.
Tank Simulation.vi
BridgeVIEW\Examples\G Examples\Apps\tankmntr.llb
The front panel appears as shown in the following illustration.
from the
.
BridgeVIEW User Manual 2-8 © National Instruments Corporation
Page 43

Chapter 2 BridgeVIEW Environment
2. Run the VI by clicking on the Run button in the toolbar. The button
changes appearance to indicate that the VI is running.
3. Use the Operating tool to change the values of the Inflow Rates and
other controls. First, highlight the old value, either by double-clicking
on the value you want to change, or by clicking and dragging across
the value with the Labeling tool. When the initial value is highlighted,
type a new value and press <Enter>. You also can click on the Enter
button in the toolbar , or click the mouse in an open area of the windo w
to enter the new value.
4. Stop the VI by clicking on the Stop button.
5. Open the block diagram of the Tank Simulator VI by choosing
Windows»Show Diagram.
The following illustration shows the block diagram.
6. Examine the different objects in the block diagram.
Every front panel in BridgeVIEW has an accompanying block
diagram, which is the VI equivalent of a program. Think of the block
© National Instruments Corporation 2-9 BridgeVIEW User Manual
Page 44

Chapter 2 BridgeVIEW Environment
diagram as source code. The components of the block diagram
represent program nodes such as For Loops, Case structures, and
multiplication functions. The components are wired togeth er to show
the flow of data within the block diagram.
The outermost structure in this diagram is the While Loop. It continues
to run until the power switch is turned off. The objects inside the loop
include functions and subVIs that generate simulated data that is
displayed on the historical trends and other objects on the front panel.
At this point, you do not need to understand all of the structures and
objects completely. Chapters 9 through 16 of this manual describe in
greater detail each element that appears in a VI.
7. Close the VI.
End of Activity 2-1.
BridgeVIEW Environment Project Menu
The BridgeVIEW system is comprised of the G programming language
and a collection of software tools designed specifically for industrial
automation applications. You can access these tools through the Project
menu in your BridgeVIEW system. Table 2-1 provides a brief description
of the items in the Project menu.
Table 2-1.
Project Menu Item Description
Configure BridgeVIEW
Startup
Historical Trend Viewer Launches the Historical Trend Viewer (HTV). You can use the
BridgeVIEW User Manual 2-10 © National Instruments Corporation
BridgeVIEW Project Menu Items
Opens a utility you can use to configure BridgeVIEW to start
particular VIs whenever you start BridgeVIEW.
HTV to view historical data logged in the Citadel Historical
Database. For more information about the HTV, see Chapter 6,
Historical Data Logging and Extraction.
Page 45

Chapter 2 BridgeVIEW Environment
Table 2-1.
BridgeVIEW Project Menu Items (Continued)
Project Menu Item Description
Launch Engine Launches the BridgeVIEW Engine. The BridgeVIEW Engine
manages the Real-Time Database, communicates with device
servers, and performs alarm management and historical data
logging. The BridgeVIEW Engine runs according to a
configuration file called a
file. You can create and edit
.scf
(SCADA Configuration File)
.scf
files using the Tag
Configuration Editor. For more information about the
BridgeVIEW Engine, see the section What Is the BridgeVIEW
Engine Manager? in this chapter.
Security»Access Levels
Opens a utility you can use to add, remove, and modify access
levels in your BridgeVIEW system. If user accounts are defined in
your system, you must have Administration privileges to edit the
list of access levels. For more information about security and
access levels, see Chapter 7, Advanced Application Topics.
Security»Change Password
Opens a dialog box to change the current user password. You must
be logged in to change your password. For more information about
security and passwords, see Chapter 7, Advanced Application
Topics.
Security»Edit User
Accounts
Opens a utility you can use to create and edit user accounts in your
BridgeVIEW system. If user accounts are defined in your system,
you must have Administration privileges to create and edit user
accounts. For more information about security and user accounts,
see Chapter 7, Advanced Application Topics.
Security»Login
Opens a dialog box you can use to log in to the system. For more
information about security, see Chapter 7, Advanced Application
Topics.
Security»Logout
Opens a dialog box you can use to log out of the system. For more
information about security, see Chapter 7, Advanced Application
Topics.
Security»Privileges
Opens a utility you can use to view your access privileges. For
more information about security and access levels, see Chapter 7,
Advanced Application Topics.
Server Tools»Server
Browser
Launches the Server Browser. You can use the Server Browser to
view information about the BridgeVIEW device serv ers. For more
information about the Server Browser, see Chapter 8, Servers.
© National Instruments Corporation 2-11 BridgeVIEW User Manual
Page 46

Chapter 2 BridgeVIEW Environment
Table 2-1.
BridgeVIEW Project Menu Items (Continued)
Project Menu Item Description
Tag»Browser
Launches the Tag Browser. You can use the Tag Browser to view
information on all of the tags in the currently-loaded
If the BridgeVIEW Engine is not running, you can use the Tag
Browser to load a different
.scf
file. For more information about
the Tag Browser, see the section What Is the Tag Browser? in
this chapter.
Tag»Configuration
Launches the Tag Configuration Editor. You can use the Tag
Configuration Editor to define all of the tags in your BridgeVIEW
system. Also, you can configure other Engine parameters in the
Tag Con figuration Editor. For more information about the Tag
Configuration Editor, see Chapter 3, Tag Configuration.
Tag»Monitor
Launches the Tag Monitor. You can use the Tag Monitor to
monitor the value, alarm state, and status of all tags in the system,
as well as write the value to an output or input/output tag. The Tag
Monitor launches the BridgeVIEW Engine if it is not already
running. For more information on the Tag Monitor, see the What
Is the Tag Monitor? section in this chapter.
What Is the BridgeVIEW Engine Manager?
.scf
file.
When you run any G application that accesses the BridgeVIEW Real-Time
Database, the BridgeVIEW Engine launches automatically, opening either
the configuration (
.scf
) file you edited most recently or the one your
application selects programmatically.
Launching the BridgeVIEW Engine brings up the Engine Manager
display, shown in Figure 2-1. The Engine Manager is a window into the
BridgeVIEW Engine, through which you can control some of the behavior
of the BridgeVIEW Engine.
Figure 2-1.
BridgeVIEW User Manual 2-12 © National Instruments Corporation
Engine Manager Display
Page 47

Chapter 2 BridgeVIEW Environment
Table 2-2 provides a description of each of the fields in the Engine
Manager dialog box. This table provides basic information about th e
Engine Manager dialog box options. For a more complete understanding
of how or why you might use the Engine Manager in a BridgeVIEW
application, you must understand how to configure tags. See Chapter 3,
Tag Configuration.
Table 2-2.
Engine Manager Field Descriptions
Field Description
Engine Status Displays the current status of the BridgeVIEW Engine—whether launching,
running, or stopped.
Log Historical
Data
Turns on or off logging of historical data to file. This button is pressed
automatically if you selected Start logging on system start-up in your
configuration file. If you do not have a valid event log path configured,
or do not have a printer configured, this checkbox is disabled.
Log Events Turns on or off logging of alarms and events to file. This button is pressed
automatically if you selected Start event logging on system start-up in your
configuration file. If you do not have a valid event log path configured, this
checkbox is disabled.
Print Events Turns on or off printing of alarms and ev ents to your line printer. This button
is pressed automatically if you selected Start printing on system start-up in
your configuration file. If you do not have a printer conf igured, this checkbox
is disabled.
Run/Stop Engine Starts the BridgeVIEW Engine, or stops the BridgeVIEW Engine and shuts
down any loaded servers.
Quit Engine Closes and exits the BridgeVIEW Engine process.
Enable Error
Dialog
Enables or disables the showing of the Error dialog box. If this box is checked,
a System Error Display dialog box pops up for you to acknowledge the event
when a system error occurs.
Server Browser Launches the Server Browser Utility. With this utility , you can see the servers
in your system, including OPC servers; view server information; and display
the server front panel if the server is running (VI-based servers only).
Show/Hide
Shows or hides the System Event Display.
System Event
Display
© National Instruments Corporation 2-13 BridgeVIEW User Manual
Page 48

Chapter 2 BridgeVIEW Environment
The Engine Manager shows the current state of the Engine, and has a
System Event Display that shows the following:
• BridgeVIEW System Events
• When the Engine started and stopped
• Which servers have been launched
• Any System Errors that have occurred
This information is written to the current BridgeVIEW System Log File,
found in the
Engine Manager Display looks when the Show System Events Display
button is enabled.
BridgeVIEW\Syslog
folder. Figure 2-2 shows how the
Figure 2-2.
Engine Manager with System Events Displayed
Once the BridgeVIEW Engine is launched and running, the Engine
Manager is minimized and appears in your Windows taskbar. Click on
the BridgeVIEW Engine icon in your taskbar to bring up the Engine
Manager display.
Y ou can lea ve the BridgeVIEW Engine Manager display minimized unless
you want to start or stop the Engine, or start or stop historical logging, event
logging and printing, view system events, or view server information.
From the Engine Manager, you can reach the Serv er Browser utility, sho wn
in Figure 2-4, by pressing the Server Browser… button. With this
utility, you can see the servers in your system, view server information,
and display the server front panel if the server is running (VI-based
servers only).
BridgeVIEW User Manual 2-14 © National Instruments Corporation
Page 49

Chapter 2 BridgeVIEW Environment
The Server Browser is shown in the following illustration. For more
information about device servers, see Chapter8, Servers.
Figure 2-3.
The Show Server User Interface button appears on the Server
Browserdialog box only when you invoke the Server Browser from
theEngine Manager.
If your application does not shut down within a few seconds after you
closethe BridgeVIEW Engine Manager, BridgeVIEW displays a dialog
box notifying you to shut down your HMI application. You can ensure
yourapplication shuts down when the Engine shuts down by monitoring
the shutdown output of any Tags or Alarms VI or the Engine Status VI
inyourdiagram. This technique is explained in Chapter4, Human
Machine Interface.
Server Browser
What Are System Errors and Events?
System errors are conditions on a system level (as opposed to a per tag
basis) that result in problematic functioning of the BridgeVIEW system.
When a system error occurs, BridgeVIEW prompts the user with a dialog
box. You can turn this dialog box on or off.
System events are changes in the system that cause a change in behavior
thatis not problematic. These include events reported by utilities such as
the Tag Configuration Editor.
© National Instruments Corporation 2-15 BridgeVIEW User Manual
Page 50

Chapter 2 BridgeVIEW Environment
Detailed system error and event messages are logged to a system log file.
The messages are written to an ASCII file with a
SYSLOG
directory. BridgeVIEW automatically creates this directory, if
it does not exist already. The system log file names take the format,
YYMMDDHHMM.log
MM
and
= minute.
What Is the Tag Browser?
With the Tag Browser utility, shown in Figure 2-4, you can view the
general configuration of all configured tags in the system. Launch the
Tag Browser by selecting Project»Tag»Browser.
A list of all the configured tags appears in the listbox. Select a tag by
clicking on it, and the configuration for that tag displays on the right.
For more detailed tag configuration information or to learn how to edit
a tag configuration, see Chapter 3, Tag Configuration.
.log
extension in the
where YY = year, MM = month, DD = day, HH= hour,
Figure 2-4.
Tag Browser Utility
T able 2-4 describes each of the fields in the T ag Browser Utility dialog box.
BridgeVIEW User Manual 2-16 © National Instruments Corporation
Page 51

Chapter 2 BridgeVIEW Environment
Table 2-3.
Tag Browser Field Descriptions
Field Description
Configuration File Displays the name of the configuration file you are browsing.
Browse If the BridgeVIEW Engine is not running, press this button to select a
different configuration file.
Location Displays the full path of the directory containing the configuration file you
are browsing.
Engine Status Displays the current state of the BridgeVIEW Engine, whether it is loaded,
running or stopped.
Configured Tags Displays the list of all tags currently configured. Click on a tag to display the
tag configuratio n on the right.
Edit Edits the selected tag in the Tag Configuration Editor.
Name Displays the name of the currently selected tag. Use this display to select and
copy the tag name and paste it into your HMI diagram.
Description Displays the description field for the currently selected tag.
Type Displays the type of the currently selected tag: analog, discrete bit array, or
string.
Access Displays the access rights for the currently selected tag: Memory, Input,
Output, or Input/Output.
Group Displays the group to which the selected tag belongs. If this field is blank, the
tag does not belong to a group.
Server Displays the name of the server connected to the currently selected tag.
If the tag is a memory tag, no server is associated with it.
I/O Group Displays the name of the I/O group for the currently selected tag. If the tag is
a memory tag, no server or I/O group is associated with it.
Item Displays the name of the item connected to the selected tag. If the tag is a
memory tag, no server, I/O group, or item is associated with it.
Alarms Enabled Displays whether alarms are enabled for the selected tag.
Auto Ack Displays whether alarms for the selected tag are acknowledged automatically .
Full Scale Displays the full scale engineering value for the tag. This is displayed for
analog tags only.
© National Instruments Corporation 2-17 BridgeVIEW User Manual
Page 52

Chapter 2 BridgeVIEW Environment
Table 2-3.
Field Description
Zero Scale Displays the zero scale engineering value for the tag. This is displayed for
analog tags only.
Units Displays the engineering unit for the tag. This is displayed for analog tags
only.
If the BridgeVIEW Engine is loaded, you can view the tags currently
loaded with the T ag Bro wser. If the BridgeVIEW Engine is not loaded, the
Tag Browser displays the currently loaded
button to change the
The Tag Browser is a useful tool if you need to look at how a tag is
configured while you are building your MMI VIs. You also can use the
Tag Browser to change the loaded configuration file.
If you want to access the configuration information for a tag
programmatically, you can use the VIs in the Tag Attributes palette.
For more information about the Tag Attributes VIs, refer to Appendix A,
HMI Function Reference.
Tag Browser Field Descriptions (Continued)
.scf
.scf
file.
file. Use the Browse…
What Is the Tag Monitor?
With the Tag Monitor, you can monitor the value, unit, timestamp, alarm
state, and status for selected tags in the system, as well as write the value to
an output or input/output tag. You launch the Tag Monitor by selecting
Project»Tag»Monitor. When you first launch the Tag Monitor, a tag
selection dialog box displays all the tags configured in the currently
selected tag configuration file. For more information about configuring
tags, refer to Chapter 3, Tag Configuration.
Figure 2-5 shows the Tag Monitor.
BridgeVIEW User Manual 2-18 © National Instruments Corporation
Page 53

Chapter 2 BridgeVIEW Environment
Note
Figure 2-5.
Tag Monitor Utility
Selecting the Tag Monitor from the Project menu automatically launches the
BridgeVIEW Engine if it is not running already.
T ag information is shown in a table format, sorted b y tag name. When a tag
has a non-zero tag status, the Status column indicates if the tag status is
Warning
or
Error
.
Table 2-4 describes the fields and captions in the Tag Monitor Utility.
© National Instruments Corporation 2-19 BridgeVIEW User Manual
Page 54

Chapter 2 BridgeVIEW Environment
Table 2-4.
Tag Monitor Utility Field Descriptions
Field Descriptions
Tag Display Table Alphabetically lists the information for tags you have selected, including the
value, units, timestamp, status, alarm state and error, if any. For writable
tags, which have a yellow background, clicking on the tag's value field
brings up the Write to Tag dialog box, that lets you specify a new value for
that tag. For bit array tags, the radix of the input value must be the same as
that of the tag's value field in the Tag Display Table. Click OK to write the
value in Value to Input and exit the dialog box. Click Apply to write the
value in Value to Input and keep the dialog box open.
Trigger Tag Displays which tag, if any, you have selected to trigger refreshing of the Tag
Display Table. If you selected a tag to trigger refreshing of the Tag Display
Table, the display refreshes when that tag changes value in the database, or
the monitor timeout period is exceeded, whichever occurs first.
Monitor Timeout
(sec)
Displays the time interval in seconds that the Tag Display Table is
configured to refresh or update. If no trigger tag is selected, the display
updates at this time interval. Otherwise, the Tag Display Table refreshes
when the tag changes or the timeout interval is exceeded, whichever
occurs first.
Status Details Brings up the Status Details dialog box, shown in Figure 2-6, that displays
a summary of the status for each tag in the system.
Select Tags to
Monitor
Brings up the Select Tags to Monitor dialog box, shown in Figure 2-7, that
lets you select which tags to monitor and configure how often to refresh the
monitor display.
The Status Details dialog box, shown in Figure 2-6, displays a summary
of the status for each tag in the system. Tags that have a warning are
highlighted in blue, and tags in error are red. BridgeVIEW provides a
description of the error or warning when possible. Internal codes are
reported by BridgeVIEW; the Server Code is returned by the server
of the tag. Clicking on Status Details is equivalent to selecting
Tag Monitor»Status Details….
BridgeVIEW User Manual 2-20 © National Instruments Corporation
Page 55

Chapter 2 BridgeVIEW Environment
Figure 2-6.
Status Details Dialog Box
With the Select Tags to Monitor dialog box, shown in Figure 2-7, you can
select which tags to monitor and configure how often to refresh the monitor
display. The Available T ags list box sho ws the tags not displayed in the Tag
Display Table. By default, the timeout is set to 1.00 second. This controls
how often the T ag Display Table is refreshed. By default, no tag is selected
to trigger a refresh of the T ag Display Table. Y ou can select a tag to trigger
a refresh of the T ag Display T able from the T rigger T ag Ring. Then, the Tag
Display Table refreshes each time that tag is updated in the database, or
when the timeout interval elapses, whichever occurs first. Clicking on
Select Tags to Monitor is equal to selecting Tag Monitor»Select Tags….
Figure 2-7.
© National Instruments Corporation 2-21 BridgeVIEW User Manual
Select Tags to Monitor Dialog Box
Page 56

Chapter 2 BridgeVIEW Environment
Select Tag Monitor»Preferences to bring up the Tag Monitor
Preferences dialog box, shown in Figure 2-8, which lets you choose how
certain types of tags are displayed. You can control how the displayed
precision for analog tags by modifying the Digits of Precision field. For bit
array tags, the values can be in binary, octal, or hexadecimal format. The
possible values for discrete tags can be 0 and 1 corresponding to Numeric
Value; or a set of user-customizable strings, one equivalent to TRUE and
the other to F ALSE. Check the Monitor Same Tags in Next Session check
box to keep the same tag list for the next time you launch the Tag Monitor.
Figure 2-8.
BridgeVIEW User Manual 2-22 © National Instruments Corporation
Tag Monitor Preferences Dialog Box
Page 57

How Do You Access Online Help?
Choose Help»Show Help. When you place one of the tools on a subVI
node, the Help window shows the icon for the subVI with wires attached
to each terminal. The following illustration shows an example of online
help. This is the Acknowledge Alarm VI from the Functions»Alarms &
Events subpalette.
Chapter 2 BridgeVIEW Environment
Simple/Complex Help View
In the Help window, you can specify whether you want to display the
simple or complex view for block diagram objects.
Note
© National Instruments Corporation 2-23 BridgeVIEW User Manual
When you open the Help window, BridgeVIEW automatically defaults to the
simple help view.
In simple help view, BridgeVIEW displays only the required and
recommended inputs for VIs and functions. In complex help view,
BridgeVIEW displays the required, recommended, and optional inputs
for VIs and functions. It also displays the full path name of a VI.
To access the simple help view, press the Simple/Complex Diagram
Help switch or choose Help»Simple Help.
Page 58

Chapter 2 BridgeVIEW Environment
In the Help window, requ ired inputs appear in bold text, recommended
inputs appear in plain text, and optional inputs appear in gray text.
When designing your own VIs, you can specify which inputs are required,
recommended, or optional by popping up on an input or output on the
connector pane and selecting the correct option from the
This Connection Is submenu.
Links to Online Help Files
In the Help Window, you can click on the Online Help button to access
BridgeVIEW online help as well as help files you have created using a
help compiler. For more information on creating help files, see the section
Creating Your Own Help Files, in Chapter 5, Printing and Documenting
VIs in G, in the G Programming Reference Manual.
BridgeVIEW User Manual 2-24 © National Instruments Corporation
Page 59

Tag Configuration
This chapter describes tags, the Tag Configuration Editor, how
you edit tags within the BridgeVIEW system, and includes an activity that
illustrates how to use the Tag Configuration Editor. Before you can run a
BridgeVIEW application, you must specify a tag configuration.
What Is a Tag?
A tag is a data value in the BridgeVIEW Engine. Tags can be used to
monitor an I/O point, to store a result of a calculation based on other tags,
or to monitor a tag on another BridgeVIEW Engine. A memory tag is a tag
used for user-specified calculations, and a network tag is a tag remotely
connected to any type of tag on another BridgeVIEW Engine.
This section defines a tag in terms of its attributes and describes how tag
attributes affect Engine operations. You can define and configure tags with
the Tag Configuration Editor, described later in this chapter.
Tag Attributes
The BridgeVIEW Engine manages the Real-Time Database (RTDB) which
contains information about all the tags in the system. The Engine handles
the following tasks:
• Communicates with device servers or other BridgeVIEW Engines
• Scales tag values
• Tracks alarms and events associated with tags, system errors and
events
• Logs tag values, alarms, events and system messages to disk
3
You can customize these tasks by configuring each tag with the Tag
Configuration Editor. The Tag Configuration Editor displays five
categories of attributes for each tag: general information, connection,
operations, scaling, and alarms.
Operations, scaling, and alarms attributes describe how the Engine handles
a tag’s data. Each attribute can be further classified by the effect on a
running Engine from changing the attribute.
© National Instruments Corporation 3-1 BridgeVIEW User Manual
Page 60

Chapter 3 Tag Configuration
General Attributes
General attributes include data type, maximum length for string and bit
array tags, and the name, description, and tag group of the tag. The
BridgeVIEW system supports four types of tags: analog, discrete, string,
and bit array. These types differ by the inclusion of attributes within the
operations, scaling, and alarm categories. The tag type is fixed when it is
created. You must use the tag name to identify a particular tag. For
information on how to configure the general attribute of a tag, see the
General section later in this chapter.
Connection Attributes
I/O connection attributes describe where the Engine sends or receives
values for the tag and how to access that data. These tags have access rights
of input, output or input/output. To configure the I/O connection attributes
of a tag, refer to the Connection section later in this chapter.
Memory tags are not connected to a real world I/O point. Memory tags
provide more complex monitoring, alarming, or control. For more
information about memory tags, see the What Is a Memory Tag? section
later in this chapter.
Operation Attributes
Operation attributes describe additional functionality that the Engine
performs on a tag or its values. These operations include tasks such as
setting initial values and enabling logging operations. To configure
the operation attributes of a tag, refer to the Operations section later in
this chapter.
Scaling Attributes
Scaling attributes describe what linear scaling function is applied to a tag's
value. Scaling is useful for converting the range of values from measured
units into a calculated range. Only analog (numeric) and Bit Array tags
have Scaling attributes. To configure scaling attributes of a tag, see the
Scaling section later in this chapter.
BridgeVIEW User Manual 3-2 © National Instruments Corporation
Page 61

Alarm Attributes
Alarm attributes describe abnormal process conditions for a given tag.
Alarms are useful for notifying users of abnormal conditions. For example,
if an analog tag measures the volume of a tank, a HI alarm can be used to
indicate that the tank is full and an operator must perform some action
and acknowledge this state before processing can proceed. For information
on how to configure alarming attributes of a tag, see the Alarms section
later in this chapter.
Static vs. Dynamic Attributes
Tag attributes are classified as either static or dynamic attributes. Static
attributes require you to restart the Engine when you change them from
the Tag Configuration Editor. A static attribute change is marked with
a solid diamond in the Tag Configuration Editor. Examples of static
attributes are general attributes and I/O connection attributes, such as
server, device, or item.
Dynamic attributes do not require the Engine to restart. The Tag
Configuration Editor can change a dynamic tag attribute in a running
Engine. A dynamic attribute change is marked with a hollow diamond in
the Tag Configuration Editor. Examples of dynamic attributes include
enabling logging operations, alarm attributes, and some scaling attributes.
For more information about dynamic tag attributes, see the Tag Attributes
VIs section of Chapter 7, Advanced Application Topics.
Chapter 3 Tag Configuration
What Is the Tag Configuration Editor?
The Tag Configuration Editor is a tool that assists you in configuring all
the parameters of the BridgeVIEW Engine. The chief component of this
tool is the configuration of all tags in the system. Other configuration
components include Alarm and Event Logging, and Historical Logging.
To start the Tag Configuration Editor, select Project»Tag»
Configuration… from the menu bar of an open VI. Figure 3-1 shows
the Tag Configuration Editor with
© National Instruments Corporation 3-3 BridgeVIEW User Manual
tanks.scf
loaded.
Page 62

Chapter 3 Tag Configuration
Figure 3-1.
Tag Configuration Editor
The Tag Configuration Editor records all tag information and Engine
parameters and stores this information in a BridgeVIEW Configuration
File with the extension
.scf
(SCADA Configuration File). The
BridgeVIEW Engine reads this file to determine all of the configuration
parameters for execution. With the Tag Configuration Editor, you can
specify the following:
• Tags used in the system
• File paths for historical data and event logging
The
.scf
file does not contain any information about the VIs in your
HMI. In fact, it is not specific to a single user application. Multiple user
applications can run concurrently as long as they use the same set of tags.
When you launch the Tag Configuration Editor, the last opened
.scf
opens automatically.
Note Only one .scf file can be loaded and running in the BridgeVIEW Engine
at a time.
If you edit a
.scf
file while the Engine is running and select Save or
Save As…, a dialog box confirms if you want to update the Engine
with your latest changes. If you want to update the Engine and any static
attributes have been changed, the Engine shuts dow n and restarts. If you
have changed only dynamic attributes in the
.scf
file, the Engine is
updated without restarting.
file
BridgeVIEW User Manual 3-4 © National Instruments Corporation
Page 63

Chapter 3 Tag Configuration
Note Communication between the BridgeVIEW Engine and any device server is
stopped temporarily when the Engine shuts down and restarts.
How Do You Create a Tag?
From the main panel of the Tag Configuration Editor, press one of the
following buttons: Create Analog Tag(s)…, Create Discrete Tag(s)…,
Create String Tag(s)…, or Create Bit Array Tag(s)…. A separate
window prompts you to define a new tag. The tag name must be unique
within a given configuration (
when you finish creating the new tag, or Create New Tag to finish creating
the new tag and create another tag of the same type. Any changes are not
written to disk until you select Save from the File menu. For step by step
instructions on using the Tag Configuration Editor to create a tag, see
Activity 3-1, later in this chapter.
.scf
) file. Select OK on the pop-up window
How Do You Edit a Tag?
From the main panel of the Tag Configuration Editor, select one or more
tags from the tags listed and press the Edit Tag(s)... button. A separate
window displays the attributes for the tags you select, which you can then
edit. When you finish editing a tag, select OK to save your changes and
return to the main panel, Edit Next Tag to save your changes and go on
to the next tag, or Cancel to discard your changes and return to the main
panel. Selecting Cancel only cancels the changes made to the current tags.
Any changes you make are not permanent until you save the configuration
file.
You also can use a spreadsheet to edit multiple tags. Use File»Export… to
export the tag information to a spreadsheet file, edit the fields, and then use
File»Import… to import the tag configuration information from the edited
spreadsheet file. For more information, see the section How Do You Use
Spreadsheet Files for Tag Configuration? in this chapter.
How Do You Delete a Tag?
To delete a tag from a configuration, select the tag(s) from the main panel
of the Tag Configuration Editor and press the Delete Tag(s) button, and
then save the SCF. Tags that will be deleted when you save the SCF are
marked with a trashcan symbol. The Delete Tag(s) button also serves as an
Undelete Tag(s) button if all selected tags have a trash can symbol. If you
decide you want to keep one or more deleted tags, select those tags and
press the Undelete Tag(s) button.
© National Instruments Corporation 3-5 BridgeVIEW User Manual
Page 64

Chapter 3 Tag Configuration
Note If you delete a tag and save the .scf file, the tag and its configuration information
are removed from the
.scf file. You still can retrieve historical and event
information about the tag, but information such as the tag description, units,
range, and alarm settings is lost.
What are Network Tags?
BridgeVIEW makes it easy to create distributed applications so more than
one computer can be involved in an HMI application.
A BridgeVIEW server is a computer that allows tags configured in the
current
via a network. The server machine may or may not have an HMI running
on it. In order for a machine to function as aBridgeVIEW server, the
Engine must use an
enabled.
A BridgeVIEW client is a computer that gets its data through tags from one
or more BridgeVIEW servers. Tags remotely accessed from BridgeVIEW
servers are network tags. An
network tags from multiple BridgeVIEW servers. However, a BridgeVIEW
client
machine.
.scf
file to be accessed by other machines connected to the server
.scf
file that has the Allow Network Access option
.scf
file for a BridgeVIEW client can have
.scf
can import network tags from only one
.scf
file per server
A BridgeVIEW server can also act as a client and get its data from other
BridgeVIEW server machines, as shown in the illustration below.
BridgeVIEW Servers
BridgeVIEW
Server/Client
BridgeVIEW Clients
Figure 3-2.
BridgeVIEW User Manual 3-6 © National Instruments Corporation
Flowchart of Server/Client Interaction
Page 65

How Do You Add Network Tags?
On the BridgeVIEW server, all tags in an allowed
by another BridgeVIEW system by opening the Tag Configuration Editor
and selecting Configure»Allow Network Access. The tags are not shared
until the
On the BridgeVIEW client, open the Tag Configuration Editor and select
File»Import Network Tags…. The Select Tags for Network Import
dialog box, shown in Figure 3-3, allows you to browse the network for an
.scf
wish to import, save the
BridgeVIEW Engine.
.scf
file is saved on the server side.
file and select tags you wish to import. After selecting the tags you
Chapter 3 Tag Configuration
.scf
file can be viewed
.scf
file on the BridgeVIEW client and start the
Figure 3-3. Select Tags for Network Import Dialog Box
How Do You Set Default Values for Tag Configuration Fields?
You can simplify the tag configuration process by defining default
values for several fields. These default values are then used when you
create tags automatically, such as with the Configuration Wizard or by
importing. For example, you might want to set the default to Log Data
or Log Events, or set the log deadband to a particular value by default.
You can set default values for tag parameters using the Set Default
Parameters dialog box, shown below. To access this dialog box,
select Configure»Default Parameters….
© National Instruments Corporation 3-7 BridgeVIEW User Manual
Page 66

Chapter 3 Tag Configuration
The default values apply when creating a new tag, importing a tag from
the server registry, or importing a tag from a spreadsheet. In the case of
spreadsheet, a value in the spreadsheet ove rrides the default value for
the field. For more information about the individual fields, see the How Do
You Configure Tags? section in this chapter.
How Do You Use Spreadsheet Files for Tag Configuration?
With the Tag Configuration Editor, you can export tag configuration
information to spreadsheet files, and import tag configuration information
from spreadsheet files. The files are tab-delimited text (
Select File»Export… to save the file as a tab-delimited
you select Export…, a dialog box prompts you to select and order the
fields you want in your spreadsheet file. If you intend to edit the
spreadsheet file and then import the edited information back into the Tag
Configuration Editor, select the All>> butto n to select all available fields.
BridgeVIEW User Manual 3-8 © National Instruments Corporation
.txt
.txt
) files.
file. When
Page 67

Chapter 3 Tag Configuration
For easy viewing and editing in the spreadsheet, press the
Use Default Order button.
After you edit the file, save it as a
.txt
file. Then, from the Tag
Configuration Editor, select File»Import… to import the information
from the spreadsheet file.
If you use spreadsheet files with the Tag Configuration Editor, it is
important that you understand the following points:
• If you do not choose all of the fields when exporting your data, you
lose configuration information when you import it back to the Tag
Configuration Editor.
• You might choose to export a subset of information, and then rely
on tag default parameters when you import the data back in to the
Configuration Editor. However, each row in the spreadsheet file must
contain the tag name and data type fields, or the import mechanism
cannot read it.
• Some configuration parameters, such as Historical Logging
Configuration and Event Configuration, are inherited from the
currently open
.scf
file when you import spreadsheet data.
• When importing, you can append the imported tags to the current
.scf
file.
Note If the tag name and data type fields are missing, the File»Import… option does
not work on the spreadsheet file.
© National Instruments Corporation 3-9 BridgeVIEW User Manual
Page 68

Chapter 3 Tag Configuration
How Do You Configure Tags?
When you configure a tag with the Tag Configuration Editor, you define
several attributes for the tag. You can separate these attributes into five
categories: general, connection, operations, scaling, and alarms. Each of
these categories is explained in detail later in this section.
If you import tag configuration information from a spreadsheet, follow
thesame format in your spreadsheet as indicated in the Attribute column
ofeach of the tables listed above. For more information about using
spreadsheets, see the How Do You Use Spreadsheet Files for Tag
Configuration? section in this chapter.
Data Type
Configuration of a tag varies slightly depending on the data type.
Thefollowing sections discuss the details of tag configuration for each
datatype.
Analog Tags
An analog tag is a continuous value representation of a connection to
areal-world I/O point or memory variable. This type of tag can vary
continuously over a range of values within a signal range.
Use an analog tag when you want to express a continuous value
(forexample, 0 to 100).
Discrete Tags
A discrete tag is a two-state (ON/OFF) value representation of a
connection to a real-world I/O point or memory variable. This type of
tagcan be either a 1(TRUE) or a 0(FALSE).
Use a discrete tag when you want to express a two-state (ON/OFF) value.
Bit Array Tags
A bit array tag is a multi-bit value representation of a connection to a
real-world I/O point or memory variable. This type of tag can be comprised
of up to 32 discrete values.
Use a bit array tag when you have a multi-bit value in which each of the
bitsrepresents a flag or single value that is turned on or off. The maximum
length of a bit array tag is 32.
BridgeVIEW User Manual 3-10 © National Instruments Corporation
Page 69

General
Chapter 3 Tag Configuration
String Tags
A string tag is an ASCII character representation of a connection to a
real-world I/O point or memory variable.
Use a string tag when you have binary information or an ASCII value.
Forexample, you might use a string tag to obtain values from a bar code
reader, or if you have data that does not fit into any other data type.
The general attributes of a tag include the name of the tag you are
configuring, the group name to use for the tag, a description of the tag,
andthe maximum length for string and bit array tags. Figure3-4 shows
theGeneral tab of the Tag Configuration dialog box.
Figure 3-4.
Table3-1 provides descriptions of the general attributes of a tag.
Fortagattribute information about the other configuration categories,
seeTables3-2,3-4,3-5, and3-7.
© National Instruments Corporation 3-11 BridgeVIEW User Manual
General Attributes Dialog Box
Page 70

Chapter 3 Tag Configuration
Table 3-1. General Configuration Attributes
Applies to
Attribute
Data Types
Description
Tag Name all Determines the name of the tag you are configuring. Always refer
to a tag by its name. Tag names are not case sensitive and can
include any combination of printable characters (including
space) with the exception of “/” (forward slash) and “\”
(backslash).
Tag Group all Determines the group name to use for this tag. You can use
groups to assist in alarm management and reporting and to help
organize tags in an application.
Tag
all Provides a description of the tag.
Description
Maximum
Length
string,
bit array
Determines the maximum number of bits in the bit array.
The length is between 1 and 32 for bit array tags. String tags
can be of any length.
Connection
You associate a tag with its real-world I/O point by assigning it a
I/O Group
, and
Item
in the
Connection
tab of the Tag Configuration
dialog box, shown in Figure 3-5. If an I/O Group does not already exist for
the server, you must create one before you can select or enter an item for
the tag. The I/O Group is user-defined and provides you with a place to
configure the rate and deadband for an item. For IAK and VI-based servers,
you select the device as part of the I/O group configuration. For OPC
servers, the I/O group conforms to an OPC group.
Server
,
When you edit a tag, use the ring inputs to assign values to the tag. Use the
Create…, Edit…
For more information about device servers, see Chapter 8,
BridgeVIEW User Manual 3-12 © National Instruments Corporation
, and
Delete
buttons to configure I/O Groups and Items.
Servers
.
Page 71

Chapter 3 Tag Configuration
Figure 3-5.
Tag Connection Dialog Box
If a device server does not appear in the server name list, you must run the
configuration or registration utility for your server before BridgeVIEW can
access the server.
Table 3-2 provides descriptions of the connection attributes, and indicates
the data types to which each attribute applies. For ta g attrib ute information
about the other configuration categories, see Tables 3-1, 3-4, 3 -5, or 3-7.
© National Instruments Corporation 3-13 BridgeVIEW User Manual
Page 72

Chapter 3 Tag Configuration
Table 3-2. Connection Configuration Attributes
Applies to
Attribute
Data Types
Description
Data Type all Determines the data type of the tag you are configuring.
BridgeVIEW tags can be analog, discrete, bit array, or string.
Tag Access all Determines the access rights for a tag. Tags can have access
rights of Memory, Input only, Output only, or Input/Output.
Memory tags are not directly connected to real-world I/O points.
You can use memory tags to monitor and control calculated
values and enable historical trending and alarming on these
values. Input only, Output only, and Input/Output tags are
connected to real-world I/O points according to the Server,
Device, and Item fields.
Server all Determines the device server that manages the communication of
the tag value. If the tag is a memory tag, this attribute is not used.
I/O Group all Determines the I/O Group to use for this tag. Select the I/O Group
this tag uses. The I/O Group is associated with the server . At least
one I/O Group must be created for the server in order to configure
a tag to use a server item. If the tag is a memory tag, this attribute
is not used.
Item Name
Filter
all Determines the string to filter the list of configured items. If the
tag is a memory tag, this attribute is not used.
Item all Determines the register, channel, or item on the device for this
tag. This might be a PLC register, a data acquisition channel, an
OPC item ID, or a DDE item, depending on the server used for
this tag. If the tag is a memory tag, this field is not used.
Access Path all Determines the access path for the selected server. If the tag is a
memory tag or if the server does not have access paths, this
attribute is not used.
I/O Group Configuration
I/O Groups are used to configure item rate and deadband for items of a
server and to select a specific device, if the server uses devices. For servers
that support resource configuration, you also can use I/O groups to
configure devices and communication resources. For OPC servers, an I/O
group conforms to the concept of an OPC group, which is user-defined and
controls timing. An I/O Group is associated with only one server and, if that
BridgeVIEW User Manual 3-14 © National Instruments Corporation
Page 73

Chapter 3 Tag Configuration
server uses devices, with only one device. A server can have multiple I/O
Groups associated with it.
I/O Group Configuration Options
The Create… button invokes the I/O Group Configuration dialog box,
which you can use to specify group name and timing parameters. For
servers that support resource configuration, you also can use this dialog box
to select and configure devices and to configure communication resources.
The Edit… button invokes the I/O Group Configuration dialog box for
the I/O Group selected in the I/O Group list. Use this dialog box to change
the group name and timing parameters. For servers that support resource
configuration, you also can use this dialog box to select and configure
devices and to configure communication resources.
The Delete button invokes a confirmation dialog box. If confirmed,
the I/O Group is deleted from the server configuration. Deleting an
I/O Group does not delete the device and communication resource
from the server configuration.
Figure 3-6.
© National Instruments Corporation 3-15 BridgeVIEW User Manual
I/O Group Configuration Dialog Box
Page 74

Chapter 3 Tag Configuration
T able 3-3 provides descriptions of the operations that can be performed on
an I/O Group. For information about other opeations that can be performed
on an I/O Group, see Tab le 3-2.
Table 3-3.
I/O Group Configuration Attributes
Attribute
Description
I/O Group Name Determines the name of the I/O Group you are configuring. I/O Group
names are not case sensitive and can include any combination of
printable characters (including spaces) with the exception of “/”
and “\”.
I/O Group Description Provides a description for the I/O Group.
I/O Group
Update Rate (secs)
Determines the rate for the server to update the item value in the
engine for all tags using the I/O Group. The server can have other
configuration options that determine the actual update rate. This is
the rate at which BridgeVIEW requests all tags configured with this
update rate be updated.
I/O Group Deadband
(% of range)
Determines the deadband for the server to update the item value in the
engine for all tags configured with the I/O Group. Use 0% if you do
not want the server to apply deadbands to the item.
Not all servers support deadbands, and some
Note
might ignore this value.
Server Name Indicates the Server Name associated with the I/O Group you are
configuring.
Communication Resource Provides a means to configure (create, edit, or delete) a
communication resource. This field is valid only for IAK servers.
Device Determines a specif ic device used by the I/O Group and Serv er for this
tag. If the associated server is an OPC Server, this attribute is not used.
Device Comm Resource Indicates the communication resource associated with the selected
device. This field is valid only for IAK servers.
Server Configuration Options
Use this group of fields to configure and select server resources. Some
or all fields in this group might not be used depending on the server
type. An IAK server has both Device and Communication Resource
configuration capabilities.
BridgeVIEW User Manual 3-16 © National Instruments Corporation
Page 75

Chapter 3 Tag Configuration
Communication Resource Configuration Options
For IAK servers, use the Create… button to invoke a new, untitled
IAK Create Communication Resource Configuration dialog box.
This configuration option is not used for other classes of servers.
For IAK servers, use the Edit… button to invoke the IAK Edit
Communication Resource dialog box for the currently selected
communication resource. This configuration option is not used
for other classes of servers.
For IAK servers, use the Delete button to remove the selected
communication resource from the server configuration. This
configuration option is not used for other classes of servers.
Device Configuration Options Configuring Device Names
This option is available for servers that allow users to configure device
names. OPC Servers do not use device names. For DDE Servers, the
device name is used to specify the DDE application and topic. See the How
Do You Connect a Tag to a DDE Server? section in this chapter for more
information.
The Add… button invokes the Device Entry dialog box, which you can
use to add a new device name for a selected server. If the server does not
support device configuration, or if the selected device name is not valid,
this button is disabled.
The Edit… bu tton inv okes the Device Entry dialog box, which you can use
to edit an existing device name for a selected server. If the server does not
support device configuration, or if the selected device name is not v alid, this
button is disabled.
The Delete button invokes a confirmation dialog box. If confirmed,
the selected device name is removed from the device list. If the serv er does
not support device configuration, or if the selected device name is not valid,
this button is disabled.
Device Configuration Options Configuring Device Resources
This option is supported by servers that allow users to configure
device resources.
Use the Create… button to invoke a new, untitled Create Device
Configuration dialog box. The options in this dialog box vary depending
on the type of server. If the server does not support device configuration,
this button is disabled.
© National Instruments Corporation 3-17 BridgeVIEW User Manual
Page 76

Chapter 3 Tag Configuration
Use the Edit… button to inv ok e the Edit Device Configuration dialog box
for the device currently selected in the device list. The options in this dialog
box vary depending on the type of server. If the server does not support
device configuration, this button is disabled.
Use the Delete button to remove the selected device from the server
configuration. If the server does not support device configuration,
this button is disabled.
Item Configuration
Use the Item Connection fields in the Connection tab (see Figure 3-5)
to select and configure the item and access path (for certain OPC Servers
only) for a tag.
Item Configuration OptionsConfiguring Item Names
This option is available for servers that allow users to configure
item names.
The Add… button in vo kes the Item Entry dialog box, which you can use to
add a new item for a selected server . If the server has access paths, you also
can use this dialog box to add an access path. If the server does not support
item configuration, this button is disabled.
The Edit… button invokes the Item Entry dialog box, which you can use
to edit an existing item name for a selected server. If the server has access
paths, you also can edit an access path. If the server does not support item
configuration, or if the selected item is not valid, this button is disabled.
The Delete button invokes a confirmation dialog box. If confirmed, the
selected item is removed from the item list. If the server has access paths,
the selected access path is removed from the access path list. If the server
does not support item configuration, or if the selected item is not valid,
this button is disabled.
Item Configuration OptionsConfiguring Item Resources
This option is supported by servers that allow users to configure
item resources.
The Create… b utton inv okes a server-dependent configuration dialog box,
which you can use to configure a new item for a selected server . If the server
does not support item configuration, this button is disabled.
BridgeVIEW User Manual 3-18 © National Instruments Corporation
Page 77

Chapter 3 Tag Configuration
The Edit… button invo kes a server-dependent configuration dialog box,
which you can use to edit the configuration of the selected item. If the
server does not support item configuration, or if the selected item is not
valid, this button is disabled.
The Delete button invokes a confirmation dialog box. If confirmed,
the selected item is removed from the server configuration.
The Browse… button, which only applies to OPC Servers that support
browsing, invokes the Browse OPC Server dialog box. Use this button
to browse the list of available items and select an item and associated
access path.
What Is a Memory Tag?
Memory tags are tags not connected directly to I/O points. They exist only
in the BridgeVIEW RTDB. To configure a memory tag, set the Access
Rights of a tag to Memory.
When Should You Use a Memory Tag?
Use memory tags when you want to perform alarm calculations,
or log historical data and event information on data that is either a
software-generated value or a combination of values from different
I/O tag readings. Below are some examples illustrating when to use
memory tags.
Example 1When Not to Use a Memory Tag
You do not need to use a memory tag for program variables unless you
want to use the historical and event logging or alarm management
capabilities of the BridgeVIEW Engine.
An HMI displays the trend of a temperature tag and the difference between
the current reading and a previous reading to allow operators to see the
current rate of change in the temperature value. Although the individual
values are logged for historical trends, the current difference is not.
You can configure the BridgeVIEW Engine to include the tag that reads
temperature. The block diagram of the HMI reads the tag value and passes
it to a real-time trend indicator. The dif ference between the current reading
and the previous value is calculated in the diagram and passed to a front
panel numeric indicator. The diagram retains the current temperature v alue
and uses it after taking the next reading. Because the system does not need
to perform any alarm management or historical logging based on the
difference, no memory tag is used.
© National Instruments Corporation 3-19 BridgeVIEW User Manual
Page 78

Chapter 3 Tag Configuration
Example 2When to Use a Memory Tag
A simple device server returns several items of data that, through a linear
combination of values, represent a meaningful measurement in engineering
units. The design of the device and its server software makes it difficult to
combine these values within the server to make a single tag. The value of
interest is not the individual points but the linear combination of these
I/O points. The operators need historical trends and alarm management
based on this single value.
In this situation, you can define a separate tag for each server item and a
memory tag with engineering range and units of the final measurement.
In the block diagram of the HMI VI, read individual tag values and
calculate the linear combination of values in the diagram. Write the
calculated value to the memory tag in the Real-Time Database and the
BridgeVIEW Engine performs historical logging and alarm calculations
according to the memory tag configuration.
Note
To learn more about how to build HMI VIs, refer to Chapter 4, Human Machine
Interface.
How Do You Automatically Generate
Tags from Server Information?
Use the Configuration Wizard to create tags from the server information.
The Configuration Wizard is useful if you want the BridgeVIEW Engine
to monitor a large number of the I/O points in your system. To invoke
the Configuration Wizard, press the Configuration Wizard button on the
main screen of the Tag Configuration Editor or select Edit»Configuration
Wizard…. For more information on servers, see Chapter 8, Servers.
When you run the server configuration utilities for the servers on your
system, you can define devices and items for the I/O points the servers
monitor and control. You can automatically create tags from these items
with the Configuration Wizard. When the tags are created, the tag name,
data type, I/O group, I/O connection, and scaling parameters are
determined by the server information for each server item. The remaining
tag parameters are determined by the default tag parameter settings. You
can edit the default parameters by selecting opening the Tag Conf iguration
Editor and selecting Configure»Default Parameters….
For IAK and VI-based servers, server information is read from the
Common Configuration Database (CCDB). For OPC servers that support
it, server information is read by browsing the server address space. When
you generate tags, you can either add them to the existing configuration by
BridgeVIEW User Manual 3-20 © National Instruments Corporation
Page 79

Chapter 3 Tag Configuration
selecting Append Tags to SCF? (default mode) or you can create a new
configuration file.
How Do You Connect a Tag to an OPC Server?
You connect to an OPC server just like you connect to the National
Instruments device servers from the Connection tab of the Tag
Configuration dialog box. Any OPC servers installed on your machine
are listed in the server name list. Select the OPC server you want to use.
Create an I/O Group for the server, specifying the group deadband and
update rate. Select or enter the Item name, which is the same as the OPC
Server Item ID. You also can select or enter an access path for OPC servers
if the server supports that.
How Do You Connect a Tag to a DDE Server?
Although no BridgeVIEW servers are based on Dynamic Data
Exchange (DDE), you can connect a tag to any existing DDE Server.
Select DDE Server as your server in the Connection tab of the Tag
Configuration Editor to communicate with DDE servers. DDE Servers
have an Application Name, Topic, and Item. In BridgeVIEW, the device
in the I/O Group Configuration dialog box is set to
(| = the “pipe” symbol) and the item in the Connection tab of the
Tag Configuration dialog box is set to
a tag to cell
R1C1
(item) of spreadsheet
item
sheet1
(application), set the tag fields to the following:
appname|topic
. For example, to connect
(topic) in Excel
Server:
Device: Excel|sheet1
Item:
To specify a particular sheet (
(
Device:
DDE Server
R1C1
book1.xls
), set the device field to the following:
Excel|[book1.xls]sheet1
(in I/O Group Configuration dialog box)
sheet1
) within an open Excel file
(in I/O Group Configuration
dialog box)
How Do You Define a Group of Tags for Alarming?
While editing a tag, pull down the Tag Group Ring in the General tab of
the Tag Configuration dialog box. You can select an existing tag group or
define a new tag group by selecting Enter New…. To create, edit, or delete
tag group definitions, select Tag Groups… from the Configure menu
from the main Tag Configuration Editor panel.
© National Instruments Corporation 3-21 BridgeVIEW User Manual
Page 80
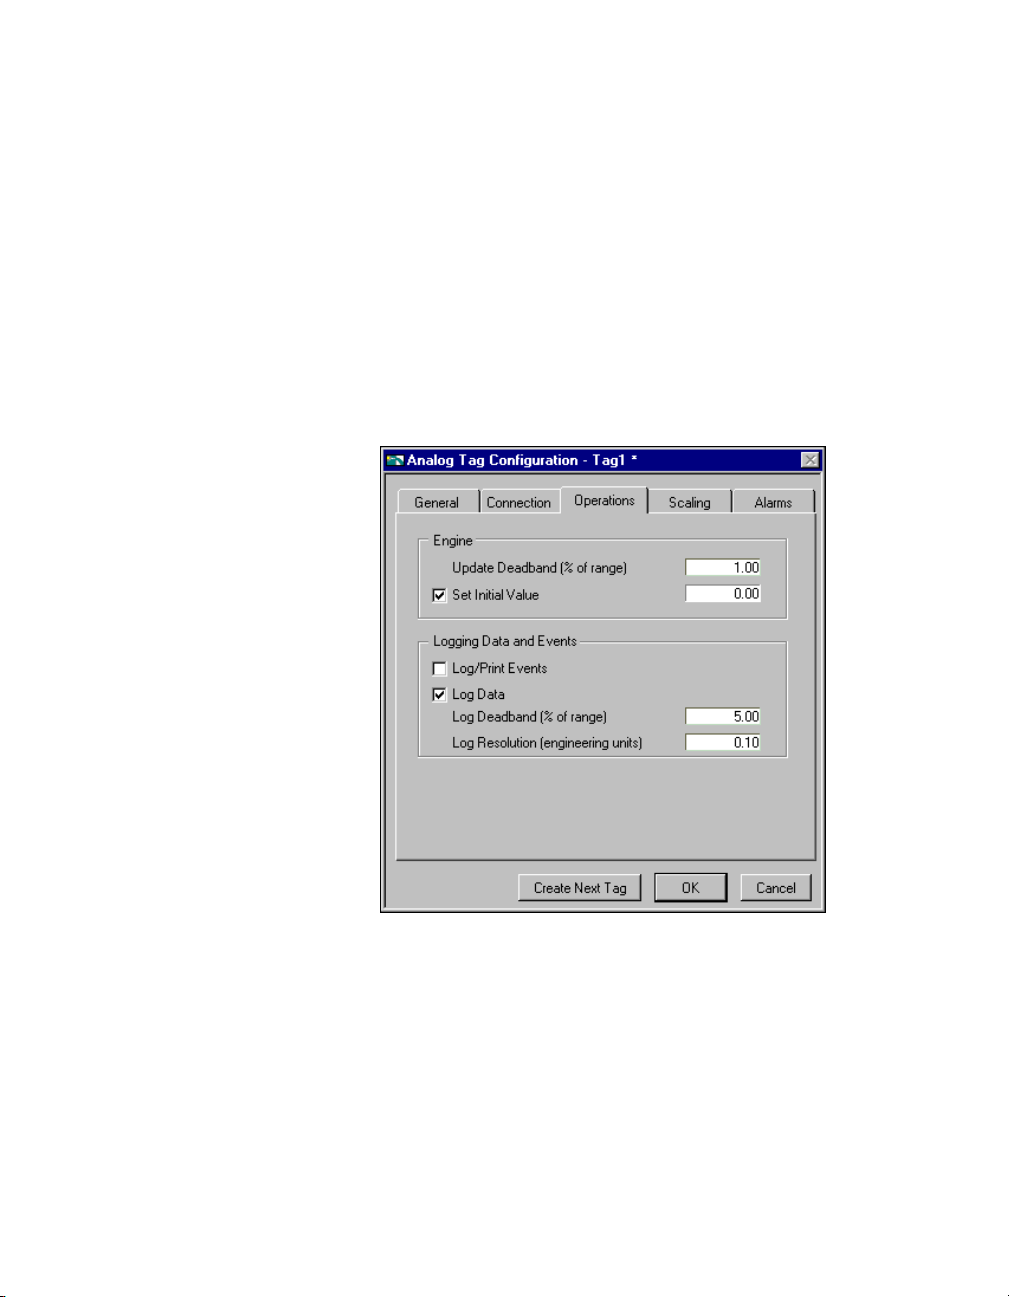
Chapter 3 Tag Configuration
Operations
You can use tag groups to help define a subset of tags in the system.
Tag groups are helpful when you want to examine the alarm states for a
subset of tags in the system. See Chapter 5, Alarms and Events, for more
information on alarm groups.
The operations attributes include when to update the tag value in the
RTDB, whether to log data to a historical file, whether to log events
associated with the tag, and information about the initial value of the tag at
Engine startup. Figure 3-7 shows the Operations Tab of the Analog Tag
Configuration dialog box. With this section of the dialog box, you can
inform the BridgeVIEW Engine of what to do with the data in the RTDB.
Figure 3-7.
Tag Operations Dialog Box
Table 3-4 provides descriptions of the operations attributes, and indicates
the data types to which each attribute applies. For ta g attrib ute information
about the other configuration categories, see Tables 3-1, 3-2, 3 -5, and 3-7.
BridgeVIEW User Manual 3-22 © National Instruments Corporation
Page 81

Chapter 3 Tag Configuration
Applies to
Attribute
Update
Data Types
all Determines when the Real-Time Database (RTDB) updates the
Deadband
Log Data analog,
discrete,
bit array
Log Data
Deadband
analog,
discrete,
bit array
Table 3-4.
Operations Configuration Attributes
Description
value for this tag. It is used to improve system performance and
prevent unnecessary processing of tag values in the RTDB. The
field is expressed differently for analog, discrete, string, and bit
array tags. For analog tags, Update Deadband is a percent of full
scale. The database updates analog tags only when a new tag
value is different than the currently stored value by at least the
Update Deadband. Use 0% if you want each ne w value for the tag
to be saved in the RTDB. For discrete, string, and bit array ta gs,
Update Deadband is expressed as either
Always
or
Determines whether a tag value is logged to historical files.
Determines when tag values are logged to disk. It is used to
improve system performance and prevent unnecessary logging
of data to disk. Like Update Deadband, the field is expressed
differently for analog, discrete, and bit array tags. For analog
tags, Update Deadband is a percent of full scale. The
BridgeVIEW Engine writes new analog tag values to historical
files only when a new tag value is different than the last logged
value by at least the Log Data Deadband. Use 0% if you want
each new value for the tag to be logged. For discrete and bit
array tags, Update Deadband is expressed as either
On Change
or
.
On Change
Always
.
Log
Resolution
analog Determines the resolution in engineering units for logging a tag
value in the Citadel Historical Database. T ag values are written to
the database in a compressed format with the resolution specified
by Log Resolution. Use
0.0
if you want the exact value written
to the Citadel Historical Database. Notice that logging the exact
value requires more time and disk space. The default value
0.1
is
.
Log/Print
Events
all Determines whether events associa ted with the tag (for example,
changes in alarm state) are logged to event log f iles or printed to
a line printer.
© National Instruments Corporation 3-23 BridgeVIEW User Manual
Page 82

Chapter 3 Tag Configuration
Table 3-4.
Applies to
Attribute
Set Initial
Value
Initial Value all The initial value used for this tag when Set Initial Value is ON.
Data Types
all Determines whether an initial value is used for this tag. If Set
Operations Configuration Attributes (Continued)
Description
Initial Value is OFF for this tag, the tag value is marked as
uninitialized until its value is updated.
Ifthe tag is an Output only or Input/Output tag, the BridgeVIEW
Engine sends the Initial Value to the server at Engine startup.
Ifthe tag is an Input only or Memory tag, the Initial Value is
stored in the RTDB at startup.
What Is Deadband?
In process instrumentation, deadband is the range through which an input
signal can vary without initiating an observable change in output signal.
Deadband usually is expressed in percent of full scale. Although the term
deadband generally applies only to analog tags, other tag types have a
limited type of deadband. A checkbox allows you to determine if updates
to the RTDB and historical data files should occur with any new data from
the device server or if the value has changed.
Note
The BridgeVIEW Engine performs historical logging and alarm management
operations based on new values in the RTDB. If you set the Update Deadband too
high, the RTDB might not be updated. This might result in inadequate historical
logging or alarm management.
How Do You Use Deadband to
IncreaseEngineThroughput?
The BridgeVIEW Engine uses Update Deadband and Log Deadband
values to eliminate unnecessary processing on minor data value changes.
Deadband allows you to define a significant change. The Engine ignores an
operation if the change in data is not considered significant. Deadband is
expressed as percent of full scale. For example, if the tag engineering range
is 0 to 200 liters, a deadband of 5% is 10liters. In addition, through I/O
group configuration, you can configure a server to apply a deadband to any
items associated with that I/O group. Not all servers implement deadbands.
OPC servers support deadbands.
BridgeVIEW User Manual 3-24 © National Instruments Corporation
Page 83

Scaling
Chapter 3 Tag Configuration
How Do You Configure a Tag
to Log Its Data or Events?
While editing a tag, click on the Log Data or Log/Print Events checkbox.
If you want to log historical data or events, the BridgeVIEW Engine must
have these processes enabled. To turn them on, open the Engine Manager
and turn on the processes with the panel buttons, or configure the Engine
to turn on these processes automatically at startup by selecting Configure»
Historical… or Configure»Events… from the Tag Configuration Editor.
You also can enable these parameters programmatically with System VIs
that enable event or historical data logging.
How Do You Set Initial Tag Value at Startup?
While editing a tag, select the Set Initial Value checkbox. Then enter the
initial value in the adjacent Initial Value field.
These attributes include what type of scaling to perform on a tag when
communicating with the device server and the expected engineering range
and units for the tag.
Table 3-5, provides descriptions of the scaling configuration attributes,
and indicates the data types to which each attribute applies. For tag
attribute information about the other configuration categories, see
Tables 3-1, 3-2, 3-4, and 3-7.
Table 3-5.
Applies to
Attribute
Raw Full
Scale
Raw Zero
Scale
Eng Full
Scale
© National Instruments Corporation 3-25 BridgeVIEW User Manual
Data Types
analog Determines the full scale (maximum) value used by the server
analog Determines the zero scale (minimum) value used by the server
analog Determines the full scale (maximum) value used by the
Scaling Configuration Attributes
for a tag.
for a tag.
BridgeVIEW Engine and the user application for a tag.
Engineering Full Scale must be greater than Engineering
Zero Scale.
Description
Page 84

Chapter 3 Tag Configuration
Table 3-5.
Scaling Configuration Attributes (Continued)
Applies to
Attribute
Eng Zero
Scale
Data Types
Description
analog Determines the zero scale (minimum) value used by the
BridgeVIEW Engine and the user application for a tag.
Engineering Zero Scale must be less than Engineering Full Scale.
Units analog Determines the engineering units for a tag. Examples include
degrees Celsius, liters, and kilograms.
Scaling analog,
discrete,
bit array
Determines the type of scaling algorithm to be used for a tag.
The scaling methods differ according to tag data type. You can
configure analog tags for linear or square root scaling, discrete
tags for invert scaling, or bit array tags for mask scaling. All tags
can be configured for no scaling.
Coerce analog Determines whether to coerce data so that it is valid for the target.
If scaling to output, the value must be within the raw (device
server) range. If scaling to input, the value must be within the
engineering (HMI) range.
Scaling Invert
Mask
bit array Determines which bits are inverted for a bit array tag. Bits in
the mask that are
The default mask is
1
are inverted; bits that are 0 are not inverted.
0
, indicating none of the bits are inve rted.
In bit-wise logic terminology, the Engine performs an XOR
with the Invert Mask to produce the scaled value.
Scaling Select
Mask
bit array Determines which bits are used for the bit array tag. Bits in
the mask that are
RTDB; bits that are
1
have their values passed through to the
0
are set to zero, regardless of the value
received from the server. In bit-wise logic terminology,
the Engine performs an AND with the Select Mask to
produce the scaled value.
The next sections explain how to scale data. Often your application needs
BridgeVIEW to manipulate the raw data used in the device server to put it
in a form, called engineering units, suitable for the operators. The following
sections describe the options for individual data types.
Note There is no scaling for string tags.
BridgeVIEW User Manual 3-26 © National Instruments Corporation
Page 85
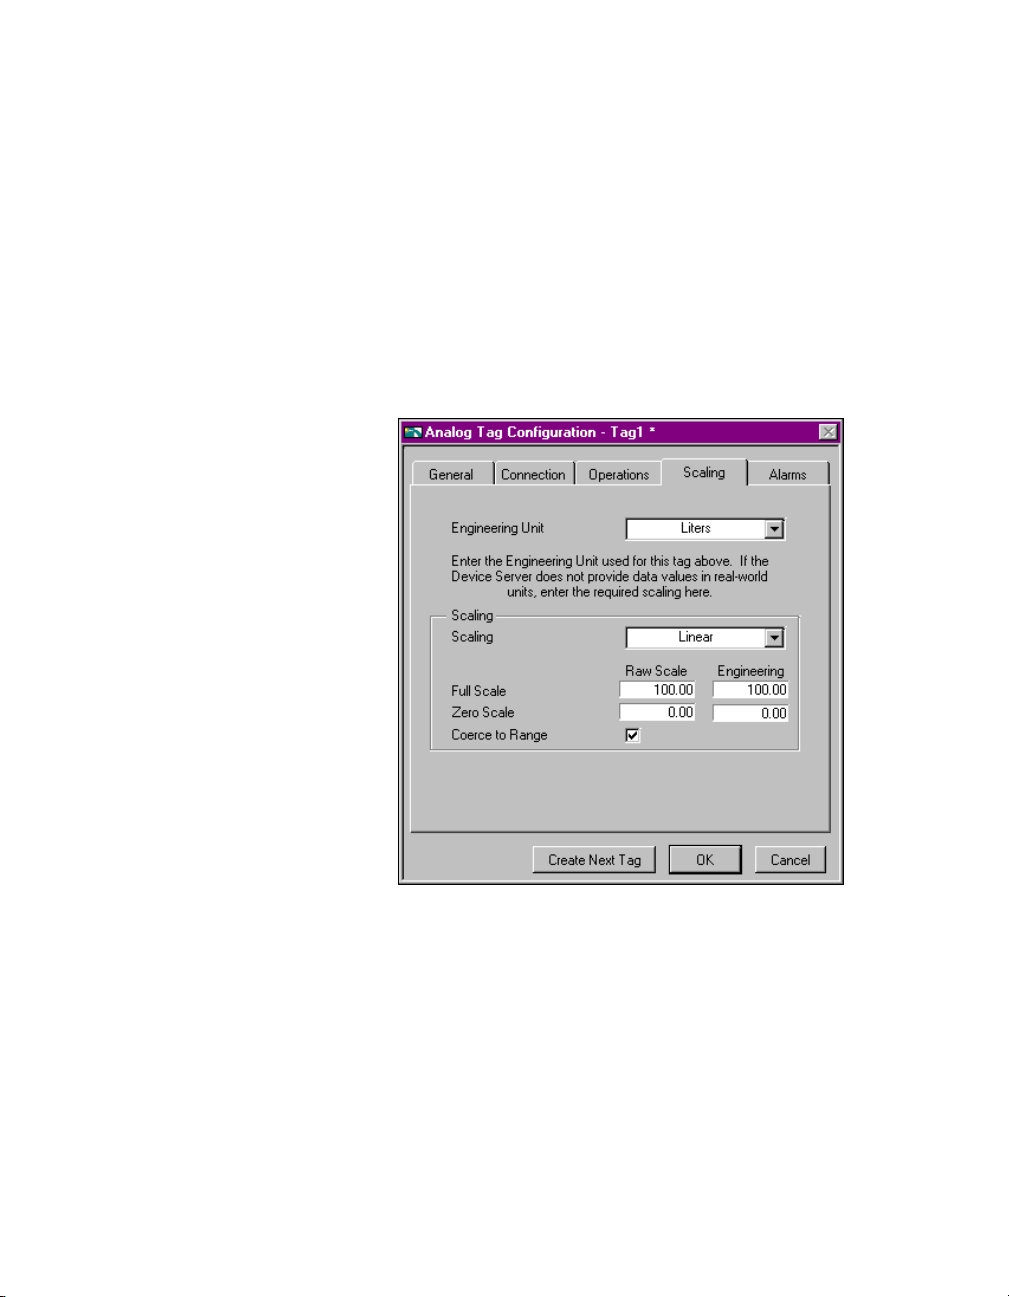
Chapter 3 Tag Configuration
Analog Tags
You can define the raw range and engineering range for a tag to perform
simple conversions between the two ranges. The raw range, defined by
Raw Full Scale and Raw Zero Scale, refers to the values used by the
device server. Engineering range, defined by Engineering Full Scale
and Engineering Zero Scale, refers to the values used by the BridgeVIEW
Engine and HMI. Pull down the Scaling ring and select Linear to enable
a linear (mx + b) conversion between raw and engineering ranges. Select
Square Root to enable a square root conversion between the raw and
engineering ranges. Figure 3-8 shows the Scaling tab of the Analog Tag
Configuration dialog box.
Figure 3-8.
The following examples describe linear and square root scaling.
Analog Tag Scaling Dialog Box
ExampleLinear Scaling
A device server returns a simple voltage from 0 to 5 V. The voltage is
related to a position sensor, and the real-world position is measured in
centimeters, with 0 volts mapped to 50 cm and 5 V mapped to 100 cm.
© National Instruments Corporation 3-27 BridgeVIEW User Manual
Page 86

Chapter 3 Tag Configuration
Configure the tag for raw range from zero (Raw Zero Scale) to five
(Raw Full Scale). Select Linear, and set the engineering range from
50 (Eng Zero Scale) to 100 (Eng Full Scale).
ExampleSquare Root Scaling
A flow meter measures the flow rate of a liquid using a differential pressure
reading. The device server provides 4–20 mA readings. The actual flow is
measured in gallons per minutes (GPM). 4 mA corresponds to 0 GPM;
20 mA corresponds to 100 GPM.
Configure the tag for raw range from 4 (Raw Zero Scale) to 20 (Raw Full
Scale). Select Square Root Scaling and set the engineering range from
0 (Eng Zero Scale) to 100 (Eng Full Scale).
How Do You Assign Units to an Analog Tag?
Use the Engineering Unit ring to assign units to a tag. If the desired unit
is not in the list, select Enter New… and enter the desired unit. In the
previous example, you select units of GPM.
Discrete Tags
The only scaling available for discrete tags is invert scaling. Click the
Invert Data checkbox, shown in Figure 3-9 to advise the BridgeVIEW
Engine to invert the discrete value when it communicates with the
device server.
BridgeVIEW User Manual 3-28 © National Instruments Corporation
Page 87

Chapter 3 Tag Configuration
Figure 3-9.
Scaling for Discrete Tag Configuration
Bit Array Tags
Bit array tags can have invert and/or select mask scaling. You can use the
invert mask to determine which bits are inverted between the device server
and the BridgeVIEW Engine. You can use the select mask to determine the
bits you do not need. Figure 3-10 shows the Scaling tab of the Bit Array
Tag Configuration dialog box, and Table 3-6 provides examples of tags
configured for bit array scaling.
© National Instruments Corporation 3-29 BridgeVIEW User Manual
Page 88

Chapter 3 Tag Configuration
Figure 3-10.
Table 3-6.
Bit Array Scaling Examples
Scaling for Bit Array Tag Configuration
Tag Name Length Raw Value Invert Mask Select Mask Scaled Value
Tag 1 8 0x0F 0x00 0xFF 0x0F
Tag 2 8 0x0F 0x33 0xFF 0x3C
Tag 3 8 0x0F 0x33 0x0F 0x0C
Tag 4 8 0x0F 0x00 0x33 0x30
Tag 5 8 0x0F 0x33 0x33 0x30
Tag 6 16 0x0FF0 0x000F 0x00FF 0x00FF
BridgeVIEW User Manual 3-30 © National Instruments Corporation
Page 89

Alarms
Chapter 3 Tag Configuration
These attributes include whether to enable alarms, under what
circumstances a tag is in alarm, the priority level of an alarm, and how
alarms are acknowledged. Each alarm limit has a priority, ranging between
1 and 15. In BridgeVIEW, 15 is the highest priority and 1 is the lowest.
There are two main types of alarms:
• Alarms based on status
• Alarms based on tag values
Configuration for alarms based on tag values is specific to data type.
Therefore, many alarm attributes apply to only a subset of the BridgeVIEW
tag data types. For more information about how to access alarm
information, build alarm summary displays, and retrieve historical
events files, see Chapter 5, Alarms and Events.
Table 3-7 provides descriptions of the alarm attributes, and indicates the
data types to which each attribute applies. For tag attribute information
about the other configuration categories, see Tables 3-1, 3-2, 3 -4, or 3-5.
Table 3-7. Alarms Configuration Attributes
Attribute
Alarms
Applies to
Data Types
all Determines whether alarms are enabled for a tag.
Description
Enabled
Alarm
Deadband
analog Determines the amount an analog tag value must diverge from an
alarm limit before the alarm condition returns to normal. Alarm
Deadband is expressed in percent of full scale.
Auto Ack all Determines how alarms can be ackno wledged. If set to Auto Ack,
the alarm is acknowledged automatically when the tag value
returns to the Normal state. If set to User Must Ack, the alarm
remains unacknowledged until the user acknowledges it,
regardless of the alarm state.
Bad Status
all Determines whether to enable Bad Status alarms for the tag.
Enabled
Bad Status
Priority
HI_HI
all Determines the value (between 1 and 15) for the alarm priority
for the Bad Status alarm, where 15 represents the highest priority .
analog Determines whether to enable HI_HI alarms for a tag.
Enabled
© National Instruments Corporation 3-31 BridgeVIEW User Manual
Page 90

Chapter 3 Tag Configuration
Attribute
Table 3-7.
Applies to
Data Types
Alarms Configuration Attributes (Continued)
Description
HI_HI Limit analog Determines the value, in engineering units, that invokes a
HI_HI alarm condition. The tag alarm state remains HI_HI
until the tag value goes below the HI_HI alarm limit minus
the alarm deadband.
HI_HI
Priority
analog Determines the value (between 1 and 15) for the alarm priority
for the HI_HI alarm, where 15 represents the highest priority.
HI Enabled analog Determines whether to enable HI alarms for a tag.
HI Limit analog Determines the value, in engineering units, that invokes a HI
alarm condition. The tag alarm state remains HI until the tag
value goes below the HI alarm limit minus the alarm deadband.
HI Priority analog Determines the value (between 1 and 15) for the alarm priority
for the HI alarm, where 15 represents the highest priority.
LO Enabled analog Determines whether to enable LO alarms for the tag.
LO Limit analog Determines the value, in engineering units, that invokes a LO
alarm condition. The tag alarm state remains LO until the tag
value goes above the LO alarm limit plus the alarm deadband.
LO Priority analog Determines the value (between 1 and 15) for the alarm priority
for the LO alarm, where 15 represents the highest priority.
LO_LO
analog Determines whether to enable LO_LO alarms for a tag.
Enabled
LO_LO Limit analog Determines the value, in engineering units, that invokes
a LO_LO alarm condition. The tag alarm state remains
LO_LO until the tag value goes above the LO_LO alarm
plus the alarm deadband.
LO_LO
Priority
Discrete
Enabled
BridgeVIEW User Manual 3-32 © National Instruments Corporation
analog Determines the value (between 1 and 15) for the alarm priority
for the LO alarm, where 15 represents the highest priority.
discrete,
bit array
Determines whether to enable tag value alarms for discrete and
bit array tags.
Page 91

Chapter 3 Tag Configuration
Applies to
Attribute
Data Types
Alarm on discrete,
bit array
Discrete
Priority
Alarm Invert
discrete,
bit array
bit array Determines which bits are inverted before calculating the
Mask
Alarm Select
bit array Determines which bits are used for the bit array alarm
Mask
Table 3-7.
Alarms Configuration Attributes (Continued)
Description
Determines whether a discrete tag should be alarm on ON (high)
or OFF (low). Determines whether a bit array goes into alarm if
all of its bits are in alarm or if any of its bits are in alarm. This
field is used only if both Alarms Enabled and Discrete Enabled
fields are set to TRUE.
Determines the value (between 1 and 15) for the alarm priority
for the tag value alarm, where 15 represents the highest priority.
alarm state. Bits in the mask that are
an alarm when low (0). Bits that are
1
are inverted; thus cause
0
are not inverted; thus,
cause an alarm when high (1). The default mask is 0, indicating
none of the bits are inverted. In bit-wise logic terminology, the
Engine performs an XOR with the Invert Mask to produce the
alarm state. The Alarm Invert Mask is applied to the scaled v alue
after any relevant scaling masks are applied.
calculation. Bits in the mask that are
calculation; bits that are
0
do not cause an alarm, regardless of
1
are used in the alarm
their value. In bit-wise logic terminology , the Engine performs an
AND with the Select Mask to produce the alarm state. The Alarm
Select Mask is applied to the scaled value after any relevant
scaling masks are applied.
Alarm
Message
Tag Last
discrete,
bit array
Determines the string used to provide additional information
about the meaning of an alarm condition.
all Indicates when the last edit to a tag occurred.
Modified
© National Instruments Corporation 3-33 BridgeVIEW User Manual
Page 92

Chapter 3 Tag Configuration
How Do You Configure Alarms for a Tag?
While editing a tag, click the Enable Alarms checkbox. Alarms are
generated depending on the value or state of a tag. The alarms based on
value vary with the tag data type. But for any tag, if the status is bad, a
Bad Status alarm is generated. By default, Bad Status Alarm is enabled
and has the highest priority (15). You can change this selection from the
Alarms tab of the Tag Configuration Editor, shown in Figure 3-11.
Analog Tags
Analog tags have four alarm levels: HI_HI, HI, LO, and LO_LO. By
providing separate alarm levels, you can provide more information about
the nature of the alarm condition.
Figure 3-11. Alarms for Analog Tag Configuration
Alarms are calculated after scaling is performed. Alarm levels are
expressed in engineering units.
BridgeVIEW User Manual 3-34 © National Instruments Corporation
Page 93

Chapter 3 Tag Configuration
Discrete Tags
Discrete tags have one alarm state—either the tag is in alarm or it is not.
You can determine whether a tag is in alarm when it is ON (High) or
OFF (Low). Figure 3-12 shows the Alarms tab of the Discrete Tag
Configuration dialog box.
Figure 3-12.
Alarms for Discrete Tag Configuration
Bit Array Tags
You can enable one of two types of alarms for bit array tags. Alarm on
Any indicates the overall tag is in alarm if any of the bits are in alarm state.
Alarm on All means the overall tag is in alarm only if all of the bits are in
alarm state. You can use the Invert Mask to determine the bits that should
use alarm on low (OFF) rather than the default alarm on high (ON).
You can use the Select (AND) Mask to determine the bits that should
be considered for the alarm. If you have bits in the Select Mask that are
zero (OFF), these bits are not used in calculation of the tag alarm state.
Figure 3-13 shows the Alarms tab of the Bit Array Tag Configuration
dialog box.
© National Instruments Corporation 3-35 BridgeVIEW User Manual
Page 94

Chapter 3 Tag Configuration
Figure 3-13.
Alarms for Bit Array Tag Configuration
String Tags
String tags have no alarm states based on tag value. They only support
Bad Status alarms.
What Is Alarm Deadband on Analog Tags?
Alarm Deadband is a method commonly used to avoid repetitive alarm
messages because of a tag value that hovers near the alarm limit. Alarm
Deadband defines how much a tag value must change from the alarm
limit before it is considered normal. For example, if a tag that represents a
temperature value hovers near an alarm limit of 40 degrees Celsius, the tag
might go in and out of alarm many times in a relatively short period of time.
Table 3-8 shows examples of events with Alarm Deadband set to 0.0%.
Table 3-8.
Events with Alarm Deadband = 0.0%
Time Value Event Alarm Type
9:15:05 40.1 Yes HI
9:15:10 39.9 Yes Normal
BridgeVIEW User Manual 3-36 © National Instruments Corporation
Page 95

Chapter 3 Tag Configuration
Table 3-8.
Time Value Event Alarm Type
9:15:15 40.1 Yes HI
9:15:20 38.5 Yes Normal
This type of situation clogs event files with redundant information and
can cause operators some frustration in having to acknowledge alarms
constantly when the tag has not changed significantly. You can use the
Alarm Deadband to alleviate this problem.
For the tag to go into alarm, it must go above the exact Alarm Value (in the
above example, 40). Howe ver , to be considered normal again, it must leave
the Alarm Value by an amount greater than the Alarm Deadband. For
example, if the range is 0 to 100 degrees Celsius, an Alarm Deadband of
1.0% (one degree Celsius) eliminates unnecessary events. Table 3-9 shows
examples of events with Alarm Deadband set to 1.0%.
Time Value Event Alarm Type
9:15:05 40.1 Yes HI
9:15:10 39.9 No HI
Events with Alarm Deadband = 0.0% (Continued)
Table 3-9.
Events with Alarm Deadband = 1.0%
9:15:15 40.1 No HI
9:15:20 38.5 Yes Normal
How Do You Keep an Alarm Unacknowledged
after the Alarm Returns to Normal?
While editing a tag, select the Alarm Acknowledgement Mode ring and
choose either Auto Ack on Normal or User Must Ack.
Auto Ack on Normal
With this option enabled, when a tag returns to normal state, the alarm
is automatically acknowledged. A message is logged to the event file if
event logging is turned on for the tag. By default, Auto Ack On Normal
is enabled.
© National Instruments Corporation 3-37 BridgeVIEW User Manual
Page 96

Chapter 3 Tag Configuration
Activity 3-1. Configure a Tag, and View the
User Must Ack
With this option enabled, an alarm remains unacknowledged until the
operator acknowledges the alarm.
Tag Configuration Parameters
and Tag Values
The objective of this activity is to use the Tag Configuration Editor to
configure tags for an HMI application and to become familiar with the
Tag Browser and Tag Monitor utilities.
As with all servers, you must register the Tanks Server VI before you can
use it. Most of the activities in this manual require the T anks Server VI, so
you must run the Register T anks Serv er VI, as indicated in the steps belo w.
For more information about registering servers, see Chapter 8, Servers.
1. Open the Register Tanks Server VI, which is located in the
BridgeVIEW\_servers\Tanks Server
2. Run the VI.
3. Close the VI.
4. Launch the Tag Configuration Editor by selecting Project»Tag»
Configuration…. This launches the Ta g Configuration Editor.
5. Select the configuration file by selecting File»Open and choosing
mytanks.scf
mytanks.scf
loads
following illustration.
from the
BridgeVIEW\Activity
into the T ag Configuration Editor, as sho wn in the
directory.
directory. This
BridgeVIEW User Manual 3-38 © National Instruments Corporation
Page 97

Chapter 3 Tag Configuration
Note This configuration file uses data simulated by the Tanks Server. Y ou must ensure
that the
Project»Server Tools»Server Browser. If you do not see
Registered Servers list, run the
BridgeVIEW\_servers\Tanks Server directory.
Tanks Server is registered with the BridgeVIEW Engine by selecting
Tanks Server in the
Register Tanks Server.vi from the
If any of the tags in the T ag Configuration Editor List have a prohibited
symbol, shown at left, next to them, you have not registered the Tanks
Server VI yet. You must register this server before you can use it.
For information about how to register this server, see steps 1
through3inthis activity.
6. Create a tag called
Product
by selecting the Create Analog Tag(s)…
button.
7. Table 3-10 contains the settings you should choose when configuring
your new analog tag. Enter the values listed in the Setting column for
each attribute in the Tag Configuration dialog box to configure the
tag connection, operations, scaling, and alarms. For example, in
the General tab of the Tag Configuration dialog box, you should
type in
Product
as the tag name. After entering all of the values,
press the OK button to set the tag configuration.
Note You also can specify a tag name by selecting the proper I/O connections
(tag access, item, etc.) and then clicking on Paste Item Name to Tag Name.
After doing so, the item name appears in the Tag Name field.
© National Instruments Corporation 3-39 BridgeVIEW User Manual
Page 98

Chapter 3 Tag Configuration
Table 3-10.
Configuration Settings for Activity 3-1
Category Attribute Setting
General Tag Name
Tag Group
Tag Description
Connection Tag Access
Server Name
I/O Group
Item
Operations Update Deadband
Product
group1
Volume of finished
product in liters
Input Only
Tanks Server
ALL
tank2
1.00
(% of range)
Set Initial Value Enabled,
0.00
Log/Print Events Enabled
Log Data Enabled
Log Deadband
5.00
(% of range)
Log Resolution
0.10
(engineering units)
Scaling Engineering Unit
Scaling
Raw Full Scale
Raw Zero Scale
Liters
<none>
1000.00
0.00
Coerce to Range Disabled
BridgeVIEW User Manual 3-40 © National Instruments Corporation
Page 99

Chapter 3 Tag Configuration
Table 3-10.
Configuration Settings for Activity 3-1 (Continued)
Category Attribute Setting
Alarms Enable Alarms Enabled
Alarm Acknowledge
Auto Ack on Normal
Mode
Alarm Deadband
1.00
(% of range)
HI_HI
HI
Enabled,
950.00, Priority = 1
Enabled,
800.00, Priority = 1
Limit =
Limit =
LO Disabled
LO_LO Disabled
Priority = 1
8. Modify the
Bad Status Alarm
Mixer, Liquid
, and
Powder
Enabled,
tags, as specified in
Table 3-11, to configure them for Historical Logging and Alarm
Acknowledgement. T o edit a tag conf iguration, double-click the tag in
the Tag Configuration Editor listbox or press the Edit Tag… button.
You can select multiple tags by holding the <Shift> key while
dragging or clicking the mouse. When you edit multiple tags, the Tag
Configuration dialog box shows three buttons: Edit Next Tag, OK,
and Cancel. Select the Edit Next Tag to record any edits from the
Tag Configuration dialog box and then display the next tag selected.
Select OK to record any edits from the Tag Configuration dialog
and return to the Tag Configuration Editor. Select Cancel to discard
changes to the current tag and return to the Tag Configuration Editor.
Table 3-11.
Configuration Modifications for Activity 3-1
Category Attribute Setting
Operations Log Data Enabled
Log Deadband
0.00
(% of range)
Log Resolution
© National Instruments Corporation 3-41 BridgeVIEW User Manual
0.10
Page 100

Chapter 3 Tag Configuration
Table 3-11.
Configuration Modifications for Activity 3-1 (Continued)
Category Attribute Setting
Alarms Enable Alarms Enabled
Alarm Acknowledge
User must Ack
Mode
9. Save the configuration by selecting File»Save. The modified
file is provided for you in the
BridgeVIEW\Activity\Solutions
.scf
directory.
10. View the tag configuration using the Tag Browser. From a VI front
panel, choose Project»Tag»Browser… and select different tag names
to see the configuration parameters. The Tag Browser is shown in the
following illustration.
11. Close the Tag Browser.
12. Vie w the tag v alue and status of the Product tag with the Tag Monitor.
Select Project»Tag»Monitor…. Select Product and click on the
Add>> button. Then select OK. The Select Tags to Monitor dialog
box is shown in the following illustration.
BridgeVIEW User Manual 3-42 © National Instruments Corporation
 Loading...