

Page 1

MITSUBISHI
Building Air Conditioning Control System
Maintenance Tools for MN converter & G-50A
- Advanced -
Operating Manual
Contents
Page
1 Foreword
1.1 Introduction of Maintenance Tools 1
1.2 Required Operating Environment 4
1.3 Installation 5
1.4 Starting and Ending the Application
9
2 Terms for Each Section
2.1 Design of Screen 22
2.2 Operating Method 22
3 On-Line Monitor Operation Method
3.1 On-Line Monitor Screen Transfer 23
3.2 Function Chart 24
3.3 Address Search Method 24
3.4 Main Screen 26
3.5 Function Selection Operations 27
3.6 Connecting Information 27
3.7 Operation Monitor 29
3.8 Malfunction Log 37
3.9 Optional Setting 39
3.10
Operation Control 42
3.11
Free contact of indoor unit 44
4 Off-Line Monitor Operating Method
4.1 Off-Line Monitor Screen Transfer 46
4.2 Function Chart 47
4.3 Operation Monitor 48
4.4 System Information 52
4.5 Monitoring of Pre-error Data 53
4.6 Filing Operation 54
4.7 Offline on Wide area access mode 57
5 File Names
5.1 System Information Data 58
5.2 Operating Status Monitor Data 58
5.3 Pre-error Data 58
5.4 Text Convert Data 58
6 How to change setting of Firewall 59
7 Troubleshooting? 64
Before using Maintenance Tools, read this manual thoroughly to ensure correct operation.
WT03939X09
Page 2

1
1.1 Introduction of Maintenance Tools
The Maintenance Tools are comprised of the On-Line Monitor and the Off-Line Monitor.
The following two connection methods are available in the Online Monitoring.
(1) Monitoring by connecting the maintenance tool to MN converter (CMS-MNF) via RS-232C.
(2) Monitoring through the central controller (G-50) by connecting the maintenance tool to LAN.
A brief explanation of each of their function is provided here.
* To use the maintenance tool via G-50 (Network), license registration for the G-50 to be used is necessary.
Purchasing the license No. for each G-50 to be used, conduct the license registration through the Web
browser (http://[IP address of the G-50A]/ administrator.html). After selecting "Maintenance tool" of the
optional function on the Web Browser Screen displayed, enter the purchased license No..
For the detail of the license registration, see Chapter 4 [Registering a License for Optional Functions] of
Central Controller Model: G-50A Web Browser Operation Manual (For manager).
1.1.1 On-Line Monitor(via MN converter)
The On-Line Monitor is connected to the unit by a MN Converter (CMS-MNF) and can monitor such areas
as system data, unit data and operating data.
(1) In case for local connection
Connecting PC installed with the maintenance tool to M-NET transmission line via MN Converter allows
conducting various monitoring and setting from the maintenance tool.
(2) In case for remote connection
Using a modem and remotely connecting PC installed with the maintenance tool to MN Converter via
public telephone circuit allow conducting various monitoring and setting as same in the case of local
connection.
*For the remote connection utilizing MN Converter, an isolator is required to be inserted between
the modem and MN Converter.
For detail, please see Installation Manual-annexing of MN Converter (CMS-MNF).
1 Foreword
MN Converter
RS-232C
M-NET
M-NET
M-NET
RS-232C
RS-232C
MN Converter
Maintenance
Tools PC
Maintenance
Tools PC
MODEM
MODEM
Public
network
Page 3

2
1.1.2 On-Line Monitor(via G-50)
The On-Line Monitor is connected to the unit by the central controller(G-50A) and can monitor such areas
as system data, unit data and operating data.
(1) In case for local connection
By directly connecting the PC installed with Maintenance Tools and G-50A through LAN, various
monitoring/setting can be performed from the Maintenance Tools.
(2)-1 In case for remote connection (Dialup connection mode)
By connecting the PC installed with Maintenance Tools and G-50A through public network remotely,
various monitoring/setting can be performed from the Maintenance Tools.
(2)-2 In case for remote connection (E-mail connection mode)
Under E-mail connection mode, communication can be executed with G-50A through E-mail transmission
via mail server. All communication with G-50A is converted into E-mail in this case.
Maintenance
Tools PC
G-50
A
LAN
HUB
M-NET
M-NET
MODEM etc
Public
network
Dial-up
Router
Maintenance
Tool PC
HUB
G-50A
LAN
Maintenance
LAN
G-50
A
POP
Internet
Provider 2
A
ccess point
Provider 1
A
ccess point
Provider1
Mail server
Provider2
Mail server
SMTP
POP
SMTP
Mail server
Mail server
E-mail
E-mail
Notice
•To use the E-mail connection mode, the version of G-50 should be above 2.60.
•When using E-mail connection mode, the local G-50A is required to be initially set with Maintenance Tool and
the mail address by the G-50A initial setting tool.
- For each mail address, it is required to obtain and set an exclusive one. To transmit mail via an internet
provider, obtain the mail address from the provider. When a mail server is existing on the LAN, obtain the
mail address from the LAN administrator.
- Set the [Pop receive interval] within 3 minutes. However to monitor operating status [Operation Monitor], set it within 1
minute.
- Setting of initial information to G-50A can not be executed from Maintenance Tool. Make sure to set it from the G-50A
initial setting tool locally. If dialup connection environment is available, it can be set from a remote position.
(For detail, please refer to 6-1 Mail Basic Setting in the instruction manual of the G-50A initial setting tool.)
• The communication speed under E-mail connection mode largely depends on the transfer rate of each mail
server. Under the circumstance, the action of Maintenance Tool may take a lot of time under some internet
environments or routing mail servers.
Page 4

3
1.1.3 Off-Line Monitor
The Off-Line Monitor can display, print information obtained by the On-Line Monitor.
In the case of connection monitoring utilizing G-50, the operation monitor data collected by G-50A will be
transmitted to remote mail servers periodically if the [Operation monitor - mail communication mode] of
online mode is adapted.
Using this function allows to collect and monitor the operation monitor data without continually connecting
the maintenance tool.
*For the setting of the [Operation monitor - mail communication mode], refer to 3.7.1 and 4.3.3 description.
*Image of the [Operation monitor - mail communication mode]
1.1.4 Wide area access mode
The “Wide area access mode" has been located starting from Ver4.06(D).
Under the "Wide area access mode," the access method for remote connection can be registered to the
database of each customer enabling easy online connection with the air conditioning system of the customer
desired to be accessed.
[Remote access method]
- LAN : Accessing by directly connecting Maintenance Tool PC and G-50A with LAN (WAN).
- Dialup : Accessing by dialup connection to G-50A via public network.
- E-mail : Accessing by E-mail communication to G-50A via mail server.
- Modem (MN Converter) : Accessing by connecting Modem to MN Converter via public telephone
circuit.
After the online connection performed by any of the above methods, you may use the similar function as that
obtainable in the normal online connection.
While under the offline mode, customer information will be provided to the monitored data enabling only to
select a specified customer for display.
MODEM etc
Internet
Provider 2
A
ccess point
Public
network
Dial-up
Router
Maintenance
LAN
G-50
A
Provider 1
A
ccess point
Provider1
Mail server
Operation monitor data
automatic mail transmit
Operation monitor mail
data ac
q
uisition
Collecting the operation
monitoring data of
air conditioners
Provider2
Mail server
Notice
•This differs from the E-mail connection mode of (2)-2 in 1.1.2 On-Line Monitor (via G-50).
Page 5

4
1.2 Required Operating Environment
This manual refers to Windows® 2000 as Windows 2000, and Windows® XP as Windows XP.
Trademarks
MS, Microsoft, Microsoft logo, and Windows are registered trademarks and trade names of Microsoft
Corporation.
Each company may use as registered trademarks and trade names the product names used in this
manual.
1.2.1 Hardware Requirements
The computer must be IBM compatible on DOS/V and capable of satisfying the following requirements.
- OS .................... Windows2000 or WindowsXP (Recommended English version *1)
- CPU .................... PentiumIII 500 MHz (Recommended 1GHz or more)
- RAM .................... Minimum 128 MB (Recommended 256MB or more)
- HDD .................... Available space 5 GB or more *2
- LCD .................... Display resolution:XGA(1024x768) or more
Unit should be equipped with a pointing device, such as a mouse pointer or track ball.
1.2.2 Required Materials
The following materials are needed for operating the Maintenance Tools :
(1) In case of routing via MN converter
MN Converter (CMS-MNF), Personal Computer, RS-232 (cross), and modem in the case of remote
connection, are required. RS-232 C is to be straight cable in this case.
For detail, please see Installation Manual-annexing of MN Converter (CMS-MNF).
(2) In case of routing via G-50
G-50, personal computer, LAN cable (Straight) and HUB.
A dial-up router is required for remote communication. For the dial-up router to be used, employ that
allowing data communication by receiving external telephone transmission.
*1 About OS
Fundamentally, it corresponds to OS of each country. However, separators of time and date differ in
each language. This separator may affect a maintenance tool.
It recommends using it by English OS and Regional options setup, changing into English area form.
Or it recommends using it, changing date separator into [/] and time separator into [:].
*2 About Hard Disk Space
The hard disk space recommended above is only the amount required for installing the maintenance
application. Additional space will be required if the operating data is also to be stored on the hard disk.
A
ccordingly, there may not be enough memory to store operating data if the maintenance system is
installed in a computer with limited hard disk memory.
* NOTE
TG-2000A and Maintenance Tool cannot operate with the same personal computer.
Page 6

5
1.3 Installation
There are two Maintenance Tool setup methods:
Method 1) New setup.(See Section 1.3.1)
Method 2) Upgrading with existing setup.(See Section 1.3.2)
1.3.1 Setting Up the Maintenance Tools (New setup)
To set up Maintenance Tools, follow the 3 steps below.
Step 1) Setting up of MSDE
Step 2) Setting up of database
Step 3) Setting up of
Maintenance Tools
Step 1) Setting up the MSDE
Execute “SETUP.exe” located in SetUp ¥1_MSDE4VS
in the
folder of CD-ROM.
Double clicking on “SETUP.exe” with the explorer displays the
MSDE setup screen as shown right.
PC is reset automatically after completing installation of MSDE.
After closing other application software, click [OK] and start
installation.
* To stop setting up, click on [Cancel] button.
The setting up processing requires for about 2-3minutes
.
If processing progresses to 100%, the screen in the right will be
displayed. Clicking on [OK] resets PC automatically. Please
carry out STEP2 after PC's starting.
Step 2) Setting up the database
Execute “Setup.bat” located in the folder of
SetUp ¥2_DB_SETUP
” of CD-ROM.
Double clicking on “Setup.bat” with the explorer displays
the command prompt screen.
The setting up processing ends within about 10 seconds
- 3 minutes
.
After ending of the setting up, “Press any key to continue …”
is displayed. Pressing any key closes the command prompt
screen.
Request
•For setting up, be sure to practice 3 steps in order.
Otherwise, Maintenance Tools will not operate normally.
•Before setting up, be sure to log in with the log-in name authorized as administrator.
Notice
•Before Setting up the MSDE, restart your computer and Ending software for application program
and Anti-Virus.
: After finishing Step 1, PC restarts automatically.
(Restarting PC is essential before going to Step 2.)
Notice
A
fter setting up MSDE, PC is designed to automatically reset. However, if this setting up is executed without
finishing other application software, PC may not be reset automatically. In this case, reset PC manually. Afte
r
restarting, go to Step 2. Without restarting PC, Maintenance Tool can not be set up unless replacing OS
itself.
Caution
Please refer to also 1.3.4 RE:
Change of computer name on PC.
Page 7

6
Step 3) Setting up the Maintenance Tools
Set up the application of this
Maintenance Tools. Please read the guide shown on the screen carefully
to proceed the setting up.
(1) Starting the setup program
1) Start setup.exe.
Execute “setup.exe” located in
SetUp ¥3_MNTTOOL
folder of CD-ROM.
Double clicking on “setup.exe” with the explorer displays
“Welcome” screen. Please confirm the caution shown on
the screen before setting up.
2) Confirm the display contents, and select [Next] button.
If no problem was found on the content, click [Next] button.
* To stop setting up, click on [Cancel] button.
(2) Confirming the Installation folder
1) Confirm the installation folder and select [Next] button.
Confirm the folder on which this program should be
installed. To change the installation folder (C drive only),
Use [Previous] button. After confirming the installation
folder, click on [Next] button.
* Clicking on [Cancel] button stops installation procedure.
(3) Confirming the installation start
1) Confirm the starting and select [Next] button.
Clicking on [Next] button starts installation.
* Clicking on [Cancel] button stops installation.
(4) Confirming the completion of Maintenance Tools setup
1) Select [Close] button.
Click on [Close] button on the Installation Complete screen.
After completing installation, restart your computer.
Keep the CD-ROM used with you carefully.
Request
•After installing Maintenance Tools, be sure to restart
your computer.
Notice
During database setting, the process may be observed as stopped for a while. However, it is still unde
r
operation internally. Wait for some time until "Press any key to continue - - - -" appears without doing
anything.
*Do not stop the set up procedure by pressing
at the upper right of the screen.
Page 8

7
1.3.2 Running Maintenance Tool Upgrade
The following describes how to upgrade the Maintenance Tool.
Step 1) Ending the Maintenance Tool
Step 2) Uninstalling the Maintenance Tool :Restart your computer after completing the STEP 2.
Step 3) Upgrade the Database
Step 4) Upgrade the Maintenance Tool :Restart your computer after completing the STEP 4.
Step 1) Ending the Maintenance Tool
End the Maintenance Tool program.
*Refer to 1.4.5 Ending the Maintenance Tool
Step 2) Uninstalling the Maintenance Tool
Uninstall the Maintenance Tool program.
* Refer to 1.3.3 Uninstalling the Maintenance Tool
Step 3) Upgrade the Database
Execute "Setup.bat" located in VerUp ¥1_DB_UPDATE
folder of CD-ROM.
Double clicking on "Setup.bat" with the explorer displays the command prompt screen.
The setting up processing ends within about 10 seconds
and the screen closes.
When the set up processing is completed, [Press any key to continue …] will be displayed at the bottom
of the screen. Please wait for this display.
About 10 seconds - 3 minutes are required to complete the set up processing.
The screen will be closed by pressing any button after completing the processing with the display of
[Press any key to continue …].
Step 4) Upgrade the Maintenance Tool
Execute "setup.exe" located in VerUp ¥2_MNTTOOL_UPDATE
folder of CD-ROM.
Double clicking on "setup.exe".
*The Maintenance Tool program version upgrading procedure is the same as new setup.
Refer to 1.3.1 Step 3) Setting up the Maintenance Tool.
Request
•For setting up, be sure to practice 4 steps in order.
Otherwise, Maintenance Tools will not operate normally.
Request
• After uninstalling Maintenance Tool program, be sure to restart your computer.
Request
• After installing Maintenance Tool program, be sure to restart your computer.
Notice
During database setting, the process may be observed as stopped for a while. However, it is still unde
r
operation internally. Wait for some time until "Press any key to continue - - - -" appears without doing
anything.
*Do not stop the set up procedure by pressing
at the upper right of the screen.
Page 9

8
1.3.3 Uninstalling the Maintenance Tools
The method to uninstall the application of the [Maintenance Tools] once installed is given below.
(1) Uninstalling the Maintenance Tools
1) Confirm the ending of Maintenance Tools.
Confirm that Maintenance Tools program has been ended.
If not, end the program.
*For the ending method, refer to Chapter 1.4.5.
2) Start [Add/Remove Programs].
Click on [Add/Remove Programs] from [Control panel] to
start.
3) Select [Maintenance Tool for windows 2000 and XP]
and press [Change & Remove] button.
Select [Maintenance Tool for windows 2000 and XP] from the application, and click on [Remove]
button.
The deletion of Maintenance Tools application starts.
4) Ending the [Add/Remove Programs].
After ending the deletion of application, end [Add/Remove Programs].
1.3.4 RE: Change of computer name on PC
Do not change the computer name after the Maintenance tool has been setup.
Maintenance tool will not run properly if changed, and may require the OS to be installed again.
Notice
•Recommend not to delete the common components.
•There are folders and files that can not be deleted with this uninstalling.
(Example:C:¥Program files¥Mnttool32)
Page 10

9
1.4 Starting and Ending the Application
1.4.1 Starting the Maintenance Tool
(1) Connect the computer and G-50A(MN Converter) and
air conditioner.
(2) Click on “Start
”, and then click on ”Programs”.
(3) Click on “Maintenance Tool for Windows2000 & XP
” in
the “Maintenance Tool
” folder.
(4) The Title Screen will soon appear.
In addition, the message of [This unit can be changed
into °F and pounds/inch
2
. Do you change them?] is
displayed, and the temperature is set into °F if is
clicked on, while into °C if is clicked on.
*After upgrade, if a maintenance tool is started for the first
time, conversion processing of a database may be
performed. In this case, "Now, Converting database! "
and a progress state are displayed.
*The capacity to store the data obtained by the maintenance
tool counts for 2G-bite maximum.
When the remaining storage capacity is insufficient at
starting, Warning Screen will appear.
In this case, move to OFF- Line Screen to delete
unnecessary data.
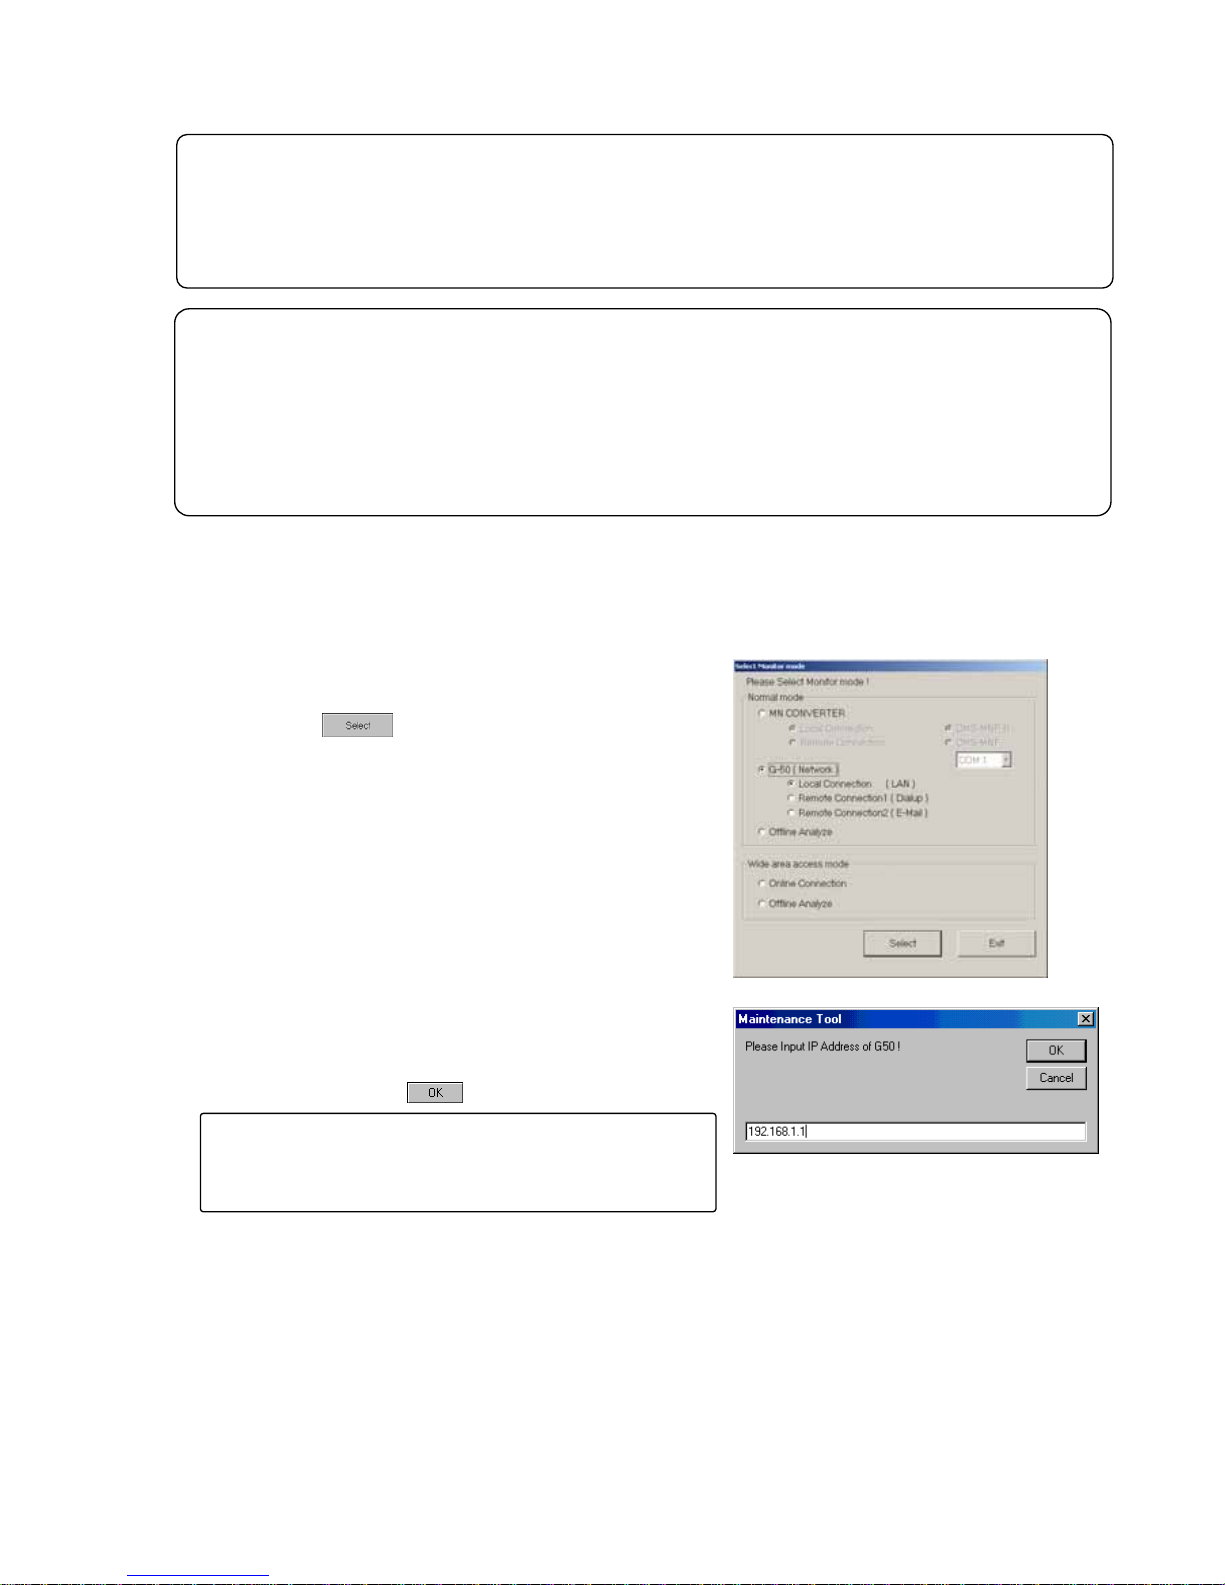
(5) Thereafter, the selection screen of Monitor mode is
displayed. Selecting the mode to be adapted.
Normal mode
a) ON LINE MODE
- MN CONVERTER
When on-line monitoring is adapted to air conditioning
system by connecting MN Converter [Refer to 1.4.2.1.]
Further select Remote connection to conduct remote
connection. [Refer to 1.4.2.2.]
- G50(LAN)
When on-line monitoring is adapted to air conditioning
system via G-50 by connecting the maintenance tool to
LAN. [Refer to 1.4.3.1.] For remote connection, select
either “Dialup connection mode” or “E-mail connection
mode”. [Refer to 1.4.3.2., 1.4.3.3.]
b) OFF LINE MODE
- Offline analysis
When offline analysis is adapted to the data collected under ON-LINE MODE [Refer to 1.4.4.]
Wide area access mode
The detail is described in the item 1.4.5.
Page 11

10
1.4.2 Starting the On-Line Monitor(MN Converter connection)
1.4.2.1 In case for local connection
This will be used when online monitoring is adapted to air conditioning system by connecting the
maintenance tool and MN Converter locally. The maintenance tool, MN Converter and air conditioning
system should be connected beforehand.
(1) Clicking "MN CONVERTER" on the selection screen of
Monitor mode selects "Local connection" simultaneously.
Select the model name of the connected MN Converter
and the COM port No. of the connected RS-232C. Last
click .
1.4.2.2 In case for remote connection
This will be used when online monitoring is adapted to air conditioning system by using a modem, and
connecting the maintenance tool and MN Converter with public telephone circuit remotely. The setting up of
the modem for Windows (modem at the remote site side) and the initial setting up (modem connecting MN
Converter at the local side. For detail, refer to (3).) are previously required. The connection of the modem,
public telephone circuit and local MN Converter is necessary.
* For a description of the on-site air conditioner system connection method, refer to the MN Converter
Operation Manual.
* If communication does not have for 10 minutes in remote connection, "Timeout occurred!" will be
displayed, if O.K. is pushed, a telephone circuit will be cut automatically and the Maintenance tool will be
ended.
(1) After clicking "MN CONVERTER" on the selection screen
of Monitor mode, and click "REMOTE CONNECTION."
For MN Converter, "CMS-MNF-B" will automatically be
selected. Then select COM port No. of RS-232C
connected with equipment (like a modem) for connection
to public telephone line.Last click .
*MN Converter to be locally installed should be
"CMS-MNF-B." Remote connection can not be
performed with "CMS-MNF."
(2) Next the screen to set remote connection will appear. In
order to conduct the initial setting (AT command setting) of
the modem to be used, click , and to initiate
remote connection, click .
*Insert an isolator between the local MN Converter and
modem for insulation. Inserting the isolator reduces the number of lines used by the internal wiring of
RS-323C. For this reason, it is required to select before the remote connection to
change the setting information on the modem to be installed at the local side.
For detail, see Installation Manual-annexing of MN Converter (CMS-MNF).
Page 12

11
(3) Initial setting of modem
For the modem to be installed at the local side (MN Converter side), initial setting should be applied
before connecting remotely. To apply the initial setting of the modem, click on the
remote setting screen.
The Connection Modem Initial Setting Screen will appear. A modem that is already initialized does
not have to be re-initialized.
The explanation of the operation only is described here. For the detail of the setting content, see
Installation Manual-annexing of MN Converter (CMS-MNF).
(a) Explanation of screen
-Select a registered modem setup file at the Select
Initial Settings File Box. The contents of the selected
file will be listed below the selection box.
-Click on and the modem will be set up
according to the contents selected at the selection
box.
(AT commands are sent to the modem.)
Check if transfer with the modem is normal at the
Transfer with Modem Status Screen.
- Click on to initialize another modem.
Send the initialize command and register the transfer
contents for the modem at the AT Command
Transmit Screen. [Refer to (b)]
- Click on to delete the selected modem
settings from the registered settings. When the
number of registrations limit is exceeded, delete the unwanted contents. [Refer to (b)]
- Click on to return to the Connection Setting Screen.
(b) Perform new modem setup.
- Enter the command (you want to set) you want to
send
to the modem at the AT command input text.
Then click on to send the entered AT
command to the modem. The response from the
modem will appear below the entered AT command.
Check the contents.
- After transmission to the modem is complete, click
on . The contents sent to the modem will be
registered as an initialize file. (Registered in the setup
file list of the Connection Modem Initial Setting
Screen.) At this time, do not forget to enter the registration name. Up to ten items can be
registered. If ten items are already registered, new items cannot be registered. Delete unwanted
items using the Connection Modem Initial Setting Screen.
- Click on to return to the Connection Modem Initial Setting Screen.
Page 13

12
(4) Initiating the remote connection
To initiate the remote connection, click
on the remote setting screen.
The Customer Selection Screen will appear. This screen
connects to the on-site remote modem.
(a) When the addressee has already been registered, select
the customer name to be connected in "Select customer
name box" and then click to initiate
connection.
In the case of initial connection or to change to a new addressee, click .
Then the Customer Information Registration Screen will appear.
(b) Enter Customer name of the field addressee, enter the type of the telephone circuit to be used and the
telephone number of the addressee, and click . The set content will be registered.
* The contents transmitted to the modem vary in the
chosen Line type.
Pay attention to the following.
When PB is chosen, "ATDT" is added before the
telephone number.
For example, when a telephone number is
0123456789,
"ATDT0123456789" is transmitted to the modem.
It becomes the following when "DP", "NONE" are
chosen in the same way.
DP --- ATDP0123456789
NONE --- ATD0123456789
When a circuit connection is impossible in the case
of above three which as well, "ELSE" is used.
When "ELSE" is chosen, nothing is added to before the telephone number.
Input a command for the circuit connection from the beginning.
For example, "ATD0,0123456789" is transmitted to the modem when "ATD0,0123456789" is
inputted in the telephone number column.
When the one except for the "ELSE” is chosen, only a number can be inputted in the telephone
number column.
The information for up to 100 customers can be registered. When the information for 100
customers has been registered, new customer information cannot be registered. Delete the
unwanted customer information using the customer selection screen.
(c) Check the contents, then click on .
The Connection Status Indication Screen will appear.
Connect the line. When you want to disconnect the line,
click on .
The line will be disconnected.
Page 14
13
1.4.3 Starting the On-Line Monitor(G-50 connection)
* To use the maintenance tool via G-50 (Network), license registration for the G-50 to be used is necessary.
Purchasing the license No. for each G-50 to be used, conduct the license registration through the Web
browser (http://[IP address of the G-50A]/ administrator.html). After selecting "Maintenance tool" of the
optional function on the Web Browser Screen displayed, enter the purchased license No..
For the detail of the license registration, see Chapter 4 [Registering a License for Optional Functions] of
Central Controller Model: G-50A Web Browser Operation Manual (For manager).
* To use the maintenance tool via G-50 (Only for LAN mode and Dialup connection mode), please check a
setup of Internet Connection Firewall of PC. If the FIREWALL function is used, communication will be
normally impossible with G-50A, and normal data will not be displayed.
For detail, please refer to [6. How to change setting of Firewall] on Page 57.
In the case of permanently installing an anti-virus software and always started under this environment, the
fire wall function of this software may be activated sometimes. In such case, The normal communication with
G-50 will be hindered not displaying data normally. When operating Maintenance Tool, finish the anti-virus
software once or remove the fire wall function.
1.4.3.1 In case for local connection
In the case when on line monitoring is applied to air conditioning system via G-50 by connecting the
maintenance tool to LAN locally.
(1) Clicking "G-50(Network)" on the selection screen of
Monitor mode selects "Local connection" simultaneously.
Last click " ."
(2) Next IP address input screen is displayed. Here,input IP
address of G-50A connected to the air conditioning
system of which operating information is desired to
monitor, and click on .
Request
It is required to set to the IP address in the same system with
G-50 to be connected to Maintenance Tool PC from
[Control Panel].
Page 15

14
1.4.3.2 In case for remote connection (Dialup)
In the case when on line monitoring is applied to local air conditioning system (with G-50 installed) from the
maintenance tool in the remote place via public telephone circuit.
* When utilizing Remote connection (Dialup),please prepare MODEM and DIAL-UP ROUTER (of a type
allowing data communication by receiving external telephone transmission) for the connection with the
public circuit in addition to the components used by Local connection (LAN).
For the system composition, please refer to the system diagram of (2)-1 in 1.1.2.
To use Remote connection (Dialup), it is previously required to register MODEM onto Windows and set
the information on the receiver (the dial-up router at G-50A in the field) of the telephone transmission
onto the dial-up connection screen.
* If communication does not have for 10 minutes in remote connection, "Timeout occurred!" will be
displayed, if O.K. is pushed, a telephone circuit will be cut automatically and the Maintenance tool will be
ended.
(1) After clicking "G-50(Network)" on the selection screen of
Monitor mode, and click "REMOTE CONNECTION(Dialup)."
Last click " ."
(2) Next Remote Monitor screen is displayed.
Here select the connection name of the dial-up router at
G-50A in the field desired to be remotely connected.
It is being set previously on the dial-up connection
screen. Then input Dial-up user name and Dial-up
password to connect with the dial-up router,and click
on .
After connecting to the telephone circuit, on-line monitoring
can be performed as same as the case when connected with LAN.
Page 16

15
1.4.3.3 In case for remote connection (E-mail)
In the case when on line monitoring is applied to local air conditioning system (with G-50 installed) from the
maintenance tool in the remote place via mail server.
(1) After clicking "G-50(Network)" on the selection screen of
Monitor mode, and click "REMOTE CONNECTION(E-mail)."
Last click " ."
(2) The mail connection setting screen is displayed.
Here, set the mail information on G-50A to be connected,
and that on the Maintenance Tool.
A
ll communication to G-50 is converted in E-mail in this case.
Notice
For each mail address, it is required to obtain and set an
exclusive one. To transmit mail via an internet provider, obtain
the mail address from the provider. When a mail server is
existing on the LAN, obtain the mail address from the LAN
administrator.
(a)Setting of the mail information on G-50
A
1) To assign the G-50A connected in the past
After assigning “Customer name” from the pull down menu, select G-50 name.”
2) To connect to new G-50A
Click to open the address book, and register and select the mail address of G-50A.
*The 10 Customer names in the past are displayed on the pull down menu. To assign earlier G-50A,
open the address book to select.
Notice
•To use the E-mail connection mode, the version of G-50 should be above 2.60.
•When using E-mail connection mode, the local G-50A is required to be initially set with Maintenance Tool and
the mail address by the G-50A initial setting tool.
- For each mail address, it is required to obtain and set an exclusive one. To transmit mail via an internet
provider, obtain the mail address from the provider. When a mail server is existing on the LAN, obtain the
mail address from the LAN administrator.
- Set the [Pop receive interval] within 3 minutes. However to monitor operating status [Operation Monitor], set it within 1
minute.
- Setting of initial information to G-50A can not be executed from Maintenance Tool. Make sure to set it from the G-50A
initial setting tool locally. If dialup connection environment is available, it can be set from a remote position.
(For detail, please refer to 6-1 Mail Basic Setting in the instruction manual of the G-50A initial setting tool.)
•The communication speed under E-mail connection mode largely depends on the transfer rate of each mail
server. Under the circumstance, the action of Maintenance Tool may take a lot of time under some internet
environments or routing mail servers.
•For the system composition, please refer to the system diagram of (2)-2 in 1.1.2.
Page 17

16
[Entering order]
1) Preparing the Customer folder
Pressing displays the input screen of customer name,
and then enter the name.
The setting can also be made from the file menu or
the sub-menu displayed by right-clicking.
Further deletion processing can be made with or
Del-key, and rename processing with button.
2) Name and address setting of G-50A
Double-clicking at a position desired to enter provides the
input mode.
Set the name and address accordingly.
*Be sure to set the name of G-50A also.
The deleting processing can be executed with the ,
Del-key, or Edit menu. It can also be performed by the Delete
setting of the sub menu displayed by right-clicking.
(b) Address book
The mail address of G-50A for each project can be registered.
As shown in the sample examples, register the name and mail address of G-50A after preparing the
[
Customer name] folder.
[Selection order]
-Selection of G-50A to be connected with Click the customer name folder desired to connect to open
the address book of the project.
After fitting the cursor to the name of address of G-50A, click [SELECT] button.
(c)Advanced setting screen
Clicking [Open Advanced] opens Advanced screen where the mail information about Maintenance Tool may be
set.
When the mail information about Maintenance Tool has not been set, Advanced screen is displayed always under
opened state.
- Setting of mail information on Maintenance Tool
1) POP server (Receiving)
- POP server address
Set the IP address of the receiving mail server (POP3)
of Maintenance Tool or domain name.
- POP account
Set the POP account (user ID) for mail receiving.
- POP password
Set the user password for mail receiving.
- POP receive interval
Select the mail receiving interval.
The default value represents 5sec.
It can be selected within a range of 5 ~180sec.
Extend the interval when the server is crowded.
2) SMTP server (Transmitting)
- SMTP server address
Set the IP address of transmitting mail server of
Maintenance Tool.
3) Mail address
- Set the mail address of Maintenance Tool.
Clicking [Close Advanced] closes Advanced screen.
(3) After setting the mail information about the G-50 connected and that about Maintenance Tool, click [CONNECT].
Page 18

17
1.4.4 Starting the Off-Line Monitor
When offline analysis is adapted to the data collected under ONLINE MODE.
(1) Clicking "Offline Analyze" on the selection screen of Monitor
mode. Last click " ."
1.4.5 Using the Wide area access mode
Under the "Wide area access mode," the access method for remote connection can be registered to the
database of each customer enabling easy online connection with the air conditioning system of the customer
desired to be accessed.
[Remote access method]
- LAN : Accessing by directly connecting Maintenance Tool PC and G-50A with LAN (WAN).
- Dialup : Accessing by dialup connection to G-50A via public network.
- E-mail : Accessing by E-mail communication to G-50A via mail server.
- Modem (MN Converter) : Accessing by connecting Modem to MN Converter via public telephone
circuit.
After the online connection performed by any of the above methods, you may use the similar function as that
obtainable in the normal online connection.
While under the offline mode, customer information will be provided to the monitored data enabling only to
select a specified customer for display.
Note :
Even when connecting under the wide area access mode, cautions will be applied as same as under the
normal connection mode. You are kindly requested to observe the cautions described in the connection
method under normal mode as well. (1.4.1 - 1.4.3)
Page 19

18
1.4.5.1 Online Connection
(1) Clicking “Online Connection (Wide area access mode)”on the
section screen of Monitor mode.
Last click " ."
(2) The customer registration screen will be displayed.
Register customer information in the order of
[1] -> [2] -> [3] hierarchically.
[1] Area name
[2] Customer name
[3] Air conditioning system name
& connection method
(a) Creating the [Area name] folder
1) When [Wide Area] is being focussed, the
sub-menu will be displayed by right-clicking.
2) Select [Create Area …].
3) As the screen to enter the AREA name appears,
set a proper Area name and press [OK] to
create the Area folder.
(b) Creating the [Customer name] folder
1) Right-clicking the [Area name folder] to be
registered displays the sub-menu.
2) Select [Create Custormer …].
3) As the screen to enter the Customer name
appears, set a proper customer name.
* In addition to the above mouse operation, the creation of [AREA name] and [Customer name] can be
set from the menu bar (File)
or tool bar (Figure).
By applying the same operation procedure(right-clicking, menu bar, tool bar), each folder can be
deleted. Also the name of each folder can be changed.
Caution :
If a folder is deleted, all information (customer name, air conditioning system name, etc.) will be
deleted similarly.
Page 20

19
(c) Setting the [Air conditioning system name]
1) Under the state when the [Customer name
folder] desired to be set on the air conditioning
system is focussed, the sub-menu will be
displayed by right-clicking the air conditioning
system list at the right screen.
2) Selecting [Create ...] displays [Setting screen of
air conditioning system].
[Setting screen of air conditioning system]
1) Set the system name.
2) Select the method to connect with the system.
- To connect by using LAN (WAN)
, enter the IP
address of G-50 to be connected. (Same as
1.4.3.1)
- To connect by using Dial-up
, select the
[Connection name] of dialup router of the local
G-50 being previously set on the dialup
connection screen of Windows. And enter [User
name] and [Password] for the connection with
the dialup router, and lastly enter the IP address
of G-50. (Same as1.4.3.2)
- To connect under E-mail mode
, enter the
E-mail address of G-50 to be connected.(Refer
to1.4.3.3.)
- To connect remotely with MN Converter and
Modem, select [Modem(MN Converter)].
3) Enter special notes if any on the comment column.
After entering and selecting the above, press [OK].
Set various information as required by repeating the items
(a)-(c) above.
Using the area selecting section allows you to extract the
only area desired to display.
Page 21

20
(d) Other setting
You may select the mail address of maintenance tool PC itself and the Com port to be used.
* To use the E-mail mode, mail setting is essentially required.
[Mail setting of maintenance tool PC]
1)
POP server (Receiving)
- POP server address
Set the IP address of the receiving mail server(POP3)
of Maintenance Tool or domain name.
- POP account
Set the POP account (user ID) for mail receiving.
- POP password
Set the user password for mail receiving.
- POP receive interval
Select the mail receiving interval.
The default value represents 5sec.
It can be selected within a range of 5 ~180sec.
Extend the interval when the server is crowded.
2) SMTP server (Transmitting)
- SMTP server address
Set the IP address of transmitting mail server of
Maintenance Tool.
3) Mail address
- Set the mail address of Maintenance Tool.
Clicking [Close Advanced] closes Advanced screen.
[Setting of Com port]
To connect Mode, select the Com port to be used.
(3) Focussing on the air conditioning system desired to be
connected and pressing [Connect] will start the
procedure for connection. After completing the normal
connection, the screen moves to the online main screen
allowing normal online operation.
However when the connection method uses
[Modem(MN Converter)], the screen of the Modem
remote connection will appear. In this case, select the
Modem to be connected and proceed the connection
procedure.(Refer to 1.4.2.2.)
1.4.5.2 Offline Analyze
(1) Clicking “Offline Analyze (Wide area access mode)”on the
section screen of Monitor mode.
Last click " ."
Page 22

21
1.4.6 Ending the Maintenance Tool
1.4.6.1 Ending the On-Line Monitor
(1) Open the Main Screen.
(2) Click on [File
] on the menu bar.
(3) Click on [Return
] in the sub-menu.
(4) The message “Are you sure you want to finish
maintenance tool?” will appear.
Click on .
The On-Line Monitor will end and the Windows screen will
appear.
*At ending of Maintenance Tools, the telephone circuit will
automatically be disconnected.
* Clicking returns to the [selection screen of Monitor mode].
1.4.6.2 Ending the Off-Line Monitor
(1) Open the Off-line Analyze Screen.
(2) Click on .
(3) The message “Are you sure you want to finish
maintenance tool?” will appear.
Click on .
* When finishing Offline Screen immediately after deleting data,
a message of "Finishing Maintenance Tool !!" may
sometime be displayed. The internal data is now under
arrangement. Offline Screen will automatically be finished after
completing this process. Please wait a while.
* Clicking returns to the [selection screen of Monitor mode].
Page 23

22
2.1 Design of Screen
The design of the screen is shown below.
- Title Bar
Displays the title of the screen.
- Menu Bar
Displays the functions that can be performed using the current
screen.
Click on an item and a sub-menu or message screen will
appear, as shown in the illustration.
If a sub-menu appears, further function selections can be made.
- Function Display / Operating Section
Displays the contents of the screen and the operation to be performed.
2.2 Operating Method
The following operations are performed by mouse.
(1) Click
Align the mouse pointer with the desired button and press the left button on the mouse. This is known as
a click.
In general, all maintenance tool operations are performed with click operations.
(2) Drag
A drag is when the mouse pointer is moved while the left button is held down.
If you desired to check the bottom screen when two or more screens are being displayed on top of each
other, align the mouse pointer with the title bar of the top screen and drag it. The bottom screen can now
be seen.
2 Terms for Each Section
(Example of what the screen looks
like when option is clicked.)
Menu Bar
Function Display /
Operating Section
Title Bar
Page 24

23
3.1 On-Line Monitor Screen Transfer
3 On-Line Monitor Operating Method
Title Screen
Main Screen
Malfunction Log Operation Control
Connecting Information Operation Monitor
Optional Setting
Page 25

24
3.2 Function Chart
Connecting Information ----------------------- [Refer to 3.6]
This allows monitoring of the indoor units connected to the outdoor unit and of the interlock units and the
operation group SC connected to indoor units.
Operation Monitor ------------------------------- [Refer to 3.7]
This allows monitoring of the operating condition of the unit and operating data. The operation data
obtained will be shown in the form of a graph.
Utilizing the mail communication mode in addition, the operation monitoring data collected by G-50A can
periodically be transmitted to remote mail servers, and it can be referred as the off-line data later.
*The Mail communication mode can not be used with MN Converter connected.
Malfunction Log ---------------------------------- [Refer to 3.8]
This allows monitoring of the ten most recent errors of the unit.
Optional Setting ---------------------------------- [Refer to 3.9]
This allows monitoring of self-diagnosis function, operation control and pre-error data monitoring.
This also allows to monitor the response to any M-NET command transmitted to the unit. Time setting.
Operation Control -------------------------------- [Refer to 3.10]
This allows the same operation as with the remote controller.
3.3 Address Search Method
3.3.1 Address Search Method Selection
(1) Start the M-NET Maintenance Tools and the Select The Address Searching Method Screen will
appear after the Title Screen.
(2) Click on either or to select the
address search method.
* Automatic Search
The Maintenance Tools automatically searches for
and displays information about units connected to
the M-Net transmission line.
* Manual Search
The user optionally searches for the units connect to the
M-Net transmission line.
Page 26

25
3.3.2 Automatic Searching
(1) Click on and the Automatic Address
Searching Screen will appear.
- The time required to complete the automatic search
will depend on the PC.
- The address currently being searched for is
displayed as [Address
]. Up to 250 addresses can
be searched for.
- Click on to end automatic search.
The Main Screen will appear.
(2) When automatic search has ended, the Main
Screen will appear.
Returning to the Main Screen enables the [Function Buttons
].
3.3.3 Manual Searching
(1) Click on and the Main Screen will appear.
(2) Click on the [Button
] of the address desired and
searching will begin.
*Note
When a system is changed, please search an address after re-starting a Maintenance tool and G-50.
Page 27

26
3.4 Main Screen
The operations in 3.3 Address Search Method have made information about the units known.
The [Unit Attributes
] are displayed on top of the address buttons.
The Function Buttons are now enabled at this time.
(1) Click on an address [Button] displaying attributes
and information about that unit will be displayed in
the [Unit Information Display Columns
].
(2) The menu bar will display [File
], [Option] ,[Print] and [Help].
- Click on [File
] and ”Save System Information” and “Return” sub-menu can be selected.
Click on “Save System Information” and the message “Are you sure you want to save the System
Information?” will appear.
Clicking displays the screen to save data. Change the data name as required and save it.
You may enter your comment also.
Click on to return to the Main Screen.
[Refer to 5.1 System Information Data.]
Click on “Return” to end the operation of the On-line monitor.
[Refer to 1.4.5.1 Ending the On-Line Monitor ]
- Click on [Option
] and “Automatic searching” and the “Stop mail communication” sub-menus can be
selected. * At the connection of MN Converter, “Stop mail communication” is not displayed.
Click on “Automatic searching ” and the message “Start the automatic searching. Is it OK?” will
appear.
Click on to perform automatic searching or click on to return to the Main Screen.
For more information about automatic searching, refer to [3.3 Address Search Method 3.3.2
Automatic Searching].
Click on “Stop mail communication” ,and the Stop mail communication Screen will appear.
Clicking on stops the mail transfer processing of operation
monotor data to remote mail servers.
After a while, the setting completion message appears. Clicking on
returns to the main screen.
Clicking on returns to the main screen directly.
- Clicking on [Print] prints out the display currently shown on the screen.
- Click on [Help
] and "Explanation of Terminology" and "Operation Method" sub-menus can be
selected.
[Refer to 3.6 Connecting Information 3.6.2 (2) ”Menu Bar” ]
Page 28

27
3.5 Function Selection Operations
(1) First, click on the desired [Function Selection
Button].
(2) Next, click on the Unit to Operate
.
(3) The screen will move to the various operation
screens.
(4) If the wrong function selection button is clicked, click
on that button once again and the other function
selection buttons will be enabled.
3.6 Connecting Information
* Items Performed Here
- Indoor units connected to outdoor units, interlock units and the operation group SC (such as system
controller and remote controller) connected to indoor units can be monitored here.
- Select and double-click the interlock units and operation group SC (remote controller only), the
Connecting Information Screen will display as a pop-up menu.
The screen displays addresses and attributes of the units connected to the select unit.
3.6.1 Screen Transfer Operation
(1) Click on on the Main Screen.
(2) Click on the for the outdoor unit to be monitored.
- Only outdoor units can be selected.
(3) Momentarily, the message “Monitoring! Please wait
for a moment.” will appear.
* NOTE
Even with the direct expansion type, when units other than outdoor units are selected by
(2), the screen returns to the Main Screen (where it waits for function selection input).
*Note
"Stop mail communication" is a function to stop the operation monitor mail transmission of G-50 under [mail
communication mode] set in Chapter 3.7. It has no relation with (2)-2 E-mail connection mode of 1.1.2
On-line Monitor (via G-50).
Page 29

28
(4)Momentarily, the Connecting Information Screen
will appear.
(5)Click on to end the Connecting
Information Screen.
(6)The message ”Finish the Connecting Information”
will appear.
Click on to end or click on to
continue.
Click on and the Main Screen appears.
3.6.2 Screen Functions and Operation
(1) Double-click on the interlock unit and operation
group SC (remote controller), the Operation
System SC Connecting Information Screen (in
case operation group SC) will appear as a pop-up
menu.
The screen displays addresses and attributes of each connected unit.
(2)”Menu Bar”
[Return
] and [Help] appear in the menu bar.
Click on [Return] to end the Connecting Information Screen and return to the Main Screen.
Click on [Help] and the Help Screen appear.
- Click on "Contents" and the index for the Help Screen
appear.
- Click on "Back" and the unit returns to its previous
operating state.
- Click on "Print" and the currently displayed screen is
printed. (Caution: Do not print while on-line. There is a
chance that it could interfere with operation.)
- Click on "Term" and Explanation of Terminology
Screen appear.
Abbreviations, codes and other terms are explained on
the explanation of terminology screen.
* NOTE
The BC controller(BC),Subsidiary outdoor unit(OS) are indicated in the outdoor unit column.
3.6.2(2)
(5)
Page 30

29
3.7 Operation Monitor
* Items Performed Here
- Monitors the operating condition and operating data of the current units every minute.
This information can be displayed and saved.
* When an excessively large number of the objective unit for monitoring exists, the monitoring interval may
exceed 1 minute (70s, 80s, ---).
* The capacity to store the data obtained by the maintenance tool counts for 2G-bite maximum.When the
remaining storage capacity is getting insufficient during Operation Monitoring, Warning Screen will
appear. In this case, suspend the Operation Monitoring, move to Offline screen and delete
unnecessary data to keep a proper capacity.
3.7.1 Screen Transfer Operation
(1) Click on on the Main Screen.
(2) Click on the unit to be monitored.
If only outdoor unit is selected here, the operating data for the units connected to the outdoor unit
will be automatically monitored.
The maximum number which can carry out a monitor changes with selected models.
An error message will appear if the limited number of units is exceeded.
The standard of the number which can carry out a monitor.
* When only Outdoor Unit is selected.
- One (1) Outdoor Unit + 50 Indoor Units.
- One (1) Outdoor Unit + Three (3) OC Sub Controller (BC,BS,OS…) + 50 Indoor Units.
* When only Indoor Units are selected, 50 Units.
(3) After the units to be monitored have been selected, click
on .
(4) The message “Monitoring! Please w ait for a moment.” will
appear.
After a while, the screen to select monitor method appears.
* In "MN converter connection", it shifts to (7).
(5)
When desiring to observe the operation data immediately,
select [Realtime Monitor Mode] and then click on .
Select [Mail communication Mode] to observe the operation
data by the off-line monitor later, after mail-transmitting the
operation data beforehand by using the mail transmission
function.
When it is judged that monitoring with one minute cycle may
not be performed because of many units to be monitored, a
message of [The monitoring cycle will be [* *] seconds
due to too many IC units for monitoring. ---] will be
displayed automatically. To continue the monitoring, click
[YES], while to suspend it once to reduce the quantity o
f
units for monitoring, click [NO]. Reduction of one IC can
minimize the cycle time by about one second.
Page 31

30
When [Mail communication Mode] is selected, the setting
items of mail communication will be displayed.
- From: Mail Address
Set the mail address of the G-50A in the [From: Mail
Address] field. When sending mail via an ISP, set the mail
address allocated by the ISP. When the mail server
resides on the LAN, obtain the mail address from the LAN
administrator.
* When sending mail via an ISP, a user contract with the ISP is required.
- To: Mail Address
Set the mail addresses of the recipients to which mail is sent.
* The mail address of recipient (To:) acquires and sets up the address only for maintenance tools.
- SMTP Server IP
Set the mail server IP address in the Mail Server Information [SMTP Server IP] field. When sending
mail via an ISP, set the ISP address of the ISP mail server. When the mail server resides on the
LAN, obtain the IP address from the LAN administrator.
* If the only information available on the ISP mail server is a domain name, use a PC to connect to
the Internet, open a DOS prompt and type “ping domain name”. Set the IP address that is displayed
as the ping response.
- Monitor Finish Data
Set the date of monitor data transmit period.
- Mail Sending Interval
Set the transmit interval of monitor data (max 240 min).
Then click on .
After a while, it returns to the main screen, but the mail transmission to remote receivers will be
performed by G-50A automatically.
* At the connection of MN Converter “the screen to select monitor method” is not displayed. Real-time
Monitor Mode is always commenced not allowing to use [Mail communication Mode].
(6) In the case of real time monitoring, the message “Monitoring. Please wait for a moment.” will
appear again.
(7)
Momentarily, the Operation Status Monitor Screen
will appear.
3.7.2(1
)
Page 32

31
(8)
Click on to end the Operating Status Monitor Screen.
The message “Finish the operation status monitor” will appear.
Click on to end or click on to not end.
Clicking displays the screen to save data.
Change the data name as required and save it. You
may enter your comment also.
Clicking does not allow the data to be saved.
Returning to the main screen.
3.7.2 Screen Functions and Operations
- The operating condition and operating data are displayed every minute.
- The [Current Time
] is displayed. The [Monitor ID] is displayed when saving data.
[Refer to 5.2 Operation Status Monitor Data]
(1) ”Operation Buttons”
allows operation in the same manner as a remote controller.
[Refer to 3. 10 Operation Control]
Click on to end the operation status monitor and return to the Main Screen.
[Refer to 3.7.1(8)]
(2) ”Menu Bar”
[Return], [Print], [Graph] and [Help] are displayed on the menu bar.
- Click on [Return] to end the Operation Status Monitor
and return to the Main Screen.
- Click on [Print] and then select “Print screen” from
the sub-menu.
The hard copy of the screen will be printed from the
connected printer.
- Clicking [Graph] displays a message of “Make the
graph to data ?”.
To graphing, click , while to return to the
operation monitor screen without graphing,
Click .
- Click on [Help] and an explanation about "Terminology" and "Operation Method" will be displayed.
[Refer to 3.6 Connecting Information 3.6.2 (2)”Menu Bar”]
Page 33

32
* About LM ADAPTER
Operation Monitor
Item Performed Here
Operation status of LM ADAPTER, current values of network variable and configration property,setting status of
switch or the like.
[Refer to 3.7 Operation Monitor]
1 Screen Transfer Operation
To move to the screen monitoring LM ADAPTER operation,
select LM ADAPTER from the main screen.
(LM ADAPTER is expressed by )
When LM ADAPTER is selected,you may not monitor
other units.
Same operation procedure as that of other units is applicable
to other main screens.
2 Screen Functions and Operations
- The operating condition and operating data are displayed every minute.
- [Current time] will be displayed.During a time when saving data,[Monitor ID] will also be displayed.
[Refer to 5.2 Operation Status Monitor Data.]
(1)[Operation Button]
[Operation control] will not be displayed.
Click on [Return] to end the operation status monitor and return to the Main Screen.[Refer to 3.7.1(8)]
(2)[Menu Bar]
[Return] , [Print] , [Graph] and [Help] are displayed on the menu bar.
Neither [Graph] nor [Ref.] may be used. Other menus are same as that of other units.
Menu Bar
Operation Button
Page 34

33
3 Introduction to the screen
Display Contents
<Function set switch>
Set status of function selector switch
0:OFF setting 1:ON setting
<Extension switch>
Set status of extension function selector switch
0:OFF setting 1:ON setting
<M-NET address switch>
Set status of M-NET address switch on LM ADAPTER
SWU1:The units digit SWU2:The tens digit
<Control flag>
Internal processing status of LM ADAPTER
FLAG:Control flag status
ERROR:Error flag status
[M]:M-NET communication processing flag
[LON]:LonWorks communication processing flag
0:Reset 1:Set
<General input>
General input status of LM ADAPTER
0:Normal 1:Detecting
<Power failure flag>
Indicating power failure detecting status of LM
ADAPTER
0:Powering 1:Interrupting
<Binding status : nvoOnOff_n>
Binding information on operation command input
0:No binding
1:Binding
Unit address
(Unit digit)
Unit address(Tens digit)
Page 35

34
Display Contents
<Binding status : nvoOnOff_n>
Binding information on operation status output
0:No binding
1:Binding
<IC connection status>
Connection status of air conditioner(indoor unit)
0:Not connected
1:Connected
<nv Transmitting/receiving data>
Latest value of network variables
[Rcv] Received value of operation command input
[Snd] Output value of operation status
St : state field data
V1 : value field data
<nci set value>
Set value of configuration property
Unit address
(Tens digit)
Display example
[Rcv] [Snd]
St Vl St Vl
stopping 00 00 00 00
Operating 01 C8 0 1 C8
Unit address(Tens digit)
Unit address
(Unit digit)
Unit address(Tens digit)
Unit address
(Unit digit)
Unit address(Unit digit)
Page 36

35
3.7.3 Trend graph
Clicking at 3.7.2 (2) [GRAPH] displays Trend Graph Screen.
(1) Procedure for graphing
(a)Click [Option] on the menu bar.
(b)The sub-menu of "Graph detail setting" and "Other setting"
will be displayed. Click "Graph detail setting" to set each
item of the graph.
*Note
Without setting of each item on "Graph detail setting,"
no graph can be displayed.
(The graph detail setting is explained in (c) and other setting is in (d).)
(c) Graph Detail Setting Screen will be displayed.
1) Click your desired number (from Graph 1 ~ 5) for
graphing.
*Note
The number of the graph selected represents
the ordinate.
2) Select [Unit] desired to be graphed.
3) Select [Source] (Data item) desired to be graphed.
4) Set [Upper limit, Lower limit] of data. You may also
set to [Auto-scale].
- When the data exceeds the high limit value or low limit value being set under [Auto-scale] setting,
the above value is replaced by the exceeded value in the setting. When the high limit value and low
limit value are set before entering, 10 will be set to the high limit value and 0 will be to the low limit
value automatically.
5) [Graph upper limit, Graph lower limit] (Ordinate display
position/range) may be acceptable as it is. Setting is
required when the display position/range is desired to
change.
(To display over the entire screen, enter 100 to the
graph high limit position, while 0 to the low limit position.)
*Note
The input of the upper limit value/lower limit value and
graph upper limit position/lower limit position can be
entered by the ten keys for numerical input besides the
entering by the key board.
6) Click after completing all setting to return to Trend Graph Screen.
(d) Conducting the "Other setting"
With "Other setting," the optional function to facilitate graph
observation can be set.
Click [Option] on the menu bar. Click "Other setting."
Other Setting Screen will be displayed.
1) Moving [Scroll bar] by dragging or clicking changes
the value of the horizontal grid line from 0 to 4. The horizontal grid line will be displayed on the
graph in a number of the value above.
*The sampling time can not be set by on-line.
6
)
5
)
Upper limit value/graph upper limit position
Lower limit value/Graph lower limit position
Page 37

36
2) Clicking returns to Trend Graph Screen
displaying the horizontal grid line in the number being
set to the graph.
(e) Starting the graph
Clicking initiates monitoring to graph the data for
each one minute. The sampling time to allow graphing by
online system is limited to 500 minutes maximum. If 500
minutes are exceeded, the data of old time is eliminated by
the excess time.
(2) Screen function and operation
- The current monitor data is displayed on [Lower column].
- Clicking [Graph number] makes the graph line bold.
- [Current time] is displayed.
- Clicking suspends the monitoring.
At suspension, [Scaler] will be displayed on the graph.
Dragging the scaler displays the data on the scaler at the
current value column and [Time] at the under part of the graph
number.
- Moving [Scroll bar] by dragging or clicking moves the
display range of the graph.
can be operated as same as the local remote
controller.
[Refer to 3.10 Operation control.]
* Here, BC operation cannot be carried out.
- Clicking clears the graph being displayed. The set values of the graph setting items and other
setting items will remain unchanged.
(3) Ending the graph
To finish Trend Graph Screen and return to Operation Status Monitor Screen, click [Return] on the
menu bar or click . A message of [Finish the trend graph and return to the monitor?] will be
displayed. For returning, click , while not returning, click . Clicking returns to
Operation Status Monitor Screen.
(3)
[Graph number]
Page 38

37
3.8 Malfunction Log
* Items Performed Here
- The malfunction log of the most recent 10 cases (except operation group SC)
3.8.1 Screen Transfer Operation
(1) Click on from the function selection buttons on the Main Screen.
(2) Click on the units to be monitored (except operation group SC).
(3) The message “Monitoring. Please wait for a moment.” will appear.
(4) Momentarily, the Malfunction Log Screen will appear.
If the number of incidents in the malfunction log is
less than ten, [--] will appear in the attribute column
and [FFFF] will appear in the code column.
* Error detailed No.
Error detailed No. may be displayed on the right of
an error code by the model which carries out
a monitor.
Refer to the service handbook for the implications of
detailed No.
* When the monitor of the unit with a simple clock
function is carried out, the time which malfunction
generated, or the time when it was integrated to
unusual generating is displayed.
- When the unit has received a setup of time: The time which malfunction generated is displayed.
- When the unit has not received the setup of time: The addition time from a power supply injection
when malfunction occur is displayed.
Note : While the power supply of a unit turns off, time does not count the simple clock function of a unit.
Therefore, the display of the time which malfunction generated, and addition time will be a mere
rough standard.
* About a flag display
- When a flag is “1” : The state which the power supply does not turn off after receiving a setup of time.
- When a flag is “0” : A setup of time is not received. Or the state which the power failure generated
after receiving a setup of time.
* About PC Time/Unit Time
- PC Time : The present time set as the maintenance tool PC.
- Unit Time : The present time which carried out the monitor from the unit with a simple clock function.
Note : When the system controller which transmits a setup of time to a unit periodically is not
connected, a year and moon data are not updated. In this case, the date column of unit time
maybe counted up till the 9999th.
3.8.2(3
)
3.8.2(2)
3.8.2(1)
Page 39

38
(5) Click on to end the Malfuncion Log Screen.
The message “Close the malfunction log display? ” will be displayed.
Click on to end or click on to not end.
is clicked, the Main Screen is returned.
Note: When G-50A is connected to the system, the malfunction log of OC is eliminated.
Please check the malfunction log in G-50 to check the malfunction log of OC.
3.8.2 Screen Functions and Operations
(1) Click on and the Address Change Screen appear.
Click on to change the address.
The unit attributes are displayed at this time.
(If there is no unit at the address given, the attributes are not
given.)
Once the address has been set, click on .
The units are changed.
If there is no unit at the address given, the message “Unit doesn’t
exist in this address. Retry again.” will appear.
Click on to return to the Address Change Screen.
(2) Click on and the message “Clear the malfunction log. Is it OK?” will appear.
Click on to clear or click on to not clear.
(3) ”Menu Bar”
The menu bar displays [File
] and [Help].
- By clicking [File
] and then selecting “Save as …” from the sub-menu, the Malfunction Log data will
be output and saved in the CSV format. This data can not be viewed on the offline screen.
- Click on [File
] and then select “Return“ from the sub-menu to end the Malfunction Log Screen
and return to the Main Screen.
- Click on [Help] and an explanation about "Terminology" and "Operation Method" will be appear.
[Refer to 3.6 Connecting Information 3.6.2 (2)”Menu Bar”]
* The error history being memorized by G-50 can also be monitor-displayed.
(Display can not be performed when connecting with MN Converter.)
The system controllers other than G-50 can not provide the monitoring of error history.
Page 40

39
3.9 Optional Setting
* Items Performed Here
- Self-Diagnosis Monitoring : The self-diagnosis function (LED for service monitor) to be performed
with Dip-SW on the circuit board of the outdoor unit can be monitored.
- Operation Control : Controlling of unit operation can be performed in the same manner as a
remote controller.
-
Sending Command : Allows to monitor the response for any M-NET command transmitted
to the unit.
-
Monitoring of Pre-error Data : The operation status of the unit (OC/OS) until generating an error can
be monitored in a unit of minute.
- Date / Time Setting : A setup of the present time can be performed to outdoor unit.
(It is used for the time when abnormalities occurred.)
(1) Click on from the function selection buttons on the Main Screen.
(2) Click on the units to be monitored or operated.
(3) The Optional Setting Screen will be appear.
Click on [Item
] to be monitored or operated.
- Click on and the Address Change Screen
appears.
[Refer to 3.8 Malfunction Log 3.8.2 (1)]
- The sending/receiving data are displayed on the
[Lower Column].
(4) Click on to end the Optional Setting Screen
and return to the Main Screen.
3.9.1 Self-Diagnosis Monitoring
(1) Click on and the Self-Diagnosis
Monitoring Screen will appear.
(2) Set the self-diagnosis SW value with .
For the set value, use the No.
on the List of LED monitor
display of the Service Handbook for each unit.
(3) After setting the set value, click on .
The self-diagnosis LED display will be shown with flag or
numerial value.
If the unit other than the outdoor unit or the set value being not
corresponded is sended, the characters “Not corresponded”
and “Attribute and Version” are displayed.
(4) Click on to end the Self-Diagnosis Monitoring Screen and return to the Optional
Setting Screen.
3.9.2 Operation Control
[Refer to 3.10 Operation Control]
Page 41

40
3.9.3 Sending Command
(1) Click on and the Sending
Command Screen
will appear.
(2) Input M-NET command desired to transmit by
clicking on the button.
Direct input from the keyboard is also possible.
(3) After inputting command, click on . Response command is displayed on [Answer] column.
(4) Click on to end the Sending
Command Screen and return to the Optional Setting Screen.
3.9.4 Monitoring of Pre-error Data
(1) Click on and the Pre-error Data
Screen will appear.
- When it chooses except the outdoor unit or
constant speed unit (OS), the message of
“This model doesn’t have the function of
Monitoring of Pre-error.
” is displayed not allowing
operation.
(2) As the screen opens, the monitoring of the data of
the selected unit before error occurred will
automatically be started.
(3) After ending the monitoring, the data of the selected unit before error occurred is displayed in a unit of
minute on Pre-error Data Screen.
Each figure on the upper column indicates a number of minute before generating an error respectively.
The change of the display content is performed with Up/down, left/right scroll bar.
The number of displayed items and that of the stored data (per minute) differ depending on the
selected item.
(4) ”Menu Bar”
The menu bar displays [Return
] and [Help].
- Click on [Return
] to end the Pre-error Data Screen and return to the Optional Setting
Screen.
As the screen to save data will appear, change the data
name as required and save it. You may enter your
comment also.
After saving, return to the Optional Setting Screen.
- Click on [Help] and an explanation about "Terminology" and
"Operation Method" will be displayed.
[Refer to 3.6 Connecting Information 3.6.2 (2)”Menu Bar”
]
* NOTE
Use this function after obtaining the knowledge of M-NET command.
Page 42

41
3.9.5 Date / Time Setting
(1) Click on . The Date / Time Setting
Screen opens and the present time of PC is displayed.
* When the unit which does not correspond to a setup of
time is chosen, the message of "This function is not
available" is displayed, and it cannot set up.
(2) A click of sets the time currently displayed to a unit.
* The time to set up can also be changed on a screen. Cursor is united with a change point and
a numerical value is inputted.
(3) Click on to end the Date / Time Setting Screen and return to the Main Screen.
Page 43

42
3.10 Operation Control
* Items Performed Here
- ON / OFF of the unit, the operation mode and setting the temperature can be performed in the same
manner as a remote controller.
3.10.1 Screen Transfer Operation
(1) Click on from the function selection buttons on the Main Screen.
(2) Click on the unit to be controled.
(3) The Operation Control Screen will be appear. This display shows the current conditions.
3.10.2 Screen Functions and Operation (Indoor unit, LOSSNAY unit)
(1) Set each desired [Item].
(2) After setting the operation item, click on .
* The item will not be transmitted if a "check" is
removed. Please remove a check if needed.
* Click on and the command which
resets a filter sign will transmit.
* If " " is chosen,
operation can do the whole system in a package.
(Only four items of ON/OFF,Mode,Temp.Set,and Fan.)
However, [Operation(ON)] cannot be operated.
(3) Click on and the
Address Change Screen will appear.
Refer to [3.8 Malfunction Log 3.8.2 (1)]
(4) ”Menu Bar”
[Help
] appears in the menu bar.
Click on [Help
] and an explanation of the "Operation Method" will appear.
[Refer to 3.6 Connecting Information 3.6.2 (2)”Menu bar”]
(5) Click on to end the Operation Control Screen.The Main Screen will return.
Notice :
When LEV OPENING is changed, to prevent failure to release the LEV opening after test run, close the
operation control screen. This release the LEV opening
on this screen automatically.
However when moving to the operation control screen from the operation monitor screen, the LEV opening
will be retained even by closing this screen
.
At a timing when finishing the operation monitor screen, the LEV opening can be released.
Page 44

43
3.10.3 Screen Functions and Operation(BC Controller)
(1) Click on the button corresponding to the valve
number you want to change.
“0” represents “close” and “1” represents “open”.
To change the valve setting, perform
“Fix Release” --> “Fix”
(2) After setting, click on .
(3) Click on to check the current conditions.
(4) Change the LEV opening with . Set to the
LEV opening. Click on to send the setup
contents.
(5) After adjustment by solenoid valve and LEV opening change is complete, click on .
The Main Screen will return. At this time, the contents set at this screen become invalid.
Notice
To prevent failure to release the status set after test run, close the operation control screen of BC/BS controller.
This releases all the content set
on this screen automatically.
However when moving to the operation control screen of BC/BS controller from the operation monitor screen,
the set content will be retained even by closing this screen
.
At a timing when finishing the operation monitor screen, the set content can be released.
Page 45

44
3.11 Free contact of indoor unit
* Items Performed Here
- When utilizing the [Indoor unit free contact mode] which uses the external input/output of Free Plan
indoor unit (Building-Multi) together with G-50 and TG 2000, the contact action of the indoor unit can be
tested with this function.
3.11.1 Starting of this function
(1) Screen moving operation and its method
a) Clicking [Option] of the menu bar
on the main
screen and then clicking [IC free contact …] of the
sub-menu will display the screen for the free
contact of indoor unit.
In the case when connected via G-50, the screen shown
right will appear once.
Now the necessary information is under collecting
from G-50.
3.11.2 Monitoring of contact status
(1) Manual monitoring
To manually check the contact status of indoor units
at each address, select the [Manual monitor] mode.
a) Click the [Manual monitor] button on the mode
selection section.
b) Click the [Address button] of the unit desired to
be monitored. The contact status will be monitored
from the unit for display.
[Attribute]
The unit attribute will be displayed.
[Indoor unit contact mode]
The contact mode being set will be monitored,
and a check mark will be affixed on the applied
mode.
[Input contact (monitor)]
The ON/OFF status of each input contact will be monitored for display.
[Output contact (monitor/operation)]
The ON/OFF status of each output contact will be monitored for display.
In the case of output contacts, the status shown with bold letter
represents the present status.
*In the case of non-objective attribute, and when the contact mode is under normal control,
the above monitor display will be [ - ].
* NOTE
[IC free contact …] can be chosen only when
G-50 is Ver.2.60 or more.
Page 46

45
(2) Automatic monitoring
To automatically monitor the contact status of indoor
units of No.1 ~ 50 repeatedly,
select the [Auto monitor] mode.
a) Click the [Auto monitor] button on the mode
selection section.
The contact status of indoor units of No.1 ~ 50 will
automatically be monitored, and this operation will
be repeated.
The display for [Attribute], [Indoor unit contact
mode], [Input contact (monitor)] and [Output
contact (monitor/operation)] are identical to that in
the manual monitoring.
* In the case to terminate the auto mode, selecting other mode will stop the monitoring.
3.11.3 Operation of output contact
(1) Contact operation
To operate for the ON/OFF selection of the output
contact of indoor units, select the [Operation contact]
mode.
a) Click the [Operation contact] button on the mode
selection section.
b) Click the [Output contact (ON/OFF)] button of the
unit for which the ON/OFF of the output contact
is desired to be selected for change.
*The state where the button is being depressed
(with bold letter)
displays the present output status.
[Option] function
Affixing a check mark to [It checks before
transmission] displays the warning screen as
shown right before transmitting actual transmission
command at the operation of output contact.
To continue the transmission, click [Yes].
When a check mark is not affixed, the transmission
command will be transmitted at the clicking of the
[Output contact (ON/OFF)] button simultaneously.
3.11.4 Termination of this function
(1) Clicking the [Close] button will close this screen and return to the main screen display.
Page 47

46
4.1 Off-Line Monitor Screen Transfer
Title Screen
(Operation monitor
Data list screen)
(Operation status monitor screen)
(System info. Data list screen)
(Pre-error Data list screen)
Operation Monitor
System Information
Monitoring of Pre-error Data
4 Off-Line Monitor Operating Method
(System information screen) (Pre-error data screen)
(Trend graph screen)
Page 48

47
4.2 Function Chart
4.2.1 Operation Monitor
Off-Line Analizing --------------------- [Refer to 4.3.1]
Monitors and prints about unit data saved in On-Line “3.7 Operation Monitor”.
Graph --------------------- [Refer to 4.3.2]
The operation data obtained can be graphed for display.
Check Mail ------------------------------- [Refer to 4.3.3]
Extracts the operation monitoring data being mail-transferred by the remote monitor mode from the mail
server.
4.2.2 System Information Monitor
Off-Line Analyzing --------------------- [Refer to 4.4.1]
Monitors and prints about unit data saved in On-Line “3.4 Main Screen”.
4.2.3 Monitoring of Pre-error Data
Off-Line Analizing --------------------- [Refer to 4.5.1]
Monitors and prints about unit data saved in On-Line “3.9.4 Monitoring of Pre-error data”.
4.2.4 Function common for each screen (Filing operation)
Delete Data ------------------------------- [Refer to 4.6.1]
The offline data selected can be deleted.
Export -------------------------------------- [Refer to 4.6.2]
Allows to output the off-line data selected on the screen as a separate file from the database.
Import -------------------------------------- [Refer to 4.6.3]
Allows to take the off-line data being output as a file by Export into the database.
Text Convert ---------------------------- [Refer to 4.6.4]
Allows to output the off-line data being displayed on the screen as a file in Text format from the
database.
The system information data can not be converted. The Pre-error data can be converted in text on
Offline Analysis Screen.
- Changing the name of monitor data
You may change the monitor data name on the screen of the data list.
- Right-clicking menu
Clicking the right button of the mouse on the [Monitor data] desired to be operated displays
the pop-up menu. Using the pop-up menu facilitates your operation.
- The offline mode includes 2 types, the [normal mode] and [wide area access mode].
Although the functions of both modes are almost same, however, under the [wide area access mode],
the following functions are provided additionally.
1) Display of monitored name objective for data collection
The [AREA name], [Customer] and [Air conditioning system name] are shown for each data obtained.
2) Display of extracted data
By selecting [AREA name] and [Customer name], the relevant data only can be displayed.
Notice: Both the data obtained by online under normal mode and that under wide area access mode can
be displayed commonly under both offline modes.
Page 49

48
4.3 Operation Monitor
* Items Performed Here
- Monitors and prints about the System Information and the Operating Data of units saved using the on-line
monitor.
4.3.1 Off-Line Analyzing
(1) Click on to display the data list screen of
Operation Monitor.
(2) Click on [Monitor Data
] desired to be monitored.
(3) Click on .
Notice: This covers the operation with the menu of the
right-clicking of the mouse.
(Refer to 4.6.6 Right-clicking menu.)
(4) Operation Status Monitor Screen
(a) Click on the buttons to display
data from one minute before or one minute after.
(b) ”Menu Bar”
The menu bar displays [Return
], [Print],
[Time-Searching
], [Help].
- Click on [Return
] to end the Operation Status
Monitor Screen.
[Refer to (c)]
- Click on [Print
] and then select “Print screen” from the
sub-menu.
The hard copy of the screen will be printed from the
connected printer.
.
- Click on [Time-Searching
] and the Time Searching
Screen will appear.
Enter the [Date
] and [Time].
(When entering the time, refer to the monitor data time.)
Once the time has been entered, click on .
The entered data will appear.
If no time data has been entered, data for the nearest
time will appear.
Notice: Set the data/time to be entered to the time presented within the monitor data.
Setting to the time outside of the monitor time may cause to disable the search function.
(b)
Page 50

49
- Click on [Help
] and “Explanation of Terminology” and “Operation Method” sub-menus can be
selected.
[Refer to 3.6 Connecting Information 3.6.2 (2) ”Menu Bar”]
(c) Click on [Return] on the menu bar to end the Operation Status Monitor Screen.
The screen returns to the data list screen of Operation Monitor.
4.3.2 Graph
(1) Click on to display the data list screen of
Operation Monitor.
(2) Click on [Monitor Data
] desired to be monitored.
(3) Click on .
(4) Trend Graph Screen
*For the Procedure for graphing, please refer to [ 3.7.3 (1) Procedure for graphing].
(a) The menu bar
[Return], [Print] and [Option] are displayed on the
menu bar.
1) [Return] is to be clicked when finishing Trend
Graph. [Refer to (c).]
2) Clicking [Print] allows selecting the sub-menu of
"Hard Copy."
Clicking "Hard Copy" displays a message of
[Print the data?]. Clicking prints out the
screen presently displayed as it is.
3) Clicking [Option] allows selecting the sub-menu of "Graph detail setting ---", "Time search ---" and
"Sampling setting ---."
- Clicking "Graph detail setting ---" displays Graph Detail Setting Screen.
For the setting method, please refer to [3.7 Operation Monitor 3.7.3 (1) Procedure for graphing].
Clicking after completing the setting on Graph Detail Setting Screen displays a message
of [Please wait for a moment.] and then displays a message of [x-records data read !!].
Click to display Trend Graph Screen.
*The sampling time to allow graphing by offline system is limited to 1515 minutes (records)
maximum. If 1515 minutes (records) are exceeded, the data after it is not displayed on graph.
- Clicking "Time search ---" displays Time Search Screen.
For the operation method, please refer to [4.3.1 (4)(b) MENU BAR [Time searching]].
* When the sampling interval is not set up in 1 minute, it does not search, even if it performs
a time search function.
Page 51

50
- Clicking "Sampling setting ---" displays Sampling
Setting Screen.
Set the sampling time (interval) by moving [Scroll bar]
or input through the keyboard.
For the sampling interval, set the time interval of the
abscissas axis with 1 ~10 minutes.
For the horizontal grid line, refer to [3.7.3 (1) Procedure for graphing].
(b) Screen function and operation
1) Clicking [Graph number] makes the graph line bold.
2) Moving [Scaler] by dragging displays [Data] on the
scaler at the current value column, and [Date/Time]
at the lower part of the graph number.
3) Moving [Scroll bar] by dragging or clicking
moves the range of the graph being displayed.
* NOTE
When a scroll bar or is clicked, a scroll button
may sometimes move continuously.
In this case, it clicks again and please let me move to
the position which wants to see graph.
4) Clicking displays Graph Detail Setting Screen.
For the setting method, refer to [3.7.3 (1) Procedure for graphing].
5) is to be clicked when finishing Trend Graph.
(c) To finish Trend Graph, click [Return] of [MENU BAR] or . Then a message of [Finish the
trend graph?] will be displayed.
Click to finish while click not to finish.
Clicking returns to Operation Monitor Data list screen.
Page 52

51
4.3.3 Check mail
*Mail Server Setting
In order to provide mail checking to the operation data
mail-messaged from G-50 by utilizing Mail communication mode
under online mode, the setting is required relating to the
connection of the objective mail server.
(a) Clicking on the sub-menu “ Mail server setting” of “Setting”
on the menu bar displays Mail server setting screen.
(b) For lan connection, click on “LAN,” set the items relating to
mail servers, and click on .
Items to be set
- Pop server :Ip address of mail servers for receiving
- User name :User name for mail receiving
- Password :Password for mail receiving
(c) For diaplup connection, click on ”Dialup Network,” set the
items relating to dialup and mail servers,and click on .
Items to be set
- Connection name:dialup connection name (requires to
set the information on the provider to be connected by
[dialup connection] from [control panel])
- Dialup user name:user name for dialup connection
- Dialup password :password for dialup connection
- POP Server
:IP address of mail servers for receiving
- User Name
:User name for mail receiving
- Password :Password for mail receiving
* When there are many amounts of data, this several hours case is in update of monitor data.
We recommend you to set up so that interval time may be inputted into "POP Receive Interval"
of "Mail Server Setting" and a mail check may be carried out periodically.
(A mail check is automatically performed at the set-up interval.)
(1) Click on to display the data list screen of
Operation Monitor.
(2) Click on .
Initiates the checking of the operation monitor data mail
for the mail server, and storing of the acquired data.
During the data transfering and storing, the progress
rate will be displayed.
(3) After completing of data tranffer and storing, the
numbers of received mail will be displayed.
(The numbers of the received mail counted here have
no relation with the numbers displayed on the monitor data.)
Clicking on returns to the data list screen of Operation
Monitor.
*The capacity to store the data obtained by the maintenance tool counts for 2G-bite maximum. When the
remaining storage capacity is getting insufficient during data reception by mail, Warning Screen will appear. In
this case, suspend the mail checking, and delete unnecessary data on Offline Screen to keep a proper capacity.
Page 53

52
4.4 System Information
4.4.1 Off-Line Analyzing
(1) Click on to display the data list screen
of System Information.
(2) Click on [Monitor Data
] desired to monitor.
(3) Click on .
- The System Information Screen of Off-Line
displays all connection information memorized by
the connected G-50.
Notice: This covers the operation with the menu of the
right-clicking of the mouse.
(Refer to 4.6.6 Right-clicking menu.)
(4) Click on the address [Button
] of the attributes to be
displayed and the [Unit Information Display
Column] is shown in the same way as when on-line.
The [Function Selection Buttons
] cannot be used.
(5) ”Menu Bar”
[Return
], [Print] and [Help] are displayed on the
menu bar.
- Click on [Return
] to end the system information. [Refer to (6)]
- Click on [Print
] and then select “Hard Copy” from the sub-menu.
The hard copy of the screen will be printed out from the connected printer.
- Click on [Help
] and an explanation “Terminology” and “Operation Method” will be displayed.
[Refer to 3.6 Connecting Information 3.6.2 (2)”Menu Bar”]
(6) Click on [Return] on the menu bar to end system information.
(5)
Page 54
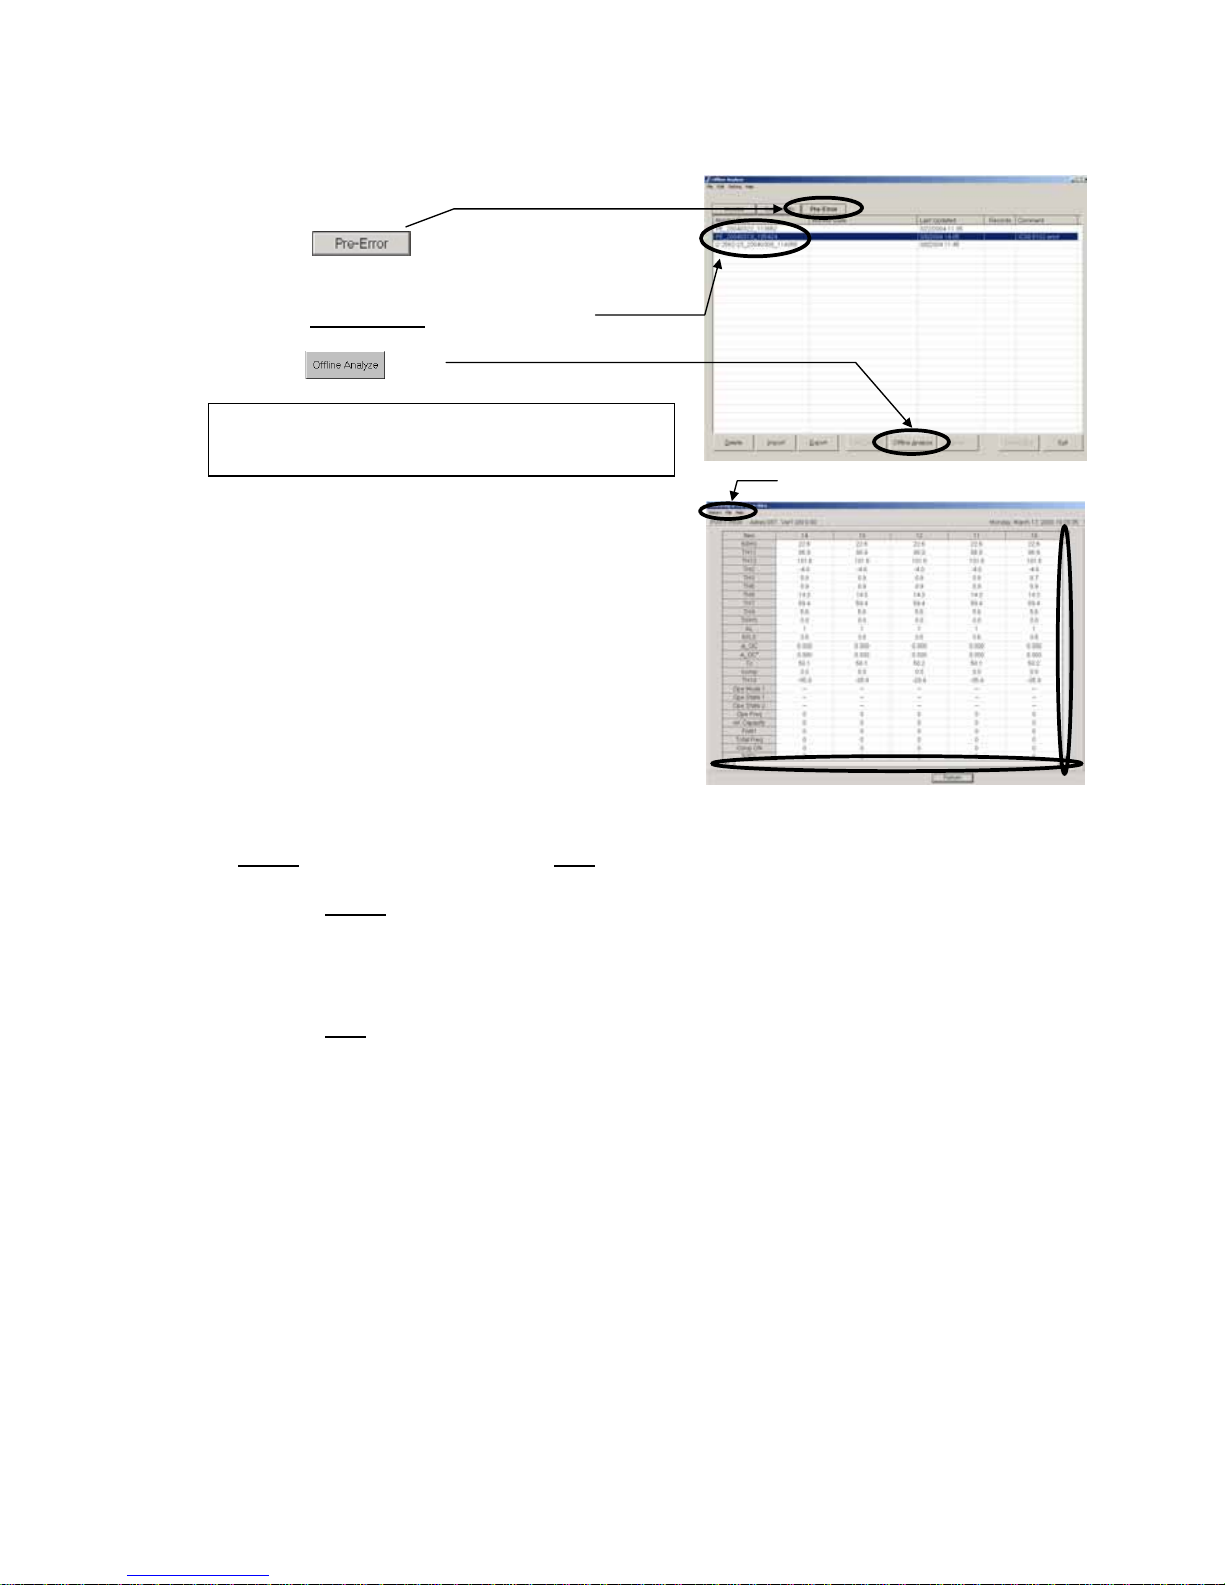
53
4.5 Monitoring of Pre-error Data
4.5.1 Off-Line Analyzing
(1) Click on to display the data list screen of
Pre-error.
(2) Click on [Monitor Data
] desired to monitor.
(3) Click on .
Notice: This covers the operation with the menu of the
right-clicking of the mouse.
(Refer to 4.6.6 Right-clicking menu.)
(4) On the Pre-error Data screen, the operation status
data immediately before generating error will be
displayed in a unit of minute.
Each figure on the upper column indicates a number of
minute before generating an error respectively.
The change of the display content is performed with
Up/down, left/right scroll bar.
The number of displayed items and that of the stored
data (per minute) differ depending on the selected
item.
(5) ”Menu Bar”
[Return
], [Text convert] of [file] and [Help] are displayed on the menu bar.
- Click on [Return
] to end the Monitor before error occurred screen.[Refer to (6)]
- Clicking [Text convert] of [file] prepares a text file of the Before error occurred data being
displayed.
- Click on [Help
] and an explanation “Terminology” and “Operation Method” will be displayed.
[Refer to 3.6 Connecting Information 3.6.2 (2)”Menu Bar”]
(6) Click on [Return] on the menu bar to end the data list screen of Pre-error Data.
(5)
Page 55

54
4.6 Function common for each screen (Filing operation)
* Clicking the button of "Monitor Data", "Monitor Date", "Last Updated" and "Others" at the upper
column allows to sort the displayed data.
* The right-clicking operation of the mouse covers the operation of each file also. For detail, refer to the item
4.6.5 Right-click menu.
4.6.1 Delete Data
(1) Clicking either , or
to display Data list screen containing the file desired
to edit.
(2) Click on [Monitor Data
] desired to delete.
(3) Click on .
Then the screen to confirm the selected monitor data
will appear.
Clicking on deletes the data.
Clicking on returns to Data list screen.
Selecting monitor data collectively enables to execute batch deletion.
This operation may be performed in the similar way of the file selection of Windows explorer (shift,ctrl).
4.6.2 Export
(1) Clicking either , or
to display Data list screen containing the file desired
to edit.
(2) Click on [Monitor Data
] desired to output.
(3) Click on .
The screen to store a file wiil be displayed.
Set the storing folder, input the file name and click on
.
*During processing operation, the progress ratio will be displayed.
4.6.3 Import
(1) Clicking either , or
to display Data list screen containing the file desired
to edit.
(2) Click on .
The screen to read a file will be displayed.
Set the reading folder, input the file name and click on
.
*During processing operation, the progress ratio will be
displayed.
Notice:
The operation monitor data (*.MTD) obtained by Win3.1/95/98 versions (Ver.3.**) can also be imported.
(The reverse operation is not allowed.)
Page 56

55
4.6.4 Text Convert
(1) Clicking to display Data list screen
containing the file desired to edit.
(Text conversion can also be adapted to the Pre-error
data. For the converting method, refer to 4.5.1(5).)
(2) Click on [Monitor Data
] desired to convert into text
format.
(3) Click on .
The screen to confirm the selected monitor data.
Clicking on provides text conversion
processing and then a file name will be displayed.
[Refer to 5.4 Text Convert Data]
In the case of Operation Monitor, clicking displays Data Transfer Screen prompting you to
select the object and method of the conversion.
(a) Click on [units].
Set the [Sampling Time
] between 1-min and 10-min.
(b) Click on .
”Converting! Please wait for a moment.” will be appeared,
then a file name will be displayed.
[Refer to 5.4 Text Convert Data]
(c) Click on to transfer the data of all units.
(d) Click on to end the Data Transfer Screen.
* During processing operation, the progress ratio will be displayed.
4.6.5 Monitor Data information convert
- Changing the name of monitor data
Clicking the Edit of the menu bar while focussing the
monitor data name on the Monitor Data of which name is
desired to be changed on the Screen listing each data will
display the editing screen.
On this screen, the name of Monitor Data or other relevant
information can be edited.
Page 57

56
4.6.6 Right-clicking menu
- Right-clicking menu
Clicking the right button of the mouse on [Monitor data]
displays the pop-up menu as shown on the right screen.
The items that can be set are same as that of the function
button on the screen listing each data.
(Some function is unable to operate partially.)
Use them in accordance with your applications.
Page 58
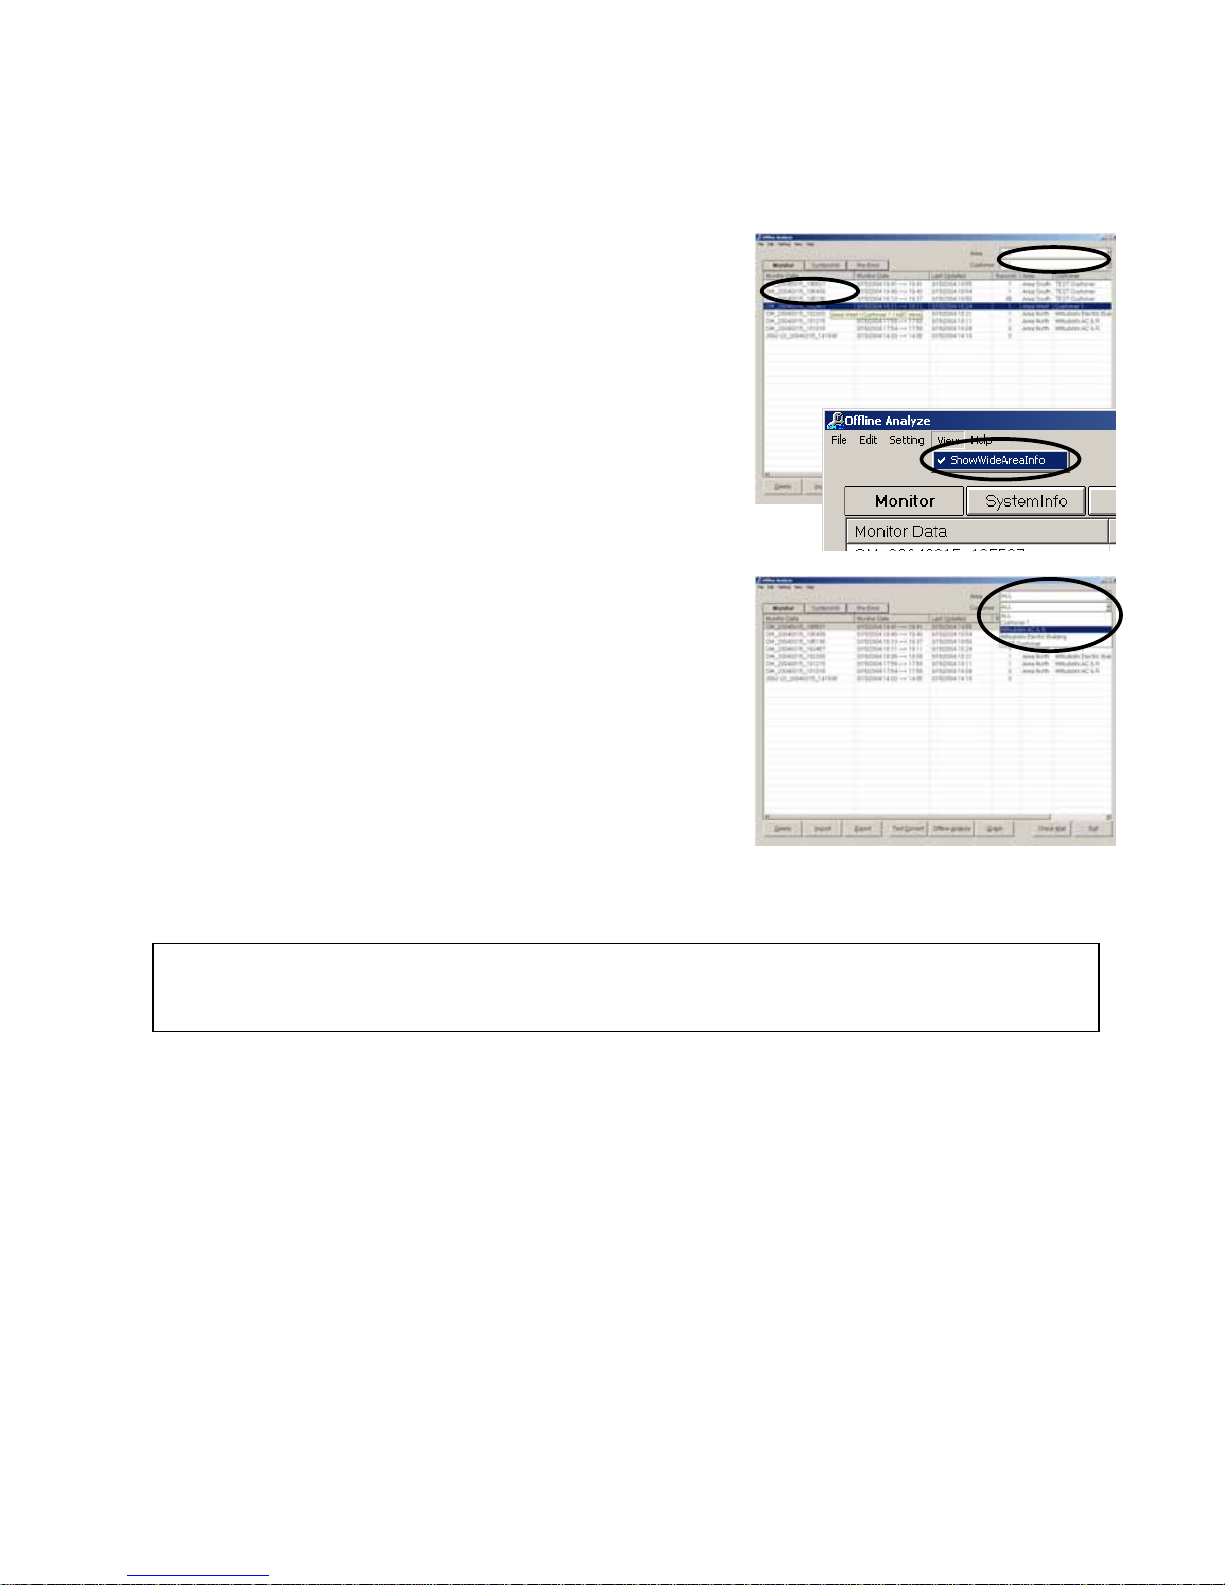
57
4.7 Offline Analyze on Wide area access mode
The function of the offline mode is mostly equals that of the normal mode, however, the following function is
provided additionally.
1) Display of monitored name objective for data collection.
- The [AREA name], [Customer name] and [Air conditioning
system name] are shown for each data obtained.
- Setting the cursor to the data provides the pop-up display
of the [AREA name], [Customer name] and
[Air conditioning system name] of the data.
In order not to show the POP-UP display, click the View of
the menu bar and remove the check mark of the
[Show Wide Area Info.] on the sub-menu.
2) Display of extracted data.
- By selecting [AREA name] and [Customer name],
the relevant data only can be displayed.
As the other function and operation are same as that under the normal mode, please refer to Chapters 4.3 - 4.6.
Notice:
Both the data obtained by online under normal mode and that under wide area access mode can be
displayed commonly under both offline modes.
Page 59

58
5.1 System Information Data
The data saved in Section "3.4 Main Screen (2)" is stored in c:¥ProgramFiles¥mnttool32¥DATA
- The following is an explanation of the file name
SI_20040315_181026.MTDX
Extension
Monitor Time*1
Fixed (SI)
5.2 Operating Status Monitor Data
The data saved in Section "3. 7 Operation Monitor" is stored in c:¥ProgramFiles¥mnttool32¥DATA
- The following is an explanation of the file name(Operating Status Monitor Data has been automatically
stored at the on-line monitoring.)
OM_20040315_181026.MTDX
Extension
Monitor Time*1
Fixed (OM)
5.3 Pre-error Data
The data saved in Section "3.9.4 Monitoring of Pre-error Data" is stored in
c:¥ProgramFiles¥mnttool32¥DATA
- The following is an explanation of the file name(Pre-error Data has been automatically stored at the
on-line monitoring.)
PE_20040315_181026.MTDX
Extension
Monitor Time*1
Fixed (PE)
5.4 Text Convert Data
The data saved in Section "4.6.4 Text Convert " is stored in
c:¥ProgramFiles¥mnttool32¥DATA
- The following is an explanation of the file name
OM_20040315_181026_(001).CSV
Extension
Serial No. (001-999)
Monitor Time*1
Fixed (OM) or (PE) or (ML)
*1 Monitor Time
Monitor starting time : YYYYMMDD_HHMMSS format
* For the data obtained before Ver4.04 via MN Converter, "MN"-"PC host name" will be displayed at the
former part of the data.
5 File Names
Default
(Changeable to any desired name.)
*The data obtained before Ver4.04 is represented by
S_***_***_***.MTDX.
Default
(Able to set at Text Convert freely.)
*The data obtained before Ver4.04 is
represented by M(E)_***_***_***.CSV.
Default
(Changeable to any desired name.)
*The data obtained before Ver4.04 is represented by
M_***_***_***.MTDX.
Default
(Changeable to any desired name.)
*The data obtained before Ver4.04 is represented by
E_***_***_***.MTDX.
Page 60

59
How to Change Setting of Firewall for Windows XP
1. Introduction
When connecting Maintenance Tool through G-50A, normal communication may not be performed if Firewall,
the security function of Windows XP, has wholly been validated.
(* In E-Mail mode and MN converter connection, it is not related)
Therefore, the setting of Firewall should partially be changed following the procedure indicated in Chapter 3
How to change the setting of Firewall.
2. Applicable case
(1) Should the following symptoms occur at the Address
Searching of OC (051~100), it may be possible that the
communication from G-50A can not be received normally as
the communication port to use has been blocked by Firewall.
• Requiring a lot of time for searching
• Not displaying the connecting relation (as shown in the right
figure)
In such case, terminate Maintenance Tool once, and change
the setting of Firewall.
3. How to change the setting of Firewall
The method to change the setting differs depending on the Service Pack loaded as explained below.
• 3-1 [For WINDOWS XP Service Pack 1]
I) In the case of G-50 (Network) - Local connection (LAN)
II) In the case of G-50 (Network) - Remote connection 1(Dialup)
• 3-2 [For WINDOWS XP Service Pack 2]
3-1 [For Windows XP Service Pack 1]
I) In the case of G-50 (Network) - Local connection (LAN)
(1) Select [Control Panel] from Start menu.
(2) Click [Switch to Classic View] to switch the
[Control Panel] screen to Classic View.
(3) Double-click [Network Connection].
(4) The [Network Connection] screen will be displayed.
(5) Right-click on the characters of [Local Area Connection]
to display the sub menu.
(6) Select [Properties] from the sub menu, and then click it.
6 How to change setting of Firewall
[Classic View]
Page 61

60
(7) The [Local Area Connection Properties] screen will be
displayed.
(8) Select the [Advanced] tab.
(9) Confirm that the checking column of [Internet Connection
Firewall] has been affixed with a check mark.
(10) Click the [Settings - - -] button.
(11) The [Advanced Settings] screen will be displayed.
(12) Click the checking column of [Internet Mail Server [SMTP]]
within the [Service] tab to affix a check mark.
(13) Click the [OK] button to close the [Advanced Settings]
screen.
II) In the case of G-50 (Network) - Remote Connection (Dialup)
The procedure for the items of (1) ~ (3) is same as that of G-50 (Network) - Local Connection (LAN).
(4) Open the [Network Connection] screen.
(5) Select the Dialup name used for G-50 (Network) - Remote
Connection1 (Dialup), and right-click to display the sub
menu.
(6) Select [Properties] from the sub menu displayed.
(7) [Properties of (Dialup name)] will be displayed.
(8) Double-click the [Advanced] tab.
(9) Confirm that the checking column of [Internet Connection
Firewall] has been affixed with a check mark.
(10) Click the [Settings - - -] button.
Page 62

61
(11) [Advanced Settings] will be displayed.
(12) Click the checking column of [Internet Mail Server [SMTP]]
within the [Service] tab to affix a check mark.
(13) Click the [OK] button to close the [Advanced Settings] screen.
Now the setting of Firewall has completed. Close all screens and start Maintenance Tool.
Caution: For security protection while connecting with Internet and the like, it is recommended to restore
the settings of Firewall to the original one after terminating Maintenance Tool.
(Remove the check mark of [Internet Mail Server [SMTP]] to restore its original status.)
3-2 [In the case of Windows XP Service Pack 2]
With Windows XP Service Pack 2, the [Windows Security Alert]
screen will be displayed at the initial starting (G-50-Network) of
Maintenance Tool.
(No display in the case of Service Pack 1)
Selecting the [Unblock] button on this screen completes all
settings of Firewall.
Supplement: For Windows XP ServicePack2, it may be set whether the receiving port of the network is
to be blocked or not per application. Selecting [Unblock] realizes normal communication by
opening minimum receiving ports required during the operation of the relevant application
program. After the termination of the application, the receiving ports not used will
automatically be blocked for further security.
Page 63

62
On the [Windows Security Alert] screen, if [Keep Blocking] or [Ask Me Later] has been selected, the settings of
Firewall should be changed manually.
The method of change is given below.
(1) Select [Control Panel] from the Start menu.
(2) The [Control Panel] screen will be displayed.
(3) Click [Network and Internet Connections].
(4) Click [Network Connections].
(5) The [Network Connections] screen will be displayed.
(6) Right-click on the characters of [Local Area Connection] to
display the sub menu.
(7) Select [Properties] from the sub menu, and then click it.
(8) The [Local Area Connection Properties] screen will be
displayed.
(9) Select the [Advanced] tab.
(10) Click the [Settings - - -] button.
Page 64

63
(11) The [Windows Firewall] screen will be displayed.
Confirm that Firewall is being set to [On [recommended]].
Do not affix a check mark to [Don't allow exceptions].
(12) Click the [Exceptions] tab.
(13) Click the checking column of [MntTool32(Maintenance Tool)] to affix
a check mark.
∗ When Maintenance Tool is not displayed on the program list, click the
[Add Program - - -] to add Maintenance Tool.
(a) Clicking the [Add program - - -] button displays the screen to add a
program.
(b) Clicking the [Browse - - -] button on the [Add a Program] screen
displays the [Browse] screen.
(c) After selecting the Programs
[C:¥Program Files¥MntTool32¥MntTool32.exe] (Default folder)
of Maintenance Tool from the [Browse] screen, click the [Open]
button.
(d) Select MntTool32 from Programs: on the [Add a Program] screen,
and click the [OK] button.
(e) Here, MntTool32 has been registered to the Programs and
Services: on the [Exceptions] tab screen of Windows firewall.
[Refer to (13).]
(f) Click the checking column of MntTool32 to affix a check mark.
(14) Click the [OK] button to close the [Windows Firewall] screen.
Now the manual setting of Firewall has completed. The same status as that when [Unblock] of
[Windows Security Alert] was selected will be presented.
Close all screens and start Maintenance Tool.
Page 65

64
Trouble When Installing or Starting
Trouble Cause Repair
Cannot install. Install CD-ROM not properly positioned. Properly position Install CD-ROM.
Cannot start application. Insufficient memory. End other applications.
OS is not an English version. Regional options setup, changing into
English area form. Or after changing date
separator into [/], time separator into [:],
and a decimal point mark is changed into
[.], it tries. (Refer to 1.2.1 *1)
The IP address of G-50A or PC is
incorrect.
Input the correct address. The message of ”Can’t Connect to G50”
is displayed at on-line starting.
LAN cable is not connected. Connect securely LAN cable between
G-50A/HUB/PC.
The message of ”Maintenance Tool can’t
connect to old version G50! Use G-50
upper version2.40!” is displayed at the
on-line starting.
The S/W version of G-50A is older than
Ver2.40.
The maintenance tools can not be
connected to the older version of G-50A
than Ver2.40. Use the new version
G-50A.
(Recommended Ver2.50 or more )
To use the E-mail connection mode, the
version of G-50 should be above 2.60.
The message “M-Net interface board not
connected” appears.
-RS-232C cable and MN converter are
not connected.
-A straight type RS-232C cable is being
used.
A cross type RS-232C cable is being
used. Make sure MN converter and PC
are properly connected.
(Refer to Operator's Manual for the MN
converter.)
MN converter is not turned on.
Connect the MN converter and the air
conditioning unit to the M-Net
transmission line.
(Refer to the Operator's Manual for the
MN Converter)
A message of " Monitor data size is very
large!! Please, delete old monitor data!!" is
displayed at starting.
The memory capacity to store data is
insufficient.
Move to Offline Screen, and delete
unnecessary data.
A message of " Maintenance Tool can’t
connect to this G-50! Because, this G-50
is not licensed!!" is displayed at starting
under the online mode.
The license registration has not been
done for G-50.
Purchase the license No., and register the
license for G-50.
A message of " The term of validity of the
installed version went out.!!" is displayed
at starting.
Maintenance tool does not start.
The term of validity of the installed version
went out.
It upgrades. Please upgrade periodically
Trouble with Main Screen
Trouble Cause Repair
Cannot select function selection buttons. Collecting data about individual units
using manual search. (Unit is
communicating.)
Can be used when communication with all
the units selected by manual search have
completed communication.
A[**]appears in the unit address button
for an existing unit.
-No response from that unit.
-Attributes cannot be known due to
communication error.
Wait a moment and then click on the
address button for the same unit again.
7 Troubleshooting?
Page 66

65
A[**]appears in the unit address button for
a unit that does not exist.
Interference caused an non-existing unit
to appear.
Wait a moment and then click on the
address button for the same unit again.
The[**] display will disappear.
A[??]appears in the address button. There is a unit that is not compatible with
the maintenance tools.
Refer to the explanation on terminology in
help.
If there is no explanation, the unit is not a
compatible type.
Address searching takes 3 minutes or
more per set. (G-50 connection)
The port required for communication is
being protected by the Firewall checking
function of Windows or anti-virus
software.
In this case, the communication
transmitted from G-50 may not partially be
received. Please remove the check mark
on the Firewall function of the necessary
port. (For detail, please refer to Page 57.)
(If the version of G-50 is more than 2.50,
only [IC] can be searched, even if it uses
FIREWALL. However, [OC] reference
cannot be performed. Moreover, since
other functions cannot operate normally,
please be sure to remove a check.)
When a maintenance tool is not ended
normally, G-50 will be in a data resending
state, and LAN communication will
increase.
In this case, please perform "Stop mail
communication" of 3.4 (2), and start a
maintenance tool again after waiting
about 15 minutes.
The version of G-50 is old. A recommendation version is 2.50 or
more.
Connecting information Trouble
Trouble Cause Repair
Cannot switch to connection information
screen.
A unit other than an outdoor unit (OC) has
been selected.
Refer to 3.6.1
The connection data display does not
appear when the operating system SC is
clicked.
An operating SC other than remote
control has been clicked.
Click on remote control.
Monitoring of connection data cannot be
done from operating SC other than
remote control.
Operation Monitor Trouble
Trouble Cause Repair
The monitor display screen on the
operation monitor has red characters.
Because of the increased re-transmission
process work due to abundant
communication noise, data may not be
monitored fully within the rated cycle.
Please take a countermeasure against
the communication noise source in this
case.
All of the characters on the monitor
display for some units are red.
There is no answer from the unit.(Cannot
communicate with the unit.)
Error with unit.
Refer to the service handbook for that
unit.
The dial-up router is not connected. Or
connected but incorrectly.
By referring to Instruction Manual of
Dial-up router, connect or set correctly.
The default gateway of G-50A is not set. Set correctly by using the G-50A initial
setting tool. (Refer to Instruction Manual
of G-50A initial setting tool.)
The incorrect display of the receiver
address is pointed out by SMTP.
Set the correct mailing address.
The message of ” G50 can't Connect to
SMTP Server !
or G-50 Date Setting is wrong !!
Continue ?” is displayed at remote
monitor setting.
The Monitor Finish Date is older than the
current date/time of G-50A.
Set the monitor finish date correctly.
(However when connecting to G-50A in a
region with a time differential, set it by
considering the time in that place.)
A message of " Monitor data size is very The memory capacity to store data is Move to Offline Screen, and delete
Page 67

66
large!! Please, delete old monitor data!!" is
displayed during collecting data.
insufficient. unnecessary data.
Data becomes a red display and the "-"
display.
Since data cannot receive normally.
- There is too much number of a monitor.
- Data transforms itself by a noise.
- Reduce the number of a monitor.
- Cope with noise generating origin.
* Also when returning from a graph
screen to an operation screen, it may
become a red display and the "-"
display, but it is normal.
Malfunction Log Trouble
Trouble Cause Repair
Cannot clear malfunction log The unit is not compatible with
malfunction log clear.
The malfunction log cannot be cleared.
There is an error code, but the contents of
the error are not displayed
This is a newly added error code and is
not compatible with the maintenance
tools.
Refer to the service handbook for that
unit.
Operation Monitor Mail Communication Mode Trouble
Trouble Cause Repair
Operation monitor mail cannot receive
normally.
A mail address and SMTP server
information were made a mistake in and
set up by mail communication setup.
Please set up the right information again
after performing "Stop mail
communication" of 3.4 (2).
The mail address a contract of is not
made with a provider was set as [FROM:
Mail Address].
(When using dialup)
Please set the regular mail address a
contract of is made with the provider to
[FROM: Mail Address].
The mail address of recipient (To:) is not
an address only for maintenance tools.
(The mail address used usually is set up.
In this case, once other mail software
receives mail, operation data mail will be
deleted from a mail server.)
The mail address of recipient (To:)
acquires and sets up the address only for
maintenance tools.
The analysis screen of the operation
monitor data (which carried out mail
acquisition by OFFLINE) is not displayed.
The system configuration information
acquired from G-50 immediately after a
mail communication setup was not
acquired normally.
Please delete the corresponding data.
Text conversion can be carried out and
data can be outputted.
Mail communication mode was set up
from the maintenance tool of a remote
place, and the mail address of recipient
(To:) was set as another addressing to a
maintenance tool of a remote place.
(System configuration information mail is
transmitted from G-50 immediately after a
mail communication setup.
However, the maintenance tool by the
side of a setup is using dial-up service,
and mail transmission cannot be
performed.
Consequently, since the maintenance tool
with which mail is transmitted cannot
acquire system configuration information
mail, even if it receives after that
operation monitor data mail, it does not
indicate by normal.
When mail communication mode is set up
from the maintenance tool of a remote
place, mail acquisition of operation data
can be performed only with the
maintenance tool which set up.
Please make a set the mail address of a
maintenance tool which set mail
communication mode to the mail address
of recipient (To:).
Page 68

67
Specific troubles induced by E-mail connection mode
Trouble Cause Repair
The message of ” Not connectable to mail
server.” or “Not connectable to G-50.” Is
displayed.
The initial information is not being set to
G-50.
(The mail address of Maintenance Tool is
not being registered previously.)
The mail address normally obtained is not
being set.
The version of G-50 is not exceeding
2.60.
The setting of the mail server address is
not correct.
The setting of environments like for LAN
cable connection is not correct.
Execute the initial setting of Maintenance
Tool or G-50A mail address on the local
G-50A by using the G-50A initial setting
tool.
Verify the set contents of the mail
server/mail address.
Obtain and use the mail address
individually for each Maintenance Tool
PC.
Set the connection environment correctly.
The message of “Network possibly
disconnected finishing Maintenance
Tool.” is displayed.
Displays when the normal communication
with G-50 was not performed.
Maintenance Tool is finished forcibly.
Restart Maintenance Tool after a while.
The message of “? operation status mails
at mail server. After receiving mail under
offline mode, start E-mail mode again.
Returning to mode selection screen?” is
displayed.
Displays when the operation monitor mail
is remained at the mail server. The action
of Maintenance Tool will be delayed
caused by a time required by the search
processing of remaining mail.
After removing the operation monitor mail
under Off-line mode, execute E-mail
connection mode.
The operation monitor screen is not
displayed normally.
The POP receiving interval of
Maintenance Tool is being set to over 2
minutes.
[Operation control screen] is being
opened for over 20 minutes on the
operation monitor screen
Set the POP receiving interval within 1
minute.
Do not open [Operation control screen] for
over 20 minutes on the operation monitor
screen.
Free contact of indoor unit Trouble
Trouble Cause Repair
A menu cannot be chosen and cannot be
started.
The version of G-50 is old. A recommendation version is 2.60 or
more.
Off-Line Monitor Trouble(1)
Trouble Cause Repair
The setting of IP address of POP server is
incorrect.
Set the correct IP address with Mail
Server Setting.
The message of ”Timeout Can’t connect
to Mailserver.” Is displayed.
The setting of the IP address of PC is
incorrect.
Set the IP address of PC correctly.
The message of “Invalid Parameter!” is
displayed.
The POP server is not set yet. Set POP server.
The LAN cable is not connected correctly. Connect LAN cable securely. The message of “Can’t Connect to mail
sever!” is displayed.
. The IP address setting of POP server is
not correct.
Set the correct IP address with Mail
Server Setting.
The message of “POP Authention Error”
is displayed.
The setting of the user and password of
POP server is not correct.
Set correctly with Mail Server Setting.
A message of " Monitor data size is very
large!! Please, delete old monitor data!!" is
displayed during collecting the mail of
operation data.
The memory capacity to store data is
insufficient.
Move to Offline Screen, and delete
unnecessary data.
A message of " Now finalizing
Maintenance Tool !!" is displayed at
finishing Offline, and the screen does not
finish.
The internal data is under arrangement at
finishing the maintenance tool.
Offline Screen will automatically be
finished after completing this process.
Please wait a while.
Data cannot be imported. It was going to import the data acquired
by “Maintenance Tools (Ver.3.**)”.
Among the data obtained by Ver3.**, the
operation monitor data (*.MTD) can only
be im
p
orted. Regarding to other data, the
Page 69

68
data obtained by Ver.4.** has no
compatibility with that obtained by
Ver.3.**.
A message of " The file name is incorrect.
--- " is displayed. Data cannot be
imported.
It contains characters unable to be
fetched in (such as [ “or”] and the like).
Please delete such special characters in
the file name.
Off-Line Monitor Trouble(2)
Trouble Cause Repair
Printing is not normally carried out for
graph etc.
- Please set a setup of a printer as
Grayscale Printing.
In processing for the time searching or
text convert of the operation status
monitor, "Date or Time is wrong" is
displayed without executing the
processing.
The information inherent in a district
(language) will be added on the column of
Date and Time depending on the PC (OS)
of the district. However, such information
inherent in the district can not be read by
the maintenance tool.
- Change the setting of the OS to that in
English for use.
- Execute processing after deleting the
information (characters) inherent in the
district to be added on the column of Date
and Time.
 Loading...