

Mikro DPM680, DPM680B Instruction Manual


Please read this instruction manual thoroughly before
installation, operation and maintenance of the DPM680
power meter.
This power meter should NOT be installed or used for primary
protection. Do not use the device in applications where its failure
can cause harm or death. Avoid high re risk applications.
The symbol on the left is used throughout this instruction
manual to alert the user or personnel of the danger or to prompt
caution during the installation and maintenance process.
EMC CoMplianCE
This power meter has been tested and found to comply with the limits of the IEC/EN61000 EMC
standards. These standards are designed to provide reasonable protection against interference
when using this device. Failure to install or use the device in accordance with the instruction may
cause harmful interference. This does not, however, guarantee that interference will not occur in any
installation. In case of interference, the user is encouraged to:
• relocate or reorient the victim/emitting equipment
• change the connection point of the victim/emitting equipment
• increase the distance between the victim/emitting equipment and the power meter
Please consult a qualied technician for assistance.
DisClaiMEr
Mikro shall not be liable for errors contained herein including any incidental and/or consequential
damages arising from the use of this material. Mikro also reserves the right to vary the product from
that described in this material without prior notice.
CopYriGHT
The licensed software contained in the product is proprietary software owned by Mikro or its third party
suppliers and it shall be used solely in connection with the product.
BEforE You BEGin

3
1. INTRODUCTION 5
1.1 How to Use This Manual 5
1.2 Content of Box 8
1.3 Parts of the Power Meter 8
2. INSTALLATION 10
2.1 Precautions 10
2.2 Meter Placement & Connections 10
2.3 Meter Setup 14
2.4 TCP/IP Connection Setup 15
3. METER OPERATIONS 17
3.1 OVERVIEW page & MAIN MENU 17
3.2 Password Authentication 18
3.3 VOLTAGE sub-menu 20
3.3.1 Phase Voltage 21
3.3.2 Line Voltage 21
3.3.3 Maximum Phase Voltage 22
3.3.4 Minimum Phase Voltage 22
3.3.5 Maximum Line Voltage 23
3.3.6 Minimum Line Voltage 24
3.3.7 Sequence Voltages 24
3.3.8 Voltage Harmonics 25
TaBlE of ConTEnT
3.3.9 Voltage Harmonics Table 26
3.3.10 Voltage Waveform 27
3.4 CURRENT sub-menu 28
3.4.1 Phase Current 29
3.4.2 Maximum Current 30
3.4.3 Minimum Current 31
3.4.4 Current Demand 32
3.4.5 Maximum Current Demand 34
3.4.6 Sequence Currents 34
3.4.7 Current Harmonics 35
3.4.8 Current Harmonics Table 36
3.4.9 Current Waveform 37
3.5 PF & FREQUENCY sub-menu 38
3.5.1 PF and Frequency 39
3.5.2 Power Factor (PF) 39
3.5.3 Displacement PF (DPF) 40
3.5.4 Max/Min Inductive PF 40
3.5.5 Max/Min Capacitive PF 41
3.5.6 Max/Min Frequency 42
3.6 POWER sub-menu 43
3.6.1 Active Power 43
3.6.2 Reactive Power 44
3.6.3 Apparent Power 45
Table of content

4
3.6.4 Total Power 45
3.6.5 Power Demand 46
3.6.6 Maximum Power Demand 47
3.6.7 Maximum Active Power 48
3.6.8 Minimum Active Power 49
3.6.9 Maximum Reactive Power 50
3.6.10 Minimum Reactive Power 51
3.6.11 Maximum Apparent Power 52
3.6.12 Minimum Apparent Power 53
3.7 ENERGY sub-menu 54
3.7.1 Active Energy 54
3.7.2 Reactive Energy 55
3.7.3 Apparent Energy 55
3.7.4 Total Energy 56
3.7.5 Reset Energy Counters 57
3.8 SETTING sub-menu 57
3.8.1 CT & VT Ratios 58
3.8.2 Communication Settings
(only for DPM680) 59
3.8.2.1 Ethernet (TCP/IP)
(only for DPM680) 60
3.8.2.2 Modbus 61
3.8.2.3 View Network Details
(only for DPM680) 62
3.8.3 System Settings 63
3.8.3.1 Version 63
3.8.3.2 Date & Time 64
3.8.3.3 Change Device Password 65
3.8.3.4 Factory Settings 66
3.8.3.5 Display Settings 67
3.8.4 For Factory Use Only 68
4. WEBPAGE OPERATIONS
(ONLY FOR DPM680) 68
4.1 Voltage and Current page 68
4.2 Energy and Power page 70
4.3 Parameter Setting page 72
4.3.1 Webpage Password 74
5. MODBUS OPERATIONS 75
6. TROUBLESHOOTING GUIDE 76
Appendix A Specications 77
Appendix B Numerical Methods 81
B.1 Demand Calculation 81
B.2 Total Harmonic Distortion Calculation 82
B.3 Sequence Components Calculation 82
B.4 Power Factor Calculation 83
B.5 Apparent Power Calculation 83
Table of content

5
1
inTroDuCTion
Thank you for purchasing the DPM680 Digital
Power Meter. This multifunction power meter
features a user-friendly colour graphical and
touch button interface. It’s primary function is for
measuring the following parameters:
• True RMS phase (LN) and line (LL) voltage.
• True RMS phase and neutral current.
• Active, reactive and apparent power.
• Active, reactive and apparent energy.
• Total and displacement power factor.
• Frequency.
• Voltage and current harmonics.
•
Voltage and current total harmonic distortion (THD).
• Positive, negative and zero sequence voltage
and current.
• Current (thermal) demand for phase current.
•
Power demand for active, reactive and apparent power.
• Time stamped maximum and minimum voltage,
current, power factor, frequency and power.
• Time stamped maximum current and power
demands.
It’s large colour graphics LCD also displays:
• Scalable voltage and current waveforms
• Voltage and current harmonic spectrums up to
the 32nd order
Introduction 1 1.1
For SCADA and remote monitoring, this power
meter also comes with:
• Modbus RTU connectivity
• Modbus TCP/IP connectivity (only for DPM680)
• Built-in webserver (only for DPM680)
1.1
How To usE THis Manual
For installation instruction, the Installation chapter
2 should be read carefully.
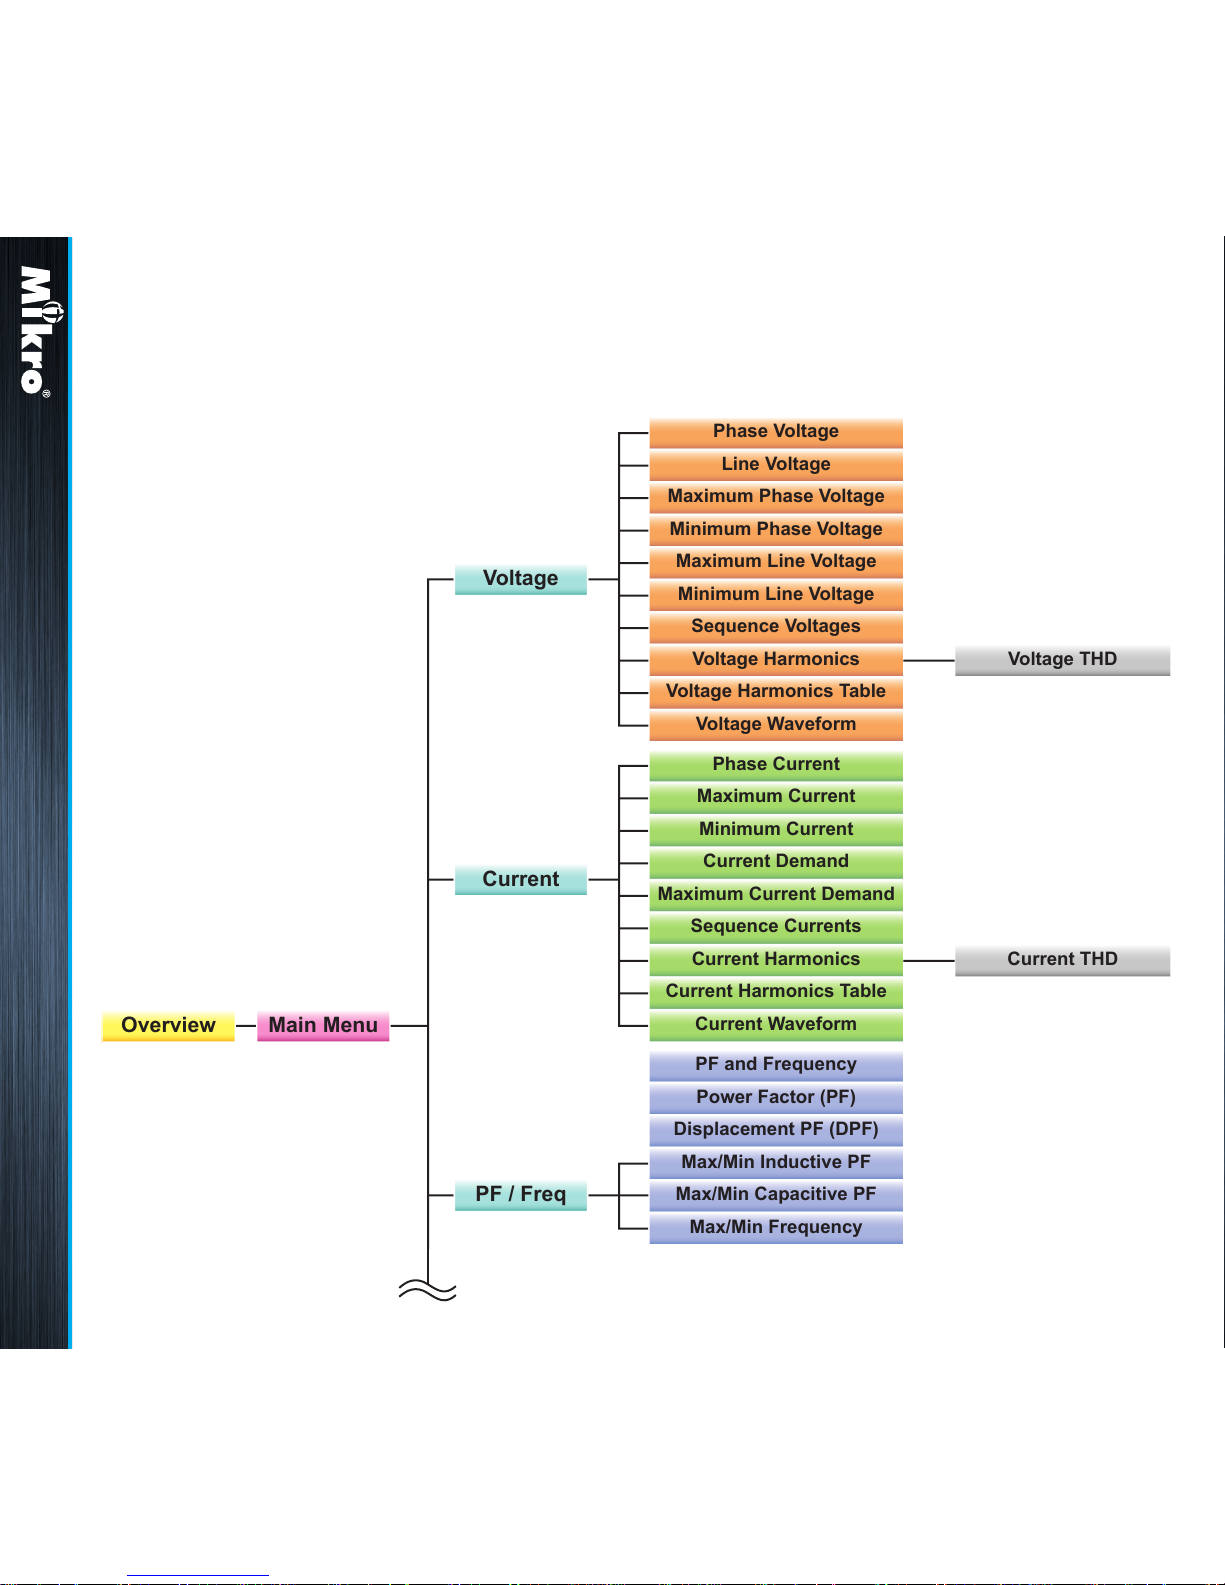
The OVERVIEW page & MAIN MENU and
Password Authentication sections of the Meter
Operations chapter 3 cover the common steps
before jumping to any parameter page. The tree
diagram shown in Fig 1 shows the menus, sub
menus, pages and sub pages to navigate through
before reaching the page of interest.
Please refer to the Table of Content to jump to
the operation details in the Meter Operations
chapter 3. Chapter 6 on Troubleshooting
Guide can be used stand-alone. For DPM680,
chapter 4 deals with the Webpage Operations.
Finally, chapter 5 on the Modbus Operations
should be used in conjunction with the DPM680
Modbus Communication Manual that can be
downloaded from the www.itmikro.com website.
Information on calculation methods are given in
Appendix B.
6
Phase Voltage
Overview Main Menu
Voltage
Current
PF / Freq
Line Voltage
Maximum Phase Voltage
Minimum Phase Voltage
Maximum Line Voltage
Voltage THD
Minimum Line Voltage
Sequence Voltages
Voltage Harmonics
Voltage Waveform
Current Demand
Minimum Current
Maximum Current
Phase Current
Maximum Current Demand
Sequence Currents
Current Harmonics Current THD
Current Waveform
Current Harmonics Table
PF and Frequency
Power Factor (PF)
Displacement PF (DPF)
Max/Min Inductive PF
Max/Min Capacitive PF
Max/Min Frequency
Voltage Harmonics Table
Fig 1 : Operation tree diagram
Introduction 1.1
Detailed technical specications and parametric
limits are listed in Appendix A.

7
Overview Main Menu
Voltage
Current
PF / Freq
Power
Energy
Setting
Maximum Phase Voltage
Minimum Phase Voltage
Maximum Line Voltage
Voltage THD
Minimum Line Voltage
Sequence Voltages
Voltage Harmonics
Voltage Waveform
Current Demand
Minimum Current
Maximum Current
Phase Current
Maximum Current Demand
Sequence Currents
Current Harmonics Current THD
Current Waveform
Current Harmonics Table
PF and Frequency
Power Factor (PF)
Displacement PF (DPF)
Max/Min Inductive PF
Max/Min Capacitive PF
Max/Min Frequency
Active Power
Reactive Power
Apparent Power
Total Power
Power Demand
Maximum Power Demand
Maximum Active Power
Minimum Active Power
Maximum Reactive Power
Minimum Reactive Power
Maximum Apparent Power
Minimum Apparent Power
Active Energy
Reactive Energy
Apparent Energy
Total Energy
Reset Energy Counters
CT & VT Ratios
Ethernet (TCP/IP)
Modbus
View Network Details
Version
Date & Time
Change Dev Password
Factory Settings
Display Settings
Comm Settings
System Settings
For Factory Use Only
Voltage Harmonics Table
Introduction 1.1

8
Front
Rear
Side
96 mm
83 mm
17 mm
100 mm
96 mm
90 mm
86 mm
86 mm
Fig 2 : Dimension of meter
1.2
ConTEnT of Box
Upon opening this box, you should nd the following items shown in Table 1:
1.3
parTs of THE powEr METEr
Fig 2 shows the outline dimension of the power meter.
Table 1 : Parts list
1
2
3
4
5
6
DPM680/B power meter
Retainer clip
Control power plug
RS-485 plug
Voltage input plug
This instruction manual
1
2
1
1
1
1
No Description Quantity
Introduction 1.2 1.3
9
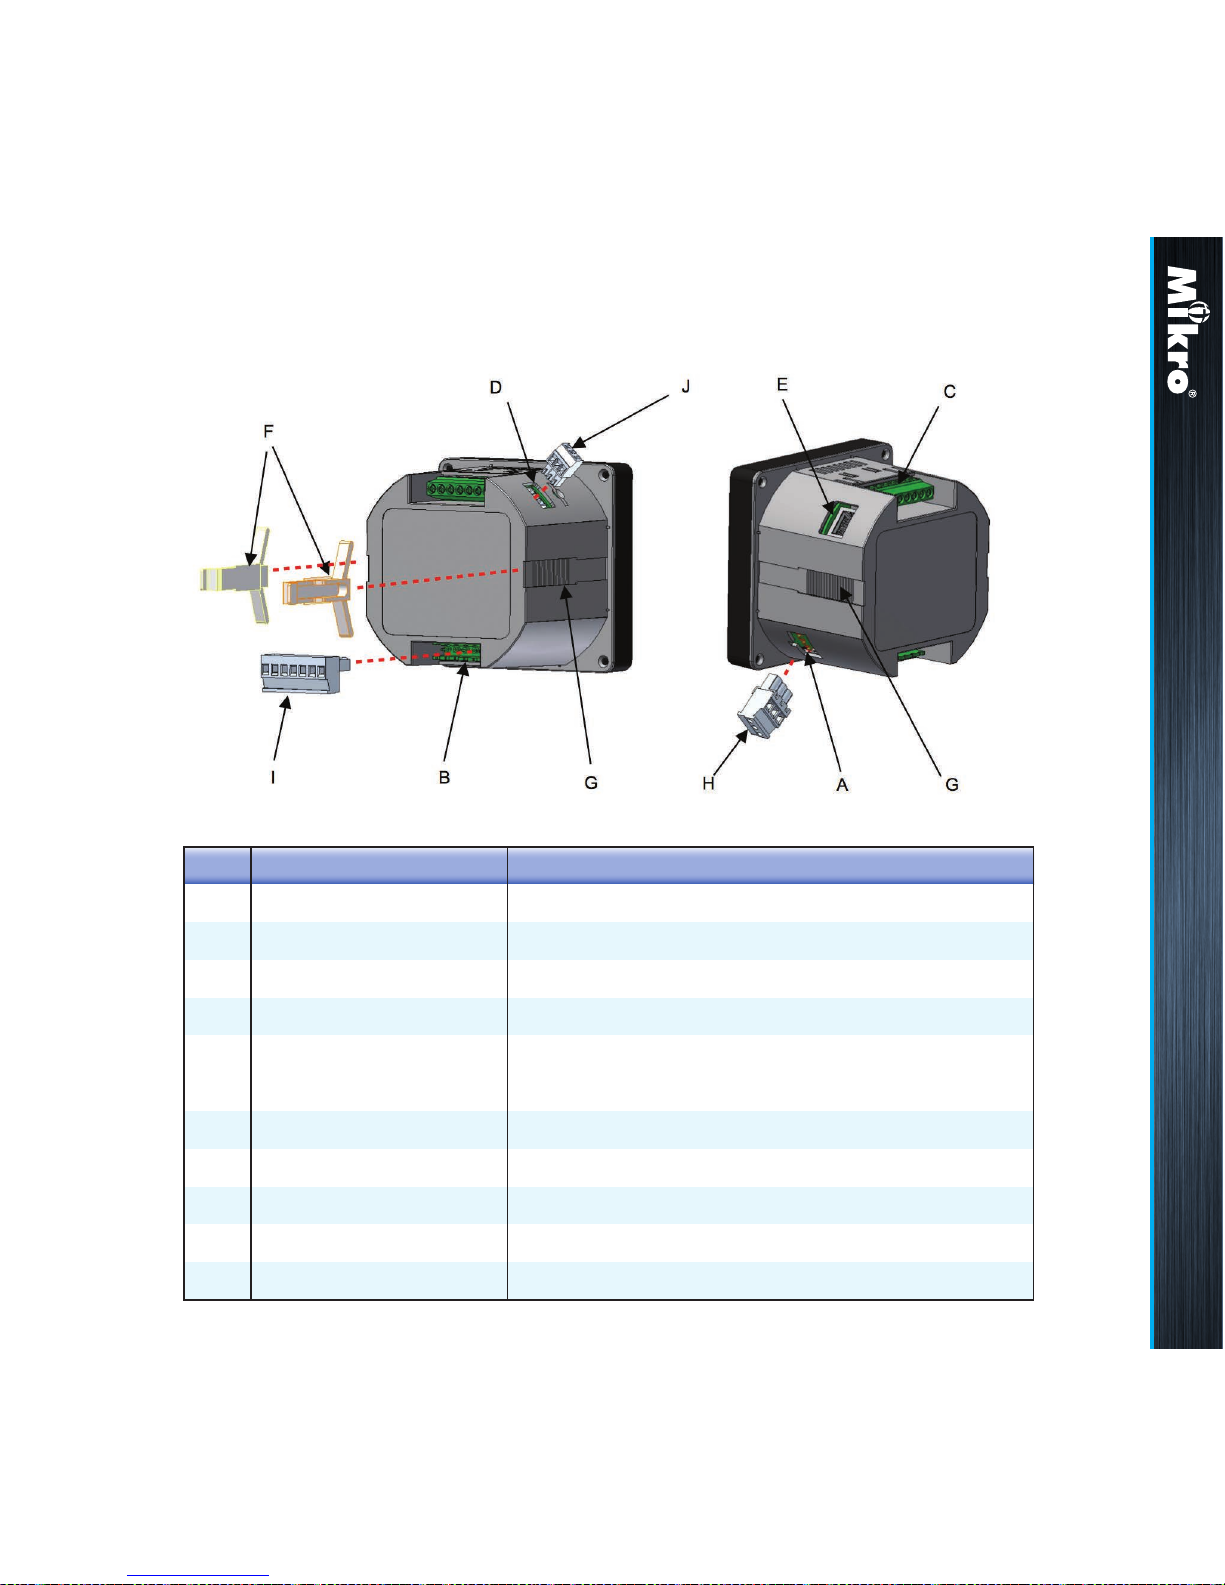
The parts and locations in the meter where connections and
fastening are made is shown in Fig 3 and Table 2:
Fig 3 : Parts location
Table 2 : Location and parts labels
Label
A
B
C
D
E
F
G
H
I
J
Part / Location Description
Control power input Meter control power supply
Voltage input Metering voltage connection
Current input Metering current connection
RS-485 port RS-485 connection for Modbus RTU
RJ45 port LAN connection for Modbus TCP/IP & webserver
(only for DPM680)
Retainer clip
Retainer clip slot
Control power plug
RS-485 plug
Voltage input plug
Clip to hold meter in cut out hole
Location to slide the retainer clips
Meter control power detachable terminal block
RS-485 detachable terminal block
Metering voltage detachable terminal block
Introduction 1.3
10
Please note that incorrect installation may impair
the operation or even damage the meter.
There is no user servicable part in the meter.
Tampering with the meter may damage the
meter, resulting in injury or even death and also
voiding any warranty.
2.2
METEr plaCEMEnT &
ConnECTions
Before installing the power meter, please
check that the environment meets the following
conditions:
• Operating temperature: -10˚C to +55˚C
• Humidity: 5% to 95%, non condensing.
• Dust free environment with sufcient ventilation
away from electrical noise and radiation.
All wiring must be in accordance with local codes
and regulations.
2
insTallaTion
2.1
prECauTions
Please observe the following safety precautions
before and during the installation of the power
meter:
• Only competent and trained personnel should
install this device.
• Use appropriate personal protective gloves,
glasses and clothing.
• Never work alone.
• Disconnect ALL (metering, control power and
communication) power sources to the meter
before performing installation, inspection, test
and maintenance.
• Do not perform megger, hi-pot or any high voltage
stress test with the meter connected to the system.
• Use a shorting block to short circuit the CTs
before disconnecting from the meter.
• Install in a suitable enclosure where meter
connections are inaccessible with suffcient
clearance from other live parts.
• Do not bypass any fuse.
• Follow safe electrical work practices.
• Use only dry cloth to wipe the meter.
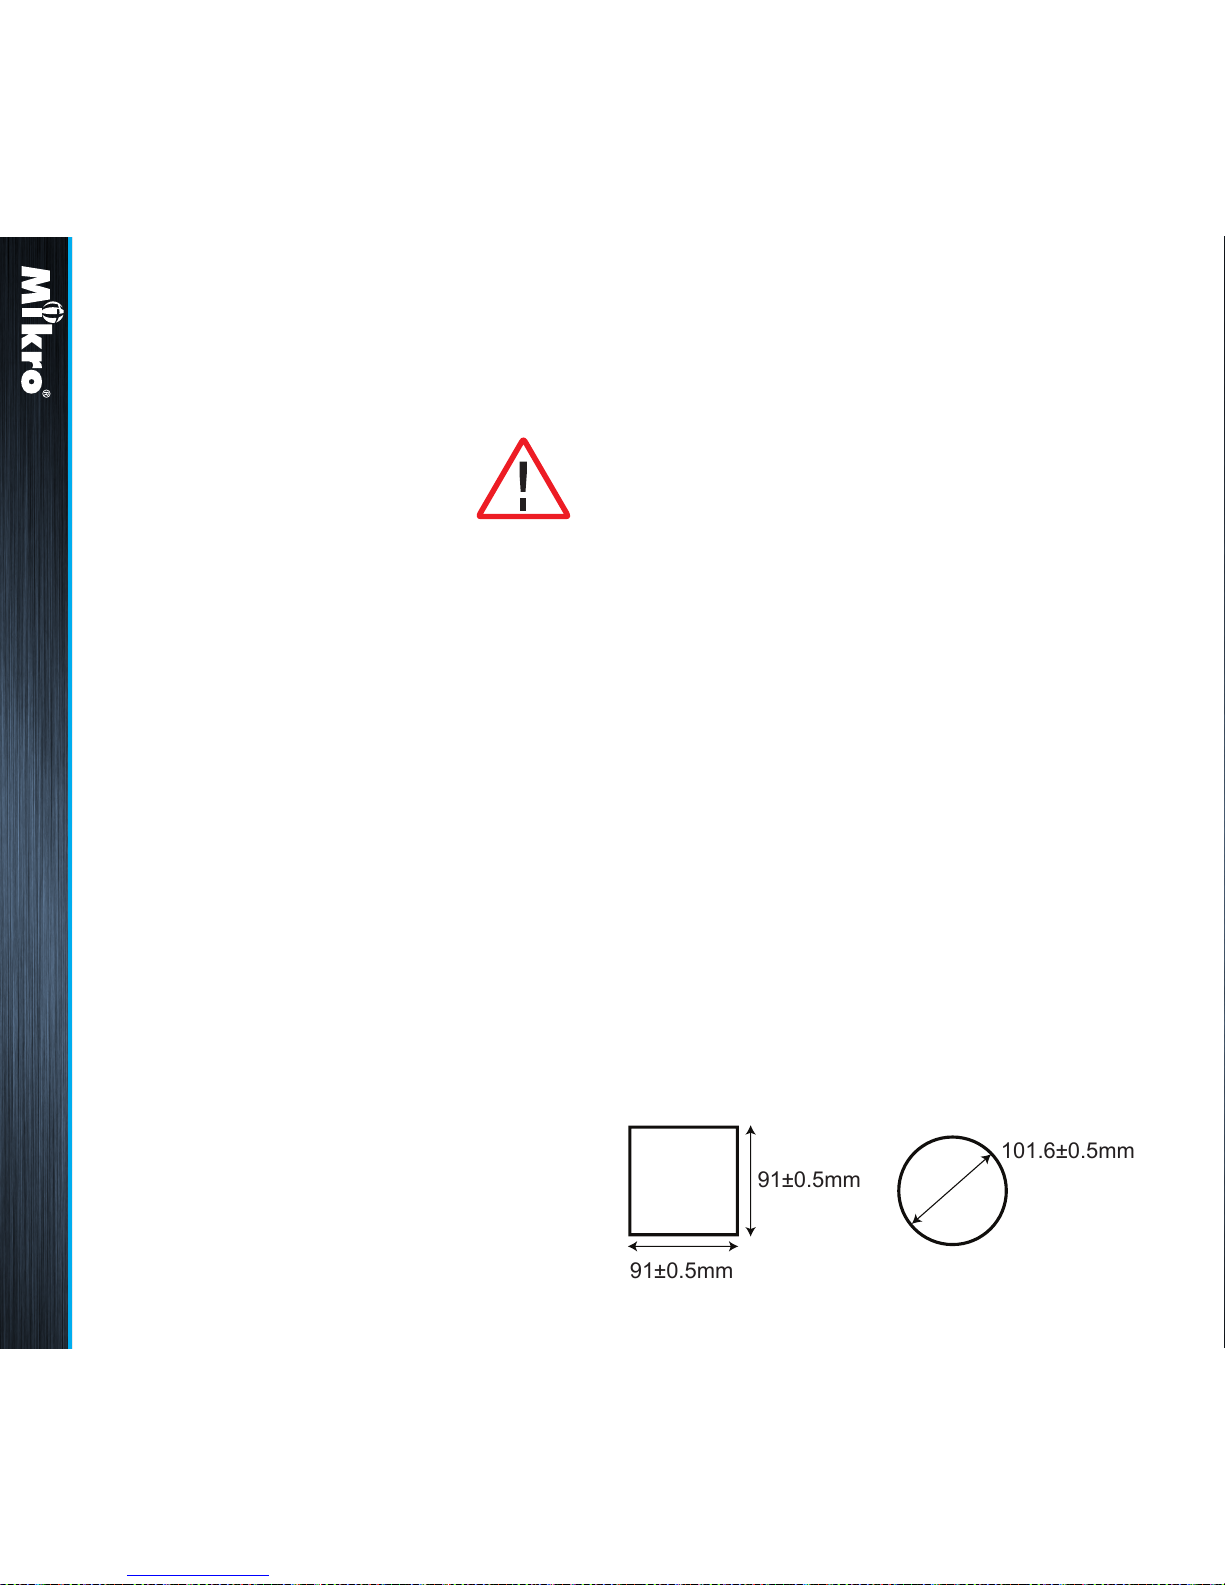
101.6±0.5mm
91±0.5mm
91±0.5mm
Fig 4 : Cut-out hole
Installation 2 2.1 2.2
11
a) provide a cut out hole on the switchgear and
control panel according to DIN43700/ANSI
C39.1 as shown in Fig 4.
b) insert the meter through the hole and slide in the
retainer clip along the slots on both sides of the
power meter until the device is tightly secured on
the switchgear and control panel. The direction
and orientation of the retainer clips is shown in
Fig 3. The retainer clip can be removed by lifting
the tab lightly at the handle end.
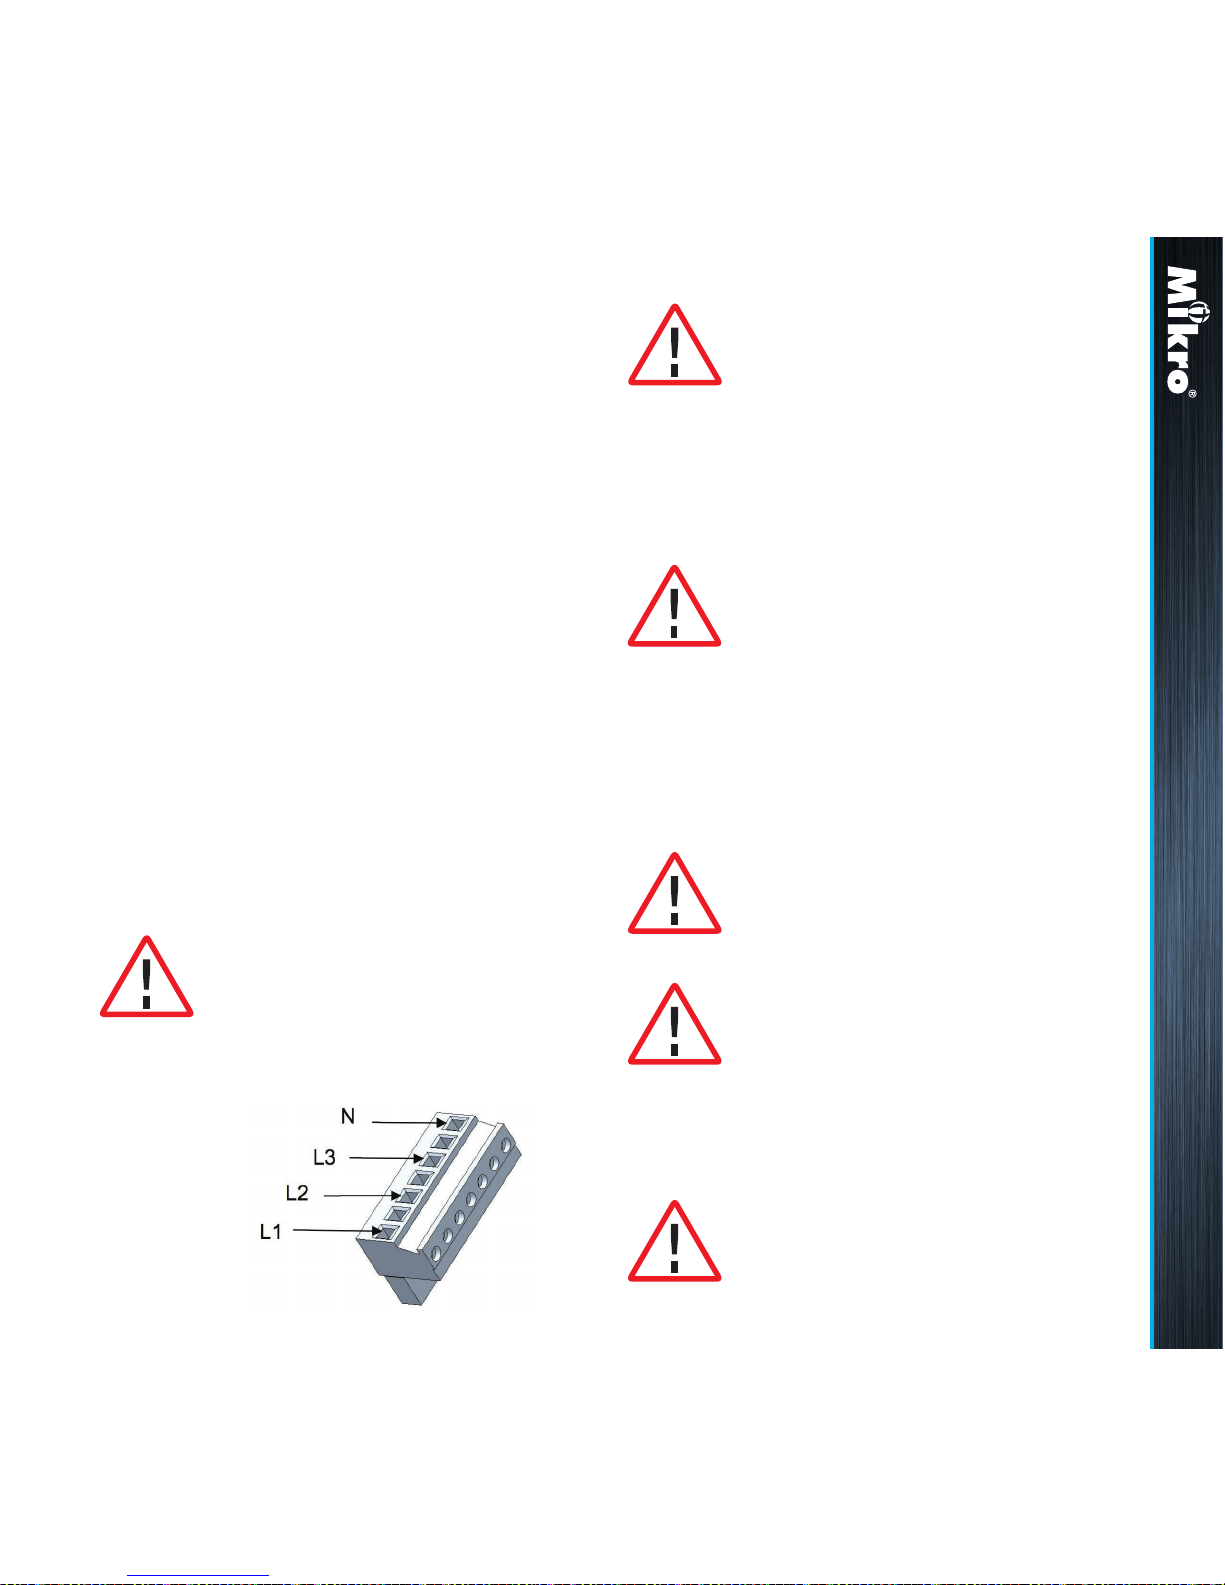
c) remove the detachable terminal block from
the voltage input connection and connect the
metering voltage inputs to the detachable
terminal block as shown in Fig 5 according
to the wiring schemes shown in Figs 6 to
9 below. The recommended wire size is
AWG16~22.
Please make sure the power to
the voltage metering input is totally
removed.
Shunt any unused metering voltage
input to the N input connection
Fig 5 :
Metering voltage input detachable terminal block
connections
Upon completing this step, please insert the
detachable terminal block securely into the
voltage input connector housing.
The terminal block must be inserted
securely into the connector housing
on the meter to prevent improper
operation.
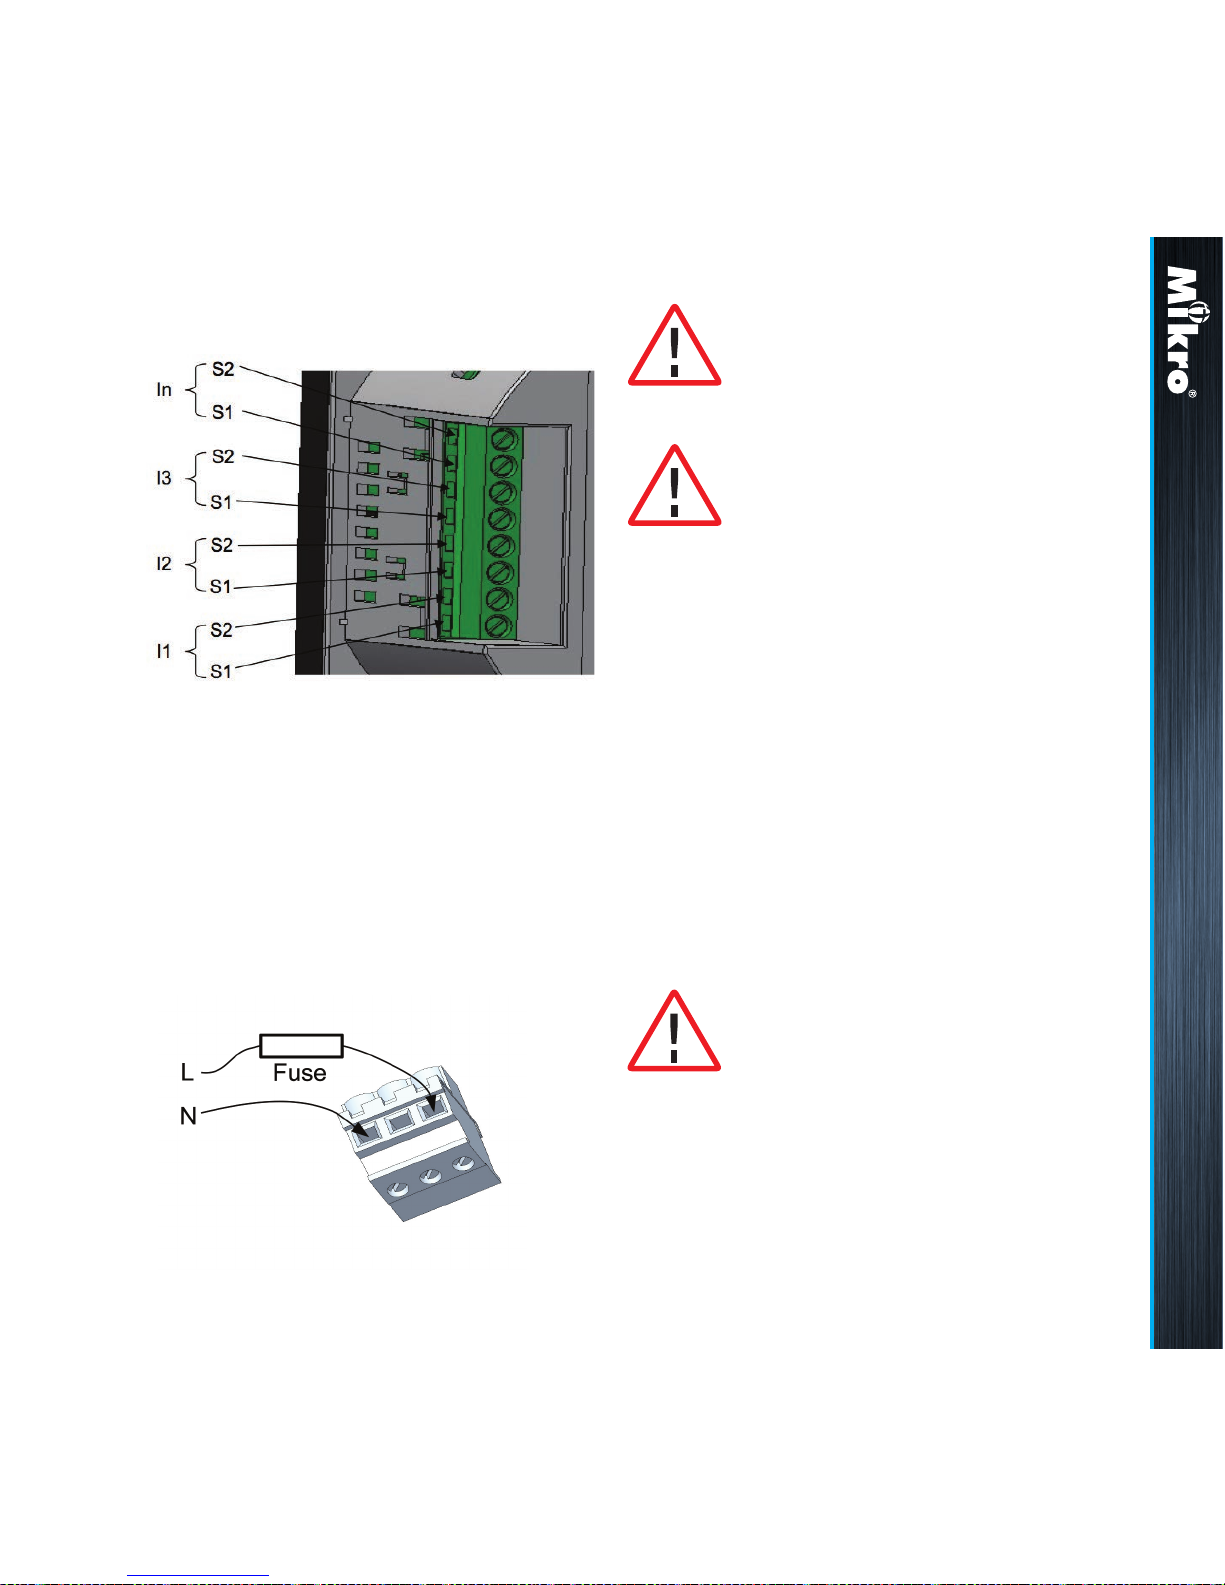
d) connect the metering current input to the current
input terminal block as shown in Fig 10 at page
12. The recommended wire size is AWG12~18.
Please make sure the power to the
current metering input is always
shunted. Under no circumstances
can the CT connections be left open
circuit. Use a CT shorting block if
necessary.
Never connect the metering current
input to the measured circuits
without using CTs.
Only use CTs complying with
IEC 61869 - 2
Installation 2.2
12
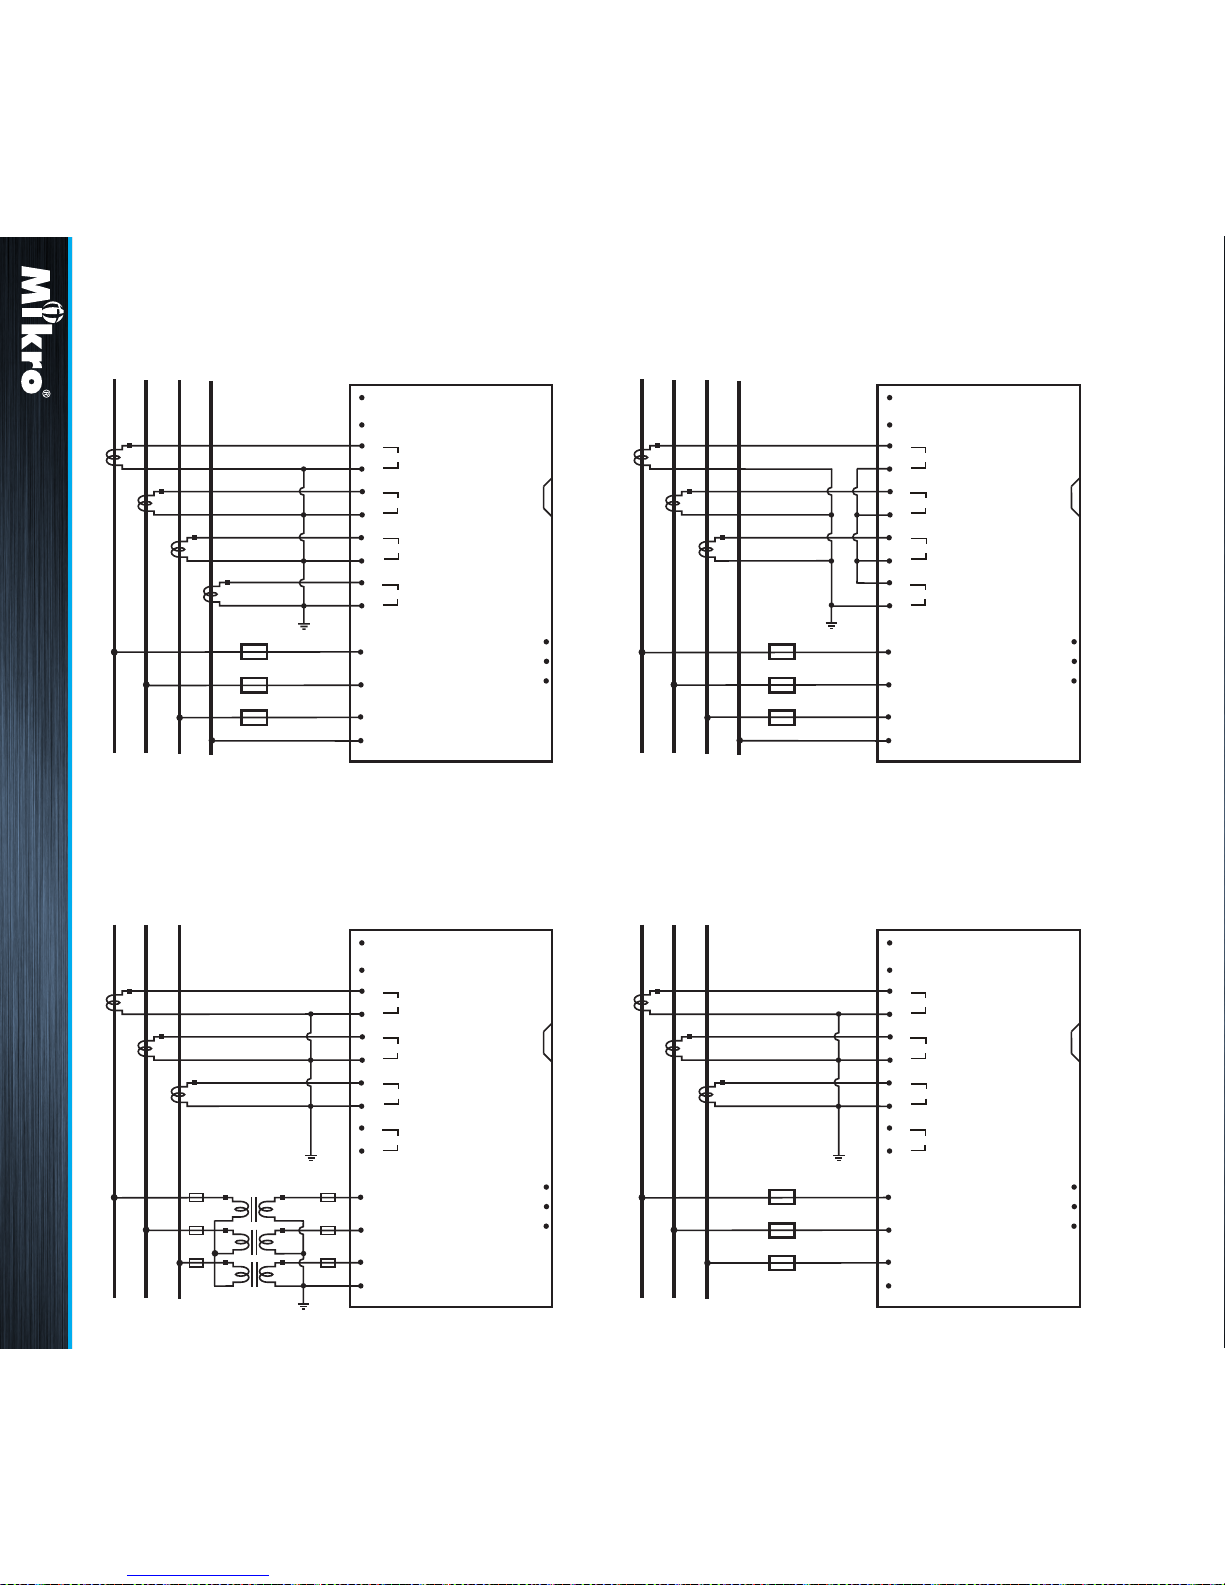
Fig 6 :
3-phase star plus neutral,
4CTs with direct voltage input connection
Fig 8 :
3-phase delta without neutral 3CTs with 3VTs connection
Fig 7 :
3-phase star plus neutral,
3CTs with direct voltage input connection
Fig 9 :
3-phase delta without neutral 3CTs with direct
voltage input connection
L3
L2
L1
S
2
S
1
S2
S1
S2
S1
l3
GND
l2
l1
S2
S1
ln
Ln
L3
L2
L1
Ln
90~415 V AC /
100~300 V DC
AUX
RS 485
Modbus-RTU
LOAD
Ethernet
(Only for DPM 680)
L3
L2
L1
RS 485
Modbus-RTU
Ethernet
(Only for DPM 680)
S
2
S
1
S2
S1
S2
S1
l3
GND
l2
l1
S2
S1
ln
Ln
L3
L2
L1
90~415 V AC /
100~300 V DC
AUX
LOAD
GND
L3
L2
L1
S
2
S
1
S2
S1
S2
S1
l3
GND
l2
l1
S2
S1
ln
Ln
L3
L2
L1
Ln
90~415 V AC /
100~300 V DC
AUX
LOAD
RS 485
Modbus-RTU
Ethernet
(Only for DPM 680)
L3
L2
L1
RS 485
Modbus-RTU
Ethernet
(Only for DPM 680)
S
2
S
1
S2
S1
S2
S1
l3
l2
l1
S2
S1
ln
Ln
L3
L2
L1
90~415 V AC /
100~300 V DC
AUX
LOAD
GND
Installation 2.2
13
Upon completing this step, please insert the
detachable terminal block into the meter control
power supply connector housing.
An isolation transformer or EMC lter may need
to be installed before feeding into the power
meter in case of power quality problems in the
control power supply.
e) remove the detachable terminal block from the
meter control power supply connection and
connect the control power supply via a fuse
to the terminal block as shown in Fig 11. The
recommended wire size is AWG 16 ~ 20.
The recommended fuse part no is LVSP5 from
Littelfuse. Please note that without this fuse, the
meter installation is only rated at CAT II. For CAT
II installations, an adequate circuit breaker or fuse
according to local regulations should be installed.
Please make sure the power to the
meter control is totally removed.
The meter control power supply
MUST be connected via an external
circuit breaker and be protected by a
CAT IV fuse.
Fig 10 :
3-phase and neutral CT connections
Fig 11 :
Control power connections
Installation 2.2
The terminal block must be inserted
securely into the connector housing
on the meter to prevent improper
operation.
Installation 2.2
14
Up to 32 devices can be connected in a daisy
chain fashion and the total cable length should
not be more than 1000m.
Upon completing this step, please insert the
detachable terminal block into the RS-485 port
connector housing.
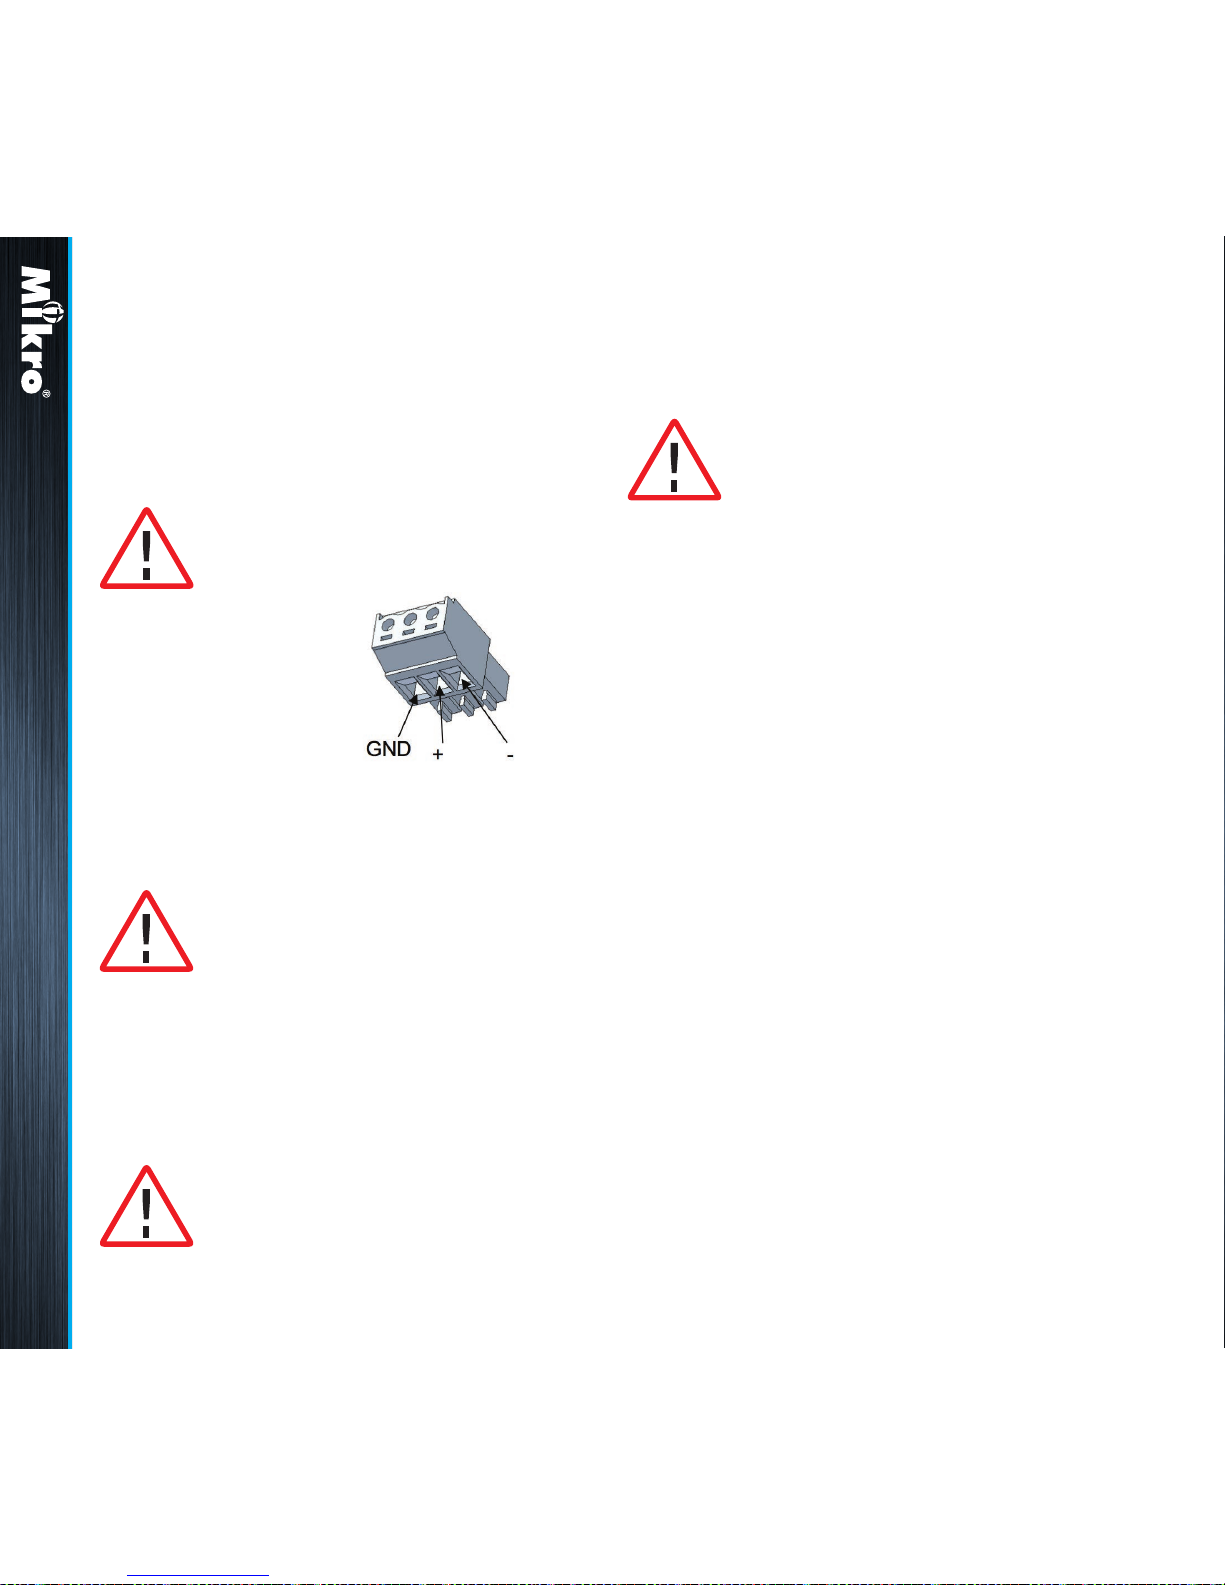
f) if Modbus RTU is used, remove the
detachable terminal block from the RS-485
port and connect the Modbus communication
cable to the terminal block as shown in Fig
12. The recommended wire size is AWG22 or
thicker, shielded twisted pair.
g) for DPM680, if Modbus TCP/IP or the web-
server is used, simply connect the LAN cable’s
RJ45 connector to the RJ45 port shown in Fig 3.
Please make sure the polarity is
correctly aligned.
Please make sure the connector
snaps into the port to ensure proper
connection is made.
Avoid running the cable near
sources of electrical noise. The
network cable shield should be
grounded at only ONE end.
Fig 12 :
Modbus RTU connections
2.3
METEr sETup
Before commencing operation, the meter has to
be set up. To do this, the meter must be powered
up by the meter control power supply.
Under section 3.8, the following parameters
should be reviewed against the default value and
modied if necessary:
• CT ratio and VT ratio, see section 3.8.1
• IP address and subnet mask, see sections
3.8.2.1 and 3.8.2.3 (only for DPM680)
• RS-485 serial data format and baud rate,
see section 3.8.2.2
• Modbus RTU device address,
see section 3.8.2.2
• Modbus remote read enable,
see section 3.8.2.2
• Date and time, see section 3.8.3.2
• Device password, see section 3.8.3.3
The terminal block must be inserted
securely into the connector housing
on the meter to prevent improper
operation.
Installation 2.2 2.3

15
To reset the energy register values, please see
section 3.7.5
The following parameters should also be
reviewed against the default value and modied
if necessary:
• demand interval and sub interval block for
thermal current demand, see section 3.4.4
• demand interval and sub interval block for
power demand, see section 3.6.5
The following registers should be reviewed and
reset if necessary:
• maximum and minimum phase voltages, see
sections 3.3.3 & 3.3.4
• maximum and minimum line voltages, see
sections 3.3.5 & 3.3.6
• maximum and minimum current, see sections
3.4.2 & 3.4.3
• maximum current demand, see section 3.4.5
• maximum and minimum inductive power factor,
see section 3.5.4
• maximum and minimum capacitive power factor,
see section 3.5.5
• maximum and minimum frequency, see section
3.5.6
• maximum power demand, see section 3.6.6
• maximum and minimum active power, see
sections 3.6.7 & 3.6.8
• maximum and minimum reactive power, see
sections 3.6.9 & 3.6.10
• maximum and minimum apparent power, see
sections 3.6.11 & 3.6.12
2.4
TCp/ip ConnECTion sETup
The meter runs on IPv4 and its TCP/IP settings
can either be xed by the user or assigned
via DHCP. By default, the TCP/IP settings are
assigned via DHCP and the alternate default
xed TCP/IP settings are as follow:
IPv4 address: 192.168.28.28
Subnet mask: 255.255.255.0
Gateway address: 192.168.28.1
These values can be changed at the meter as
explained in section 3.8.2.1.
Installation 2.3 2.4
16
e) Single click to highlight the Internet Protocol
Version 4 (TCP/IPv4) bar and click on the
Properties button. The Internet Protocol
Version 4 (TCP/IPv4) Properties window will
appear as shown in Fig 14.
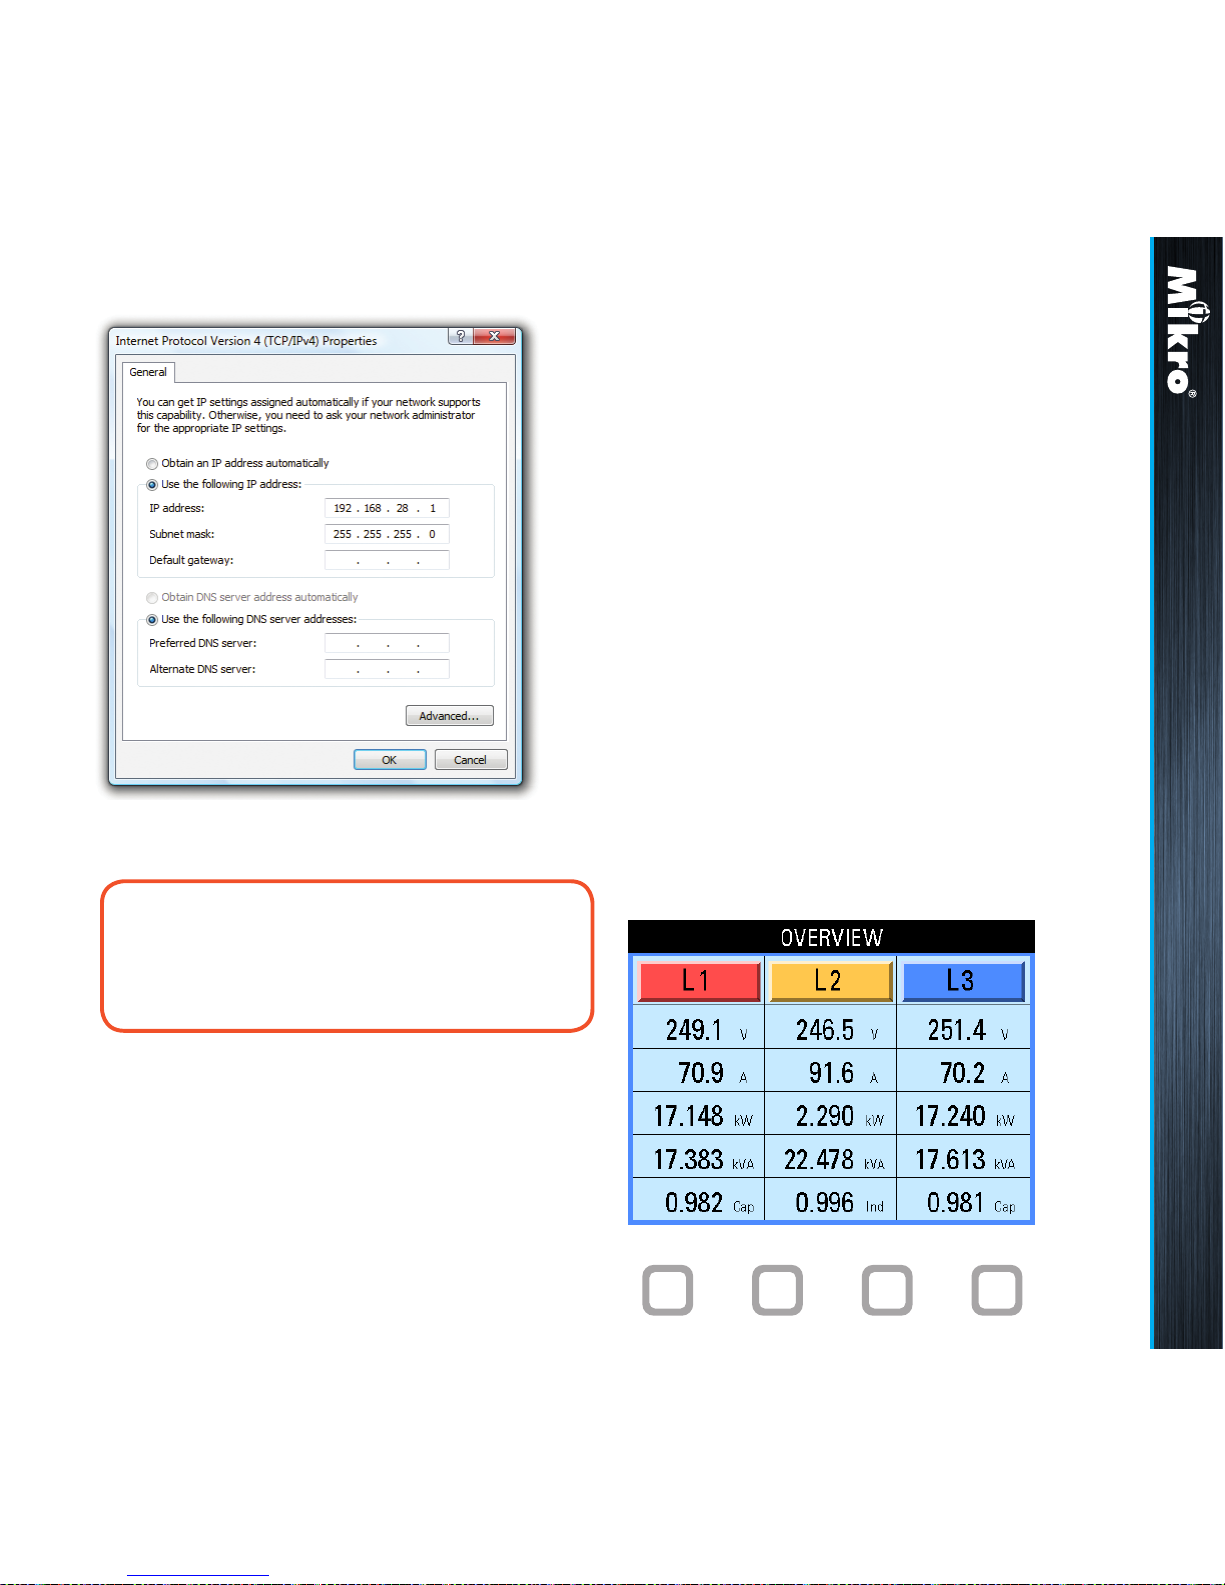
f) check on the Use the following IP address
button and set the IP address to 192.168.28.1
and the subnet mask to 255.255.255.0 as
shown below.
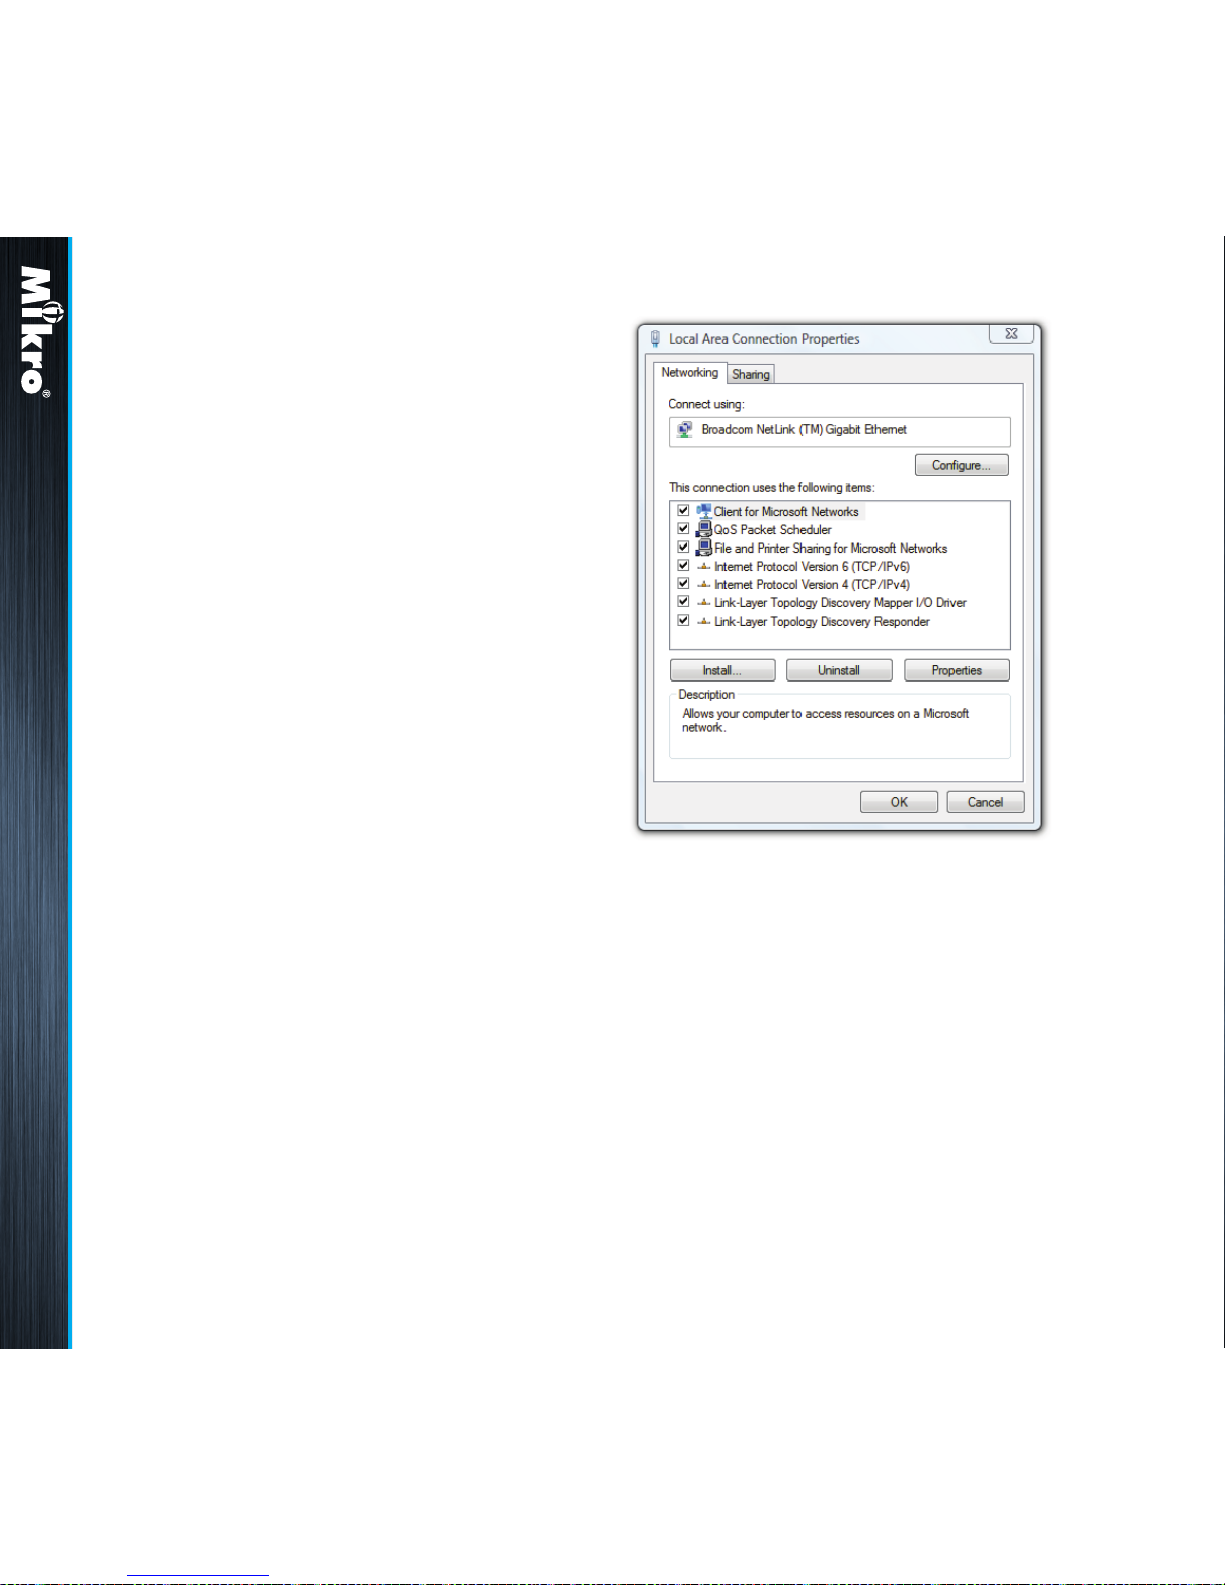
Fig 13 :
Local Area Connection Properties window
Only devices within the sub-network as dened
by the subnet mask can communicate with the
meter. In the instance of the above default subnet
mask, only devices (e.g. PC or router, etc.) with
IP addresses that begin with 192.168.28 can
communicate with the meter.
For direct PC connection, the IP address of the
PC can be changed as follows:
a) go to the START menu and click on the
Control Panel label.
b) under the Network and Internet heading,
click on the View network status and tasks
link.
c) under the Tasks sidebar, click on the Manage
network connections link.
d) double click on the LAN port that is connected
to the meter. You may be asked by Windows
for access permission. Upon conrmation,
you will see the Local Area Connection
Properties window as shown in Fig 13.
Installation 2.4
17
Fig 14 :
Internet Protocol Version 4 (TCP/IPv4) Properties window
noTE:
The last digit of the IP address may be varied
from 1 up to 255 but care must be taken to
use only a vacant IP address.
Meter Operations 2.4 3 3.1
3
METEr opEraTions
The power meter front panel user interface comes
with a large colour LCD display and 4 touch buttons,
labelled F1, F2, F3 and F4 as shown in Fig 15.
To touch the button, simply place a nger on the
square below the labels corresponding to the menu
item at the bottom of the display.
3.1
oVErViEw paGE & Main
MEnu
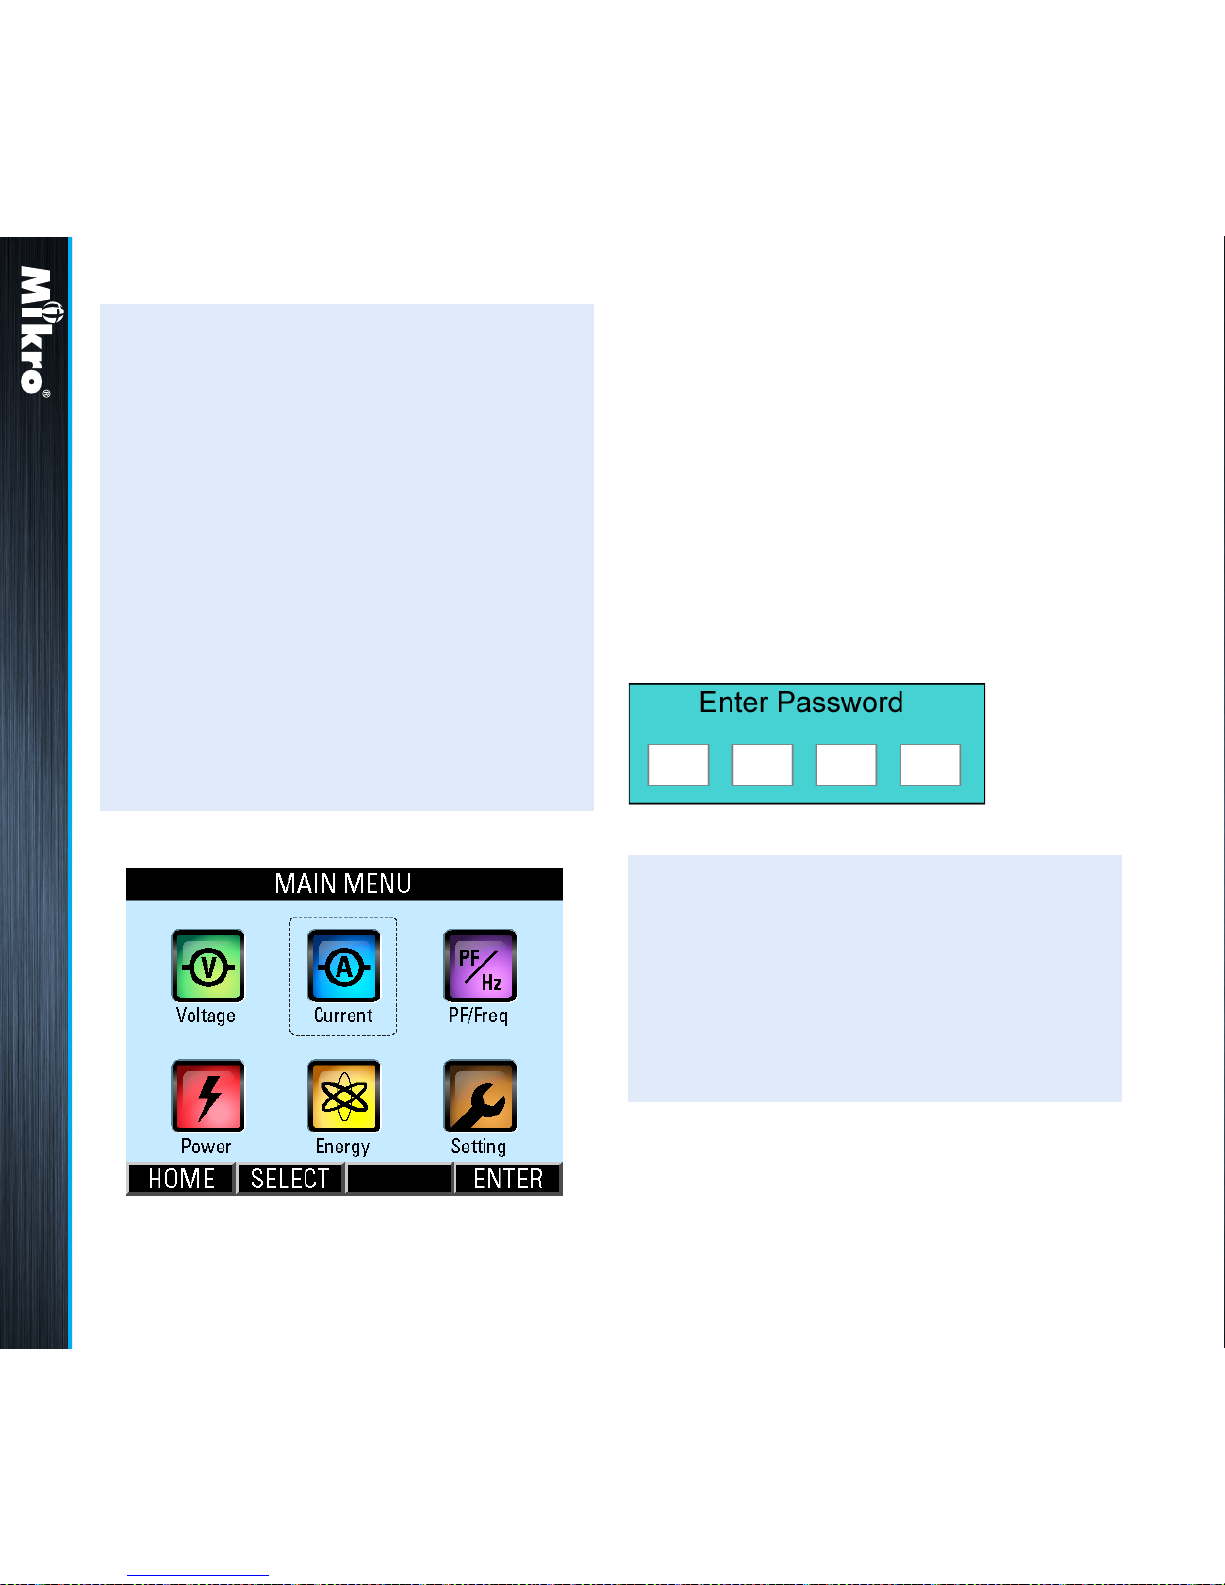
Upon power up, the power meter will display an
OVERVIEW page, listing a summary of basic
parameters for all phases as shown in Fig 15:
g) click on the OK button to exit. Repeat pressing
the OK button in the Local Area Connection
Properties window.
Fig 15 : OVERVIEW page
F1 F2 F3 F4
18
TouCH BuTTon funCTions:
• when any button is touched, the MAIN
MENU will be displayed as shown in Fig 16
below.
• to go to the sub-menu of interest, touch the
SELECT (F2) button in multiple times until
the corresponding icon is highlighted (within
a dashed rectangular box) as shown in
Fig 16. To conrm this selection, touch the
ENTER (F4) button.
• to return to the OVERVIEW page, touch the
HOME (F1) button in the MAIN MENU.
When the power meter is left idle for more than 5
minutes, the display will default to the OVERVIEW
page.
Fig 16 : MAIN MENU
Meter Operations 3.1 3.2
3.2
passworD
auTHEnTiCaTion
For authentication in the parameter setting
operations, the user may be prompted for a valid
password. In this mode, the Enter Password
window as shown in Fig 17 below will appear.
TouCH BuTTon funCTions:
• to abort the operation and return to the
previous page, touch the ABORT (F4) button.
• otherwise, touch the SET (F1) button to enter
the input password mode.
In the input password mode, the UP (F2) and
DOWN (F3) buttons will become active and
the background colour of the active eld will be
changed to white.
Fig 17 : Enter Password window

19
noTE:
The device password will be used for all
authentication purposes except in the
Factory Settings sub page.
The default device password is 9999. The user
is advised to set their own password for security
reasons.
On the other hand, the factory setting password
is xed at 6256 and it cannot be changed.
Meter Operations 3.2
TouCH BuTTon funCTions:
• to increase the number, touch the UP (F2)
button.
• to decrease the number, touch the DOWN
(F3) button.
• to select the next active eld to change, touch
the NEXT (F1) button and repeat the above 2
steps.
• to abort the operation and return to the
previous page, touch the ABORT (F4) button.
• to conrm the password, touch the ENTER
(F4) button. If the password is wrong, an
error message will appear and the above
process has to be repeated unless aborted
by touching the ABORT (F4) button.
20
TouCH BuTTon funCTions:
• to select the parameter page of interest,
touch either the UP (F2) or DOWN (F3)
button until the item of interest is highlighted
(within a dashed rectangular box and a RED
dot to its left).
• to conrm this selection, touch the ENTER
(F4) button.
• to return to the MAIN MENU, touch the
BACK (F1) button.
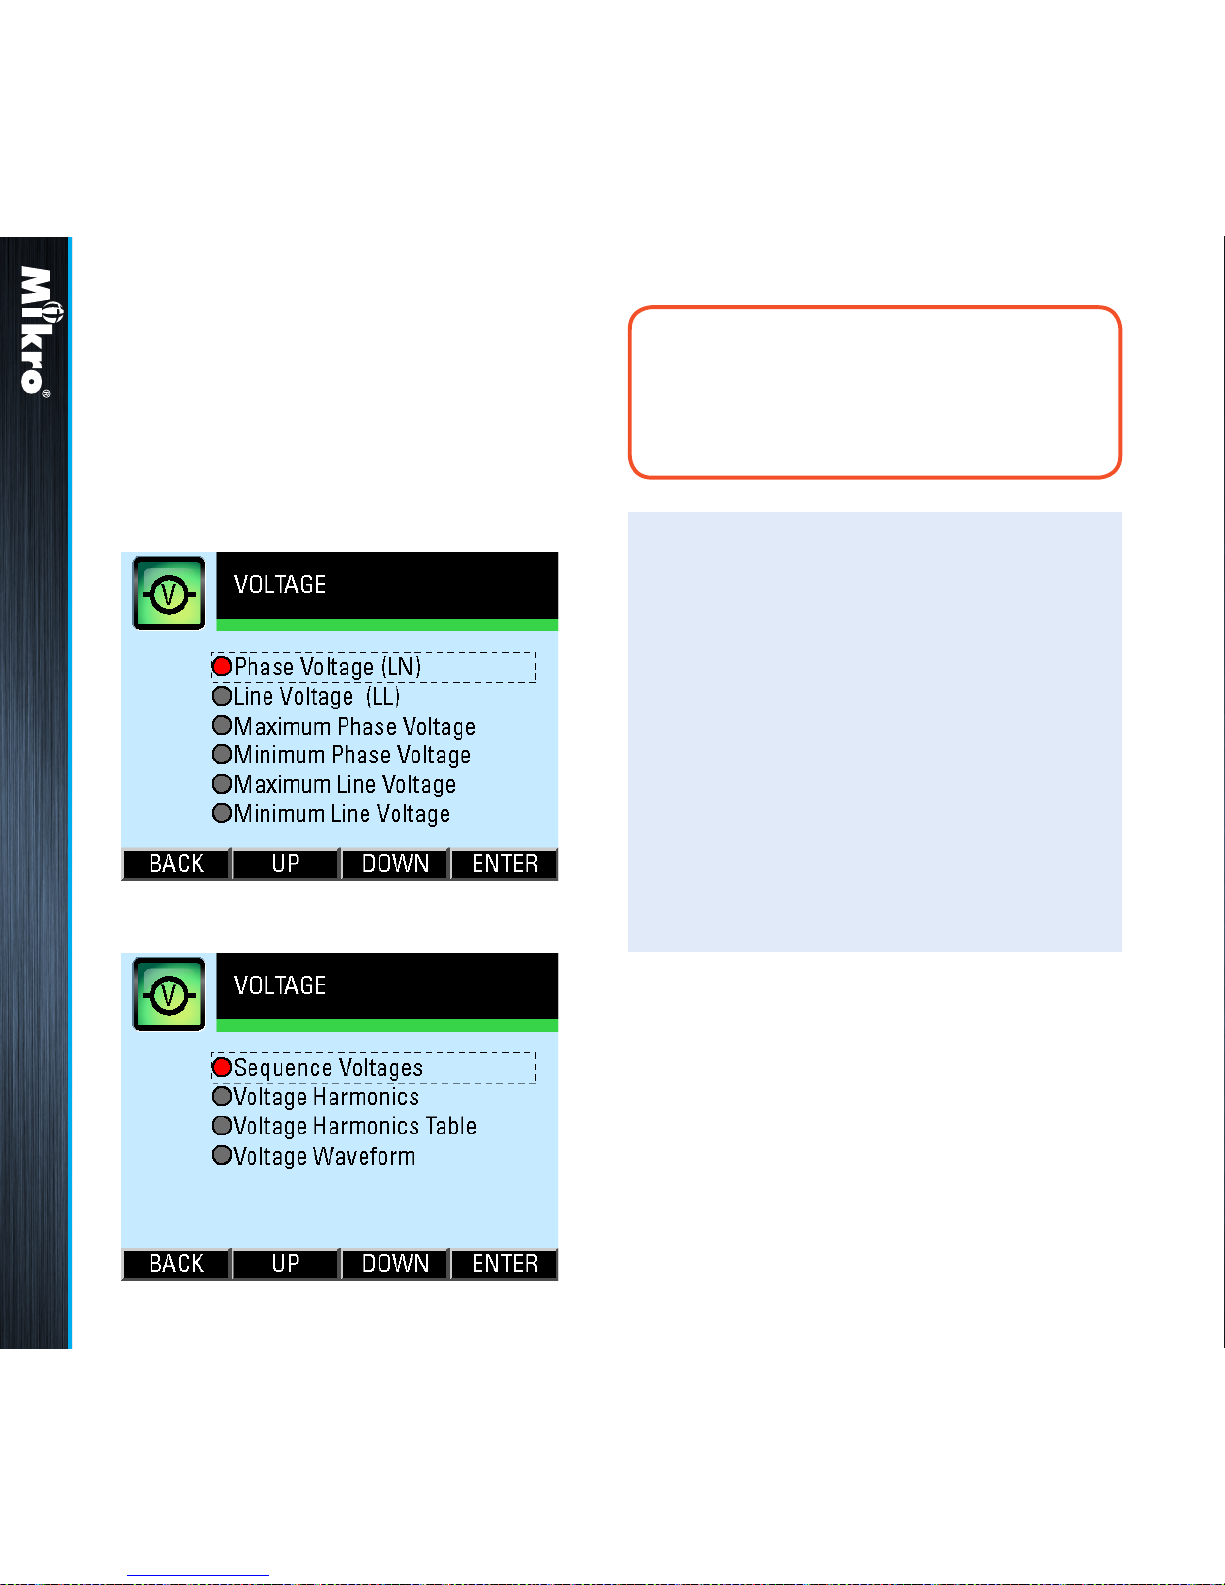
3.3
VolTaGE suB-MEnu
The VOLTAGE sub-menu allows the selection of
voltage parameter pages as shown in Fig 18 and
its continuation in Fig 19:
Fig 18 : VOLTAGE sub-menu
Fig 19 : VOLTAGE sub-menu (cont’d)
noTE:
In a delta system without any neutral as shown
in Figs 8 and 9, the phase quantities are
measured with respect to a virtual neutral point.
Meter Operations 3.3
21
TouCH BuTTon funCTions:
• to jump to the Maximum Phase Voltage
page, touch the PEAK (F2) button.
• to jump to the Line Voltage page, touch the
LINE (F3) button.
• to jump to the Voltage Waveform page,
touch the WAVE (F4) button.
• otherwise, touch the BACK (F1) button to
return to the VOLTAGE sub-menu.
TouCH BuTTon funCTions:
• to jump to the Maximum Line Voltage page,
touch the PEAK (F2) button.
• to jump to the Phase Voltage page, touch the
PHASE (F3) button.
• to jump to the Voltage Waveform page,
touch the WAVE (F4) button.
• otherwise, touch the BACK (F1) button to
return to the VOLTAGE sub-menu.
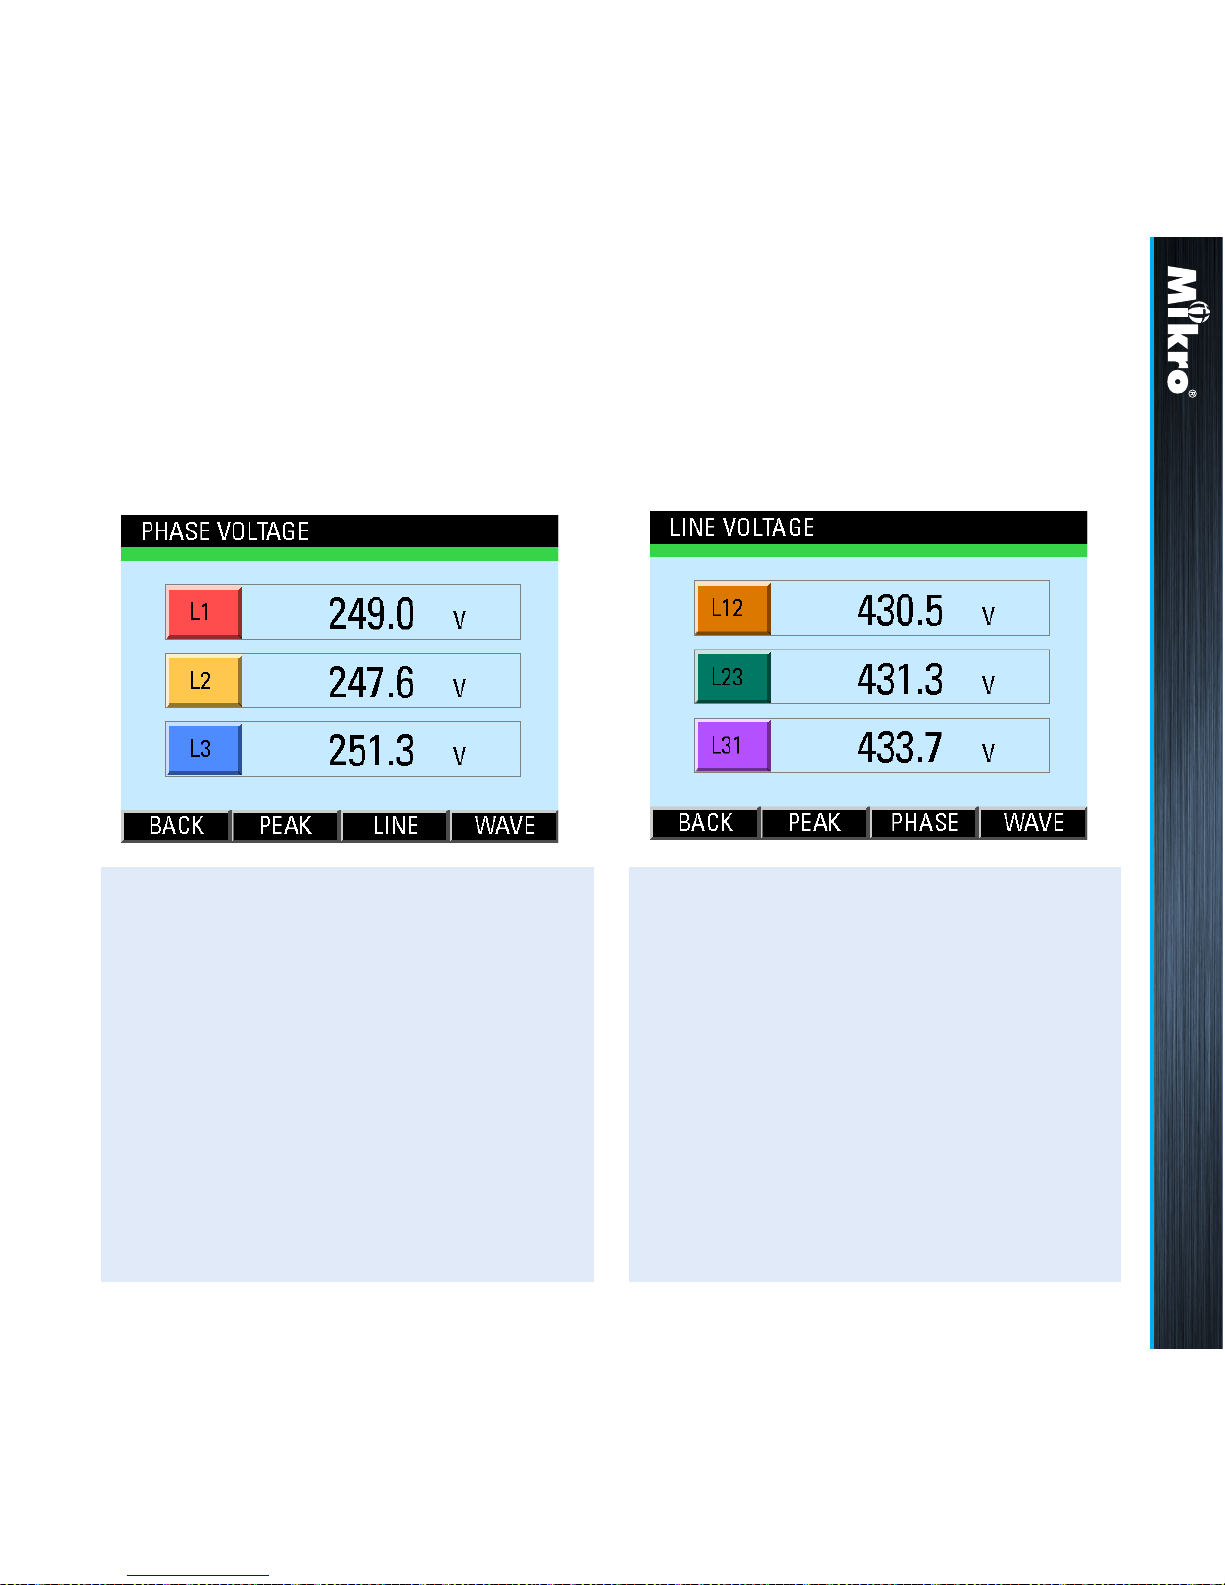
3.3.1
pHasE VolTaGE
The Phase Voltage page shows the true RMS
voltage of each phase as shown in Fig 20 below:
3.3.2
linE VolTaGE
The Line Voltage page shows the true RMS
voltage between any 2 phases as shown in Fig 21:
Fig 20 : Phase Voltage page
Fig 21 : Line Voltage page
Meter Operations 3.3.1 3.3.2
22
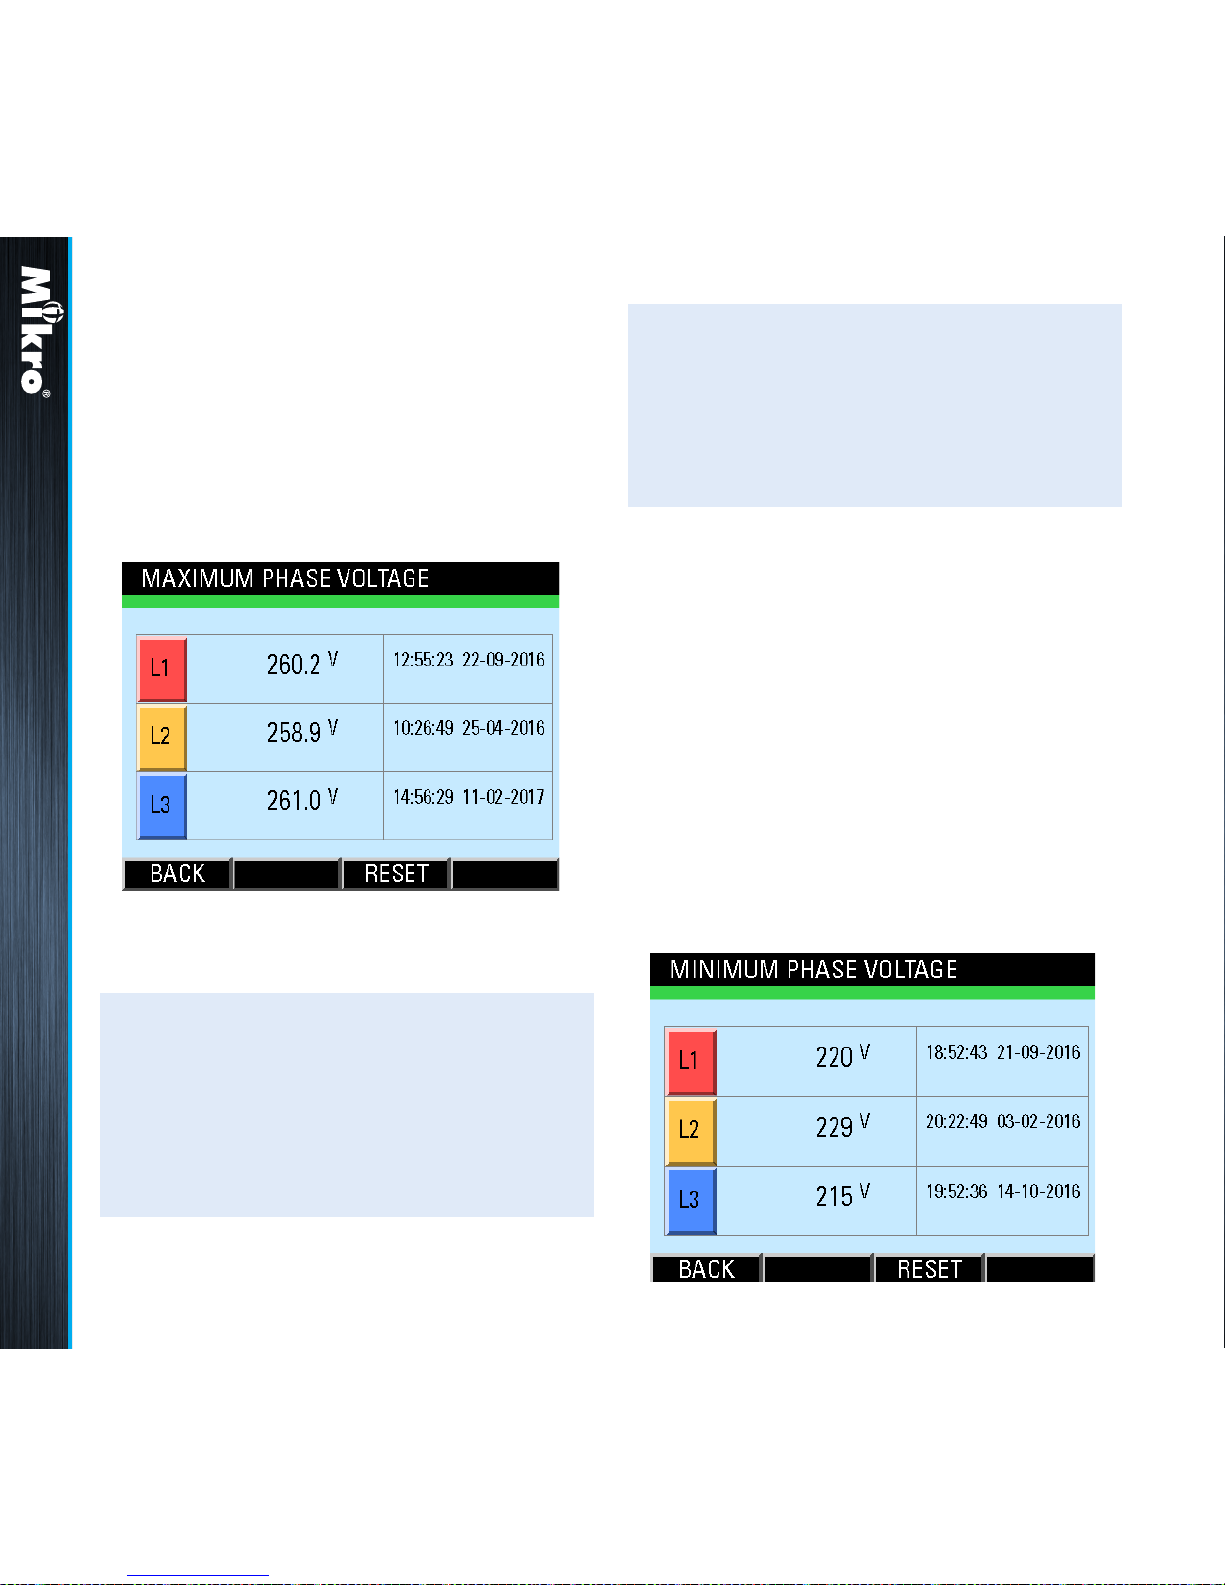
3.3.3
MaxiMuM pHasE VolTaGE
The Maximum Phase Voltage page shows the
recorded maximum true RMS phase voltage with
the corresponding time and date since the last
reset as shown in Fig 22:
The time and date records are displayed in the
hour:minute:second day-month-year format.
In clearing the recorded values, the user will be
prompted with a Clear Logged Data? conrmation.
When these recorded values are cleared, the
corresponding time and date records are also
cleared to the default 00:00:00 00-00-2000.
3.3.4
MiniMuM pHasE VolTaGE
The Minimum Phase Voltage page shows the
recorded minimum true RMS phase voltage with
the corresponding time and date since the last
reset as shown in Fig 23:
Fig 22 : Maximum Phase Voltage page
Fig 23 : Minimum Phase Voltage page
TouCH BuTTon funCTions:
• to reset the recorded maximum voltage
values to zero, touch the RESET (F3) button.
• otherwise, touch the BACK (F1) button to
return to the VOLTAGE sub-menu.
TouCH BuTTon funCTions:
• to conrm clearing the recorded values, touch
the YES (F4) button.
• otherwise, touch the NO (F2) button.
Meter Operations 3.3.3 3.3.4
23
The time and date records are displayed in the
hour:minute:second day-month-year format.
The time and date records are displayed in the
hour:minute:second day-month-year format.
In clearing the recorded values, the user
will be prompted with a Clear Logged Data?
conrmation.
When these recorded values are cleared, the
corresponding time and date records are also
cleared to the default 00:00:00 00-00-2000.
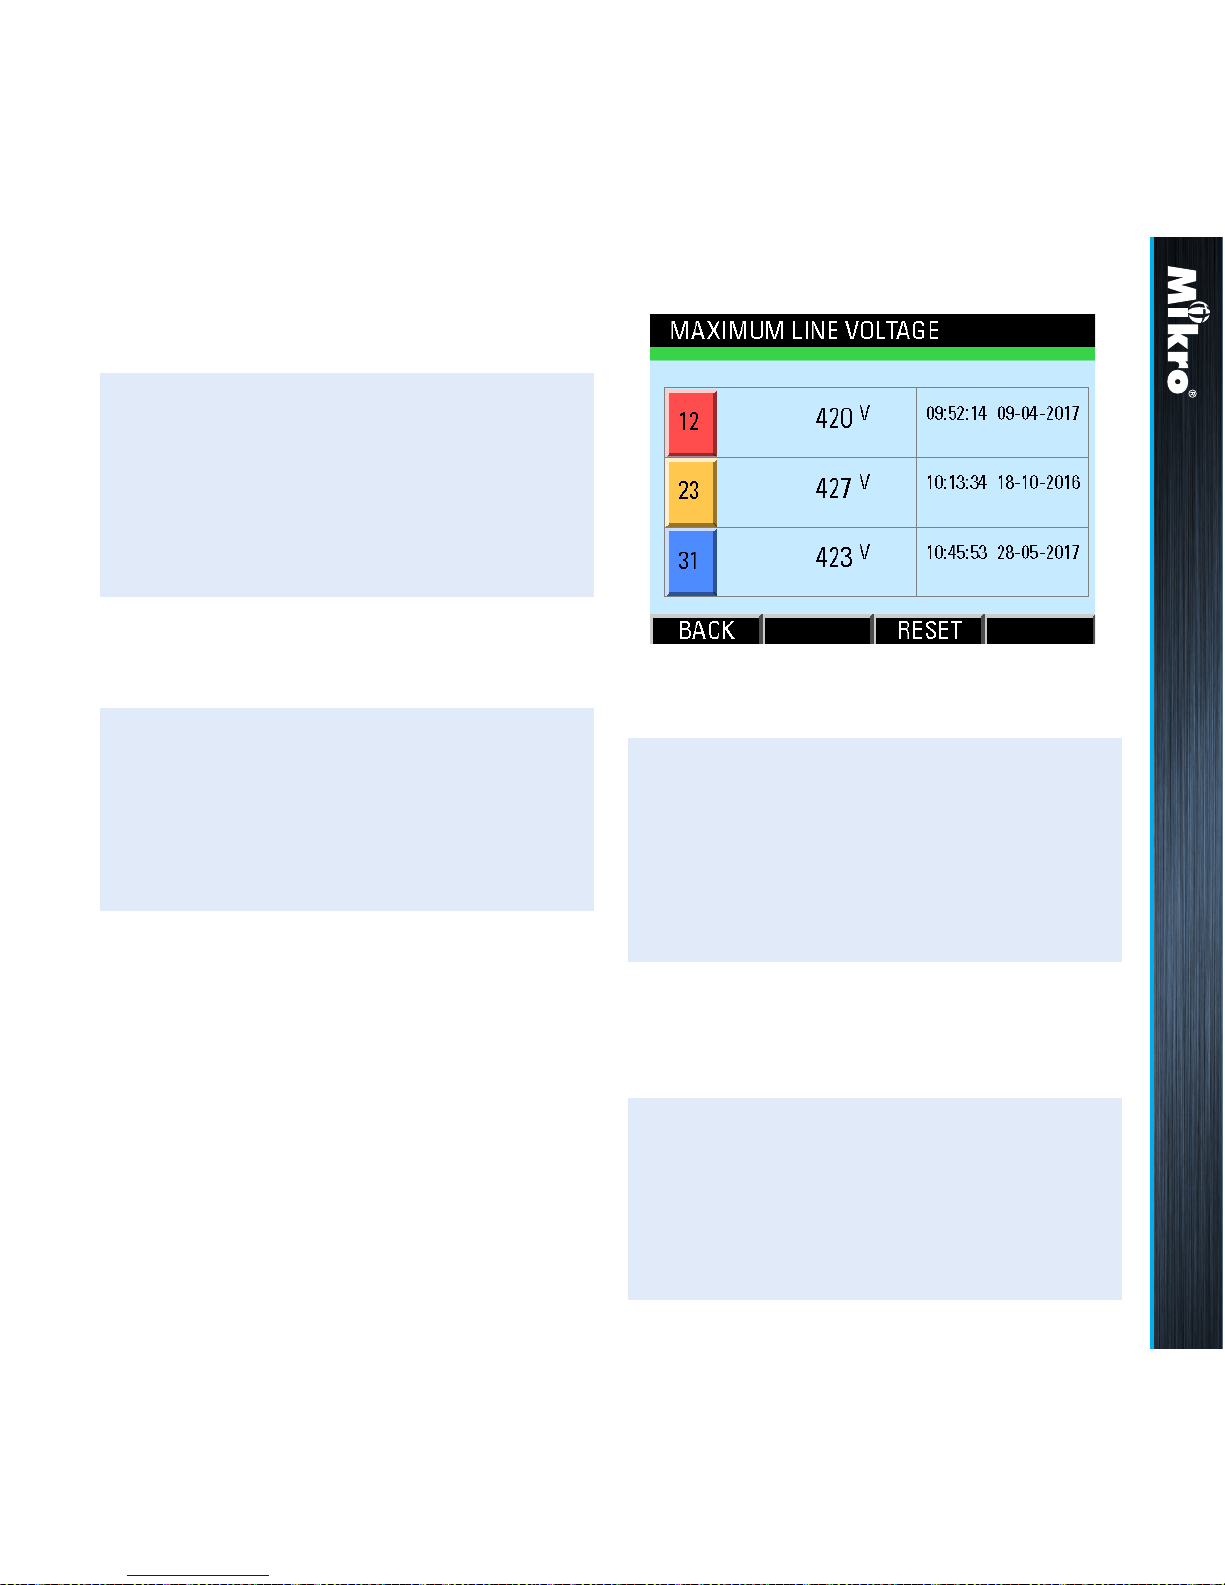
3.3.5
MaxiMuM linE VolTaGE
The Maximum Line Voltage page shows the
recorded maximum true RMS line voltage with
the corresponding time and date since the last
reset as shown in Fig 24:
Fig 24 : Maximum Line Voltage page
TouCH BuTTon funCTions:
• to reset the recorded minimum voltage values
to zero, touch the RESET (F3) button.
• otherwise, touch the BACK (F1) button to
return to the VOLTAGE sub-menu.
TouCH BuTTon funCTions:
• to reset the recorded maximum voltage
values to zero, touch the RESET (F3) button.
• otherwise, touch the BACK (F1) button to
return to the VOLTAGE sub-menu.
TouCH BuTTon funCTions:
• to conrm clearing the recorded values, touch
the YES (F4) button.
• otherwise, touch the NO (F2) button.
In clearing the recorded values, the user
will be prompted with a Clear Logged Data?
conrmation.
TouCH BuTTon funCTions:
• to conrm clearing the recorded values, touch
the YES (F4) button.
• otherwise, touch the NO (F2) button.
Meter Operations 3.3.4 3.3.5
24
In clearing the recorded values, the user
will be prompted with a Clear Logged Data?
conrmation.
When these recorded values are cleared, the
corresponding time and date records are also
cleared to the default 00:00:00 00-00-2000.
TouCH BuTTon funCTions:
• to conrm clearing the recorded values, touch
the YES (F4) button.
• otherwise, touch the NO (F2) button.
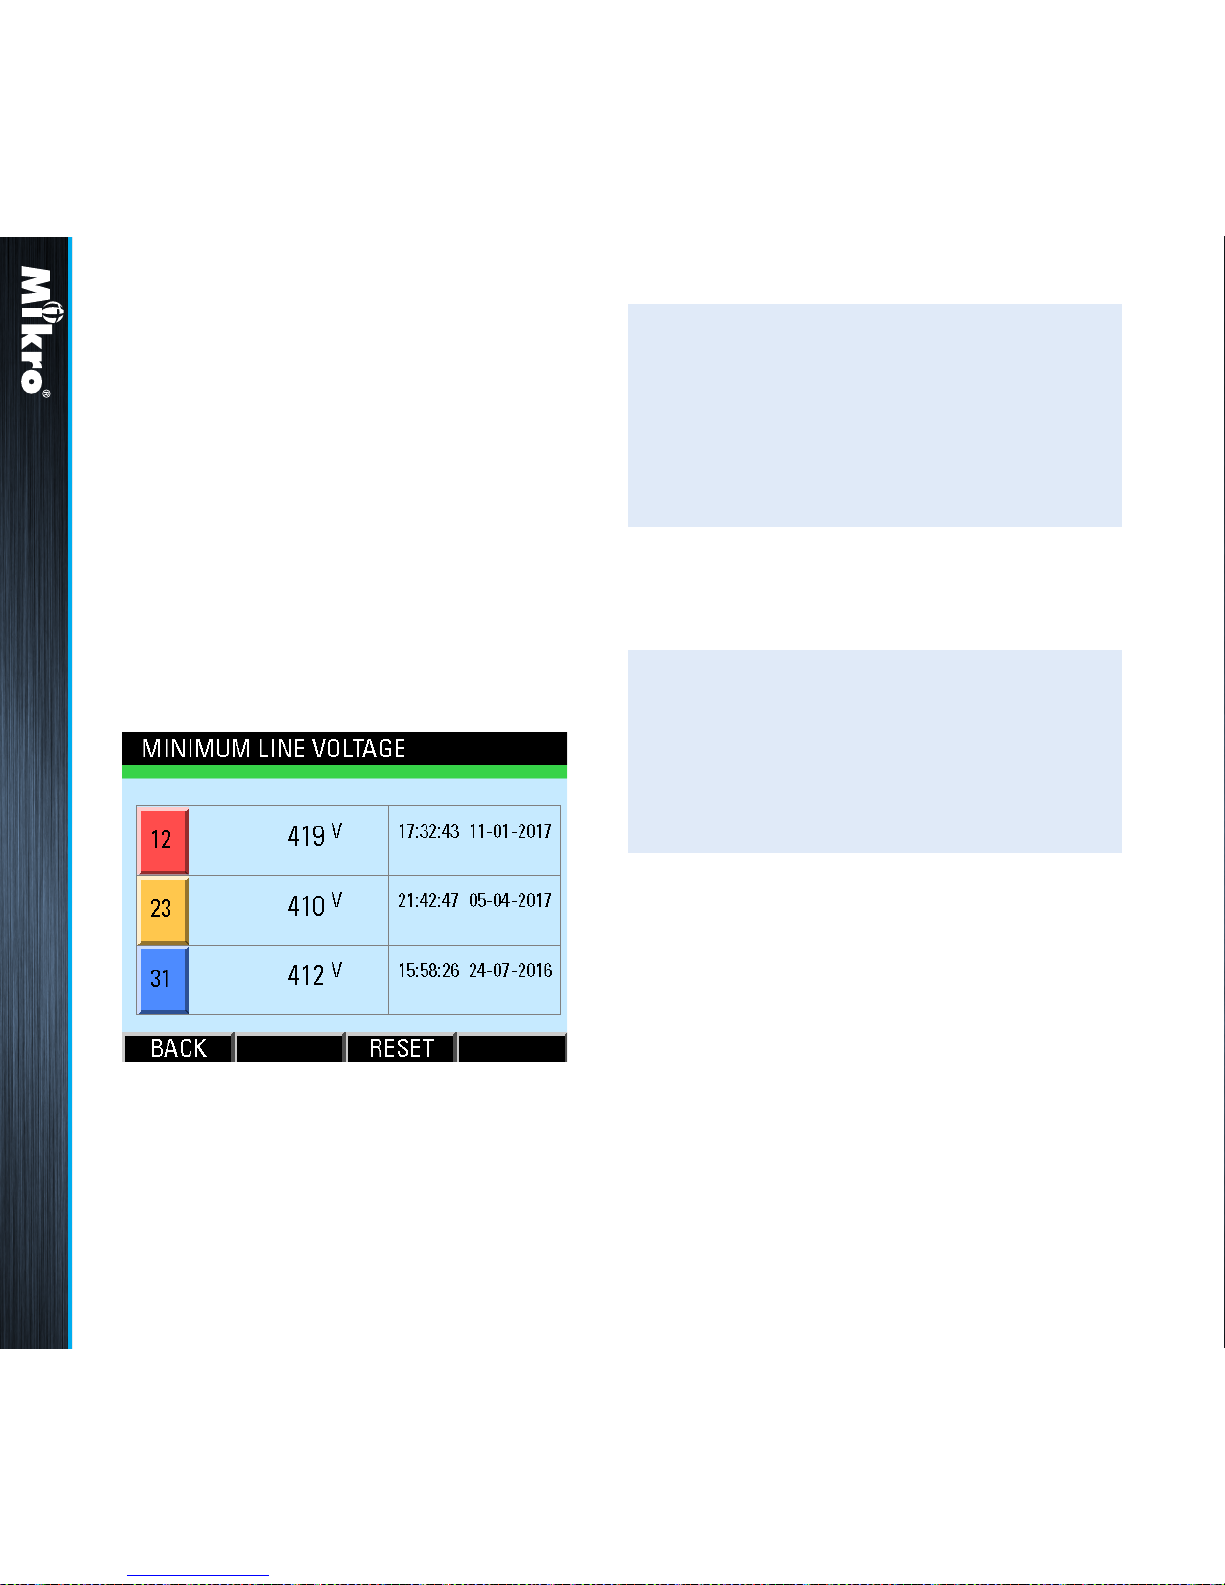
3.3.6
MiniMuM linE VolTaGE
The Minimum Line Voltage page shows the
recorded minimum true RMS line voltage with the
corresponding time and date since the last reset
as shown in Fig 25:
Fig 25 : Minimum Line Voltage page
The time and date records are displayed in the
hour:minute:second day-month-year format.
TouCH BuTTon funCTions:
• to reset the recorded minimum voltage values
to zero, touch the RESET (F3) button.
• otherwise, touch the BACK (F1) button to
return to the VOLTAGE sub-menu.
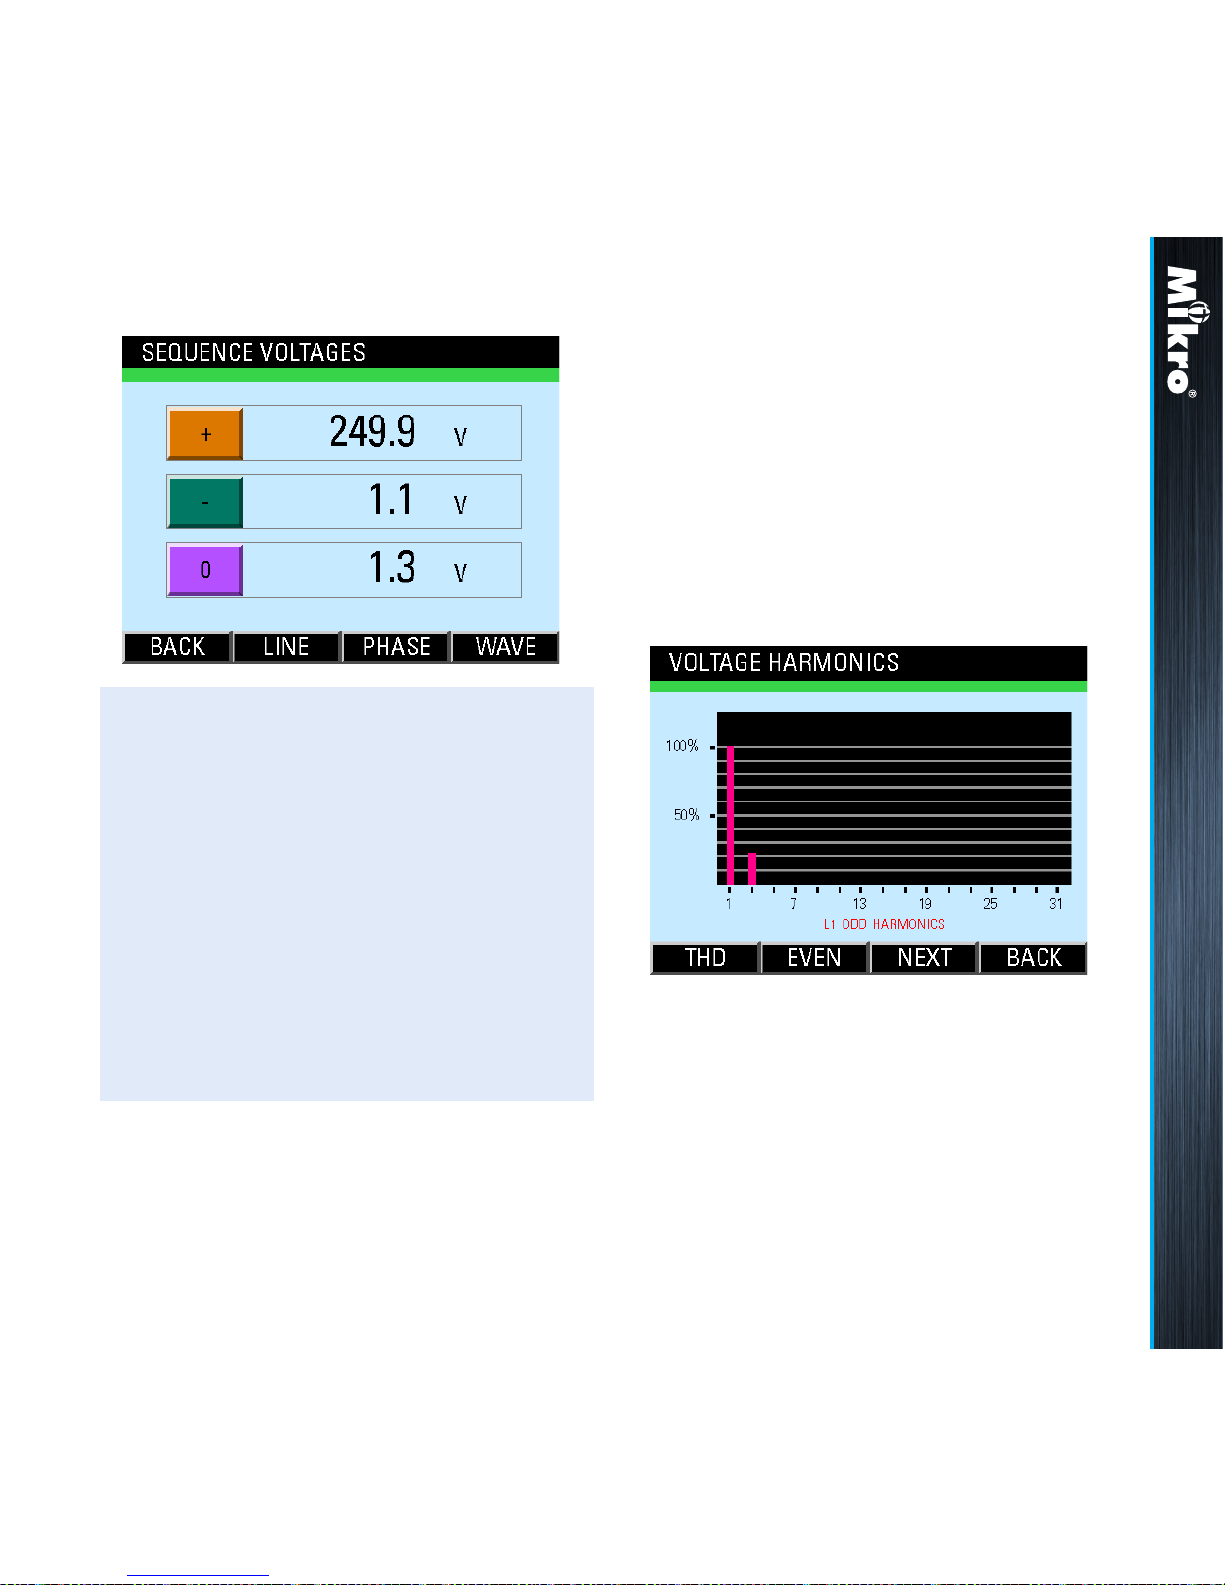
3.3.7
sEquEnCE VolTaGEs
The Sequence Voltages page shows the
positive, negative and zero sequence RMS phase
voltages as shown in Fig 26. They are useful
for identifying abnormalities such as voltage
imbalance and phase reversals. Please see
section B.3 in Appendix B for details.
When these recorded values are cleared, the
corresponding time and date records are also
cleared to the default 00:00:00 00-00-2000.
Meter Operations 3.3.6 3.3.7
25
Fig 26 : Sequence Voltages page
TouCH BuTTon funCTions:
• to jump to the Line Voltage page, touch the
LINE (F2) button.
• to jump to the Phase Voltage page, touch the
PHASE (F3) button.
• to jump to the Voltage Waveform page,
touch the WAVE (F4) button.
• otherwise, touch the BACK (F1) button to
return to the VOLTAGE sub-menu.
3.3.8
VolTaGE HarMoniCs
The Voltage Harmonics page shows the
voltage harmonics spectrum and the voltage
Total Harmonics Distortion (THD) of each phase.
Upon entering this parameter page, the voltage
harmonics spectrum will be displayed as shown
in Fig 27:
Fig 27 : Voltage Harmonics page
The harmonics content is displayed as a percentage
of the fundamental phase voltage. Please see
section B.2 in Appendix B for more details.
Meter Operations 3.3.7 3.3.8
26
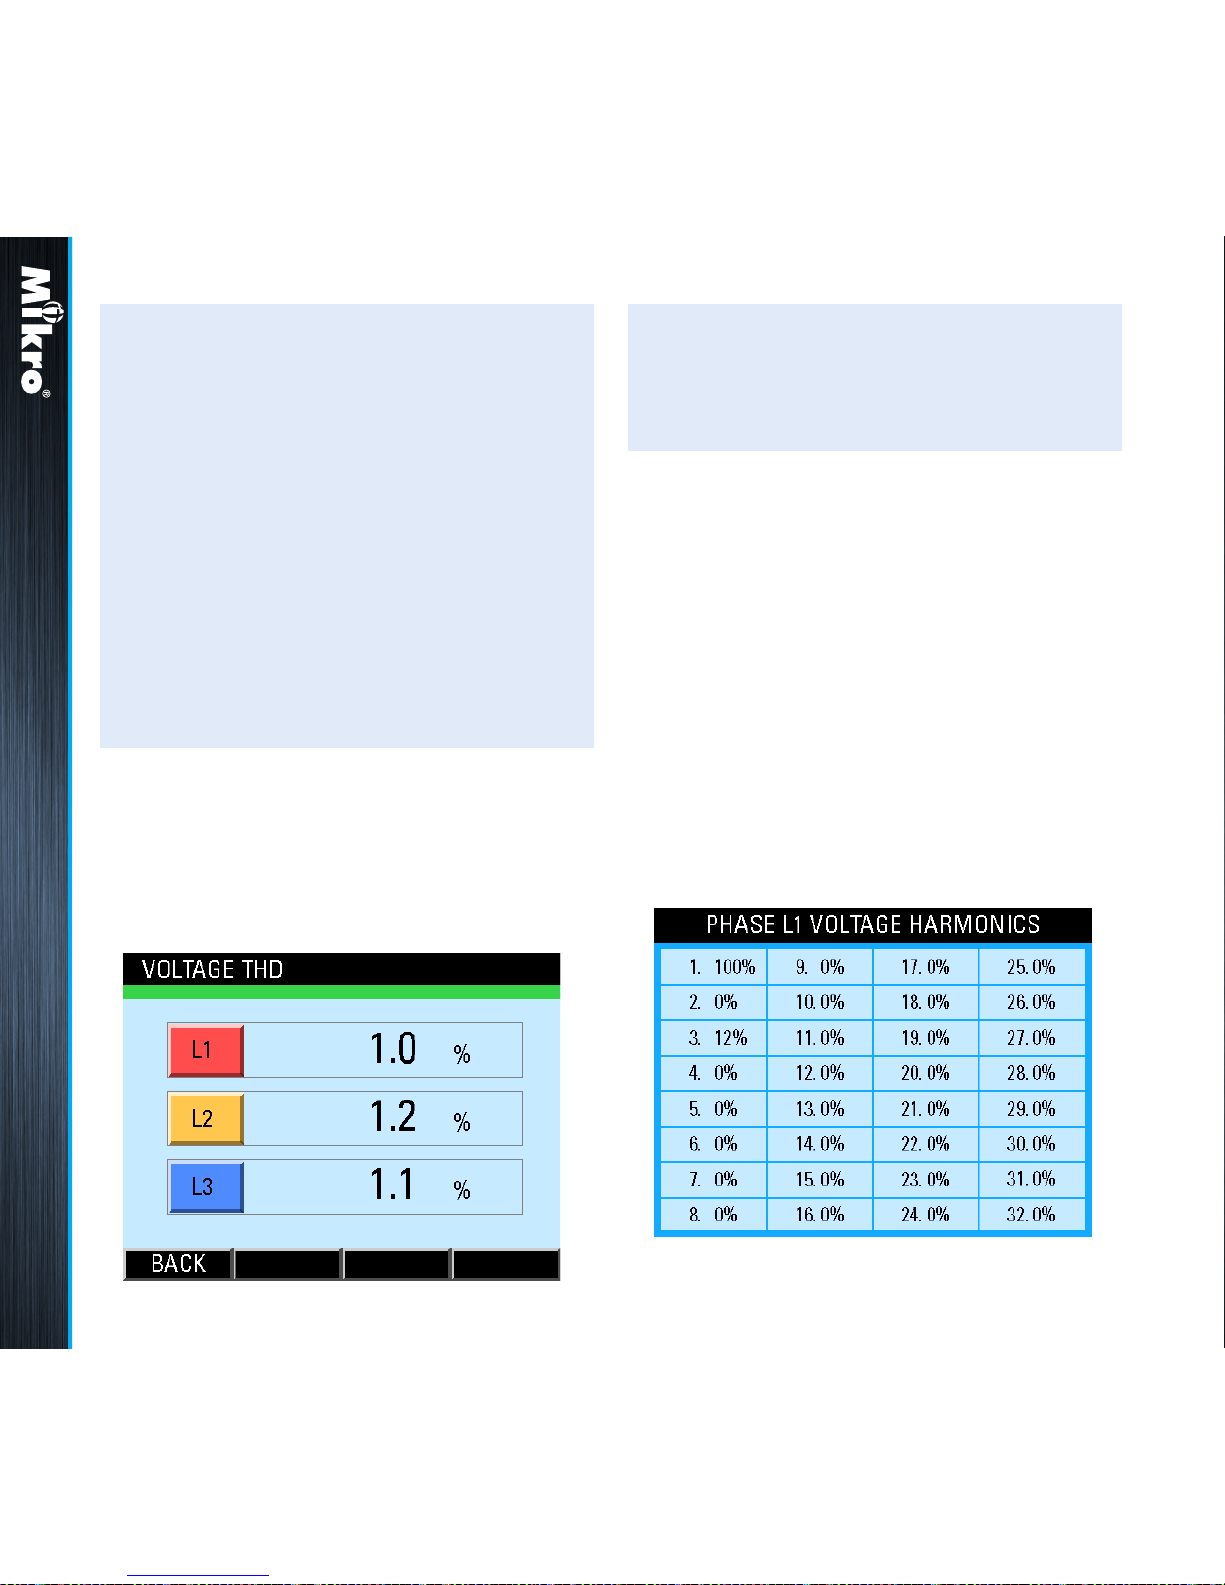
3.3.9
VolTaGE HarMoniCs
TaBlE
The Voltage Harmonics Table page shows
the harmonic voltages as a percentage of the
fundamental voltage for each phase up to the
32
nd
order as shown in Fig 29 for phase L1:
Fig 29 : Phase L1 Voltage Harmonics page
In the Voltage THD parameter page, the voltage
THD for each phase is displayed as shown in
Fig 28.
Fig 28 : Voltage THD parameter page
TouCH BuTTon funCTions:
• to return to the Voltage Harmonics page,
touch the BACK (F4) button
TouCH BuTTon funCTions:
• to alternate between the odd and even
harmonics spectrum display, touch the EVEN
(F2) or ODD (F2) button.
• to display the spectrum of the next phase,
touch the NEXT (F3) button.
• to jump to the THD parameter page as shown
in Fig 28 below, touch the THD (F1) button.
• otherwise, touch the BACK (F4) button to
return to the VOLTAGE sub-menu.
Meter Operations 3.3.8 3.3.9
 Loading...