

Page 1

ALTUS
™
Net Oil Computer Manual
May 2000
Page 2

Page 3

ALTUS
™
Net Oil Computer Manual
For technical assistance, phone the Micro Motion Customer
Service Department:
• In the U.S.A., phone 1-800-522-6277, 24 hours
• Outside the U.S.A., phone 303-530-8400, 24 hours
• In Europe, phone +31 (0) 318 549 443
• In Asia, phone (65) 770-8155
Copyright ©1998, Micro Motion, Inc. A l l rig h ts res erved.
Micro Motion, ELITE, and BASIS are registered trademarks, and ALTUS is a
trademark of Micro Mo tion, Inc., Boulder, Colorado. Hastelloy is a registered
trademark of Haynes International, Inc., Kokomo Indiana. Inconel is a re gi st er ed
trademark of Inco Alloys International, Inc., Huntington, West Virginia. Teflon is a
registered trademar k of E.I. DuPont de Nemours Co., Inc., Wilmington, Delaware.
Page 4

Page 5

Contents
1 Before You Begin
1.1 About this manual . . . . . . . . . . . . . . . . . . . . . . . . . . . . 1
1.2 Application software described in this manual. . . . . . . 1
1.3 Introduction to the ALTUS
Replacing an older NOC and transmitter. . . . . . . . . . . 1
Water cut determination . . . . . . . . . . . . . . . . . . . . . . . 1
NOC capabilities . . . . . . . . . . . . . . . . . . . . . . . . . . . . . 2
2 Installation Considerations
2.1 Piping arrangement and ancillary equipment . . . . . . . 3
2.2 Sensor installation . . . . . . . . . . . . . . . . . . . . . . . . . . . . 5
Sensor orientation . . . . . . . . . . . . . . . . . . . . . . . . . . . . 5
Avoiding inaccurate flow counts . . . . . . . . . . . . . . . . . 6
2.3 Flow direction . . . . . . . . . . . . . . . . . . . . . . . . . . . . . . . 7
3 Using the Person-Process Interface
3.1 Person-Process Interface . . . . . . . . . . . . . . . . . . . . . . 9
3.2 Security button. . . . . . . . . . . . . . . . . . . . . . . . . . . . . . . 10
3.3 Function buttons . . . . . . . . . . . . . . . . . . . . . . . . . . . . . 11
3.4 Cursor control buttons . . . . . . . . . . . . . . . . . . . . . . . . . 12
. . . . . . . . . . . . . . . . . . . . . . . . . . . . . .
™
NOC . . . . . . . . . . . . . . . . 1
. . . . . . . . . . . . . . . . . . . . .
. . . . . . . . . .
1
3
9
ALTUS™ Net Oil Computer Manu al
4 Configuration
4.1 Recording the configuration. . . . . . . . . . . . . . . . . . . . . 15
4.2 Configuration sequence. . . . . . . . . . . . . . . . . . . . . . . . 15
Step 1 Configure well performance measurements . . . . . . . . 15
Mode of operation . . . . . . . . . . . . . . . . . . . . . . . . . . . . 16
Units of measurement . . . . . . . . . . . . . . . . . . . . . . . . . 16
Well data-densities . . . . . . . . . . . . . . . . . . . . . . . . . . . 17
Compensations . . . . . . . . . . . . . . . . . . . . . . . . . . . . . . 21
Step 2 Configure system data. . . . . . . . . . . . . . . . . . . . . . . . . 24
Step 3 Configure inputs . . . . . . . . . . . . . . . . . . . . . . . . . . . . . 25
Flow variables . . . . . . . . . . . . . . . . . . . . . . . . . . . . . . . 25
Density inputs . . . . . . . . . . . . . . . . . . . . . . . . . . . . . . . 26
Temperature . . . . . . . . . . . . . . . . . . . . . . . . . . . . . . . . 27
Sensor calibration data . . . . . . . . . . . . . . . . . . . . . . . . 28
Sensor information . . . . . . . . . . . . . . . . . . . . . . . . . . . 35
Step 4 Configure outputs . . . . . . . . . . . . . . . . . . . . . . . . . . . . 36
Discrete outputs. . . . . . . . . . . . . . . . . . . . . . . . . . . . . . 36
Milliamp outputs. . . . . . . . . . . . . . . . . . . . . . . . . . . . . . 37
Pulse output. . . . . . . . . . . . . . . . . . . . . . . . . . . . . . . . . 40
. . . . . . . . . . . . . . . . . . . . . . . . . . . . . . . . . . .
15
i
Page 6

Contents
continued
5 Using the View Menu
5.1 Accessing the view menu . . . . . . . . . . . . . . . . . . . . . . 43
5.2 Well performance measurements . . . . . . . . . . . . . . . . 44
Continuous mode. . . . . . . . . . . . . . . . . . . . . . . . . . . . . 44
Well test mode . . . . . . . . . . . . . . . . . . . . . . . . . . . . . . . 44
5.3 Process totalizers. . . . . . . . . . . . . . . . . . . . . . . . . . . . . 45
5.4 Inventory totalizers. . . . . . . . . . . . . . . . . . . . . . . . . . . . 46
5.5 Active alarm log . . . . . . . . . . . . . . . . . . . . . . . . . . . . . . 47
5.6 LCD options . . . . . . . . . . . . . . . . . . . . . . . . . . . . . . . . . 47
5.7 Diagnostic monitor. . . . . . . . . . . . . . . . . . . . . . . . . . . . 48
5.8 Applications list . . . . . . . . . . . . . . . . . . . . . . . . . . . . . . 48
5.9 Power outage. . . . . . . . . . . . . . . . . . . . . . . . . . . . . . . . 48
6 Continuous Mode
6.1 Continuous mode configuration . . . . . . . . . . . . . . . . . . 49
6.2 Startup and display test . . . . . . . . . . . . . . . . . . . . . . . . 49
6.3 Process monitor. . . . . . . . . . . . . . . . . . . . . . . . . . . . . . 49
6.4 Accessing continuous mode . . . . . . . . . . . . . . . . . . . . 49
6.5 Viewing production measurements . . . . . . . . . . . . . . . 50
6.6 Quick view . . . . . . . . . . . . . . . . . . . . . . . . . . . . . . . . . . 52
6.7 Pause and resume. . . . . . . . . . . . . . . . . . . . . . . . . . . . 52
6.8 Reset . . . . . . . . . . . . . . . . . . . . . . . . . . . . . . . . . . . . . . 54
. . . . . . . . . . . . . . . . . . . . . . . . . . .
. . . . . . . . . . . . . . . . . . . . . . . . . . . . . . .
43
49
7 Well Test Mode
7.1 Well test mode configuration . . . . . . . . . . . . . . . . . . . . 55
7.2 Startup and display test . . . . . . . . . . . . . . . . . . . . . . . . 55
7.3 Process monitor. . . . . . . . . . . . . . . . . . . . . . . . . . . . . . 55
7.4 Accessing well test mode. . . . . . . . . . . . . . . . . . . . . . . 55
7.5 Conducting a well test . . . . . . . . . . . . . . . . . . . . . . . . . 56
7.6 Stopping and continuing a well test . . . . . . . . . . . . . . . 58
7.7 Viewing performance measurements . . . . . . . . . . . . . 60
7.8 Viewing performance measurements for the
current test. . . . . . . . . . . . . . . . . . . . . . . . . . . . . . . . 61
7.9 Viewing previous well tests . . . . . . . . . . . . . . . . . . . . . 63
. . . . . . . . . . . . . . . . . . . . . . . . . . . . . . . . .
55
ii
ALTUS™ Net Oil Computer Manu al
Page 7

Contents
continued
8 Maintenance
8.1 Alarm messages . . . . . . . . . . . . . . . . . . . . . . . . . . . . 67
Responding to alarms . . . . . . . . . . . . . . . . . . . . . . . . 67
NOC alarm messages . . . . . . . . . . . . . . . . . . . . . . . . 68
Transmitter alarm messages. . . . . . . . . . . . . . . . . . . 68
Alarms that do not generate fault outputs . . . . . . . . . 69
Fault outputs . . . . . . . . . . . . . . . . . . . . . . . . . . . . . . . 73
Critical status fault alarms . . . . . . . . . . . . . . . . . . . . . 74
Transmitter failure fault alarms . . . . . . . . . . . . . . . . . 74
Fault alarms requiring troubleshooting . . . . . . . . . . . 75
Active alarm log. . . . . . . . . . . . . . . . . . . . . . . . . . . . . 78
8.2 Customer service. . . . . . . . . . . . . . . . . . . . . . . . . . . . 78
8.3 Setting outputs. . . . . . . . . . . . . . . . . . . . . . . . . . . . . . 78
Setting discrete outputs. . . . . . . . . . . . . . . . . . . . . . . 79
Setting milliamp outputs . . . . . . . . . . . . . . . . . . . . . . 79
Setting the frequency output . . . . . . . . . . . . . . . . . . . 80
8.4 Density calibration . . . . . . . . . . . . . . . . . . . . . . . . . . . 80
Density unit for calibration. . . . . . . . . . . . . . . . . . . . . 80
Duplicating the factory calibration . . . . . . . . . . . . . . . 81
Duplicating a previous calibration . . . . . . . . . . . . . . . 82
Two-point density calibration. . . . . . . . . . . . . . . . . . . 83
. . . . . . . . . . . . . . . . . . . . . . . . . . . . . . . . . . .
9 Laboratory Determination of Dry Oil and
67
Produced Water Densities
9.1 Reasons for using live oil density . . . . . . . . . . . . . . . 87
9.2 Laboratory density measurement . . . . . . . . . . . . . . . 87
Taking a sample from the flow line . . . . . . . . . . . . . . 88
Processing sample and measuring densities . . . . . . 91
. . . . . . . . . . . . . . . . .
10In-Line Determination of Live Oil and
Produced Water Densities
10.1 Reasons for using live oil density . . . . . . . . . . . . . . . 93
10.2 In-line density determination . . . . . . . . . . . . . . . . . . . 93
Density determination procedures. . . . . . . . . . . . . . . 93
Measuring and saving the water density . . . . . . . . . . 94
Manually entering the water density . . . . . . . . . . . . . 99
Measuring and saving the oil density . . . . . . . . . . . . 103
Entering the water cut . . . . . . . . . . . . . . . . . . . . . . . . 104
11Sensitivity Analysis
11.1 Error factors. . . . . . . . . . . . . . . . . . . . . . . . . . . . . . . . 107
11.2 Individual sensitivity. . . . . . . . . . . . . . . . . . . . . . . . . . 107
11.3 Overall uncertainty. . . . . . . . . . . . . . . . . . . . . . . . . . . 108
. . . . . . . . . . . . . . . . . . . . . . . . . . . .
. . . . . . . . . . . . . . . . .
87
93
107
ALTUS™ Net Oil Computer Manu al
iii
Page 8

Contents
continued
12Software Diagrams
12.1 View menu in well test mode . . . . . . . . . . . . . . . . . . 111
12.2 View menu in continuous mode. . . . . . . . . . . . . . . . 112
12.3 Configuration menu . . . . . . . . . . . . . . . . . . . . . . . . . 113
12.4 Maintenance menu . . . . . . . . . . . . . . . . . . . . . . . . . 115
. . . . . . . . . . . . . . . . . . . . . . . . . . .
Appendixes
Appendix A ALTUS™ NOC Software Configuration
Record . . . . . . . . . . . . . . . . . . . . . . . . . . . . 117
Appendix B Return Policy . . . . . . . . . . . . . . . . . . . . . . . . . . . 121
Index
. . . . . . . . . . . . . . . . . . . . . . . . . . . . . . . . . . . . . . . . . . . . .
111
123
iv
ALTUS™ Net Oil Computer Manu al
Page 9

Contents
continued
Figures
Figure 1-1 Water cut calculation. . . . . . . . . . . . . . . . . . . . . . . . 2
Figure 2-1 Typical installation, Micro Motion
NOC with 3-phase separator . . . . . . . . . . . . . . . 4
Figure 2-2 Typical installation, Micro Motion
NOC with 2-phase separator . . . . . . . . . . . . . . . 4
Figure 2-3 Sensor in horizontal pipe run,
tubes downward . . . . . . . . . . . . . . . . . . . . . . . . . 5
Figure 2-4 Sensor in vertical pipe run. . . . . . . . . . . . . . . . . . . . 5
Figure 3-1 Person-Process Interface . . . . . . . . . . . . . . . . . . . . 9
Figure 3-2 Pressing security button, security disabled. . . . . . . 10
Figure 3-3 Pressing security button, security enabled . . . . . . . 10
Figure 3-4 Function buttons . . . . . . . . . . . . . . . . . . . . . . . . . . . 11
Figure 3-5 Cursor control buttons. . . . . . . . . . . . . . . . . . . . . . . 13
Figure 4-1 Effect of transient bubbles on density . . . . . . . . . . . 22
Figure 4-2 Holding at last measured density . . . . . . . . . . . . . . 22
Figure 4-3 Correction of density readings . . . . . . . . . . . . . . . . 22
Figure 4-4 Flow calibration values on sensor serial
number tag . . . . . . . . . . . . . . . . . . . . . . . . . . . . . 29
Figure 4-5 D1 and D2 on sensor serial number tag . . . . . . . . . 30
Figure 4-6 K1 and K2 on sensor serial number tag . . . . . . . . . 31
Figure 4-7 K1 and K2 values from comments section . . . . . . . 32
Figure 4-8 K1 and K2 values from second page . . . . . . . . . . . 32
Figure 4-9 FD and dens temp coeff on sensor serial
number tag . . . . . . . . . . . . . . . . . . . . . . . . . . . . . 33
Figure 5-1 Using buttons in the view menu . . . . . . . . . . . . . . . 43
Figure 6-1 Process monitor mode . . . . . . . . . . . . . . . . . . . . . . 49
Figure 7-1 Process monitor mode . . . . . . . . . . . . . . . . . . . . . . 55
Figure 8-1 Model 3500 sensor wiring terminals . . . . . . . . . . . . 76
Figure 8-2 Model 3700 sensor wiring terminals . . . . . . . . . . . . 76
Figure 9-1 Sample port for laboratory density
measurement . . . . . . . . . . . . . . . . . . . . . . . . . . . 88
Figure 9-2 Laboratory sampling procedure using
water-filled cylinder . . . . . . . . . . . . . . . . . . . . . . . 89
Figure 9-3 Laboratory sampling procedure using
empty cylinder. . . . . . . . . . . . . . . . . . . . . . . . . . . 90
Figure 9-4 Laboratory density measurement system,
low pressure . . . . . . . . . . . . . . . . . . . . . . . . . . . . 92
Figure 9-5 Laboratory density measurement system,
high pressure . . . . . . . . . . . . . . . . . . . . . . . . . . . 92
Figure 10-1 Stratification with no flow. . . . . . . . . . . . . . . . . . . . . 96
Figure 10-2 Diameter and length of cylindrical vessel . . . . . . . . 97
Figure 10-3 Taking a water sample from the separator . . . . . . . 101
Figure 10-4 Using a hygrometer to measure water density . . . . 101
Figure 10-5 Taking an oil sample . . . . . . . . . . . . . . . . . . . . . . . . 103
®
sensor and
®
sensor and
ALTUS™ Net Oil Computer Manu al
v
Page 10

Contents
continued
Tables
Table 4-1 Densities and deviations for continuous mode . . . . 18
Table 4-2 Well data for well test mode. . . . . . . . . . . . . . . . . . . 21
Table 4-3 Transient bubble remediation parameters. . . . . . . . 23
Table 4-4 System parameters . . . . . . . . . . . . . . . . . . . . . . . . . 24
Table 4-5 Flow variables . . . . . . . . . . . . . . . . . . . . . . . . . . . . . 25
Table 4-6 Density inputs . . . . . . . . . . . . . . . . . . . . . . . . . . . . . 26
Table 4-7 Temperature inputs . . . . . . . . . . . . . . . . . . . . . . . . . 27
Table 4-8 Flow calibration values . . . . . . . . . . . . . . . . . . . . . . 29
Table 4-9 D1 and D2 density values . . . . . . . . . . . . . . . . . . . . 30
Table 4-10 K1 and K2 tube period values . . . . . . . . . . . . . . . . . 31
Table 4-11 FD and dens temp coeff values. . . . . . . . . . . . . . . . 33
Table 4-12 Nominal FD values for sensors . . . . . . . . . . . . . . . . 34
Table 4-13 Temperature calibration values . . . . . . . . . . . . . . . . 35
Table 4-14 Sensor information variables. . . . . . . . . . . . . . . . . . 35
Table 4-15 Discrete output 1 power sources. . . . . . . . . . . . . . . 36
Table 4-16 Discrete output assignment variables . . . . . . . . . . . 36
Table 4-17 Fault conditions and settings for
milliamp outputs . . . . . . . . . . . . . . . . . . . . . . . . . 37
Table 4-18 Process variables for milliamp outputs . . . . . . . . . . 38
Table 4-19 Calibration span variables . . . . . . . . . . . . . . . . . . . . 39
Table 4-20 Pulse output variables . . . . . . . . . . . . . . . . . . . . . . . 40
Table 6-1 Continuous production measurements . . . . . . . . . . 51
Table 7-1 Performance measurements for
current well test . . . . . . . . . . . . . . . . . . . . . . . . . . 62
Table 7-2 Performance measurements for
previous well tests. . . . . . . . . . . . . . . . . . . . . . . . 65
Table 8-1 Using NOC alarms. . . . . . . . . . . . . . . . . . . . . . . . . . 68
Table 8-2 Using slug flow alarms. . . . . . . . . . . . . . . . . . . . . . . 69
Table 8-3 Using output saturation alarms . . . . . . . . . . . . . . . . 70
Table 8-4 Using totalizer alarms . . . . . . . . . . . . . . . . . . . . . . . 70
Table 8-5 Using calibration and trim alarms . . . . . . . . . . . . . . 71
Table 8-6 Using conditional status alarms. . . . . . . . . . . . . . . . 72
Table 8-7 Fault output levels . . . . . . . . . . . . . . . . . . . . . . . . . . 73
Table 8-8 Configurations for fault outputs . . . . . . . . . . . . . . . . 73
Table 8-9 Using critical status fault alarms . . . . . . . . . . . . . . . 74
Table 8-10 Using transmitter failure fault alarms. . . . . . . . . . . . 74
Table 8-11 Troubleshooting excessive drive gain . . . . . . . . . . . 75
Table 8-12 Nominal resistance ranges for
flowmeter circuits. . . . . . . . . . . . . . . . . . . . . . . . . 77
Table 8-13 Troubleshooting sensor error fault alarms. . . . . . . . 77
Table 8-14 Density of air in grams per cubic centimeter . . . . . . 84
Table 8-15 Maximum flow rates for high-density
calibration . . . . . . . . . . . . . . . . . . . . . . . . . . . . . 85
Table 8-16 Density of water. . . . . . . . . . . . . . . . . . . . . . . . . . . 86
Table 9-1 Laboratory equipment for determining live oil
and produced water densities . . . . . . . . . . . . . . 87
Table 10-1 Approximate capacity of cylindrical vessels. . . . . . 97
Table 10-2 Approximate capacity of spherical ends . . . . . . . . 97
Table 11-1 Uncertainty factors for percent water cut and
percent net oil . . . . . . . . . . . . . . . . . . . . . . . . . . 107
vi
ALTUS™ Net Oil Computer Manu al
Page 11

1 Before You Begin
Water cut
D
eDo
–
DwD
o
–
-------------------- -=
1.1 About this manual
1.2 Application software
described in this manual
1.3 Introduction to the ALTUS™
NOC
Replacing an older NOC
and transmitter
This manual explains how to configure, operate, and maintain the
ALTUS
™
Net Oil Computer (NOC). This manual does not explain
installation or wiring. For information about installation and wiring, see
ALTUS Installation Manual
the
.
This manual pertains to software menus that enable operation,
configuration, and maintenance of the NOC.
• The ALTUS applications platform has software functions that do not
pertain to the NOC.
• For information about software functions that are not described in
this manual, refer to the installation and detailed setup manuals for
the applications platform.
The ALTUS NOC works with a Micro Motion® sensor to produce realtime measurements of water cut, net oil volume flow, and net water
volume flow. The NOC measures full-stream mass flow and volumetric
flow at rates from a few barrels to more than 100,000 barrels per day.
If an AL TUS NOC is installed as a replacement for an older Micro Motion
Net Oil Computer and RFT9739 or RFT9712 transmitter, power-supply
and output wiring does not need to be replaced. Because transmitter
software is included with the ALTUS NOC, a transmitter is not required.
Using the Person-Process
Interface
Configuration Using the View Menu Continuous ModeBefore You Begin Installation Considerations
Water cut determination
ALTUS™ Net Oil Computer Manu al
The NOC calculates water cut from the following equation:
Where
:
D
= Emulsion density
e
D
= Oil density
o
D
= Water density
w
Figure 1-1
, page 2, shows how water cut is calculated by the NOC. The
operator enters the oil and water densities at the reference temperature
(60°F in
temperature (100°F in
Figure 1-1
). The Micro Motion sensor measures the fluid
Figure 1-1
). The NOC extrapolates the densities
to the operating temperature, using an API equation for oil and a
Chevron Research equation for produced water. The water cut equation
is solved at operating temperature, then referenced back to 60°F. Using
water cut, mass flow rate, and net oil and water densities, the NOC
calculates net oil, net water, and gross flow at reference temperature.
1
Page 12

continued
Before You Begin
Figure 1-1. Water cut calculation
1.05
1.00
0.95
0.90
0.85
0.80
Density (g/cc)
0.75
0.70
Produced water density enter ed in NOC
Crude oil density ent er ed i n N O C
60° 90°
NOC capabilities
Produced water density
D
–
Water cut
100°
Temperature (°F)
eDo
-------------------- -=
DwD
–
o
120° 150°
Crude oil density
The NOC can operate in continuous mode or well test mode:
• In continuous mode, the NOC can continuously monitor a well,
separator, or pipeline.
• In well test mode, the NOC can perform a well test on any of up to 48
different wells. Well performance data for the test that is in progress
or for previous tests can be viewed during the test.
The NOC nonvolatile memory archives data acquired during the last
three well tests. The NOC resumes testing if a power failure or shutoff
interrupts the test that is in progress. The last three power outages are
recorded with power-on and power-off time/date stamps.
The NOC has three discrete outputs, two milliamp outputs, and a pulse
output:
• Discrete output 1 can be an alarm for transient bubble remediation.
• Discrete output 2 indicates net oil. It produces 10 output pulses per
barrel or 10 output pulses per cubic meter of net oil.
• Discrete output 3 indicates net water. It produces 10 output pulses
per barrel or 10 output pulses per cubic meter of net water.
• Milliamp output 1 can indicate any measured variable.
• Milliamp output 2 can indicate any measured variable.
• The pulse output can represent a flow variable.
The NOC can remediate density readings to compensate for the
presence of transient bubbles in the sensor. If erratic density resulting
from transient bubbles causes sensor drive gain to exceed the
programmed value, the NOC can be programmed to respond in one of
three ways:
• The NOC can hold the density value that was measured at a
specified time before transient bubbles were detected.
• The NOC can produce an alarm indicating the presence of transient
bubbles. The alarm can be assigned to discrete output 1.
• The NOC can stop the well test that is in progress.
2
ALTUS™ Net Oil Computer Manu al
Page 13

2 Installation Considerations
2.1 Piping arrangement and
ancillary equipment
Figure 2-1
when a 3-phase test separator is used.
Figure 2-2
when a 2-phase test separator is used.
Adhere to the following general guidelines:
• Design and size the test separator to ensure complete separation of
the entrained gas from the liquid phase.
• Size the Coriolis sensor so that at maximum liquid flow, pressure
drop is less than 3 psi.
• Install the sensor as far below the test separator as possible.
Install the sensor upstream from the dump valve
•
• Balance any sensor pressure drop with hydrostatic head, measured
from the lowest level in the separator down to the sensor inlet. Rule
of thumb: pressure drop should be about 0.4 psi per foot.
• If the liquid temperature is significantly different from the ambient
temperature, thermally insulate or heat trace the sensor and
upstream pipe to minimize paraffin coating and transient temperature
at the start of dumping periods.
• Install a meter proving loop, if required.
• Install a static mixer and sampling port for calibration and verification
purposes. Locate the static mixer and sampling port downstream
from the sensor and the proving loop connections.
• Make sure the dump valve is capable of regulating back pressure
and controlling the liquid flow rate.
, page 4, shows a typical installation of a sensor and an NOC
, page 4, shows a typical installation of a sensor and an NOC
.
Using the Person-Process
Interface
Configuration Using the View Menu Continuous ModeBefore You Begin Installation Considerations
ALTUS™ Net Oil Computer Manu al
3
Page 14

continued
Installation Considerations
Figure 2-1. Typical installation, Micro Motion® sensor and NOC with 3-phase separator
Figure 2-2. Typical installation, Micro Motion
®
sensor and NOC with 2-phase separator
4
ALTUS™ Net Oil Computer Manu al
Page 15

Installation Considerations
continued
2.2 Sensor installation
Sensor orientation
Install the sensor according to the appropriate sensor instruction
manual.
If possible, mount the sensor with its flow tubes downward in a
horizontal pipe run, as shown in
Figure 2-3
.
If necessary to prevent sand or other solid particles from accumulating
in the flow tubes, or to accommodate existing vertical piping, mount the
sensor in a vertical pipe run, as shown in
Figure 2-4
. The oil/water
interface should flow upward through the pipeline.
Figure 2-3. Sensor in horizontal pipe run, tubes downward
Flow direction
Using the Person-Process
Interface
Figure 2-4. Sensor in vertical pipe run
Flow direction
Configuration Using the View Menu Continuous ModeBefore You Begin Installation Considerations
ALTUS™ Net Oil Computer Manu al
5
Page 16

Installation Considerations
PgPpP
m
+
>
Avoiding inaccurate flow
counts
continued
CAUTION
Settling of the oil/water interface in a sensor can
cause the flowmeter to indicate flow when there is no
flow.
• To avoid inaccurate flow counts, program a low flow
cutoff. To program a low flow cutoff, see page 25.
• Settling of the oil/water interface is more likely to occur if
the sensor is mounted in a vertical pipe run than if the
sensor is mounted in a horizontal pipe run.
Because the crude oil in the separator is at an equilibrium condition, any
pressure reduction can cause the solution gas (i.e., the light end
components) to break out from the saturated crude oil.
Even a seemingly small amount of free gas in the liquid phase can result
in substantial measurement errors in water cut and net oil. (See pages
107-109 to estimate the effect of free gas).
The amount of gas that is produced varies, and depends on the
properties of the crude oil and the operating conditions.
To prevent formation of solution gas in the flowmeter, the following
criterio n shou ld be followed:
Where:
Pg= Static head pressure of liquid, measured from liquid level at
separator to sensor inlet
P
= Frictional pressure loss of flow line, from test separator to
p
sensor inlet
P
= Pressure drop across sensor
m
Detailed pressure drop calculations are strongly recommended during
design and installation of the piping system.
6
ALTUS™ Net Oil Computer Manu al
Page 17

Installation Considerations
continued
The following general guidelines are suggested:
• To maximize the static head gain (P
), install the sensor as far below
g
the test separator as possible.
• Note that 1 psi (6.9 kPa) of static head gain results from 28 inches of
water column.
• To minimize the frictional head loss (P
), install the sensor as near as
p
possible to the test separator, and use larger-diameter connecting
pipes. Minimize use of piping elements such as tees, elbows, and
reducing unions.
• Install sampling ports, static mixer , proving connections, dump valve ,
back pressure regulator, or other flow-restricting devices downstream
from the sensor. A full-port valve should be considered if a cutoff
valve must be installed between the separator and the sensor.
• Whenever possible, frictional pressure loss should be less than 3 psi
(20.7 kPa) at the maximum anticipated flow rate.
• To minimize pressure drop across the sensor (P
), install a larger
m
sensor. Pressure drop across the sensor should be less than 3 psi
(20.7 kPa) at the maximum anticipated flow rate.
• In some environments, extremely tight emulsion occurs. Extremely
tight emulsion can make removal of entrained gas difficult, even with
a large separator. Using a suitable demulsifier chemical to break
down the emulsion is a possible method of alleviating this problem.
Using the Person-Process
Interface
2.3 Flow direction
If the sensor is installed directly at the wellhead, (i.e., if a test separator
is not used), the line pressure at the sensor should be maintained above
the crude oil bubble point pressure.
The sensor measures accurately regardless of flow direction. The arrow
on the sensor housing indicates normal forward flow direction. Refe r to
ALTUS Detailed Setup Manual
the
for directions about setting the NOC
to indicate forward flow, reverse flow, or forward and reverse flow.
Configuration Using the View Menu Continuous ModeBefore You Begin Installation Considerations
ALTUS™ Net Oil Computer Manu al
7
Page 18

8
ALTUS™ Net Oil Computer Manu al
Page 19

3 Using the Person-Process
Interface
3.1 Person-Process Interface
Figure 3-1. Person-Process Interface
Volume Flow
Backlit
display
Volume Total
NEXT PRINT VIEW
Figure 3-1
• Configure the NOC
• Monitor and control the application
• Perform maintenance and diagnostic tasks
DEVICE 1
shows the Person-Process Interface. Use the interface to:
4,352.33
bpd
56,485.88
bbl
Using the Person-Process
Interface
Cursor control
buttons
Configuration Using the View Menu Continuous ModeBefore You Begin Installation Considerations
Function buttons
ALTUS™ Net Oil Computer Manu al
Security button
9
Page 20

Using the Person-Process Interface
continued
3.2 Security button
The security button is in the lower right of the interface, marked by an
icon of a padlock.
• If security is disabled, press the security button to access the main
menu. See
• If security has been enabled, you will be prompted to enter a
password. See
• To enable security, see the
You can use the security button to return to the main menu or password
entry screen. Press the security button once to return to:
• The main menu, shown in
• The password entry screen, shown in
enabled
At the main menu or password entry screen, press EXIT to return to the
operation screen.
Figure 3-2
Figure 3-2. Pressing security button, security disabled
DEVICE 1
Volume Flow
4,532.33
bpd
Mass Total
56,485.88
bbl
NEXT PRINT VIEW
.
Figure 3-3
.
ALTUS Detailed Setup Manual
Figure 3-2
DEVICE 1
Configuration
Maintenance
Security
Language
SEL HELP EXIT
, if security is disabled
Figure 3-3
, if security is
.
Figure 3-3. Pressing security button, security enabled
DEVICE 1
Volume Flow
4,532.33
bpd
Mass Total
56,485.88
bbl
NEXT PRINT VIEW
10
Enter Password
SEL HELP EXIT
ALTUS™ Net Oil Computer Manu al
Page 21

Using the Person-Process Interface
continued
3.3 Function buttons
Figure 3-4. Function buttons
The pushbuttons below the display are the function buttons. The action
each button performs appears on the display just above the button.
Figure 3-4
reviews the functions that are assigned to each button.
DEVICE 1
Configuration
Maintenance
Security
SEL HELP EXIT
Using the Person-Process
Interface
START • Start well test
• Start averaging oil or water densities
STOP • Stop well test
• S t op averaging oil or water densities
CLEAR Clear all displayed values
RESET Reset total
PAUSE • Pause counting of all displayed totals
• Pause performance measurements
RESUME • R esume counting of all displ ayed totals
• R esume production meas ur em ents
SEL Select the highlighted option
CHG Make a change to the highlighted option
SAVE Save a change
ENTER Enter a password
YES Proceed with action
OK Proceed with action
NEXT • Scroll to next screen
• At the last screen, scroll to the first screen
• Test the next well in the sequence
RETURN Retu rn to well test screen
PGDN Page down to next help screen
Configuration Using the View Menu Continuous ModeBefore You Begin Installation Considerations
VIEW Access the view menu
ACK Acknowledge an alarm message
EXIT Return to the previous screen
NO Cancel action
HELP Show a help screen
RESET Reset total
START Start a new well test
VIEW View performance meas urements for a
well that is being tested
PRINT Send a ticket to a printer
PGUP Page up to previous help screen
ALTUS™ Net Oil Computer Manu al
11
Page 22

Using the Person-Process Interface
continued
3.4 Cursor control buttons
Actions performed by the function buttons apply to the item at the cursor.
Figure 3-5
, page 13, shows a typical configuration sequence involving
both a menu item and a variable edit item. Pressing HELP produces a
screen that has help for the item at the cursor.
Menus
Each menu includes a list of items.
• The cursor is a reverse-video highlight bar.
• Use the up or down arrow buttons to locate the cursor at the menu
item you want to select or change.
• After locating the cursor at the desired menu item, press CHG or the
right cursor button to select the item.
Items
After a menu item has been selected, the cursor enables you to enter or
change the selected item:
• The cursor is an underscore character, which is located under a
character.
• If the item has a value of Yes or No, all arrows toggle between the
two choices. Otherwise, press the up and down arrow buttons to
increase or decrease the value of the character at the cursor.
• If the item has more than one digit or character (like the oil density in
the example), press the left and right arrow buttons to move the
cursor to the next or previous character.
• When the value is correct, press SAVE.
• If y ou wish to cancel the change, press EXIT. The interface returns to
the previous screen without saving the changes.
12
ALTUS™ Net Oil Computer Manu al
Page 23

Using the Person-Process Interface
Figure 3-5. Cursor control buttons
continued
Menu
Indicates items
available to scroll
Cursor is a
highlight bar
Item
Cursor is an
underscore
Well Data-Densities
Oil Density
Water Density
Oil Deviation
Water Deviation
CHG HELP EXIT
Well Data-Densities
Oil Density
Water Density
Oil Deviation
Water Deviation
SAVE EXIT
0.9000 g/cc
1.1000 g/cc
0.0005 g/cc
0.0005 g/cc
0.9000
g/cc
1.1000 g/cc
0.0005 g/cc
0.0005 g/cc
EXIT
↓
Move cursor to left or toggle YES/NO
↓
Move cursor up/Scroll up
SELECT
Move cursor down/Scroll down
Increase value at cursor
or toggle YES/NO
Move cursor to right
or toggle YES/NO
Decrease value at cursor
or toggle YES/NO
Using the Person-Process
Interface
Configuration Using the View Menu Continuous ModeBefore You Begin Installation Considerations
ALTUS™ Net Oil Computer Manu al
13
Page 24

14
ALTUS™ Net Oil Computer Manu al
Page 25

4 Configuration
4.1 Recording the
configuration
4.2 Configuration sequence
While you are configuring the NOC, record configuration parameters in
the NOC configuration record (
Failure to perform configuration tasks in the proper sequence could
result in an incomplete or flawed configuration. Perform configuration
tasks in the following sequence:
1. Configure well performance measurements.
2. Configure system data.
3. Configure inputs.
4. Configure outputs.
Appendix A
).
CAUTION
Selecting configuration will interrupt measurement
and control functions. All outputs will go to their
configured fault settings.
Set control devices for manual operation before accessing
configuration menus.
Step 1
Configure well performance measurements
Using the Person-Process
Interface
Configuration Using the View Menu Continuous ModeBefore You Begin Installation Considerations
ALTUS™ Net Oil Computer Manu al
Well performance measurements include the following parameters:
• Mode of operation
• Units of measurement
• Well data – densities
• Compensations
15
Page 26

Configuration
Mode of operation
Configuration
Well performance meas
continued
Mode of operation
CAUTION
Changing the mode of operation will erase all
stored test data.
Mode of Operation
Continuous Mode
Well Test Mode
SAVE EXIT
Units of measurement
To avoid erasing test data, d o not chan ge the mo de of
operation during a well test.
To set the mode of operation:
a. Press the security button on the display face.
b. Select Configuration.
c. Select Well Performance Meas.
d. Select Mode of Operation.
e. Select Continuous Mode or Well Test mode, then
press SAVE.
The units of measurement menu allows you to select
a reference temperature for measuring net oil and net
water.
To select a unit of temperature, see page 27.
To select a unit of volume flow, see page 25.
CAUTION
Changing reference temperature changes the
indicated standard volumes and reference
densities.
If the reference temperature is changed, change oil
and water reference density values.
16
ALTUS™ Net Oil Computer Manu al
Page 27

Configuration
Configuration
Well performance meas
Units of Measurement
60 degF
15 degC
20 degC
continued
Units of measurement
To select the reference temperature:
a. Press the security button on the display face.
b. Select Configuration.
c. Select Well Performance Meas.
d. Select Units of Measurement.
e. Select the desired refer ence temperature, then
press SAVE.
The reference temperature that is currently being
used is always the one that is highlighted.
SAVE EXIT
Well data-densities
Configuration
Well performance meas
Well data-densities
Well Data-Densities
Oil Density
0.9000 g/cc
Water Density
1.1000 g/cc
Oil Deviation
0.0005 g/cc
Water Deviation
0.0005 g/cc
CHG HELP EXIT
Using the Person-Process
Interface
Continuous mode
To enter oil and water densities and deviations for
continuous mode:
a. Press the security button on the display face.
b. Select Configuration.
c. Select Well Performance Meas.
d. Select Well Data-Densities.
↓
e. Use the function buttons and the cursor control
buttons to configure the parameters that are listed
Table 4-1
in
, page 18.
Configuration Using the View Menu Continuous ModeBefore You Begin Installation Considerations
ALTUS™ Net Oil Computer Manu al
17
Page 28

Configuration
continued
Oil and water densities, deviations, and duration
averages are described in the chapter that explains
density determination (pages 93-104
).
Well Data-Densities
Oil Deviation
0.0005 g/cc
Water Deviation
0.0005 g/cc
Oil Duration Ave
Water Duration Ave
CHG HELP EXIT
↑
5 sec
5 sec
Table 4-1. Densities and deviations for continuous mode
Variable Default Description
Oil density 0.9000 g/cc • I f oil density at reference temperature is known, enter the densi ty value
Water density 1.1000 g/cc • If water density at reference temperature is known , e nt e r the density value
Oil deviation 0.0005 g/cc • E nter the maximum oil density deviation that wi ll be allowed du ring density
Water deviation 0.0005 g/cc • Enter the maximum water density deviation that will be allowed during density
Oil density ave 5 sec Enter the amount of time during which oil density will be averaged during density
Water density ave 5 sec Enter the amount of time during which water density will be averaged during
• If oil density at reference tempe rature is unk nown, perform a density
determina tio n (see pages 93-104)
• If water density at reference temperature is unknown, perform a density
determina tio n (see pages 93-104)
determina tio n (see pages 93-104)
• I f t he dif ference bet wee n t wo co nsecutive density readings i s grea te r t han the
programmed deviation, the densit y average is restarted. The averaging is
completed when the deviation is not exceeded during the averaging period
determina tio n (see pages 93-104)
• I f t he dif ference bet wee n t wo co nsecutive density readings i s grea te r t han the
programmed deviation, the densit y average is restarted. The averaging is
completed when the deviation is not exceeded during the averaging period
determina tio n (see pages 93-104)
density determ i nation (see pages 93 -104)
18
ALTUS™ Net Oil Computer Manu al
Page 29

Configuration
Configuration
Well performance meas
Well Data-Densities
Wells 1 to 12
Wells 13 to 24
Wells 25 to 36
Wells 37 to 48
continued
Well data-densities
Well test mode
To enter well names, oil and water densities,
deviations, and purge times for well test mode:
a. Press the security button on the display face.
b. Select Configuration.
c. Select Well Performance Meas.
d. Select Well Data-Densities.
e. Select the menu item for the number of the well
that will be configured, then press CHG.
CHG HELP EXIT
Wells 1 to 12
01: Tinsley 22-14b
02: N Cowden 24-17a
03: R Dutton 36-13c
04: B Olsen 23-15d
05: 13-24-44-5E6
06: 08-11-23-6E2
07: 18-44-04-3W5
08: 12-28-36-6W7
SAVE EXIT
Using the Person-Process
Interface
f. Select the well that will be configured, then press
SAVE.
↓
Configuration Using the View Menu Continuous ModeBefore You Begin Installation Considerations
ALTUS™ Net Oil Computer Manu al
19
Page 30

Configuration
Well Name:
Oil Density
Water Density
Purge Time
CHG HELP EXIT
continued
Well #1
Tinsley 22-14b
0.8000 g/cc
1.0000 g/cc
30 minutes
g. To enter a well name:
• Begin entering characters at the far left
position
• Enter up to 18 alphanumeric characters,
↓
including spaces
h. Use the function buttons and the cursor control
buttons to configure the parameters that are listed
Table 4-2
in
.
Oil and water densities, deviations, and duration
averages are described in the chapter that explains
density determination (pages 93-104
).
Well #1
Oil Deviation
0.0005 g/cc
Water Deviation
0.0005 g/cc
Oil Duration Ave
5 sec
Water Duration Ave
5 sec
CHG HELP EXIT
↑
20
ALTUS™ Net Oil Computer Manu al
Page 31

continued
Configuration
Table 4-2. Well data for well test mode
Variable Default Description
Well name Not applicable
(none)
Oil density 0.8000 g/cc • I f oil density at reference temperature is known, enter the densi ty value
Water density 1.0000 g/cc • If water density at reference temperature is known , e nt e r the density value
Purge time 30 minutes Enter t he time during which, prior to a well test, measurements will not be recorded
Oil deviation 0.0005 g/cc • E nter the maximum oil density deviation that wi ll be allowed during density
Water deviation 0.0005 g/cc • Enter the maximum water density deviation that will be allowed during density
Oil density ave 5 sec Enter the amount of time during which oil density will be averaged during density
Water density ave 5 sec Enter the amount of time during which water density will be averaged during density
Beginning at the far left position , en te r up to 18 alphanumeri c ch aracters, including
spaces, that will serve as the name for the selected well
• I f oil density at reference temperature is unknown, perform a density
determina tio n (see pages 93-104)
• I f water density at reference temperature is unknown, perform a density
determina tio n (see pages 93-104)
until separator conte nt s f ro m the previous tes t have been purg ed
determina tio n (see pages 93-104)
• I f t he dif ference bet wee n t wo co nsecutive density readings i s grea te r t han the
programmed deviation, the densit y average is restarted. Th e averaging is
completed when the deviation is not exceeded during the averaging period
determina tio n (see pages 93-104)
• I f t he dif ference bet wee n t wo co nsecutive density readings i s grea te r t han the
programmed deviation, the densit y average is restarted. Th e averaging is
completed when the deviation is not exceeded during the averaging period
determina tio n (see pages 93-104)
determina tio n (see pages 93-104)
Using the Person-Process
Interface
Compensations
The compensations menu allows you to configure the
NOC to perform transient bubble remediation.
Transient bubble remediation (TBR) corrects density
and water cut read ings during brief period s when gas
bubbles are passing through the sensor.
Figure 4-1
•
, page 22, illustrates the effect of
transient bubbles on measured density.
Figure 4-2
•
, page 22, illustrates how the NOC
holds the measured density at the time period
before transient bubbles were detected, if hold
last value is selected as the action taken.
Figure 4-3
•
, page 22, illustrates how transient
bubble remediation corrects density readings.
Configuration Using the View Menu Continuous ModeBefore You Begin Installation Considerations
ALTUS™ Net Oil Computer Manu al
21
Page 32

continued
Configuration
Figure 4-1. Effect of transient bubbles on density
15.00 V
10.00 V
5.00 V
Drive gain (volts)
0.00 V
Figure 4-2. Holding at last measured density
15.00 V
10.00 V
5.00 V
Drive gain (volts)
0.00 V
Programmed drive gain
level (see
Table 4-3
)
Programmed
time period
Table 4-3
(see
1.0 g/cc
Density (g/c c)
0.9 g/cc
Drive gain (volts)
0.8 g/cc
Time
1.0 g/cc
Density (g/c c)
0.9 g/cc
Drive gain (volts)
0.8 g/cc
Time
)
Figure 4-3. Correction of density readings
15.00 V
10.00 V
5.00 V
Drive gain (volts)
0.00 V
Programmed drive gain
level (see
22
Table 4-3
)
1.0 g/cc
Density (g/c c)
0.9 g/cc
Drive gain (volts)
0.8 g/cc
Time
ALTUS™ Net Oil Computer Manu al
Page 33

continued
Configuration
Transient Bubble Remd
Drive Gain Level
Action Taken
Time Period
Configuration
Well performance meas
Hold Last Value
Compensations
Transient bubble remd
5.4 V
15 seconds
To set parameters for transient bubble remediation:
a. Press the security button on the display face.
b. Select Configuration.
c. Select Well Performance Meas.
d. Select Compensations.
e. Select Transient Bubble Remd.
f. Use the function buttons and the cursor control
buttons to configure the parameters that are listed
Table 4-3
in
.
CHG HELP EXIT
Table 4-3. Transient bubble remediation parameters
Variable Default Definition
Drive gain level 14.5 volts • Enter a value of 0.5 to 14.5 volts
Action taken Hold last value • Hold last value:
Time period 15 seconds If hold last value is selected as the action t aken, enter the amount of time before
• T he ent er ed value is the voltage above which the NOC will indicate transient bubbles
• To determine the appropria te value, view the average and maximum values in the
view production measureme nt s m enu ( see 50-51), the view current test me nu (se e
pages 61-62), or the view well tests me nu (se e pages 63-65)
• Entering a value of 14.5 will disable transient bubble remediation
-
The NOC will hold the measured density at the time period before transient bubb le s
were detected
-
Transient bubbles can be indicated by discrete output 1 (see page 36)
-
This option requires configuration of a time period (s ee below)
• Stop well test:
-
The NOC will stop the well test if transient bubbles are detected
-
Transient bubbles can be indicated by discrete output 1 (see page 36)
• A larm only: Transient bubbles will be indicated by discrete output 1 (se e pa ge 36)
transient bubbles were detected that w ill be used to derive a density re ading
Using the Person-Process
Interface
Configuration Using the View Menu Continuous ModeBefore You Begin Installation Considerations
ALTUS™ Net Oil Computer Manu al
23
Page 34

Configuration
continued
Step 2
Configure system data
To configure system data:
Configuration
System
a. Press the security button on the display face.
b. Select Configuration.
c. Select System.
d. Use the function buttons and the cursor control
System
Tag
Time
Date
Master Reset
SEL HELP EXIT
buttons to configure the parameters that are listed
Table 4-4
in
.
Table 4-4. System parameters
Variable Default Description
Ta g Device 1 Enter up to 8 digits and/or characters that identify this NOC, well, or separator
Time Current time Enter a value of 0 to 23 for hours, a value of 00 to 59 for minutes, and a value of 00
Date Cur rent date Enter 4 digits for the year, a character code for the month, and 2 digits for the day
to 59 for seconds
24
ALTUS™ Net Oil Computer Manu al
Page 35

Configuration
continued
Flow variables
Configuration
Inputs
Coriolis
Config process var
Flow variables
Flow Variables
Flow Damping
0.8 sec
Meter Direction
Forward
Mass Units
g/s
Mass Low Flow Cutoff
0.00000 g/s
CHG HELP EXIT
Step 3
Configure inputs
To confi gur e flow variables:
a. Press the security button on the display face.
b. Select Configuration.
c. Select Inputs.
d. Select Coriolis.
e. Select Config Process Var.
f. Select Flow Variables.
g. Use the function buttons and the cursor control
buttons to configure the parameters that are listed
Table 4-5
↓
in
.
Using the Person-Process
Interface
Table 4-5. Flow variables
Variable Default Description
Flow damping 0.8 sec • The selected value is the time req ui re d for flow outputs and di s pl ays to
achieve 63% of their new value in response to a step change at the input
• D amping filters out nois e or th e ef fects of rapid changes in the flow rate
without affecting measurem e n t acc uracy
Meter direction Forward • S el ect the direction in whi ch process fluid will flow thr ough the sensor
relative to the flow direction arrow on th e sensor
• T he sensor can measure forward or backward flow
Mass units g/s • Sel ect the desired unit of mass flow
• Mass flow outputs and displays will indicate flow in the selected unit
Mass low flow cutoff 0.00000 g/s • Enter the mass flow rate below which mass flow outputs and displays will
indicate zero flow
• T he recommended flow cut of f is 0.02% of the flow rate that is repre sented
by the milliamp output at 20 mA. For example, if an output of 20 mA
represents 100 lb/min, the flow cutoff should 0.02 lb/min
• To set the calibration span for milliamp outputs, see page 39
Volume units l/s • S elect the desired unit of volume flow
• Volume flow outputs and displays will indicate flow in the selected unit
V olume low flow cutoff 0.0000 0 l/s • Enter the volume flow rate belo w which v olu me flo w outputs and d ispla ys wil l
indicate zero flow
• T he recommended flow cut of f is 0.02% of the flow rate that is repre sented
by the milliamp output at 20 mA. For example, if an output of 20 mA
represents 100 l/min, t he f low cutof f sho ul d 0. 02 l/min
• To set the calibration span for milliamp outputs, see page 39
Configuration Using the View Menu Continuous ModeBefore You Begin Installation Considerations
ALTUS™ Net Oil Computer Manu al
25
Page 36

Configuration
continued
Density inputs
Configuration
Inputs
Coriolis
Config process var
Density
Density
Density Units
Density Damping
1.7 sec
Slug Low Limit
0.000000 g/cc
Slug High Limit
5.000000 g/cc
CHG HELP EXIT
Table 4-6. Density inputs
g/cc
To configure density inputs:
a. Press the security button on the display face.
b. Select Configuration.
c. Select Inputs.
d. Select Coriolis.
e. Select Config Process Var.
f. Select Density.
g. Use the function buttons and the cursor control
buttons to configure the parameters that are listed
Table 4-6
↓
in
.
Variable Default Description
Density units g/cc • Select the desired unit of density
Density damping 1.7 sec • The selected value is the time required for density outputs and displays to
Slug low limit 0.000000 g/ cc • E nter the desired low limit, in g/cc, for the fluid density. The recommended slug
Slug high limit 5.000000 g/cc • Enter the desire d hi gh limit, in g/cc, for the fluid density. The recommended slug
Slug time 1.0 sec • Enter the number of seconds for which flow outputs will hold their last measured
• D ensity outputs and displays will indicate density in the selected un it
achieve 63% of their new value in response to a step change at the input
• D am ping filters out noise or the effects of rapid cha nges in density without
affecting measurement accurac y
low limit is 0.8 x the lowest density to be measured
• T he ent er ed value is the density below which a slug flow alarm will be generated
• T he ent er ed value should be lower than the density that will cau se drive gain to
indicate the presenc e of tran sient bubbles in the sensor (see pages 21 -23)
• For more information about slug flow, see page 69
high limit is 1.4 g/cc
• T he ent er ed value is the density above which a slug flow alar m will be ge nerat ed
• The entered value should be higher than the density that will cause drive gain to
indicate the presenc e of tran sient bubbles in the sensor (see pages 21 -23)
• For more information about slug flow, see page 69
flow r ate w hile d ens ity i s ou tside the r an ge sp ecif ied b y the s lug l ow limit and s lu g
high limit
• If transient bubble remediation has been implemented, set slug time to 0.0 sec. If
a value of 0.0 is entered, flow outputs will go to th e l evel that indicates zero flow
as soon as slug flow is detected
• T he maximum slug time is 300 seconds
• For more information about slug time, see page 69
26
ALTUS™ Net Oil Computer Manu al
Page 37

Configuration
continued
Temperature
Configuration
Inputs
Coriolis
Config process var
Temperature
Temperature
Temperature Units
degC
Temp. Damping
3.5 sec
CHG HELP EXIT
Table 4-7. Temperature inputs
To confi gure temperature inputs:
a. Press the security button on the display face.
b. Select Configuration.
c. Select Inputs.
d. Select Coriolis.
e. Select Config Process Var.
f. Select Temperature.
g. Use the function buttons and the cursor control
buttons to configure the parameters that are listed
Table 4-7
in
.
Using the Person-Process
Interface
Variable Default Description
Temperature units degC • Select degrees Celsius, Fahrenheit, Rankine, or Kelvin
• Temperature outputs and displays will indicate temperature in the selected unit
Temperature damping 3.5 sec • The selected value is the time required for temperature outputs and displays to
achieve 63% of their new value in response to a step change at the input
• D am ping filters out noise or the effects of rapid cha nges in temperature without
affecting measurement accurac y
• I f de nsi t y de te rmination will be per form ed, set temperature damping at 1.0 sec.
To perform a density determinatio n, see pages 93-104
Configuration Using the View Menu Continuous ModeBefore You Begin Installation Considerations
ALTUS™ Net Oil Computer Manu al
27
Page 38

Configuration
continued
Sensor calibration data
Configuration
Inputs
Coriolis
Sensor cal data
Sensor Cal Data
Flow Factor
1.00000
Flocal Temp Coef
5.130
D1
0.000000
D2
1.000000
CHG HELP EXIT
Sensor calibration data describe the sensor’s
sensitivity to flow, density, and temperature.
To configure sensor calibration data:
a. Press the security button on the display face.
b. Select Configuration.
c. Select Inputs.
d. Select Coriolis.
↓
e. Select Sensor Cal Data.
f. Use the function buttons and the cursor control
buttons to configure sensor calibration data.
• Sensor cal data should be entered from the
sensor serial number tag or factory calibration
certificate.
• Tags and certificates vary in appearance,
depending on the sensor model number and
manufacturing date.
Flow calibration values
include the flow factor and
the flow calibration temperature coefficient. To
configure flow calibration values, see page 29.
Density calibration values
include D1 and D2
density values, K1 and K2 tube periods, the flowing
density correction factor, and the density calibration
temperature coefficient. T o configure density
calibration values, see pages 30-34.
Temperature calibration values
include the
temperature slope and the temperature offset. To
configure temperature calibration values, see
page 35.
28
ALTUS™ Net Oil Computer Manu al
Page 39

continued
Configuration
Flow calibration values
Flow calibration values include the flow factor and the flow calibration
temperature coefficient. To configure flow calibration values, see
Table 4-8
and
Figure 4-4
.
Table 4-8. Flow calibration values
Variable Default Description
Flow factor 1.00000 g/sec • Enter the first 5 di gi ts of th e flow cal factor (see
Flowcal temp coef 5. 130 • Enter the last 3 digits of th e f low cal factor (see
• T he ent er ed value is the flow rate, in g/sec, that generates 1
between velocity signals from the sensor
• T he ent er ed value represents the percent change in the measured flow rate per
100°C change in tempe ratur e
Figure 4-4
Figure 4-4
)
sec of time shift
µ
)
Figure 4-4. Flow calibration values on sensor serial number tag
Flow factor
on
newer
tag
Flow factor
19.0005.13
Flocal temp coef
on
newer
tag
Flocal temp coef
19.0005.13
on
older
on
tag
19.0005.13
older
tag
19.0005.13
Using the Person-Process
Interface
Configuration Using the View Menu Continuous ModeBefore You Begin Installation Considerations
ALTUS™ Net Oil Computer Manu al
29
Page 40

continued
Configuration
Density calibration values
Density calibration values include D1 and D2 density values, K1 and K2
tube periods, the flowing density correction factor (FD), and the density
calibration temperature coefficient (dens temp coeff).
• To configure D1 and D2, see
• To configure K1 and K2, see
Table 4-9
Table 4-10
• To configure FD and the dens temp coeff, see
Figure 4-9
, page 33.
and
and
Figure 4-5
Figure 4-6
Table 4-11
Table 4-9. D1 and D2 density values
Variable Default Description
D1 0.000000 g/cc • If the se ns or tag shows a D1 value, enter the D1 value (see
D2 1.000000 g/cc • If the se ns or tag shows a D2 value, enter the D2 value (see
• I f the sensor tag does not show a D1 value, enter the Dens A or D1 value from
the calibration certificate
• The entered value is the density of the low-density calibration fluid (Micro Motion
uses air)
• I f the sensor tag does not show a D2 value, enter the Dens B or D2 value from
the calibration certificate
• The entered value is the density of the high-density calibration fluid (Micro Motion
uses water)
, below.
, page 31.
Figure 4-5
Figure 4-5
and
)
)
Figure 4-5. D1 and D2 on sensor serial number tag
D1
newer
on
tag
0.0010
D2
on
newer
0.9980
tag
30
ALTUS™ Net Oil Computer Manu al
Page 41

continued
Configuration
Table 4-10. K1 and K2 tube period values
Note
If K1 and K2 values are being entered from a factory calibration certificate:
• D O N OT enter values from the CO M MENTS section on the firs t pa ge ( see
• D O ent er values listed on the second page (see
Variable Default Description
K1 5000.000 • If the sensor tag shows a K1 value, enter the K1 value (see
• I f the sensor tag does not show a K1 value, enter the first 5 di gits of the den si ty
calibration factor (see
• T he ent er ed value represents the sensor flow tube period in
adjusted to 0°C
K2 50000.000 • If the sensor tag shows a K2 value, enter th e K2 value (see
• I f the sensor tag does not show a K2 value, enter the second 5 digits of the density
calibration factor (see
• T he ent er ed value represents the sensor flow tube period in
adjusted to 0°C
Figure 4-8
, page 32)
Figure 4-6
Figure 4-6
Figure 4-7
, older tag)
, older tag)
, page 32)
Figure 4-6
sec associated with D1,
µ
Figure 4-6
, newer tag)
, newer tag)
µsec associated with D2,
Using the Person-Process
Figure 4-6. K1 and K2 on sensor serial number tag
K1
newer
on
tag
12500142864.44
12502.000
K2
newer
on
tag
12500142864.44
14282.000
K1
K2
on
on
older
older
Interface
tag
12500142864.44
Configuration Using the View Menu Continuous ModeBefore You Begin Installation Considerations
tag
12500142864.44
ALTUS™ Net Oil Computer Manu al
31
Page 42

continued
Configuration
Figure 4-7. K1 and K2 values from comments section
not
Do
use these
K1 and K2 values
Figure 4-8. K1 and K2 values from second page
These K1
and K2
values can
be used
32
ALTUS™ Net Oil Computer Manu al
Page 43

continued
Configuration
Table 4-11. FD and dens temp coeff values
Variable Default Description
FD 0.000 • If the se ns or tag shows an FD value, enter the FD value (see
Dens temp coeff 4.440000 • If the se nsor tag shows a TC value, enter the TC value (see
• I f the sensor tag does not show an FD value, enter the ap pr opriate FD value from
Table 4-12
• The entered value adjusts density calculations for the effect of high flow rates on
measured dens i ty
• If the sensor tag does not show a TC value, enter the last 3 digits of the density
calibration factor (see
• T he ent er ed value represents the percent change in the measured density per 100°C
change in temperature
, page 34
Figure 4-9
, older tag)
Figure 4-9. FD and dens temp coeff on sensor serial number tag
FD
newer
on
tag
Figure 4-9
Figure 4-9
)
, newer tag)
Using the Person-Process
Interface
Dens temp coeff
4.44000
newer
on
tag
12500142864.44
310
Dens temp coeff
on
older
tag
12500142864.44
Configuration Using the View Menu Continuous ModeBefore You Begin Installation Considerations
ALTUS™ Net Oil Computer Manu al
33
Page 44

continued
Configuration
Table 4-12. Nominal FD values for sensors
Nominal
ELITE
®
CMF010 standard pressure 316L stainless steel 140
CMF010 standard pressure Inconel
®
686 220
Sensor model Flow tube material
FD value
CMF010 high pressur e Inconel 686 760
CMF025 standard pressure 316L stainless steel or Hastelloy
®
C-22 450
CMF050 standard pressure 316L stainless steel or Hastelloy C-22 430
CMF100 standard pressure 316L stainless steel or Hastelloy C-22 230
CMF200 standard pressure 316L stainless steel or Hastelloy C-22 320
CMF300 standard pressure 316L stainless steel or Hastelloy C-22 280
®
BASIS
F025S 316L stainless steel 0
F050S 316L stainless steel 0
F100S 316L stainless steel 0
F200S 316L stainless steel 350
Model D DS006 standard pressure 316L stainless steel or Hastelloy C-22 450
DS012 stand ard pressure 316L stainless steel 900
DS012 standard pressure Hastelloy C-22 490
DS025 stand ard pressure 316L stainless steel 110
DS025 standard pressure Hastelloy C-22 330
DS040 stand ard pressure 316L stainless steel 220
DS040 standard pressure Hastelloy C-22 610
DS065 stand ard pressure 316L stainless steel 310
DS100 standard pressure 316L stainless steel or Hastelloy C-22 520
DS150 standard pressure 316L stainless steel or Hastelloy C-22 480
DS150 standard pressure 316L stainless steel with Tefzel
®
lining 640
DS300 standard pressure 316L stainless steel or Hastelloy C-22 200
DS300 standard pressure 316L stainless steel with Tefzel lining 260
DS600 standard pressure 316L stainless steel 50
Model DH DH006 high pressure 316L stainless steel 0
DH012 high pressure 316L stainless steel 0
DH025 high pressure 316L stainless steel 0
DH038 high pressure 316L stainless steel 0
DS100 high pressure 316L stainless steel 0
DH150 high pressure 316L stainless steel 0
DH300 high pressure 316L stainless steel 0
Model DL DL065 316L stainless steel 210
DL100 316L stainless steel 670
DL200 316L stainless steel 150
Model DT DT065 Hastelloy C-22 550
DT100 Hastelloy C-22 380
DT150 Hastelloy C-22 130
34
ALTUS™ Net Oil Computer Manu al
Page 45

continued
Configuration
Temperature calibration values
Temperature calibration values include the
temperature slope and the temperature offset. To
configure temperature calibration values, see
Table 4-13
.
Table 4-13. Temperature calibration values
Variable Default Description
Temperature slope 1.000000 • Enter the temperature sl ope value provided by Micro Motion, or pe rfor m a
Temperature offset 0.000000 • Ente r th e t em perature offset value provided by Micro Mo tion, or perform a
temperature calibration
• To perform a temperature calibration, see the
temperature calibration
• To perform a temperature calibration, see the
ALTUS Detailed Setup Manual
ALTUS Detailed Setup Manual
Using the Person-Process
Sensor information
Configuration
Inputs
Coriolis
Sensor information
Sensor information includes variables that serve as
references without affecting calibration parameters,
totalizers, or outputs.
To configure sensor information:
a. Press the security button on the display face.
b. Select Configuration.
Sensor Information
↓
Sensor Model No.
CMF025
Sensor Serial No.
000000
Sensor Material
304 SS
Sensor End Connection
ANSI 150
CHG HELP EXIT
c. Select Inputs.
d. Select Coriolis.
e. Select Sensor Information.
f. Use the function buttons and the cursor control
buttons to configure the parameters that are listed
Table 4-14
in
.
Table 4-14. Sensor information variables
Variable Default Description
Sensor model no. Uninitialized Enter a description of the sensor model, such as "CMF30 0"
Sensor serial no. 000000 Enter the serial number that is on the sensor serial number ta g
Sensor material 304 SS Select the appropriate sensor flow tube material (304 SS, 316L SS, Hastelloy C,
Sensor end connection ANSI 150 Select the appropriate flange, union fitting, sanitary fitting, or wafer fitting
Sensor liner None Select the appropriate liner mater i al for the sensor flow tubes (Tefzel or none)
Inconel, or Tantalum)
Interface
Configuration Using the View Menu Continuous ModeBefore You Begin Installation Considerations
ALTUS™ Net Oil Computer Manu al
35
Page 46

Configuration
continued
Discrete outputs
Configuration
Outputs
Discrete outputs
Discrete output 1
Discrete output 2
Discrete output 3
Discrete Output 1
Power Source
Internal
Assignment
None
CHG HELP EXIT
Step 4
Configure outputs
To configure discrete outputs:
a. Press the security button on the display face.
b. Select Configuration.
c. Select Outputs.
d. Select Discrete Outputs.
e. Select Discrete Output 1, Discrete Output 2, or
Discrete Output 3.
f. Use the function buttons and the cursor control
buttons to configure the power source and
assignment for the selected discrete output.
Power source
Discrete outputs can be connected to factorysupplied or user-supplied relays.
• To select the appropriate power source for
discrete output 1, see
Table 4-15
, below.
• The power source for discrete output 2 and
discrete output 3 cannot be configured.
• For relay specifications and installation
instructions, see the
ALTUS Installation Manual
Assignment
Discrete output 1 can be inactive or can indicate
transient bubble remediation. See
Table 4-16
.
• Discrete output 2 represents net oil.
• Discrete output 3 represents net water.
.
Table 4-15. Discrete output 1 power sources
Note
For relay specifications and installation instructions, see the
Relay type
Factory-supplied relays Internal Select internal power
User-supplied relays Internal • Select internal power if relays are internally powered
Default
Power source
• S el ect external power if relays are externall y powere d
ALTUS Installation Manual
Table 4-16. Discrete output assignment variables
Discrete output Variable
Discrete output 1 Transient bubble
remediation event
None Discrete output 1 will be inactive
Discrete output 2 Net oil Cannot be
Discrete output 3 Net water Cannot be
36
Default
None Discrete output 1 will indicate high drive gain
re-assigned
re-assigned
Description
Discrete output 2 will produce 10 output pulses per
barrel or 10 output pulses per cubic mete r of net oil
Discrete output 3 will produce 10 output pulses per
barrel or 10 output pulses per cubic mete r of net water
ALTUS™ Net Oil Computer Manu al
Page 47

Configuration
CAUTION
continued
Milliamp outputs
Configuration
Outputs
Milliamp outputs
Milliamp output 1
Fault indication
Milliamp output 2
Fault indication
Fault Indication
Condition
Downscale
Setting
3.60 mA
CHG HELP EXIT
Configuring milliamp outputs includes the following
procedures:
• Configuring fault indication
• Assigning a process variable to the output
• Configuring the calibration span
Fault indication
To configure fault indication for milliamp outputs:
a. Press the security button on the display face.
b. Select Configuration.
c. Select Outputs.
d. Select Milliamp Outputs.
e. Select Milliamp Output 1 or Milliamp Output 2.
f. Select Fault Indication.
g. Use the function buttons and the cursor control
buttons to configure the condition and setting of
fault indicators for the selected milliamp output.
Condition:
•
Milliamp outputs can produce
downscale, upscale, last measured value, or
internal zero fault indicators. See
Table 4-17
The default condition is downscale.
Setting:
•
If downscale or upscale is selected
as the fault condition, the setting determines
the amount of current that indicates a fault.
Table 4-17
See
.
Using the Person-Process
Interface
.
Using last measured value or internal zero may
hamper identification of fault outputs.
To make sure fault outputs can be identified, select
downscale or upscale.
Table 4-17. Fault conditions and settings for milliamp outputs
Note
The default condition for fault indication is downscale
Condition Description
Downscale Can be configured from 1. 0 to 3.6 m A 3.6 mA
Upscale Can be configured from 21.0 to 24.0 mA 22.0 mA
Last measured value • Holds at the mA value that represents the last measured value for the process
variable before the fault occurred
• A pp arent lack of variation in the process variable could i ndi cate a fault
Internal zero • Goes to the mA value that rep resents a value of 0.0 for the process variable
• An apparent value of 0.0 for the process variable could indicate a fault
Default
setting
Not applicable
Not applicable
Configuration Using the View Menu Continuous ModeBefore You Begin Installation Considerations
ALTUS™ Net Oil Computer Manu al
37
Page 48

Configuration
None
Frequency Input
Unc Oil Rate
Unc Water Cut
Unc Water Rate
Net Oil Rate
Water Cut
Gross Flow Rate
Net Water Rate
Ave Unc Oil Rate
SAVE EXIT
continued
Configuration
Outputs
Milliamp outputs
Process Variable
Milliamp output 1
Variable assignment
Milliamp output 2
Variable assignment
↓
Process variable
To configure process variables for milliamp outputs:
a. Press the security button on the display face.
b. Select Configuration.
c. Select Outputs.
d. Select Milliamp Outputs.
e. Select Milliamp Output 1 or Milliamp Output 2.
f. Select Variable Assignment.
g. Press CHG to access the process variable menu.
h. Use the function buttons and the cursor control
buttons to select one of the process variables
listed in
Table 4-18
.
Table 4-18. Process variables for milliamp outputs
Variable
Frequency input Mass flow Process variable that is represented by the frequency input
Unc oil rate Uncorrected flow rate of oil
Unc water cut Uncorrected water cut
Unc water rate Uncorrected flow rate of water
Backflow rate Real-time reverse flow rate
Net oil rate Real-time net flow rate of oil at reference temperature
Water cut Real-time water cu t at re ference temperature
Gross flow rate Real-time flow rate of oil and water
Net water rate Real-time net flow rate of water at reference temperature
Ave unc oil rate Average uncorrected flow rate of oil
Ave unc water cut Average uncorrected water cut
Ave unc gross flow Uncorrected average flow rate of oil and water
Ave unc water rate Uncorrected average flow rate of water
Ave net oil rate Average net flow rate of oil at reference temperature
Ave water cut Average water cut at reference temperature
Ave gross flow rate Average flow rate of oil and water
Ave net water rate Average net flow rate of oil at reference temperature
Temperature Temperature
Mass flow rate Mass flow rate
Mass flow live zero Flow rate when it drops below the mass low flow cutoff
Density Density of oil and water
Vol. flow rate Volume flow rate of oil and water
Drive gain Drive gain voltage
Default
Description (what the output will represent)
38
ALTUS™ Net Oil Computer Manu al
Page 49

Configuration
20.0mA
4.0mA
Low Flow Cutoff
Damping Seconds
CHG HE LP EXIT
continued
Configuration
Outputs
Milliamp outputs
Calibration Span
Milliamp output 1
Calibration span
Milliamp output 2
Calibration span
↓
0.00 g/s
0.000 g/s
0.00 g/s
0
Calibration span
To configure the calibration span for milliamp outputs:
a. Press the security button on the display face.
b. Select Configuration.
c. Select Outputs.
d. Select Milliamp Outputs.
e. Select Milliamp Output 1 or Milliamp Output 2.
f. Select Calibration Span.
• The calibration span menu item appears only
after a process variable has been assigned to
the output.
• To assign process variables to milliamp
outputs, see page 38.
g. Use the function buttons and the cursor control
buttons to configure the parameters that are listed
Table 4-19
in
.
Using the Person-Process
Interface
Table 4-19. Calibration span variables
Notes
• The calibration span menu item appears only after a process variable has been assigned to the output
• To assign process variables to milliamp outputs, see page 38
• S om e values are dependent on sensor calibration data. To configure sensor calibration d at a, see pages 18-26
Variable Default Description
20 mA Sensor upper limit • Enter the value the outp ut w ill represent at 20.0 mA
4 mA Sensor lower limit • Enter the value the output will represent at 4.0 mA
Low flow cutoff 0 for all variables If a flow variable is assigned to the output, the low flow cutoff is the flow rate below
Damping seconds 0 sec • Select the amount of added damping for the milliamp outpu t
4.0 mA minimum Not applicable
20.0 mA maximum The highest value that can be represented by the output
Minimum span • The smallest allowable difference between the value re pr ese nt ed at 4.0 mA and
(read-only)
• T he ent er ed value must be greater than the 4.0 mA value
• T he ent er ed value must be less than the 20.0 mA value
which the output will indicate zero flow
• T he sel ected value is the amount of time that is added to damping on flow,
density, or temperature
The lowest value that can be represented by the outpu t
the value represented at 20. 0 m A
• T he 20.0 mA value must be greater than th e 4. 0 mA value
Configuration Using the View Menu Continuous ModeBefore You Begin Installation Considerations
ALTUS™ Net Oil Computer Manu al
39
Page 50

Configuration
continued
Pulse output
Configuration
Outputs
Frequency output
To configure the pulse output:
1. Press the security button on the display face.
2. Select Configuration.
3. Select Outputs.
4. Select Frequency Output.
5. Use the function buttons and the cursor control
Frequency Output
↓
Flow Source
None
Flow Units
kg/min
Scaling Method
Frequency = Flow
Frequency
1000.000 Hz
CHG HELP EXIT
buttons to configure the parameters that are listed
Table 4-20
in
.
CAUTION
Using last measured value or internal zero may
hamper identification of fault outputs.
To make sure fault outputs can be identified, select
downscale or upscale.
Table 4-20. Pulse output variables
Variable Default Description
Flow source Mass flow Select none, frequency inpu t, uncorrected oil volume, uncorrected water
Scaling method Frequency = flow • Select frequency = flow, pulses/unit, or units/pulse
Frequency 1000.000 Hz • I f fre quency = flow is selected as the scal ing m et hod, enter the
Flow 16,666 g/sec • If frequency = flow is selected as the scaling method, enter the flow rate
Pulses 60.00 pulses • If pulses/unit is selected as the scaling method, en te r t he num ber of
Units 16.667 g • I f un its/pulse is selected as t he scaling method, en te r t he num ber of
Maximum pulse width 511 ms • The pulse widt h can be configured for output frequencie s bel ow 500 Hz
Power Active Select active or passive operation for the frequency output
Fault indication Downscale • Downscale: Output goes to 0 Hz
volume, backflow volume, net oil volume, gross volume, net water
volume, mass, or volume
• T he frequency output has a range of 0 to 12, 50 0 H z
frequency (or pulse rate), in Hz, that represents the configured flow rate
• To scale the pulse output, see the example on page 41
that is represented by the configured frequency
• To scale the pulse output, see the example on page 41
output pulses that re pr esent one mass or volume unit
• To scale the pulse output, see the example on page 41
mass or volume units that are represented by one output pulse
• To scale the pulse output, see the example on page 41
• Enter the desired pulse width in milliseconds
• Voltage is 24 VDC nominal for active operation, 20 VD C appli ed
maximum fo r pa ssive operation
• S ourcing current is 10 mA at 3 VDC for active operation
• S i nking current is 500 mA for active or passive operation
• Upscale: Output goes to 15,000 Hz
• Last measured value:
- Output holds at the fre quency that represen t s t he la s t m easured flow
rate before the fault occurred
- Apparent lack of variation in the flow rate could indicate a fault
• I nt ernal zero:
- Output goes to 0 Hz
- An apparent no-flow condition could indicate a fault
40
ALTUS™ Net Oil Computer Manu al
Page 51

Configuration
continued
Example:
Scale the pulse output so 10,000 pulses represent one barrel of actual
liquid. This would be a common setting for a volumetric proving
application.
a. Select volume as the flow source. Remember that gross volume is
temperature-corrected, and volume is actual volume at line
conditions.
b. Select bbl/day as the flow unit.
c. Select pulses per unit as the scaling method.
Using the Person-Process
d. Change the frequency to 10,000 Hz.
Interface
The output pulses are now configured for 10,000 pulses per barrel.
Configuration Using the View Menu Continuous ModeBefore You Begin Installation Considerations
ALTUS™ Net Oil Computer Manu al
41
Page 52

42
ALTUS™ Net Oil Computer Manu al
Page 53

5 Using the View Menu
5.1 Accessing the view menu
When you press VIEW at the operation screen, the view menu is
displayed.
buttons and cursor control buttons in the view menu.
Figure 5-1. Using buttons in the view menu
Well Performance Meas
Process Totalizers
Active Alarm Log
LCD Options
Diagnostic Monitor
Applications List
Power Outage
SEL HELP EXIT
Figure 5-1
VIEW MENU
shows the functions performed by the function
EXIT
If SEL has been pressed,
move cursor toward left
Move cursor upward
SELECT
If SEL has been pressed ,
move cursor toward right
Move cursor downward
Using the Person-Process
Interface
Configuration Using the View Menu Continuous ModeBefore You Begin Installation Considerations
START • Start well test
• S t art averaging oil or water densities
STOP • Stop well test
• Stop averaging oil or water densities
CLEAR Clear all displayed values
RESET Reset total
PAUSE • Pause counting of all displayed totals
• Pause performance measurements
RESUME • Resume counting of all displayed totals
• R esume production meas ur em ents
SEL Select the highlighted option
CHG Make a change to the highlighted option
SAVE Save a change
ENTER Enter a password
YES Proceed with action
OK Proceed with action
NEXT • Scroll to next screen
• At the last screen, scroll to the first screen
• Test the next well in the sequence
RETURN Return to well test screen
PGDN Page down to next help screen
ALTUS™ Net Oil Computer Manu al
VIEW Access the view menu
ACK Acknowledge an alarm message
EXIT Retur n to t he pr evious sc reen
NO Cancel action
HELP Show a help screen
RESET Reset total
START Start a new well test
VIEW View performance meas urements for a
well that i s being tested
PRINT Send a ticket to a printer
PGUP Page up to previous help screen
43
Page 54

Using the View Menu
continued
5.2 Well performance measurements
Continuous mode
View
Well performance meas
Well Performance Meas
View Production Meas
Quick View
Pause / Resume
Reset
SEL HELP EXIT
The tasks you can perform in the well performance
measurements menu depend on the operation mode.
To set the NOC to operate in continuous mode, see
page 16. To use the NOC in continuous mode, see
pages 49-54.
In continuous mode, the well performance
measurements menu includes the following items:
• View Production Meas
•Quick View
• Pause/Resume
• Reset
Well test mode
View
Well performance meas
Well Performance Meas
Start Well Test
View Well Tests
SEL EXIT
To set the NOC to operate in well test mode, see
page 16. To use the NOC in well test mode, see
pages 55-65.
In well test mode, the items in the well performance
measurements menu depend on whether or not a
well test is in progress.
If a well test is not in progress
If a well test is not in progress, the well performance
measurements menu includes the following items:
•Start Well Test
•View Well Tests
44
ALTUS™ Net Oil Computer Manu al
Page 55

Using the View Menu
CAUTION
View
Well performance meas
Well Performance Meas
Return To Well Test
View Well Tests
View Current Test
SEL EXIT
continued
If a well test is in progress
If a well test is in progress, the well performance
measurements menu includes the following items:
• Return to Well Test
•Start Well Test
• View Current Test
Using the Person-Process
Interface
5.3 Process totalizers
View
Process totalizers
Process
Process
Mass
769.9 lb
Volume
56,485.88 bbl
Freq Input Rollover
9999999999.99 lb
Mass Rollover
9999999999.99 lb
PAUSE RESET EXIT
↓↑
In the view menu, you can monitor or reset process
totals, and pause and resume counting of displayed
totals.
The volume that is displayed in the process totalizers
menu is the measured mass divided by the
measured density. Temperature compensation and
reference oil and water densities are not used in this
calculation. The displayed total is the actual gross
volume of fluid.
If counting has been paused, pressing RESET will
cause the total to reset to a non-zero value.
To make sure the total resets to zero, press RESET
before pressing PAUSE.
Configuration Using the View Menu Continuous ModeBefore You Begin Installation Considerations
ALTUS™ Net Oil Computer Manu al
45
Page 56

Using the View Menu
continued
To reset a process totalizer, or to pause and resume
counting of the displayed totals:
1. At the operation screen, press VIEW.
2. Select Process Totalizers.
3. Select Process.
4. Select the desired process totalizer.
• To reset the selected totalizer, press RESET.
Pressing reset does not affect a well test that
is in progress.
• To pause counting of all displayed totals, press
PAUSE.
• To resume counting of all displayed totals,
press RESUME.
5. Press EXIT repeatedly to return to the operation
screen.
The value to which the process total resets depends
on whether or not counting has been paused.
• If you press RESET without pressing PAUSE, the
total resets to zero.
• If you press PAUSE, then press RESET, the total
resets to the amount that accumulated from the
time counting was paused to the time the total
was reset. For example, if counting was paused at
500 barrels, then 25 barrels were counted before
the total was reset, the total resets to 25 barrels.
5.4 Inventory totalizers
View
Process totalizers
Inventory
Inventory
Mass
769.9 lb
Volume
56,485.88 bbl
Freq Input Rollover
9999999999.99 lb
Mass Rollover
9999999999.99 lb
↓↑
EXIT
The display shows rollover values for each totalizer.
The rollover value is the maximum total that can be
achieved before the totalizer rolls over to zero .
To monitor inventory totalizers:
1. At the operation screen, press VIEW.
2. Select Process Totalizers.
3. Select Inventory.
4. Press EXIT repeatedly to return to the operation
screen.
The volume that is displayed in the inventory
totalizers menu is the measured mass divided by the
measured density. Temperature compensation and
reference oil and water densities are not used in this
calculation. The displayed total is the actual gross
volume of fluid.
The display shows rollover values for each totalizer.
The rollover value is the maximum inventory that can
be achieved before the inventory rolls over to zero.
46
ALTUS™ Net Oil Computer Manu al
Page 57

Using the View Menu
continued
5.5 Active alarm log
View
Active alarm log
Active Alarm Log
Density Alarm
17-JUL-98 8:30
Temperature Alarm
10-JUL-98 9:04
Alarm-Meas Paused
10-JUL-98 5:10
HELP EXIT
5.6 LCD options
View
LCD options
LCD Options
Contrast
LCD Backlight
The NOC performs self-diagnostics during operation.
If the NOC detects certain events or conditions, an
alarm message appears in the highlight bar at the top
of the screen.
If the condition that caused an alarm is present, the
alarm is listed in the active alarm log.
• Each alarm is time/date stamped.
• The first alarm listed is the most recent.
For information about responding to alarm
messages, see pages 67-78.
The active alarm log is also accessible via the
maintenance menu (see page 78).
Using the Person-Process
Interface
Display contrast can be adjusted for operator
preference. After selecting LCD Options from the
View menu:
• Select Contrast to adjust the screen contrast
• Select LCD Backlight to turn screen backlighting
on or off
Configuration Using the View Menu Continuous ModeBefore You Begin Installation Considerations
SEL HELP EXIT
ALTUS™ Net Oil Computer Manu al
47
Page 58

Using the View Menu
continued
5.7 Diagnostic monitor
View
Diagnostic monitor
Diagnostic Monitor
Drive Gain
2.580 V
Tube Frequency
89.23 Hz
Live Zero
0.01 lb/min
5.8 Applications list
The diagnostic monitor shows real-time values for
drive gain, sensor flow tube frequency, and live zero.
• Drive gain is useful for indicating transient
bubbles in the sensor flow tubes. To configure the
NOC for transient bubble remediation, see pages
21-23.
• Tube frequency is useful for troubleshooting fault
alarms. To troubleshoot fault alarms, see pages
75-77.
• Live zero is useful for monitoring the indicated
flow rate when it drops below the mass low flow
cutoff, or when there is no flow. To configure the
mass low flow cutoff, see page 25.
EXIT
The applications list shows all appli cat ion s that ar e
installed and the software revision for each. Refer to
this screen if you need to know the software revision
number to report problems.
5.9 Power outage
View
Po wer outa ge
Power Outage
#3 Power Off At
06:00 28 OCT 1998
#3 Power On At
06:30 28 OCT 1998
#2 Power Off At
08:02 2 AUG 1998
#2 Power On At
08:05 2 AUG 1998
CLEAR EXIT
The power outage menu enables you to view the
power off and power on times and dates for the last
three power outa ges that lasted more than 30
seconds.
To clear times and dates, press CLEAR.
↓
48
ALTUS™ Net Oil Computer Manu al
Page 59

6 Continuous Mode
6.1 Continuous mode
configuration
6.2 Startup and display test
6.3 Process monitor
6.4 Accessing continuous
mode
Figure 6-1. Process monitor mode
To configure the NOC to operate in continuous mode, see page 16.
At startup, the transmitter automatically tests its display. During display
testing, all pixels darken for approximately five seconds. After the display
test is completed:
1. The Micro Motion
2. An application list appears.
3. The transmitter enters the operation mode, as shown in
The process monitor is the default operation mode. See
To access the continuous mode, press VIEW.
®
logo appears.
Figure 6-1
Figure 6-1
.
.
Using the Person-Process
Interface
Configuration Using the View Menu Continuous ModeBefore You Begin Installation Considerations
Volume Flow
Backlit
display
Volume Total
NEXT PRINT VIEW
Function buttons
ALTUS™ Net Oil Computer Manu al
DEVICE 1
4,352.33
bpd
56,485.88
bbl
Cursor control
buttons
Security button
49
Page 60

Continuous Mode
continued
6.5 Viewing production measurements
View
Well performance meas
Well Performance Meas
View Production Meas
Quick View
Pause / Resume
Reset
SEL HELP EXIT
View Production Meas
Net Oil
Water Cut
Gross Flow
Net Water
Drive Gain
Density
Temperature
Back Flow
Mass Flow
Uncorrected Flow
To view production measurements:
1. At the operation screen, press VIEW.
2. Select Well Performance Meas.
3. Select View Production Meas.
4. Select any of the production measurements that
are listed in
Table 6-1
, page 51.
SEL EXIT
Net Oil
Actual Rate
13,110 bpd
Average Rate
13,050 bpd
Minimum Flow
12,111 bpd
Minimum Time/Date
08:23 28 SEPT 98
EXIT
• For net oil, water cut, net water, density,
temperature, mass flow, and uncorrected flow, the
display indicates the actual value, the average
value, the minimum and maximum values, the
↓
time and date when minimum and maximum
values were achieved, and the time and date of
the last reset.
• F or drive gain and back flow , the display indicates
the actual value, the average value, the maximum
value, the time and date when the maximum
value was achieved, and the time and date of the
last reset.
50
ALTUS™ Net Oil Computer Manu al
Page 61

Continuous Mode
View
Well performance meas
View production meas
Temperature
Actual Temperature
Average Temperature
Minimum Temperature
Minimum Time/Date
08:23 28 SEPT 98
RESET EXIT
continued
Temperature
123.4 degF
122.7 degF
112.6 degF
Drive gain, density, temperature, and back flow
menus have an individual RESET button for each,
which enables resetting of these individual values in
the menu.
Drive gain, density, temperature, and back flow are
also reset when well performance measurements are
reset (see page 54).
↓
Using the Person-Process
Interface
Table 6-1. Continuous production measurements
Note
• For net oil, water cut, net water, density, temperature, mass flow, and uncorrected flow, the NOC indicates the actual value, the
average value, the minimum and maximum values, the time and dat e w hen minimum and maximum values were achieved,
and the time and date of the last res et
• For drive gain and back flow, the NOC indicates the act ual value, the average value, the maximum value, the time and date
when the maximum value was achieved, and the time and date of t he l as t re set
Production
measurement Definition
Net oil • Net oil, in barrels or cubic meters, at 60°F, 15°C, or 20°C
• N et oi l cannot be reset in this menu
Water cut • Water cut as 0% to 100% at 60°F, 15°C, or 20°C
• Water cut cann ot be reset in this menu
Gross flow • Flow rate of oil and water, in barrels or cubic meters, at 60°F, 15°C, or 20°C
• Gross flow cannot be reset in this menu
Net water • Net water, in barrels or cubic meters, at 60°F, 15°C, or 20°C
• N et water can not be r eset in this menu
Drive gain • Sensor drive gain in volts
• R ecorded drive gain can be reset individually
Density • Fluid density, in density unit selected during configuration
• D uring transient bubble remediation, the density at which the measure m ent is being held, if hold
last value was selected as the action taken (see pag es 21-23)
• Density can be reset individually
Temperature • Fluid temperature, in temperature unit select ed during configuration
• Temperature can be reset individuall y
Back flow • Actual volume flow rate in reverse direction
• B ack flow can be r eset individually
Mass flow • Mass flow rate of all fluid
• Mass flow cannot be rese t in t hi s m enu
Uncorrected flow • Select any of these production measurements that are no t corrected for temperature:
- Uncorrecte d oil
- Uncorrecte d water
- Uncorrecte d water cut
- Uncorrecte d gross
• U ncorrected flow canno t be res et in the se menus
Configuration Using the View Menu Continuous ModeBefore You Begin Installation Considerations
ALTUS™ Net Oil Computer Manu al
51
Page 62

Continuous Mode
continued
6.6 Quick view
View
Well performance meas
Quick view
Quick View
Average Net Oil Rate
30,110.98 bpd
Net Oil Total
7,654,321.89 bbl
Average Water Cut
Average Gross Rate
The quick view menu allows you to view the following
values:
• Average net oil rate
• Net oil total
• Average water cut
• Average gross rate
• Gross total
• Average/total since last reset
• Test time elapsed
To access the quick view menu:
1. At the operation screen, press VIEW.
2. Select Well Performance Meas.
3. Select Quick View.
↓
12.11 %
724.29 bpd
EXIT
6.7 Pause and resume
View
Well performance meas
Pause / resume
Well Performance Meas
View Production Meas
Quick View
Pause / Resume
Reset
SEL HELP EXIT
52
To pause or resume the accumulation of production
measurements:
1. At the operation screen, press VIEW.
2. Select Well Performance Meas.
3. Select Pause / Resume.
ALTUS™ Net Oil Computer Manu al
Page 63

Continuous Mode
Pause / Resume
Production Meas
PAUSE EXIT
continued
Resumed
4. To pause accumulation of production
measurements, press PAUSE.
Using the Person-Process
DEVICE 1
Production Measurements are on
Pause
Paused Time
0:08 hrs:min
RESUME EXIT
Alarm-Meas Paused
Net Oil
Actual Rate
13,110 bpd
Average Rate
13,050 bpd
Minimum Flow
12,111 bpd
Minimum Time/Date
08:23 28 SEPT 98
ACK
5. To resume accumulation of production
measurements, press RESUME.
Interface
Configuration Using the View Menu Continuous ModeBefore You Begin Installation Considerations
Fifteen minutes after measurements have been
paused, the transmitter produces an alarm message
that reads, "Meas Paused."
• Press ACK to acknowledge the alarm.
• The "Meas Paused" alarm will be produced every
↓
15 minutes until measurements are resumed.
ALTUS™ Net Oil Computer Manu al
53
Page 64

Continuous Mode
continued
6.8 Reset
View
Well performance meas
Reset
Well Performance Meas
View Production Meas
Quick View
Pause / Resume
Reset
SEL HELP EXIT
Reset
Last Reset All
19:07 28 SEPT 1998
Paused Time
Test Time Elapsed
22:52 hrs:min
To reset performance measurements:
1. At the operation screen, press VIEW.
2. Select Well Performance Meas.
3. Select Reset.
4. When the warning screen appears, select YES to
continue to with the reset.
WARNING
Selecting reset will reset all of the performance
measurement totals, averages, minimums, and
maximums at once.
Set control devices for manual operation before
selecting reset.
The display shows the time and date of the last reset,
the total amount of time well performance
measurements have been paused since the last
reset, and the elapsed test time since the last reset.
0:00 hrs:min
RESET EXIT
54
ALTUS™ Net Oil Computer Manu al
Page 65

7 Well Test Mode
7.1 Well test mode
configuration
7.2 Startup and display test
7.3 Process monitor
7.4 Accessing well test mode
Figure 7-1. Process monitor mode
To configure the NOC to operate in the well test mode, see page 16.
At startup, the transmitter automatically tests its display. During display
testing, all pixels darken for approximately five seconds. After the display
test is completed:
1. The Micro Motion
2. An application list appears.
3. The transmitter enters the operation mode, as shown in
The process monitor is the default operation mode. See
To access the well test mode, press VIEW.
®
logo appears.
Figure 7-1
Figure 7-1
.
DEVICE 1
.
Determination
Determination
Laboratory Density
In-Line Density
Volume Flow
Backlit
display
Volume Total
NEXT PRINT VIEW
Function buttons
ALTUS™ Net Oil Computer Manu al
352.33
bpd
485.88
bbl
Cursor control
buttons
Sensitivity Analysis Software DiagramsWell Test Mode Maintenance
Security button
55
Page 66

Well Test Mode
continued
7.5 Conducting a well test
View
Well performance meas
Well Performance Meas
Start Well Test
View Well Tests
SEL EXIT
Start Well Test
Wells 1 to 12
Wells 13 to 24
Wells 25 to 36
Wells 37 to 48
To conduct a well test:
1. At the operation screen, press VIEW.
2. Select Well Performance Meas.
3. Select Start Well Test.
4. Select the menu item for the number of the well
that will be tested, then press CHG.
CHG EXIT
Wells 1 to 12
01: Tinsley 22-14b
02: N Cowden 24-17a
03: R Dutton 36-13c
04: B Olsen 23-15d
05: 13-24-44-5E6
06: 08-11-23-6E2
07: 18-44-04-3W5
08: 12-28-36-6W7
SAVE EXIT
5. Select the well that will be tested, then press
SAVE.
↓
56
ALTUS™ Net Oil Computer Manu al
Page 67

Well Test Mode
Well Name
Last Test
START EXIT
01: Tinsley
Well #1
Tinsley 22-14b
09:32 21 OCT 1998
DEVICE 1
On Test
Purge Time Remaining
STOP VIEW EXIT
continued
26:31
6. Press START to start the well test.
• If purge time is zero, the NOC first indicates test
time as zero, then begins counting.
• If purge time is not zero, the NOC counts
downward and indicates the purge time. When
the purge is completed, the elapsed test time is
displayed, and continues increasing throughout
the test.
• To monitor performance measurements while the
test is in progress, press VIEW. For more
information, see page 60.
• To stop the test, press STOP. For more
information, see pages 58-59.
Determination
Determination
Laboratory Density
In-Line Density
01: Tinsley
DEVICE 1
On Test
Test Started
14:33 28 OCT 1998
Test Time Elapsed
2:30:13
STOP VIEW EXIT
ALTUS™ Net Oil Computer Manu al
When the purge is complete, the NOC indicates the
start time and elapsed time for the test. The Test
Started time is the time when the purge was
completed and the well test began.
Sensitivity Analysis Software DiagramsWell Test Mode Maintenance
57
Page 68

Well Test Mode
continued
7.6 Stopping and continuing a well test
DEVICE 1
01: Tinsley
On Test
Test Started
14:33 28 OCT 1998
Test Time Elapsed
2:30:13
STOP VIEW EXIT
01: Tinsley
Stop Well Test?
To stop a well test, press STOP.
• To stop the test, press YES.
• To continue the test, press NO.
YES NO
DEVICE 1
01: Tinsley
Test Stop
Test Started
14:33 28 OCT 1998
Test Time Elapsed
2:30:13
NEXT START EXIT
• To test the next well in the sequence, press NEXT.
• To start a new test on the same well, press
START.
58
ALTUS™ Net Oil Computer Manu al
Page 69

Well Test Mode
Well Name
Last Test
START EXIT
Well #2
N. Cowden 24-17a
14:30 22 OCT 1998
Well #1
continued
If a well test has been stopped, then NEXT has been
pressed as explained on page 58, the next well in the
sequence can be tested.
Laboratory Density
Determination
• To test the same well again after a test has been
stopped as explained on page 58, press YES.
• To return to the well selection screen that is
illustrated at step 5 (page 56), press NO.
Test this well again?
YES NO
Well #1
Purge this well
again?
YES NO
• To purge the well again, press YES.
• To start a test without purging the well, press NO.
Determination
Sensitivity Analysis Software DiagramsWell Test Mode Maintenance
In-Line Density
ALTUS™ Net Oil Computer Manu al
59
Page 70

Well Test Mode
continued
7.7 Viewing performance measurements
DEVICE 1
01: Tinsley
On Test
Test Started
14:33 28 OCT 1998
Test Time Elapsed
2:30:13
STOP VIEW EXIT
Well #1
↓
Actual Net Oil Rate
14,223.88 bpd
Average Net Oil Rate
14,010.99 bpd
Actual Water Cut
12.01 %
Average Water Cut
11.89 %
RETURN HELP EXIT
During a well test, you can view on-line values of
performance measurements by pressing VIEW.
The NOC indicates the following performance
measurements:
• Actual net oil flow rate
• Average net oil flow rate
• Actual water cut
• Average water cut
• Actual gross flow rate
• Average gross flow rate
• Actual fluid density. During transient bubble
remediation, the density at which the
measurement is being held, if hold last value was
selected as the action taken (see pages 21-23)
• Actual fluid temperature
60
To view detailed performance measurements for a
well that is being tested, see pages 61-62.
ALTUS™ Net Oil Computer Manu al
Page 71

Well Test Mode
continued
7.8 Viewing performance measurements for the
current test
View
Well performance meas
Well Performance Meas
Return to Well Test
View Well Tests
View Current Test
SEL EXIT
01: Tinsley
Net Oil
Water Cut
Gross Flow
Net Water
Drive Gain
Density
Temperature
Back Flow
Mass Flow
Uncorrected Flow
Test Times
SEL EXIT
To view detailed performance measurements for the
well that is being tested:
1. At the operation screen, press VI EW.
2. Select Well Performance Meas.
3. Select View Current Test. This menu item
appears only while a well test is in progress.
4. Select any of the performance measurements
that are listed in
Table 7-1
, page 62.
Determination
Determination
Laboratory Density
In-Line Density
ALTUS™ Net Oil Computer Manu al
Sensitivity Analysis Software DiagramsWell Test Mode Maintenance
61
Page 72

continued
Well Test Mode
For each performance measure except test times,
the NOC indicates the actual value, the average
value, the minimum and maximum values, and the
time and date when minimum and maximum values
Net Oil
↓
Actual Rate
13,110.87 bpd
Average Rate
13,050.09 bpd
Minimum Flow
12.111.07 bpd
Minimum Time/Date
08:23 28 SEPT 1998
EXIT
were achieved.
Table 7-1. Performance measurements for current well test
Note
For each performance measurement except test times, the NOC indicates the actual value, the average value, the minimum and
maximum values, and the time an d dat e w h en minimum and maximum values we re achieved
Performance measure D ef i ni ti on
Net oil Net oil, in barrels or cubic meters, at 60°F, 15°C, or 20°C
Water cut Water cut as 0% to 100% at 60°F, 15°C, or 20°C
Gross flow Volume flow of oil and water, in barrels or cubic meters, at 60°F, 15°C, or 20°C
Net water Net water, in barrels or cubic meters, at 60°F, 15°C, or 20°C
Drive gain Sensor drive gain in volts
Density Fluid density, in density unit selected during configuration
Temperature Flui d t em perature, in temperature unit selected during configuration
Back flow Reverse flow rate of all fluid
Mass flow Mass flow rate of all fluid
Uncorrected flow Select any of these performa nce measurements that are not cor r ect ed for temperature:
Te st times View the following times:
• Uncorrected oil
• Uncorrected water
• Uncorrected water cut
• Uncorrected gross
•Test started
• Test time elapsed
• Transient bubble time
62
ALTUS™ Net Oil Computer Manu al
Page 73
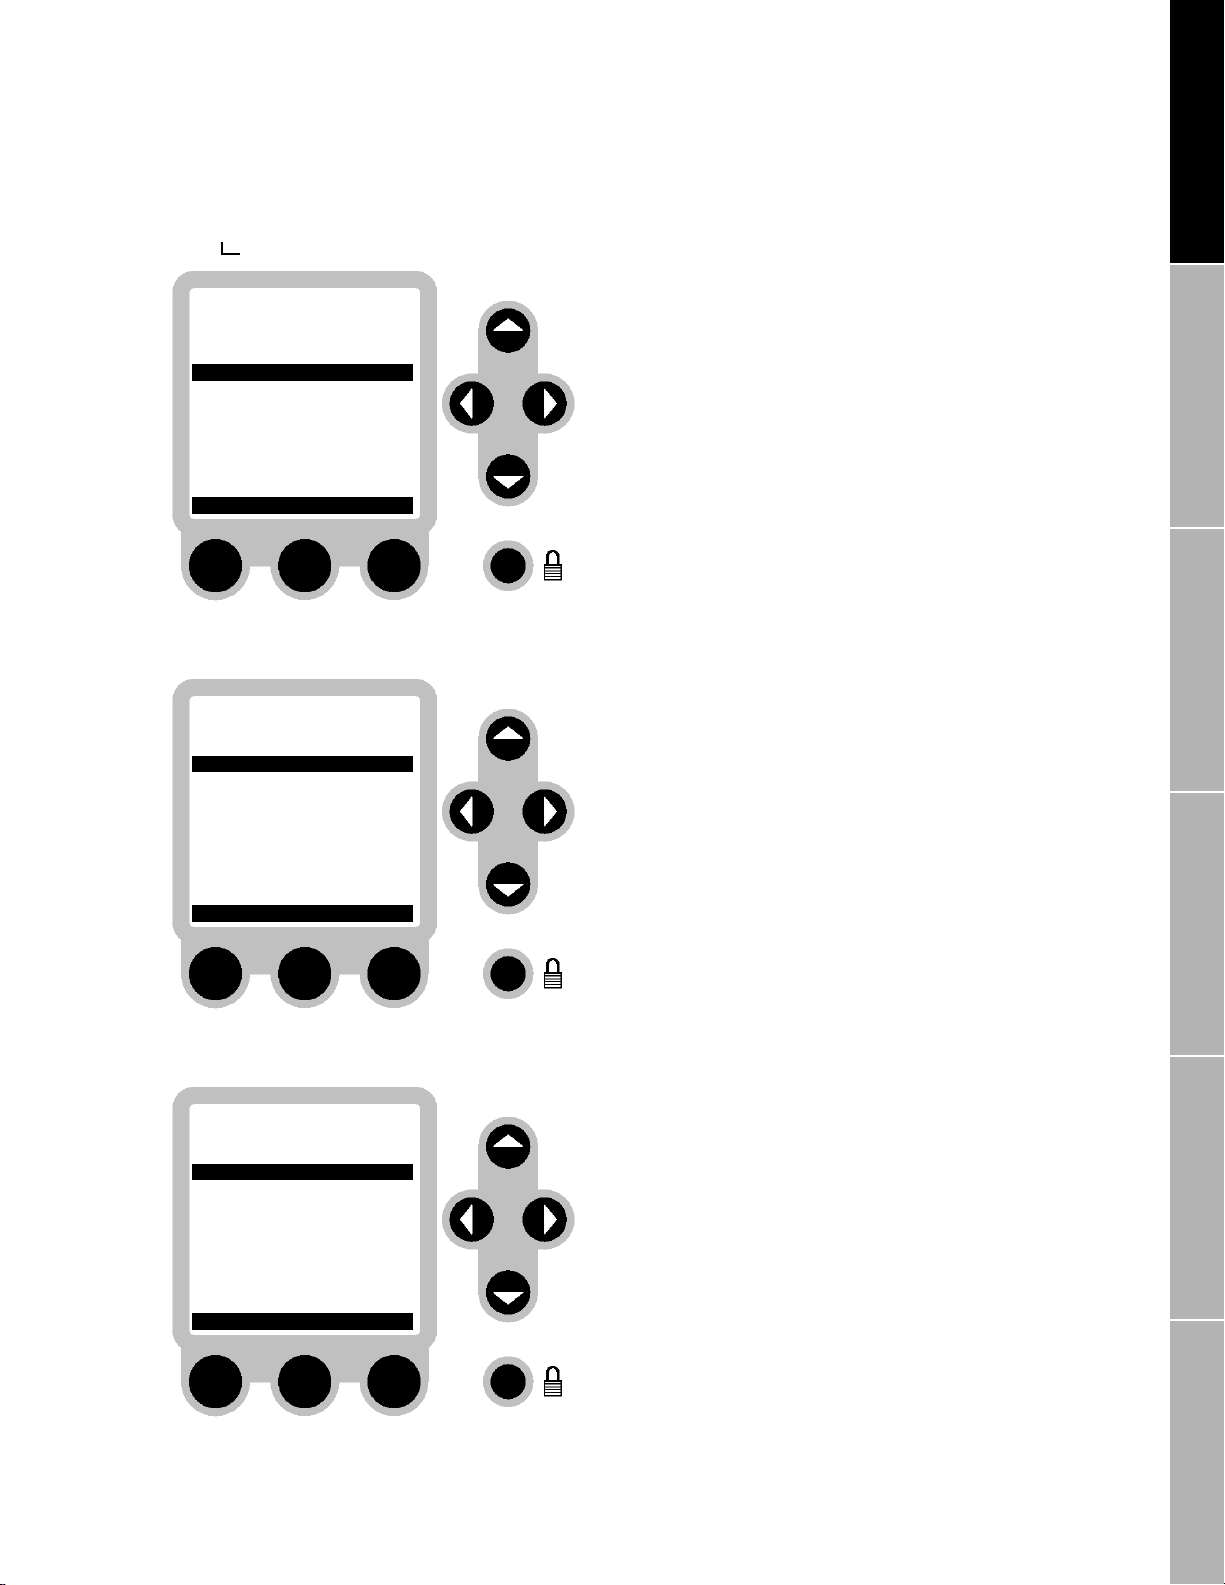
Well Test Mode
continued
7.9 Viewing previous well tests
View
Well performance meas
Well Performance Meas
Start Well Test
View Well Tests
SEL EXIT
Start Well Test
Wells 1 to 12
Wells 13 to 24
Wells 25 to 36
Wells 37 to 48
To view performan ce mea su re men ts for well tests
that have been completed:
1. At the operation screen, press VI EW.
2. Select Well Performance Meas.
3. Select View Well Tests.
4. Select the menu item for the number of the well
that has been tested, then press CHG.
Determination
Determination
Laboratory Density
In-Line Density
CHG EXIT
Wells 1 to 12
01: Tinsley 22-14b
02: N Cowden 24-17a
03: R Dutton 36-13c
04: B Olsen 23-15d
05: 13-24-44-5E6
06: 08-11-23-6E2
07: 18-44-04-3W5
08: 12-28-36-6W7
SAVE EXIT
5. Select a well that has already been tested, then
press SAVE.
Sensitivity Analysis Software DiagramsWell Test Mode Maintenance
↓
ALTUS™ Net Oil Computer Manu al
63
Page 74

Well Test Mode
01:42 14 OCT 1998
10:12 13 SEP 1998
09:04 14 AUG 1998
SEL HELP EXIT
Net Oil
Water Cut
Gross Flow
Net Water
Drive Gain
Density
Temperature
Back Flow
Mass Flow
Uncorrected Flow
Test Times
SEL EXIT
Well #1
01: Tinsley
continued
6. Select the time and date of the test for which
performance measurements will be viewed. The
listed time is the time when the purge was
completed and the well test began.
7. Select any of the performance measurements
that are listed in
Table 7-2
, page 65.
Average Rate
Minimum Flow
Minimum Time/Date
08:23 28 SEPT 1998
Maximum Flow
64
For each performance measure except test times,
the NOC indicates the average value, the minimum
and maximum values, and the time and date when
minimum and maximum values were achieved.
01: Tinsley
↓
13,050.09 bpd
12.111.07 bpd
14,097.45 bpd
EXIT
ALTUS™ Net Oil Computer Manu al
Page 75

continued
Well Test Mode
Table 7-2. Performance measurements for previous well tests
Note
For each performance measu re m ent except test times, the NOC indi cat es th e average value, the minimum and m aximum
values, and the time and date when minimum and maximum values were achieved
Performance measure Def inition
Net oil Net oil, in barrels or cubic meters, at 60°F, 15°C, or 20°C
Water cut Water cut as 0% to 100% at 60°F, 15°C, or 20°C
Gross flow Volume flow of oil and water, in barrels or cubic meters, at 60°F, 15°C, or 20°C
Net water Net water, in barrels or cubic meters, at 60°F, 15°C, or 20°C
Drive gain Sensor drive gain in volts
Density Fluid density, in density unit selected during configuration
Temperature Flui d t em perature, in temperature unit selected during configuration
Back flow Reverse flow rate of all fluid
Mass flow Mass flow rate of all fluid
Uncorrected flow Select any of these performa nce measurements that are not cor r ect ed for temperature:
Te st times View the following times:
• Uncorrected oil
• Uncorrected water
• Uncorrected water cut
• Uncorrected gross
•Test started
• Test time elapsed
• Transient bubble time
Using the Person-Process
Interface
Configuration Using the View Menu Continuous ModeBefore You Begin Installation Considerations
ALTUS™ Net Oil Computer Manu al
65
Page 76

66
ALTUS™ Net Oil Computer Manu al
Page 77

8 Maintenance
Well Test Mode Maintenance
8.1 Alarm messages
Temperature Alarm
Net Oil
Actual Rate
13,110.87 bpd
Average Rate
13,050.09 bpd
Minimum Flow
12.111.07 bpd
Minimum Time/Date
08:23 28 SEPT 1998
HELP ACK
Responding to alarms
Temperature Alarm
Sensor temperature is
outside the range of
calculation accuracy
for the NOC application. This range is
0 to 302 degF or -18
to 150 degC.
The NOC performs self-diagnostics during operation.
If the NOC detects certain events or conditions, an
alarm message appears in the highlight bar at the top
of the screen.
↓
If the alarm condition must be acknowledged, press
ACK to acknowledge the alarm.
Laboratory Density
Determination
To respond to an alarm, press HELP, then follow the
instructio ns on the scre en.
Determination
In-Line Density
• The help screen explains what the alarm means.
• The help screen will tell you what to do. You may
be advised to perform an action, or to contact
someone.
• If the help occupies more than one screen, you
can read all the help screens by pressing PGDN
(page down) or PGUP (page up).
EXIT
ALTUS™ Net Oil Computer Manu al
Sensitivity Analysis Software Diagrams
67
Page 78

Maintenance
continued
NOC alarm messages
The NOC produces alarm messages in the following situations:
• Drive gain indicates transient bubbles in the Coriolis sensor.
• Process temperature or density goes outside the acceptable range
for the application.
• Production measures have been paused for more than 15 minutes in
the continuous operation mode.
Table 8-1
summarizes NOC alarms and lists corrective actions.
Table 8-1. Using NOC alarms
Notes
• To get help troubleshooting an alarm message, press HELP, then follow the instructions
• To acknowledge an alarm message, press ACK
Alarm message Cause
TBR Alarm Transient bubbles in Coriolis sensor • Check for cavitation, flashing, or bubble carry-under
Density Alarm D en si ty has gone below 0.6100 g/cc or
has gone above 1.1400 g/cc
Temperature Alarm Temperature has gone below 0°F
(–18°C) or above 302°F (150°C )
Pause Alarm Production measurements have been
paused for more than 15 minutes in
continuous mode
Action
• Monitor density
• If desired, increase drive gain above which presence of
transient bubbles will be indicated (see page 23)
• If desired, configure NOC to stop the well test if
transient bubbles are detected (see page 23)
• I f desi r ed, configure NOC to hold las t value (see
page 23)
• Check drive gain to see if gas has caused low density
• C heck drive gain to see if sediment has caused high
density
• B ring temperature wit hi n ac ceptable limits
• Temperature is outside the specifie d accuracy range,
but production is still being mea sur ed
• Acknowledge al arm
• Resume accumulation of production measurements
68
Transmitter alarm
messages
The ALTUS transmitter produces several types of alarm messages.
The following types of alarms do not drive outputs to fault levels:
• Slug flow and output saturation alarms
• Totalizer alarms
• Calibration and trim alarms
• Conditional status alarms
The following types of alarms drive outputs to fault levels:
• Critical status fault alarms
• Transmitter failure fault alarms
• Sensor error fault alarms
ALTUS™ Net Oil Computer Manu al
Page 79

Maintenance
continued
Well Test Mode Maintenance
Alarms that do not
generate fault outputs
Slug flow alarms
Conditions such as slug flow (large gas bubbles in a liquid flow stream)
adversely affect sensor performance by causing erratic vibration of the
flow tubes, which in turn causes the transmitter to produce inaccurate
flow signals. If you program slug limits, a slug flow condition causes the
transmitter to produce slug flow alarms.
The "Slug Flow" alarm indicates slug flow has occurred for less than the
amount of time that is configured for the slug time. Outputs indicating the
flow rate remain at the last measured flow rate before the slug flow
condition occurred.
The "Slug Timeout" alarm indicates slug flow has occurred for more than
the amount of time that is configured for the slug time. If the "Slug
Timeout" alarm occurs, outputs indicating the flow rate go to the level
that represents zero flow.
• All outputs other than flow rate outputs continue to indicate the
measured value for the process variable.
• The flowmeter resumes normal operation when density stabilizes
within the programmed slug flow limits.
• Slug time can be up to 300 seconds.
• If slug time is configured for 0.0 seconds, outputs indicating the flow
rate will go to the level that represents zero flow as soon as slug flow
is detected.
Laboratory Density
Determination
Table 8-2
summarizes slug flow alarms and lists corrective actions.
Table 8-2. Using slug flow alarms
Notes
• To get help troubleshooting an alarm message, press HELP, then follow the instructions
• To acknowledge an alarm message, press ACK
Alarm message Cause Action
Slug Flow • G as bubbles are causing density to go
below low slug flow limit
• S oli ds are causing process den sit y to
exceed high slug flow limit
Slug Timeout Slug flow has occ ur re d for more th an
amount of time config ur ed for slug time
• Check process for cavitation, flashi ng, or leaks
• Monitor density
• If desired, enter new slug flow limits (see page 26)
• If desired, incre ase slug time (see page 26)
Determination
Sensitivity Analysis Software Diagrams
In-Line Density
ALTUS™ Net Oil Computer Manu al
69
Page 80

Maintenance
continued
Output saturation alarms
If an output variable exceeds the upper range limit or goes below the
lower range limit, the transmitter produces an output saturation alarm.
The alarm can mean the output variable is outside appropriate limits for
the process, or can mean measurement units need to be changed.
Table 8-3
summarizes output saturation alarms and lists corrective
actions.
Table 8-3. Using output saturation alarms
Notes
• To get help troubleshooting an alarm message, press HELP, then follow the instructions
• To acknowledge an alarm message, press ACK
Alarm message Caus e Action
Freq. Out Saturated Frequency output has exceeded 12,500 Hz • Alter fluid process
mA Out 1 High Sat Milliamp output 1 has exceeded 20.5 mA • Alter fluid process
mA Out 1 Low Sat Milliamp output 1 has gone below 3.8 mA • Alter fluid process
mA Out 2 High Sat Milliamp output 2 has exceeded 20.5 mA • Alter fluid process
mA Out 2 Low Sat Milliamp output 2 has gone below 3.8 mA • Alter fluid process
Drive Overrange • Severely erratic or complete cessation of
flow tube vibration
• Plugged flow tube
• C hange flow unit (see page 40)
• Change frequency and flow values, pulses per unit,
or units per pulse (see pages 40-41)
• I ncr ease value of variable represented by
milliamp output 1 at 20 mA ( see page 39)
• Decrease value of variable represented by
milliamp output 1 at 4 m A (see page 39)
• I ncr ease value of variable represented by
milliamp output 2 at 20 mA ( see page 39)
• Decrease value of variable represented by
milliamp output 2 at 4 m A (see page 39)
• Fill sensor with process fluid
• Bring flow rate within sensor limit
• P ur ge flow tubes
Totalizer alarms
If the totalizers are operating, the transmitter produces totalizer alarms.
Table 8-4
summarizes totalizer alarms and lists corrective actions.
Table 8-4. Using totalizer alarms
Notes
• To get help troubleshooting an alarm message, press HELP, then follow the instructions
• To acknowledge an alarm message, press ACK
Alarm message Cause Action
Inventory 1 Rollover
Inventory 2 Rollover
Inventory 3 Rollover
Totalizer 1 Rollover
Totalizer 2 Rollover
Totalizer 3 Rollover
70
Inventory totalizer has exceeded rollover
value and has rolled over to zero
Process totalizer has exceeded rollover
value and has rolled over to zero
Press ACK to acknowledge alarm
ALTUS™ Net Oil Computer Manu al
Page 81

Maintenance
continued
Well Test Mode Maintenance
Calibration and trim alarms
Calibration and trim alarms indicate the following conditions:
• An output state or value has been set in the diagnostics menu
• Calibration or output trim is in progress
• Calibration was aborted by the operator
• Calibration is complete
Table 8-5
summarizes calibration and trim alarms and lists corrective
actions.
Table 8-5. Using calibration and trim alarms
Notes
• To get help troubleshooting an alarm message, press HELP, then follow the instructions
• To acknowledge an alarm message, press ACK
Alarm message Cause Action
mA Out 1 Fixed Mil lia m p out put 1 trim or simulation in pro gres s Exit diagnostics menu
mA Out 2 Fixed Milliamp output 2 trim or simulation in progress
Freq. Out Fixed Frequency output trim or simulation in progress
Cal In Progress • Sensor zero calibration in progress
• Density calibration in progress
• Temperature calibration in progress
Calibration Complete • Sensor zero calibration complete
• Density calibration complete
• Temperature calibration complete
Calibration Aborted • User aborted sensor zero calibration
• User aborted density calibration
• User aborted temperature calibration
• If "Calibration Complete" replaces "Cal In
Progress", no action
• If "Calibration Failure" replaces "Cal In Progress"
and sensor zero was perform ed, rezero after:
-
Eliminating mechanical noise, if possible
-
Completely shutting off flow
-
Ensuring interi or of sensor junction box is
completely dry
• I f "Calibration Failure" replaces "Cal in Progress"
and density or temperatu re cal ibrat ion was
performed, recali b rat e for density or temperature
Press ACK to acknowledge alarm
• Re-initiate calibration procedure
• Existing calibration values will remain unchanged
Determination
Determination
Laboratory Density
In-Line Density
ALTUS™ Net Oil Computer Manu al
Sensitivity Analysis Software Diagrams
71
Page 82

Maintenance
continued
Conditional status alarms
Conditio nal status a larms occur in the following situations:
• During normal startup
• During normal operation
• After power to the transmitter has been cycled
• After a master reset has been performed
Table 8-6
summarizes conditional status alarms and lists corrective
actions.
Table 8-6. Using conditional status alarms
Notes
• To get help troubleshooting an alarm message, press HELP, then follow the instructions
• To acknowledge an alarm message, press ACK
Alarm message Cause Action
Power Reset • Power failure
• Brownout
• Power cycle
Master Reset • Master reset has been performed
• Software configuration contains default values
EEPROM Initialized • EEPROM has been cleared and software
upgrade has been downloaded
• Software configuration contains default values
PPI Fault Person-Process Interface failed • Adj ust sc reen contrast (see page 47)
EEPROM Corrupt EEPROM has temporarily failed or been corrupted If problem persists, phone Micro Motion
EEPROM Error
Check accuracy of totalizers
• Configure sensor calibration data (see
pages 28-35)
• Do not operate transmi t te r until
configuration has been verified
• If problem persists, phone Micro Motion
Customer Service (see page 78 for phone
numbers)
Customer Service (see page 78 for phone
numbers)
72
ALTUS™ Net Oil Computer Manu al
Page 83

Maintenance
continued
Well Test Mode Maintenance
Fault outputs
Outputs go to fault levels if a fault is detected. The transmitter also
produces fault outputs when you perform configuration, calibration, or
diagnostic tasks. See
Table 8-7
.
The transmitter can be configured to produce downscale, upscale, last
measured value, or internal zero fault outputs. See
Table 8-8
.
• To configure fault outputs, see page 37 and page 40.
• The default configuration for fault outputs is downscale.
Table 8-7. Fault output levels
Software mode Output levels
Configuration Fault level
Diagnostics Fault level
Calibration Active (outputs indicate m eas ur ed values)
Output simulation Active (outputs indicate values at which they are set)
CAUTION
Using last measured value or internal zero may
hamper identification of fault outputs.
To make sure fault outputs can be identified, select
downscale or upscale.
Laboratory Density
Determination
Table 8-8. Configurations for fault outputs
Fault limit Fault value
Downscale • Milliamp outputs can be configured from 1.0 to 3.6 mA;
default is 3.6 mA
• P ulse output goes to 0 Hz
Upscale • Milliamp outputs can be configured from 21.0 to
24.0 mA; default is 22.0 mA
• P ulse output goes to 15,000 H z
Last measured value Outputs hold at mA value or frequency that represents the
last measured value for the process variable before the
fault occurred
Internal zero • Milliamp outputs go to mA value that represents 0.0 for
the process variable
• P ulse output goes to 0 Hz
Determination
Sensitivity Analysis Software Diagrams
In-Line Density
ALTUS™ Net Oil Computer Manu al
73
Page 84

Maintenance
continued
Critical status fault alarms
Critical status fault alarms occur in the same situations in which
conditional status alarms occur (see page 72); however, critical status
fault alarms drive outputs to fault levels.
Table 8-9
summarizes critical fault alarms and lists corrective actions.
Table 8-9. Using critical status fault alarms
Notes
• To get help troubleshooting an alarm message, press HELP, then follow the instructions
• To acknowledge an alarm message, press ACK
Alarm message Cause Action
Warming Up • Transmitter is performing self-test
• O ut puts remain at fault levels until self-test is
complete
Calibration Failure • Sensor zero calibration failed
• Density calibration failed
• Temperature calibration failed
• O ut puts remain at fault levels until calibration
has been successfully completed
Charize Required • Master reset has been performed
• S of tware configuration contains default values
• O ut puts remain at fault levels until transmitter
has been configured
Press ACK to acknowledge alarm
• If sensor zero calibration was performed, rezero after:
-
Eliminating mechanical noise, if possible
-
Completely shutting of f flow
-
Ensuring interior of sensor junction box is
completely dry
• If density or temperatur e cal ibrat i on was performed,
recalibrate for density or temperature
• Configure sensor calibration data (see pages 28-35)
• D o not operate transmitter until conf iguration has
been verified
Transmitter failure fault
alarms
When a software or hardware failure occurs, the transmitter produces
one of the fault alarms listed in
If any of the fault alarm messages listed in
Table 8-10
.
Table 8-10
appears on the
screen, phone one of the Micro Motion Customer Service telephone
numbers listed in
Customer service
, page 78.
CAUTION
Transmitter failure fault alarms are critical, and could
result in measurement error.
The transmitter does not have any parts that are
serviceable by the user. If a trans mitter f a ilure is in dicated,
phone Micro Motion Customer Service (see page 78 for
phone numbers).
Table 8-10. Using transmitter failure fault alarms
Alarm message Caus e Action
Hardware Failure Hardware has failed Phone Micro Motion Customer Service (see
EEPROM Failure EEPROM has failed or been corrupted
page 78 for phone numbers)
74
ALTUS™ Net Oil Computer Manu al
Page 85

Maintenance
CA UTION
continued
Fault alarms requiring troubleshooting
View
Diagnostic monitor
Diagnostic Monitor
Drive Gain
8.401 V
Tube Frequency
100.759 Hz
Live Zero
0.010 lb/min
EXIT
Some fault alarms require troubleshooting to isolate
the problem that caused fault outputs to be produced.
Fault alarms that require troubleshooting include:
• Sensor Failure
• Density Failure
• Temperature Failure
• Temperature Overrange
•RTD Failure
During troubleshooting the flowmeter could
produce inaccurate output signals, resulting in
measurement error.
Set control devices for manual operation before
troubleshooting the flowmeter.
If the transmitter produces fault outputs and any of
the alarm messages listed at the top of this page
appears on the screen, follow these steps to
troubleshoot the problem:
1. Press ACK, repeatedly if necessary, to clear all
the messages.
2. Press VIEW to access the view menu.
3. Select Diagnostic Monitor.
4. Read the voltage for the drive gain:
a. If drive gain exceeds 8.0 volts or is unstable,
Table 8-11
see
.
b. If drive gain is less than 8.0 volts, go to step 5,
page 76.
Determination
Determination
Laboratory Density
In-Line Density
Table 8-11. Troubleshooting excessive drive gain
Symptom Cause Corrective action
Drive gain
exceeds 8.0 V
or is unstable
ALTUS™ Net Oil Computer Manu al
Cavitation, flashing, or bubble carry-under • If possible, increa se inlet pressure and/or back pressure
Plugged flow tube Purge flow tubes
• D rive board failure
• S ensor imbalance
• S ensor failure See step 6, page 77
• I f pu mp is mounted upstre am fr om sensor, increase
distance between pump and sensor
Phone Micro Motion Customer Service (see page 78 for
phone numbers)
Sensitivity Analysis Software DiagramsWell Test Mode Maintenance
75
Page 86

continued
Maintenance
5. Unplug sensor wiring terminal blocks at the transmitter.
Figure 8-1
•
Figure 8-2
•
Figure 8-1. Model 3500 sensor wiring terminals
illustrates Model 3500 sensor wiring terminals.
illustrates Model 3700 sensor wiring terminals.
white
black (d r ains)
Connect outer braid
of shielded or
armored cable here
Model 3500 with I/O cable
(Terminal block attached to DIN rail)
Figure 8-2. Model 3700 sensor wiring terminals
brown
red
orange
yellow
green
blue
violet
gray
yellow
violet
green
blue
brown
Model 3500 with screw-type or solder-tail
wiring connectors
(Middle term i nal block on back panel)
red
brown
yellow
black (d r ains)
violet
orange
green
white
blue
gray
black (drains)
orange
white
gray
red
76
Model 3700 wiring terminals
(Blue terminal block)
ALTUS™ Net Oil Computer Manu al
Page 87

continued
Maintenance
6. Measure ohms of resistance between the three wire pairs and wire
triplet at the sensor junction box.
a. If all measured resistance values are within the ranges listed in
Table 8-12
, the sensor cable is faulty or improperly connected.
Repair or replace the cable, or reconnect it according to the
9-Wire Cable Preparation and Installation Instruction Manual
.
b. If open or short circuits are found, the sensor case or junction box
contains moisture, or the sensor is damaged. See
Table 8-13
Table 8-12. Nominal resistance ranges for flowmeter circuits
Notes
• R esistance values increase 0. 38675 ohms per °C i ncrease in temperature
• Nominal resistance values will vary 40% per 100°C. However, confirming an open coil or shorted coil is more important than
any slight deviation from the resist ance values presented below
• R esistance across blue and gray wires (ri ght pickoff circuit) should be within 1 0 % of res is t ance across green and whi t e w ires
(left pickoff circuit)
• A ct u al res ist ance values depend on the sensor model and date of manufacture
• R eadings across wire pair s should be stable. If they are unstable, see
Table 8-13
Well Test Mode Maintenance
.
Laboratory Density
Determination
Circuit Wire colors
Drive coil Brown to red 1 to 2 8 to 2650
Left pickoff Green to white 5 to 9 15.9 to 300
Right pickoff Blue to gray 6 to 8 15.9 to 300
Lead length compen sat or Orange to yellow 3 to 4 Ap proximat el y 0 t o 1
Temperature sensor Yellow to violet 4 to 7 100 Ω at 0°C + 0.38675 Ω per °C
Sensor junction box
wiring terminals Nominal resi st ance range
Ω
Ω
Ω
Ω
Table 8-13. Troubleshooting sensor error fault alarms
Notes
• To get help troubleshooting an alarm message, press HELP, then follow the instructions
• To acknowledge an alarm message, press ACK
Resistance at sensor
junction box Cause Alarm message Action
All resistance values are within
the ranges listed in
Open or short from green to
white (termi nal 5 to terminal 9)
Open or short from blue to gray
(terminal 6 to te rminal 8)
Open or short from red to
brown (terminal 2 to terminal 1)
Open or short from orange to
yellow (terminal 3 to terminal 4)
Open or short from yellow to
violet (termi nal 4 to terminal 7)
Table 8-12
• Sensor cable is faulty
• Sensor cable is improperly
connected
• M oisture in sensor case or
junction box
• Open or short left pickoff
• M oisture in sensor case or
junction box
• Open or short right pickoff
• M oisture in sensor case or
junction box
• Open or short drive coil
• M oisture in sensor case or
junction box
• Open or short lead length
compensator
• M oisture in sensor case or
junction box
• Open or short RTD
Sensor Failure
Density Fail ure
Temperature Failure
RTD Failure
Temperature Overrange
Sensor Failure
Density Fail ure
Temperature Failure
Temperature Overrange
RTD Failure
Temperature Overrange
• Repair or replace cable
• Reconnect cable according to
9-Wire Cable Preparation
the
and Installation Instruction
Manual
• If sensor case or junction box
contains moisture, check for
leaking junction box, conduit,
or conduit seals
• If sensor case or junction box
does not contain moistur e,
return sensor to Micro Motion
Determination
Sensitivity Analysis Software Diagrams
In-Line Density
ALTUS™ Net Oil Computer Manu al
77
Page 88

Maintenance
continued
Active alarm log
ALARMS
Active Alarm Log
Density Alarm
17-JUL-98 8:30
Temperature Alarm
10-JUL-98 9:04
Alarm-Meas Paused
10-JUL-98 5:10
HELP EXIT
8.2 Customer service
If the condition that caused an alarm is present, the
alarm is listed in the active alarm log.
• Each alarm is time/date stamped.
• The first alarm listed is the most recent.
The active alarm log can be accessed from the
maintenance menu or the view menu.
To access the log from the maintenance menu:
1. At the operation screen, press the security button.
2. Select Maintenance.
3. Select Active Alarm Log.
To access the log from the view menu:
1. At the operation screen, press VIEW.
2. Select Active Alarm Log.
For Customer Service, phone the Micro Motion
Customer Service Department:
• In the U.S.A., phone 1-800-522-6277, 24 hours.
• Outside the U.S.A., phone 303-530-8400,
24 hours.
• In Europe, phone +31 (0) 318 549 443.
• In Asia, phone (65) 770-8155.
8.3 Setting outputs
The software allows you to set the states of discrete
outputs or the values of milliamp outputs or the pulse
output.
CAUTION
While diagnostic tasks are being performed
outputs go to their configured settings, resulting
in measurement error.
Set control devices for manual operation before
accessing the diagnostics menu.
78
ALTUS™ Net Oil Computer Manu al
Page 89

Maintenance
continued
Setting discrete outputs
Maintenance
Diagnostics
Simulate outputs
Discrete outputs
ALARMS
Discrete Outputs
Discrete Output 1
Discrete Output 2
Discrete Output 3
SAVE EXIT
YES
NO
NO
Setting milliamp outputs
Maintenance
Diagnostics
Simulate outputs
Milliamp outputs
ALARMS
Milliamp Outputs
Milliamp Output 1
Milliamp Output 2
12.578
8.994 mA
mA
To set the state of a discrete output:
1. Press the security button on the display face.
2. Select Maintenance.
3. Select Diagnostics.
4. Select Simulate Outputs.
5. Select Discrete Outputs.
6. Select the discrete output to be set.
7. Press CHG.
8. Use the cursor control buttons to toggle the
output on or off.
• YES indicates the output is on.
• NO indicates the output is off.
9. Press SAVE to set the state of the output.
When you return to the operation mode, the states of
the outputs are released and are again controlled by
the application.
To set the value of a milliamp output:
1. Press the security button on the display face.
2. Select Maintenance.
3. Select Diagnostics.
4. Select Simulate Outputs.
5. Select Milliamp Outputs.
6. Select the milliamp output to be set.
7. Press CHG.
8. Use the cursor control buttons to change the
output value.
9. Press SAVE to set the value.
When you exit to the simulate outputs screen, the
output goes to its configured fault setting.
Determination
Determination
Laboratory Density
In-Line Density
SAVE EXIT
ALTUS™ Net Oil Computer Manu al
When you return to the operation mode, the values of
the outputs are released and are again controlled by
the application.
79
Sensitivity Analysis Software DiagramsWell Test Mode Maintenance
Page 90

Maintenance
continued
Setting the frequency output
Maintenance
Diagnostics
Simulate outputs
Frequency output
ALARMS
Frequency Output
Frequency Output
5,258
SAVE EXIT
8.4 Density calibration
Hz
To set the value of the frequency output:
1. Press the security button on the display face.
2. Select Maintenance.
3. Select Diagnostics.
4. Select Simulate Outputs.
5. Select Frequency Output.
6. Press CHG.
7. Use the cursor control buttons to change the
output value.
8. Press SAVE to set the value.
When you exit to the simulate outputs screen, the
output goes to its configured fault setting.
When you return to the operation mode, the value of
the output is released and is again controlled by the
application.
At the factory, Micro Motion calibrates each NOC to
work with a specific sensor. The NOC requires a field
density calibration in the following situations:
• The sensor flow tubes have become permanently
coated.
• The sensor flow tubes have eroded.
Density unit for calibration
If density calibration is necessary, use any of the
following methods to calibrate the NOC:
• Duplicate the factory calibration, as instructed on
page 81.
• Duplicate a previous field calibration, as
instructed on page 82.
• Use two fluids with known densities to perform a
density calibration, as instructed on pages 83-86.
Density calibration requires reading and entering
density values in grams per cubic centimeter.
CAUTION
Selecting configuration will interrupt
measurement and control functions. All outputs
will go to their configured fault settings.
Set control devices for manual operation before
accessing configuration menus.
80
ALTUS™ Net Oil Computer Manu al
Page 91

continued
Maintenance
CHG HELP EXIT
Configuration
Inputs
Coriolis
Density
Density Units
Density Damping
Slug Low Limit
0.000000 g/cc
Slug High Limit
1.000000 g/cc
Config process var
Density
↓
g/cc
1.7 sec
To change the density unit:
1. Press the security button on the display face.
2. Select Configuration.
3. Select Inputs.
4. Select Coriolis.
5. Select Config Process Var.
6. Select Density.
7. At the density menu:
a. Select Density Units.
b. Press CHG.
c. Select g/cc, then press SAVE.
Laboratory Density
Determination
Duplicating the factory calibration
Configuration
Inputs
Coriolis
Sensor cal data
Sensor Cal Data
↓↑
D1
0.000000
D2
1.000000
K1
5000.000
K2
50000.000
CHG HELP EXIT
To duplicate the factory calibration:
1. Press the security button on the display face.
2. Select Configuration.
3. Select Inputs.
4. Select Coriolis.
5. Select Sensor Cal Data.
6. Use the function buttons and the cursor control
buttons to configure density calibration values.
• Density calibration values include D1 and D2
density values, K1 and K2 tube periods, the
flowing density correction factor, and the
density calibration temperature coefficient.
• To configure density calibration values, see
pages 30-34.
• Density calibration values should be entered
from the sensor serial number tag or factory
calibration certificate.
• Tags and certificates vary in appearance,
depending on the sensor model number and
manufacturing date. See pages 30-33.
Determination
Sensitivity Analysis Software DiagramsWell Test Mode Maintenance
In-Line Density
ALTUS™ Net Oil Computer Manu al
81
Page 92

continued
Maintenance
Duplicating a previous calibration
Configuration
Inputs
Coriolis
Sensor Cal Data
D1
D2
K1
K2
CHG HELP EXIT
Sensor cal data
↓↑
0.000000
1.000000
5000.000
50000.000
CAUTION
Selecting configuration will interrupt
measurement and control functions. All outputs
will go to their configured fault settings.
Set control devices for manual operation before
accessing configuration menus.
To dupli cat e a previous calibration, refer to the
density factors that are recorded in the NOC
configuration record (
steps:
1. Press the security button on the display face.
2. Select Configuration.
3. Select Inputs.
4. Select Coriolis.
5. Select Sensor Cal Data.
6. Use the function buttons and the cursor control
buttons to enter D1, D2, K1, K2, FD, and dens
temp coeff values from the worksheet.
Appendix A
), then follow these
82
ALTUS™ Net Oil Computer Manu al
Page 93

Maintenance
continued
Well Test Mode Maintenance
Two-point density
calibration
During 2-point density calibration, you command the transmitter to
measure the sensor tube period when the flow tubes contain a fluid with
a reference low density (usually air) and when the flow tubes contain a
fluid with a reference high density (usually water).
Two-point density calibration is preferably performed under zero flow
conditions. The calibration procedure includes a low-density calibration
and a high-density calibration. If necessary, you can perform only the
high-density calibration.
To prepare for the density calibration:
1. Use produced water to flush the flow line.
2. Remove the sensor from the flow line.
3. Drain the fluid from the sensor.
4. Rinse the sensor tubes with toluene at least twice, then rinse the
tubes with acetone at least twice. Use another oil solvent if toluene or
acetone is not available.
5. Use compressed air to blow the sensor dry until residual acetone or
other solvent has been completely evaporated.
6. If sensor wiring was disconnected at step 2, reconnect the wiring and
cycle power off, then on.
7. Wait approximately 5 minutes for the sensor flow tubes to achieve the
ambient air temperature.
Laboratory Density
Determination
CAUTION
Selecting calibration will interrupt control functions.
All control outputs will go to their configured idle
settings.
Set control devices for manual operation before accessing
calibration me n us.
Determination
Sensitivity Analysis Software Diagrams
In-Line Density
ALTUS™ Net Oil Computer Manu al
83
Page 94

continued
Maintenance
CHG HELP EXIT
Maintenance
Calibration
ALARMS
Low Density
Density D1
0.000000 g/cc
Calibrate Density
Density
Low density
To perform the low-density calibration:
1. Prepare the sensor for density calibration as
instructed on page 83.
2. Fill the sensor with a low-density fluid, such as air.
3. Use any established method to derive an
accurate density, in grams per cubic centimeter,
for the fluid at line conditions. If air is the lowdensity calibration fluid, a value from
Table 8-14
can be used for the density. (Specific gravity x
0.9991 = grams per cubic centimeter.)
4. Press the security button on the display face.
5. Select Maintenance.
6. Select Calibration.
7. Select Density.
8. Select Low Density .
9. At the low density menu:
10.Select Density D1, then press CHG.
11.Enter the line-condition density
cubic centimeter
, then press SAVE.
in grams per
12.Select Calibrate Density, then press CHG.
13.After calibration is complete, an alarm message
appears at the top of the screen. Press ACK to
acknowledge the alarm.
14.Press SAVE to save the calibration.
15.Perform the high-density calibration as instructed
on pages 85-86.
Table 8-14. Density of air in grams per cubic centimeter
Pressure in
millibar (inch es
of mercury)
850 (25.14) .0010 .0010 .0010 .0010 .0010 .0010 .0009 .0009 .0009
900 (26.62) .0011 .0011 .0011 .0010 .0010 .0010 .0010 .0010 .0009
950 (28.10) .0012 .0011 .0011 .0011 .0011 .0011 .0010 .0010 .0010
1000 (29.57) .0 012 .0012 .0012 .0012 .0011 .0011 .0011 .0011 .0011
1050 (31.06) .0 013 .0013 .0012 .0012 .0012 .0012 .0012 .0011 .0011
If the actual atmospheric pressure is not known, use the following equation:
10°C
50°F
15°C
59°F
Air density in g/cc
20°C
68°F
=
Temperature in °C and °F
25°C
77°F
0.0012 1 0.000032
30°C
86°F
–
[]×
35°C
95°F
×()
Elevation in feet
40°C
104°F
45°C
113°F
50°C
122°F
84
ALTUS™ Net Oil Computer Manu al
Page 95

Maintenance
continued
To perform the high-density calibration:
1. Perform the low-density calibration as instructed on page 84.
2. Press EXIT to return to the density menu.
3. Fill the sensor with a high-density fluid, such as tap water or distilled
water.
4. If possible, shut off the flow. Otherwise, pump the fluid through the
sensor at the lowest flow rate allowed by the process. The flow rate
must be less than rate listed in
Table 8-15
, or the calibration will fail.
Table 8-15. Maximum flow rates for high-density calibration
Maximum flow rate
Sensor model lb/m in kg/h
®
ELITE
®
BASIS
Model D D6 0.5 13
Model DH DH6 0.5 13
Model DL DL65 62 1695
Model DT DT65 75 2040
CMF010 1 27
CMF025 20 545
CMF050 62 1700
CMF100 250 6800
CMF200 800 21,775
CMF300 2500 68,040
F025 10 272
F050 31 850
F100 125 3400
F200 400 10,887
D12 1 33
D25 6 170
D40 11 306
D65 75 2040
D100 200 5445
D150 700 19,050
D300 1750 47,625
D600 6250 170,100
DH12 1 33
DH25 6 170
DH38 12 340
DH100 200 5445
DH150 700 19,050
DH300 1750 47,625
DL100 200 5445
DL200 875 23,812
DT100 200 5445
DT150 350 9525
Well Test Mode Maintenance
Determination
Determination
Sensitivity Analysis Software Diagrams
Laboratory Density
In-Line Density
ALTUS™ Net Oil Computer Manu al
85
Page 96

continued
Maintenance
CHG HELP EXIT
Maintenance
Calibration
ALARMS
High Density
Density D2
0.100000 g/cc
Calibrate Density
Density
High density
5. To ensure stable density, make sure the fluid in
the flow tubes remains
completely
free of gas
bubbles during the calibration. Using a rubber
hammer, tap on the sensor case to dislodge any
air bubbles that might be clinging to the flow
tubes.
6. Wait approximately five minutes for the sensor
tubes to achieve the same temperature as the
high-density calibration fluid.
7. Use any established method to derive an
accurate density, in grams per cubic centimeter,
for the fluid at line conditions. If tap water is the
high-density calibration fluid, a value from
Table 8-16
can be used for the density. (Specific
gravity x 0.9991 = grams per cubic centimeter.)
8. Select High Density.
9. At the high density menu:
10.Select Density D2, then press CHG.
11.Enter the line-condition density
cubic centimeter
, then press SAVE.
in grams per
12.Select Calibrate Density, then press CHG.
13.After calibration is complete, an alarm message
appears at the top of the screen. Press ACK to
acknowledge the alarm.
14.Press SAVE to save the calibration.
Table 8-16. Density of water
Temperature
32
33
34
35
36
37
38
39
40
41
42
43
44
45
46
47
48
49
50
51
52
53
54
55
56
57
58
0.0
0.6
1.1
1.7
2.2
2.8
3.3
3.9
4.4
5.0
5.6
6.1
6.7
7.2
7.8
8.3
8.9
9.4
10.0
10.6
11.1
11.7
12.2
12.8
13.3
13.9
14.4
Density
in g/cc
0.9998
0.9998
0.9999
0.9999
0.9999
0.9999
0.9999
1.0000
1.0000
0.9999
0.9999
0.9999
0.9999
0.9999
0.9999
0.9998
0.9998
0.9998
0.9997
0.9996
0.9996
0.9995
0.9995
0.9994
0.9994
0.9992
0.9992
Temperature
59
60
61
62
63
64
65
66
67
68
69
70
71
72
73
74
75
76
77
78
79
80
81
82
83
84
85
86
15.0
15.6
16.1
16.7
17.2
17.8
18.3
18.9
19.4
20.0
20.6
21.1
21.7
22.2
22.8
23.3
23.9
24.4
25.0
25.6
26.1
26.7
27.2
27.8
28.3
28.9
29.4
30.0
Density
in g/cc°F °C °F °C
0.9991
0.9991
0.9989
0.9989
0.9988
0.9987
0.9986
0.9984
0.9983
0.9982
0.9981
0.9980
0.9980
0.9979
0.9977
0.9975
0.9973
0.9972
0.9970
0.9969
0.9968
0.9966
0.9964
0.9963
0.9961
0.9960
0.9958
0.9956
86
ALTUS™ Net Oil Computer Manu al
Page 97

9 Laboratory Determination of
Dry Oil and Produced
Water Densities
9.1 Reasons for using live oil
density
To enable the most accurate possible water cut and net oil
measurements, "live oil" density rather than "dead oil" density should be
programmed into the NOC. "Live oil" refers to the crude oil at line
conditions. Reducing the operating pressure to atmospheric pressure
causes the live oil to lose its solution gas or light-end components and
become a dead oil at a greater density than when it was under pressure.
The difference between the density of live oil and the density of dead oil
can be quite significant, depending on the gas-to-oil (GOR) ratio and the
separator pressure and temperature. If dead oil density is used, water
cut measurements will be too low, and net oil will be too high.
This chapter describes the laboratory method for measuring dry oil and
produced water densities.
• The method involves using a precision density meter to determine
the density of a liquid sample taken from the flow line.
• The method requires correcting measured densities of dry oil and
produced water to 60°F.
To obtain an IBM-compatible software program for computing corrected
crude oil and produced water densities, phone the Micro Motion
Customer Service Department:
• In the U.S.A., phone 1-800-522-6277, 24 hours.
• Outside the U.S.A., phone 303-530-8400, 24 hours.
• In Europe, phone +31 (0) 318 549 443.
• In Asia, phone (65) 770-8155.
Determination
Determination
Laboratory Density
In-Line Density
9.2 Laboratory density
The laboratory method requires the equipment listed in
Table 9-1
measurement
Table 9-1. Laboratory equipment for determining live oil and produced water densities
Equipment Suggested supplier Mo del number
Precision lab density met er (0.0001 g/cc accuracy) Anton Paar DMA48*
Pressure adaptor for density meter (80 psi g or lower)
High-pressure density measuring cell (80 psig or higher) DMA512
Thermostati ng c irculating water bath Neslab RTE-1000
Stainless steel sample cy l in der s ( 500 ml capacity) Whitey 316L-HDF4-50 0
Stainless steel ¼-inch valve SS-33VM4-S4
Stainless steel ¼-inch tubi ng No specific supplier
Nitrogen cylinder equipped with pressure regulator
Pressure gauges
* The standard Anton Paar density meter m easures liquid density at atmospheric pressur e. Wh en fitted with a pressure
adaptor, the meter can operate up to 80 psig. Wh en coupled with an external stainless steel measuri ng cell such as the
Model DMA512, the DM A48 can measure liquid den si t y up to 5500 psig.
ALTUS™ Net Oil Computer Manu al
.
Sensitivity Analysis Software DiagramsWell Test Mode Maintenance
87
Page 98

Laboratory Determination of Dry Oil and Produced Water Densities
continued
Taking a sample from the
flow line
Locate the sample port downstream from the sensor, as shown in
Figure 9-1
probe opening situated near the center of the flow pipe. To ensure a
representative sampling, install a static mixer immediately upstream
from the sample port.
Use one of the following sampling procedures:
Method 1
•
pressure is higher than 80 psig, or where flexible stainless steel
tubing is not available.
Method 2
•
pressure is less than 80 psig, or where flexible stainless steel tubing
is available.
. The sampling port should protrude into the flow line, with the
involves using a water-filled sample cylinder if separator
involves using an empty sample cylinder if separator
Figure 9-1. Sample port for laboratory density measurement
88
ALTUS™ Net Oil Computer Manu al
Page 99

Laboratory Determination of Dry Oil and Produced Water Densities
Method 1
Use a water-filled sample cylinder if separator pressure is higher than 80
psig, or when flexible stainless steel tubing is not available.
1. Fill the clean sample cylinder with produced water, preferably the
water from the well being tested or water with similar salinity.
Pressurizing the sample cylinder is not necessary.
2. Connect the sample cylinder to the sampling port as shown in
Figure 9-2
3. Open V-1, then open V-4 to purge the connecting lines briefly . Close
V-4 and open V-2 to equalize the pressure in the sample cylinder.
4. Slowly open V-3 to draw liquid into the sample cylinder and to
displace the water in the sample cylinder.
5. Close V-3 when a trace of oil appears at the drain port.
6. Wait for a few minutes to allow the free water to settle in the sample
cylinder. The wait time varies, depending on whether the oil and
water are readily separable.
7. Slowly open V-3 to drain the free water from the bottom drain port
and to allow additional liquid sample to flow into the sample cylinder.
Close V -3 when a trace of oil appears at the drain port.
8. Repeat steps 6 and 7 several times until the amount of free water
drained is less than 50 ml. This indicates that a sufficient amount of
oil/water emulsion has been collected in the sample cylinder.
9. Close V-1, V-2, and V-3. Open V-4 to depressurize the sample line.
10. Remove the sample cylinder. Record well I.D., sample pressure, and
sample temperature.
. Close V-1, V-2, V-3, and V-4.
continued
Laboratory Density
Determination
Figure 9-2. Laboratory sampling procedure using water-filled cylinder
Determination
Sensitivity Analysis Software DiagramsWell Test Mode Maintenance
In-Line Density
ALTUS™ Net Oil Computer Manu al
89
Page 100

Laboratory Determination of Dry Oil and Produced Water Densities
Method 2
Use an empty sample cylinder if separator pressure is less than 80 psig,
or where flexible stainless steel tubing is available.
1. Connect an empty sample cylinder to the sampling port as shown in
Figure 9-3(A)
should point upward at about 75 degrees from horizontal.
2. Open V-1, then open V-2.
3. Slowly open V-3 to withdraw liquid sample into the sample cylinder
and purge the air out of the sample cylinder. Close V-3 when a trace
of liquid appears at the outlet port.
4. Secure the sample cylinder to a support base as shown in
Figure 9-3(B)
5. Wait for a few minutes to allow the free water to separate in the
sample cylinder. The wait time varies, depending on whether oil and
water are readily separable.
6. Slowly open V-3 slowly to drain the free water from V -3 and withdraw
oil/water mixture into the sample cylinder. Close V-3 when a trace of
oil appears at the outlet port.
7. Repeat steps 5 and 6 several times until the amount of free water
drained is less than about 50 ml. This indicates that a sufficient
amount of oil/water emulsion has been collected in the sample
cylinder.
8. Close V-1, V-2, and V-3. Open V-4 to depressurize the sample lines.
9. Remove the sample cylinder. Record well I.D ., sample pressure, and
temperature.
, with V-1, V-2, V-3 and V-4 closed. The outlet port
. Outlet V-3 should point downward.
continued
Figure 9-3. Laboratory sampling procedure using empty cylinder
90
ALTUS™ Net Oil Computer Manu al
 Loading...