

Page 1
OPERATOR’S MANUAL
Data Visualization Software
53PW6000
Release 4.0
Micro-PWC™ SYSTEM
PN26004 Rev. 0
Page 2

MicroMod Automation, Inc.
The Company
MicroMod Automation is dedicated to improving customer efficiency by providing the most ost-effective, application-specific process
solutions available. We are a highly responsive, application-focused company with years of expertise in control systems design and
implementation.
We are committed to teamwork, high quality manufacturing, advanced technology and unrivaled service and support.
The quality, accuracy and performance of the Company's products result from over 100 years experience, combined with a continuous
program of innovative design and development to incorporate the latest technology.
Use of Instructions
∆ Warning. An instruction that draws
attention to the risk of injury or death.
❢ Caution. an instruction that draws
attention to the risk of the product,
process, or surroundings.
Although Warning hazards are related to personal injury, and Caution hazards are associated with equipment or property damage, it
must be understood that operation of damaged equipment could, under certain operational conditions, re sult in degraded process
system performance leading to personal injury or death. Therefore, comply fully with all Warning and Caution notices.
Information in this manual is intended only to assist our customers in the efficient operation of our equipmen t. Use of this manual for
any other purpose is specifically prohibited and its contents are not to be reproduced in full or part without prior approval of MicroMod
Automation, Inc.
✎Note. Clarification of an instruction
or additional information.
i Information. Further reference for
more detailed information or
technical details.
Licensing, Trademarks and Copyrights
Micro-DCI and MicroLink are trademarks of MicroMod Automation, Inc.
Microsoft is a registered trademark, and Windows is a trademark of Microsoft Corporation
© 2005 MicroMod Automation, Inc. (September 2005)
Health and Safety
To ensure that our products are safe and without risk to health, the following points must be noted.
The relevant sections of these instructions must be read carefully before proceeding.
1. Warning Labels on containers and packages must be observed.
2. Installation, operation, maintenance and servicing must only be carried out by suitably trained personnel and in
accordance with the information given or injury or death could result.
3. Normal safety procedures must be taken to avoid the possibility of an accident occurring when operating in conditions
of high pressure and/or temperature.
4. Chemicals must be stored away from heat, protected from temperature extremes and powders kept dry. Normal safe
handling procedures must be used.
5. When disposing of chemicals, ensure that no two chemicals are mixed.
Safety advice concerning the use of the equipment described in this manual may be obtained from the Company address on the back
cover, together with servicing and spares information.
All software, including design, appearance, algorithms and
source codes, is copyrighted by MicroMod Automation, Inc.,
and is owned by MicroMod Automation or its suppliers.
Page 3

Micro-PWC OPERATOR’S MANUAL
TABLE OF CONTENTS
1.0 - Introduction..........................................................................1
1.1 Intended Audience.........................................................................................1
1.2 Functional Description ..................................................................................1
1.2.1 User Interface...................................................................................1
1.2.2 Micro-PWC Management Features..................................................2
1.2.3 Hierarchical Displays........................................................................2
1.2.4 Graphic Displays ..............................................................................2
1.2.5 Logging.............................................................................................2
1.2.6 Trends..............................................................................................2
1.2.7 Process Alarms ................................................................................2
1.2.8 Events ..............................................................................................3
1.2.9 Message Review..............................................................................3
1.2.10 Micro-PWC Utilities ........................................................................3
1.2.11 Printer Review ................................................................................3
1.3 Document Conventions.................................................................................3
1.4 Reference Documents...................................................................................4
1.5 Glossary of Terms and Abbreviations............................................................4
2.0 - User Interface.......................................................................7
2.1 Introduction....................................................................................................7
2.2 Micro-PWC Appearance................................................................................7
2.3 Input Devices.................................................................................................7
2.3.1 Pointing Devices...............................................................................7
2.3.2 Keyboard..........................................................................................8
2.4 Micro-PWC Display .....................................................................................10
2.4.1 System Window..............................................................................10
2.4.2 System Window Components ........................................................ 11
2.4.3 Menu Functions..............................................................................11
2.4.3.1 Micro-PWC Parameters...............................................11
2.4.3.2 Security Parameters.....................................................12
2.4.3.3 Network Parameters ....................................................12
2.4.4 Mini-Alarm Window ........................................................................12
2.4.5 Operator Window ...........................................................................14
2.4.5.1 Operator Window Components....................................15
2.4.6 Operator Window Operations.........................................................16
2.4.6.1 Open an Operator Window ..........................................16
2.4.6.2 Page Up/Page Down Operator Window Commands..16
2.4.6.3 Display Back/Display Forward .....................................16
2.4.6.4 Acknowledge................................................................17
2.4.6.5 Close............................................................................17
2.4.6.6 Resize an Operator Window........................................17
Contents i
Page 4

Micro-PWC OPERATOR’S MANUAL
2.4.7 Show Users and Screen Contents.................................................18
2.4.8 Arrange Windows Function............................................................18
2.5 Summary - Window Types, Components, and Operations..........................19
3.0 - Micro-PWC Features.......................................................... 21
3.1 Introduction................................. ... ... .... ... ... ... .... ... .......................................21
3.2 Getting Started...................................................... ... ... .... ... ..........................21
3.2.1 System Default State......................................................................21
3.2.2 Logging In.......................................................................................22
3.2.3 Logging Out....................................................................................23
3.2.4 Show Users Option ........................................................................23
3.2.5 Changing Your Password...............................................................24
3.2.6 Exiting the Micro-PWC System ......................................................25
3.3 System Features ........... ... .... .......................................... ... ... ... ... .... ... ... ... ....25
3.3.1 Security ..........................................................................................26
3.3.2 Message Configuration ..................................................................26
3.3.2.1 Message Text. ... .... ... ... ... .... ... ... ... .... ... ... ... ....................27
3.3.2.2 Message Priority ......................... .... ... ... ... ... .... ... ... ... ....27
3.3.2.3 Message Destination Area...........................................27
3.3.2.4 Send the Operator Message........................................28
3.3.3 Message Routing ...........................................................................28
3.3.3.1 Message Color Definition.............................................28
3.3.3.2 Message Indentation Definition....................................29
3.3.3.3 Message Class: Process Alarm Messages..................29
3.3.3.4 Message Class: System Event Messages...................29
3.3.3.5 Message Class: Operator Messages...........................30
3.3.3.6 Message Class: Operating Errors................................30
3.3.3.7 Message Class: Operator Actions ...............................30
3.3.3.8 Message Filter Parameters..........................................30
3.4 System Status Display............. ... ... ... .... ... ... ... .... ... .......................................31
3.4.1 General Information for All Node Types.........................................32
3.4.1.1 Node Name.................... .... ... ... ... .... ... ... ... ... .... ... ... ... ....32
3.4.1.2 Info Menu.............................................................. ... ....33
3.4.2 Information for Specific Node Types...............................................34
3.4.2.1 Console-Type Notes: Micro-PWC............ ... .... ... ... ... ....34
3.4.2.2 Micro-DCI Communications Node ...............................34
3.4.2.3 The Utilities Menu ........................................................34
3.4.2.4 Printer Queue Control..................................................35
3.4.2.5 Printer Queue Information .................................... .......36
3.4.2.6 Console Group Information..........................................37
ii Contents
4.0 - Hierarchical Process Displays ......................................... 39
4.1 Overview........................ .......................................... ... .................................39
4.2 The Summary Display.................................................................................40
Page 5

Micro-PWC OPERATOR’S MANUAL
4.2.1 Accessing the Summary Display....................................................40
4.2.2 Using the Summary Display...........................................................41
4.3 The Group Display.......................................................................................43
4.3.1 Accessing the Group Display .........................................................43
4.3.2 Group Display.................................................................................43
4.3.2.1 Group Legends ............................................................44
4.3.2.2 Point Tagnames...........................................................44
4.3.2.3 Status Area...................................................................45
4.3.2.4 Process Display Area...................................................45
4.4 Process Control Functions ..........................................................................46
4.4.1 Dynamic Faceplates.......................................................................46
4.5 Control Faceplates ......................................................................................47
4.6 The Point Display ........................................................................................48
4.6.1 Accessing the Point Display...........................................................48
4.6.2 Point Display Appearance..............................................................48
4.6.2.1 Tagname......................................................................49
4.6.2.2 Legend.........................................................................49
4.6.2.3 Status Area...................................................................49
4.6.2.4 Param Pushbutton .......................................................49
4.6.2.5 Info Pushbutton...........................................................50
4.6.2.6 Process Display Area...................................................50
5.0 - Logs ....................................................................................51
5.1 Introduction..................................................................................................51
5.1.1 Accessing Log Print.................... ... ... .... ... ... ... ... .... ... ... ... .... ... ... ... ... .52
5.2 Event Logs...................................................................................................53
5.2.1 Print Event Logs.............................................................................53
5.3 Spreadsheet Logs........................................................................................54
5.3.1 Print Spreadsheet Logs..................................................................54
5.3.2 Clearing the Recovery Log Notify Window.............................. ... ... .54
6.0 - T rend Displays ...................................................................55
6.1 Trend Display Format..................................................................................59
6.1.1 Trend Graph...................................................................................59
6.1.2 Time Base and Size of Display Window.........................................59
6.1.3 Trend Readout Arrow.....................................................................59
6.1.4 Time at Arrow Button and Arrows...................................................60
6.1.5 Trace On/Off Button .......................................................................60
6.1.6 Display Option Button.................... ... .... ... ... ... ... .... ... ... ... .... ... ..........61
6.1.7 Trace Scale Button.........................................................................61
6.1.8 Trace Tag and Atom .......................................................................61
6.1.9 Value at Arrow................................................................................61
6.1.9.1 Value Precision Indicator..............................................61
6.1.10 Database Select Button................................................................62
Contents iii
Page 6

Micro-PWC OPERATOR’S MANUAL
6.1.11 Info Button ....................................................................................62
6.1.12 Compression Button and Arrows..................................................62
6.1.12.1 Trend Compression Speed Factors...........................65
6.1.13 Zoom/Unzoom Button ....... .... ... ... ... .... ... ... ... .... ... ... ... ... .... ... ... ... ....65
6.1.14 Reset Button.................................................................... ... ... ... ....66
6.1.15 Pause/Resume Button ...... .... ... ... ... .... ... ... ... .... ... ... ... ... .... ... ... ... ....66
6.1.16 Segment Button and Arrows ........................................................66
7.0 - Using Graphic Displays .................................................... 69
7.1 Introduction................................. ... ... .... ... ... ... .... ... .......................................69
7.1.1 Accessing Graphic Displays...........................................................70
7.2 Control Through Graphics...........................................................................71
7.3 Display Vectoring........................ ... ... .... ... ... ... .... ... ... ... .... .............................72
7.4 Error Indication........................................... ... .... ... ... ... .................................73
7.5 Alarm Acknowledgment..................................... ... ... ... .... ... ... ... ... .... ... ... ... ....74
7.6 The Zoom Menu Item..................................................................................74
7.6.1 The Pan Operations: Up, Down, Left, Right, Center ......................75
7.6.2 The Zoom Operations: In, Out, Fit, Pick.........................................75
7.6.3 Zoom and Pan Operations in Pop-up Graphic Windows................76
7.6.4 Resizing the Zoomed/Panned Operator Window. ... ... ....... ... ... ... ....76
8.0 - Process Alarms.................................................................. 77
8.1 Introduction................................. ... ... .... ... ... ... .... ... .......................................77
8.2 Mini-Alarm Window Title Bar................................................ ... ... .... ... ... ... ....77
8.2.1 Alarm Indicator...............................................................................77
8.3 Process Alarms in the Mini-Alarm Window..................................................78
8.3.1 Process Alarm Priorities.................................................................78
8.3.2 Audible Alarm Format.....................................................................78
8.3.3 Acknowledging Alarms in the Mini-Alarm Window.........................78
8.3.4 Filtering Alarms in the Mini-Alarm Window.....................................79
8.4 Process Alarm Review ............ ... ... ... .... ... ............................................. ... ....80
8.4.1 Accessing the Alarm Review Display.............................................80
8.4.2 Alarm Review Display Acknowledgment........................................80
8.4.2.1 Display Vectoring from the Alarm Review Display.......81
8.4.3 Filtering Alarms ..............................................................................82
8.4.3.1 Message Class: Process Alarm Messages..................83
8.4.3.2 Message Class: Priority ...............................................83
8.4.3.3 Message Class: Area ..................................................83
8.4.3.4 Clearing and Setting Alarm Review Message Types...84
8.4.4 Sort Alarms in the Alarm Review....................................................84
8.4.5 Freeze Alarm Review Display........................................................84
8.4.6 Search Alarm Review Display........................................................85
8.5 ADP Panel Operation.............................................. ... .... ... ... ... ... .... ... ... ... ....85
8.5.1 The Soft ADP Panel Window .........................................................86
iv Contents
Page 7

Micro-PWC OPERATOR’S MANUAL
9.0 - Events .................................................................................87
9.1 Introduction..................................................................................................87
9.2 System Events in the Mini-Alarm Window............................... ... .... ... ... ... ... .87
9.2.1 Audible Alarm Format for Event Messages....................................87
9.2.2 Acknowledging Event Messages in the Mini-Alarm Window..........87
9.2.3 System Event Format.....................................................................87
9.3 System Event Review.................... ... .... ... ... ... .... ... ... ... ... .... ... ... ... .... .............8 8
9.3.1 Accessing the Event Review Display .............................................88
9.3.2 Event Review Display Acknowledgment ........................................88
9.3.3 Filtering Event Messages...............................................................89
9.3.3.1 Message Class: System Event Messages...................90
9.3.3.2 Clearing and Setting Event Review Message Types...90
9.3.4 Sort Events in the Event Review Display ......................................90
9.3.5 Freeze Event Review Display ........................................................91
9.4 Event Historian............................................................................................92
9.4.1 Accessing the Event Historian........................................................92
9.4.2 Scrolling the Event Historian ..........................................................92
9.4.3 Pause/Resume the Event Historian ...............................................93
9.4.4 Filtering Messages in the Event Historian......................................93
9.4.4.1 Filtering Messages by Time.........................................94
9.4.4.2 Filtering Messages by Class and Type........................95
9.4.5 Print Event Historian File................................................................97
10.0 - Message Review ..............................................................99
10.1 Introduction................................................................................................99
10.2 Messages in the Mini-Alarm Window ........................................... ... ... ... ... .99
10.2.1 Audible Alarm Format for Operator Messages.............................99
10.2.2 Acknowledging Messages in the Mini-Alarm Window..................99
10.2.3 Operator Message Format...........................................................99
10.3 Message Review .....................................................................................100
10.3.1 Accessing the Message Review Display....................................100
10.3.2 Message Review Display Acknowledgment...............................100
10.3.3 Filtering Messages.....................................................................101
10.3.3.1 Message Class: Operator Messages.......................102
10.3.3.2 Message Class: Priority ......... ... ... .... ... ... ... .... ... ... ... ..103
10.3.3.3 Message Class: Area....... ... ... ... ... .... ... ... ... .... ... ... ... ..103
10.3.3.4 Clearing and Setting Message Review
Message Types..................................................103
10.3.4 Sort Messages in the Message Review Display ........................103
10.3.5 Freeze Message Review Display...............................................104
11.0 - Utilities ............................................................................105
11.1 Introduction..............................................................................................105
11.1.1 Notes on QIC Tape Drive Use ....................................................105
Contents v
Page 8

Micro-PWC OPERATOR’S MANUAL
11.1.2 Notes on DAT Tape Drive Use....................................................106
11.2 Backup and Restore................................................................................107
11.2.1 The Backup Utility.............. .... .......................................... ... ... ... ..107
11.2.1.1 Backing Up Information Distributed to
Console Group Members ..................................108
11.2.1.2 Backup Options........................................................109
11.2.1.3 Backing Up User Model Data...................................109
11.2.2 Performing the Backup............................................................... 110
11.2.2.1 Select a Backup Device Type................................... 110
11.2.2.2 Select a Backup ....................................................... 110
11.2.2.3 View the Contents of a Tape .................................... 110
11.2.2.4 Compress the Backed Up Data.................................111
11.2.2.5 Add a Comment about the Backup ...........................111
11.2.2.6 Backup Status...........................................................111
11.2.2.7 Cancel a Backup................................................. ... .. 112
11.2.2.8 Completing the Backup Operation ........................... 112
11.2.3 The Restore Utility...................................................................... 112
11.2.3.1 List Tape Button........................................................114
11.2.3.2 List Disk Button ................... ..................................... 114
11.2.3.3 Restore File Button................................................... 115
11.2.4 ADP Backup and Restore........................................................... 115
11.3 Database Maintenance............................................................................ 116
11.3.1 Historical Manual Entry............................................................... 116
11.3.1.1 Viewing an Historical Database Value...................... 117
11.3.1.2 Changing an Historical Database Value................... 118
11.3.1.3 Adding an Historical Database Value.......................118
11.3.1.4 Deleting an Historical Database Value.....................118
11.3.2 Database Maintenance Windows............................................... 118
11.3.2.1 Archival Database Maintenance...............................119
11.3.2.2 Archival Block Database Maintenance.....................121
11.4 Archival Utilities .......................................................................................122
11.4.1 Archive Historical Data ...............................................................122
11.4.2 Archive Historical Block Data......................................................124
11.4.3 Restore Archival Data.................................................................125
11.4.3.1 Restore Operation Window.................................... ..125
11.4.4 Restore Archival Block Data.......................................................126
11.4.5 List Archival Block Data..............................................................127
11.5 Alarm Groups...........................................................................................128
11.6 CRT Print.................................................................................................128
11.6.1 Selecting the Image Type...........................................................128
11.6.2 Invert Image................................................................................128
11.6.3 Stretch, Auto Fit and Scale Options............................................128
11.6.4 Printing the Image ......................................................................129
vi Contents
Page 9

Micro-PWC OPERATOR’S MANUAL
11.7 Other Applications ...................................................................................129
11.8 Release All Configuration Locks.. ... .... ... ... .......................................... ... ..130
11.9 System Help ............................................................................................131
11.10 User Help................... ... ... .... ... .......................................... ... ... ...............131
11.10.1 Edit User Help Information .......................................................131
11.10.2 Clear User Help Information.....................................................132
11.10.3 Import User Help Information ...................................................132
11.10.3.1 The File Filter Text Entry Box and List Boxes.........132
11.10.3.2 The Directories List Box .........................................133
11.10.3.3 The Selected File Text Entry Box...........................133
11.10.3.4 The Filter Button................................ ... ... .... ...........133
11.11 Quick Keys.............................................................................................134
11.11.1 Accessing the Quick Keys Feature...........................................134
11.11.2 Configuring Quick Keys ............................................................135
11.11.2.1 Configuring Quick Keys 33 through 64.............. ... ..136
11.11.2.2 Clearing Quick Key Assignments ...........................136
11.11.2.3 Exiting Quick Keys...... .... ... ... ... ... .... ... ... ... .... ...........136
11.11.3 Summary - Quick Keys........................................ ... ... .... ... ... ... ..137
11.12 CRT Context Keys.................................................. ... .... ... ... ... .... ... ... .....138
11.12.1 Preparing the Context...............................................................138
11.12.2 Initial Display Layout - Login Context Key................................138
11.12.3 Accessing CRT Context Keys...................................................138
11.12.4 Configuring CRT Context Keys.................................................139
11.12.5 Clearing CRT Context Keys......................................................139
11.12.6 Exiting CRT Context Keys........................................................139
11.12.7 Summary - CRT Context Keys .................................................140
11.13 Console Group Synchronization............................................................141
11.13.1 Console Group Synchronization Overview...............................141
11.13.2 Selecting a Console Node to Synchronize With.......................143
11.13.3 Selecting Configuration Data for Synchronization....................145
11.13.3.1 String File Considerations......................................147
11.13.3.2 Substituting Node Names During Synchronization 147
11.13.3.3 Replacing Node Name Prefixes Unconditionally....147
11.13.3.4 Replacing Multiple Node Name Prefixes................148
11.13.4 Performing the Synchronization ...............................................149
11.14 Time Adjustment.................. ... ... ... .... ... ... ... .... ... ... ... ... .... ........................150
11.14.1 Using the Time Adjustment Utility.............................................150
11.14.2 Adjusting the Time More than 5 Minutes..................................151
12.0 - Printer Review................................................................153
12.1 Introduction..............................................................................................153
12.1.1 Accessing the Printer Review Display........................................153
12.2 Using Printer Review...............................................................................155
Contents vii
Page 10

Micro-PWC OPERATOR’S MANUAL
12.2.1 Scrolling the Printer Review Display ..........................................155
12.2.2 Pause/Resume the Printer Review Display................................155
12.2.3 T ime Selection............................... .......................................... ..156
12.2.4 Printing Messages......................................................................156
List of Figures
Figure 2-1. Micro-PWC System Default Window ..............................................10
Figure 2-2. System Window ................................................ ... ... ... ... .... ............. 11
Figure 2-3. Micro-DCI Logo Pushbutton ...........................................................11
Figure 2-4. Mini-Alarm Window .............................. ... ... ... .... ... ... ... ... .... ... ... ... ....13
Figure 2-5. Show Users Window .. ... ... ... .......................................... .... ... ... ... ....18
Figure 3-1. User Login Window ................................................................. ... ....22
Figure 3-2. Change Password Window ............................................................24
Figure 3-3. Message Configuration Window ....................................................27
Figure 3-4. Area Selection Window ..................................................................27
Figure 3-5. System Status Display ...................................................................31
Figure 3-6. SSD Object for a Micro-PWC .........................................................31
Figure 3-7. SSD Object for a Micro-PWC Client ...............................................32
Figure 3-8. Network Info Window Example ......................................................33
Figure 3-9. Services Window Example ......................... ... .... ... ... ... ... .... ... ... ... ....34
Figure 3-10. Device Status Window .................................................................35
Figure 3-11. Printer Queue Control Window .....................................................36
Figure 3-12. Console Groups Display ..............................................................38
Figure 4-1. Operator Window Select Menu ...................................................... 39
Figure 4-2. Summary Index Entry Window ...................................... ................. 40
Figure 4-3. Select Summary Window ...............................................................40
Figure 4-4. Summary Display Example . .... ... ... ... .... ... ... ... .... ... ... ... ... .... ... ... ... ....41
Figure 4-5. Group Information Window ............................................................42
Figure 4-6. Group Selection Window ................................................................43
Figure 4-7. Group Display Configured for Four Points .....................................44
Figure 4-8. Tagname and Point Status Areas from a 6 Point Group Display ....45
Figure 4-9. Value Entry Window ............................................................. ... ... ....46
Figure 4-10. Enter Tagname Pop-up Window .................................................. 48
Figure 4-11. ANI Module Point Display .............................................................49
Figure 5-1. Log Print Window ....... ... ... ... .... ... ... ... .... ... ... ... .... ... ... ... ... .... .............52
Figure 5-2. Print Log Window (Event Logs) ......................................................53
Figure 5-3. Print Log Window (Spreadsheet Logs) ...........................................54
Figure 6-1. Selecting the Trend Option .............................................................56
Figure 6-2. Trend Index Entry Window ................................... ... ... ... .... ... ... ... ....56
Figure 6-3. Select Trend Window .....................................................................57
viii Contents
Page 11

Micro-PWC OPERATOR’S MANUAL
Figure 6-4. Trend Display Example ..................................................................58
Figure 6-5. Time Entry Window ........................................................................60
Figure 6-6. Compression Value Entry Window ................................................. 63
Figure 6-7. Original Waveform ..........................................................................64
Figure 6-8. Compressed Waveform - 6:1 Compression ...................................64
Figure 6-9. Compressed Waveform - 7:1 Compression ...................................64
Figure 6-10. Compressed Waveform - 5:1 Compression ................................. 64
Figure 6-11. Segment Number Entry Window ..................................................67
Figure 7-1. Typical Graphic Display ..................................................................69
Figure 7-2. Select Graphic Pop-up Window .....................................................70
Figure 7-3. Graphic Display with Control Pushbutton Labelled “M” ..................71
Figure 7-4. Control Window .......................... ... ... .... ... ... ... ... .... ... ... ... .... ... ..........71
Figure 7-5. Display Vector Pushbuttons ....................................................... ... .72
Figure 7-6. Error Indicator ..... ... .... ... ... ... .... ... ... ... .... ... ... ... ... .... ... ... ....................73
Figure 7-7. Zoom/Pan Window ..................... ... ... .... ... ... ... ... .... ... ... ... .... ... ... .......74
Figure 8-1. Alarm Review Window ...................................................................80
Figure 8-2. Number Entry Keypad ....................................................................81
Figure 8-3. Alarm Review Filter Window ..........................................................82
Figure 8-4. Alarm Review Sort Window ............................................................84
Figure 8-5. Display Frozen Window ................................................ .... ... ... ... ... .85
Figure 8-6. ADP Button Face ...........................................................................85
Figure 8-7. ADP Panel .................. ... ... ... .... ... ... ... .... ... .......................................86
Figure 9-1. Event Review Window ...................................................................88
Figure 9-2. Event Review Filter Window ..........................................................89
Figure 9-3. Event Review Sort Window ............................................................90
Figure 9-4. Event Historian Display ..................................................................92
Figure 9-5. Event Historian Filter Window ........................................................94
Figure 9-6. Time Selection Window ..................................................................94
Figure 9-7. Print Event Log Window ............................. ... ... .... ... ... ... .... ... ... ... ... .97
Figure 9-8. Printer Selection Window ...............................................................98
Figure 10-1. Message Review Window ..........................................................100
Figure 10-2. Number Entry Keypad ................................................................101
Figure 10-3. Message Review Filter Window ................................................. 102
Figure 10-4. Message Review Sort Window ..................................................104
Figure 11-1. Backup Window ..........................................................................107
Figure 11-2. Backup File Selection Window ...................................................108
Figure 11-3. Find Window ...............................................................................108
Figure 11-4. Configuration Data from Backup/Restore .............................. ..... 109
Figure 11-5. Backup Operation Window .........................................................110
Figure 11-6. List Tape Window ....................................................................... 111
Figure 11-7. Backup Status Window ............................................................... 111
Figure 11 -8. Restore Operation Window ........................................................ 112
Figure 11-9. File Restore Confirmation Box .................................................... 113
Contents ix
Page 12

Micro-PWC OPERATOR’S MANUAL
Figure 11-10. Restore Window ............................... ... ... ... .... ... ... ... ... .... ... ... ... .. 113
Figure 11-11. Restore File Selection Window .................................................114
Figure 11-12. Disk File Selection Window ...................................................... 114
Figure 11-13. Manual Data Entry Window ......................................................116
Figure 11-14. Historical Tags Window .................... ... ... .................................. 117
Figure 11 -15. Archival Database Maintenance Window ................................. 119
Figure 11-16. Historical Database Archive Window ........................................122
Figure 11-17. Database Archive Parameters Window ............... ... ... .... ... ... ... ..123
Figure 11-18. Backup Operation Window .......................................................123
Figure 11-19. Historical Block Archive Window .............................................. 124
Figure 11-20. Historical Block Archive Child Window .....................................124
Figure 11-21. Archival Database Restore Window .......................... ............... 125
Figure 11-22. Restore Operation Window ......................................................125
Figure 11-23. Archive Restore Confirmation Window .....................................126
Figure 11-24. Archival Block Database Restore Window ...............................126
Figure 11-25. Block List Window ....................................................................127
Figure 11-26. CRT Print Setup Window ..........................................................128
Figure 11-27. Configuration in Progress Warning Window .............................130
Figure 11-28. Configuration Lock Information Window ...................................130
Figure 11-29. Help Button ................... ............................................................131
Figure 11-30. Display Information Window ...................... ............................... 131
Figure 11-31. Import File Window ...................................................................132
Figure 11-32. Default Quick Keys Keypad Display .................................... ..... 134
Figure 11-33. Quick Key Label Assignment Window ........... ... ... ... ... .... ... ... ... ..135
Figure 11-34. Quick Key Pop-Up with Text String Assignments .....................135
Figure 11-35. Quick Key Window ...................................................................136
Figure 11-36. CRT Context Keys Keypad .......................................................138
Figure 11-37. CRT Context Key Assignment Window ....................................139
Figure 11-38. Console Groups Display Window .............................................142
Figure 11 -39. Console Group Synchronization Window .................................143
Figure 1 1-40. Console Node Selection Window ............................................. 144
Figure 11-41. Console Group Synchronization Selection Window .................144
Figure 11-42. onfiguration Item Selection Window .........................................145
Figure 11-43. Find Window .................... .... ... ... .......................................... ... ..146
Figure 11-44. System Configuration Data Window .........................................146
Figure 11-45. Time Adjustment Window .........................................................150
Figure 12-1. Printer Selection Window ...........................................................153
Figure 12-2. Printer Review Display Example ................................................ 154
Figure 12-3. Time Selection Window ..............................................................156
Figure 12-5. Device Reprint Banner Example ................................................ 157
Figure 12-4. Select Time Window ...................................................................157
x Contents
Page 13

Micro-PWC OPERATOR’S MANUAL
List of Tables
Table 1-1. Reference Documents ....................................................................... 4
Table 1-2. Glossary........................ ... ... ... .... ... ... ... .......................................... ... .. 4
Table 2-1. Function Key Operation..................................................................... 8
Table 3-1. Access Levels.................................................................................. 26
Table 4-1. Group Status Conditions.................................................................. 41
Table 4-2. Recommended Point and Format Combinations............................. 46
Table 9-1. Event Historian Time Entries ........................................................... 95
Table 12-1. Time Entry.................................................................................... 156
Contents xi
Page 14

Micro-PWC OPERATOR’S MANUAL
xii Contents
Page 15

Micro-PWC OPERATOR’S MANUAL
1.0 Introduction
The Micro-PWC is an operator’s console for use with Micro-DCI instruments. This manual describes the
operations required to use a configured Micro-PWC. It is designed to accomplish the following objectives:
• provide instructions on how to perform operational tasks on the Micro-PWC
• provide suggestions and examples for op er a tor ac tiv itie s
• provide additional information as necessary
1.1 Intended Audience
This manual is intended for use by personnel engaged in operating Micro-DCI equipment.
1.2 Functional Description
Micro-DCI provides the capability to divide process functions among many system components to provide
operating flexibility , system reliability, reduced system costs and ease of implementation. Distribution combined with redundancy also allows system control and operating functions to be divided among system
elements to increase reliability and flexibility, and to reduce risk.
Micro-PWCs can be organized into console groups with a maximum of 10 console-type server nodes in
each group. Many types of data and configuration information are distributed automatically to all server
nodes in the same console group.
Automation of most processes requires more than control at the unit operations level. The system must
also include an inherent ability to provide process management functions such as graphical presentation of
plant process conditions as well as reporting functions. The Micro-PWC and Micro-DCI process control
instruments form the basic building bl ocks of the Micr o-DCI Distributed Control System. Th e Micro-PWC is
the human/machine interface to this system, providing the Process Operator, Process Engineer, Instrument Engineer and Maintenance personnel with global access to all process and system parameters
required by each to perform their respective tasks.
The 53PW6000 (Micro-PWC) on a Pentium-based Personal Computer hardware platform provides the
user interface in a Windows NT environment. Using interactive process graphics and hierarchical displays, the Process Operator can monitor and control all analog loop s and discrete devices interfaced to the
network, as well as sequential batch operations.
The Micro-PWC provides the Engineer with an interface through which to configure and change Graphic
and Hierarchical Displays, database I/O, Micro-DCI process contr ol functions and sequences, Log (repor t)
formats, and security features (including access levels for opera ting personnel). Most cha nges are immediate, on-line and distributed to all Micro- PWCs within the same co nsole group, requiring no com pilation time
before downloading and therefore no interruption of the process.
The Micro-PWC provides Maintenance Personnel with the capability to globally monitor the operating status of any system component on the network, and to diagnose component failures.
1.2.1 User Interface
The Micro-PWC provides the Process Operator, Engineer, and Maintenance Technician with a windowbased interface to both the process and the Micro-PWC itself. The user interface is described in detail in
Section 2.
Introduction 1
Page 16

Micro-PWC OPERATOR’S MANUAL
1.2.2 Micro-PWC Management Features
The Micro-PWC contains many items which aid in managing use of the system. These include:
• User Logins
• Security Features
• Messages
• Message Routing
• System Status Display
These items are described in Section 3.
1.2.3 Hierarchical Displays
Hierarchical displays are a set of pre-configured, console group-wide, graphical representations emulating
traditional instrument displays. A three-tiered hierarchy of displays exists to provide the user with inform ation about the process. This hierarchy consists of Summary, Group, and Point displays, which are available
on all console nodes in the same console group.
A summary display provides an overview of 24 groups, arranged in six rows of four blocks. There are
1,000 summary displays available.
A group display provides an operation overview of four, six, or eight points simult aneously. All process control actions and alarm acknowledgment for po ints within a group can be performed from the group display
on a point-by-point basis.
A point display provides the most detailed information and operation functions about a single point in the
hierarchical display system. From this level the operator can perform regulatory changes. Hierarchical displays are described in Section 4.
1.2.4 Graphic Displays
Up to 10,000 group wide graphic displays can be configured on the Micro-PWC. A graphic display configured on any Micro-PWC is distributed (when saved or installed) to all Micro-PWCs on the same network.
The operator may control a process by using control pushbuttons located on graphic displays. The display
vector pushbutton allows the user to move quickly and easily to other graphics or displays of other types.
Graphic displays, control through graphics, and display vectoring are discussed in Section 7.
1.2.5 Logging
Logs are used to collect and format data for use in repo rts and spreadsheet calculations. The two types of
logs available on the Micro-PWC include event lo gs and spreadsheet logs. Logs are available group wide.
Logs are covered in Section 5.
1.2.6 Trends
Trend traces display the values of one to eight points in an analog trend format similar to tha t presented b y
a conventional strip chart recorder. Three types of trend recording are provided on the Micro-PWC, including current trending, historical trending and archival trending. Trend displays are available group wide.
Trends are covered in Section 6.
1.2.7 Process Alarms
A process alarm is generated when a pro cess variable is in a n abnormal condition . Process alarms are displayed in the top two lines of the Mini-Alarm Window, in the Alarm Review display, and are accompanied
2 Introduction
Page 17

Micro-PWC OPERATOR’S MANUAL
by audible alarms. The optional annunciator display panel (ADP) and the other process alarms are covered in Section 8.
1.2.8 Events
System events occur when a problem or change-of-state is detected with the control system, as opposed
to abnormal conditions, problems, or changes-of-state associated with the process which is being monitored. System event messages are displayed in the third lin e of the Mini-Alar m Window, the Event Review
display, and the Event Historian. System events are covered in Section 9.
1.2.9 Message Review
Operator messages are used to provide the operator with information and instructions for performing
actions, and can be generated from any Micro-PWC. Operator messages are displayed in the fou rth line of
the Mini-Alarm Window and in the Message Review display, and ca n be accomp anied by an aud ible alarm.
Message review is covered in Section 10.
1.2.10 Micro-PWC Utilities
A number of useful maintenance and information management functions are provided as Micro-PWC utilities. Utilities covered in this manual include:
•CRT Print
• Release All Configuration Locks
• System Help
• User Help
• Quick Keys
• CRT Context Keys
These utilities are covered in Section 11.
1.2.11 Printer Review
Messages which have been sent to a printer or to a file ca n be d i splayed using th e Printer Review display.
Printer review is covered in Section 12.
1.3 Document Conventions
This document uses standard text conventions to represent keys, display items and user data inputs:
Display item Any item displayed on a screen appears as italic text. Example: Running
User data input
Bold Identifies any part of a command line that is not optional or variable and
must be entered exactly as shown.
Italic Identifies a variable parameter entered in a command line.
[ ] Brackets indicate an optional parameter; text within the bracke ts follows the
previously described conventions. For example:
CUP [port] [baud] [file_name.CSP]
Introduction 3
Page 18

Micro-PWC OPERATOR’S MANUAL
Special Keys Identifies a specific key that is not alphabetic, numeric or punctuation.
Examples:
Press ENTER.
Press ESC V M. (Press and release each key in sequence.)
Press CTRL-ALT-SHIFT-DEL. (Press all keys in sequence without releasing any one key
until you have pressed them all.)
File name Indicates a file or directory name. Example:
file1.exe
c:\new
Revision variable A ? indicates a value that may change depending on the version of an item.
Example:
Part number: 1234567?0
Part number: 1234567??
1.4 Reference Documents
This manual provides information only for the operation of the Micro-PWC. Table 1-1 lists additional documents that relate to the operation of the available control systems.
Table 1-1. Reference Documents
System Number Document Title
General PN26005 Micro-PWC Configuration
PN26001 Micro-PWC Introduction an d In stallation
1.5 Glossary of Terms and Abbreviations
This glossary provides definition for terms used in the Micro-PWC Operator’s Manual. Where alternate
usage is defined in the glossary, the first listed term is considered the preferred usage.
Table 1-2. Glossary
Term Definition
Atom A single data element in the global database. Atoms can exist in various
forms, including (but not limited to) a single bit (e.g., Auto/Manual), a
floating point number , a t agname or a multi-chara cter legend; there is no
predefined limit to the size of an atom.
4 Introduction
Mini-Alarm
Window
The Mini-Alarm Window is located to the right of the System Window on
the Micro-PWC screen. It automatically appears upon system startup
and is visible at all times. The Mini-Alarm Window provides a title bar, an
alarm display area, an event display area, Alarm Acknowle dge buttons
to acknowledge alarms and events, a Filter button, and a More Alarms
indicator.
Page 19

Micro-PWC OPERATOR’S MANUAL
Table 1-2. Glossary (Continued)
Term Definition
Node A point of interconnection to a network. On the process control network
operator and process control stations connections are considered
nodes, and on the Ethernet all Micro-PWCs and servers are nodes.
Operator
Window
Process Area A functional partition of the process. A tag is assigned to and often
Quick Key A menu option available from the Micro-PWC Operator Window menu
Software
license
System Window
Located on the Micro-PWC screen below the System Window and MiniAlarm Window, the Oper ator Window provides the operator interface to
the process, and displays program outpu t fro m Ope ra to r Win dow
applications such as Hierarchical Displays, Trends, Graphics, Alarm
Review, etc. The Operator Window is composed of a title bar , a menu
bar, and a display area. Up to four Operator Windows may be present
simultaneously on a Micro-PWC.
located in a particular process area. Micro-PWC functions can be
assigned by area.
bar, which, when selected, provides the user with the ability to vector
directly to one of 64 possible displays.
A software license conveys to the purchaser the right to use a defined
software product. Local software products are licensed for a specific
platform, while global application product s are licensed for network-wide
usage. Software licenses are enforced with PICs and with a software
licensing manager program.
A small window located at the top left corner of the Micro- PWC screen. It
appears automatically upon system startup and is visible at all times.
The System Window provides a date/time indicator and a Menu button
for access to other system features and utilities.
Introduction 5
Page 20

Micro-PWC OPERATOR’S MANUAL
6 Introduction
Page 21

Micro-PWC OPERATOR’S MANUAL
2.0 User Interface
2.1 Introduction
The Micro-PWC user interface provides:
• Window management
• One System Window
• One Mini-Alarm Window
• Up to four Operator Windows
The function and use of these user interface elements are explained in this section.
2.2 Micro-PWC Appearance
Visually, the graphical user interface is presented in a window based format. Multiple windows can be
opened simultaneously, allowing the user to view up to four different process displays at once.
The window format provides a three-dimensional (3D) appearance to such screen objects as buttons,
scroll bars and window frames. A pointing device, such as a mouse or track ball (refer to Section 2.3,
Input Devices), is used to select objects on the screen.
2.3 Input Devices
Operation of Micro-PWC functions is most conveniently accomplished by the use of a pointing device,
such as a mouse or track ball. Although it is possible to access all displays and all menu bar choices via
the keyboard, a pointing device is required to access the object-oriented graphical functions such as pushbuttons, toggle buttons, radio buttons and so on. (Section 2. 4, Micro -PWC Disp lay provides a detailed discussion of these items.)
✎ NOTE While it is possible to perform all process operation functions at the
PC using only a pointing device, a keyboard is required for some
configuration activities.
2.3.1 Pointing Devices
The pointer cursor (also known as the mouse cursor) is a small, mobile image on the screen, which is controlled by a pointing device such as a mouse or track ball. In this manual, the term pointer refers to the
pointer cursor, while the term mouse refers to the pointing device.
User Interface 7
Page 22

Micro-PWC OPERATOR’S MANUAL
2.3.2 Keyboard
The IBM A T comp atible 101-ke y keyboard provides the function keys (F1 through F12) and ALT-function key
combinations. They are used to perform the functions listed in Table 2-1 Where an A
nation is specified, press and hold A
LT simultaneously with the specified function key.
Table 2-1. Function Key Operation
Key Function
F1 Graphic
ALT-F1 Network status display
F2 Summary
F3 Group
F4 Point display
F5 Quick keys
F6 Trend
LT-function key combi-
F7 Alarm review
ALT-F7 Print log
F8 Event review
ALT-F8 Arrange windows
F9 Display forward
ALT-F9 Alarm ack
F10 Display backward
ALT-F10 Window acknowledge
F11 Not used
ALT-F11 Silence
F12 Help
F1 G
RAPHIC Displays the graphic selection box. Enter the number of the graphic (one to
10,000), then click OK (or press R
ETURN) to display a specific graphic. To view
an index list of all graphics which have been defined, click List located at the
bottom of the graphic selection box.
F2 S
UMMARY Displays the summary selection box. Enter the number of the summary (one
to 1,000) to be displayed, then click OK. To view an index list of all summaries
which have been defined, click List located at the bottom of the summary
selection box.
After viewing a point or group display called up via the hierarchy (i.e., the user
first called up a summary, then a group from that summary, then a point from
that group), recall the last summary displayed by pressing F2. This is the only
instance in which the system will automatically vector to the last summary
display shown.
8 User Interface
Page 23

Micro-PWC OPERATOR’S MANUAL
F3 G
ROUP Displays the group selection box. Enter the summary number (one to 1,000)
and group number (one to 24) for the group to be displayed (separated by a
period [.]), then click OK. To view an index list of all groups which have been
defined, click List located at the bottom of the group selection box.
After viewing a point display called up via the hierarchy (i.e., first a group was
called up, then a point from that group), the last group displayed can be
recalled by pressing F3. This is the only instance in which the system will
automatically vector to the last group display shown.
F4 P
OINT Displays the point box. Enter the tagname of the point to be displayed (up to
16 alphanumeric characters), then click OK.
F5 Q
UICK Calls up the Quick Key keypad for the Operator Window which has keyboard
focus.
F6 T
REND Calls up the trend selection box. Enter the number of the trend (one to 512) to
be displayed, then click OK. To view an index list of all trends which have been
defined, click List located at the bottom of the trend selection box.
F7 A
LARM REVIEW Shows the Alarm Review display, a list of all active process alarms captur ed
on the system. The order in which process alarms are listed on the Alarm
Review display is the same as that used in the Mini-Alarm Window. The configurer can elect to display either the newest or oldest high priority alarm, and
this can depend on whether or not unacknowledged alarms exist.
If more than one page of process alarms exists, use the scroll bar or P
and P
AGE DOWN to view the additional alarms.
AGE UP
F8 E
VENT REVIEW Shows the Event Review display, a list of all active process alarms and system
events captured on the system.
If more than one page of system alarms exists, use the scroll bar or P
and P
AGE DOWN to view the additional alarms.
F9 D
ISPLAY
F
ORWARD
Use F9 and F10 to move forward and backward between the last 10 displays
which have appeared in the window with keyboard focus, regardless of display type. These keys correspond to the Display Forward and Display Back
functions available from the window option on the menu bar of each Operator
Window.
Changing displays by any means other than Display Forward and Display
Back will affect the list which keeps track of the last 10 displays viewed. For
example, if the user is on display n (where n is greater than one and less than
10) and selects another display by any means other than Dis pla y Fo rward or
Display Back, then displays n+1 through 10 will be discarded, and the new
display will be placed at the end of the list (i.e., it becomes display n +1).
✎ NOTE Use F9 display forward and F10 display back function keys to move
through displays of different types, which h ave already appeared on
the screen; these keys should not be confused with P
P
AGE DOWN, which are used to move through different pages of one
AGE UP and
display type.
ISPLAY BACK See Display Forward.
F10 D
AGE UP
F12 H
ELP Calls up context sensitive help displays.
User Interface 9
Page 24

Micro-PWC OPERATOR’S MANUAL
A
LT-F7 PRINT LOG Displays the log print window. This window provides access to lists of
summary logs, event logs and spreadsheet logs, and also provides access to
the printing mechanism for the logs which appear in these lists.
A
LT-F8 ARRANGE
W
INDOWS
A
LT-F9 ALARM ACK Acknowledges the alarm in the top line of the Mini-Alarm Win dow and silences
Returns all windows to their original size and location, and moves the pointer
to the upper left hand corner of the screen.
the audible alarm.
A
LT-F10 WINDOW
A
CK
Acknowledges all alarms associated with the page on display. This button is
functional only on Point and Group displays, Alarm and Event Review
displays, and on Graphic displays. Use of this button is equivalent to clicking
the Acknowledge item on the menu bar of an Operator Window.
A
LT-F11 SILENCE Silences the audible alarm. Does not perform alarm acknowledgment.
2.4 Micro-PWC Display
The Micro-PWC provides a window-based user interface to the process. Windows contain displays which
can be accessed by the user via the input devices available on the system. The standard input devices are
the keyboard and the mouse.
Three key types of windows which appear on the Micro-PWC are the System, Mini-Alarm, and Operator
Windows. One System Window, one Mini-alarm Window, and up to four Oper ator Windo ws can a ppear on
the display. Each of these window types has a different purpose and appearance.
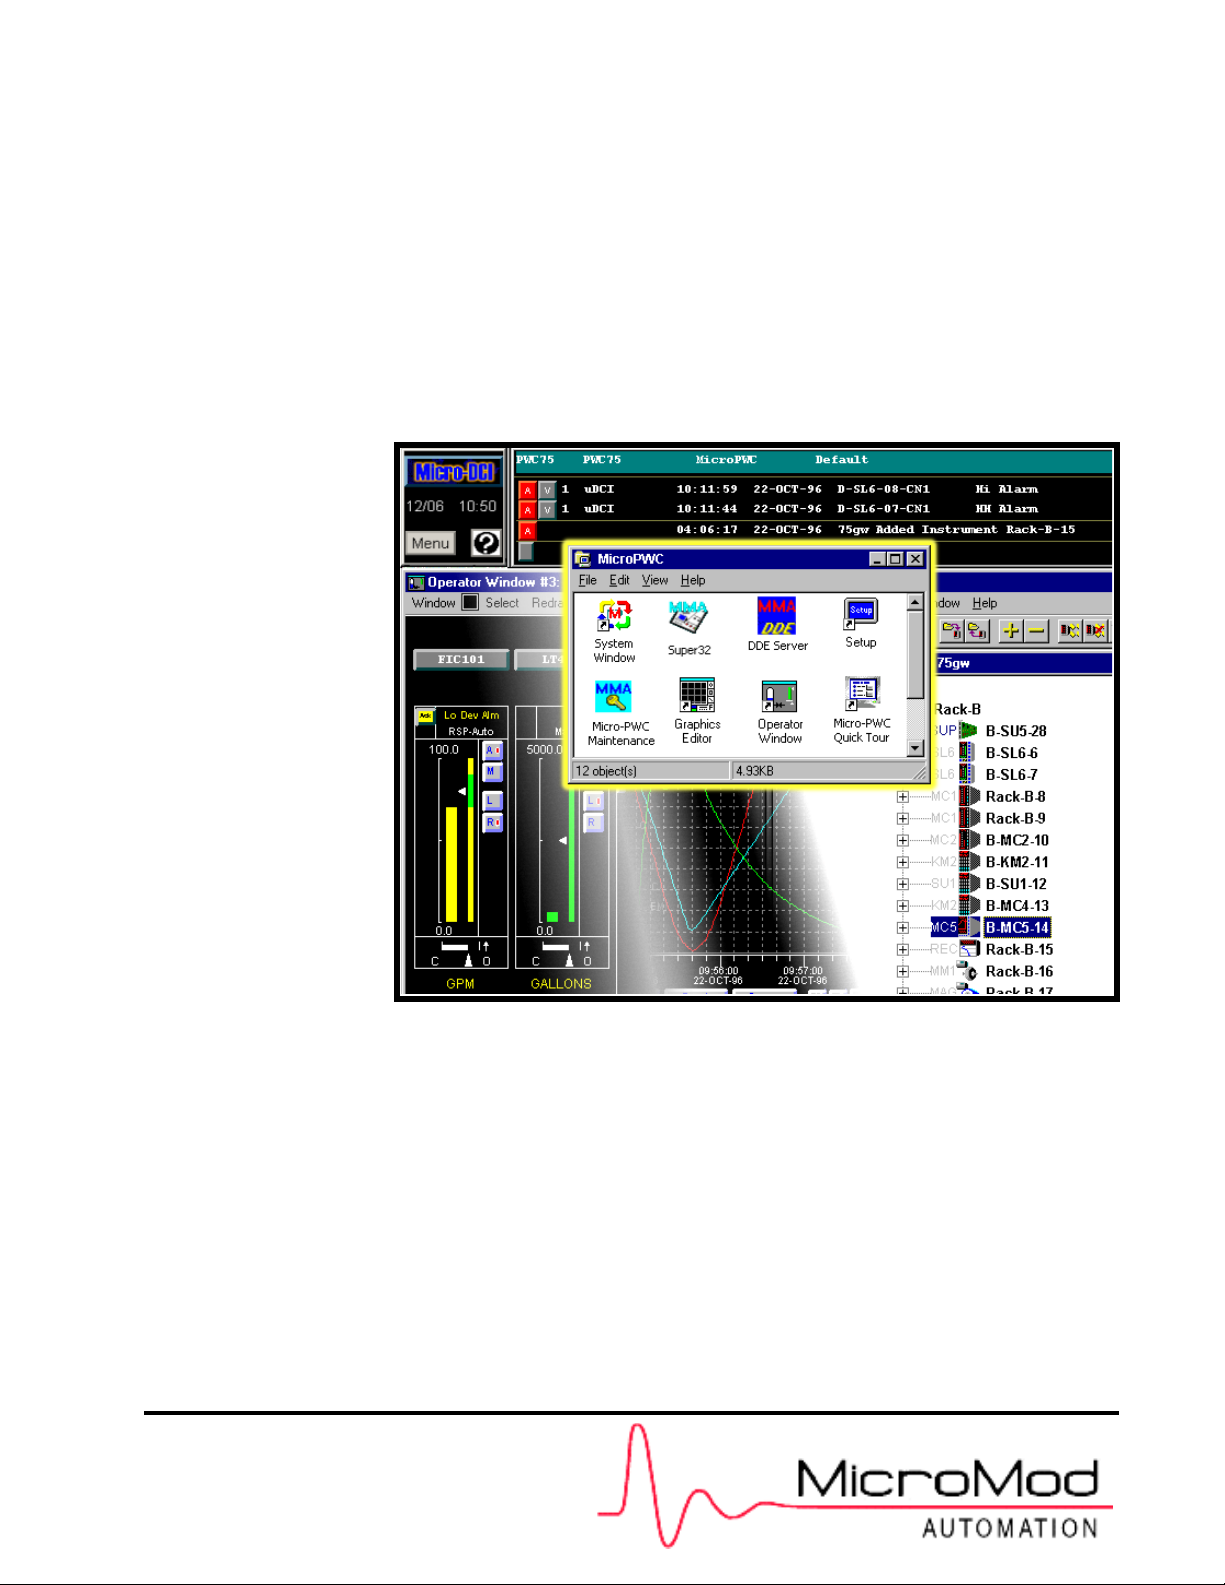
The Micro-PWC default display consists of the System Window , the Mini- Alarm Window, and one Operator
Window, as shown in Figure 2-1. This default window configuration is used at system startup. If no other
default window configuration has been configured, it is also used when an operator logs out.
MINI-ALARM
WINDOW
SYSTEM
WINDOW
OPERATOR
WINDOW
T02738A
Figure 2-1. Micro-PWC System Default Window
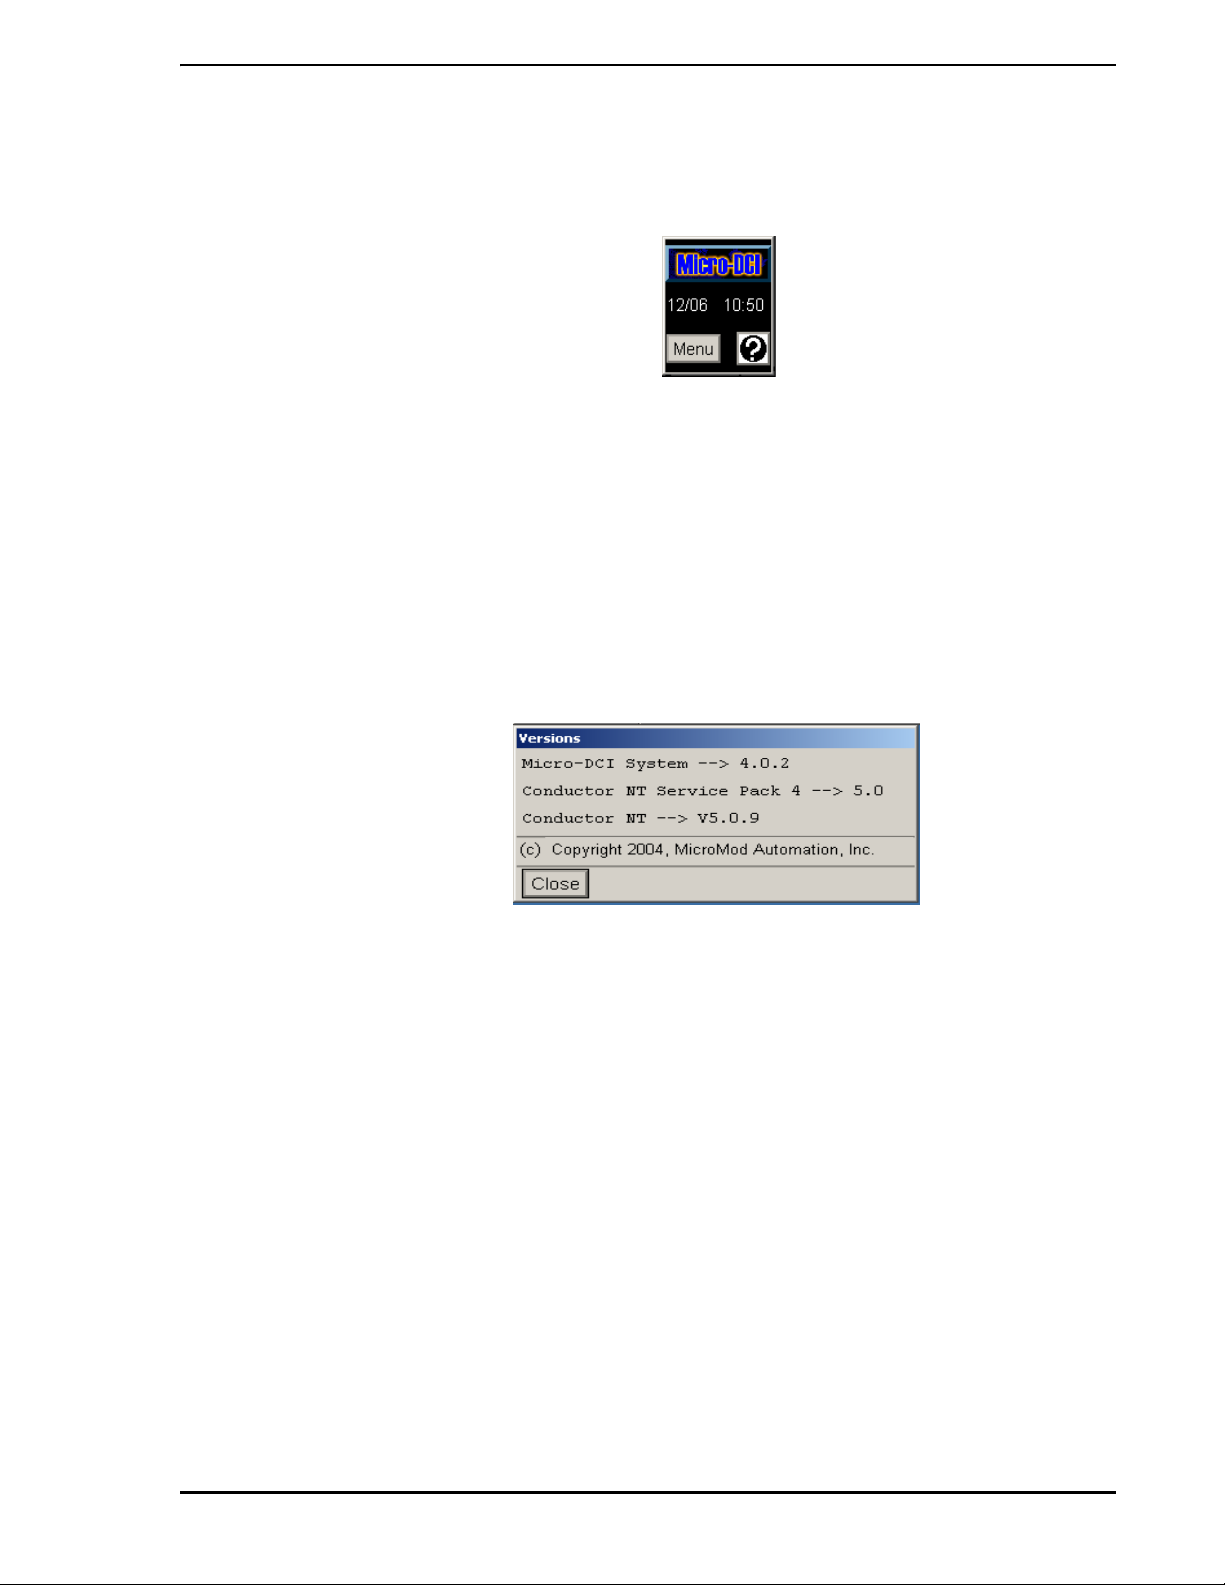
2.4.1 System Window
The System Window (Figure 2-2) is a small window located in the top left corner of screen, immediately to
the left of the Mini-Alarm Window. The System Window appears automatically upon system startup and is
visible at all times, unless it is intentionally covered by the operator or is temporarily covered by a pop-up
10 User Interface
Page 25
Micro-PWC OPERATOR’S MANUAL
window. The System Window cannot be moved, closed, or resized. Normal window operations such as
opening an Operator Window or maximizing a window will not cover or overlap the System Window.
Figure 2-2. System Window
2.4.2 System Window Components
The System Window is composed of three main parts:
• Micro-DCI logo pushbutton
• Date and time indicator
• Menu pushbutton and Help icon
The Micro-DCI logo pushbutton identifies the system as a member of the Micr o-DCI p roduct line ; pre ssing
the button causes the Micro-PWC software version number to be displayed (Figure 2-3).
Figure 2-3. Micro-DCI Logo Pushbutton
The date and time indicator continuously displays the date and time.
The Menu pushbutton provides access to the System Window menu functions.
2.4.3 Menu Functions
The Menu button on the System Window provides access to configuration of Micro-PWC parameters,
security parameters, and network parameters.
2.4.3.1 Micro-PWC Parameters
The following Micro-PWC setup parameters are available for user configuration from the System Window:
• System name (title bar in Mini-Alarm Window)
• PC network name
• Alarm presentation on top line of Mini-Alarm Window
• Priority color assignments
User Interface 11
Page 26

Micro-PWC OPERATOR’S MANUAL
2.4.3.2 Security Parameters
The following security parameters are configurable for each user logged into Micro-PWC:
• Password
• Operator access level
• Area access
• Priority access
• Node access
• Initial displays
• 64 Quick Keys per login name (single window display)
• 16 CRT context keys per login name (multi-window display)
• Message filtering
The following security parameters are configurable for a Micro-PWC with no user logged in (default security):
• Operator access level
• Area access
• Priority access
• Node access
• Initial displays
• 64 Quick Key assignments
• 16 CRT context key assignments
• Message filtering
2.4.3.3 Network Parameters
The following network parameters allow for configuration of parameters that are global to the network:
• Alarm setup
• Alarm vectors
• Area names
• Event bit names
• Printer assignment
• Message routing
• Network device assignments
• Operator Window parameters
✎ NOTE If a client is being run, the event bit configuration can be run only
from the node where the data base resides. This node should be a
server node.
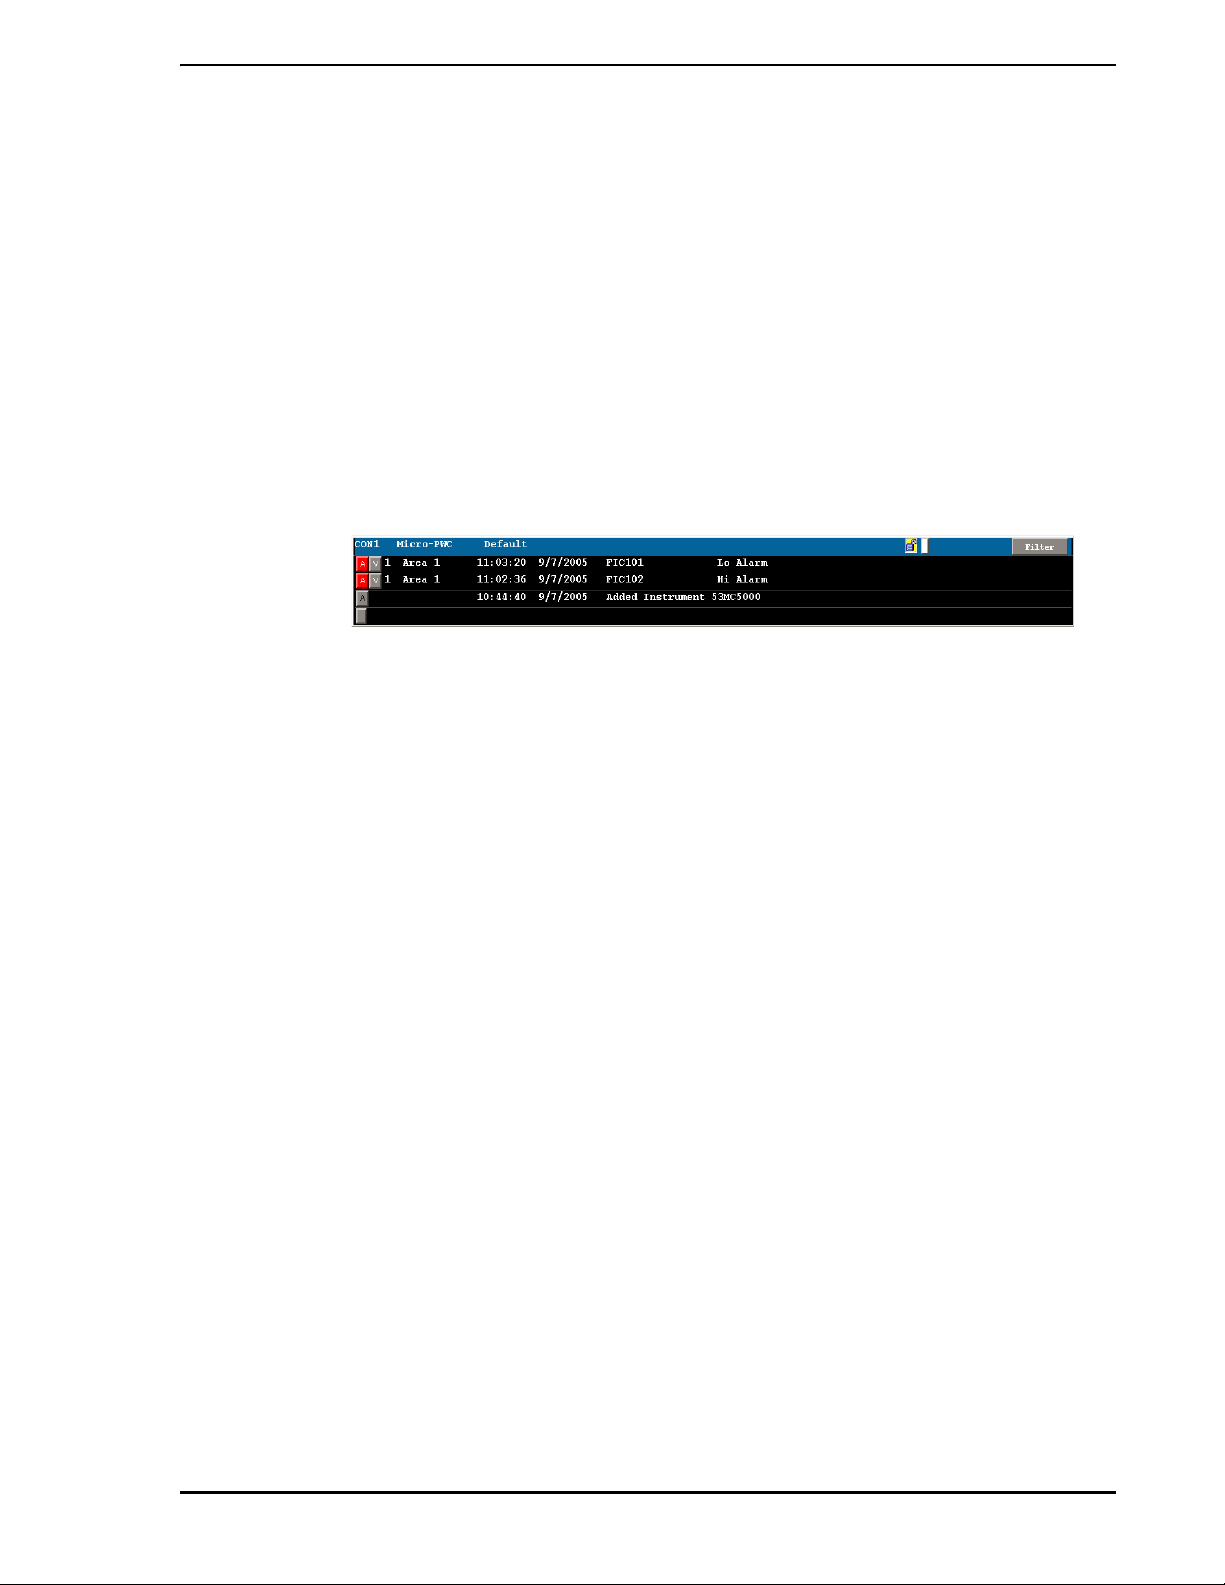
2.4.4 Mini-Alarm Window
The Mini-Alarm Window appears to the right of the System Window on the scr een (Figure 2-4). Like the
System Window, the Mini-Alarm Window appears automatically upon system start up and is visible at all
times, unless it is intentionally covered by the operator or is temporarily covered by a pop-up window.
12 User Interface
Page 27
Micro-PWC OPERATOR’S MANUAL
The Mini-Alarm Window appears on all screens and cannot be maximized, minimized, closed or resized.
Two alarm lines, one event line, and one operator message line are displayed.
The Mini-Alarm Window (Figure 2-4) is composed of the following parts:
• Title bar
• Process alarm display area
• System event display area
• Operator message display area
• Alarm Acknowledge buttons to acknowledge alarms, events and messages
•a Vector button on each process alarm line (lines 1 and 2), used to call up a predetermined
display associated with the point which is in alarm.
•a Filter button and More Alarms (+ALARMS) indicator.
Figure 2-4. Mini-Alarm Window
The title bar identifies the window by Micro-PWC name. The nam e of the current host node is displa yed to
the right of the Micro-PWC address. If the system (i.e., Micro-PWC1) communicating with the Micro-PWC
is the primary node assigned to the Micro-PWC1 (refer to the Micro-PWC Configuration Guide), it will be
displayed in normal video. If the host node is a backup node, the host node name will be displayed in
reverse video. The title bar also contains a string which can be configured to provide further information,
such as plant name and location. The login name of the user currently logged in on the Micro-PWC
appears on the title bar, followed by the +ALARMS indicator (if more alarms exist), a Silence button, and
the Filter button. The Silence button contains a horn icon on the button face, and is visible only when audi-
ble alarms exist.
The process alarm display area has a black background, on which up to two process alarms appear. The
data contained in each line of the process alarm display area is displayed in a number of fields; the width of
each field is configurable. The fields are:
•Priority
•Area
•Time
•Date
•Tag
•Status
•Alarm tag
• Legend
The system event display area appears below the process alarm display ar ea. Event messages r eport th e
occurrence of system events (as opposed to process events) such as database loading and serve r status
(e.g., Server is Offline). One event message is displayed in this area.
The operator message display area appears below the system event display. Operator messages are sent
to all operators in an area of the plant to provide information. This feature provides the users with online
User Interface 13
Page 28

Micro-PWC OPERATOR’S MANUAL
communication between areas which are distant from o ne ano ther. Refer to Sectio n 3 .3, System Fe atures
for details on use of the operator message feature.
An Alarm Acknowledge button is located at the left side of each alarm line. This button is displayed in the
priority color of the alarm, and contains the letter A until the associated alarm is acknowledged. If the associated alarm has been acknowledged, the button is displayed in the priority color of the alarm, but is othe rwise blank. Individual alarms can be acknowledged by clicking this button.
A Vector button is located immediately to the right of the Alarm Acknowledge button. This button contains the letter V. If alarm vectoring (see Section 8.4.2.1, Display Vectoring from the Alarm Review Display)
has been configured for the point named in that alarm line, the display assigned via alarm vectoring will
appear in the Operator Window which has the lowest number. If no display has been assigned via alarm
vectoring, the point display for the point in alarm will be used. If no Operator Window is open when the
Vector button is clicked, no display appears. To cause the display to appear in an Operator Window other
than the one with the lowest number, drag and drop the Vector button inside the frame of the window
where the resulting display will be contained. If the user attempts to place the display in a window other
than an Operator Window (e.g., a pop-up window), the Micro-PWC will emit a beep to indicate an error,
and no further action will be taken. If the contents of the alarm line change during the drag operation, the
alarm vectoring configuration in effect when the Vector button was selected will remain in effect until the
operation is completed.
The +ALARMS indicator is located immediately to the right of the title bar. This indicator appears when
more process alarms exist than can be shown in the alarm display area (i.e., when there are more tha n two
process alarms).
The Filter button is located to the right of the title bar, beyond the +ALARMS indicator. Clicking on th is button causes the Mini-Alarm Filtering window to appear. This window contains options which can be used to
filter process alarms by Priority and Area. If all alarms will be d isplayed the la bel on this button reads Filter;
if some alarms will not be displayed due to filtering configured for the user’s login, the label reads Filtered.
The Mini-Alarm Filtering window also provides a toggle button with which to enable or disable audible
alarms. This toggle button always present when audible alarms have been enabled for the local MicroPWC via the Device Type Assignment window described in the Micro-PWC Configuration Guide.
✎ NOTE The message filtering configured for a user’s login takes
precedence over filtering configured at any other level. If access to
a particular Message Type is filtered out at the login level, it cannot
be turned on using Filter on the Mini-Alarm or using the filter o ptions
which appear on the menu bars of the Alarm Review, Event
Review, Message Review, or Event Historian displays. All
messages which are accessible to the us er can be fur th er filter ed
using these items. If the user elects to filter the contents of a display
using a Filter option from a window menu bar or the Mini-Alarm
Window Filter, the menu bar item will change to L-FILTERED, to
indicate that filtering is local (L) to the window.
2.4.5 Operator Window
The Operator Window provides the operator interface to the process, and can display output contained in
process displays. These process displays include:
• Hierarchical displays (including Summary, Group and Point displays)
• Trend displays
•Graphics
• System Status Display (SSD)
• Process Alarm Review
14 User Interface
Page 29

Micro-PWC OPERATOR’S MANUAL
• System Event Review
• Printer Review
• Event Historian
• Message Review
By default, one Operator Window automatically appears at system startup (when the Default account logs
in) or when a new user logs in, if no default CRT contexts (describ ed in Section 11.12, CRT Context Keys)
have been defined for these accounts. Under these conditions, additional Operator Windows will not automatically appear, but can be opened by the user.
It is possible to have up to four Operator Windows open simultaneously on a Micro-PWC. Section 2.4.6,
Operator Window Operations, provides further information on the default arrangement of Operator Win-
dows. A user’s login account can be configured to automatically open up to four Operator Windows each
time that user logs in. The Operator Window can be maximized, closed and resized.
Because each Operator Window operates independently, a different process display can be run in each
Operator Window. For example, while Window 1 displays a Summary Page, Window 2 could display a
Graphic, Window 3 a Trend display, and Window #4 a Process Alarm display.
2.4.5.1 Operator Window Components
The Operator Window is composed of the three main window components: a title bar, a menu bar, and a
display area.
The title bar identifies the number of the Operator Window and type of process display, if any, running in
the window. At the left end of the title bar is a small square button (which contains a horizontal bar) known
as the Window Menu button, which pro vide s ac cess to the window control functions Move, Resize, and
Lower.
The menu bar provides the user with the following items:
•Window
• Maximize/Restore button
•Select
• Redraw (depends on display type)
• Zoom (depends on display type)
•Help
The Window option on the menu bar provides access to a casca ding submenu of additional window cont rol
functions, including Page Up, Page Down, Display Back, Display Forward, Acknowledge, and Close.
The Maximize/Restore option on the menu bar is used to change the size of the Operator Window. Click
this button to enlarge a small Operator Window to fill the entire display area below the System and MiniAlarm Windows. Click this button again to return the window to its previous size.
The Select option on the menu bar provides access to a cascading submenu of process interface features,
such as Graphics, Trends, Summarie s, Point s, Group s, Quick Keys, various Review displays, and the System Status Display. If the security level of the current operator does not allow access to an option, that
option is unavailable. (It is present, but appears in a lighter shade, and is said to be “stippled out”.
The Redraw option refreshes the Operator Window display.
The Zoom option allows you to resize the contents of the Operator Window without changing the size of
the window boundaries.
User Interface 15
Page 30

Micro-PWC OPERATOR’S MANUAL
The Help icon on the menu bar allows the user to access online, context sensitive system help, as well as
user generated user help.
2.4.6 Operator Window Operations
A maximum of four Operator Windows can be opened on each Micro-PWC. As windows ar e opened on the
screen, the size and location of each window and its contents are automatically adjusted to fit in the available space.
The Micro-PWC is designed to open one Operator Window automatically when the system is st arted, when
the Default Login state exists, or when a new user logs in (if no CRT Context has been assigned for that
user). The first Operator Window to be opened occupies the entire work area below the System and MiniAlarm Windows.
If a second Operator Window is opened, Operator Window #1 is resized to occupy the left half of the
screen; Operator Windows #1 and #2 are displayed side by side. The windo w content s are scaled to fit the
new size.
Operator Window #3 will occupy the lower left quadrant of the screen work area, with Operator Window #1
being resized and scaled to fit in the quadrant above it.
Operator Window #4 will occupy the lower right quadrant of the screen work area, with Operator Window
#2 being resized and scaled to fit in the quadrant above.
Although the initial size and location of each window are pre-determined, this can be modified by the operator, using the options available from the Window option on the Operator Window menu bar, or by using
the resize handles.
The windows can be restored to their original size and shape at any time by selecting Menu > Arrange
Windows discussed in Section 2.4.8, Arrange Windows Function. This function can also be accessed by
pressing the A
RRANGE WINDOWS key on the keyboard.
2.4.6.1 Open an Operator Window
To open an Operator Window manually, the System Window must first have keyboard focus. From the
System Window, select Menu > Windows > Open New Window.
Selecting this option causes an Operator Window to be opened in the display area of th e screen be low the
Mini-Alarm Window.
2.4.6.2 Page Up/Page Down Operator Window Comman ds
The Window option on the menu bar provides Page Up and Page Down functions. These functions are
used to move through other pages of the display currently o n view in the display area, such as p ages of an
Alarm Review display. Page Down moves the user from a display with a lower page number to a display
with a higher page number; e.g., from Alarm Review page 1 to Ala rm Review page 2. Page Up reverses
the process.
Page Up and Page Down can also be used to move through displays of the same type, such as the 1,000
Summary displays.
The same functionality is provided by the P
AGE UP and PAGE DOWN keys on the keyboard.
2.4.6.3 Display Back/Display Forw ard
The Window option on the menu bar provides Display Back and Display Forward functions. These functions are used to move backward and forward between the last 10 displays which have appeared in the
window, regardless of the display type. For example, a user might view a Group display, then a Point dis-
16 User Interface
Page 31

Micro-PWC OPERATOR’S MANUAL
play , followed by a T rend display. To return to the Point display , the user need only select the Display Back
function. This saves time and keystrokes by removing the need to call up the display via the Select button
and resulting pop-up windows.
2.4.6.4 Acknowledge
Click the Acknowledge option to acknowlegde all alarms associated with the page on display . This option is
functional only on Point and Group displays, Alarm and Event Review displays, and Graphic displays.
2.4.6.5 Close
To close an Operator Window, position the pointer on the Window option on the menu bar of the window.
Select Close from the resulting cascade menu. A window will prompt:
Close Window?
Click Yes or No. No other action can be taken until a selection is made. This guards against accidenta l closure of an Operator Window. Any remaining windows will be resized as described in Section 2.4.6, Opera-
tor Window Operations.
2.4.6.6 Resize an Operator Window
An Operator Window can be stretched or shrunk by using the Resize menu item (available from the Window Menu button at the left side of the title bar), or by using the resize hand les located on the frame of the
Operator Window. Window size can be changed vertically, horizontally or diagonally. The display which
appears in the window is automatically adjusted to the new window size.
To resize an Operator Window using the Resize menu item, select Window > Resize. Selection can be
made using the mouse or by pressing the letter R on the keyboard.
The Operator Window can also be resized using the resize handle segments on the window frame.
User Interface 17
Page 32

Micro-PWC OPERATOR’S MANUAL
2.4.7 Show Users and Screen Contents
To determine which user is logged in to each Micro-PWC, and the contents of the Operator Windows on
each one, use the Show Users function. From the System Window, select Menu > User > Show Users to
display the Show Users window.
Figure 2-5. Show Users Window
For each Micro-PWC on the network, the Show Users window displays (in a scrollable list box) the identity
of the item, the name of the user logged in, and information from the title bar of each Operator Window
open on that Micro-PWC monitor. The time at which this information was gathered appears at the upper
left corner of the display. If the window has been on display for some time, click on the Rescan button at
the bottom of the display to update the information.
Click Screen Dump to view, locally, the screen contents of the remote Micro-PWC.
2.4.8 Arrange Windows Function
If the size and/or location of a window has been modified, the windows can be restored to their original size
and shape at any time from the System Window by selecting Menu > Windows > Arrange Windows. This
function can also be accessed by pressing the A
Selecting this menu item will arrange the open Operator Windows so that none overlap and the screen
area is divided as evenly as possible among these windows. The pointer will be moved to the upper left
corner of the screen. Any pop-up windows present will be unchanged in size and position.
RRANGE WINDOWS key on the keyboard.
18 User Interface
Page 33

Micro-PWC OPERATOR’S MANUAL
2.5 Summary - Window Types, Components, and Operations
A
LARM
A
CKNOWLEDGE
B
UTTON
A
LARM
A
CKNOWLEDGE KEY
A
RRANGE WINDOWS A function which allows all Operator Windows present to be quickly resto red to
C
HECK BUTTON A check button is a type of graphic control button used to select settings that
Located at the left side of each alarm line. This button is displayed in the
priority color of the alarm, and contains the letter A until the associated alarm
is acknowledged. If the associated alarm has been acknowledged, the button
is displayed in the priority color of the alarm, but is otherwise blank. The user
may acknowledge individual alarms by placing the cursor on this button and
clicking the left mouse button.
The Alarm Acknowledge key, located on the keyboard, always acknowledges
the alarm on the top line of the Mini-Alarm Window, no matter where the
cursor is located on the screen when the Alarm Acknowledge key is pressed.
their original size, shape and location.
are not mutually exclusive. The visual cue used to indicate that an item has
been selected is that a selected button is filled in or checked.
F
ILTER BUTTON Located at the right end of the Mini-Alarm Window title bar. Pressing this
button causes a pull-down display to appear. This display contains options
which can be used to filter process alarms by Priority and Area.
H
ELP ICON Contains a question mark (?). Press this button to display further information
regarding the current operation.
L
OGO PUSHBUTTON Displays the Micro-PWC software version number.
M
ENU PUSHBUTTON Located on the System Windo w and provides access to System, Securi ty and
Network parameters, as well as Configuration functions.
M
INI-ALARM
W
INDOW
Located to the right of the System Window on the Micro-PWC screen. It
automatically appears upon system start up and is visible at all times. The
Mini-Alarm Window provides a title bar, an alarm display area, an event
display area, Alarm Acknowledge buttons to acknowledge alarms and
events, a Filter button and a More Alarms (+ALARMS) indicator.
O
PERATOR WINDOW Located on the Micro-PWC screen below the System Window and Mini- Alarm
Window, th e Operator W in dow provid es th e oper ator interface to th e process,
and displays program output from Operator Window process displays such as
Hierarchical displays, Trends, Graphics, the Alarm Review, etc. The Operator
Window is composed of a title bar, a menu bar, and a display area. Up to four
Operator Windows can be present simultaneously on a Micro-PWC.
S
YSTEM WINDOW A small window located at the top left corner of the Micro-PWC screen. It
appears automatically upon system start-up, and is visible at all times unless
deliberately covered by the operator. The System Window provides a date/
time indicator and a Menu button for access to other system features and
utilities.
User Interface 19
Page 34

Micro-PWC OPERATOR’S MANUAL
T
ITLE BAR Located at the top of a Micro-PWC window, a title bar provides information to
identify the window.
V
ECTOR BUTTON Located immediately to the right of the Alarm Acknowledge button in each
alarm line. This button contains the letter V. Clicking on this button allows the
user to vector to a display previously assigned to the point which appears in
that alarm line. If no other display has been previously configured, the point
display for the point in alarm on that alarm line will appear. The display called
up in this manner will automatically appear in the Operator Window with the
lowest number. To load the display in a different Operator Window, position
the pointer on the Vector button and continue to hold the left mouse button
while dragging the pointer to the desired Operator Window. Release the left
mouse button when the pointer is inside the frame of the target window.
20 User Interface
Page 35

Micro-PWC OPERATOR’S MANUAL
3.0 Micro-PWC Features
3.1 Introduction
The Micro-PWC console contains features which aid in the use and management of the system. These
features include activities such as:
• Logging in
• Logging out
• Changing passwords
• Opening and arranging windows
• Accessing utilities
• Accessing the System Status Display
• Printing Logs and CRT screen contents
This chapter provides basic information required to get started using the system, then moves on to briefly
discuss various system features. Note that this manual does not attempt to describe configuration operations; refer to the Micro-PWC Configuration Guide for details on configuration.
Many of these system features are accessed using the menus availab le via the System Window Menu button. (The System Window is described in Section 2.4.1, System Window.)
3.2 Getting Started
One of two states can exist on a Micro-PWC that is running:
•the System Default state (no user logged in)
•the User Logged In state
3.2.1 System Default State
The System Default state occurs after a Micro-PWC initial start up, after a user has logged out of a MicroPWC, or when a Micro-PWC is restarted. In the System Default st ate:
• security access level, Quick Keys, and CRT Context Keys are those defined in the Default
user login setup
• the user name in the title bar of the Mini-Alarm Window is Default
• the displays contained in the Operator Windows are those de fined in the initial login displays of
the Default login setup. If no initial login displays are defined for the default login, a single
Operator Window is opened, which contains the System Status Display.
When the System Default state exists, the system responds as th ough a user named Default is logged in
on the system. Depending on the security level assigned to this Default user, various activities can be performed on the system, such as opening Operator Windows, viewing displays, or printing the contents of
the CRT.
If the capuser account (with default permissions set) is logged in, a full shutdown of the Micro-PWC is not
permitted. This is because capuser is the default operator account and full shutdown privileges are withheld. If necessary a user with administrative privileges can perform full system shutdown by selecting:
Micro-PWC Maintenance > Basic > Full System Shutdown.
Micro-PWC Features 21
Page 36

Micro-PWC OPERATOR’S MANUAL
3.2.2 Logging In
The User Logged In state exists when a user (other than Default) has logged in. Users can be logged in
manually or automatically.
When the Micro-PWC software is started, the login name of the current Windows user is compared to the
user login names found in the Micro-PWC configuration. If a match is found, that user will automatically be
logged into the Micro-PWC, with all of the permissions and CRT contexts configured for that Micro-PWC
user.
To log in manually, select Menu > User. The menu displayed allows the user to log in to (or out of) the
Micro-PWC. (Note that if the optional badge reader hardware and software are in use, and Inhibit Key-
board Logins has been selected, the Login option will not appear on this menu.)
✎ NOTE A security system of access levels controls the user’s access to
areas and priorities, as well as network and server functions. When
the security system is active, the user’s access to parameters is
defined by the system default or the user’s login configuration.
When the security system is inactive, no restrictions are placed on
the user’s access abilities.
Select Log In from the menu; the window in Figure 3-1 appears. In the area next to the Log In prompt enter
the login name of the user to be logged in, using either the Micro-PWC keyboard or by clicking on the
appropriate keys on the video keyboard. The login name should be followed by clicking OK. Next, enter the
password in the same manner, again followed by clicking OK.
Figure 3-1. User Login Window
If an incorrect login name or password is entered during a login attempt, a System Event message will be
generated. This message will appear in the System Event display area of the Mini-Alarm Window. The
message will also be stored in the Event Historian (refer to Section 9.4, Event Historian). The message will
include the time and date, the node name, the name o f the user already logged in on the Micro-PWC at the
time of the unsuccessful attempt, a message regarding the invalid attempt, the name of the Micro-PWC on
which the unsuccessful login was attempted, and the name under which the invalid login was attempted.
For example:
16:42:43 12-JUL-05 PWC1 User Default Invalid Login Attempt on
Terminal PWC1 Fred.
Here, the Default user was logged in on PWC1 when the user Fred unsuccessfully attempted to login.
22 Micro-PWC Features
Page 37

Micro-PWC OPERATOR’S MANUAL
If the attempt is unsuccessful, a pop-up dialog will prompt:
!Login failure.
Try again?
Click OK to close the window and return to the Micro-PWC login window.
✎ NOTE It is possible to configure a user login account which is restricted
from using specified systems. If login on a Micro-PWC is denied,
the user account may be restricted from using it. Ask your system
administrator for details on Micro-PWC availability from that login
account.
The initial displays assigned in the user’s login configuration are placed on the CRT assigned to the keyboard used for the login operation. The Quick Keys (see Section 11.11, Quick Keys) and CRT Context
Keys (see Section 1 1.12, CRT Context Keys) assigned in the user’s login configuration ar e available to the
user. The user’s name is displayed in the title bar of the Mini-Alarm Window.
A user can log in on a terminal which already has an active login on it. This action causes the previous
user to be logged out. If the new user has defined a n initial CR T context (i .e., CR T Login Context Key), the
CRT will display this new environment. If no initial CRT Context has been defined, the displays on the CRT
remain unchanged.
✎ NOTE If security is activated on the system, and a user’s login account is
configured to filter out (exclude) messages from one or more
process areas, then that login account cannot be used to perform
operations on the process areas for which message filtering has
been applied. Questions on how message filtering is configured on
the system, and specifically for this account, should be directed to
the system administrator . Co nfigu rat io n of these items is discusse d
in the Micro-PWC Configuration Guide.
3.2.3 Logging Out
When a user logs out of a Micro-PWC, the following actions take place only on the CRT assigned to the
keyboard from which the user is logging out:
• The security access level, Quick Keys and CRT Context Keys change to those defined for the
Default user.
• The user name in the title bar of the Mini-Alarm Window changes to Default.
• The Login Context changes to that of the Default user , and th e login parameters will change to
those of the Default user. (In other words, when an actual user logs out, the Micro-PWC
returns to the Default login state; it is as if the Default user had logged in.)
The log out procedure is similar to that used to log in. To log out, from the System Window click Menu >
User > Log Out. The current user will be logged out.
3.2.4 Show Users Option
The Show Users option provides a list of all Micro-PWC users logged on at any one time. Click Menu >
User > Show Users to view a display containing this information. This option is described in detail in Sec-
tion 2.4.7, Show Users and Screen Contents.
Micro-PWC Features 23
Page 38

Micro-PWC OPERATOR’S MANUAL
3.2.5 Changing Your Password
When a login is initially configured, the password for the login defaults to the first seven characters of the
user name entered for the login. One of a new user’s first actions should be to change this password, to
prevent unauthorized persons from using the account.
A good password is an essential component of system security. Use the following guidelines when choosing a password:
• Avoid the obvious choices, such as names, social security numbers, words that appear in a
dictionary, license plate numbers, etc.
• Make it complex; use a mixture of upper and lower case letters, as well as numbers, in the
password.
• Use all seven characters; a password that is too short is easy to guess.
While the user is not prevented from using a single character or spouse’s name as a password, this is not
good practice.
To change a password, the user must:
1. Log in on the system.
2. From the System Window, select Menu > Configure > Security > Change Password. The
Change Password window (Figure 3-2) appears, which contains a text entry box labelled
Login.
TC00030A
Figure 3-2. Change Password Window
3. Enter the login name in this entry box, then press R
4. Use the same method to enter your current password for that login name. The password will
not be displayed on the screen, for security reasons.
For most users, this operation will be performed only on one’s own login name and p assword,
although it is possible for a user with a higher access level (refer to Section 3.3.1, Security, in
this section) to change the password of a user with a lower access level. Note that by being
required to enter the password as described above, the user is forced to prove possession of
the original password before it can be changed.
✎ NOTE Passwords are case sensitive.
5. Next, enter the New Password in the appropriate text entry box, followed by R
6. Enter the new password again, this time in the Verify Password text entry box, and press
R
ETURN. Because the passwords do not appear on the screen, this step is essential to make
sure that there were no typing mistakes when the new p assword was entered.
If the new password and the verification entry match, the new password is accepted. If they do not match,
a pop-up dialog appears, advising the user to try again.
ETURN.
ETURN.
24 Micro-PWC Features
Page 39

Micro-PWC OPERATOR’S MANUAL
3.2.6 Exiting the Micro-PWC System
To exit the Micro-PWC system, select Menu > User > Exit. A window appears with two options; select the
desired option and click OK. The user will be logged off and the selected exit option will be performed.
3.3 System Features
Clicking the System Window Menu button produces a menu containing the following items:
• User
• Windows
•Configure
• Utilities
•Print log
The first item, User, has been discussed in Section 3.2, Getting Started.
The other menu items provide access to additional features which allow the user to:
• Open windows (described in Section 2.4.5, Operator Window).
• Arrange windows (described in Section 2.4.8, Arrange Windows Function).
With proper security access levels:
• Perform configuration operations. Discussion of configuration topics is beyond the scope of
this document; see the Micro-PWC Configuration Guide for details on configuration.
• Change passwords (described in Section 3.2.5, Changing Your Password ).
• Access Micro-PWC utilities (described in Section 7), which include:
• Backup and restoration of data
• Manual data entry
• Historical database maintenance operations
• Archival database maintenance operations
• Print all or part of the contents of a screen
• Use the calculator display
• Message configuration (described in Section 3.3.2, Message Configuration)
• Message routing (described in Section 3.3.3, Message Routing)
• Print Logs on demand
Additional Micro-PWC features which aid in management of the system, and with which the user sho uld be
familiar, are:
• Security (see Section 3.3.1, Security), which determines limits of a user’s ability to access
items on the Micro-PWC.
• The System Status Display (see Section 3.4, System Status Display), which provides
information on the Data Highway and the nodes connected to it.
Micro-PWC Features 25
Page 40

Micro-PWC OPERATOR’S MANUAL
3.3.1 Security
The Micro-PWC includes a security system of nine access levels which control the user’s access to:
• Micro-PWC System functions
• Process control functions
• Plant areas
Access levels are assigned to both users and to the areas and functions. You must have an access level
equal to or higher than that of the function you wish to use, in order to have access to it. Available access
levels are listed in Table 3-1.
Table 3-1. Access Levels
Name Ranking
Operator Level 1 (Lowest access level)
Operator Level 2
Operator Level 3
Engineer Level 1
Engineer Level 2
Engineer Level 3
Supervisor Level 1
Supervisor Level 2
Supervisor Level 3 (Highest access level)
Security can be configured to be Active or Inactive on the Micro-PWC. When the security system is active,
the user’s access to these parameters is defined by the System Default or by the user’s login configuration. When the security system is inactive, no restrictions are placed on the user’s access abilities.
If you do not have access to a function, the menu item or button for that function will appear stippled out. If
you encounter difficulty in accessing a function or plan t area, see your system administrator to verify that
you have been assigned the proper access level or to have your access level changed.
3.3.2 Message Configuration
A method of communication between operators is available on the Micro-PWC, allowing text messages
known as Operator Messages to be sent from one plant Area to another. The Message Configuration feature provides this method of generating Operator Messages from a Micro-PWC.
26 Micro-PWC Features
Page 41

Micro-PWC OPERATOR’S MANUAL
To create an Operator Message, select Menu > Configure > Message Configuration. The Message Configuration window (Figure 3-3) will be displayed.
TC00032A
Figure 3-3. Message Configuration Window
The window is used to configure the text, priority, and destination of the Operator Message.
3.3.2.1 Message Text
To configure the text of the message, click in the text entry box located at the top of the Message Configuration window and enter a message of up to 80 ASCII characters.
3.3.2.2 Message Priority
Each message is associated with a priority. To set the priority, click in the Priority text entry box and enter
the number of the desired priority (range of 1 to 16).
3.3.2.3 Message Destination Area
Each message can be associated with a specific plant area. The Area assignment is used to route the
message to the devices (files, printers) which have been configured to receive Operator Messages a sso ciated with that area. The message will also be sent to all Micro-PWCs where users who have access to that
area are logged in. On the Micro-PWCs, the message will be displayed in the Message line (bottom line) of
the Mini-Alarm Window. To assign the Operator Message to an Area, click the Area button. The Area
Selection window (Figure 3-4) will be displayed.
TC00033A
Figure 3-4. Area Selection Window
Micro-PWC Features 27
Page 42

Micro-PWC OPERATOR’S MANUAL
The Area Selection window consists primarily of a scrollable list box which contains 255 areas. To select
the destination area for the Operator Me ssage, click on the desired Area, then click OK. The default is
Area 1. (To exit without changing the area assignment, click Cancel.)
3.3.2.4 Send the Operator Message
To send the Operator Message and exit Message Configuration, click Send. To exit without sending the
message, click Cancel.
3.3.3 Message Routing
Information on various topics is provided by the system in the form of messages. Messages are divided
into categories called Message Classes; this enables the system to distinguish between different kinds of
messages and allows efficient message sorting.
Messages within each class are further distinguished by separation into message types. Definitions of
types within a Message Class enables the Micro-PWC to quickly process and sort messages within a
class. Message Classes on the Micro-PWC include:
• Process Alarms
•System Events
• Operator Messages
Process Alarms, System Events, and Operator Messages provide information which must be immediately
available to the operator. Messages from these three classes are displayed in the Mini-Alarm Window on
the Micro-PWC screen. The remaining Message Classes reflect status changes in the system rather than
alarm conditions; messages belonging to these classes are not displayed in the Mini-Alarm Window. Logging of messages is configurable. Questions on how Message Routing is configured on your system
should be directed to your system administrator.
In addition to Message Classes, Message Routing also allows the filtering of messages base d on the following parameters:
•Priority
•Area
Message Routing enables messages of any Message Class to be separately routed to any device which
has been configured through the Printer Assignment menu se lection. Message Routing a lso defines which
Message Types in each Message Class are to be routed to any device, filtering out messages which are
not important for the specific application.
3.3.3.1 Message Color Defini t io n
By default, messages which are sent to a printer are printed in black, and messages which are sent to a file
appear as black characters on a white background.
Different colors can be configured for use when a message from a p articular class is sent to a file (or to an
optional color printer).
✎ NOTE The message color defined here is used when the message is
logged to a device (file or printer); it is not the same as Alarm
Priority color (see Section 8.3.1, Process Alarm Priorities), and will
not affect messages in the Mini-Alarm Window or Alarm Review
display.
Any questions regarding message color definition on your system should be directed to your system
administrator.
28 Micro-PWC Features
Page 43

Micro-PWC OPERATOR’S MANUAL
3.3.3.2 Message Indentation Definition
Another feature which can be configured on the system is the number of spaces of indentation to be used
for each Message Class. Where a number of different Message Classes are routed to the same printe r, a
different indentation can be used for each Message Class; this can assist the user when looking for messages of a particular class.
Any questions regarding message indentation definition on your system should be addressed to your system administrator.
3.3.3.3 Message Class: Process Alarm Messages
Process Alarm messages are displayed in the top two lines of the M ini-Alarm Window, known as the alarm
display area.
Process Alarms are displayed in the following format:
<Priority><Area><Time><Date><Tagname><AlarmCondition><Legend>
Process Alarm Messages are classified into the Message Types:
• Bad Input/Output
• High/Low Alarm
• Deviation Alarm
• Security Alarm
• Process Alarm Message
• Discrete Alarm
• Return to Normal
• Alarm Acknowledged
Process Alarm Messages can be filtered by Message Type.
3.3.3.4 Message Class: System Event Messages
System Event messages are displayed in the third line of the Mini-Alarm Window, known as the event display area. System event messages are displayed in the following format:
<Time><Date><Message>
System event messages are classified into the Mess ag e Types:
• Operator Station Events
• Network Events
• Return to Normal
• Event Acknowledged
• Node Down
• Node Up
• I/O Switchover
System events can be filtered by Message Type.
Micro-PWC Features 29
Page 44

Micro-PWC OPERATOR’S MANUAL
3.3.3.5 Message Class: Operator Messages
Operator messages are messages sent by an operator to all operators in an area , and appear in the four th
line of the Mini-Alarm Window.
Operator messages are displayed in the following format:
<Priority><Area><Time><Date><Message>
Operator messages are classified into the following Message Types:
• Operator message
• Operator call
• Message acknowledged
• Operator call acknowledged
Operator calls are messages issued from a server. Operator messages can be filtered by Message Type.
3.3.3.6 Message Class: Operating Errors
Operating Error messages are sent to a device designated via the Message Routing Assignment matrix.
This device can be a printer or a file.
Operating Error messages are displayed in this format:
<Time><Date><Device><Message>
Operating Error messages are classified into the following Message Type:
• Operating message
Operating Error messages can be filtered.
3.3.3.7 Message Class: Operator Actions
Operator Action messages are sent to a device designated via the Message Routing Assignment matrix.
This device can be a printer or a file.
Network Operator Action messages are displayed in this format:
<Area><Time><Date><Username><Terminal Name><Message>
Micro-PWC Operator Action messages are dis pla ye d in this form a t:
<Time><Date><Username><Terminal Name><Message>
Operator action messages are classified into the following Message T ype:
• Network Operator Action
• Micro-PWC Operator Action
Operator Action messages can be filtered.
3.3.3.8 Message Filter Parameters
In addition to the above Message Classes, messages can also be filtered to include or exclude messages
according to the following parameters:
•Priority
•Area
30 Micro-PWC Features
Page 45

Micro-PWC OPERATOR’S MANUAL
3.4 System Status Display
The System Status Display (SSD), shown in Figure 3-5, provides information about each node connected
to the network.
Figure 3-5. System Status Display
Each node on the network is depicted by a graphical representation known as an SSD object.
An SSD object is composed of a schematic illustration of the node above a button containing the name of
the node and information on the state of the node and its connections to the network. The appearance of
the SSD object varies, depending on the type and state of the node. Click the button to access a menu for
the node represented by the SSD object. Like the appearance of the SSD object, the entries on the menu
vary with the type of node represented.
Figure 3-6 is an example of the SSD object for a Micro-PWC. Figure 3-7 represents a Micro-PWC client,
which provides operator displays like the Micro-PWC, but does not perform network tasks, such as database and graphics storage, and communication with other operator consoles.
Figure 3-6. SSD Object for a Micro-PWC
Micro-PWC Features 31
Page 46

Micro-PWC OPERATOR’S MANUAL
Figure 3-7. SSD Object for a Micro-PWC Client
The system status display is organized into rows of nodes, using following rules:
1. A row contains nodes of only one type of device (e.g., Micro-PWC).
2. The rows of device types are ordered as follows, from top to bottom:
• Micro-PWC (labeled “PWC”)
• Micro-DCI Network Interface
If no nodes of a particular device type exist, subsequent rows of other devices are moved
up in the SSD (i.e., no blank rows are created).
3. A row can contain up to eight nodes. If more than eight nodes of one type exist on the network,
they are displayed on multiple, consecutive rows.
4. Within a row, nodes are ordered left-to-right according to device number; i.e., PWC1 appears
to the left of PWC2, and so on.
If more nodes exist on the network than can be shown in the no rm a l viewin g ar ea of the S SD, scr oll ba rs
will appear at the right and bottom sides of the display. These can be used to view the portions of the SSD
which extend beyond the normal viewing area.
If the Operator Window containing the SSD is positioned so that a node’ s SSD object is near the right edge
of the screen, it may be difficult to use the menu for the node in the normal manner. To resolve this, you
can:
• Resize or move the window so that the node is not at the right edge,
- or -
• Use the bottom scroll bar to shift the content s of the window so that the node is not at the right
edge.
3.4.1 General Information for All Node Types
All SSD objects, regardless of node type, share certain features, including:
• Node name
• Network connection information
• Info menu
These features are discussed in the following paragraphs.
3.4.1.1 Node Name
The Node Name is displayed on the face of the button which is located below the node icon. The Node
Name is composed of a three character descriptor which indicates the de vice type (for exam ple , PWC) fol-
32 Micro-PWC Features
Page 47

Micro-PWC OPERATOR’S MANUAL
lowed by the device number (for example, PWC6). The color of the Node Name indicates the network sta tus of the node, as follows:
Cyan Indicates that the node is the local Micro-PWC node. The local node is
also indicated by an asterisk (*) following the node name.
White Indicates the node is on the network. The node can be accessed by the
local Micro-PWC.
Black
(Text and Node Icon)
on Red
(Button Color)
3.4.1.2 Info Menu
Click the button containing the Node Name to display the pull-down menu for a node. The pull-down menu
for each node contains a button labelled Info. Click this button to access the Info Menu. The Info Menu
contains, at the minimum, the following two entries:
• Network Info
• Show Available Services
3.4.1.2.1 Network Info
Clicking on the Network Info item in the Info Menu will cause a Network Info window to be displayed
(Figure 3-8).
Indicates that the node is not currently on the network. The node can no
longer be accessed from the local Micro-PWC. (However, the node was
accessible at some point in time following the most recent restart of the
local Micro-PWC. If the node is still inaccessible at the time of the next
local Micro-PWC restart, it will be removed entirely from the SSD.) The
menu of the node cannot be used in this state. The node icon is
displayed in black, as well as the Node Name.
In this case, the node name is also enclosed in parentheses.
Figure 3-8. Network Info Window Example
This window contains read-only information about the node selected from the System Status Display. The
information will include the Internet (IP) address, the host name (if any), and the Ethernet address of the
node (if known).
Click OK to return to the System Status Display.
Micro-PWC Features 33
Page 48

Micro-PWC OPERATOR’S MANUAL
3.4.1.2.2 Show Available Services
Selecting Info Menu > Show Available Services displays a window similar to that found in Figure 3-9.
Figure 3-9. Services Window Example
This window contains a read-only list of the services available on the node selected from the System Status Display. This information is used by Technical Support personnel during troubleshooting. If a node
function does not work as expected, check this list to find out if the service is actually available on the
node. Note that each data tr ansaction on the n etwork is preceded by a code number identifying the service
associated with the transaction. These code numbers are shown in brackets preceding each item on the
list of available services. For example:
[0001] DBA
{0003] Screen Services
[0024] Process Summary Service
[0056] Event Bit Updates
3.4.2 Information for Specific Node Types
The following paragraphs describe the information shown on SSD objects which is specific to individual
notes types.
3.4.2.1 Console-Type Notes: Micro-PWC
The SSD object for a Micro-PWC is shown in Figure 3-6. The pull-down menu available from these icons
contains only the INFO item. (See the Micro-PWC Installation and Setup Guide for a detailed discussion of
the software installation procedure for the Micro-PWC.)
3.4.2.2 Micro-DCI Communications Node
The pull-down menu on a Micro-DCI Communications Node contains an Info item and a Super32 Network
Display item. If the user has Supervisor 1 security level or greater, a Micro-DCI network configuration win-
dow can be called up by selecting the Super32 Network Display item.
3.4.2.3 The Utilities Menu
The Utilities option, located on the System Status Display menu bar, provides access to printer device status information and printer control utilities.
34 Micro-PWC Features
Page 49

Micro-PWC OPERATOR’S MANUAL
Select Utilities > Device Status to access the printer control utilities and display the Device Status window
shown in Figure 3-10. If no devices are configured, a confirmation box will appear which contains an error
message informing the user that no devices are configured.
TC00538A
Figure 3-10. Device Status Window
The Device Status window provides information about items being printed. It also provides access to job
and printer control. The following information is provided for each device:
• Device name
• Device status
•Node
• Active backup unit name (Assign)
• Queue size
• Number of queue entries
• Size of current job
• Percent of current job printed
3.4.2.4 Printer Queue Cont rol
The column labelled Device Name contains a button for each device which has been defined via Printer
Assignment configuration (see the Micro-PWC Configuration Guide). The name of the device appears on
the face of the button. The color of the button indicates the status of the device:
• Green indicates the device is operating NORMALLY.
• Red indicates the device has FAILED.
• Yellow indicates the device has been placed in SUSPEND mode.
✎ NOTE When the button color changes to indicate the device status, the
text on the button also changes color so that it remains visible. The
text color has no other significance.
In addition to button color, the Device Status field to the right of each Device Name button provides status
indication in text form, i.e., it will display the word Normal, Failed or Suspended.
Micro-PWC Features 35
Page 50

Micro-PWC OPERATOR’S MANUAL
When the Device Name button is clicked, the Printer Queue Control window (Figure 3-11) will be dis-
played.
TC00039A
Figure 3-11. Printer Queue Control Window
The first item in the Printer Queue Control window is the name of the device. Below this identifier the window is divided into two main sections. The first of these is labelled Cancel and contains two buttons:
• Current Item
• All Items
Click Current Item to terminate the job which is active in the device. Click All Items to terminate the active
job and delete all other entries from the queue for that device.
Cancelling a job removes its entry from the print queue; however, any portion of the job which has already
been loaded into buffer space (in any relevant device, such as the printer, the Micro-PWC, and so on) will
be printed. Therefore, it is not unusual for a few pages of a job to print out after the job ha s been cancele d.
The next portion of the window is labelled Control, which also contains two buttons:
• Suspend
•Normal
Click Suspend to suspend operation of the device (Suspend mode). When in Suspend mode, processing
of any jobs in the queue will be completed, but no new jobs will be accepted in the queue. Click Normal to
return to normal operation.
3.4.2.5 Printer Queue Informat io n
The Node field on the Device Status window displays the name of the node which is currently serving the
print device.
When a device is operating normally, nothing is displayed in the Assign field. When a device fails, the
Assign field will display the device name of the backup unit which is actually servicing the queue for the
failed device. Backup device assignments are configured via Printer Assignment (see the Micro-PWC Con-
figuration Guide).
The Queue Size field displays the number of bytes in all jobs in the device’s print queue, while the Queue
Entries field indicates the number of jobs in the queue. The Current Item Size indicates the size, in bytes,
of the job which is currently active. The % Printed field indicates what portion of the currently active job has
been completed.
36 Micro-PWC Features
Page 51

Micro-PWC OPERATOR’S MANUAL
3.4.2.6 Console Group Information
To help control the synchronization of configuration data, Micro-PWC nodes are assigned to console
groups. Nodes within a console group synchronize configuration data only with those nodes within the
same console group. Note that console group assignment has no effect on the ability to view collected dat a
in the various databases, including the Historical, Archival, Batch, Historical Block, Archival Block and
Event Bit Databases.
If there is a reason to distribute console group-wide data to another console group (for example, you may
have a graphic or spreadsheet you wish to use in more than one console group) this information can be
distributed to other console groups via the Console Group Synchronization utility, described in Section
11.13, Console Group Synchronization.
Assignment to a console group is made during the installa tion of the Micro-PWC softwar e. The default console group number provided during the insta llation proc edure is 1. A n ode cannot be in more than on e console group. Up to 10 console nodes can exist in each group. Console groups can be assigned to numbers
from 1 to 50; this provides flexibility when assigning numbers. (While technically 50 console groups can
exist on the Network, the number of operator seats should be restricted to 50 per Network. Having more
than 50 operator seats on a Network could have a negative effect on system performance.) Console Gr oup
assignments can be revised at any time after installation, using the Micro-PWC Maintenance Utility.
The System Status Display provides information about each node connected to the network. To see how
the console nodes on the network are grouped, click on the Utilties option on the System Status Display
menu bar, then click Console Groups Display. The Console Groups Display window (Figure 3-12) will
appear.
The Console Groups Display window is divided horizontally into a section for each console group. The
group number is displayed, followed by a group of icons with node numbers, representing the console
nodes in that group. The console group which includes the local node is e nclosed within a cya n box. Micr oPWC Client nodes are console-type nodes, but are by default members of the console group of their
server. This is represented visually on the Console Groups Display, where Micro-PWC Client icons are
grouped together in boxes following their primary nod e; a black line ind ica te s the r ela tionship be tween the
primary node and its client nodes.
Micro-PWC Features 37
Page 52

Micro-PWC OPERATOR’S MANUAL
Click on the Update button to refresh the window and incorporate any changes to the console group
assignments made since the window was opened. Click on Close to close this window.
Figure 3-12. Console Groups Display
38 Micro-PWC Features
Page 53

Micro-PWC OPERATOR’S MANUAL
4.0 Hierarchical Process Displays
4.1 Overview
This chapter describes the hierarchy of displays that provide the user with process information. This hierarchy consists of Summary, Group, and Point displays. The Micro-PWC also provides the means to create
custom displays which can be used in place of the standard displays. If the hierarchical displays on the
Micro-PWC are different from those described here, it is possible that custom hierarchical displays are in
use on the system. Consult your system administrator for information on local custom displays.
With an Operator Window open, click the Select option on the menu bar of the window. This confers keyboard focus on that window, and causes a pull-down menu to appear, as shown in Figure 4-1.
Figure 4-1. Operator Window Select Menu
Click Summary, Group or Point to display the specified window.
Alternatively, once an Operator Window has keyboard focus, you can press a function key (F2 for a Sum-
mary display, F3 for a Group display, and F4 for a Point display) to access a hierarchical display. After the
function key is pressed, a pop-up window prompts you to enter the index number of the display yo u want to
view. This pop-up window varies with the type of display selected.
Hierarchical Process Displays 39
Page 54

Micro-PWC OPERATOR’S MANUAL
4.2 The Summary Display
4.2.1 Accessing the Summary Display
Pressing F2 or clicking the Summary option causes the window shown in Figure 4-2 to appear.
TC00041A
Figure 4-2. Summary Index Entry Window
The top portion of this window contains an entry box labeled Index.
Below the entry box is a keypad. Enter the desired numbers using the keyboard or by using the mouse to
click the desired index number in the keypad area of the window. Use the B
entries. Click OK to complete the operation.
ACKSPACE key (⇐) to revise
The Summary Index Entry window also contain s a List button. Click List to call up the Select Summary
window (Figure 4-3).
TC00042A
Figure 4-3. Select Summary Window
This window provides a list box which contains a scrollable list of all Summaries configu red on the system.
It also contains an entry box labelled Index. Click an item in the list box to select it. The index number of
that summary will automatically appear in the Index entry box. If desired, this number can be entered or
changed manually by clicking on the entry box, then entering an index number from the keyboard.
To locate a Summary for which only the title (or a portion of the title) is known, en ter the known strin g in the
entry box labelled Title, then click Search at the bottom of the window. The first Summary title containing
an instance of that string will be placed at the top of the list box and highlighted.
To place Summary Display 1 at the top of the list box, click Top.
40 Hierarchical Process Displays
Page 55

Micro-PWC OPERATOR’S MANUAL
4.2.2 Using the Summary Display
A Summary Display provides an overview of 24 groupings of points, arranged in six rows of four blocks,
each representing a group (Figure 4-4). At the top of the screen a legend for the 24 groups is displayed.
The legend can consist of up to 48 characters. There are 1000 Summary Displays available.
TC00043A
Figure 4-4. Summary Display Example
A pushbutton is located in the upper left corner of each block on the Sum m ary Disp l ay ; this pu sh bu tt on
contains the number (1 through 24) of the gro up represen ted by the blo ck. The color of the pushbutton pr ovides information regarding the status of the group, as described in Table 4-1.
Table 4-1. Group Status Conditions
Color Text Status
Red Unack. alarms At least one point in the group is in an alarm state, and the alarm is
unacknowledged.
Yellow (Unack.) At least one point in the group was previously in alarm, and, although the point in
alarm has returned to normal, the alarm has not been acknowledged.
Yellow Alarms At least one point in the group is in an alarm state, and the alarm has been
acknowledged.
Cyan ??? The status of at least one point in the group is unknown because the point cannot
be accessed from the network.
Green [No text] All points in the group are accessible, are in normal state or alarm inhibit state, and
no alarms need acknowledgment.
Gray [No text] If the group has not been configured, the pushbutton appears in gray.
Position the pointer on one of these pushbuttons and click the middle mouse button to cause the contents
of the Operator Window to change directly to the Group Display associated with the pushbutton.
Hierarchical Process Displays 41
Page 56

Micro-PWC OPERATOR’S MANUAL
Alternatively, click on this pushbutton using the left mouse button to display the Group Information window
(Figure 4-5), which provides access to the Group Display or to individual Point Displays.
Figure 4-5. Group Information Window
The Group Information window provides an overview of a group of points, listing both the point name and
the status of each point. From this window, it is possible to go directly to any one of the following displays:
• the Group Display for the group
• the Point Display for any point in the group
• the Graphic Display assigned to the group
• the Trend Display assigned to the group
•the Next or Previous Group Display
The top portion of the Group Information window contains a list of points assigned to the group. The tagname for each point is located on the face of a pushbutton. To the right of each tagname pushbutton is a
field which reports the status of the point. To call up the Point Display for a point in the group, click the button which contains the point’s tagname. To call up the Graphic or Trend display assigned to the Group,
click on the Graphic or Trend button located below the Point information area.
To call up the Group Display, click on the Group button onGroup Information window, or click OK.
To view the Group Display for the previous Group in the Summary Display, click Prev; to view the Group
Display for the next Group, click Next. Wrap is provided between the first and last availa ble groups; groups
which have not been configured are ignored.
Alarms cannot be acknowledged from the Summary Display, nor can they be acknowledged from the
Group Information window. The A
LT-F10 (Window Acknowledge) key has no effect when the window with
focus contains a Summary Display. Alarms can be acknowledged from Group, Point, Graphic and Alarm
Review displays, or from the Mini-Alarm Window.
42 Hierarchical Process Displays
Page 57

Micro-PWC OPERATOR’S MANUAL
4.3 The Group Display
4.3.1 Accessing the Group Display
In addition to access via the Group Information window, it is also possible to call up a Group Display
directly from any Operator Window by selecting the sequence Select > Group. The Group Selection window (Figure 4-6) is displayed.
Figure 4-6. Group Selection Window
To call up a Group Display using this window, enter the Summary Index number, a period (.), and then the
Group Index number in the text entry box labelled Index. The keypad and List button on this display are
identical in function to those used in the Summary Index window (Figure 4-2).
In addition to access via the Group Selection window, you can also call up a Group Display directly from
any Operator Window by selecting Select > Group from the menu bar, or by pressing F3. Either of these
actions will cause a window (Figure 4-6) to be displayed.
4.3.2 Group Display
A Group Display presents operational data for up to eight points or modules simultaneously (Figure 4-7
illustrates a Group Display with four points). Points are assigned to the Group Display according to their
location in the Group Information window. Any module in an instrument database can be assigned to a
group display.
All available process control actions (that is, AUTO, MANUAL, RUN, RESET, and so on) and alarm
acknowledgment for tags in a group can be performed from the Group Display on a point by point basis.
Equal access is available at all times to every display button on every point on the Group Display. It is not
necessary to select a particular point prior to using the control features available for it. Clicking on a button
automatically selects the button and point.
Hierarchical Process Displays 43
Page 58

Micro-PWC OPERATOR’S MANUAL
Figure 4-7. Group Display Configured for Four Points
Although all control features can be used from the Group Display, a point’s parameters must be changed
from its Point Display.
✎ NOTE Operation of the Zoom item on the Group Display menu bar is
identical to that of the Zoom item found on Graphic Displays. See
Section 7.6, The Zoom Menu Item, for further information.
4.3.2.1 Group Legends
At the top of the Group Display is a Group Legend of up to 48 characters. The main area of the display is
divided into four, six or eight blocks; the information within each block relates to one point. There are
24,000 Group Displays available.
4.3.2.2 Point Tagnames
At the top of each point’s block on the Group Display is a button which contains the first 12 characters of
the point’s tagname. If the tagname is longer than 12 characters, the last (twelfth) character displayed in
the tagname is a tilde (~). Click this button to call up the Point Display for that tagname in the Operator
Window. (Th e complete tagname appears on the point display.)
✎ NOTE Not all Micro-DCI hierarchical displays include point legends.
Consequently , while ther e is space for th ese fields on the Point and
Group displays, these fields may be blank on the Micro-PWC.
44 Hierarchical Process Displays
Page 59

Micro-PWC OPERATOR’S MANUAL
4.3.2.3 Status Area
Each point on the Group Display contains a Status area, located directly below the point description (Fig.
Figure 4-8). The status area is composed of two lines and an indicator area.
Figure 4-8. Tagname and Point Status Areas from a 6 Point Group Display
4.3.2.3.1 Status Messages
Point status messages are displayed in the firs t l ine of the Status Area. Dep end ing on th e type of p oint displayed, this message can be an alarm or other condition of the point. The area number is displayed to the
right of the alarm status descriptors.
4.3.2.3.2 Mode Message
The second line of the S tatus Area indicates the current mode of the point; e.g., Auto or Man.
4.3.2.3.3 Alarm Indicator
In addition to a status message and mode, each point’s Status Area contains an ACK [Acknowledge] button, located on the left side of the area. This button ap pears when an un acknowledged alarm exists for the
point. The color of the button reflects the current status of the point:
• red for hihi or lolo alarm
• yellow for hi or lo alarm
• green for normal
Click ACK to acknowledge the alarm or, if the Operator Window containing the alarm indicator has keyboard focus, press A
LT-F10 on the keyboard to acknowledge all points in the group which are in alarm.
If no unacknowledged alarms exist for the point, the ACK button is not visible.
4.3.2.4 Process Display Area
Directly below the status area for each point on the Group Display, the process display area is arrang ed in
one of several forms, according to the type of module being described.
Analog points are displayed in a form which includes a process bar in the process display area . The length
of the process bar corresponds to the value of the Process Variable (PV) atom and is displayed as a percentage of full scale; the upper and lower limit s of the rang e of the Process Variable are reflected in the values at the top and bottom of the scale located at the left of the pr ocess bar. These limit s are presen ted in a
fixed precision format, with one digit to the right of the decimal point.
Below the process bar, the data displayed includes the values of the Process Variable for all types of analog points, the value of the Setpoint and setpoint controls (if applicable), controller output indicator, the
value of the Output, and output controls (if applicable). The number of digits used to display a value
(including the decimal point) and the size of the group d isplay (whether it is configu red for four, six, or eight
Hierarchical Process Displays 45
Page 60

Micro-PWC OPERATOR’S MANUAL
points) can affect the appearance of the display. There are no restrictions on the number of digits which
can be configured to display a value; however, if the format contains too many digits, part of the displayed
value may overlap onto the portion of the screen occupied by the adjacent point’ s display . To avoid this, the
combinations of points and formats shown in Table 4-2 are recommended:
Table 4-2. Recommended Point and Format Combinations
Points Formats
4 point group display 9 digits (including decimal point)
6 point group display 6 digits (including decimal point)
8 point group display 4 digits (including decimal point)
If control of the Setpoint or Output are available for the point, a button cont aining the legen d SP or OUT will
appear to the left of the Setpoint or Output value. Clicking one of these buttons will cause a Value Entry
window to appear. This window will contain an entry box and keypad display, such as the one shown in
Figure 4-9. Enter the desired value for the Setpoint or Output value in the entry box (using either the pop-
up keypad or the keyboard), then click OK or press E
NTER to complete the operation.
TC00048A
Figure 4-9. Value Entry Window
4.4 Process Control Functions
Control functions provide the ability to monitor individual process variables and devices, and provide the
ability to perform manual and automatic mode device control. Process information is received in reports
from function configured in a controller module. The control ability allows changing process conditions from
the Micro-PWC by initiating changes to the controller. A controller receives input from and sends output
signals to the process through termination units connected to process devices and stations.
✎ NOTE Control abilities can be limited to specific personnel by defining
password security. The security level of a user must give control
access rights before any control can be initiated.
4.4.1 Dynamic Faceplates
Dynamic faceplates for the different types of function codes can be either standard or user created. Standard control faceplates are provided. A control facepla te can be a fixed part of a display or it can be called
as a pop-up faceplate. The same control actions can be performed from a fixed faceplate as can be performed from a pop-up faceplate. This assumes that the symbol file used for the fixed faceplate is also the
46 Hierarchical Process Displays
Page 61

Micro-PWC OPERATOR’S MANUAL
same one used for the pop-up faceplate, or the pop-up faceplate, if different, has all the same capabilities
as the fixed faceplate built in. When a group is opened the operator has control access to all of the faceplates within the group.
• To access control faceplates from control graphics click a control pushbutton.
• To access faceplate from a group information window click the tagname on the left side of the
window. Faceplates pro vid e access to point displays for the tags that they control.
• To access a point display click the tagname button at the top of the faceplate.
4.5 Control Faceplates
Control faceplates provide access to control function within a module. The access can be used to manually
initiate process changes and to monitor the results of both automatic and manual control operations. Automatic refers to operation being performed under controller execution. Manual refers to those actions initiated after taking a function out of automatic control. Refer to the appropriate control system manual for
detailed descriptions of the associated control faceplates.
Hierarchical Process Displays 47
Page 62

Micro-PWC OPERATOR’S MANUAL
4.6 The Point Display
4.6.1 Accessing the Point Display
A Point Display can be accessed by one of several methods:
1. From a Group Display, click the tagname pushbutton of the desired point (Figure 4-9).
2. From the Group Information window of a Summary Display (Figure4-5), click the tagname
pushbutton of the desired point.
3. From the Alarm Review display, click the Vector pushbutton (labelled V) on the line containing
the desired point.
4. From the Operator Window menu bar, select the sequence Select > Point. The Enter Tagname
window (Figure 4-10) will appear . Type the tagname of the point using the Micro-PWC
keyboard. Alternatively, to access a video version of the keyboard, click the U
pushbutton. The video keyboard will be displayed. Press E
operation.
5. From the Micro-PWC keyboard, press F4. The Enter Tagname window (Figure 4-10) will
appear. Enter the tagname as described in Method 4 above.
P ARROW
NTER or click OK to complete the
Figure 4-10. Enter Tagname Pop-up Window
If a Point Display is accessed from a group (i.e., by Method 1 or Method 2), the Point Display for the next
point in the group can be accessed by using the P
previous point in the group can be viewed using the P
between the first and last points.
AGE DOWN key or the Page Down menu item. Similarly, the
AGE UP key or the Page Up menu item. Wrap occurs
4.6.2 Point Display Appearance
The Point Display provides detailed information for a point in the global database, including information not
shown on the group display. In addition, a point’s parameters can be changed from the Point Display.
Although the appearance of a Point Display varies according to the module type, the Point Display for
every module type will contain the following components, as shown in the Point Display for an ANI module
(Figure 4-11).
✎ NOTE Operation of the Zoom item on the Group Display menu bar is
identical to that of the Zoom item found on Graphic Displays.
See Section 7.6, The Zoom Menu Item, for further information.
48 Hierarchical Process Displays
Page 63

Micro-PWC OPERATOR’S MANUAL
Figure 4-11. ANI Module Point Display
4.6.2.1 Tagname
The Point tagname appears in the upper lef t corner of the Point Displa y. The full tagname (up to 16 characters) is shown.
4.6.2.2 Legend
Legends are currently not supported in Micro-DCI instruments.
4.6.2.3 Status Area
The Status Area appears below the tagname and legend areas. This area is nearly identical to the Group
Display status area described in Section 4.3.2.3, Status Area.
The second and third lines of the status message area contain the alarm status of point and mode messages, respectively. These lines function as described for the Group Display.
The alarm indicators function as described for the Group Display.
4.6.2.4 Param Pushbutton
The Param pushbutton appears near the top right corner of the Point Display. Click on this pushbutton to
view the Parameter window.
The Parameter window allows you to change the parameters for the point. The Parameter window contains a numbered list of parameters. The contents of this list is different for each module type; typical
parameters include items such as alarm limit and deadband values and instrument ranges. If the list contains more than ten parameters, the vertical scroll bar must be used to view the additional parameters.
Hierarchical Process Displays 49
Page 64

Micro-PWC OPERATOR’S MANUAL
Each entry in the list contains the atom name, description, and current value of a parameter. A new value
for a parameter can be entered in the text entry b ox which appea rs at the rig ht side of each lin e. Keyboard
focus can be moved from one entry box to another by using the U
E
NTER key, or by clicking on an entry box.
P and DOWN ARROW keys, by pressing the
4.6.2.5 Info Pushbutton The Info pushbutton appears at the top right corner of the Point Display. Click this pushbutton to view the
Info window.
4.6.2.6 Process Display Area
The rest of the Point Display is called the Process Display Area. The information shown in the Process Display Area is determined by the Module Type.
The Process Display Area for all analog Module Types is similar to that for an ANI module (Figure 4-11
provides an example). On the lower right side appears the same information shown on the Group Display
(value bar, alarm bar, control buttons, etc.). To the left of that information appears a current trend display,
which plots the process value of the point against time, every second, for up to two minutes. This trend
begins plotting only when the Point Display is called up, and is not configurable. Current Trends are not
stored (see Section 6). The current process value is shown, digitally, above th e trend and to the right of the
status area.
✎ NOTE The Process Display Area for the CON module provides current
trends for three values: the Process Value (PV), the Setpoint (SP),
and the Output (OUT). Each trace can be toggled on or off
individually, using buttons found below the Process Display Area.
50 Hierarchical Process Displays
Page 65

Micro-PWC OPERATOR’S MANUAL
5.0 Logs
5.1 Introduction
A log is used to collect and format data for use in reports and spreadsheet calculations. Two types of
group-wide logs are available on the Micro-PWC:
• Event Logs
• Spreadsheet Logs
Logs are distributed to all Micro-PWCs in the same console group.
Event logs are used to examine the Historical Database and create list s of all events which occurred within
a specific time span.
Spreadsheet logs are used to obtain data from, change, and put dat a into the Globa l database, a nd to load
the data into spreadsheets, allo wing you to format, st ore, and perform calculations us ing live process dat a.
Spreadsheet log configuration is perfo rmed using Microsoft
Spreadsheet logs are synchronized on a console group basis; that is, a spreadsheet log can be configured
or changed on any Micro-PWC in a console group, and the resulting changes will be copied to (synchronized with) all other Micro-PWCs in that console group, regardless of system type. This practice permits
backup of the information from any node. Note that only the configuration data which correspond s to the
type of spreadsheet on the local node (i.e., Microsoft Excel) will be useful locally.
®
Excel.
✎ NOTES Logs are sent to a printer device when generated. If a “printer” has
been configured with a Device Type of “File” (see the Micro-PWC
Configuration Guide, or your system administrator), logs configured
to print to that printer will actually be sent to that file, rather than to
an actual hard copy printer.
Printers used to print scheduled logs must support PostScript.
Logs 51
Page 66

Micro-PWC OPERATOR’S MANUAL
5.1.1 Accessing Log Print
Log Print is accessed by using the menus available from the System Window Menu button. Select Menu >
Print Log. The window shown in Figure 5-1 will appear.
Figure 5-1. Log Print Window
The available options (Process Summaries, Event Logs, and Spreadsheet Logs) are associated with radio
buttons located at the top of the Lo g Print window. By default, the Process Summar ies log type is selected.
To change the type of log to be printed, click the radio button associated with the desired log type.
A list box appears below the Log Type buttons. The Log Name of each log configured (if any) for the
selected Log Type will appear in the list box. Use the scroll bars to view log names which extend beyond
the viewing area of the list box.
At the bottom of the window, in addition to the usual Close and Help buttons, is a button labelled Print,
used to print logs.
52 Logs
Page 67

Micro-PWC OPERATOR’S MANUAL
5.2 Event Logs
Event logs are used to obtain information about events which occurred in the Historical Database within a
specified time span. T o select event logs for printing, click the Event Logs radio button, located at the to p of
the Log Print window.
5.2.1 Print Event Logs
The Print button on the Log Print window allows the user to print event logs on demand. First select the
desired log from the list box by clicking on it; it will be highlighted. Next, click Print to display the Print Log
window (Figure 5-2).
TC00210A
Figure 5-2. Print Log Window (Event Logs)
The name of the Event Log appears first in the window, followed by the Start Time button. The time and
date displayed on the face of this button indicate the earliest time and date to be used for messages
included in the Event Log. The default starting time is 19 :00:00 31-DEC-69; to change this, click the b utton.
A pop-up window appears, containing an entry box and the prompt:
Enter Start Time (HH:MM:SS DD-MMM-YY):
Enter the desired starting time in the indicated format. Note that the 24 hour clock is used, and the month
is identified by the first three letters of the month name. Click OK to complete the operation.
Similarly, the second item on this window is the End Time button. The time and date displayed on th e face
of this button indicate the latest time and date allowed on messages to be included in the Event Log. The
default End Time is the current time and date.
The third item on this window is the Device button. If a device has been selec te d, the na m e of the device
is displayed to the right of the Device button. Click this button to display the Printer Selection window.
Highlight the desired printer by clicking it, then click OK to complete the selection operation.
Logs 53
Page 68

Micro-PWC OPERATOR’S MANUAL
5.3 Spreadsheet Logs
Spreadsheet logs are used to obtai n data from, chang e, and put dat a into the Global dat abase. The dat a is
loaded into spreadsheets, allowing the user to format, store, and perform calculations on live process data.
The spreadsheet logs are accessed by selecting the Spreadsheet Logs ra dio button, located on the Log
Print window (Figure 5-1). The list box in the Log Print window will list all Spreadsheet Logs which have
been configured on the network.
The package used to perform the Micro-PWC Spreadsheet Log Configuration is Microsoft EXCEL.
5.3.1 Print Spreadsheet Logs
The Print button on the Log Print window allows the user to print logs on demand. Click this button to display the Print Log window (Figure 5-3).
Figure 5-3. Print Log Window (Spreadsheet Logs)
The first item on this window is the log name. Below the log name is the Device button. If a device has
been selected, the device name will be displayed to the right of the Device button.
Click Device to display the Printer Selection window. Highlight the desired printer by clicking it, then click
OK to complete the selection operation, or click Cancel to exit without changing the device selection.
5.3.2 Clearing the Recovery Log Notify Window
A Recovery Log Notify window will appear when an attempt is made to print a spreadsheet log if the log
was previously printing (or open for edit) when Excel was terminated abnormally. To stop this window from
appearing each time the log is requested to print (or opened for edit), go into Log Configuration.
Log Configuration, which is discussed in the Micro-PWC Configuration Guide, is accessed by selecting
Menu > Configure > Logs from the System Window. Attempting to edit the spreadsheet log will cause the
Recovery Log Notify window to appear. To prevent this window from appearing every time an attempt is
made to print or edit the log, select the log's filename and select the Remove Recovery File option in the
window, then click on OK. After the spreadsheet is loaded, save the spreadsheet. If the spreadsheet is
not saved, the Recovery Log Notify window will continue to appear each time an attempt is made to print
(or load) the spreadsheet.
54 Logs
Page 69

Micro-PWC OPERATOR’S MANUAL
6.0 Trend Displays
Three types of trend recording are available on the Micro-PWC:
• Current Trending
• Historical Trending
• Archival Trending
The current, historical and archival trending functions display the values of one or more points in an an alog
trend format similar to that presented by a conventional strip chart recorder.
A current trend for each point appears as a part of the point display. Current trends are not configurable,
and are not stored. Current trending for a point exists only when the point is on display. Refer to Section
4.0, Hierarchical Process Displays, for a discussion of Hierarchical Displays, including point displays.
Long term trending is handled separately and is available in two forms:
• Up to 10,000 (network-wide) historical trend displays are available on the Micro-PWC. The
configuration of these trends can be performed on any Micro-PWC, and then distributed to all
other Micro-PWCs within the same console-group. See the Micro-PWC Configuration Guide
for details on the trend configuration procedure.
• The Archive Database utility permits Historical data and Historical Block data to be transfe rred
to a removable storage media, creating a permanent record which can be retrieved and
displayed at a later date as the Archival (or Archival Block) database. Data from more than
one Archive tape can be restored; this material does not overwrite existin g archival data, but
rather is added to the existing data to become a part of the Archival Database. By clicking a
single button on a Trend display, the Archival Database can be specified as the data source,
providing access to Archival Trends for the points configured on the trend display.
Any point that exists in the Historical Database and which can be converted to a numeric value can be
trended.
Except for the text in the Database Select button, which indicates which database is being viewed
(HISTorical or ARCHival), the Archival Trend Display format is identical to that of the Historical Trend Dis-
play. This section details the use of the Trend Display.
To call up a Trend display, an Operator Window must be open and have keyboard focus. Click Select >
Trend (Figure 6-1). Alternatively, press the T
REND key on the keyboard.
Trend Displays 55
Page 70

Micro-PWC OPERATOR’S MANUAL
Figure 6-1. Selecting the Trend Option
A pop-up window will appear, which contains an entry box and numeric keypad.
Figure 6-2. Trend Index Entry Window
To enter the index num ber of the trend to be configur ed, click on the displayed keyp ad numbers or click the
entry box and then enter the trend index number via the keyboard. The
sponds to the B
ACKSPACE key on the keyboard.
LEFT ARROW on the keypad corre-
Trends can also be accessed using the List button on the Trend Index Entry window. Click List to display
the Select Trend window (Figure 6-3), which contains the number and (if assigned) the legend for all con-
figured trends.
56 Trend Displays
Page 71

Micro-PWC OPERATOR’S MANUAL
TC00059A
Figure 6-3. Select Trend Window
The Select Trend window allows the user to select the trend in a number of different ways.
A trend can be selected from the list by first clicking the trend name to select and highlight it, then complete
the selection process by clicking OK. The desired trend will appear, similar to the example in Figure 6-4. If
the name of the desired trend is not visible, additional pages of the lis t can be viewed by clicking the U
D
OWN ARROWS to the right of the list box.
If the trend index number is known, enter the number in the entry box labelled Index, then click OK. The
desired trend will be displayed.
If the trend name, or a portion of it, is known, enter the known string in the entry box labelled Title, then
click Search. The first instance of a trend name cont aining that string will be displayed in the top line in the
list box, and will be highlighted. Complete the selection process by clicking OK.
To return to the top of the list, click the Top button. The first item in the list will appear at the top of the list
box.
Once selected, a trend display will appear, similar to the example in Figure 6-4.
P and
Trend Displays 57
Page 72

Micro-PWC OPERATOR’S MANUAL
Figure 6-4. Trend Display Example
58 Trend Displays
Page 73

Micro-PWC OPERATOR’S MANUAL
6.1 Trend Display Format
A Trend Display consist s of numerous parts, each of which is described in detail in the following paragraphs. Briefly, the central area of the display is a Trend Graph containing colored traces which represent
up to eight trendable variables.
Above the Trend Graph are eight sets of three buttons each, one set per trace. These buttons are used to
manipulate individual traces or to replace the default range of the Trend Graph with the range for an individual trace. Below the Trend Graph are additional buttons; these buttons, which include the
Compression, Zoom, Reset, Pause, and Segment buttons, affect all traces on the trend graph equally.
✎ NOTE The Zoom item on the Trend Display menu bar operates
independently of the Zoom button on the Trend Display itself, which
is described in Section 6.1.13, Zoom/Unzoom Button. Operation of
the menu bar Zoom is identical to that of the Zoom item found on
graphic displays, as described in Section 7.6, The Zoom Menu
Item.
6.1.1 Trend Graph
The Trend Graph p or tion o f th eTrend Display occupies the lower two thir ds of th e Operator Window. Up to
eight process variables can be displayed graphically as traces plotted on the Trend Graph. The vertical
axis represents the percentage of display range, while the horizontal axis depicts the time base in minutes.
Each process variable is plotted on the graph in a different color.
Using the Trend Readout arrow (displayed at the top of the Trend Graph), the operator can point to any
display value of a process variable on the graph. See Section 6.1.3, Trend Readout Arrow, for detailed
information on this item.
6.1.2 Time Base and Size of Display Window
The displayed time base of a trend display is separated into five sections, and is based on segment size.
Segment size is a user-configurable parameter, and is determined by the values entered to define the
number of SECONDS and the number of POINTS in a segment. The POINTS referred to here should not
be confused with the Historical Database point(s) for which values are being collected; rather, POINTS are
the values collected for the Historical Database point, which then become POINTS plotted as a trend trace.
(See the Micro-PWC Configuration Guide for details on trend configuration.) By default, the number of
POINTS and the number of SECONDS are both set to 60, and display as five 1 minute intervals (segments) on the Trend Graph.
The Micro-PWC locates the points which lie within each time interval. If one point is found, the value of the
point is used to plot it on the trend display. If more than one point exists within the interval, the assigned
Display Option (MINimum, MAXimum, AV eraGe , or INSTantaneous) is used to calculate one value from all
points which exist in the interval. This value is then plotted on the trend display. (If the INSTantaneous Display Option is used, the last value found will be used to plot the point on the Trend Graph.) The resulting
value is used to plot the point on the trend display. If no points are found in an interval, no point is plotted
for that interval.
This method of plotting trends permits greater flexibility in trend configuration. For example, points with different collection rates can be plotted on the same trend graph, and non- period ic dat a ca n also be trende d.
6.1.3 Trend Readout Arrow
The Trend readout arrow enables the operator to determine the collection time and value at any point
where the arrow intersects with the horizontal axis of the graph. TheTrend Readout arrow is controlled by
the L
EFT ARROW and RIGHT ARROW buttons, which bracket the Time At Arrow button, located above the upper
Trend Displays 59
Page 74

Micro-PWC OPERATOR’S MANUAL
right corner of the Trend Grap h. Clicking either of the se A
RROW buttons causes the Trend Readout arrow to
move along the top of the T ren d Gra ph in th e in dicated di rection. Each time the button is clicked, the point
of intersection between the Trend Readout arrow and th e Trend Graph moves (in the d irection sele cted) to
the next valid location of a collected value on the display.
6.1.4 Time at Arrow Button and Arrows
The Time at Arrow button displays the specific time and date toward which the Trend Readout arrow is
pointing. The format used is HH:MM:SS DD-MMM-YY. This allows the operator to be precise when interpreting the data on the Trend Display. (When the display is refreshed, the arrows shift along with the trace
so that the display of the value for the time selected by the operator is maintained.)
To move the Trend Readout arrow to point to a new time and date, click on the Time at Arrow button. A
pop-up window appears (Figure 6-5) which contains an entry box and prompts for a new time and date.
(The Trend Readout arrow cannot be moved to a time prior to the beginn ing of a trend.)
TC00060A
Figure 6-5. Time Entry Window
The new time and date can be entered in the format shown (HH:MM:SS DD-MMM-YY). If a field is omitted
during entry, that field will default to the value used in the current Time at Arrow. (An exception to this rule
is the seconds (SS) field, which always defaults to 00 if no value is entered for the field.)
For example, if the current Time at Arrow is 10:17:32 30-JUN-05, then entering:
15-
will cause the Trend Readout arrow to move to 10:17:00 15-JUN-05.
It is also possible to move to a new time relative to that of the current Value at Arrows. To do so, prefix the
number to be shifted with a plus or minus to indicate in which direction the movement is to take place. For
example, to move the Trend Readout arrow to the point on the Trend Graph which is 10 minutes prior to
the current location, enter:
-:10
To move the Trend Readout arrow to the location five minutes after the current location, enter:
+:5
6.1.5 Trace On/Off Button
A set of three buttons is provided on theTrend Display for each of the eight possible trac es. The first button
in each set is the Trace On/Off button, which displays the index number of the associated trace and contains an ON/OFF indicator. The ON/OFF indicator is a red dot which is displayed when the trace is ON.
The indicator is not visible when the trace is OFF. Click the Trace On/Off button to cause the trace to toggle between the visible (ON) and invisible (OFF) states.
Each trace can be configured to be ON (visible) or OFF (invisible) by default when the trend is initially displayed. (The Micro-PWC Configuration Guide provides details on the configuration procedure.)
60 Trend Displays
Page 75

Micro-PWC OPERATOR’S MANUAL
6.1.6 Display Option Button
The Display Option button is the second of the three buttons associated with each trace. The Display
Option button allows you to select the option which determines the form in which data is to be presented
for that trace on the Trend Graph. These options include MINimum, MAXimum, AVeraGe, and INSTantaneous.
If MIN, MAX or AVG is selected, the data collected during the collection interval will be used to calculate
the value plotted on theTrend Graph . If INSTantaneous is selected, the actual value of the data at the time
of collection will be used to plot the value on the Trend Graph.
Click on the Display Option button to move through the choices. The face of the button will reflect the
current choice in effect.
6.1.7 Trace Scale Button
The Trace Scale button is the third button in the set of three associated with each trace. The face of this
button indicates the color in which the trace is displayed. Click this button to change the Scale Bar Limits of
the Trend Graph to reflect the specific High and Low limits for the associated individual trace. The new
Scale Bar Limits will be displayed in the same color as the trace with which they are associated. To restore
the original Scale Bar Limits, click Trace Scale a second time, or click Reset (see Section 6.1.14, Reset
Button).
6.1.8 Trace Tag and Atom
The tagname and atom of the Historical Database point which is being trended appear to the right of the
Trace Scale button.
6.1.9 Value at Arrow
To the right of the trace tag and atom is a value which represents the Value at Arrow. This is the value of
the Historical Database point trended by this trace at the time indicated by the location of the Trend
Readout arrow.
6.1.9.1 Value Precision Indicator
Due to differences in collection rates, it is possible that no point was collected on the precise point in time
indicated by the Trend Readout arrow. In this case, the value displayed is an interpolated value. The value
actually shown may have been collected slightly before or after the point in time indicated by the Trend
Readout arrow. The Value Precision Indicator is a one-character field which follows the Value at Arrow.
The character displayed here provides information regarding the precision of the value:
x Indicates a precise, actual value is displayed.
< Indicates that the time-st amp of the value displa yed is actu ally prior to (old er
than) that indicated on the Time at Arrow button (see Section 6.1.4, T im e at
Arrow Button and Arrows); or the Micro-PWC is unable to interpolate the
value.
> Indicates that the time-stamp of the value displayed is actually after (newer
than) that indicated on the Time at Arrow button (see Section 6.1.4, T im e at
Arrow Button and Arrows).
i Indicates an interpolated value, calculated using the closest values before
and after that indicated on the Time at Arrow button.
Trend Displays 61
Page 76

Micro-PWC OPERATOR’S MANUAL
6.1.10 Database Select Button
The Database Select button allows you to toggle between the Historical and Archival databases when
viewing trends. To do so, click this button. The text on the face of the button will change to reflect which
database (HISTorical or ARCHival) is in use.
Remember that the Archival Database does not exist until Archival database data has been restored from
the archive media, as described in Section 11.4.2, Archive Historical Block Data.
6.1.11 Info Button
The info button provides access to information on all traces configured on the Trend Display. Click this
button to display the Trend Info window for the trend(s) currently on display. While the format of the infor-
mation presented may vary slightly, depending on the kind of point being trended, the same type of information is provided for most points, including:
• Historical Database Tagname
• Range for the point
• Time-stamps of the first and last sample
• Controller tagname and atom
• Collection rate
• Storage rate
• Collection option (MIN, MAX, AVG, INST)
• Identity of node from which the point data was collected
• Identity of node on which the collected data was stored
• Historical database legend for the point
(If no Historical Database legend has been configured for the point, the Micro-PWC will use
the point legend configured in the server; if no legend has been configured there, no legend
will be displayed.)
6.1.12 Compression Button and Arrows
The compression ratio is the ratio between the current segment size and the configur ed segment size. The
current compression ratio in use is displayed on the face of the Compression button; for example, 1:1.00
(one point to one second).
The Compression button is located in the lower left corner of theTrend Display, below the T rend Graph. A
D
OWN ARROW is located to the left of the Compression button, an UP ARROW is on the right. The current com-
pression ratio in effect is displayed on the face of the Compression button. Click the U
raise or lower the compression ratio to a predefined ratio. Predefined ratios are:
1:0.10
1:0.25
1:0.50
1:1.00
1:2.00
1:5.00
1:10.00
1:20.00
1:50.00
P or DOWN ARROW to
62 Trend Displays
Page 77

Micro-PWC OPERATOR’S MANUAL
In the above list, the Compression Value is shown to the right of the colon. To enter a new compression
value directly, click the Compression button. A pop-up window (Figure 6-6) appears. This window contains an entry box, and OK and Cancel buttons.
TC00061A
Figure 6-6. Compression Value Entry Window
Click the entry box to call up the text entry cursor, then enter the compression value to be used. Click OK
to complete the operation. If the value entered is outside the range (0.05 to 50), the following error message will be displayed:
Value not in range
(0.05 - 50.00)
Click OK to close the pop-up. Also, if the combination of the segment size configured for the trend and the
Compression Value entered will result in too many points being plotted in a segment, the following error
message will be displayed:
Segment size too large
Click OK to close this error window, and enter a lower compression value. This condition can occur when
the configured segment size is larger than the default segment size (60 seconds).
Caution must be exercised when interpreting data displayed on a compressed display. By experimenting
with viewing the same trend display using a number of different compression ratios, it is easy to see that
although all the displays are correct representations of the compressed trend data, the traces displayed
may be deceiving if not viewed with care.
When the display options MIN, MAX, or AVG are in effect, rem ember that th e values of the point s betwee n
the displayed points could have varied widely. Even when INSTantaneous is the display option in effect, a
compressed display can be subject to misinterpretation. (The examples which follow in this section illustrate how this is true for instantaneous values.)
When viewing a compressed trend display of process variables, the value of which repeat over time, be
especially careful. “Aliasing” can cause the trace for the signals to appear as a straight line, as a magnified
duplicate of the original trace, even as a mirror image of the original trace.
To see the reason for the generation of these possibly misleading traces, the way in which compressed
displays are “drawn” must be considered. Every nth sample is plotted on the graph as a point, and the
points are connected by straight lines. There fore, the position of the extracted points along the original
trace will affect the shape of the trace on the new compressed display . For example, if an Historical trend is
Trend Displays 63
Page 78

Micro-PWC OPERATOR’S MANUAL
established to display a periodic signal which repeats every 60 seconds, and a collection rate of 10 seconds is configured, then the display will show six points per period of the signal (Figure 6-7).
Figure 6-7. Original Waveform
If this trend is compressed six times, the display will show only every sixth sample. The resulting display
will be a straight line since every sixth sample has the same value (Figure 6-8)
Figure 6-8. Compressed Waveform - 6:1 Compression
If the display is compressed seven times, the resulting display will be identical to the original, since the
value of the eighth sample (first sample plus 7) is the same as the value of the second, the value of the fifteenth point is the same as the value of the third, and so on. (Figure 6-9).
Figure 6-9. Compressed Waveform - 7:1 Compression
If the display is compressed five times, the resulting display will be the mirror image of the original waveform (Figure 6-10).
64 Trend Displays
Figure 6-10. Compressed Waveform - 5:1 Compression
Page 79

Micro-PWC OPERATOR’S MANUAL
6.1.12.1 Tre nd Compression Speed Factors
There are several factors which affect the amount of time necessary to perfor m trend compression. The
most important factor is the amount of data to be processed. To a lesser extent, both the location of the
data with respect to the location of processing, and the speed of the Micro-PWC performing the processing, have a measurable influence.
Trend compression time is base d on the amo unt of dat a tha t is processed. If all point s on the trend disp lay
contain the same amount of data to be compressed, each will take the same time to compress. However, it
is possible to have points with different densities displayed on the same trend (e.g., the trace from Pen 1
reflects data collected at 1 second intervals, while the trace from Pen 2 reflects data collected at 5 minute
intervals). When this situation exists, extra care is needed when comparing compression times.
Where trend compression is a common operation, it is better to do the compression in the Historical Database, in which case it is done as a background task. This is done via the configuration of the Historical
Database points, where the periodic collection rate (1 second, 2 seconds, etc.), the storage rate option
(1, 2, 5, etc.), and the collection option (minimum, maximum, average, or instantaneous value) are configured. (Historical Database configuration is discussed in the Micro-PWC Configuration Guide.)
Briefly , these configuration options make it possible to do much of the compression within the Historical
Database. For instance, an initial compression ratio of 10 to 1 can be achieved within the Historical Database by storing a value that is the average of 10 collection samples (collected at one second), and displayed on a Trend Display so that one value is displayed for each point on the plot. Subsequent
compression of the Trend Display using a compression ratio of 1:50 will be much faster, and will yield
exactly the same trace as that displayed when averaging of all collection samples and compression (u sing
a 1:50 compression ratio) are performed via the T rend Displ ay. By storing a value that is the average of 10
samples, the total amount of data extracted from the Historical Database and averaged is one tenth of
what would be required if every sample were stored and averaged on the Trend Display.
When the Micro-PWC on which the Historical Database dat a is stored is d if ferent from the M icro-PWC that
is controlling the Operator Window which contains the Trend Display, the data must travel across the system (ethernet) network in order to be displayed. This can cause a noticeable delay when there is a large
amount of data to be transferred. It can take more than twice as long to compress a large trend under
these circumstances. Using the Historical Database configuration to perform data compression as
described above and thus transferring less data across the network becomes even more important under
these circumstances.
The speed with which trend compression is performed is also affected by the speed of the Micro-PWC
computer being used to view the Trend Display. The processing speed of the Micro-PWC computer is
affected both by the load placed on the CPU and the type of hardware in which the Micro-PWC sof tware is
installed. Consult your system administrator if yo u have any questions about the hardware platform in use
at your site.
6.1.13 Zoom/Unzoom Button
Use the Zoom/Unzoom button to enlarge a portion of the Trend Graph by choosing two opposing corners
of a rectangular area which is to be enlarged. The chosen section will then be resized to fill the entire area
of the Trend Graph.
To use this feature, click the Zoom button. A prompt appears above the upper left corner of theTrend
Graph:
Select the first zoom point:
Trend Displays 65
Page 80

Micro-PWC OPERATOR’S MANUAL
Position the pointer and click the point which will serve as the first corner of the rectangle. The prompt
changes to:
Select the second zoom point:
Move the pointer to the location which is to serve as the opposite corner of the rectangle; a white outline
appears to illustrate the area which will be enlarged. Click the second zoom point. The area so defined is
enlarged to fill the entire Trend Graph, and the Zoom button changes to read Unzoom.
To return the Trend Graph to its original state, click Unzoom.
✎ NOTE The Zoom item on the Trend Display menu bar operates
independently of the Zoom button on the Trend Display itself.
Operation of the menu bar Zoom item is identical to that of the
Zoom item found on Graphic Dsplays, as described in Section 7.6,
The Zoom Menu Item.
6.1.14 Reset Button
The Reset button is used to return the T rend Display to its original state, as it appeared when the display
was first called up. For example, if the Trace Scale button has been used to change the Scale Bar Limits
to those of the T race High and Trace Low for a p articular trace, click Reset to return the Scale Ba r Limit s to
the original settings for the display.
Reset can only be used to return to the initial settings of the Trend Display currently on view. Reset cann ot
be used to reset a change made via the Database Select button (described in Section 6.1.10), which
allows the user to change from Historical to Archival trends, and vice versa.
6.1.15 Pause/Resume Button
The text on the face of the Pause/Resume button indicates the state which will occur when the button is
clicked. Clicking this button when it reads Pause will cause the screen to stop updating, effectively freezing
the display for reading and analysis; the text on the button changes to Resume.
Clicking this button when it reads Resume causes the display to resume updating.
6.1.16 Segment Button and Arrows
The Trend Graph is di vided into five segments (see Section 6.1.2, Time Base a nd Size of Display Window )
The Segment button is located in the lower right corner of the Trend Display, and is flanked by both a dou-
ble arrow and a single arrow button on either side.
Click on one of the single arrow buttons to shift the Trend Display one segment in the indicated direction.
Click on one of the double arrow buttons to shift the Trend Display four segment s in the indicate d direction.
Note that the Trend Display is actually composed of 5 segments; one segment is used for overlap when
using the double arrow buttons.
The face of the Segment button displays the curr ent segment nu mber and the tot al number of segme nts in
the following format:
S. nnnn of tttt
where S. stands for Segment, nnnn is the number of the segment which currently contains the Trend
Readout arrow, and tttt is the total number of segments available.
66 Trend Displays
Page 81

Micro-PWC OPERATOR’S MANUAL
To go directly to a particular segment, click on the Segment button. A pop-up window (Figure 6-11)
appears. This window contains an entry box, and OK and Cancel buttons.
Figure 6-11. Segment Number Entry Window
Click on the entry box to call up the text entry cursor, then enter the number of the segment to be displayed. Click OK to complete the operation.
Trend Displays 67
Page 82

Micro-PWC OPERATOR’S MANUAL
68 Trend Displays
Page 83

Micro-PWC OPERATOR’S MANUAL
7.0 Using Graphic Displays
7.1 Introduction
This section describes the use of graphic displays on the Micro-PWC, including:
• Accessing graphics
• Control through graphics
• Display vectoring
There are 10,000 graphic displays available on the Micro-PWC. Graphics are configured (by the user) to
display process values, to allow for process values to be changed, and to provide a graphical representation of the process. A typical graphic, such as the example in Figure 7-1, contains a pictorial represent ation
of a section of the process in a plant, using symbols, bars, lines, text, and so on. All of the graphical objects
used in the group and point displays (such as pushbutton s, sliders, bargraphs, and tren ds) can be used on
graphics.
TC00063A
Figure 7-1. Typical Graphic Display
Values (such as temperatures, pressures, and alarm states) from the plant process can cause changes to
text, colors, or shapes on a graphic. Values are updated every second in the Operator Window which has
keyboard focus. In all other Operator Windows, updates occur every two seconds.
A graphic can contain pushbuttons and other objects which allow user interaction via the mouse and keyboard. For example, a graphic may contain a pushbutton with the label ACK, which appears when a point
Using Graphic Displays 69
Page 84

Micro-PWC OPERATOR’S MANUAL
goes into alarm and which, when clicked, acknowledges the alarm. Two pushbuttons frequently used on
graphics are the Control pushbutton (see Section 7.2, Control Through Graphics) and the Display Vector
pushbutton (see Section 7.3, Display Vectoring).
7.1.1 Accessing Graphic Displays
Graphic Displays can be accessed using either the keyboard or mouse. Using the keyboard, with an
Operator Window open and with keyboar d fo cu s, pr es s F1. A pop-up window will appear, which allows the
user to enter the index number of the desired graphic display.
Alternatively, the mouse can be used (instead of F1) to display this window. Again, an Operator Window
must be open. From the Operator Window men u bar, select the sequ en ce Sele ct > Gra phi c. A pop-up window will appear, which allows the user to enter the index number of the desired graphic display.
If the number of the desired Graphic is not known, or if you wish to first view a list of a vailable Gr aphic Displays, click List on the window. The original window will be replaced by a new one titled Select Graphic
(Figure 7-2), which contains a list box which lists the num ber and legend of each availa ble Graphic Display.
TC00064A
Figure 7-2. Select Graphic Pop-up Window
Click the desired item in the list box to highlight it, then click OK to complete the selection operation, or
click Cancel to exit without selecting a Graphic. Other options on the Select Graphic window include the
Search button, which allows the user to search the list for a Graphic number, or an alphanumeric string
representing all or part of a Graphic legend; the Graphic with the specified number (entered in the Index
entry box) or the first entry encountered containing the specified string (entered in the title entry box) will be
placed at the top of the list. A Top button is also supplied; click this button to display the beginning of the
list in the list box.
✎ NOTE Searches using the Title text entry box are case sensitive.
After a graphic display has been selected, use P
Graphic displays.
70 Using Graphic Displays
AGE UP and PAGE DOWN keys to move between adjacent
Page 85

Micro-PWC OPERATOR’S MANUAL
7.2 Control Through Graphics
A process can be controlled from a graphic through the use of a Control pushbutton. The default label on
the button face is C, but buttons with other labels may be used. Typically, a Control pushbutton is located
near another graphical object on the graphic display, such as a valve, which is to be controlled
(Figure 7-3). A graphic display can contain more than one Control pushbutton.
TC00065A
Figure 7-3. Graphic Display with Control Pushbutton Labelled “M”
A Control pushbutton is configured with the name of the point (module) to be controlled. Clicking on a
Control pushbutton opens a pop-up Control wi ndow (Figure 7-4) containing a single-point group model for
this point.
TC00066A
Figure 7-4. Control Window
The appearance and use of the display in the Control window varies according to the Module Type of the
point, as described in Section 4.3.2, Group Display. Typically, the display in the Control window allows process values (e.g., a set point) to be changed by the use of sliders or pushbuttons. A pushbutton near the
top of the display contains the tagname of the point. Clicking this pushbutton closes the Control window
and replaces the graphic with the correspo nd i ng po i nt dis pla y.
The title bar of the Control window identifies its parent Operator Window by number. No more than two
pop-up Control windows can be open at a time from one Operator Window. Click OK to close a Control
window. The Control window can be moved and resized in the normal fashion.
Using Graphic Displays 71
Page 86

Micro-PWC OPERATOR’S MANUAL
7.3 Display Vectoring
The Display Vector pushbutt on is shown in Figure 7-5.
TC00067A
Figure 7-5. Display Vector Pushbuttons
Display Vector (Vector) pushbuttons are incorporated in a Graphic when it is configured; for example, the
Graphic in Figure 7-1 contains Vector pushbuttons at the lower left side of the display.
Click a Vector pushbutton to change (vector) the display in the Operator Window from the current graphic
to a different display, which has been specified during configuration. This new display can be another
graphic, or a display of a different type. For example, one Display Vector pushbutton can be configured to
vector to Graphic #12 and another can vector to Summary #10. Typically, a label appears next to the Vec-
tor pushbutton, identifying the vector display.
By default, the new display appears in the window in which the Vector pushbutton is located; to cause the
new display to appear in a different Operator Window, drag the Vector pushbutton and drop it inside the
frame of the Operator Window in which the new display is to be viewed.
✎ NOTE Attempts to drop the display in anything other than an Operator
Window (e.g., a pop-up window, the System Window, and so on)
will cause the Micro-PWC terminal to beep and the operation to
terminate. Similarly, if the pointer is on an Operator Window frame
(instead of inside the window or on the title bar), the terminal will
beep and the operation will terminate
72 Using Graphic Displays
Page 87

Micro-PWC OPERATOR’S MANUAL
7.4 Error Indication
If an error occurs when a graphic is on display, the error indicator (Figure 7-6) appears in the center of the
Operator Window.
TC00068A
Figure 7-6. Error Indicator
Click on the error indicator to open a window, titled DBA Errors, which contains messages describing the
error(s). The following are the most common causes of errors:
• A process value used by the graphic cannot be accessed. The message supplies further
details on the problem.
• The graphic was not configured completely. This results in “variable not defined” messages.
To quickly determine which object on the graphic is associated with a particular error message, click the
message in the DBA Errors window. The associated object on the graphic will flash rapidly several times in
response. Be aware that the flashed object ca n be hidd e n be hind the DBA Errors window. If no object
appears to flash when the error message is clicke d on , mo ve the DBA Errors window and click the error
message again.
The error indicator always appears in the center of th e graphic. If you have used the Zoom/Pan feature, the
error indicator may not appear on the visible part of the graphic. Similarly, use of Zoom/Pan may cause the
flashed object to be outside the visible part of the graphic. Use the Zoom To Fit function to assure that the
entire graphic is visible in the Operator Window.
Using Graphic Displays 73
Page 88

Micro-PWC OPERATOR’S MANUAL
7.5 Alarm Acknowledgment
A graphic can allow alarm acknowledgment. For example, a grap hic can be configured so that a pushbutton labelled ACK appears when a point in alarm needs acknowledgment. Click the pu sh button to ackno wledge the alarm and remove the pushbutton from the d isp la y. Note that this is a user-configurable option; if
you have questions on how graphics have been configured on your system, consult your system administrator.
Alarms can also be acknowledged from a graphic by pressing A
Window > Acknowledge from the Operator Window menu bar. Each point which needs acknowledgment,
and whose ACK atom is referenced by the graphic, is acknowledged.
LT-F10 on the keyboard, or by selecting
7.6 The Zoom Menu Item
By default, the entire Graphic Display is always shown in the Operator Window when the graphic is first
called up.
The Zoom item on the menu bar of the graphic display provides access to th e Zo o m an d Pa n op erat i on s,
which are used to change:
• The portion of the Graphic which is visible in the Operator Window (Pan).
• The amount of the Graphic Display which can be visible in th e Operator Window, known as the
view size (Zoom).
The view size always has an Aspect Ratio 4 (wide) by 3 (high), to maintain correct proportions of models
during scaling operations.
To access the Zoom and Pan functions, click Zoom on the menu ba r of th e graphic d isplay. The Zoom/Pan
window (Figure 7-7) will be displayed.
TC00069A
Figure 7-7. Zoom/Pan Window
The top portion of the Zoom/Pan window provides PAN functions, while the bottom part of the window is
devoted to the ZOOM operation.
If the Zoom/Pan window is on display and the display in the Operator Window is changed to any type of
display other than another Graphic or a Trend, Group or Point display, the Zoom/Pan window will automatically be closed.
74 Using Graphic Displays
Page 89

Micro-PWC OPERATOR’S MANUAL
✎ NOTE Changes to the view size made in a graphic will not be saved as
part of a CRT Context Key or Quick Key setting; when a graphic
display is called up by either of these methods, a zoom-to-fit
operation (described in Section 7.6.2, The Zoom Operations: In,
Out, Fit, Pick) will automatically be performed.
7.6.1 The Pan Operations: Up, Down, Left, Right, Center
The Pan operations (Up, Down, Left, Right, Center) are used to change the portion of the view shown in
the Operator Window; they do not change the view size.
Each of the Pan functions is represented on the Zoom/Pan window by a button. The face and location of
the button indicate its function. The face of each of the directional operations (Up, Down, Left, and Right)
contains an arrow pointing in the appropriate direction, and each button is located in the appropriate position around the Center button. The face of the Center button contains a bull’s eye.
Each click on one of the directional Pan buttons moves the visible portion of the view in the selected direction by 1/3 of the corresponding view dimension.
After the Center button is clicked, the pointer assumes the shape of a bull’s eye. The next click in the
graphic display will center the view on the point clicked.
7.6.2 The Zoom Operations: In, Out, Fit, Pick
The Zoom operations (In, Out, Fit, Pick) change the apparent size of the graphic which appears in the
Operator Window.
A Graphic Display can have a maximum size of 400 by 300 units, and a minimum size of 20 by 15 units.
The number of units in a graphic is n ormally invisible to the user, except during configuration (discussed in
the Micro-PWC Configuration Guide) because installed graphics are automatically zoomed to fit when
loaded in the Operator Window. Attempts to Zoom In or Out beyond the minimum or maximum size of a
graphic display will have no effect, and the view size will remain at the minimum or maximum.
Each time Zoom In is clicked, the view size is reduced by 62%. The center of the view remains unchanged.
Objects in the graphic which are visible appear correspondingly larger. If the view has been fully zoomed
in, no further change occurs to the view size.
Each time Zoom Out is clicked, the view size is enlarged by 62%. The center of the view remains
unchanged. Objects in the graphic which are visible appear correspondingly smaller. If the view has been
fully zoomed out, no further change occurs to the view size.
Click Zoom Fit to adjust the view size by automatically zooming out (or in) so that the entire model is visible and fills the Working View . If t here are no objects out side the current view size, the view size will “zoom
in” in order to make the objects present fill the Operator Window. (However, it will not zoom in beyond the
default view size, which is 100 by 75 units.) Each time an installe d graphic is displaye d in an Operator Window a Zoom Fit operation is automatically performed.
The Zoom Pick button allows you to select two diagonal corners (e.g., the lower left and upper right corners) of the box which encompasses the desired view size. The rect angle resulting fr om these selections is
called the zoom box. If a zoom box is smaller than the minimum permissible view size, the view size will
remain unchanged.
Using Graphic Displays 75
Page 90

Micro-PWC OPERATOR’S MANUAL
✎ NOTE The contents of the Graphic display in the Operator Window after a
Zoom Pick operation may not reflect exactly the contents of the
zoom box used to make the selection. This is because the graphic
is restricted to an aspect ratio of 4 (wide) by 3 (high), while the
zoom box is not. In order to reconcile the two, the 4 x 3 aspect ratio
is applied to the largest dimension of the zoom box selected by the
user.
7.6.3 Zoom and Pan Operations in Pop-up Graphic Windows
Zoom and Pan operations are also available in pop-up gra phi c wind o ws whic h ar e ac ce sse d via Mod el
Pop-Up pushbuttons appearing on Graphic Displays. A Zoom button appears at the bottom of such pop-
up windows; click on it to access the Zoom/Pan window. The Zoom and Pan operations can be performed
as described above. A Zoom to Fit operation is automatically performed on such windows when they are
first displayed.
✎ NOTE Zoom/Pan operations are not available in pop-up controller
windows.
7.6.4 Resizing the Zoomed/Panned Operator Window
When an Operator Window (or pop-up g raph ic windo w) is resized, the view size is not changed. However,
if the shape of the window is changed (i.e., made narrower, wider, taller, or shorter), more of the view may
be visible than before. The objects in the view will appear larger if the window is made larger, or smaller if
the window is made smaller.
76 Using Graphic Displays
Page 91

Micro-PWC OPERATOR’S MANUAL
8.0 Process Alarms
8.1 Introduction
A Process Alarm is generated when a process variable is in an abnormal condition. Process alarms are
displayed in the first two lines of the Mini-Alarm Window an d ar e acc om panied by au dib le alarm s . A complete list of Process Alarms is contained in the Alarm Review display. Like other messages generated on
the system, Process Alarms are stored in the Historical Database and can be viewed on a Micro-PWC, or
logged to a printer using the Event Historian (refer to Section 9.0, Events). Process Alarms can also be
logged to a printer as they occur.
8.2 Mini-Alarm Window Title Bar
The title bar in the Mini-Alarm Window identifies the win do w by th e Micr o -PWC nam e . The na m e of th e
current host node is displayed to the right of the Micro-PWC address. The title bar also contains a string
which can be configured to provide further information, such as plant name and location. The login name
of the user currently logged in on the Micro-PWC appears on the title bar, followed by the More Alarms
(+ALARMS) indicator (if more alarms exist), a Silence button and the Filter button. The Silence button
contains a horn icon on the button face, and is visible only when audible alarms exist.
8.2.1 Alarm Indicator
The +ALARMS indicator is located on the Mini-Alarm Window title bar, immediately to the right of the login
name of the user currently logged in on the Micro-PWC. This indicator appears when more process alarms
exist than can be shown in the alarm display area (i.e., when there are more than two process alarms).
Process Alarms 77
Page 92

Micro-PWC OPERATOR’S MANUAL
8.3 Process Alarms in the Mini-Alarm Window
Process alarms are displayed in the top two lines of the Mini-Alarm Window. If more unacknowledged process alarms exist than can be displayed in the Mini-Alarm Window, then the message +ALARMS appears
in the title bar of the Mini-Alarm Window.
8.3.1 Process Alarm Priorities
Sixteen levels (from 1 to 16, with Level 1 being the highest) are available for use in prioritizing alarms.
The priority determines the importance of an alarm and the position in which it is displayed in the Mini-
Alarm Window. The priority also determines the color in which the alarm is displayed, and the type of audible alarm which accompanies it.
8.3.2 Audible Alarm Format
Audible Alarms are available in two formats on the Micro-PWC:
• Steady beep
• Rapid beep
The rapid beep is used for alarms with a high priority, while the steady beep is used for lower priority
alarms. The priority level which marks the division between the high and lower priority audible alarm formats can be configured by the user, as described in the Micro-PWC Configuration Guide. For details on
the configuration of this item on your system, consult your system administrator.
✎ NOTES Data contained in the Mini-Alarm Window is automatically filtered
by the filtering mask configured for the user currently logged in on
the Micro-PWC, and by any additional filtering performed by the
user (see Section 8.3.4, Filtering Alarms in the Mini-Alarm Window).
This means that not all users will necessarily receive the same set
of alarms and messages. When there are no unacknowledged
process alarms, system events, or messages in the Mini-Alarm
Window on a particular Micro-PWC console, the audible alarm will
be automatically turned off for that user until the next
unacknowledged alarm or message appears in the Mini-Alarm
Window.
Note that there can still be unacknowledged alarms on the
system that are not visible on the user's screen, due to the
filtering configuration.
A Silence button (with a horn icon on the button face) appears on
the Mini-Alarm Window title bar when audible alarms exist. This
button corresponds to A
silence (but not acknowledge) alarms for the node on which it
appears.
LT-F11 on the keyboard, and can be used to
8.3.3 Acknowledging Alarms in the Mini-Alarm Window
At the far left of each process alarm line in the Mini- Alarm Window is an Alarm Acknowledge button. An A
displayed on the face of the button as a request for acknowledgment, indicating the alarm is unacknowledged. If the face of the button does not cont ain an A, the alarm has been acknowledged. To acknowledge
a process alarm, click on the Alarm Acknowledge button.
Alternatively, you can use the A
acknowledged in this manner.
78 Process Alarms
LT-F9 key combination. Note that only the first process alarm can be
Page 93

Micro-PWC OPERATOR’S MANUAL
8.3.4 Filtering Alarms in the Mini-Alarm Window
The Filter button is located at the right end of the title bar of the Mini-Alarm Window. The label displayed
on the face of this button indicates wh ether alar ms displa yed in the Mini- Alarm Window have be en filtered.
If all alarms will be displayed, the face of the button will display the word Filter. If some alarms will not be
displayed, due to the label reads Filtered.
Click this button to display a pop-up window containing a user interface. This window contains options
which can be used to filter process alarms by Priority and Area. If additional filtering options are applied to
the Mini-Alarm Window using this pop-up window, the label reads L-Filtered.
✎ NOTE Setting the filter option Alarm Acknowledged on the Mini-Alarm filter
will not remove alarms that are acknowledged from the displayed
list. The same is true for Alarm Review displays. This is not the
purpose of the Alarm Acknowledged filter. There is a specific type
of alarm message in the Process Alarm class which is generated
when a controller receives and processes an acknowledge request.
Those messages are the Acknowledge messages that will be
filtered by the Filter option.
The main display area of this window is divided in two portions, the left side is labelled Message Class, and
contains buttons which display the available Message Class names. The right side of the display contains
a list box, which lists the Message Types available for the selected Message Class. Filtering is accomplished as described in Section 8.4.3, Filtering Alarms.
Process Alarms 79
Page 94

Micro-PWC OPERATOR’S MANUAL
8.4 Process Alarm Review
The Alarm Review display allows the operator to view multiple Process Alarms in a single display. The
actual number of alarms which can b e seen d epends on the size of the Operator Win dow in which the y are
displayed.
8.4.1 Accessing the Alarm Review Display
The Alarm Review display is accessed using the menu available from the Operator Window menu bar .
Choose the sequence Select > Alarm Review. The Alarm Review window (Figure 8-1) will be displayed.
TC00264A
Figure 8-1. Alarm Review Window
The Alarm Review display is filtered to reflect the access configured for the user currently logged in to the
Micro-PWC. The menu bar of the Alarm Review display contains a Filter option. Like the Filter button on
the Mini-Alarm title bar, the label displayed for this option indicates whether alarms displayed in the Alarm
Review window have been filtered.
If all alarms will be displayed, the menu option reads Filter. If some alarms will not be displayed, due to the
filtering configured for the current user’s login account, the menu option reads Filtered.
Click on this option to display a pop-up window containing a user interface. This window contains options
which can be used to filter process alarms by Process Alarm type, Priority, and Area. If additional filtering
options are applied to the Alarm Review using this window, the label reads L-Filtered.
By default, the alarms are sorted by priority. Alarms which have the same priority are further sorted by
time. Either the oldest or newest alarm can be first in time order, depending on the option selected when
the system was configured. A quick way to see the default at a glance is to click the Sort option on the
Alarm Review display menu bar, and view the resulting display. (The Sort option is described in Section
8.4.4, Sort Alarms in the Alarm Review.)
8.4.2 Alarm Review Display Acknowledgment
Each line in the Alarm Review display contains data pert aining to on e particular alarm. At the far left side of
the line is the Alarm Acknowledge button. An A displayed on the face of the button is a request for
acknowledgment, indicating the alarm is unacknowledged. If the fa ce of the button does not contain an A,
the alarm has been acknowledged.
80 Process Alarms
Page 95

Micro-PWC OPERATOR’S MANUAL
Alarms on the Alarm Review display can also be acknowledged using the Ack option on the Alarm Review
menu bar. Clicking on this option causes a menu to appear. This menu is used to acknowledge multiple
alarms by:
•Priority
•Area
• All alarms
Click the desired item; a window containing a text entry box and a keypad, similar to the one in Figure 8-2,
will be displayed. (The label above the text entry box will differ, depending on the parameter selected.)
TC00070A
Figure 8-2. Number Entry Keypad
Enter the number of the Priority or Area for which alarms are to be acknowledged. Click OK to complete
the operation; all alarms visible in the Alarm Review display for that priority, area, etc., will be acknowledged.
To acknowledge all the alarms visible in the Alarm Review display, from the menu bar select Ack > All
Alarms (or press A
Click Yes to acknowledge all alarms visible in the Alarm Review display, or click No to exit without
acknowledging alarms.
8.4.2.1 Display Vectoring from the Alarm Review Display
A Vector pushbutton appears to the right of each Alarm Acknowledge button. The face of the Vector
pushbutton displays the character V. Click this button to change (vector) directly to another display.
The display which appears depends upon which display has been configured, via Alarm Vectoring Configuration, for the point which is in alarm. If no display has been assigned, the Point Display for the point in
alarm will appear by default. When a Vector button on the Alarm Review display is clicked, the resulting
display appears, by default, in the same window which was occupied by the Alarm Review.
LT-F10 if an IBM AT-compatible keyboard is used). A confirmation box will ask:
?Acknowledge All Alarms on Display
✎ NOTE This operation differs slightly from that of the Vector buttons in the
Mini-Alarm Window; clicking on a Vector button in the Mini-Alarm
Window causes the resulting display to appear, by defa ul t, in the
Operator Window which has the lowest number (e.g., Operator
Window #1).
Process Alarms 81
Page 96

Micro-PWC OPERATOR’S MANUAL
To have the t arget displa y appear in a wind ow other than the on e occupied by the Alarm Review, drag and
drop the desired Vector pushbutton into an Operator Window.
If the line displayed in the Alarm Review display changes during the drag and drop operation, the alarm
vectoring configuration which was in effect when the Vector button was selected will remain in effect until
the operation is completed.
✎ NOTE Attempts to drop the display into anything other than an Operator
Window (e.g., a pop-up window, the System Window, and so on)
will cause the Micro-PWC to beep and the operation to terminate.
Similarly, if the pointer is on an Operator Window frame (instead of
inside the window, or on the title bar), the console will beep and the
operation will terminate.
8.4.3 Filtering Alarms
Data contained in an Alarm Review display is automatically filtered by the filtering mask configured for the
user currently logged in on the Micro-PWC. The user can further filter incoming process alarm s by Process
Alarm Type, Pr iority, and Area. To access the filtering mechanism, click the Filter item which appears in the
Operator Window menu bar of the Alarm Review window. The Alarm Review Filter window (Figure 8-3) will
be displayed.
TC00543A
Figure 8-3. Alarm Review Filter Window
The main display area of this window is divided in two portions; the left side is labelled Message Class, and
contains buttons which display the available Message Class names. The right side of the main display
area contains a list box, which in turn contains a scrollable list of all the Message Types available for the
selected Message Class. Click the desired Message Class button to select it:
• Process Alarms
•Priority
•Area
When a new Message Class is selected, the list of Message Types in the list box changes to display the
types available for that Message Class. Each Message Type has a pushbutton associated with it. Click this
pushbutton to select or deselect the MessageType. If a Message Type is selected, messages of that type
82 Process Alarms
Page 97

Micro-PWC OPERATOR’S MANUAL
will be filtered out, and will not be displayed.
✎ NOTE The Display (deselected state) and Don’t Display (selected state)
buttons illustrate button appearance based on state; they are
examples only, and therefore always stippled out, and not avai lable
for actual use.
Use the Restore button at the bottom of the Alarm Review Filter window to return to the default filte ring for
the current login.
8.4.3.1 Message Class: Process Alarm Messages
Process Alarm messages are displayed in both the Alarm Review display and the top two lines of the Mini-
Alarm Window, kno wn as the alarm display area.
Process Alarm Messages are classified into the following Message Types:
• Bad Input/Output
• High/Low Alarm
• Deviation Alarm
• Security Alarm
• Process Alarm Message
• Discrete Alarm
• Return to Normal
• Alarm Acknowledged
Process Alarm messages for Bad Input/Output, High/Low, Deviation and Discrete alarms are displayed in
the format:
<Priority><Area><Time><Date><Tagname><AlarmStatus> <Legend>
Process Alarm messages for Security alarms are displayed in the format:
<Priority><Area><Time><Date><Tagname><AlarmStatus> <Alarm Tag><Legend>
Process Alarm messages for all other alarms are displayed in the format:
<Priority><Area><Time><Date><Message>
8.4.3.2 Message Class: Priority
To filter messages by Priority, click the Priority Message Class button on the Alarm Review Filter window
(Figure 8-3). The Message Ty pe area of the window will contain an entry for each available Priority
(1 through 16). Click each Priority for which routing is to be changed, or use the Clear or Set buttons to
clear or set the routing status of all Priorities.
8.4.3.3 Message Class: Area
When the Area Message Class is selected, the list box contains a scrollable list of the 255 available areas.
Select items as described in Section 8.4.2, Alarm Review Display Acknowledgment. If an Area has been
selected, alarm messages from servers in that area will not be displayed.
Process Alarms 83
Page 98

Micro-PWC OPERATOR’S MANUAL
8.4.3.4 Clearing and Setting Alarm Review Message Types
It is possible to clear or set multiple Message T ypes si multaneously, eliminating the need to click numerous
toggle buttons. Click Set or Clear to set or clear all Message Types in the selected Message Class. Click
Set All or Clear All to set or clear all Message Types in all Message Classes i n the Alar m Review win dow.
8.4.4 Sort Alarms in the Alarm Review
The order in which alarm messages are displayed in the Alarm Review window is determined by the
choices made during configuration of the Micro-PWC’s Alarm Setup, described in the Micro-PWC
Configuration Guide. The system can be configured to display either the newest or oldest alarm (with highest priority) first. Furthermore, this order can be the same or reversed if unacknowledged alarms exist.
The Sort option on the Alarm Review display menu bar is used to sort alarms based on the following
parameters:
• Time Order (oldest alar m first, or newest alarm first)
• Process alarm type
•Priority
•Area
To sort the alarms in the Alarm Review display, click theSort option. The Alarm Review Sort window (see
Figure 8-4) will be displayed.
TC00072A
Figure 8-4. Alarm Review Sort Window
The top of the window contains a pair of toggle buttons labelled Oldest and Newest. Click Oldest if the
oldest alarm messages in the Alarm Review display are to be displayed first; click Newest if the most
recent alarm messages are to be displayed first.
The central area of the Alarm Review Sort window cont ains a toggle button for each parameter by which
the contents of the Alarm Review can be sorted, including Type, Priority, and Area. Click the appropriate
toggle button to select the desired sort parameter.
Once the time order and sort parameter have been selected, click OK to complete the operation.
To restore the Alarm Review display to its initial priority/time order, click Clear at the bottom of the Alarm
Review Sort window. Click OK to close the Alarm Review Sort window.
8.4.5 Freeze Alarm Review Display
The Alarm Review display is a dynamic display, and is updated continuously as new messages are
received. If many messages are received in rapid succession, viewing of the display can be difficult. To
temporarily stop the display from updating, click on the Freeze option on the Alarm Review display menu
bar. The Display Frozen pop-up window (Figure 8-5) appears, and the Alarm Review display will remain
84 Process Alarms
Page 99

Micro-PWC OPERATOR’S MANUAL
static until OK is clicked. Messages received while the display was frozen will be added when the display is
unfrozen.
Figure 8-5. Display Frozen Window
8.4.6 Search Alarm Review Display
The Alarm Review display can be searched for the occurrence of a specific tagname. To do so, click
Search on the menu bar of the Alarm Review display. The Tag Search window will be displayed.
This window contains the prompt:
Enter tagname:
followed by a text entry box. Click on the text entry box to gain focus on it, then enter the tagname to be
located. Click OK to complete the search operation. When the tagname is found, the alarm for that tagname is displayed on the top line of the Alarm Review display.
8.5 ADP Panel Operation
The Annunciator Display Panel (ADP) user interface is controlled by the Mini-Alarm Window. The MiniAlarm Window provides a soft interface window for di splaying ADP group st atus, as well as a co nfiguration
point for defining the action that will be taken when an ADP key is pressed.
A pushbutton located on the Mini-Alarm Window title bar is used to call up the ADP panel display. The button is the default button face color when there are no point s in alarm wh ich are assign ed to ADP p anel bu ttons. The button changes color to indicate if one or more of the assigned ADP groups have an alarm. If all
alarmed points are acknowledged, the button face will be red. If any of the alarmed points are not acknowledged, the button will contain a white exclamation point character (!) in the middle of the button face, as
illustrated in Figure 8-6.
TC00700A
Figure 8-6. ADP Button Face
Process Alarms 85
Page 100

Micro-PWC OPERATOR’S MANUAL
8.5.1 The Soft ADP Panel Window
Clicking on the ADP button will cause the Soft ADP Panel window to appear, as shown in Figure 8-7.
TC00698A
Figure 8-7. ADP Panel
The Soft ADP Panel window provides the same information as the physical ADP panels. The actions
caused by mouse clicks are identical to the actions caused by pressing an ADP key, including using the
S
HIFT key to bring up the alternate 32 ke ys. The black rect angle above e ach ke y wi ll cont ain a yellow or red
indicator if a point that is assigned to the button is in alarm. If the point is unacknowledged, the color indicator will blink.
The window has a row of radio buttons across the top which determine which panel states are showing.
Clicking on one of the radio buttons will activate the corresponding panel. In addition, the radio buttons will
indicate the highest state of all buttons on each corresponding panel. If the panel contains any unacknowledged points, the rectangle surrounding the radio button will blink red. If there are points in alarm, but they
are all acknowledged, the rectangle will be a steady red.
86 Process Alarms
 Loading...