

Page 1

FLUE GAS ANALYSER
GA-12
PLUS
Operating manual
03/ 2013
V 0.99
Page 2

www.madur.com Manual
GA-12
plus
Index
1.Description of GA-12plus analyser................................................................................3
2.Maintance.........................................................................................................................4
2.1. Electrochemical cells.............................................................................................4
2.2. Gas channel............................................................................................................4
2.3. Battery.....................................................................................................................4
2.4. Service.....................................................................................................................5
2.5. Errors.......................................................................................................................5
2.6. Switching off after use...........................................................................................5
3.Operation..........................................................................................................................6
3.1. Use of the keyboard...............................................................................................6
3.1.1. Description of the keys..................................................................................7
3.1.2. Editing numbers..............................................................................................7
3.2. Basic operation......................................................................................................8
3.2.1. Getting started................................................................................................8
3.2.2. Switching on....................................................................................................8
3.3. Results screens......................................................................................................9
3.3.1. The info bar.....................................................................................................9
3.3.2. The menu bar..................................................................................................9
3.3.3. Results...........................................................................................................10
4.Menu...............................................................................................................................11
4.1. Storing results......................................................................................................11
4.2. Action menu..........................................................................................................14
4.3. Chart......................................................................................................................19
4.4. Measurement parameters...................................................................................21
4.5. Main menu.............................................................................................................23
4.5.1. Settings..........................................................................................................23
4.5.2. Burner regulation..........................................................................................24
4.5.3. Reports..........................................................................................................25
4.5.4. Clock..............................................................................................................27
4.5.5. Service...........................................................................................................27
4.5.5.1. Info............................................................................................................28
4.5.5.2. Control list...............................................................................................28
4.5.5.3. Calibration with gases............................................................................29
4.5.5.4. Pressure calibration................................................................................30
4.6. Printing..................................................................................................................32
5.Flow velocity measurement.........................................................................................33
2
Page 3
www.madur.com Manual
GA-12
plus
1. Description of GA-12
plus
analyser
GA-12plus is a mobile boiler gas analyser extending the series of our well-known
GA-12 analysers. There can be up to four gas sensors installed in the device. The basic
version of the device is adjusted to measure the concentration of following gases: O2,
CO, NO. Optionally NO2, SO2 or H2S sensor can be installed as the last, fourth sensor.
To guarantee the accuracy of measurement the velocity of the gas flow through the
analyser is stabilised. The efficient pump additionally makes it possible to measure the
content of soot in the flue gases.
The analyser can be equipped with either one or two pressure sensors. In the first case
it is unavoidable to switch the pump off in order to measure the pressure. In the second
case the measurement of the pressure can be done simultaneously to gas measurements
and does not interrupt them.
GA-12
plus
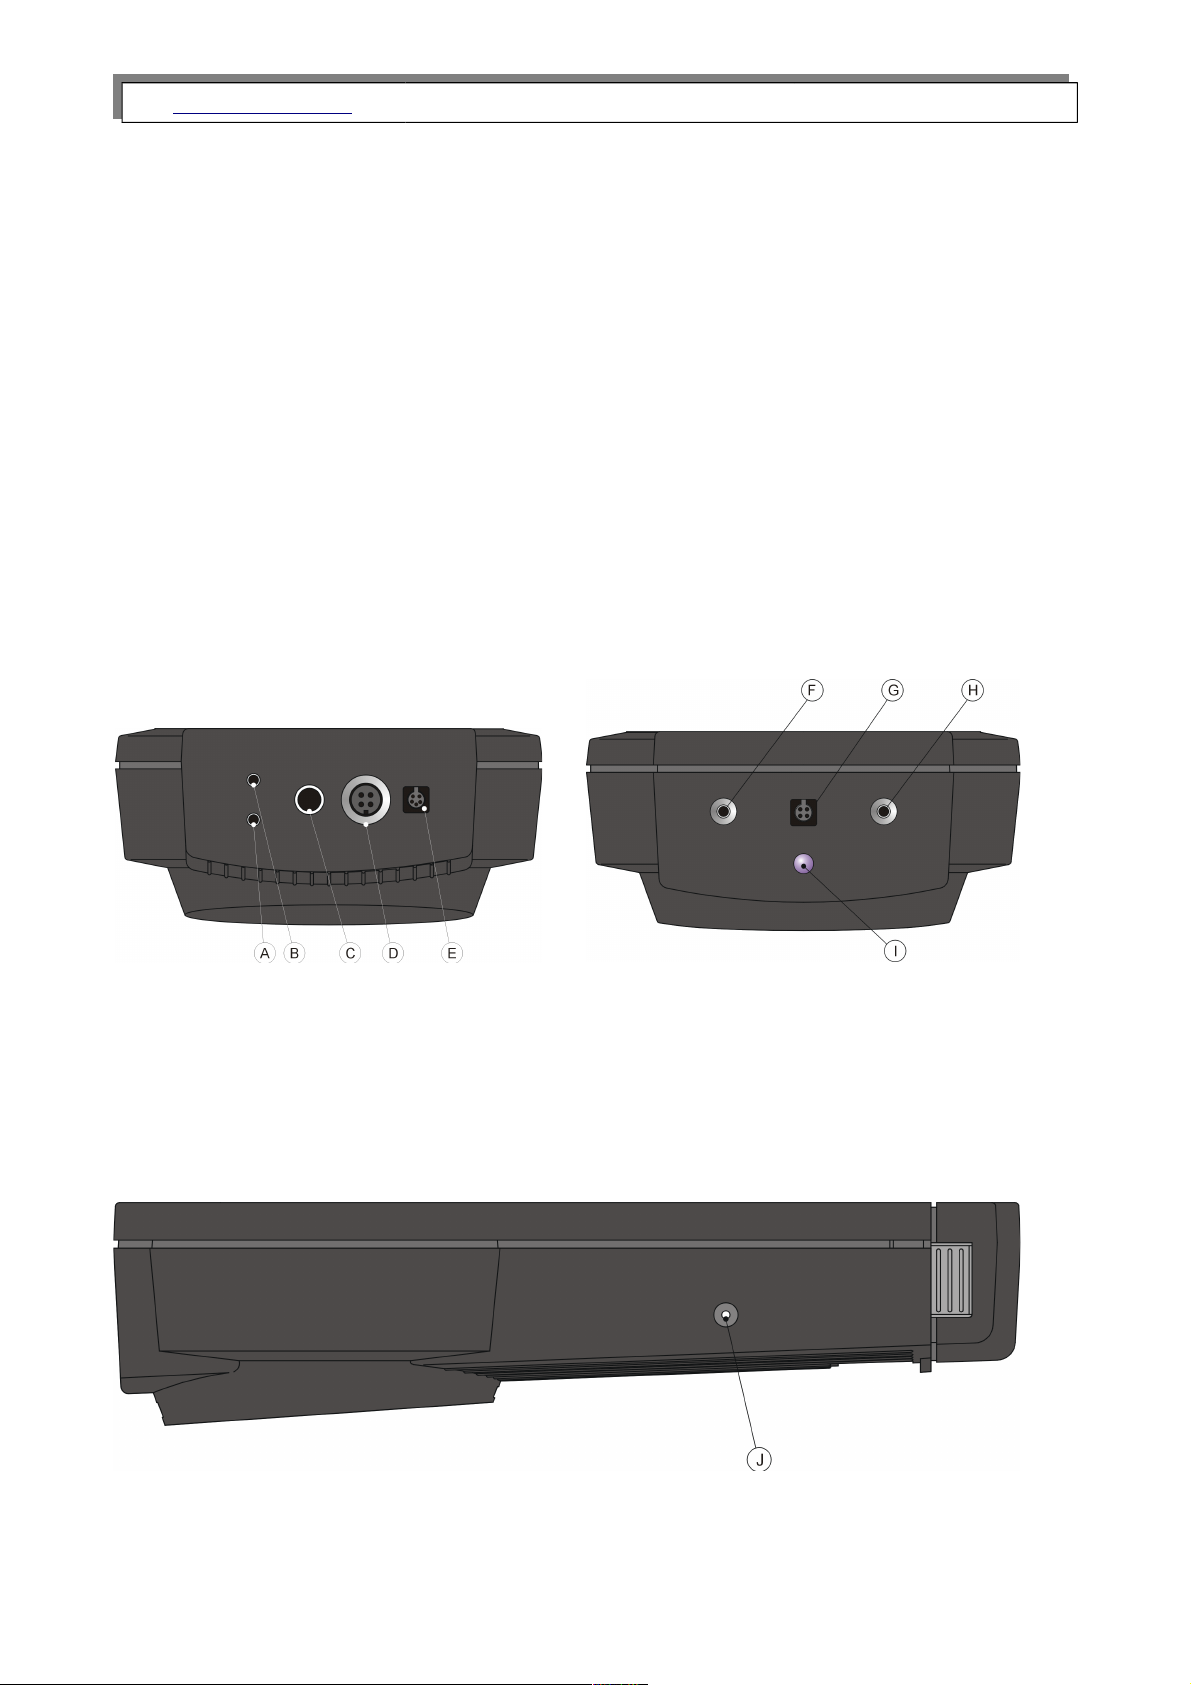
analyser – bottom view:
A – basic pressure sensor inlet (+
B – gas inlet
C – gas outlet
D – gas probe socket
E – HT (humidity + temperature) probe socket
GA-12
plus
analyser – top view
F – differential pressure sensor inlet (-) – only in the
version with two pressure sensors
G –RS-232C interface socket
H – differential pressure sensor inlet (+) – only in the
version with two pressure sensors
J – IR emitter for communication with printer
GA-12
plus
analyser – side view
J – mains adapter socket
3
Page 4

www.madur.com Manual
GA-12
plus
2. Maintance
2.1. Electrochemical cells
To extend the lifetime of the cells and guarantee the accuracy of the measurements the
points listed below should be followed.
• The cells should not be exposed to influence of the concentration exceeding the
measurement range.
• All the cells can react unpredictably to chemicals whose components are not typically
found in flue gases. For this reason the equipment should not be cleaned with chem-
ical solvents. The vapour produced by such solvents can lead to destabilisation and
even permanent damage to the cells should it penetrate into the gas chamber.
• The cells have a voltage applied to them even when the analyser is switched off. It is
therefore advised to make sure that there are always charged batteries in the ana-
lyser.
• It is advised not to switch the analyser off before the gas system is free of flue gases.
• The analyser which is not to be used for some time should be kept in a cool place.
This will reduce the wear on the cells.
2.2. Gas channel
An in-line filter with the condensate separator protects the gas channel of the analyser
from condensed water contained in fumes. The filter element will become dirty with use
and should be changed when necessary. The water that condenses in the condensate
separator should be emptied as required.
2.3. Battery
The device uses Li-Ion 3,6V battery.
Warning:
If the instrument is not in use for some time, then the battery will neverthe-
less be consumed since certain circuits are permanently in use. For this
reason the state of charge of the batteries should be checked monthly at
least.
4
Page 5

www.madur.com Manual
GA-12
plus
2.4. Service
Due to the fact that electrochemical cells’ parameters change with time it is necessary
to carry out a periodical service connected with either the calibration of the electrochem-
ical cells or their replacement. We recommend that service be carried out every 12
months or after the device have worked for 200 hours.
2.5. Errors
The instrument has a self-check function. When an error occur it would be shown on
the screen Control list.
2.6. Switching off after use
The lifetime of the electrochemical cells depends on the use of the instrument. Wear on
the cell is greater at higher gas concentrations and during longer measurements. This
leads to a slow deterioration of the cell.
Warning:
For this reason the instrument should not be switched off until all the flue
gases have been purged from the system with clean air and the instrument
has been allowed to run in air for a few minutes.
5
Page 6
www.madur.com Manual
GA-12
plus
3. Operation
3.1. Use of the keyboard
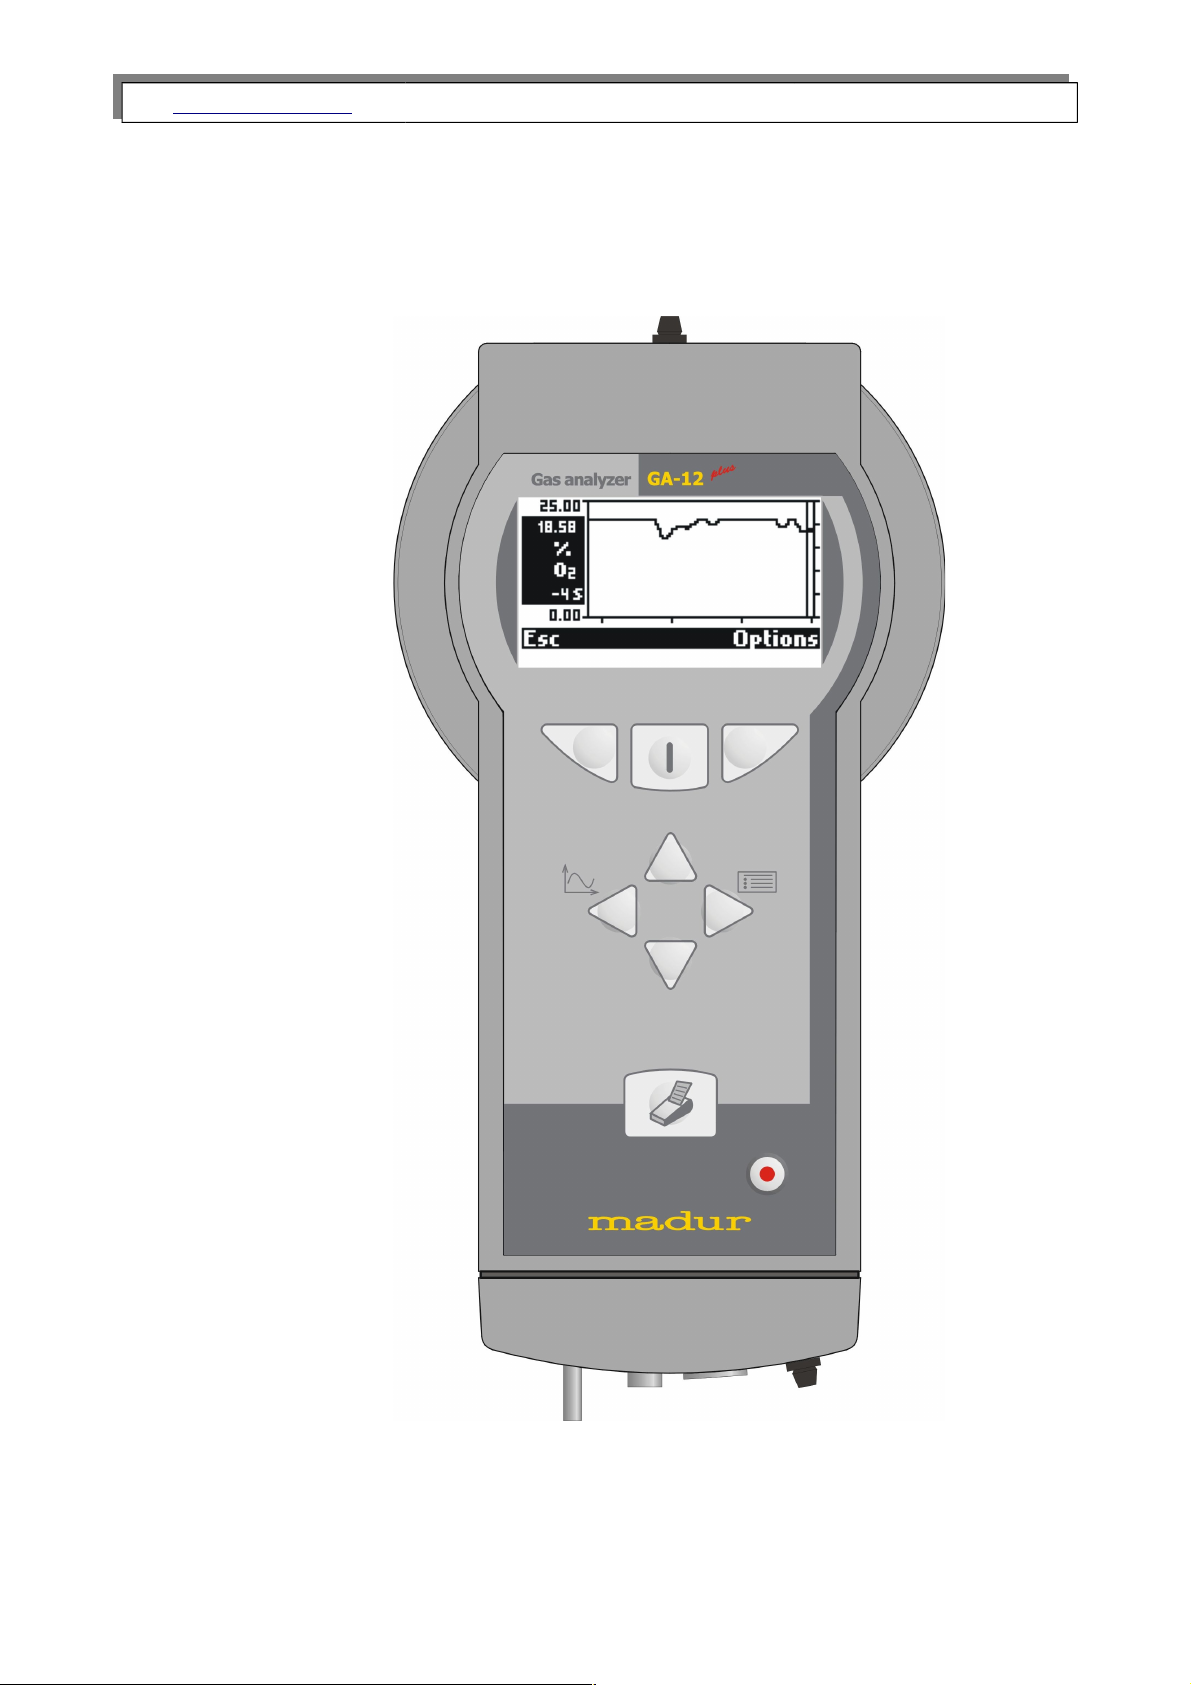
The analyser's apparence
6
Page 7
www.madur.com Manual
GA-12
plus
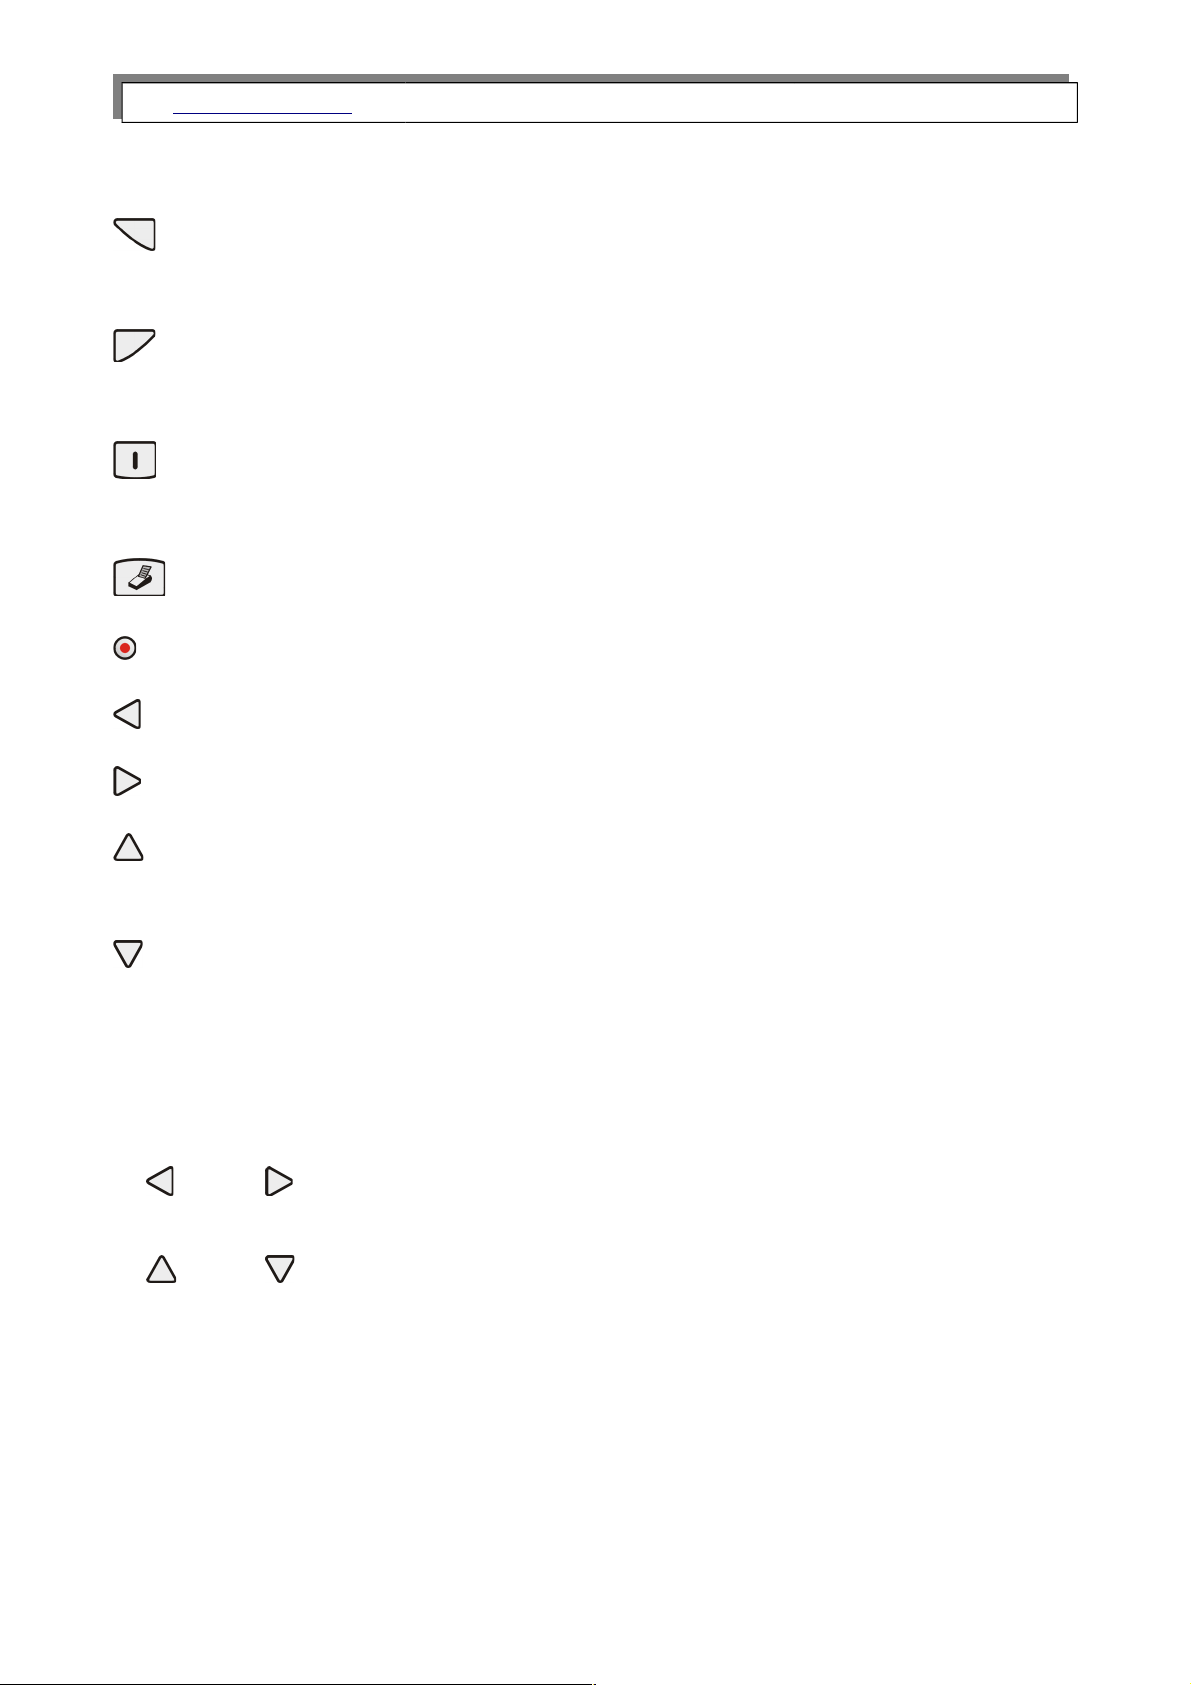
3.1.1. Description of the keys
- Left function key. Carries out the function shown on the display whilst the instrument
is switched on.
- Right function key. Carries out the function shown on the display whilst the
instrument is switched on.
- Centre function key. Switches the instrument on. Carries out the function shown on
the display when the instrument is switched on.
- Calls the printing options.
- Switches the instrument off.
- On a results screen calls the Chart menu, in text mode shifts the cursor to the left
- On a results screen calls the option Menu, in text mode shifts the cursor to the right.
- Moves the cursor upwards in a menu. In text mode increases the value. On a results
screen chooses the next screen.
- Moves the cursor downwards in a menu. In text mode decreases the value.
On a results screen chooses the next screen.
3.1.2. Editing numbers
Numbers are entered as follows:
and - move the cursor backwards or forwards to the digit to be
changed.
and -
increases/decreases the value of the marked digit.
7
Page 8
www.madur.com Manual
GA-12
plus
3.2. Basic operation
3.2.1. Getting started
Connect the individual parts of the instrument:
• connect the gas probe.
• ensure that the gas outlet is not blocked.
3.2.2. Switching on
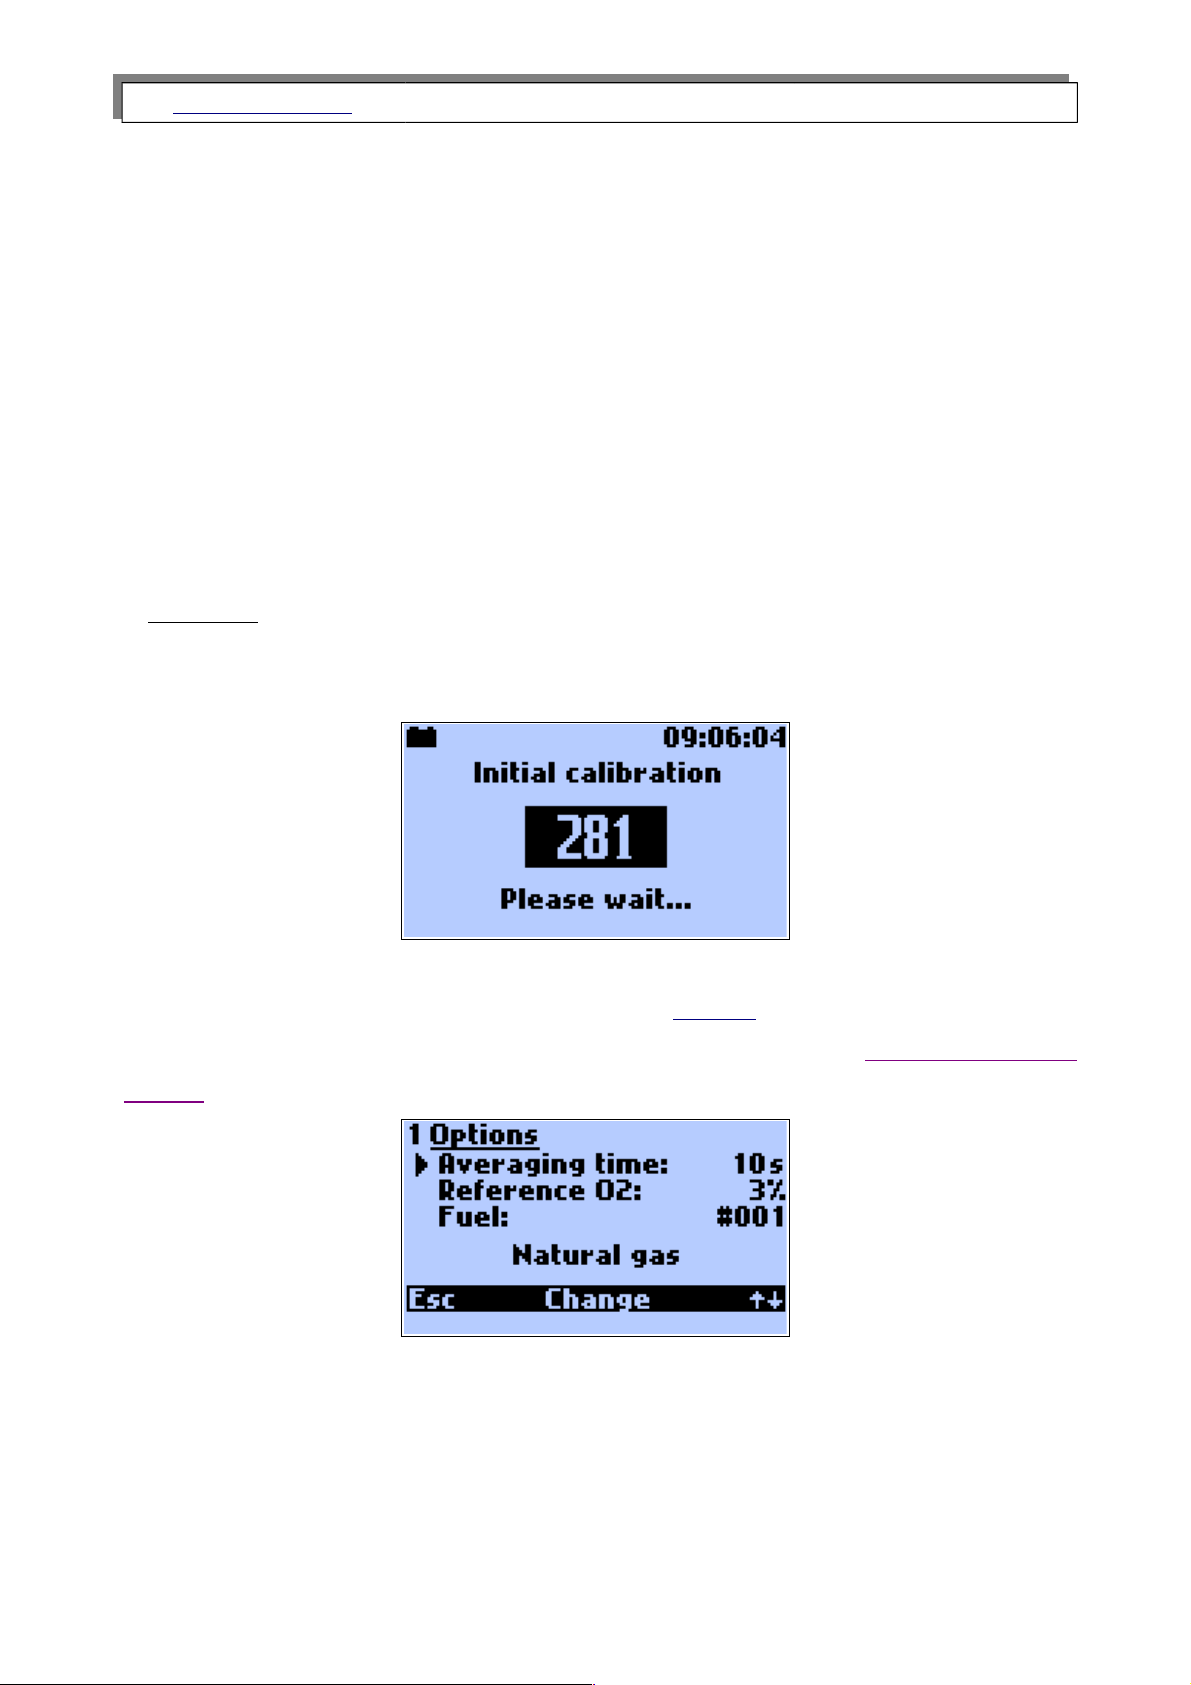
The instrument performs a zero calibration immediately after being switched on.
Warning:
During zero calibration the probe must be outside the flue gas channel.
After the zero calibration has been completed the Options open automatically. Here the
measuring parameters can be checked or changed. See also point Measurement para-
meters.
8
Page 9
www.madur.com Manual
GA-12
plus
3.3. Results screens
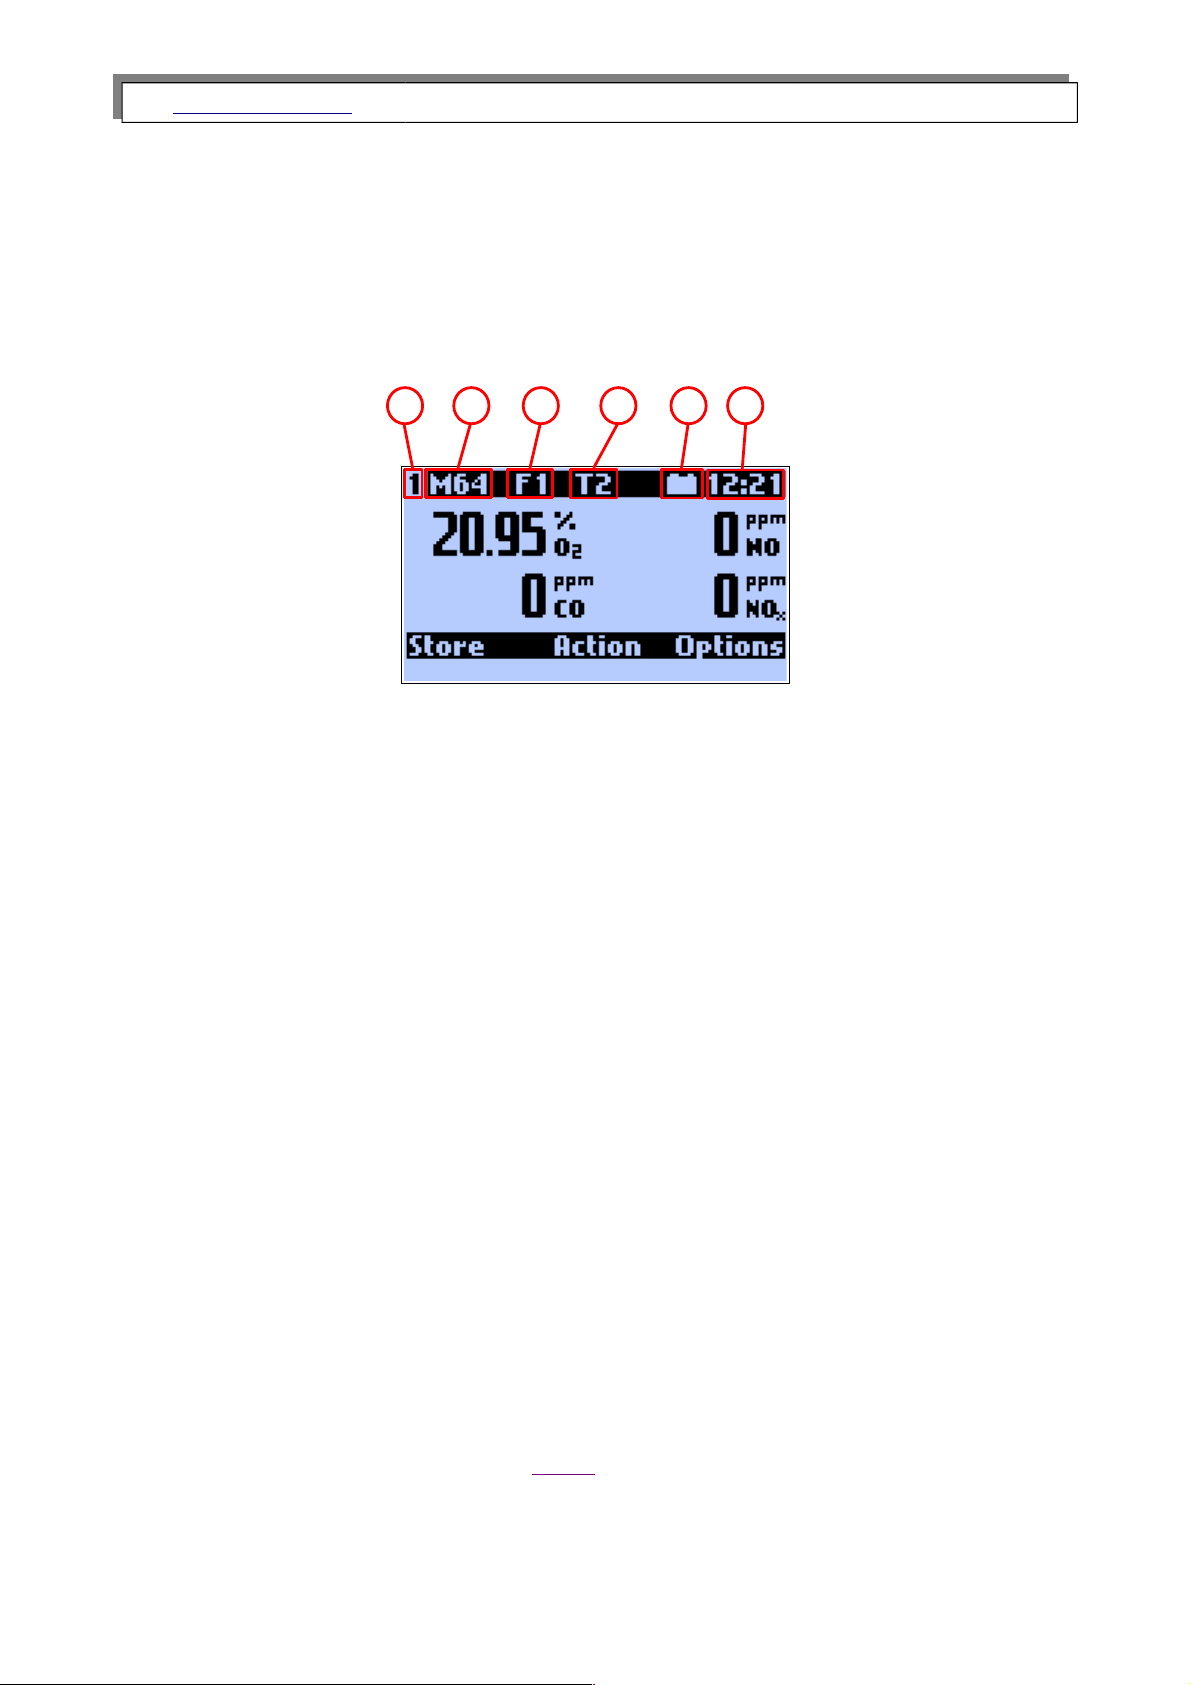
The function keys Data or Esc will automatically call up the results screen from any
point. Below there are two examples of results screens.
3.3.1. The info bar
A) The number 1 stands for the first results screen. Four results screens can be
defined. These can be called up using the up and down keys.
B) M64 shows how many memory spaces are still available.
C) F1 shows the chosen fuel. The instrument contains 6 fixed and 4 programmable
fuels. These are numbered 0...9.
D) T2 shows the set averaging time. This can be programmed in fixed steps
between 2 and 180 seconds. If the period of time measured since the starting of
the instrument is shorter then the chosen averaging time, this field will refer to
the current averaging time.
E) Plug/Battery - The symbol of the plug means that the instrument is being sup-
plied with the energy from the outside, the symbol flashes until the charging of
the battery is completed; battery stands for the inner battery of the instrument
and also shows the state of charge of the battery.
F) 12:21 shows the current time as set in the analyser.
3.3.2. The menu bar
The menu bar at the base of the display shows the use of the function keys. The pos-
sibilities are explained under the point Menu.
9
A
B C D E
F
Page 10

www.madur.com Manual
GA-12
plus
3.3.3. Results
All the results of measurements and calculations are shown as averaged values. Aver-
aging time is chosen by the user under Options from 2 – 6 – 10 – 20 – 30 – 60 – 120 –
180 seconds.
The user can define the content of the individual results screens. The necessary soft-
ware, madurPortable, is to be found on the utility disk.
Here is a list of all measured or calculated variables that can be shown on the results
screens:
• Volumetric concentration of the gases: O
2
, CO, NO, NOx, CO2, SO
2 ,
NO2 and H2S
(depending on the analyser’s configuration)
• Undiluted volumetric concentration of the gases CO
u
, NOxu, NOu, NO2u, SO
2
and
H2S
u
• Mass concentration of the gases:
◦ absolute: CO
m
, NOxm, NOm, SO2m, NO
2m
and H2S
m
◦ relative, related to a defined level of rest oxygen: CO
rel
, NO
xrel
, NO
rel
, SO
2rel
NO
2rel
and H2S
rel
• Emission of the gases related to the energy value: ECO, ENO
x
, ESO2, ENO2,
ESO2, EH2s
• Combustion parameters: qA, Sco, ETA, ETA*, Lambda, TI, EA
• Temperatures of the combustion gas, the air and inside of the analyser.
• Draught/differential pressure and flow rate
• Relative humidity of the gas in the analyser.
• Dewpoint
• Battery voltage
10
Page 11
www.madur.com Manual
GA-12
plus
4. MENU
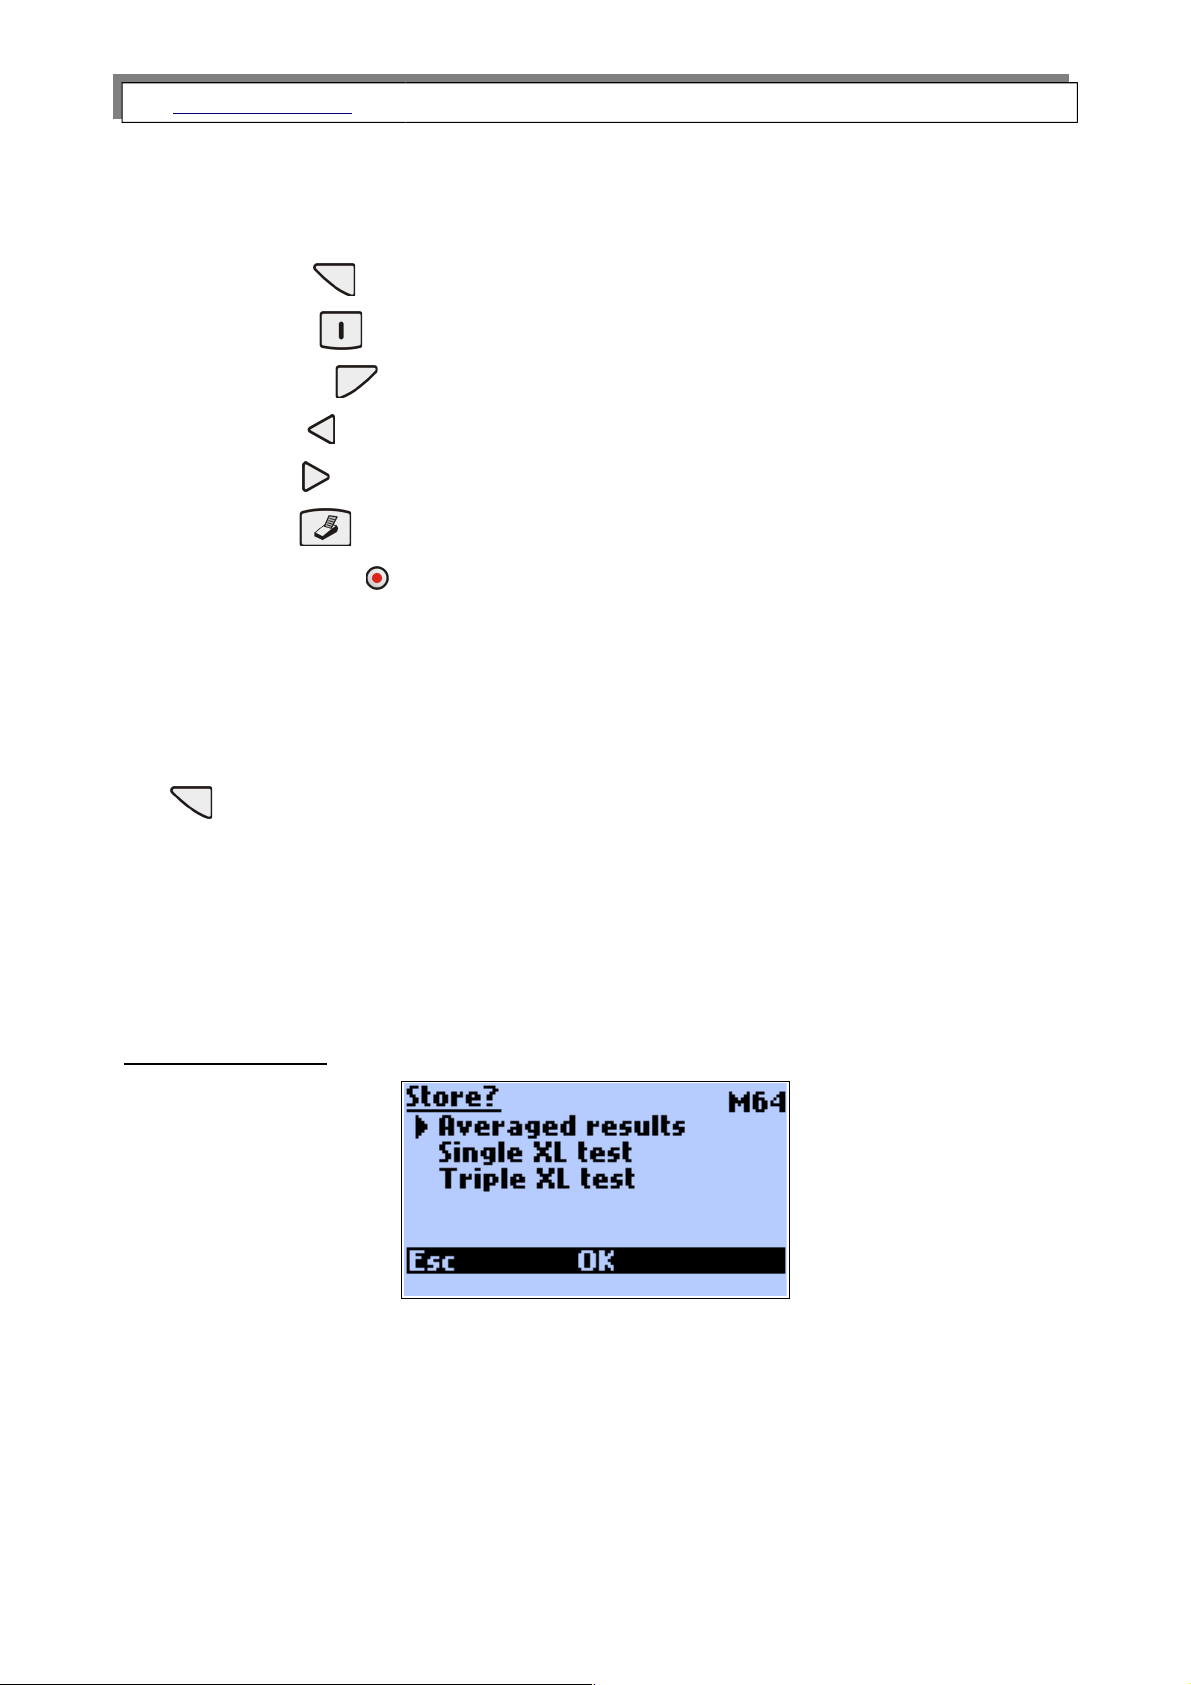
From the results screens the following options can be activated with the keyboard:
● Store – Left function key.
● Action – Centre function key.
● Options – Right function key.
● Chart – Arrow left.
● Menu - Arrow right.
● Print – Key with a printer shown on it.
● Switch off – Pressing the round, red key will switch the instrument off com-
pletely.
4.1. Storing results
The Store option can be reached from any results screen by pressing the left function
key . The results on the screen are stored in a buffer and remain there until stored
permanently.
The results are stored in the form of reports.
If the report should also include the chimney draught, or the soot content then this
measurement must be carried out before storing the results.
Results can be stored in three different ways:
Averaged results:
The averaged results will be stored. The averaging times that can be chosen from 2,
10, 20, 30, 60, 120 and 180 seconds.
11
Page 12
www.madur.com Manual
GA-12
plus
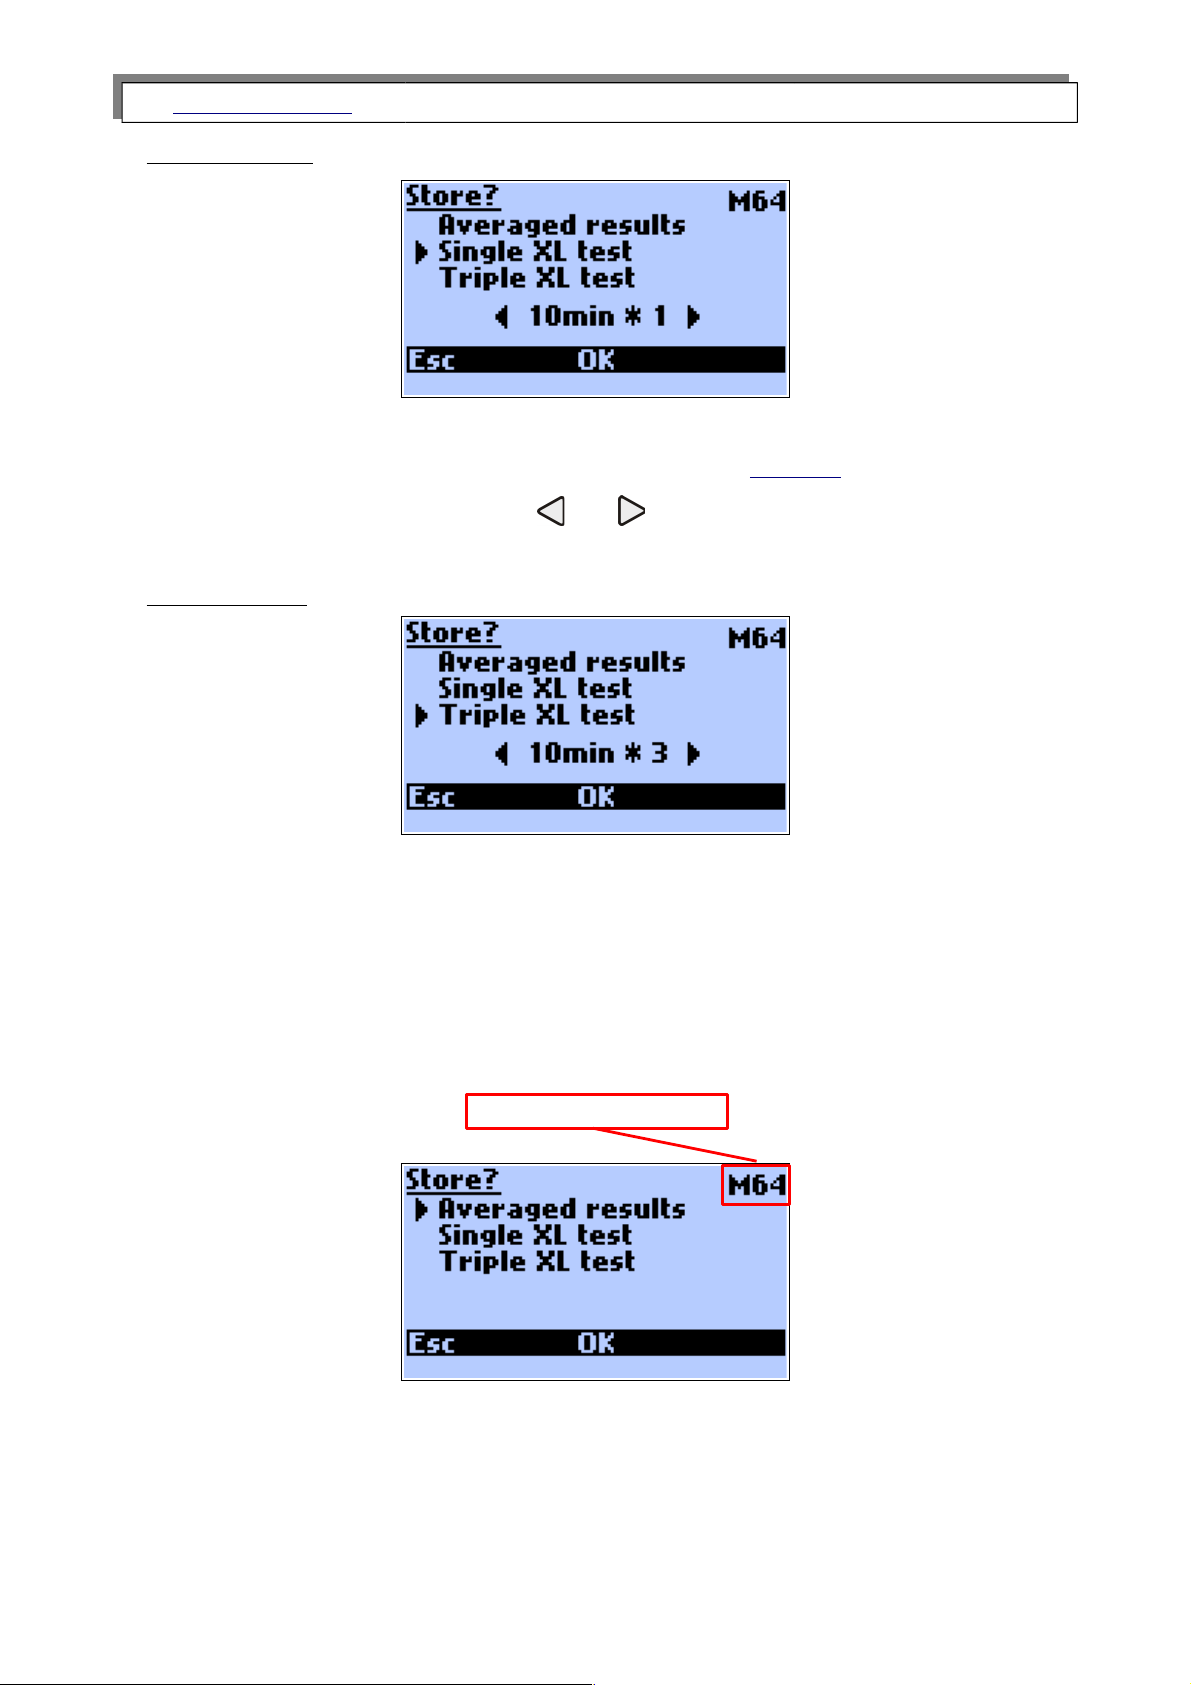
Single XL test:
The averaged results will be stored. The term XL (extra long) is used for the formation
of especially long averages. XL test time can be set via Options second screen or on
current screen by the use of the keys: and
Available times: 10sec, 20sec, 30sec, 1min, 2min, 5min, 10min, 15min, 20min, 30min.
Triple XL test:
This will automatically store three consecutive single XL Tests.
During storage of XL test, battery charge icon is replaced with the number of current
test (X1, X2, X3) and the clock counts down the time, till the end of test. During the XL
test the analyser beeps every two seconds.
In the top-right corner the number of available reports is shown:
12
Available reports number
Page 13
www.madur.com Manual
GA-12
plus
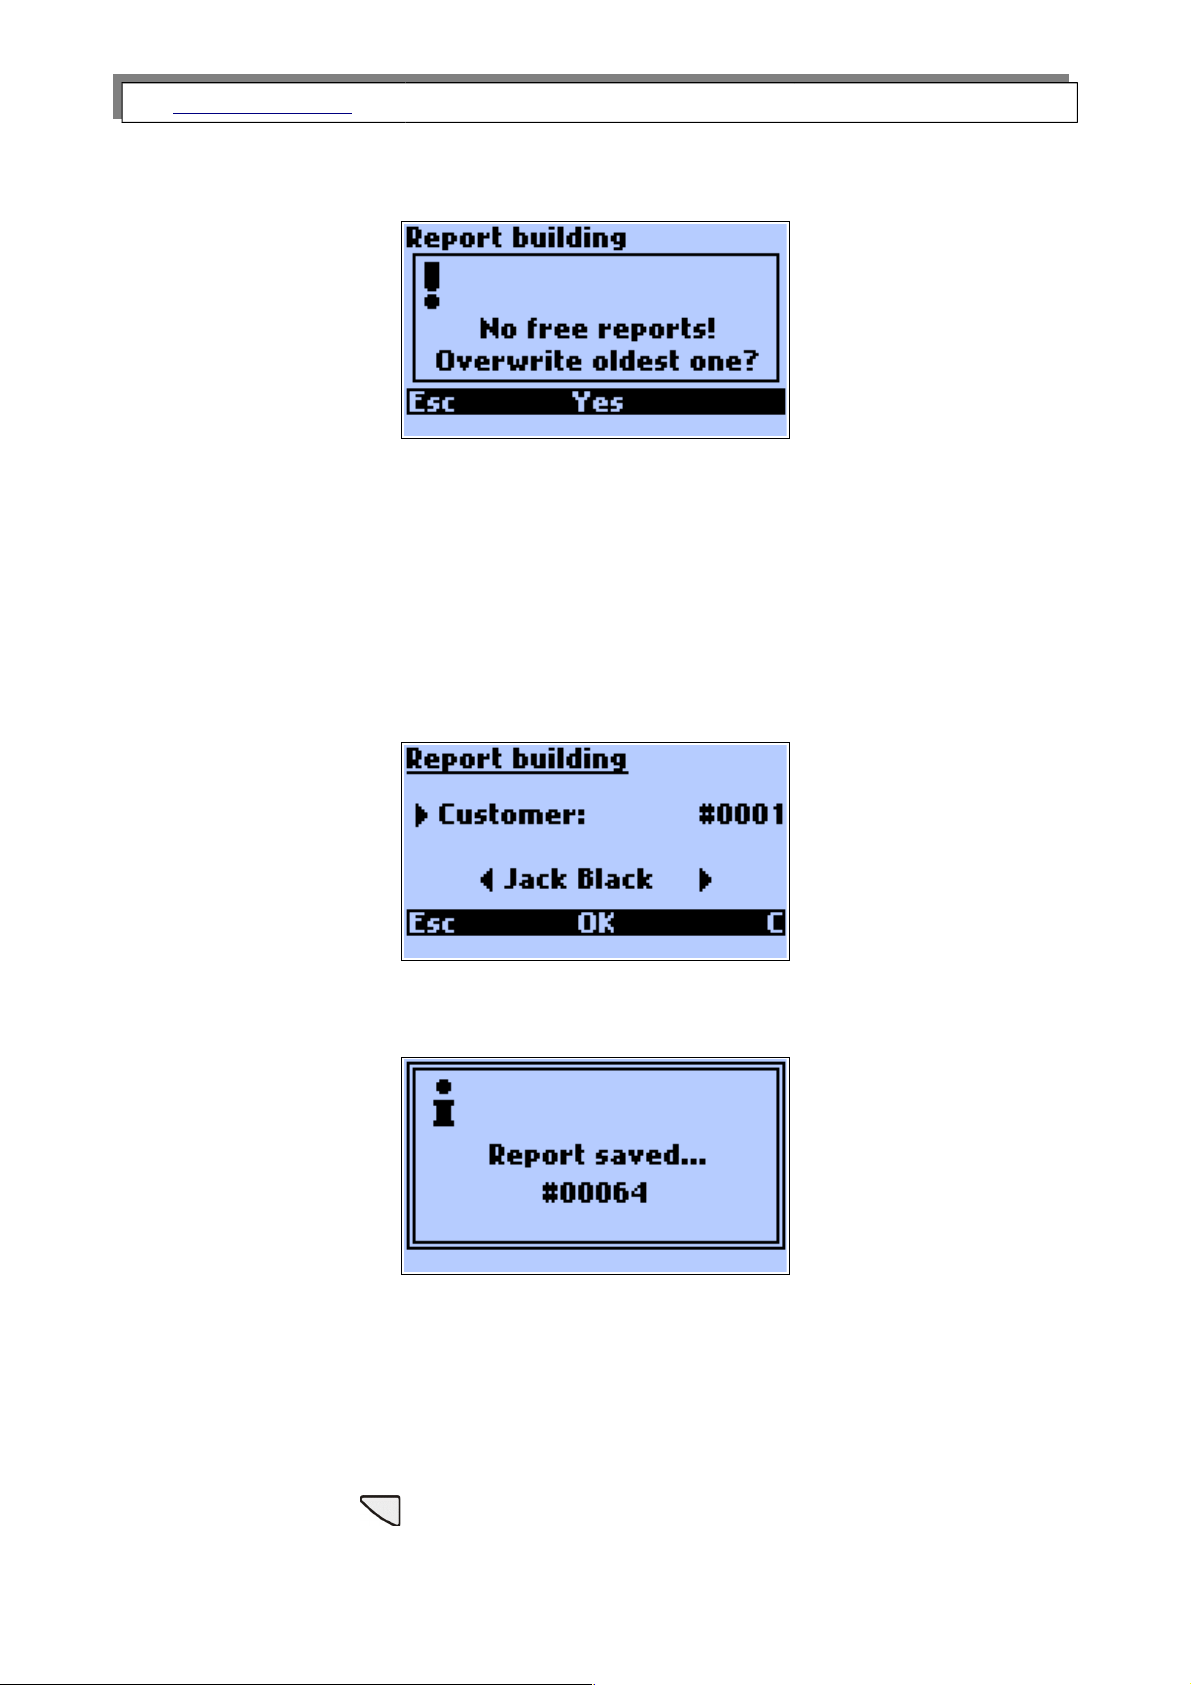
If the memory of analyser is full, and no more reports can be stored the following
screen is shown when the storage is attempted.
ECS
The storing of results will be stopped and the instrument returns automatically to the
results screen.
YES
The oldest report(s) will be deleted and the new one(s) stored instead.
If the results are to be stored, then the instrument will request a customer number
(identification number of the report). This number will appear on the report.
When the number has been entered and confirmed with OK, the following screen will
appear momentarily.
This completes the storing of the results and the instrument will return automatically to
the results screen. The number that appears on the confirmation screen #00064 is the
serial number of the report registered by the analyser. The reports counter can be restar-
ted by the use of the madurPortable PC software.
There is a possibility of stopping and shortening the XL test.
If the function key
is pressed during the single XL test or during the X1 test (the
first test of tripple XL test) then the measurement is stopped and result is not stored. If the
13
Page 14
www.madur.com Manual
GA-12
plus
function key is pressed during the X2 or X3 test, the measurement is disrupted but
it’s result will be stored.
During the XL test, its result can be viewed. Pressing the key during displaying the
results screen, for a few seconds, the XL test results’ will be shown (averaged for the
period of time since the beginning of the test).
4.2. Action menu
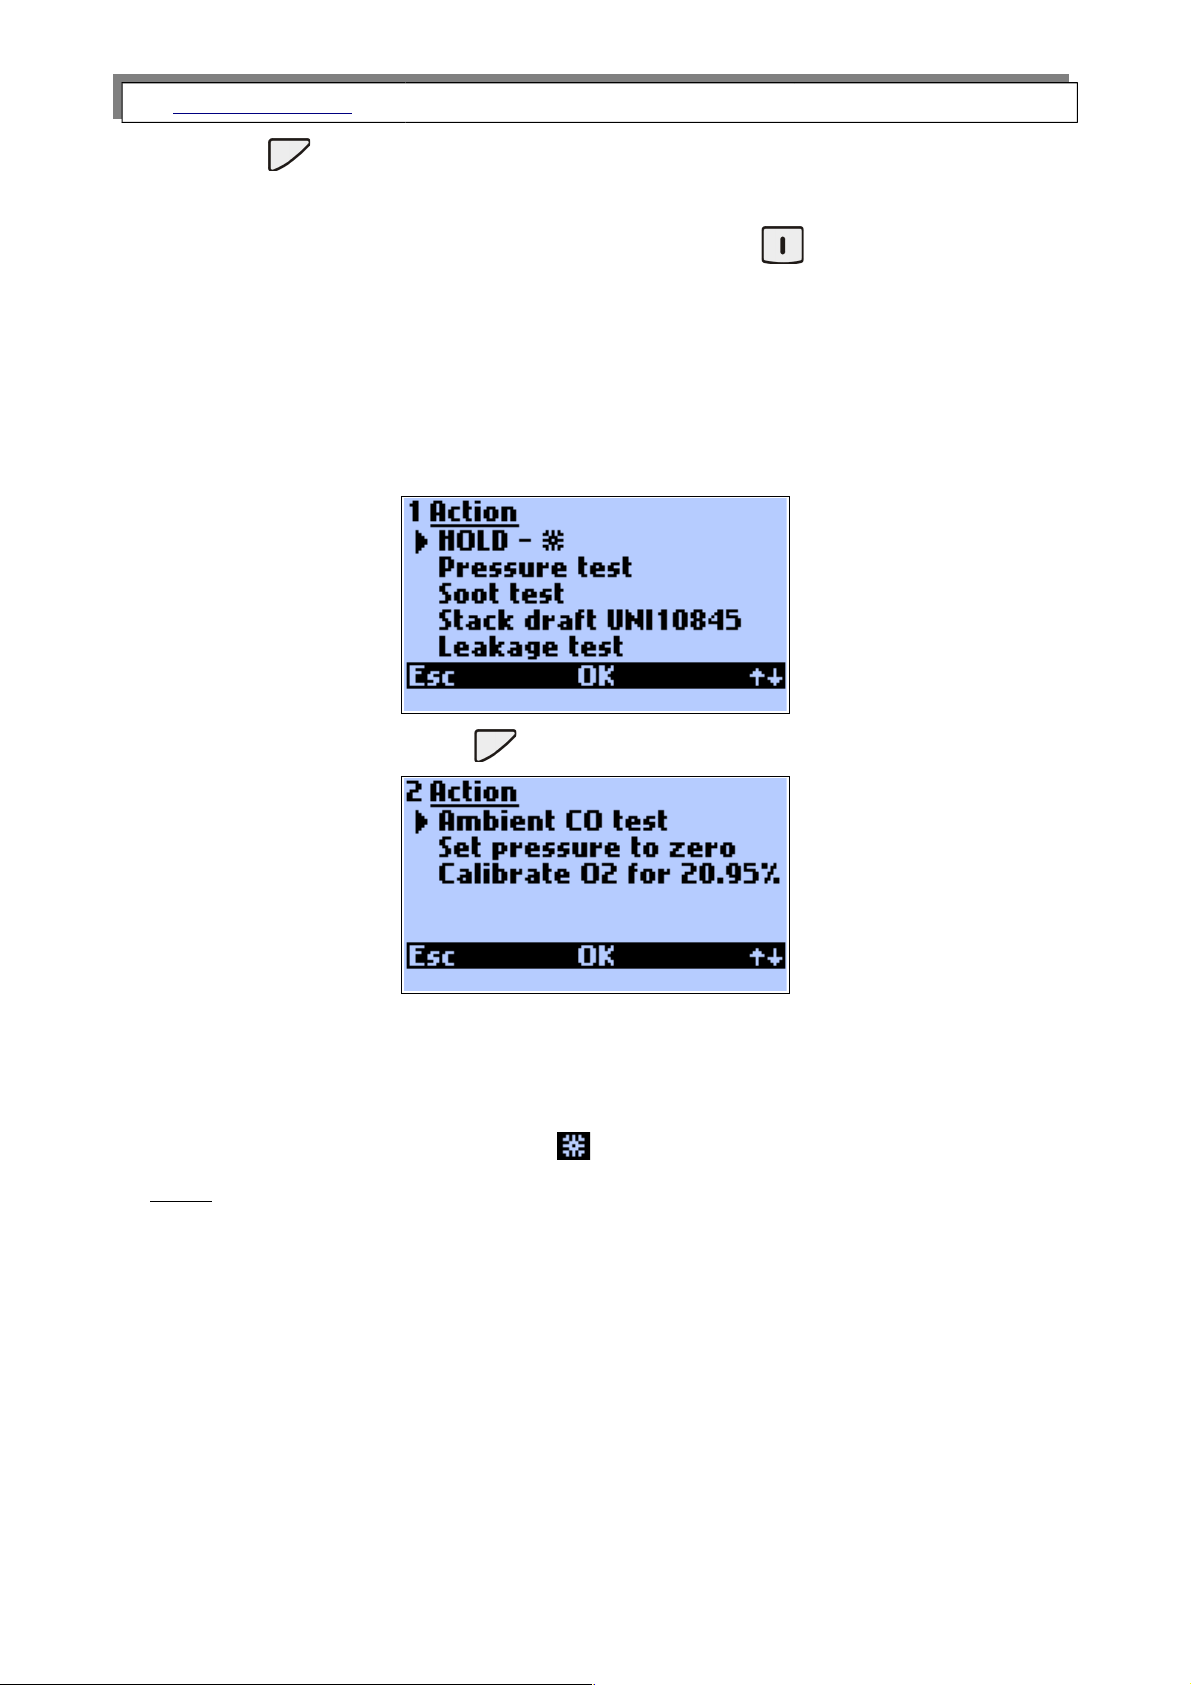
Pressing the centre function key on the results screen will open Action screen.
Pressing the right function key will switch to the second page:
Hold
The present measurement values are frozen and the screen will spring automatically to
the frozen values. Pressing the centre function key again will end the freezing of the val-
ues. Hold mode is signalised by flashing sign over the central function key.
Note:
Holding the measurement can hold the pump. Settings are made by the use
of the option „Pump stop when hold” from madurPortable PC program. If
this option is ticked every time the test is held the pump is turned off until
it’s restarted.
14
Page 15
www.madur.com Manual
GA-12
plus
Pressure test
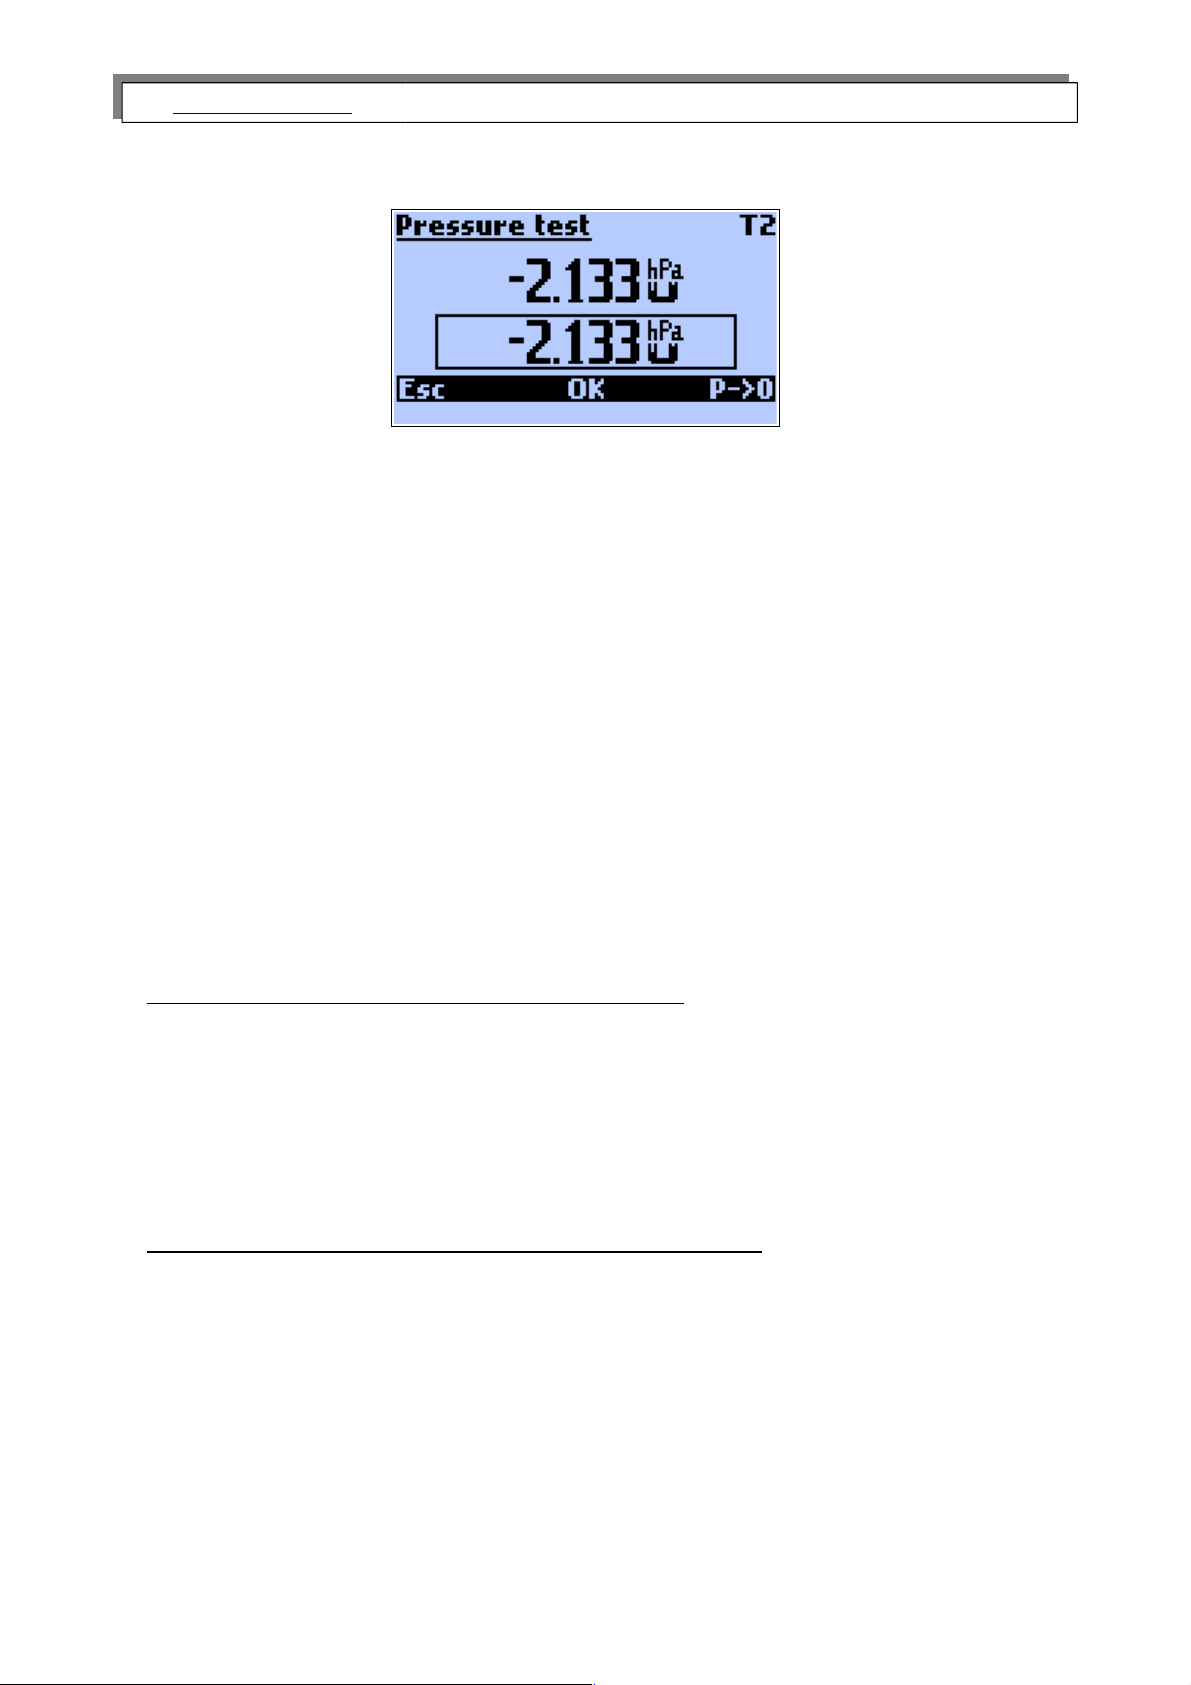
The following screen will appear:
The upper displayed value is the currently measured pressure value. The value in the
frame is the value stored for a printout or a report.
T2 in the right upper corner is the set averaging time. If the period of the time since the
beginning of the measurement is shorter than the chosen averaging time, the current av-
eraging time of the test will be displayed.
P->0 key is used for the zeroing of the sensor. It is important that during this process
there is no pressure applied to the sensor.
OK key stores the measured pressure value (it will appear in the frame at the bottom of
the display).
The value is stored until the next print of the results is done or the next report is stored,
later it is erased.
The pressure test is carried out differently for the instruments equipped with optional
pressure sensor and the instruments without one.
The analyser without the optional pressure sensor.
Only the single-inlet pressure measurement is available. This is carried out via the inlet
situated at the bottom of the instrument’s case. During the pressure test the pump must
be switched off (it is automatically switched off when the screen shown above appears on
the display). The pressure test can be carried out only when the Pressure test screen is
displayed. The flow velocity test carried out with the use of Pitot tube is not available.
The analyser with the optional differential pressure sensor
If the analyser is equipped with the optional differential pressure measurement sensor
(the inlets at the top of the analyser’s case) the differential pressure measurement is
available. The pressure measurement is carried out simultaneously to all the other meas-
urements. It is not necessary to hold the pump and the flow velocity test can be carried
out with the use of Pitot tube.
15
Page 16
www.madur.com Manual
GA-12
plus
Soot test
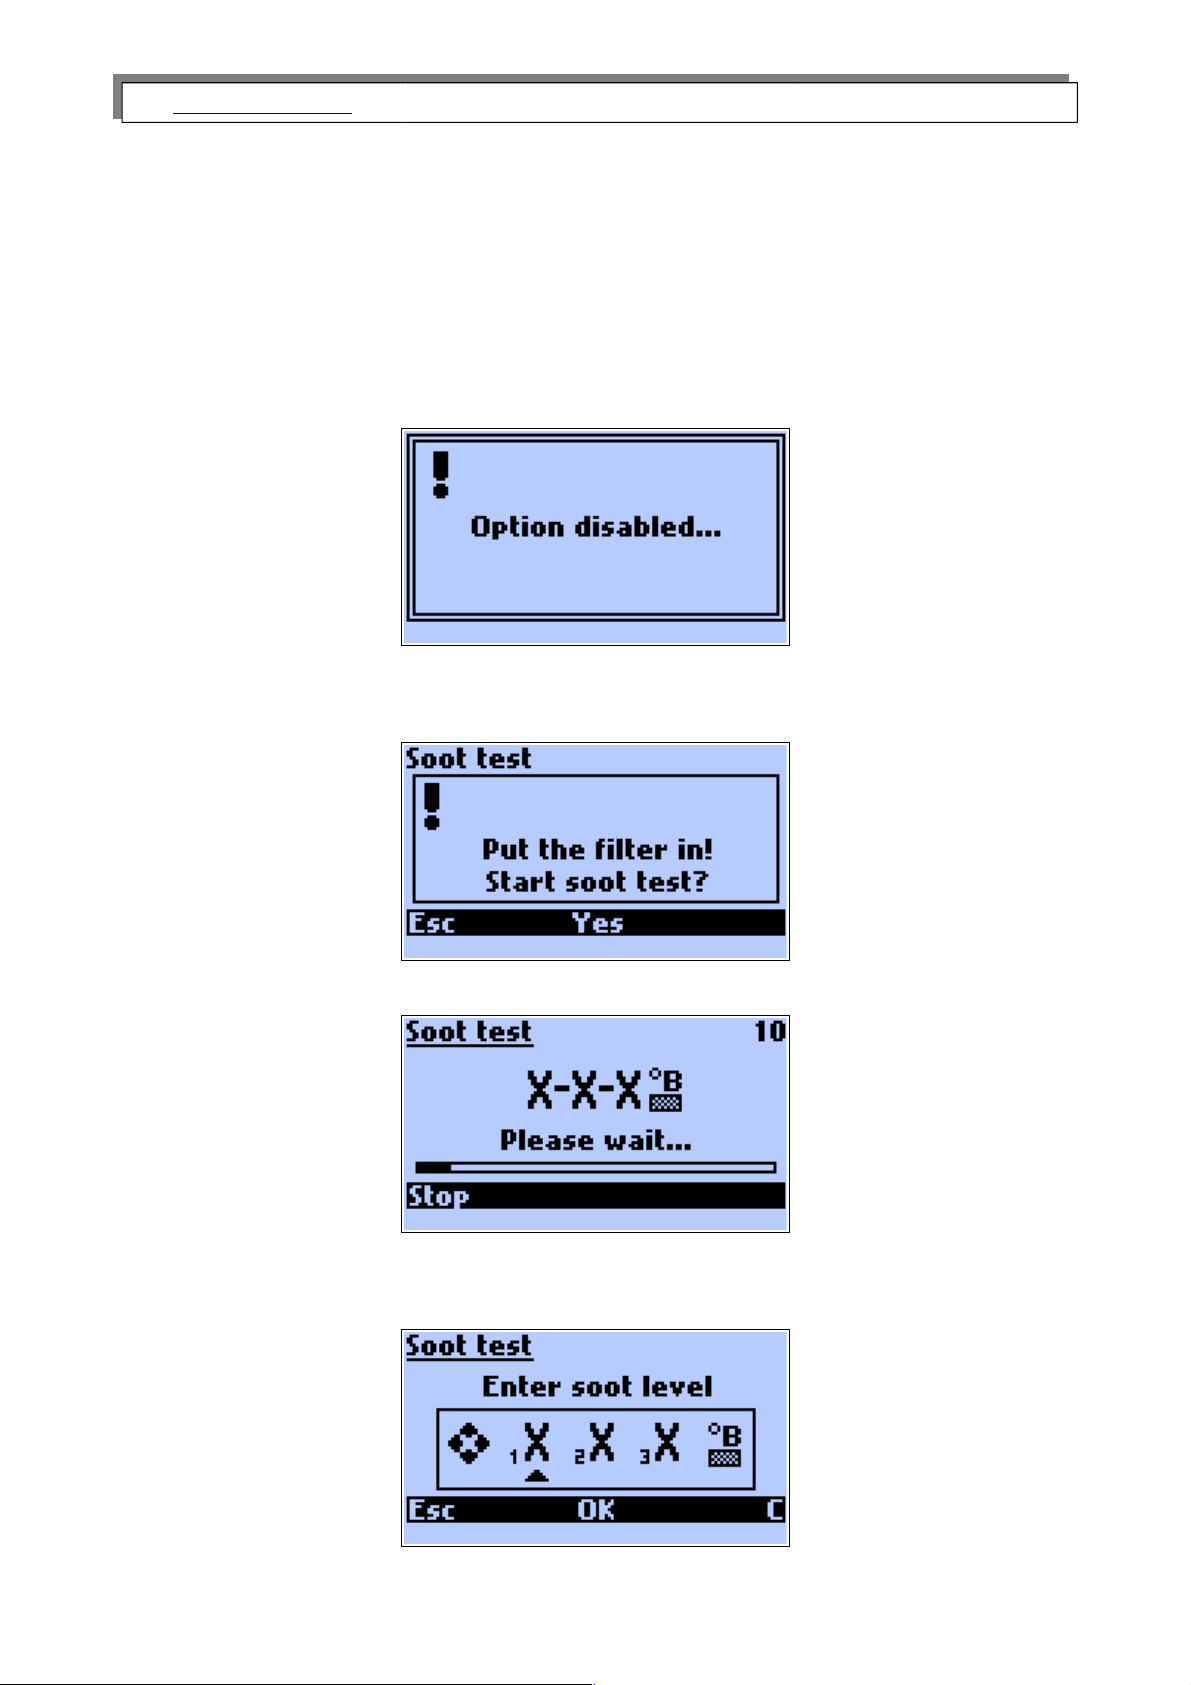
The soot test can be carried out provided that the analyser is being
supplied with energy from outside. The efficiency of the pump powered by
the inner battery is not enough to carry out the test. Also the heating
of the probe holder (necessary when carrying out the soot test) requires
that the instrument be powered by the mains adapter. If the instrument
is not powered by the mains adapter the following screen will appear:
The user should plug the mains adapter to the instrument. After choosing the option
Soot test the user will be asked to put the filter in.
After confirmation the measurement will begin.
The measurement can be disrupted with function Stop.
Once the measurement is finished the following screen will appear.
16
Page 17
www.madur.com Manual
GA-12
plus
With the use of arrow keys the value taken from the comparative scale should be filled
in and confirmed with OK key. It is possible to save three mesurements results (1X, 2X,
3
X) which will be visible in a saved report.
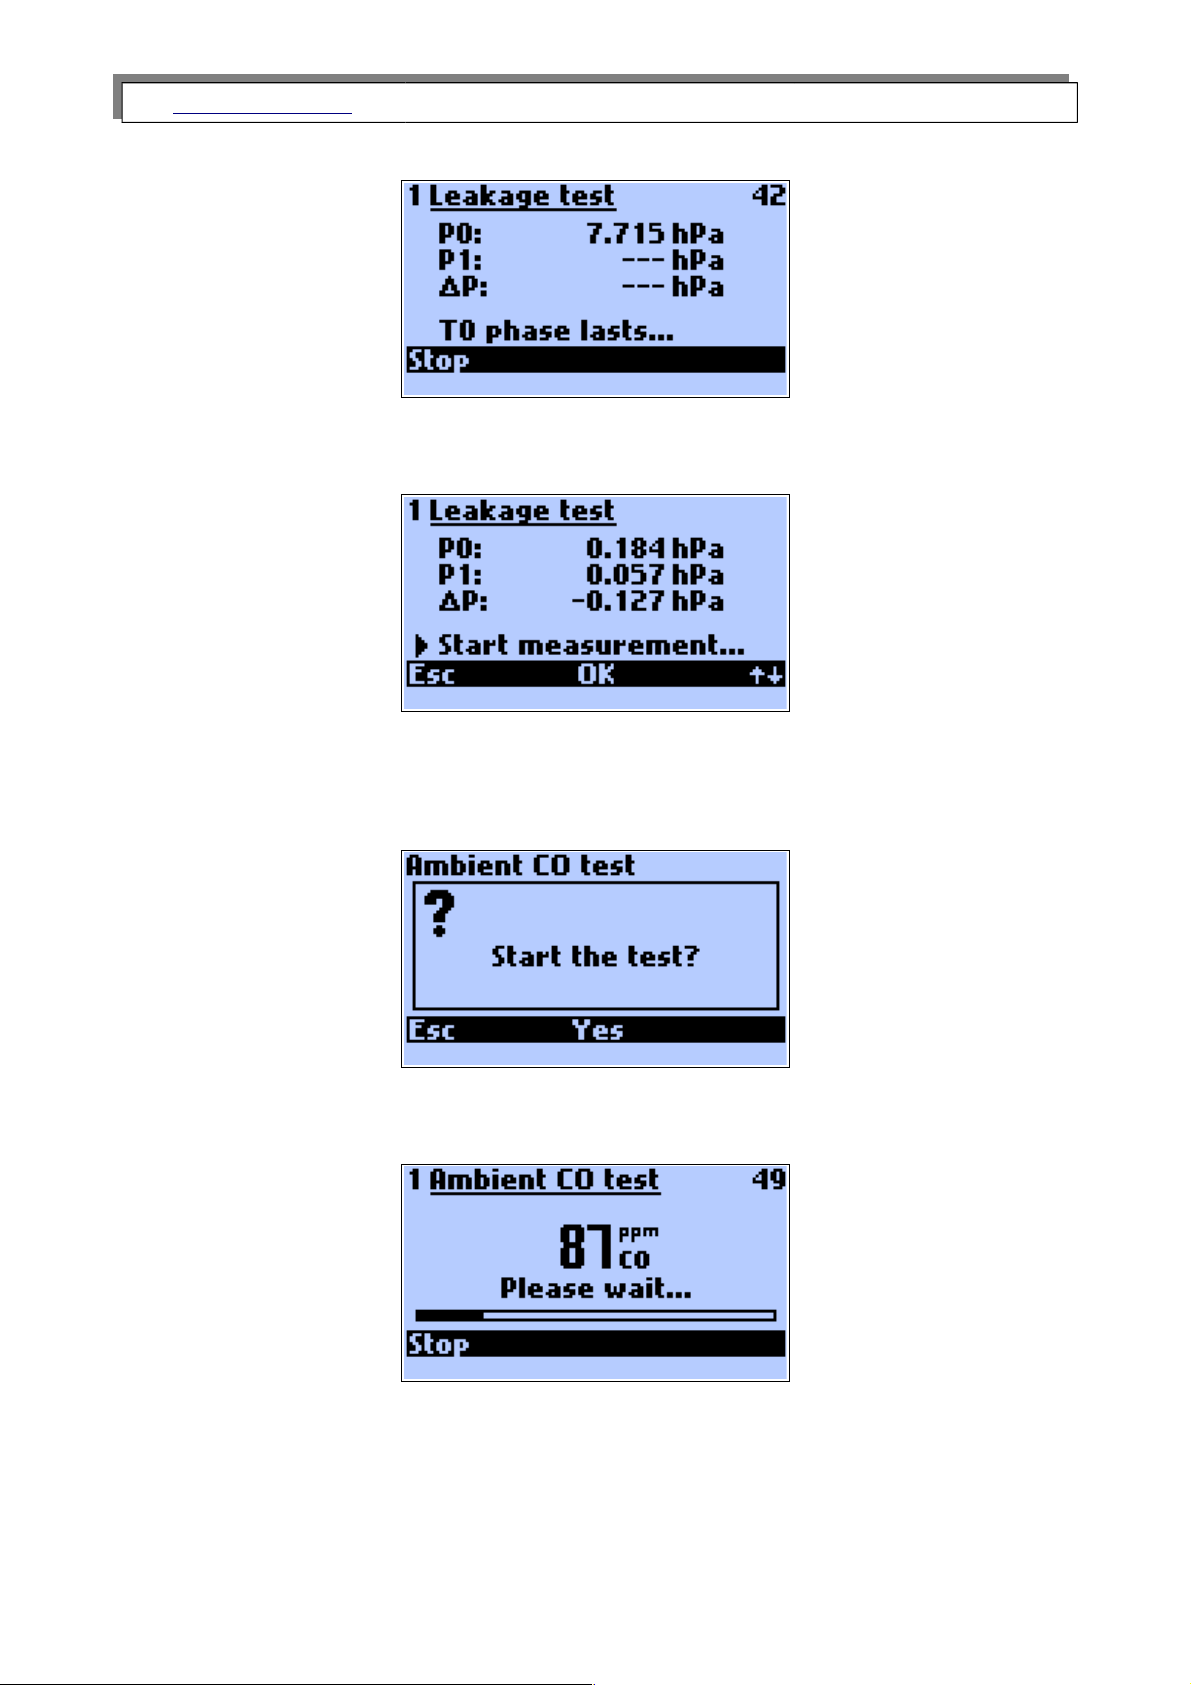
Leakage test
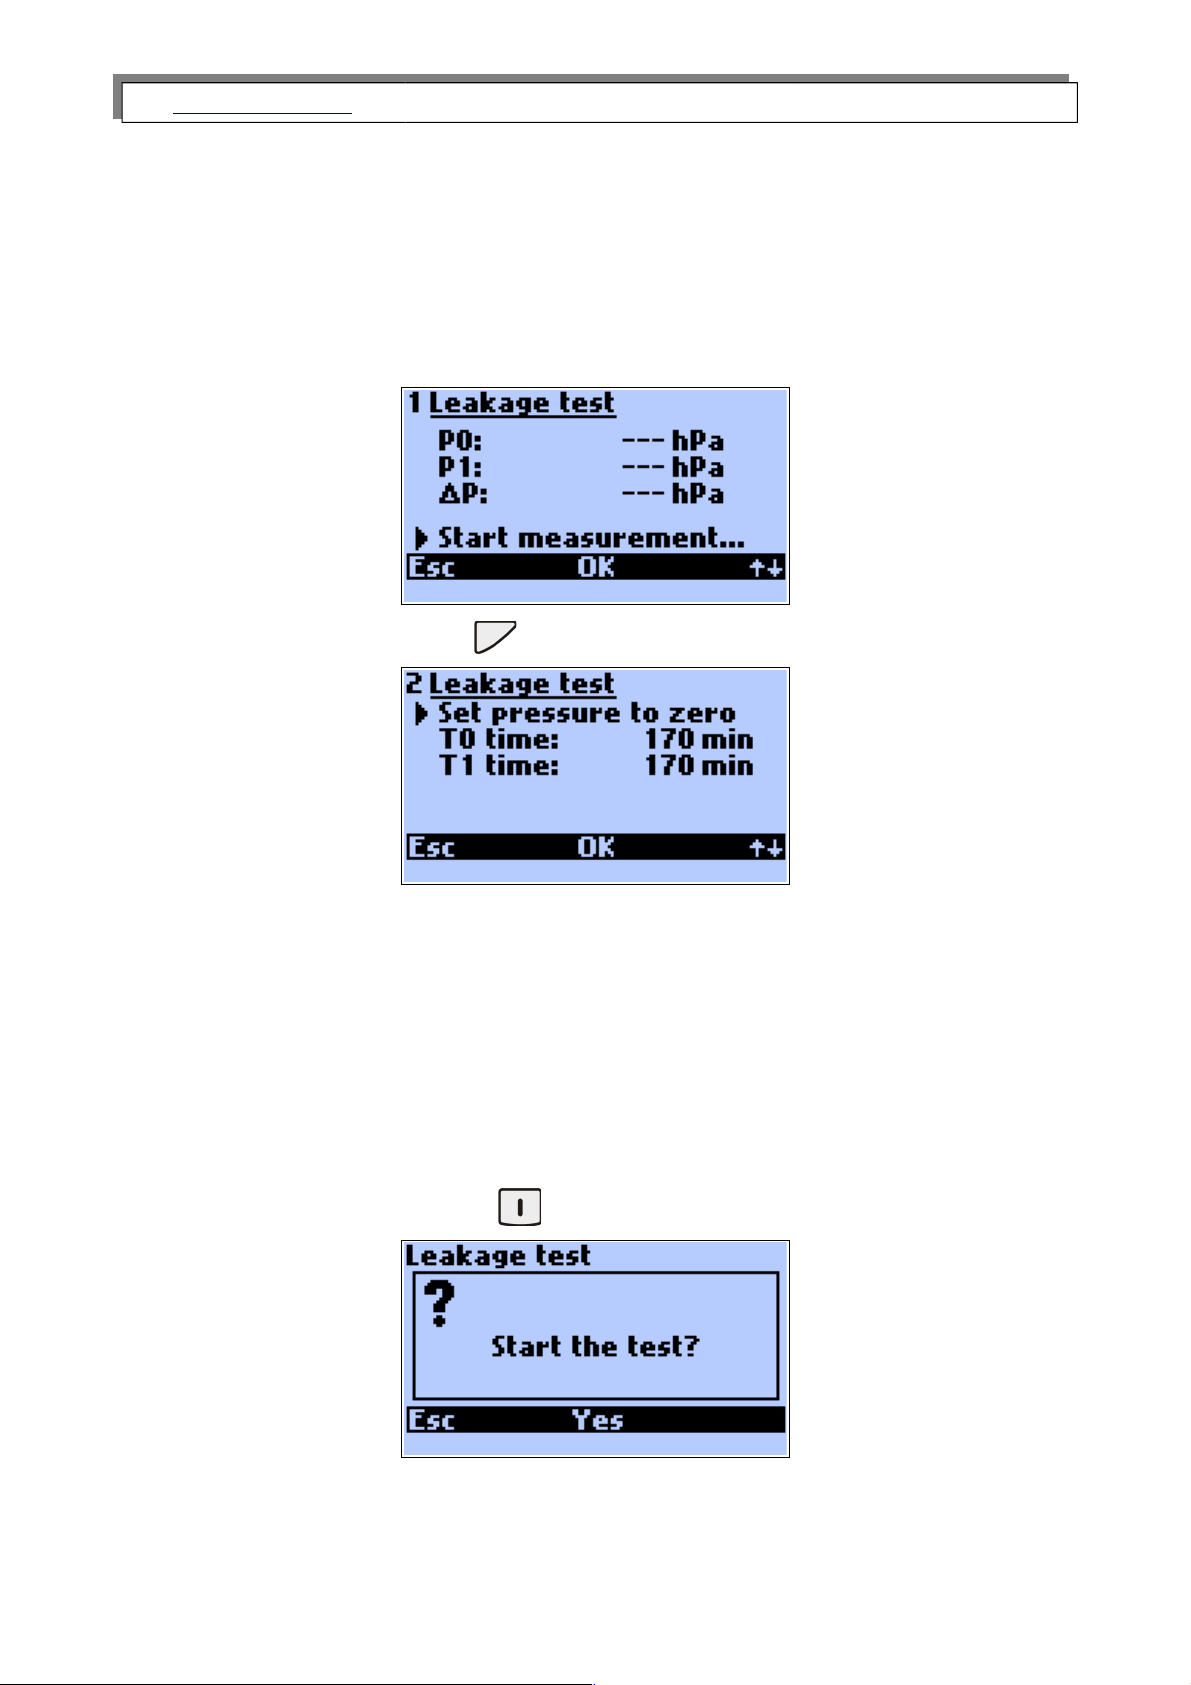
This option is used to check the pressure tightness of the measured circuit. Analysers
makes two test using pressure sensor and compares them.
Pressing the right function key will switch to the second page:
P0 – first pressure test result
P1 – second pressure test result
ΔP – difference between P0 and P1 results
Set pressure to zero – zeroes the pressure sensor
T0 time – time of the first pressure test (1min. to 15 min.)
T1 time – time of the second pressure test (1min. to 15 min.)
Pressing the middle function key on the first screen starts the test
17
Page 18
www.madur.com Manual
GA-12
plus
After confirmation the first test starts followed by the second one.
After the first and the second test summary will provide information about the pressure
tightness.
Ambient CO test
This option is used to measure the ambient CO level. After this option is chosen the
user will be asked if he want to start the test.
After confirmation the measurement will begin.
The measured value of ambient CO will be stored and will appear in the next report.
Set pressure to zero
This option is used to zero the pressure sensor.
18
Page 19
www.madur.com Manual
GA-12
plus
Calibrate O2 for 20.95%
In order to increase the accuracy of long-period measurements GA-12
plus
has the pos-
sibility of calibrating the O
2
sensor on demand. Before choosing the command Calibrate
O2 for 20.95 % the probe should be removed from the stack and the readings should be
stabled. Calibration of the O
2
sensor can be followed by the zeroing of all the other gas
sensors. Suitable settings can be done via madurPortable PC program.
4.3. Chart
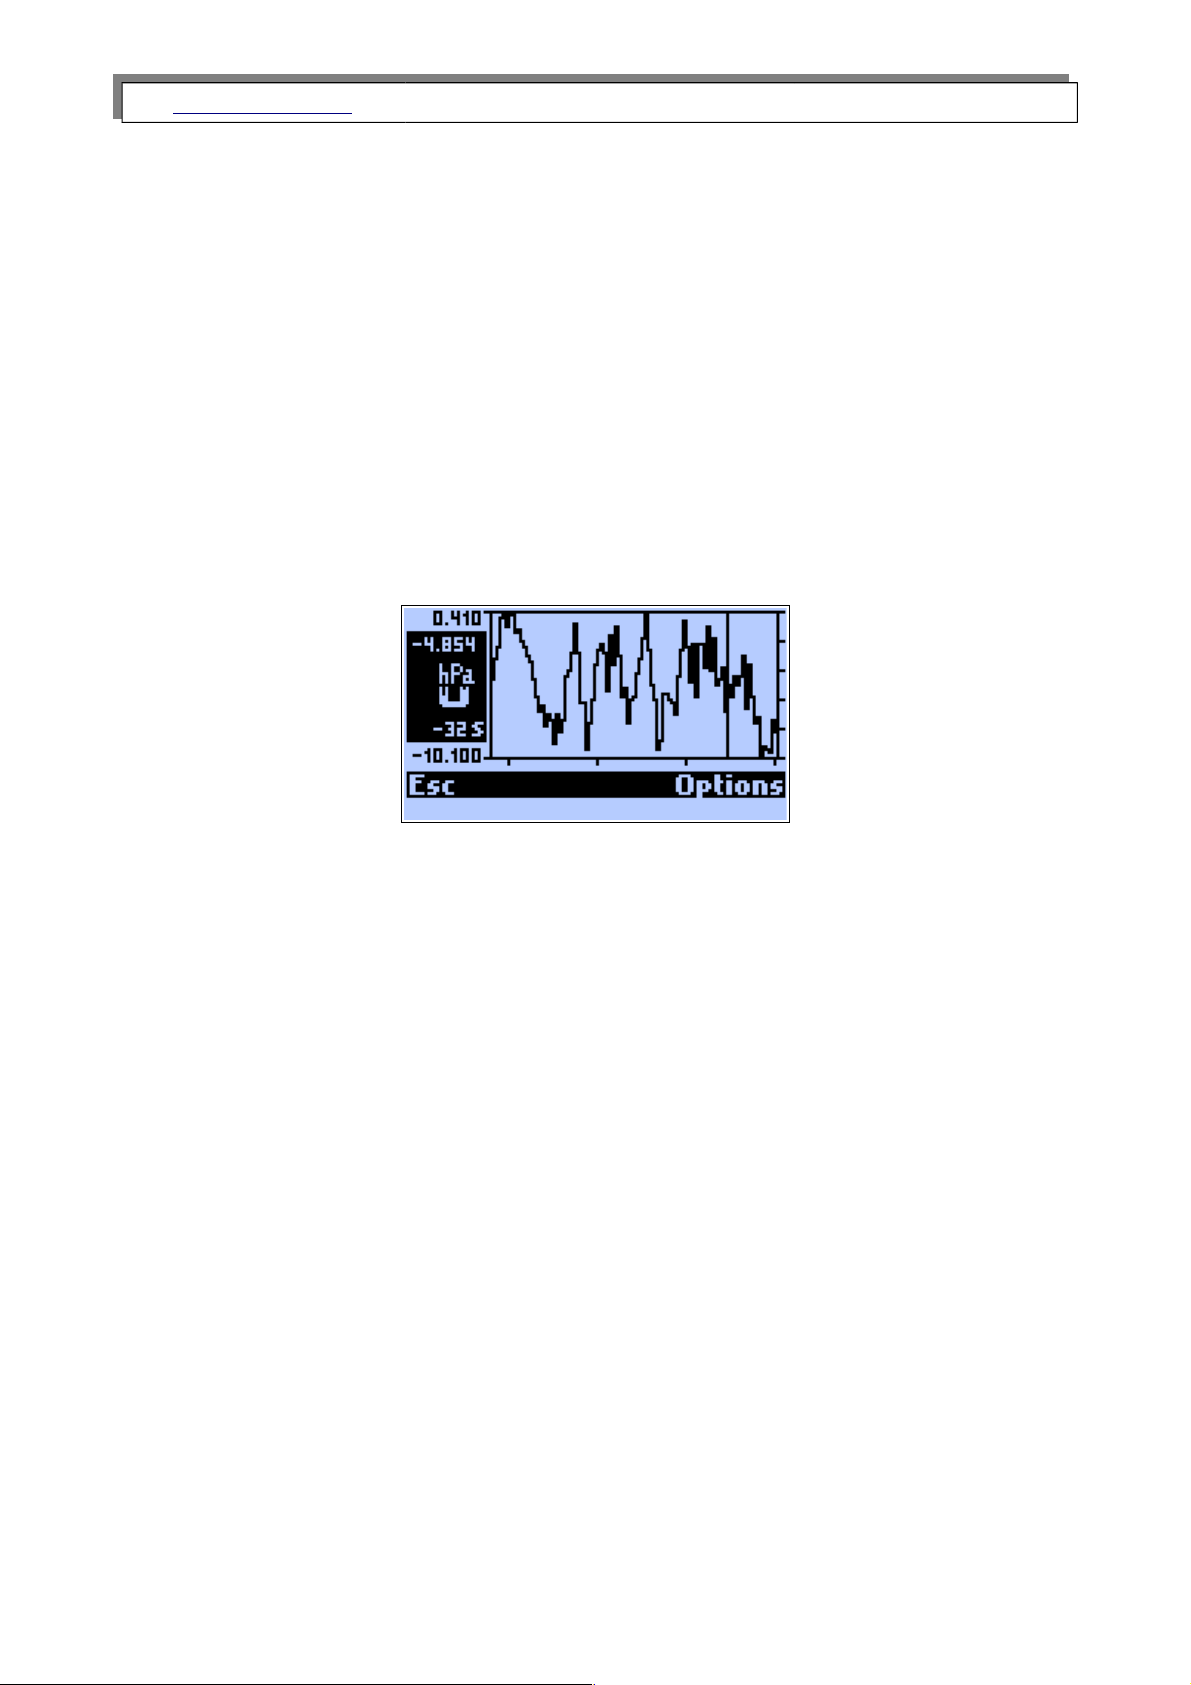
The instrument can display the measurement results for the last 190 seconds. The
most recent value is on the right-hand side of the chart. The arrow left/right keys are used
to scroll the marker enabling one to read the exact value at each point of the chart.
the values on the left have the following meanings:
● Maximum value of the Y axis (here 0.410).
● Current value or, when the marker is activated, the marker value (here -4.854).
● The unit (here hPa). This appears automatically with the variable.
● The variable (here pressure). The arrow up/down keys can be used to scroll
through the variables.
● Marker time (here –32s). This means the marker stands on the value that was
recorded 32 seconds earlier.
● Minimum value of the Y axis (here -1.100)
19
Page 20
www.madur.com Manual
GA-12
plus
The menu bar
ESC
Leaves the Chart and returns to the results screen.
Options
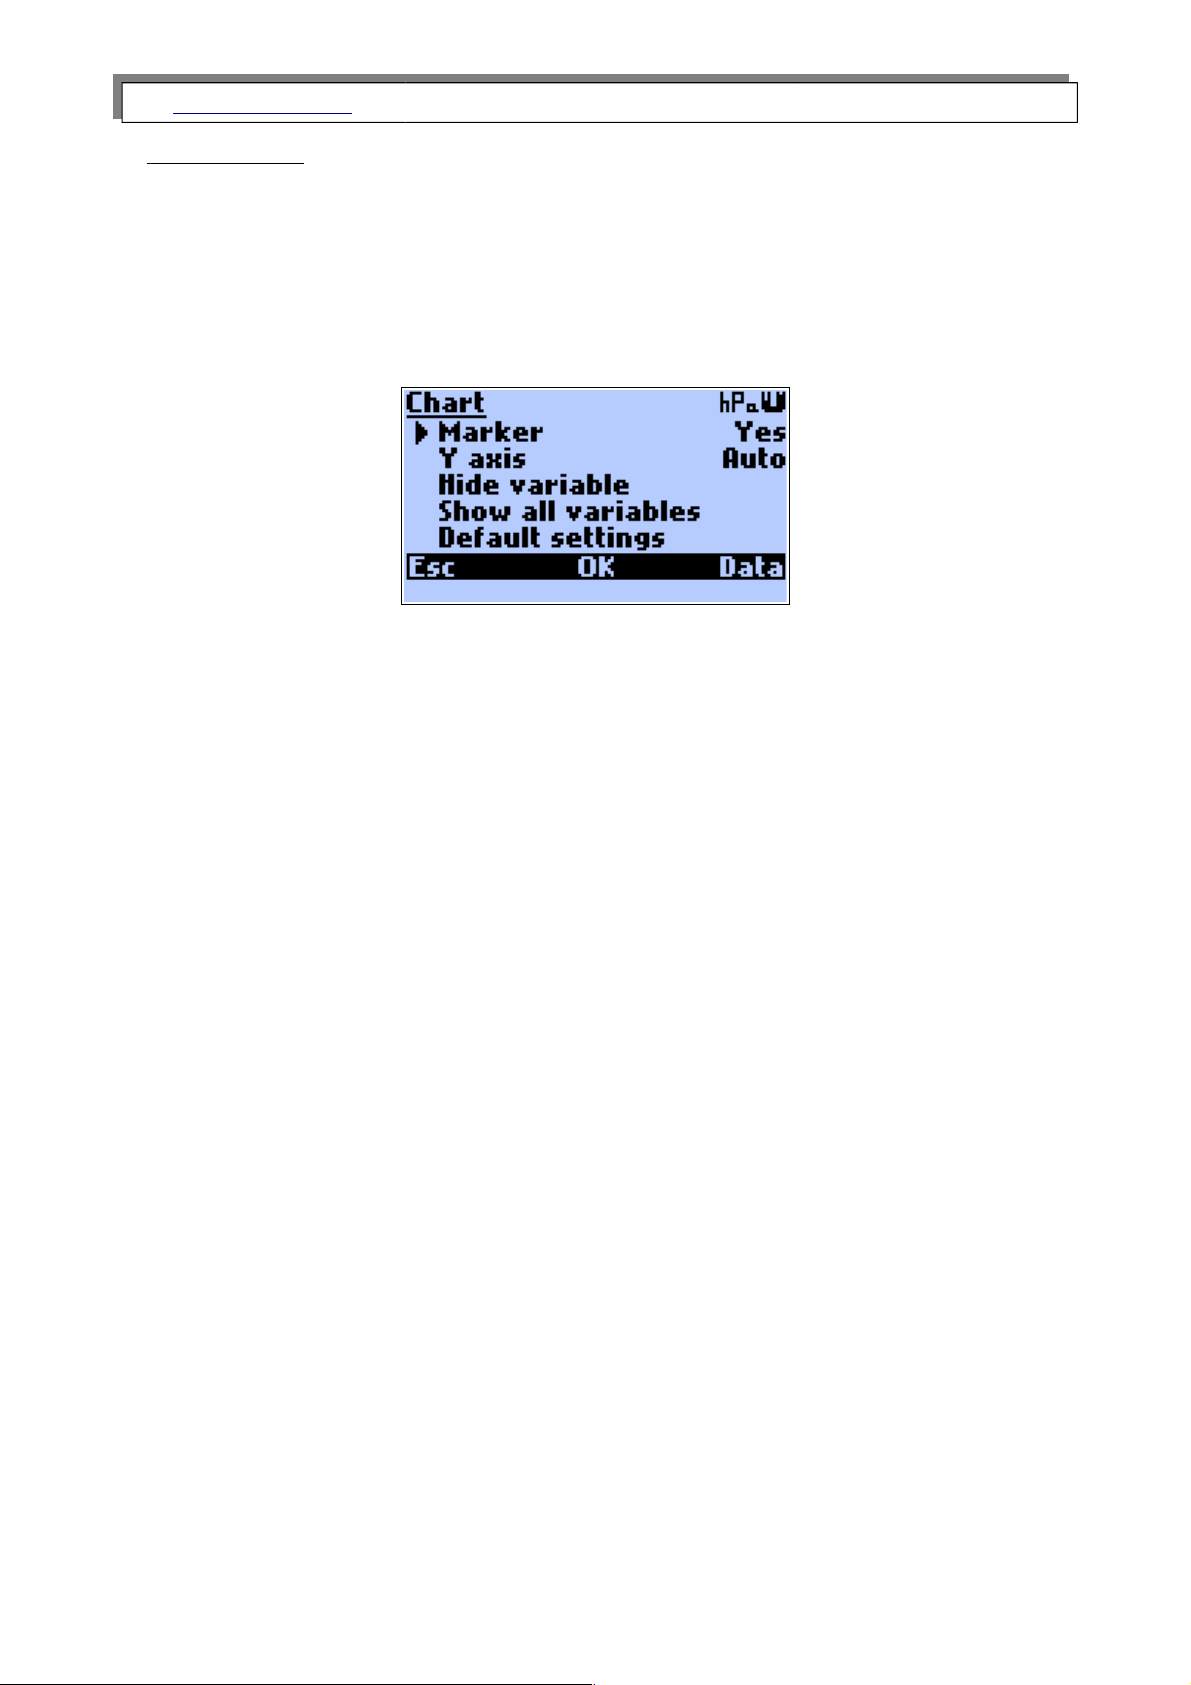
This opens the window for the Chart settings. The following screen appears:
Description of the options:
Marker
Switches the marker on or off.
Y Axis
The scale system for the Y-axis can be set. These are the options:
◦ Auto (automatic scale) – the instrument chooses according to the measured val-
ues.
◦ Manual – can be set by the user with the madurPortable PC program.
◦ Full – done according to the measurement range of the variable
Hide variable
After confirmation with OK the variable will no longer be shown on the chart. Can
be re-activated using Show all variables or with the madurPortable program.
Show all variables
After confirmation with OK the instrument will show all measured and calculated
variables on the chart.
Default settings
After confirmation with OK the instrument will show some important measured and
calculated results: O2, CO, ETA, Lambda, Tgas.
20
Page 21
www.madur.com Manual
GA-12
plus
4.4. Measurement parameters
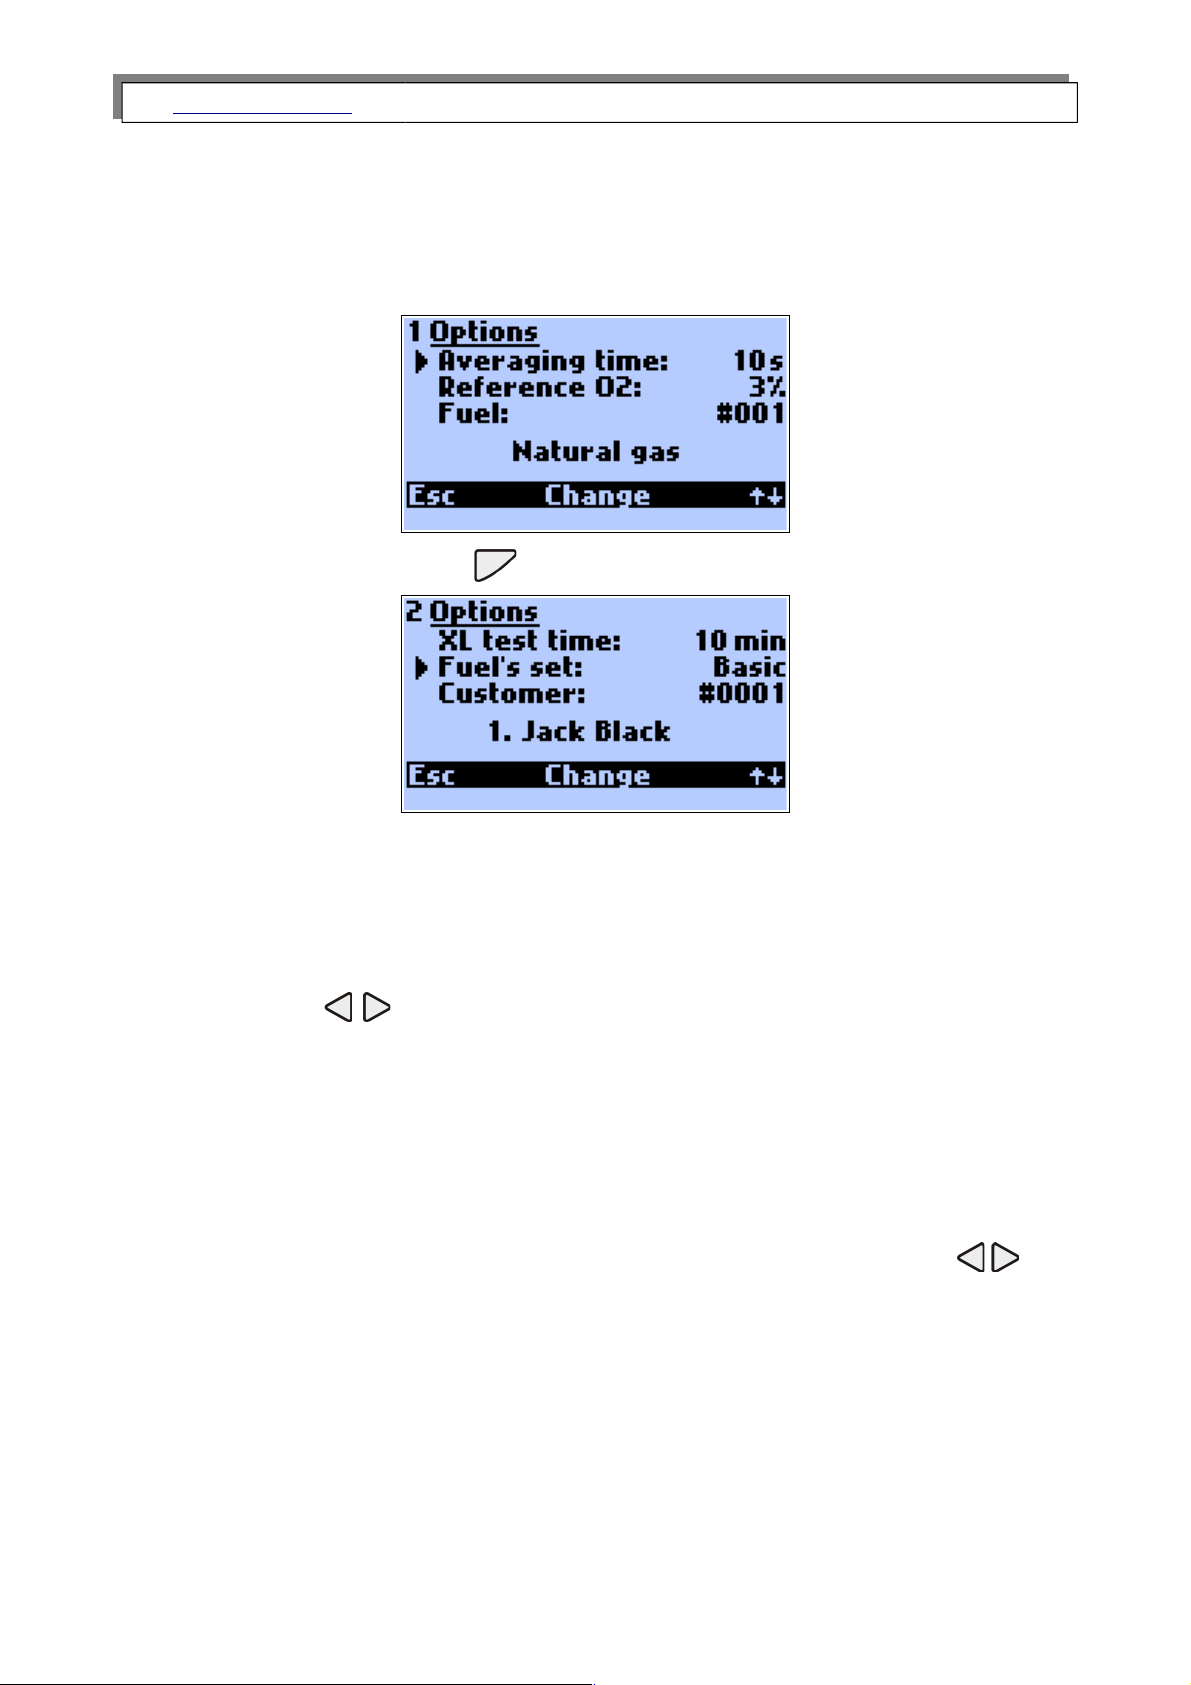
The right function key will access Options from the results screens.
The following screen appears:
Pressing the right function key will switch to the second page:
Averaging time
The averaging times ranging from 2 to 180 seconds can be set using the arrow left/right
key.
Reference O2
By using arrow keys or the function key Change reference O2 value can be
changed in the range 0-13% O2.
Note: If option „Use O
2ref
from fuel data” was ticked in service program madur-
Portable then there is no possibility to change the reference oxygen in the
instrument, this value is adopted from defined fuel parameters.
Fuel
The following 6 fuels can be set using the function key Change or the arrow :
Basic fuels
0- Light oil
1- Natural gas
2- Town gas
3- Coke-oven gas
4- Liquid gas
5- Extra light oil
21
Page 22

www.madur.com Manual
GA-12
plus
There are also 4 memory locations (6-9) for 4 fuels specific to the user which can be
freely programmed by the user. This is carried out using the madurPortable PC program.
There is a possibility to replace the first standard fuels with the set of ÖNORM or Italian
fuels. This can be chosen on the second page of option menu in Fuel's set line.
The Austrian fuels:
1- Erdgas
2- Flüssiggas
3- Heizöl HEL
4- Heizöl EL
5- Holz
6- Kohle
The italian fuel set
1- Gas naturale
2- GPL
3- Gasolio
4- Olii combustibili
5- Pellets
XL test
Using the key Change or arrow left/right key allows setting the XL test time. The following val-
ues are available:
10sec - 20sec - 30sec - 1min - 2min - 5min - 10min - 15min - 20min – 30min
Customer
By using arrow keys or the function key Change customer data can be changed.
Customers can be defined in madurPortable PC program.
22
Page 23
www.madur.com Manual
GA-12
plus
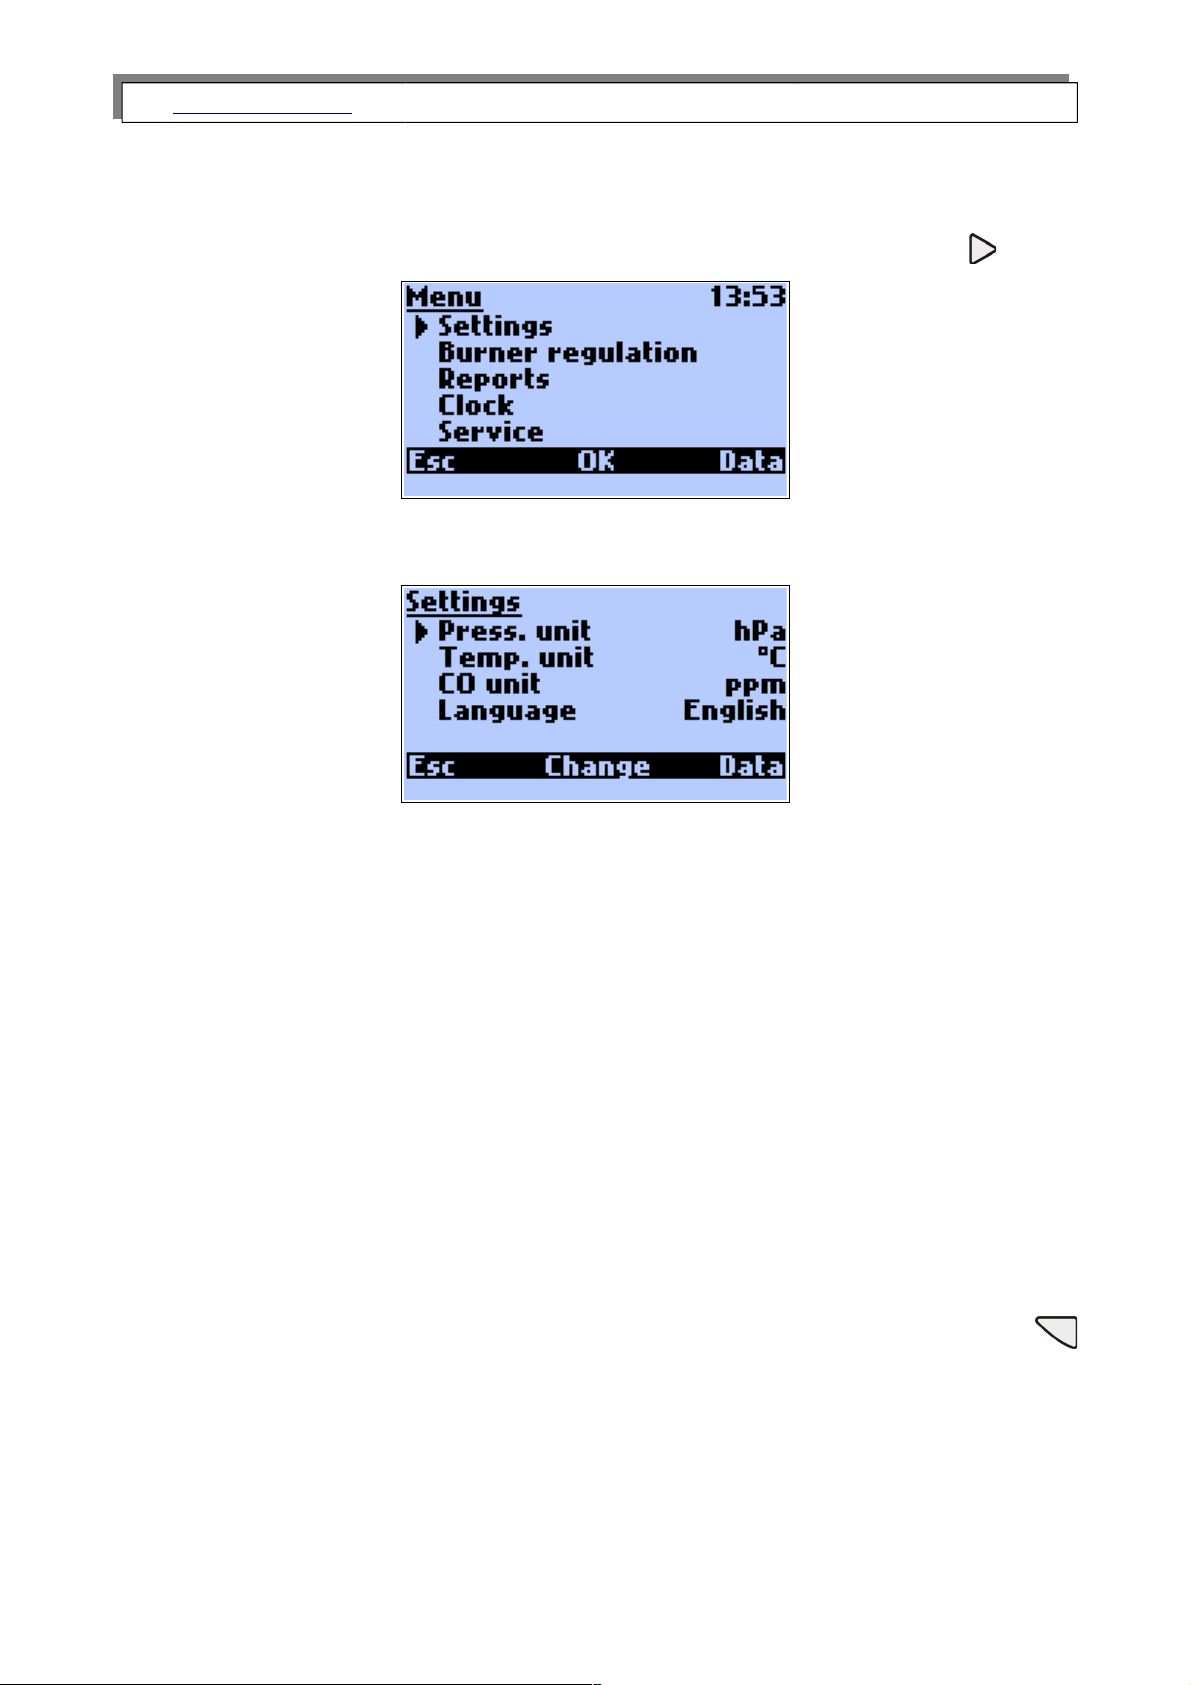
4.5. Main menu
From the results screen the Menu option is available after the use of the key: .
4.5.1. Settings
The Settings Menu can be used to change following parameters:
Pressure unit
There are four pressure units available: hPa, Pa, mmH2O and inH2O.
Temperature unit
Two units are available: °C and °F.
CO unit
There are two units available: % and ppm. % is available only if the sensor with
a widened CO range (10%) has been installed.
Language
The instrument is pre-programmed with a number of languages. There is also a possib-
ility of downloading an additional language through madurPortable program. In case of
an accidental language change (when having problems with finding the proper setting in
the analyser’s menu) it is possible to restore the default language by keeping the key
pressed when starting the analyser. The choice of the default language is made in madur-
Portable program.
23
Page 24
www.madur.com Manual
GA-12
plus
4.5.2. Burner regulation
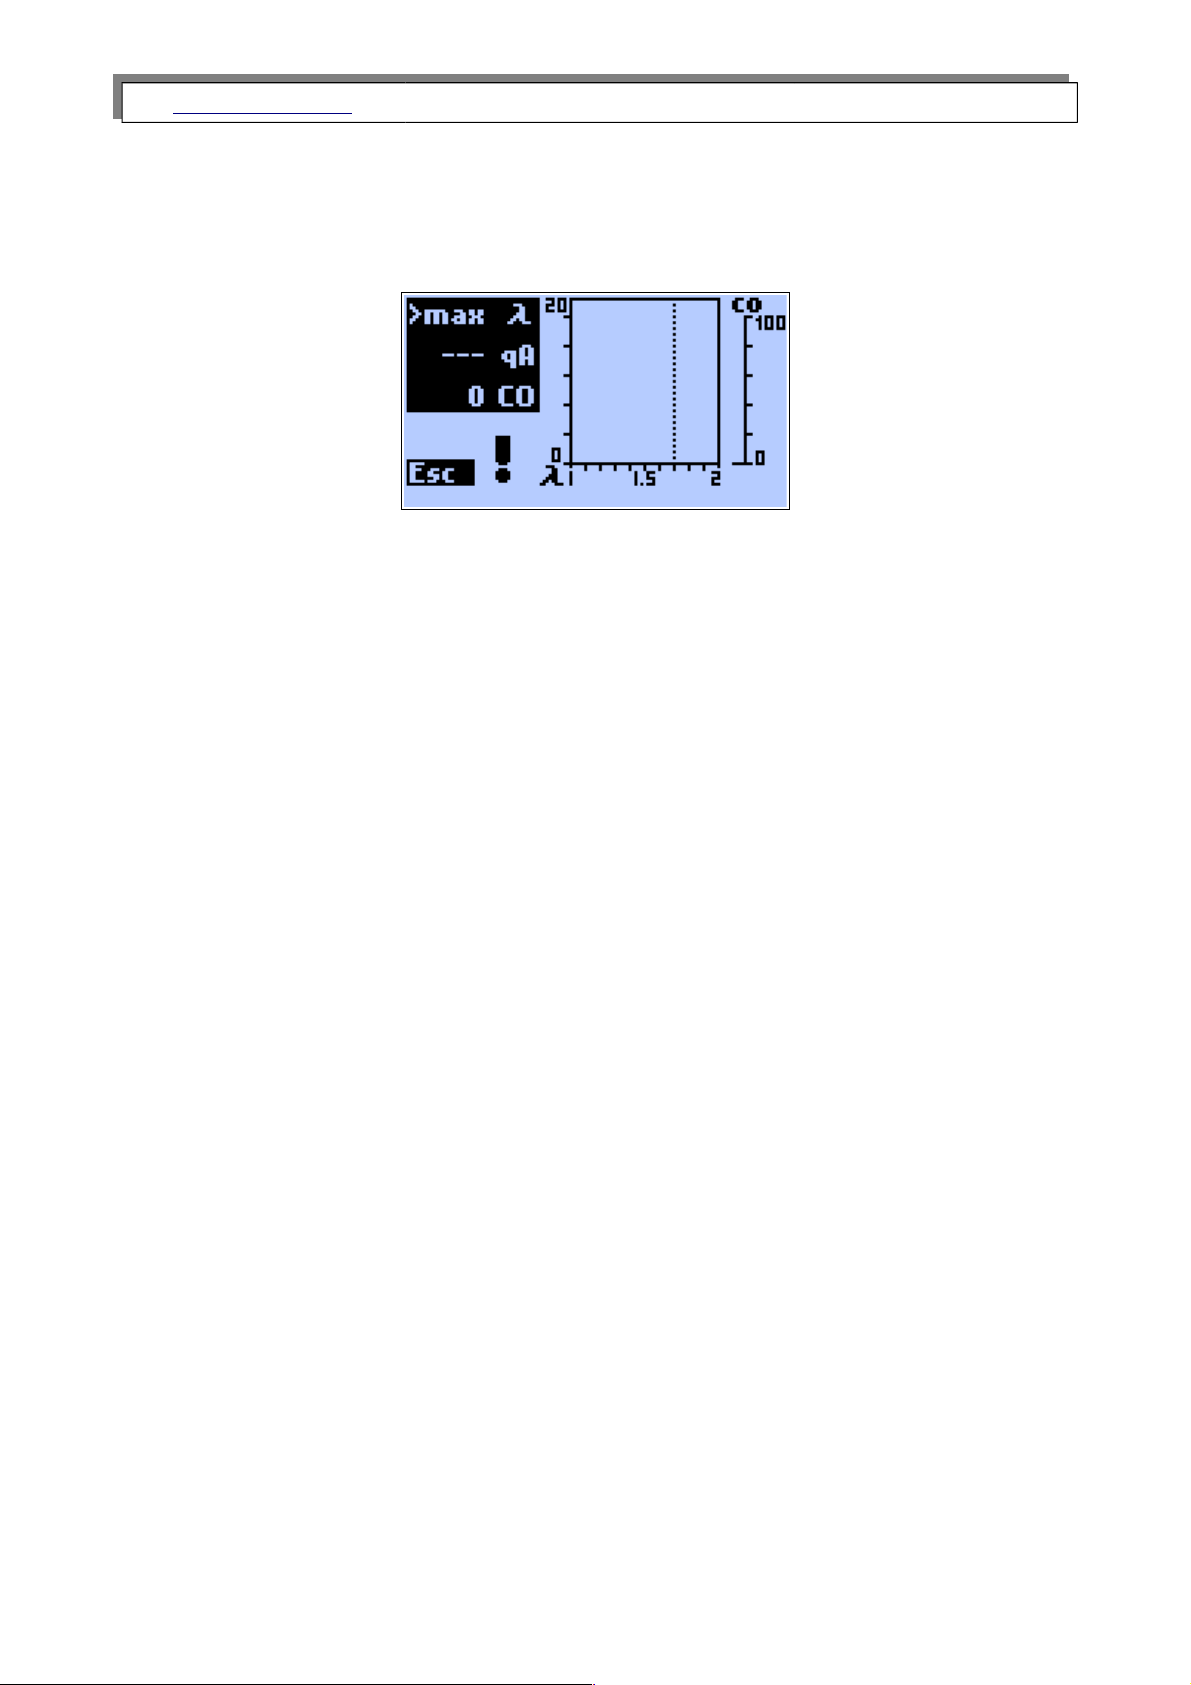
This option allows the combustion process in a burner to be visualised. Three variables
that define the combustion process are shown graphically.
These are:
CO – carbon monoxide concentration
qA – stack loss
Lambda – Excess air
All three appear on the screen at the same time. This means that the dynamic connec-
tion between all the variables is easily seen and the air inlet can be adjusted for optimal
combustion.
• qA is shown as a diagonal straight line that will move up or down when adjustments
are made. This is shown in the range 0…20 %.
• Lambda is a is a vertical straight line, which will move left/right during adjustment. This
is shown in the range 1…2.
The user can also set two markers to define the desired range for Lambda. If the
Lambda becomes larger then the value defined by the right marker, an arrow on the left-
hand side points downwards meaning that the air flow must be reduced. If the value
becomes smaller then the value defined by the left marker the arrow points upwards
meaning that the air flow should be increased.
On the right-hand side of the display the CO concentration indicator is shown (used
range: 0 – 100ppm)
24
Page 25
www.madur.com Manual
GA-12
plus
4.5.3. Reports
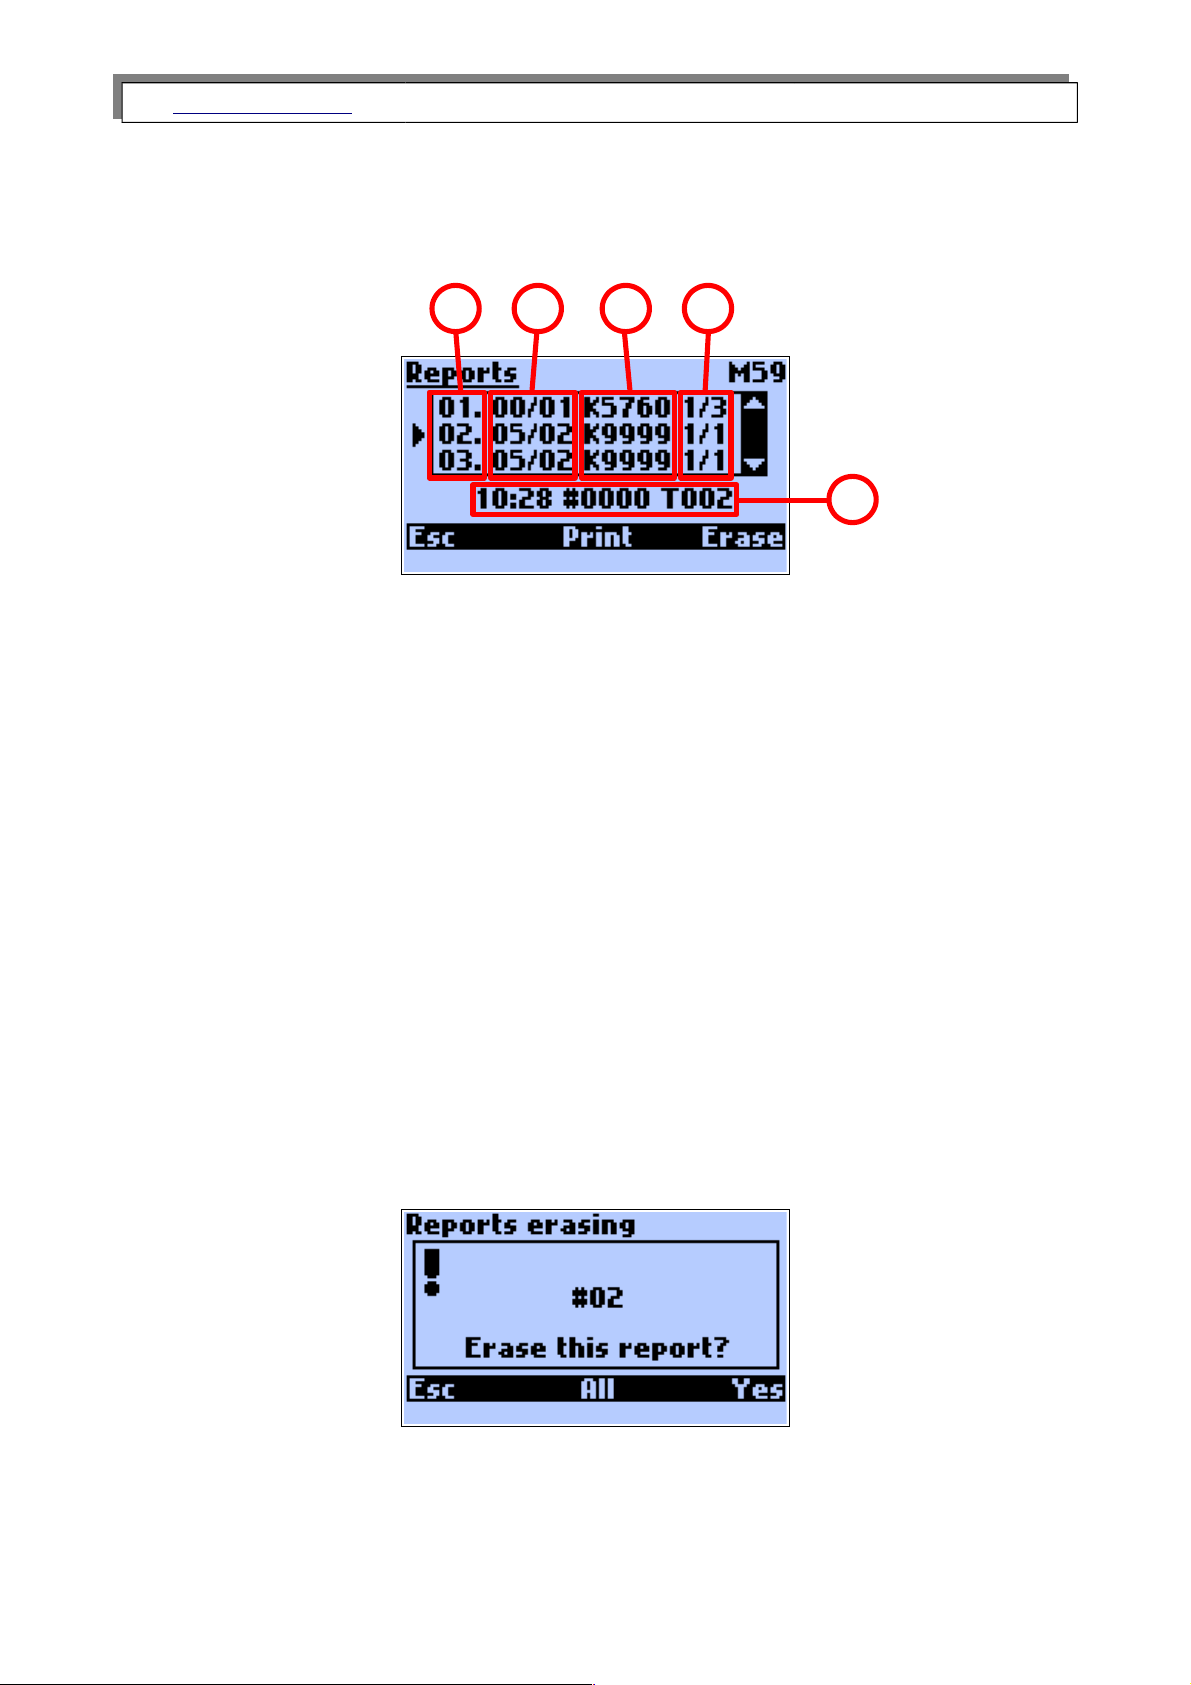
This option is used to administrate the stored reports.
The fields have the following meanings:
A. The report number given to the report within the reports table (1..64).
B. The creation date of the report. Displayed in the format defined in the menu Clock.
C. The customer’s number.
D. These numbers inform the user of whether the report is a single one; or the
first/second or the third of the three reports of a triple XL test – 1/3, 2/3, 3/3
E. In this field the additional information on the marked report will be displayed. This
includes the exact creation time of the report – 10:28, the serial number of the re-
port registered by the analyser #0000 and the averaging time – in this case two
seconds.
In the right-hand upper corner the information on how many memory spaces are still
available is displayed.
Esc returns to the Menu. To erase the report use the Erase button; the confirmation
screen will be displayed.
Pressing Esc returns to previous menu. Pressing Yes will erase the chosen report,
pressing All will delete all stored reports.
25
A
B C D
E
Page 26
www.madur.com Manual
GA-12
plus
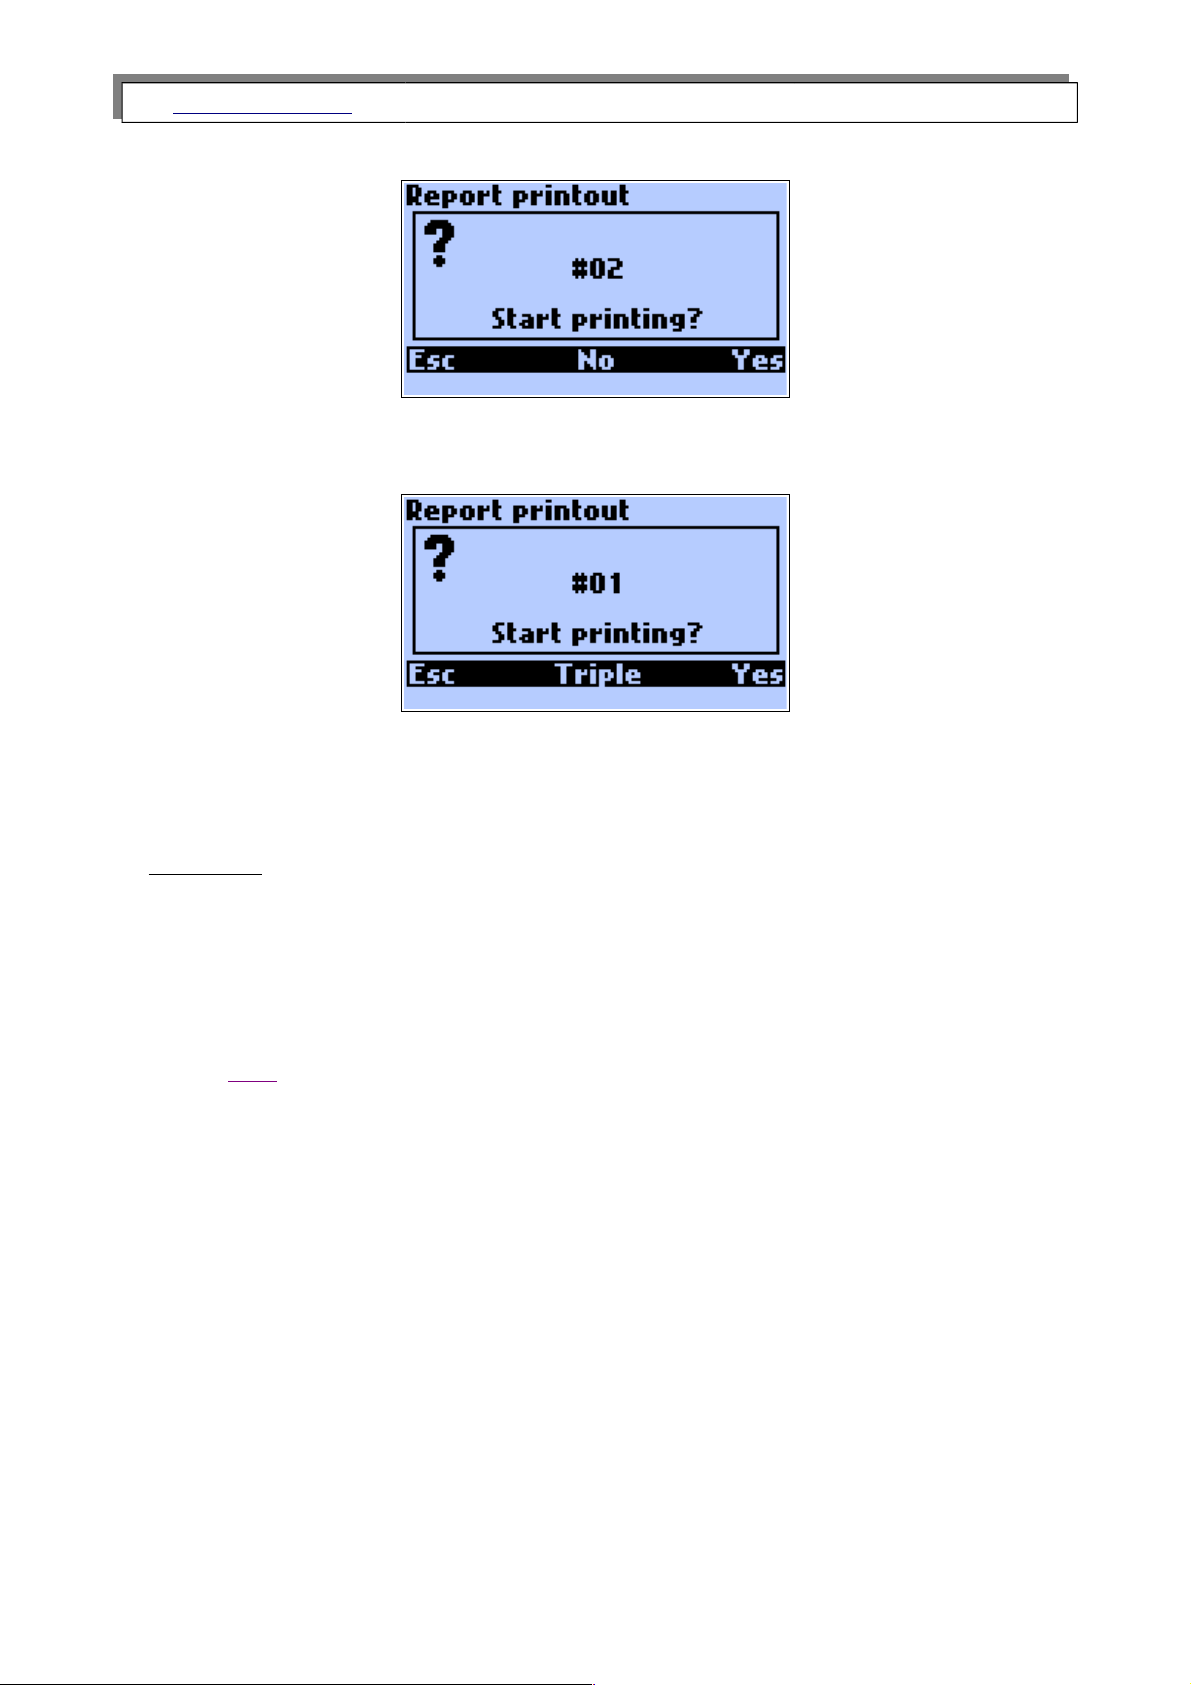
After pressing the Print key the following screen will appear:
Using Esc or No returns to the previous screen, choosing Yes starts printing. If the
chosen report is a one from the triple XL test report, the following screen is displayed:
Choosing Triple causes averaging and printing all three parts of triple report as
a whole.
Attention!
Check if the printer is on and it’s receiver is near the upper edge of the
analyser.
It is also possible to define printing format. This can be done only in the window Print
see point Print.
26
Page 27
www.madur.com Manual
GA-12
plus
4.5.4. Clock
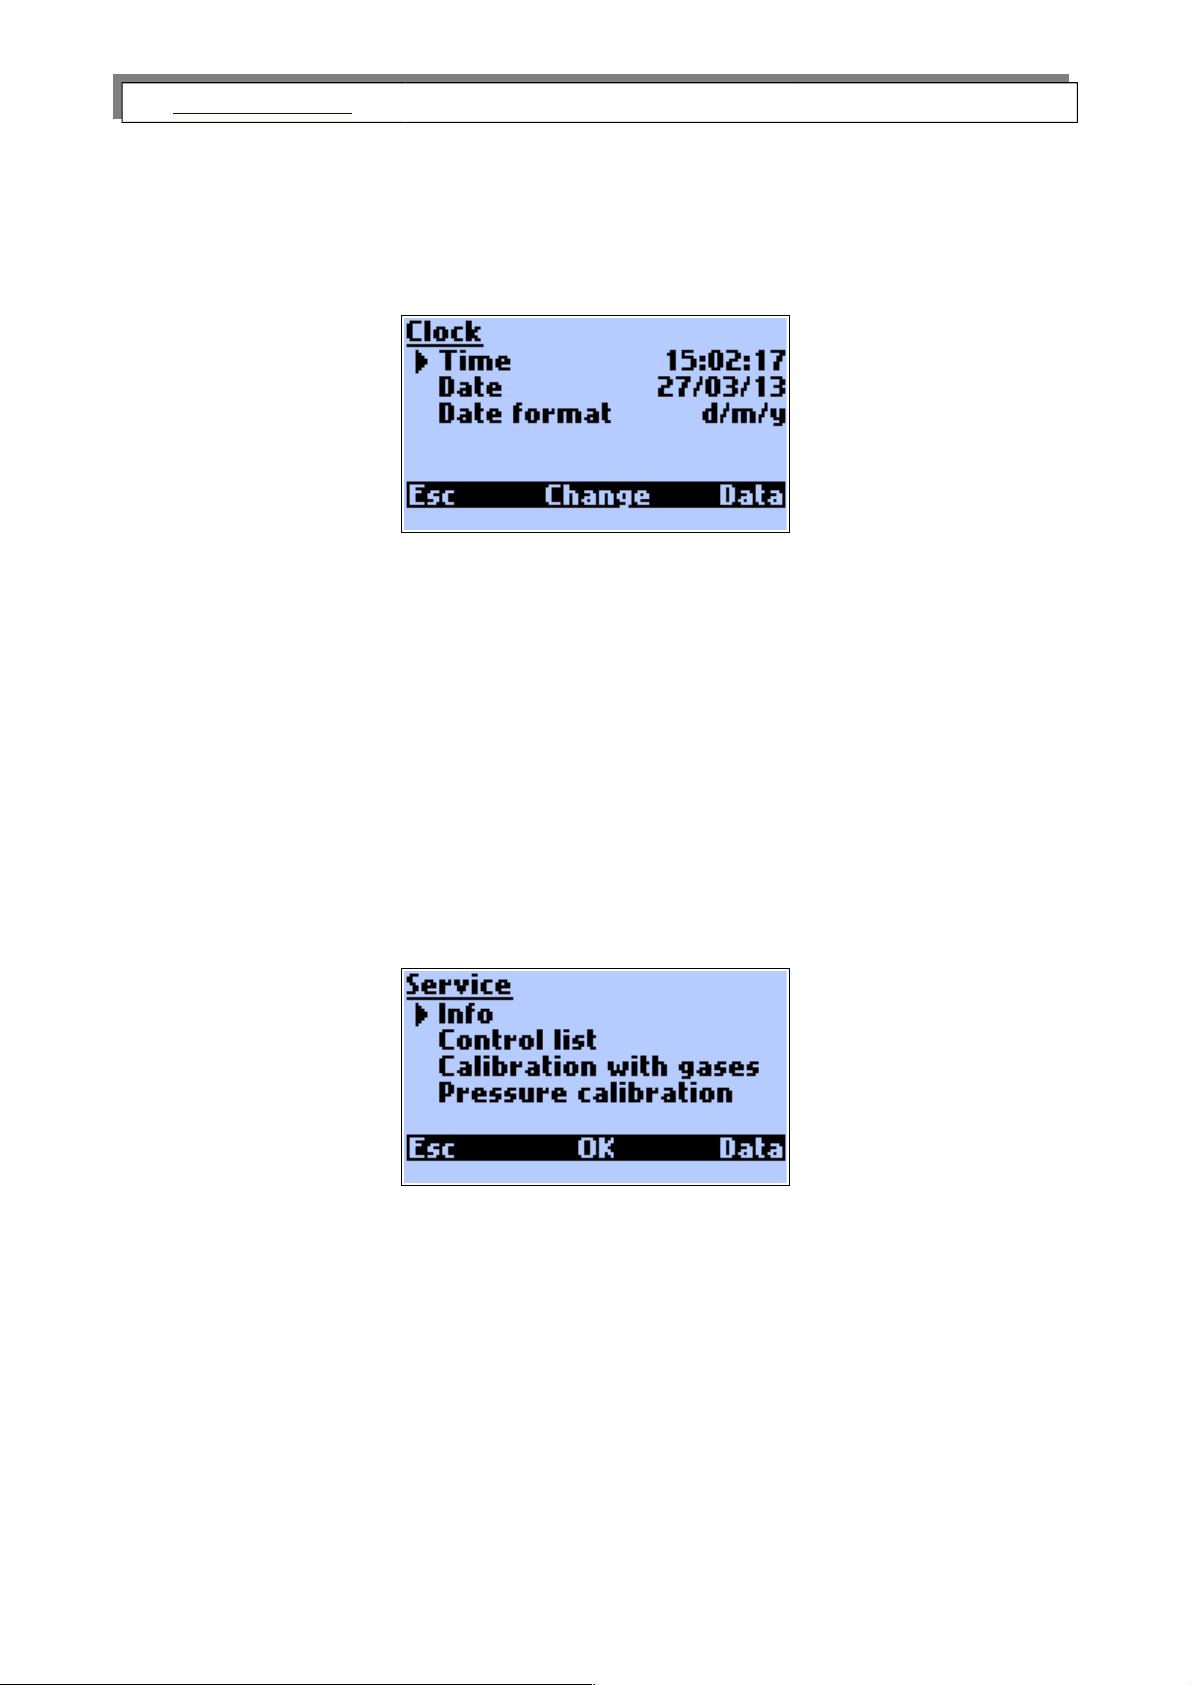
In the Clock Menu options the following settings (as shown in the picture) can be
changed:
Time
The time displayed by the inner clock can be set.
Date
The date indicated by the inner calendar can be set.
Date format
Two date representation formats are available. The user can choose between: Day –
Month – Year and Month – Day – Year date format
4.5.5. Service
The following screen appears when the option is opened:
27
Page 28
www.madur.com Manual
GA-12
plus
4.5.5.1. Info
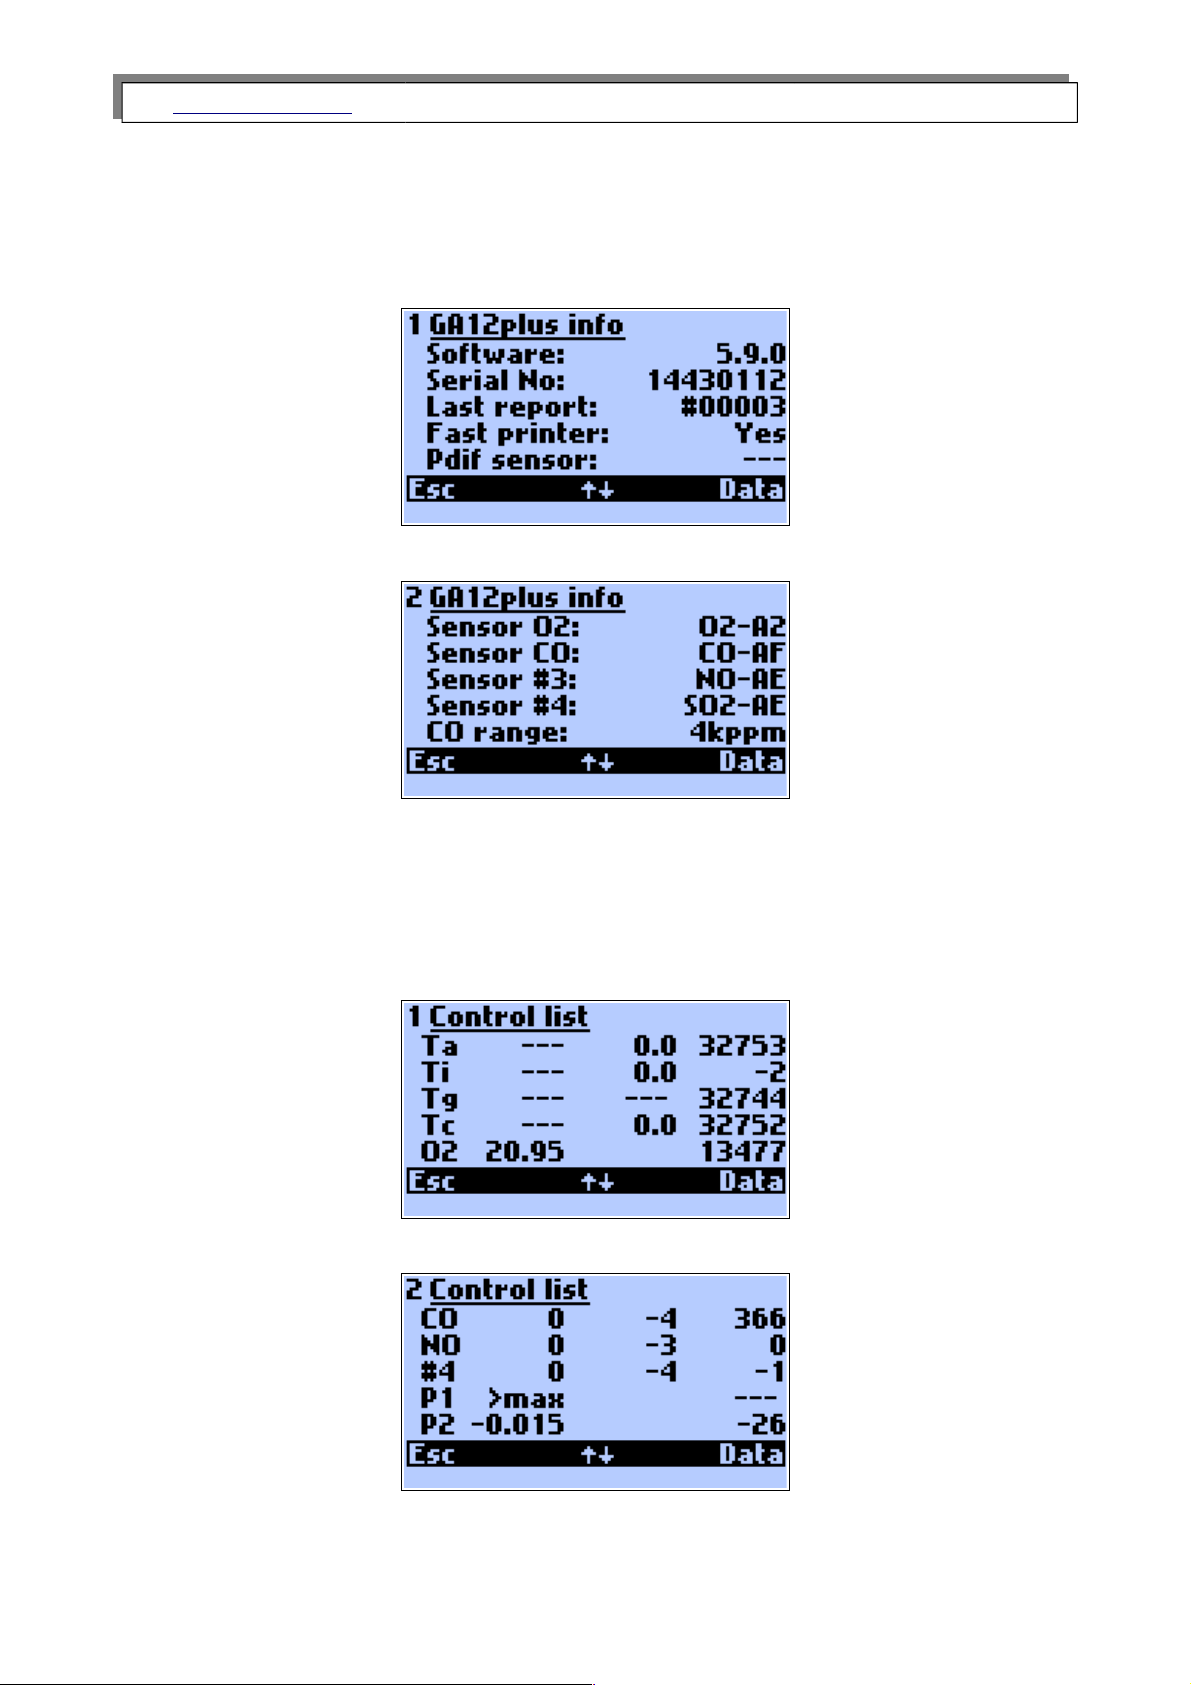
On the Info screen the information concerning the configuration of the instrument are
displayed.
Using the ↑↓ key will evoke the next Info screen.
4.5.5.2. Control list
The option Control list shows all measured signals. This is of great use when search-
ing for possible defects. The content of the Control list is displayed on the three screens
numbered 1, 2 and 3.
28
Page 29
www.madur.com Manual
GA-12
plus
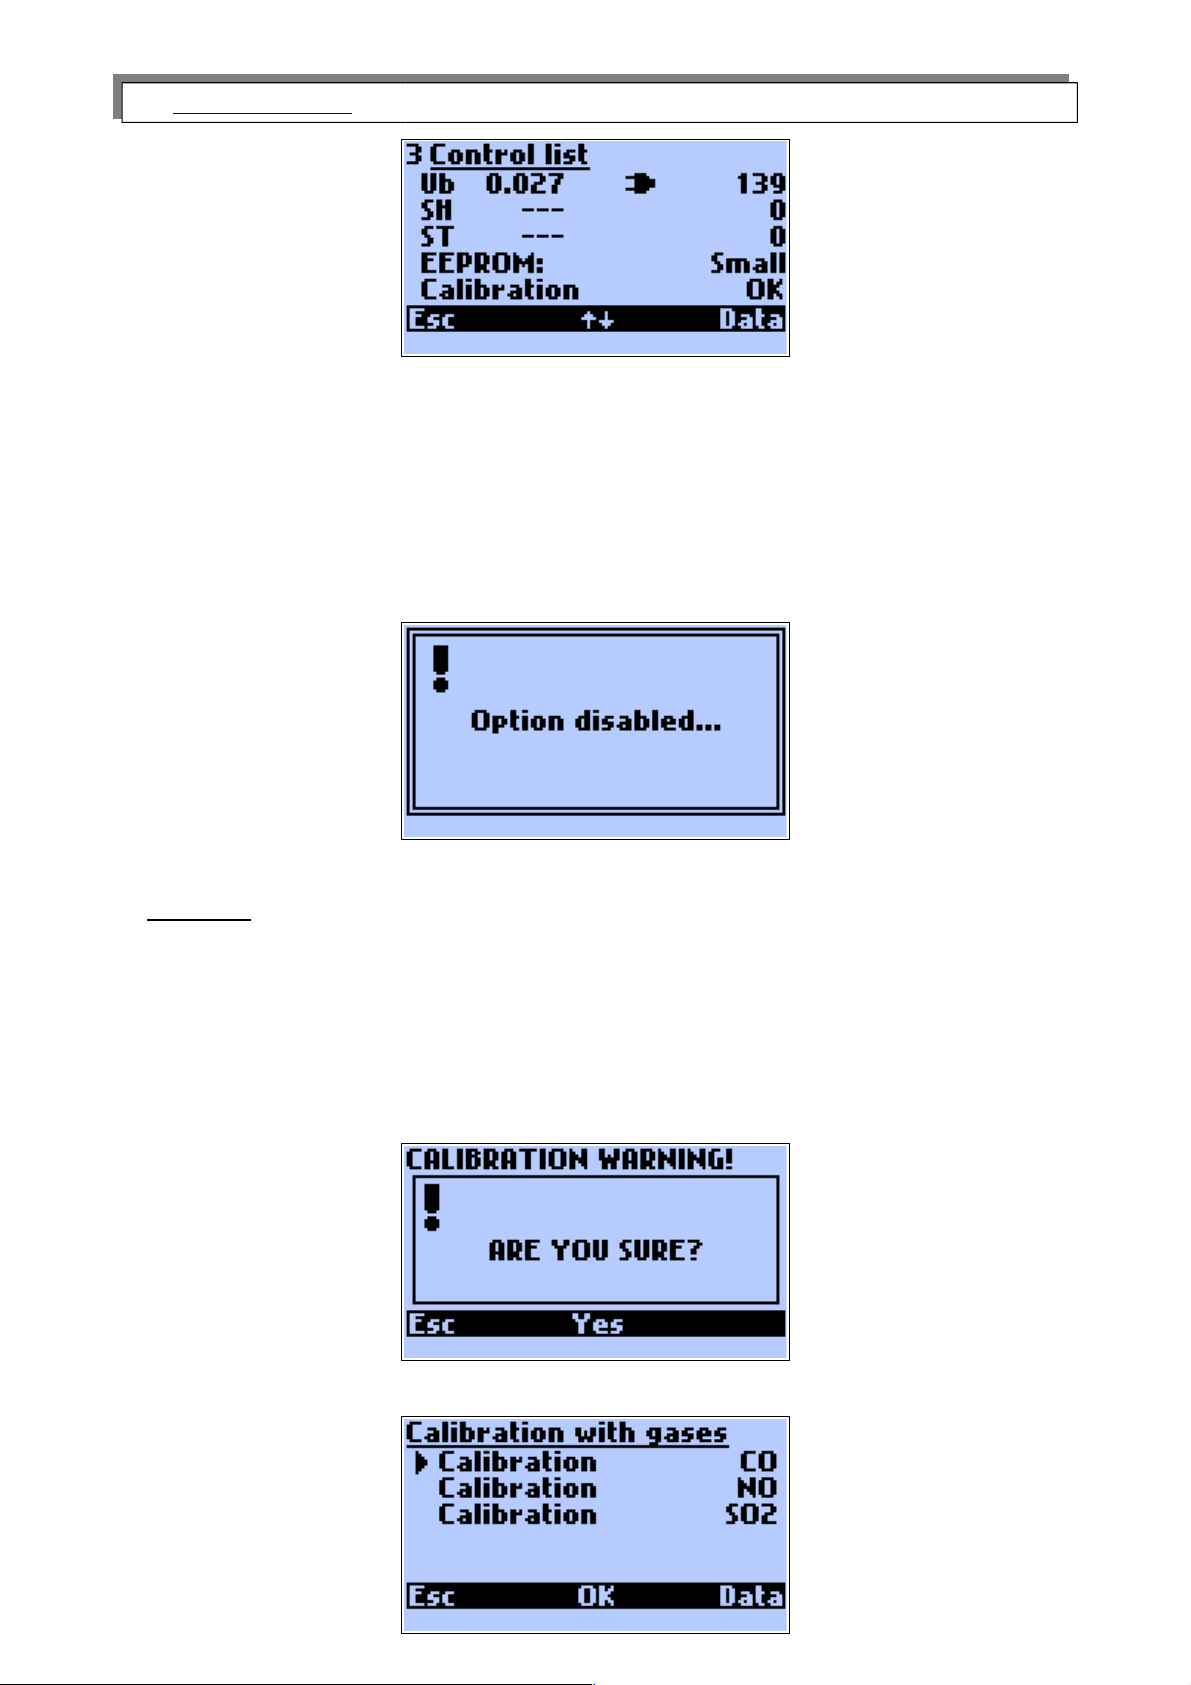
The ↑↓ key is used to change between the consecutive screens of the Control List.
4.5.5.3. Calibration with gases
Calibration with gases is about observing the sensors’ reaction to the familiar to the
user gas concentration. The access to the calibration is originally blocked at the factory. If
so after choosing the option the following screen will appear:
Unblocking the calibration process is possible via the madurPortable PC program.
Warning:
Each incorrect change of the calibration value will cause an irreversible
loss of the previous values thereby the instrument will become of no
use for the further measurement. The calibration should be therefore
carried out only by the qualified staff of the service.
Choosing the option Calibration with gases displays the following screen:
After confirmation the following screen will appear:
29
Page 30
www.madur.com Manual
GA-12
plus
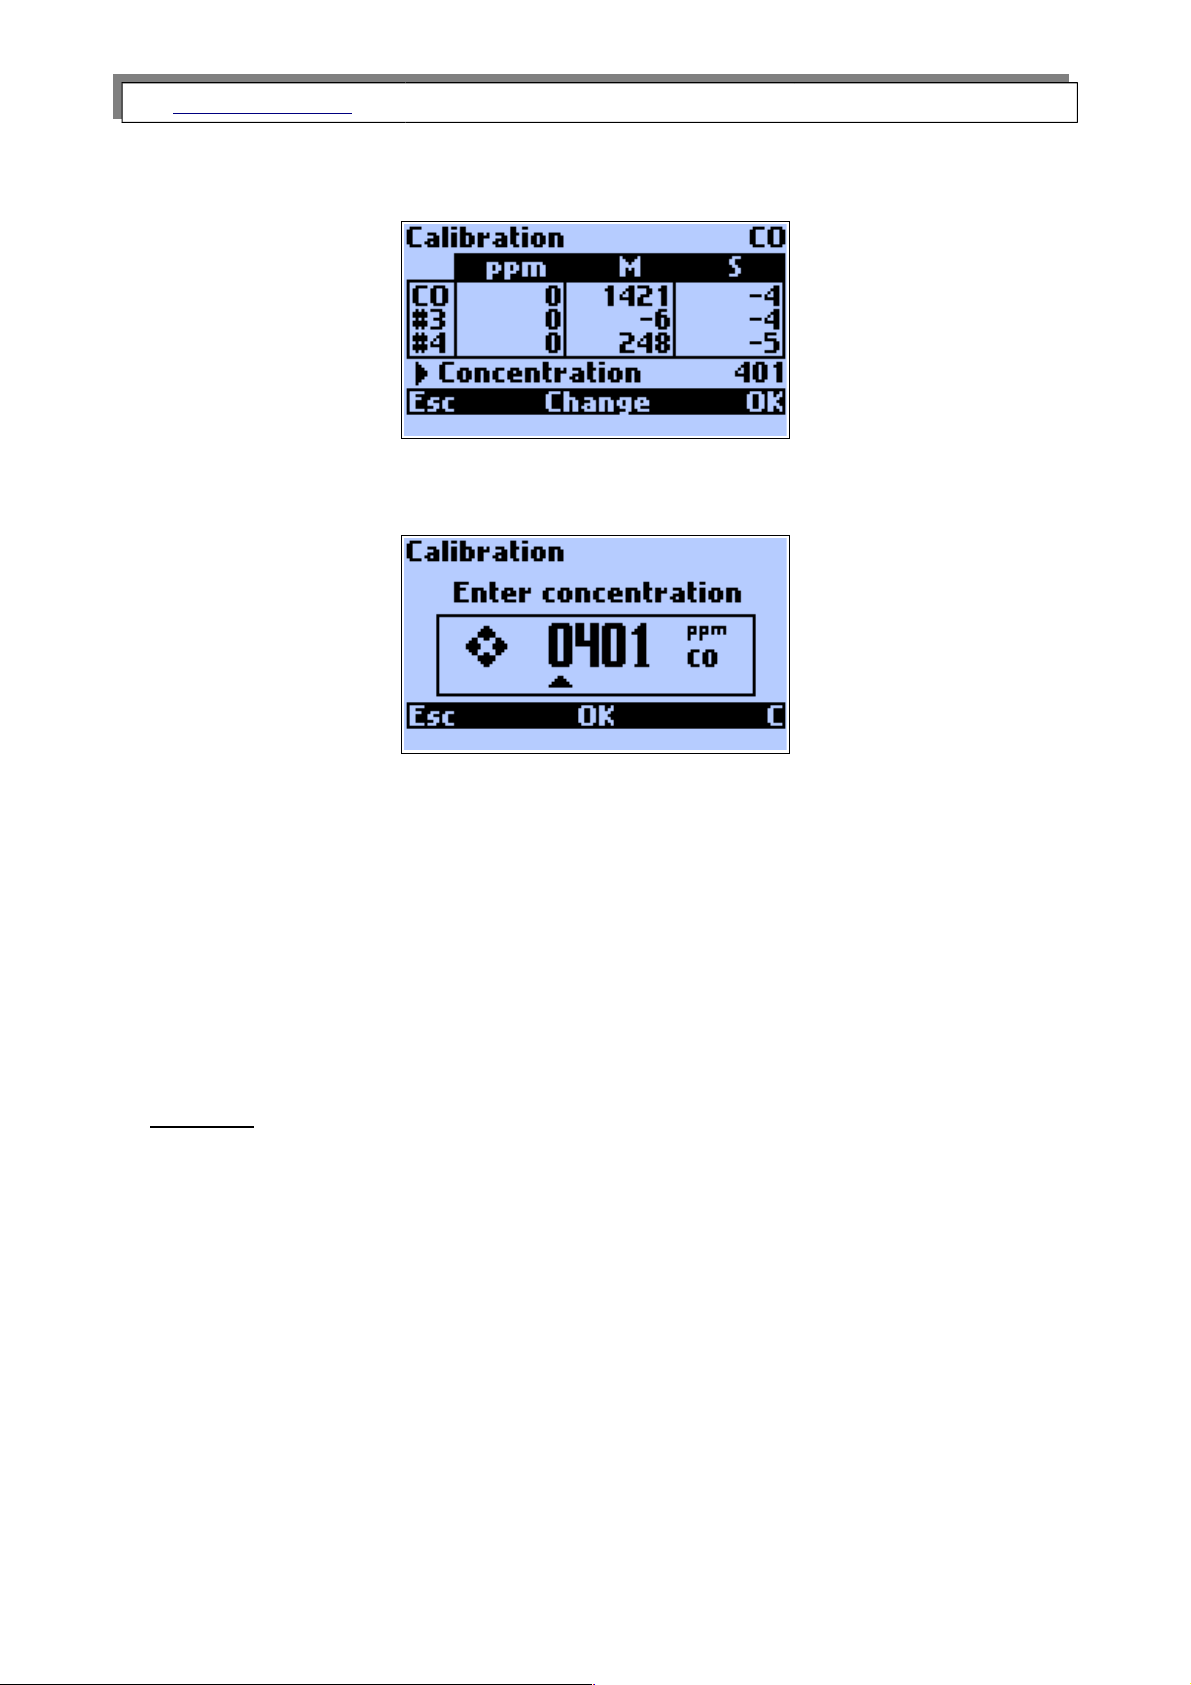
The screen makes it possible to choose between the calibration gases.
The process of calibrating will be presented for CO.
The Change key evokes the screen used for entering the reference gas concentration
value.
After applying the gas to the instrument it is advised to wait until stable values appear in
the S (signal) column and then to press the OK key. The values from the S column will
be saved and stored in the column M (memorised).
4.5.5.4. Pressure calibration
Pressure calibration like gas calibration is available only to the service staff. To carry
out the calibration process it is necessary to have a precise pressure source.
Warning:
Each incorrect change of the calibration value will cause an irreversible
loss of the previous values thereby the instrument will become of no
use for the further pressure measurement. The calibration should be
therefore carried out only by the qualified staff of the service.
30
Page 31
www.madur.com Manual
GA-12
plus
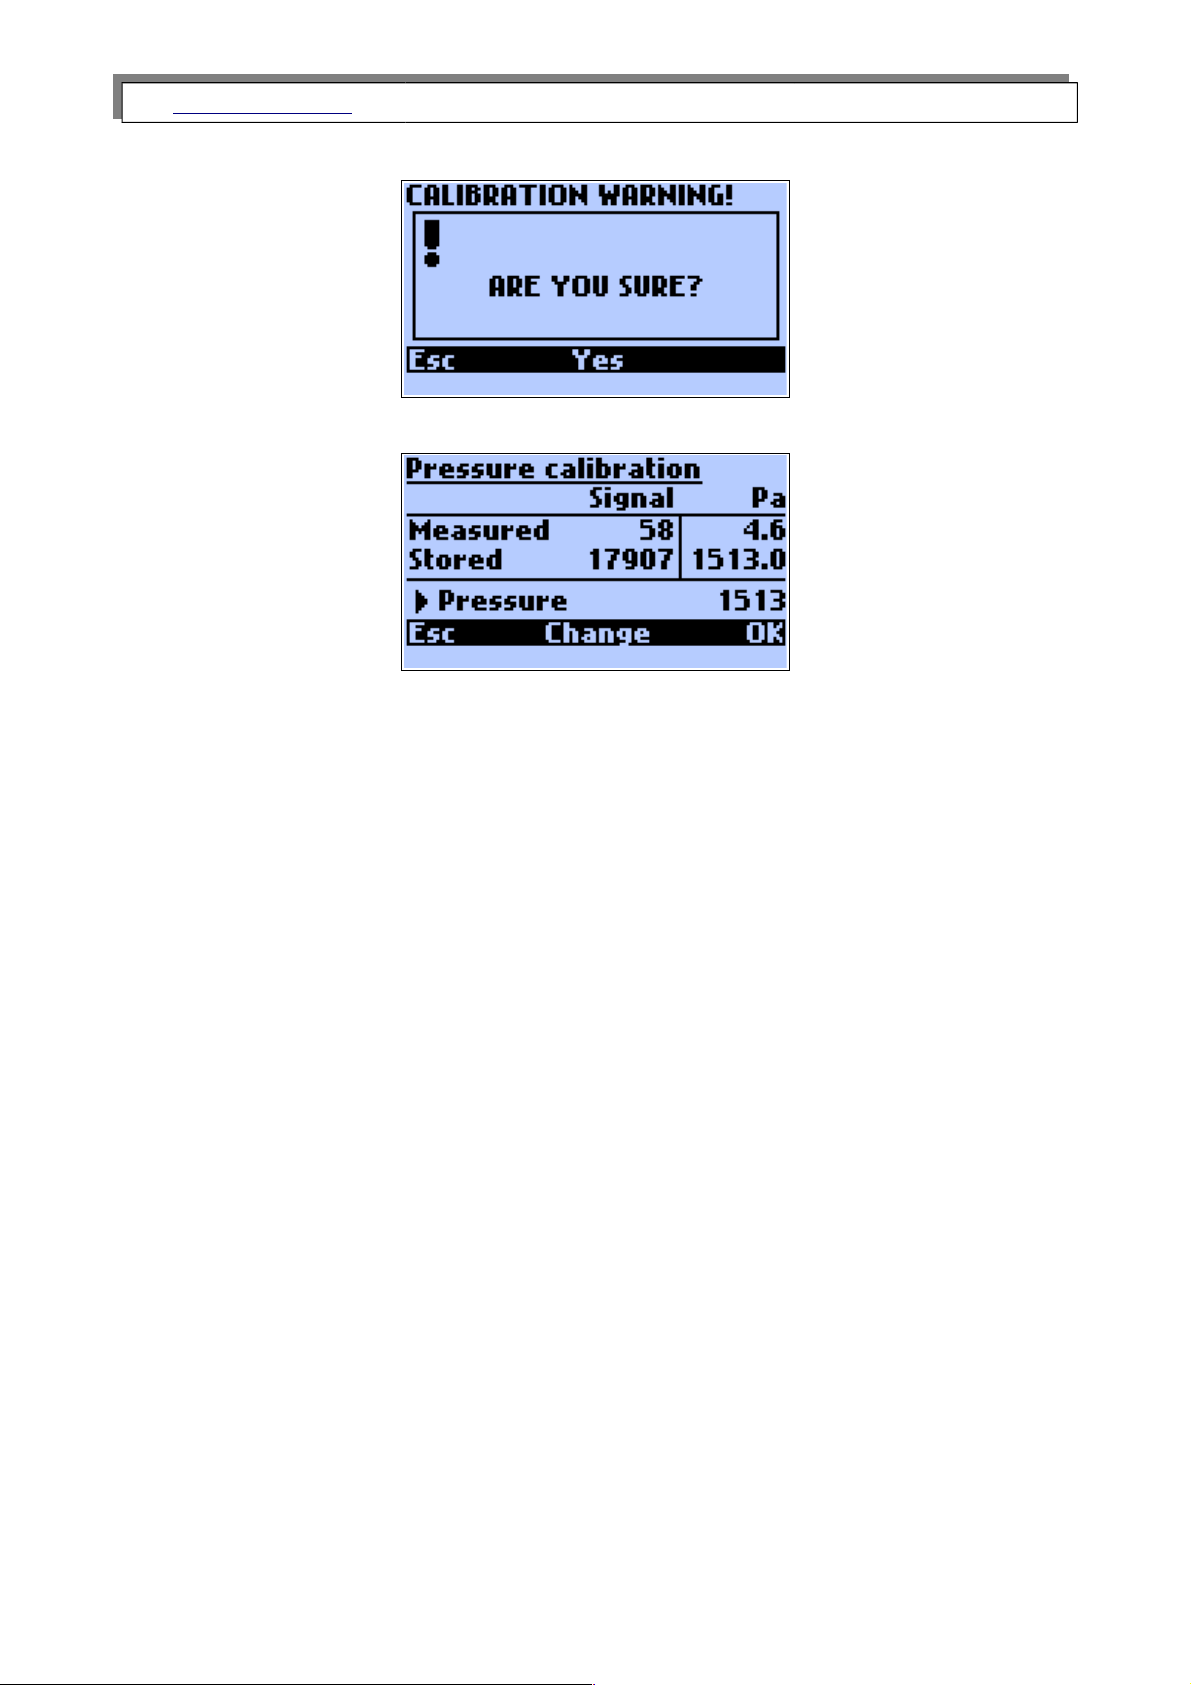
After choosing the pressure calibration option the following screen will appear:
After confirmation the following screen will be displayed.
The fields on the screen have the following meaning:
Measured
The signal currently supplied by the pressure sensor and the pressure measured by
the instrument.
Stored
The previously stored signal and calibration pressure.
Pressure
Calibration pressure in [Pa].
The calibration process
Apply the calibration pressure to the instrument. With the Change key fill in the value of
the calibration pressure. Press OK to store the value of the calibration pressure.
31
Page 32
www.madur.com Manual
GA-12
plus
4.6. Printing
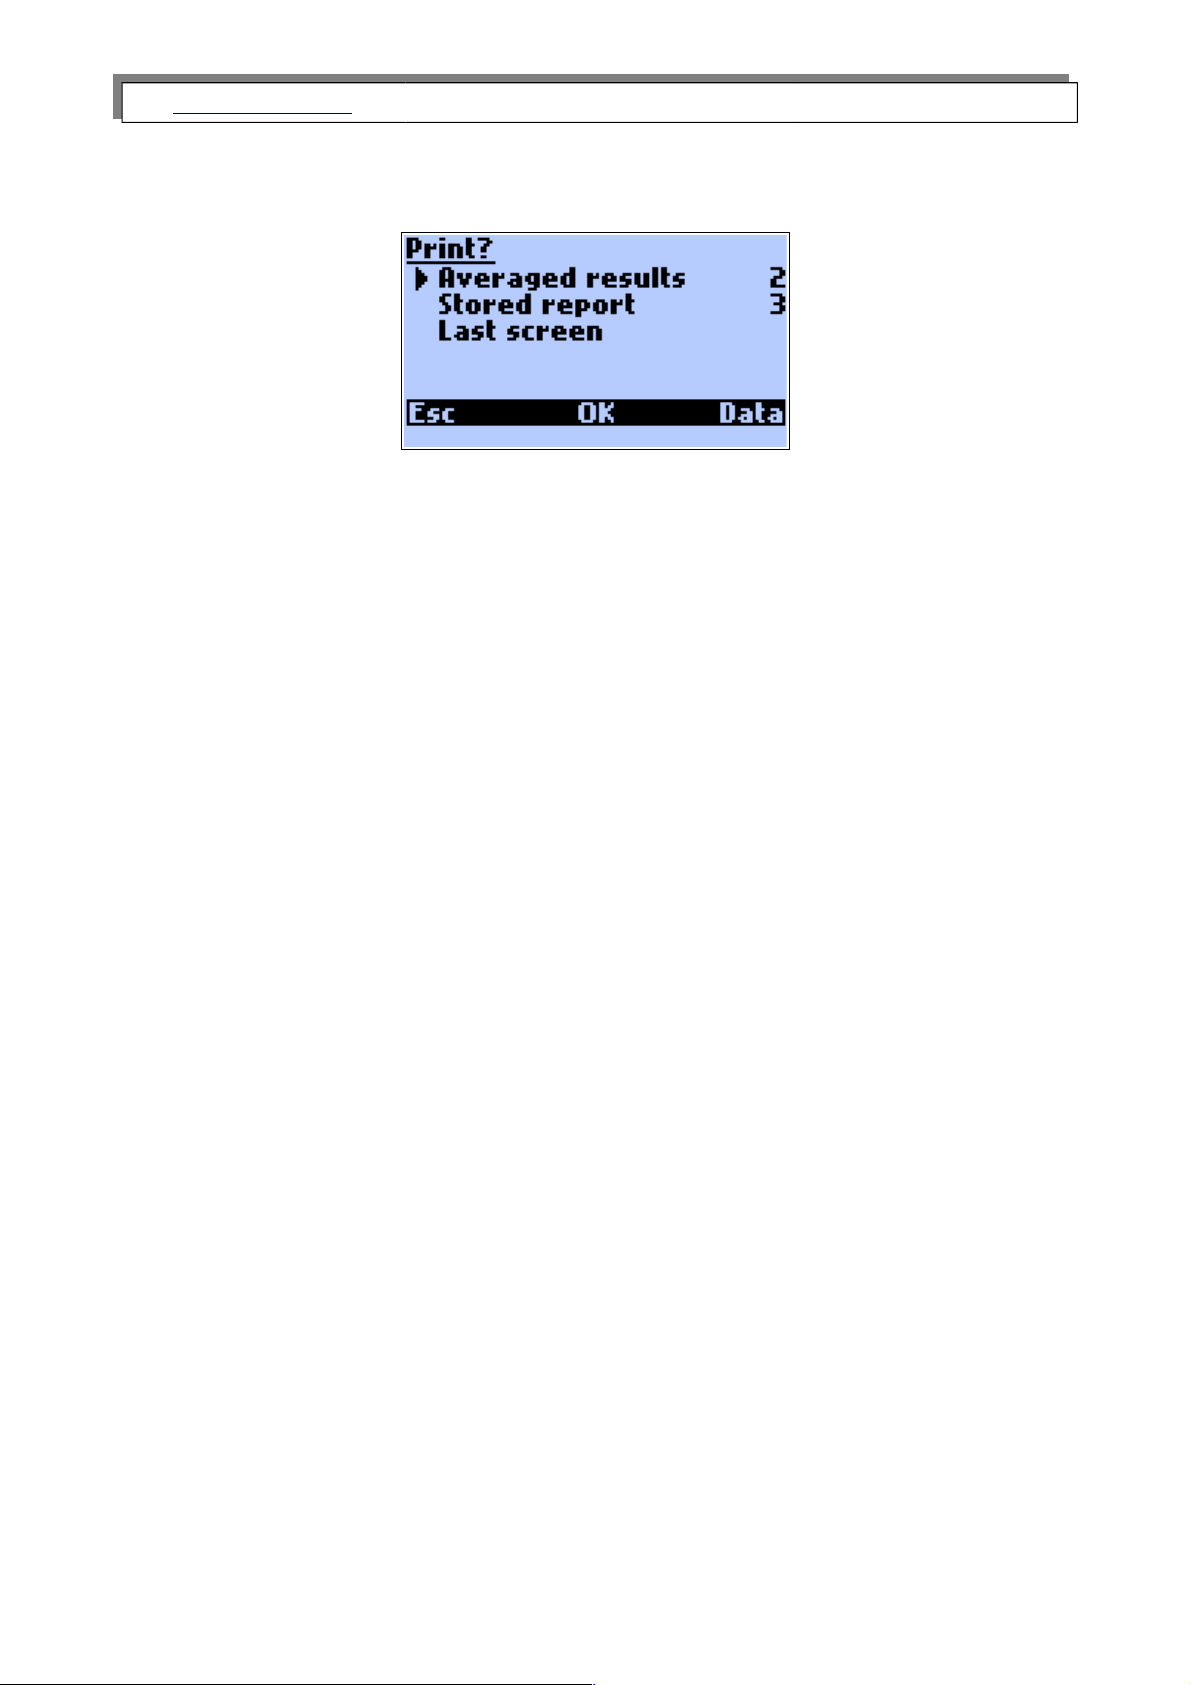
Using the arrow left/right keys for given line will cause the change of the printing format.
There are four default, set at the factory formats, the other four can be defined by the
user with the help of the PCGA12plus.exe program.
Averaged results
The last measured temporary values will be printed.
Stored report
Report printout. After choosing this command the window of administrating the reports
will be displayed.
Last screen
The content of the last screen displayed will be printed.
32
Page 33
www.madur.com Manual
GA-12
plus
5. FLOW VELOCITY MEASUREMENT
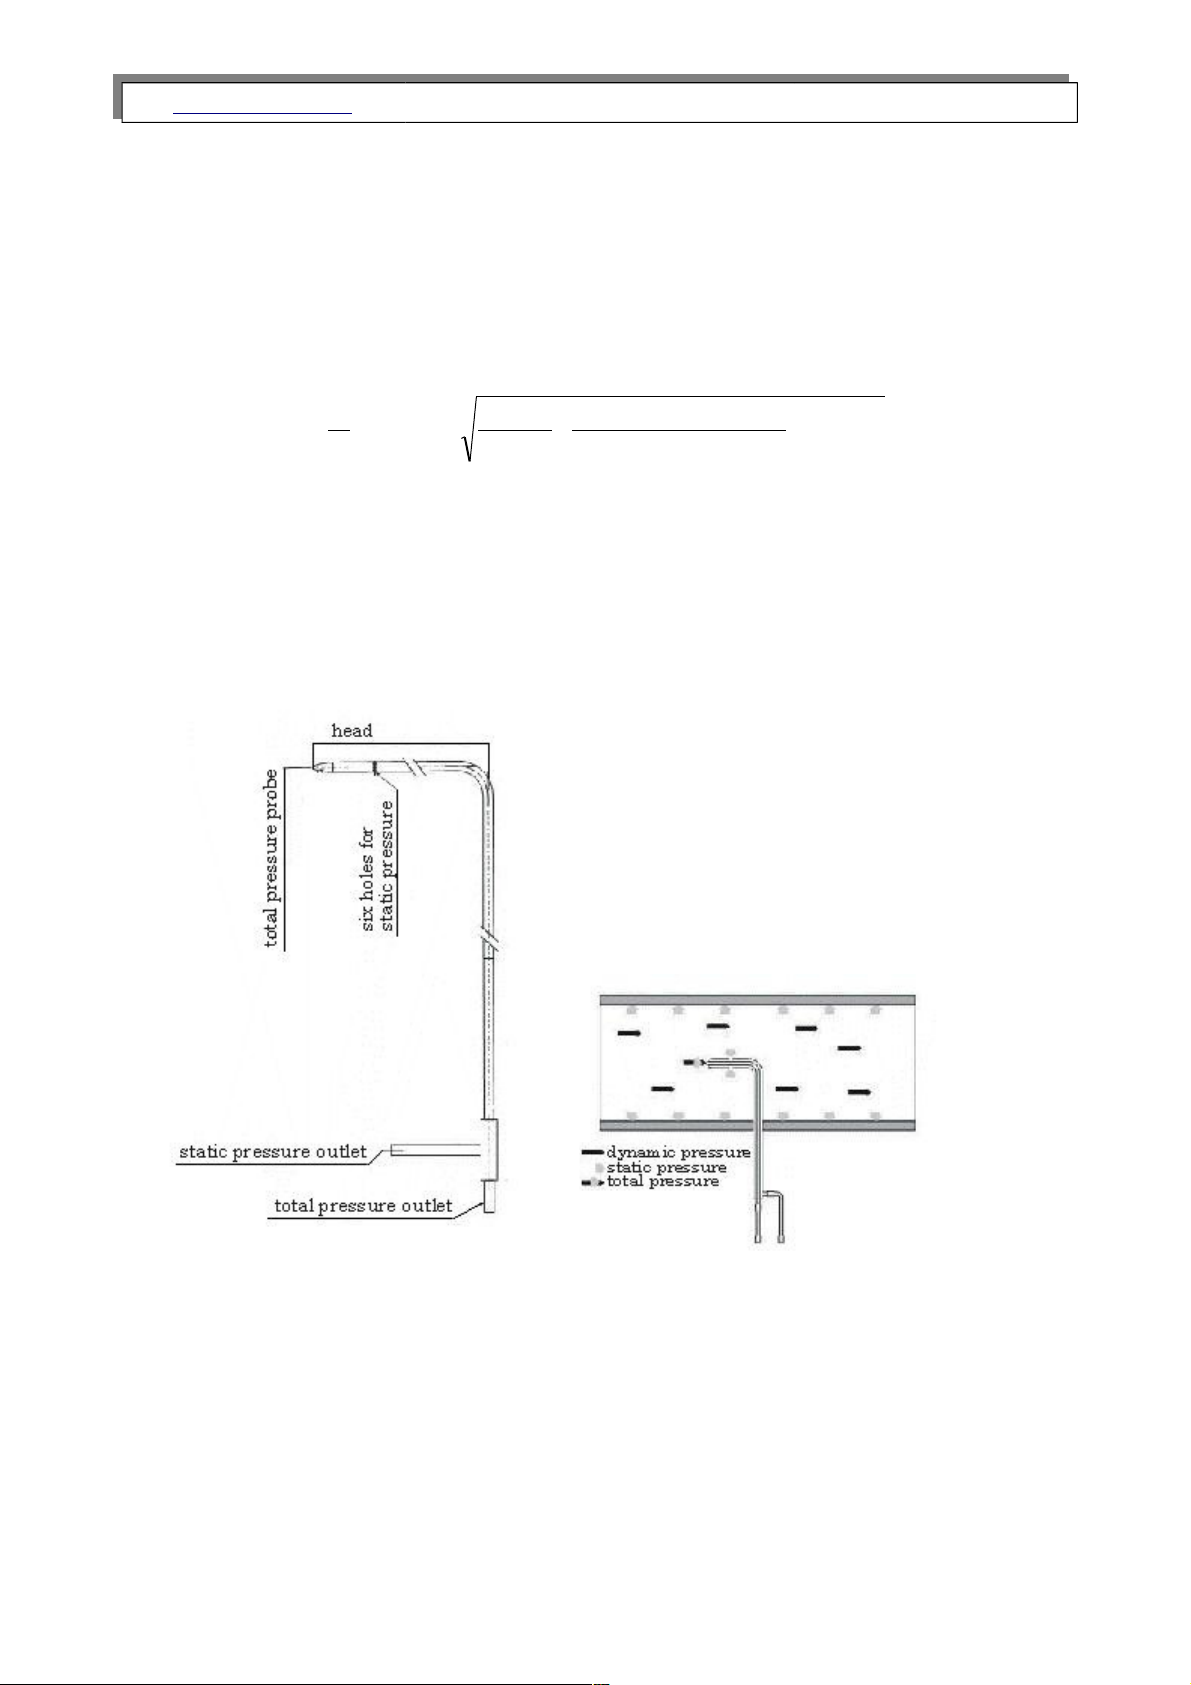
The GA12 analyser is able to measure the differential pressure of the flue gases and
can be equipped with a Pitot tube with which the flow velocity measurement can be per -
formed. This value is necessary when calculating the mass flow velocity and the mass of
pollutants emitted by the source in a particular period of time. The system calculates the
values using the formula:
v – flue gas velocity [m/s]
1.291 – coefficient of the Pitot tube
T
gas
– flue gas temperature [K]
P
stat
– static pressure [Pa]
P
dif
– differential pressure [Pa]
The Pitot tube consists of two concentric tubes with one end bent at a right angle. The
total pressure inlet is situated at the very end of the tube. The flue gases flow parallel to
the bent end of the tube. The holes used for measuring the static pressure value are situ-
ated at the circumference of the transverse section of the bent end of the tube (see the
picture above) which means they are perpendicular to the direction of the flue gas flow.
The static pressure measurement can be performed as the flue gas flow causes a negat-
ive pressure to occur in the static pressure holes.
33
[ ]
[ ]
[ ]
PaP
PaPPa
Pa
KT
s
m
v
dif
stat
gas
*
100000
100000
*
289
*291.1
+
=
Page 34

www.madur.com Manual
GA-12
plus
The tube must be connected to the analyser inlets (the total pressure outlet of the tube
– to the analyser’s differential pressure sensor inlet (+) and the static pressure outlet of
the tube to the analyser’s differential pressure sensor inlet (-) ).
The GA12 analyser measures the difference between the values of the total and the
static pressure (which means the differential pressure) and calculates the flue gas velo-
city on the basis of these measured values. The calculated value can be displayed on the
results screen.
The results of the measurement performed with the use of a Pitot tube are correct
provided that the analyser position is not changed after the beginning of the sensor zero-
ing process and both the device and the tube are held in the same (described above) po-
sition throughout the measurement process.
This measurement will only provide the flow velocity at a single point in the cross sec-
tion of the flue gas channel, but at normal flue gas flow rates the velocity profile will be
reasonably constant across the cross section. With use of the cross sectional area of the
flue gas channel, the volume and hence mass flow rates can be calculated.
34
 Loading...