


2.0

Copyright
The information contained within this document regarding LogTag Analyzer software usage
is intended as a guide and does not constitute a declaration of performance. The information
contained in this document is subject to change without notice. Unless otherwise noted, the
example companies, organizations, e-mail addresses and people depicted herein are
fictitious, and no association with any real company, organization, e-mail address or person
is intended or should be inferred. Complying with all applicable copyright laws is the
responsibility of the user.
No representation or warranty is given and no liability is assumed by LogTag Recorders with
respect to the accuracy or use of such information or infringement of patents or other
intellectual property rights arising from such use or otherwise.
Copyright © 2004-2010 LogTag Recorders. All rights reserved.
www.logtagrecorders.com

iii
Contents
Copyright ii
Introduction 6
Installing the software 7
System requirements .......................................................................................................... 8
Getting a copy of the software ............................................................................................ 8
The installation process ...................................................................................................... 9
Upgrading from earlier versions ......................................................................................... 10
Starting the software ........................................................................................................ 11
Quick Start Guide 13
Connecting the Interface .................................................................................................. 14
Using the LogTag with the Interface .................................................................................. 15
Get a LogTag ready for use ............................................................................................... 16
Welcome ................................................................................................................ 17
Locate LogTag(s) download and save relevant data ................................................... 18
Configure LogTag(s) for next use ............................................................................. 19
Prepare LogTag(s) for next use ................................................................................ 20
Starting and using the LogTag .......................................................................................... 22
LogTag light patterns ....................................................................................................... 24
Retrieve information from LogTag ..................................................................................... 25
Preparing LogTag(s) for use 26
Getting a LogTag ready for use ......................................................................................... 27
Restricted Access Requirements ........................................................................................ 28
Preparing LogTag for next use .......................................................................................... 30
Alert Processing ............................................................................................................... 34
Advanced Alert Settings .................................................................................................... 37
Display Logger Alarms ...................................................................................................... 40
Verify Access Password ..................................................................................................... 42
Pre-start data collection .................................................................................................... 42
Continuous operation ....................................................................................................... 43
Working with batches of LogTags ...................................................................................... 43
Getting the best from your LogTag .................................................................................... 44
Prolonging battery life ...................................................................................................... 45
Results from LogTag 47
Getting results from LogTag .............................................................................................. 48
Saving LogTag Data ......................................................................................................... 49
Saving LogTag Data files ......................................................................................... 49
Saving a Multi Chart file........................................................................................... 49

iv Contents
Selected LogTag Data files (*.sltd) ........................................................................... 50
PDF files ................................................................................................................ 52
Understanding the results ................................................................................................. 53
Inspecting the information at close range ........................................................................... 55
Manual scaling of the chart ............................................................................................... 58
Chart annotations ............................................................................................................ 60
Chart subtitle ................................................................................................................... 62
Combining charts onto a single chart ................................................................................. 64
Changing Chart Colours ........................................................................................... 65
Shifting chart start times ......................................................................................... 65
Aligning Charts ....................................................................................................... 67
Special Chart Tabs .................................................................................................. 68
Automatically calculated statistics ...................................................................................... 71
Average Reading .................................................................................................... 71
Standard Deviation ................................................................................................. 72
Mean Kinetic Temperature ....................................................................................... 73
Degree Minutes ...................................................................................................... 75
Displaying statistics .......................................................................................................... 76
Printing the results ........................................................................................................... 76
Sending a file by e-mail direct from Analyzer ...................................................................... 77
Calling up previous results ................................................................................................ 79
Digital signatures ............................................................................................................. 80
How secure is my data ..................................................................................................... 82
Viewing file properties ...................................................................................................... 84
Customizing the software 86
General Settings .............................................................................................................. 87
Summary Statistics ........................................................................................................... 88
Chart Statistics ................................................................................................................. 89
Charts ............................................................................................................................. 90
Automation...................................................................................................................... 92
File and Folder Settings ................................................................................................... 105
Exports and Reports ........................................................................................................ 109
Dates and Times ............................................................................................................. 111
Time zones ..................................................................................................................... 112
Communication Ports ...................................................................................................... 113
User Server .................................................................................................................... 114
Software Updates ............................................................................................................ 115
Configuration Reports ...................................................................................................... 116
Menus and Toolbars 117
Menu commands ............................................................................................................. 118
File Menu .............................................................................................................. 119
Edit Menu ............................................................................................................. 122
LogTag Menu ........................................................................................................ 123
Window Menu ....................................................................................................... 124
Help Menu ............................................................................................................ 125
Toolbar commands .......................................................................................................... 126
Print preview toolbar ....................................................................................................... 127
Standard Window commands ........................................................................................... 129

Contents v
Working with Networks 131
Distributing software to workstations ................................................................................ 132
Simple Distribution of FTP/SMTP settings .......................................................................... 133
Restricting what users can do .......................................................................................... 134
How users log on ............................................................................................................ 135
How users change their password .................................................................................... 136
Getting more information 137
Getting updated software ................................................................................................ 138
Finding your software version .......................................................................................... 140
Getting more help ........................................................................................................... 141
Appendix 142
Troubleshooting .............................................................................................................. 143
Finding your computer specifications ................................................................................ 144
Resolving USB Driver Problems ........................................................................................ 151
Checking the installation of the USB driver ............................................................... 151
USB driver installation through software installation .................................................. 157
Manual USB driver installation on Windows XP ......................................................... 159
Manual USB driver installation on Windows 2000 ...................................................... 163
Sensor Responsiveness .................................................................................................... 169
Index 171

6
C HAPTER 1
Introduction
This guide will take you through the relevant steps so that you will be able to make the
most of your LogTag products. The guide is structured into chapters that will guide you
through the process of installing the software, using the LogTag products and lastly some
of the options that are available to you for making your efforts and experience of using
the software as efficient, effective and pleasant as possible.
The chapters in this guide are placed in an order that you will need to follow in order to
successfully use the LogTag products first time. Experienced users of the software may
choose to skip the first two chapters. However, if you are about to use a newer version of
a LogTag and/or Interface Cradle, we recommend you at least skim the installation
chapter for any relevant changes that should be performed prior to using your new
version of LogTag hardware.
This guide covers all the features included in version 2.0 of the LogTag Analyzer software.
The chapter "Finding your software version (on page 140)" included later in this guide will
help you through the process of finding out what version of the LogTag Analyzer software
is being used and will help explain and determine if this version of the guide refers to the
version of the software being used. The chapter "Getting updated software (on page
138)" included later in this guide will help you through the process of obtaining an
updated copy of the software. Therefore, if you find a feature described within this guide
that does not appear in your software and/or a feature within the version of software
being used that is not described in this guide, then we recommend you obtain a newer
version of the software and/or a newer version of this guide. You may obtain a free online
copy of the latest version of this guide from the LogTag Recorders Internet site,
www.logtagrecorders.com.
Although this guide includes all the relevant information to install and use the product
range supplied by LogTag Recorders, there are at times an expectation that the reader is
familiar with using their computer and the Windows® operating system. If a feature of
the software is specific to a version of the Windows® operating system, the guide will
indicate appropriately for you the relevant differences.
Feedback, positive or negative, about the software, the LogTag products and/or this guide
is welcome. If you believe the products could be improved, you are welcome to send us
your comments and we will do our best to include the improvements in a future release.

7
C HAPTER 2
Installing the software
To make use of your LogTag you will need to first install the software on your computer.
This will allow you to prepare your LogTag(s) for use, retrieve the readings the LogTag(s)
have recorded, and analyze the data. This chapter will take you through the steps
necessary to successful install the software on to your computer so you can begin using
your LogTag(s). The process of installing the LogTag Analyzer software should be very
familiar to users that have previously installed other software and therefore some
experienced users may choose to only skim read or entirely skip this chapter. If you are
new to using a computer and/or unsure about installing the software, we recommend you
read the remainder of this chapter.
In This Chapter
System requirements .............................................. 8
Getting a copy of the software ................................ 8
The installation process .......................................... 9
Upgrading from earlier versions .............................. 10
Starting the software .............................................. 11

8 LogTag Analyzer User Guide (2.0)
System requirements
To ensure that the software will be able work with your computer, the following lists the
minimum specifications required:
Pentium II 233MHz processor
64MB RAM
45MB free disk space
Windows NT, Windows 2000, Windows XP, Windows VISTA or WIndows 7
Internet Explorer 5.0 or later
1 available serial port and/or 1 available USB port, depending on purchased interface
800 x 600 screen resolution
256 screen colors
The recommended specifications are:
Pentium V or later
512MB of available RAM
Windows XP, or later
Internet Explorer 6.0 or later
65535 (16bit), or more, screen colors.
1024 x 768, or higher, screen resolution.
If you are unsure of what your computer specifications are, please read the section about
"Finding your computer specifications (on page 144)", which will help you locate the
relevant information.
Getting a copy of the software
The software is available for download from the LogTag Recorders Internet site,
www.logtagrecorders.com. LogTag Recorders does not charge for the download of the
LogTag Analyzer software or for the updates to the LogTag Analyzer software. You are
welcome to distribute copies of the LogTag Analyzer software provided it is distributed in
the packaged format as originally downloaded from the LogTag Recorders Internet site.
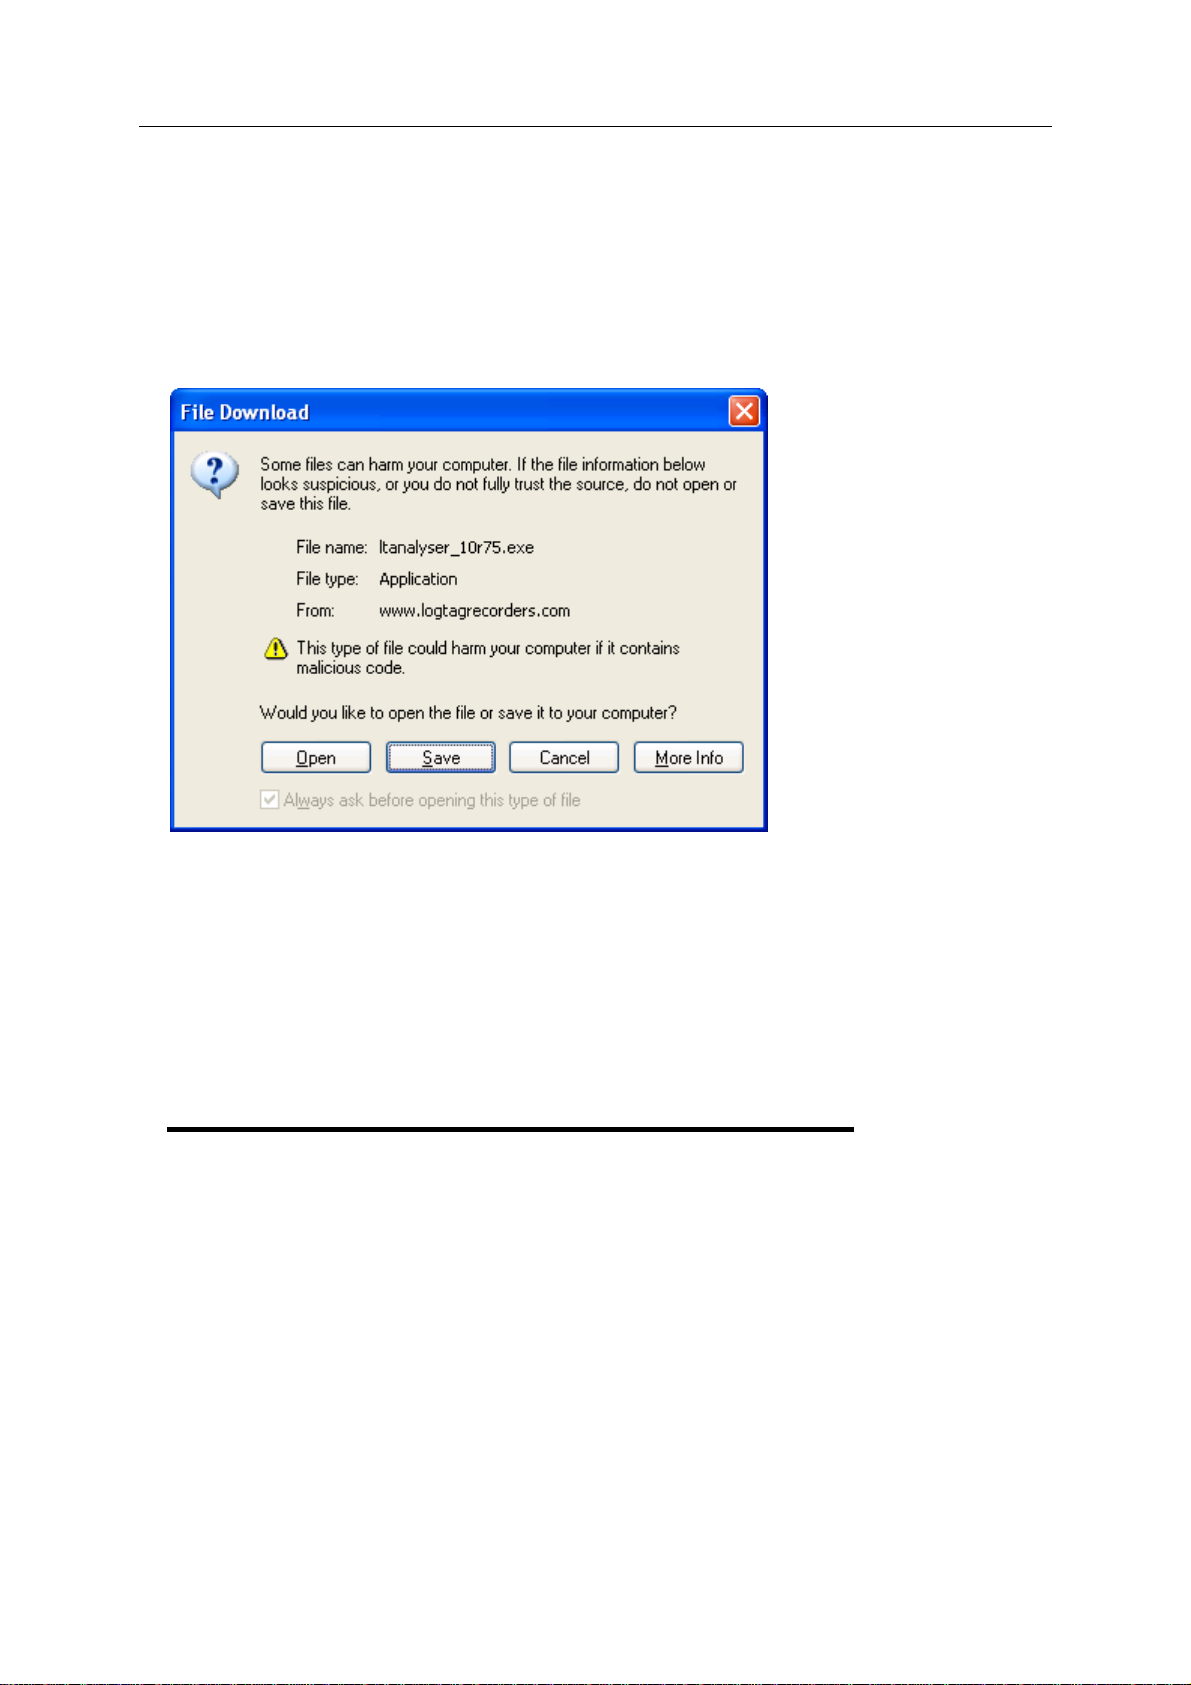
Chapter 2 Installing the software 9
When you visit the LogTag Recorders Internet site, follow the software navigation links to
obtain a download link for the latest version of the LogTag Analyzer software. The request
to download LogTag Analyzer software from the LogTag Recorders Internet site will result
in an e-mail automatically being sent to you with the download link for the latest version.
To begin the actual download of the software process, click on the link provided in your
e-mail, and your e-mail software will prompt you to save or open the file.
We recommend choosing the option to save the file to your disk and to save the file to
your desktop. If you are an experienced user you may wish to save the file to a different
folder of your choosing. Once the installation process has been completed, this file can be
safely deleted, as it is not required for using the software.
Only one file needs to be downloaded to enable installation of the software on your
computer. Once the relevant installation file has been downloaded to your computer, you
only have to open the file to begin the installation process.
The installation process
To install the LogTag Analyzer software, first you need to locate the installation file that
was downloaded from the LogTag Recorders Internet site. To begin the installation
process open the installation file, which is typically performed by double clicking the left
mouse button.
Tip: Double clicking a mouse button, implies the user clicks the same mouse button in
quick succession.
The installation process will guide you through the relevant steps to correctly and
successfully install the software. If you have installed any other software, you should find
the installation process familiar. To proceed through each step of the installation process,
click the "Next" button. If you want to change a previous step you can click the "Back"
10 LogTag Analyzer User Guide (2.0)
button. When the process is ready to be completed, clicking the "Finish" button, when it
appears, will finish the installation process. If you want to stop installing the software,
click the "Cancel" button.
We recommend you leave all options to their default setting, especially if you are unsure
of what option to select or what the actual implications are if the option was to be
changed.
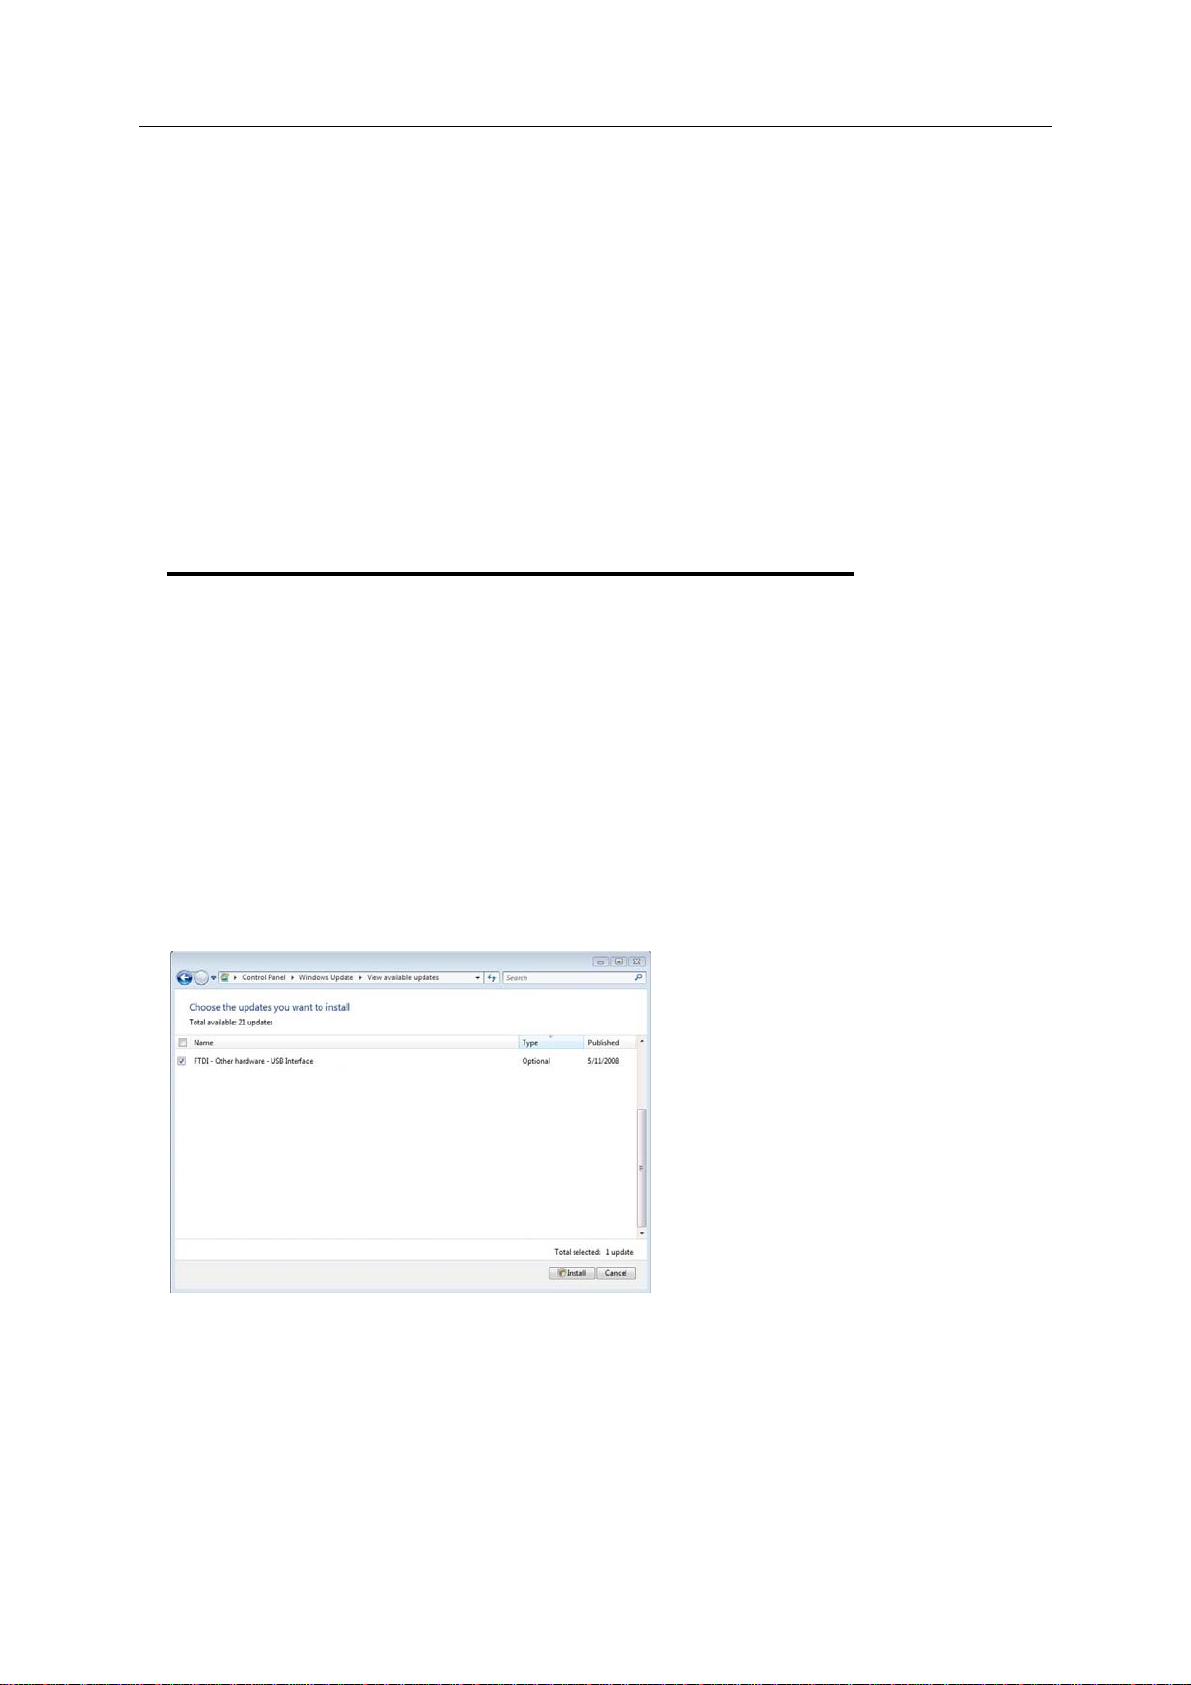
The drivers required to operate your USB interface are installed as part of the main
installation process. From time to time updated drivers may be released by LogTag
Recorders. If you are operating on Windows XP or Windows Vista these drivers will be
available through the Microsoft Windows ® Update feature, as an optional hardware
update.
Upgrading from earlier
versions
If you are installing a newer version of LogTag Analyzer on a computer, which already has
an earlier version installed, the old installation will be replaced by the newer version.
Any previously installed unsigned USB drivers will not be replaced automatically. To
replace the USB drivers you will need to go to Windows Update and select the FTDI - USB
Interface update from the "Other hardware" section.
Please refer to your Operating System manual or help on how to access this feature.
You can also update your driver from the Control Panel device manager. Please see
Resolving USB Driver Problems (on page 151) later in this document.

Chapter 2 Installing the software 11
Note: LogTag Recorders do not recommend updating your LogTag Analyzer software
manually. Instead, you should be using the automated update function, which ensures
you only use the version with the same character set as the one already installed.
Manually updating a version with the standard character set by installing the version with
the Unicode character set -or vice versa- may produce unwanted and erroneous results,
especially where passwords are affected.
Starting the software
At the conclusion of the installation process, the final screen will provide you with an
option to immediately start the LogTag Analyzer software. If the option "Start LogTag
Analyzer after finished" is not visible, then you require other newer software, for example
a newer version of Microsoft Internet Explorer, to be installed prior to the LogTag
Analyzer software being able to successfully start.
The installation of the LogTag Analyzer software will also provide you with two simple
methods to start the LogTag Analyzer at a later time:
12 LogTag Analyzer User Guide (2.0)
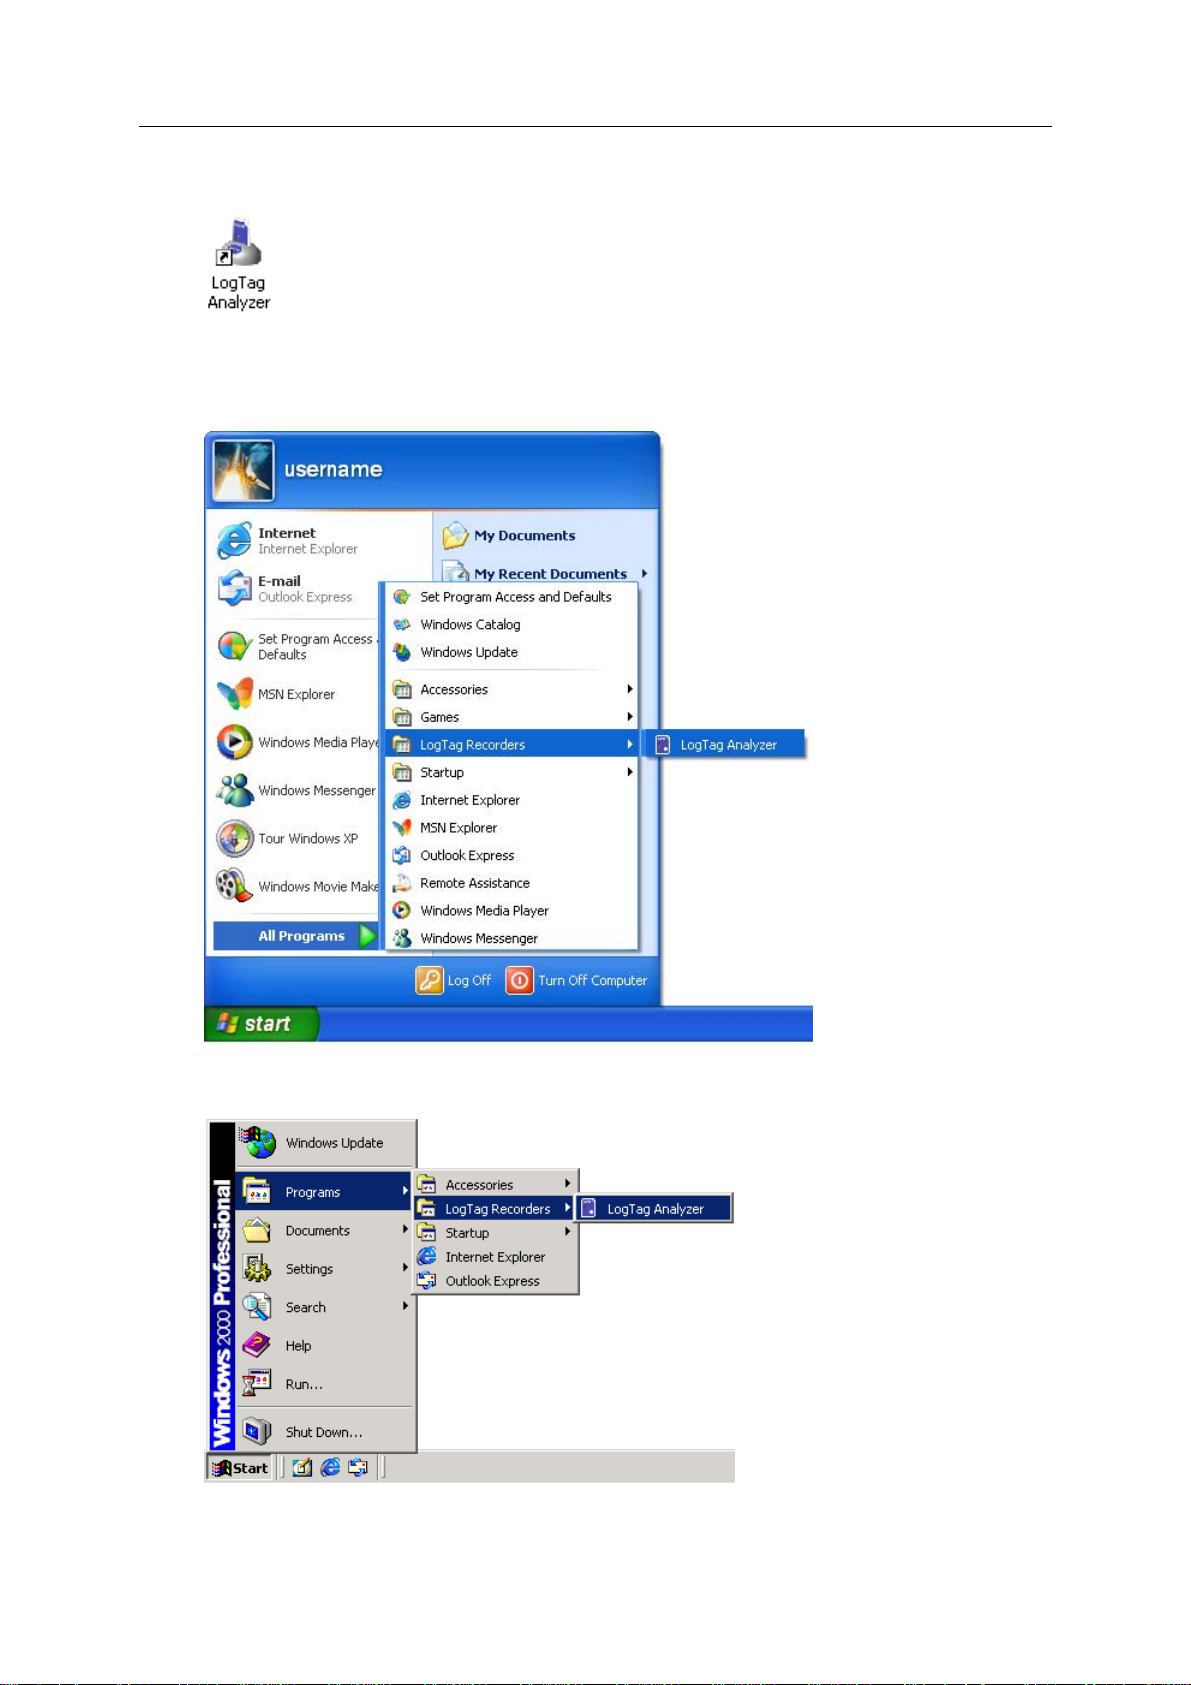
1 A "Shortcut" on the desktop, which you can double click to start the software.
2 A "Shortcut" in the "Start" menu system.
If you are using Windows XP, you may need to click on the "All Programs" item to
locate the "LogTag Analyzer" shortcut, like in the following picture.
If you are not using Windows XP, you will find the "LogTag Analyzer" shortcut in the
"Programs" menu, in a similar location to the following picture.

13
C HAPTER 3
Quick Start Guide
You've got the software installed on your computer and now you want to use the LogTag,
see how it goes and what it can do. This chapter will briefly cover the steps involved to
get your LogTag ready to use, how to get it started and then retrieve the recorded
information out of the LogTag. The subsequent chapters will explain in more depth these
steps and the various options available to you.
In This Chapter
Connecting the Interface ........................................ 14
Using the LogTag with the Interface ........................ 15
Get a LogTag ready for use .................................... 16
Starting and using the LogTag ................................ 22
LogTag light patterns ............................................. 24
Retrieve information from LogTag ........................... 25

14 LogTag Analyzer User Guide (2.0)
Connecting the Interface
There are two types of the Interface Cradle available. The first connects to the computers
serial (RS232) communications port and the other connects to the computers USB
(Universal Serial Bus) communications port. Although there may be multiple connectors
on the computer for each of these types of communications ports, the shape of each is
unique and therefore it is not possible to connect the Interface Cradle to the wrong type
of communications port. The software supports the connection of multiple Interface
Cradles at the same time and therefore as many serial and/or USB Interface Cradles as
are needed and the computer supports may be connected.
The connectors for the serial (RS232) communications ports typically look like the
following picture.
Serial (RS232) communication ports can be typically found at the rear of the computer
and there are usually at most two ports installed on a single computer. Most serial
Interface Cradle connectors will have screws included on the plug and as such we
recommend that these are tightened when the connector is plugged in so that it does not
accidentally pull out during usage.
The connectors for USB devices typically look like the following picture.
Connectors for USB devices and the sockets on the computer where USB devices are
plugged in will often display a USB logo nearby to help them be identified. Example
pictures of the USB logos that may appear are:

Chapter 3 Quick Start Guide 15
The sockets for the USB communication ports are typically located at the rear of the
computer. In some computers there may also be two or more USB communication ports
located on a front panel of the computer and/or on the top of the computer case. Please
ensure that the software has been installed prior to connecting the USB Interface Cradle
to the computer as the software installation also installs the drivers required to
successfully connect and use the USB Interface Cradle. If you experience problems
getting the software to find and identify a connected USB Interface Cradle then there may
have been a problem during the installation of the software with the installation of the
drivers that the USB Interface Cradle requires. The subsequent section resolving USB
driver problems (on page 151) will guide you through the steps necessary to resolve any
problems with getting USB Interface Cradles working on the computer.
If the computer is using the Windows NT
not be able to be used, as Windows NT
®
operating system, a USB Interface Cradle will
®
does not support USB devices.
Using the LogTag with the
Interface
The LogTag fits into the Interface Cradle slot with the front of the LogTag facing towards
the front label of the Interface Cradle with the contacts on the reverse side, similar to the
following picture.
If you look into the Interface Cradle slot, you will be able to see where the contacts
connect with the matching contacts in the Interface Cradle.
When placing the LogTag into the Interface Cradle slot, you should be able to feel a very
slight resistance as the contacts "grab" the LogTag. This is normal. Removal of the
LogTag will cause a slight clicking noise as the contacts snap back into their "unloaded
position".

16 LogTag Analyzer User Guide (2.0)
If the LogTag has readings stored
within its memory, the software will
automatically start to download the
data and will also display an animated
picture during the download process,
similar to the following picture.
The download process can be stopped
by clicking on the "Cancel" button below
the download animation or by pressing
the "Esc" key.
Get a LogTag ready for use
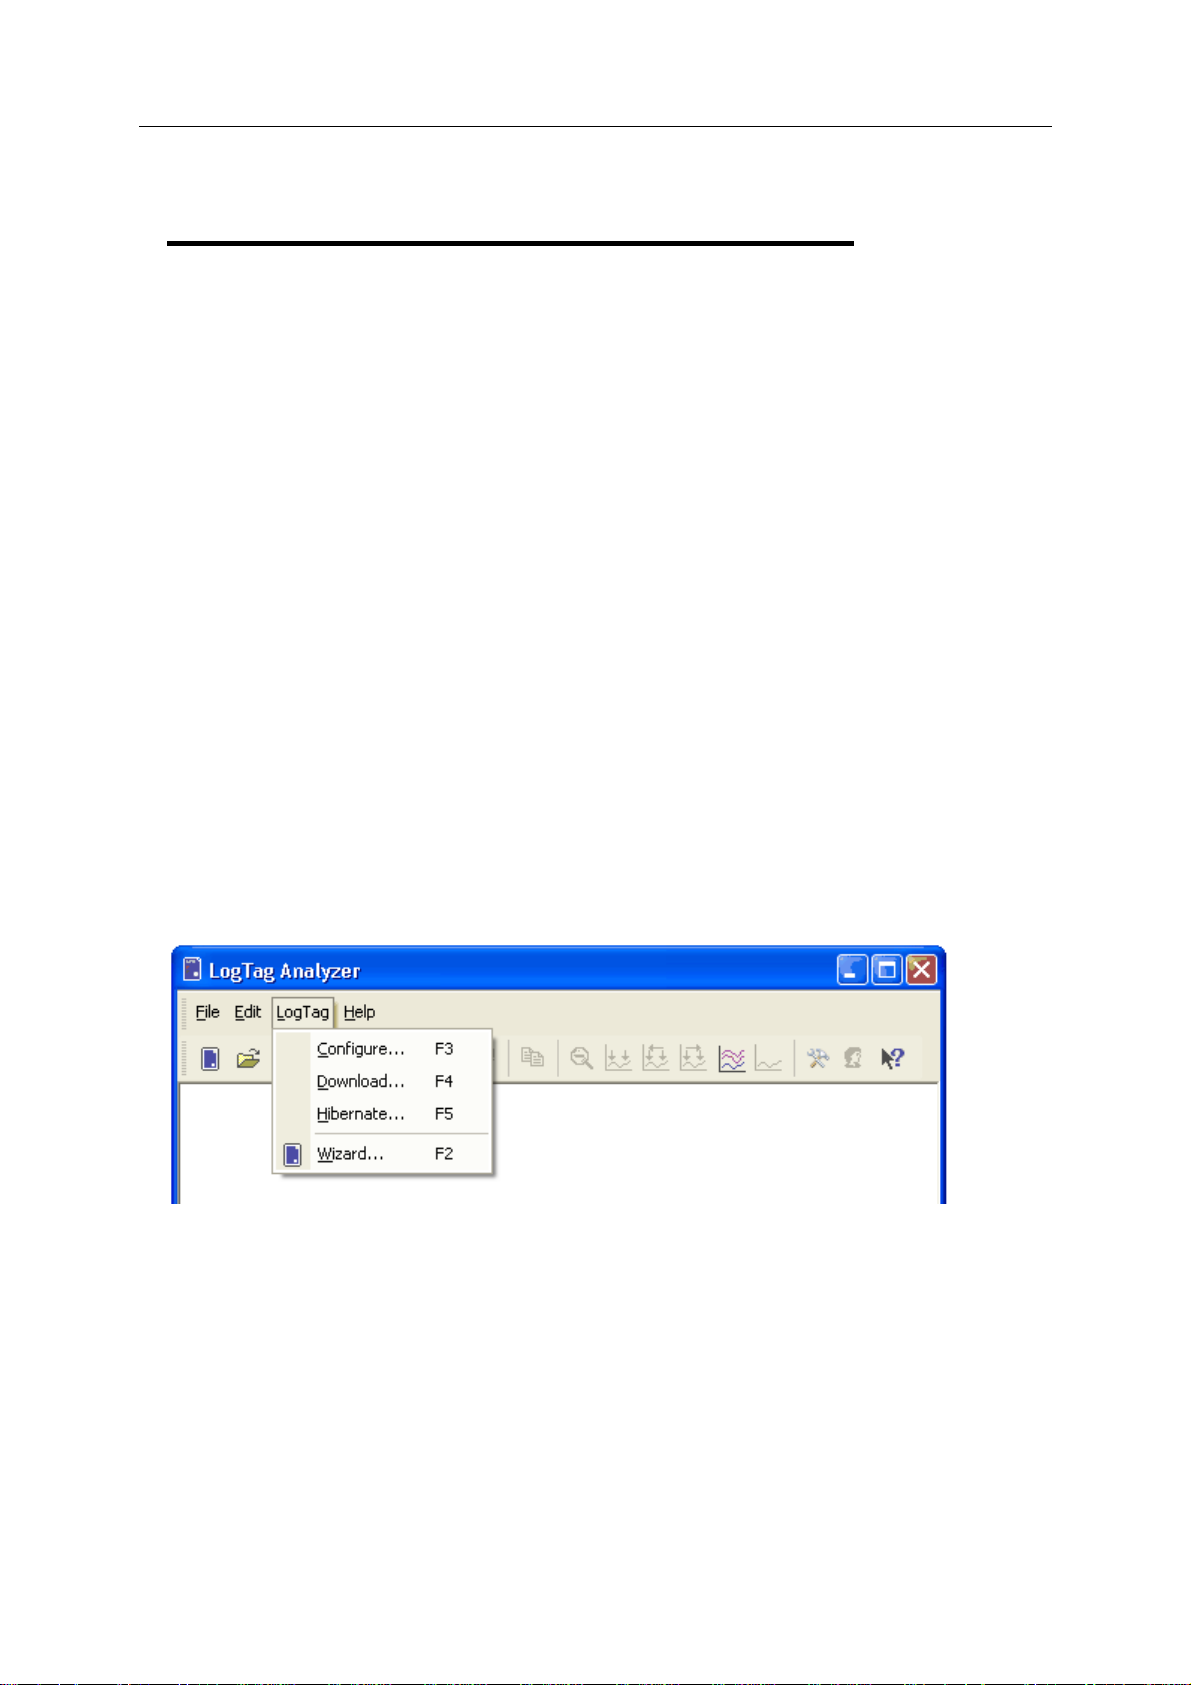
To begin the process of preparing a LogTag to record information, first click the LogTag
icon (
start the LogTag wizard.
) that is located on the toolbar (see "Menus and Toolbars" on page 117), which will
The LogTag wizard performs two distinct tasks:
1 It finds the communication port (USB and/or Serial) that the LogTag is attached to
through the Interface Cradle and retrieves the data that is stored within the LogTag,
and
2 It allows the LogTag that is currently connected and in the Interface Cradle to be
prepared for its next use.
The wizard is a key part of the software that is used for each of the steps.

Chapter 3 Quick Start Guide 17
Welcome
First the Wizard has a welcome screen (this is "1" on the Action List). This asks you to
make sure you have not neglected to place the LogTag firmly in the Interface Cradle.
The Wizard is responsible for certain "Action Steps" and these are clearly listed at the left
in the wizard window.
To get to the next screen, click on
and the next wizard screen will appear.
The green arrow will indicate you have moved to Step 2.

18 LogTag Analyzer User Guide (2.0)
Locate LogTag(s) download and save relevant data
In this screen you will see one of the following pictures next to each of the items in the
list:
(no picture) indicates the software is still using this communications port.
The LogTag should be almost instantly recognized by serial number and the number of
readings. It is possible to have and use more than one communication port at a time and
if so, the wizard will find all the LogTags.
Data was successfully retrieved from the LogTag and stored/saved to disk.
Data was successfully retrieved from the LogTag but there was no need to save
the information to disk.
The software was unable to detect an Interface Cradle connected to the
communications port or was unable to detect a LogTag in the Interface Cradle.
The LogTag is a single use logger and cannot be prepared for use again and
should therefore be returned to the supplying distributor or agent once you have
finished with the LogTag. You will still be able to continue to retrieve information
stored within the LogTag.

Chapter 3 Quick Start Guide 19
The communication ports that are not in use (the ones that initially are reported with the
mark) can be removed from view by selecting an option (see "Communication Ports"
on page 113). You don't have to do that now, but you can do it later to clean up the
"wizard window" appearance.
To get to the next screen, click on
and the third wizard step screen will
appear. The software will automatically proceed to the next wizard step, as if the user
clicked on
, if each of the Interface Cradles detected have a LogTag detected
in them and the information within the LogTag was successfully retrieved.
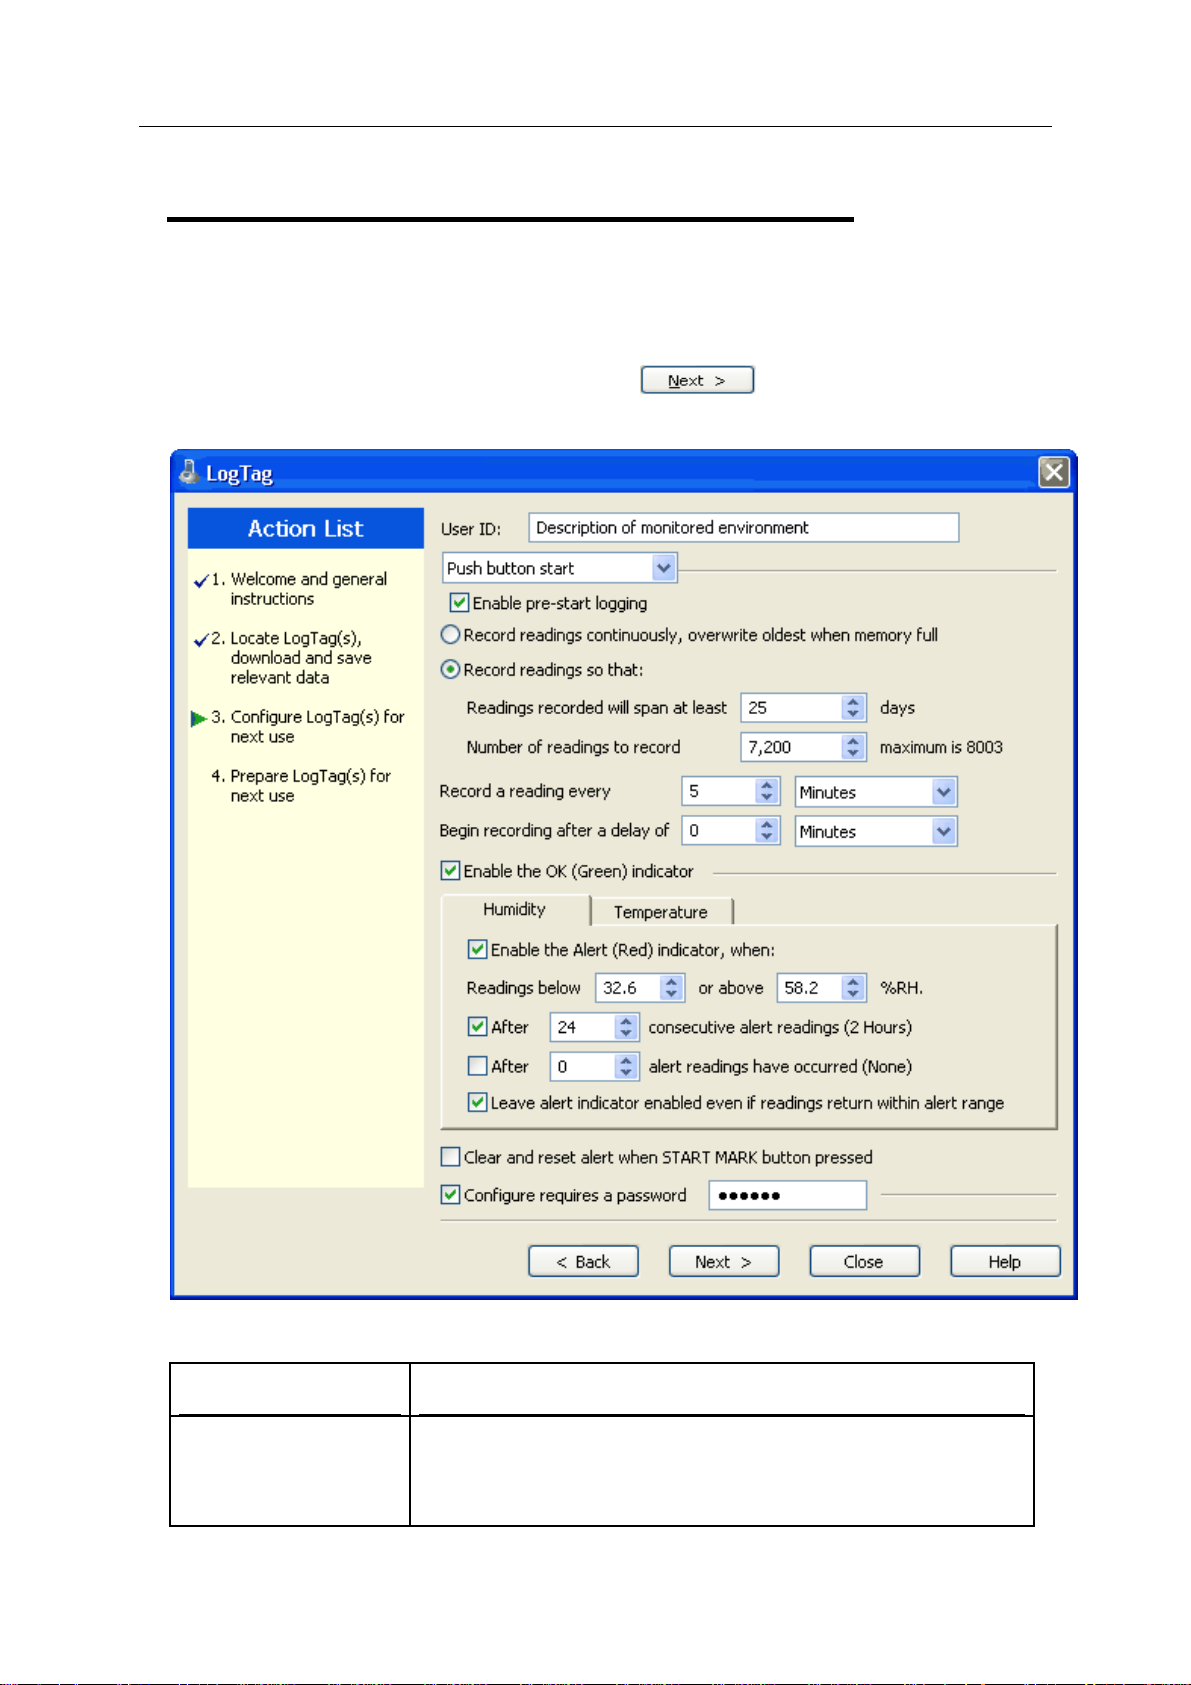
Configure LogTag(s) for next use
The options are available so you have appropriate control over the way the LogTags will
behave and store data for the upcoming period of recording. These options are explained

20 LogTag Analyzer User Guide (2.0)
in more detail in the chapter "Preparing LogTag for use on page 26". Click to
record the configuration data and you will see the final confirmation screen.
Prepare LogTag(s) for next use
The last Wizard screen involves sending the new configuration data to each LogTag to
prepare them for their next use. While the software is sending the new configuration data
to each LogTag the top of the window will look similar to the following picture. The
process of sending the new configuration data to each LogTag should take less than 20
seconds in total to complete.

Chapter 3 Quick Start Guide 21
Once the software has finished uploading the updated configuration information into each
LogTag, the window displaying the progress will look similar to the following picture.
In this screen you will see one of the following pictures next to each of the items in the
list:
(no picture) indicates the LogTag is still in the process of being prepared for its next
use.
The LogTag was successfully prep ared for its next use.
The LogTag failed to be prepared for next use. Press to try again.
The battery within the LogTag is low and is unlikely to have enough capacity to
record all the data you want during its next use. In this situation the LogTag should no
longer be used.
When all LogTags have finished receiving their new configuration data, click
to close the wizard. Your LogTag(s) are now ready to be started and used.
Please note that the automatic download feature is disabled in this screen. If you use the
button to configure a different LogTag, you may update the configuration of
a LogTag with unsaved data.

22 LogTag Analyzer User Guide (2.0)
Starting and using the LogTag
Once a LogTag has been successfully configured for use it is ready to be started. There
are two discrete methods available to start a LogTag recording, which are selected during
configuration. These start methods are explained in more detail in the chapter "Preparing
LogTag for use on page 26".
1 By pressing and holding the START MARK button on the LogTag until both the OK and
Alert lights alternately flash on and off.
2 By waiting until the date/time defined during configuration is reached, at which time
recording will automatically commence. Pressing the START MARK button will have no
effect until recording has commenced.
You can also have the LogTag record an "inspection" mark at any time while it is
recording, simply by pressing and holding the START MARK button on the LogTag until
both the OK and Alert lights flash on and off at the same time. You may have the LogTag
record as many inspection marks as you want while it is recording, however only one
inspection mark can be recorded per reading. In other words, if your LogTag is configured
to take readings at 15 minute intervals, inspection marks can be recorded at intervals of
15 minutes or more. If the LogTag has finished recording then pressing the START MARK
button will have no effect until after the LogTag has been prepared for next use.
Once the LogTag has started recording (either via Start button or date/time start) the
Alert and OK indicator lights operate in the following manner:
Red 'Alert' light : Flashes every 4 seconds if a configured alert condition has been met
and/or exceeded.
If an alert condition is still present at the end of recording then the Alert light will
continue to flash at the same rate.
Green 'OK' light: Regularly flashes every 4 seconds while recording is active to indicate
that no alert condition is present.
If recording is complete and no alert condition is present then will flash regularly every 8
seconds.

Chapter 3 Quick Start Guide 23
Only flashes if no alert condition is present.

24 LogTag Analyzer User Guide (2.0)
LogTag light patterns
The LogTag's LED's signal a number of different events or status information. The table
below contains a summary of the light patterns you may come across during use.
Signal Sequence Occurrence
LogTag
wake-up signal
LogTag
start-up signal
Sequence of four
alternate flashes of
green-red LED’s
Sequence of sixteen
alternate flashes of
green-red LED’s
displayed after configuration has been
successfully applied to the LogTag.
when a LogTag is woken up from hibernation (see
"Prolonging battery life" on page 45) state.
Not to be mixed up with...
displayed when the LogTag starts its recording
cycle.
Mark signal Sequence of five
simultaneous flashes
of green and red LED’s
Logging active,
no alert
present
Logging
finished, no
alert present
Single flash of green
LED every 4 seconds
(approx.)
Single flash of green
LED every 8 seconds
(approx.)
displayed when pressing start/mark button while
recording to indicate an inspection mark in the
software.
displayed directly after the start-up signal
following a push button start where a recording
delay has been configured. In this instance the
start-up signal is repeated when the actual
recording begins.
indicates LogTag is recording.
This is not displayed when pre-start is active and
the main logging cycle has not yet started. It is
also not displayed when the green LED has been
turned off in the configuration screen.
indicates LogTag has finished recording.
This is not displayed when the green LED has
been turned off in the configuration screen.
Will also be displayed when unit has been woken
up from hibernation.

Chapter 3 Quick Start Guide 25
Alert condition
present
Communication The green LED will
Start button
press
Single flash of red LED
every 4 seconds
flash occasionally
red LED glows faintly
displayed when the LogTag has detected an alert
condition (see "Alert Processing" on page 34) and
the Alert LED has been activated
If an alert is present you cannot determine if the
unit is still logging or has finished its log cycle. It
is more important to ensure an alarm condition is
not overlooked, and 8 seconds are to long a time
to still achieve that.
If the Alert LED has not been activated during
configuration, in essence the visual indicators
have been disabled, and the green LED will flash
every 4 or 8 seconds as above.
during communication with the interface the
green LED will flash occasionally; no information
is conveyed in this.
This is by design but conveys no information.
Retrieve information from
LogTag
When you are ready to view the recordings that are stored within the LogTag, just place
the LogTag into the Interface Cradle as before. If the LogTag is still recording when you
go to retrieve the readings it will continue to record without interruption so you will be
able to download again later if you choose.
If the LogTag has readings stored within its memory, the software will automatically start
to retrieve a copy of the recording contained within the LogTag and will also display an
animated picture during the download process, similar to the following picture.
Once the readings have been successfully retrieved from the LogTag(s), the software will
display the information for you. The chapter "Results from LogTag (on page 47)" explains
in more detail the information that is displayed to you as a result of retrieving the
recorded readings from LogTag(s).

26
C HAPTER 4
Preparing LogTag(s) for use
Before you can use a LogTag to monitor and record environmental conditions you must
first prepare it for use. The process of preparing a LogTag for use allows you to define a
number of parameters, including:
How long it should record the environmental condition for, so that you can be assured
that it will record for the duration of time required. For example, if you want it to
monitor a shipment that will take 10 days to deliver, you will be able to make sure it
will record the humidity and/or temperatures throughout the entire 10 day period.
How often it should record the environmental conditions.
Under what conditions it should display an alert. An alert indicates when the
environmental condition being recorded is not within set limits.
This chapter explains how to prepare a LogTag for use and what the options mean.
In This Chapter
Getting a LogTag ready for use ............................... 27
Restricted Access Requirements .............................. 28
Preparing LogTag for next use ................................ 30
Alert Processing ..................................................... 34
Advanced Alert Settings .......................................... 37
Display Logger Alarms ............................................ 40
Verify Access Password ........................................... 42
Pre-start data collection .......................................... 42
Continuous operation ............................................. 43
Working with batches of LogTags ............................ 43
Getting the best from your LogTag .......................... 44
Prolonging battery life ............................................ 45

Chapter 4 Preparing LogTag(s) for use 27
Getting a LogTag ready for
use
There are two ways to prepare a LogTag for use, both of which will achieve the same
result. Once a LogTag has been through the configuration process to get it ready for next
use, any readings previously recorded will no longer be available for retrieval.
1 Click the LogTag icon (
LogTag menu.
This is the safest option, as it will retrieve any readings that are stored within the
LogTag and save them to disk before getting the LogTag ready for next use. This
option is useful when you are unsure whether or not the readings stored within the
LogTag have been previously retrieved and saved to disk.
2 Click the "Configure..." menu item located in the LogTag menu.
This is the quickest option, as it does not involve the step that retrieves any readings
that are stored within the LogTag. This option is useful when you know you have
previously retrieved the readings or you no longer need a record of the readings that
are currently stored within the LogTag.
) on the toolbar or the "Wizard..." menu item located in the
The wizard will appear once you have selected the option of your choice to guide you
through the necessary steps to prepare a LogTag for next use. While the wizard is visible
the "Automatic download" feature will be disabled.
28 LogTag Analyzer User Guide (2.0)
Restricted Access
Requirements
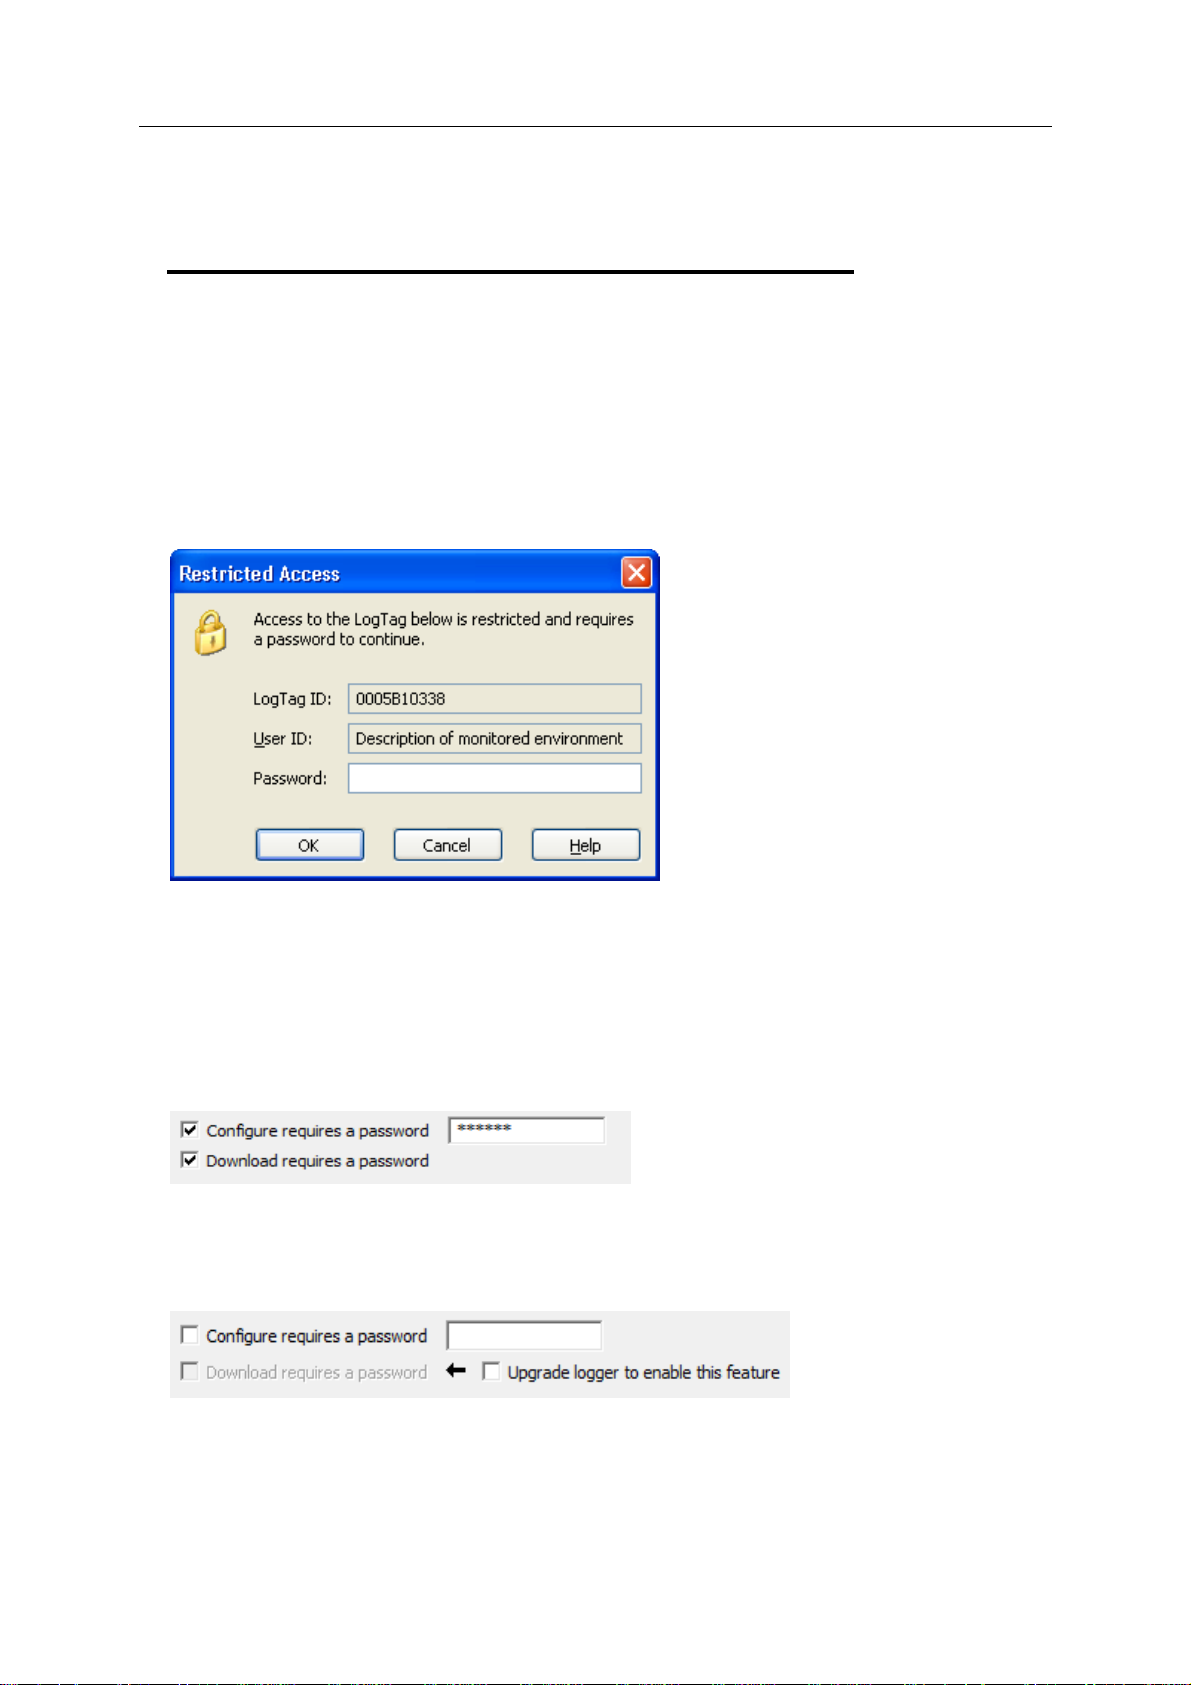
Every LogTag supports an option that, when enabled, results in users being required to
provide the correct password to gain further access to the LogTag. When the restricted
access option is enabled, a window similar to the following picture will be displayed
allowing the user to enter the correct password.
The relevant process and/or wizard will only continue successfully if the correct password
is supplied by the user. Passwords are case sensitive and therefore the passwords "Bob"
and "bob", for example, are different.
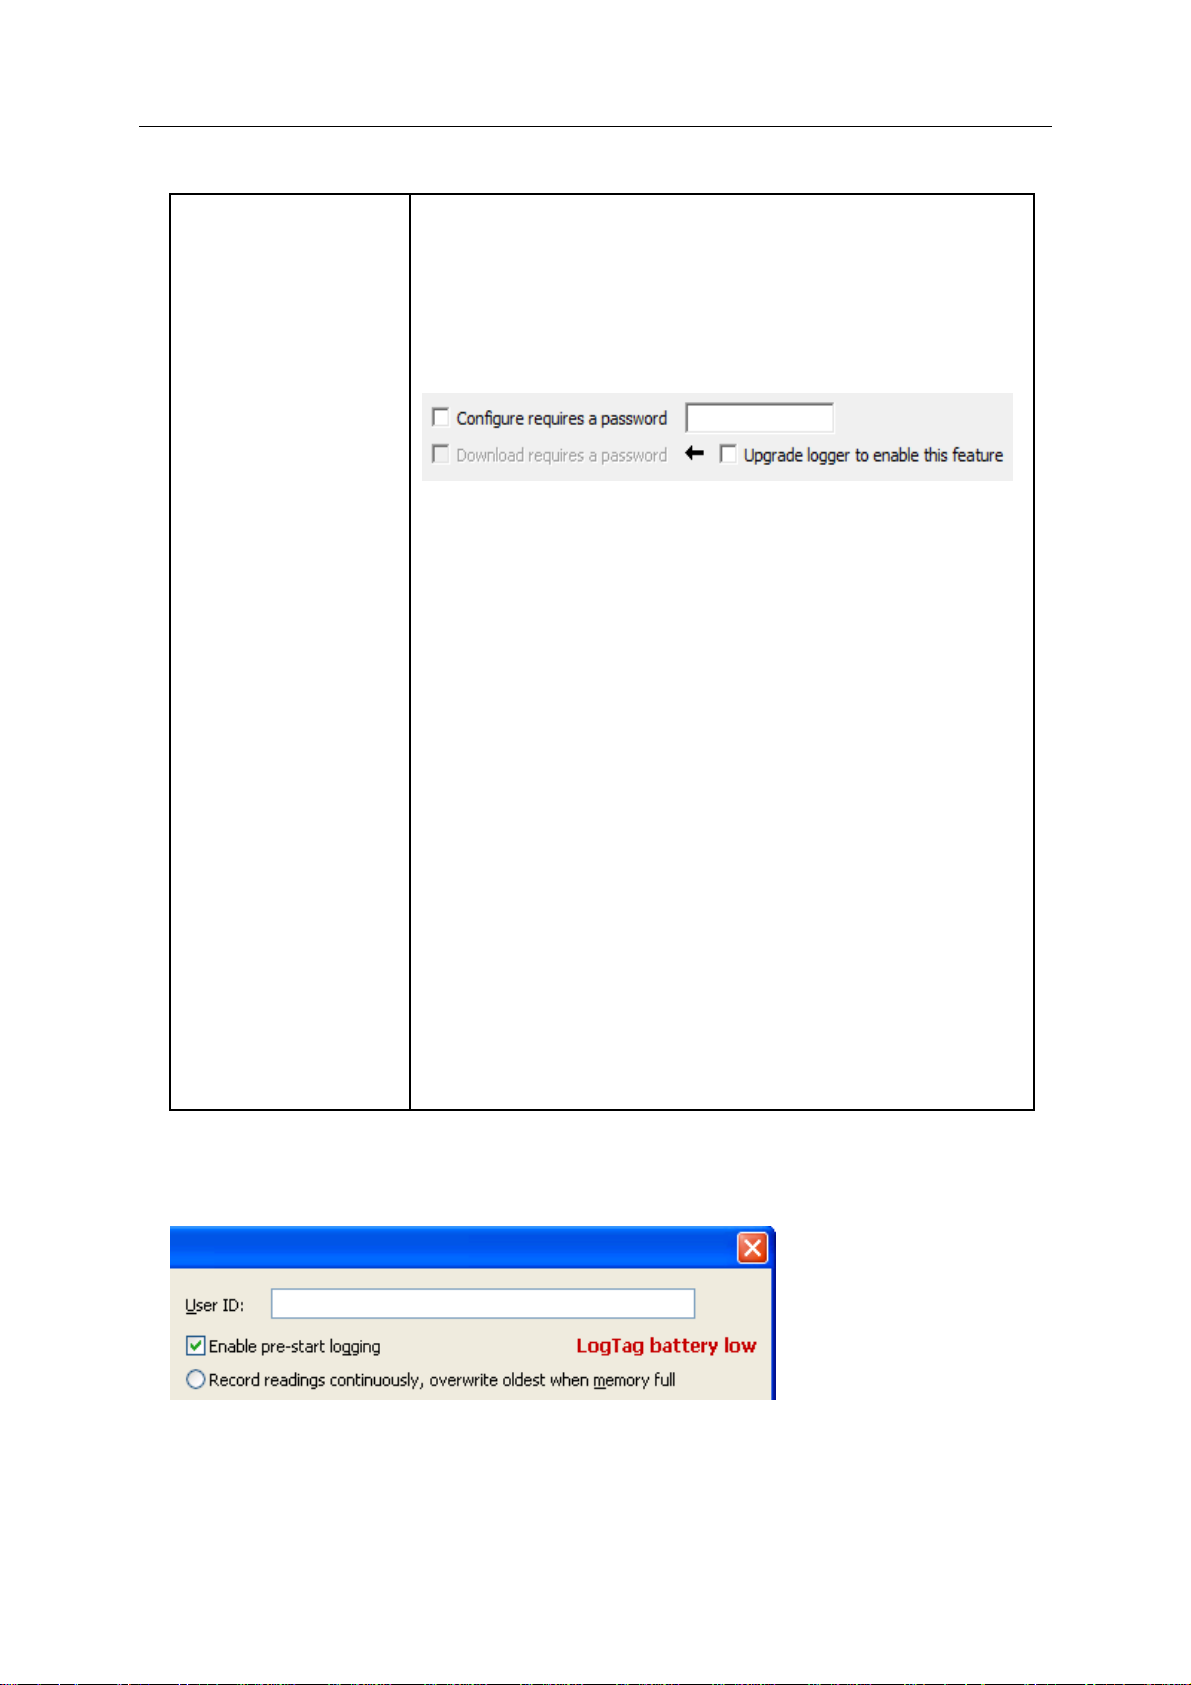
Various models also offer the option to also request a password when the logger is
downloaded. This function is enabled when configuring the logger by ticking the box next
to "Download requires password":
Some models do not have this feature enabled and can be upgraded, so a password can
be requested on download. In this case a further check box appears on the configuration
screen:
The tick box "Download requires a password" is greyed out if the update has not
previously been applied to the logger being configured. Once you tick the "Update logger
to enable this feature" box, the "Download requires a password" box becomes available
for activation. You can then select the password functions for either configuration or

Chapter 4 Preparing LogTag(s) for use 29
download. The logger will be permanently upgraded as soon as the configuration is
downloaded.
Following should be noted:
The update cannot be reversed.
If the "Update logger to enable this feature" is ticked, the upgrade will perform,
regardless whether any of the "...requires a password" tick boxes are enabled or not.
If multiple units are configured at the same time using more than one interface, all
units will be upgraded if the Upgrade option is selected.
If this upgrade is applied, LogTag Analyzer 1.8r9 or later will be required to access the
loggers. Older versions will display an error message if communication is attempted.
When the "Again" button is used with a different unit, that unit will also be upgraded.
Data files cannot be protected by passwords.
If a unit has been upgraded in a previous session, and is now configured using the
"Download requires a password" function, units configured with the "Again" button in
the same session will not automatically be upgraded; only those units that have
already been upgraded separately in a previous session will have the "Password on
download" function enabled.
30 LogTag Analyzer User Guide (2.0)
Preparing LogTag for next use
The "Configure LogTag(s) for next use" step provides you with all the options that can be
configured to effect how a LogTag records data during its next use. Once the changes
within this screen have been made, if any, click
information to the LogTag(s).
to send the configuration
The following table describes each configurable option that is permitted to change.
Function Purpose
User ID This can be used for identification of the load in transit to be
monitored, or simply an identifier that describes the purpose of the
monitoring. Bill of Loading information, Shipper, commodity,
contact name and other relevant information can be placed here.

Chapter 4 Preparing LogTag(s) for use 31
Start method This is used to determine how/when the LogTag will start recording
its next set of readings.
Push button start
When the 'Push button start' option is selected, the LogTag will
start recording when the START MARK button has been pressed
and held until both the OK and Alert lights alternately flash on
and off. If pre-start recording is enabled, the LogTag will start
logging pre-start readings immediately (see section "Pre start
data collection on page 42").
Date/Time start
When the 'Date/Time start' option is selected, the LogTag will
automatically start recording at the date/time defined in the
subsequent field. Pressing the START MARK button prior to the
start date/time will have no effect. There will be no pre-start
readings recorded prior to the start date/time.
Note: When using the Date/Time start option, the earliest start
time that can be selected is two minutes after the current time.
This delay allows you to complete the remaining configuration
options and gives the software enough time to configure the
LogTag before it starts.
Push button start from hibernation
When the 'Push button start from hibernation' option is
selected, the LogTag will start as if programmed for 'Push
button start'. The difference is that once the configuration is
successfully downloaded to the LogTag it will be placed into
hibernation. When the START MARK button has been pressed
and held, the LogTag will wake from hibernation and start
recording with the parameters as configured.
Please note in this mode the real time clock inside the logger is
not active. It is therefore vital that the computer on which the
unit is downloaded is set to the correct time.
Please see Prolonging battery life (on page 45) for more
information on Hibernation.
Not every LogTag model can support every start mechanism. As a
result, specific options may not be be listed when configuring a
LogTag.
Enable pre-start logging Pre-start logging is a feature that protects the recording in the
event of a failure to actually press the START MARK button to
initiate the recording. It is an insurance policy against the loss of
critical data. This is almost always checked for transit monitoring
applications. This option is further explained in the section "Pre
start data collection on page 42".
Record readings
continuously, overwrite
oldest when memory
full
This is what is called a "data wrap" in which the recorder just keeps
writing data to memory. It is a "moving window" of data. For
example, this is useful for fixed base MKT monitoring with the
interval set to one year, so that the current "yearly MKT" can
always be in the memory of the LogTag. If this option is selected,
the user will be "opted out" of the next two options. This option is
further explained in the section "Continuous operation (on page
43)".

32 LogTag Analyzer User Guide (2.0)
Record readings so
that:
Readings recorded will
span at least X days
Number of readings to
record X maximum is Y
Record a reading every
X
If this is selected, the logger stops logging when the number of
data points has been gathered and stored in memory that spans at
least the number of days specified below. When this option is
selected, the following two options will determine the number of
data points over the span of time that will be recorded.
If you know how long you want to record, the Configuration screen
will automatically set the number of readings to be collected at a
particular interval. This setting will only have an effect if the above
option "Record readings so that:" is selected.
This data box will display the calculated number of readings if you
select a time span and an interval. Alternatively, you can select the
number of readings desired, and the time span will be altered
based on the interval. If this is selected, the logger will stop logging
when the number of readings has been gathered and stored in
memory. "Y" represents the maximum number of readings the
LogTag can store, however with a selected interval and a selected
time span, you may not need to use all of the available data space.
This setting will only have an effect if the above option "Record
readings so that:" is selected.
This determines how frequently the LogTag records the
environmental humidity and/or temperature into its internal
memory.
Begin recording after a
delay of X
Enable the OK (Green)
indicator
Humidity / Temperature These tab controls will allow the humidity and temperature alert
Configure requires a
password
Determines how long after the START MARK button on the LogTag
has been pressed that it will actually begin to record the
environment humidity and/or temperature. This feature is useful for
example, when the LogTag could falsely trigger an alert because
the environmental conditions it is being started in is quite different
to the environmental conditions to be monitored. If pre-start
logging is enabled, the LogTag will continue to record pre-start
readings during this delay.
This determines whether or not the green light should function
while the LogTag is recording after being started.
conditions to be configured independently. These tab controls will
only appear when configuring a LogTag that has a humidity and a
temperature sensor. If the LogTag has only one sensor then the
following alert conditions will apply to that sensor.
This feature allows the user to define a password that must be
provided (see "Restricted Access Requirements" on page 28) to
configure the LogTag next time. If this option is enabled and the
password changes, the user will be required to verify the new
password (see "Verify Access Password" on page 42) when the
wizard progresses to the next step. Passwords are case sensitive
and therefore the passwords "Bob" and "bob", for example, are
different.
Download requires a
password
If this option is enabled, the LogTag's recorded data can only be
downloaded after entering the correct password.
Note: Only one password can be provided for each LogTag. The
same password applies to the Configure and Download actions.
Chapter 4 Preparing LogTag(s) for use 33
Upgrade logger to
enable this feature
TRIX-8 and TREX-8 loggers which do not yet have the "Download
requires a password" feature can be upgraded. These units will
then require LogTag Analyzer revision 1.8r9 or later to be
configured or downloaded, and an error message will be displayed
in older versions.
If LogTag Analyzer configures such a logger, an additional check
box is displayed:
The “Download requires a password” is grayed out if the update
has not previously been applied to the logger being configured.
Once you tick the “Update logger to enable this feature” box, the
“Download requires a password” check box becomes available for
activation. You can then select the password functions for either
configuration or download. The logger will be permanently
upgraded as soon as the configuration is downloaded.
Note:
The update cannot be reversed.
If the “Update logger to enable this feature” is ticked, the
upgrade will perform, regardless whether any of the “...requires
a password” tick boxes are enabled or not.
If multiple units are configured at the same time using more
than one interface, all units will be upgraded if the Upgrade
option is selected.
When the “Again” button is used with a different unit, that unit
will also be upgraded.
Note: If a unit has been upgraded in a previous session, and is
now configured using the “Download requires a password”
function, units configured with the “Again” button in the same
session will not automatically be upgraded; only those units that
have already been upgraded separately in a previous session will
have the “Password on download” function enabled.
If the battery within the LogTag is detected to be low and therefore not recommended for
further use, the software will display a warning to you in the top right corner, like the
following example.
Some LogTag models display the remaining percentage in this screen once it falls below
half capacity. Some models cannot be configured any longer once their battery capacity
falls below a pre-determined threshold.

34 LogTag Analyzer User Guide (2.0)
Alert Processing
The LogTag can display a visual alert if one or more of the configured alert conditions
have been met. An alert condition can be a single alert reading (a reading outside of or
including the upper and lower threshold values), a combination of consecutive alert
readings or a total of alert readings encountered during the trip.
The threshold parameters are identified in LogTag Analyzer when the LogTag's readings
are downloaded and displayed.
Please note that matching these to known conditions of interest in your monitoring
program may require some information about the effects of exposure to different
durations of out-of-range humidity and/or temperatures.
As with the other logging parameters these are adjusted in the "Configure LogTags for
use" screen.
The following table describes each configurable option.
Function Purpose
Enable the Alert (Red)
indicator when
This determines whether or not the red light should activate when
an alert condition has been detected. An alert occurs when one or
more of the conditions described below have been met. When an
alert condition has occurred, this indicator will flash at a regular
interval.

Chapter 4 Preparing LogTag(s) for use 35
Readings below X or
above Y (inclusive)
After X consecutive alert
readings (W minutes)
After X alert readings
have occurred (W
minutes)
You can set the upper threshold limit and lower threshold limit by
entering the appropriate information in the boxes. If readings stay
inside the range specified by X and Y the alert indicator will not
activate. If a reading of X and below, or Y and above is recorded,
the alert indicator may light up, dependent on the alert conditions.
Charts will display alert readings according the settings made in the
Charts (on page 90) section of the 'Options' Screen.
Note: The values entered in these boxes are included in the alert
range. In the above example 7 consecutive readings of 45°C will
trigger an alert, whereas 7 consecutive readings of 44.9°C will not
trigger an alert. Please set your alert values with this in mind.
Tick this box, and enter a number into the adjacent field if you
want to trigger an alert condition once X number of consecutive
alert readings are recorded. Note that the number of minutes
shown will depend on the number of alert readings you enter into
the box AND the recording interval already specified. For example,
if X is 3 and two readings are above the upper threshold limit but
the subsequent reading is below the upper threshold limit and still
above the lower threshold limit then the alert indicator will not
activate. Maximum value is 256, minimum is 2.
Tick this box, and enter a number into the adjacent field if you
want to trigger an alert condition once a total number of alert
readings have been recorded, regardless of whether they are
consecutive or not. Maximum value is 256, minimum is 2.
Leave alert indicator
enabled even if
readings return within
alert range
Clear and reset alert
when START MARK
button pressed
You can increase or decrease the values with the arrows next to
the fields. Please note these are linked and certain combinations
may not be allowed.
If this option is enabled then the alert indicator will remain active,
even if the current reading does not meet the alert conditions
specified by the previous controls.
If this option is disabled then the alert indicator will remain active
only if the current reading meets the alert conditions specified by
the previous controls.
If this feature is enabled, any user can turn off an active alert by
pressing the LogTag's START MARK button. It will also reset the
internal alert counters such that it would be as if no alert condition
had occurred at all while the LogTag was recording.
Should the LogTag subsequently detect a further alert condition,
the alert will activate again.
Once the LogTag has finished recording, pressing the START MARK
button will not clear and reset any active alert.
If the LogTag being configured does not support this feature, it will
be disabled and its setting cannot be changed.

36 LogTag Analyzer User Guide (2.0)
Example:
You wish to configured a LogTag so alert conditions are indicated if 5 continuous readings
are out-of-range or 7 total readings are out-of-range. Alert parameters should be set as
follows:
This table shows how different conditions would result in the Alert Indicator flashing or
not:
What the LogTag recorded What the LogTag indicated
2 readings out-of-range, return to normal,
2 readings out-of-range, return to normal,
2 readings out-of-range, return to normal
Neither alert condition is met.
The maximum number of consecutive
out-of-spec readings is only 2 (5 required.)
The total out-of-range events equals 2 + 2 + 2
= 6. The alert condition is 7 total, so the alert
does not go off.
4 readings out-of-range, return to normal,
4 readings out-of-range
4 readings out-of-range, return to normal,
2 readings out-of-range
No Flashing Red Alert Indicator
The first alert condition is not met, as the the
maximum number of consecutive alert condition
readings is only 4 (5 required.)
The second alert condition however IS met
since the total alert condition readings equals 4
+ 4 = 8. The alert condition is 7 total. so the
alert DOES go off.
Flashing Red Alert Indicator
Neither alert condition is met.
The maximum number of consecutive alert
condition readings is only 4 (5 required.)
The total number of alert condition readings
equals 4 + 2 = 6. The alert condition is 7 total,
so the alert does not go off.
No Flashing Red Alert Indicator
Chapter 4 Preparing LogTag(s) for use 37
6 readings out-of-range, return to normal The second alert condition is not met, as the
total out-of-range events equals 6 (7 required.)
The maximum number of consecutive alert
condition readings however is 6, the alert
condition is 5 consecutive readings, so the alert
DOES go off.
Flashing Red Alert Indicator
Please note following special conditions:
1. If you wish an alert to be indicated on the first reading that is recorded out-of-spec,
place a tick in the box next to "Enable the Alert (Red) indicator when" and remove the
ticks in both boxes next to the "After X consecutive alert readings" and "After X alert
readings have occurred".
2. You can not enter a number into the "After X consecutive alert readings" field which is
larger than the number in "After X alert readings have occurred", since the latter alert
condition would always be met first.
3. Similarly, you can not enter a number into the "After X alert readings have occurred"
field which is smaller than the number in "After X consecutive alert readings". The
software will adjust field values as appropriate.
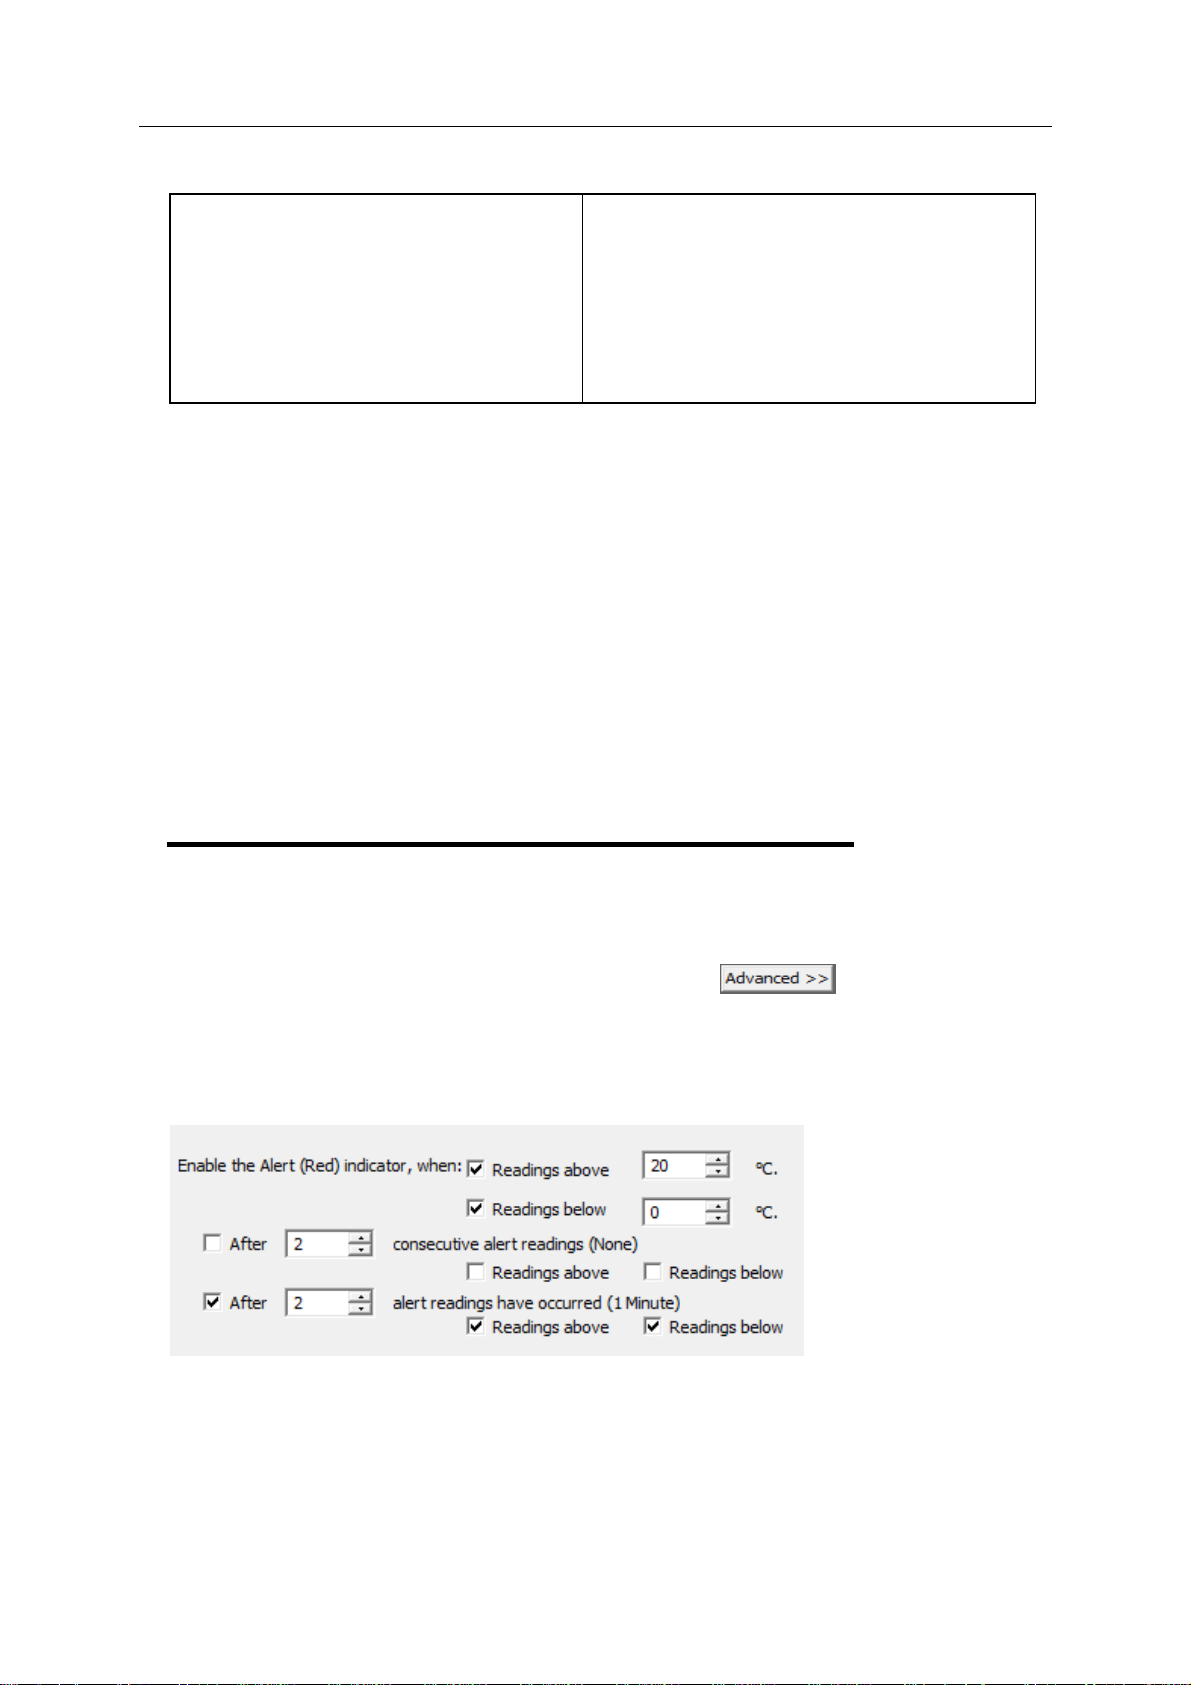
Advanced Alert Settings
Some LogTags support more detailed alert settings than described before. If LogTag
Analyzer encounters one of these loggers, an additional
the bottom left of the configuration screen.
When this button is pressed, the alert configuration screen changes and displays
additional settings:
button is visible in
The red alert indicator can now be configured independently for upper and lower alert
values.

38 LogTag Analyzer User Guide (2.0)
Function
Readings above X
Readings below Y
(inclusive)
After X consecutive alert
readings (W minutes)
Readings above
Readings below
After X alert readings have
occurred (W minutes)
Readings above
Readings below
Purpose
In addition to entering the threshold levels, tick the boxes next
to "Readings above" or "Readings below" to enable the alert
conditions for only the upper or only the lower threshold
settings, or for both. If both boxes are ticked, the behaviour is
the same as for the standard alert settings. The charts will
display alert readings according to the settings made in the
Charts (on page 90) section of the 'Options' Screen.
Tick the boxes next to "Readings above" or "Readings below" to
establish whether only readings above and including the upper
threshold or only readings below and including the lower
threshold should count towards the consecutive alert readings. If
both boxes are ticked, the behaviour is the same as for the
standard alert settings. If the Alert Indicator is disabled for either
the upper or the lower alert, the respective box for the
consecutive alert is grayed out and cannot be ticked.
Tick the boxes next to "Readings above" or "Readings below" to
establish whether only readings above and including the upper
threshold or only readings below and including the lower
threshold should count towards the total number of alert
readings. If both boxes are ticked, the behaviour is the same as
for the standard alert settings. If the Alert Indicator is disabled
for either the upper or the lower alert, the respective box for the
alert total is grayed out and cannot be ticked.
The advanced settings are displayed automatically without the need to press
if an advanced configuration is already found in the logger to be configured. If you do not
wish to use the advanced settings, press
, and the standard Alert Processing
(on page 34) configuration screen is displayed.
Example:
You wish to configure a LogTag so an alert is displayed if 5 continuous readings are
out-of-range or 7 total readings are out-of-range, but only if the temperature goes to
20ºC and above. You wish to see in LogTag Analyzer if the product has gone to 0ºC and
below, but you do not wish to trigger an alert for this condition. Alert parameters should
be set as follows:

Chapter 4 Preparing LogTag(s) for use 39
This table shows how different conditions would result in the Alert Indicator flashing or
not:
What the LogTag recorded What the LogTag indicated
2 readings of 20ºC or above, return to
normal, 8 readings at 0ºC or below, return
to normal, 4 readings of 20ºC or above,
return to normal
4 readings of 20ºC or above, return to
normal, 4 readings of 20ºC or above
Neither alert condition is met.
The maximum number of consecutive
out-of-spec readings is only 2 (5 required, the 8
readings below 0ºC do not count towards alert
readings).
The total out-of-range events equals 2 + 4 = 6.
The alert condition is 7 total, so the alert does
not go off, as again the 8 readings below 0ºC
do not count towards alert readings.
No Flashing Red Alert Indicator
The first alert condition is not met, as the the
maximum number of consecutive out-of-spec
readings is only 4 (5 required.)
The second alert condition however IS met
since the total out-of-range events equals 4 + 4
= 8. The alert condition is 7 total. so the alert
DOES go off.
Flashing Red Alert Indicator
Separate alert conditions are useful if you expect the monitored product to encounter
temperatures lower than the lowest possible alert temperature. In this case a flashing
alert indicator may not necessarily indicate an unfavourable condition was encountered.
In programs where such conditions are monitored the lower alert should be turned off.

40 LogTag Analyzer User Guide (2.0)
Display Logger Alarms
TRID30-7F and TRID30-7R loggers have a different settings screen.
The settings are similar to the Advanced Alert Settings on page 37, hence they are not
explained again here. There is however one notable exception; for each range (above or
below) you can only select either accumulative or consecutive readings, but not a
combination of both. This does however give you the option to select e.g. a different
number of cumulative readings for above and below ranges.
In this screen you can also see an
following configuration screen is displayed, allowing you to enter parameters specific to
TRID30-7F and TRID30-7R loggers.
button. When clicking this button,

Chapter 4 Preparing LogTag(s) for use 41
Function
Clear and reset alarm
when STOP/CLEAR
button pressed
Alarm remains on even
if readings return to
non-violation range
Pause alarm/statistics
processing for X
readings
Purpose
If this option is enabled, any user can turn off an active alarm by
pressing the LogTag's STOP/CLEAR button. It will also reset the
internal counters such that it would be as if no alarm had occurred
while the LogTag was recording. Should the LogTag subsequently
detect a further alarm condition, the alarm will activate again. Once
the LogTag has finished recording, pressing the STOP/CLEAR
button will not clear and reset any active alarm.
In any case, an alarm will be registered in the day summary,
regardless whether it was cleared or not.
If this option is enabled then the alarm symbol will stay on, even if
the current reading does not meet the alarm conditions specified by
the previous controls.
If this option is disabled then the alarm symbol will stay on only if
the current reading meets the alarm conditions specified by the
previous controls.
If this option is enabled, pressing either button on the LogTag
while recording excludes the next reading from the alarm and
statistics calculations; PAUSED will now be shown on the display.
This allows the user to review the statistics or clear an alarm
without causing an invalid reading, alarm or statistic.
Switch off display after
30 seconds
Allow logging stop with
STOP button
Allow reset of logger
with START button
Show total summary
days collected
If this option is enabled, the display will turn off after 30 seconds to
save battery power.
If this option is enabled, the LogTag can be stopped by pressing
the STOP button. The recorder will no longer take any readings,
however you can still review the day statistics and download the
logged results to a PC with LogTag Analyzer.
If this option is enabled, TRID30-7F and TRID30-7R loggers can be
re-activated and used again for a new trip by pressing the START
button.
When re-activating the recorder, all previously recorded
readings and statistics will be erased!
When this option is enabled, a warning box will be displayed to
remind you this is enabled and can result in loss of data.
If this option is enabled, the LogTag shows the number of days for
which statistics have already been collected on the display.
Please refer to the LogTag TRID30-7F product specification & guide
(http://www.logtagrecorders.com/products/pdf/LOGTAG_TRID30-7_PRODUCT_SPECIFIC
ATION.pdf) for a detailed description on the functionality of these products.
42 LogTag Analyzer User Guide (2.0)
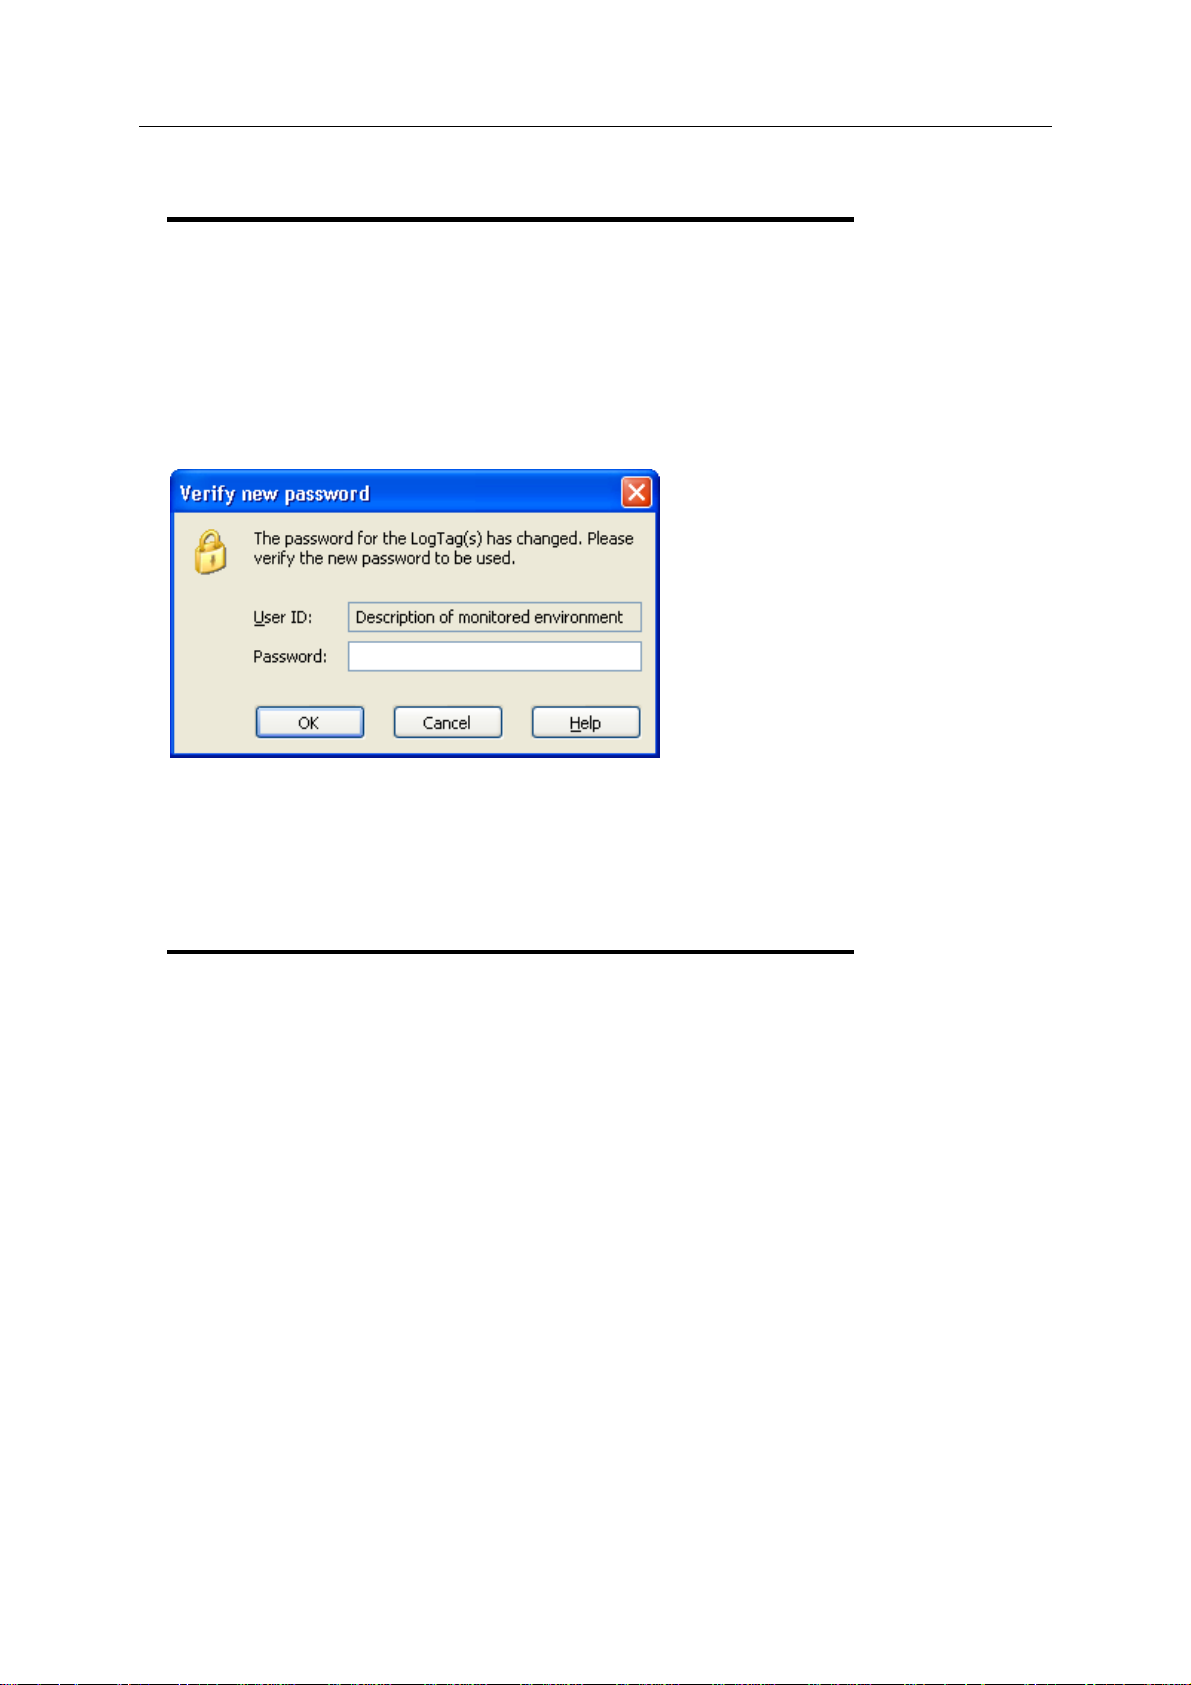
Verify Access Password
When configuring a LogTag for its next use, if the user enables the "Configure requires a
password on page 26" option and/or changes the password to restrict access to the
LogTag, then the user is required to verify the password to be defined before it will be
stored in the LogTag. The window that will appear to verify the password will be similar to
the following picture.
Once a password has been stored in the LogTag, further access to it can only be achieved
by providing the correct password. Therefore, if a password is forgotten further access to
the LogTag will not be possible. Passwords are case sensitive and therefore the
passwords "Bob" and "bob", for example, are different.
Pre-start data collection
The LogTags support a feature called "pre-start logging", which can be selected during
configuration.
When pre-start logging is enabled the LogTag will automatically start logging as soon as
configuration is completed. It will record at the same sampling interval as defined in the
configuration and will continue to record until the user starts the LogTag by pressing the
START MARK button on the LogTag. Once the LogTag has been started, it will record as
per the configuration settings. While the LogTag is recording pre-start readings the Alert
LED on the LogTag will not activate if an alert condition is detected.
Pre-start logging is useful as a fail-safe recording setting so if the LogTag is not started at
the appropriate time, the readings will still be available to view later.
When the readings are retrieved from the LogTag, any pre-start readings will be identified
as pre-start readings so the user can quickly identify the readings recorded before and
after the LogTag was started.
All LogTags have a finite amount of memory to store the readings it records. Therefore,
while the LogTag is recording pre-start readings the LogTag will operate in its 'continuous

Chapter 4 Preparing LogTag(s) for use 43
operation' mode, which is explained further in the section "Continuous operation (on page
43)". Once the memory within the LogTag is full the oldest pre-start reading will be
overwritten with the latest reading recorded, regardless of whether the reading recorded
is a pre-start reading or a reading to be recorded after the LogTag has been started.
If a LogTag has been configured to start recording at a certain date/time, or for push
button start from hibernation, no pre-start readings will be recorded.
Continuous operation
All LogTags have a finite amount of memory to store the readings that are recorded.
When the LogTag is recording readings continuously it will not stop once the memory
within the LogTag is full of readings. Rather it will replace the oldest reading stored within
the LogTag with the latest reading so that only the most recent readings are maintained
in the LogTag's memory.
If the LogTag being configured does not support this feature, you will not be able to
select this setting.”
Working with batches of
LogTags
You may find that at some stage you need perform a similar task on multiple LogTags,
whether it is retrieving readings stored within the LogTags and/or preparing them for
their next use. The LogTag Analyzer software has been designed to make the effort
involved with multiple LogTags as simple as possible.
To retrieve a copy of the recorded readings stored within multiple LogTags, simply insert
each LogTag to download into the Interface cradle. The software will then automatically
retrieve the recorded data from the LogTag, save it to disk and then display the
information for you. Therefore, you will be able to retrieve the recorded readings stored
from within one or more LogTags without needing to interact with the software and/or
computer.
To prepare multiple LogTags for use you can use the "Wizard..." or the "Configure..."
wizard, available in the "LogTag" menu, depending on whether or not you want to
retrieve and save a copy of any readings recorded within the LogTags you are about to
use. Simply prepare the first LogTag(s) as per usual and at the conclusion of the last step
remove the LogTag(s) from their Interface Cradle, place the next LogTag(s) to be
prepared for their next use into an Interface Cradle and click
will be able to prepare multiple LogTags for use with minimal interaction with the
software and/or computer.
. Therefore, you

44 LogTag Analyzer User Guide (2.0)
Getting the best from your
LogTag
Many users of humidity and/or temperature loggers are used to attaching the logger to a
hook or tie-wrapping them to a monitored object. A wide variety of attachment methods
can be used with the hole on upper right hand corner of the LogTag, such as bolting the
LogTag in position, attaching it to a packaging strap, using a car-seal for security or other
means.
The hole is quite strong, so most means of attachment will not compromise the structural
integrity of the LogTag. We do, however, recommend that the dead weight stress on the
hole itself not exceed 5 pounds (2 Kg).
The sensor for the LogTag is also very responsive, so we recommend you position the
LogTag in a location, where it will not be susceptible to changes in temperature due to
operational activities. For example, it is not recommended you place a LogTag beside a
door way, as every time someone passes through the door, the LogTag will register the
change of environmental temperature due to the breeze that will be generated by the
person, which does not necessarily reflect the overall temperature of the environment
been monitored.
Chapter 4 Preparing LogTag(s) for use 45
Prolonging battery life
If your LogTag is not going to be used for extended periods of time, it may be worthwhile
to set the LogTag into "Hibernation" mode. In "Hibernation" mode the LogTag will
consume minimal power, which will extend the battery life when compared with leaving
an idle LogTag in operating mode.
While a LogTag is in "Hibernation" mode it will:
1 Not be able to record and store any new readings.
2 Not activate the Alert and OK lights.
3 Not respond to the START MARK button being pressed
The only exception is when the LogTag has been configured for 'Push button start from
hibernation' in the configuration screen. In this case pressing the START MARK button will
'wake' the product and commence logging according to the configured settings. Not every
model supports this feature.
To 'wake' a LogTag from "Hibernation" mode to normal operating mode so that it can
record and store new readings, go through the usual process of preparing it for next use
(see "Preparing LogTag(s) for use" on page 26).
To set a LogTag to "Hibernation" mode, select the “Hibernate...” menu item in the
“LogTag...” menu.
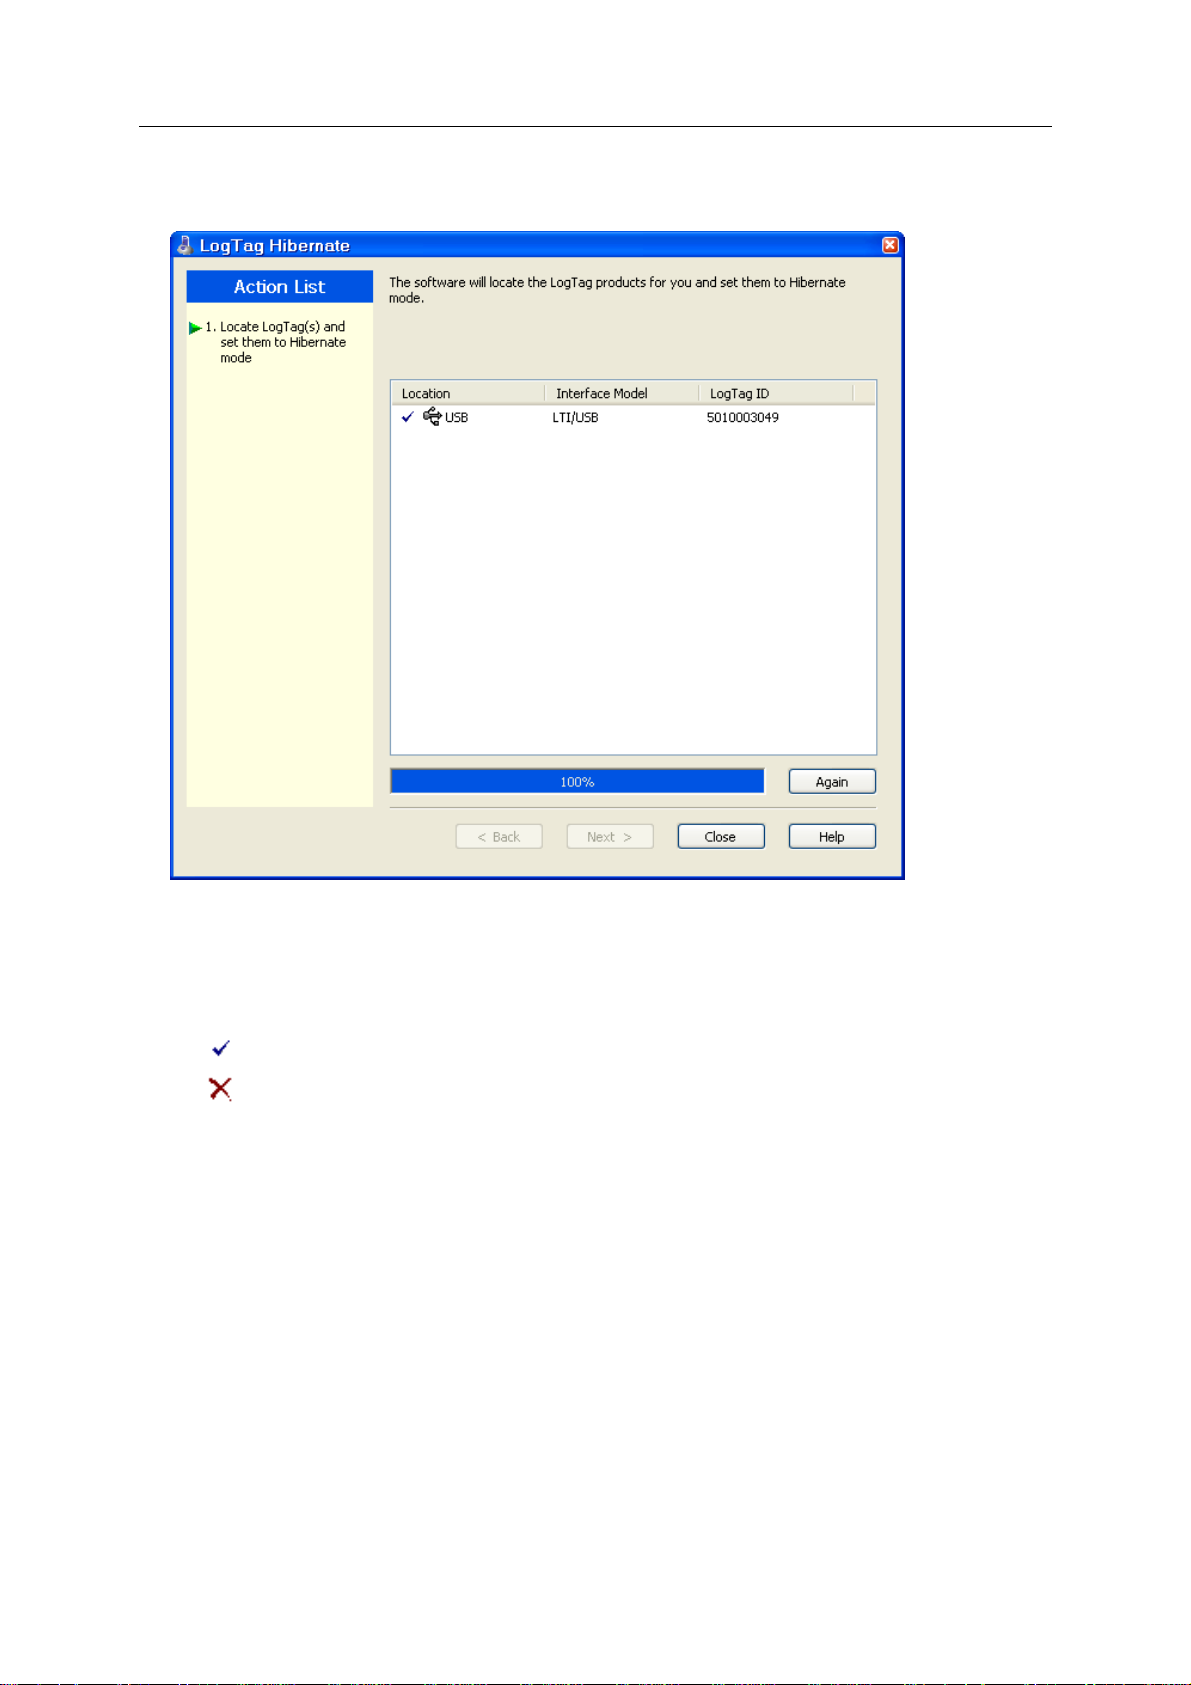
46 LogTag Analyzer User Guide (2.0)
The following example illustrates using the "Hibernation" feature.
In this screen you will see one of the following pictures next to each of the items in the
list:
(no picture) indicates the LogTag is still in the process of being set to "Hibernation"
mode.
The LogTag was successfully set to hibernation mode.
The software was unable to set the LogTag to hibernation mode.
Once a LogTag has been successfully set to "Hibernation" mode it should be removed
from the Interface Cradle before pressing any other button. As soon as the software
communicates with a LogTag in "Hibernation" mode, for example through automatic
download, Hibernation, etc, it will be returned to normal operating mode.
The extent to which the Hibernation mode will prolong the battery life of a LogTag may
vary between different models and versions of LogTag products. Some LogTag models
may not support Hibernation.

47
C HAPTER 5
Results from LogTag
The LogTag stores the recorded readings in its internal memory. Since the LogTag
contains the recorded readings in its internal memory, you must use the LogTag Analyzer
software to extract the information from the LogTag through the Interface Cradle and into
a format that can be displayed to you in a meaningful way. It is usually very important
that the information retrieved from a LogTag is retained. The software will automatically
save the information retrieved from a LogTag to your disk drive so that you can view the
information at a later date, a useful feature if you require traceability. This chapter
explains how you can retrieve the recorded information stored within a LogTag and have
the software display it to you on the screen in a meaningful way.
In This Chapter
Getting results from LogTag .................................... 48
Saving LogTag Data ............................................... 49
Understanding the results ....................................... 53
Inspecting the information at close range ................ 55
Manual scaling of the chart ..................................... 58
Chart annotations ................................................... 60
Chart subtitle ......................................................... 62
Combining charts onto a single chart ....................... 64
Automatically calculated statistics ............................ 71
Displaying statistics ................................................ 76
Printing the results ................................................. 76
Sending a file by e-mail direct from Analyzer ........... 77
Calling up previous results ...................................... 79
Digital signatures ................................................... 80
How secure is my data ........................................... 82
Viewing file properties ............................................ 84

48 LogTag Analyzer User Guide (2.0)
Getting results from LogTag
You can retrieve the recordings from LogTag(s) as many times as you require. The
process of retrieving data stored within a LogTag does not erase it from the LogTag's
memory. If the LogTag is currently recording while you retrieve the information, it will
continue to record without interruption.
There are three ways to retrieve the recorded results from a LogTag.
1 While the LogTag Analyzer software is open (does not need to be the currently active
software), simply slot the LogTag into the Interface Cradle. If the automatic download
feature is enabled, the software will automatically retrieve the recorded readings, save
the information to your disk drive and display the information to you. While the
software is automatically retrieving the readings you will see an animated picture
appear, similar to the following picture.
2 Click the "Download..." menu item located in the LogTag menu.
This is the second quickest option, as it does not include the steps involved in
preparing the LogTag(s) for their next use.
3 Click the LogTag icon (
) or the "Wizard..." menu item located in the LogTag menu.
This option will allow you to prepare the LogTag for its next use after retrieving the
readings stored within the LogTag. If you do not need to configure the LogTag for its
next use now, the previous option described may be preferred as it will not involve the
configuration steps and therefore be a quicker and simpler method.
The wizard will appear once you have selected the appropriate option of your choice to
guide you through the necessary steps to retrieve the recorded readings. While the wizard
is visible the "Automatic download" feature will be temporarily disabled. You will not be
able to access any of the Wizards while an "Automatic download" is in progress.

Chapter 5 Results from LogTag 49
Saving LogTag Data
Saving LogTag Data files
Every time you download a LogTag Recorder to your computer the data are automatically
saved into a file with a *.ltd file extension (LogTag Data). This type of file is unique to
LogTag data loggers and can only be read by LogTag Analyzer software.
You can:
generate a name for this file, which contains certain key details about the unit (File
Name on page 106)
decide if existing files with older data should be overwritten or kept (Uniqueness on
page 108)
automatically send files to e-mail recipients and FTP sites (Automation on page 92)
automatically export data to other file formats (Exports and Reports on page 109) and
save all or part of the data to make them accessible to other users (Selected LogTag
files on page 50 and PDF files on page 52).
Please refer to the respective sections in this user guide for more information.
Saving a Multi Chart file
If the main LogTag Analyzer window currently displays a Multi-Chart as explained in
Combining charts onto a single chart (on page 64), you can save the current configuration
by clicking on the
(on page 119). Select a file name and location for your Multi Chart file. The file extension
for Multi Chart files is "*.multi".
Note: The Multi Chart file should be saved in the same folder as the individual data files.
If any of the data files referenced in a Multi Chart file are renamed, deleted, or moved to
a different folder, the Multi Chart configuration cannot be displayed.
The configuration file contains information about the data files included in the Multi Chart
display, the subtitle, chart colors, and time offset when Shifting chart start times (see
"Combining charts onto a single chart" on page 64).
toolbar icon or selecting the "Save" command from the File menu
Any annotations added to the Multi chart display are saved in a separate annotation file
with the file extension ".anno". This file must be located in the same folder as the Multi
Chart file to be included in the Multi Chart display.
To open a previously saved Multi Chart configuration file, click on the
select the "Open..." command from the File menu (on page 119), then select the "*.multi"
file to be opened.
toolbar icon or

50 LogTag Analyzer User Guide (2.0)
To save a Multi Chart file under a different name, select the Save As... command from the
File menu (on page 119) and enter a new file name.
Selected LogTag Data files (*.sltd)
Users can save a file, which when opened again, will only display a selected time window
of the recorded data. The time window of this "Selected LogTag Data" file is defined
through the zoom settings of the currently active tab, or can be entered in the dialog box
displayed when the "Save as..." command from the File menu (on page 119) is chosen
with 'Selected LogTag Data (*.sltd)' as the file type.
Select a file name and location for your file.

Chapter 5 Results from LogTag 51
The chart of this file, which contains pre-start readings, has been zoomed to show only a
small proportion of the readings:
The window slider shows there are still readings earlier and later than the displayed data.
When saved as a *.sltd file, it will be automatically re-opened and now only displays the
previously zoomed readings:
Note: Those readings which are no longer displayed are still present in the file. Any *.sltd
file can be saved as a *.ltd file, and when re-opened, all readings taken by the recorder
during this trip will become available for viewing.
This can also be achieved by simply re-naming the file from *.sltd to *.ltd.
Files with a *.sltd extension cannot be read by versions of LogTag Analyzer earlier than
2.0, they can however be read once renamed to *.ltd.
*.sltd files can also be opened directly from e-mail attachments or by double clicking the
file in Windows Explorer, as the installer forLogTag Analyzer registers this file extension
and associates it with LogTag Analyzer.

52 LogTag Analyzer User Guide (2.0)
PDF files
LogTag Analyzer can save the currently active LogTag data window to a PDF file. One
single file will be generated with chart images, a data listing and summary included for
each tab.
PDF files can be generated automatically, or by selecting "Save as" from the File menu
(on page 119). Select a file name and location for your PDF file. Automatic generation of
PDF files is enabled in the section about Exports and Reports on page 109. Here you can
also define the composition of the PDF file.
Click the
button; the following dialogue window is displayed, allowing
you to select which content of the PDF file will be created.
Note: Only one single Data listing will be created. Depending on which sections are
enabled, pre-start only, chart only or all readings will be included.

Chapter 5 Results from LogTag 53
Each section can be identified by its heading. If a chart is zoomed, the PDF file will also
contain a zoomed setting.
Understanding the results
The Data Screen is an all purpose data display. The window appears inside the main
LogTag Analyzer window, and has a series of tabs along the bottom. Each of these tabs
changes the Data Screen display.
The different display types are:
Chart A display of the data in a time versus humidity and/or temperature
chart.

54 LogTag Analyzer User Guide (2.0)
Data A listing (spreadsheet style) of the time versus humidity and/or
temperature data.
Summary A summary of the data, including averages, ranges, alert results,
LogTag identification data, and other information.
Pre-Start Chart A chart of data stored by the LogTag prior to it being started.
Pre-Start Data A listing of the data stored by the LogTag prior it being started.
Pre-Start Summary A summary of the data stored by the LogTag prior to it being started.
All Chart A chart of the all of the data stored in the LogTag including the data
prior to it being started and after being started.
All Data A listing of the all of the data stored in the LogTag including the data
prior to it being started and after being started.
All Summary A summary of all of the data stored in the LogTag including the data
prior to it being started and after being started.
Day Summary A summary of the day statistics for display loggers.
The screens that are typically used are the first three (Chart, Data and Summary), since
they represent the normal usage of the LogTag. The other Data Screens are included to
deal with situations where the LogTag may have not been activated due to user error; the
data is still collected and available. LogTags may be handled by those who are unfamiliar
with the start feature. The “pre-start logging on page 42” feature protects against
accidental “no starts” to preserve data that may be valuable.
In some cases, not all the "tabs" previously described will be displayed, for example you
may only see Chart, Data and Summary. If the LogTag has been configured to not record
any pre-start data, the downloaded data will not display any; you will only see the data
that has been set up in the “configured mode” and recorded after starting the LogTag.
Pre-start recording is an option, not a default. Also if the LogTag was configured to record
continuously and the data has wrapped in memory all the pre-start data would have been
replaced with more recent data and as such there will be no pre-start data left to display.

Chapter 5 Results from LogTag 55
Inspecting the information at
close range
When a file is displayed either from downloading or from calling up a stored data file, the
file typically appears as a chart. It might look something like this:
The display does not show all of the available data points. For more detail, you can zoom
in and display just one small section of the charted data. Using the mouse, find the upper
left corner of a window of interest, hold down the left mouse button, and move the
mouse to the bottom right corner. The zone of interest will be highlighted.

56 LogTag Analyzer User Guide (2.0)
The highlighted zone is immediately displayed after the left mouse button is released on
the maximum displayable resolution:
This display now shows the maximum detail from the highlighted area.
When this mouse operation has been completed, for example, a picture of the highlighted
area can be placed on the clipboard. This picture can be then be pasted into any Microsoft
Windows
®
application. For example, if you are writing a letter and want to illustrate a
point based on chart data from a LogTag, you can paste the picture of the chart directly
into the letter.
When the mouse pointer is moved over the chart, a small window (tooltip) is displayed
near the mouse pointer. It displays the reading closest to the mouse pointer position. If
the readings are very close together, it is a good idea to zoom in to an area of interest to
inspect individual readings with the help of tooltips.
The tooltip will always show date and time of the recording, even when elapsed time is
chosen for the x-axis display. This will allow you to get the date and time information
quickly without having to change the setting in the options for Charts (on page 90).
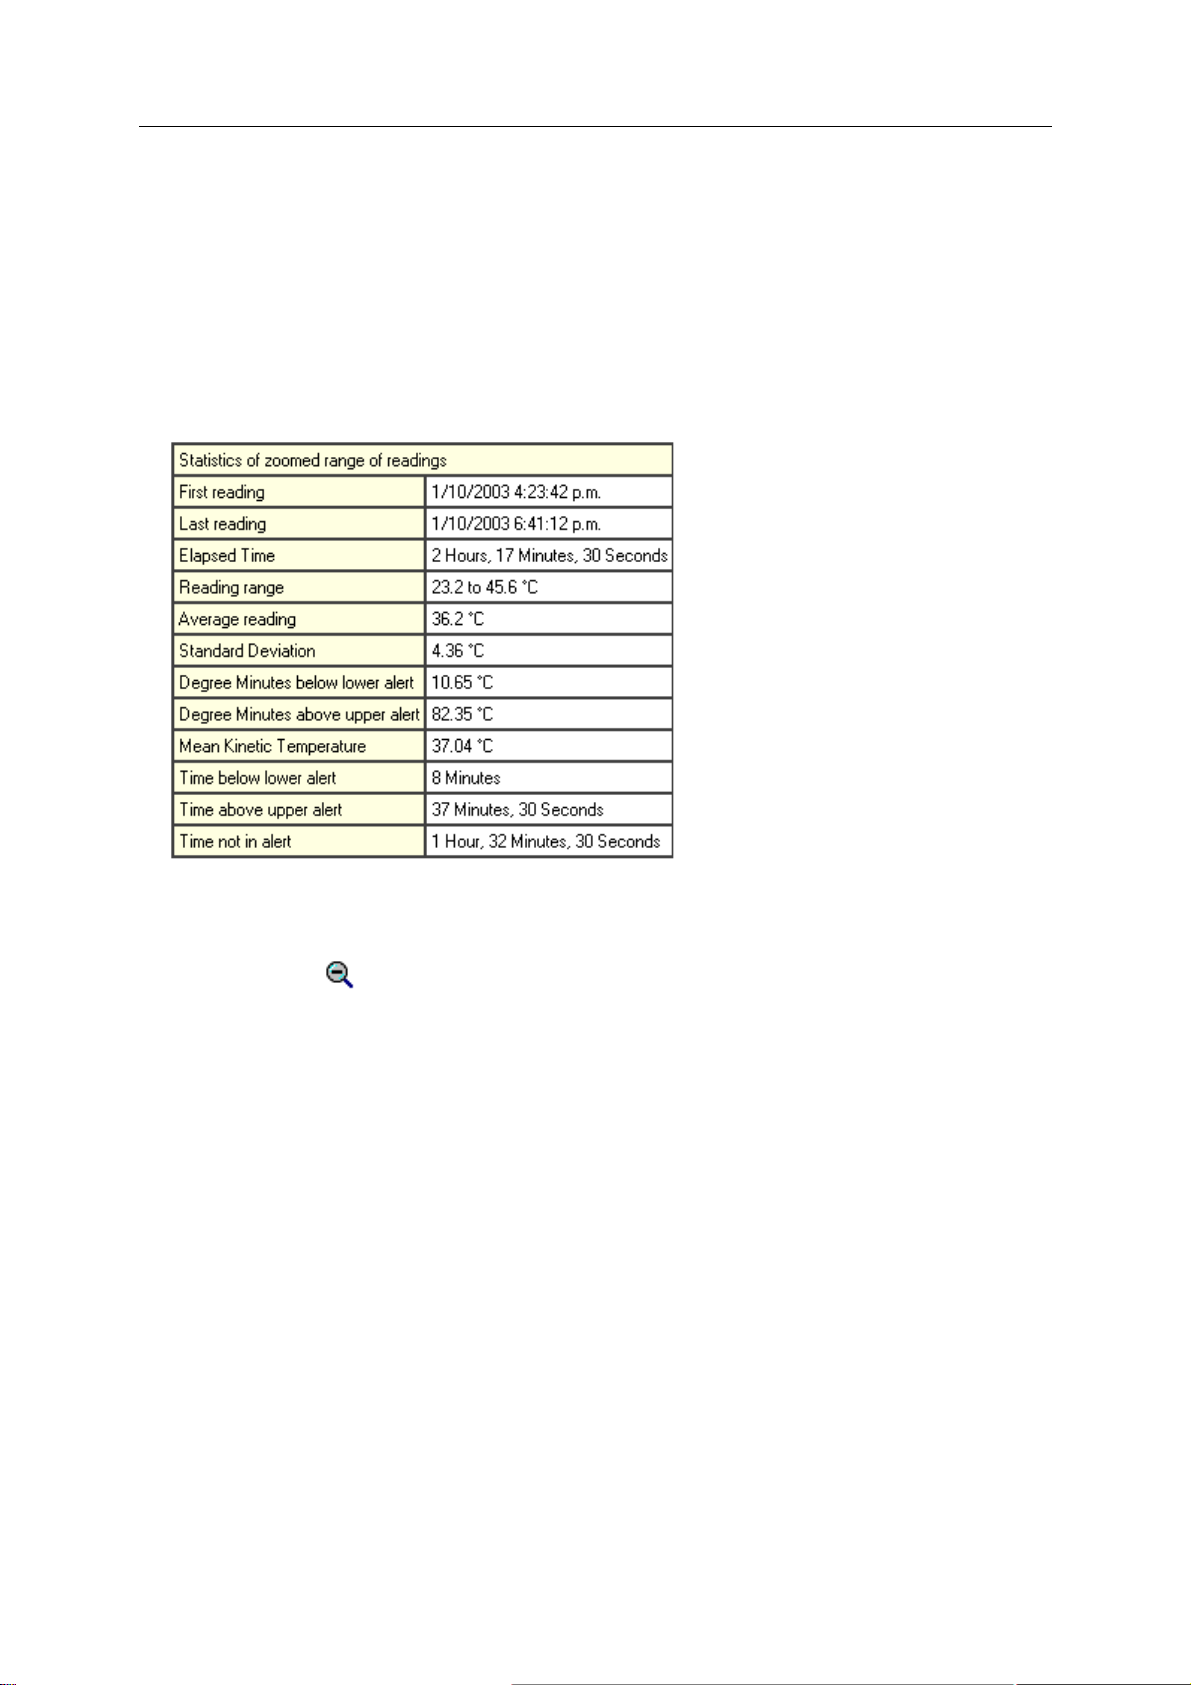
Chapter 5 Results from LogTag 57
Whenever the data displayed on the chart has been zoomed in to show more detail and is
showing only a portion of the charted data, if you click on the corresponding Data tab you
will see that only the readings shown on the chart are currently displayed. If you also click
on the corresponding Summary tab you will see an additional section of statistics that
have been calculated based on only the portion of readings currently being shown on the
Chart screen. Following is an example of the additional section of statistics that will
appear within the Summary Screen when a section of the readings within the Chart
screen have been zoomed in.
If there are readings beyond the limits of the sensor within the time interval that is being
displayed, the statistics for this interval will be displayed as "**".
The Zoom Out (
) command in the Edit menu (on page 122) or on the toolbar (see
"Toolbar commands" on page 126) can be used to revert the display back to showing the
range of data points that were showing prior to the new zoom section being selected.

58 LogTag Analyzer User Guide (2.0)
Inspection marks are recorded each time the START MARK button is pressed on the
LogTag. Each inspection mark is numbered and can be identified by counting the number
of marks on the Chart display. If you click on the corresponding Summary tab and scroll
down in the data record you will see a summary of all the points that were recorded
between each subsequent inspection mark. Following is a picture of a portion of a
Summary Screen showing the relevant information for the sequence of data points
between the inspection mark #2 and inspection mark #3.
Manual scaling of the chart
To change the temperature an d humidity scale, or select a range of readings by time and
date, select “Manual Scaling” from the chart popup context menu.
The following dialog will be displayed:

Chapter 5 Results from LogTag 59
Range of sensor The chart is zoomed to the minimum and maximum values for
each sensor.
Range of readings The chart is zoomed to the minimum and maximum reading
values.
Manual Scaling This option lets you specify the date/time range, temperature and
humidity ranges (if applicable) for the chart display. The dialog
shows the current zoom settings.
Click
To return to the previous zoom level, use the Zoom Out (
to apply your selected settings.
) command in the Edit menu
(on page 122) or on the toolbar (see "Toolbar commands" on page 126).
By default, each chart is initially displayed zoomed to the range of readings. This default
setting can be changed in the Options dialog (see chapter “Charts (on page 90)”).
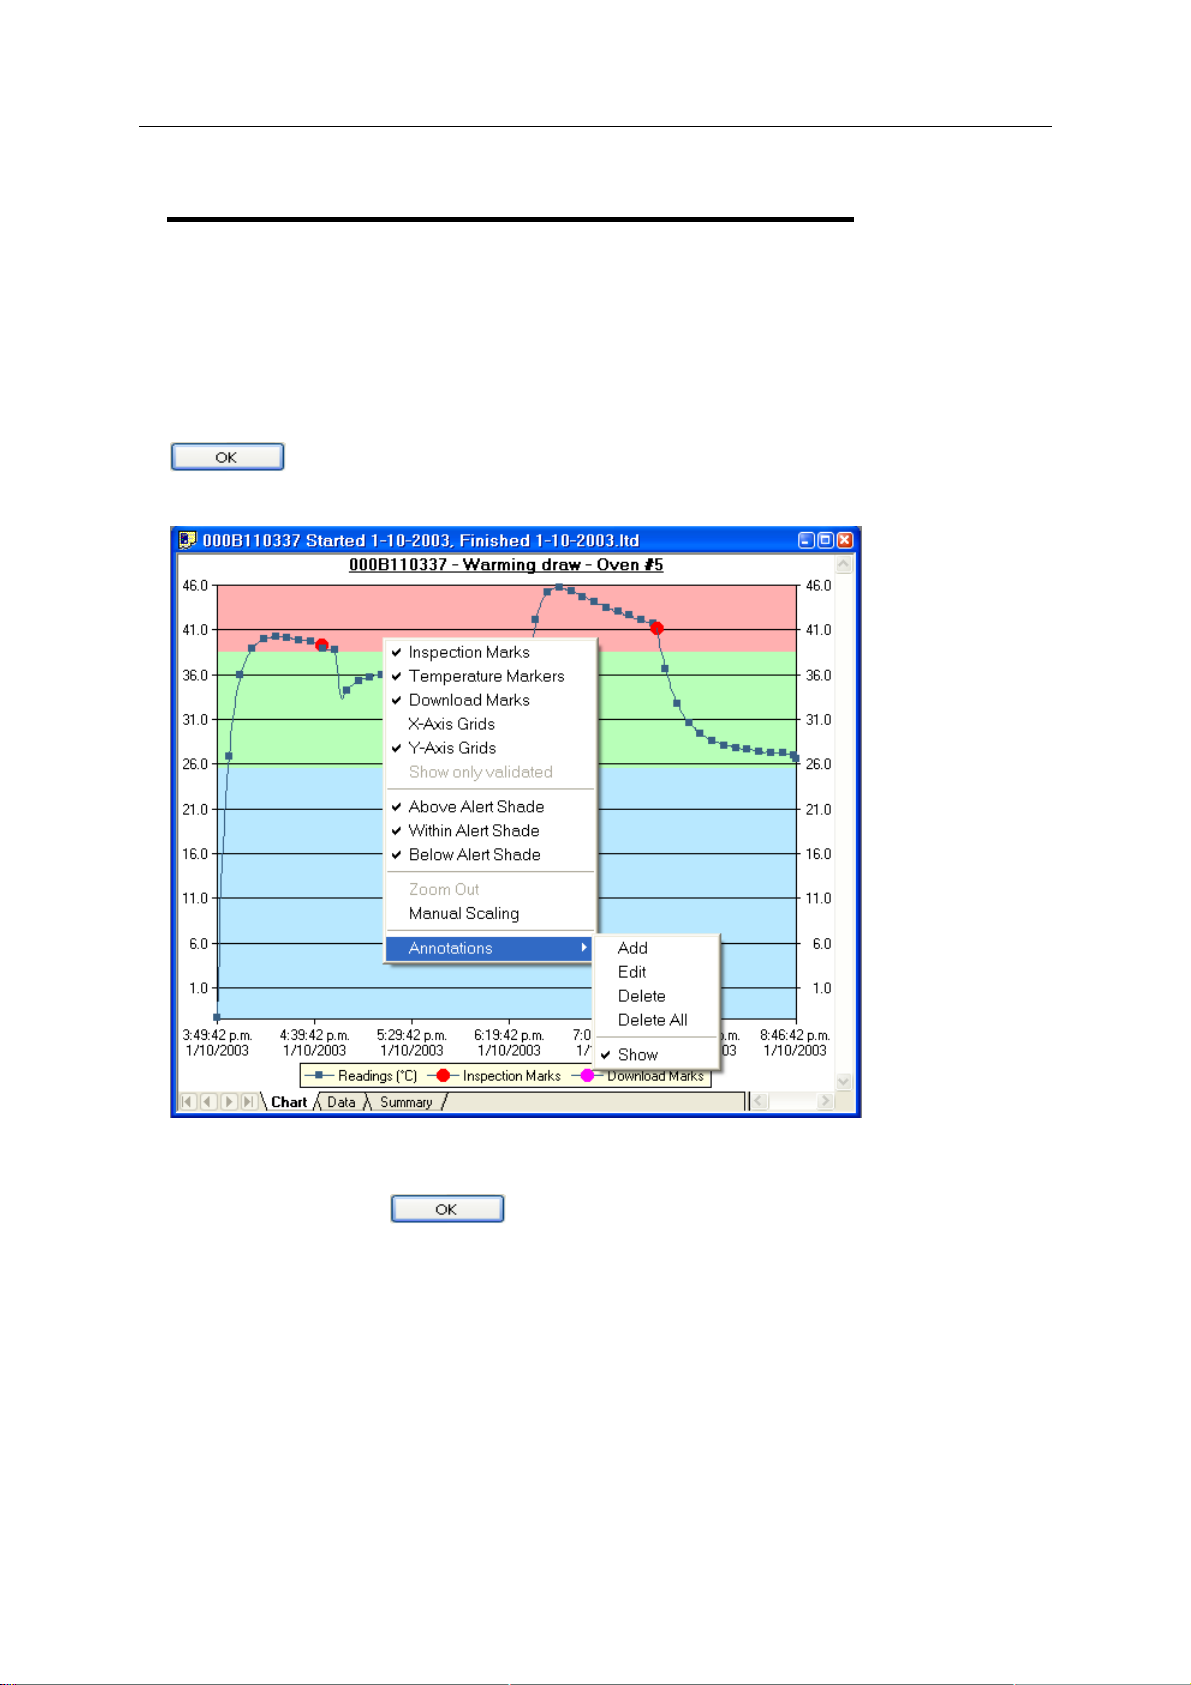
60 LogTag Analyzer User Guide (2.0)
Chart annotations
To include more information in your chart you can add chart annotations. These will be
displayed and printed with your chart.
Click the right mouse button at the location where you want to add the annotation. Select
"Add" from the Annotations popup context menu. Enter the annotation text and click
. The annotation will be displayed in the chart. When you zoom the chart
display, the annotation will be zoomed with the chart readings.
To edit an annotation, move the mouse pointer into the area of an existing annotation.
Click the right mouse button and select "Edit" from the Annotations popup context menu.
Edit the text and click
To delete an annotation, move the mouse pointer into the area of an existing annotation.
Click the right mouse button and select "Delete" from the Annotations popup context
menu. The annotation will be deleted.
to display the edited annotation.
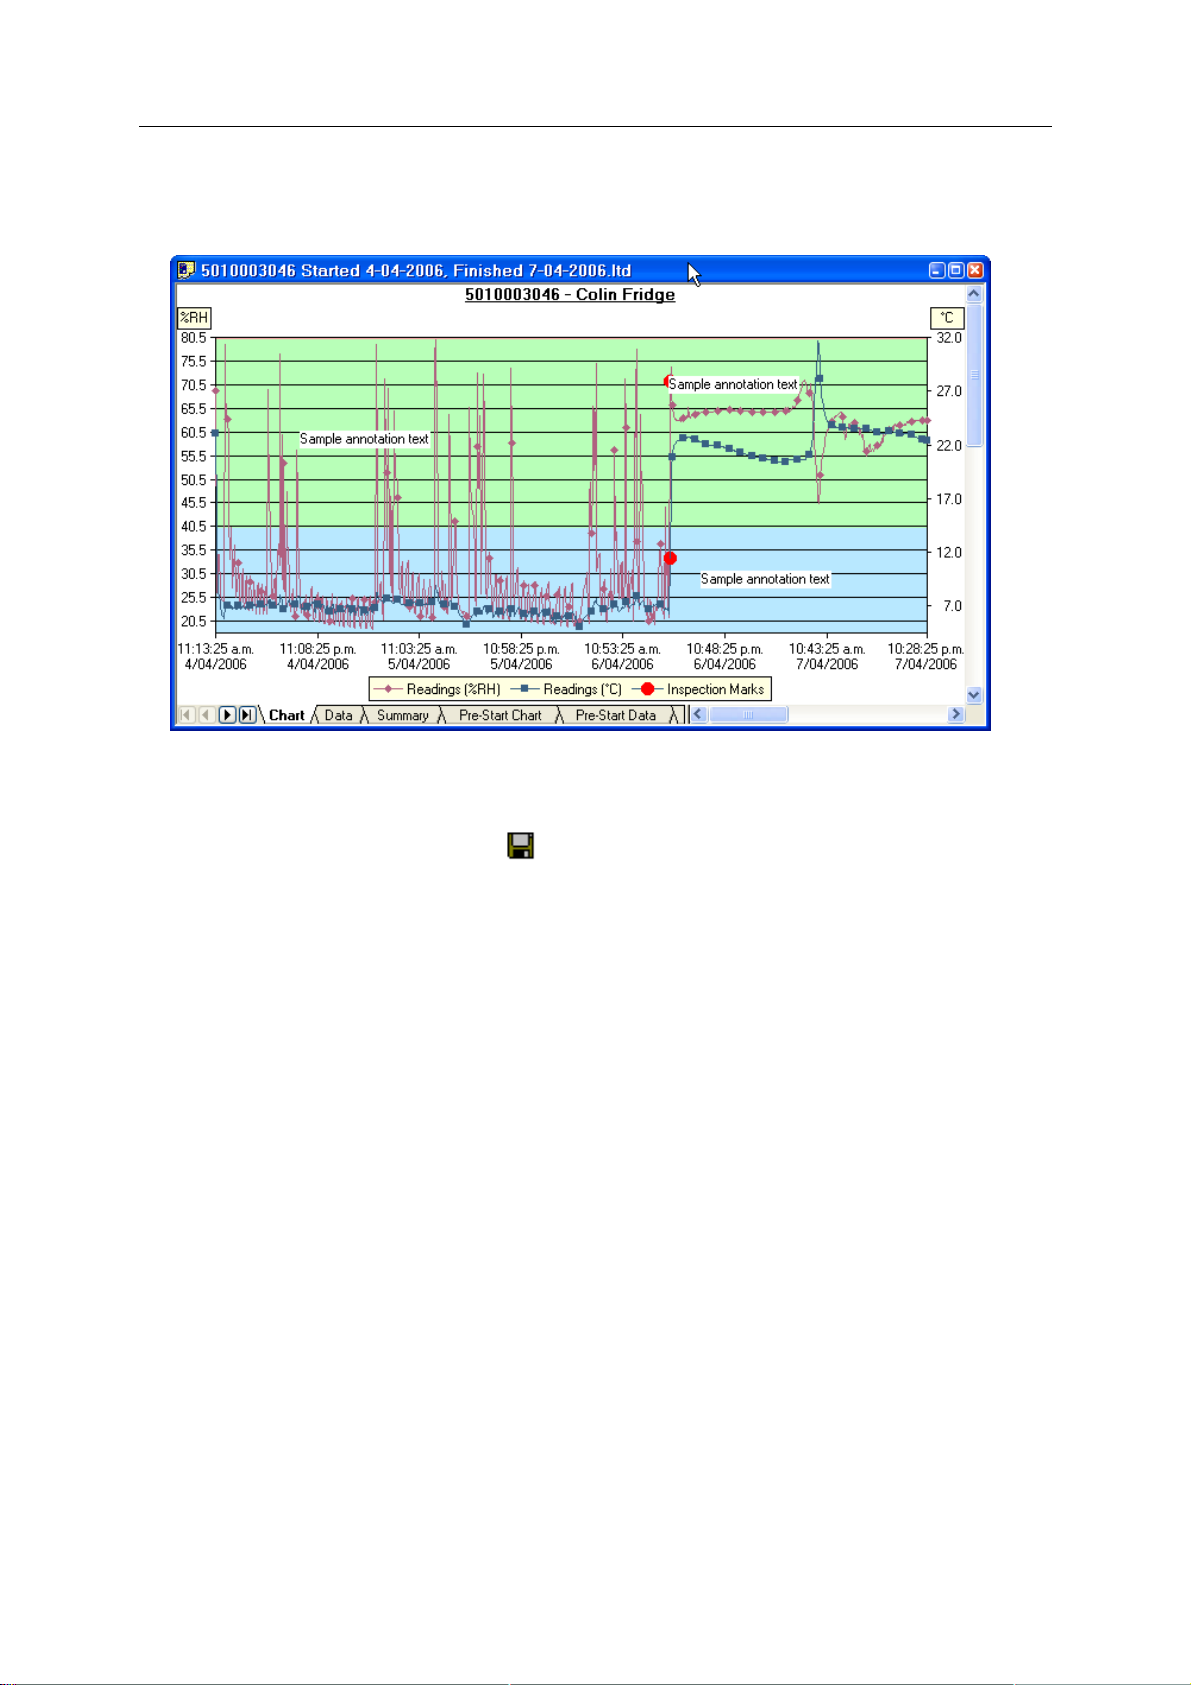
Chapter 5 Results from LogTag 61
To delete all annotations, select "Delete All" from the Annotations popup context menu.
Selecting the "Show" command from the Annotations popup context menu will show or
hide all of the annotations on the chart.
To save the annotations, click the
toolbar button or select the "Save" command from
the "File (see "File Menu" on page 119)" menu. The annotations will be saved in a file
with the same name as the data file and the file extension ".anno".
When saving annotations in Multi Chart mode, the software will ask you to specify a file
name for the Multi Chart configuration, if you are saving this configuration for the first
time.

62 LogTag Analyzer User Guide (2.0)
Chart subtitle
The chart subtitle is displayed and printed underneath the chart title.
To edit the subtitle, right-click on the area above the chart and select "Edit Chart Subtitle"
from the popup context menu.
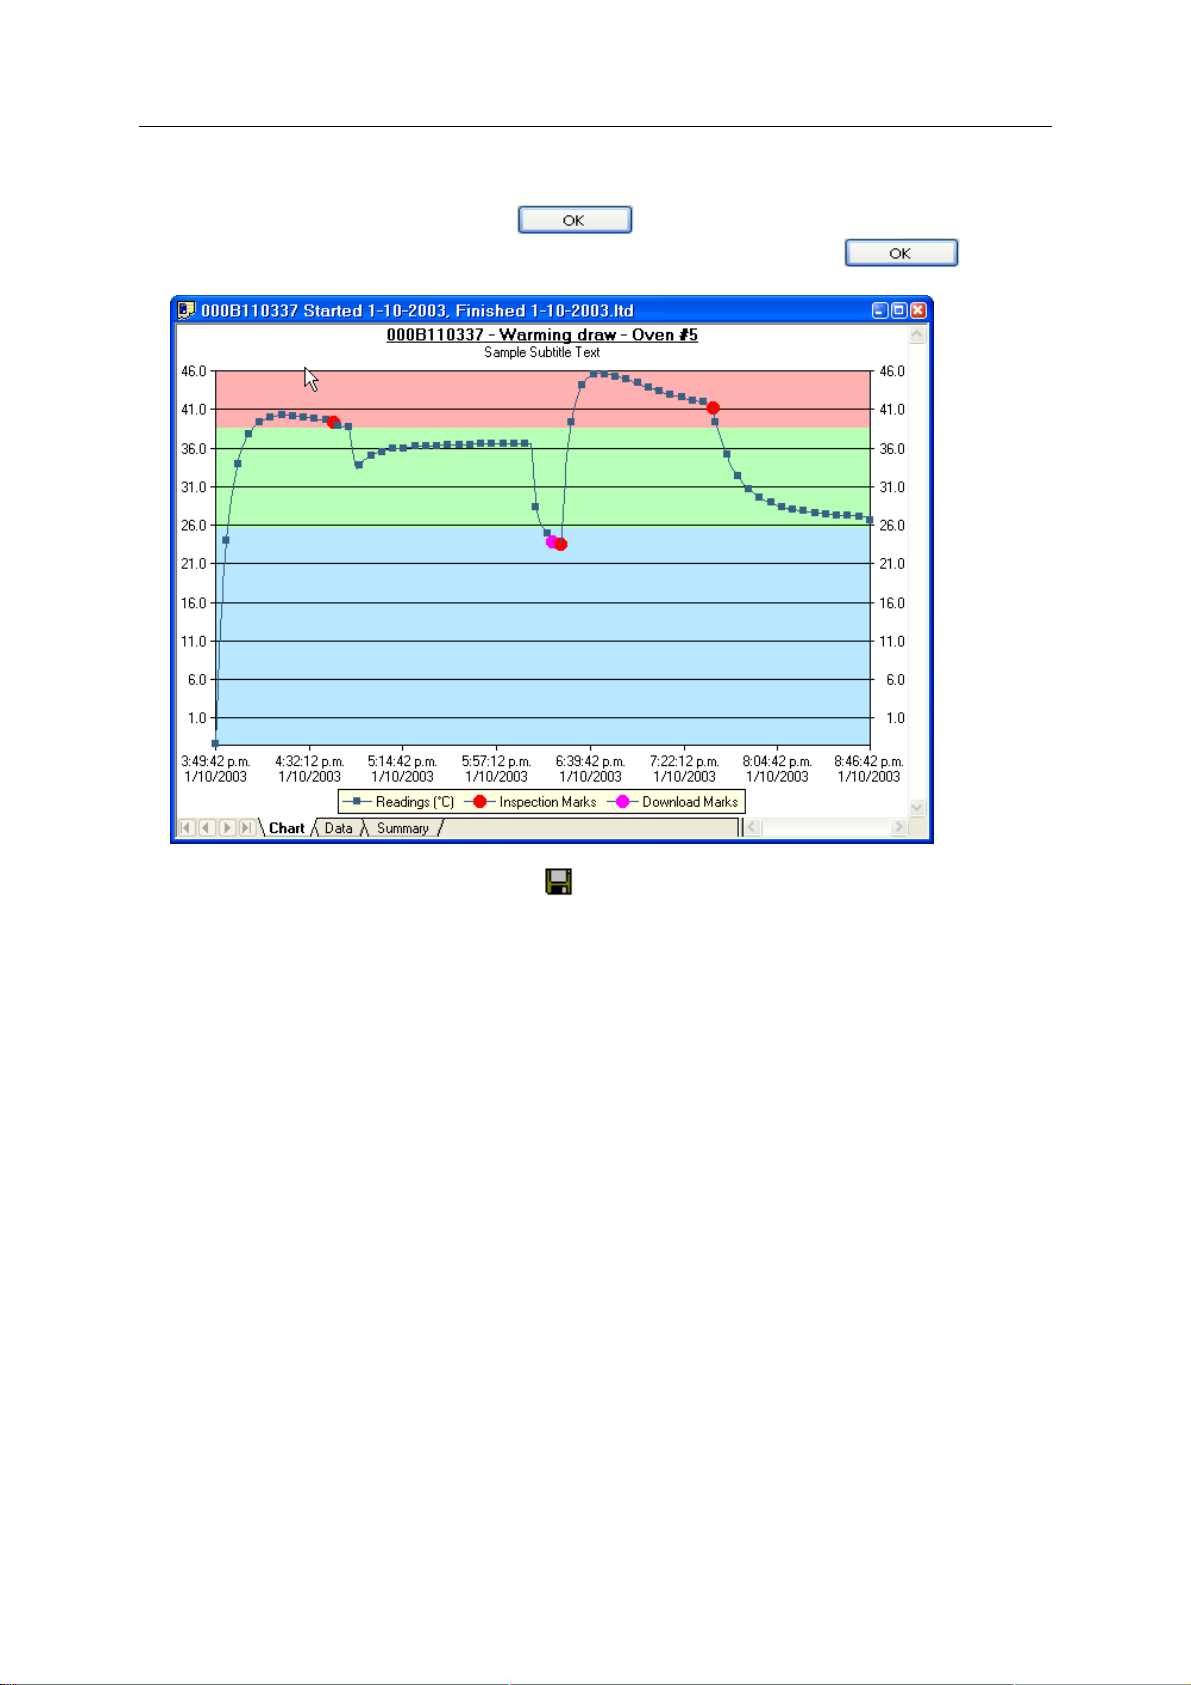
Chapter 5 Results from LogTag 63
Enter or modify the text, then click to display the edited subtitle. To remove
the subtitle, delete the text in the Edit Chart Subtitle dialog and click
.
To save the chart subtitle click on the
toolbar icon or select the Save (see "File Menu"
on page 119) command from the File (see "File Menu" on page 119) menu.
If the LogTag Analyzer application is in Single Chart mode, the subtitle (and annotations)
for the currently active chart will be saved in a file with the chart file name and the file
extension .anno.
In Multi Chart mode, the subtitle is saved in the Multi Chart configuration file (file
extension .multi). If you are saving the configuration for the first time, you will be asked
to specify a file name for the Multi Chart configuration.

64 LogTag Analyzer User Guide (2.0)
Combining charts onto a
single chart
To overlay multiple charts in one view, select the Multi Chart ( ) command. All charts
that are currently open will be displayed together. Additional files opened while in Multi
Chart mode (including data downloaded from LogTags) will be added to the display.
Each of the individual charts will be displayed with a letter symbol to allow you to tell
them apart. The legend contains an entry for each chart showing the chart name and the
corresponding letter.
You can change the background color for the Multi Chart display through the Charts (on
page 90) section in the Options (see "Customizing the software" on page 86) Window.
To remove charts from the Multi Chart display, use the Single Chart (
switch to Single Chart mode, then close the files you don't want to display. Select the
Multi Chart (
You will notice that the Data and Summary tabs are not available in the Multi Chart
display. If you require additional information about the chart data, activate the display of
) command to switch back to Multi Chart mode.
) command to

Chapter 5 Results from LogTag 65
the desired statistics on in the Chart Statistics (on page 89) section in the Options (see
"Customizing the software" on page 86) Window. The chosen values will be displayed
separately for each chart.
You can also view Min, Max and Average Charts (see "Special Chart Tabs" on page 68),
and select other options.
Changing Chart Colours
By default, all charts in the Multi Chart display are displayed in the colors specified in the
Charts (on page 90) section within the Options (see "Customizing the software" on page
86) Window.
To change the display color of individual charts/sensors, move the mouse pointer over a
chart until the tooltip is displayed. Right-click, then select "Change Chart Color" from the
popup context menu.
Select the desired colors for the chart readings and markers in the color selector boxes.
To restore the default color (as specified in the Charts (on page 90) section within the
Options (see "Customizing the software" on page 86) Window), select the "Restore
Defaults" command.
Shifting chart start times
For easier data comparison, chart start times can be shifted in Multi Chart display. There
are two ways to shift a chart along the time axis:

66 LogTag Analyzer User Guide (2.0)
1. Move the mouse pointer over the chart until the appropriate tooltip is displayed.
Right-click, then select the "Shift Chart" command from the popup context menu. This will
cause the following dialog to be displayed, where the new start time and date can be
entered, or the chart can be revert to its origi nal date/time by selecting the "Original start
time" button. Click the OK button to display the change.
2. Press and hold the CTRL key, left-click on the chart you would like to move, and drag
the chart to new the position.
An additional time axis is displayed for each shifted chart indicating the corresponding
time in relation to the original start time.
Note: Shifting a chart will not change any of the original recorded data, only the location
the data is displayed in relation to other charts within the Multi Chart display will change.

Chapter 5 Results from LogTag 67
Aligning Charts
Select "Align Charts" from the popup context menu to automatically align all charts in the
current Multi Chart window.
The charts are aligned to the earliest start time:
- "Chart" tab: All start times are aligned.
- "Pre-start Chart" tab: All charts with Pre-start readings are aligned to the earliest
Pre-start reading.
- "All Chart" tab: Charts are aligned to the earliest reading (Pre-start reading if any
Pre-start readings have been recorded for the chart).
Every chart is assigned a different colour and a time axis is displayed to illustrate the
original start time. You can display the elapsed time instead of the date/time by selecting
the "Elapsed Time" option in the Chart Options dialog (Charts (on page 90)).
Aligning charts in one tab will also influence how these charts are represented in the
other tabs. If for example you select "Align Charts" in the "Chart" tab, and switch to the
"All Chart" tab, you will notice that the charts are now aligned at a new origin, with all
pre-start readings to the left and all readings to the right of this origin. The charts in the
"Pre-start" tab are aligned with the last pre-start reading to the right.
To revert to the original start times for all charts, select
Single Chart mode, then switch back to Multi Chart mode with
in the toolbar to switch to
.

68 LogTag Analyzer User Guide (2.0)
Special Chart Tabs
When you select the average tab command in the toolbar, up to three additional
chart tabs will be shown, with the Chart Average tab highlighted:
These chart tabs display graphs calculated from the "Chart", "Pre-Start Chart", and "All
chart" tabs and show minimum, maximum and average value graphs. Changes in either of
the three original data displays, such as adding a new file and aligning or shifting charts,
result in a re-display of the corresponding "Min/Max/Average" tab, e.g. if one of the
charts in the "Pre-Start Chart" is shifted, the "Pre-Start Min/Max/Average" chart would
redraw showing graphs based on the updated values.
You can annotate these special chart tabs in the same way as other chart tabs; such
annotations will be visible in the other chart tabs and are stored with the multi chart when
saved.
Please note that following behaviour applies to these special chart tabs:
Zoom settings will not be transferred to the "Average" tabs.
Download marks and inspection marks will not be displayed in the "Average" tabs.
Non-validated readings and re-calibrated readings will not be displayed with the
special attributes, even if set in the options. If you have chosen to "show
non-validated readings", they are included in the minimum/maximum/average
calculations, otherwise not.
To avoid memory overflows there are some restrictions regarding the maximum
allowed time span of the charts in a multi-chart. These restrictions vary with logging
interval, should you try to add a chart outside the allowed range following dialogue
box will appear:
In this case the multi chart will disassemble, so you can close the window whose chart
you no longer want to display, and re-assemble the multi-chart by clicking on
.
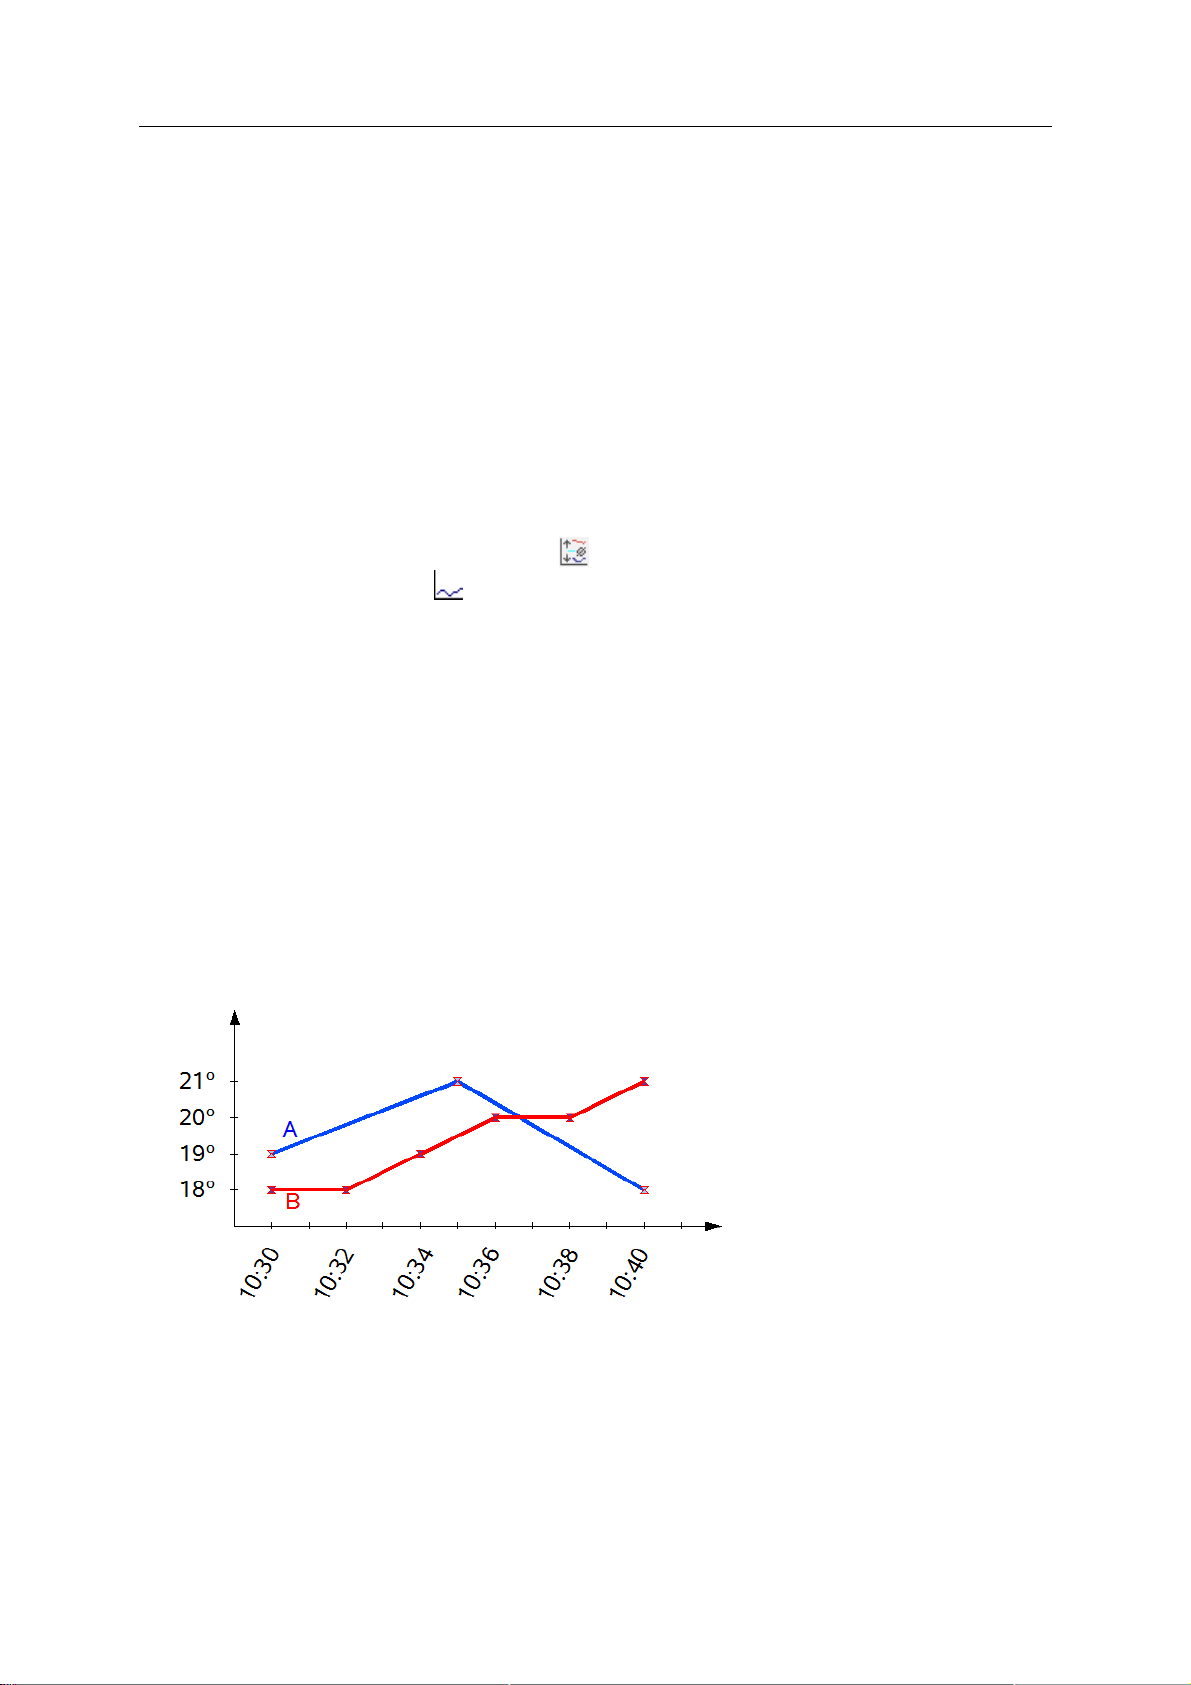
Chapter 5 Results from LogTag 69
If one or more of the charts have sections with readings outside the LogTag's sensor
range, LogTag Analyzer is unable to calculate the minimum, maximum and average
values, and those sections of the graph will not be displayed. This will likely result in a
"broken" graph line, regardless of whether "show readings beyond specifications" in
the Charts (on page 90) section in the Options (see "Customizing the software" on
page 86) Window is enabled or not.
Due to the large number of calculations performed in this feature, specifically when
opening large numbers of charts spanning long periods, having the average tabs
displayed can occupy large amounts of memory and run slow. Therefore we
recommend only turning the feature on when required.
Clicking on the highlighted average tab
Selecting the single charts
active will disassemble the multi chart, and when switching back to multi chart the
average tabs will be displayed again until turned off.
command in the toolbar while the average charts are
command will turn the average tabs off.
Behind The Scenes
To create some meaningful results, LogTag Analyzer uses a special trend line process to
calculate the minimum, maximum and average values across multiple charts, rather than
a histogram. It is important you understand this mechanism, so you can interpret the
displayed readings correctly.
This is an example of two LogTags, one with a 5 minute log interval (A) and the other (B)
logging every 2 minutes.
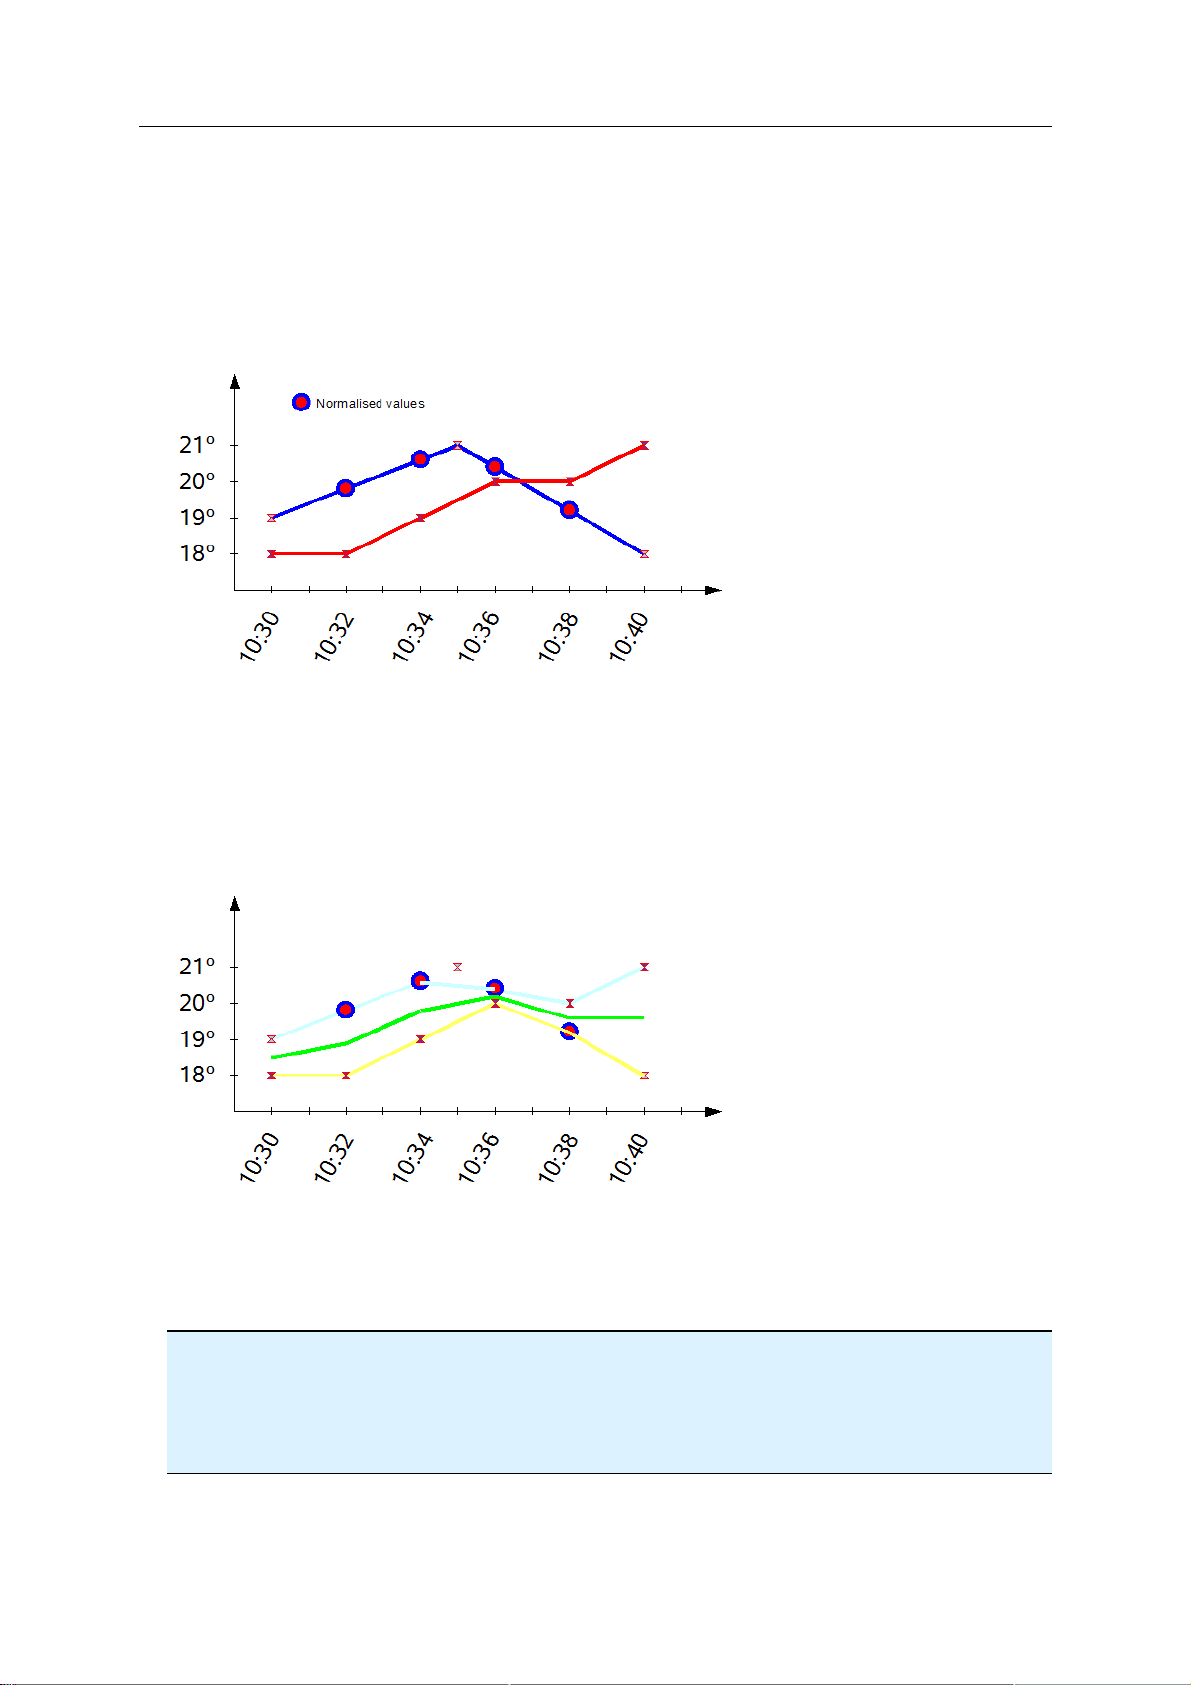
70 LogTag Analyzer User Guide (2.0)
Before the data are displayed in an average tab, LogTag Analyzer normalizes every chart's
readings so they fall in line with the logging interval of the LogTag with the shortest log
interval, in this case unit (B). It does not shift any charts, but rather calculates a
theoretical value for those reading times by linear interpolation. Interpolation determines
probable environmental conditions, i.e. what the LogTag would have recorded if taking a
reading at that time.
Without this method, it would not be possible to compare LogTags with different log
intervals, or units that have the same log interval, but were started at different times.
Starting with the earliest time present in the chart, a value is created for each LogTag as
if it had recorded a log at that time. It is those values that are used to calculate and
display the minimum, maximum and average charts.
As a result of this process, absolute values for minimum and maximum may not always be
shown if they do not fall on normalized times, as seen in the example at 10:35 - despite
21ºC being the maximum it will not be displayed as it is not a normalized value.
Note: The charts in above example are based on LogTags started at the same time. If
unit (A) had been started earlier, depending on the start time unit (B) may also have its
readings interpolated. To ensure the chart with the shortest log interval always has its
real values shown, please use the Aligning Charts (on page 67) function from the context
menu.

Chapter 5 Results from LogTag 71
Automatically calculated
statistics
When a file is displayed either from downloading or from calling up a stored data file, the
software will automatically calculate and display some statistics of the recorded data.
These statistics are shown on the corresponding Summary tab and are also calculated for
each sequence of data points between the inspection marks.
If any readings within the time interval are beyond the limits of the sensor, the values for
Average Reading, Standard Deviation, and Mean Kinetic Temperature will not displayed
for the relevant time interval.
Average Reading
The Average Reading is the arithmetic mean of the sequence of data points. It is
calculated by adding all the data point values together and then dividing the total by the
number of data points. Mathematically this formula can expressed as illustrated in the
following picture:
Where:
av the calculated arithmetic mean
n the number of data points to include in the calculation
t
a data point to include in the calculation
i
For example, if there were 5 data points to calculate the arithmetic mean of and they
were, 12.3, 15.9, 16.2, 14.7, 14.9, then the arithmetic mean would be 14.8.

72 LogTag Analyzer User Guide (2.0)
Standard Deviation
The standard deviation is a useful for determining how spread out the readings are from
the arithmetic mean (Average Reading). Most controlled environments typically try to
keep the environmental conditions at a stable and consistent humidity and/or
temperature. The standard deviation can be used to help indicate how stable the
environmental conditions were maintained. One standard deviation (sometimes expressed
as "one sigma") away from the mean, positive or negative represents a pproximat el y 68
percent of all the readings. Two standard deviations, or two sigmas, away from the mean
represents approximately 95 percent of the readings. Three standard deviations represent
about 99 percent of the readings.
For example, if the arithmetic mean of the readings was 50.6°C and the standard
deviation was 2.3°C, then approximately 68% of the readings were between 48.3°C and
52.9°C, 95% of all the readings were between 46.0°C and 55.2°C and 99% of the
readings were between 43.7°C and 57.5°C. Further more, if all the readings were
recorded over a span of 1 day (24 hours) then the temperature was between 48.3°C and
52.9°C for approximately 16 hours and 19 minutes during the recorded period of time.
Mathematically the formula for calculating the standard deviation can expressed as
illustrated in the following picture:
Where:
s the calculated standard deviation
n the number of readings to include in the calculation
av the calculated arithmetic mean
t
a reading to include in the calculation
i
For example, if there were 5 readings to calculate the standard deviation of and they
were, 12.3, 15.9, 16.2, 14.7, 14.9, then the standard deviation would be 1.54
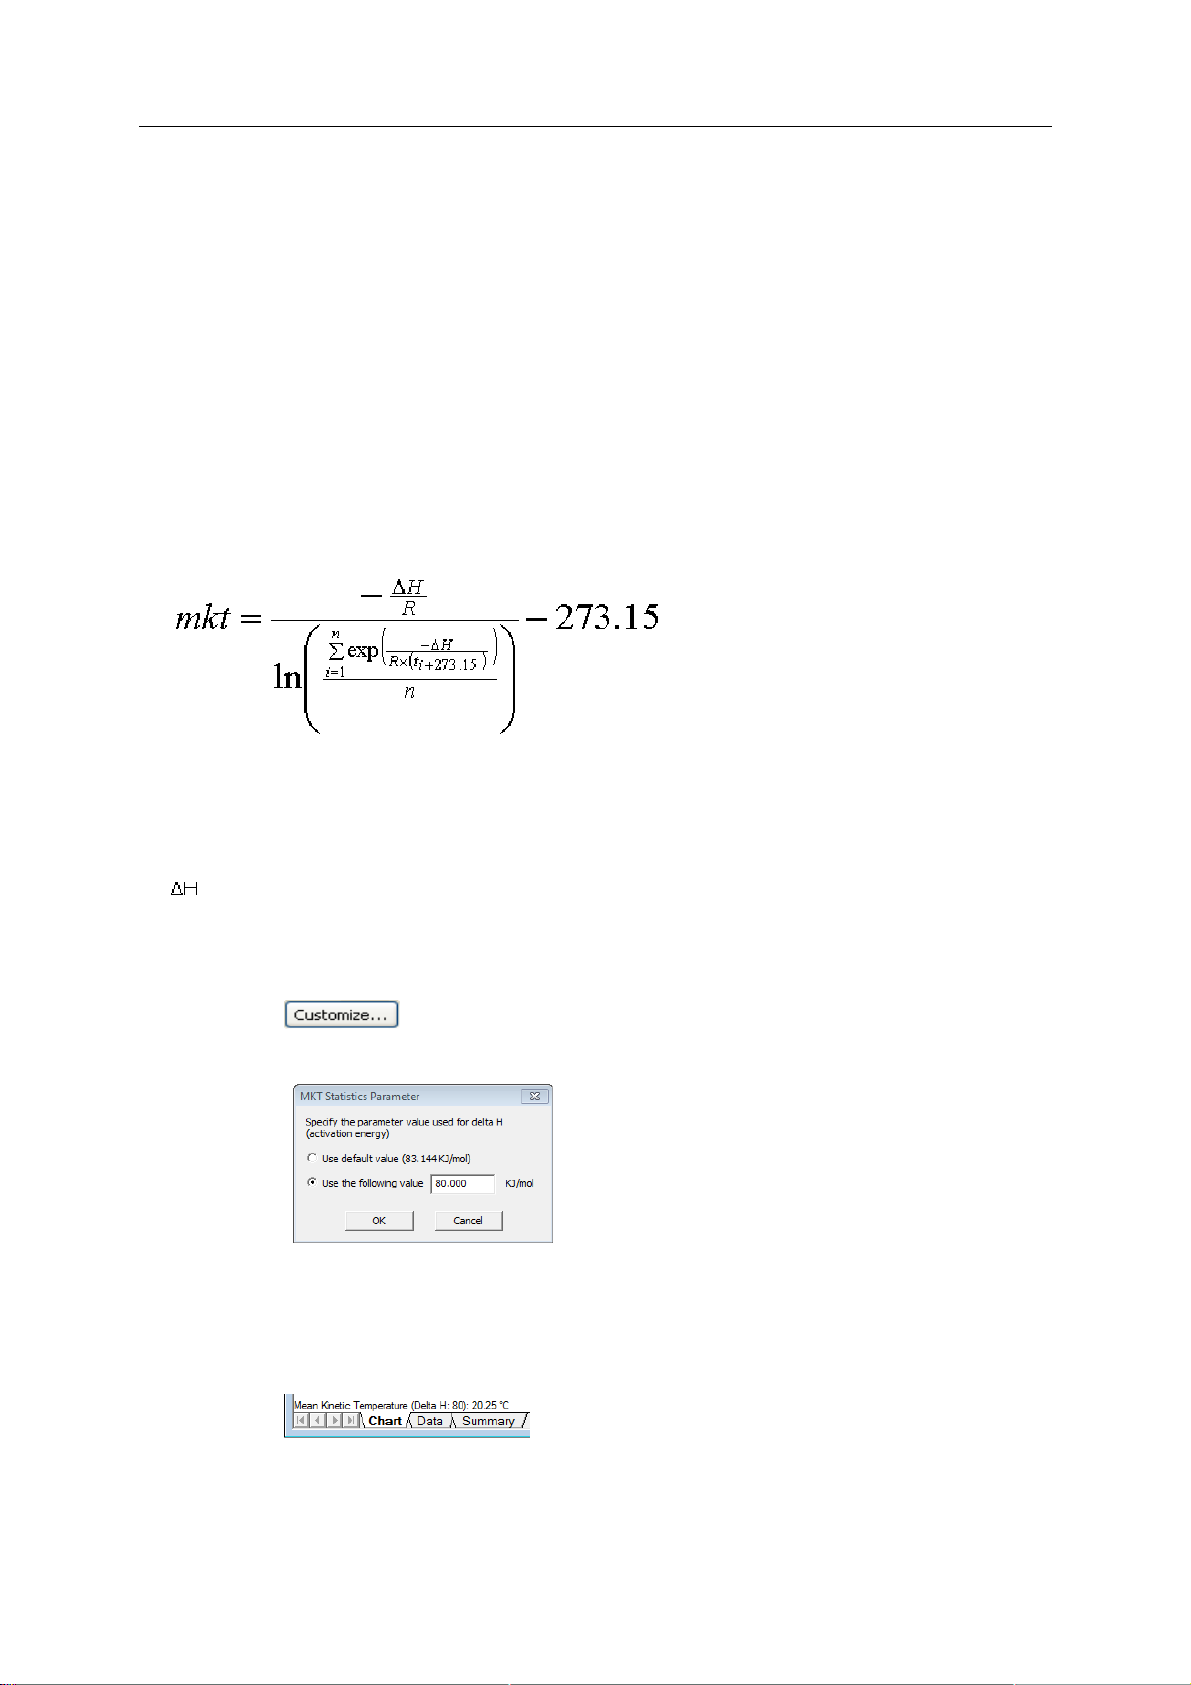
Chapter 5 Results from LogTag 73
Mean Kinetic Temperature
Some products and materials have accelerated rates of degradation at higher
temperatures. For example, perishable food items, pharmaceutical products and many
forms of bacteria can grow/degrade exponentially as the environmental temperature
increases. Mean kinetic temperature is a calculation that accommodates the non-linear
thermal effect temperature can have on products. Mean kinetic temperature is
represented as the equivalent temperature the product was thermally subjected to during
the period of time the various temperature reading were recorded.
Mathematically the formula for calculating the mean kinetic temperature can expressed as
illustrated in the following picture:
Where:
mkt Mean kinetic temperature, in degrees Celsius
the activation energy. By default LogTag Analyzer uses
an activation energy value of 83.144 KJ/mol for the
calculation.
You can select a custom value for ΔH by clicking t h e
button in the Summary Statistics or Chart
Statistics option screen and entering the desired value.
Charts and the Statistics page display the ΔH parameter
if it is different to the default value:
R the universal gas constant, which is 0.0083144 KJ/mol K

74 LogTag Analyzer User Guide (2.0)
n the number of data points to include in the calculation
t
a data point to include in the calculation, in degrees
i
Celsius
For example, if there were 5 data points to calculate the mean kinetic temperature of and
they were, 12.3, 15.9, 16.2, 14.7 and 14.9 degrees Celsius, then the mean kinetic
temperature would be 14.9 degrees Celsius using the default ΔH.

Chapter 5 Results from LogTag 75
Degree Minutes
There are some products and materials that exist which can change their characteristics
and/or degrade if they experience temperatures which are not within ideal conditions for
long enough. For example, some products may experience freezer burn if they experience
an extremely cold condition or experience a colder than ideal temperature for long
enough period of time. Other products for example, ice cream, change their
characteristics if they experience temperatures which allow it to melt. The LogTag
Analyzer will automatically display the results of two separate Degree Minutes
calculations. The result of the first Degree Minutes calculation displayed will be based on
the readings that were recorded below the ideal conditions and the result of the second
Degree Minutes calculation displayed will be based on the readings that were recorded
above the ideal conditions. The ideal conditions used in the calculation of the Degree
Minutes formula are based on the upper and lower alert values that where configured
when the LogTag was originally prepared for use.
Mathematically the formula for calculating the degree minutes above alert can be
expressed as illustrated in the following picture:
Where:
degmin Total Degree Minutes spent above/below the alert
threshold.
t
The temperature that was above/below the alert threshold.
i
a The al ert te mperat ure t hreshold.
s The duration of time, in minutes, the temperature was
sustained.
For example, if there were 5 data points to calculate the degree minutes of and they
were, 12.3, 15.9, 16.2, 14.7 and 14.9 degrees, each of these temperatures were recorded
at 2 minute intervals and the high alert temperature threshold was 12.6 degrees, then the
degree minutes temperature above the upper alert threshold would be 22.6
degree-minutes.

76 LogTag Analyzer User Guide (2.0)
Displaying statistics
The statistics displayed on the Summary tab can be configured in the Options dialog.
Refer to the (see chapter "Summary Statistics (on page 88)"). By default, all statistics
are displayed on the Summary tab.
Statistics can also be displayed on the chart, underneath the legend. See chapter "Chart
Statistics (on page 89)" for more information about configuring the chart statistics.
If there are readings beyond the limits of the sensor within the time interval being
displayed, the statistics for the relevant interval will be displayed as "**".
Printing the results
Printing from LogTag Analyzer is slightly different to printing from other common
Windows software, as the printer functions in terms of range of information to print rather
than range of pages. This technique allows you to focus on what you want printed rather
than the pages showing the information.
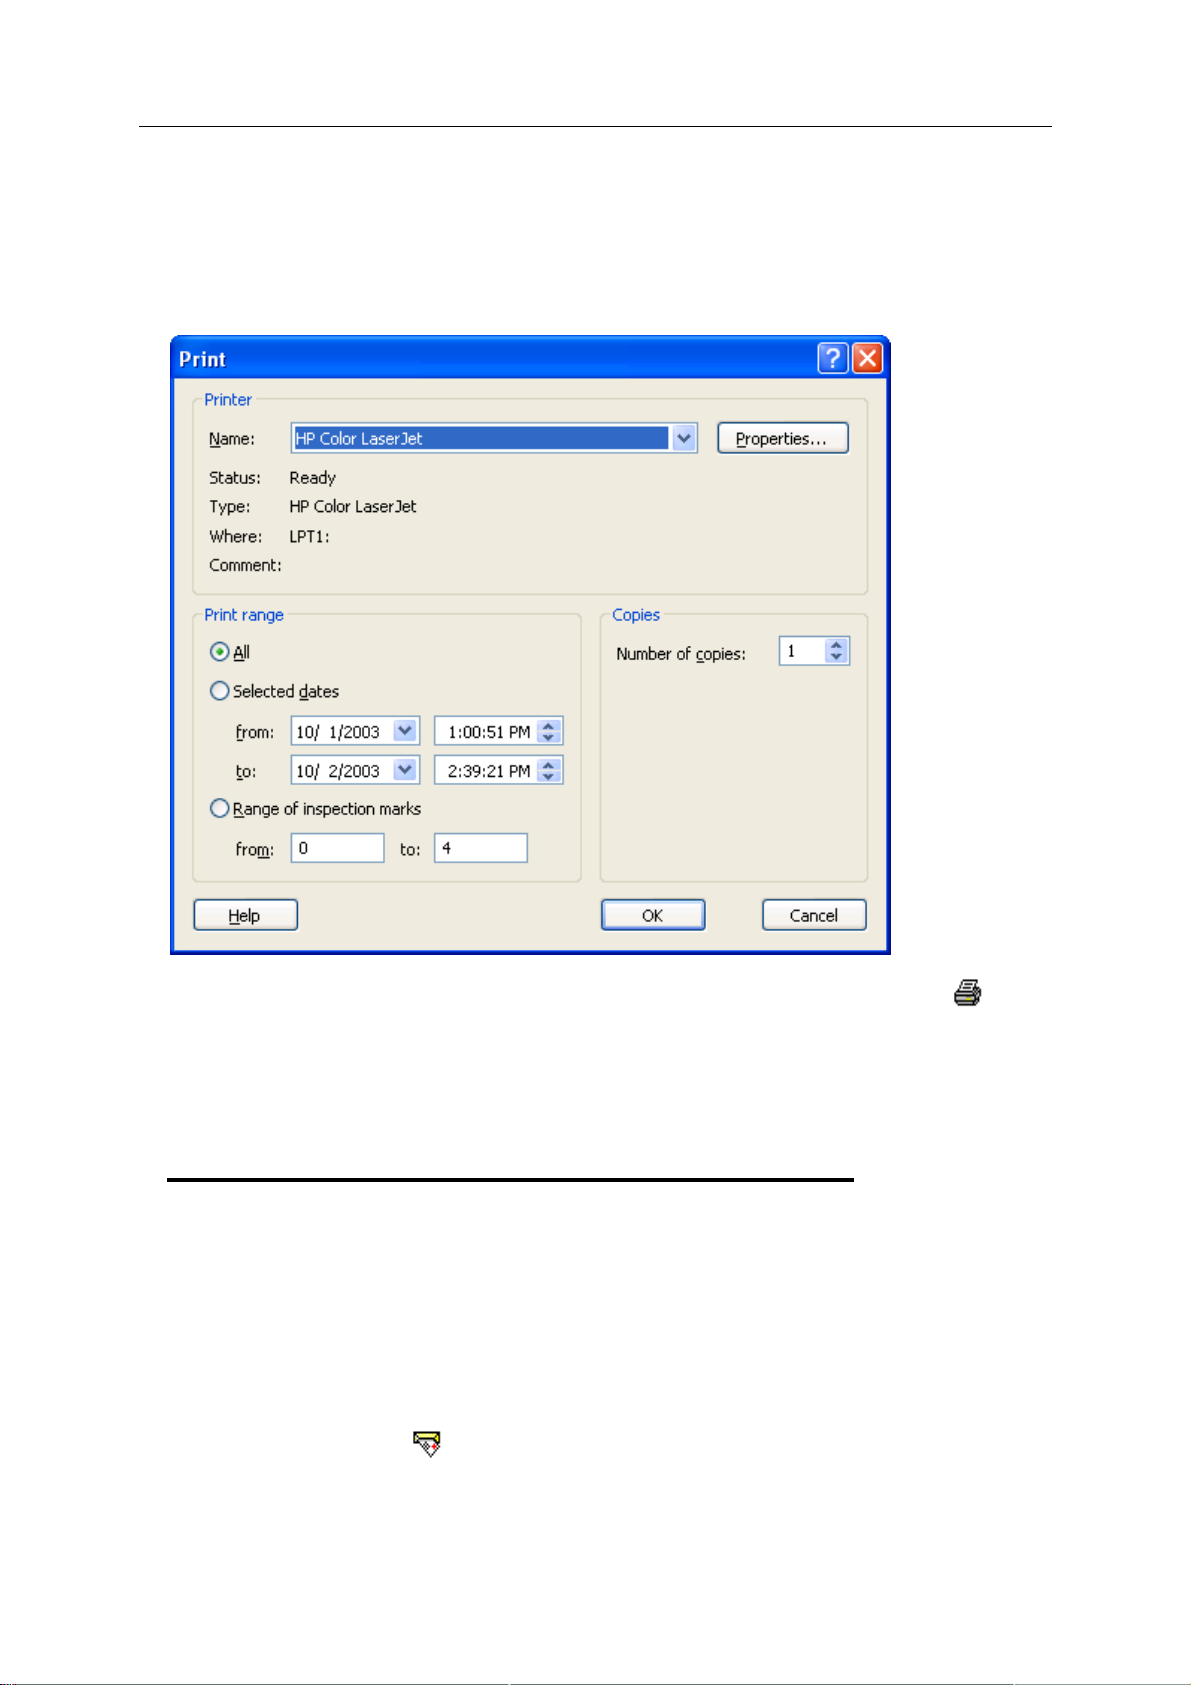
Chapter 5 Results from LogTag 77
You can choose to print all of the information, select a range of dates and times to print
from or select a range of "inspection" marks. This could be a very important for transit
monitoring since post trip and pre-event data are not significant to a discussion or dispute
centering on a humidity and/or temperature maintenance issue.
The print window can be brought up by simply clicking once on the "Print" icon (
located on the toolbar (see "Menus and Toolbars" on page 117) or by clicking the
"Print..." menu item from within the File menu.
)
Sending a file by e-mail direct
from Analyzer
You can send files of interest to another person, by e-mail, directly from the software
without the need to exit to your e-mail software or to deal with file attachments.
While you have the file of interest open and being displayed on the screen, just click once
on the "Send Mail" icon (
117) and your e-mail software will pop up with the file already inserted as an attachment.
) located on the toolbar (see "Menus and Toolbars" on page
78 LogTag Analyzer User Guide (2.0)
Type the desired e-mail address to send the file of interest to, add any message that you
wish to include, and then click "Send". That is all.
Clicking the "Send..." menu item within the File menu will achieve the same results as
clicking the "Send Mail" icon as previously described.
Note, the recipient of the file will also need to have a copy of the LogTag Analyzer
software to open and view the file that you sent. LogTag Analyzer software is free and
can be downloaded from the LogTag Recorders Internet site, www.logtagrecorders.com.
If you want to attach your data files in file formats other than the LogTag Analyzer
format, specify the desired file formats in the Exports and Reports (on page 109) section
in the Options (see "Customizing the software" on page 86) Window. The data files will
automatically be attached to your e-mail(s) in the desired formats.
To send a Multi Chart configuration, the configuration must first be saved to disk (see
chapter Saving a Multi Chart configuration). The "Send Mail" command will automatically
attach the multi chart configuration file, the annotation file (if annotations have been
added) and the relevant individual data files to your e-mail(s).
Note: You can automatically send e-mails and upload files to ftp sites using LogTag
Analyzer's automated SMTP and FTP functionality. Please see Automati c Uploading to FTP
sites and automatic e-mailing on page 93 for further details.
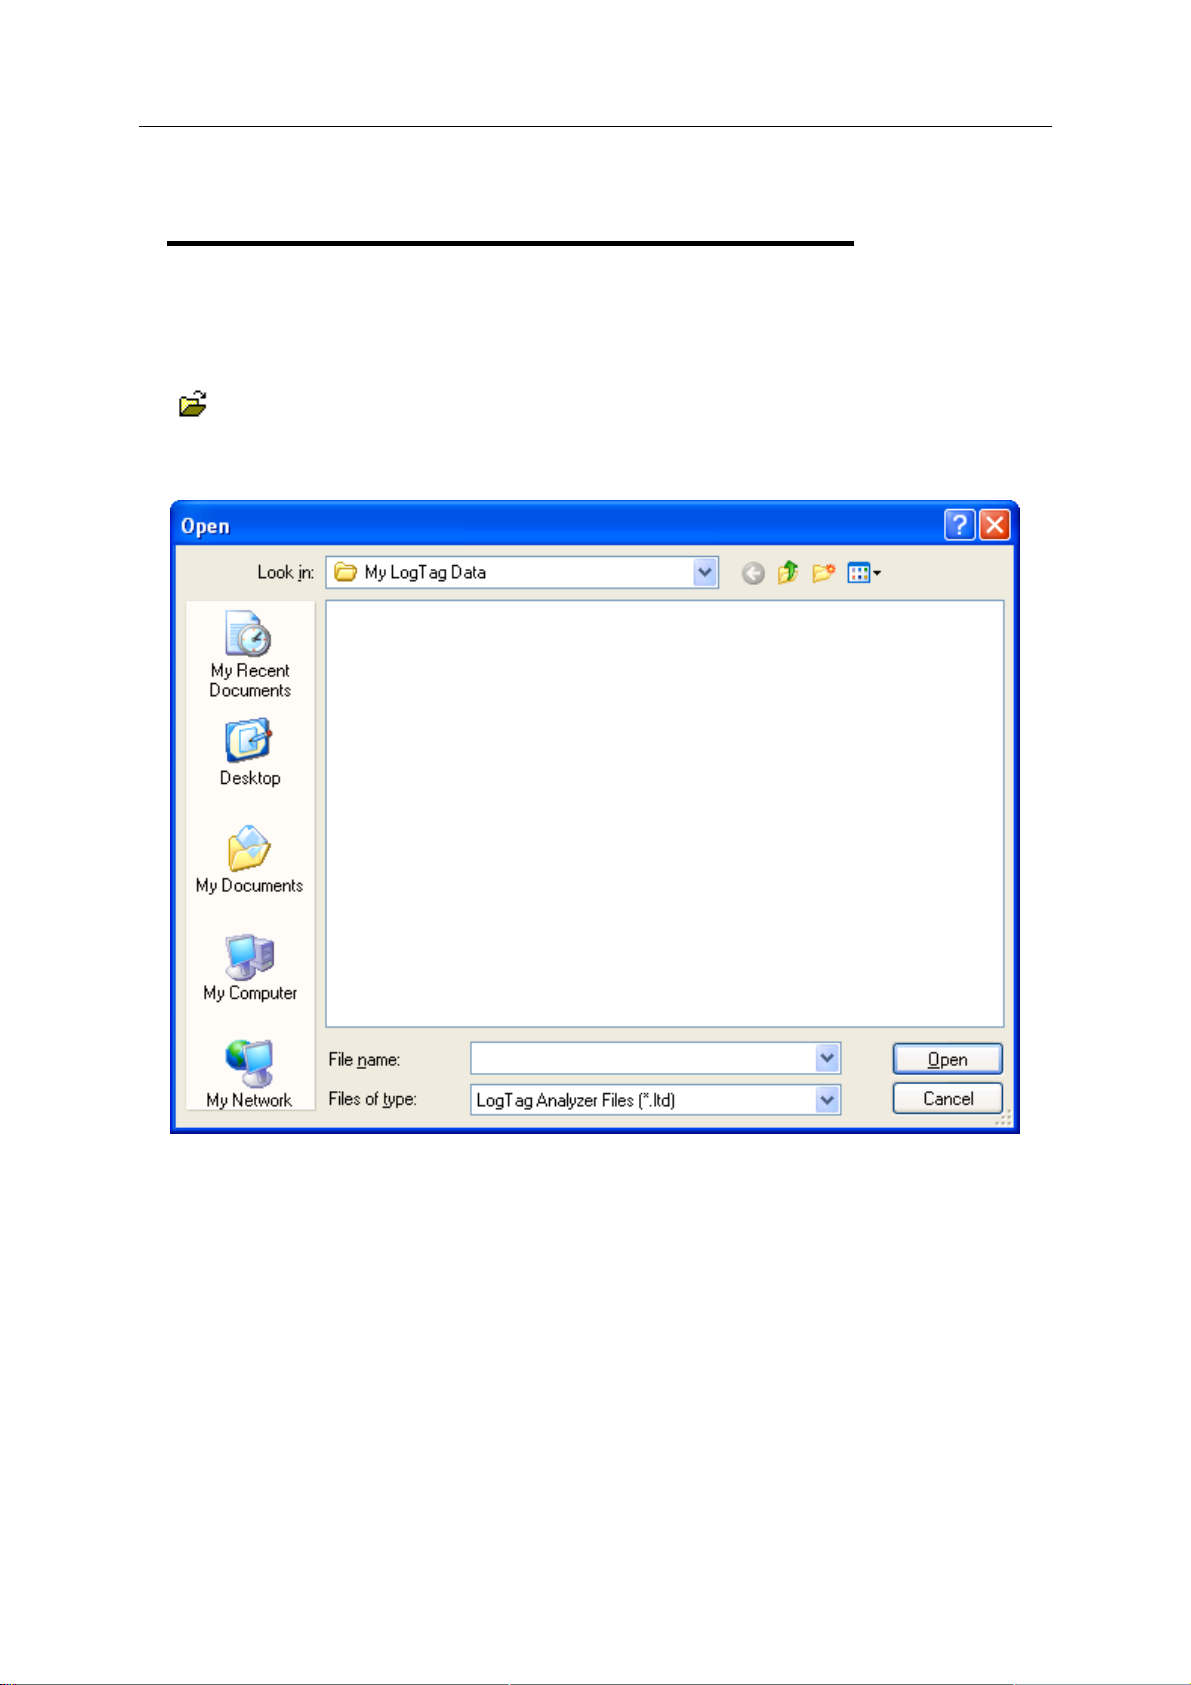
Chapter 5 Results from LogTag 79
Calling up previous results
The files that have most recently opened and displayed are listed towards the bottom of
the "File (see "File Menu" on page 119)" menu. To open other files, click the "Open" icon
(
) located on the toolbar (see "Menus and Toolbars" on page 117), which will display
the "Open" file dialog similar to the following picture and allows the user to locate and
open one or more files of interest.
You can open files from all locations accessible by the Windows™ Operating System,
including network and ftp locations. Please refer to your operating system's help for more
information.
Clicking the "Open..." menu item within the File menu will achieve the same results as
clicking the "Open" icon as previously described.
After the software has been installed for the first time, there are two recently opened files
listed in the "File" menu, even though no files have been opened yet. These are sample
files, which were installed along with the software so that users can see an example of
information that can be retrieved from LogTags. These files are not required for the
correct operation of the software and therefore may be deleted at any time.
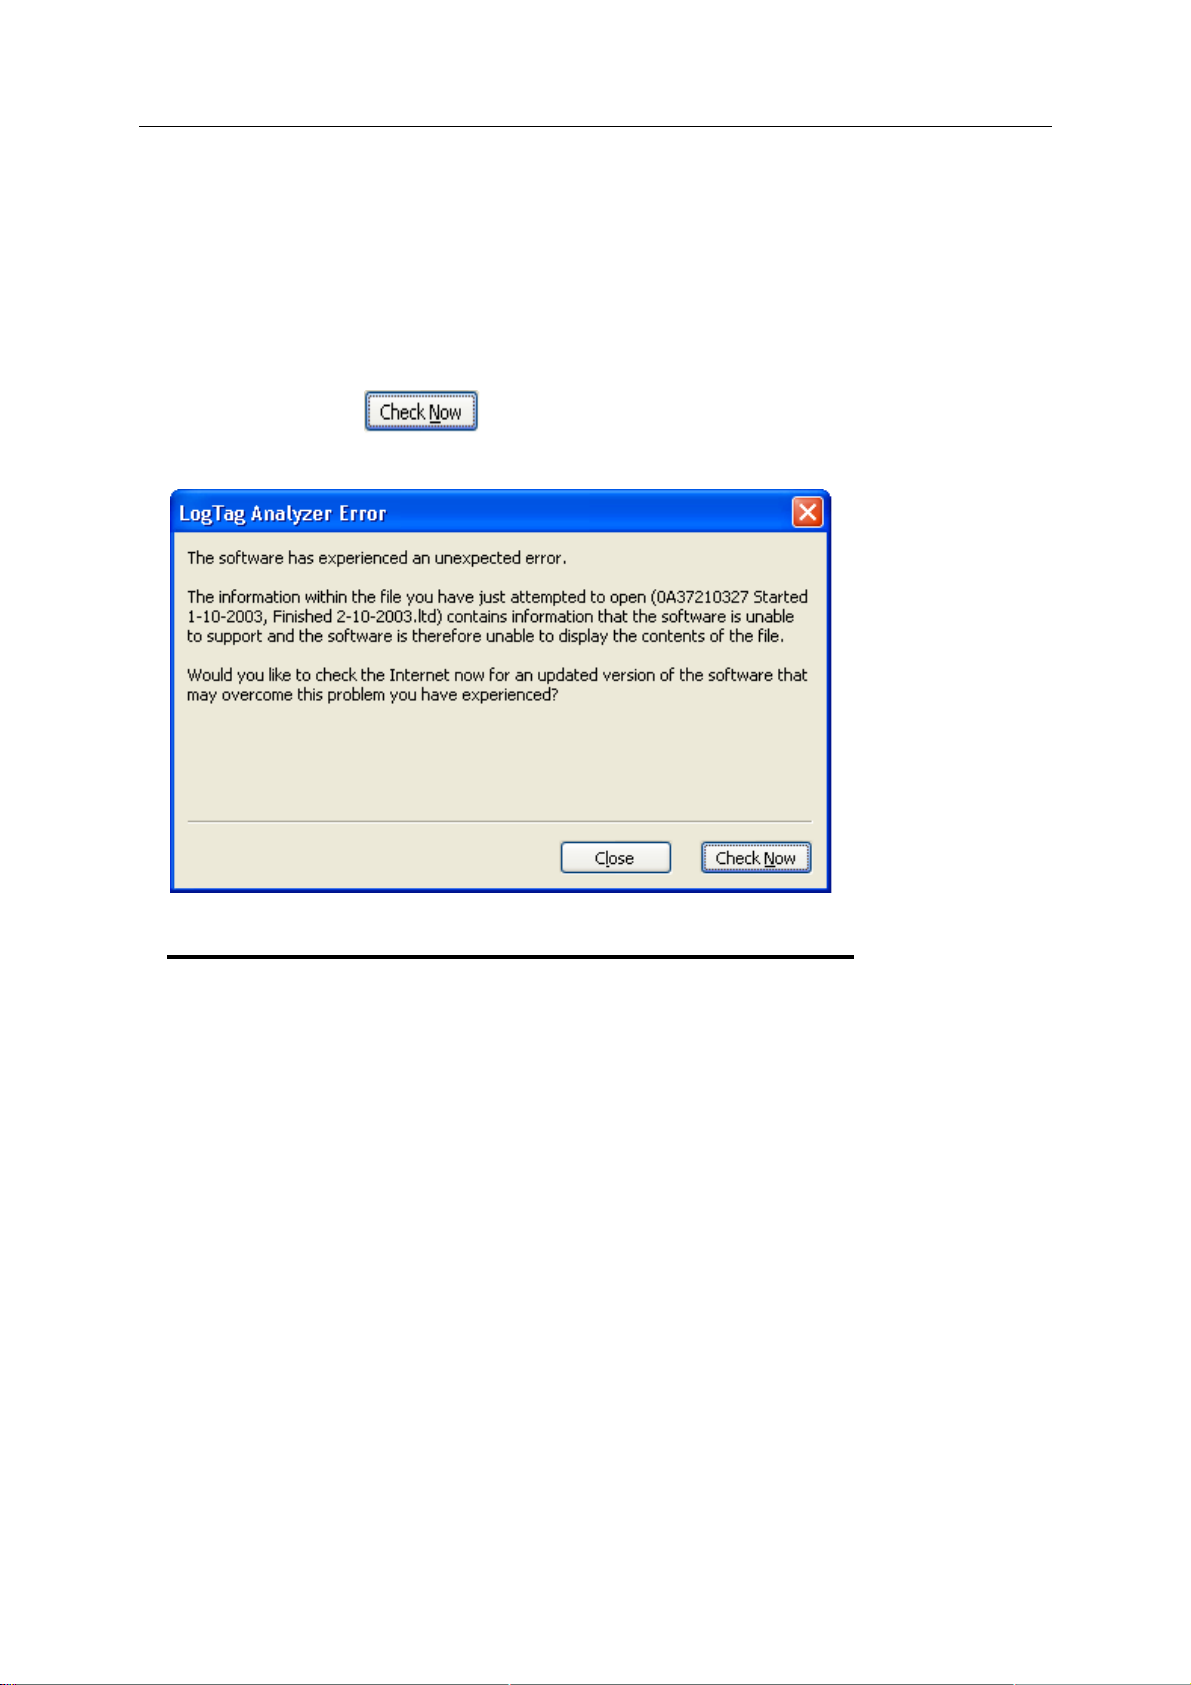
80 LogTag Analyzer User Guide (2.0)
You can also open files directly from within Windows™ Explorer or from within your e-mail
software by double clicking on the file or right clicking and selecting "open" from the
context menu. When opening files from e-mail programs that store attachments in
temporary folders such as MS Outlook, you may be asked to store the file in a new
location when performing further actions such as selecting multi-charts or uploading to
FTP sites.
If the software is unable to open the file, it will display an error similar to the following
picture. Clicking on
will start the process of checking the Internet for an
updated copy of the software (see "Getting updated software" on page 138).
Digital signatures
Support for digital signatures is primarily provided for compliance with the US FDA 21 CFR
Part 11 regulation - Electronic records and electronic signatures. Various industries
however, may find inclusion of digital signatures beneficial towards their quality control
and assurance systems.
Digital signatures allow users to include their digital signature within a LogTag Analyzer
file along with a meaning/reason for the inclusion of the digital signature. To add digital
signatures to LogTag Analyzer files, the copy of the LogTag Analyzer software being used
must be connected to the LogTag User Server software. For more information about how
to get the software to connect to the LogTag User Server software see the "User Ser ver
(on page 114)" set of options settings and/or contact your local network administrator.

Chapter 5 Results from LogTag 81
While the file that the digital signature is to be added to is open and currently selected,
add a digital signature by clicking on the "Digital Signatures" icon (
) located on the
toolbar (see "Menus and Toolbars" on page 117), which will display the "File Properties"
dialog with the "Digital Signatures" tab already activated, similar to the following picture.
Then click
to begin the process of adding a digital signature to the file. If
is disabled, moving the mouse pointer over and leaving it still
for a short time will revel the reason why the button is disabled.

82 LogTag Analyzer User Guide (2.0)
Once the "Add Digital Signature" dialog is visible, enter your LogTag Analyzer user
password and the select the meaning for the digital signature that is being added.
Click
to permanently add the digital signature to the file or to
not add the digital signature. Multiple digital signatures from the same and/or different
users to LogTag Analyzer files may be added to a single file.
How secure is my data
All LogTag files are encrypted and contain checks to detect if the file has been tampered
with since it was originally created. If the software detects that a file has been tampered
with, even by only one character or has become corrupted and therefore the data within
does not represent the data originally retrieved from the LogTag, the software will not
open the file and display the information within.
An additional validation and security feature of the LogTag is that it will automatically
insert error detection codes periodically during recordings, which are used to detect
corruption or manipulation of data. Whenever these detection codes for a block of
recordings fails its integrity validation test, the relevant readings become marked as non
validated readings. Non validated readings are displayed differently to validated readings
to indicate that they have failed their integrity test.
Non validated recordings typically occur in the scenarios following scenarios:
1 One or more readings within the non validated block of readings is not the genuine
recorded value.
2 The LogTag has been configured to perform continuous recordings and once the
memory within the LogTag has been fully used, will cause older recordings to be
overwritten, which will thereby invalidate the error detection code and integrity check
for the block of readings the older recordings been overwritten exist within. In this
scenario, it is not a problem that these recordings are non validated, rather it means

Chapter 5 Results from LogTag 83
that the particular block of recordings has only the validation and integrity protection
offered by the communications between the LogTag and the computer system, which
is typically the same, if not better than the level of protection offered by every other
brand of logger available in the global market, that LogTag Recorders know of.
3 A communications or hardware failure has occurred during the transfer of the data
from the LogTag to the computer. In this scenario the problem is typically resolved by
trying to retrieve the recordings from the LogTag again, while ensuring the contacts
on the back of the LogTag are clean, that the contacts within the Interface Cradle are
clean and that the contacts within the Interface Cradle are returning evenly to their
normal position when the LogTag is removed.
Since the software does not modify any of the recorded data within a LogTag file at any
time, if the software can open the file, re gardless of how long ago it was created, the
contents of the file will still represent the original recorded information retrieved from the
LogTag.
Therefore, the files created by the LogTag Analyzer software meet all criteria for data
integrity and data security as set forth in the US FDA 21 CFR Part 11 regulations. The
firmware code that is embedded in the processor chip of each LogTag cannot be
extracted or reverse-assembled. Accordingly, data sets that are recorded on the memory
within the LogTag cannot be downloaded or modified except by being transferred to a
LogTag file. There is no way to interfere with the process of the transfer of information
between the LogTag and the software in such a way that data integrity would be
compromised.
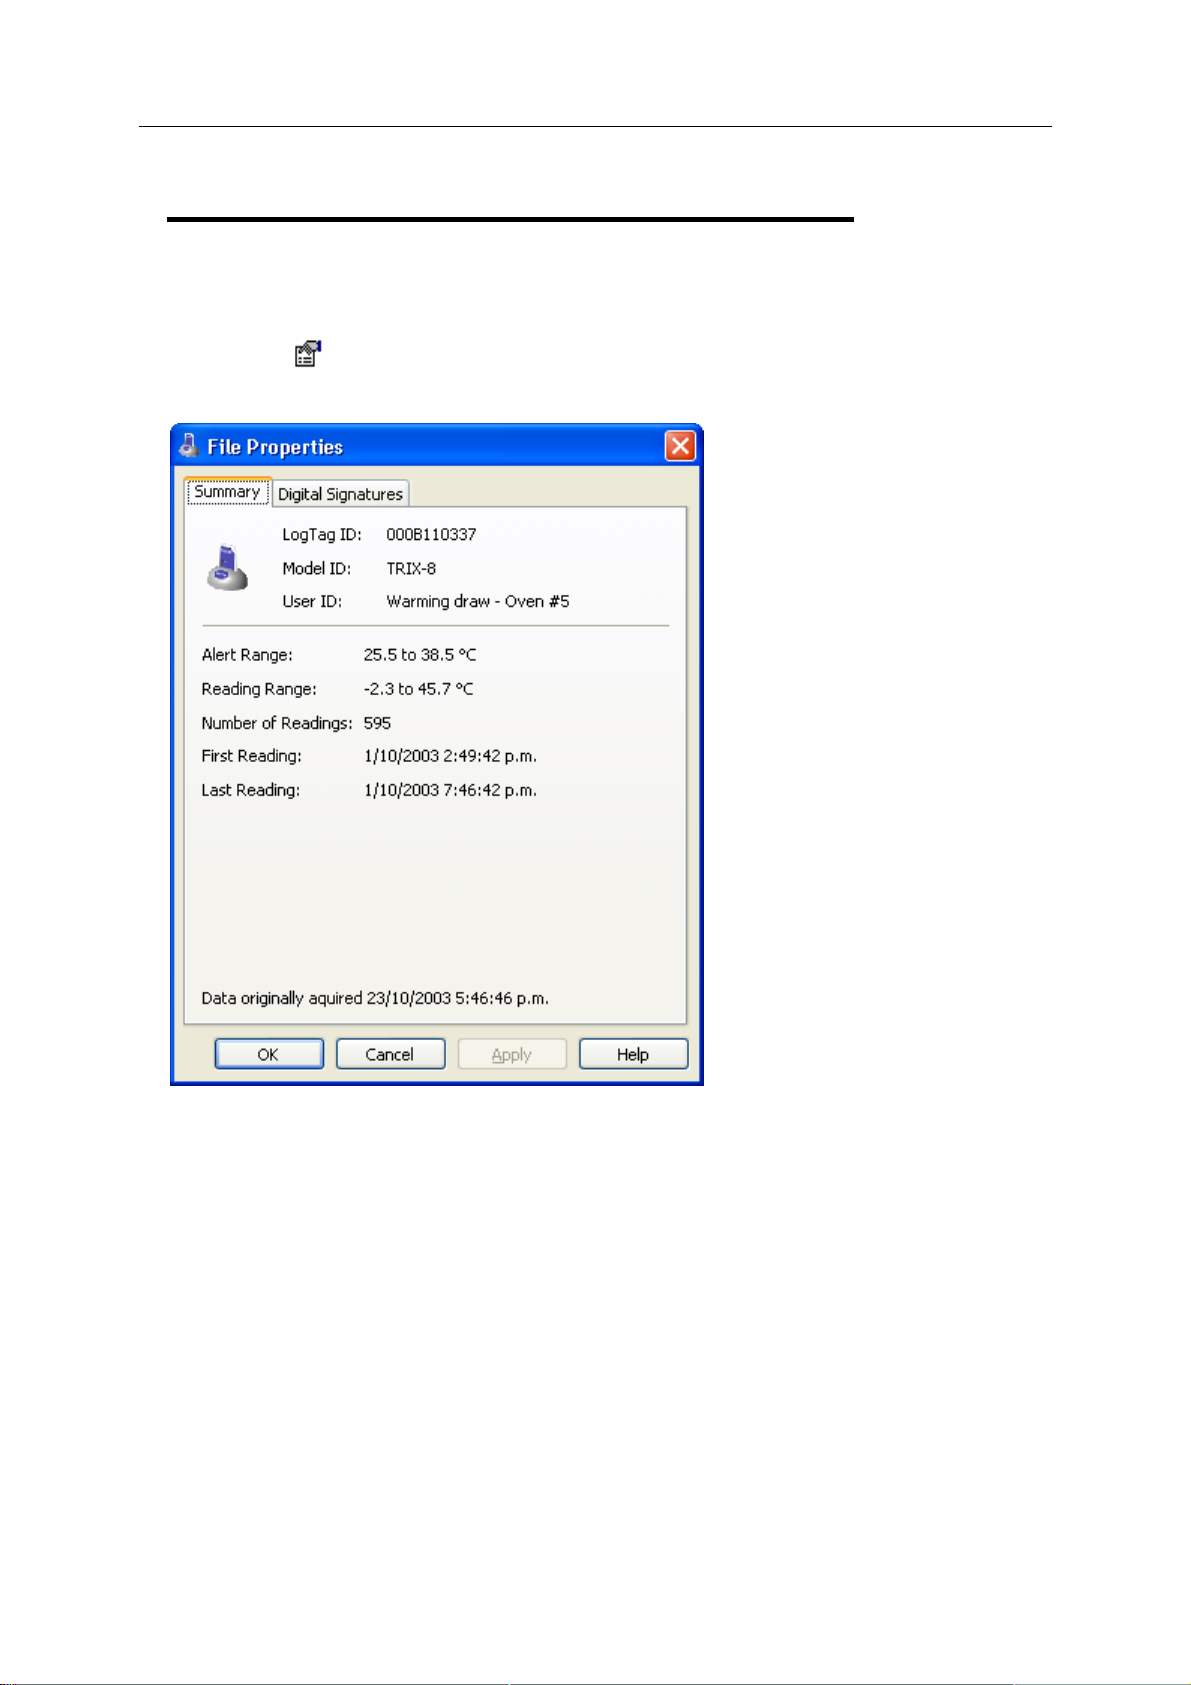
84 LogTag Analyzer User Guide (2.0)
Viewing file properties
The file properties, which is accessed through the File Menu (on page 119) and/or
through the
included within the file, as indicated in the following picture.
toolbar command, provides users with a brief summary about the data

Chapter 5 Results from LogTag 85
This file properties information is also available for viewing directly through the Windows
Explorer software that was included with the Windows operating system, without the
need to have the LogTag Analyzer software open. To view the information, simply locate
the file of interest with Windows Explorer and, using the mouse, click the right button
over the file and select the "Properties" menu item, with the left mouse button, from the
menu that will be displayed, similar to the following picture.
Select the "Summary" tab and you will see the summary of the data contained in the file.
If the contents of the file require a newer version of software to open and view, have
become corrupted or have been modified then the "Summary" tab will not be visible.
If the LogTag has a limited number of trips left, this is also indicated here.

86
C HAPTER 6
Customizing the software
In the "Edit" menu is a command called "Options...".
This menu command opens a Window, which will allow the many of the features that the
software offers to be customized. The following sections will provide an explanation of
each of these options so that users will be able to make the best use of the software.
In This Chapter
General Settings ..................................................... 87
Summary Statistics ................................................. 88
Chart Statistics ....................................................... 89
Charts ................................................................... 90
Automation ............................................................ 92
File and Folder Settings .......................................... 105
Exports and Reports ............................................... 109
Dates and Times .................................................... 111
Communication Ports.............................................. 113
User Server ............................................................ 114
Software Updates ................................................... 115
Configuration Reports ............................................. 116

Chapter 6 Customizing the software 87
General Settings
The General Settings options allow you to change various preferences that will effect the
overall appearance of the information shown by the software.
Show temperatures in
This will determine what units of measurement temperatures will be displayed in. The
options include:
Fahrenheit (°F)
Celsius (°C)
Kelvin (K)
Use Font
Determines what font to use to display and print information about LogTag recordings
and is changed through the
button. A sample of the font selected will be shown
to you on the screen.
Language
This instructs the software which language for the software to use for all the information
it displays and prints.

88 LogTag Analyzer User Guide (2.0)
Summary Statistics
This option allows you to specify which statistics are displayed in the Summary tab. The
statistics can be enabled or disabled by clicking the tick box for the relevant item in the
list.
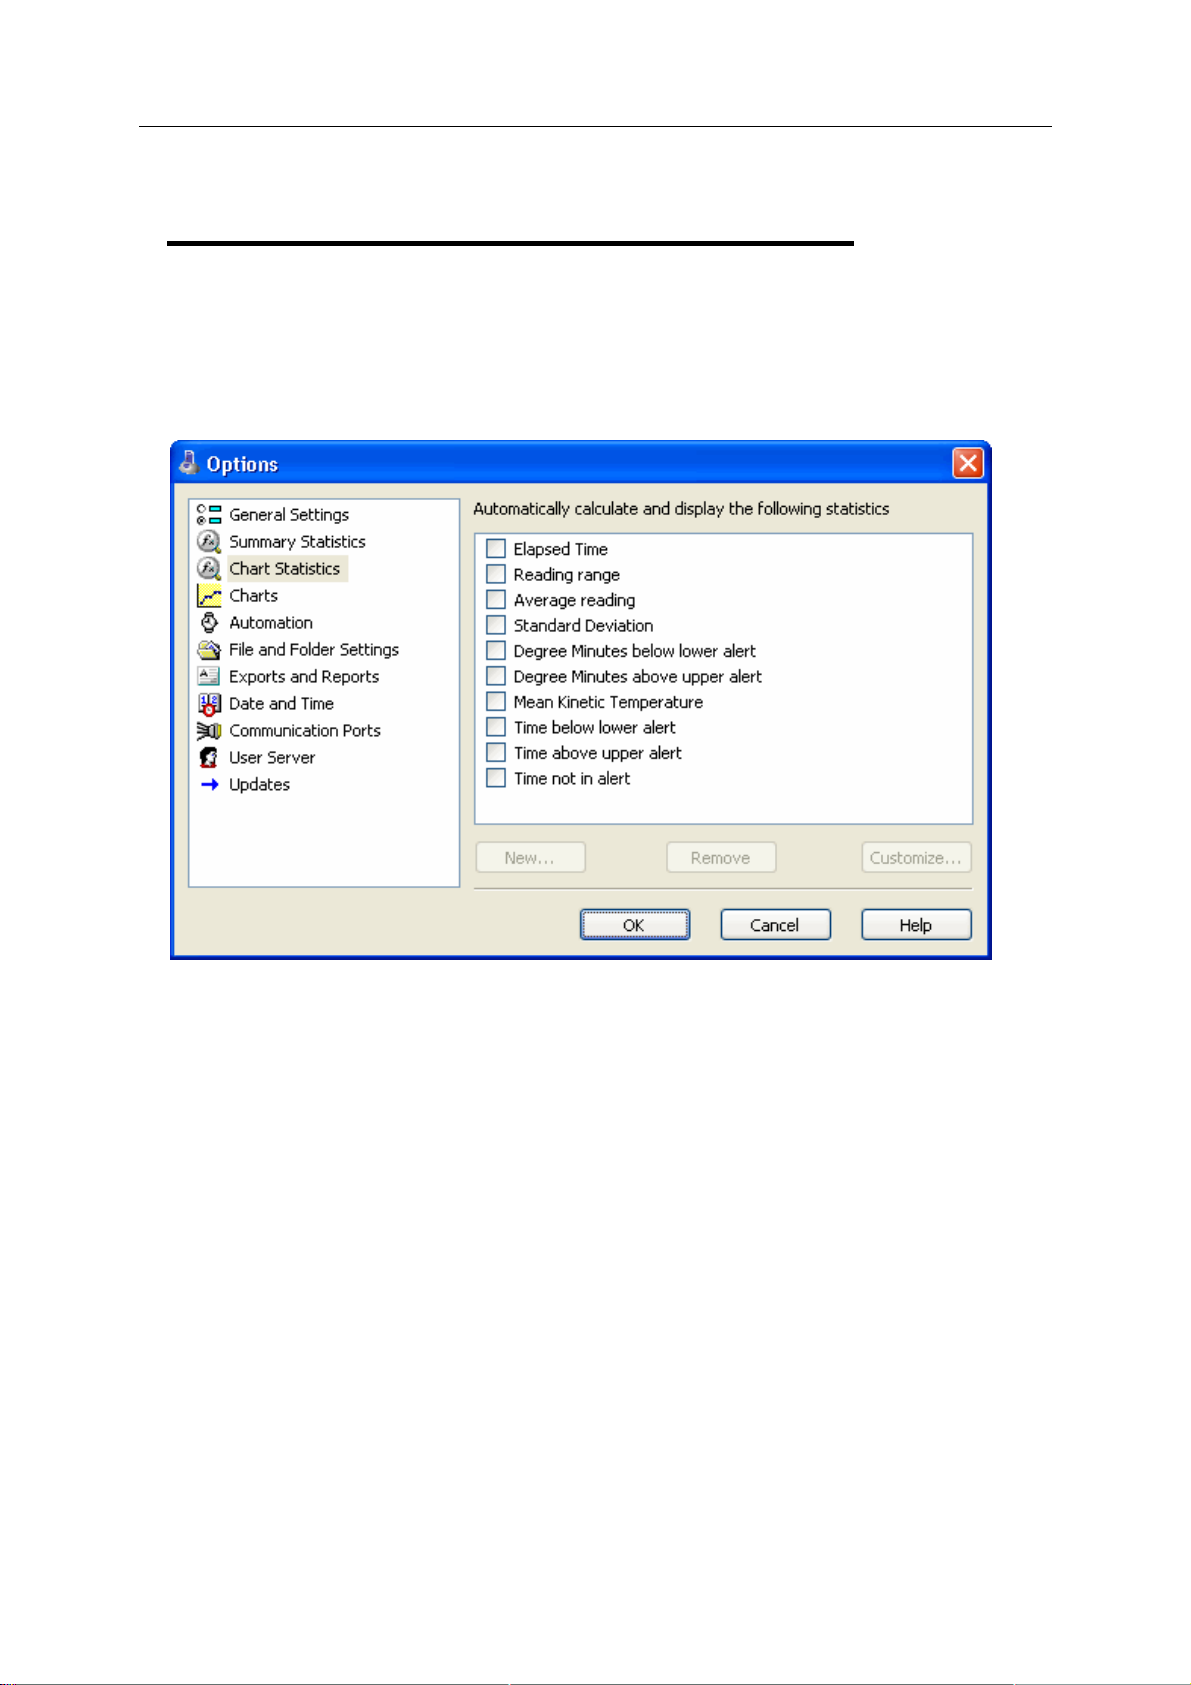
Chapter 6 Customizing the software 89
Chart Statistics
This option allows you to specify which statistics are displayed on the charts. The
statistics can be enabled or disabled by clicking the tick box for the relevant item in the
list.

90 LogTag Analyzer User Guide (2.0)
Charts
The Charts options allow the various aspects of the charts that display the readings
recorded by LogTags to be customized. At the base of the Window is a color selector and
other relevant controls, which apply to the highlighted item on the list in the window.
Some experimentation with these settings will show very quickly how they work. Select a
color in the color panel, click
results of the change.
Note that the three regions on the chart display can be controlled. LogTags can be
configured to detect over and under conditions based on a series of temperature and/or
humidity measurements. When the data is displayed graphically on the chart, these
become color background regions. These are different colors for "at or above high alert
limit", "between high alert limit and low alert limit" and "at or below low alert limit". This
allows out-of-range and in-range data to be spotted easily on the listed or charted data.
By selecting a line style for the "above high alert limit" and "below low alert limit" regions
you can improve the readability of the charts on black and white printouts.
You can choose to include or exclude non-validated data from the chart display by
checking or un-checking the "Non-validated readings" check box in the list. If
non-validated data is to be displayed, it can either appear just like validated data, or you
can define a different colour and marker style to be used. Check the check box "Display
non-validated readings differently:" to display non-validated data in the selected
colour/style.
, and then go to the Data screen to see the

Chapter 6 Customizing the software 91
Please refer to section How secure is my data (on page 82) for a detailed explanation of
non-validated data.
When readings beyond the specified measurement range of a LogTag have been
recorded, the display will indicate this using the following techniques:
The Chart display will not plot the out of range values and the chart curve will appear
with broken lines.
The Data display will include "<" or ">" for each reading that is beyond the
specification range.
The Statistics display will include "**" for each statistic that includes readings that are
beyond the specification range.
If the option "Show readings beyond specification" is enabled, all reading values will be
displayed, even if the recorded readings are beyond the operating range of the LogTag.
For example, the TRIX-8 has a published minimum temperature of -40°C. Temperatures
to -41.5°C may be displayed if the “Show readings beyond specification” is enabled,
however the accuracy of recordings between -40 and -41.5 is unknown. Temperatures
between -40 and -41.5 will be displayed even if the temperature falls to a much lower
actual value.
LogTag Recorders provides no guarantee of temperature reading reliability or accuracy
beyond the published range for a given product and the "Show readings beyond
specification" option is not recommended to be enabled for general use.
The "Elapsed Time" option switches the x-Axis display between date/time and elapsed
time since the beginning of the display period.
"Show Min/Max/Average Tab" shows up to three additional tabs in a multi chart with
graphs representing Minimum, Maximum and Average readings (See Combining Charts
into a single chart on page 64.)
Most of the Chart Options settings can be enabled or disabled by clicking the tick box for
the relevant item in the list.
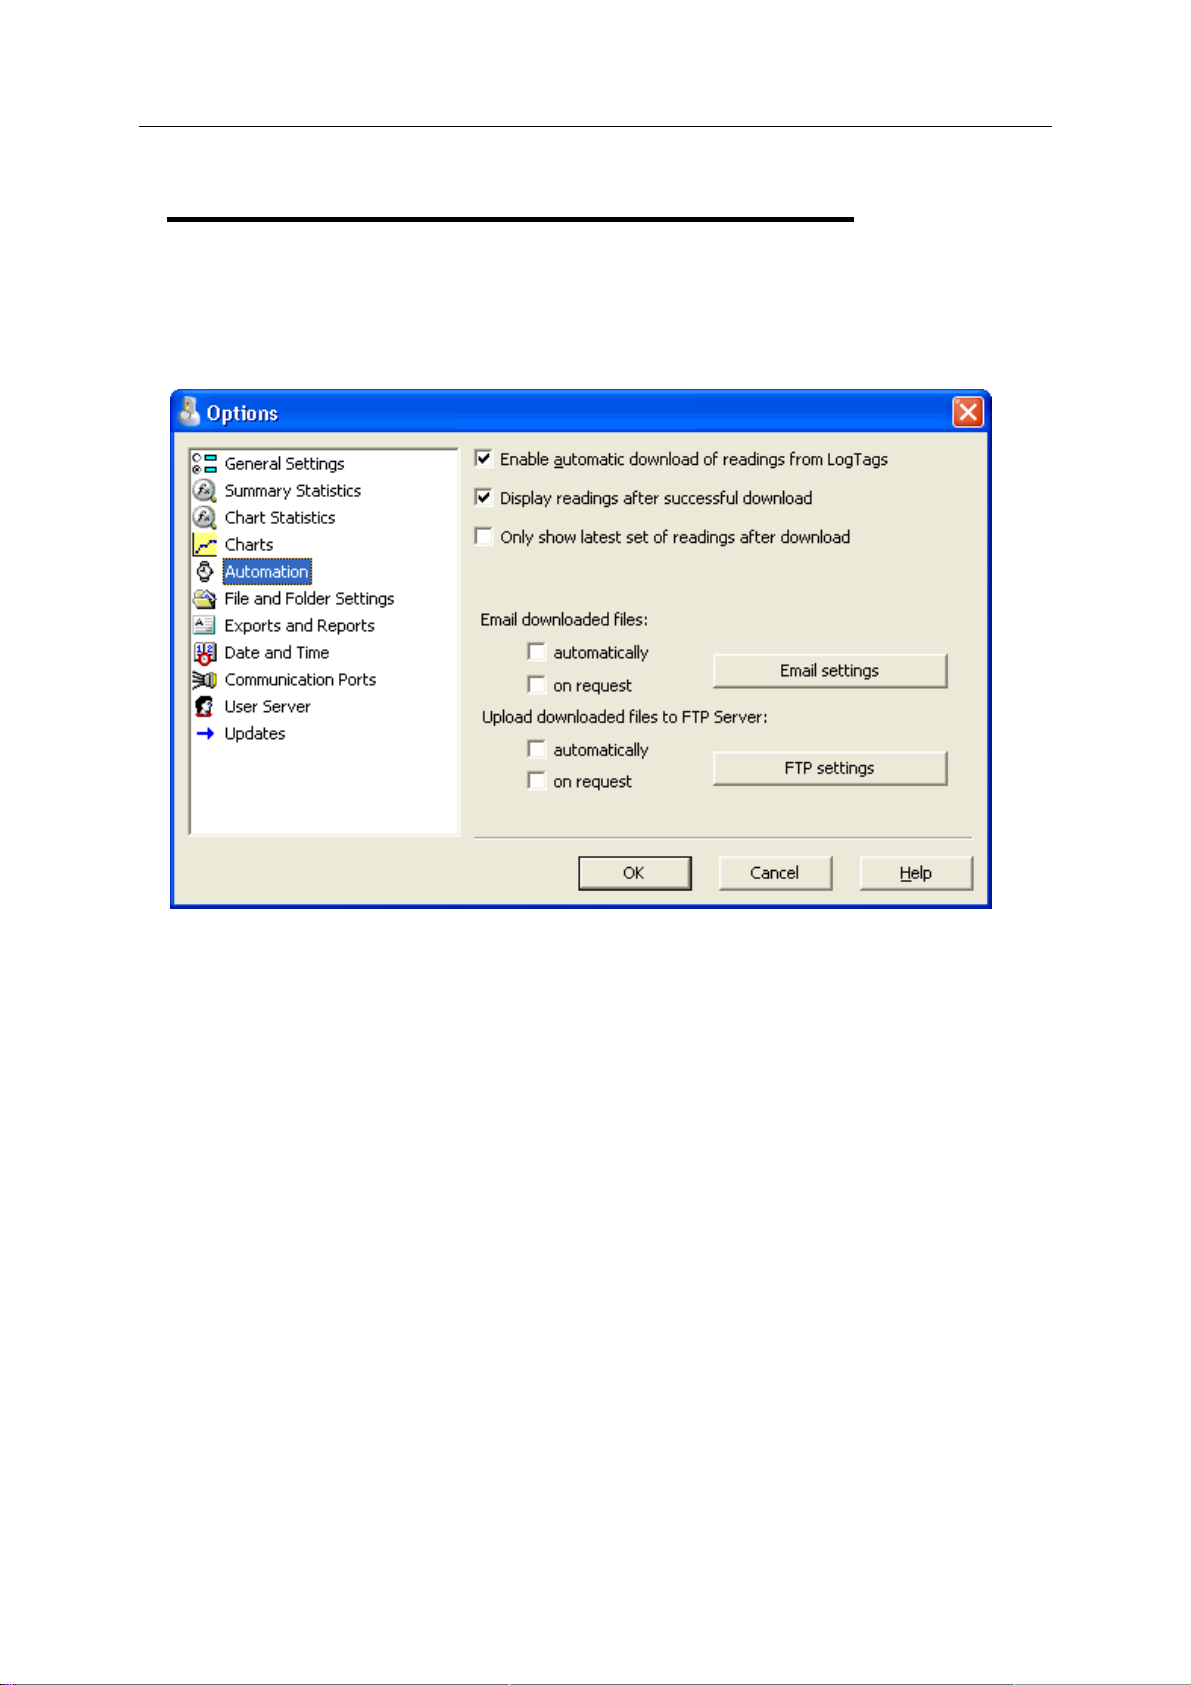
92 LogTag Analyzer User Guide (2.0)
Automation
The Automation options determine what the software does automatically when it detects
a LogTag in the Interface Cradle.
Enable automatic download of readings from LogTags
Instructs the software to automatically retrieve recordings from a LogTag when it is
placed in an Interface Cradle that is connected to the computer. While the software is
automatically retrieving recordings from a LogTag an animated picture will appear on the
screen to let the user know this action is being performed. With this function enabled, it is
not necessary to go through the download wizard procedure. This function is very useful
when working with multiple LogTags.
This function can be temporarily disabled by holding down the "Ctrl" key on the keyboard
while a LogTag is placed in the Interface Cradle.
Display readings after successful download
Instructs the software to display the recordings after downloading them from the LogTag.
The default display format is determined by the "Display" setting in the "File Settings (see
"File and Folder Settings" on page 105)" option. This option will affect readings
downloaded through the automatic download feature and when downloading through the
Wizard approach.

Chapter 6 Customizing the software 93
Only show the latest set of readings after download
Instructs the software to only display the most recently retrieved set of readings on the
screen. If there are multiple windows of readings open and being displayed, all of these
windows will therefore be automatically closed and only the most recently retrieved set of
readings will be displayed.
Automatic e-mailing and uploading to FTP sites
In the same way that LogTag Analyzer files are saved to a local hard drive, they can be
automatically uploaded to an FTP site and automatically be e-mailed every time data from
a LogTag are downloaded.
FTP (File Transfer Protocol) is a standard which describes how files are transferred
between different computers and networks. SMTP (Simple Mail Transfer Protocol) is used
for e-mail and describes how electronic mail is distributed across networks. Detailed
explanations of how both FTP and SMTP work are beyond the scope of this manual,
however if you wish to learn more about FTP, SMTP, e-mail and networking please refer
to one of the many good articles available on the Internet, such as the ones on Wikipedia
or the various FTP and SMTP client providers.
In the Automation dialogue you can select for both FTP and e-mail whether you wish to
make the process automatic, on request, or both. If you activate manual
uploading/e-mailing, but not automatic uploading/e-mailing, you need to press a button
on the toolbar to upload or send the file in the currently active window. This button is in
the form of a globe symbol, which also indicates which setting is currently active.
If the globe is active, and a small "F" is depicted in the lower right corner,
automatic FTP uploading is activated.
If the globe is active, and a small "e" is depicted in the upper right corner,
automatic e-mailing is activated.
If the globe is active, and both the "F" and the "e" are depicted, both automatic
FTP uploading and e-mailing are activated.

94 LogTag Analyzer User Guide (2.0)
If the globe is active, but no letter is displayed, neither automatic FTP uploading
nor automatic e-mailing are activated. Manual FTP or e-mail functions may still
both be active.
If the globe is grayed out, neither automatic nor manual FTP or e-mail functi ons
are available.
When neither box for e-mailing has a tick, no e-mailing will be possible. Similarly, when
neither box for FTP upload has a tick, no uploading via FTP will be possible, however in
both cases the settings data will still remain stored.
Clicking on the FTP or E-mail settings buttons brings up the dialogue windows for the
Basic FTP settings (on page 100) or the Basic SMTP and e-mail settings (on page 95).
Usually this information will be provided by your network administrator. If your company
has specific IT policies you may not be allowed to configure the settings yourself. In this
case, or if your network administrator has already created a company wide access for
multiple users, you may be provided with a settings file called "UploadSettings.dat". Your
network administrator will detail instructions how to import these settings into LogTag
Analyzer.
Changing FTP or e-mail settings while files are being uploaded will display following
dialogue box when clicking OK to close the Options window.
Click "yes" to cancel the current upload, and "No" to continue uploading to the previously
selected location.
When uploading or e-mailing files a status window is displayed at the bottom of the
LogTag Analyzer window.

Chapter 6 Customizing the software 95
This window shows status messages related to the FTP and e-mailing functions. The
window can be hidden by right clicking anywhere in it and de-selecting the Upload/Send
Status box. It can be re-displayed by right clicking anywhere on the menu or toolbar and
selecting the Upload/Send Status box.
Note: The manual e-mail function described here is different from the "send mail" button
on the toolbar. The "send mail" button invokes your standard e-mail program, attaches
the data file, requires you to fill in an e-mail address and press the send button. The
manual e-mail function via SMTP does not use your standard e-mail program, but the
configured SMTP settings and requires no further action once the globe button on the
toolbar is pressed.
Note: Automatic upload via FTP and automatic e-mailing only work if a file is created by
downloading data from a LogTag in the interface. If the uniqueness settings in the "File
and Folder Settings" are set so t hat certain conditions do not result in creation of a new
file, no file is uploaded or e-mailed either.
Files with formats other than the native LogTag Analyzer format can also be e-mailed or
uploaded. They can be selected separately for each transfer mechanism in the respective
"Settings" dialogue and are independent of the settings in the Exports and Reports (on
page 109) option dialogue.
Note: If you upload a file via the manual or automatic FTP function, any file that already
exists on the server with the same name will be overwritten. It is up to you to make sure
files are created with unique file names.
Basic SMTP and e-mail settings
Disclaimer
The distribution of unsolicited e-mails provides huge inconvenience to anyone with an
e-mail account. LogTag Analyzer's e-mail function allows the automated e-mailing of files
to a large number of recipients simultaneously without user interaction. Some countries
consider this as spam and will prosecute offenders.
It is therefore of the utmost importance that you as the sender obtain permission from
the recipients to send these files. LogTag Recorders provides this functionality as a
feature assisting in the distribution of information between various users within an
organization and will not assume responsibility for any misuse of its software.
Setting up automated e-mailing requires two main pieces of information:
The name of the SMTP server which you wish to use to send the e-mails and
A valid user name and password for the SMTP server.
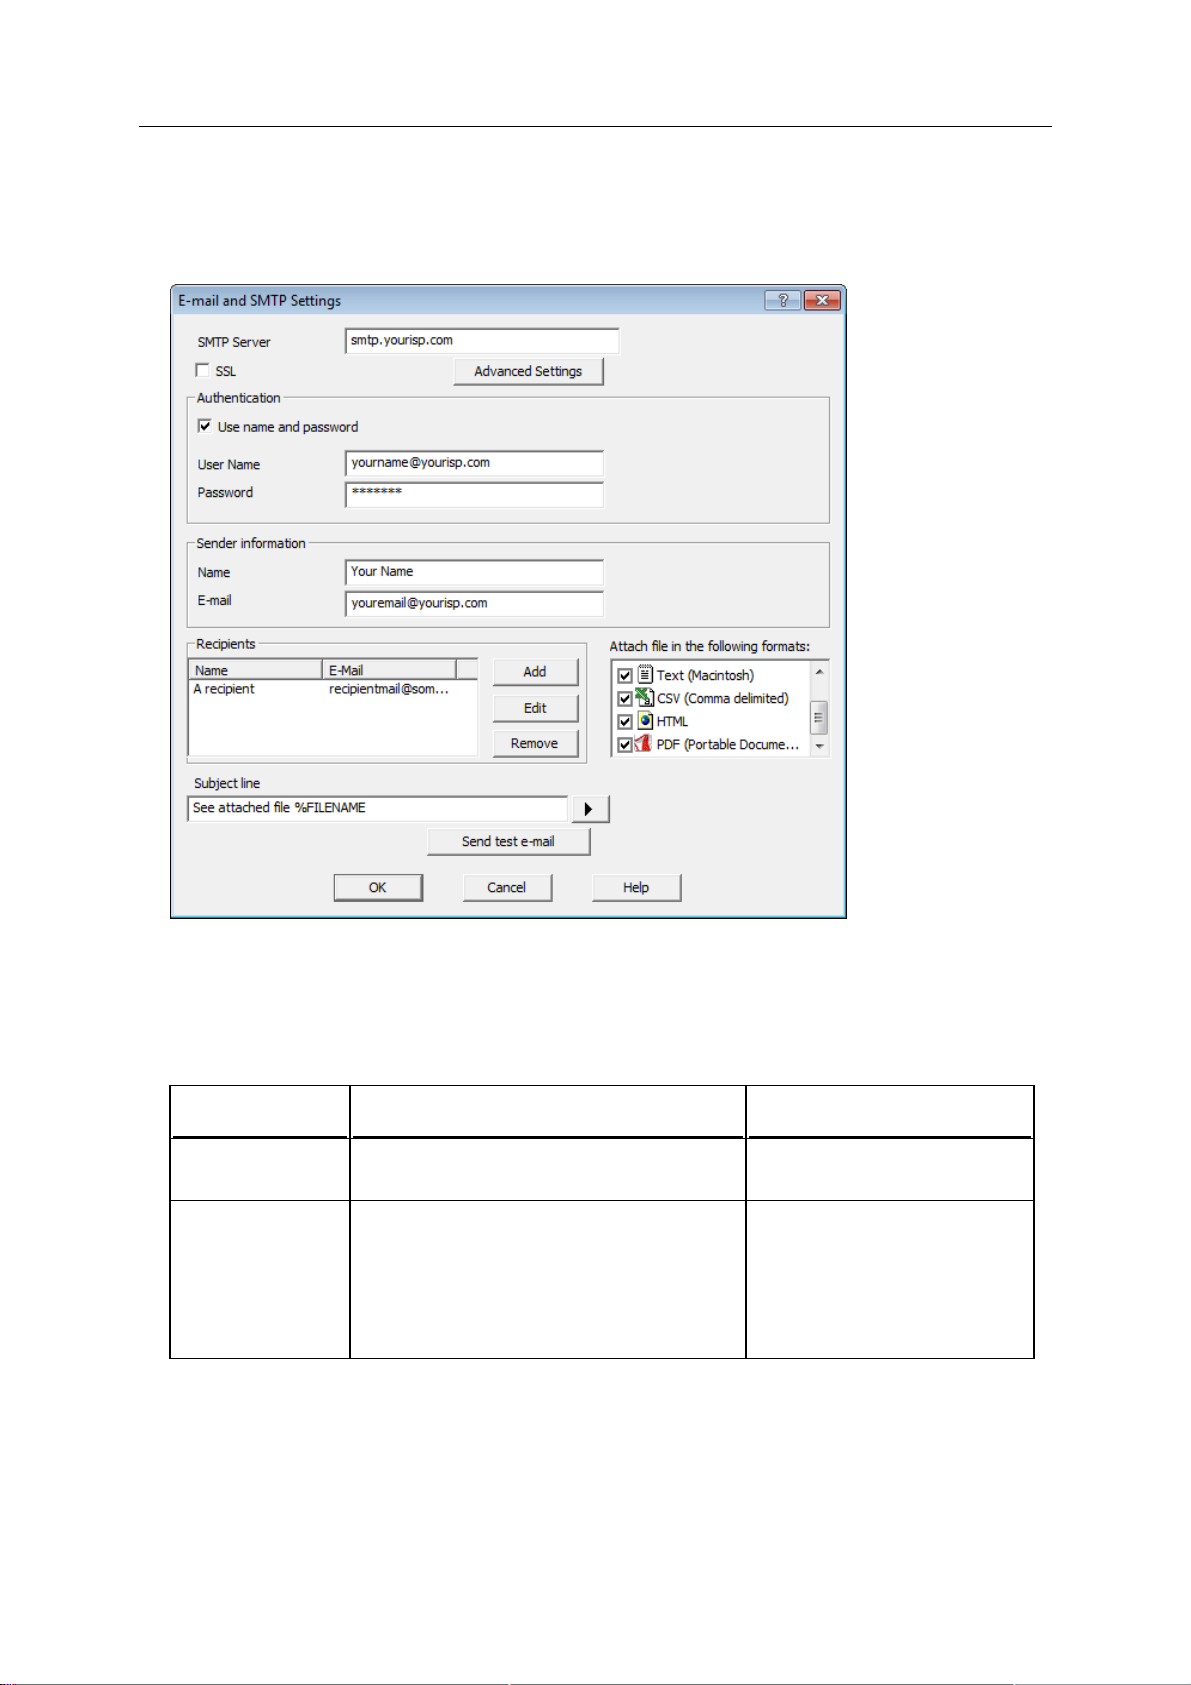
96 LogTag Analyzer User Guide (2.0)
Once you click on the "SMTP Settings" button a dialogue window will appear, allowing you
to enter the configuration data for the SMTP e-mail function. A lot of these settings will be
familiar to you from your standard e-mail program.
If you have been supplied with access data by your network administrator we suggest you
print the following table, enter the data into the fields provided and keep it in a safe
place.
Field What to enter Your details
SMTP Server Enter the name of the SMTP server you
were given by your network administrator
SSL SSL stands for Secure Sockets Layer. You
may be required to tick this box if your
SMTP server requires a secure connection.
Typically this setting is not required, and
your network administrator will set this up
if required.

Chapter 6 Customizing the software 97
Use name and
password
User Name Enter the user name you have been
Password Enter the password you have been given
Name Enter the name as it should appear in the
E-mail address Enter the e-mail address that the recipient
Some SMTP servers require an
authentication method, especially if the
SMTP server you are using is not provided
by your ISP, e.g. if you are using e-mail
accounts from a hosted site. In this case
you need to tick this box and provide login
data for this SMTP server. Quite often,
though, you will not be required to use
Authentication.
allocated by your network administrator
required for Authentication. Please note
that for authentication this often needs to
include a full e-mail address rather than
just the SMTP login.
by your network administrator required for
Authentication.
recipients e-mail program. This can be
your name or someone else's name.
can reply to by pressing the reply button of
his e-mail program. This can be your
e-mail address, or someone else's address.
Recipients Enter the e-mail addresses of the intended
recipients. Pressing the "add" button will
bring up a new entry window where you
can enter a recipient's name and e-mail
address.
You can also highlight a recipient's name
and edit the data or remove it from the
list.
Subject Line Text entered in this line will be displayed in
the subject line of the e-mail when
displayed on the recipients' e-mail
programs. Clicking on the
allow you to specify some file related
information which will be entered into the
subject line at the time of sending. You
can enter your own text with the file
related information.
button will
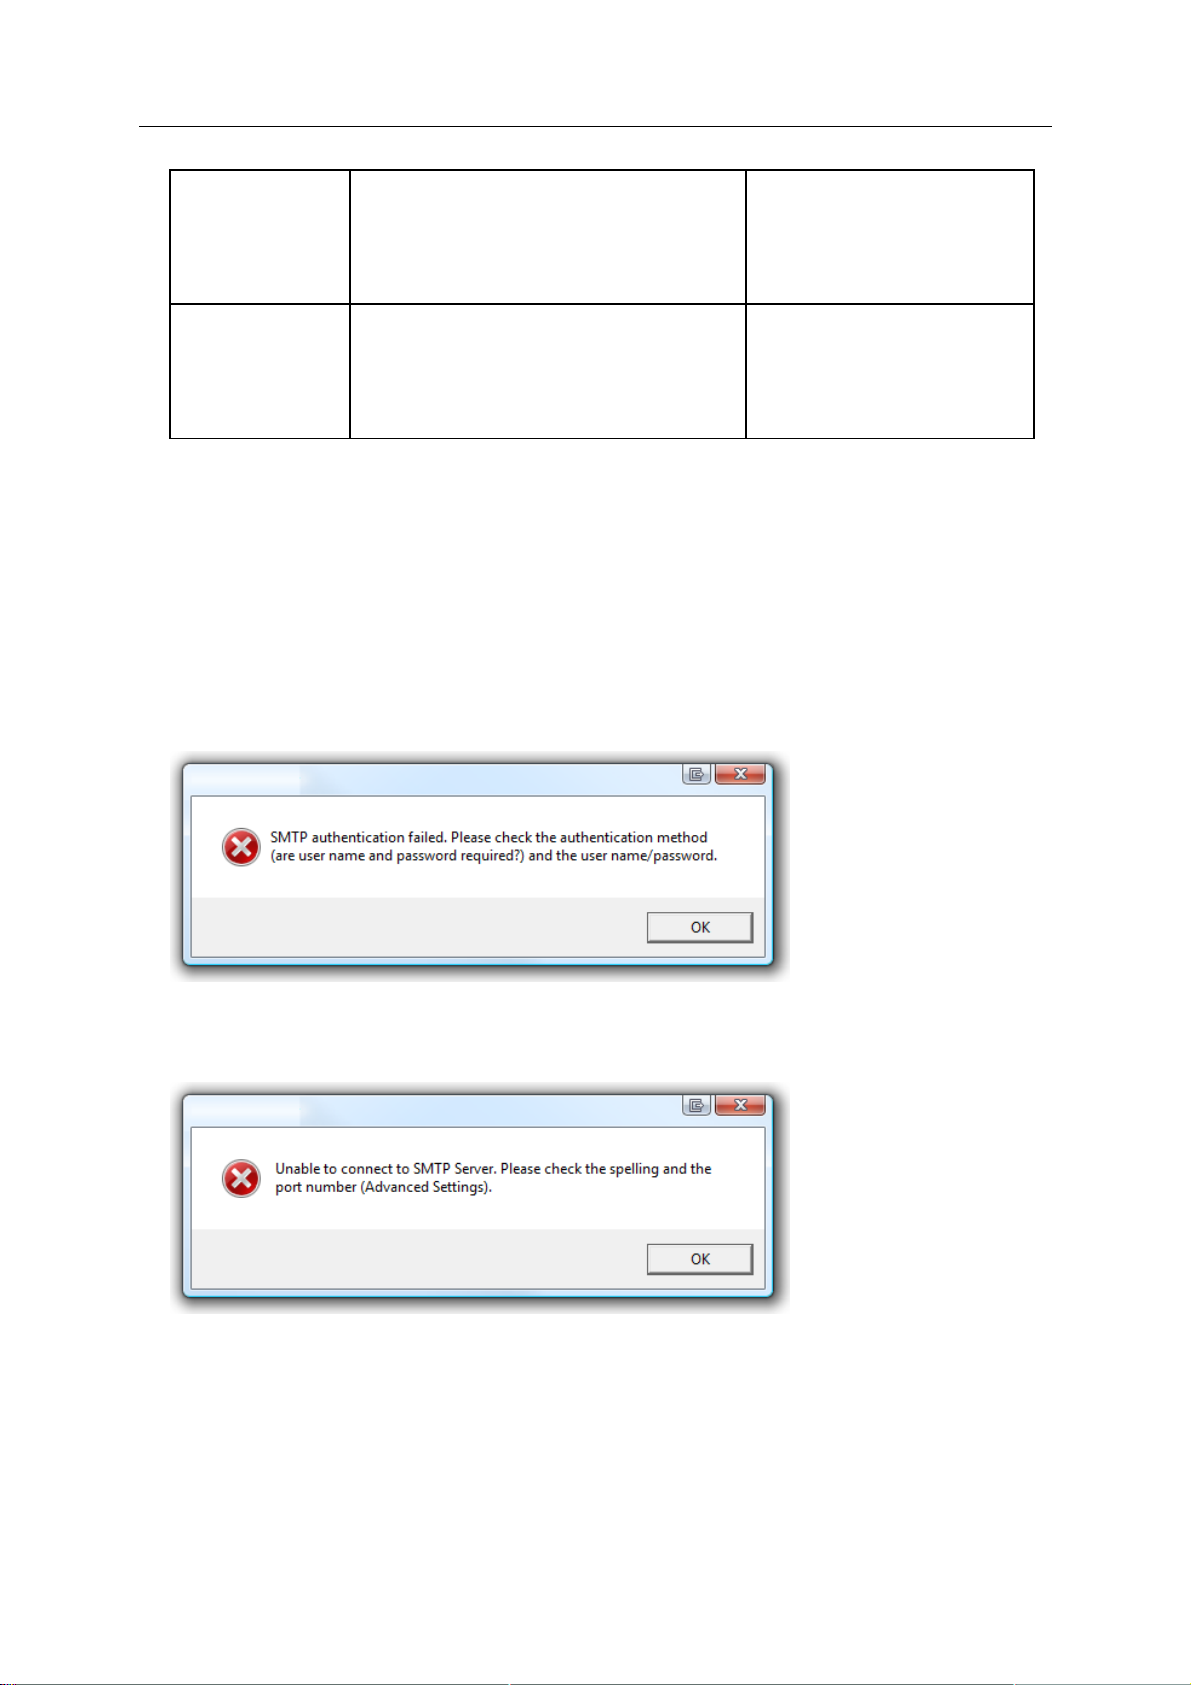
98 LogTag Analyzer User Guide (2.0)
Advanced settings Press this button to display a new dialogue
window where you can enter advanced
SMTP settings like port numbers, retries
and log files. Refer to the section about
Advanced SMTP settings (on page 99).
Attach file in the
following formats
Select all files that you wish to attach when
the e-mail is sent. Each file ticked here will
be created, regardless of the settings
made in "EDIT - OPTIONS - EXPORTS AND
REPORTS".
As a minimum you only need to provide an SMTP server address and one recipient e-mail
address for this function to work.
Every time you make changes to these settings you should perform a test by pressing the
"Send Test e-mail" button. LogTag Analyzer will
check you have provided valid connection data,
send a test e-mail to the e-mail addresses in the recipient list.
If any of these actions fail, LogTag Analyzer will display one of the following error
messages:
In this case the SMTP server requires authentication, and the data provided were not
correct. Please enter the correct authentication data.

Chapter 6 Customizing the software 99
This error message is displayed if LogTag Analyzer could not connect to the specified
SMTP site because it could not find it. This could be due to internet connectivity issues,
due to an incorrect port name or due to a mis-spelt server name.
This error message is displayed if one or more of the addresses in the recipient list have
an incorrect mail format (i.e. are not in the format a@b.c). LogTag Analyzer can only
check for the correct format of the addresses, but not for correctness of the e-mail
addresses. Please note if you do not provide a correct return address, you may not know
that intended recipients are not receiving the messages.
We recommended you add your own e-mail address to the list of recipients. This way you
get feedback if your e-mail has been sent correctly in your e-mail program. It is also good
practice to enter a valid and correct e-mail return address for yourself. Some ISP's will not
relay messages without a sender's address.
Advanced SMTP settings
Clicking on the "Advanced Settings" button in the SMTP settings dialogue displays
following Window:

100 LogTag Analyzer User Guide (2.0)
This will allow experienced users to change additional settings normally associated with
FTP transfers.
Field What to enter
Port Number The default port for providing SMTP connections is 25. Some
network administrators change the port number on their SMTP
servers to increase security and stop hacking attacks. If your
network administrator has advised a different port for connection,
please enter it here.
In this case you may also need to change the settings of your
firewall.
If you wish to learn more about this topic please see any of the
published articles on networking and TCP/IP available on the
Internet.
Retry If a connection cannot be established, LogTag Analyzer will retry to
e-mail the file again after the number of minutes entered here. This
helps eliminate e-mail errors due to intermittent Internet
connection errors.
Maximum Retries Enter the number of times LogTag Analyzer should try to e-mail the
file if previous attempts have not been successful.
Automatic Disconnect if
idle
Log uploads If a tick is placed in the box next to "Log uploads" the message
Log Connection errors Tick this box if you wish connection errors to be logged. This is
LogTag Analyzer will keep the connection to the SMTP server
active, even if currently no files are being e-mailed. This avoids
having to exchange password and login information every time a
file is uploaded therefore providing faster uploads, especially if only
a slow Internet connection is available. After a certain amount of
inactivity the connection is dropped to save resources. Enter the
time after which you wish LogTag Analyzer to automatically
disconnect from the SMTP server.
exchange between the SMTP server and LogTag Analyzer is
recorded into a file. These files are automatically named
"YYYY_M_D_LogTag Analyzer_SMTP.log", you can specify a
location where the files are created, or click
location of your choice.
recommended if you frequently experience upload errors and you
wish to discuss this issue with your network administrator.
to browse to a
Click OK to store the settings or cancel to abort.
Basic FTP settings
You will require two main pieces of information to upload data to an FTP site:
The name of the FTP site and a directory on the site in which the files will be stored
once uploaded and
A valid user name and password allowing you access to this directory.
 Loading...