

Application Note 104
October 2006
Load Transient Response Testing for Voltage Regulators
Practical Considerations for Testing and Evaluating Results
Jim Williams
INTRODUCTION
Semiconductor memory, card readers, microprocessors,
disc drives, piezoelectric devices and digitally based systems furnish transient loads that a voltage regulator must
service. Ideally, regulator output is invariant during a load
transient. In practice, some variation is encountered and
becomes problematic if allowable operating voltage tolerances are exceeded. This mandates testing the regulator
and its associated support components to verify desired
performance under transient loading conditions. Various
methods are employable to generate transient loads, allowing observation of regulator response.
Basic Load Transient Generator
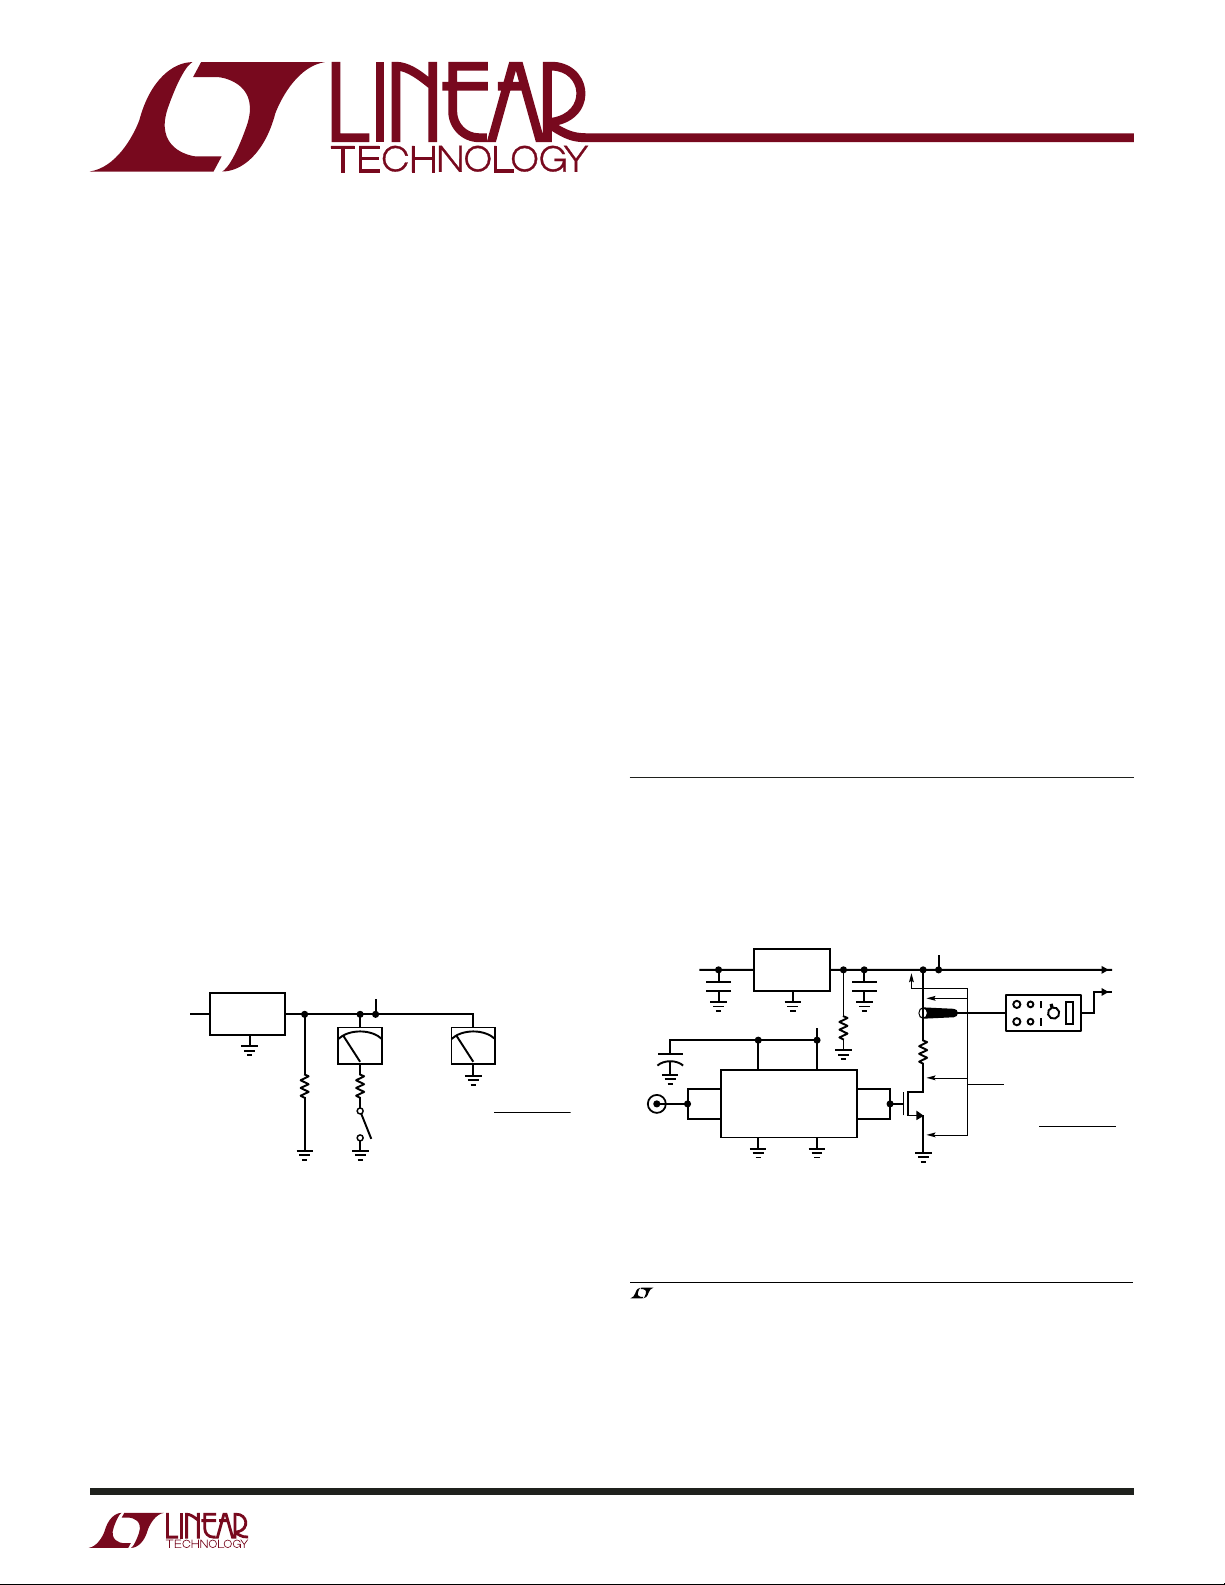
Figure 1 diagrams a conceptual load transient generator.
The regulator under test drives DC and switched resistive
loads, which may be variable. The switched current and
+E
REGULATOR
INPUT SUPPLY
REGULATOR
UNDER TEST
DC LOAD
REGULATOR
CURRENT
MONITOR
R
SWITCHED
LOAD
LOAD
SWITCH
I
SWITCHED
VOLTAGE
MONITOR
E
REGULATOR
=
R
SWITCHED LOAD
AN104 F01
output voltage are monitored, permitting comparison of
the nominally stable output voltage versus load current
under static and dynamic conditions. The switched current
is either on or off; there is no controllable linear region.
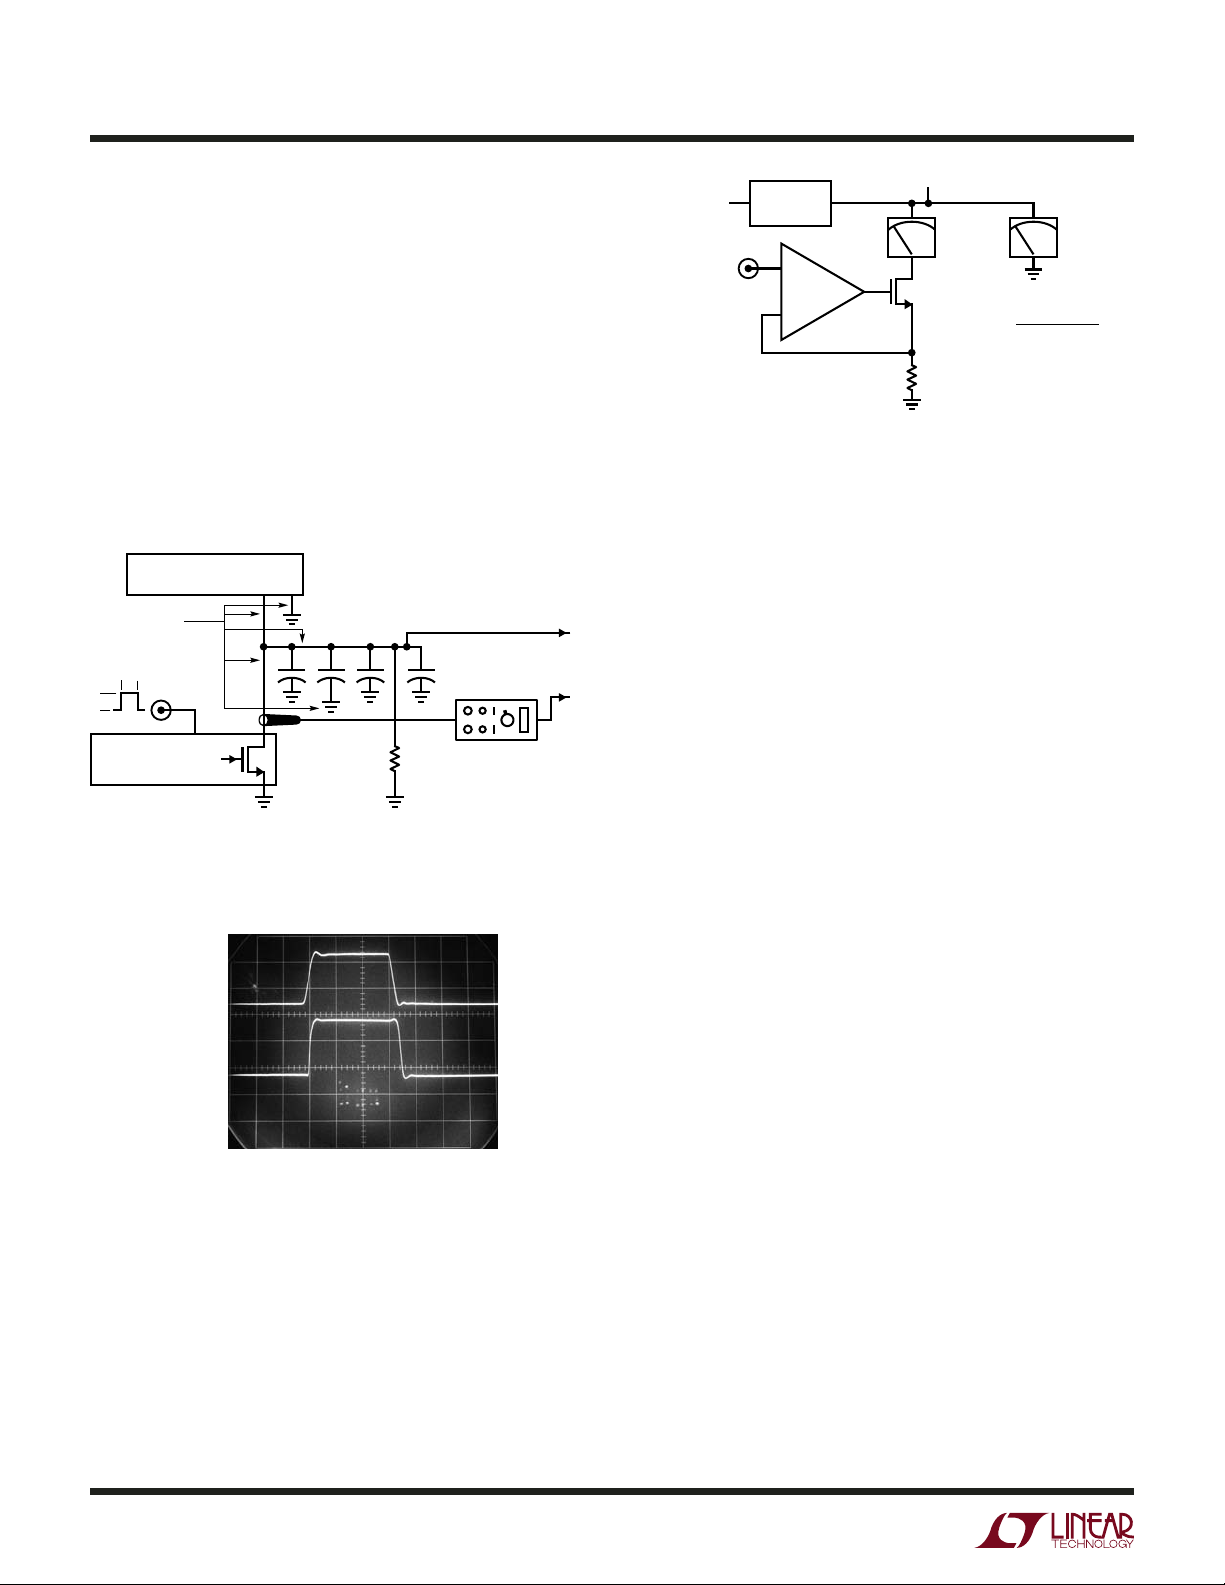
Figure 2 is a practical implementation of the load transient
generator. The voltage regulator under test is augmented
by capacitors which provide an energy reservoir, similar to
a mechanical fl ywheel, to aid transient response. The size,
composition and location of these capacitors, particularly
, has a pronounced effect on transient response and
C
OUT
overall regulator stability.
1
Circuit operation is straightforward. The input pulse triggers the LTC1693 FET driver to
switch Q1, generating a transient load current out of the
Note 1. See Appendix A, “Capacitor Parasitic Effects on Load Transient
Response” and Appendix B, “Output Capacitors and Stability” for extended
discussion.
+E
REGULATOR
INPUT SUPPLY
PULSE
INPUT
REGULATOR
UNDER TEST
C
IN
+10
VC2
DC LOAD
O1
O2
G1
+
10µF
VC1
I1
LTC1693-1
I2
G2
REGULATOR
C
OUT
R
LOAD
Q1
IRLZ24
TO AC-COUPLED
OSCILLOSCOPE
TEKTRONIX P-6042 CURRENT
PROBE OR EQUIVALENT
MINIMIZE
INDUCTANCE
E
I
SWITCHED
REGULATOR
=
R
SWITCHED LOAD
AN104 F02
CH1
CH2
Figure 1. Conceptual Regulator Load Tester Includes Switched
and DC Loads and Voltage/Current Monitors. Resistor Values Set
DC and Switched Load Currents. Switched Current is Either On or
Off; There is No Controllable Linear Region
Figure 2. A Practical Regulator Load Tester. FET Driver and Q1
Switch R
. Oscilloscope Monitors Current Probe Output and
LOAD
Regulator Response
, LT, LTC and LTM are registered trademarks of Linear Technology Corporation.
All other trademarks are the property of their respective owners.
an104f
AN104-1
Application Note 104
regulator. An oscilloscope monitors the instantaneous load
voltage and, via a “clip-on” wideband probe, current. The
circuit’s load transient generating capabilities are evaluated
in Figure 3 by substituting an extraordinarily low impedance power source for the regulator. The combination of
a high capacity power supply, low impedance connections and generous bypassing maintains low impedance
across frequency. Figure 4 shows Figure 3 responding to
the LTC1693-1 FET driver (Trace A) by cleanly switching
1A in 15ns (Trace B). Such speed is useful for simulating
many loads but has restricted versatility. Although fast,
the circuit cannot emulate loads between the minimum
and maximum currents.
+E
REGULATOR
INPUT SUPPLY
CONTROL
INPUT
REGULATOR
UNDER TEST
+
–
CONTROL
AMPLIFIER
REGULATOR
CURRENT
MONITOR
Q1A1
CURRENT
SENSE RESISTOR
I =
R
CURRENT SENSE
E
INPUT
VOLTAGE
MONITOR
AN104 F05
Figure 5. Conceptual Closed Loop Load Tester. A1 Controls Q1’s
Source Voltage, Setting Regulator Output Current. Q1’s Drain
Current Waveshape is Identical to A1 Input, Allowing Linear
Control of Load Current. Voltage and Current Monitors are as in
Figure 1
HEWLETT-PACKARD
6012A POWER SUPPLY
MINIMIZE
INDUCTANCE
300ns
5V
LOAD TESTER
(FIGURE 2)
PULSE
–
+
3V
+ + + +
DC LOAD
(OPTIONAL)
VOLTAGE MONITOR TO
AC-COUPLED OSCILLOSCOPE
2200µF*
EACH
TEKTRONIX P-6042 CURRENT
PROBE OR EQUIVALENT
*SANYO OSCON
AN104 F03
CH1
CH2
Figure 3. Substituting Well Bypassed, Low Impedance Power
Supply for Regulator Allows Determining Load Tester’s
Response Time
A = 5V/DIV
B = 0.5A/DIV
HORIZ = 100ns/DIV
AN104 F04
Figure 4. Figure 2’s Circuit Responds to FET Driver Output
(Trace A), Switching a 1A Load (Trace B) in 15ns
Closed Loop Load Transient Generators
Figure 5’s conceptual closed loop load transient generator
linearly controls Q1’s gate voltage to set instantaneous
transient current at any desired point, allowing simulation
of nearly any load profi le. Feedback from Q1’s source to the
A1 control amplifi er closes a loop around Q1, stabilizing its
operating point. Q1’s current assumes a value dependant
on the control input voltage and the current sense resistor over a very wide bandwidth. Note that once A1 biases
to Q1’s conductance threshold, small variations in A1’s
output result in large current changes in Q1’s channel.
As such, large output excursions are not required from
A1; its small signal bandwidth is the fundamental speed
limitation. Within this restriction, Q1’s current waveform
is identically shaped to A1’s control input voltage, allowing linear control of load current. This versatile capability
permits a wide variety of simulated loads.
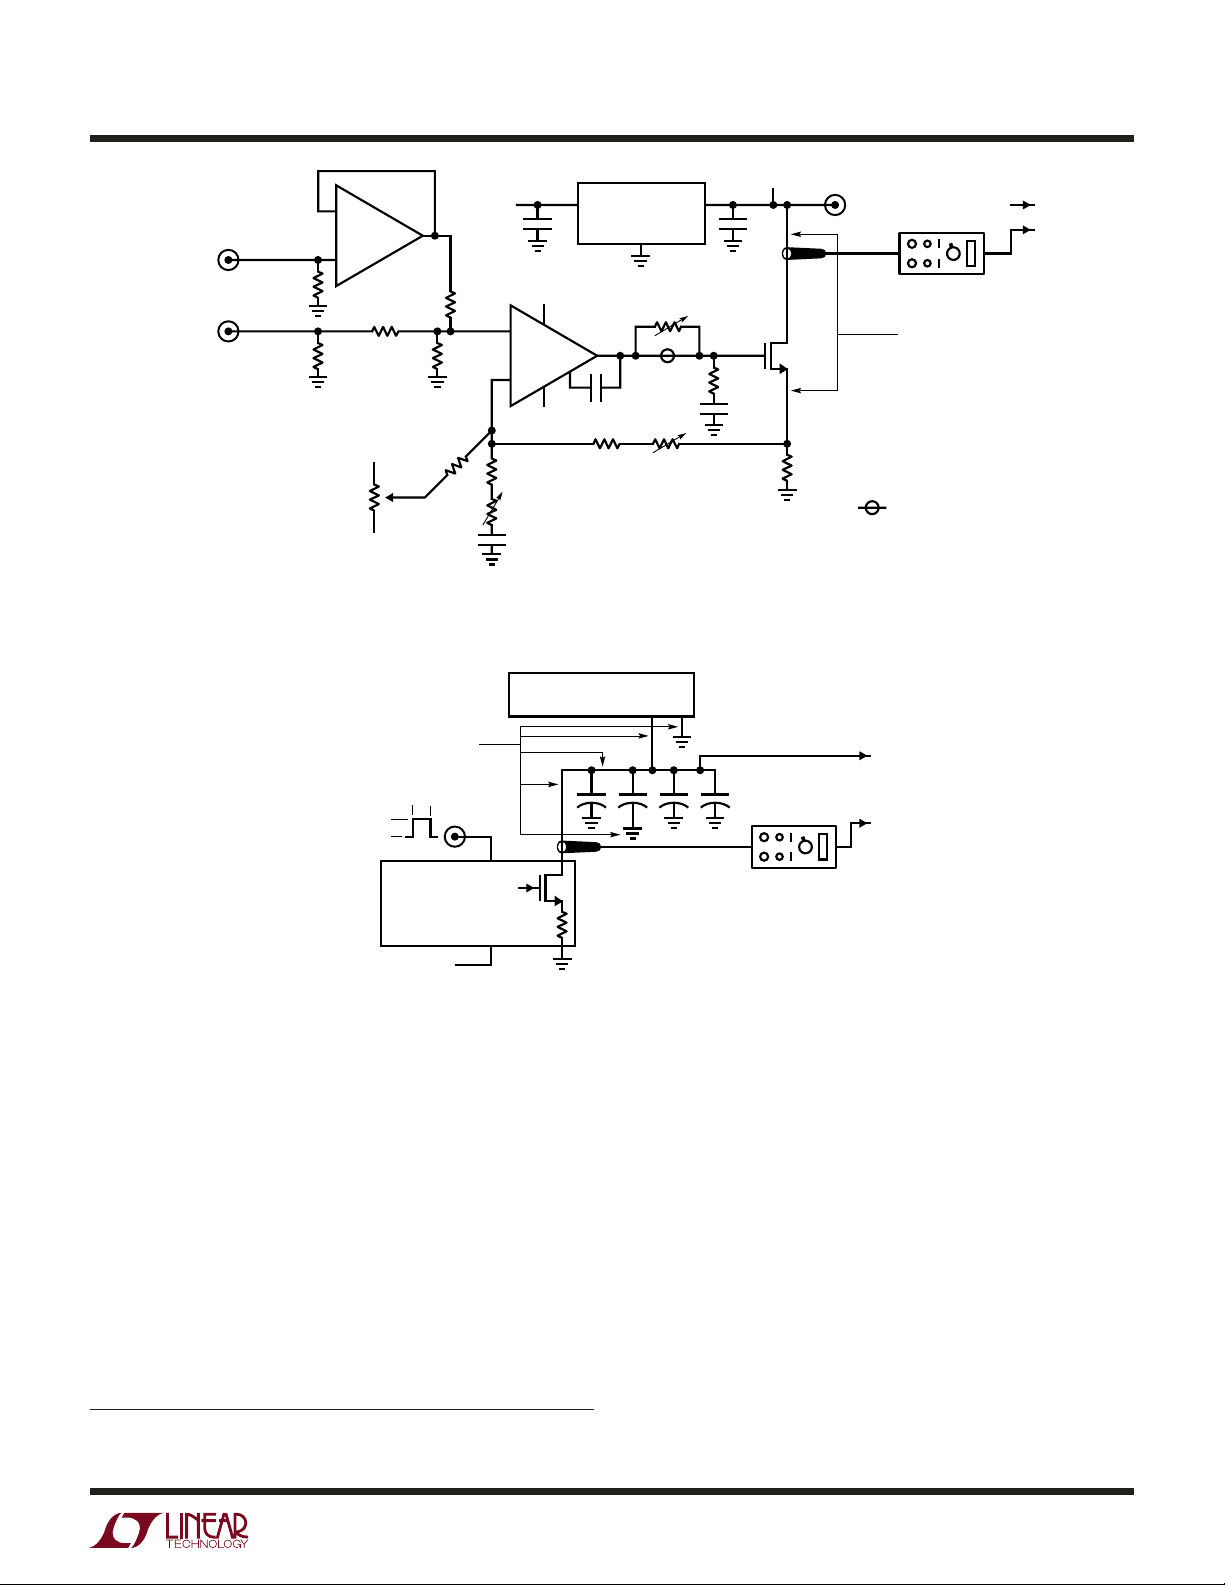
FET Based Circuit
Figure 6, a practical incarnation of a FET based closed loop
load transient generator, includes DC bias and waveform
inputs. A1 must drive Q1’s high capacitance gate at high
frequency, necessitating high peak A1 output currents and
attention to feedback loop compensation. A1, a 60MHz
current feedback amplifi er, has an output current capacity
exceeding 1A. Maintaining stability and waveform fi delity at high frequency while driving Q1’s gate capacitance
necessitates settable gate drive peaking components, a
damper network, feedback trimming and loop peaking
adjustments. A DC trim, also required, is made fi rst. With
no input applied, trim the “1mV adjust” for 1mV DC at
Q1’s source. The AC trims are made utilizing Figure 7’s
arrangement. Similar to Figure 3, this “brick wall” regulated
source provides minimal ripple and sag when step loaded
by the load transient generator. Apply the inputs shown
and trim the gate drive, feedback and loop peaking adjustments for the cleanest, square cornered response on the
oscilloscope’s current probe equipped channel.
an104f
AN104-2
DC BIAS
0 – 10V = 0 – 1A
WAVEFORM INPUT
0 – 1V = 0 – 1A
100k
51Ω
–
+
A2
LT1006
866Ω*
REGULATOR
INPUT
SUPPLY
8.16k*
100Ω*
+
A1
LT1210
–
IN OUT
C
IN
+15
C
0.01µF
–15
REGULATOR
UNDER TEST
GND
GATE DRIVE PEAKING
100Ω
Application Note 104
+E
2.5Ω
10µF
CERAMIC
REGULATOR
C
OUT
VOLTAGE MONITOR TO
AC-COUPLED OSCILLOSCOPE
TEKTRONIX P-6042 CURRENT
Q1
IRLZ24
PROBE OR EQUIVALENT
MINIMIZE
INDUCTANCE
CH1
CH2
+15
10k
–15
+1mV
ADJUST
120k
100Ω
1k LOOP PEAKING
68pF
560Ω
1k
FEEDBACK
AN104 F06
0.1Ω**
= FAIR-RITE
#2743001112
= 1% METAL FILM RESISTOR*
= VISHAY WSL2512.5%**
Figure 6. Detailed Closed Loop Load Tester. DC Level and Pulse Inputs Feed A1 to Q1 Current Sinking Regulator Load. Q1’s Gain
Allows Small A1 Output Swing, Permitting Wide Bandwidth. Damper Network, Feedback and Peaking Trims Optimize Edge Response
HEWLETT-PACKARD
0.5V, (0.5A)
MINIMIZE
INDUCTANCE
250ns TO 500ns
100kHz
CLOSED LOOP
LOAD TESTER
(FIGURES 6, 8)
1V, (100mA)
6012A POWER SUPPLY
+ + + +
PULSE
DC BIAS
–
+
VOLTAGE MONITOR TO
AC-COUPLED OSCILLOSCOPE
3V
TEKTRONIX P-6042 CURRENT
*SANYO OSCON
2200µF*
EACH
PROBE OR EQUIVILENT
CH1
CH2
AN104 F07
Figure 7. Closed Loop Load Tester Response Time is Determined as in Figure 3. “Brick Wall” Input Provides Low Impedance Source
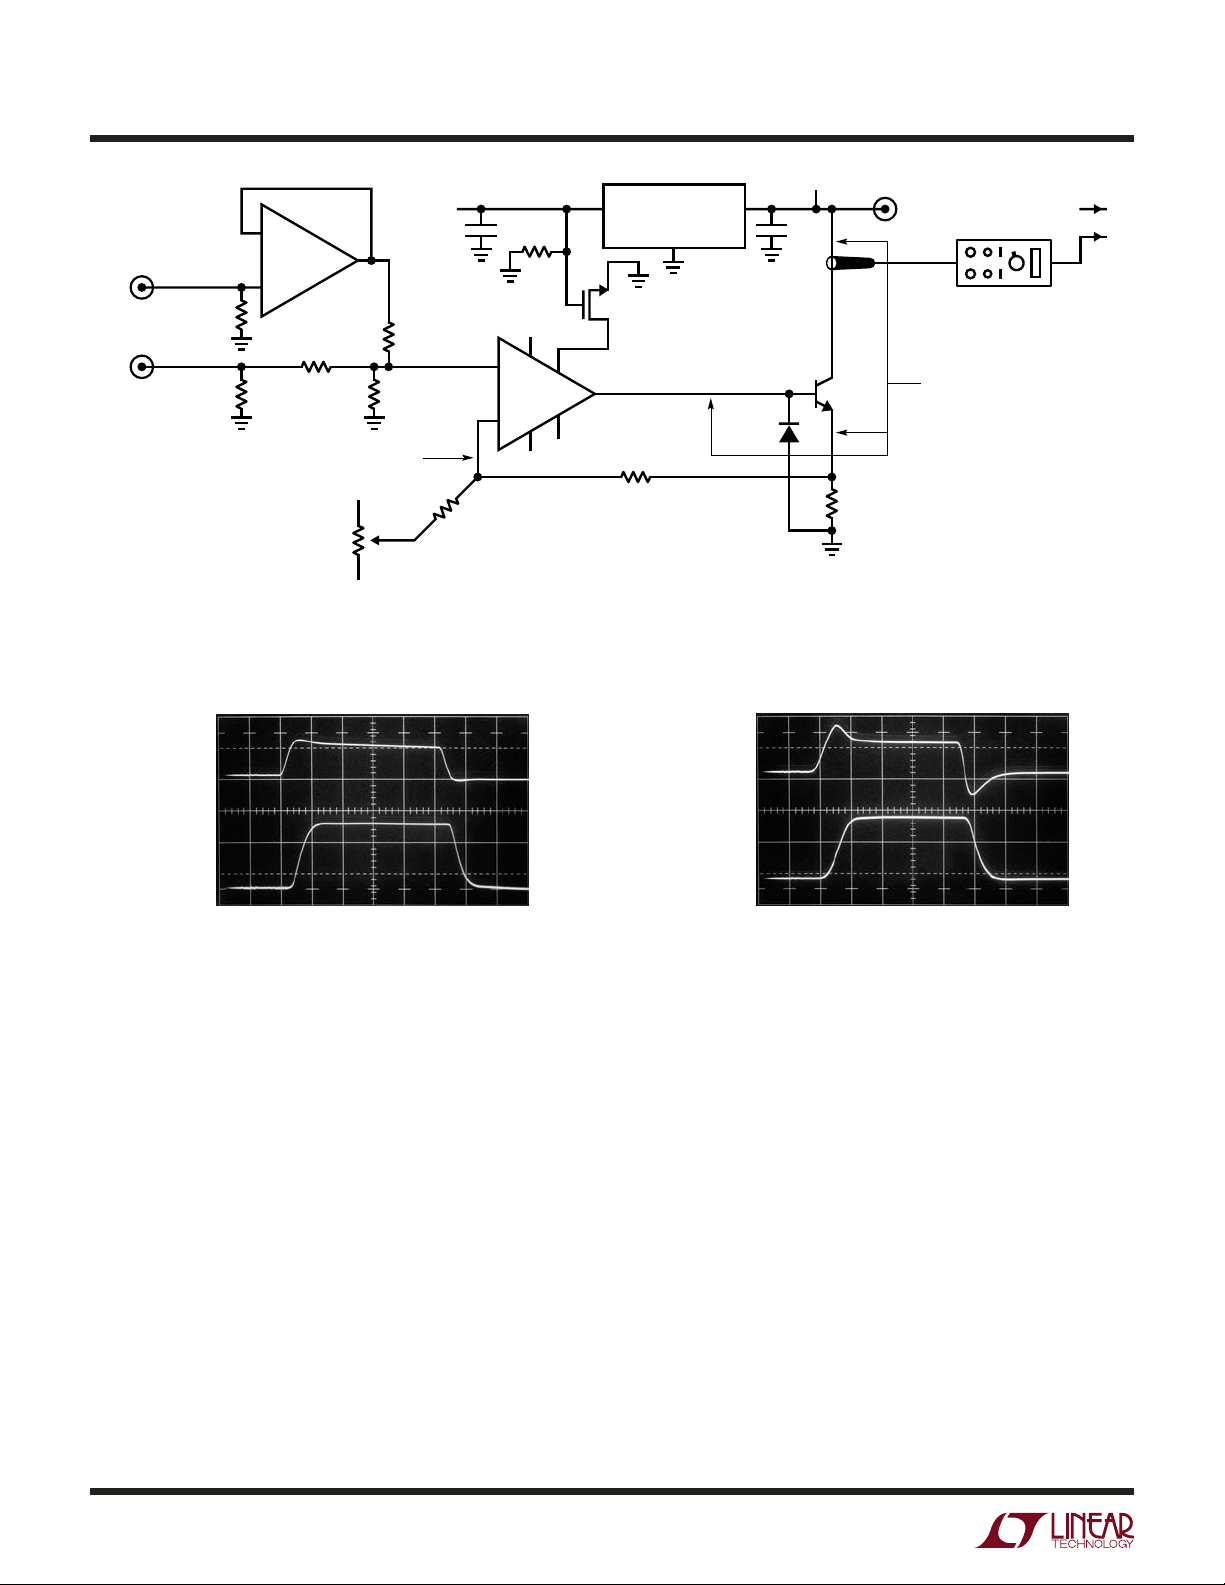
Bipolar Transistor Based Circuit
Figure 8 considerably simplifi es the previous circuit’s loop
dynamics and eliminates all AC trims. The major trade-off
is a 2x speed reduction. The circuit is similar to Figure 6,
except that Q1 is a bipolar transistor. The bipolar’s greatly
reduced input capacitance allows A1 to drive a more benign
load. This permits a lower output current amplifi er and
eliminates the dynamic trims required to accommodate
Figure 6’s FET gate capacitance. The sole trim is the “1mV
adjust” which is accomplished as described before2. Aside
from the 2x speed reduction the bipolar transistor also introduces a 1% output current error due to its base current.
Note 2. This trim may be eliminated at some sacrifi ce in circuit complexity.
See Appendix D, “A Trimless Closed Loop Transient Load Tester”.
Q2 is added to prevent excessive Q1 base current when
the regulator supply is not present. The diode prevents
reverse base bias under any circumstances.
Closed Loop Circuit Performance
Figures 9 and 10 show the two wideband circuits’ operation.
The FET based circuit (Figure 9) only requires a 50mV A1
swing (Trace A) to enforce Trace B’s fl at-topped current
pulse with 50ns edges through Q1. Figure 10 details the
bipolar transistor based circuit’s performance. Trace A,
taken at Q1’s base, rises less than 100mV causing Trace
B’s clean 1A current conduction through Q1. This circuit’s
100ns edges, about 2x slower than the more complex
FET based version, are still fast enough for most practical
transient load testing.
an104f
AN104-3
Application Note 104
+E
REGULATOR
C
OUT
AN104 F08
Q1
D44H2
0.1Ω**
VOLTAGE MONITOR TO
AC-COUPLED OSCILLOSCOPE
TEKTRONIX P-6042 CURRENT
PROBE OR EQUIVALENT
MINIMIZE
INDUCTANCE
= 1% METAL FILM RESISTOR*
= VISHAY WSL2512.5%**
DC BIAS
0 – 10V = 0 – 1A
100k
–
LT1006
+
A2
866Ω*
REGULATOR
INPUT
SUPPLY
8.16k*
C
IN
1M
+15
REGULATOR
IN OUT
UNDER TEST
GND
Q2
VN2222L
+
SD
WAVEFORM INPUT
0 – 1V = 0 – 1A
51Ω
100Ω*
MINIMIZE CAPACITANCE
+15
10k
+1mV
ADJUST
–15
120k
A1
LT1206
–
–15
C
MUR11O
NC
560Ω
Figure 8. Figure 6 Implemented with Bipolar Transistor. Q1’s Reduced Input Capacitance Simplifi es Loop Dynamics, Eliminating
Compensation Components and Trims. Trade Off is 2x Speed Reduction and Base Current Induced 1% Error
CH1
CH2
A = 0.05V/DIV
AC-COUPLED
ON 2.5VDC
B = 0.5A/DIV
AC-COUPLED
ON 0.1ADC
HORIZ = 50ns/DIV
AN104 F09
Figure 9. Figure 6’s Closed Loop Load Tester Step Response
(Q1 Current is Trace B) is Quick and Clean, Showing 50ns Edges
and Flat Top. A1’s Output (Trace A) Swings Only 50mV, Allowing
Wideband Operation. Trace B’s Presentation is Slightly Delayed
Due to Voltage and Current Probe Time Skew
Load Transient Testing
The previously discussed circuits permit rapid and thorough
voltage regulator load transient testing. Figure 11 uses
Figure 6’s circuit to evaluate an LT1963A linear regulator.
Figure 12 shows regulator response (Trace B) to Trace A’s
asymmetrically edged input pulse. The ramped leading
edge, within the LT1963A’s bandwidth, results in Trace
B’s smooth 10mV
excursion. The fast trailing edge,
P-P
well outside LT1963A passband, causes Trace B’s abrupt
disruption. C
output level and a 75mV
cannot supply enough current to maintain
OUT
spike results before the regula-
P-P
tor resumes control. In Figure 13, a 500mA peak-to-peak
500kHz noise load, emulating a multitude of incoherent
A = 0.05V/DIV
AC-COUPLED
ON 0.6VDC
B = 0.5A/DIV
AC-COUPLED
ON 0.1ADC
HORIZ = 100ns/DIV
AN104 F10
Figure 10. Figure 8’s Bipolar Output Load Tester Response is
2x Slower than FET Version, but Circuit is Less Complex and
Eliminates Compensation Trims. Trace A is A1’s Output, Trace B
is Q1’s Collector Current
loads, feeds the regulator in Trace A. This is within regulator bandwidth and only 6mV
of disturbance appears
P-P
in Trace B, the regulator output. Figure 14 maintains the
same conditions, except that noise bandwidth is increased
to 5MHz. Regulator bandwidth is exceeded, resulting in
over 50mV
error, an 8x increase.
P-P
Figure 15 shows what happens when a 0.2A DC biased,
swept DC-5MHz, 0.35A load is presented to the regulator.
The regulator’s rising output impedance versus frequency
results in ascending error as frequency scales. This information allows determination of regulator output impedance
versus frequency.
an104f
AN104-4

DC BIAS
0 – 10V = 0 – 1A
WAVEFORM INPUT
0 – 1V = 0 – 1A
–
A2
LT1006
+
100k
866Ω*
51Ω
MINIMIZE CAPACITANCE
+5V
8.16k*
100Ω*
10µF
+
A1
LT1210
–
+15
–15
LT1963A
IN
3.3V
SD
GND
GATE DRIVE PEAKING
C
0.01µF
OUT
SENSE
100Ω
Application Note 104
3.3V
VOLTAGE MONITOR TO
10µF
Q1
IRLZ24
2.5Ω
10µF
CERAMIC
AC-COUPLED OSCILLOSCOPE
TEKTRONIX P-6042 CURRENT
PROBE OR EQUIVALENT
MINIMIZE
INDUCTANCE
CH1
CH2
+15
10k
–15
+1mV
ADJUST
120k
100Ω
1k LOOP PEAKING
68pF
560Ω 1k
FEEDBACK
AN104 F11
0.1Ω**
= FAIR-RITE
#2743001112
= 1% METAL FILM RESISTOR*
= VISHAY WSL2512.5%**
Figure 11. Closed Loop Load Tester Shown with LT1963A Regulator. Load Testing for a Variety of Current Load Waveshapes is Possible
A = 0.5A/DIV
AC-COUPLED
ON 0.3ADC
LEVEL
B = 0.02V/DIV
AC-COUPLED
ON 3.3VDC
HORIZ = 10µs/DIV
AN104 F12
Figure 12. Figure 11 Responds (Trace B) to Assymetrically Edged
Pulse Input (Trace A). Ramped Leading Edge, Within LT1963A
Bandwidth, Results in Trace B’s Smooth 10mV
Excursion. Fast
P-P
A = 0.5A/DIV
ON 0.1ADC
LEVEL
B = 0.02V/DIV
AC-COUPLED
ON 3.3VDC
AN104 F13
Figure 13. 500mA
HORIZ = 2ms/DIV
, 500kHz Noise Load (Trace A), Within
P-P
Regulator Bandpass, Produces Only 6mV Artifacts at Trace B’s
Regulator Output
Trailing Edge, Outside LT1963A Bandwidth, Causes Trace B’s
Abrupt 75mV
Disruption. Traces Latter Portion Intensifi ed for
P-P
Photographic Clarity
A = 0.5A/DIV
ON 0.1ADC
LEVEL
B = 0.02V/DIV
AC-COUPLED
ON 3.3VDC
HORIZ = 2ms/DIV
AN104 F14
Figure 14. Same Conditions as Figure 13, Except Noise
Bandwidth Increased to 5MHz. Regulator Bandwidth is
Exceeded, Resulting in 50mV
Output Error
P-P
A = 0.02V/DIV
AC-COUPLED
ON 3.3VDC
HORIZ = 500KHz/DIV
AN104 F15
Figure 15. Swept DC – 5MHz, 0.35A Load (On 0.2ADC) Results in
Above Regulator Response. Regulator Output Impedance Rises
with Frequency, Causing Corresponding Ascending Output Error
an104f
AN104-5

Application Note 104
Capacitor’s Role in Regulator Response
The regulator employs capacitors at its input (C
output (C
) to augment its high frequency response. The
OUT
) and
IN
capacitor’s dielectric, value and location greatly infl uence
regulator characteristics and must be quite carefully consid-
3
C
ered.
is much less critical, so long as it does not discharge
C
IN
dominates the regulator’s dynamic response;
OUT
below the regulator’s dropout point. Figure 16 shows a
typical regulator circuit and emphasizes C
and its para-
OUT
sitics. Parasitic inductance and resistance limit capacitor
effectiveness at frequency. The capacitor’s dielectric and
value signifi cantly infl uence load step response. A “hidden”
parasitic, impedance build-up in regulator output trace
runs, also infl uences regulation characteristics, although
its effects can be minimized by remote sensing (shown)
and distributed capacitive bypassing.
Figure 17 shows Figure 16’s circuit responding (Trace
B) to a 0.5A load step biased on 0.1A DC (Trace A) with
L
+5V 3.3V
+
C
IN
10µF
LT1963A
IN
3.3V
SD
GND
R
OUT
SENSE
TRACE
TRACE
L
P
= C
C
IN
= 10µF. The low loss capacitors employed result
OUT
in Trace B’s well controlled output. Figure 18 greatly expands
the horizontal time scale to investigate high frequency behavior. Regulator output deviation (Trace B) is smooth, with
no abrupt discontinuities. Figure 19 runs the same test as
Figure 17 using an output capacitor claimed as “equivalent”
to the one employed in Figure 17. At 10µs/division things
seem very similar, but Figure 20 indicates problems. This
photo, taken at the same higher sweep speed as Figure 18,
reveals the “equivalent” capacitor to have a 2x amplitude
error versus Figure 18, higher frequency content and
A = 0.5A/DIV
AC-COUPLED
ON 0.1ADC
B = 0.1V/DIV
AC-COUPLED
ON 3.3VDC
HORIZ = 100ns/DIV
Figure 18. Expanding Horizontal Scale Shows Trace B’s
Smooth Regulator Output Response. Mismatched Current
and Voltage Probe Delays Account for Slight Time Skewing
AN104 F18
C
OUT
(WITH PARASITICS)
R
P
AN104 F16
Figure 16. C
C
is Much Less Critical. Parasitic Inductance and Resistance
IN
Dominates Regulator’s Dynamic Response;
OUT
Limit Capacitor Effectiveness at Frequency. Capacitor Value and
Dielectric Signifi cantly Infl uence Load Step Response. Excessive
Trace Impedance is Also a Factor
A = 0.5A/DIV
AC-COUPLED
ON 0.1ADC
B = 0.1V/DIV
AC-COUPLED
ON 3.3VDC
HORIZ = 10µs/DIV
AN104 F17
Figure 17. Stepped 0.5A Load to Figure 16’s Circuit (Trace A)
= C
with C
IN
= 10µF Results in Trace B’s Regulator Output.
OUT
Low Loss Capacitors Promote Controlled Output Excursions
Note 3. See Appendices A and B for extended discussion of these
concerns.
A = 0.5A/DIV
AC-COUPLED
ON 0.1ADC
B = 0.1V/DIV
AC-COUPLED
ON 3.3VDC
HORIZ = 10µs/DIV
Figure 19. “Equivalent” 10µF C
Capacitor’s Performance
OUT
AN104 F19
Appears Similar to Figure 17’s Type at 10µs/DIV
A = 0.5A/DIV
AC-COUPLED
ON 0.1ADC
B = 0.1V/DIV
AC-COUPLED
ON 3.3VDC
HORIZ = 100ns/DIV
AN104 F20
Figure 20. Horizontal Scale Expansion Reveals “Equivalent”
Capacitor Produces 2x Amplitude Error vs Figure 18.
Mismatched Probe Delays Cause Time Skewing Between Traces
an104f
AN104-6

Application Note 104
resonances.4 Figure 21 substitutes a very lossy 10µF unit
for C
. This capacitor allows a 400mV excursion (note
OUT
Trace B’s vertical scale change), >4x Figure 18’s amount.
Conversely, Figure 22 increases C
to a low loss 33µF
OUT
type, decreasing Trace B’s output response transient by
40% versus Figure 18. Figure 23’s further increase, to a
low loss 330µF capacitor, keeps transients inside 20mV;
4x lower than Figure 18’s 10µF value.
A = 0.5A/DIV
AC-COUPLED
ON 0.1ADC
B = 0.2V/DIV
AC-COUPLED
ON 3.3VDC
HORIZ = 100ns/DIV
Figure 21. Excessively Lossy 10µF C
Allows 400mV Excursion
OUT
– 4x Figure 18’s Amount. Time Skewing Between Traces Derives
from Probe Mismatch
AN104 F21
The lesson from the preceding study is clear. Capacitor
value and dielectric quality have a pronounced effect on
transient load response. Try before specifying!
Load Transient Risetime versus Regulator Response
The closed loop load transient generator also allows investigating load transient risetime on regulation at high
speed. Figure 24 shows Figure 16’s circuit (C
IN
= C
OUT
= 10µF) responding to a 0.5A, 100ns risetime step on a
0.1A DC load (Trace A). Response decay (Trace B) peaks
at 75mV with some following aberrations. Decreasing
Trace A’s load step risetime (Figure 25) almost doubles
Trace B’s response error, with attendant enlarged following aberrations. This indicates increased regulator error
at higher frequency.
All regulators present increasing error with frequency, some
more so than others. A slow load transient can unfairly
make a poor regulator look good. Transient load testing
that does not indicate some response outside regulator
bandwidth is suspect.
A = 0.5A/DIV
AC-COUPLED
ON 0.1ADC
B = 0.1V/DIV
AC-COUPLED
ON 3.3VDC
AN104 F22
Figure 22. Increasing C
HORIZ = 10µs/DIV
with Low Loss 33µF Unit Reduces
OUT
Output Response Transient by 40% Over Figure 17
A = 0.5A/DIV
AC-COUPLED
ON 0.1ADC
B = 0.1V/DIV
AC-COUPLED
ON 3.3VDC
HORIZ = 10µs/DIV
AN104 F23
Figure 23. Low Loss 330µF Capacitor Keeps Output Response
Transients Inside 20mV – 4x Lower than Figure 17’s 10µF
A = 0.2A/DIV
AC-COUPLED
ON 0.1ADC
B = 0.05V/DIV
AC-COUPLED
ON 3.3VDC
HORIZ = 100ns/DIV
AN104 F24
Figure 24. Regulator Output Response (Trace B) to 100ns.
Risetime Current Step (Trace A) for C
= 10µF. Response
OUT
Decay Peaks at 75mV
A = 0.2A/DIV
AC-COUPLED
ON 0.1ADC
B = 0.05V/DIV
AC-COUPLED
ON 3.3VDC
HORIZ = 100ns/DIV
AN104 F25
Figure 25. Faster Risetime Current Step (Trace A) Increases
Response Decay Peak (Trace B) to 140mV, Indicating Increased
Regulation Loss vs Frequency
Note 4. Always specifi y components according to observed performance,
never to salesman’s claims.
an104f
AN104-7

Application Note 104
A Practical Example – Intel P30 Embedded Memory
Voltage Regulator
A good example of the importance of voltage regulator load
step performance is furnished by the Intel P30 embedded
memory. This memory requires a 1.8V supply, typically
regulated down from +3V. Although current requirements
are relatively modest, supply tolerances are tight. Figure
26’s error budget shows only 0.1V allowable excursion from
1.8V, including all DC and dynamic errors. The LTC1844-1.8
regulator has a 1.75% initial tolerance (31.5mV), leaving
only a 68.5mV dynamic error allowance. Figure 27 is
the test circuit. Memory control line movement causes
50mA load transients, necessitating attention to capacitor
5
selection.
is optional. If not, use a good grade 1µF capacitor
C
IN
for C
If the regulator is close to the power source
. C
IN
is a low loss 1µF type. In all other respects
OUT
the circuit appears deceptively routine. A load transient
generator provides Figure 28’s output load test step
Intel P30 Embedded Memory Voltage Regulator Error Budget
PARAMETER LIMITS
Intel Specifi ed Supply Limits 1.8V ± 0.1V
LTC1844 Regulator Initial Accuracy ±1.75% (±31.5mV)
Dynamic Error Allowance ±68.5mV
Figure 26. Error Budget for Intel P30 Embedded Memory Voltage
Regulator. 1.8V Supply Must Remain Within ±0.1V Tolerance,
Including All Static and Dynamic Errors
6
(Trace A).
peaks, >2x better than required. Increasing C
Trace B’s regulator response shows just 30mV
to 10µF,
OUT
in Figure 29, reduces peak output error to 12mV, almost
6x better than specifi cation. However, a poor grade 10µF
(or 1µF, for that matter) capacitor produces Figure 30’s
unwelcome surprise. Severe peaking error on both edges
occurs (Trace B’s latter portion has been intensifi ed to aid
photograph clarity) with 100mV observable on the negative going edge. This is well outside the error budget and
would cause unreliable memory operation.
A = 50mA/DIV
AC-COUPLED
ON 1mADC
B = 0.05V/DIV
AC-COUPLED
ON 1.8VDC
HORIZ = 50µs/DIV
Figure 28. 50mA Load Step (Trace A) Results in 30mV Regulator
Response Peaks, 2x Better than Error Budget Requirements.
C
= Low Loss 1µF
OUT
A = 50mA/DIV
AC-COUPLED
ON 1mADC
B = 0.05V/DIV
AC-COUPLED
ON 1.8VDC
AN104 F28
+3V
INTEL P30
LTC1844
IN
1.8V
SD
GND
OPTIONAL
INPUT
CAPACITOR
(SEE TEXT)
OUT
BYP
1.8V ± 0.1V
C
OUT
(SEE TEXT)
OPTIONAL
NOISE REDUCTION
CAPACITOR
(SEE TEXT)
V
CCQ
V
CC
EMBEDDED
MEMORY
OE
CE
AN104 F27
CONTROL
LINES
Figure 27. P30 Embedded Memory VCC Regulator Must Maintain
±0.1V Error Band. Control Line Movement Causes 50mA Load
Steps, Necessitating Attention to C
Note 5. The LTC1844-1.8’s noise bypass pin (“BYP”) is used with an
optional external capacitor to achieve extremely low output noise. It is not
required for this application and is left unconnected.
Selection
OUT
AN104-8
AN104 F29
Figure 29. Increasing C
HORIZ = 50µs/DIV
to 10µF Decreases Regulator Output
OUT
Peaks to 12mV, Almost 6x Better than Required
A = 50mA/DIV
AC-COUPLED
ON 1mADC
B = 0.05V/DIV
AC-COUPLED
ON 1.8VDC
AN104 F30
Figure 30. Poor Grade 10µF C
HORIZ = 50µs/DIV
Causes 100mV Regulator
OUT
Output Peaks (Trace B), Violating P30 Memory Limits. Traces
Latter Portion Intensifi ed for Photographic Clarity
Note 6.
Figure 8’s circuit was used for this test, with Q1’s emitter current
shunt changed to 1Ω.
an104f

REFERENCES
Application Note 104
1. LT1584/LT1585/LT1587 Fast Response Regulators
Datasheet. Linear Technology Corporation.
2. LT1963A Regulator Datasheet. Linear Technology
Corporation.
3. Williams, Jim, “Minimizing Switching Residue in Linear
APPENDIX A
Capacitor Parasitic Effects on Load Transient Response
Tony Bonte
Large load current changes are typical of digital systems.
The load current step contains higher order frequency
components that the output decoupling network must
handle until the regulator throttles to the load current
level. Capacitors are not ideal elements and contain parasitic resistance and inductance. These parasitic elements
dominate the change in output voltage at the beginning
of a transient load step change. The ESR (equivalent
series resistance) of the output capacitors produces an
instantaneous step in output voltage.(ΔV = ΔI • ESR). The
ESL (equivalent series inductance) of the output capacitors produces a droop proportional to the rate of change
of output current (V = L • ΔI/Δt). The output capacitance
produces a change in output voltage proportional to the
Regulator Outputs”. Linear Technology Corporation, Application Note 101, July 2005
4. Shakespeare, William, “The Taming of the Shrew,”
1593–94.
Note. This application note was derived from a manuscript originally
prepared for publication in EDN magazine.
time until the regulator can respond (ΔV = Δt • ΔI/C). These
transient effects are illustrated in Figure A1.
The use of capacitors with low ESR, low ESL, and good
high frequency characteristics is critical in meeting the
output load voltage tolerances. These requirements dictate
high quality, surface mount tantalum, ceramic or organic
electrolyte capacitors. The capacitor’s location is critical
to transient response performance. Place the capacitor as
close as possible to the regulator pins and keep supply line
traces and planes at low impedance, bypassing individual
loads as necessary. If the regulator has remote sensing
capability, consider sensing at the heaviest load point.
Strictly speaking, the above are not the only time related
terms that can infl uence regulator settling. Figure A2 lists 7
different terms, occurring over 9 decades of time, that can
potentially infl uence regulation. The regulator IC must be
carefully designed to minimize regulator loop and thermal
error contributions.
ESR
AMPLITUDE
EFFECTS
ESL
EFFECTS
SLOPE, =
CAPACITANCE
EFFECTS
V
∆I
t
POINT AT WHICH REGULATOR
C
TIME
TAKES CONTROL
AN104 FA01
Figure A1. Parasitic Resistance, Inductance and Finite Capacitance Combine with Regulator Gain-Bandwidth Limitations to Form Load
Step Response. Capacitors Equivalent Series Resistance (ESR) and Inductance (ESL) Dominate Initial Response; Capacitor Value and
Regulator Gain-Bandwidth Determine Responses Latter Profi le
10ns
100ns 1µs 10µs 1000µs 20ms 200ms 20s
CAPACITOR BULK
(DISTRIBUTED)
CAPACITANCE
BULK
CAPACITOR
RESISTANCE
REGULATOR
LOOP
THERMAL
REGULATION
(IC DIE)
IC PACKAGE
(THERMAL)
PACKAGE
AND
HEAT SINK
AN104 FA02
Figure A2. Time Constants Potentially Infl uencing Regulator Settling Time After a Load Step are Electrical and Thermal. Effects Span
Over 9 Decades
an104f
AN104-9

Application Note 104
APPENDIX B
Output Capacitors and Loop Stability
Dennis O’Neill
Editorial Note: The following text, excerpted from the
LT1963A datasheet, concerns the output capacitor’s relationship to transient response. Although originally prepared
for LT1963A application, it is generalizable to most regulators and is presented here for reader convenience.
A voltage regulator is a feedback circuit. Like any feedback
circuit, frequency compensation is needed to make it
stable. For the LT1963A, the frequency compensation is
both internal and external – the output capacitor. The size
of the output capacitor, the type of the output capacitor,
and the ESR of the particular output capacitor all affect
the stability.
In addition to stability, the output capacitor also affects
the high frequency transient response. The regulator loop
has fi nite bandwidth. For high frequency transient loads
recovery from a transient is a combination of the output
capacitor and the bandwidth of the regulator. The LT1963A
was designed to be easy to use and accept a wide variety of
output capacitors. However, the frequency compensation
is affected by the output capacitor and optimum frequency
stability may require some ESR, especially with ceramic
capacitors.
For ease of use, low ESR polytantalum capacitors (POSCAP)
are a good choice for both the transient response and
stability of the regulator. These capacitors have intrinsic
ESR that improves the stability. Ceramic capacitors have
extremely low ESR, and while they are a good choice in
many cases, placing a small series resistance element
will sometimes achieve optimum stability and minimize
ringing. In all cases, a minimum of 10µF is required while
the maximum ESR allowable is 3Ω.
The place where ESR is most helpful with ceramics is low
output voltage. At low output voltages, below 2.5V, some
ESR helps the stability when ceramic output capacitors
are used. Also, some ESR allows a smaller capacitor
value to be used. When small signal ringing occurs with
ceramics due to insuffi cient ESR, adding ESR or increasing the capacitor value improves the stability and reduces
the ringing. Figure B1 gives some recommended values
V
OUT
1.2V 20mΩ 15mΩ 10mΩ 5mΩ
1.5V 20mΩ 15mΩ 10mΩ 5mΩ
1.8V 15mΩ 10mΩ 10mΩ 5mΩ
2.5V 5mΩ 5mΩ 5mΩ 5mΩ
3.3V 0mΩ 0mΩ 0mΩ 5mΩ
≥ 5V 0mΩ 0mΩ 0mΩ 0mΩ
10µF 22µF 47µF 100µF
Figure B1. Capacitor Minimum ESR
of ESR to minimize ringing caused by fast, hard current
transitions.
Figures B2 through B7 show the effect of ESR on the
transient response of the regulator. These scope photos
show the transient response for the LT1963A at three different output voltages with various capacitors and various
values of ESR. The output load conditions are the same
for all traces. In all cases there is a DC load of 500mA.
The load steps up to 1A at the fi rst transition and steps
back to 500mA at the second transition.
At the worst case point of 1.2V
with 10µF C
OUT
OUT
(Figure B2), a minimum amount of ESR is required. While
20mΩ is enough to eliminate most of the ringing, a value
closer to 50mΩ provides a more optimum response. At
2.5V output with 10µF C
(Figure B3) the output rings
OUT
at the transitions with 0Ω ESR but still settles to within
10mV in 20µs after the 0.5A load step. Once again a small
value of ESR will provide a more optimum response.
At 5V
with 10µF C
OUT
(Figure B4) the response is well
OUT
damped with 0Ω ESR.
With a C
of 100µF at 0Ω ESR and an output of 1.2V
OUT
(Figure B5), the output rings although the amplitude is
only 20mV
. With C
P-P
of 100µF it takes only 5mΩ to
OUT
20mΩ of ESR to provide good damping at 1.2V output.
Performance at 2.5V and 5V output with 100µF C
OUT
shows
similar characteristics to the 10µF case (see Figures B6
to B7). At 2.5V
response. At 5V
5mΩ to 20mΩ can improve transient
OUT
the response is well damped with
OUT
0Ω ESR.
Capacitor types with inherently higher ESR can be combined
with 0mΩ ESR ceramic capacitors to achieve both good
high frequency bypassing and fast settling time. Figure
B8 illustrates the improvement in transient response that
can be seen when a parallel combination of ceramic and
an104f
AN104-10

(mΩ)
R
ESR
Application Note 104
V
= 1.2V
OUT
= 500mA WITH
I
0
20
OUT
= 10µF
C
OUT
50mV/DIV
500mA PULSE
0
20
(mΩ)
ESR
50
50
R
V
= 2.5V
OUT
= 500mA WITH
I
OUT
= 10µF
C
OUT
50mV/DIV
500mA PULSE
(mΩ)
ESR
R
(mΩ)
R
100
ESR
100
10
100
20µs/DIV
Figure B2
0
20
AN104 FB02
V
OUT
= 500mA WITH
I
OUT
C
OUT
50mV/DIV
= 5V
500mA PULSE
= 10µF
20µs/DIV
Figure B3
0
5
AN104 FB03
V
OUT
= 500mA WITH
I
OUT
C
OUT
50mV/DIV
= 1.2V
500mA PULSE
= 100µF
(mΩ)
50
R
ESR
10
20
20µs/DIV
AN104 FB04
50µs/DIV
AN104 FB05
Figure B5Figure B4
V
= 2.5V
OUT
= 500mA WITH
I
0
5
OUT
C
OUT
50mV/DIV
500mA PULSE
= 100µF
0
5
(mΩ)
ESR
10
R
V
OUT
= 500mA WITH
I
OUT
C
OUT
50mV/DIV
= 5V
500mA PULSE
= 100µF
20
50µs/DIV
AN104 FB06
Figure B6
A
B
(mΩ)
ESR
R
20
50µs/DIV
AN104 FB07
Figure B7
V
= 1.2V
OUT
= 500mA WITH 500mA PULSE
I
OUT
=
C
OUT
A = 10µF CERAMIC
B = 10µF CERAMIC II 22µF/45mΩ POLY
50mV/DIV
C = 10µF CERAMIC II 100µF/35mΩ POLY
C
50µs/DIV
AN104 FB08
Figure B8
an104f
AN104-11

Application Note 104
POSCAP capacitors are used. The output voltage is at the
worst case value of 1.2V. Trace A with a 10µF ceramic output
capacitor, shows signifi cant ringing with a peak amplitude
of 25mV. For Trace B, a 22µF/45mΩ POSCAP is added in
parallel with the 10µF ceramic. The output is well damped
and settles to within 10mV in less than 20µs.
For Trace C, a 100µF/35mΩ POSCAP is connected in
parallel with the 10µF ceramic capacitor. In this case the
peak output deviation is less than 20mV and the output
settles in about 10µs. For improved transient response
the value of the bulk capacitor (tantalum or aluminum
electrolytic) should be greater than twice the value of the
ceramic capacitor.
Tantalum and Polytantalum Capacitors
There is a variety of tantalum capacitor types available,
with a wide range of ESR specifi cations. Older types have
ESR specifi cations in the hundreds of mΩ to several Ohms.
Some newer types of polytantalum with multi-electrodes
have maximum ESR specifi cations as low as 5mΩ. In general the lower the ESR specifi cation, the larger the size and
the higher the price. Polytantalum capacitors have better
surge capability than older types and generally lower ESR.
Some types such as the Sanyo TPE and TPB series have
ESR specifi cations in the 20mΩ to 50mΩ range, which
provide near optimum transient response.
dielectrics are good for providing high capacitances in a
small package, but exhibit strong voltage and temperature
coeffi cients as shown in Figures B9 and B10. When used
with a 5V regulator, a 10µF Y5V capacitor can exhibit an
effective value as low as 1µF to 2µF over the operating
temperature range. The X5R and X7R dielectrics result in
more stable characteristics and are more suitable for use
as the output capacitor. The X7R type has better stability
across temperature, while the X5R is less expensive and
is available in higher values.
20
0
–20
–40
–60
CHANGE IN VALUE (%)
–80
–100
0
Figure B9. Ceramic Capacitor DC Bias Characteristics
40
BOTH CAPACITORS ARE 16V,
1210 CASE SIZE, 10µF
X5R
Y5V
26
4
8
DC BIAS VOLTAGE (V)
14
12
10
16
AN104 FB09
Aluminum Electrolytic Capacitors
Aluminum electrolytic capacitors can also be used with the
LT1963A. These capacitors can also be used in conjunction
with ceramic capacitors. These tend to be the cheapest and
lowest performance type of capacitors. Care must be used
in selecting these capacitors as some types can have ESR
which can easily exceed the 3Ω maximum value.
Ceramic Capacitors
Extra consideration must be given to the use of ceramic
capacitors. Ceramic capacitors are manufactured with a
variety of dielectrics, each with different behavior over
temperature and applied voltage. The most common dielectrics used are Z5U, Y5V, X5R and X7R. The Z5U and Y5V
20
0
–20
–40
–60
CHANGE IN VALUE (%)
–80
BOTH CAPACITORS ARE 16V,
1210 CASE SIZE, 10µF
–100
–50
–25 0
25 75
TEMPERATURE (°C)
X5R
Y5V
50 100 125
AN104 FB10
Figure B10. Ceramic Capacitor Temperature Characteristics
an104f
AN104-12

Application Note 104
Voltage and temperature coeffi cients are not the only
sources of problems. Some ceramic capacitors have a
piezoelectric response. A piezoelectric device generates
voltage across its terminals due to mechanical stress, similar to the way a piezoelectric accelerometer or microphone
works. For a ceramic capacitor the stress can be induced
by vibrations in the system or thermal transients.
“FREE” Resistance with PC Traces
The resistance values shown in Figure B11 can easily be
made using a small section of PC trace in series with the
output capacitor. The wide range of non-critical ESR makes
it easy to use PC trace. The trace width should be sized to
handle the RMS ripple current associated with the load. The
output capacitor only sources or sinks current for a few
microseconds during fast output current transitions. There
10mΩ 20mΩ 30mΩ
Width
0.5oz C
U
Length
1.0oz CU Width
Length
2.0oz CU Width
Length
0.011" (0.28mm)
0.102" (2.6mm)
0.006" (0.15mm)
0.110" (2.8mm)
0.006" (0.15mm)
0.224" (5.7mm)
is no DC current in the output capacitor. Worst case ripple
current will occur if the output load is a high frequency
(>100kHz) square wave with a high peak value and fast
edges (<1µs). Measured RMS value for this case is 0.5
times the peak-to-peak current change. Slower edges or
lower frequency will signifi cantly reduce the RMS ripple
current in the capacitor.
This resistor should be made using one of the inner layers of the PC board which are well defi ned. The resistivity
is determined primarily by the sheet resistance of the
copper laminate with no additional plating steps. Figure
B11 gives some sizes for 0.75A RMS current for various
copper thicknesses. More detailed information regarding
resistors made from PC traces can be found in Application
Note 69, Appendix A.
0.011" (0.28mm)
0.204" (5.2mm)
0.006" (0.15mm)
0.220" (5.6mm)
0.006" (0.15mm)
0.450" (11.4mm)
0.011" (0.28mm)
0.307" (7.8mm)
0.006" (0.15mm)
0.330" (8.4mm)
0.006" (0.15mm)
0.670" (17mm)
Figure B11. PC Trace Resistors
an104f
AN104-13

Application Note 104
APPENDIX C
Probing Considerations for Load Transient Response
Measurements
Signals of interest in load transient response studies occur
within a bandwidth of about 25MHz (t
= 14ns) This
RISE
is a modest speed range but probing technique requires
some care for high fi delity measurement. Load current is
measured with a DC stabilized (Hall Effect based) “clip on”
current probe such as the Tektronix P-6042 or AM503. The
conductor loop placed in the probe jaws should encompass the smallest possible area to minimize introduced
parasitic inductance, which can degrade measurement.
At higher speeds, grounding the probe case may slightly
decrease measurement aberrations, but this is usually a
small effect.
Voltage measurement, typically AC-coupled and in the
10mV to 250mV range, is best accomplished with Figure
C1’s arrangement. The measured voltage is fed to a BNC
fi xtured 50Ω back terminated cable, which drives the oscilloscope via a DC blocking capacitor and a 50Ω termination.
The back termination is strict practice, enforcing a true
50Ω signal path. Practically, if its ÷2 attenuation presents
problems, it can usually be eliminated with only minor
signal degradation in the 25MHz measurement passband.
The termination at the oscilloscope end is not negotiable.
Figure C2 shows a typical observed load transient with
no back termination but 50Ω at the oscilloscope. The
presentation is clean and well defi ned. In C3, the cable’s
50Ω termination is removed, causing a distorted leading edge,ill-defi ned peaking and pronounced post-event
ringing. Even at relatively modest frequencies the cable
displays unterminated transmission line characteristics,
resulting in signal distortion.
In theory, a 1x scope probe using a probe-tip coaxial
connection could replace the above but such probes
usually have bandwidth limitations of 10MHz to 20MHz.
Conversely, a 10x probe is wideband, but oscilloscope
vertical sensitivity must accommodate the introduced
attenuation.
BNC CONNECTION
TO BOARD
C
IN
REGULATOR
UNDER TEST
TO LOAD
TRANSIENT
GENERATOR
C
OUT
V
IN
50Ω COAXIAL IN-LINE
BACK TERMINATION
(OPTIONAL, SEE TEXT)
50Ω COAXIAL LINE
10µF COAXIAL
COUPLING
CAPACITOR*
50Ω IN-LINE
TERMINATION
OSCILLOSCOPE
AN104 FC01
* = VISHAY #430P IN BNC
FIXTURED ENCLOSURE
Figure C1. Coaxial Load Transient Voltage Measurement Path Promotes Observed Signal Fidelity. 50Ω Back Termination May Be
Removed with Minimal Impact on 25MHz Signal Path Integrity. 50Ω Termination at Oscilloscope Cannot Be Deleted
VERT = 0.05V/DIV
AC-COUPLED
HORIZ = 200ns/DIV
AN104 FC02
Figure C2. Typical High Speed Transient Observed Through
Figure C1’s Measurement Path. Presentation is Clean and Well
Defi ned
VERT = 0.05V/DIV
AC-COUPLED
HORIZ = 200ns/DIV
AN104 FC03
Figure C3. Figure C2’s Transient Measured with 50Ω
Oscilloscope Termination Removed. Waveform Distortion and
Post-Event Ringing Result
AN104-14
an104f

APPENDIX D
Application Note 104
A Trimless Closed Loop Transient Load Tester
Text Figure 8’s circuit is attractive because it eliminates the
FET based design’s AC trims. It does, however, retain the
DC trim. Figure D1 trades circuit complexity to eliminate
the DC trim. Operation is similar to text Figure 8’s circuit
except that A2 appears. This amplifi er replaces the DC
trim by measuring the circuits DC input, comparing it to
Q1’s emitter DC level and controlling A1’s positive input
909Ω*
DC BIAS
0 – 1A
10Ω
WAVEFORM INPUT
0 – 1V = 0 – 1A
909Ω*
+15
1k
100Ω*
51Ω
10k
1µF
10k*13k
+
A2
LT1001
–
100Ω*
to stabilize the circuit. High frequency signals are fi ltered
at A1’s inputs and do not corrupt A1’s stabilizing action.
A useful way to consider circuit operation is that A2 will
balance its inputs, and hence the circuit’s input and output, regardless of A1’s DC input errors. DC current bias
is set to any desired point by a variable reference source
directed to A2’s positive input. This network’s resistors are
arranged for a minimum load current of 10mA, avoiding
loop disruption for currents near zero.
Q2
VN2222L
REGULATOR
+15
+
A1
LT1210
–
–15
SD
560Ω
INPUT SUPPLY
1M
MUR11O
V
REG
Q1
D44H2
0.1Ω**
= 5% MYLAR1µF
= 1% METAL FILM RESISTOR*
= VISHAY WSL2512.5%**
AN104 FD01
1µF
10k
0.01µF
10k*
Figure D1. A2 Feedback Controls A1’s DC Errors, Eliminating Text Figure 8’s Trim. Filtering Restricts A2’s Response to DC and
Low Frequency
Information furnished by Linear Technology Corporation is believed to be accurate and reliable.
However, no responsibility is assumed for its use. Linear Technology Corporation makes no representation that the interconnection of its circuits as described herein will not infringe on existing patent rights.
an104f
AN104-15

Application Note 104
AN104-16
Linear Technology Corporation
1630 McCarthy Blvd., Milpitas, CA 95035-7417
(408) 432-1900 ● FAX: (408) 434-0507
●
www.linear.com
an104f
LT 1006 • PRINTED IN USA
© LINEAR TECHNOLOGY CORPORATION 2006
 Loading...