

Lilliput Owon XDS2000 Series User Manual

XDS2000 Dual-Channel Series
Digital Storage Oscilloscopes
User Manual
www.owon.com.cn

Apr. 2018 edition V1.0.0
Copyright © LILLIPUT Company. All rights reserved.
The LILLIPUT's products are under the protection of the patent rights, including ones which have
already obtained the patent rights and those which are applied for. The information in this manual will
replace all materials published.
The information in this manual was correct at the time of printing. However, LILLIPUT will continue
to improve products and reserves the rights to change specification at any time without notice.
is the registered trademark of the LILLIPUT Company.
Fujian LILLIPUT Optoele ctr onics Technology Co., Ltd.
No. 19, Heming Road
Lantian Industrial Zone, Zhangzhou 363005 P.R. China
Tel: +86-596-2130430 Fax: +86-596-2109272
Web:
www.owon.com.cn E-mail: info@owon.com.cn

General W arranty
OWON warrants that the product will be free from defects in materials an d workmanshi p
for a period of 3 years from the date of purchase of the product by the original purchaser
from the OWON Company. The warranty period for accessories such as probes is 12
months. This warranty only applies to the original purchaser and is not transfe rable to a
third party.
If the product proves defective during the warranty period, OWON will either repair t he
defective product without charge for parts and labour, or will provide a replacement in
exchange for the defective product. Parts, modules and replacement products used by
OWON for warranty work may be new or reconditioned like new. All replaced parts,
modules and products become the property of OWON.
In order to obtain service under this warranty, the customer must notify OWON of the
defect before the expiration of the warranty period. Customer shall be responsible for
packaging and shipping the defective product to OWON's designated service centre, a
copy of the customers proof of purchase is also required.
This warranty shall not apply to any defect, failure or damage caused by improper use or
improper or inadequate maintenance and care. OWON shall not be obligated to furnish
service under this warran t y a) to repai r dam age r esul tin g from attem pts by perso nnel other
than OWON representatives to install, repair or service the product; b) to repair dam age
resulting from improper use or connection to incompatible equipment; c) to repair any
damage or malfunction caused by the use of non-OWON supplies; or d) to service a
product that has been modified or integrated with other products when the effect of such
modification or integration increases the time or difficulty of servicing the product.
Please contact the near est OWON's Sales and Service Offic es for services or a complet e
copy of the warranty statement.
For better after-sales service, please visit www.owon.com.cn and register the purchased
product online.
Excepting the after-sales services provided in this summary or the applicable warranty
statements, OWON will not offer any guarantee for maintenance definitely declared or hinted,
including but not limited to the implied guarantee for marketability and special-purpose
acceptability. OWON should not take any responsibilities for any indirect, special or consequent
damages.

i
Table of Contents
1. General Safety Requirements .......................................................................................... 1
2. Safety Terms and Symbols ............................................................................................... 2
3. Junior User Guidebook ................................................................................................... 4
Introduction to the Structure of the Oscilloscope ..................................................................... 5
Front Panel ............................................................................................................................................... 5
Front Panel Menu Buttons ........................................................................................................................ 6
Rear Panel ................................................................................................................................................ 6
Control Area ............................................................................................................................................. 7
User Interface Introduction ........................................................................................................ 8
How to Implement the General Inspection ............................................................................. 10
How to Implement the Function Inspection ............................................................................ 10
How to Implement the Probe Compensation .......................................................................... 11
How to Set the Probe Attenuation Coefficient ........................................................................ 12
How to Use the Probe Safely..................................................................................................... 13
How to Implement Self-calibration .......................................................................................... 13
Introduction to the Vertical System ......................................................................................... 14
Introduction to the Horizontal System .................................................................................... 15
Introduction to the Trigger System ......................................................................................... 16
4. Advanced User Guidebook ............................................................................................ 17
How to Set the Vertical System ................................................................................................ 18
Use Mathematical Manipulation Function ............................................................................. 20
Waveform math ...................................................................................................................................... 21
User defined function ............................................................................................................................. 22
Digital Filter ........................................................................................................................................... 22
Using FFT function ................................................................................................................................ 22
Use Vertical Position and Scale Knobs .................................................................................... 25
How to Set the Horizontal System ........................................................................................... 25
Zoom the Waveform .............................................................................................................................. 26
How to Set the Trigger/Decoding System ................................................................................ 26
Single Trigger ......................................................................................................................................... 27
Alternate Trigger (Trigger mode: Edge) ................................................................................................ 35
Logic Trigge r.......................................................................................................................................... 35
Bus Trigger ............................................................................................................................................. 36
Bus Decoding ......................................................................................................................................... 42
How to Operate the Function Menu ........................................................................................ 46
How to Implement Sampling Setup ....................................................................................................... 46
How to Set the Display System .............................................................................................................. 48

ii
How to Save and Recall a Waveform ..................................................................................................... 50
How to Record/Playback Waveforms .................................................................................................... 57
How to Clone a waveform ...................................................................................................................... 61
How to Implement the Auxiliary System Function S etting .................................................................... 63
How to Update your Instrument Firmware............................................................................................. 67
How to Measure Automatically.............................................................................................................. 68
How to Measure with Cursors ................................................................................................................ 72
How to Use Autoscale ............................................................................................................................ 75
How to Use Built-in Help ....................................................................................................................... 77
How to Use E xecutive Button s ............................................................................................................... 77
How to Print the Screen Image ............................................................................................................... 79
5. Communication with PC ............................................................................................... 80
Using USB Port .......................................................................................................................... 80
Using LAN Port ......................................................................................................................... 81
Connect directly ..................................................................................................................................... 81
Connect through a router ........................................................................................................................ 82
6. Demonstration ............................................................................................................... 85
Example 1: Measurement a Simple Signal .............................................................................. 85
Example 2: Gain of a Amplifier in a Metering Circuit .......................................................... 86
Example 3: Capturing a Single Signal ..................................................................................... 87
Example 4: Analyze the Details of a Signal ............................................................................. 88
Example 5: Application of X-Y Function ................................................................................ 90
Example 6: Video Signal Trigger ............................................................................................. 91
7. Tr oubleshooting ............................................................................................................. 93
8. Technical Specifications ................................................................................................ 94
Trigger .................................................................................................................................................... 96
General Technical Specifications ............................................................................................. 98
9. Appendix ........................................................................................................................ 99
Appendix A: Enclosure ............................................................................................................. 99
Appendix B: General Care and Cleaning ............................................................................... 99

1.General Safety Requirements
1
1. General Safety Requirements
Before use, please read the following safety precautions to avoid any possible bodily
injury and to prevent this product or any other connected products from damage. In
order to avoid any contingent danger, ensure this product is only used within the
range specified.
Only the qualified technicians can implement the maintenance.
To avoid Fire or Personal Injury:
Connect the probe correctly. The grounding end of the probe corresponds to the
grounding phase. Please don't connect the grounding end to the positive phase.
Use Proper Power Cord. Use only the power cord supplied with the product and
certified to use in your country.
Connect or Disconnect Correctly. When the probe or test lead is connected to a
voltage source, please do not connect and disconnect the probe or test lead at random.
Product Grounded. This instrument is grounded through the power cord grounding
conductor. To avoid electric shock, the grounding conductor must be grounded. The
product must be grounded properly before any connection with its input or output
terminal.
When powered by AC power, it is not allowed to measure AC power source
directly, because the testing ground and power cord ground conductor are
connected together, otherwise, it will cause short circuit.
Check all Terminal Ratings. To avoid fire or shock hazard, check all ratings and
markers of this product. Refer to the user's manual for more information about ratings
before connecting to the instrument.
Do not operate without covers. Do not operate the instrument with covers or panels
removed.
Use Proper Fuse. Use only the specified type and rating fuse for this instrument.
Avoid exposed circuit. Do not touch exposed junctions and components when the
instrument is powered.
Do not operate if in any doubt. If you suspect damage occurs to the instrument, have
it inspected by qualified service personnel before further operations.
Use your Oscilloscope in a well-ventilated area. Make sure the instrument installed
with proper ventilation, refer to the user manual for more details.
Do not operate in wet conditions.
Do not operate in an explosive atmosphere.
Keep product surfaces clean and dry.
2.Safety Terms and Symbols
2
2. Safety Terms and Symbols
Safety Terms
Terms in this manual. The following terms may appear in this manual:
Warning: Warning indicates the conditions or practices that could result in
injury or loss of life.
Caution: Caution indicates the conditions or practices that could result in
damage to this product or other property.
Terms on the product. The following terms may appear on this product:
Danger: It indicates an injury or hazard may immediately happen.
Warning: It indicates an injury or hazard may be accessible potentially.
Caution: It indicates a potential damage to the instrument or other property might occur.
Safety Symbols
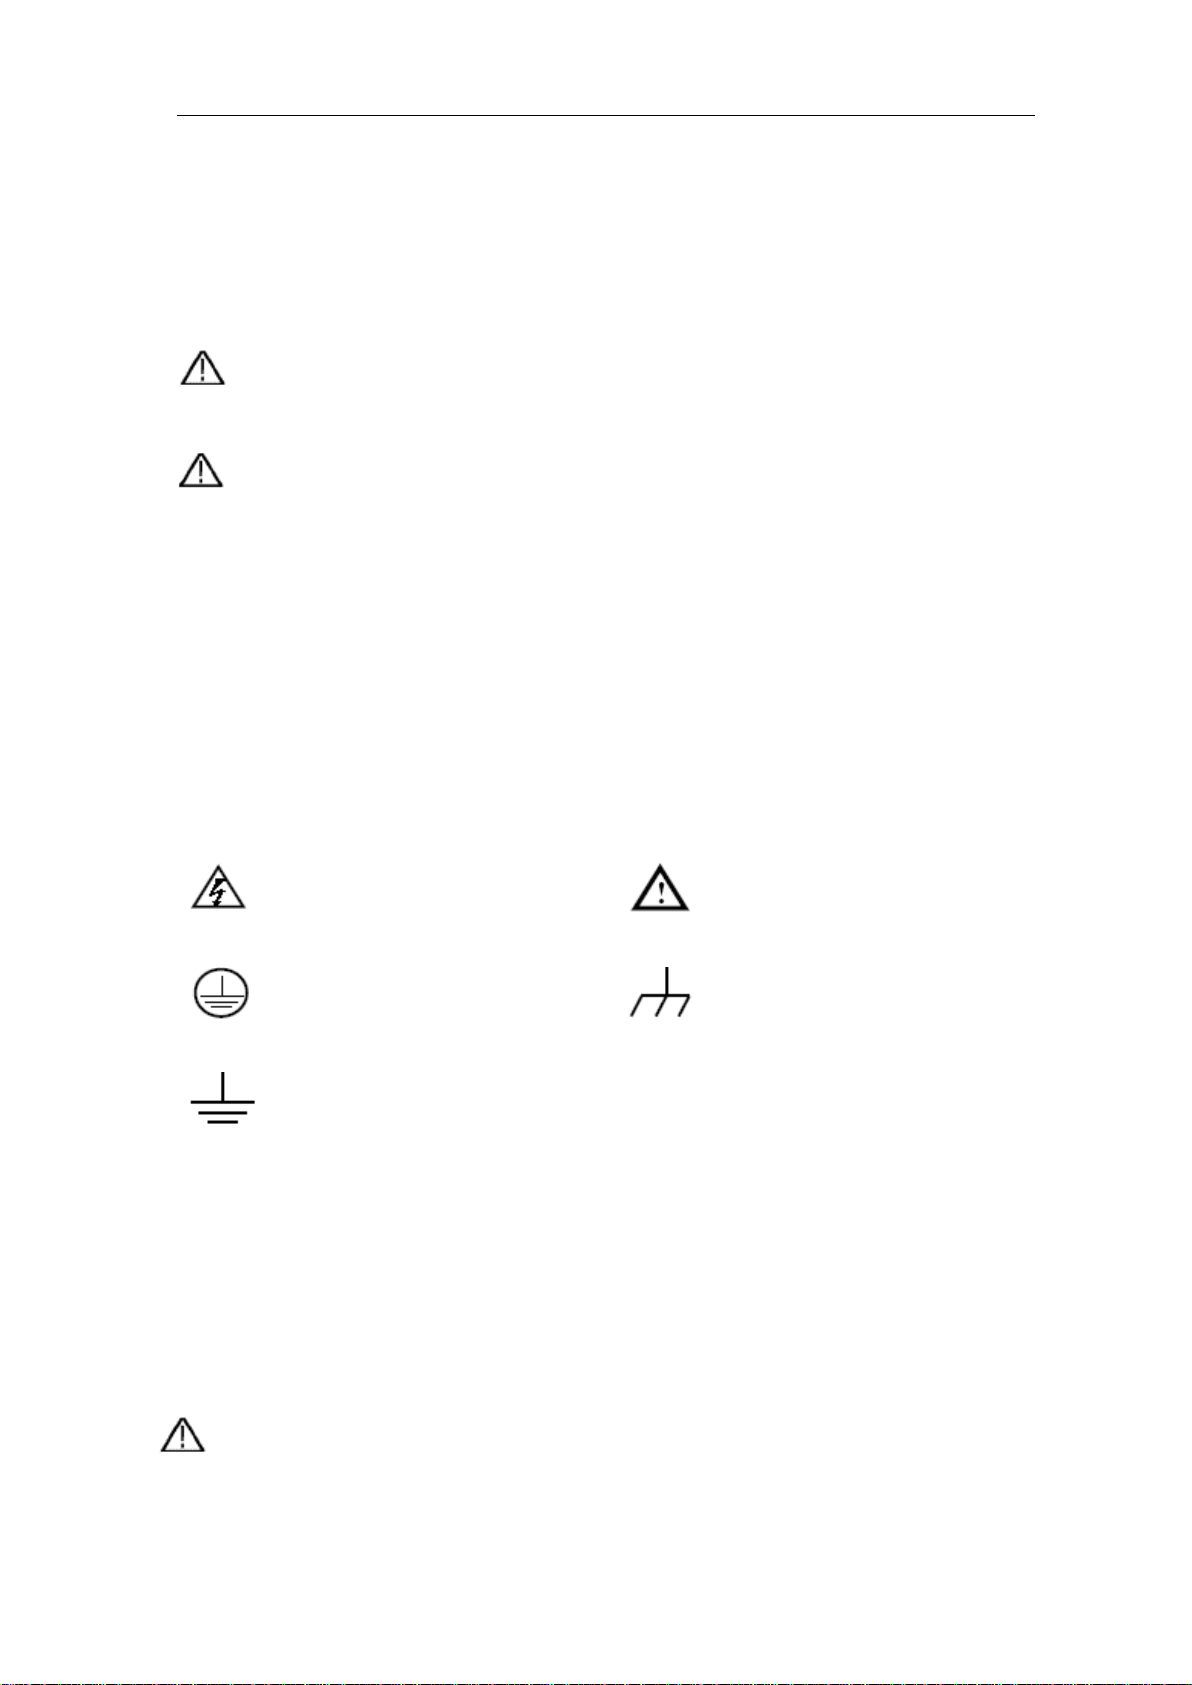
Symbols on the product. The following symbol may appear on the product:
Hazardous Voltage
Protective Earth Terminal
Test Ground
Refer to Manual
Chassis Ground
To avoid bod y damage and prevent product and connected equipment damage, carefully
read the following safety information before using the test tool. This product can only be
used in the specified applications.
Warning:
The two channels of the oscilloscope are not electrically isolated. The channels should
adopt a common ground during measuring. To prevent short circuits, the 2 probe
2.Safety Terms and Symbols
3
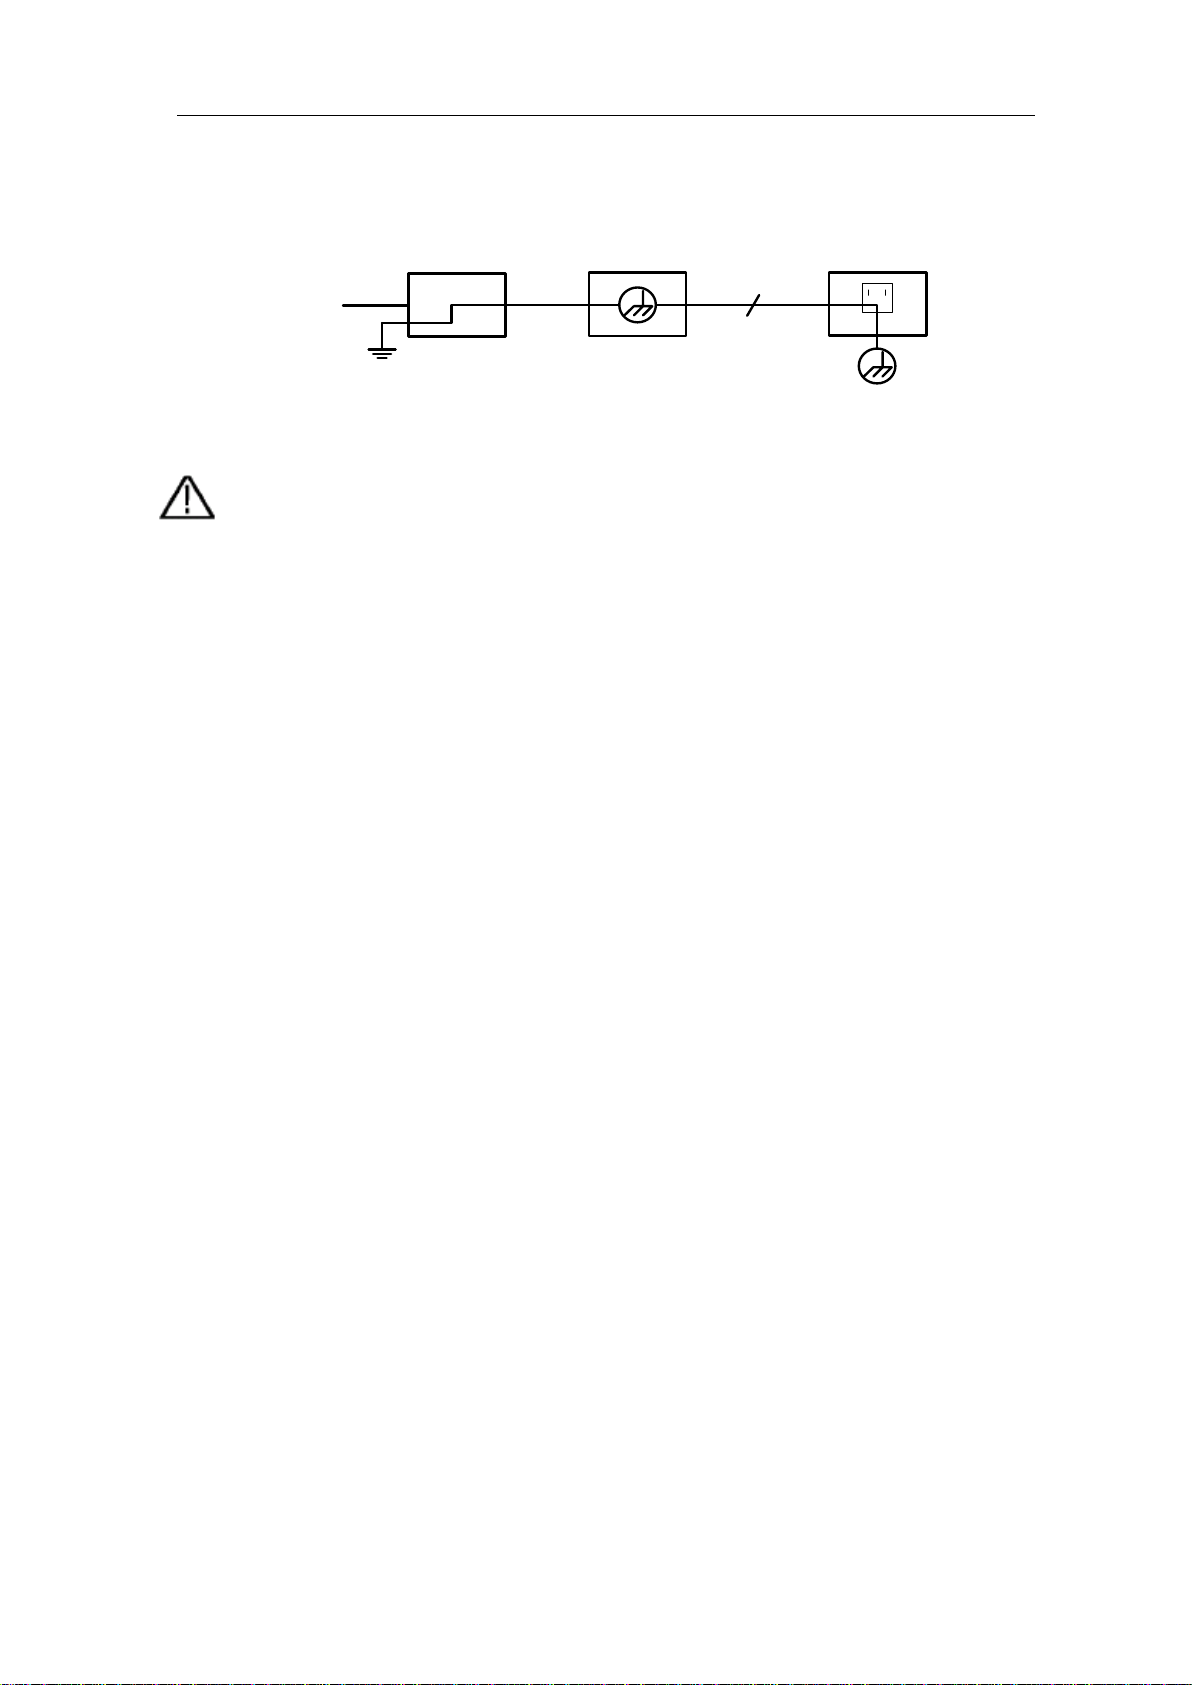
Ground Clip
Signal Input
Oscilloscope
Electrical Outlet
Probe
Power Cord
Warning:
To avoid fire or electrical shock
connected
42V peak (30Vrms) or on circuits of more than
4800VA
not apply input voltages above the rating of the instrument
because the probe tip voltage will directly transmit to the
grounds must not be connected to 2 different non-isolated DC levels.
The diagram of the oscilloscope ground wire connection:
It is not allowed to measure AC power when the oscilloscope is AC powered.
, when the oscilloscope input signal
is more than
, please take note of below items:
Only use accessory insulated voltage probes and test lead.
Check the accessories such as probe before use and replace it if
there are any damages.
Remove probes, test leads and other accessories immediately after
use.
Remove USB cable which connects oscilloscope and computer.
Do
oscilloscope. Use with caution when the probe is set as 1:1.
Do not use exposed metal BNC or banana plug connectors.
Do not insert metal objects into connectors.

3.Junior User Guidebook
4
3. Junior User Guidebook
This chapter deals with the following topics mainly:
Introducti on to th e str uct ure of the os ci ll os co pe
Introducti on to th e u ser interface
How to implem ent the general inspection
How to implement the function inspection
How to make a probe com pensation
How to set the probe att en ua ti on co eff ic ie n t
How to use the probe safely
How to implement an auto-calibration
Introducti on to th e ver tic al system
Introducti on to th e ho riz on ta l sy stem
Introducti on to th e tri gg er syste m
3.Junior User Guidebook
5
8
2
5
3
7
4
6
1
Introduction to the Structure of the Oscilloscope
This chapter makes a simple description of the operation and function of the front panel of
the oscilloscope, enabling you to be familiar with the use of the oscilloscope in the
shortest time.
Front Panel
The front panel has knob s and function buttons. The 5 buttons in the column on the right
side of the display screen or in the row under the display screen are menu selection
buttons, through which, you can set the different options for the current menu. The other
buttons are function buttons, through which, you can enter different function menus or
obtain a specific function application directly.
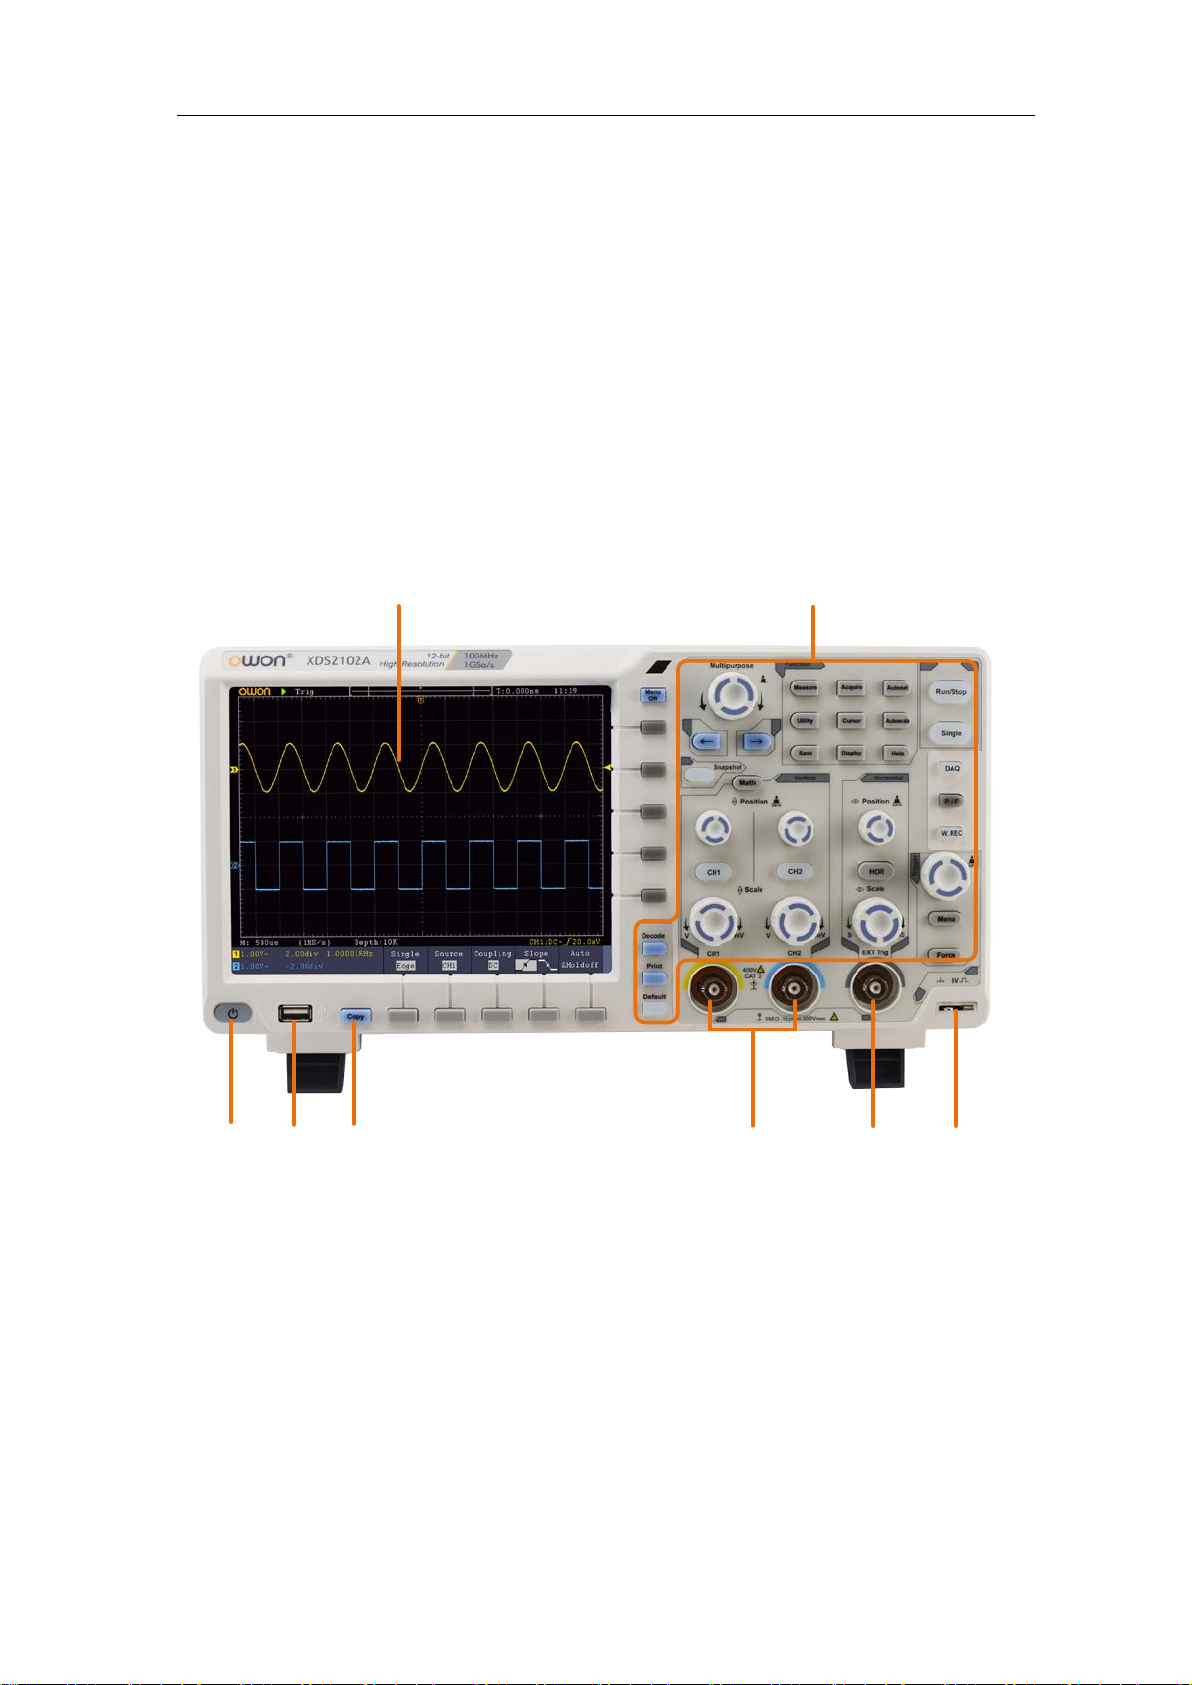
Figure 3-1 Front panel
1. Display area
2. Control (button and knob) area
3. Probe Compensation: Measurement signal (5V/1kHz) output.
4. EXT Trigger Input
5. Signal Input Channel
6. Copy button: You can save the waveform by just pressing this button in any user
interface.
7. USB Host port: It is used to transfer data when external USB equipment connects to
the oscilloscope r e gard ed as "host device". For exampl e: Saving th e wavefo rm to USB
flash disk needs to use this port.

3.Junior User Guidebook
6
Select the right menu item
Select the bottom menu item
Remove the left and right menu
9
8
7 6
11
1
2
5
3
4
10
8. Power on/off
Backlight of this button:
Red light: The oscilloscope is turned off (connects with AC Power);
Green light: The oscilloscope is turned on (powered by AC Power).
Front Panel Menu Buttons
Figure 3-2 Menu Buttons
Rear Panel
Figure 3-3 Rear Panel
1. Handle
2. Air vents
3. AC power input jack
4. Fuse
5. Foot stool: Adjust the tilt angle of the oscilloscope.
6. VGA port: To connect the oscilloscope with a monit or or a projector as VGA output
(optional).
7. LAN port: the network port which can be used to connect with PC.
3.Junior User Guidebook
7
8
7
6
1
2
3
11
10
5
4
9
8. USB Device port: It is used to transfer data when ex t ernal US B equi pm ent con nect s t o
the oscilloscope regarded as "slave device". For example: to use this port when
connect PC to the oscilloscope by USB.
9. Lock Hole: You can lock the oscilloscope to a fixed location using the security lock
(please buy it yourself) to secure the oscilloscope.
10. AV Port: AV signal output port (optional).
11. Trig Out(P/F) port: Trigger signal output or Pass/Fail output.
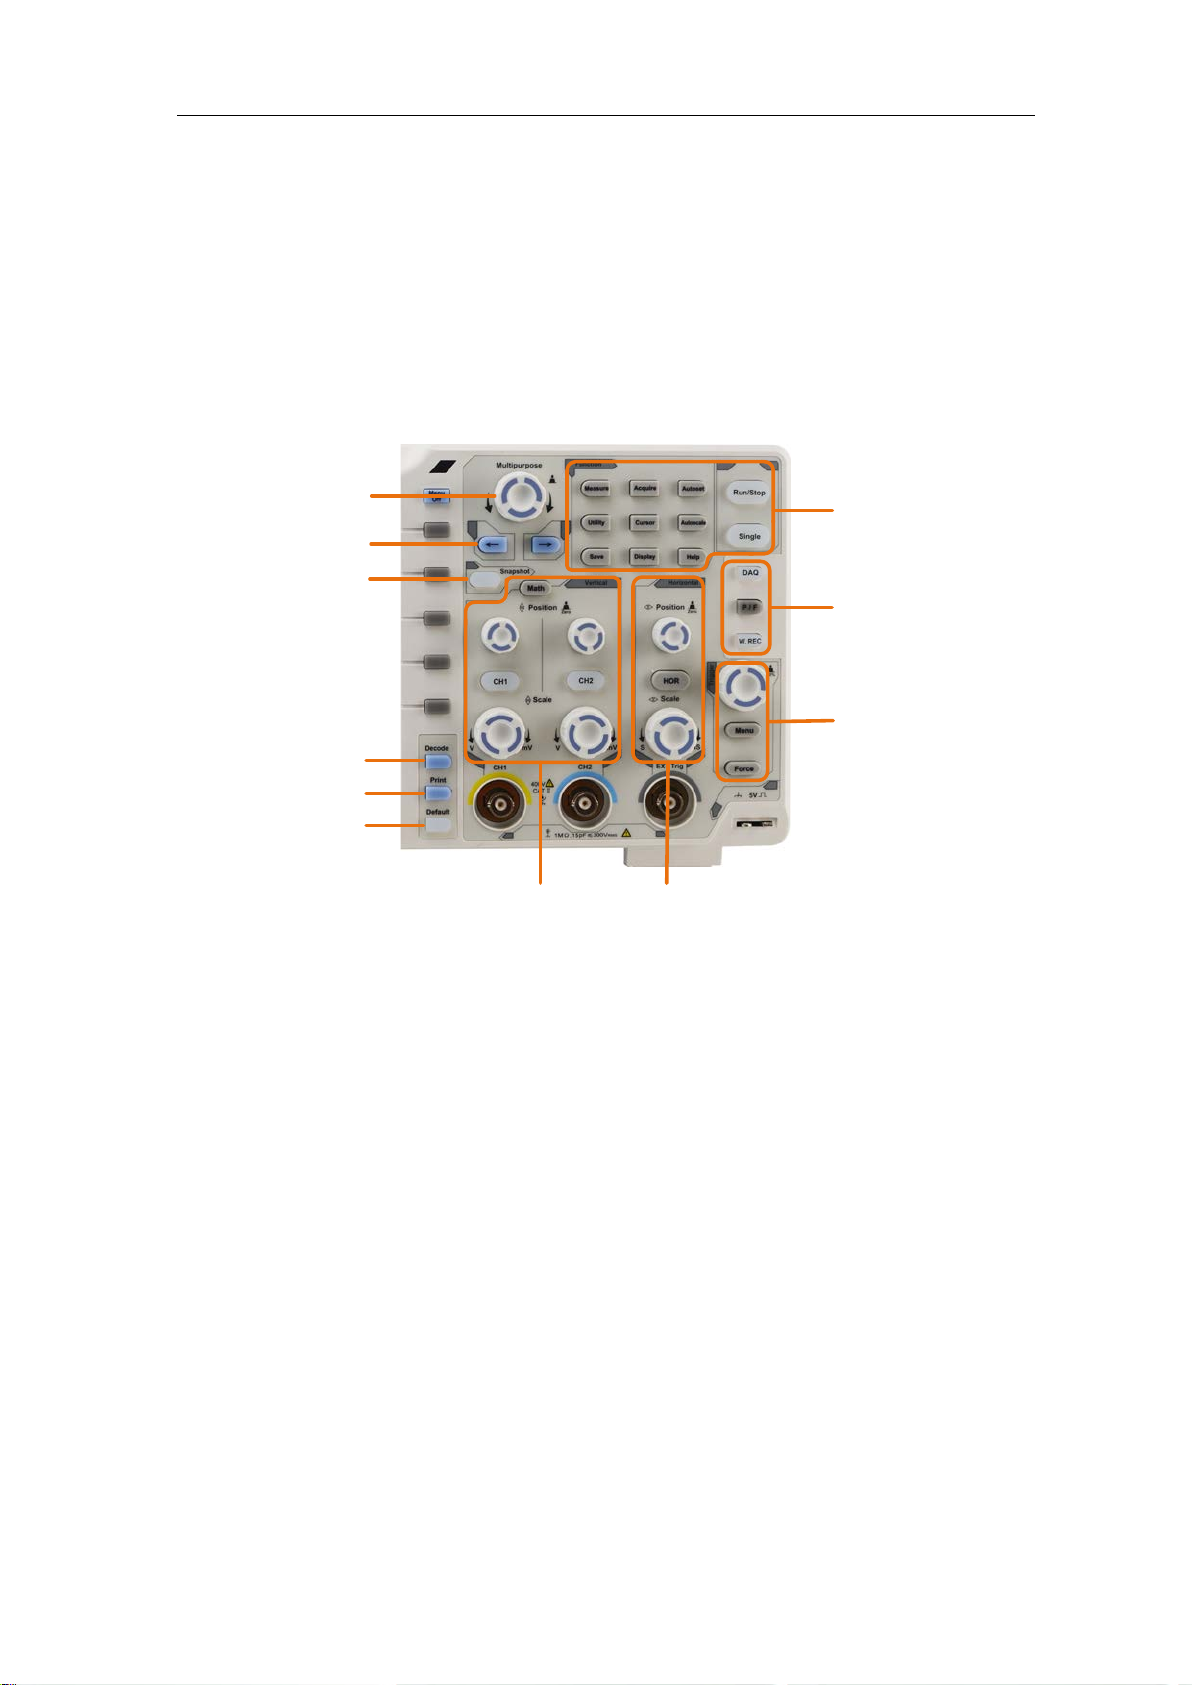
Control Area
Figure 3-4 Control Are a Overview
1. Function button area: Total 11 buttons
2. DAQ: Multimeter Recorder (This function is not available in XDS2000 series.)
P/F: Pass/Fail
W.REC: Waveform Record
3. Trigger control area with 2 buttons and 1 knob.
The Trigger Level knob is to adjust trigger voltage. Other 2 buttons refer to trigger
system setting.
4. Horizontal control area with 1 button and 2 knobs.
"HOR" button refer to horizontal system setting menu, "Horizontal Position" knob
control trigger position, "Horizontal Scale" control time base.
5. Vertical control area with 3 buttons and 4 knobs.
"CH1" and "CH2 " correspond to setting menu in CH1 and CH2, "Math" button refer
to math menu, the math menu consists of six kinds of operations, including CH1-CH2,
CH2-CH1, CH1+CH2, CH1*CH2, CH1/CH2 and FFT. T wo "Vertical Position" knob
control the vertical position of CH1/CH2, and two "Scale" knob control voltage scale
of CH1, CH2.
3.Junior User Guidebook
8
1
3
15
10
23
20
6
7
8
9
12
13
16
17
18
22
24
5
14
21
2
4
19
11
4
12
6. Default: Call out the factory settings.
7. Print
8. Turn on/off Decode function.
9. Snapshot
10. Direction key: Move the cursor of the focused parameter.
11. M knob (Multipurpose knob): when a symbol appears in the menu, it indicates
you can turn the M knob to select the menu or set the value. You can push it to close
the menu on the left and right.
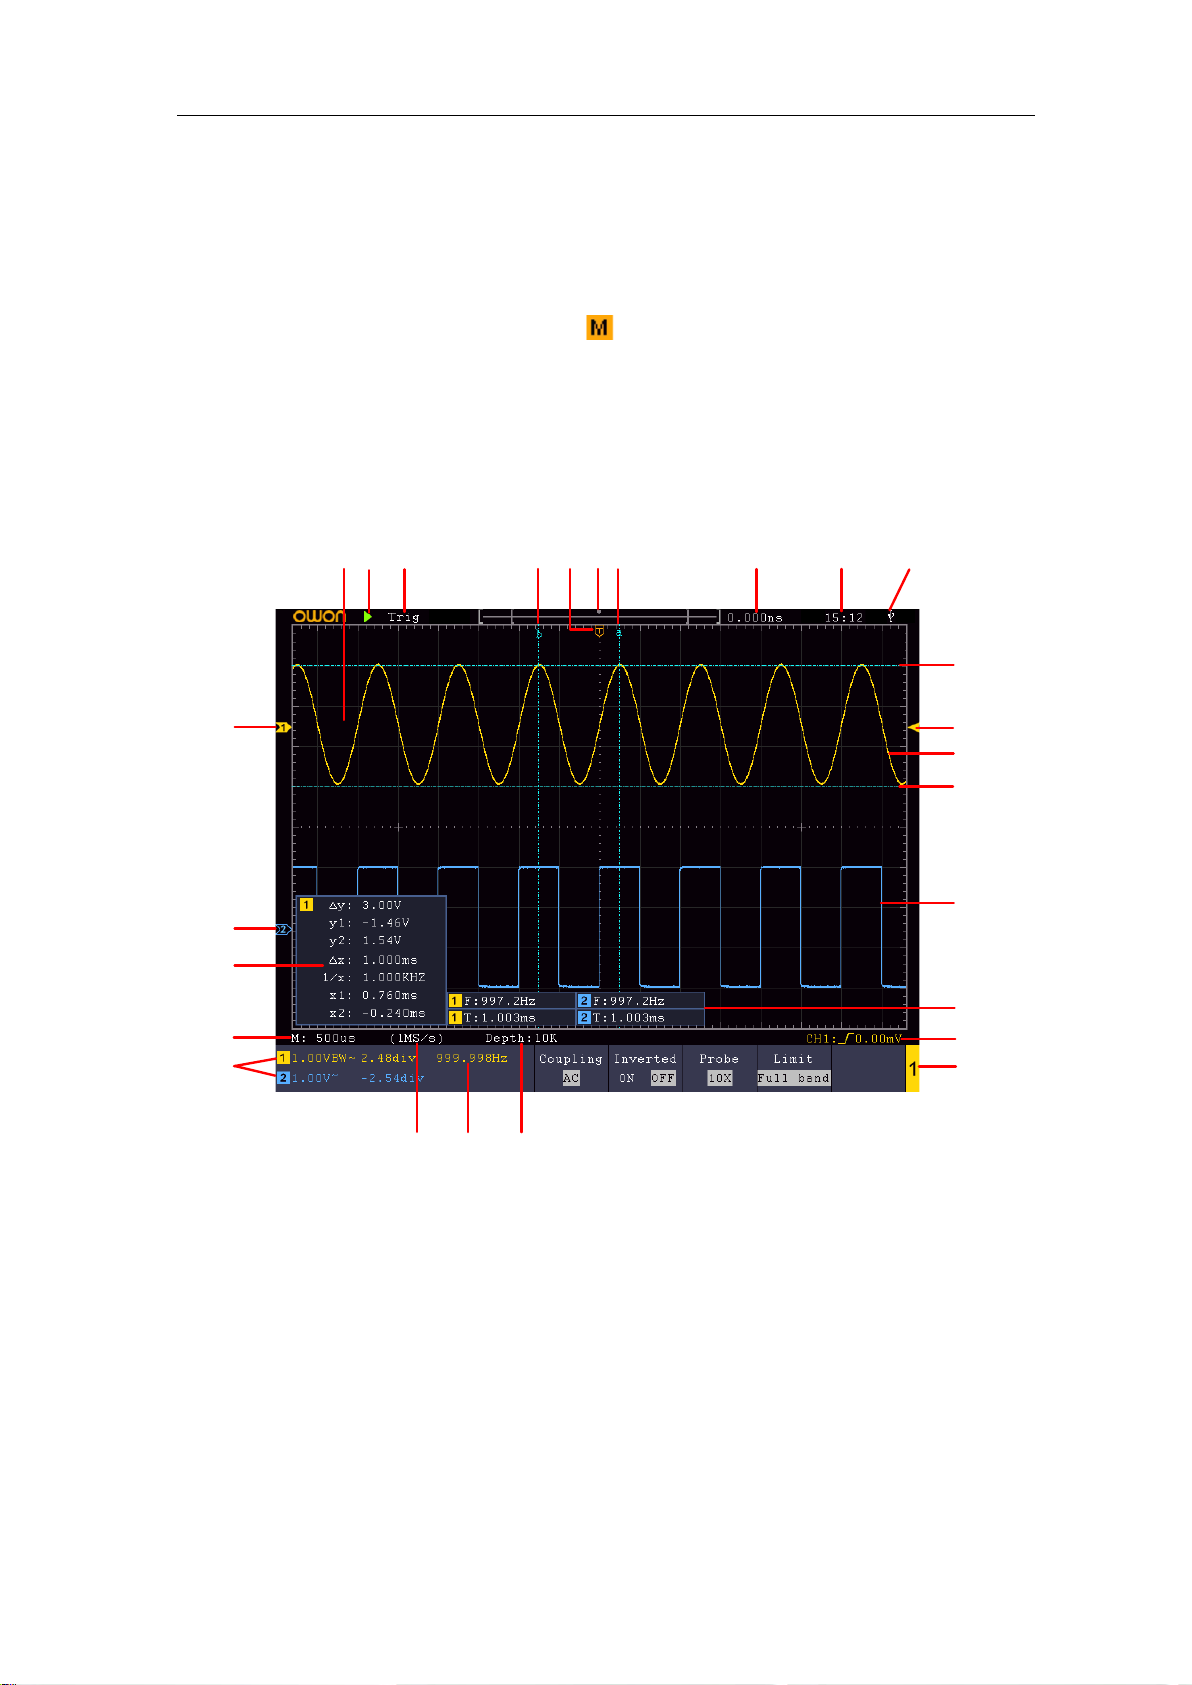
User Interface Introduction
1. Waveform Display Area.
2. Run/Stop
3. The state of trigger, including:
Auto: Automatic mode and acquire waveform without triggering.
Trig: Trigger detected and acquire waveform.
Ready: Pre-triggered data captured and ready for a trigger.
Scan: Capture and display the waveform continuously.
Stop: Data acquisition stopped.
4. The two blue dotted lines indicates the vertical position of cursor measurement.
Figure 3-5 Illustrative Drawing of Display Interfaces

3.Junior User Guidebook
9
5. The T pointer indicates the horizontal position for the trigger.
6. The pointer indicates the trigger position in the record length.
7. It shows present triggering value and displays the site of present window in
internal memory.
8. It shows setting time.
9. It indicates that there is a USB disk connecting with the oscilloscope.
10. The pointer shows the trigger level position.
11. The waveform of CH1.
12. The two blue dotted lines indicate the horizontal position of cursor measurement.
13. The waveform of CH2.
14. It indicates the measured type and value of the corresponding channel. "T" means
period, "F" means frequency, "V" means the average value, "Vp" the peak-peak
value, "Vr" the root-mean-square value, "Ma" the maximum amplitude value,
"Mi" the minimum amplitude value, "Vt" the Voltage value of the waveform's
flat top value, "Vb" the Voltage value of the waveform's flat base, "Va" the
amplitude value, "Os" the overshoot value, "Ps" the Preshoot value, "RT" the rise
time value, "FT" the fall time value, "PW" the +width value, "NW" the -Width
value, "+D" the +Duty value, "-D" the -Duty value, "PD" the Delay A->B
value, "ND" the Delay A->B value, "TR" the Cycle RMS, "CR" the Cursor
RMS, "WP" the Screen Duty, "RP" the Phase, "+PC" the +Pulse count, "-PC"
the - Pulse count, "+E" the Rise edge count, "-E" the Fall edge count, "AR" the
Area, "CA" the Cycle area.
15. The icon shows the selected trigger type, e.g. represents triggering on the
rising e dge for an Edge trigger. The reading shows the trigger level value of the
corresponding channel.
16. Channel identifier of current bottom menu.
17. The readings show the record length.
18. The frequency of the trigger signal.
19. The readings show current sample rate.
20. The readings indicate the corresponding Voltage Division and the Zero Point
positions of the channels. "BW" indicates bandwidth limit.
The icon shows the coupling mode of the channel.
"—" indicates direct current coupling
"~" indicates AC coupling
" " indicates GND coupling
21. The reading shows the setting of main time base.
22. It is cursor measure window, showing the absolute values and the readings of the
cursors.
23. The blue pointer shows the grounding datum point (zero point position) of the
waveform of the C H2 channel. If the pointer is not displayed, it means that this
channel is not opened.
24. The yellow pointer indicates the grounding datum point (zero point position) of

3.Junior User Guidebook
10
the waveform of the CH1 channel. If the pointer is not displayed, it means that
the channel is not opened.
How to Implement the General Inspection
After you get a new oscilloscope, it is recommended that you should make a check on the
instrument according to the following steps:
1. Check whether there is any damage caused by transportation.
If it is found that the packaging carton or the foamed plastic protection cushion has
suffered serious damage, do not throw it away first till the complete device and its
accessories succeed in the electrical and mechanical property tests.
2. Check the Accessories
The supplied access ories have been already described in the "Appendix A: Enclosure"
of this Manual. You can check wh ether ther e is any loss of accesso ries wi th referenc e
to this description. If it is found that there is any accessory lost or dam a ged , pl ease get
in touch with the distributor of OWON responsible for this service or the OWON's
local offices.
3. Check the Complete Instrument
If it is found that there is damage to the appearance of the instrument, or the
instrument can not work normally, or fails in the performance test, please get in touch
with the OWON's distributor responsible for this business or the OWON's local
offices. If there i s damag e to the inst rument caus ed by the t ransportat ion, pl ease keep
the package. With the transportation department or the OWON's distributor
responsible for this business informed about it, a repairing or replacement of the
instrument will be arranged by the OWON.
How to Implement the Function Inspection
Make a fast funct ion check to verif y the normal operation of the instrument, according to
the following steps:
1. Connect the po wer cord to a power source. Long press the
bottom left of the instrument.
The instrument carries out all self-check items and shows the Boot Logo. Push the
Utility button, select Function in the bottom menu. Select Adjust in the left menu,
select Default in the bottom menu. The default att enuati on coe fficient set val ue of th e
probe in the menu is 10X.
button on the
2. Set the Switch in the Oscilloscope Probe as 10X and Connect the Oscilloscope
with CH1 Channel.
Align the slot in the probe with the plug in the CH1 connector BNC, and then tighten
3.Junior User Guidebook
11
the probe with rotating it to the right side.
Connect the probe tip and the ground clamp to the connector of the probe
compensator.
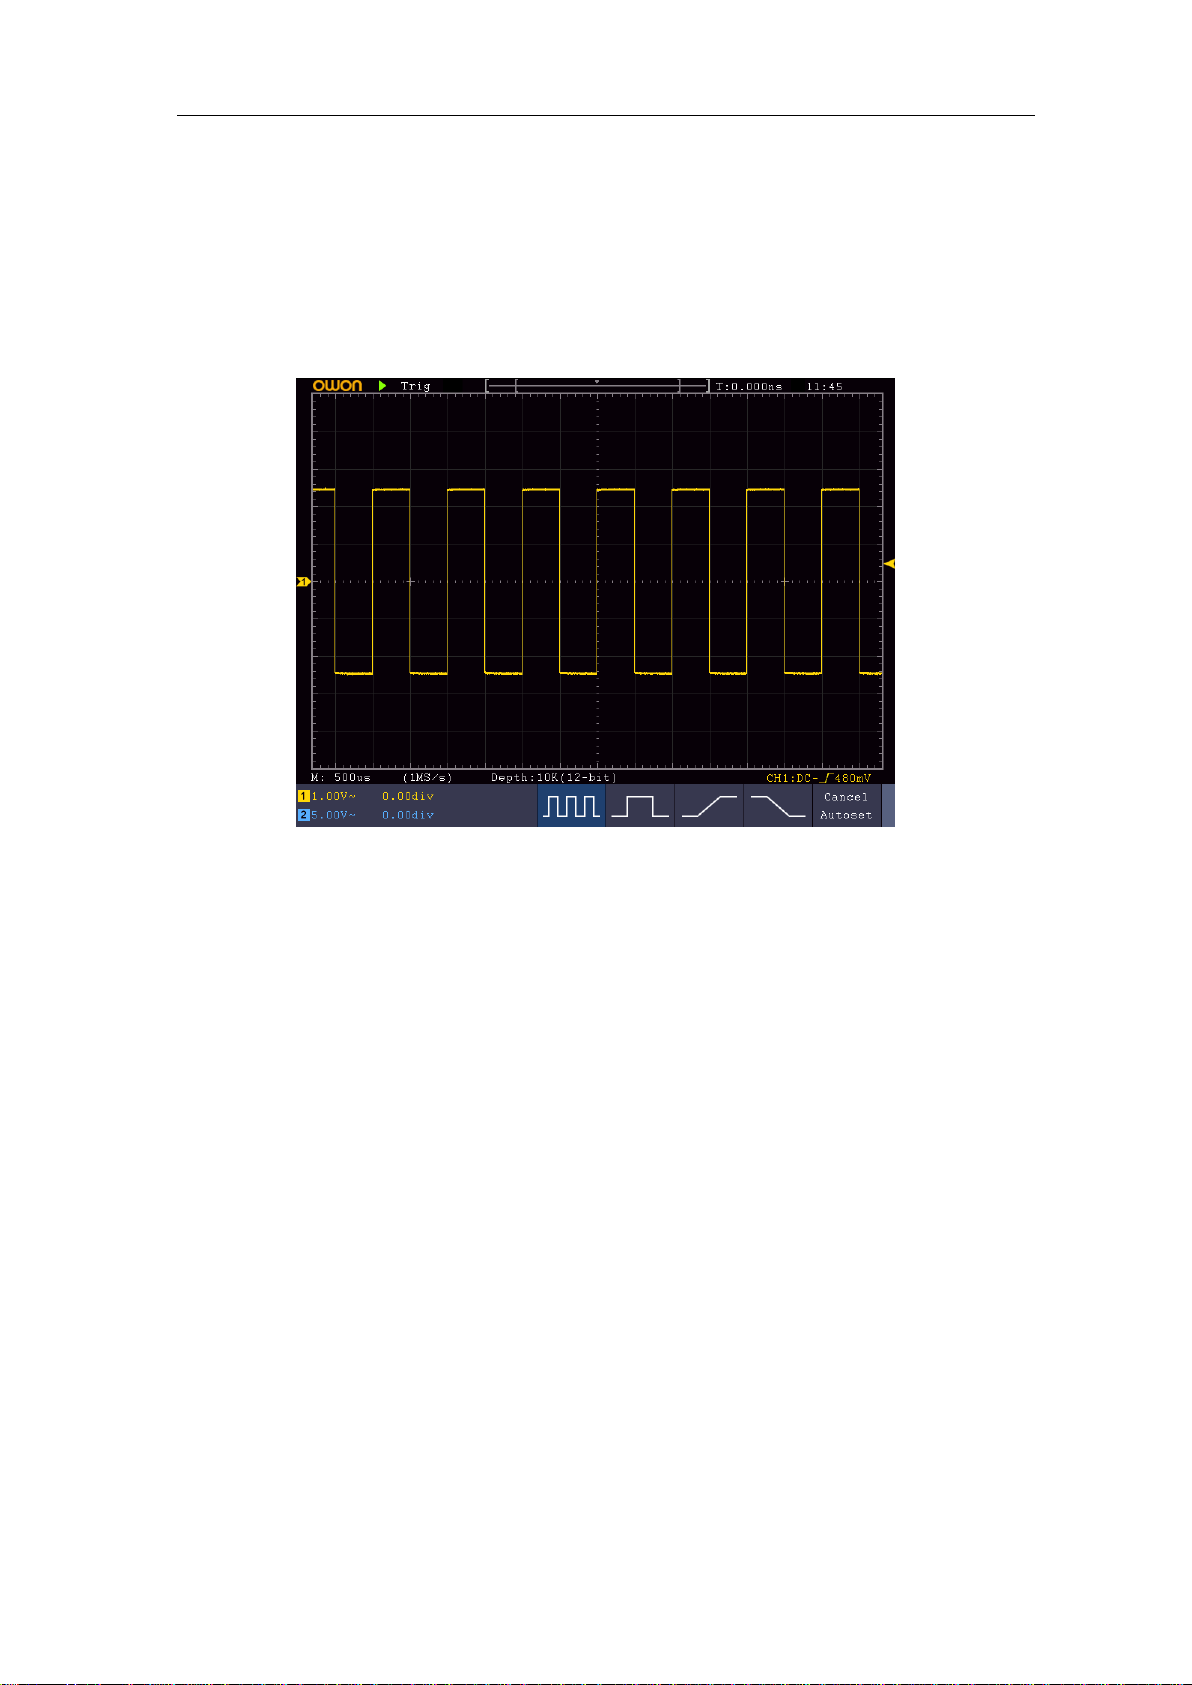
3. Push the Autoset Button on the front panel.
The square wave of 1 KHz frequency and 5V peak-peak value will be displayed in
several seconds (see Figure 3-6).
Figure 3-6 Auto set
Check CH2 by repeating Step 2 and Step 3.
How to Implement the Probe Compensation
When connect the probe with any input channel for the first time, make this adjustment to
match the probe with the input channel. The probe which is not compensated or presents a
compensation deviation will result in the measuring error or mistake. For adjusting the
probe compensation, please carry out the following steps:
1. Set the attenuation coefficient of the probe in the menu as 10X and that of the switch
in the probe as 10X (see "How to Set the Probe Attenuation Coefficient" on P12), and
connect the probe with the CH1 channel. If a probe hook tip is used, ensure that it
keeps in close touch with the probe. Connect the probe tip with the signal connector
of the probe compensator and connect the reference wire clamp with the ground wire
connector of the probe connector, and then push the Autoset button on the front
panel.
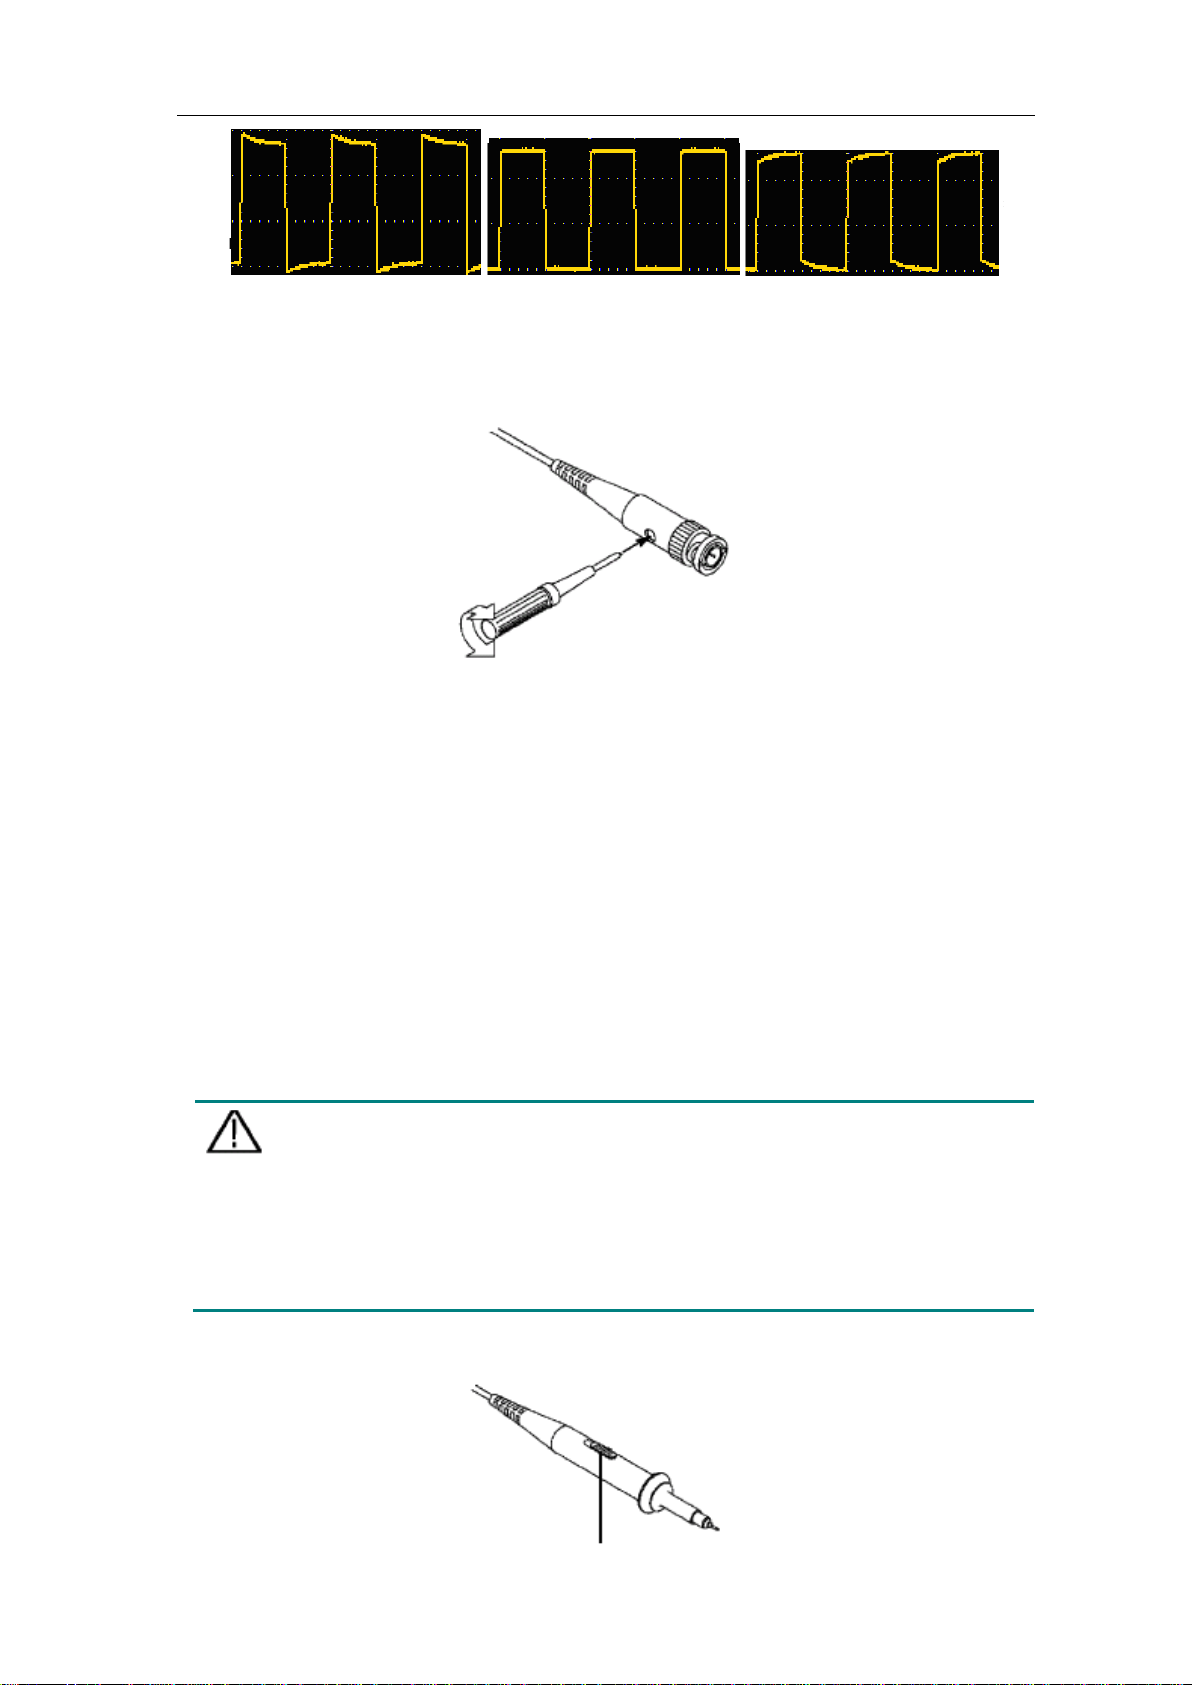
2. Check the displayed waveforms and regulate the probe till a correct compensation is
achieved (see Figure 3-7 and Figure 3-8).
3.Junior User Guidebook
12
Caution:
in the
Overcompensated Compensated correctly Under compensated
Figure 3-7 Displayed Waveforms of the Probe Compensation
3. Repeat the steps mentioned if needed.
Figure 3-8 Adjust Probe
How to Set the Probe Attenuation Coefficient
The probe has several attenuation coefficients, which will influence the vertical scale
factor of the oscilloscope.
To change or check the probe attenuation coefficient in the menu of oscilloscope:
(1) Push the function menu button of the used channels (CH1 or CH2 button).
(2) Select Probe in the bottom menu; select Attenu in the right menu, turn the M knob to
select the proper value corresponding to the probe.
This setting will be valid all the time before it is changed again.
The default attenuation coefficient of the probe on the instrument is preset to
10X.
Make sure that the set value of the attenuation switch in the probe is the
same as the menu selection of the probe attenuation coefficient
oscilloscope.
The set values of the probe switch are 1X and 10X (see Figure 3-9).
3.Junior User Guidebook
13
Caution:
connect the probe to the
Figure 3-9 Attenuation Switch
When the attenuation switch is set to 1X, the probe will limit the bandwidth
of the oscilloscope in 5MHz. To us e the full bandwidth of the oscilloscope,
the switch must be set to 10X.
Identify the Probe Attenuation Coefficient Automatica lly
The oscilloscope can identify the probe attenuation coefficient of the 100:1 (impedance
5K±20%) or 10:1 (impedance 10K±20%) probe with the identifying pin. When you
attach the probe, the oscilloscope set the attenuation automatically on the oscilloscope
vertical menu for the channel to match the probe.
For example, if you attach a 10:1 probe with the identifying pin, the screen will prompt
"The probe attenuation factor is X10", and set the attenuation to 10X automatically on the
oscilloscope vertical menu for the channel.
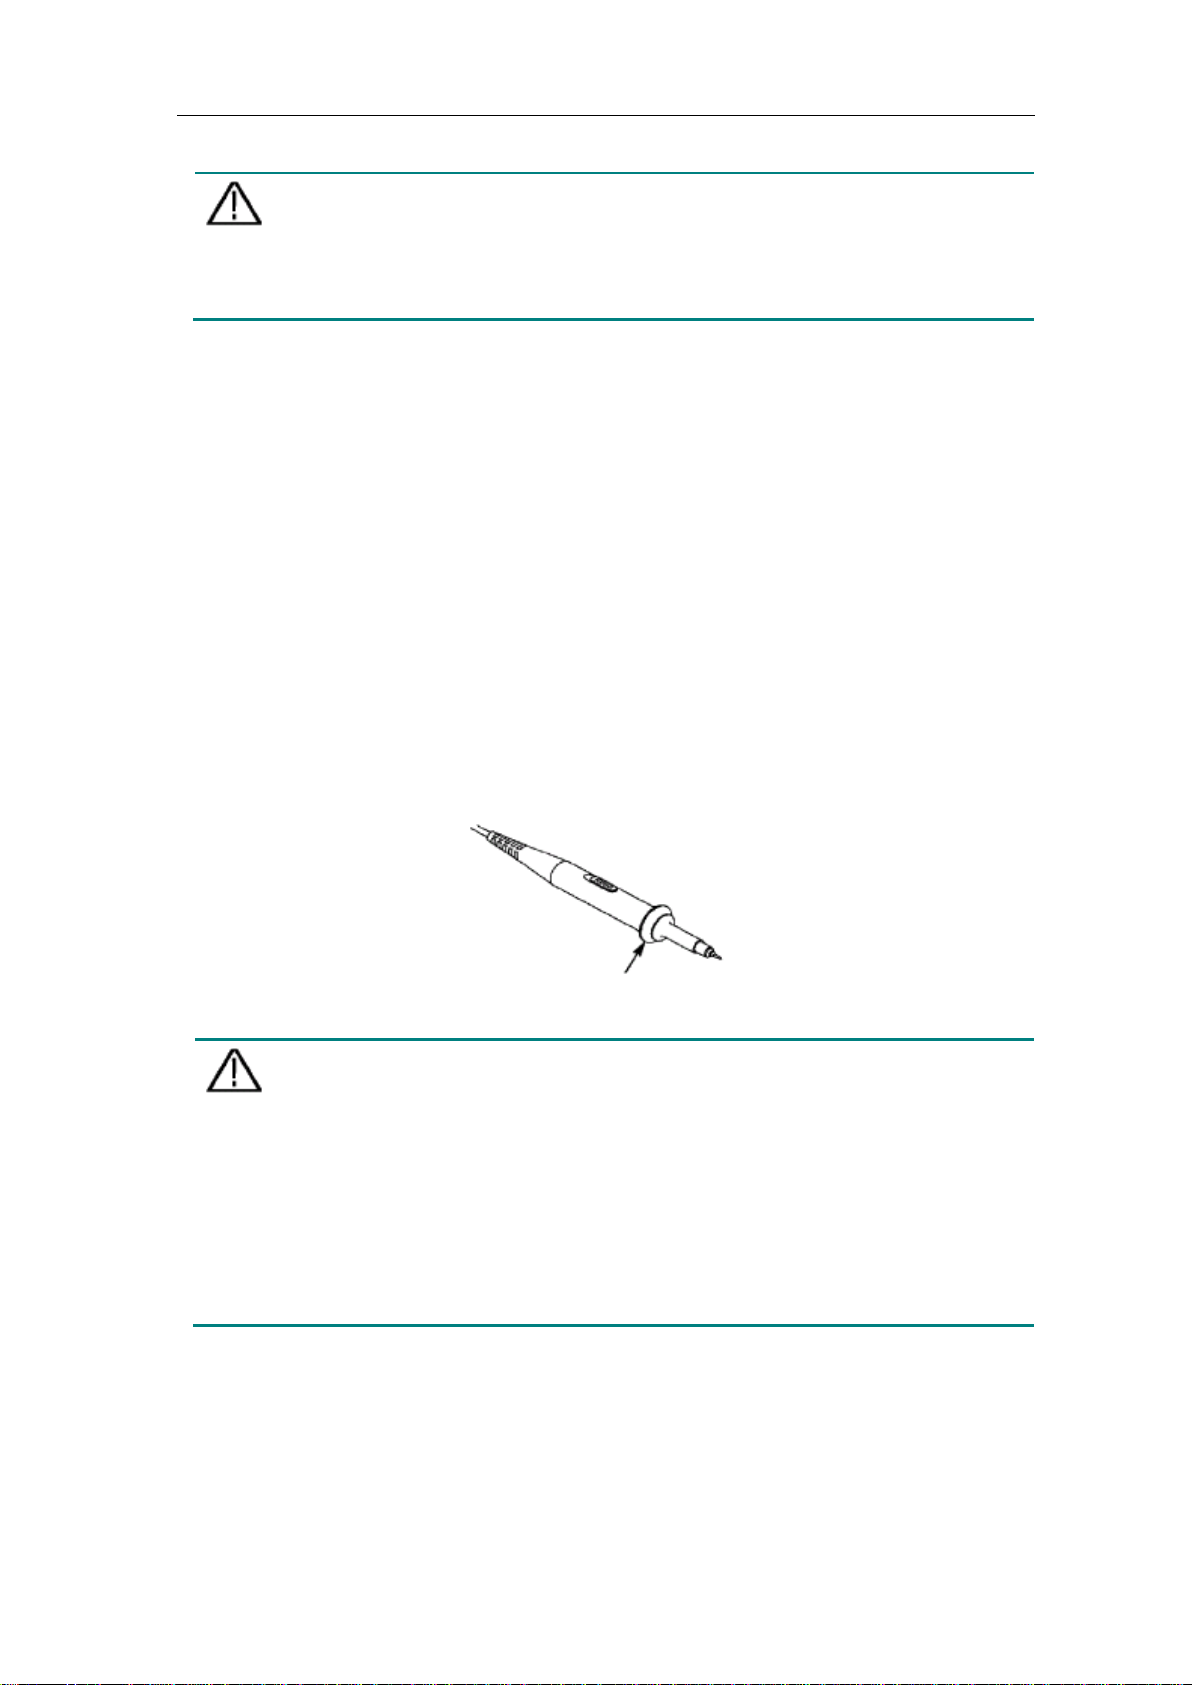
How to Use the Probe Safely
The safety guard ring around the probe body protects your finger against any electric
shock, shown as Figure 3-10.
Figure 3-10 Finger Guard
Warning:
To avoid electric shock, always keep your finger behind the safety guard
ring of the probe during the operation.
To protect you from suffering from the electric shock, do not touch any
metal part of the probe tip when it is connected to the power supply.
Before making any measurements, always
instrument and connect the ground terminal to the earth.
How to Implement Self-calibration
The self-calibration application can make the oscilloscope reach the optimum condition
rapidly to obtain the most accurate measurement value. You can carry out this application
program at any time. This program must be executed whenever the change of ambient
3.Junior User Guidebook
14
temperature is 5℃ or over.
Before performing a self-calibration, disconnect all probes or wires from the input
connector. Push the Utility button, select Function in the bottom menu, select Adjust. in
the left menu, select Self Cal in the bottom menu; run the program after everything is
ready.
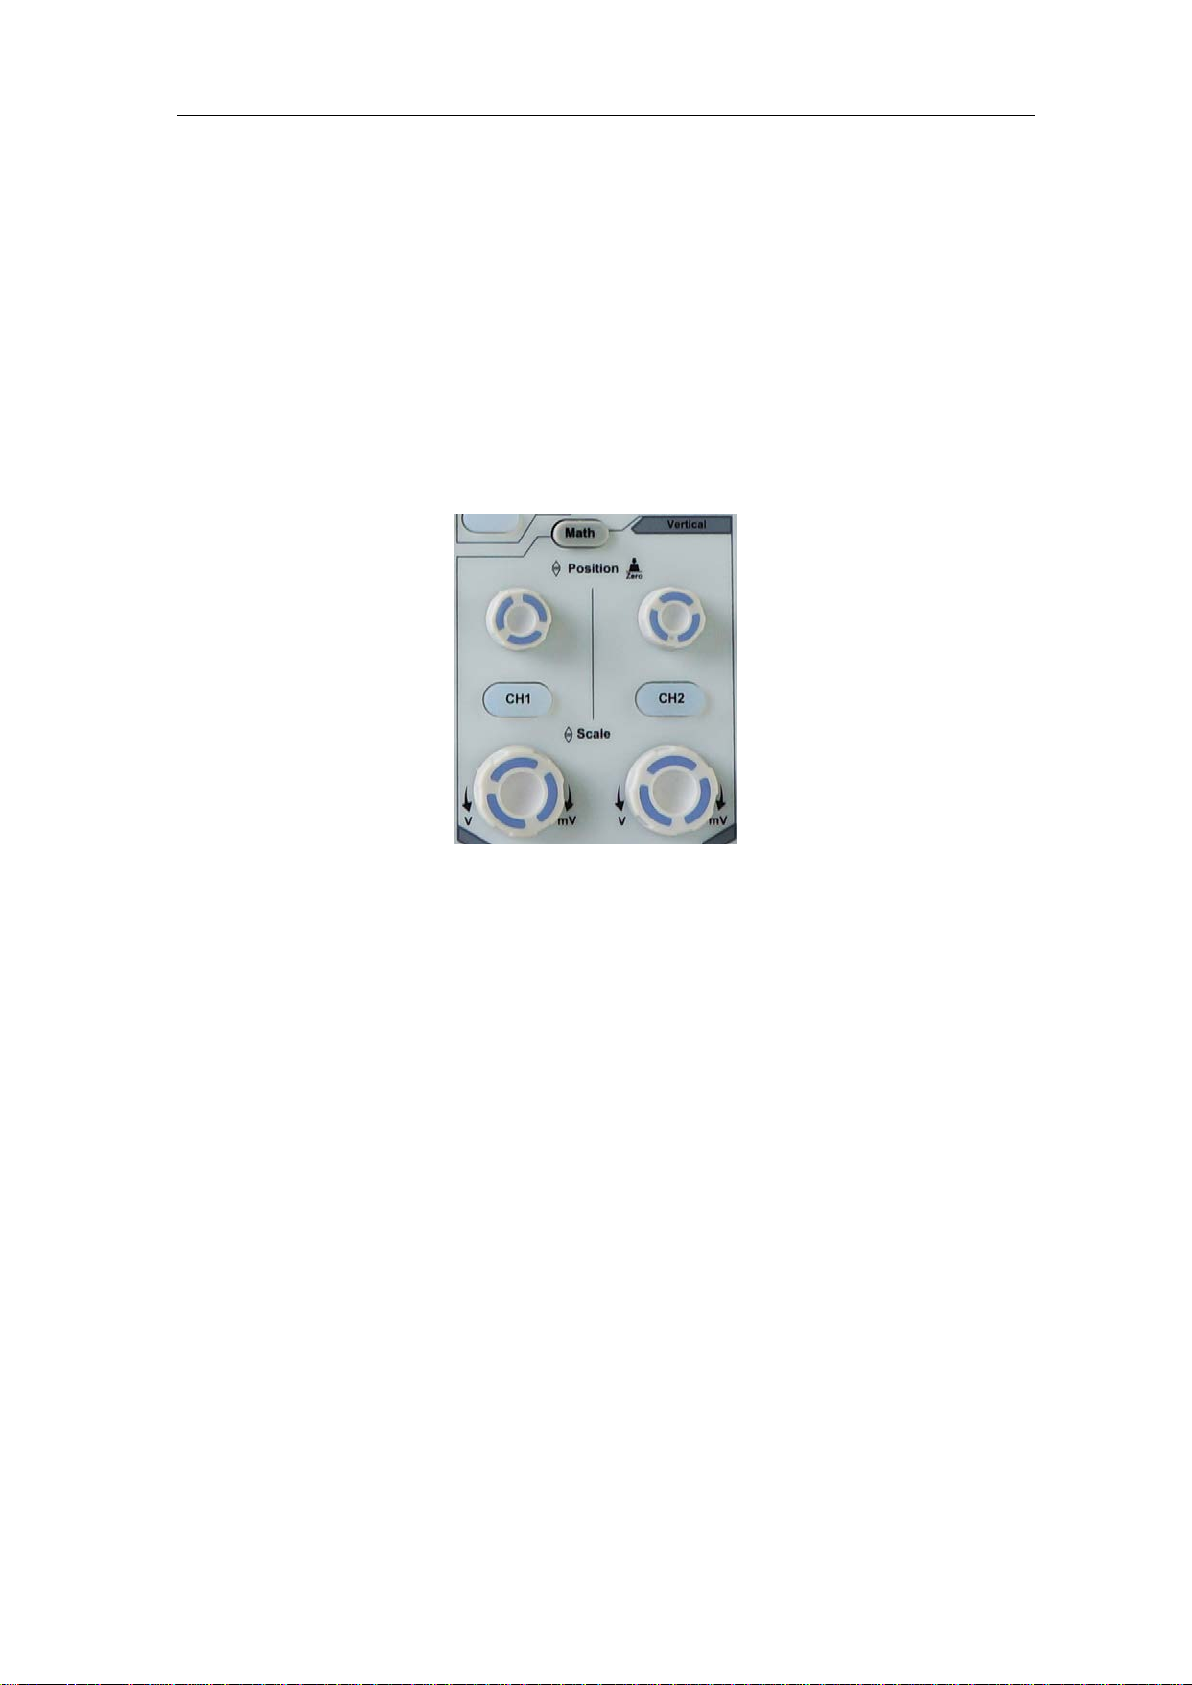
Introduction to the Vertical System
As shown in Figure 3-11, there are a few of buttons and knobs in Vertical Contro ls. The
following practices will gradually direct you to be familiar with the using of the vertical
setting.
Figure 3-11 Vertical Control Zone
1. Use the Vertical Position knob to show the signal in the center of the waveform
window. The Vertical Position knob functions the regulating of the vertical display
position of the signal. Thus, when the Vertical Position knob is rotated, the pointer
of the earth datum point of the channel is directed to move up and down following
the waveform.
Measuring Skill
If the channel is under the DC coupling mode, you can rapidly measure the DC
component of the signal through the observation of the difference betw een the wave
form and the signal ground.
If the channel is under the AC mode, the DC component would be filtered out. This
mode helps you display the AC component of the signal with a higher sensitivity.
Vertical offset back to 0 shortcut key
Turn the Vertical Position knob to change the vertical display position of channel
and push the position knob to set the vertical display position back to 0 as a shortcut
key, this is especially helpful when the trace position is far out of the screen and w ant
it to get back to the screen center immediately.
2. Change the Vertical Setting and Observe the Consequent State Information Change.
3.Junior User Guidebook
15
With the information displayed in the status bar at the bottom of the waveform
window, you can determine any changes in the channel vertical scale factor.
Turn the Vertical Scale knob and change the "Vertical Scale Factor (Voltage
Division)", it can be found that the scale factor of the channel corresponding to
the status bar has been changed accordingly.
Push buttons of CH1, CH2 and Math, the operation menu, symbols, waveforms
and scale factor status information of the corresponding channel will be displayed
in the screen.
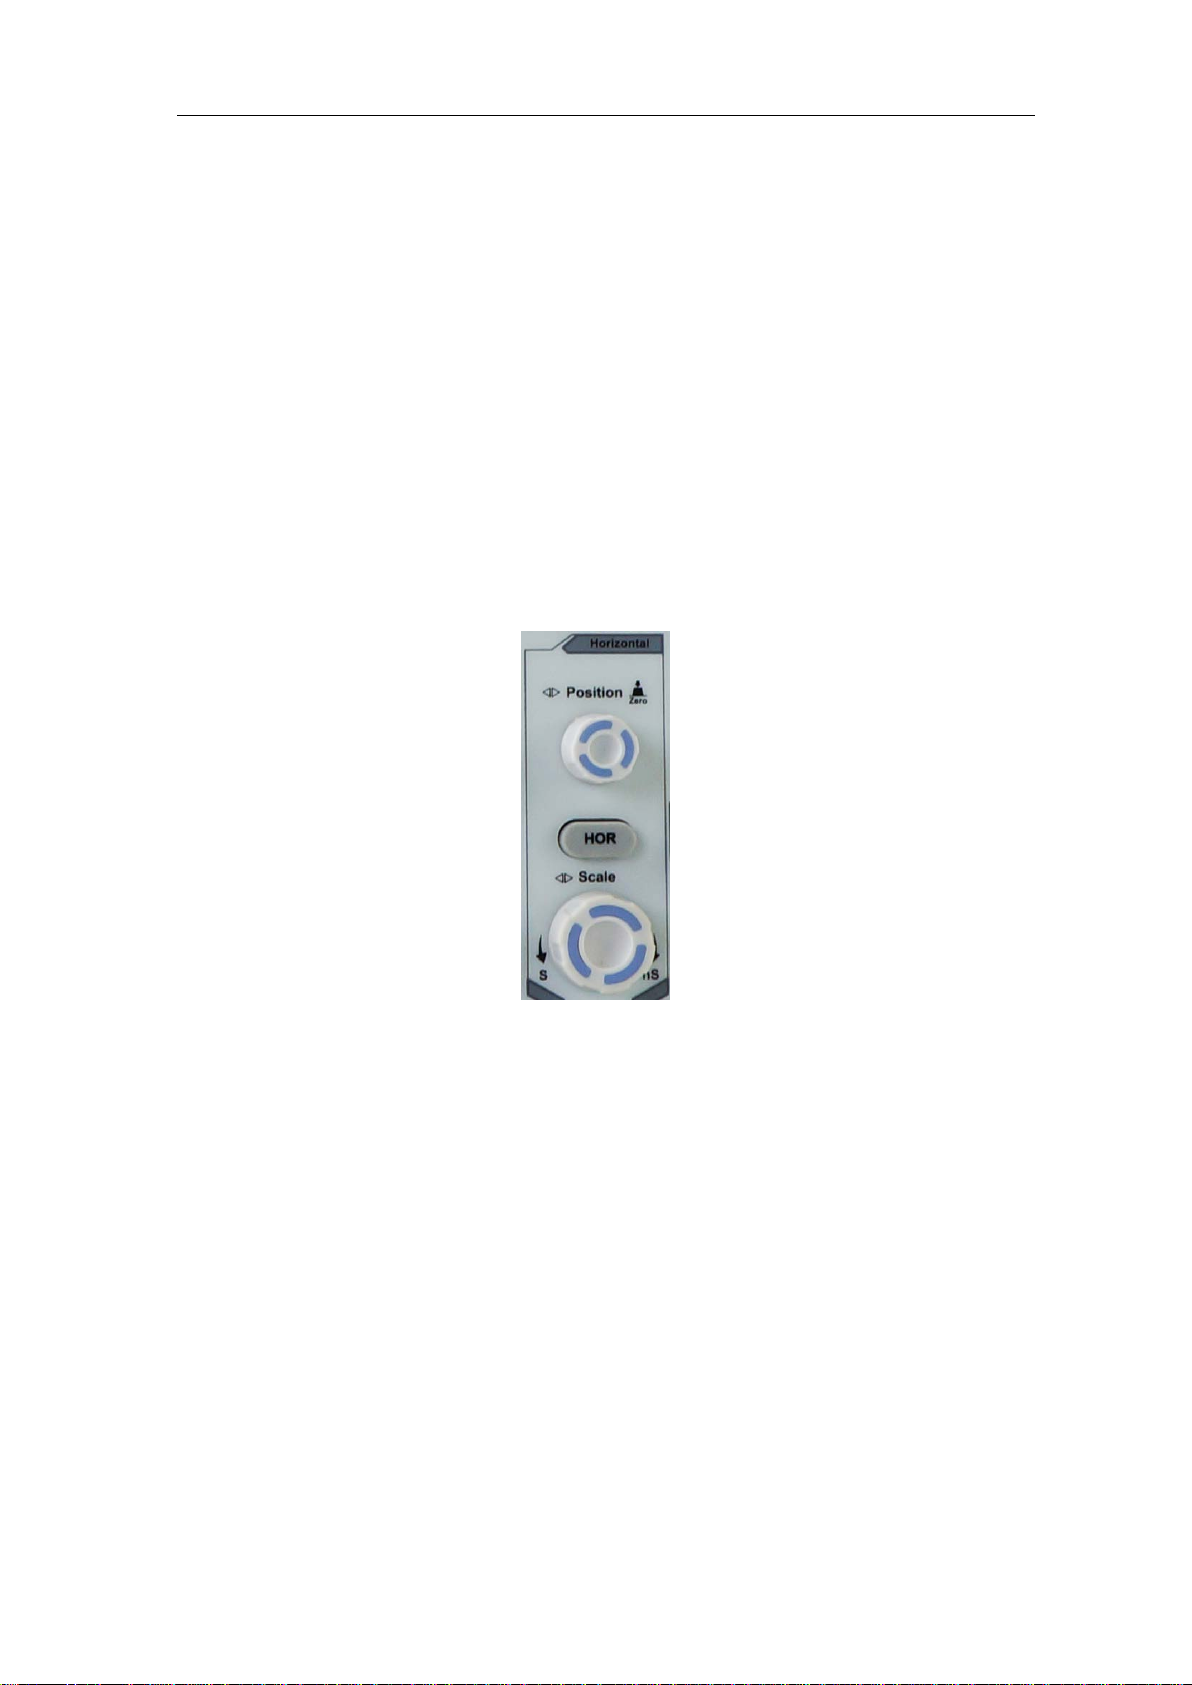
Introduction to the Horizontal System
Shown as Figure 3-12, there are a button and two knobs in the Horizontal Controls. The
following practices will gradually direct you to be familiar with the setting of horizontal
time base.
Figure 3-12 Horiz ontal Cont rol Zone
1. Turn the Horizontal Scale knob to change the horizontal time base setting and
observe the consequent status information change. Turn the Ho rizontal Scale knob to
change the horizontal time base, and it can be found that the Horizontal Time Base
display in the status bar changes accordingly.
2. Use the Horizontal Position knob to adjust the horizontal position of the signal in the
waveform window. The Horizontal Position knob is used to control the triggering
displacement of the signal or for other special applications. If it is applied to
triggering the displacement, it can be observed that the waveform moves horizontally
with the knob when you rotate the Horizontal Position knob.
Triggering displacement back to 0 shortcut key
Turn the Horizontal Position knob to change the horizontal position of channel and
push the Horizontal Position knob to set the triggering displacement back to 0 as a
shortcut key.
3. Push the Horizontal HOR button to switch between the normal mode and the wave
3.Junior User Guidebook
16
zoom mode.
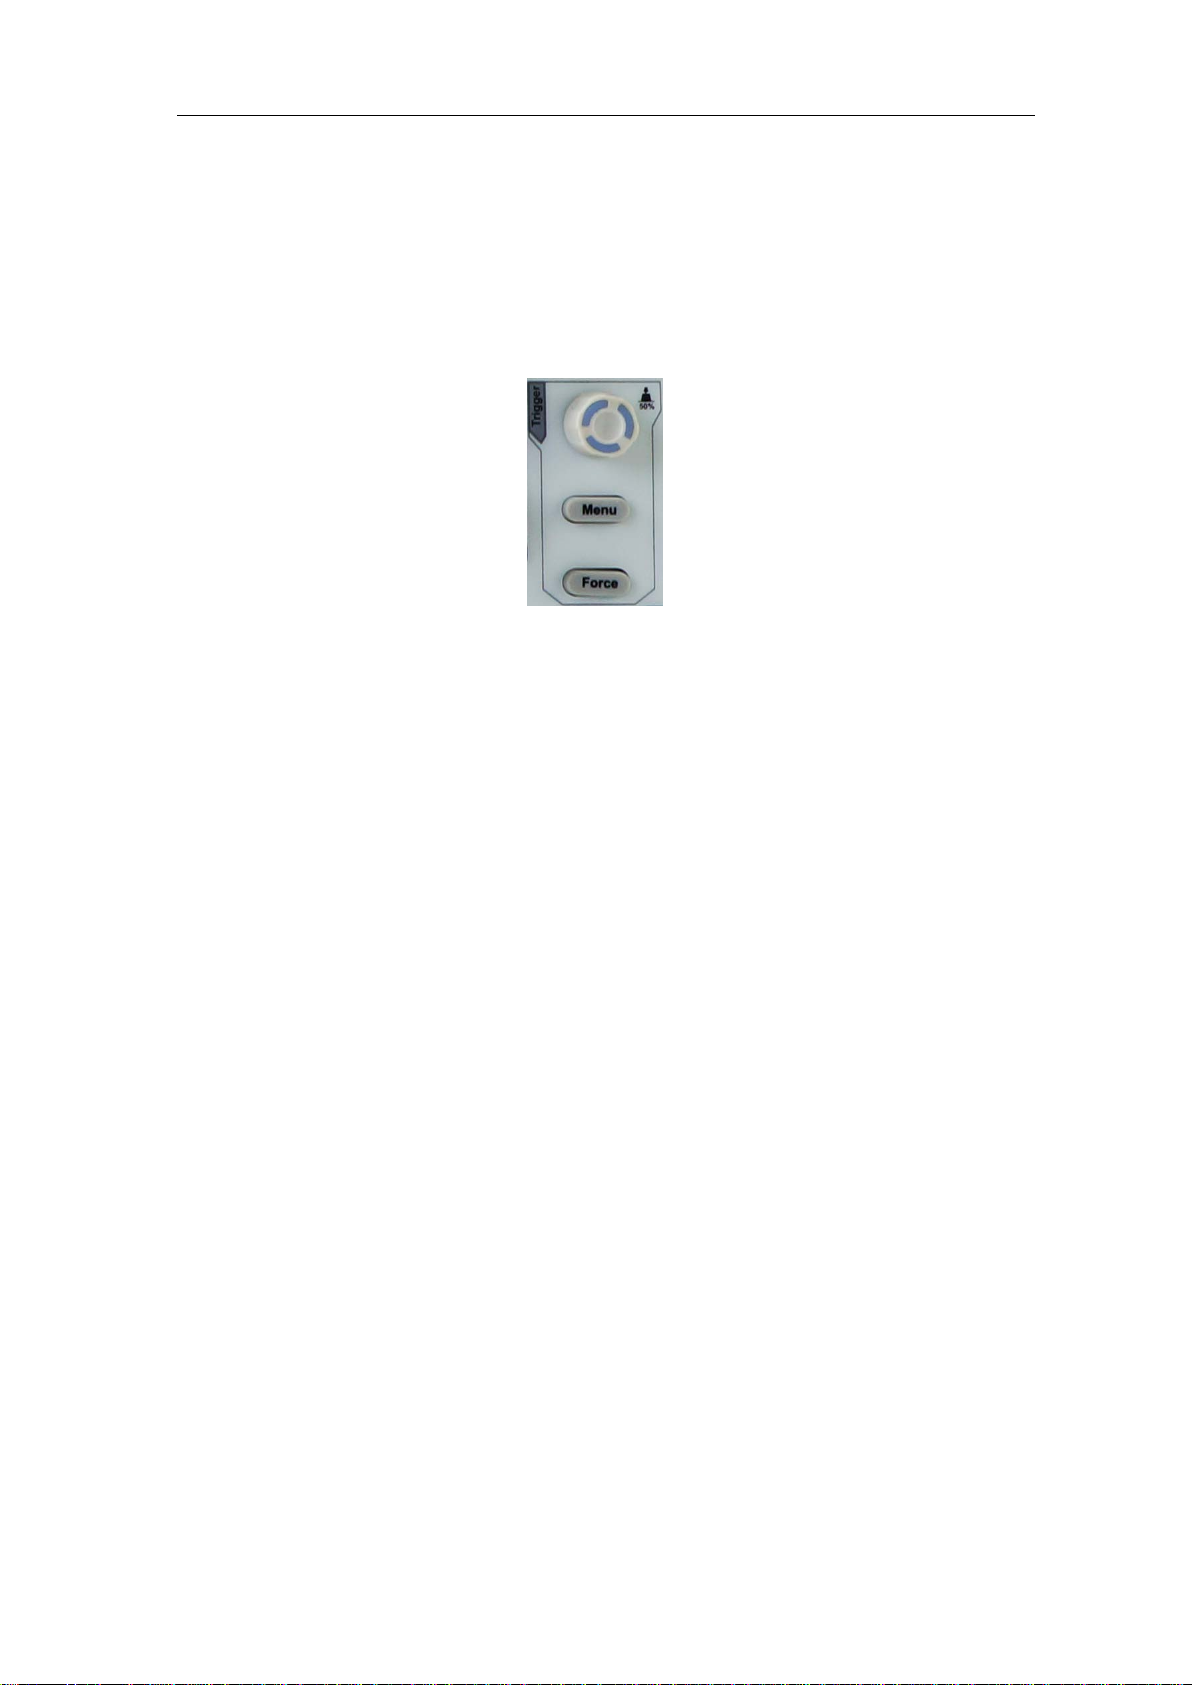
Introduction to the Trigger System
As shown in Figure 3-13, there are one knob and three buttons make up Trigger Controls.
The following practices will direct you to be familiar with the setting of the trigger system
gradually.
Figure 3-13 Trigger Control Zone
1. Push the T rigger Menu button and call out the trigger menu. With the operations of
the menu selection buttons, the trigger setting can be changed.
2. Use the Trigger Level knob to change the trigger level setting.
By turning the Trigger Lev el knob, the trigger i ndicator in the screen will move up
and down. With the movement of the trigger indicator, it can be observed that the
trigger level value displayed in the screen changes accordingly.
Note: Turning the Trigger Level knob can change trigger lev el value and it is als o
the hotkey to set trigger level as the vertical mid point values of the amplitude of the
trigger signal.
3. Push the Force button to force a trigger signal, which is mainly applied to the
"Normal" and "Single" trigger modes.

4.Advanced User Guidebook
17
4. Advanced User Guidebook
Up till now, you have already been familiar with the basic operations of the function areas,
buttons and knobs in the front panel of the oscilloscope. Based the introduction of the
previous Chapter, the user should have an initial knowledge of the determination of the
change of the oscilloscope setting through observing the status bar. If you have not been
familiar with the above-mentioned operations and methods yet, we advise you to read the
section of Chapter 3 "Junior User Guidebook".
This chapter will deal with the following topics mainly:
How to Set the Vertical System
How to Set the Horizontal System
How to Set the Trigger/Decoding System
How to Implement the Sampling Setup
How to Set the Display System
How to Save and Recall Waveform
How to Record/Playback Waveforms
How to Clone a waveform
How to Implement the Auxiliary System Function Setting
How to Update your Instrument Firmware
How to Measure Automatically
How to Measure with Cursors
How to Use Autoscale
How to Use Built-in Help
How to Use Executive Buttons
How to Print the Screen Image
It is recommended that you read this chapter carefully to get acquainted the various
measurement functions and other operation methods of the oscilloscope.

4.Advanced User Guidebook
18
Function
Menu
Setting
Description
DC
GROUND
Pass both AC and DC components of the input signal.
Disconnect the input signal.
ON
OFF
Display inverted waveform.
Display original waveform.
Turn the M knob to set the Amps/Volts ratio. The
Volts/Amp ratio is automatically calculated.
Full band
Get full bandwidth.
Limit the channel bandwidth to 20MHz to reduce
How to Set the Vertical System
The VERTICAL CONTROLS includes three menu buttons such as CH1, CH2 and
Math, and four knobs such as Vertical Position, Vertical Scale for each channel.
Setting of CH1 and CH2
Each chann el has an indep endent verti cal men u and each item is set res pect ively bas ed on
the channel.
To turn waveform s on or off (ch ann e l, math)
Pushing the CH1, CH2, or Math buttons have the following effect:
• If the waveform is off, the waveform is turned on and its menu is displayed.
• If the waveform is on and its menu is not displayed, its menu will be displayed.
• If the waveform is on and its menu is displayed, the waveform is turned off and its menu
goes away.
The description of the Channel Menu is shown as the following list:
Coupling
Inverted
Probe
Limit
1. To set channel coupling
AC
Attenu
MeasCurr
A/V (mA/V)
V/A (mV/A)
20M
0.001X
to
1000X
YES
NO
Block the DC component of the input signal.
Step by 1 – 2 – 5. Match this to the probe attenuation
factor to have an accurate reading of vertical scale.
If you are measuring current by probing the voltage
drop across a resistor, choose YES.
range is 100 mA/V - 1 KA/V.
Amps/Volts ratio = 1/Resistor value
display noise.
Taking the Channel 1 for example, the measured signal is a square wave signal containing
the direct current bias. The operation steps are shown as below:
(1) Push the CH1 button to show the CH1 SETUP menu.
(2) Select Coupling in the bottom menu.

4.Advanced User Guidebook
19
(3) Select DC in the right menu. Both DC and AC components of the signal are passed.
(4) Select AC in the right menu. The direct current component of the signal is blocked.
2. To adjust the probe attenuation
For correct measurem ent s, the attenuation coeffi cien t settings in the operating menu of the
Channel should always match what is on the probe (see "How to Set the Probe Attenuation
Coefficient" on P12). If the attenuation coefficient of the probe is 1:1, the menu setting of
the input channel should be set to X1.
Take the Channel 1 as an example, the attenuation coefficient of the probe is 10:1, the
operation steps are shown as follows:
(1) Push the CH1 button to show the CH1 SETUP menu.
(2) Select Probe in the bottom menu. Select Attenu in the right menu, turn the M knob to
set it as 10×.
3. To measure current by probing the voltage drop across a resistor
Take the Channel 1 as an examp le, if you are measuring current by probing the voltage
drop across a 1Ω resistor, the operation steps are shown as follows:
(1) Push the CH1 button to show CH1 SETUP menu.
(2) Select Probe in the bottom menu. In the right menu, set MeasCurr as YES, the A/V
radio menu will appear below. Select it; turn the M knob to set the Amps/Volts ratio.
Amps/Volts ratio = 1/Resistor value. Here the A/V radio should be set to 1.
4. To invert a waveform
Waveform inverted: the displayed signal is turned 180 degrees against the phase of the
earth potential.
Taking the Channel 1 for example, the operation steps are shown as follows:
(1) Push the CH1 button to show the CH1 SETUP menu.
(2) Select Inverted in the bottom menu, switch to ON. the waveform is invert ed. Push
again to switch to OFF, the waveform goes back to its original one.
5. To set bandwidth limit
When high frequency components of a waveform are not important to its analysis, the
bandwidth limit control can be used to reject frequencies above 20 MHz.
Taking the Channel 1 for example, the operation steps are shown as below:
(1) Push the CH1 button to show CH1 SETUP menu.
(2) Select Limit in the bottom menu.
(3) Select Full band in the right menu. The high frequenc y of the signal will be allowed
to pass.
(4) Select 20M i n the right menu. The bandwidth is limited to 20 MHz. The frequencies
above 20MHz will be rejected.

4.Advanced User Guidebook
20
Function Menu
Setting
Description
CH1
CH2
CH1
CH2
(div)
the vertical position of the Math
waveform
Vertical
(V/div)
Turn the M knob to adjust the vertical division of the Math
waveform
Switch to select the horizontal position or
M knob to adjust it
Position value
Switch to select the vertical position or
division of the FFT waveform,
turn the M knob to adjust it
User
Function
Use Mathematical Manipulation Function
The Mathematical Manipulation function is used to show the results of the addition,
multiplication, division and subtraction operations between two channels, the FFT
operation for a channel, advanced math feature including Intg, Diff, Sqrt, user defined
function, and digital filter. Press the Math button to display the menu on the bottom.
The Waveform Calculation menu:
Dual Wfm
Math
Factor1
Sign + - * / Select the sign of mathematical manipulation
Factor2
Vertical
Source
Window
Turn the M knob to adjust
CH1
CH2
Hamming
Rectangle
Blackman
Hanning
Kaiser
Select the signal source of the factor1
Select the signal source of the factor2
Select CH1 as FFT source.
Select CH2 as FFT source.
Select window for FFT.
Bartlett
FFT
Format
Hori (Hz)
Vertical
Intg, Diff, Sqrt, and user defined function
V RMS
Decibels
Radian
Degrees
Position value
Time base value/
Division value/
V RMS and Decibels are
time base of the FFT waveform, turn the
vertical

4.Advanced User Guidebook
21
CH1
CH2
Only the signals whose frequencies are
can pass the filter.
Only the signals whose frequencies are
greater than the current cutoff frequency
can pass the filter.
Only the signals whose frequencies are
and lower than the current cutoff
frequency upper can pass the filter.
Only the signals whose frequencies are
lower than the current cutoff frequency
or greater than the current cutoff
frequency upper can pass the filter.
Retangular
Blackman
cut-off fre
upper down
Vertical
(div)
Turn the M knob to adjust the vertical
position of Math waveform
Enable or disable FFT peak search.
peak.
DIR
channel
type
window
low-pass
high-pass
band-pass
band-reject
Tapered
Triangular
Hanning
Hamming
Select channel
lower than the current cut-off frequency
greater than the cutoff frequency down
down
Select window for digital filter
Turn the M knob to set cut-off frequency
Dynamic marker ▽ marks the FFT
FFT Peak
or
ON
OFF
Waveform math
Taking the additive operation between Channel 1 and Channels 2 for example, the
operation steps are as follows:
1. Press the Math button to display the math menu in the bottom. The pink M wavefor m
appears on the screen.
2. Select Dual Wfm Math in the bottom menu.
3. In the right menu, select Factor1 as CH1.
4. Select Sign as + in the right menu.
5. In the right menu, select Factor2 as CH2.
6. Select Vertical (div) in the right menu, turn the M knob to adjust the vertical position
of Math waveform.
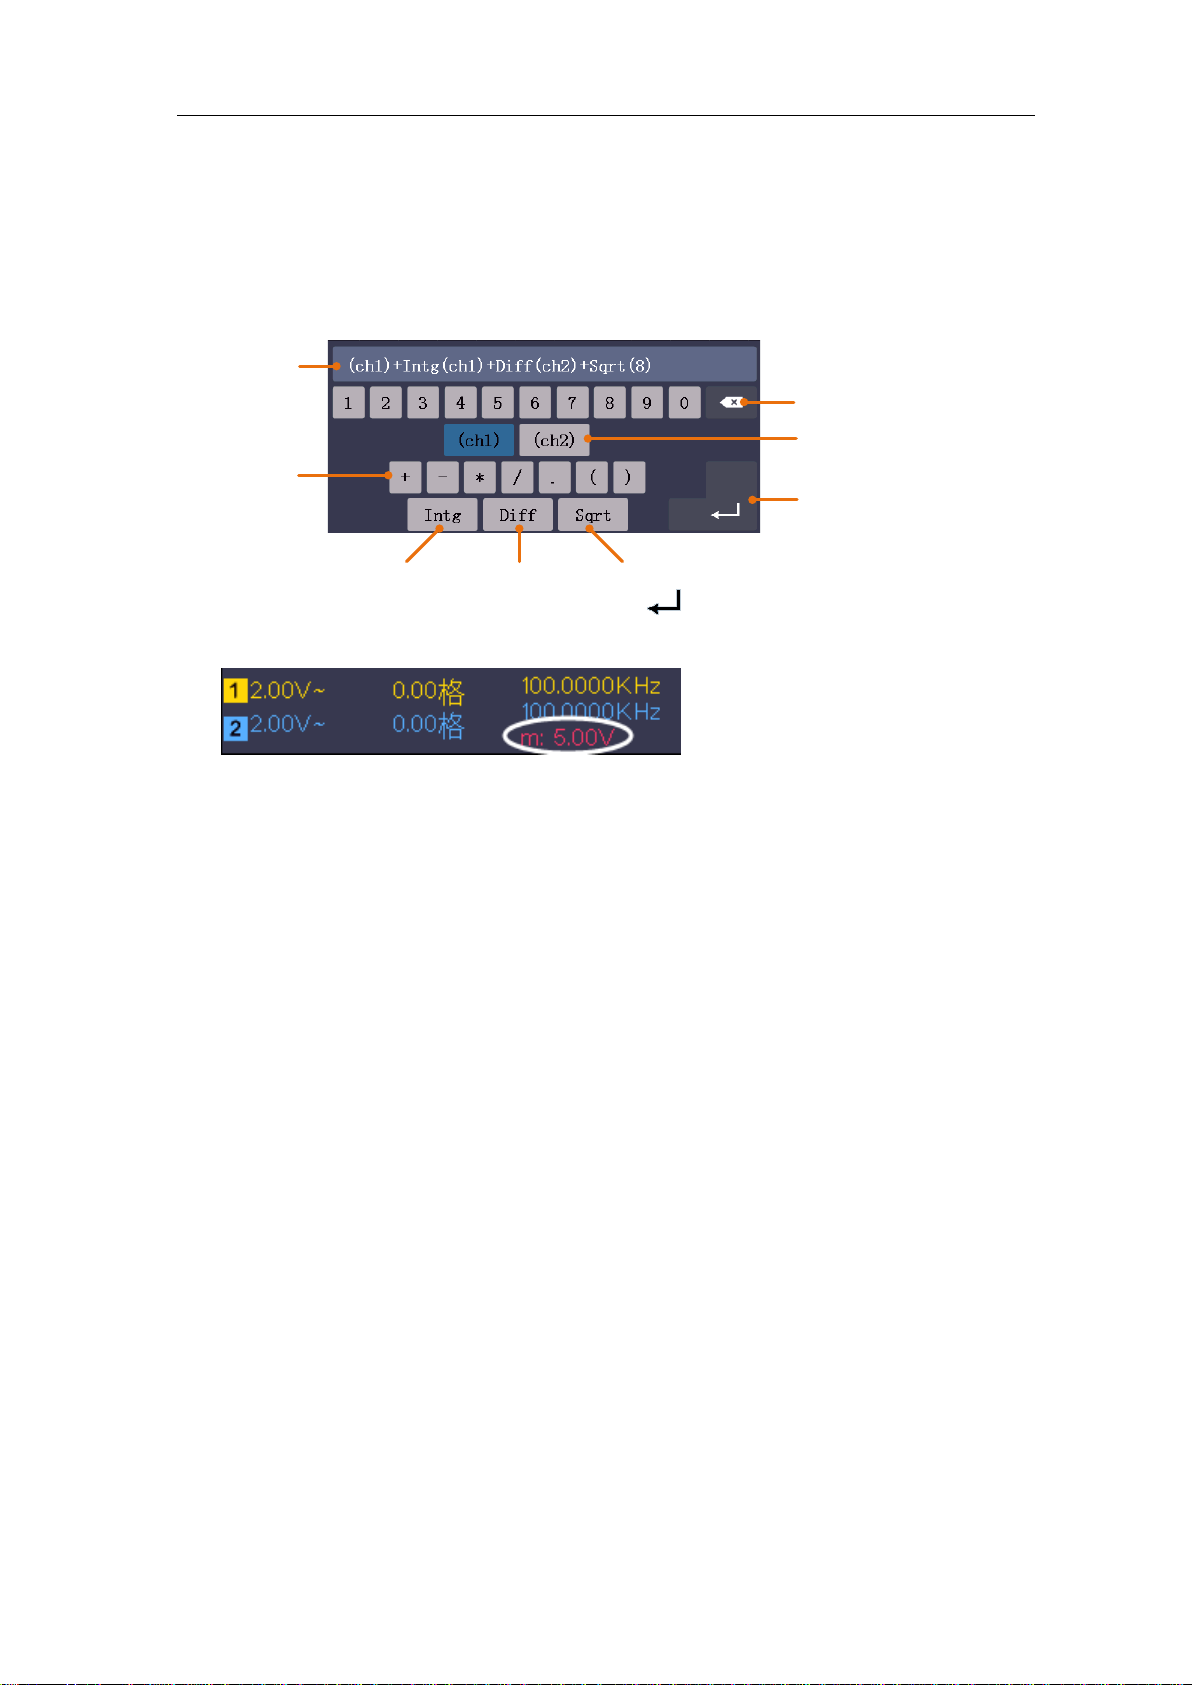
4.Advanced User Guidebook
22
Channel
Confirm
Clear
Operators
Integral
Differential
Square root
Expression
7. Select Vertical (V/div) in the right menu, turn the M knob to adjust the vertical division
of Math waveform.
User defined function
1. Press the Math button to display the math menu in the bottom.
2. Select User Function in the bottom menu, an expression input keyboard pops up.
3. Create an expression. When done, choose
in the keyboard to confirm
division of Math waveform is displayed at the left bottom of screen.
. The
Digital Filter
Digital filter provides 4 types of filters (low pass, high pass, band pass and band reject).
The specified frequencies can be filtered by setting the cut-off frequenc y.
1. Press the Math button to display the math menu in the bottom.
2. Select DIR in the bottom menu.
3. In the right menu, select channel as CH1 or CH2.
4. In the right menu, select type, select the desired filter type.
5. In the right menu, select window, select the desired window.
6. When low-pass or high-pass type is selected, select cut-off fre in the right menu.
When band-pass or band-reject type is selected, select upper or down in the right
menu. Turn M knob to adjust the frequency.
7. In the right menu, select Vertical (d iv), turn M knob to adjust the vertical position of
Math waveform. The voltage division of Math waveform is the same as the selected
channel.
Note: On the Scan format, digital filter is disabled.
Using FFT function
The FFT (fast Fourier transform) math function mathematically converts a time-domain
waveform into its frequency components. It is very useful for analyzing the input signal on
Oscilloscope. You can match these frequencies with known system frequencies, such as
system clocks, oscillators, or power supplies.
4.Advanced User Guidebook
23
It has slightly better
Transients or bursts where the signal levels
before and after the event are significantly
FFT function in this oscilloscope transforms 8192 data points of the time-domain signal
into its frequency components mathematically (the record length should be 10K or abov e).
The final frequency contains 4096 points ranging from 0Hz to Nyquist frequency.
Taking the FFT operation for example, the operation steps are as follows:
1. Press the Math button to display the math menu in the bottom.
2. Select FFT in the bottom menu.
3. In the right menu, select Source as CH1.
4. In the right menu, select Window. In the left menu, turn the M knob to select the
proper window type.
5. In the right menu, select Format. In the left menu, turn the M knob to select
amplitude unit (V RMS, Decibels) or phase unit (Radian, Degrees).
6. Select Hori (Hz) in the r ight menu; select repeatedly to make the symbol in front
of the horizontal position value (the upper one), turn the M knob to adjust the
horizontal position of FFT waveform; then select to make the symbol in front of
the time base value below, turn the M knob to adjust the time base of FFT waveform.
7. Select Vertical in the right menu; do the same operations as above to set the vertical
position and vertical division.
To select the FFT window
■ There are 6 FFT windows. Each one has trade-offs between frequency resolution and
magnitude accuracy. What you want to measure and your source signal characteristics
help you to determine which window to use. Use the following guidelines to select the
best window.
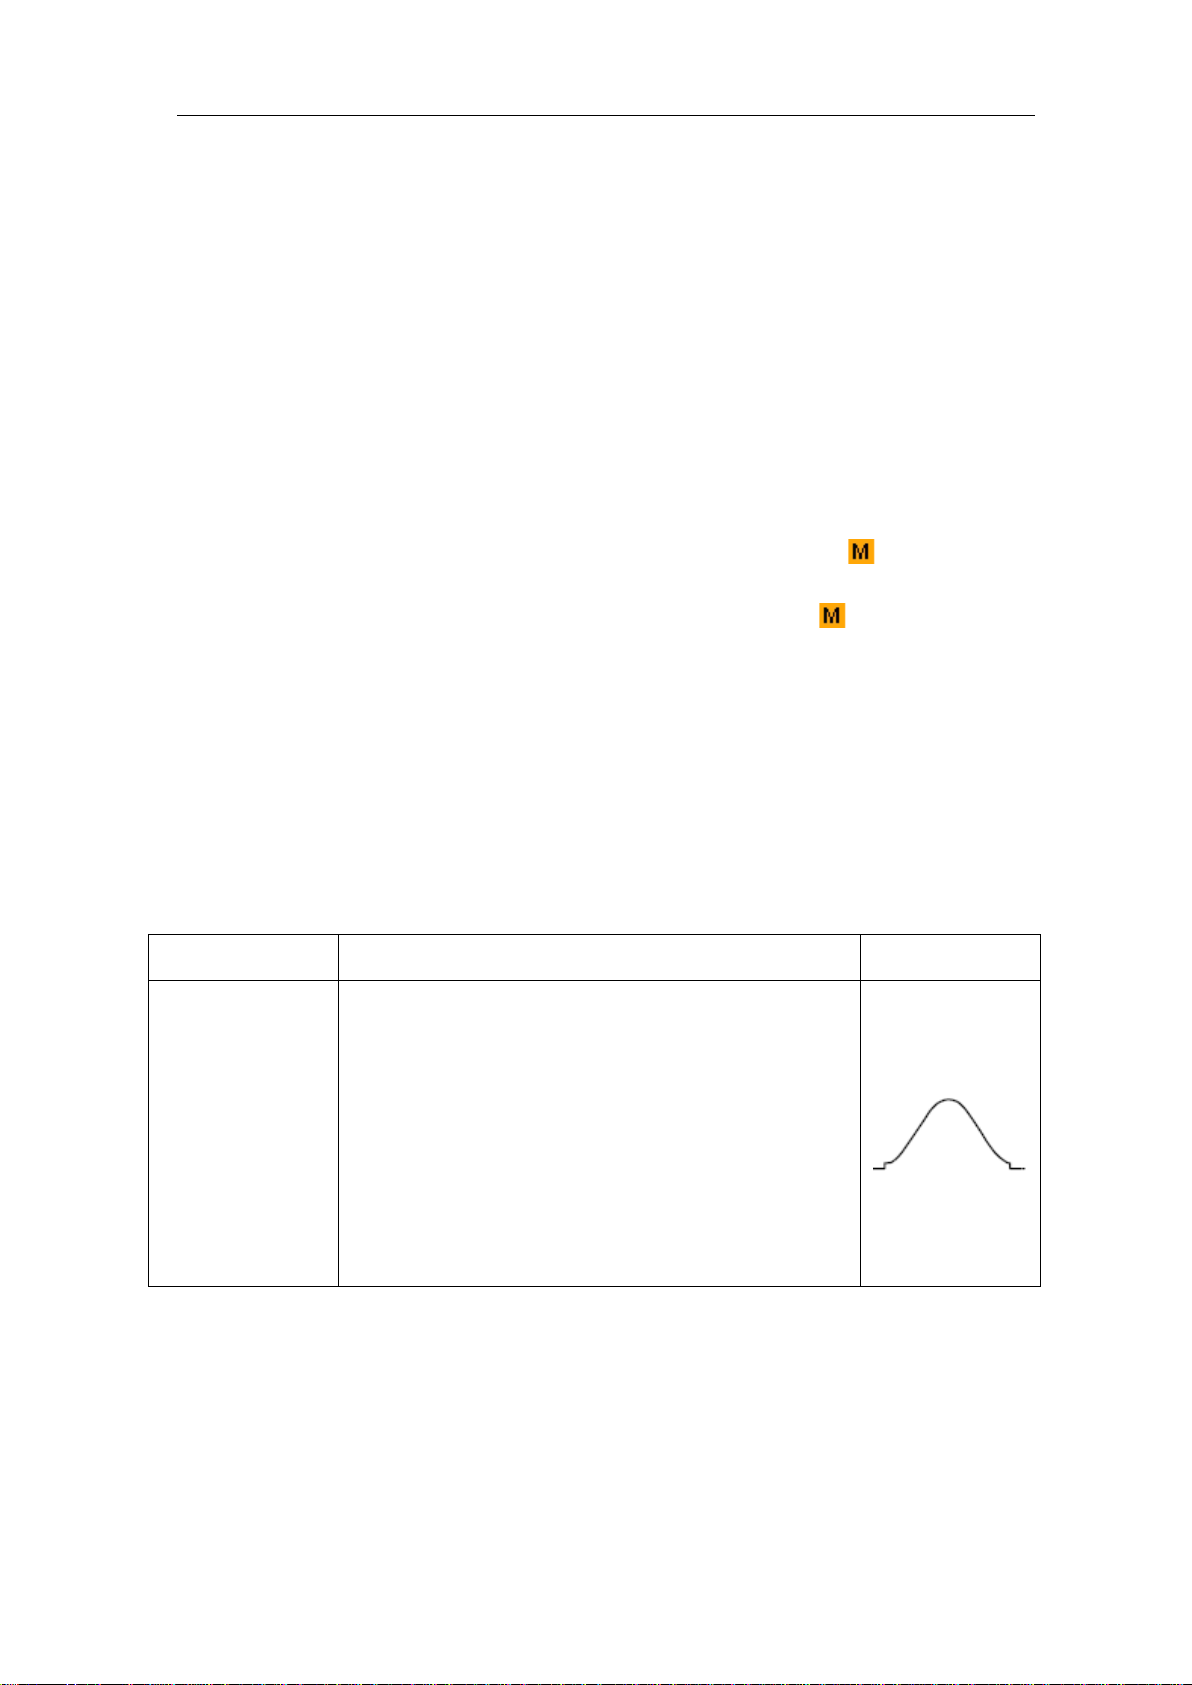
Type Characteristics Window
Better solution for magnitude than Rectangle, and
good for frequency as well.
frequency resolution than Hanning.
Recommend to use for:
Hamming
Sine, periodic and narrow band random noise.
different.
4.Advanced User Guidebook
24
repetitive signals and measuring frequency
Transients or bursts where the signal levels
before and after the event are significantly
The frequency resolution when using the Kaiser
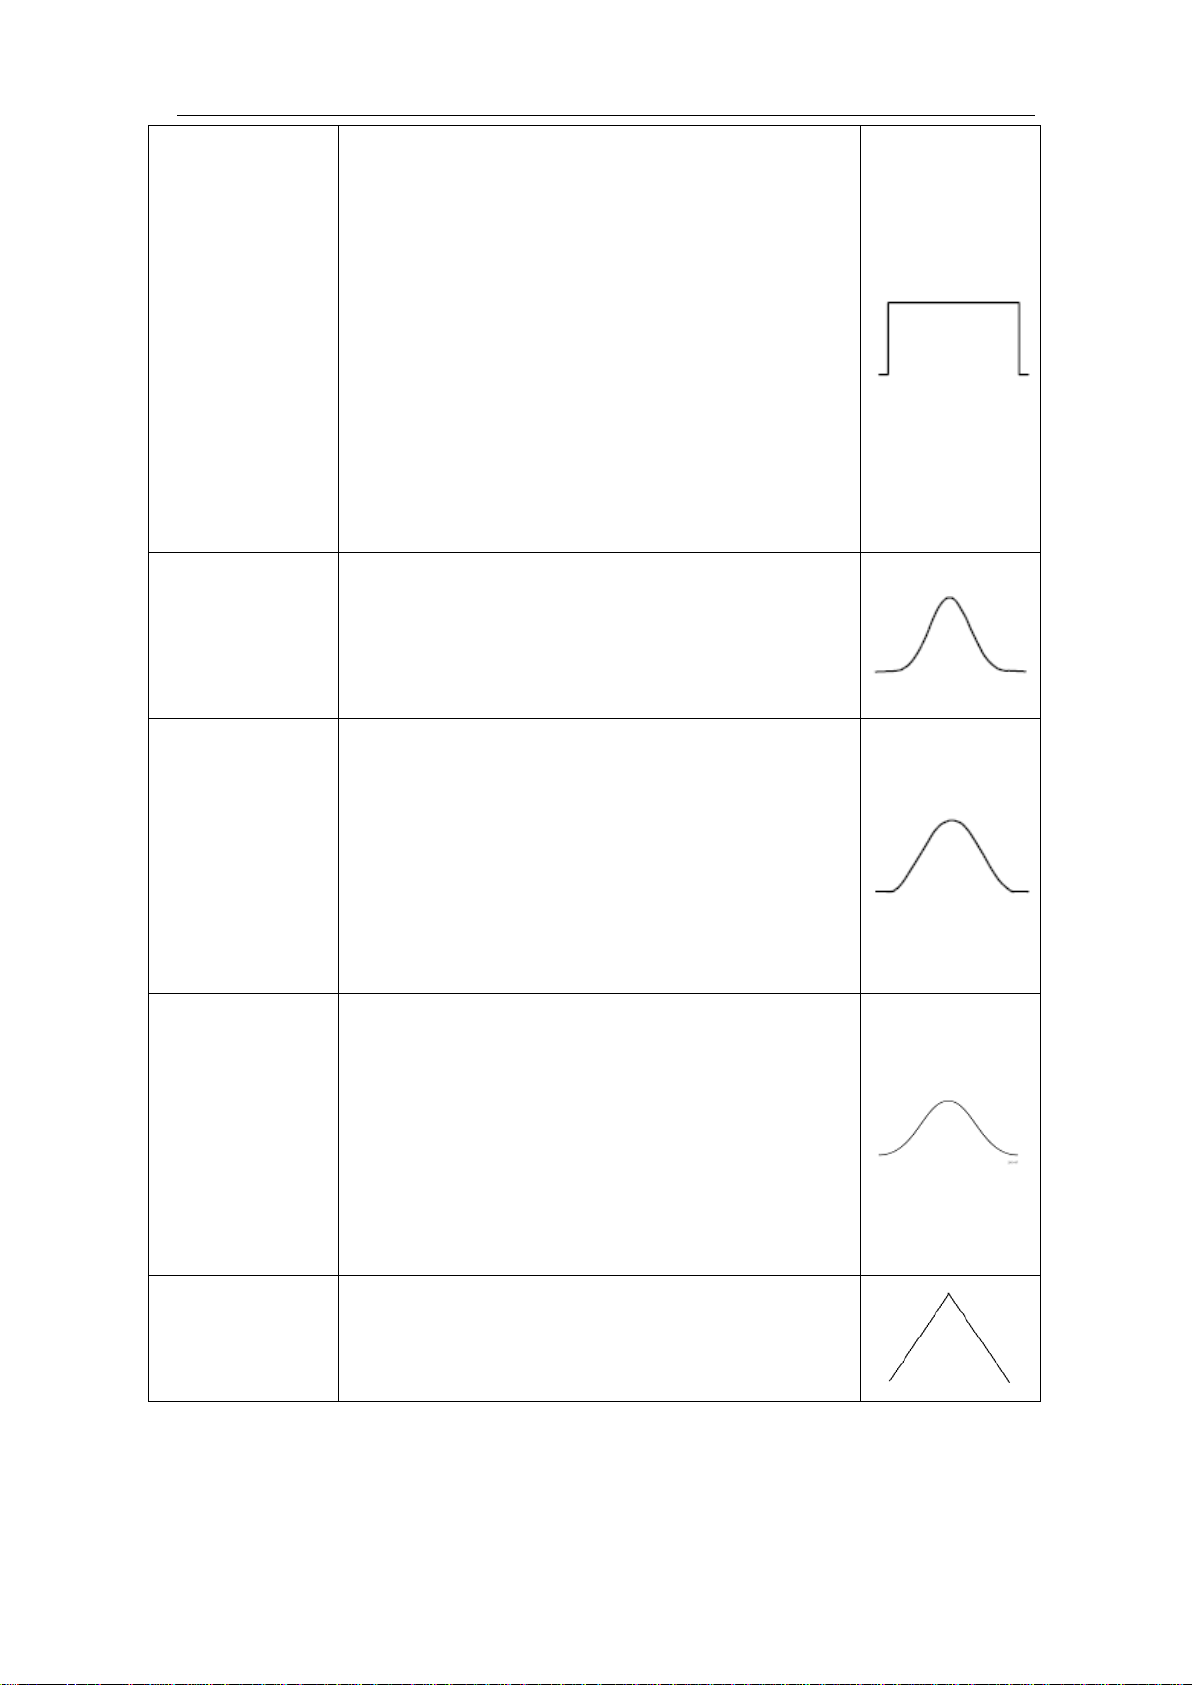
The Bartlett window is a slightly narrower variant
Best solution for frequency, worst for magnitude.
Best type for measuri ng the frequency spect rum of
non
components near DC.
Recommend to use for:
Rectangle
Blackman
Hanning
Transients o r burs ts, the signal level bef ore and
after the event are nearly equal.
Equal-amplitude sine waves with frequencies
those are very close.
Broadband random noise with a relatively slow
varying spectrum.
Best solution for magnitude, worst for frequency.
Recommend to use for:
Single frequency waveforms, to find higher
order harmonics.
Good for magnitude, but poorer frequency
resolution than Hamming.
Recommend to use for:
Sine, periodic and narrow band random noise.
different.
window is fair; the spectral leakage and amplitude
accuracy are both good.
Kaiser
The Kaiser window is best used when frequencies
are very close to the same value but have widely
differing amplitudes (the side lobe level and shape
factor are closest to the traditional Gaussian RBW ).
This window is also good for random signals.
Bartlett
of the triangular window, with zero weight at both
ends.
Notes for using FFT
Use the default dB scale for details of multiple frequencies, even if they have very
different amplitudes. Use the Vrms scale to compare frequencies.
4.Advanced User Guidebook
25
DC component or offset can cause incorrect magnitude values of FFT waveform. To
minimize the DC component, choose AC Coupling on the source signal.
To reduce r andom noise and aliased components in repetitive or single-sho t events, set
the oscilloscope acquisition mode to average.
What is Nyquist freque nc y?
The Nyquist frequ ency is the highes t frequency that any real-time digitizing oscilloscope
can acquire without aliasing. This frequency is half of the sample rate. Frequencies above
the Nyquist frequency will be under sampled, which causes aliasing. So pay more
attention to the relation between the frequency being sampled and measured.
Use Vertical Position and Scale Knobs
1. The Vertical Position knob is used to adjust the vertical positions of the
waveforms.
The analytic resolution of this control knob changes with the vertical division.
2. The Vertical Scale knob is used to regulate the vertical resolution of t he wave
forms. The sensitivity of the vertical division steps as 1-2-5.
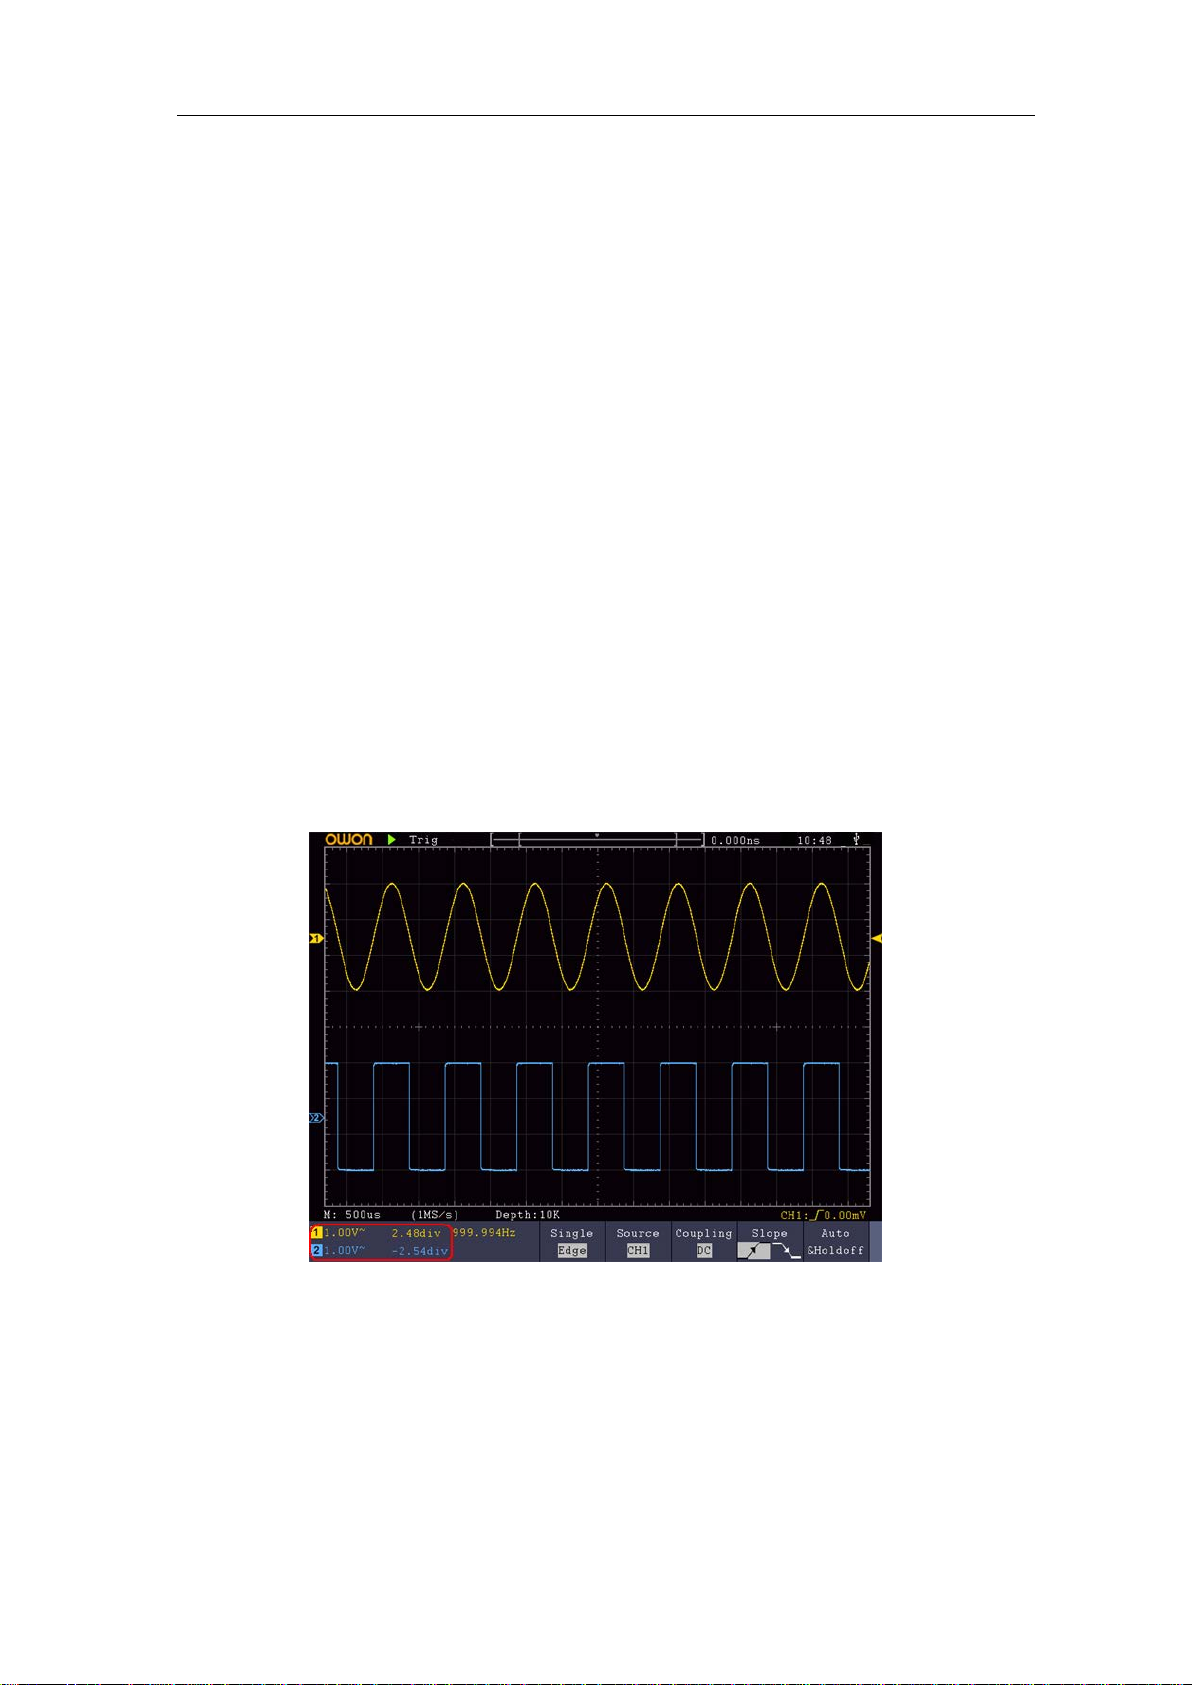
The vertical position and vertical resolution is displ ayed at the left bottom corner of
the screen (see Figure 4-1).
Figure 4-1 Information about Vertical Position
How to Set the Horizontal System
The HORIZONTAL CONTROLS includes the Horizontal HOR button and such
knobs as Horizontal Position and Horizontal Scale.
1. Horizontal Position knob: this knob is used to adjust the horizontal positions of
 Loading...