

Page 1
Blot Scanner
User Guide
™
®
Page 2
Notes on Safety
LI-COR products have been designed to be safe when operated in the manner
described in this manual.
The safety of this product can not be guaranteed if the product is used in any other
way than is specified in this manual. The C-DiGit Blot Scanner is intended to be
used by qualified personnel. Read this entire manual before using the C-DiGit Blot
Scanner.
Equipment Markings
!
Manual Markings
WARNING Warnings must be followed carefully to avoid bodily injury.
CAUTION Cautions must be observed to avoid damaging your equipment.
NOTE Notes contain additional information and useful tips.
IMPORTANT Information of importance to prevent procedural mistakes in the
WARNING: This equipment generates, uses, and can radiate radio frequency energy and if not
installed in accordance with the instruction manual, may cause interference to radio
communications. It has been tested and found to comply with the limits for a Class A computing
device pursuant to Subpart J of Part 15 of FCC rules, which are designed to provide a reasonable
protection against such interference when operated in a commercial environment. Operation of
this equipment in a residential area is likely to cause interference in which case the user, at his
own expense, will be required to take whatever measures may be required to correct the
interference.
CE Marking
This product (model number 3600) is a CE-marked product. For conformity
information, contact LI-COR Support at biosupport.licor.com. Outside of the U.S.,
contact your local sales office or distributor.
The product is marked with this symbol when it is necessary for you to
refer to the manual or accompanying documents in order to protect
against damage to the product.
operation of the equipment or related software. Failure to comply
may result in a poor experimental outcome but will not cause
bodily injury or equipment damage.
Federal Communications Commission
Radio Frequency Interference Statement
ii
Page 3

Notice
The information contained in this document is subject to change without notice. LI-COR
MAKES NO WARRANTY OF ANY KIND WITH REGARD TO THIS MATERIAL,
INCLUDING, BUT NOT LIMITED TO THE IMPLIED WARRANTIES OF
MERCHANTABILITY AND FITNESS FOR A PARTICULAR PURPOSE. LI-COR shall not be
liable for errors contained herein or for incidental or consequential damages in connection
with the furnishing, performance, or use of this material.
This document contains proprietary information that is protected by copyright. All rights are
reserved. No part of this document may be photocopied, reproduced, or translated to
another language without prior written consent of LI-COR, Inc.
Printing History
Publication Number 977-13448
1st Printing January, 2013
LI-COR
Inc in the United States and other countries. Third party trademarks, trade names, and
product names may be trademarks or registered trademarks of their respective owners. You
may not remove or alter any trademark, trade names, product names, logo, copyright or
other proprietary notices, legends, symbols, or labels. This End-User License Agreement
does not authorize you to use LI-COR’s or its licensors’ names or any of their respective
trademarks.
LI-COR is an ISO 9001 registered company. Copyright 2013 LI-COR, Inc. All rights
reserved. Specifications subject to change. The C-DiGit Blot Scanner is covered by U.S.
patents, foreign equivalents, and patents pending.
®
C-DiGit™, and WesternSure™ are trademarks or registered trademarks of LI-COR,
iii
Page 4

Table of Contents
Section 1. Introduction
About C-DiGit Blot Scanner.............................................................................. 1-1
What's in the Box ............................................................................................. 1-2
Placement in the Laboratory.............................................................................. 1-2
Ambient Laboratory Conditions................................................................... 1-2
Space Requirements.................................................................................... 1-3
Safety Considerations ........................................................................................ 1-3
Chemical Safety.......................................................................................... 1-3
Electrical considerations.............................................................................. 1-3
Scanning Surface and Rear Safety Labels ..................................................... 1-3
Fuse Replacement....................................................................................... 1-4
External Panels and Controls............................................................................. 1-4
Front Panel ................................................................................................. 1-4
Back Panel.................................................................................................. 1-5
Scanning Surface ........................................................................................ 1-5
Scanning Surface Safety .............................................................................. 1-6
Sample Placement ...................................................................................... 1-6
Section 2. Quick Start Tutorial
Section 3. Scanning Membranes
Placing the Membrane on the C-DiGit Blot Scanner Scanning Surface ............... 3-1
Using Blocking Buffer....................................................................................... 3-2
Primary and Secondary Antibodies.................................................................... 3-3
Washing Buffer................................................................................................. 3-4
Substrates ......................................................................................................... 3-4
Imaging ............................................................................................................ 3-5
Section 4. Image Studio for C-DiGit
Overview ......................................................................................................... 4-1
Learning the Software.................................................................................. 4-1
Optional Key Tips....................................................................................... 4-1
The Image Studio Main Window....................................................................... 4-2
Quick Launch Buttons ...................................................................................... 4-3
The Application Menu ...................................................................................... 4-3
Save ................................................................................................................. 4-4
Save as PDF...................................................................................................... 4-4
Print ................................................................................................................. 4-5
Export............................................................................................................... 4-6
Single Image View ...................................................................................... 4-6
iv
Page 5

Export Current Image .................................................................................. 4-7
Multiple Image View................................................................................... 4-9
Edit File Name ............................................................................................4-11
Copy Image ................................................................................................ 4-12
Move Image................................................................................................ 4-14
Import .............................................................................................................. 4-16
Image Studio............................................................................................... 4-17
Odyssey......................................................................................................4-18
Pearl........................................................................................................... 4-19
Other Image ...............................................................................................4-20
Delete Images................................................................................................... 4-20
Work Area........................................................................................................ 4-21
Switch ........................................................................................................ 4-21
Import Settings............................................................................................ 4-21
Instrument ........................................................................................................4-22
Information ............................................................................................... 4-22
Connect .................................................................................................... 4-22
Disconnect................................................................................................ 4-23
Update Software........................................................................................ 4-23
Logs .................................................................................................................4-23
Print.......................................................................................................... 4-23
Export ....................................................................................................... 4-24
Update .............................................................................................................4-24
Import Key........................................................................................................4-24
Preferences....................................................................................................... 4-24
General ...................................................................................................... 4-25
Image LUTs ................................................................................................4-26
Image View ................................................................................................4-26
XLS Export .................................................................................................. 4-27
Viewing and Manipulating Image Data .............................................................4-28
Image LUTs............................................................................................... 4-28
Link LUTs Across Filtered Images............................................................... 4-31
Profiles ......................................................................................................4-31
Concentration ...........................................................................................4-32
Acquire Ribbon ................................................................................................ 4-33
Status ........................................................................................................ 4-34
Setup......................................................................................................... 4-34
Sensitivity.................................................................................................. 4-35
Scanner..................................................................................................... 4-35
Image Ribbon ................................................................................................... 4-35
View the Image ......................................................................................... 4-35
Adjust the Image Appearance ....................................................................4-38
View Mode ...............................................................................................4-40
Slide Show ................................................................................................4-40
Create ....................................................................................................... 4-40
Crop the Image.......................................................................................... 4-43
Crop Marks ............................................................................................... 4-43
Data Analysis (Shapes and Annotation Ribbons)................................................ 4-45
v
Page 6

Add and Manipulate Shapes Manually ....................................................... 4-45
Profiles Tab ............................................................................................... 4-47
Auto Adjust ............................................................................................... 4-47
Subtract the Background............................................................................ 4-48
Show......................................................................................................... 4-49
Annotate the Image ................................................................................... 4-49
Tables and Table Ribbon ..................................................................................4-51
Images Table............................................................................................. 4-51
Add or Delete a Column............................................................................ 4-52
Edit the Image Title.................................................................................... 4-53
Add Custom Columns................................................................................ 4-54
Paste Data in a Column ............................................................................. 4-55
Paste Data from a Spreadsheet to a Column ...............................................4-56
Copy Data to a Spreadsheet....................................................................... 4-56
Sort by Column ......................................................................................... 4-56
Filter the Table Manually........................................................................... 4-57
Define Filters............................................................................................. 4-57
View the Shapes Table............................................................................... 4-59
Exporting Data .......................................................................................... 4-60
Print Images and Create Reports........................................................................4-62
Print an Image........................................................................................... 4-62
Save an Image as a PDF File ......................................................................4-63
Print a Report ............................................................................................ 4-64
Save a Report as a PDF File .......................................................................4-66
Section 5. Computer Connections and Networking
Direct Connection Via USB Cable..................................................................... 5-2
Direct Connection Via Ethernet Cable............................................................... 5-2
Connection to Existing LAN .............................................................................. 5-3
Section 6. Maintenance and Troubleshooting
Maintenance .................................................................................................... 6-1
Troubleshooting – Hardware Problems.............................................................. 6-1
System Requirements .................................................................................. 6-1
Cannot Connect to C-DiGit Blot Scanner..................................................... 6-1
USB Cabling Problems ................................................................................ 6-2
Front Panel Warning Light Indicates an Error ............................................... 6-3
Resetting the Instrument .............................................................................. 6-3
Troubleshooting – Chemistry Problems ............................................................. 6-3
High Background Due to Substrate.............................................................. 6-3
High Background from Wrapping the Blot in Plastic Wrap........................... 6-4
Low Signal.................................................................................................. 6-5
Troubleshooting – Image Studio Problems......................................................... 6-5
Obtaining Technical Support ............................................................................ 6-6
vi
Page 7

Appendix A. Specifications
Appendix B. Windows® XP Installation Instructions
Appendix C. Training Video Links
vii
Page 8
Introduction
1
About C-DiGit Blot Scanner
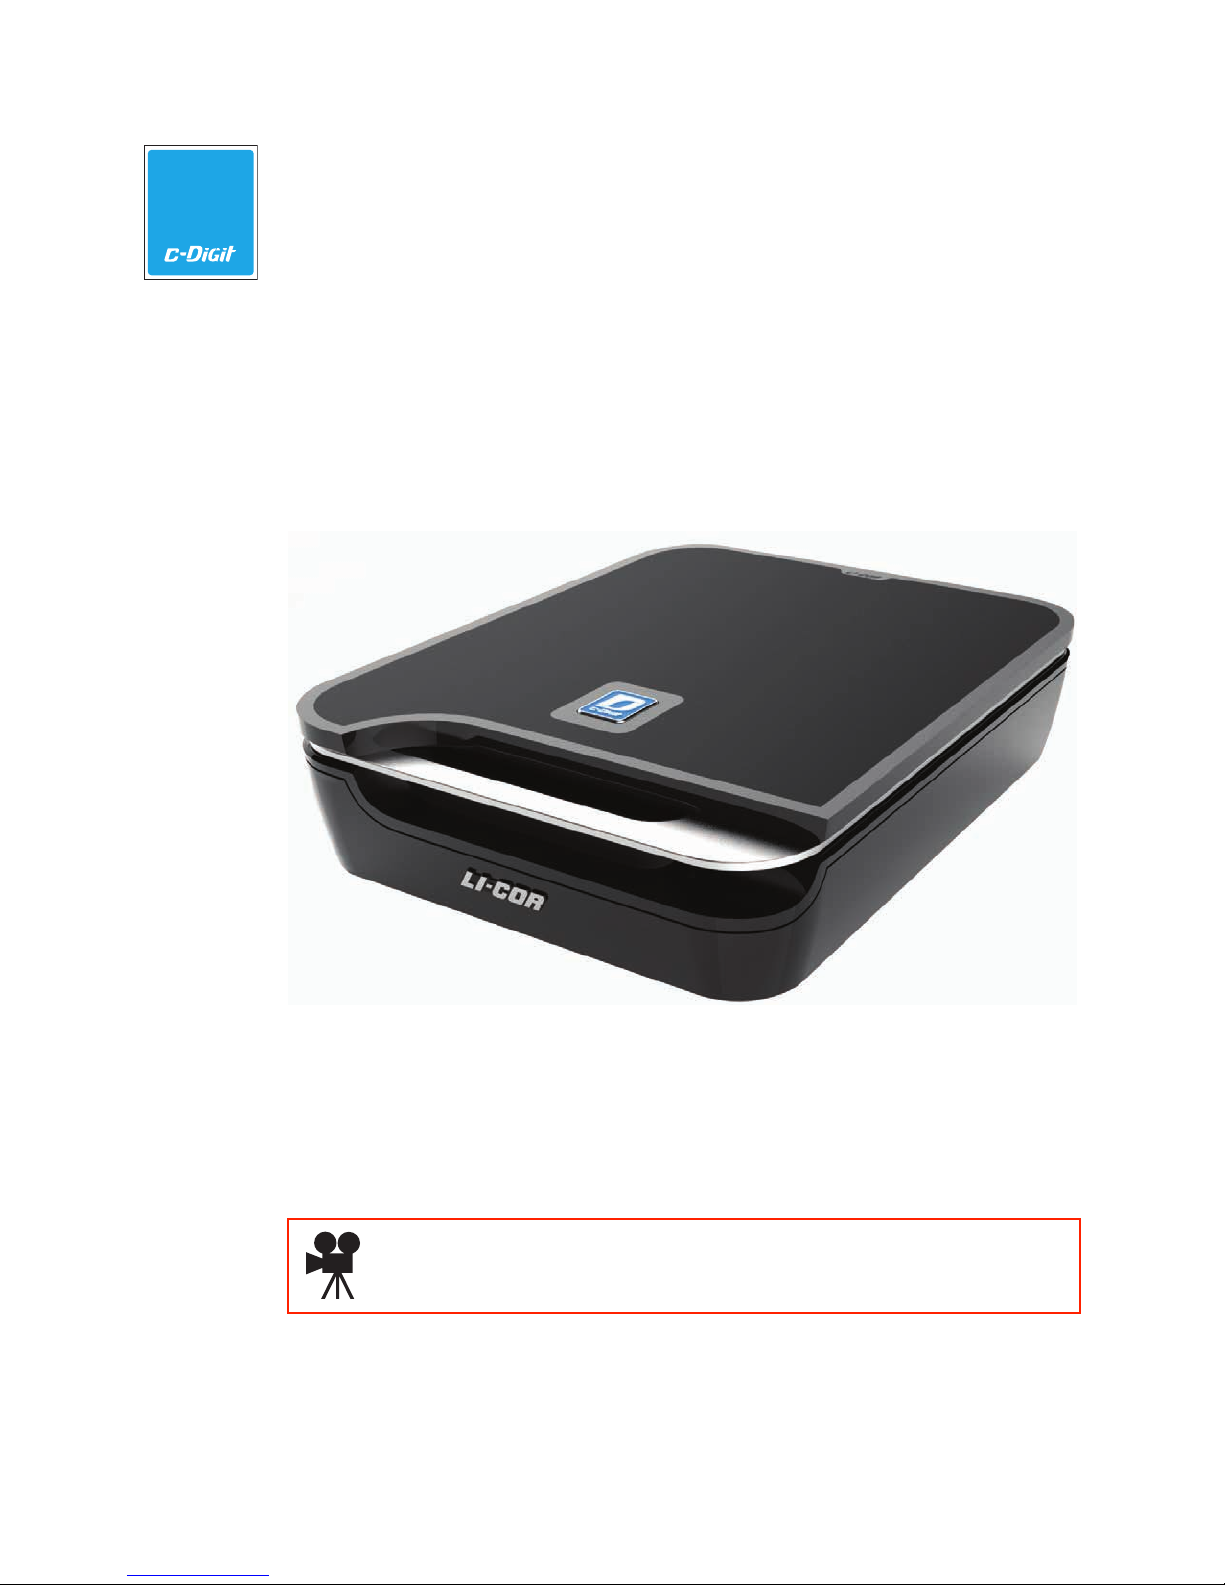
The C-DiGit Blot Scanner is designed to image membranes for chemiluminescent
Western blot analysis using digital methods, eliminating the need for traditional
exposure to film. Before image acquisition is started, a membrane is placed on the
scanning surface and the lid is closed. Image acquisition is started via Image Studio
Software (Section 4).
The C-DiGit has one detection channel that detects visible wavelength emissions
from chemiluminescent substrates.
The C-DiGit Blot Scanner is a networkable device, and can be connected directly
to a computer (Macintosh
through wired networks.
Click here to watch an introductory video about the C-DiGit Blot
Scanner.
C-DiGit User Manual 1-1
®
or PC) via Ethernet or USB cables, or can be connected
Page 9
What’s in the Box
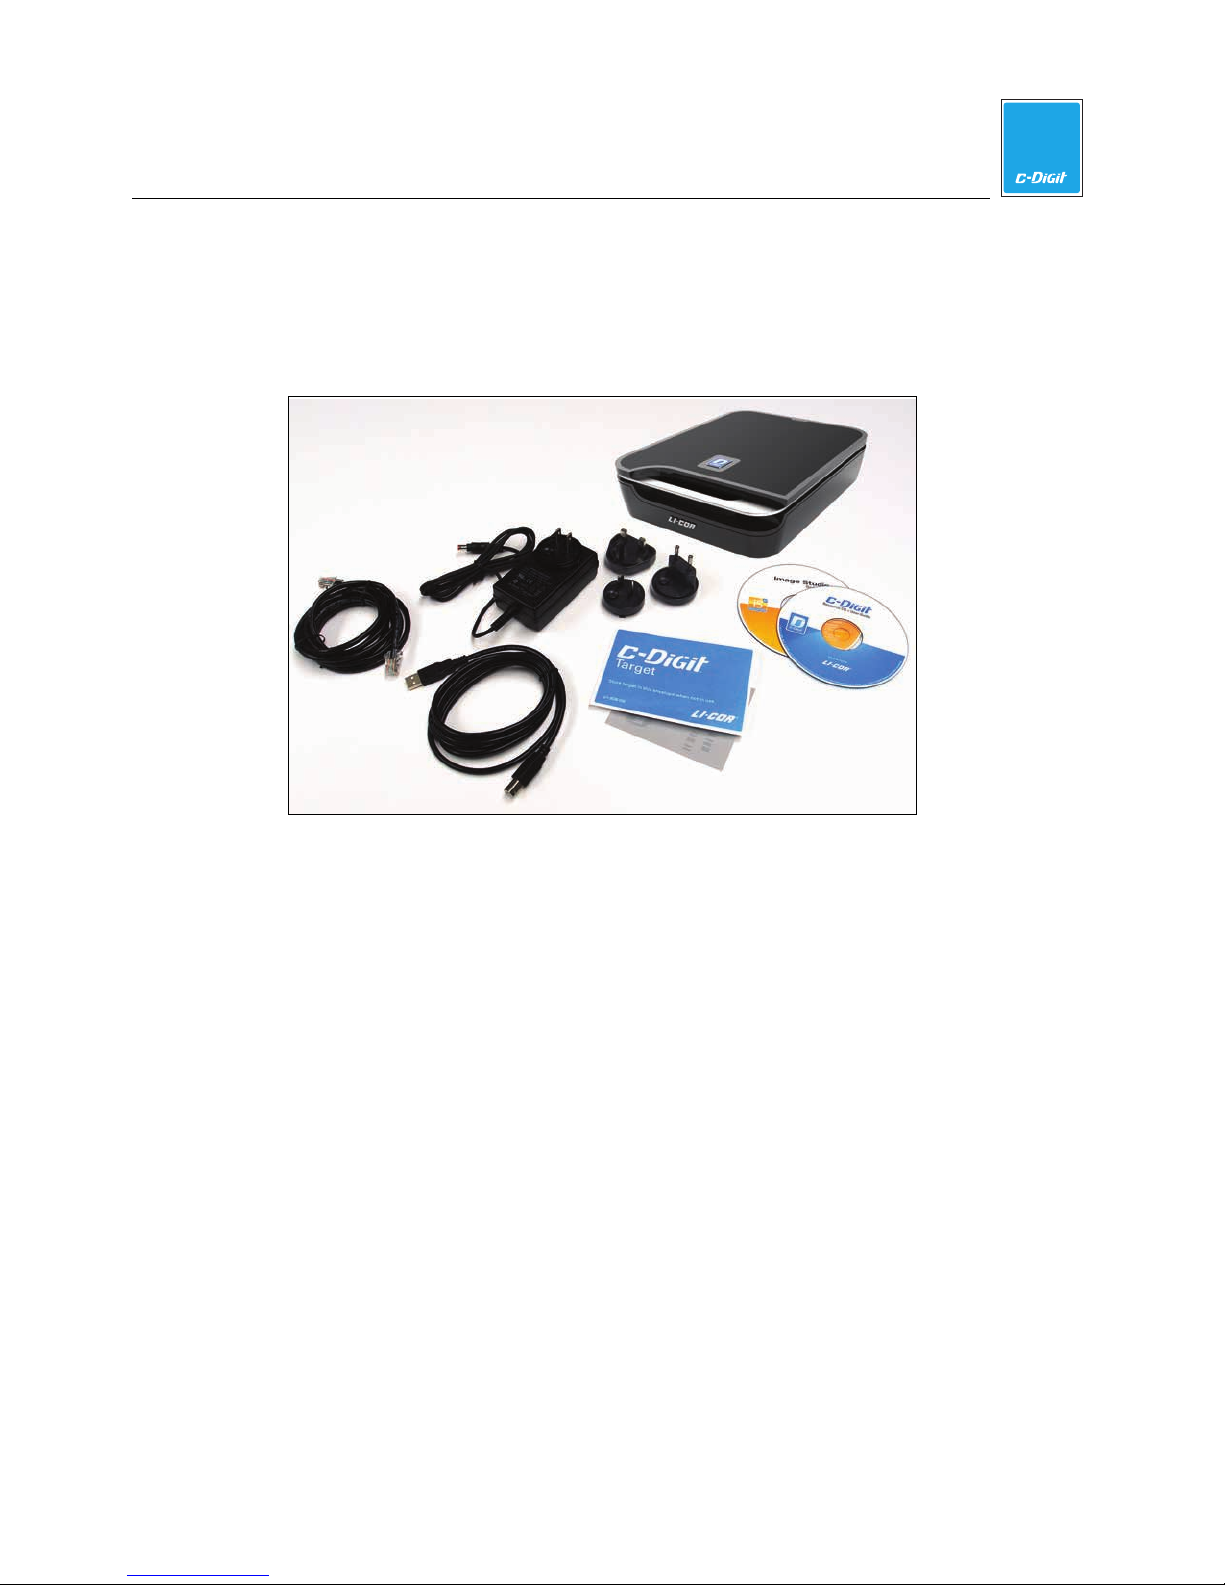
In addition to the C-DiGit Blot Scanner, you will find the items shown below
(l-r): 1) Ethernet and 2) USB cables, 3) a power supply with interchangeable plugs,
4) a C-DiGit Target image, and 5) Image Studio and Resource CDs.
1
Introduction
3
1
2
The C-DiGit Target (p/n 6536-030) is a photosensitive card used to verify that your
C-DiGit Blot Scanner is functioning properly; the card is briefly exposed to room
light and then imaged on the instrument. If the acquired pattern matches the target
image, the C-DiGit Blot Scanner is functioning as it should, and is ready to image
your sample. Instructions for using the Target are given below in Section 2, Quick
Start Tutorial. The Target should be stored in the blue envelope when not in use.
* Use only the provided cables with the C-DiGit Blot Scanner.
Placement in the Laboratory
The C-DiGit Blot Scanner weighs approximately 2.18 kg (4.8 lbs.). The instrument
should be placed on a level surface that is at a workable height for the user.
Ambient Laboratory Conditions
Place the C-DiGit Blot Scanner away from external heat sources (furnaces,
windows, etc.). Additional heating can cause high temperatures within the
enclosure. Place the instrument away from sinks or other sources of water that pose
a shock hazard. Recommended operating conditions are 15-30 °C and a dew point
no greater than 25 °C to prevent condensation on the instrument.
5
4
C-DiGit User Manual 1-2
Page 10
Space Requirements
The C-DiGit Blot Scanner requires an area 27.94 cm L (11.0") x 22.23 cm W
(8.75") x 7.3 cm H (2.875", lid closed), or 31.12 cm, (12.25”, lid open).
Safety Considerations
Chemical Safety
LI-COR Biosciences recommends that all chemicals be handled carefully, and that
safe laboratory procedures be followed at all times. Be aware of the hazards
associated with any chemical before you begin work.
WARNING: The C-DiGit Blot Scanner should not be used with any radioactive
materials.
Electrical Considerations
The C-DiGit Blot Scanner includes a power supply that plugs into a wall outlet,
with an output that plugs into the C-DiGit instrument.
Do not locate the C-DiGit Blot Scanner where the power supply cord will be
walked on or exposed to water or chemical spills.
The C-DiGit Blot Scanner draws a maximum of 1 ampere at 120V (see Appendix A
for complete specifications). If a power strip or surge protector is used, make sure
the total of the ampere ratings on the instruments plugged into the extension cord
does not exceed the extension cord ampere rating. Also make sure the total
amperage of instruments plugged into the wall outlet does not exceed the
amperage capacity for the outlet (usually 15 or 20 amperes in the United States).
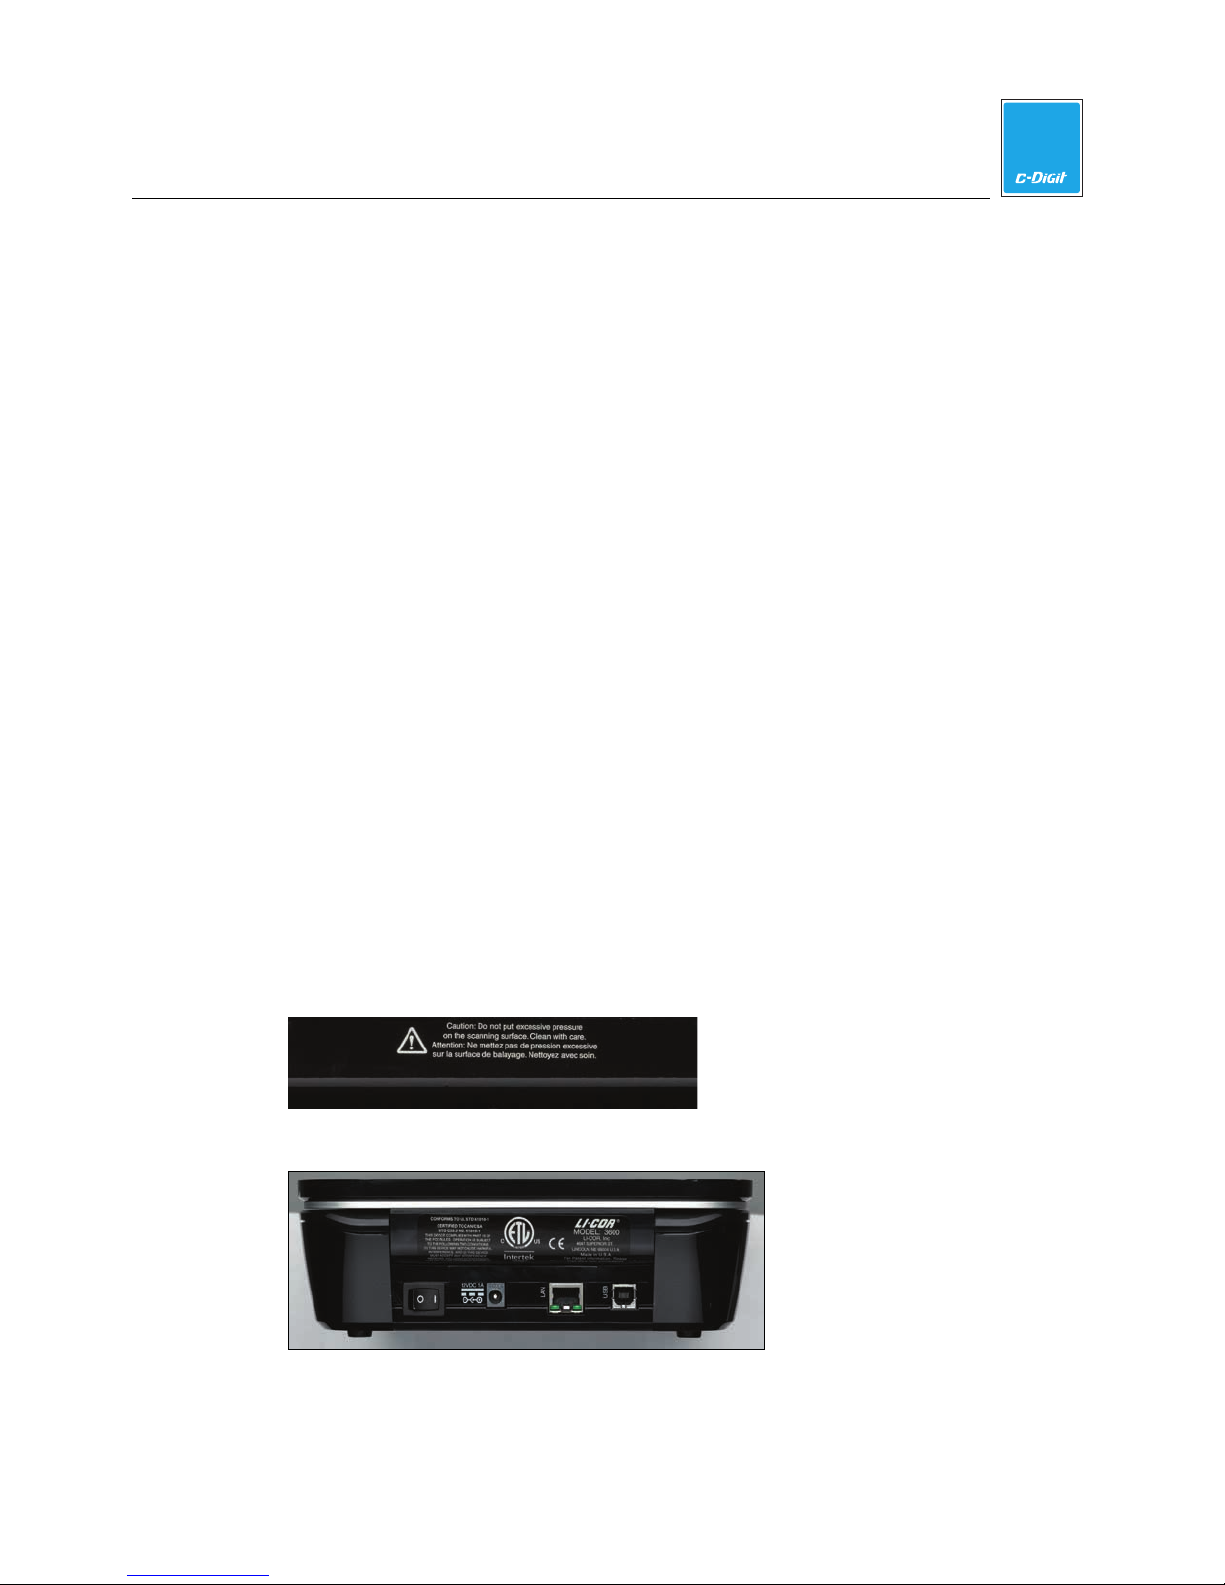
Scanning Surface and Rear Safety Labels
1
Introduction
Figure 1-1. Scanning surface instrument safety label.
Figure 1-2. Rear instrument safety label.
C-DiGit User Manual 1-3
Page 11
Fuse Replacement
There are no user replaceable fuses in this instrument.
External Panels and Controls
Front Panel
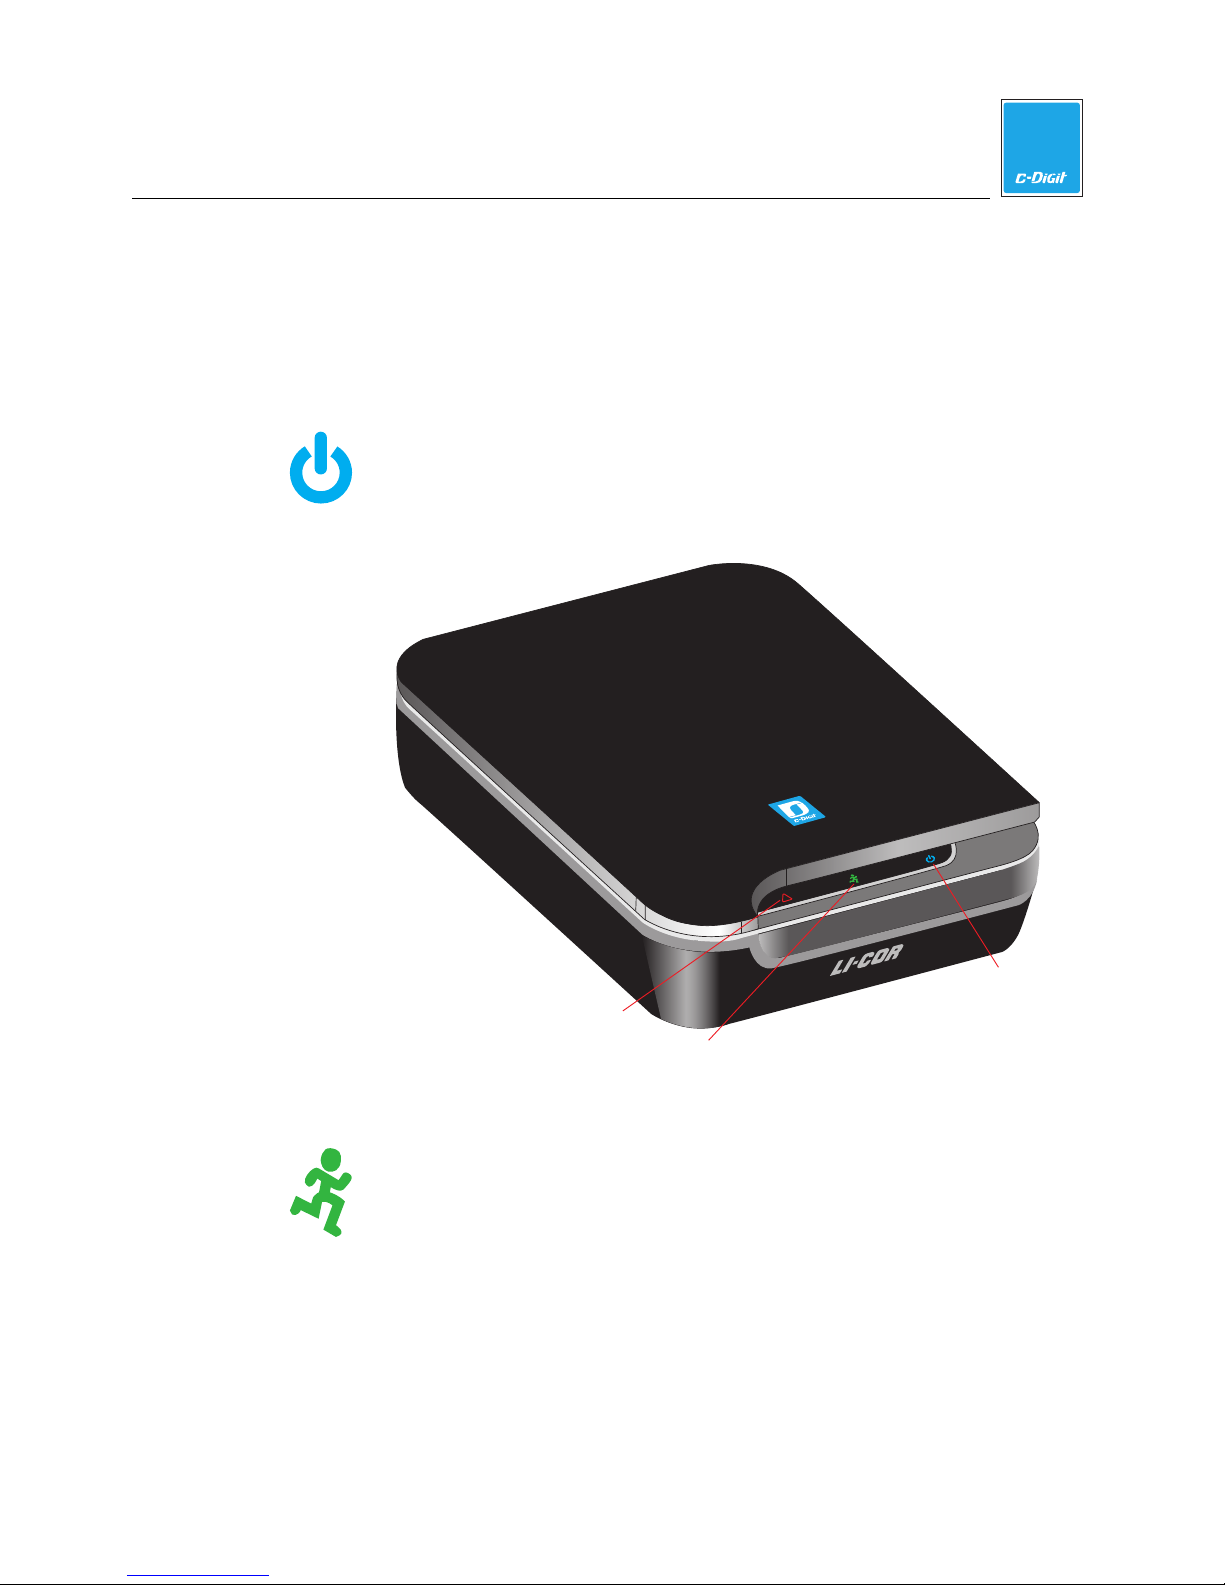
Power Indicator: While the C-DiGit Blot Scanner is performing its
startup or shutdown procedure, the blue power indicator light on the
instrument front panel blinks. When the blue indicator light is
continuously on, the instrument is ready for operation.
1
Introduction
!
Power indicator
Red error condition indicator
Green image acquisition indicator
Figure 1-3. Front panel features and controls of the C-DiGit Blot
Scanner.
Image Acquisition Indicator: This green indicator light blinks during
image acquisition and is continuously on at other times, as long as
communication with the Image Studio software is maintained. The
indicator light is off only when communication is lost, the Image
Studio software is closed, or the instrument is powered off.
C-DiGit User Manual 1-4
Page 12
1
Introduction
Error Indicator: The red error indicator light illuminates when a
!
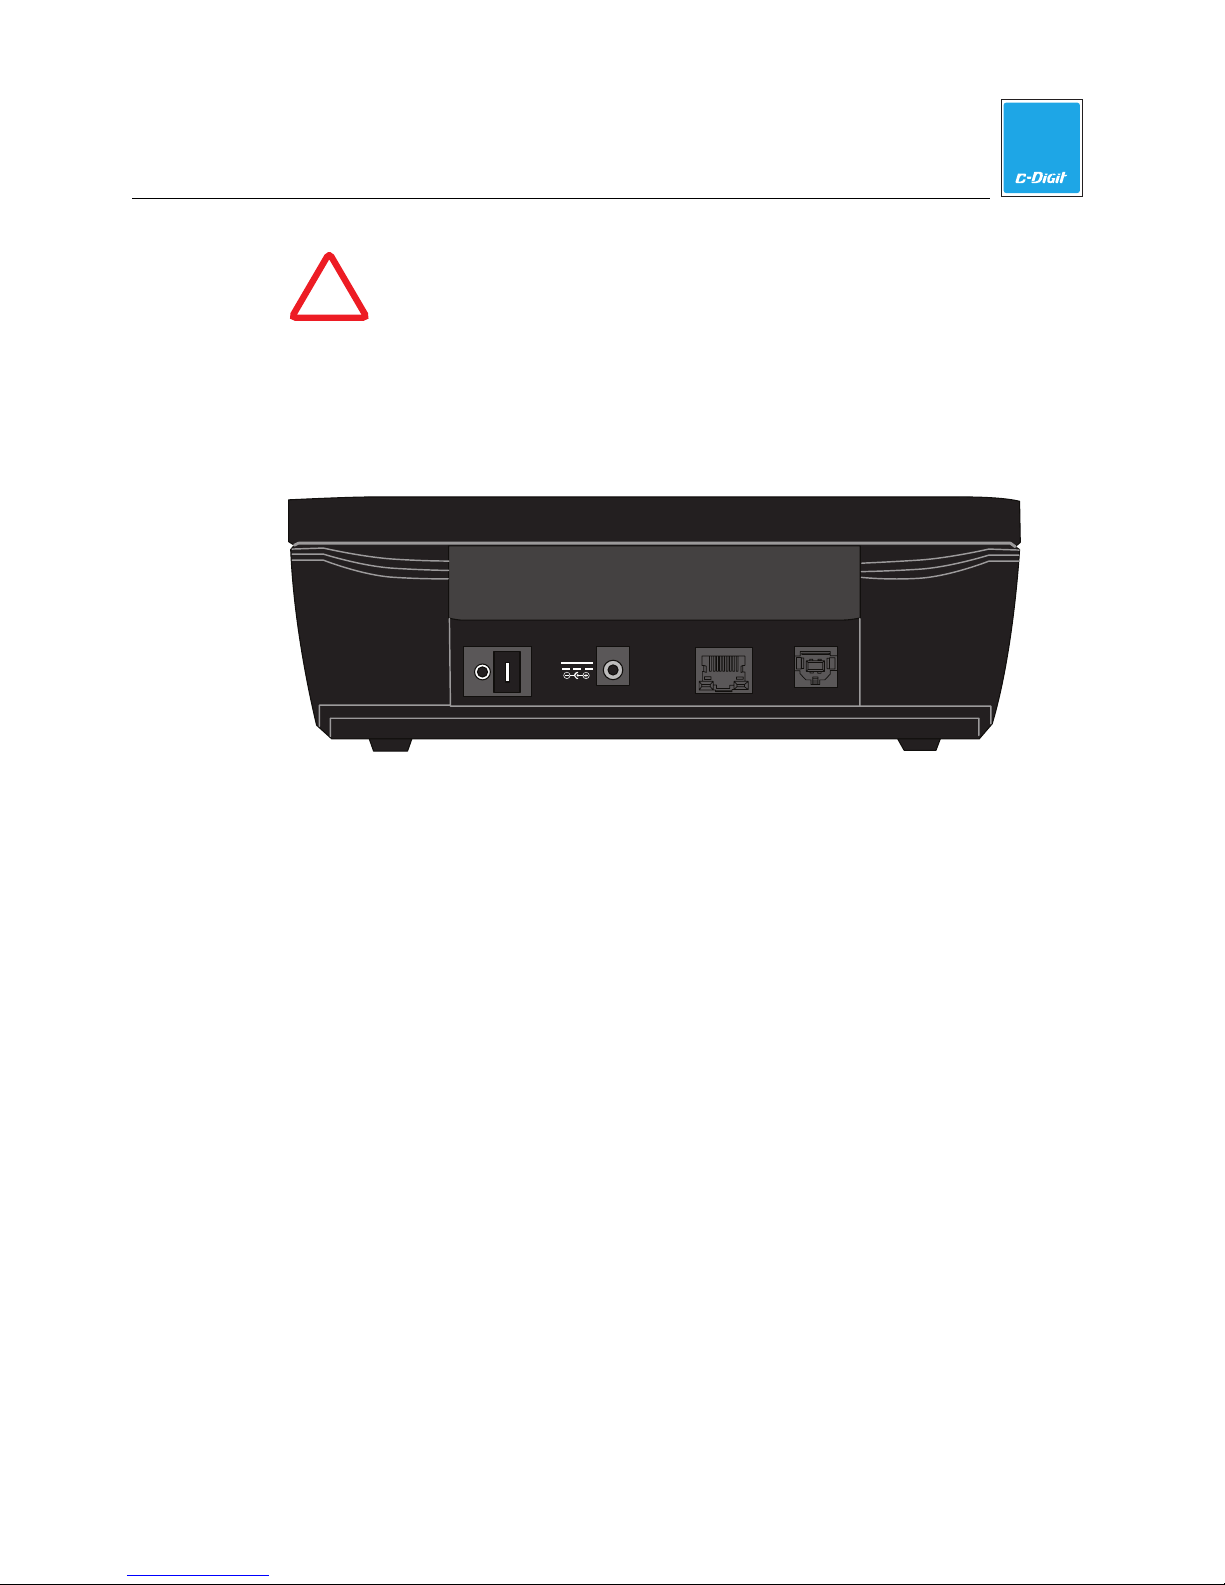
Back Panel
The C-DiGit back panel has the instrument ON/OFF switch and connectors for the
USB and Ethernet cables and the power supply.
process could not be completed. See the Status Message History dialog
(see Section 6, Maintenance and Troubleshooting) in the Image Studio
software for details about the error condition.
12VDC 1A
LAN
Amphenol
USB
Scanning Surface
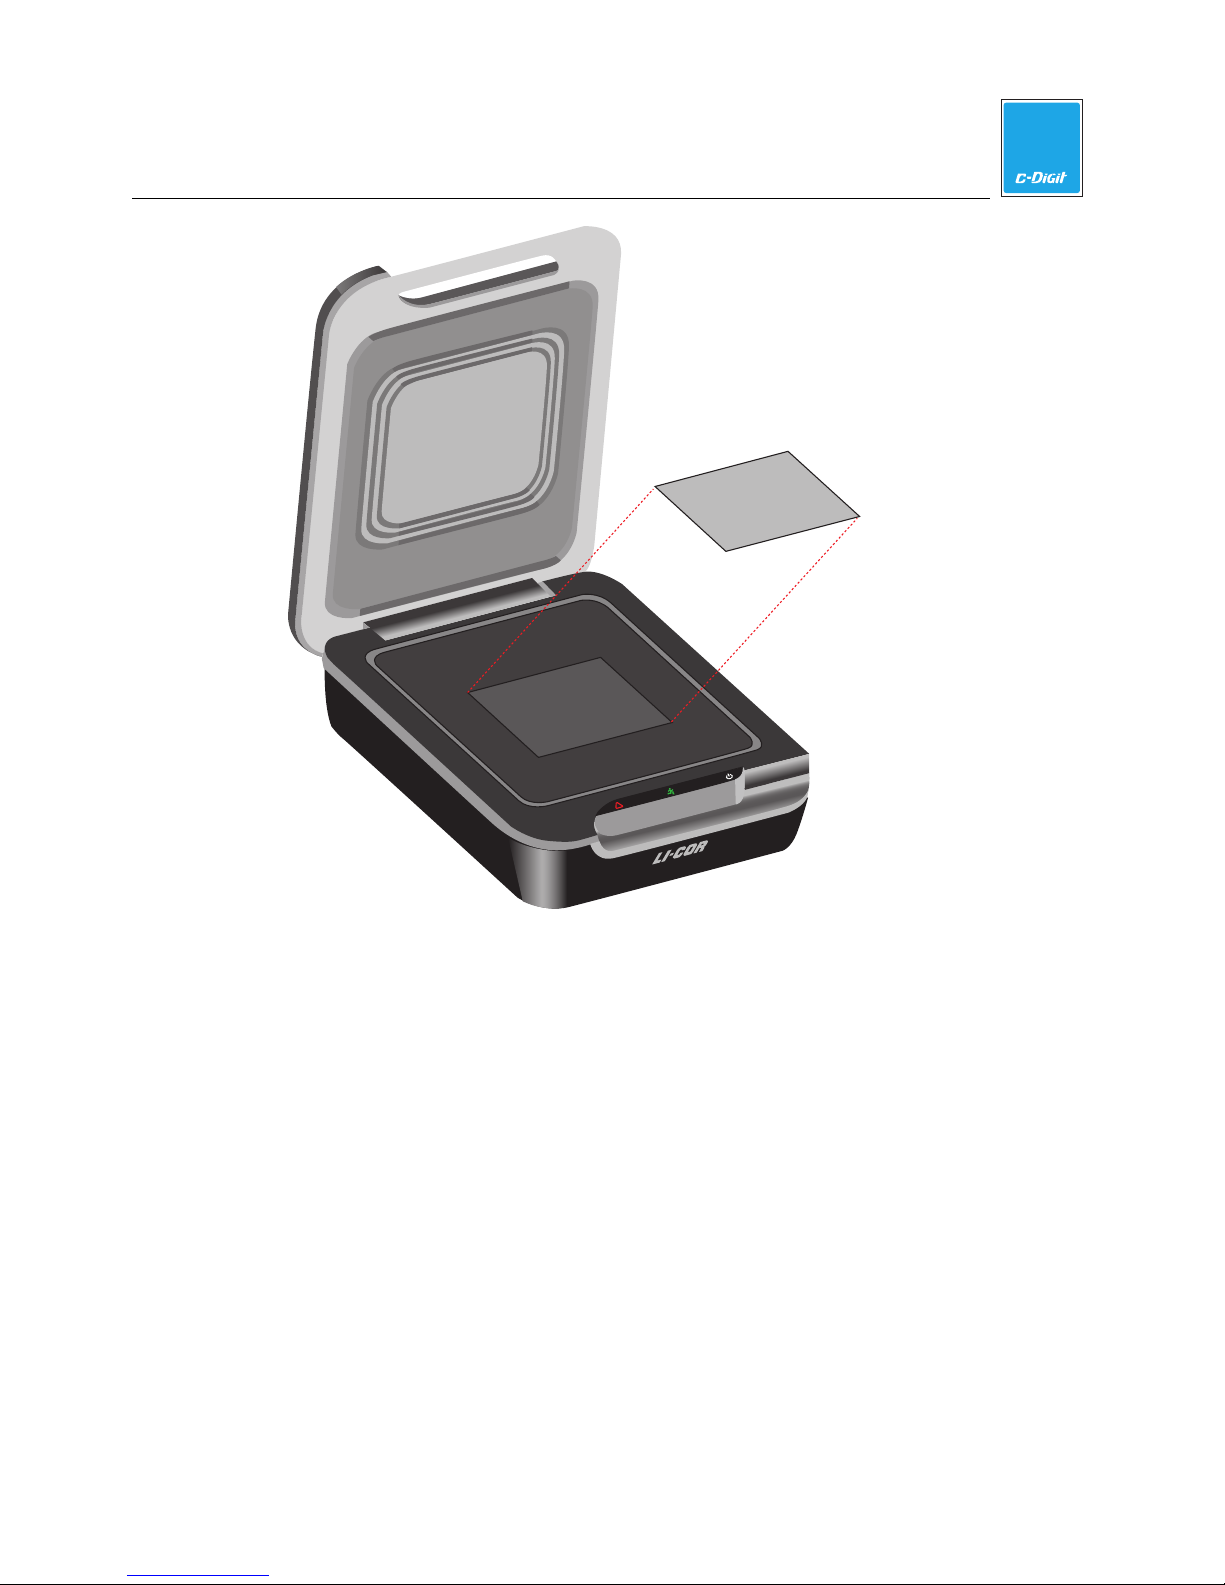
The scanning surface is accessed by opening the lid on the C-DiGit Blot Scanner
(Figure 1-4).
C-DiGit User Manual 1-5
Page 13
1
Introduction
8.5 cm
Place membrane here
10 cm
Face down,
top of membrane
facing rear of
C-DiGit
!
Figure 1-4. The imaging surface is designed to scan a single membrane up to 10
cm x 8.5 cm.
Scanning Surface Safety
Be careful not to get your fingers caught between the C-DiGit instrument lid and
the base of the scanning surface when the lid is closed. Do not put excessive
pressure on the scanning surface. Clean the scanning surface with 100% methanol,
then water. CAUTION: DO NOT use acetone to clean the imaging surface.
Sample Placement
The C-DiGit Blot Scanner Imaging Surface has a clear window that delineates the
edges of the C-DiGit Blot Scanner scanning surface. Membranes up to 10 cm x 8.5
cm placed within these markers will be fully imaged. Membranes can be placed
anywhere within the imaging area to be scanned.
Membranes should be placed sample side down with the top toward the back of
the instrument.
Tips for handling and imaging membranes are given in Section 3.
C-DiGit User Manual 1-6
Page 14
2
Quick Start Tutorial
The Quick Start Tutorial Guide included with the C-DiGit Blot Scanner is intended
as a quick verification tool to ensure that the C-DiGit is working properly, before
you proceed to scan your own membranes. The Tutorial Guide is reproduced in
this section, with some additional detail.
1. Unpack C-DiGit
In addition to the C-DiGit Blot Scanner, you will find the items shown below
(l-r): 1) Ethernet and 2) USB cables, 3) a power supply with interchangeable
plugs, 4) a C-DiGit Target, and 5) Image Studio and Resource CDs.
3
1
4
2
The USB cable is the default method used to connect to the C-DiGit Blot
Scanner; the Ethernet cable is used for alternative connection methods
described in Section 5.
5
2. Place C-DiGit in the Lab
Place the C-DiGit Blot Scanner away from heat sources (furnaces, windows,
etc.) and out of direct sunlight.
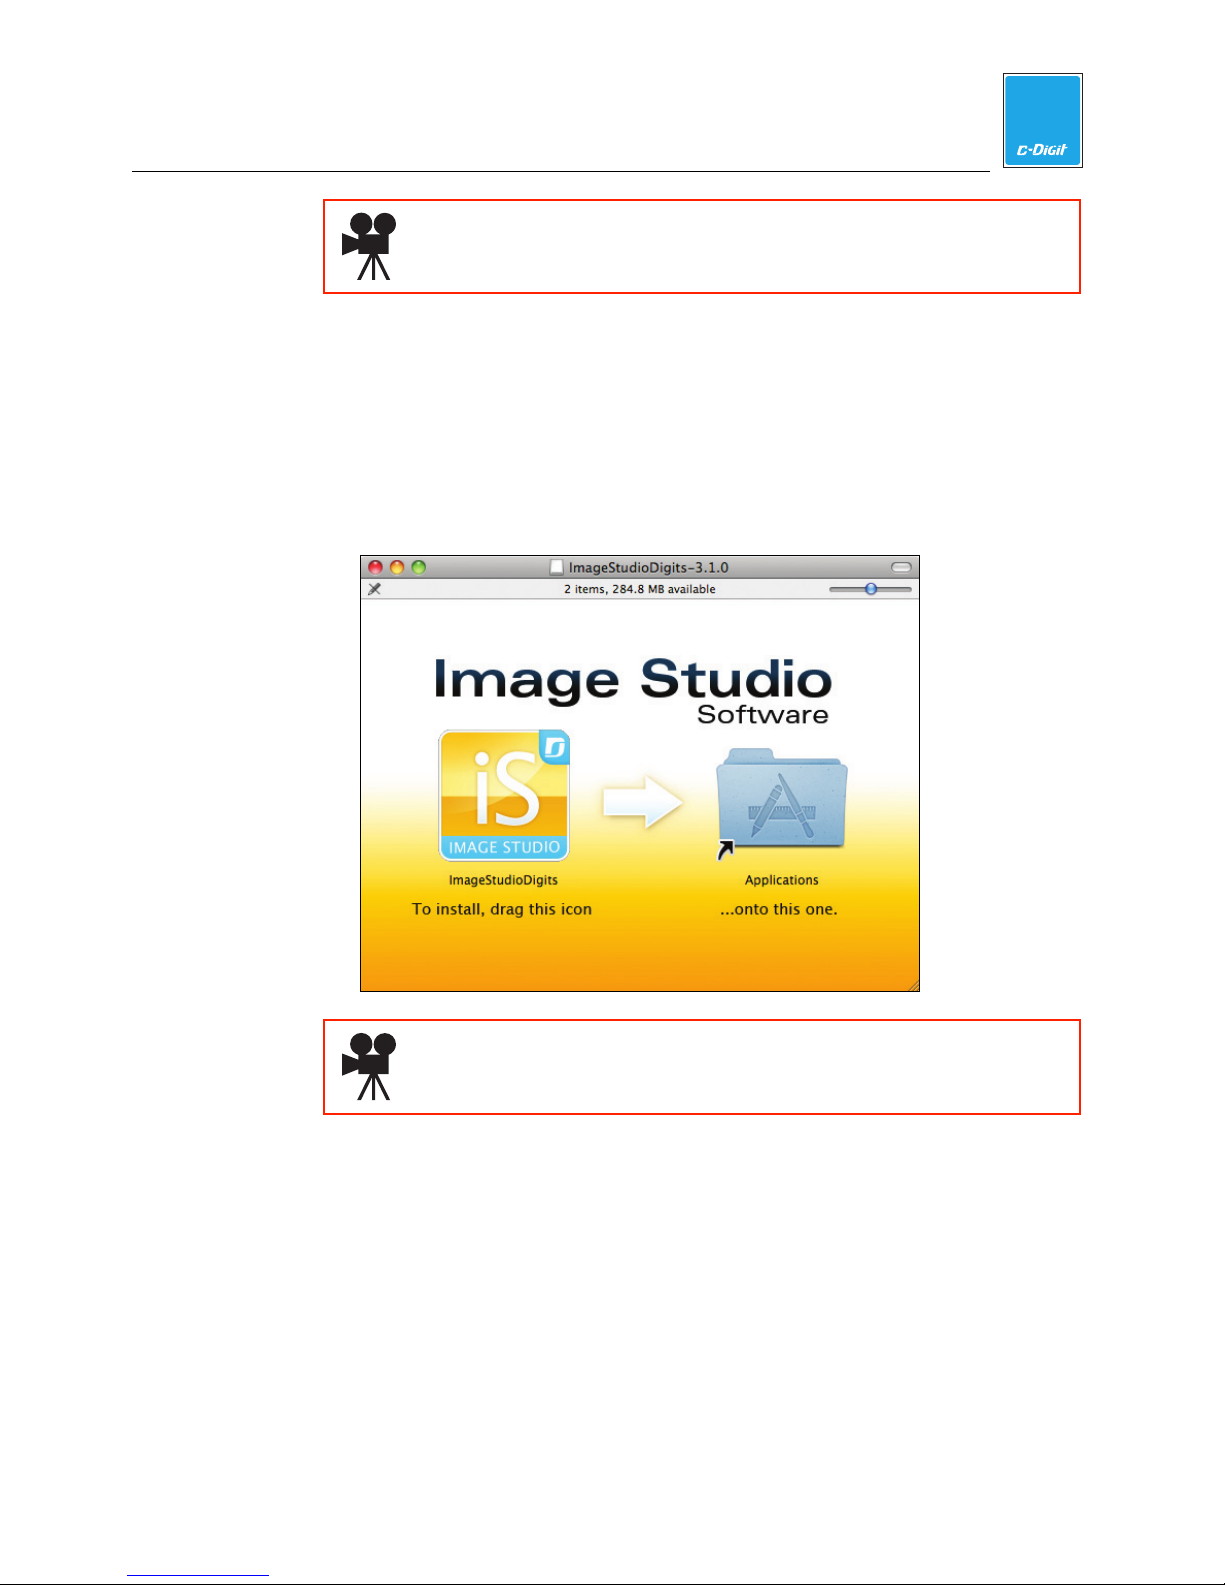
3. Install Image Studio Software
Insert the Image Studio DiGits CD, and follow the instructions below to install
the Image Studio software. Note that you should make sure that your user
account has administrator rights on the computer.
C-DiGit User Manual 2-1
Page 15
2
Quick Start Tutorial
Click here to watch a video that describes the requirements for
Image Studio.
Macintosh
Note: Compatible with OS X 10.6 (Snow Leopard), 10.7 (Lion), or 10.8
(Mountain Lion).
1. Place installation CD into drive.
2. If installation does not start immediately, browse the Desktop and doubleclick on MacImageStudio-3.x.dmg.
3. Click Agree to accept the license agreement.
4. To install, drag the Image Studio icon into the Applications folder.
®
Users
Click here to watch a video that demonstrates how to install Image
Studio on a Macintosh computer.
C-DiGit User Manual 2-2
PC Users
Note: Compatible with Windows
1. Place installation CD into drive.
2. If installation does not start immediately, browse to the CD or Desktop and
double-click on Win Image Studio Digits Installer_3.1.x.exe.
3. Click Agree to accept the license agreement.
4. Follow the instructions to install the Image Studio software.
* Windows
in Appendix B.
®
XP may require a more extensive installation procedure, found
®
7, XP*, or Vista.
Page 16
2
Quick Start Tutorial
Click here to watch a video that demonstrates how to install Image
Studio on a Windows-based computer.
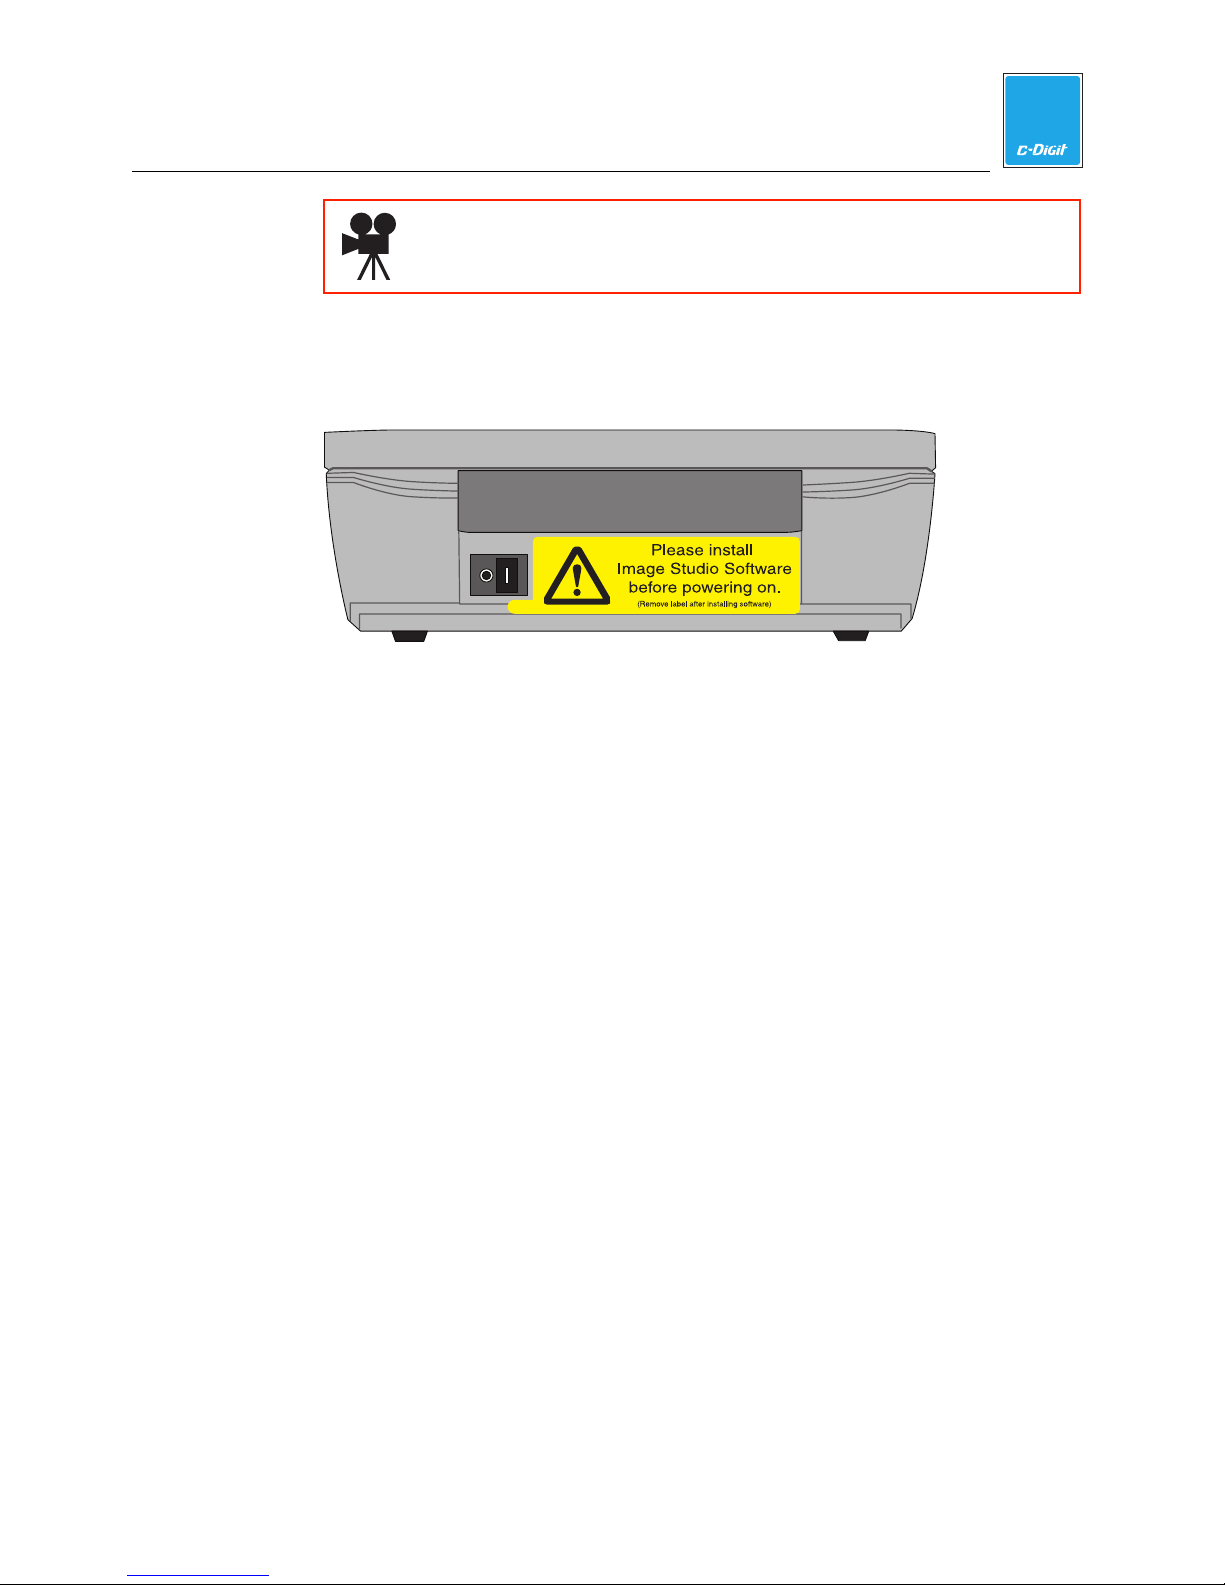
4. Remove warning label from the back panel
Remove the yellow warning label on the C-DiGit Blot Scanner back panel
(below).
12VDC 1A
LAN
Amphenol
USB
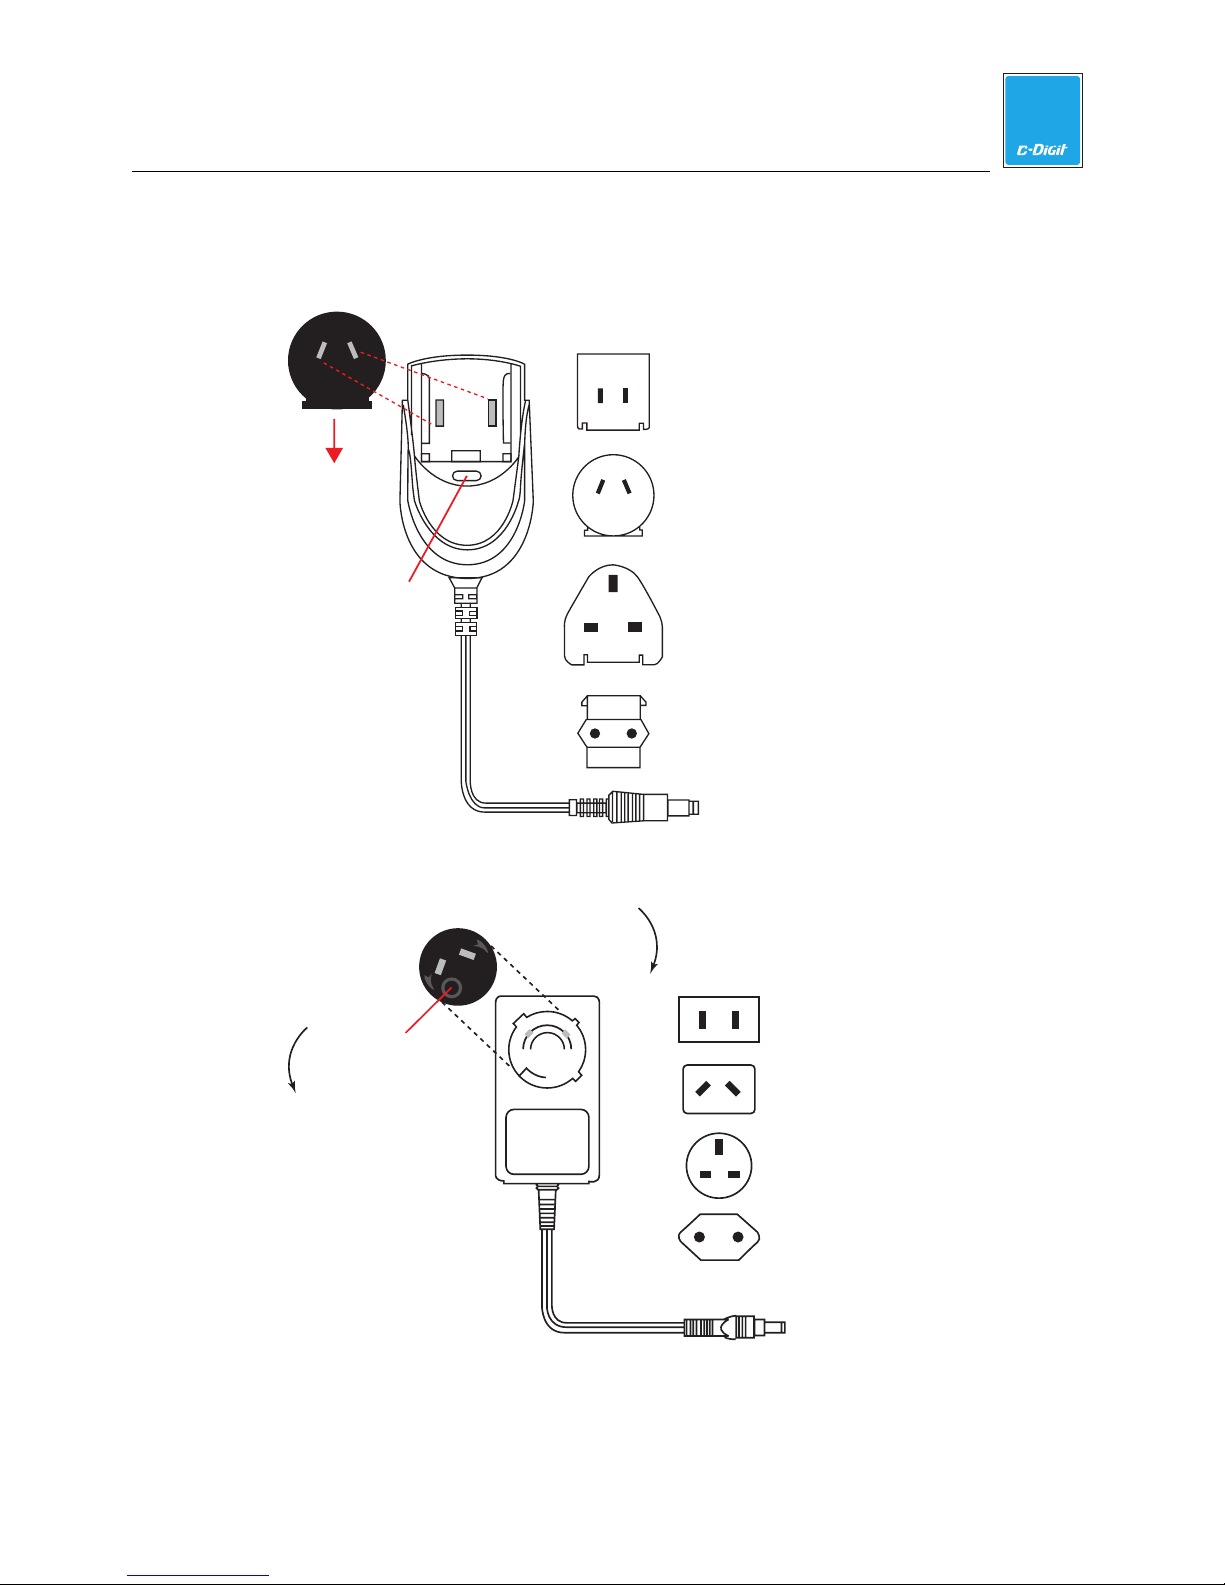
5. Install the Power Supply Plug
There are two power supplies available for use with the C-DiGit; you will have
received either the Cincon (p/n 591-13058) or SL Power Electronics (p/n 591-
13032) power supply. Each of these power supplies is a universal 100-240VAC
input, 12VDC power output supply with interchangeable AC plugs for use in
North America and Japan, Australia, Europe, and the United Kingdom. Install
the appropriate plug on the power supply as shown below. NOTE: The SL
Power Electronics supply has the North American/Japanese plug pre-installed.
For use in other countries, remove this plug and replace with the appropriate
plug.
C-DiGit User Manual 2-3
Page 17
Cincon Power Supply
Align metal contacts on
power supply and plug,
and then slide down
until plug locks into
position
Push button and
slide out to release
Quick Start Tutorial
N. America,
Japan
Australia
United
Kingdom
2
SL Power Electronics Power Supply
LOCK
OPEN
U
S
P
H
Push button and
turn counterclockwise
to release
Turn clockwise
to lock
Europe
N. America, Japan
Australia
United Kingdom
Europe
C-DiGit User Manual 2-4
Page 18
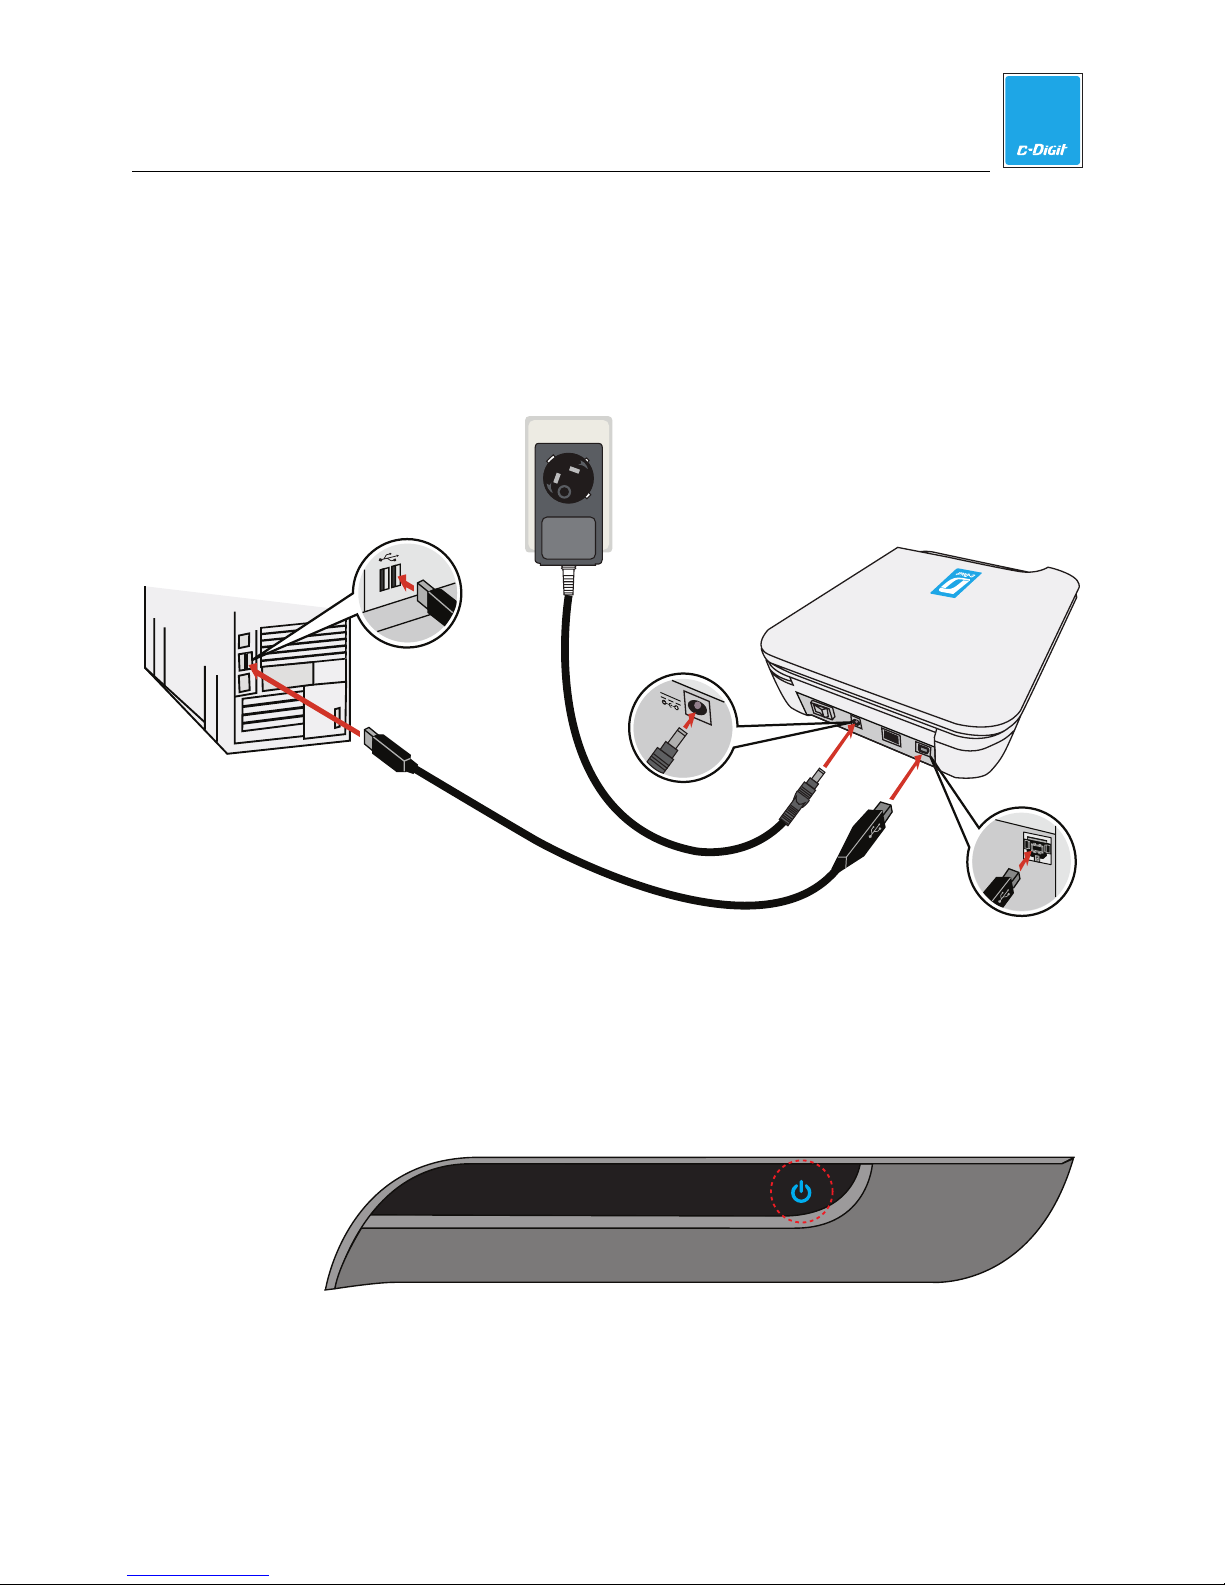
6. Connect the USB and Power Cables
Computer
USB Connection
2
Quick Start Tutorial
Plug the power supply into the wall outlet, and plug the power cord into the
receptacle on the C-DiGit back panel (below). Connect the flat (Type A)
connector on the USB cable to your computer, and the square (Type B)
connector to the C-DiGit Blot Scanner back panel at the connector labeled
‘USB’.
AC Power
LOCK
N
OPE
U
S
P
H
C-DiGit
Power Connection
12VDC
1A
C-DiGit Blot Scanner
USB Connection
7. Turn on C-DiGit Blot Scanner
Power C-DiGit Blot Scanner on with the power switch on the back panel. The
blue power light on the instrument front panel (below) illuminates and blinks
when the instrument is first powered on, and stops blinking when the
instrument has fully started up and is ready to use.
8. Wait While USB Drivers Install
When C-DiGit is powered on and connected to the computer for the first time,
drivers are automatically installed on the computer. Allow up to 5 minutes for
the drivers to install before starting the Image Studio software in Step 9
USB
C-DiGit
C-DiGit User Manual 2-5
Page 19
Quick Start Tutorial
below. NOTE: You may have to dismiss any Windows
messages.
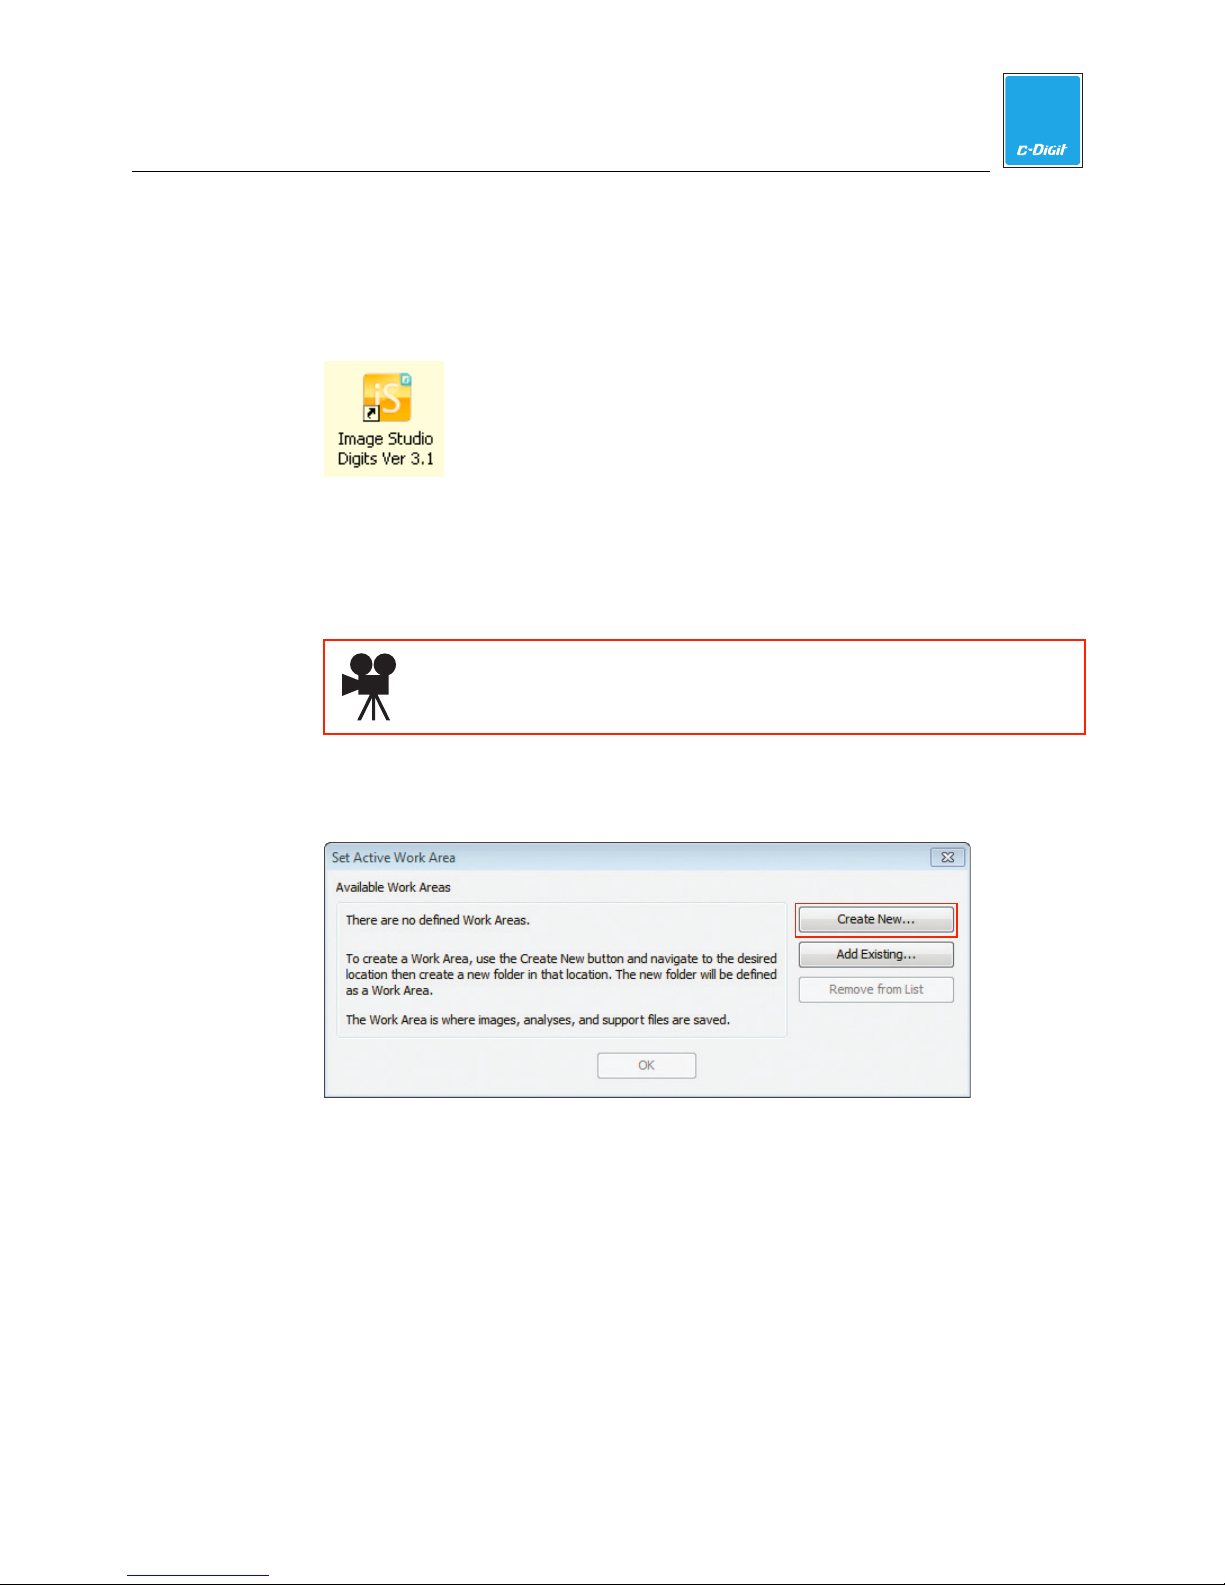
9. Start Image Studio
Double-click the Image Studio icon (below) on the desktop to start Image
Studio.
10. Create a New Work Area Folder
The first time you start the software you will need to create the first Work Area.
The Work Area is a folder on the hard drive or network where the images,
analyses and settings are stored.
Click here to watch a video that demonstrates how to create a Work
Area Folder.
®
‘Found New Hardware’
2
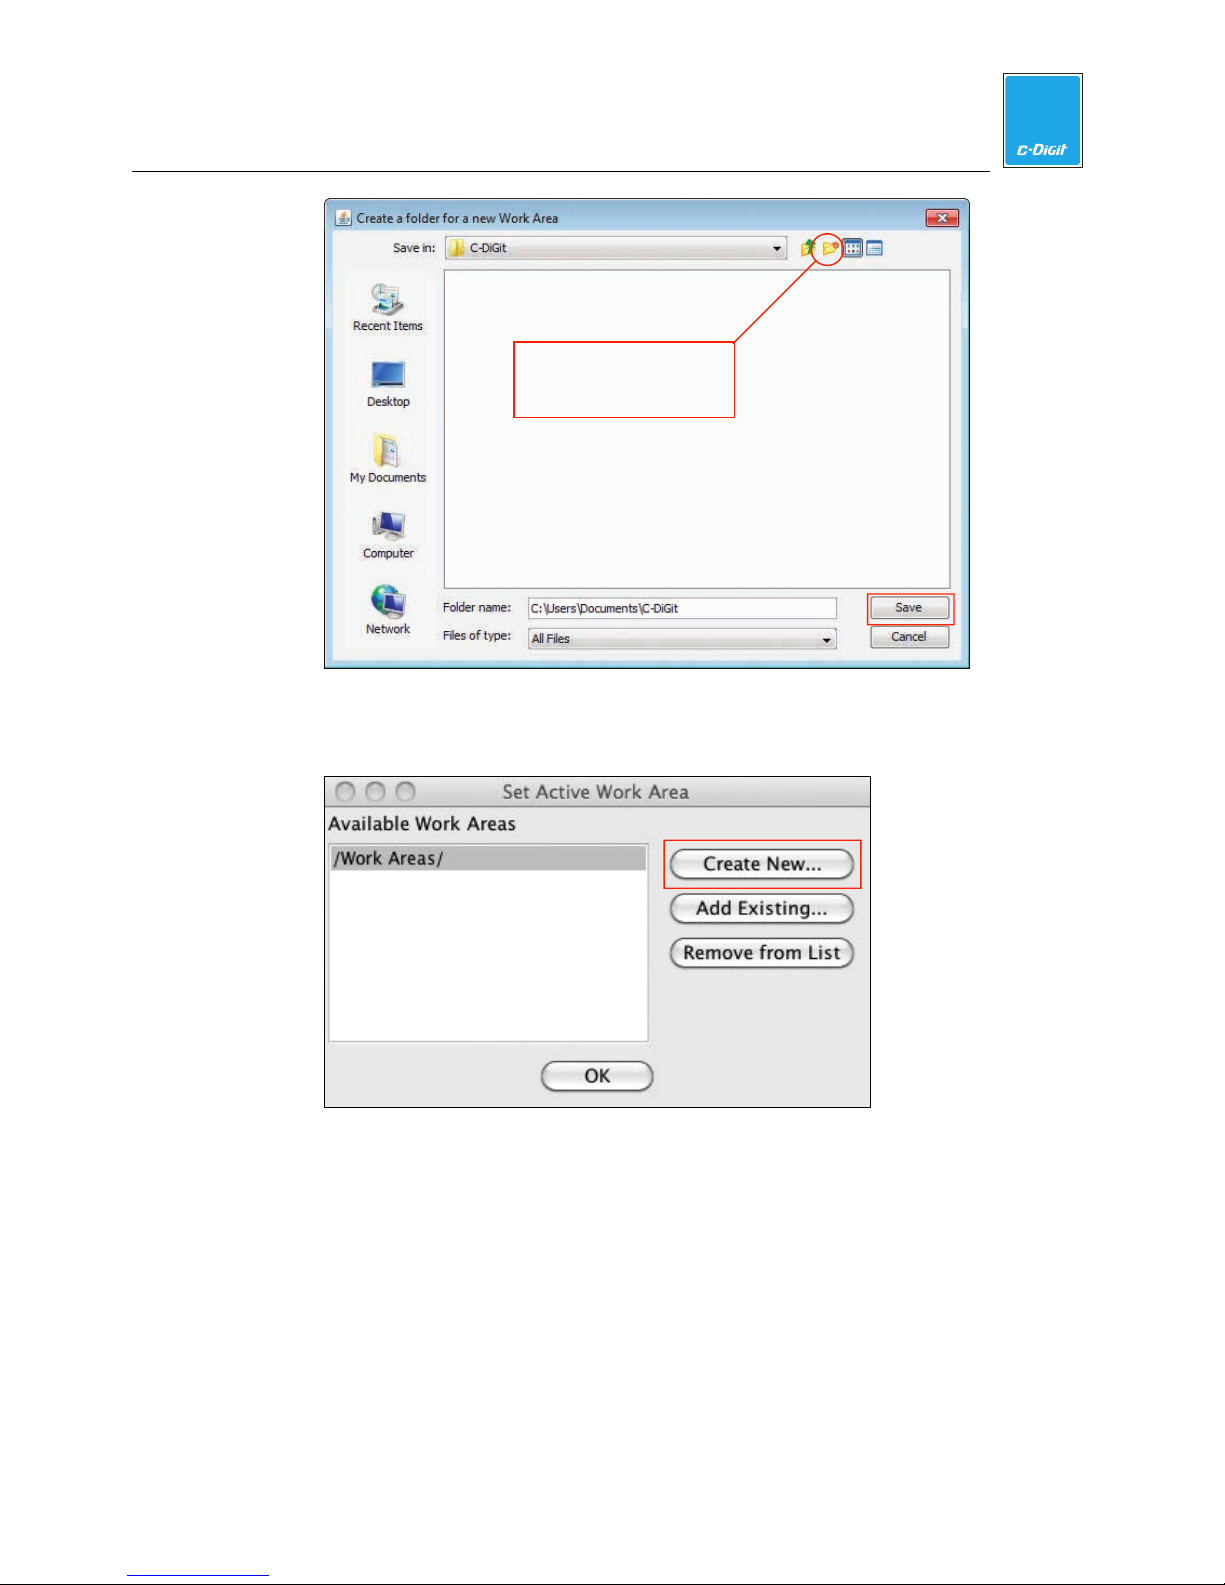
PC: Click Create New… in the Set Active Work Area dialog box to browse to a
folder on the hard drive or network to use as the Work Area.
Click the New Folder icon to create a new folder for the Work Area. Name the
folder; this folder will now appear in the Available Work Areas window each
time the software is opened. Select the folder and click Save to set it as the
Work Area.
C-DiGit User Manual 2-6
Page 20
Click here to create
a new folder
Mac: Click
Folder button, and name the folder. Click
Create New. Navigate to where the folder will reside, click the New
Quick Start Tutorial
Choose.
2
C-DiGit User Manual 2-7
Page 21
Quick Start Tutorial
To remove a Work Area from the window, select it and click Remove from List.
Removing the folder from the window does not delete the folder or its contents;
it simply makes it unavailable in the Work Area list.
Note: Each user should create their own Work Area, as previous settings for the
instrument, analysis, image display, etc. from the last session will be applied to
the next session in the same Work Area.
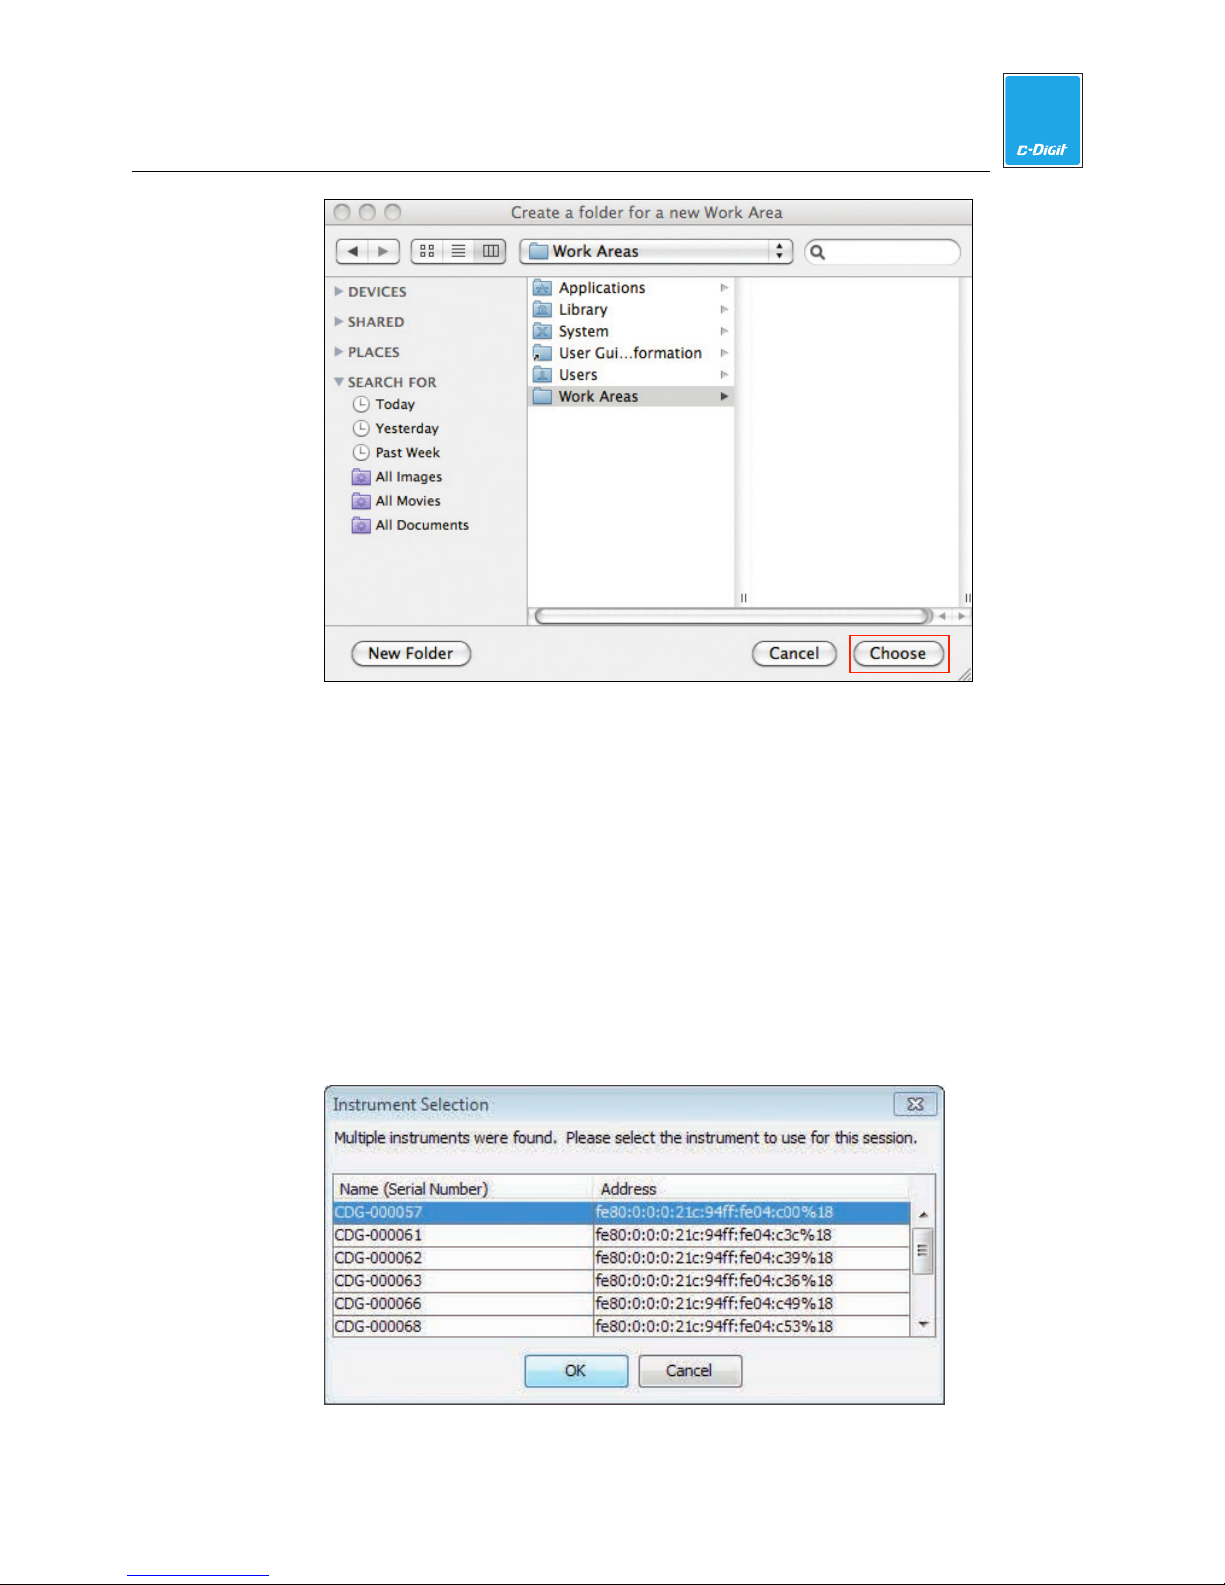
11. Connect to C-DiGit Blot Scanner
If there is only one C-DiGit Blot Scanner detected by the computer, it will
connect automatically; if there are multiple C-DiGit Blot Scanners detected,
you can choose the desired C-DiGit Blot Scanner from a list of available
instruments (below, listed by serial number).
2
C-DiGit User Manual 2-8
Page 22
Quick Start Tutorial
NOTE: You can find the serial number on a label on the underside of the
instrument.
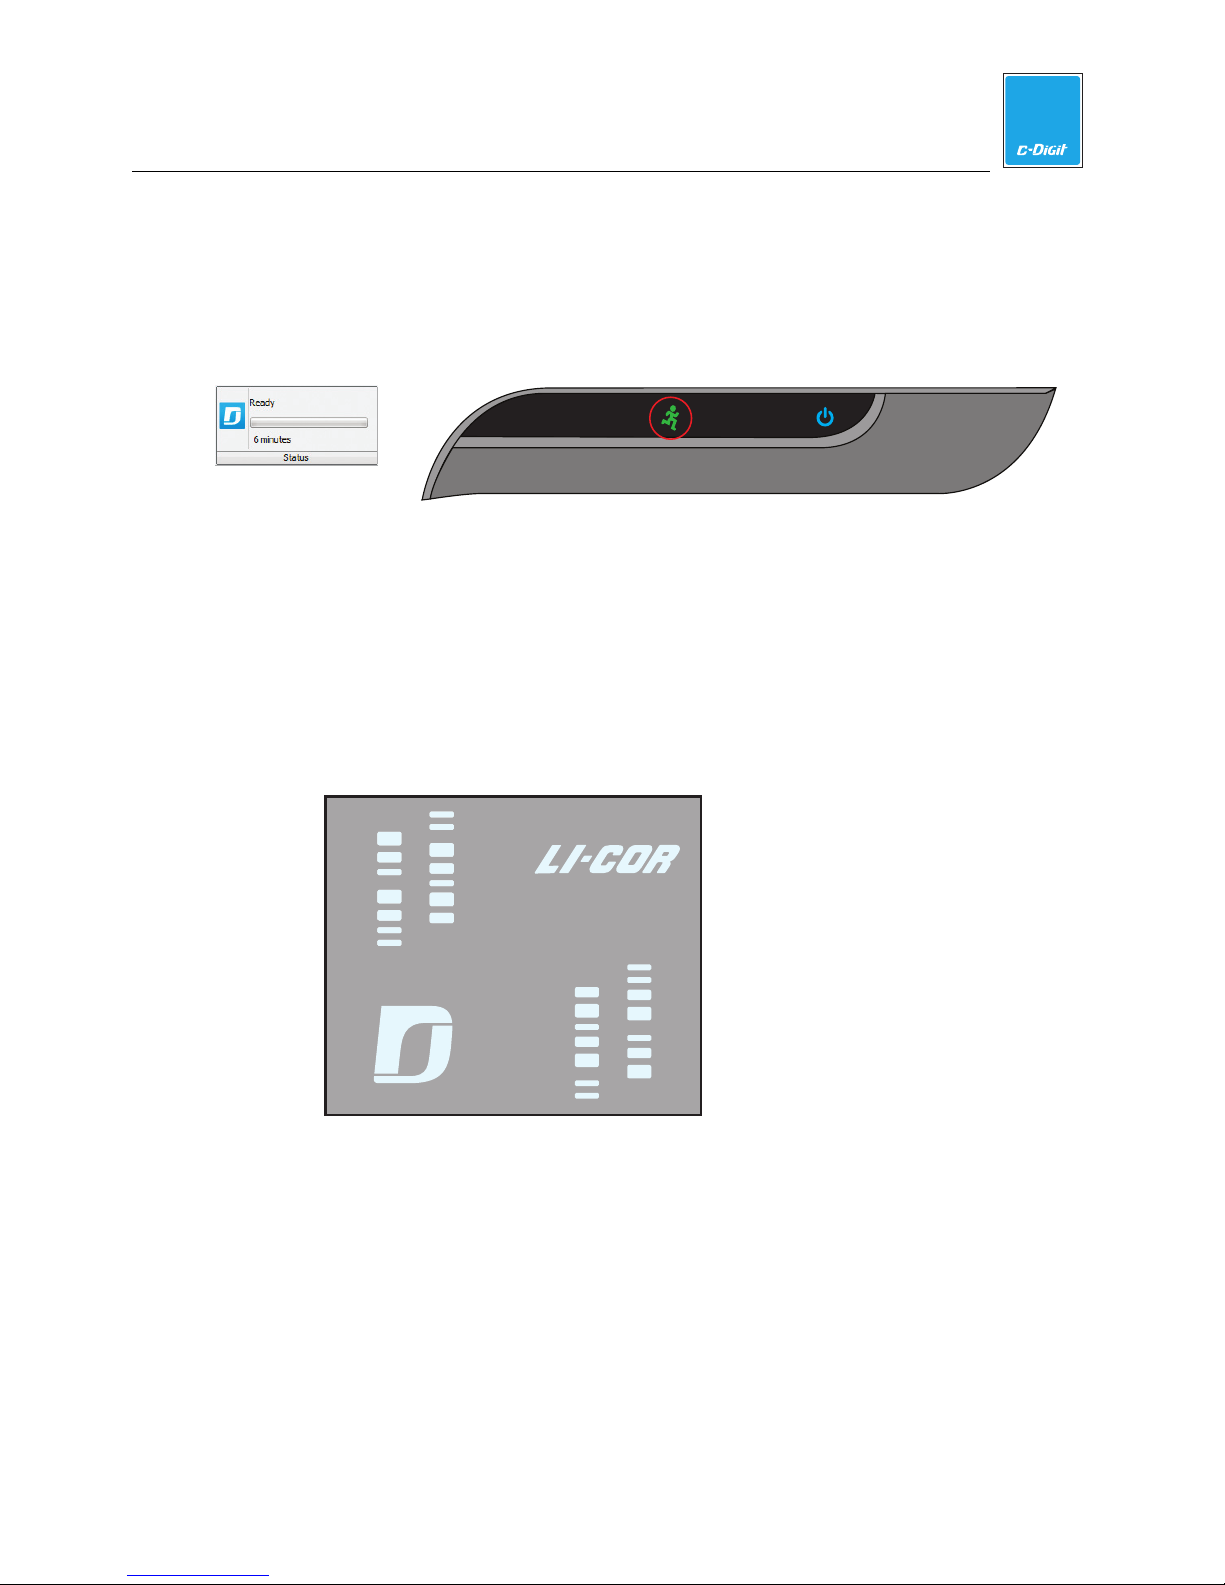
When a connection is established, the green indicator light (below) will
illuminate on the instrument front panel, and the Status panel in the Image
Studio window will display ‘Ready’.
NOTE: C-DiGit Blot Scanner uses IPv6 and IPv4 Link-Local Addressing to
automatically create an IP network without any user configuration or additional
servers. If you experience connection problems, be sure that IPv6 is enabled
on the computer.
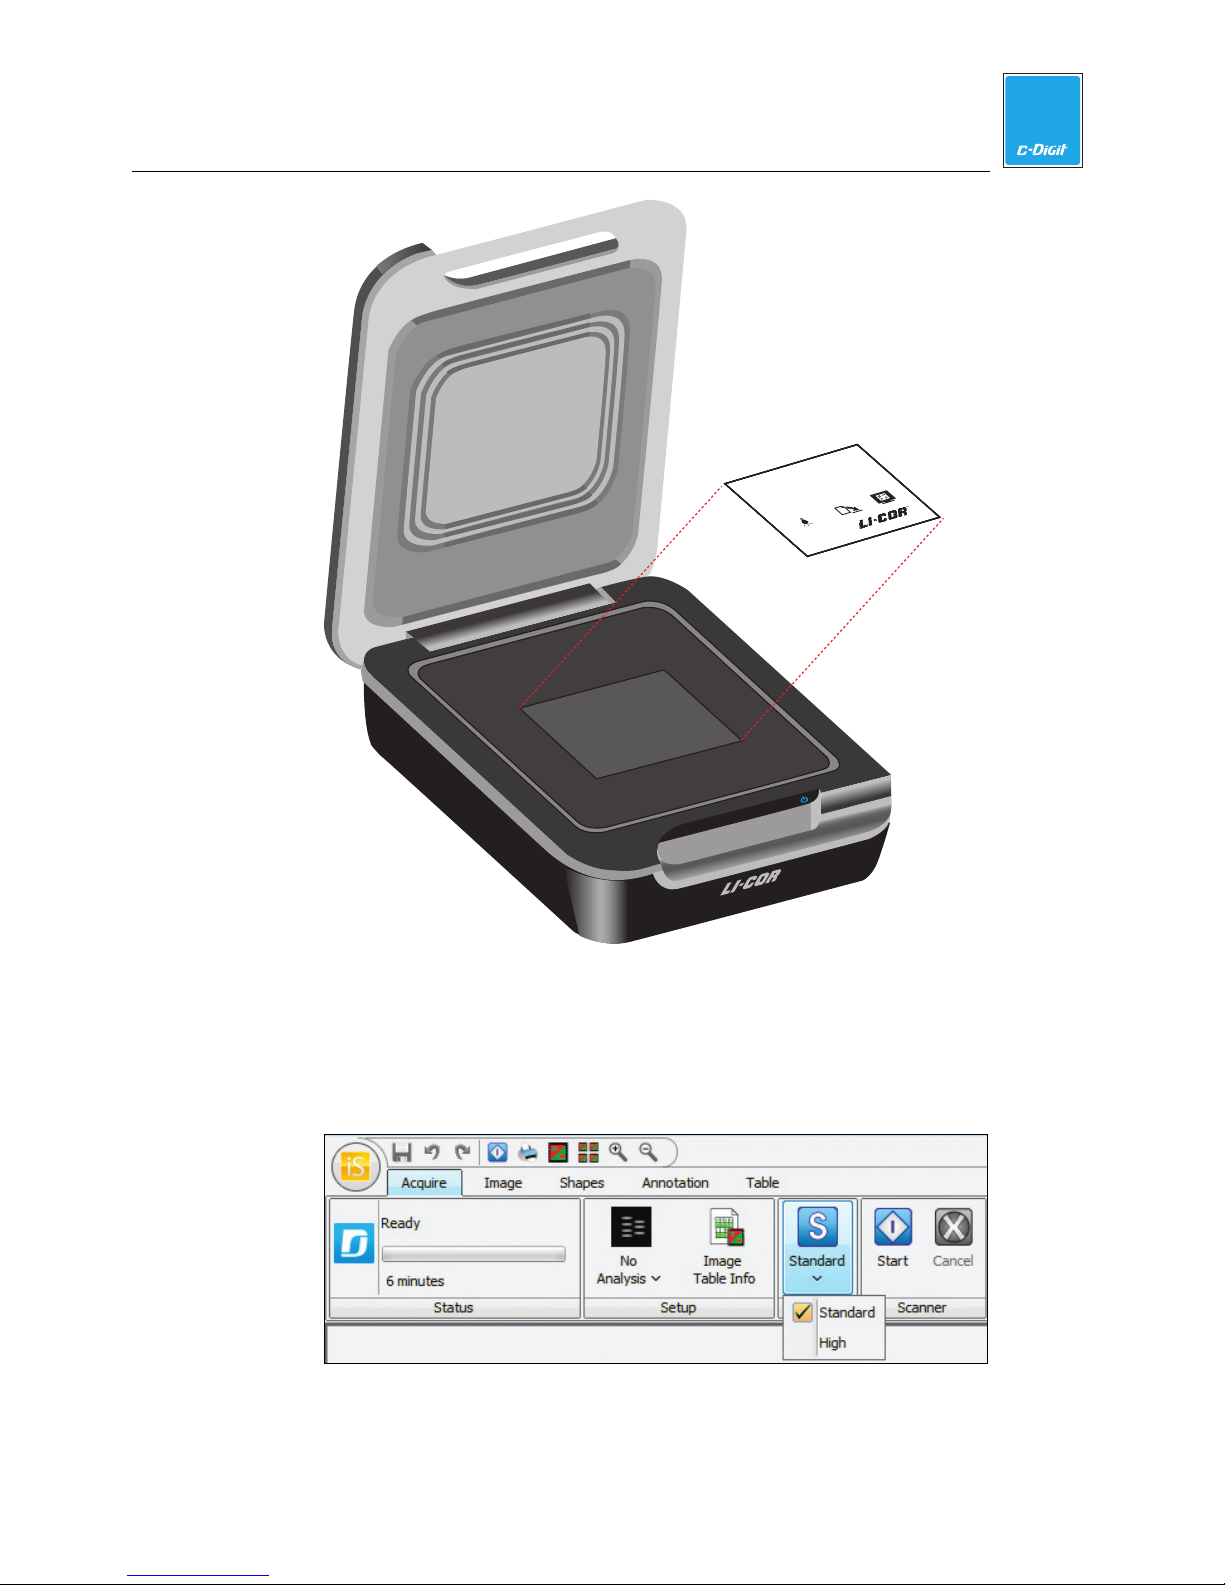
12. Expose the C-DiGit Blot Scanner Target
Open the Target envelope and expose the side of the Target with the gray
background to room light for 30 seconds. Place the Target face down (gray
background) on the C-DiGit Blot Scanner scanning surface.
2
Expose this side.
C-DiGit User Manual 2-9
Page 23
2
Quick Start Tutorial
t
for use as a quick verification tes
2. Place exposed
side down
to room
light for 30 seconds
©2012
or complete
3. Scan
www.licor.com/cdigit
C-DiGit™Target
PN 6536-030
This target is
ofthe C-DiGit Sc anner. Refer to the C-DiGit
User Manual on the Resource CD f
instructions.Please store this target in the dark.
1. Expose
Place target here
13. Acquire Target Image
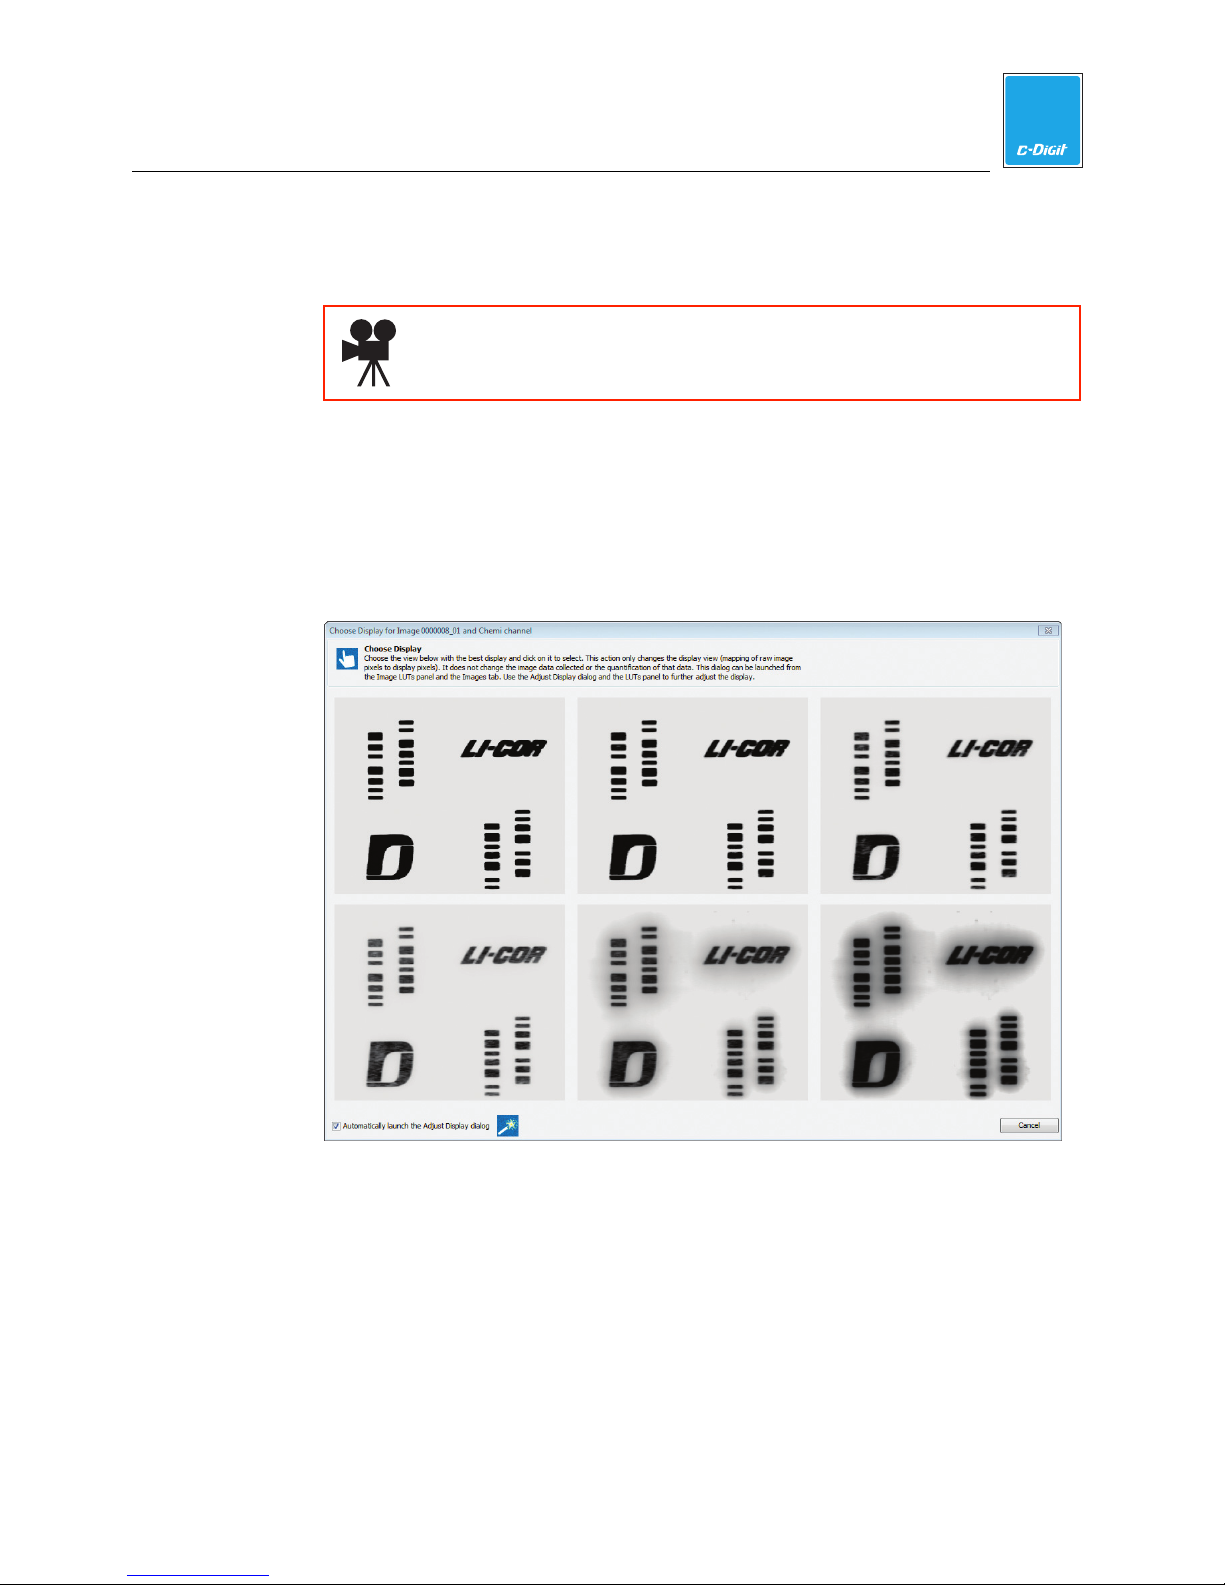
Make sure that the Sensitivity is set to Standard. If the Sensitivity is not set to
Standard, click on the Sensitivity button and choose Standard from the pulldown menu (below). The image acquisition using Standard sensitivity takes
approximately 6 minutes to complete.
Click the Start button on the Acquire tab ribbon.
C-DiGit User Manual 2-10
Page 24
Quick Start Tutorial
The image acquisition will start, and the target image will be displayed as a
series of six images of various brightness/contrasts (Step 14).
Click here to watch a video that demonstrates how to acquire an
image.
2
14. Adjust Target Image
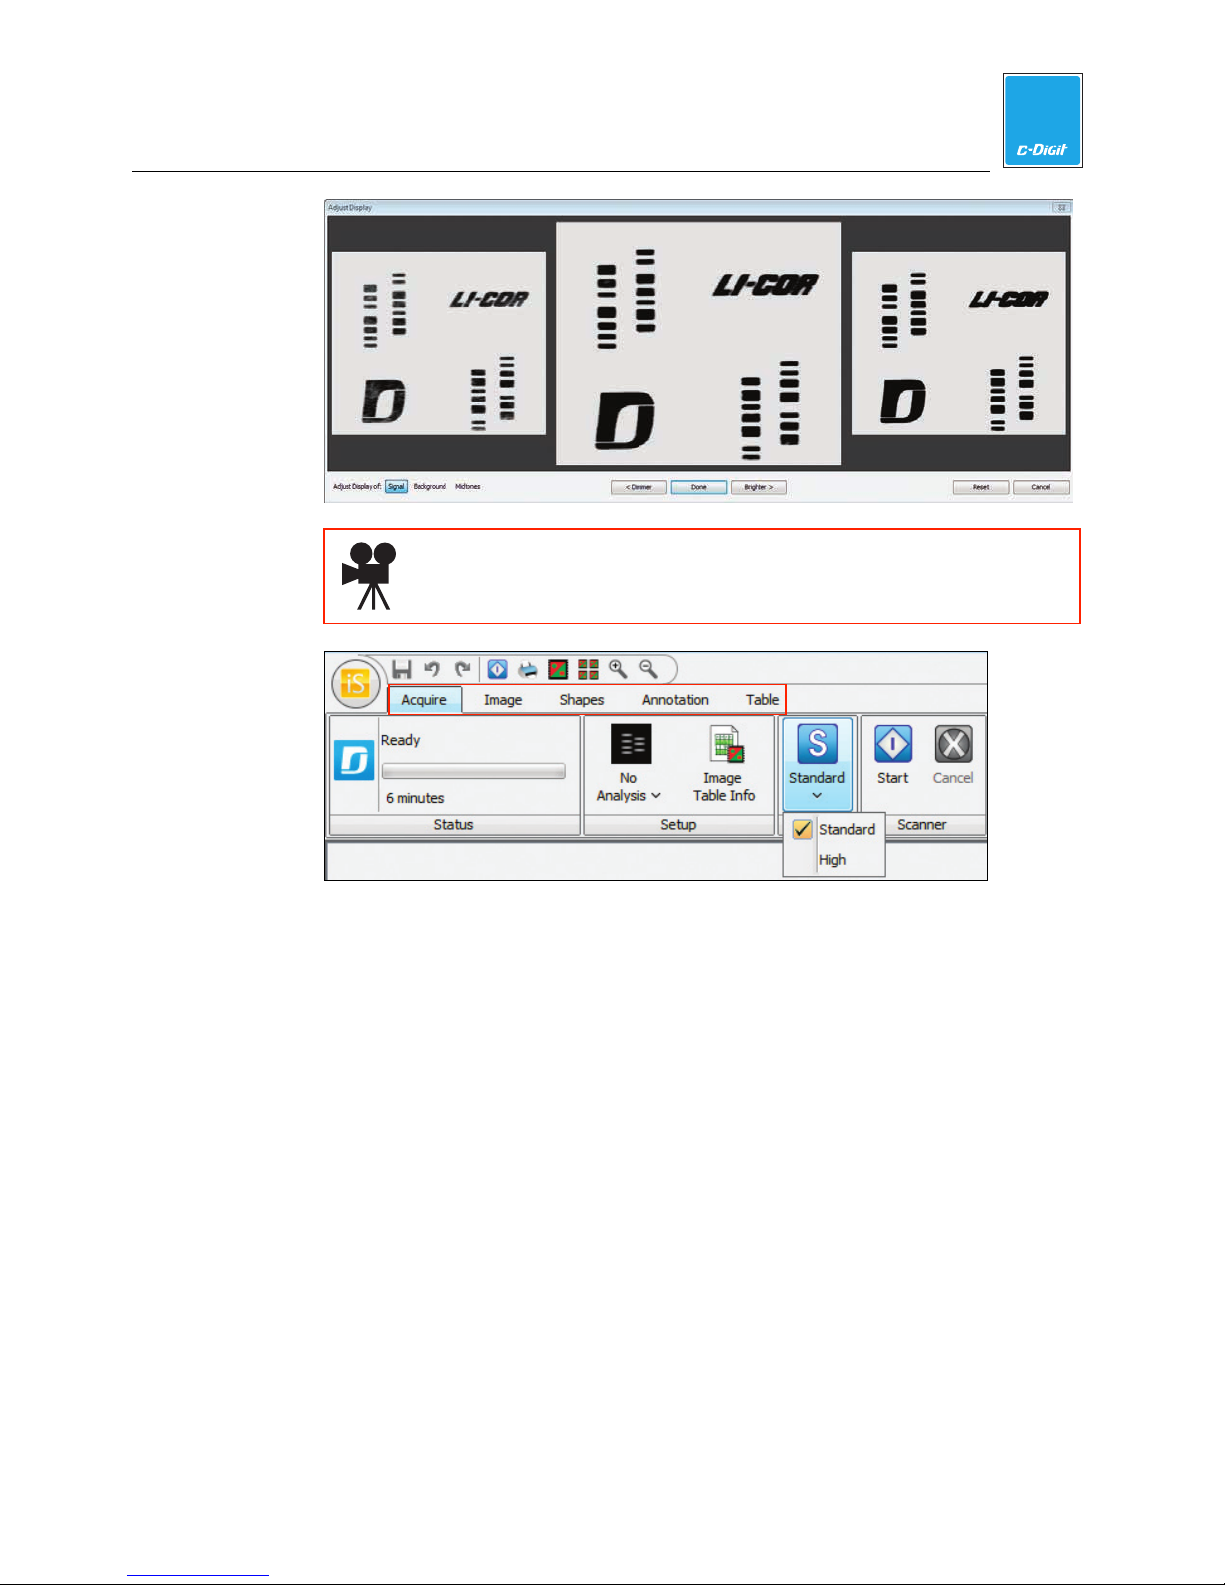
Verify that your target image acquisition is similar to that shown below. If it
matches, your C-DiGit is functioning correctly. NOTE: Store the Target in its
envelope when not in use. You will generally not need to use the Target after
this initial verification step; it may be used later, however, for diagnostic
purposes if there is a problem with the instrument.
Click on the best image; that image will open in a new window (below),
allowing for further adjustment, if desired. Click on Signal, Background, or
Midtones to adjust the brightness for these channels, if needed. Click Done.
C-DiGit User Manual 2-11
Page 25
2
Quick Start Tutorial
Click here to watch a video that demonstrates how to choose and
adjust an acquired image.
Click on the ribbon tabs (above) for additional features, including:
Image - Adjust the image appearance, crop, rotate, view image array.
Shapes - Draw shapes to quantify data.
Annotation - Add text annotations to image.
Table - Filter table columns, add headers, export data, etc.
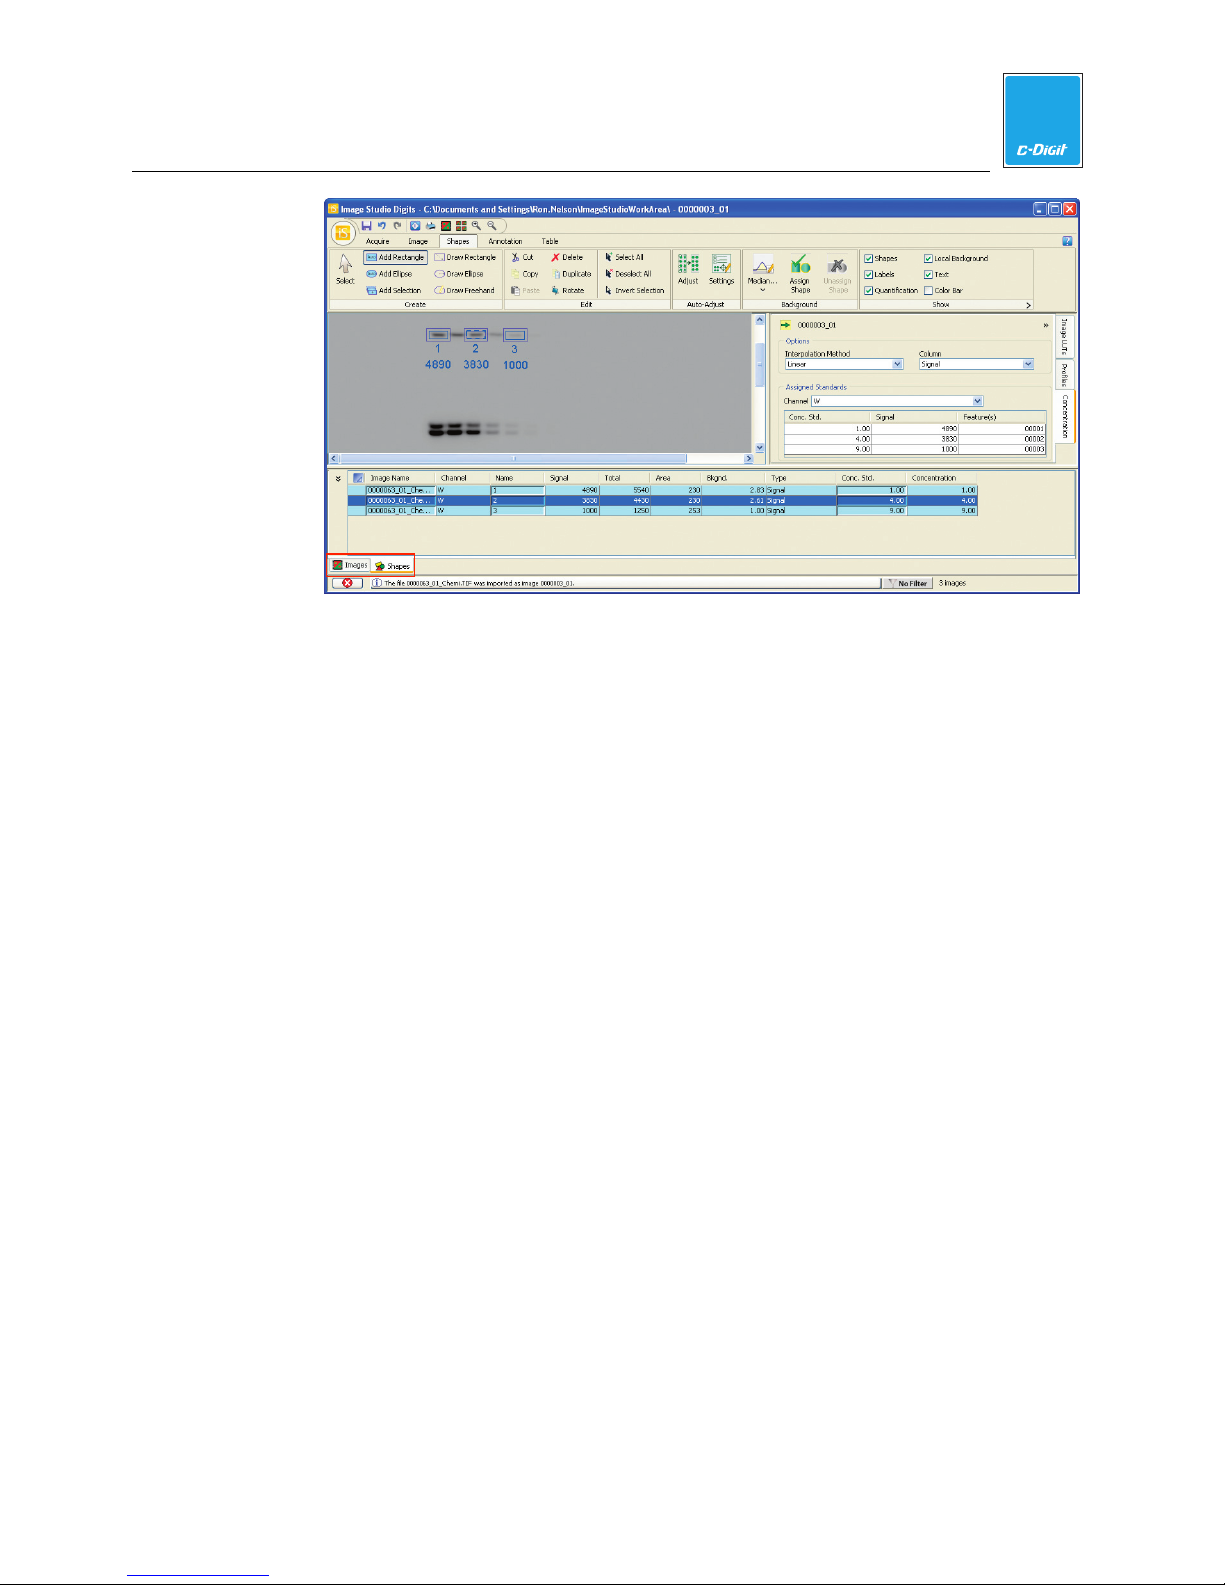
Click on the Shapes and/or Images tabs at the bottom of the main window to
view:
Shapes - Table of quantification data for selected image.
Images - Table of acquired images, settings, and comments.
C-DiGit User Manual 2-12
Page 26
2
Quick Start Tutorial
C-DiGit User Manual 2-13
Page 27

3
Scanning Membranes
For Western blotting methods, nitrocellulose or PVDF membranes may be used.
LI-COR offers Odyssey nitrocellulose membranes (10 membranes; 0.22 μm, 7 cm x
8.5 cm) under part number 926-31090. There are some general tips for using
membranes:
IMPORTANT: Do not touch the membrane – handle only with clean forceps.
Lift the membrane only by the corners.
Keep the membrane wet if it is to be stripped and re-used. This can easily be
accomplished by wrapping the membrane in plastic wrap.
Use clean containers to avoid cross-contamination and reduce background.
Multiple membranes can be washed together, provided there is ample volume
so each membrane moves freely.
Generally speaking, chemiluminescent detection protocols for Western blotting do
not need to be modified for use with the C-DiGit Blot Scanner. LI-COR does,
however, have a variety of resources available for optimizing Western blots. Some
of the most common questions regarding imaging with the C-DiGit Blot Scanner
are listed below; more detailed support materials can be found at:
http://www.licor.com/bio/applications/quantitativeWesternBlots/supportMaterials.jsp
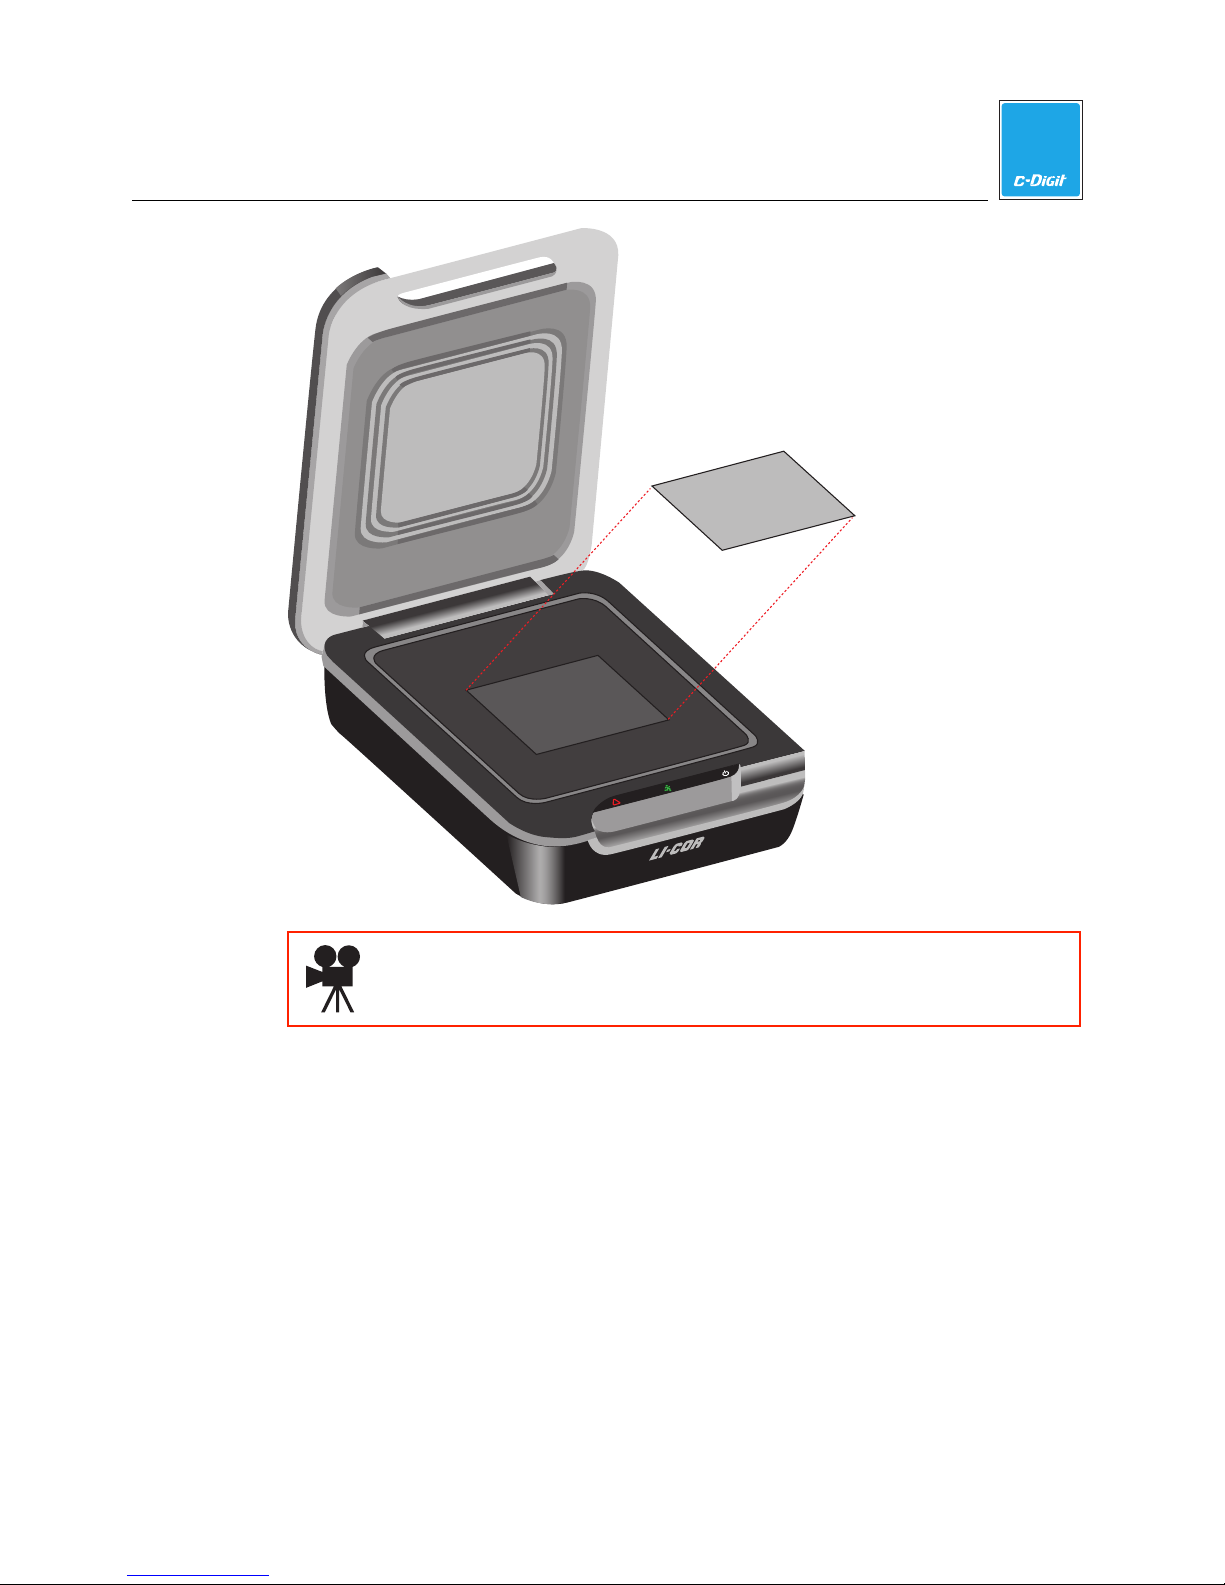
Placing the Membrane on the C-DiGit Blot Scanner Scanning
Surface
The imaging surface is designed to scan a single membrane up to 10 x 8.5 cm.
Place the membrane face down, with the top of the membrane facing the back of
the instrument.
C-DiGit User Manual 3-1
Page 28
3
Using Membranes
10 cm
Face down,
top of membrane
facing rear of
C-DiGit
Place membrane here
!
Click here to watch a video that demonstrates how to place a membrane
on the C-DiGit Blot Scanner.
8.5 cm
Using Blocking Buffer
1. Can I use Odyssey
Yes. Use only for the blocking step and be aware that the sodium azide from
the Odyssey blocking buffer may still be present on the membrane at the
detection step and will bind to the HRP enzyme, resulting in reduced light
production and less intense bands.
2. Can I use milk-based blockers?
Yes. Milk-based blockers can be used for chemiluminescent detection but
should be avoided when detecting phosphoproteins or glycoproteins. Milkbased blockers may contain endogenous biotin and glycoproteins, resulting in
higher background on the membrane.
C-DiGit User Manual 3-2
®
blocking buffer to block my blot?
Page 29

Using Membranes
3. Can I dilute the HRP-conjugated secondary antibodies in Odyssey
blocking buffer?
No. Odyssey blocking buffer contains sodium azide as a preservative. Sodium
azide binds irreversibly to the HRP enzyme, inhibiting the binding of the
substrate and slowing the chemiluminescent reaction. This results in less light
production that may affect the appearance of less intense bands or even the
entire blot. For optimal results do not use any solutions containing sodium
azide for chemiluminescent Western blotting (for either secondary or primary
antibodies).
4. What is the best blocker for chemiluminescent Western blots?
It is best to try several blockers to find the one that gives the most satisfying data
for each antigen and antibody pair. There is not an optimum blocker for all
conditions.
3
®
Primary and Secondary Antibodies
1. Why is the signal missing in the middle of the bands?
Too much secondary antibody on the membrane results in consumption of all
of the substrate in that area. Without substrate, there is no chemiluminescent
signal and a blank spot appears in the center of the band. Try different dilutions
of the primary and secondary antibodies to find what gives the best results, or
try changing the substrate.
2. Does it matter where I purchase the HRP-conjugated secondary
antibodies?
The reactivity of secondary antibodies ranges widely between vendors. The
ratio of HRP enzyme to antibody varies as well, and may affect the detection of
the target. If the secondary antibodies from one vendor are not working, trying
antibodies from LI-COR or other vendors may be helpful. LI-COR offers the
WesternSure™ Goat anti-Mouse HRP secondary antibody under part number
926-80010, and the WesternSure™ Goat anti-Rabbit HRP secondary antibody
under part number 926-80011.
3. Should the HRP-conjugated secondary antibodies be highly crossadsorbed?
Although highly cross-adsorbed antibodies are essential for two-channel,
multiplex detection, it is not always necessary with chemiluminescent blotting
for a single target.
C-DiGit User Manual 3-3
Page 30

Washing Buffer
Substrates
Using Membranes
1. Does it matter how I wash the membranes after antibody incubation?
Yes. Adequately washing the membranes will greatly improve the appearance
of the chemiluminescent Western blot. Wash the membranes with a salinebuffered solution containing 0.05 to 0.1% of a non-ionic detergent such as
Tween
ample wash solution.
®
20. Wash four times for five minutes each on a shaker or rotator with
1. Which substrate should I use?
There are a wide variety of chemiluminescent substrates for HRP detection. In
general, substrates with a faster reaction rate tend to be more sensitive. The
C-DiGit Blot Scanner is designed to work well with most substrates. LI-COR
carries a line of chemiluminescent substrates that have been validated to work
with the C-DiGit Blot Scanner; two of these substrates are WesternSure™
ULTRA (p/n 926-85000) and WesternSure™ Premium (p/n 926-95000).
2. How do I apply the substrate?
Make sure the substrate is at room temperature before use. Substrate should be
applied by following the manufacturer’s suggested methods for the amount of
substrate to use and the incubation time prior to imaging. The substrate can be
directly added to the sample side of the membrane (either by pipetting the
substrate on the sample surface, or by preincubating the membrane in the
substrate), allowed to incubate, and scanned without having to wrap the
membrane before scanning. Membranes can also be wrapped in a plastic
covering prior to scanning.
3. The membrane dried during imaging. Can I apply more substrate and
image again?
No. Applying more substrate to a dried blot will likely result in high background.
4. How do I keep the membrane from drying out?
In general, the membrane should not dry out in the amount of time it takes to
complete a scan. However, to maintain moisture on the membrane for an
extended amount of time, place a clear, flat plastic covering on top of the
chemiluminescent Western blot to keep the substrate in contact with the HRP
enzyme and to prevent the blot from drying out. Membranes can also be
completely wrapped in plastic covering prior to scanning (see question 1 under
‘Imaging’ below). Make sure there is no plastic wrap extending out past the
scanning surface and into the outer lid seal.
3
C-DiGit User Manual 3-4
Page 31
Imaging
Using Membranes
1. Can I wrap the blot in plastic wrap before imaging?
As long as the plastic is clear, clean, and wrinkle free (the plastic wrap may
cause unwanted background, especially if it is folded or handled roughly), the
blot can be wrapped in plastic before imaging.
2. Why are the bands on my blot so light?
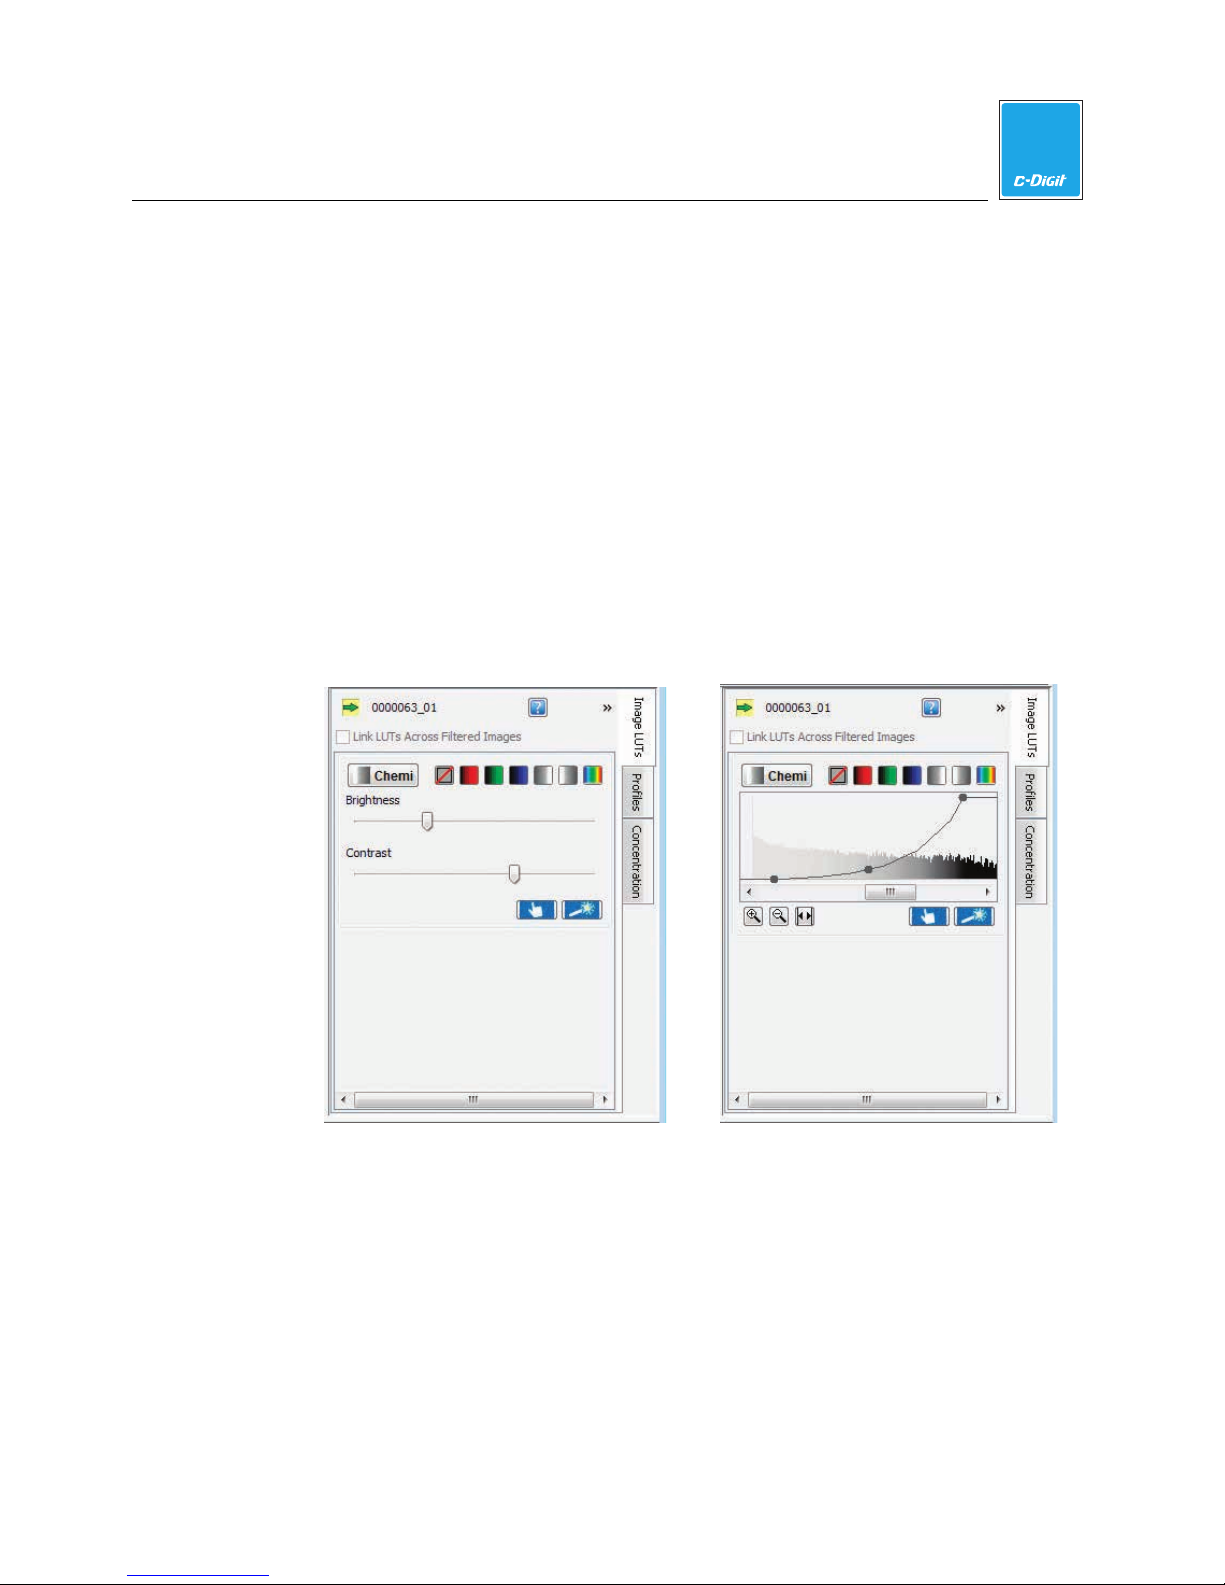
Use the Look Up Table (LUT) in Image Studio to adjust how data are mapped to
the display pixels of your computer screen.
You can view the Image LUTs as either slider bars (the default view, below left)
or as histograms overlaid with a curve (below right). To hide this view, click
the double arrows in the top right corner.
3
Overlaying the LUT histogram is a curve with three adjustable points (below
left). Move the top Max Point to the left to map more of the higher intensity
data to the brighter display pixels to make the bands appear brighter. Move the
lower Min Point to the right to map the lower intensity data to the background
color, creating a visually cleaner background. The middle point smoothly
adjusts the mapping from linear to logarithmic. Changing to a more logarithmic
mapping reduces the contrast between the lower and higher intensity data, so
the appearance of less intense bands is improved while avoiding overly dark
bands.
C-DiGit User Manual 3-5
Page 32
3
Using Membranes
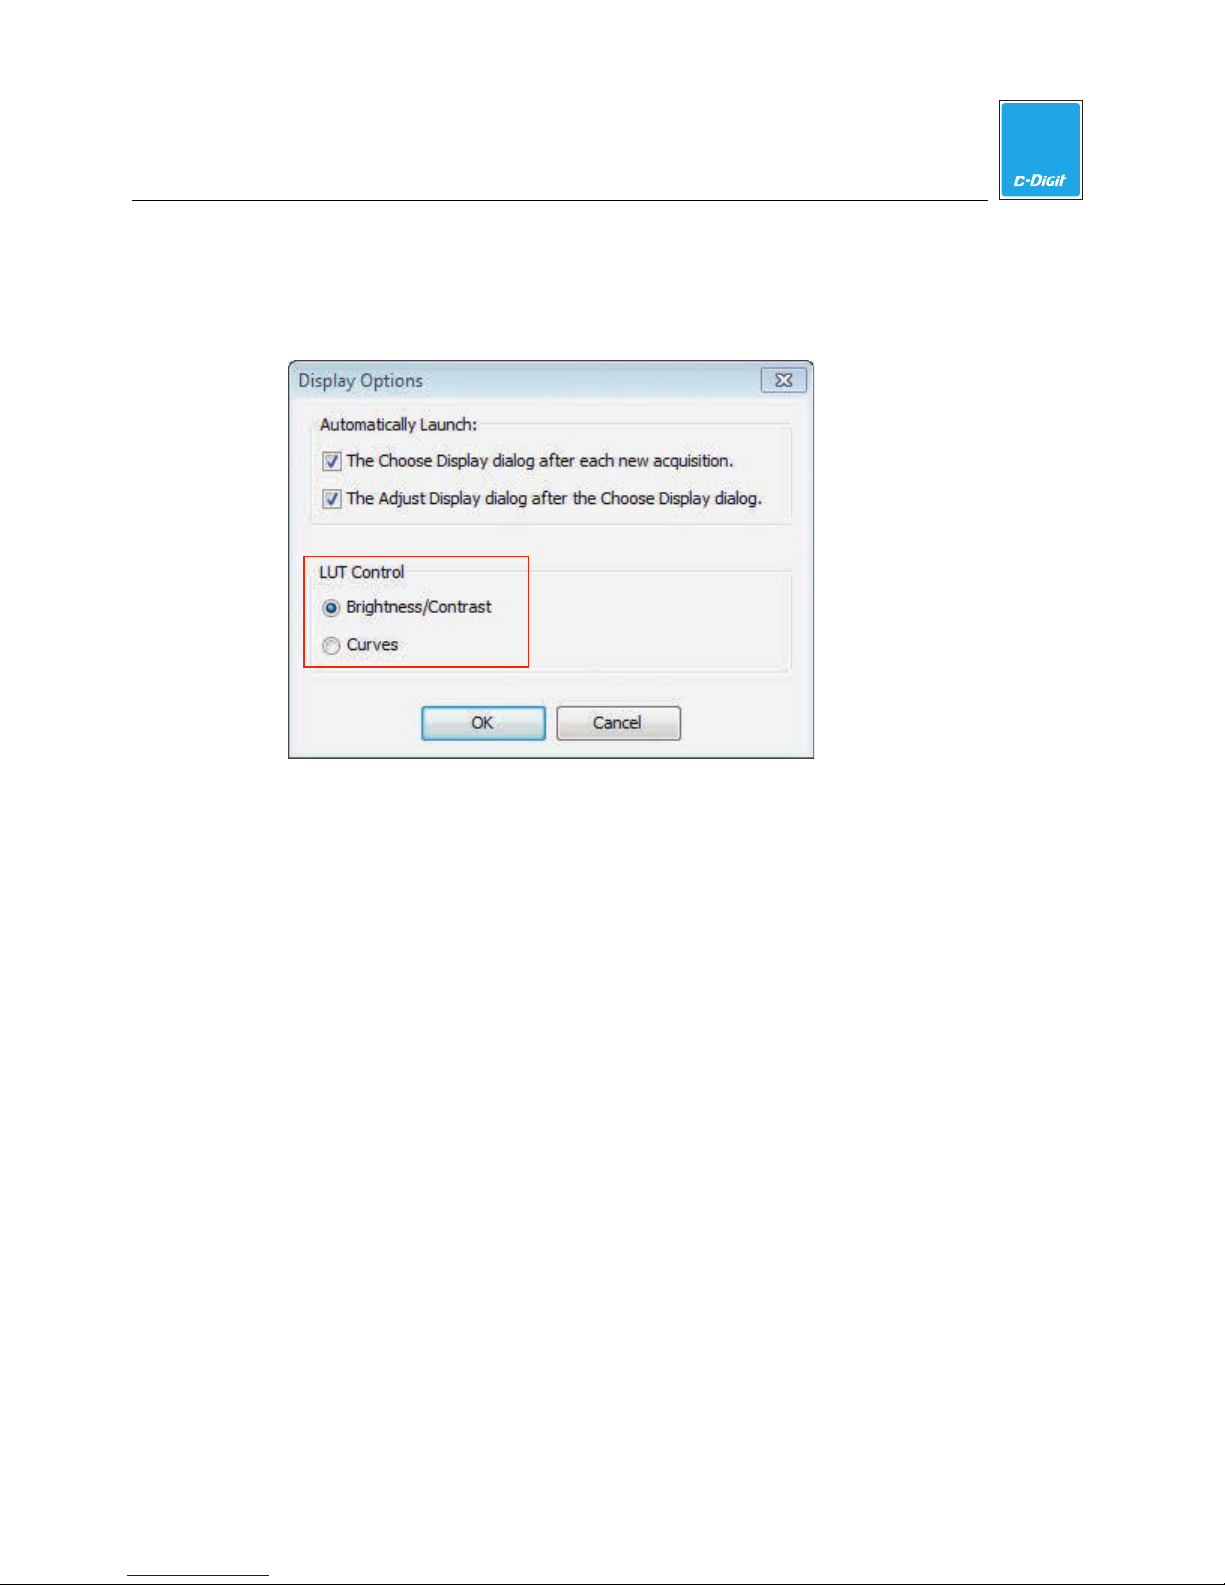
To change the Image LUTs from histograms (Curves) to Brightness/Contrast sliders,
and vice versa, click the arrow (>) on the Display group on the Image ribbon to
open the Display Options dialog.
C-DiGit User Manual 3-6
Page 33
4
Overview
Image Studio for C-DiGit
Image Studio DiGits is a simple, easy to use Western blot imaging and analysis tool
that features an intuitive, application-driven ribbon interface. Image Studio DiGits
is compatible with both PC and Macintosh computers. This section provides a
reference for the software features available on each ribbon interface.
Learning the Software
Each part of the user interface (button, etc.) has a tool tip associated with it that can
be invoked by hovering the mouse over the feature on the user interface. Image
Studio Software help is also available by clicking the
part of the main window.
button at the upper right
Optional Key Tips
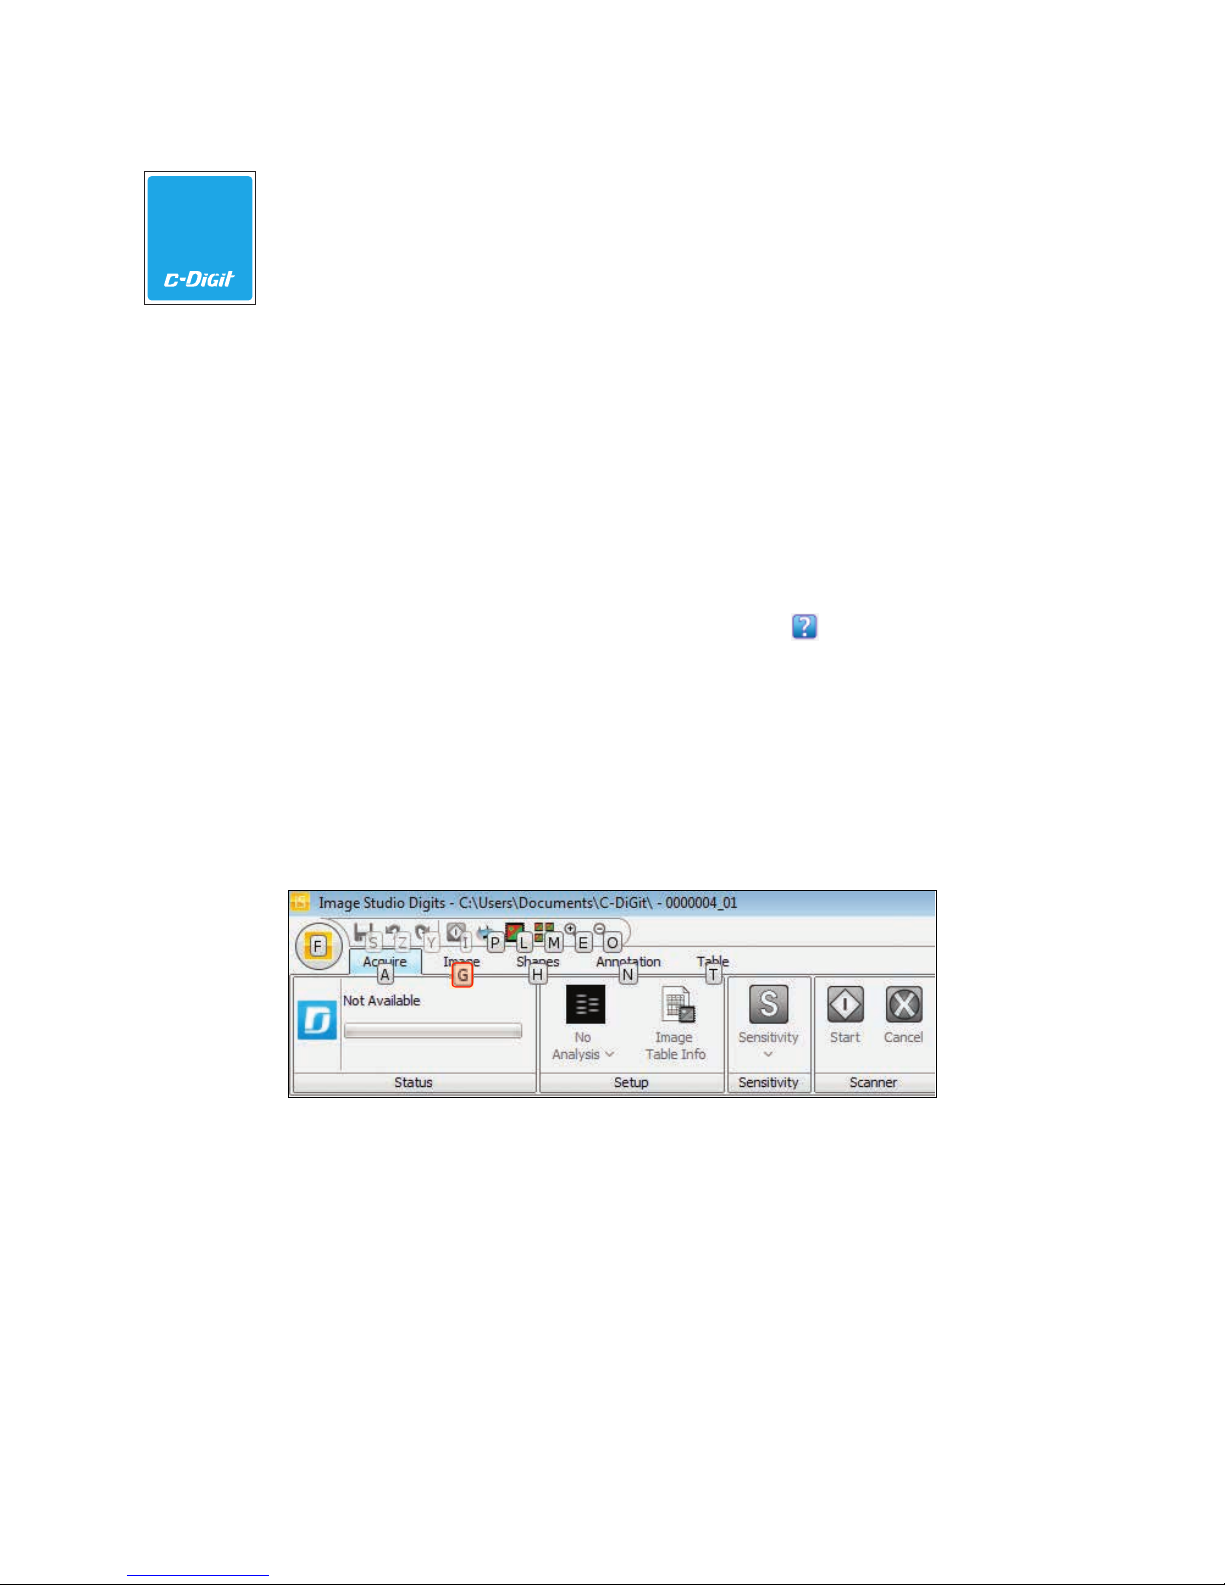
Activate Key Tips to use the keyboard to access the ribbon tabs and other features
of the Image Studio software. Press Alt (Macintosh: Alt+Option) to display the Key
Tips for all ribbon tabs and application quick launch buttons. Press the letter key
next to the application quick launch buttons to select that application (e.g. press
‘G’ to open the Image tab, as shown below).
Press the letter key next to the ribbon tabs to view the ribbon for the selected tab
and the key tips for the commands on that ribbon. Press the letter key next to the
commands to activate the commands or open another menu. For Key Tips with two
letters, press the keys sequentially on the keyboard.
In this manual, instructions refer to selecting tabs and commands with the mouse.
Press Alt at any time to use the Key Tips to select tabs and commands with the
keyboard.
C-DiGit User Manual 4-1
Page 34
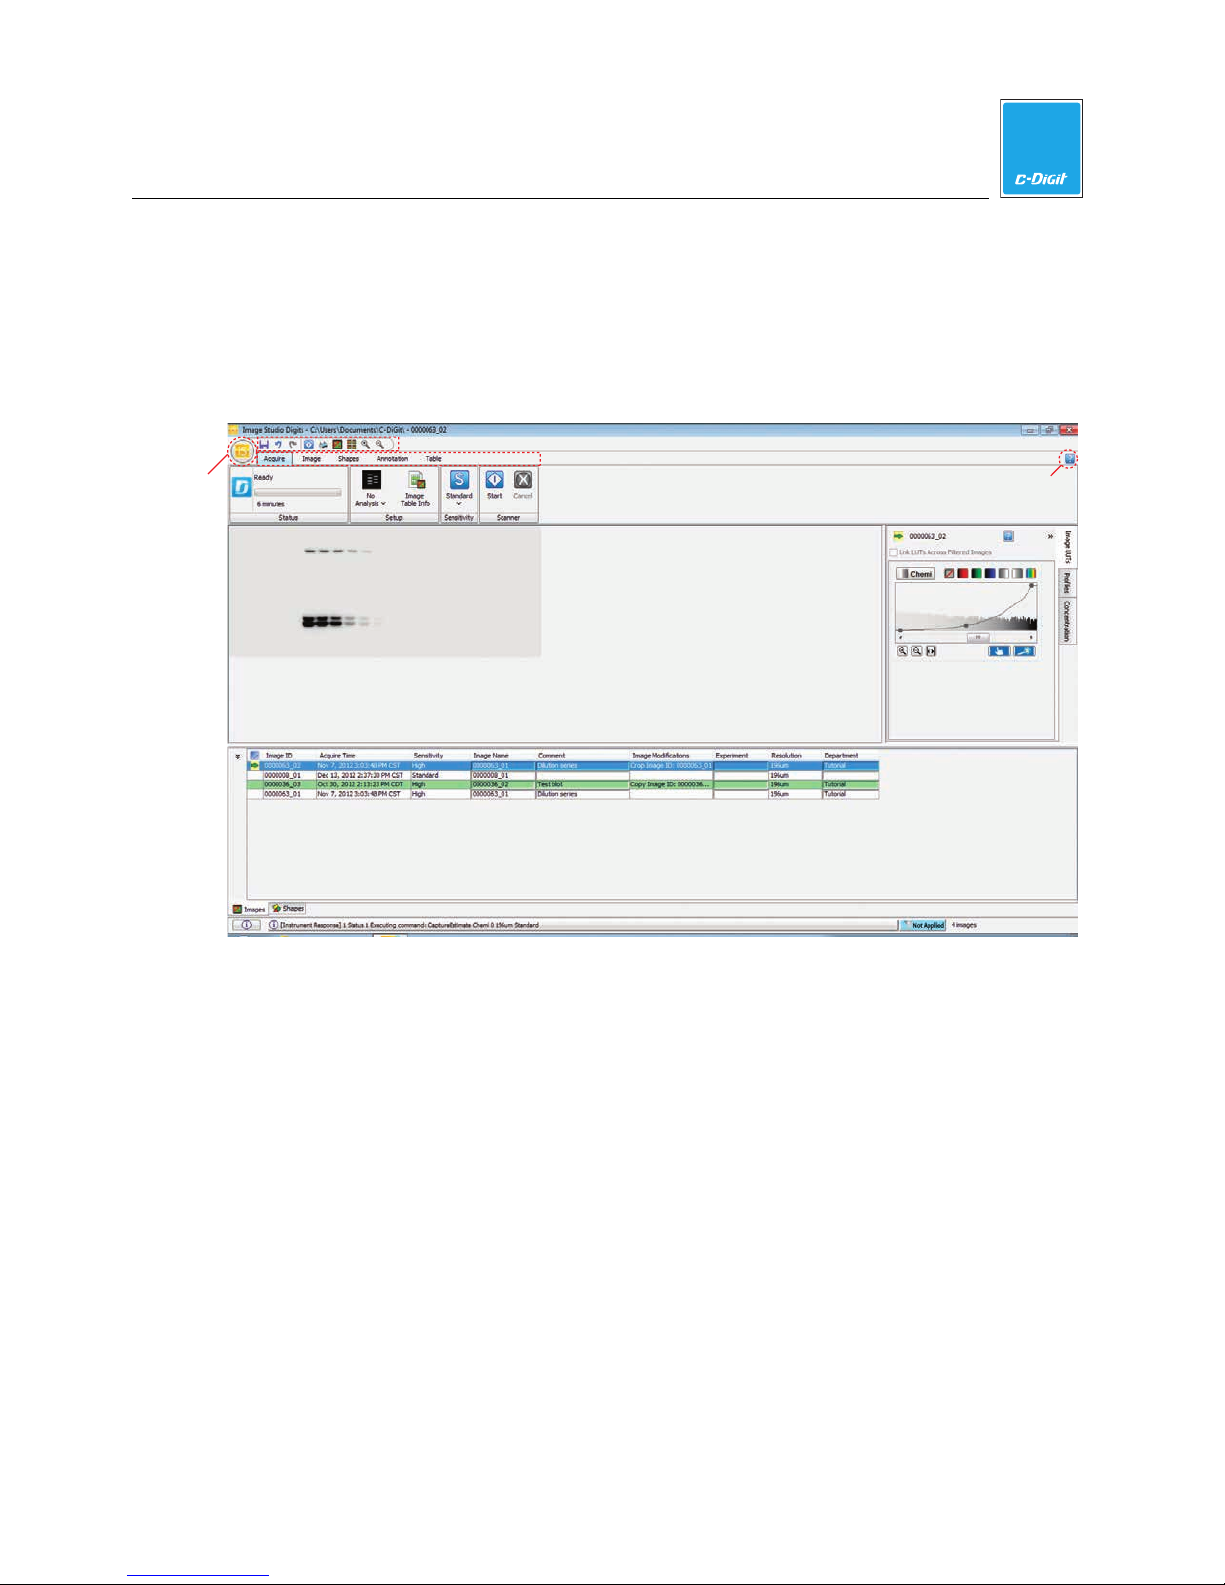
The Image Studio Main Window
The Image Studio main window has a number of different areas that contain the
image, image data, status, quick launch buttons, ribbon tabs, Application menu,
Images and Shapes tables, and a button to launch the Help application, as shown
below.
Application
Menu
Quick Launch Buttons
Image Area
Ribbon Tabs
Image Studio Software
4
Help
Images/Shapes Tables
Status Bar
Image Data
C-DiGit User Manual 4-2
Page 35
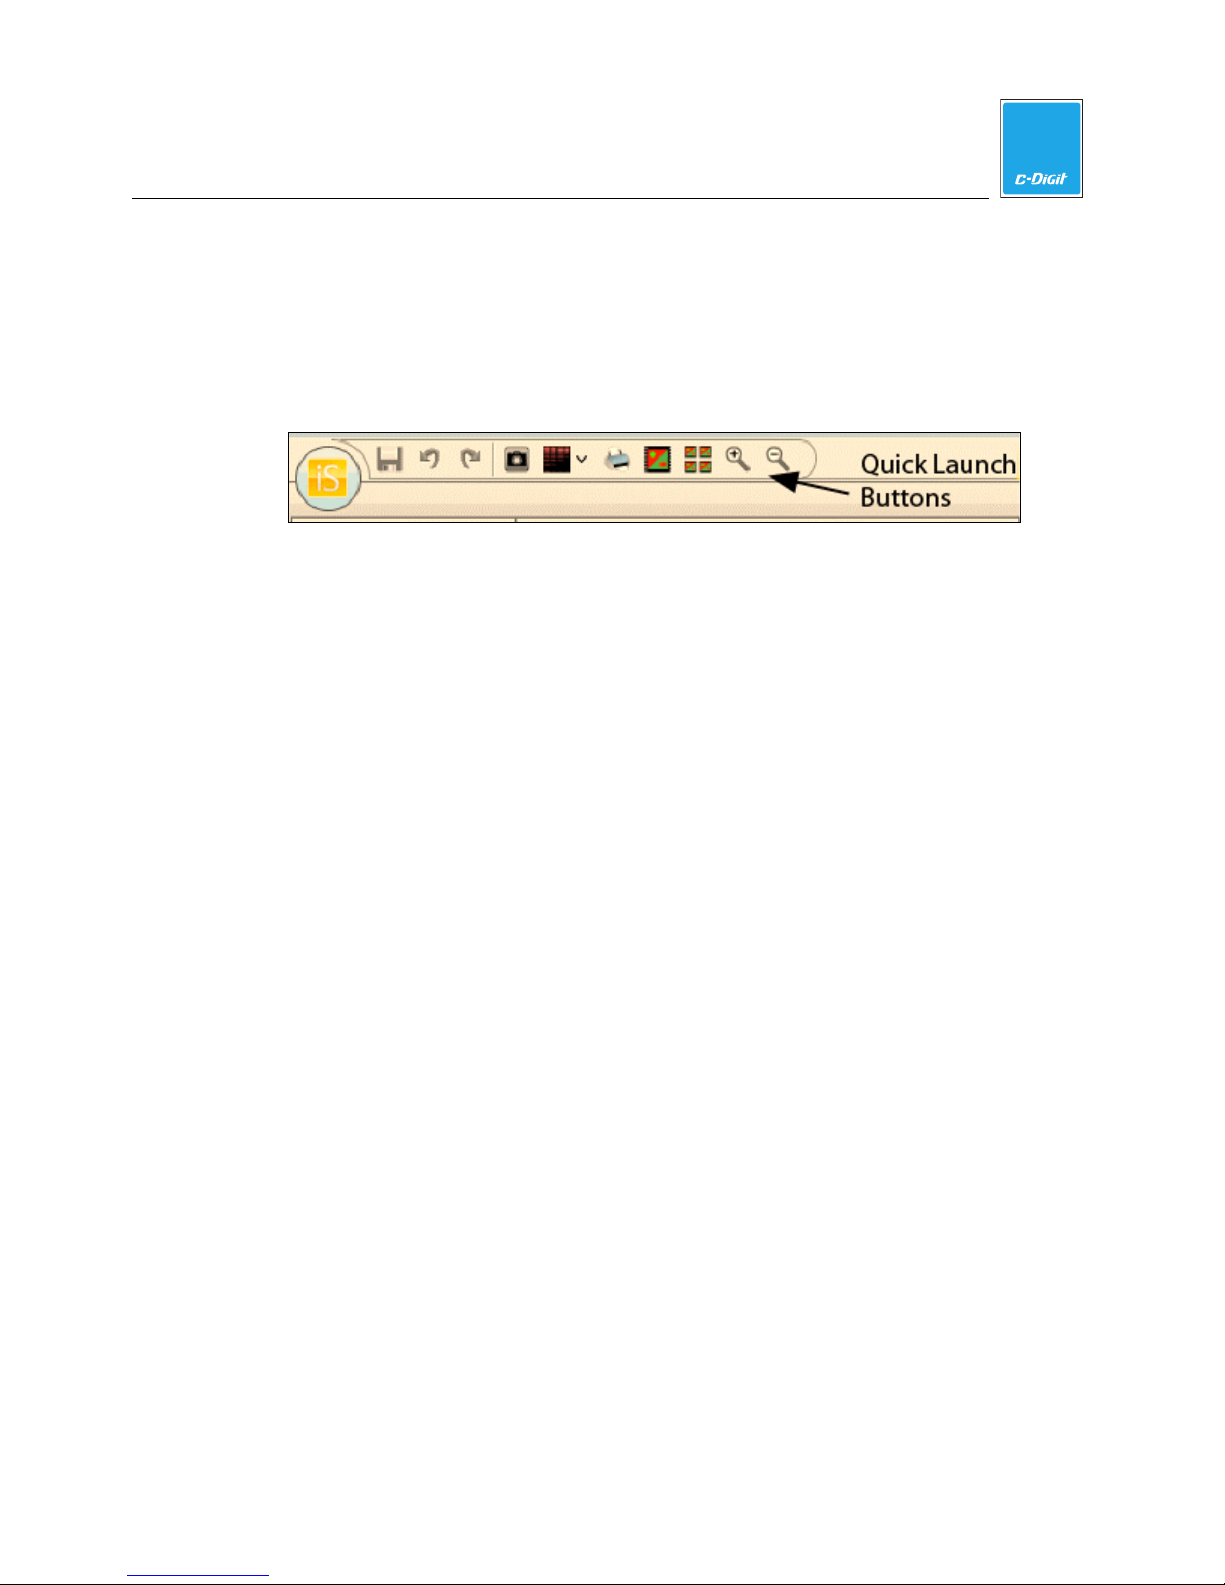
Quick Launch Buttons
The Image Studio Quick Launch buttons are located on the ribbon task bar above
the tabs. These buttons are accessible from all the tabbed ribbon views. They
include (l-r):
Image
Save, Undo, Redo, Start Scan, Select Analysis, Print, Single
View display, Multiple Image View display, Zoom In, and Zoom Out.
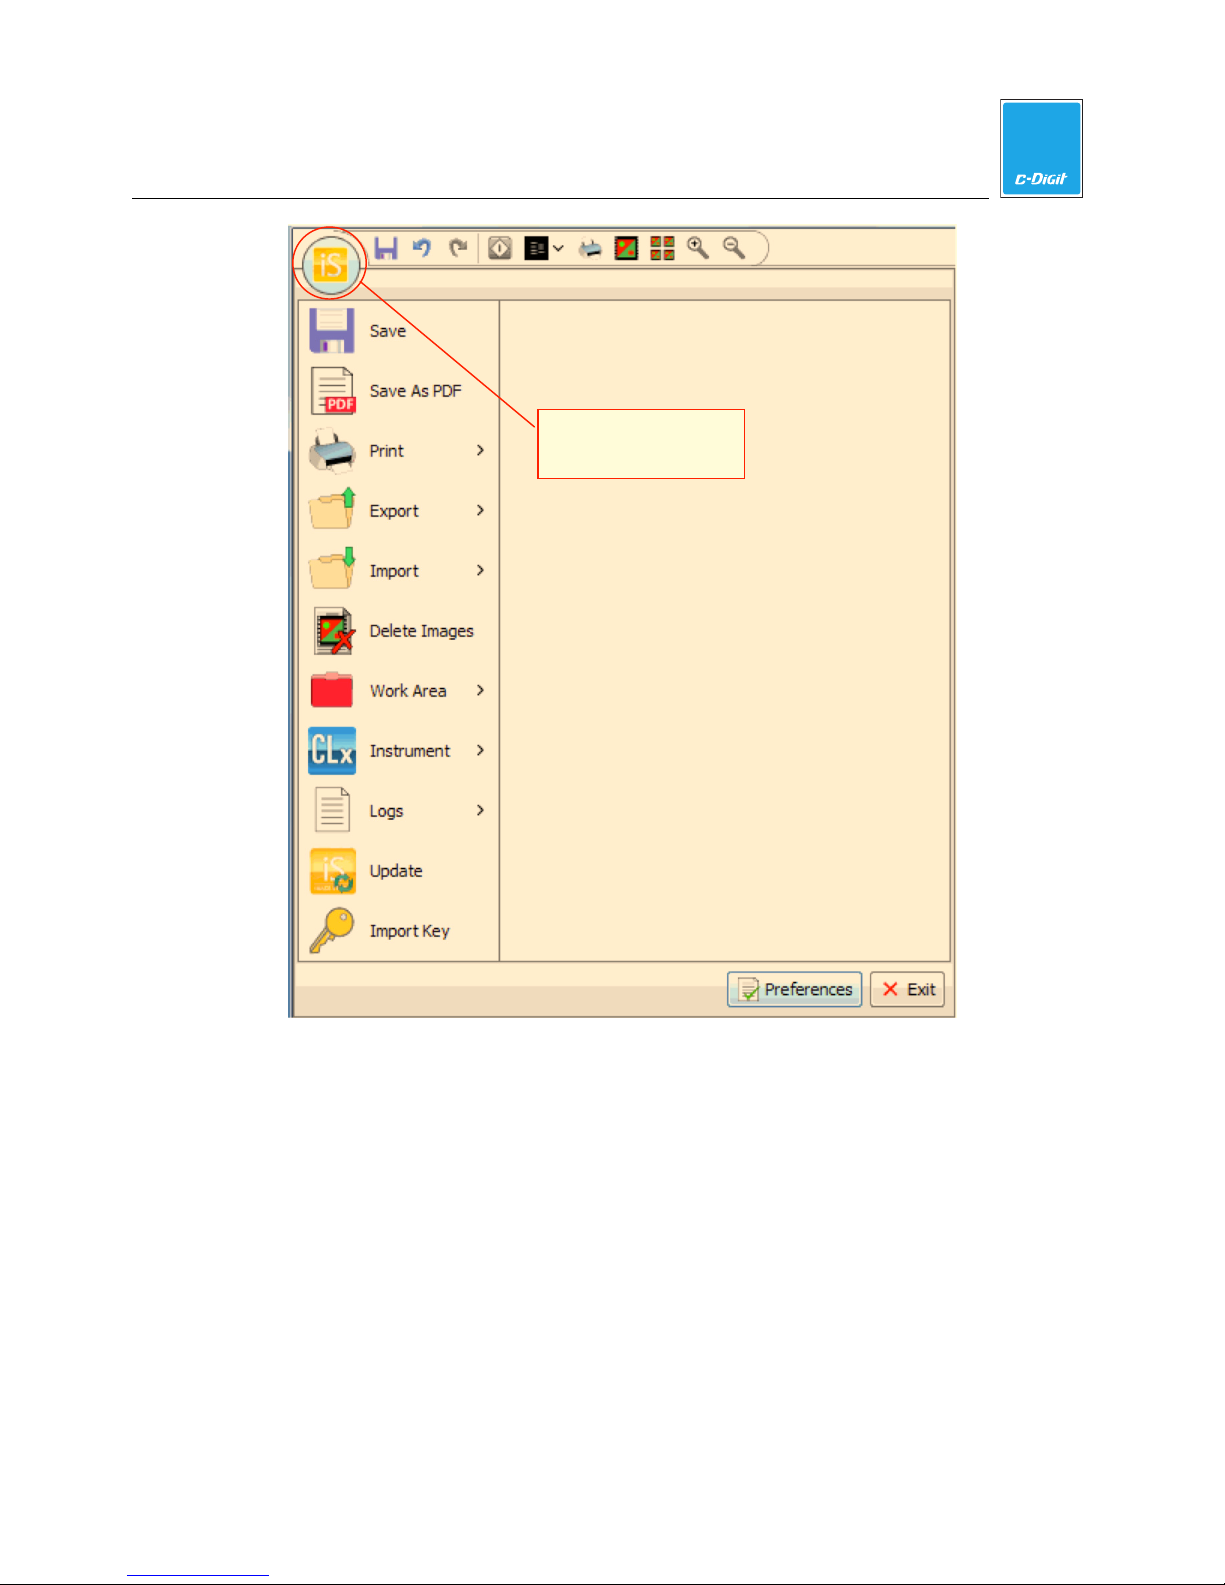
The Application Menu
The Application button is the round button with the Image Studio icon at the upper
left corner of the application.
Press the Application button to display the Application menu (below). The leftmost
panel displays the primary menu. If the menu item is followed by an arrow symbol
(>) click the item to display a secondary menu in the rightmost panel. The
secondary menu displays additional choices and their descriptions.
Note: To access these commands with the keyboard, press the ALT key to display
the Key Tips.
Image Studio Software
4
C-DiGit User Manual 4-3
Page 36
pp
4
Image Studio Software
Image Studio
A
lication menu
The footer area of the Application window contains two buttons: Preferences and
Exit. Preferences are described later in this section. Click Exit to exit the Image
Studio application.
Save
Click Save to save all new or edited analyses currently open within the application.
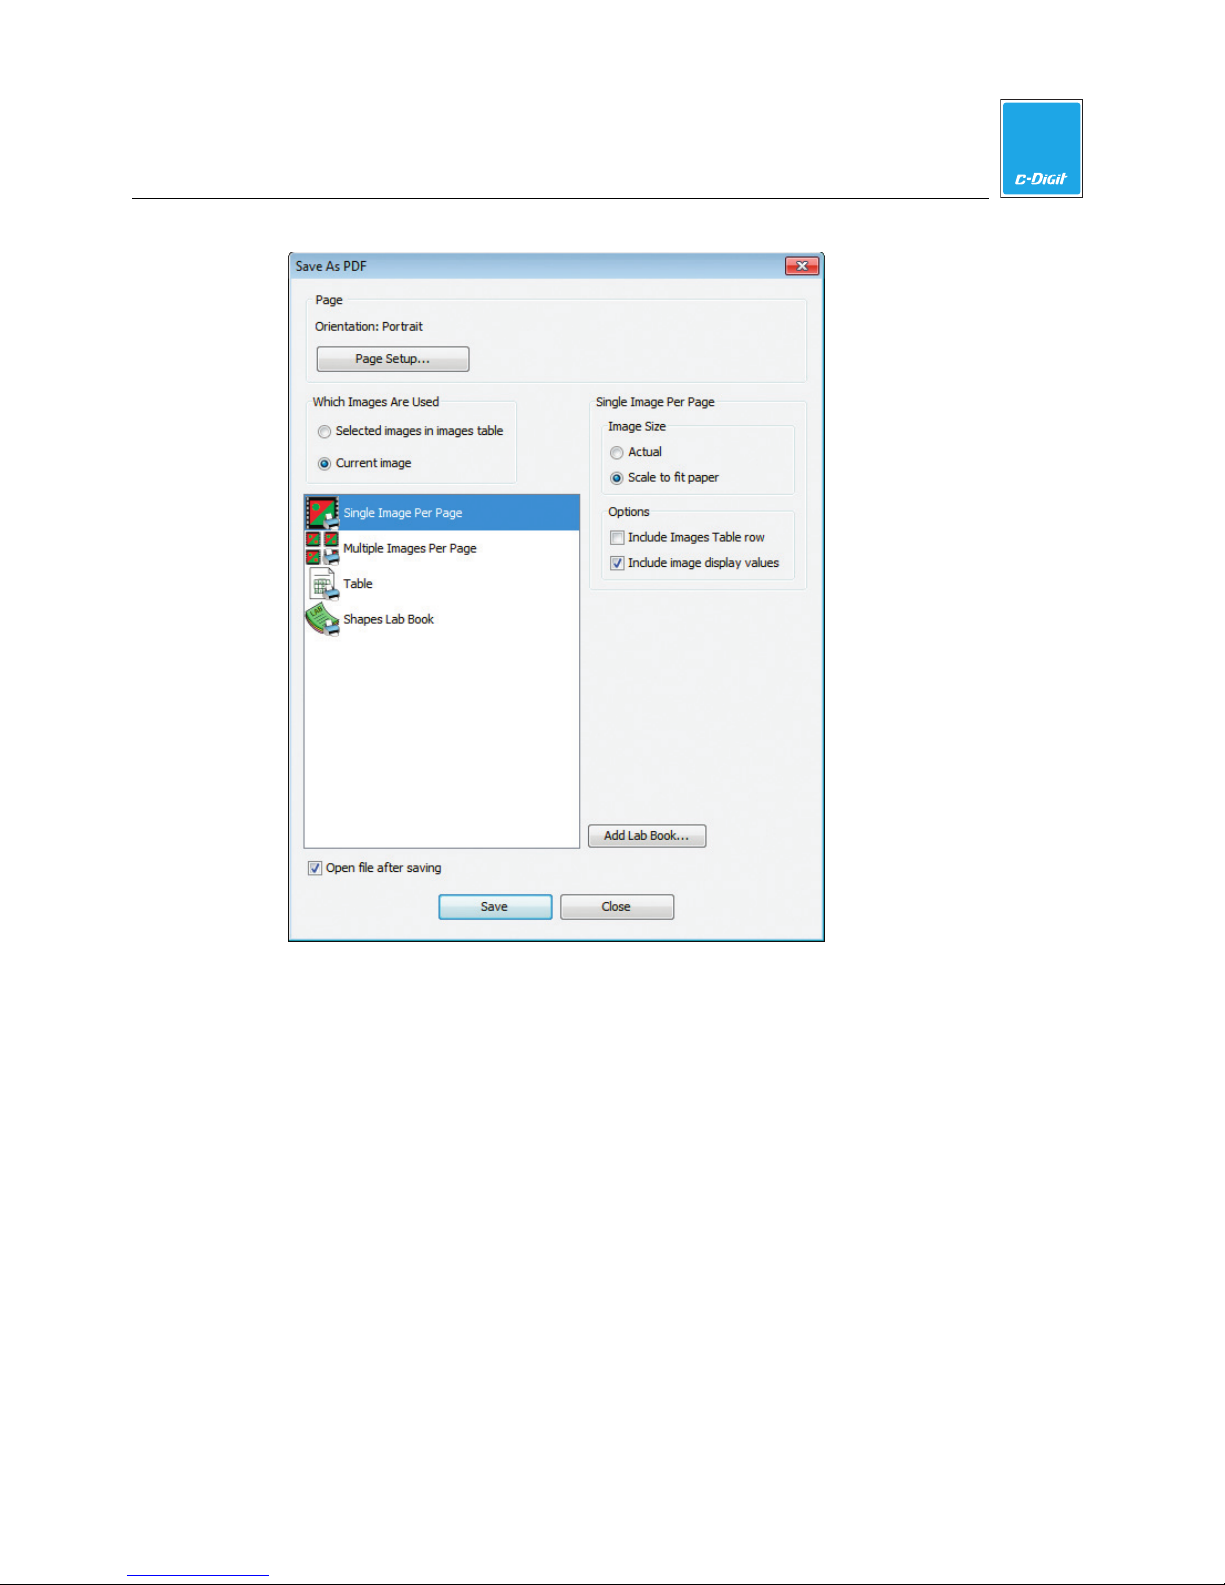
Save as PDF
Click Save as PDF to open the Save as PDF dialog (below), where you can select
the Table, Lab Book, or Images to save in PDF format. See ‘Print Images and
Create Reports’ later in this section for more information.
C-DiGit User Manual 4-4
Page 37
4
Image Studio Software
Print
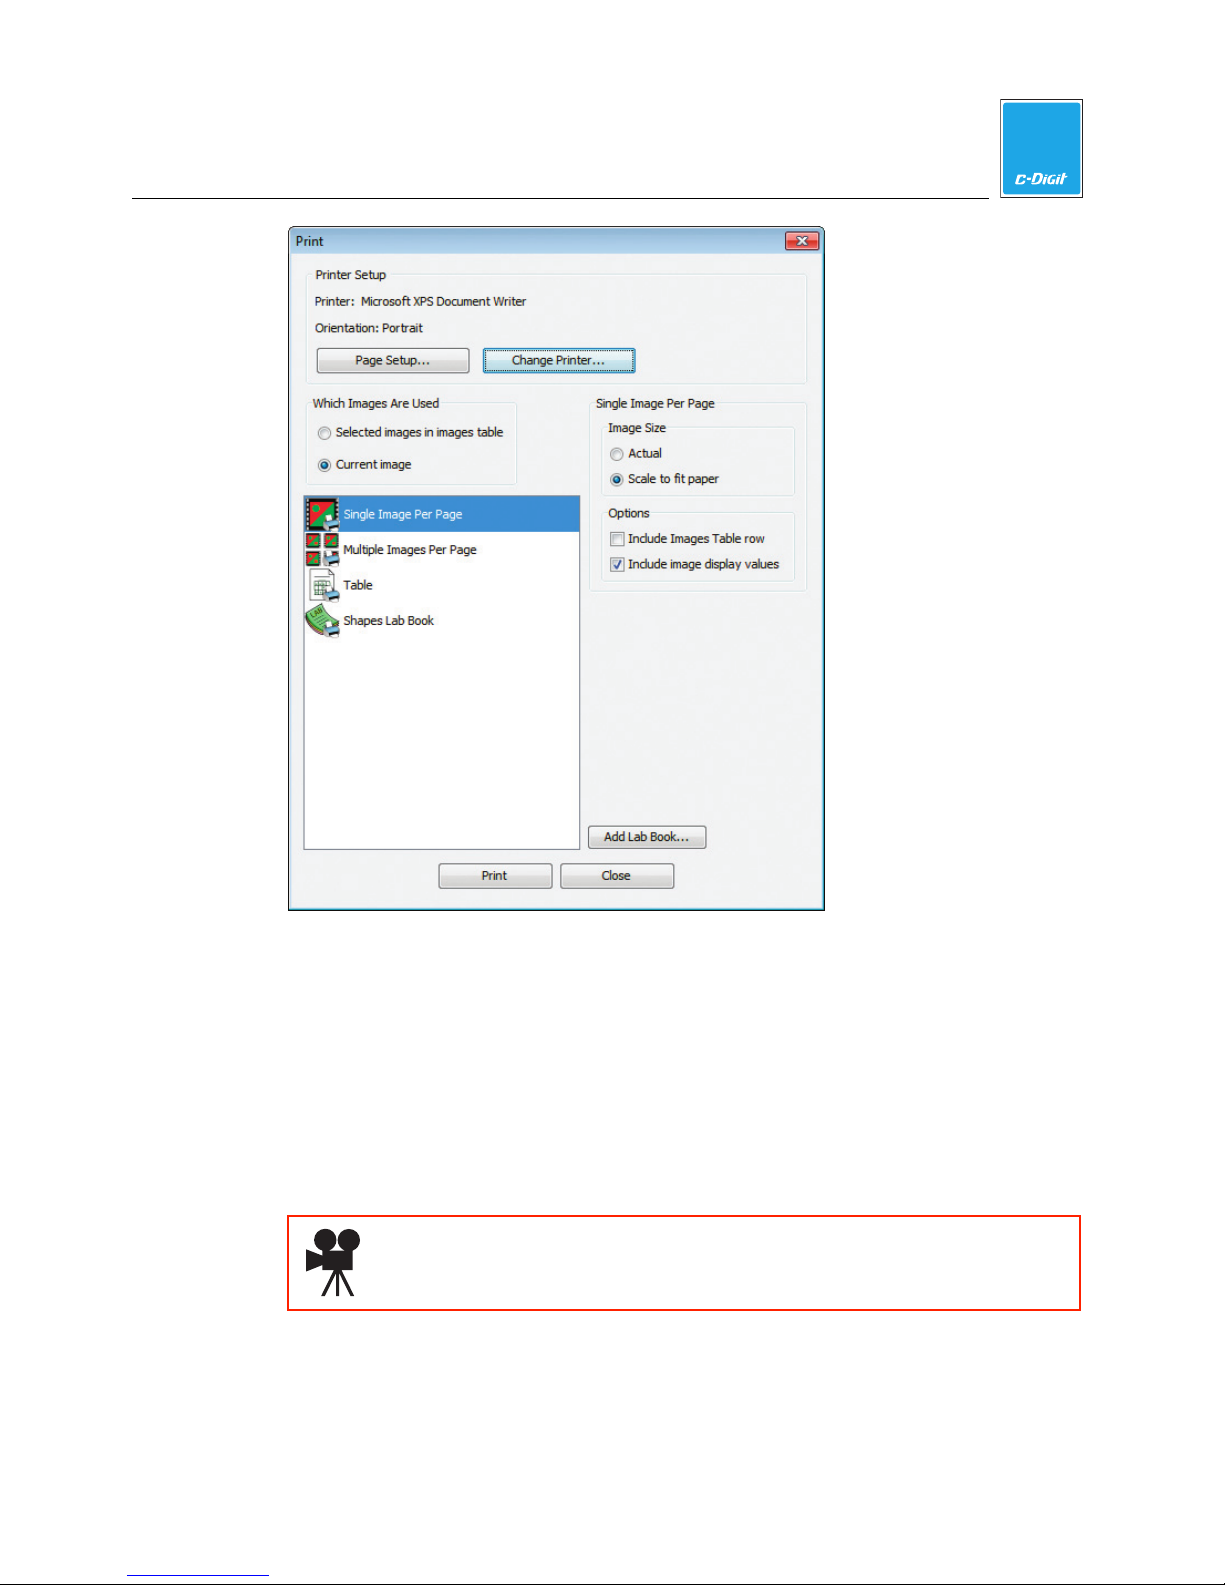
The Print menu has choices for configuring the printed output for images, tables,
and/or Shapes Lab Books. See ‘Print Images and Create Reports’ later in this
section.
C-DiGit User Manual 4-5
Page 38
4
Image Studio Software
Export
The Export menu has choices for exporting images and table data. You can choose
to export the currently displayed image, or selected images in the Images table.
Click the Images tab at the bottom of the main window, and select the images that
you want to export. The entire folder is copied, including images, analysis files, and
other text files. This is useful if you are transferring data to a different location for
archiving or you are transferring data from another Work Area. Open the
Application menu.
Click here to watch a video that demonstrates how to export data.
Single Image View
Click the Export menu and expand the Single Image View submenu.
C-DiGit User Manual 4-6
Page 39
4
Image Studio Software
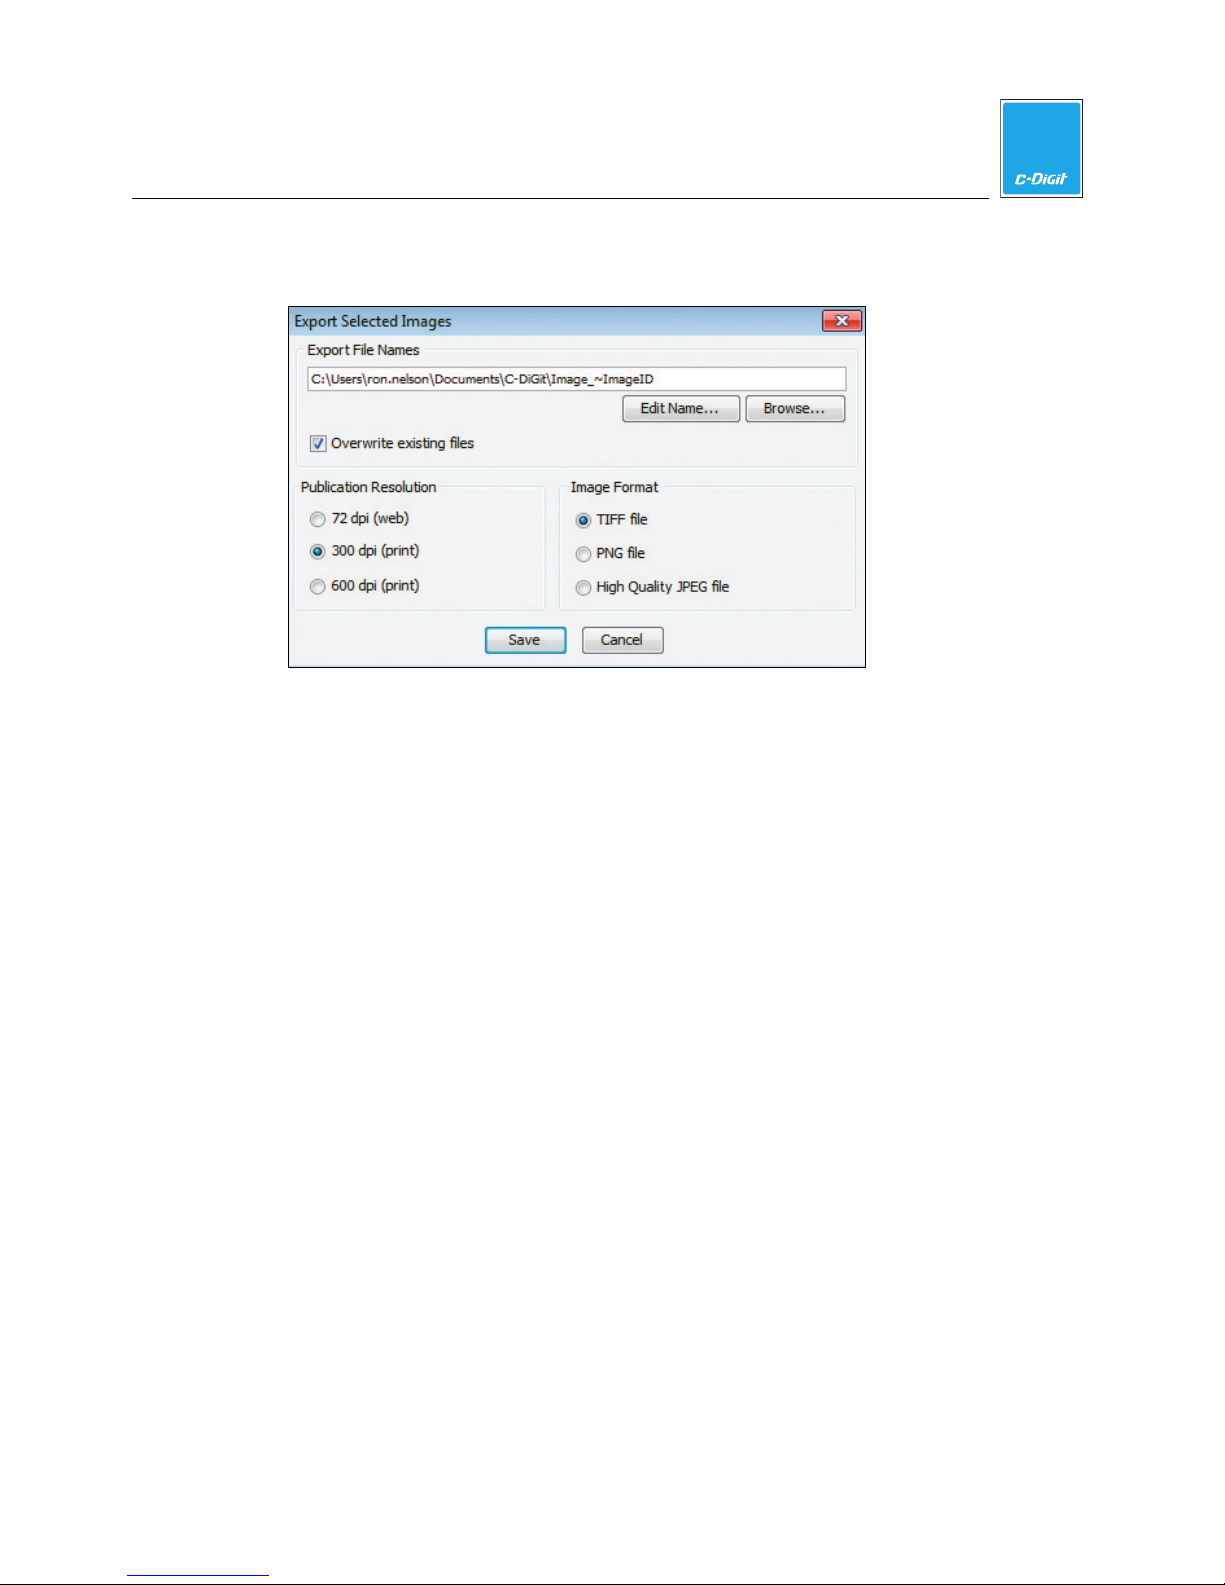
Check Selected Images in ImagesTable. The Export Selected Images dialog is
displayed.
1. Enable Overwrite existing files, or disable if you don't want the existing files to
be overwritten.
2. Select the Publication Resolution and the Image Format. If the image is for
viewing on a website or for attaching to an e-mail, choose 72 dpi and High
Quality JPEG file or PNG file.
3. If you accept the default folder and name, the folder will be your current Work
Area and the name of each image will be its Image ID with an extension
indicating the File type, for example, Image_0000019_01.tif,
Image_0000020_01.tif.
4. If you want to change the default name or folder, click Edit Name to change the
name; click Browse to navigate to a different folder.
5. Click Save when finished.
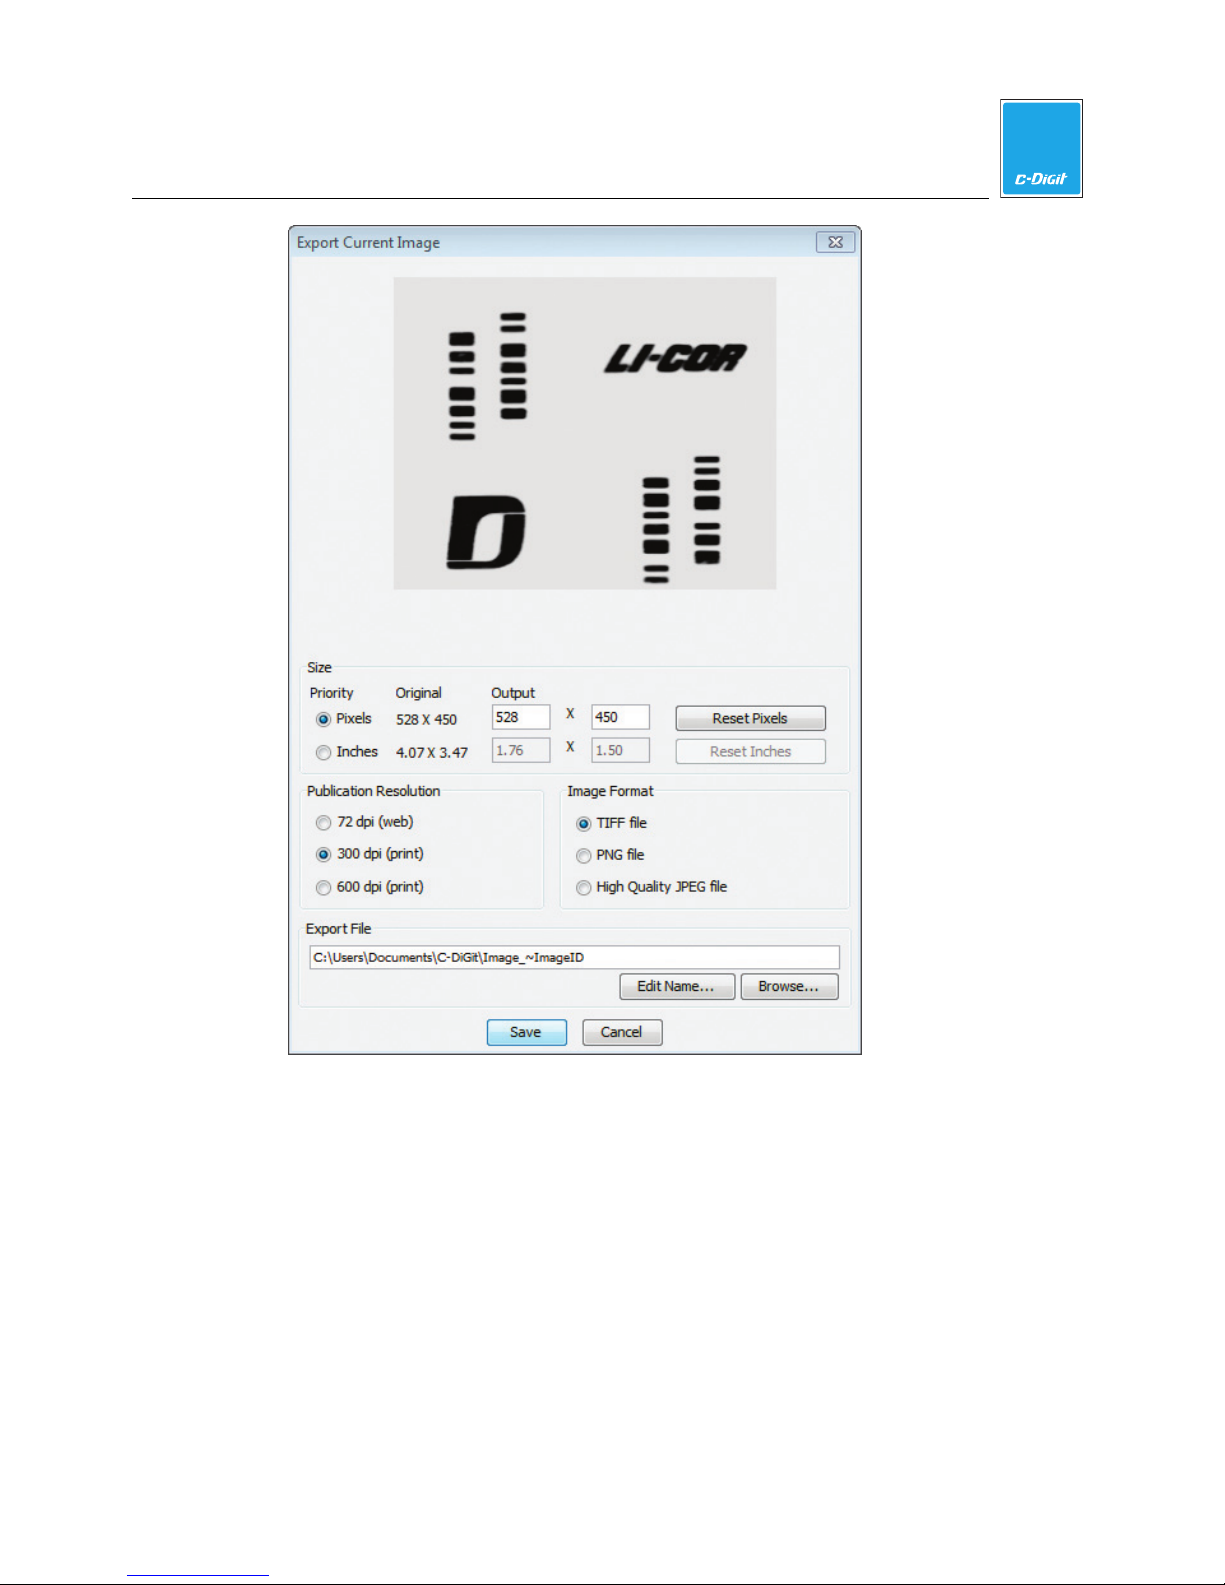
Export Current Image
Open the Application menu. Click the Export menu and expand the Single Image
View submenu. Check Current Image. The Export Current Image dialog is
displayed.
C-DiGit User Manual 4-7
Page 40
4
Image Studio Software
1. Select the Size Priority.
Select Inches to set the output size to inches when changing DPI. The output
pixel count changes proportionally when the inches value is changed.
Select Pixels to set the output size in pixels when changing DPI. The output
inches value changes proportionally when the pixel count is changed.
Click Reset Pixels or Reset Inches to return the Output to the Original Size.
2. Select the Publication Resolution and the Image Format. If the image is for
viewing on a website or for attaching to an e-mail, choose 72 dpi and High
Quality JPEG file or PNG file.
C-DiGit User Manual 4-8
Page 41

4
Image Studio Software
3. If you accept the default folder and name, the folder will be your current Work
Area and the name will be the Image ID with an extension indicating the File
type, for example, Image_0000021_01.tif.
4. If you want to change the default name or folder, click Edit Name to change the
name; click Browse to navigate to a different folder.
5. Click Save when finished.
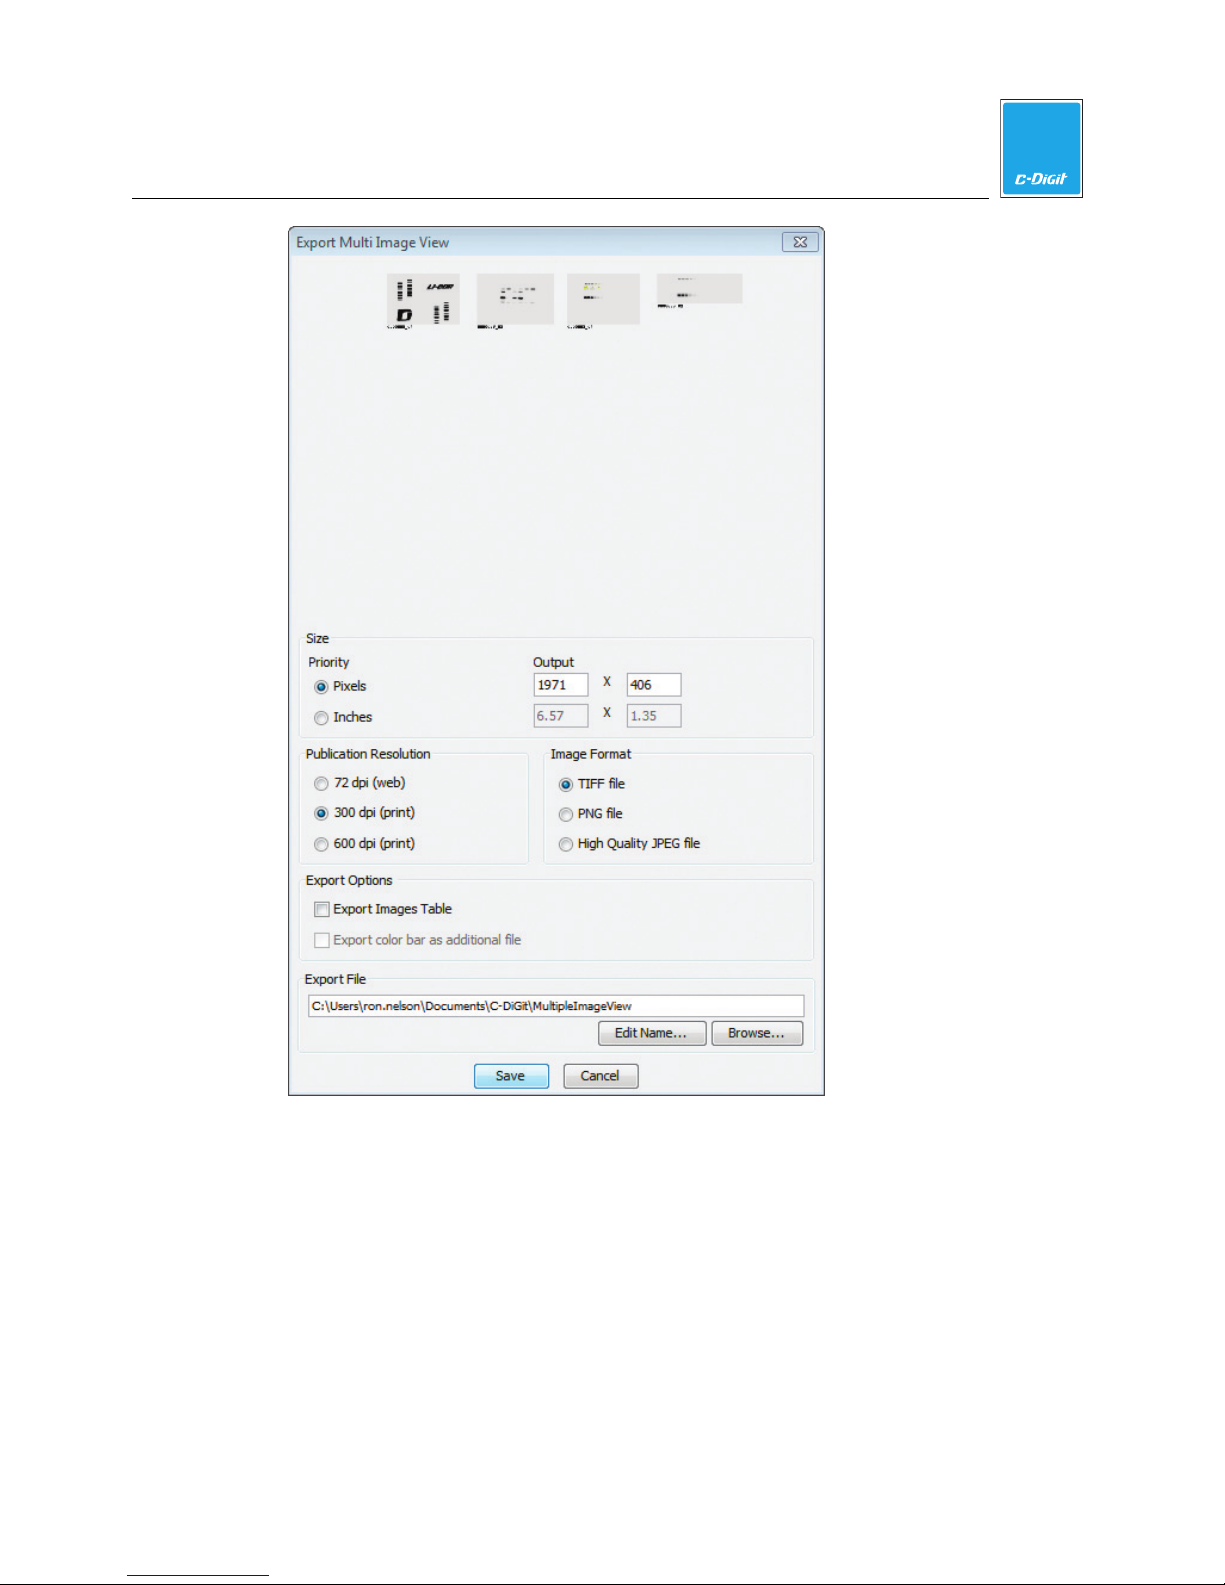
Multiple Image View
Click the Multi-Image mode button, and then open the Application menu.
Choose Multiple Image View from the Export menu. The Export Multi Image
View dialog (below) is displayed.
C-DiGit User Manual 4-9
Page 42
4
Image Studio Software
1. Select the Size Priority.
Select Inches to set the output size in inches when changing DPI. The output
pixel count changes proportionally when the inches value is changed.
Select Pixels to set the output size in pixels when changing DPI. The output
inches value changes proportionally when the pixel count is changed.
2. Select the Publication Resolution and the Image Format. If the image is for
viewing on a website or for attaching to an e-mail, choose 72 dpi and High
Quality JPEG file or PNG file.
C-DiGit User Manual 4-10
Page 43
4
Image Studio Software
3. Check Export Images Table to include the Images table.
4. If you accept the default folder and name, the folder will be your current Work
Area and the name will be MultipleImageView.
5. If you want to change the default name or folder, click Edit Name to change the
name; click Browse to navigate to a different folder.
6. Click Save when finished.
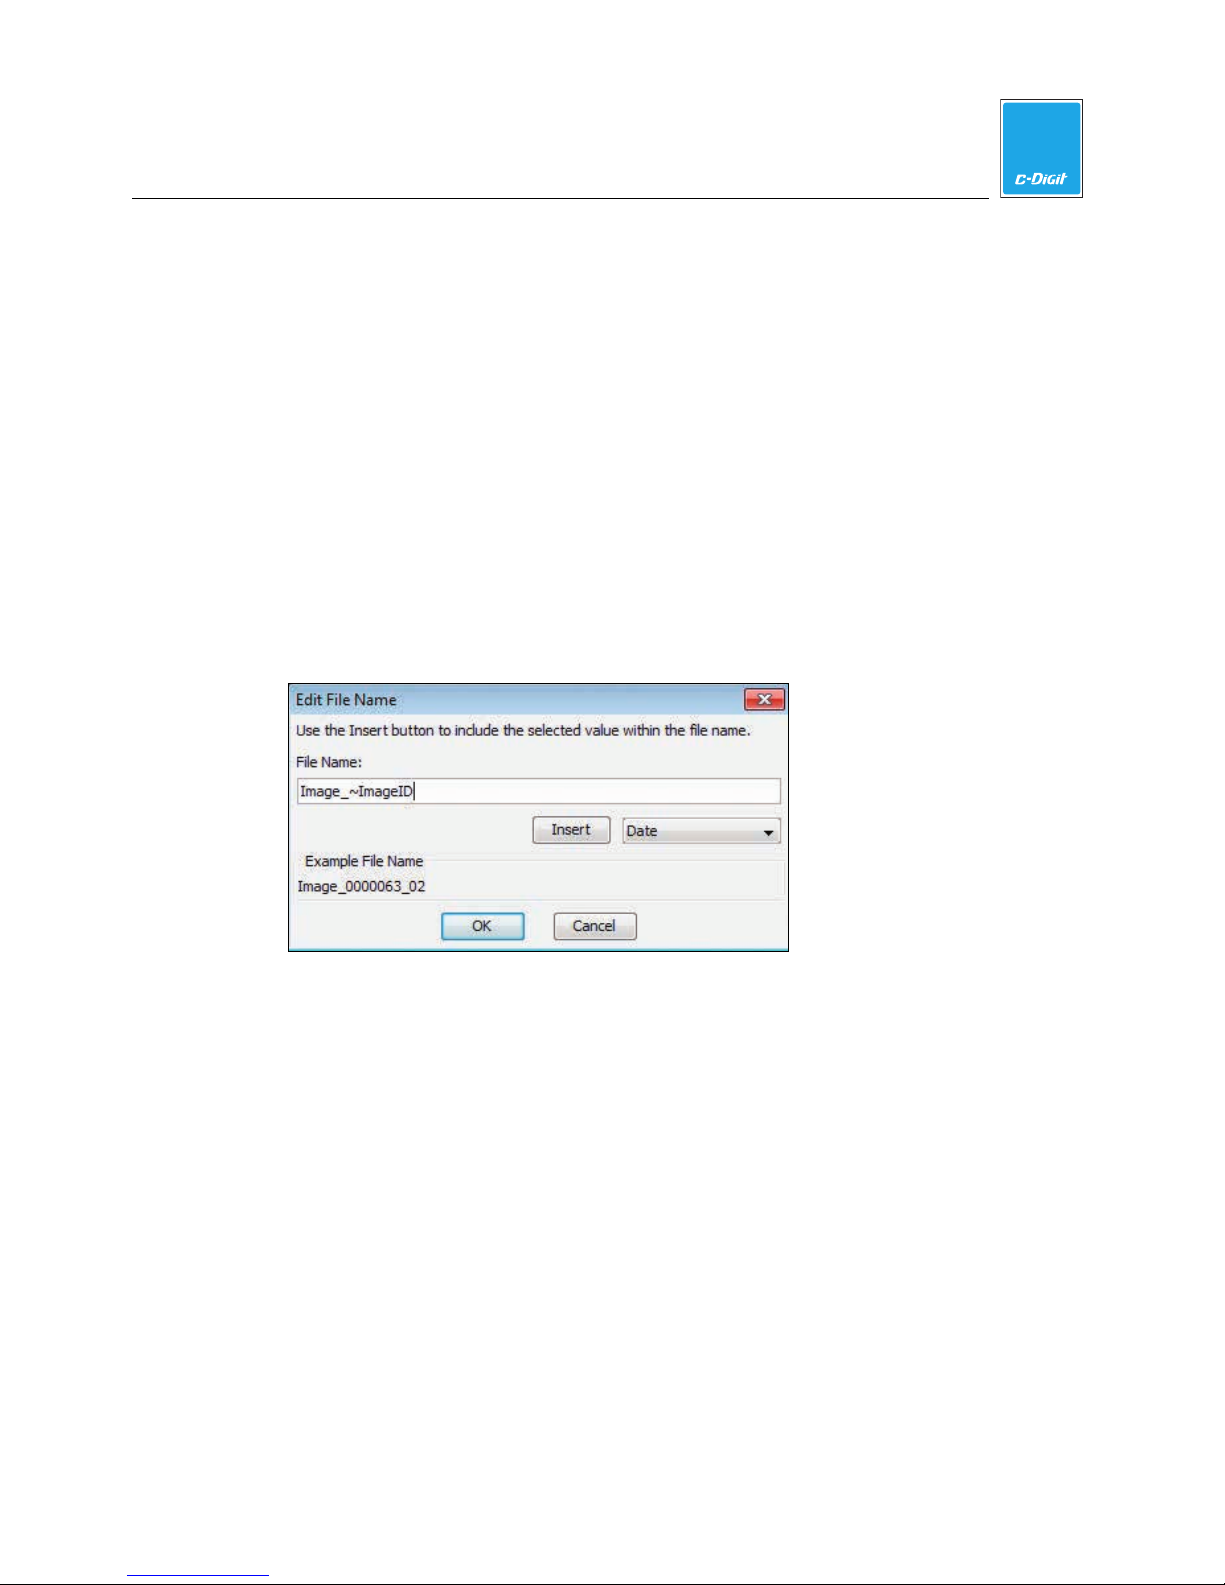
Edit File Name
The Edit File Name dialog is displayed if you click Edit Name in the Export Selected
Images or Export Current Image dialogs. The Edit File Name dialog provides a way
to build a file name using selections from a list of the columns in the Images Table.
The selections are inserted into the File Name text field, preceded by a tilde (~).
1. Select a column field from the drop-down menu.
2. Click Insert. The field is added to the name in the File Name text field at the
cursor location.
3. Repeat these steps to add more fields. Notice that the fields are preceded by a
tilde (~).
4. To preview the filename, view the Example File Name that is displayed in the
dialog as you add fields. Hint: Separate inserted fields with an underscore or
space character to make the fields readable.
5. Click OK when finished.
Note: If you are exporting multiple images, be sure to include a unique value
(e.g. Image ID). If you simply specify a filename, such as "My_Image~Date", as
C-DiGit User Manual 4-11
Page 44
4
Image Studio Software
each file is created it will use that name, thus overwriting the previously saved
file.
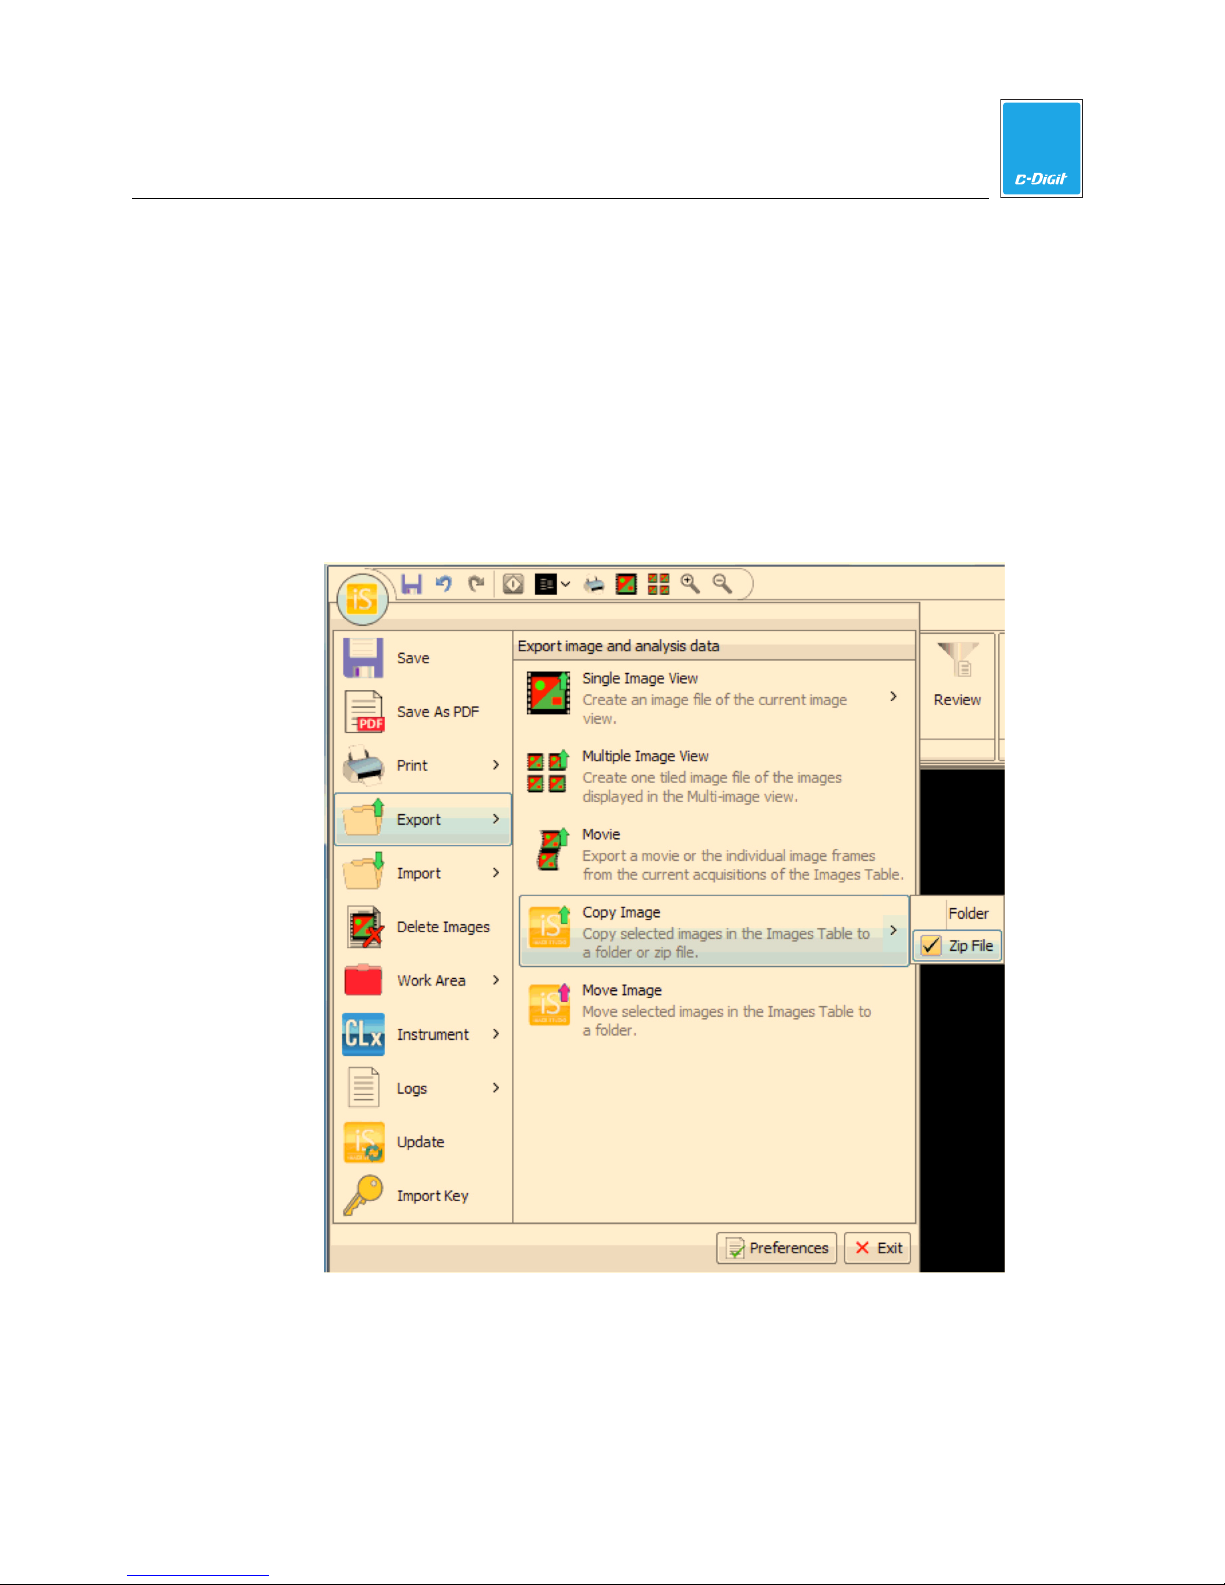
Copy Image
Copy Image copies the selected images and acquisitions from the Images Table to
a folder or a zip file. When you copy the images, they are not removed from
Images Table.
the
1. Select the images to Copy.
2. Open the
Application menu. Hover over Export.
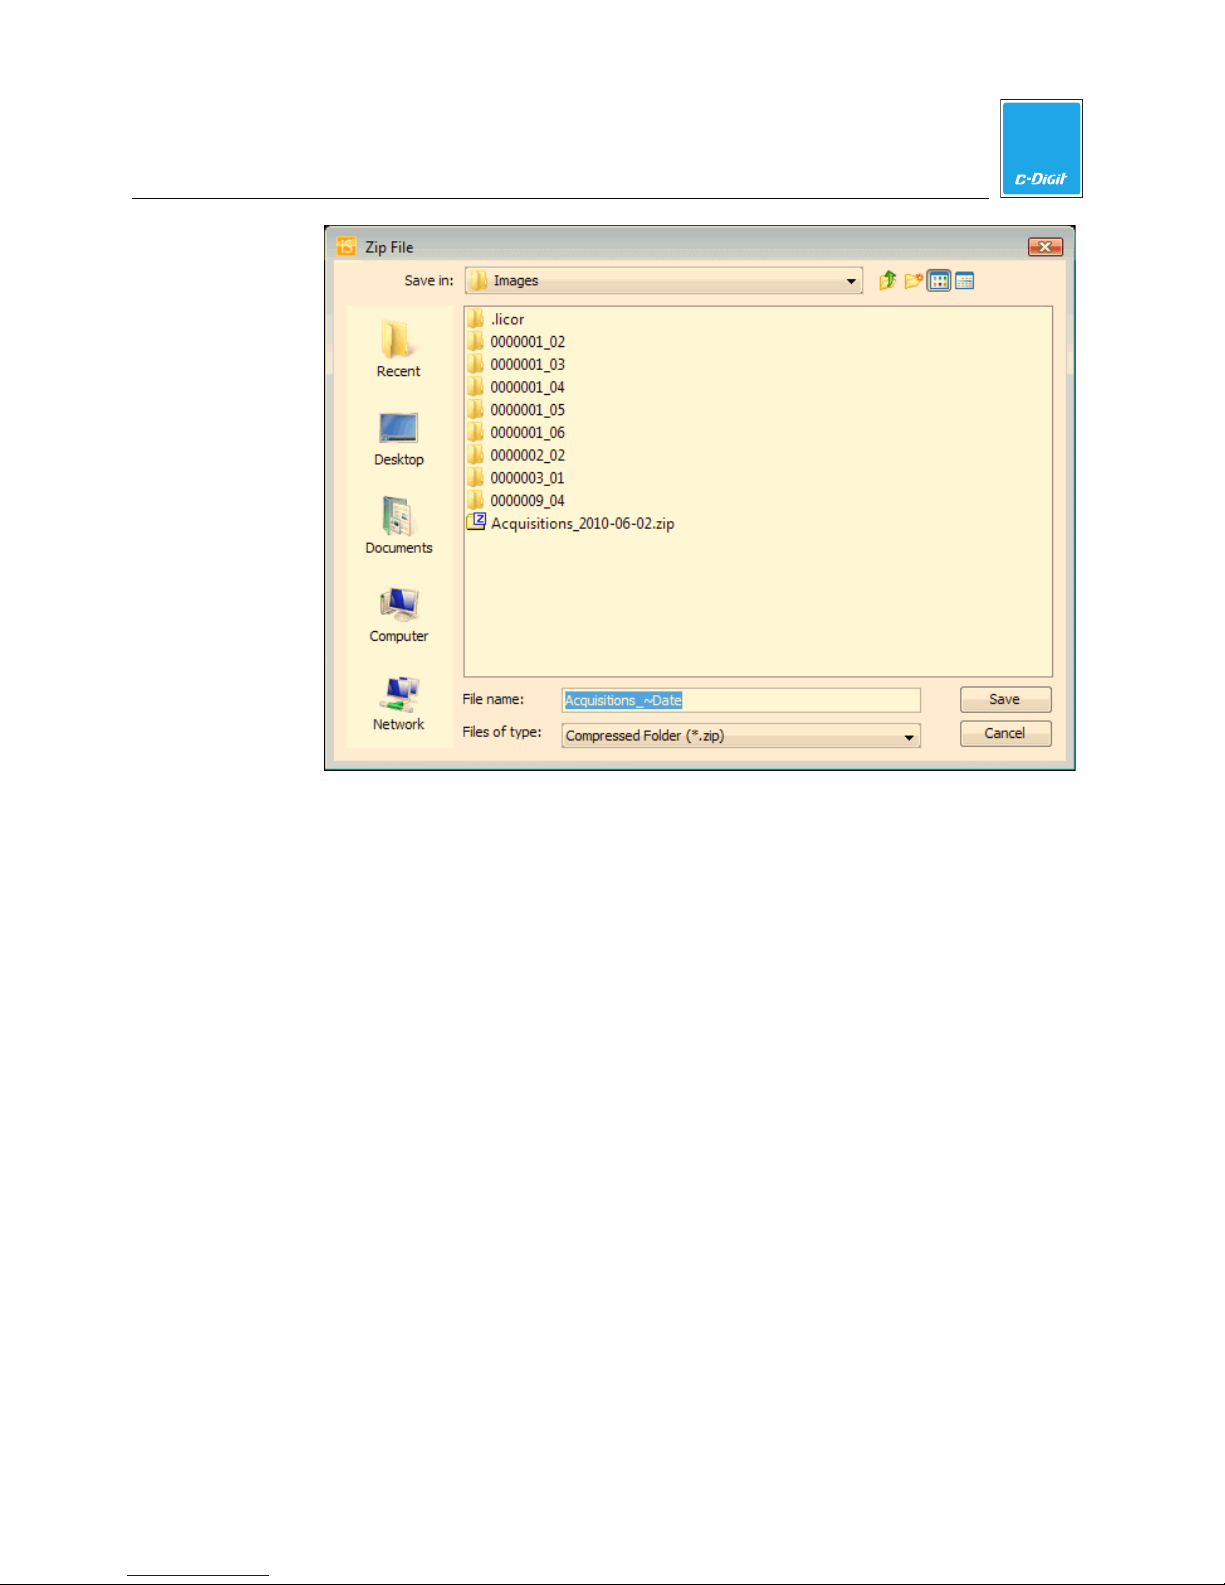
3. Expand the Copy Image menu and choose Folder or Zip File. If you
choose
Zip File the Zip File dialog (below) is displayed.
C-DiGit User Manual 4-12
Page 45
4
Image Studio Software
4. Accept the default folder and filename, create a new folder, or navigate to a
folder to save the copied acquisitions.
5. Click
Save when finished. The images and acquisitions are copied to a zip file
in the location specified.
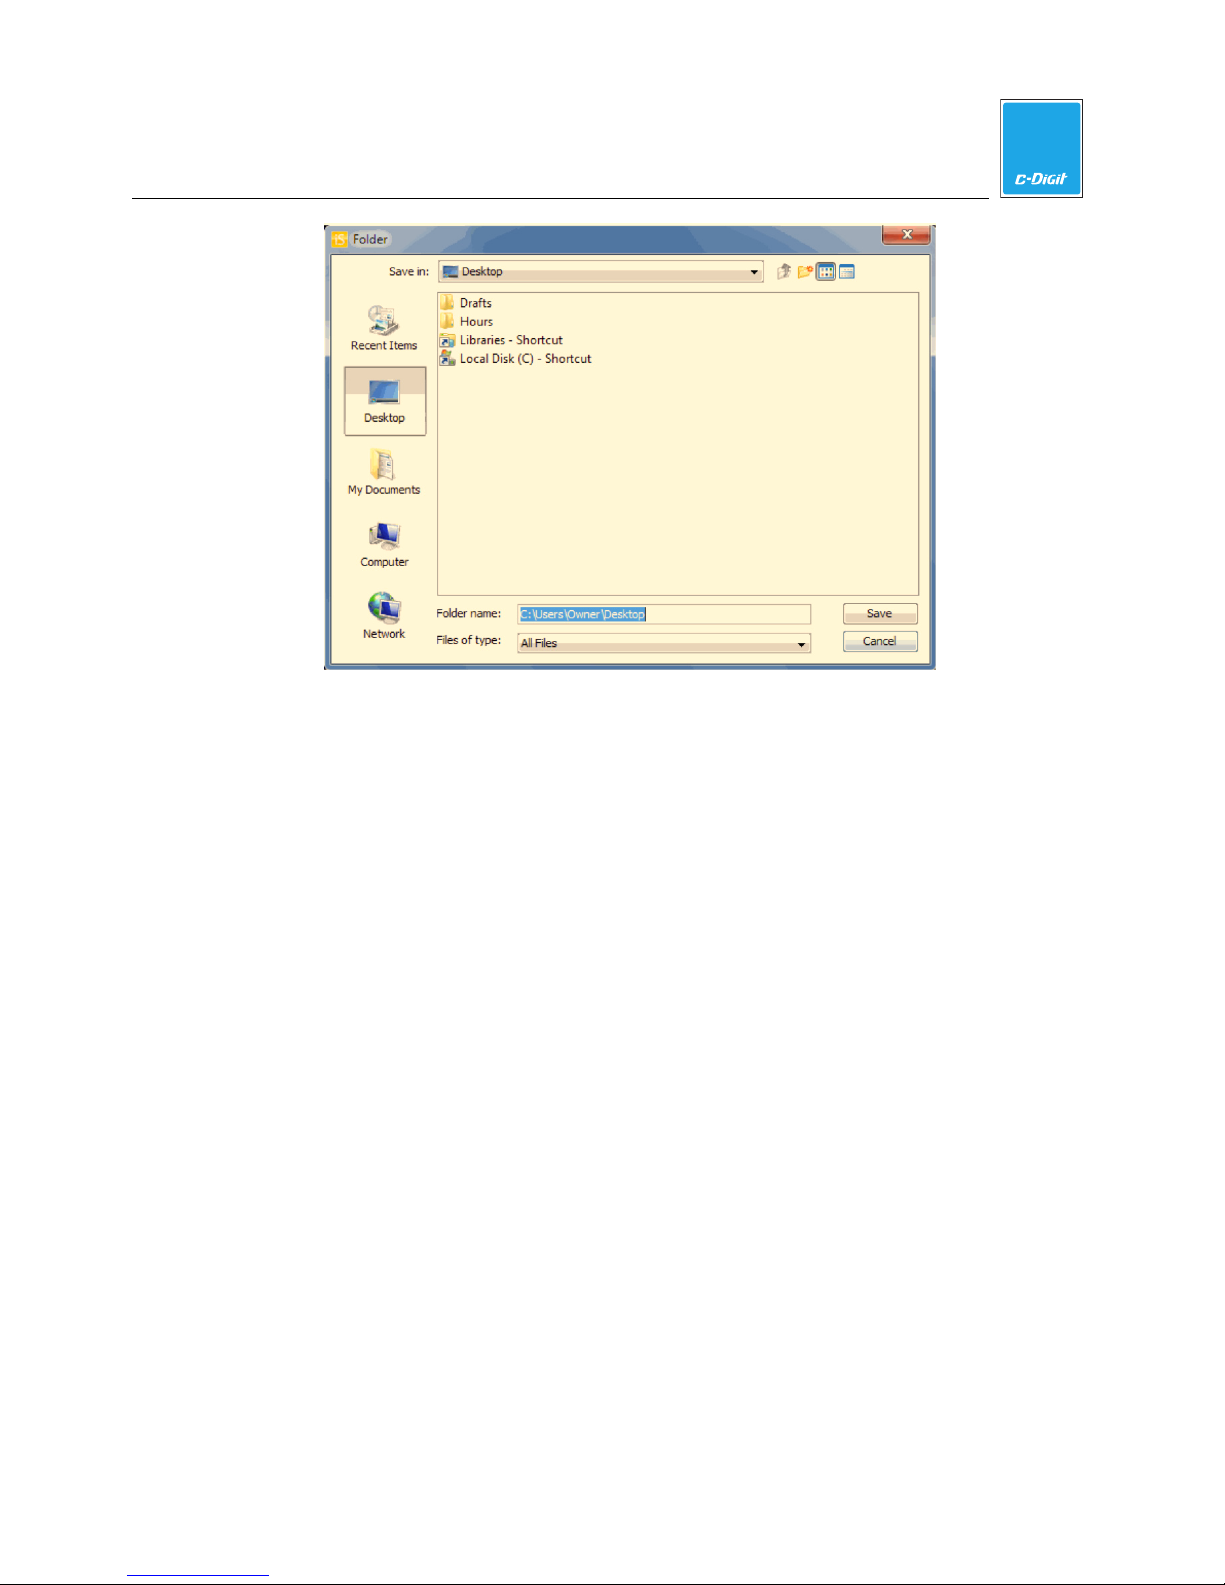
If you choose
Folder the Folder dialog (below) is displayed.
C-DiGit User Manual 4-13
Page 46
4
Image Studio Software
6. Accept the default folder, create a new folder, or navigate to a folder where you
want to save the copied acquisitions. This folder can be a different Work Area
that was previously created.
7. Click
Save when finished. The images and acquisitions are copied to a folder in
the location specified.
Move Image
Move Image moves the selected images and acquisitions from the Images Table to
a folder for archiving. (This folder can be a different Work Area.) When you move
the images, they are permanently removed from the
Area.
1. Select the images that you want to move.
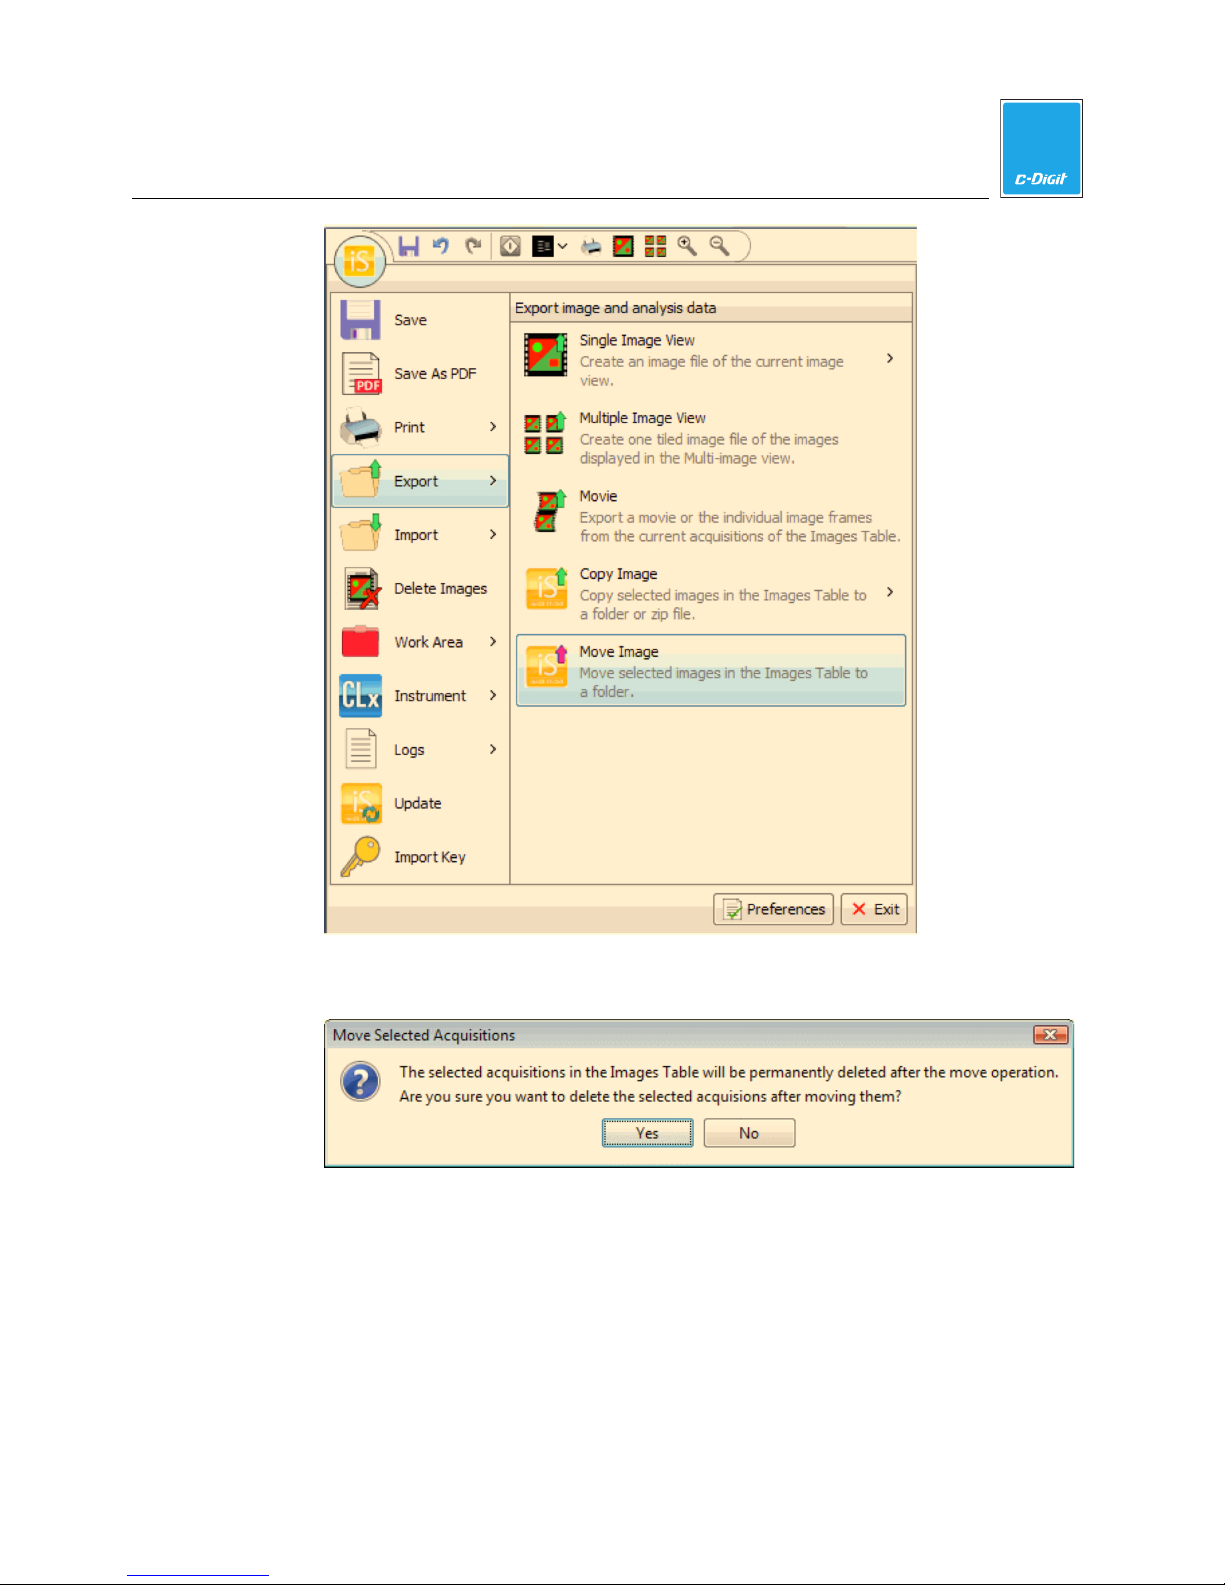
2. Open the
Application menu. Hover over Export.
Images Table in this Work
C-DiGit User Manual 4-14
Page 47
4
Image Studio Software
3. Choose Move Image from the Export menu. The message below is displayed.
4. If you want the selected acquisitions to be deleted from the Images table after
the move, click
C-DiGit User Manual 4-15
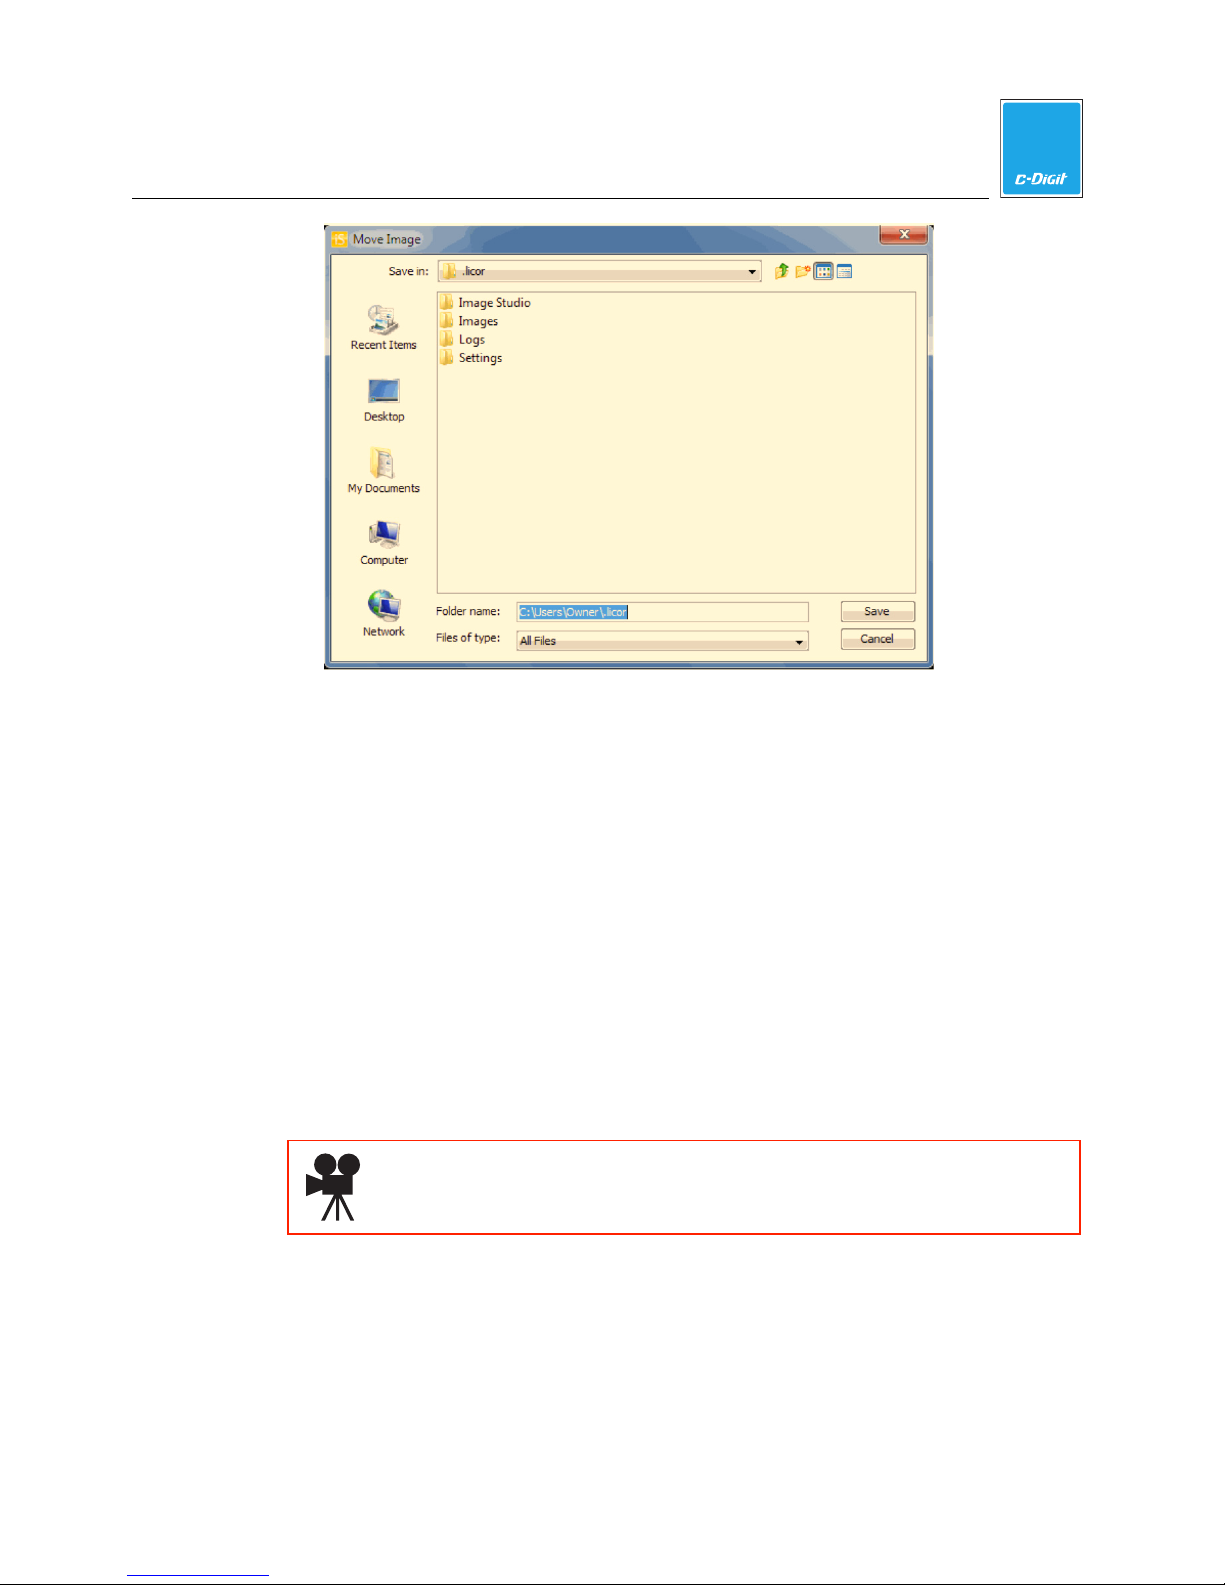
Yes to continue. The Move Image dialog is displayed.
Page 48
4
Image Studio Software
5. Accept the default folder or navigate to a folder to save the archived
acquisitions.
6. Click
Save when finished. The images and acquisitions are moved to the
location you specified. They are removed from the Images Table and deleted
from this Work Area.
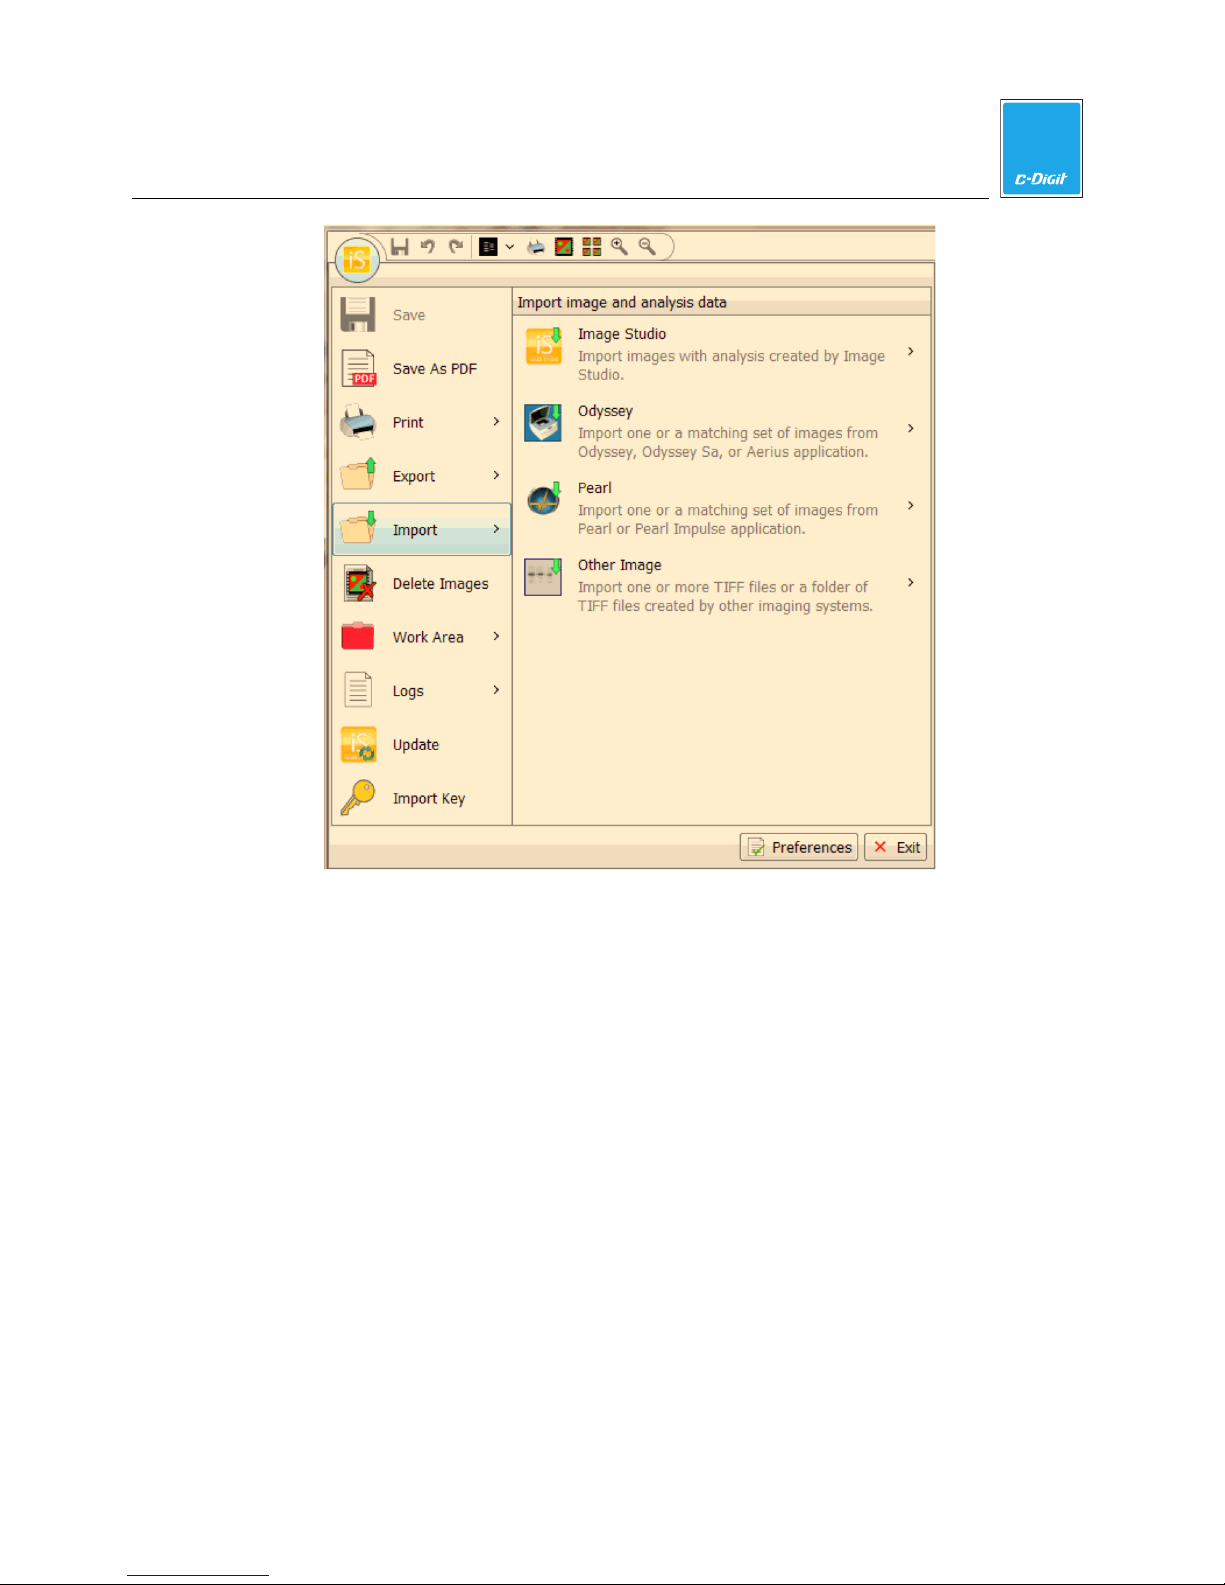
Import
The Import menu has choices for importing images and acquisitions (images plus
analysis data) from the C-DiGit Blot Scanner application as well as from Odyssey
or Pearl
You can import acquisitions (images plus analysis data) created by Image Studio,
Odyssey
1. Open the Application menu and choose Import to display the choices.
®
images.
®
or Pearl® software, or import other TIFF files for analysis.
Click here to watch a video that demonstrates how to import images.
®
C-DiGit User Manual 4-16
Page 49
4
Image Studio Software
Image Studio
Image Studio copies an image folder or ZIP file created in Image Studio to the
current default images folder. The entire folder is copied, including images,
analysis files, and other text files. This is useful if you have previously transferred
data to a different location for archiving or you are transferring data from another
Work Area.
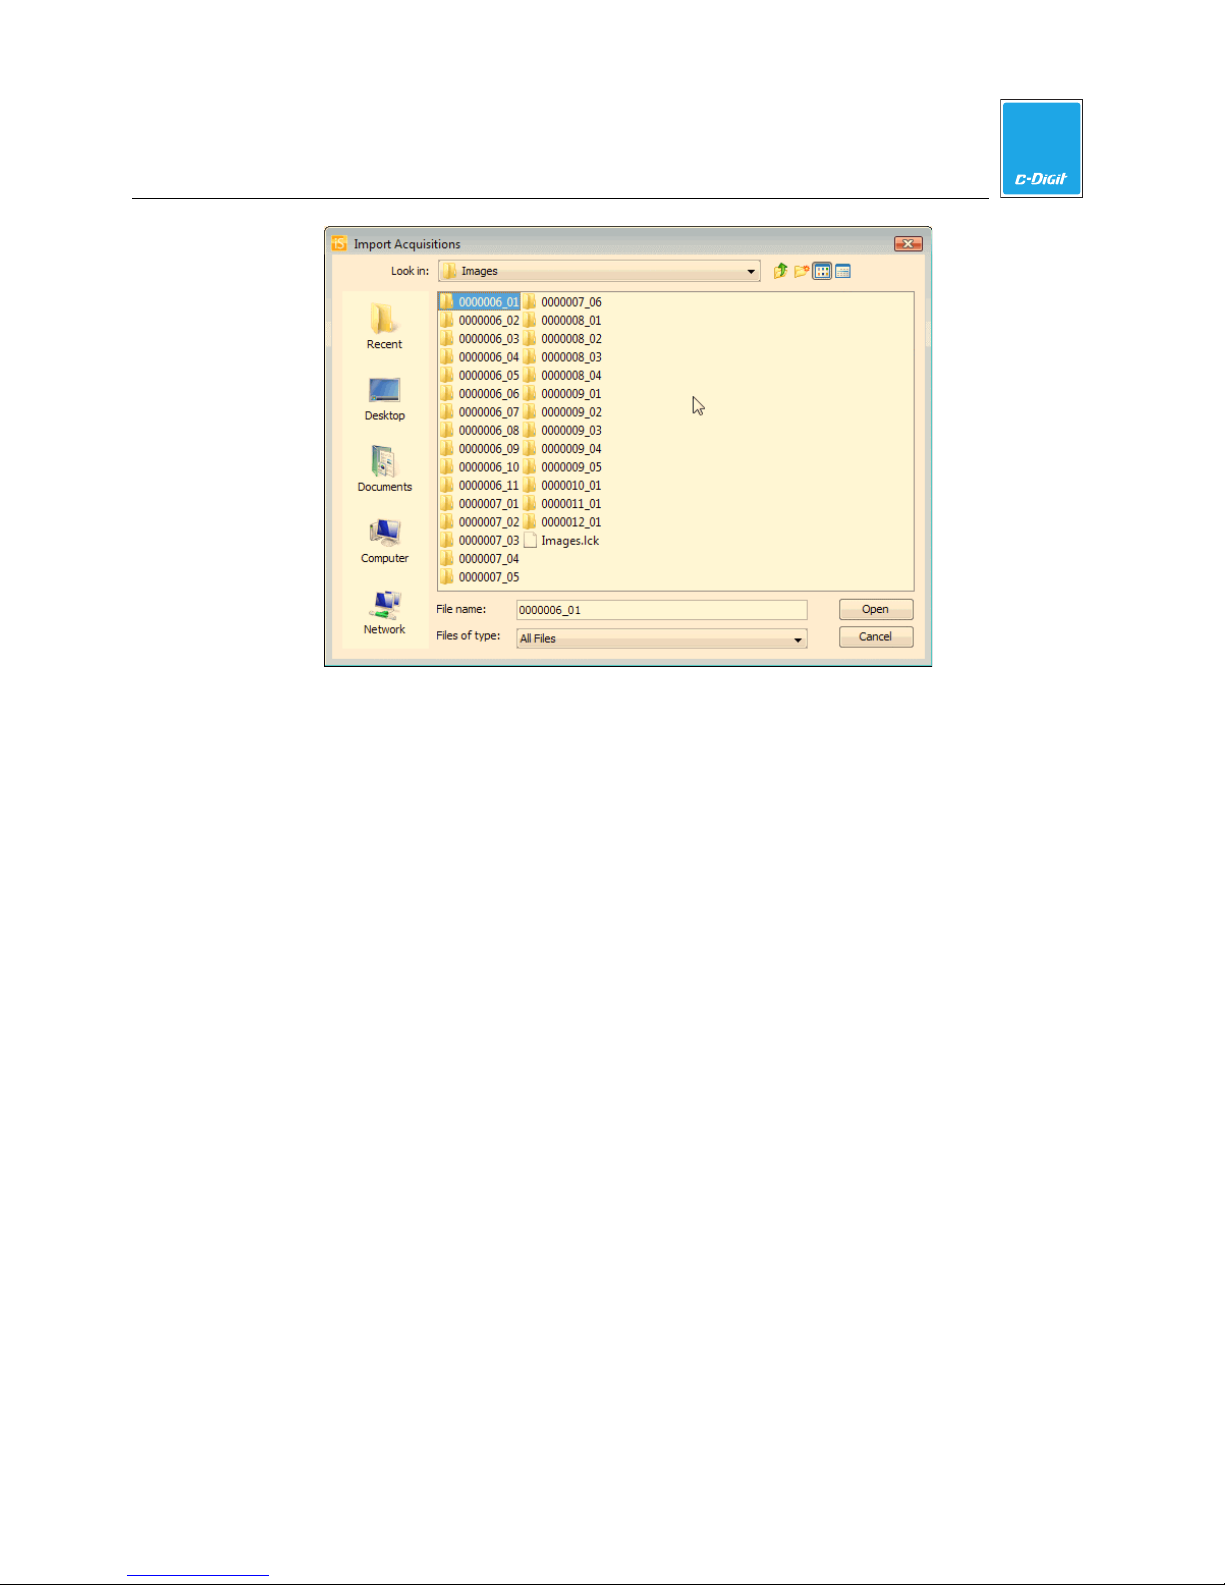
1. Choose Image Studio from the Import submenu. The Import Acquisitions
dialog (below) is displayed.
C-DiGit User Manual 4-17
Page 50
4
Image Studio Software
2. Navigate to a source folder or zip file and select it. Multiple folders can be
selected. These folders can be other Work Areas.
3. Click Open. The entire folder is copied to the current default directory and the
original folder is left in place.
Note: Images cannot be imported from the current Work Area. Be sure to select
a folder outside the current Work Area.
Odyssey
Odyssey imports one or more images created with the Odyssey Infrared Imaging
System Software into the current default directory. The import creates a new image
folder with appropriate image files. This does not import analysis data.
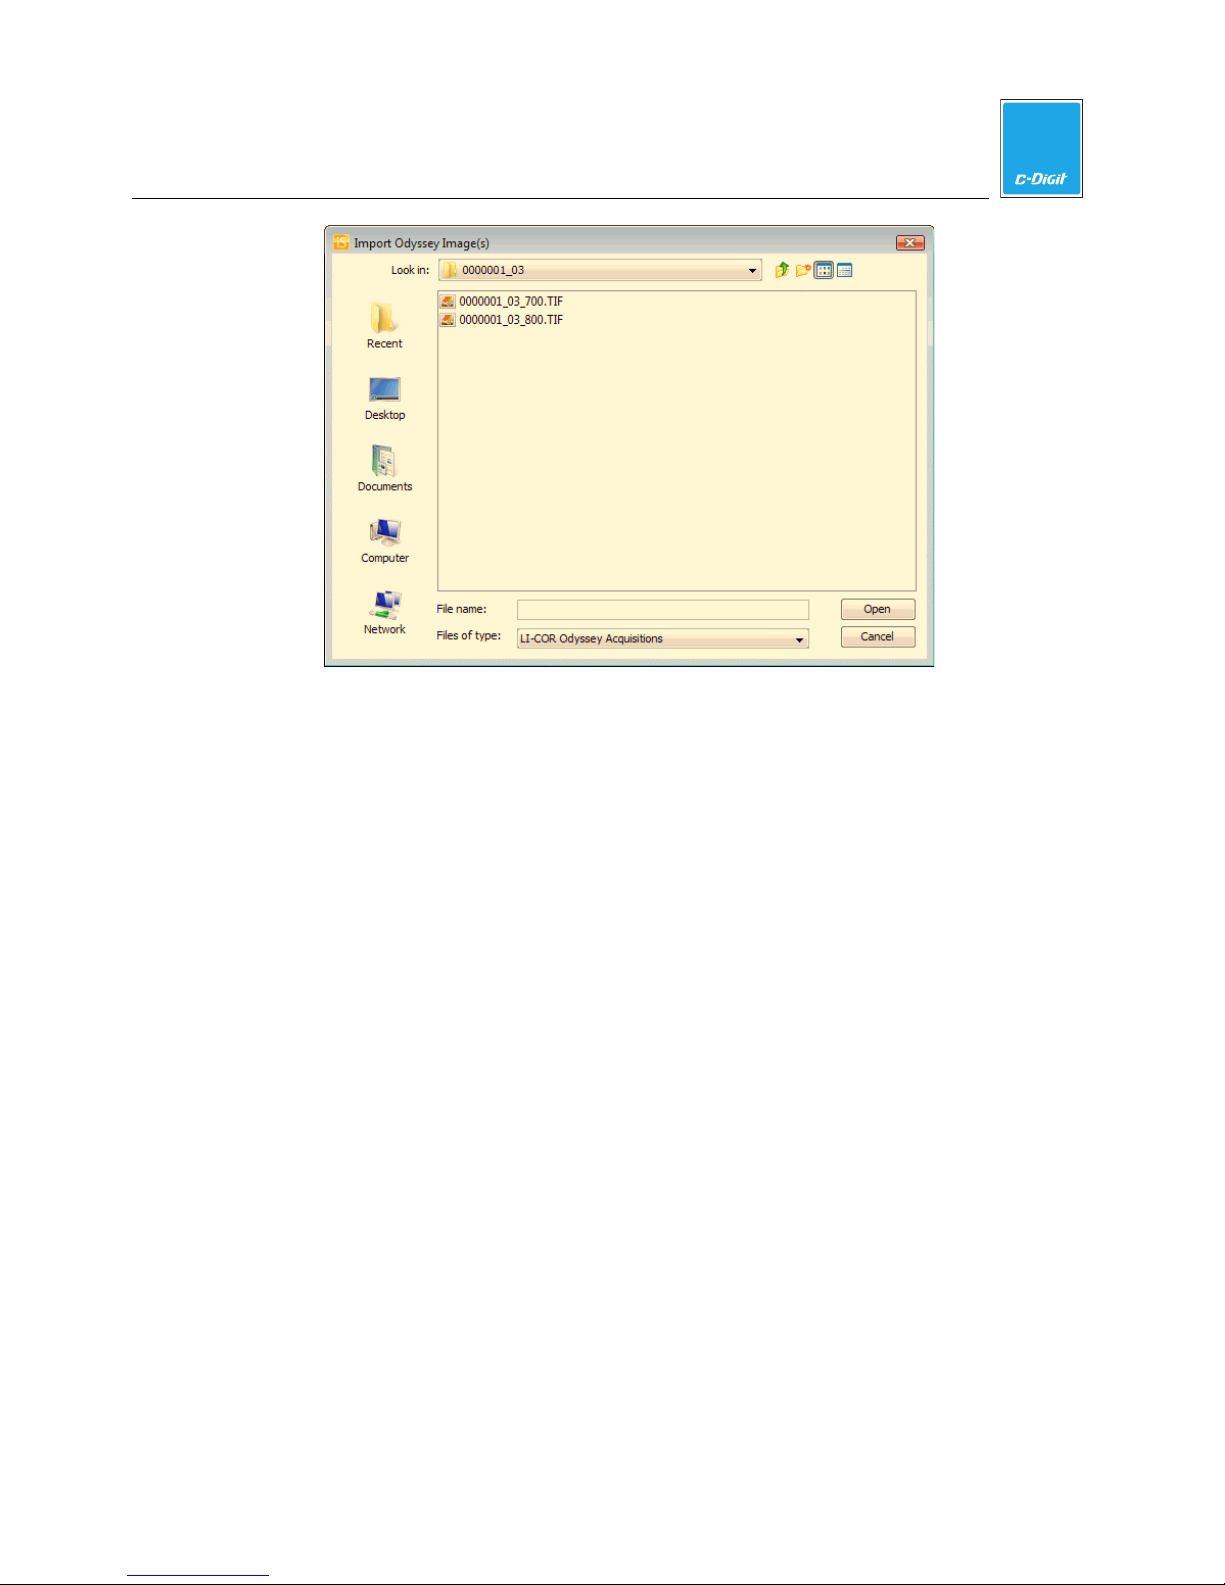
1. Choose Odyssey from the Import submenu. The Import Odyssey Image(s)
dialog is displayed.
C-DiGit User Manual 4-18
Page 51
4
Image Studio Software
2. Navigate to a source folder and select images to be imported into the default
folder on the file system.
3. Select the image(s) to import and click Open. You can select one or more
folders that contain several TIF files from multiple channels. Note: The files
must be the same size and resolution.
You can also select an individual TIF file, or select two TIF files of the same
image in different channels. Note: Do not select multiple TIF files that are not
of the same image.
4. The new TIF files are converted upon import. The original TIF files are not
changed. The “Name” field inherits the Odyssey “acquisition Name” if a folder
is imported. The Image ID field for the new image is assigned a new unique
Image ID.
Pearl
Pearl imports one or more TIF files created in Pearl Software.
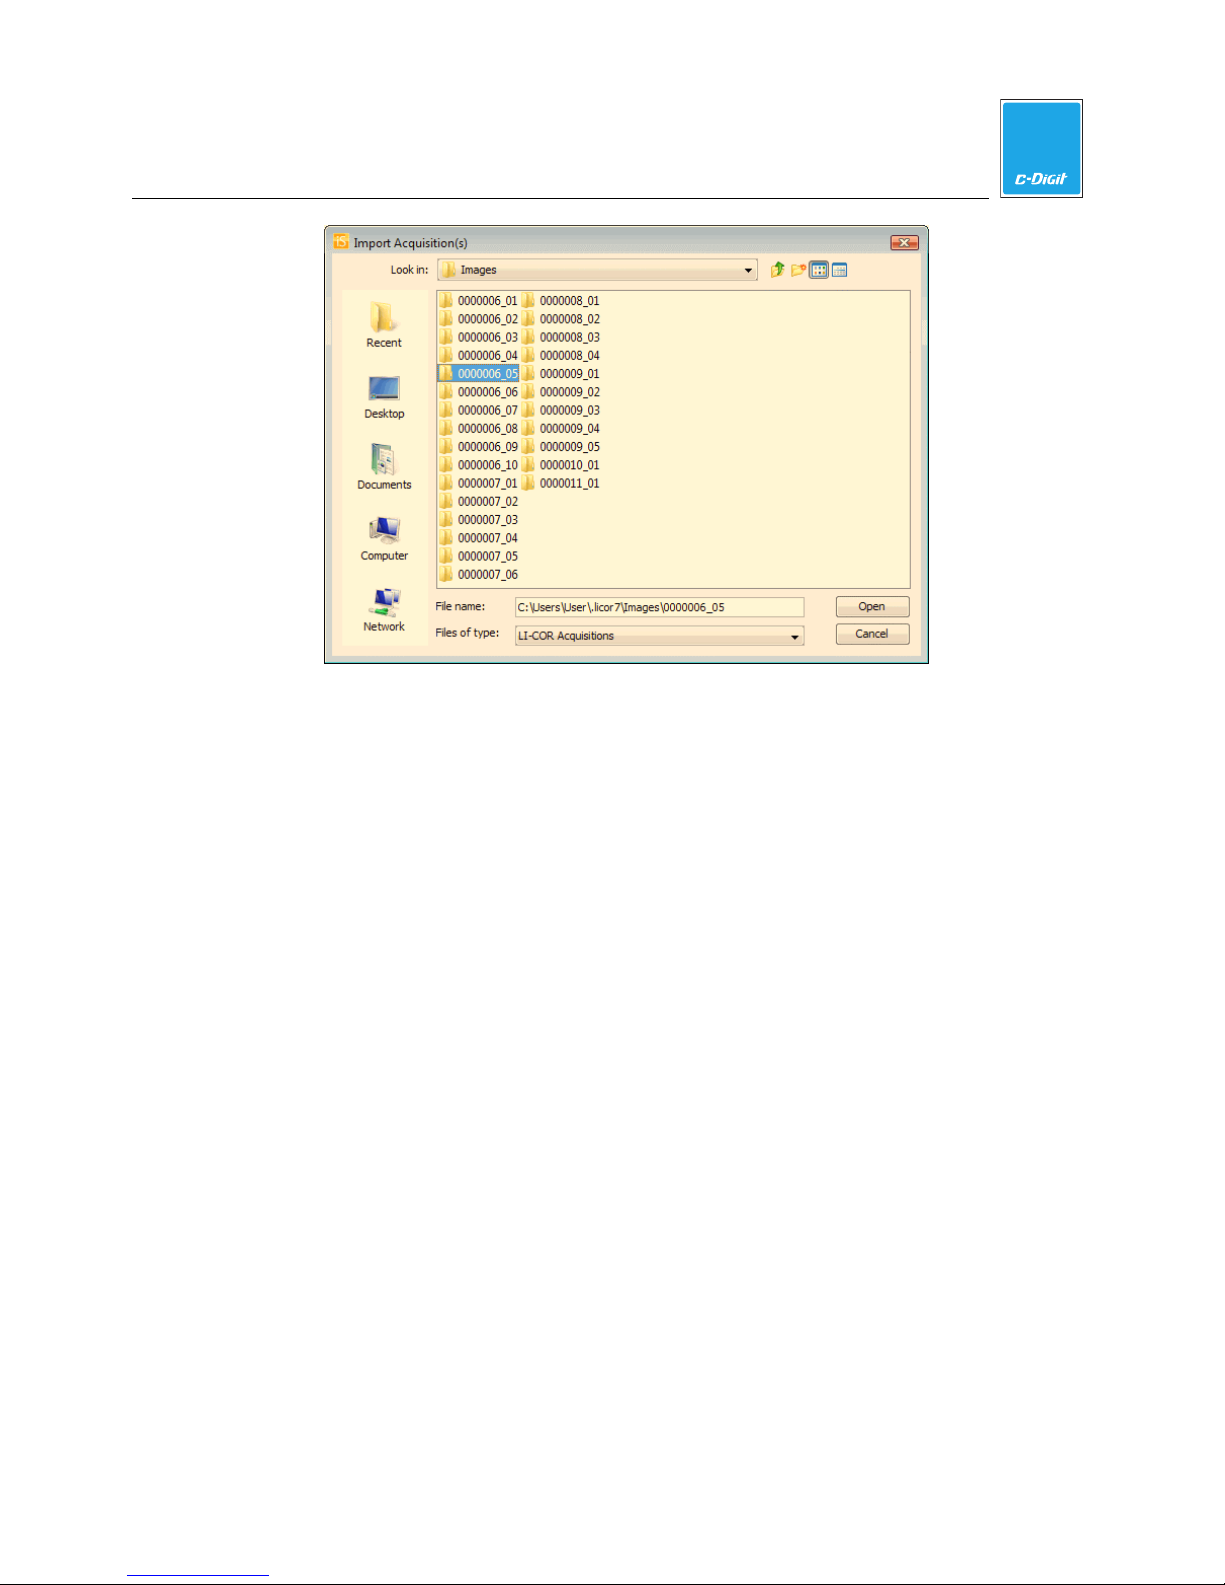
1. Choose Pearl from the Import submenu. The Import Acquisition(s) dialog
(below) is displayed.
C-DiGit User Manual 4-19
Page 52
4
Image Studio Software
2. Navigate to a source folder and select images to be imported into the default
folder on the file system. Click Open.
3. The “Name” field inherits the Pearl ImageID if a folder is imported. The Image
ID field for the new image is the same as the imported ImageID of the folder or
Pearl Images.
Other Image
1. Move the mouse over Other Image to see the options Files and Folder. Click
Files to import .tif, .jpg, or .png files. Click Folder to import a folder containing
image files.
2. Navigate to a source folder and select the file or folder containing files to be
imported. Click Open.
Note: If the file cannot be imported, an error message will appear at the bottom
of the Image Studio window. If the data are inverted during import, Data
Inverted During Import appears in the Image Modifications column.
3. The imported file(s) appears in the Images Table.
Delete Images
The Delete Images command deletes selected images in the Images Table. Select
the Images to delete, and click the Delete Images button. NOTE: You can also
right-click on the image row in the table and choose Delete Images from the pop-
up menu.
C-DiGit User Manual 4-20
Page 53
Work Area
4
Image Studio Software
Switch
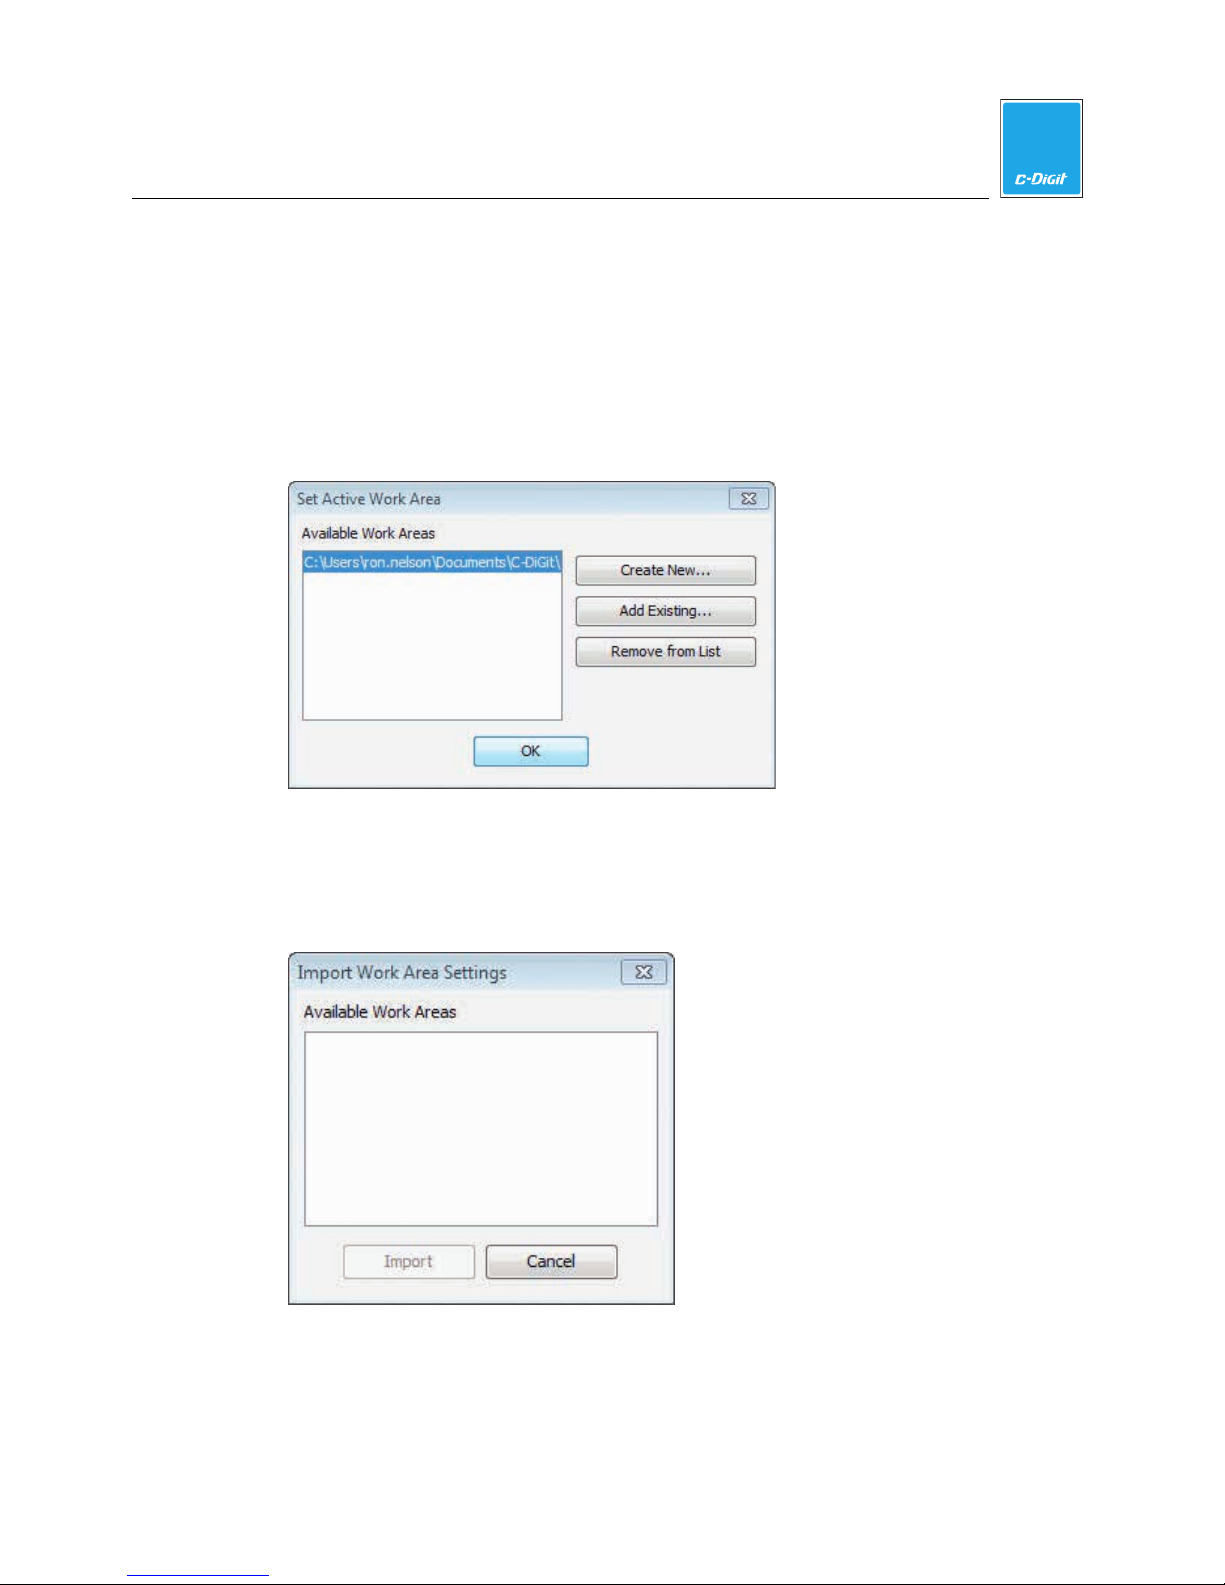
Click to close the current Work Area and open the Set Active Work Area dialog
(below). Choose an available Work Area and click OK. The current Work Area
closes and the new Work Area opens. Close the dialog without clicking OK to
continue using the current Work Area.
Import Settings
Imports all Work Area settings from a chosen Work Area. Opens the Import Work
Area Settings dialog (below), where you can choose an available Work Area from
which to import the settings.
C-DiGit User Manual 4-21
Page 54
Instrument
The Instrument menu contains options for viewing and managing the instrument
status.
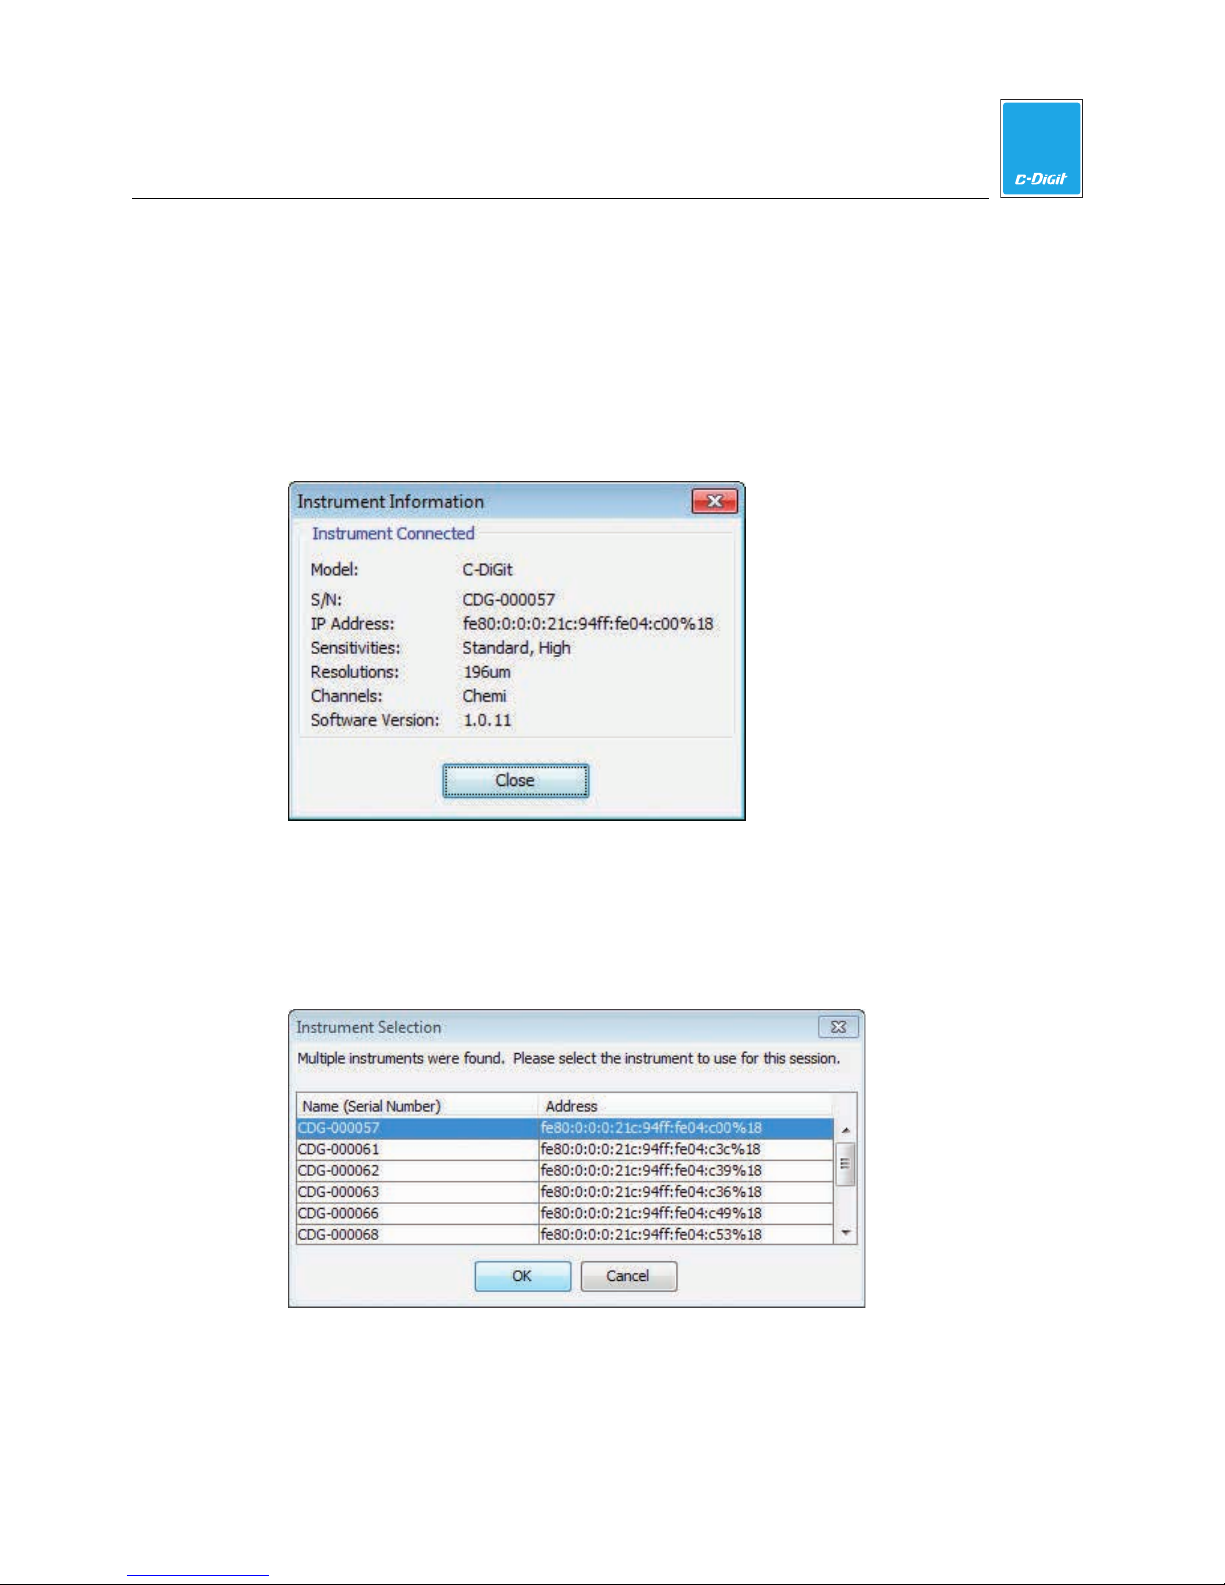
Information
Opens a dialog that displays instrument status, including the serial number, IP
Address, internal software version, etc.
Image Studio Software
4
Connect
If there is only one C-DiGit Blot Scanner detected by the computer, it will connect
automatically; if there are multiple C-DiGit Blot Scanners detected, you will have
to choose the desired C-DiGit Blot Scanner from a list of available instruments
(below, listed by serial number).
NOTE: You can find the serial number on a label on the underside of the
instrument.
C-DiGit User Manual 4-22
Page 55
Logs
4
Image Studio Software
Disconnect
Disconnects from the currently connected instrument.
Update Software
Click to open the LI-COR Biosciences Image Studio Software support page with
links to the latest upgrades for the C-DiGit Blot Scanner instrument (embedded)
software.
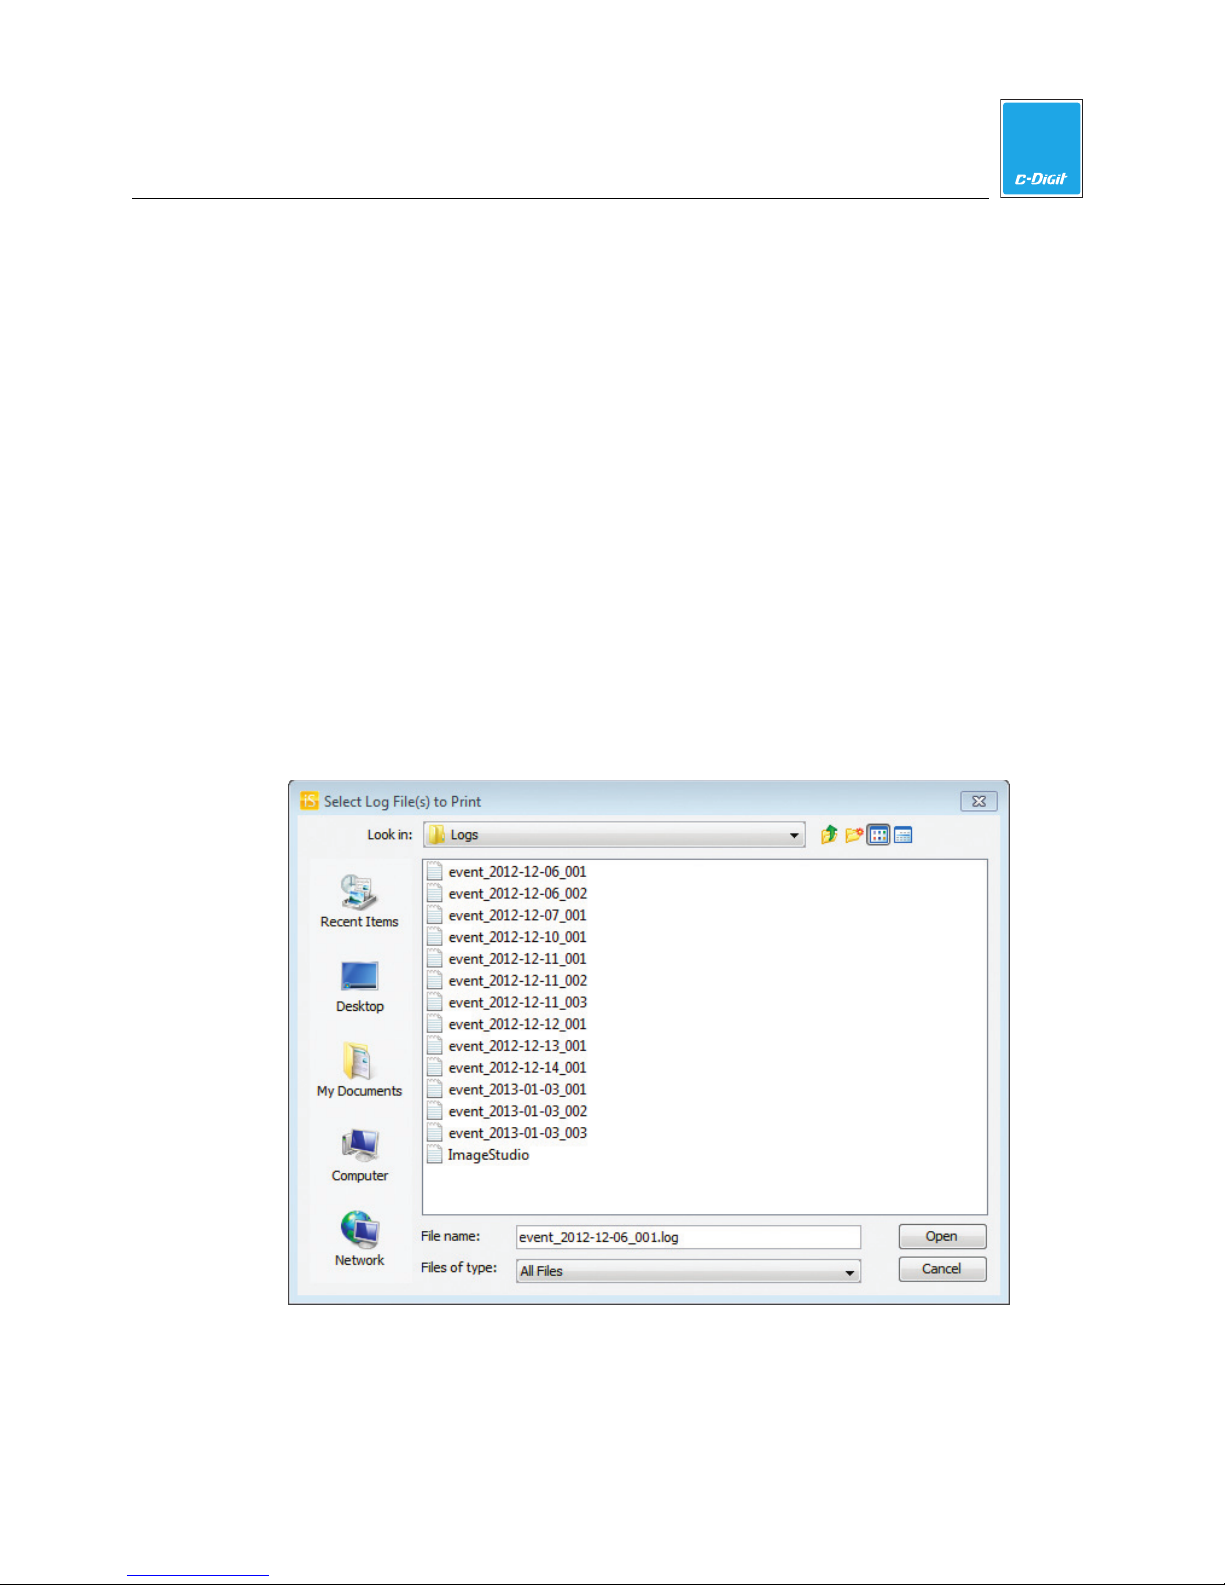
The Logs menu contains choices for printing and/or exporting the application log
files. The log files are simple text files that serve as diagnostic records of the Image
Studio sessions. A new log file is created each time Image Studio is started; the file
name reflects the date during which the file was created.
Print
Opens the Select Log File(s) to Print dialog, where you can choose log files to send
to the printer. Highlight a single file, or multiple files. Click Open to send the
selected files to the default printer.
C-DiGit User Manual 4-23
Page 56
4
Image Studio Software
Export
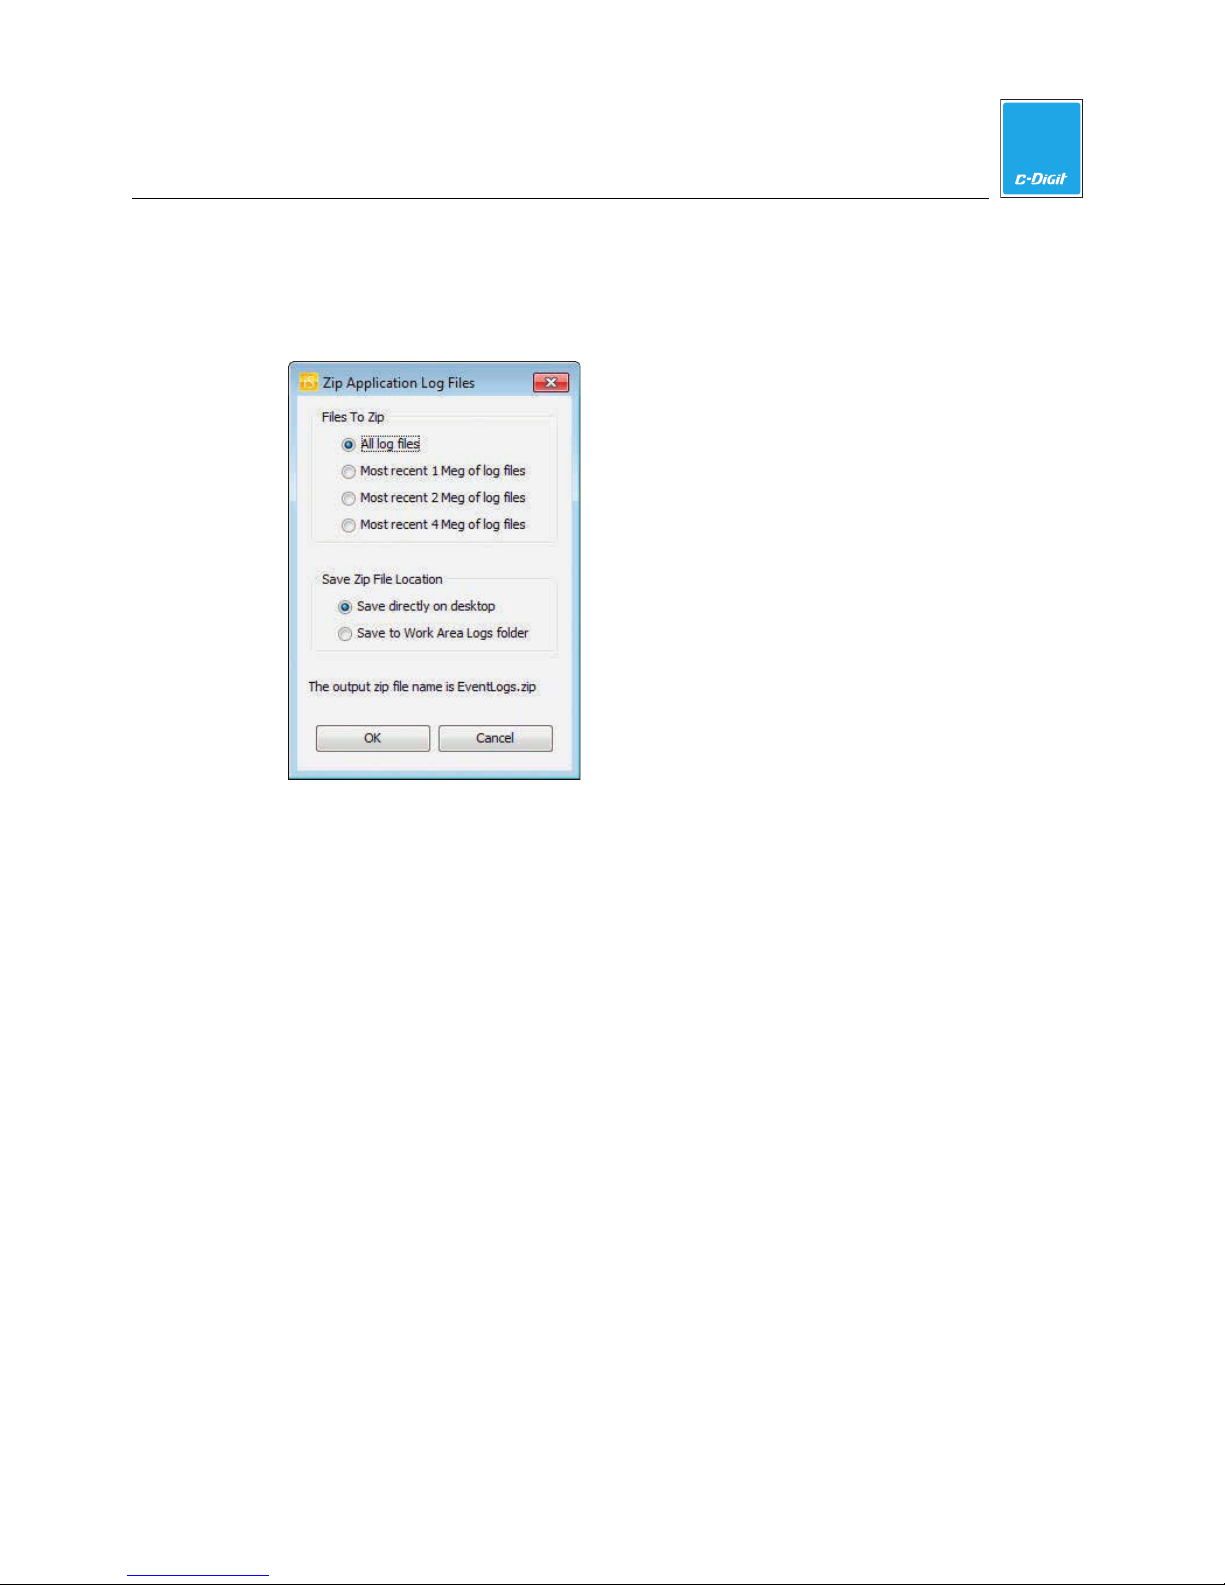
Opens the Zip Application Log Files dialog (below), where you can select the log
files to be compressed (zipped), and the location to which to save the zip file. The
zip file is automatically named EventLogs.zip.
Update
Click to open the LI-COR Biosciences Image Studio Software support page with
links to the latest updates for Image Studio software.
Import Key
Adding additional keys is not supported in Image Studio for C-DiGit.
Preferences
The Preferences dialog has four page views: General, Image LUTs, Image View,
and XLS Export. Click the labels under ‘Preference List’ to change the page view.
C-DiGit User Manual 4-24
Page 57
4
Image Studio Software
General
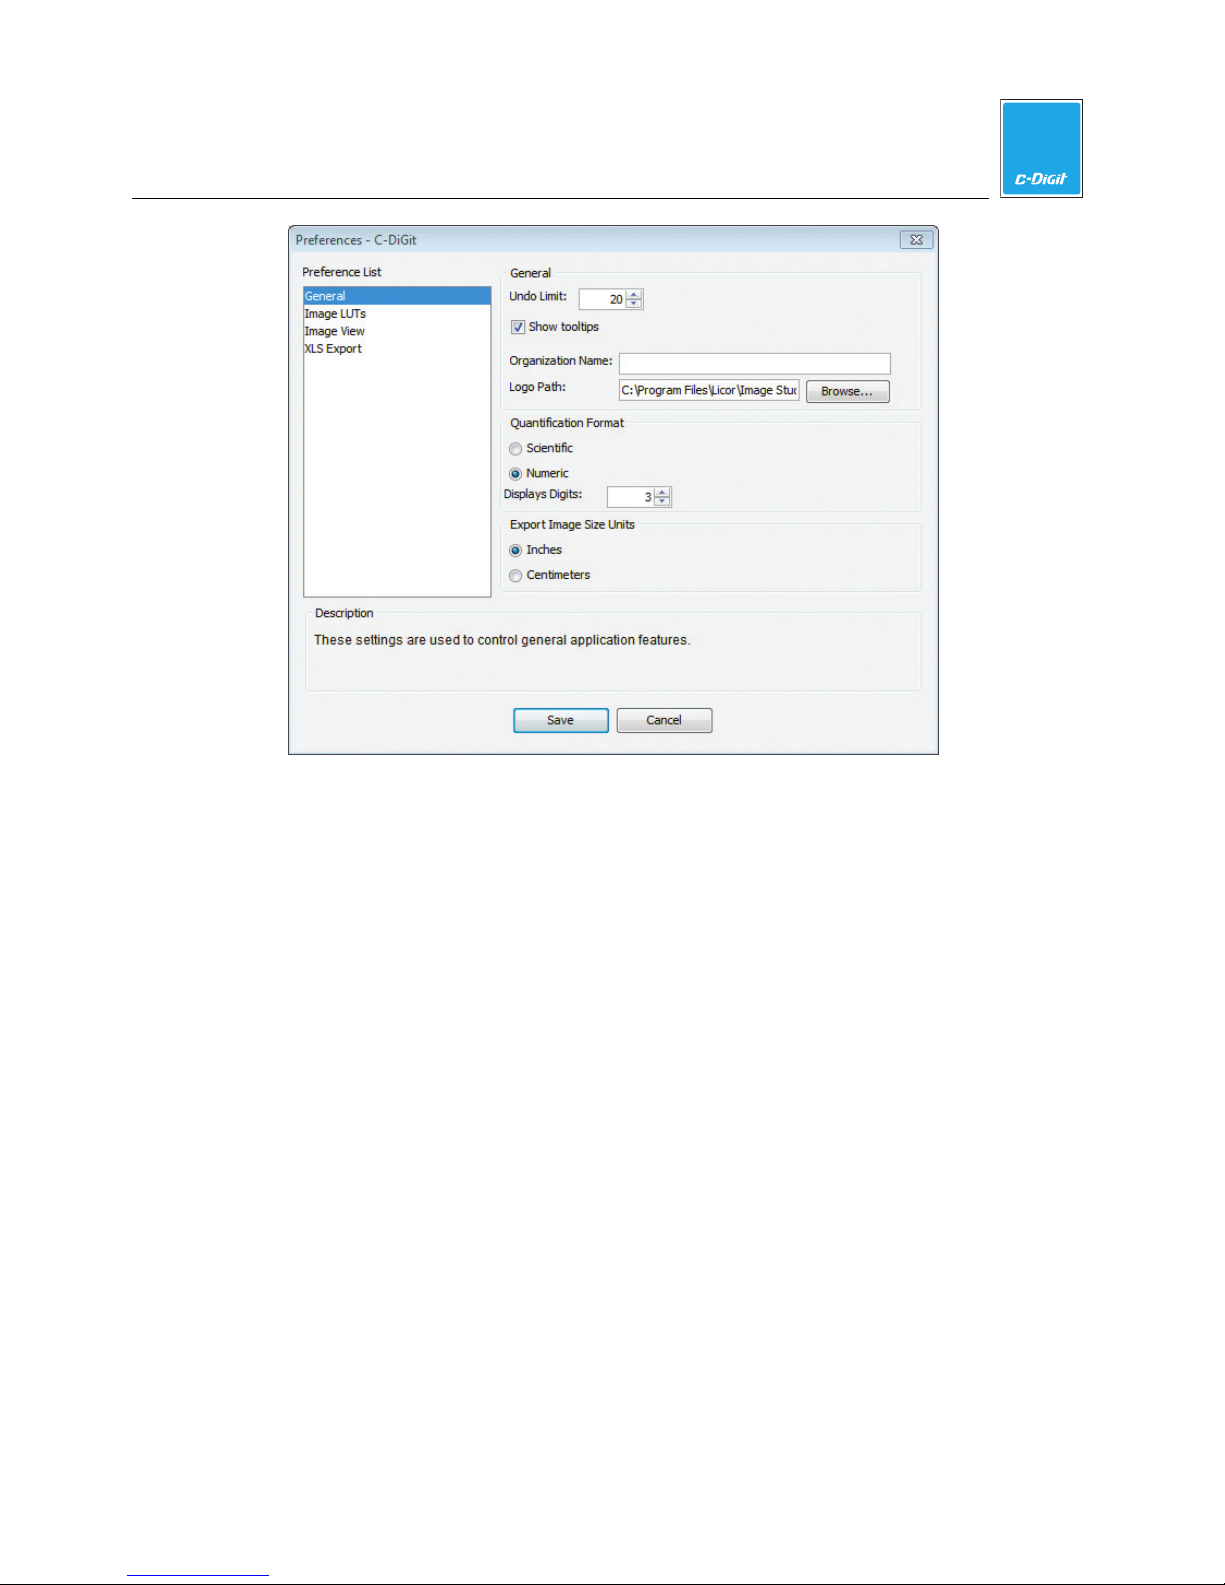
Use the General preferences to control general application features. You can set
the undo limit, choose whether to show tooltips, specify your organization name
and company logo to display on imported images, set the quantification format and
the number of digits to display, and choose the image size units (inches or
centimeters).
The Undo Limit sets the number potential undo operations that can be stored
by the application.
When enabled, Show Tooltips displays a tooltip when the cursor is hovered
over an icon or label in the application.
The Organization Name specifies the organization name to be used in an
Images Table column.
The Logo Path defines the location of company logo files. By default it is set to
the LI-COR
reports. To add your own logo, use the Browse button to navigate to the
directory and file. Image Studio supports GIF, PNG, JPEG, and BMP file types.
The maximum size of the displayed image is 2" x 1". If the logo exceeds either
of those dimensions, it is scaled maintaining the aspect ratio. If you do not want
a logo displayed on reports, leave the Logo Path blank.
®
logo, which places a 2” x 1” logo in the upper left corner of all
C-DiGit User Manual 4-25
Page 58
4
Image Studio Software
The Quantification Format specifies whether to use Scientific or Numeric
notation for floating point values. Note: Excel reports numeric formats using its
default format for floating point fields. These fields my be displayed as both
standard and scientific formats unless the formatting is overridden in Excel.
Use the counter to specify the number of significant digits to display.
The Export Image Size Units sets the size units to Inches or Centimeters.
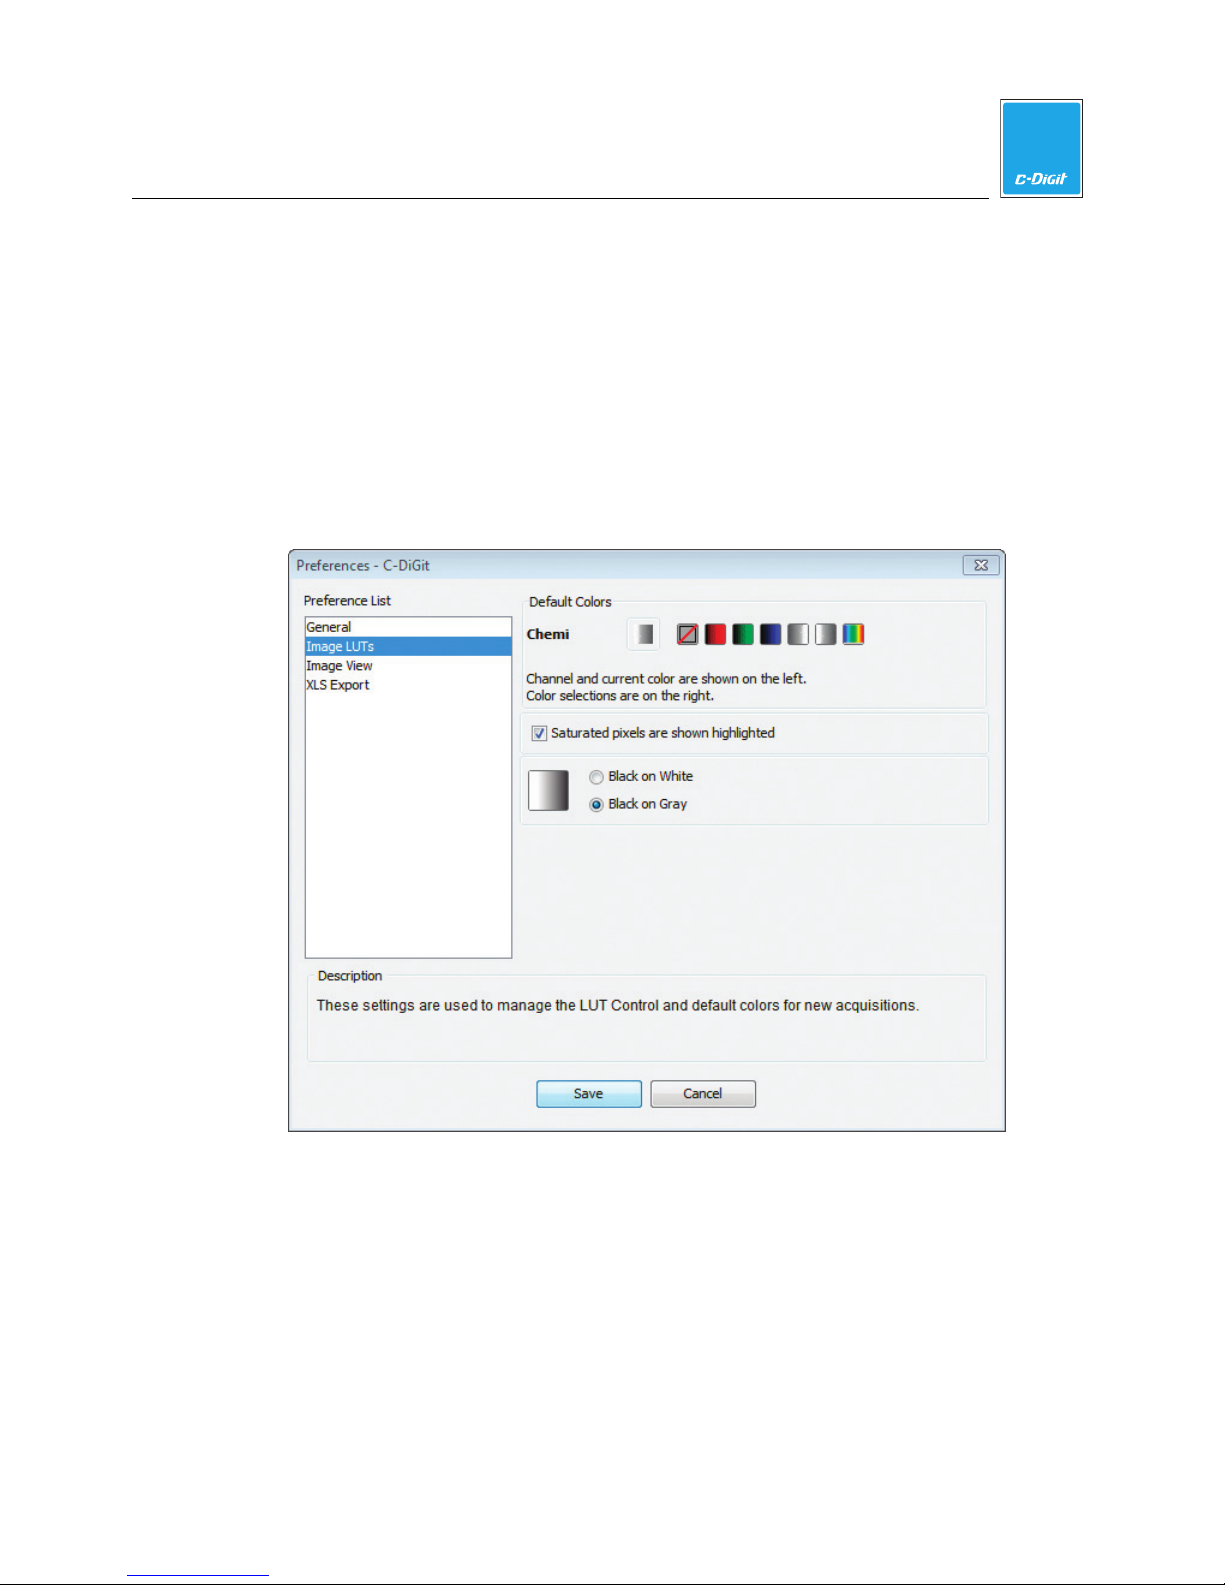
Image LUTs
Click Image LUTs to specify the default image display colors for new acquisitions.
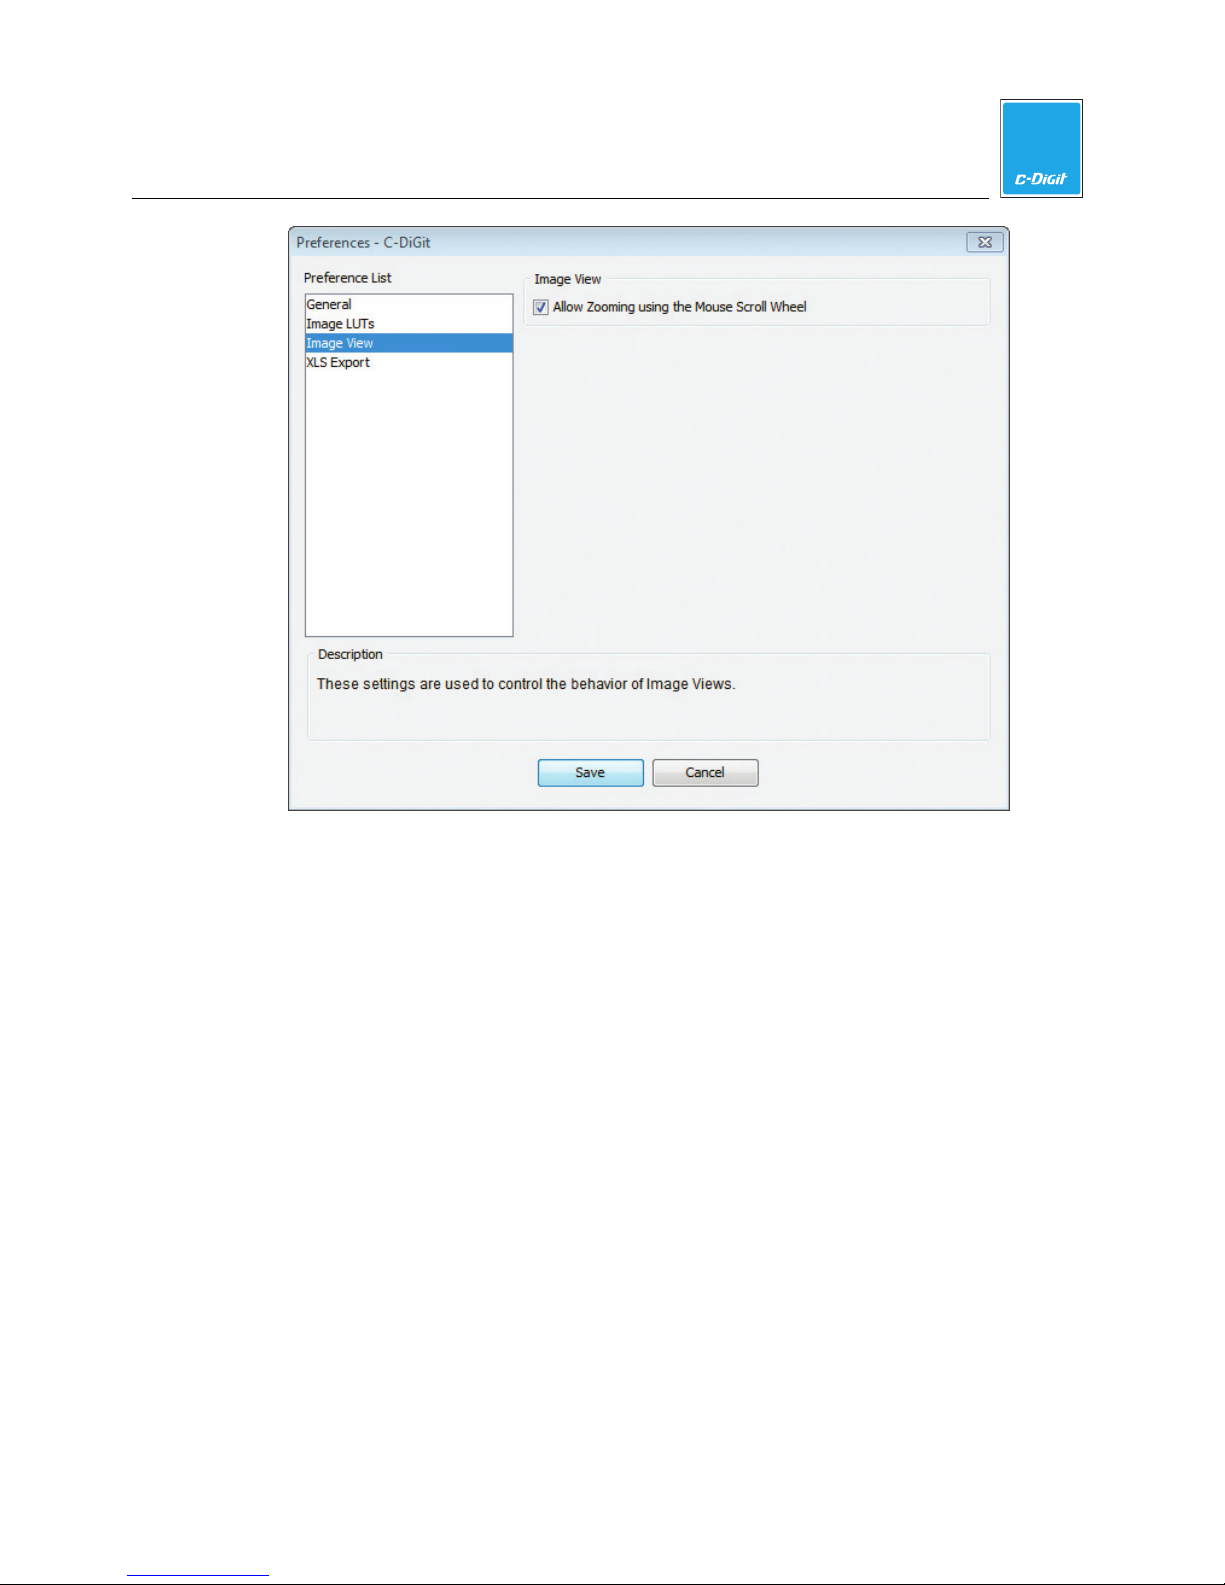
Image View
Contains a check box that allows you to enable or disable the use of the mouse
scroll wheel to zoom in or out on the image view. When the cursor is placed over
the image in the main Image Studio window, enabling the check box allows you to
enlarge or reduce the image using the mouse scroll wheel.
C-DiGit User Manual 4-26
Page 59
4
Image Studio Software
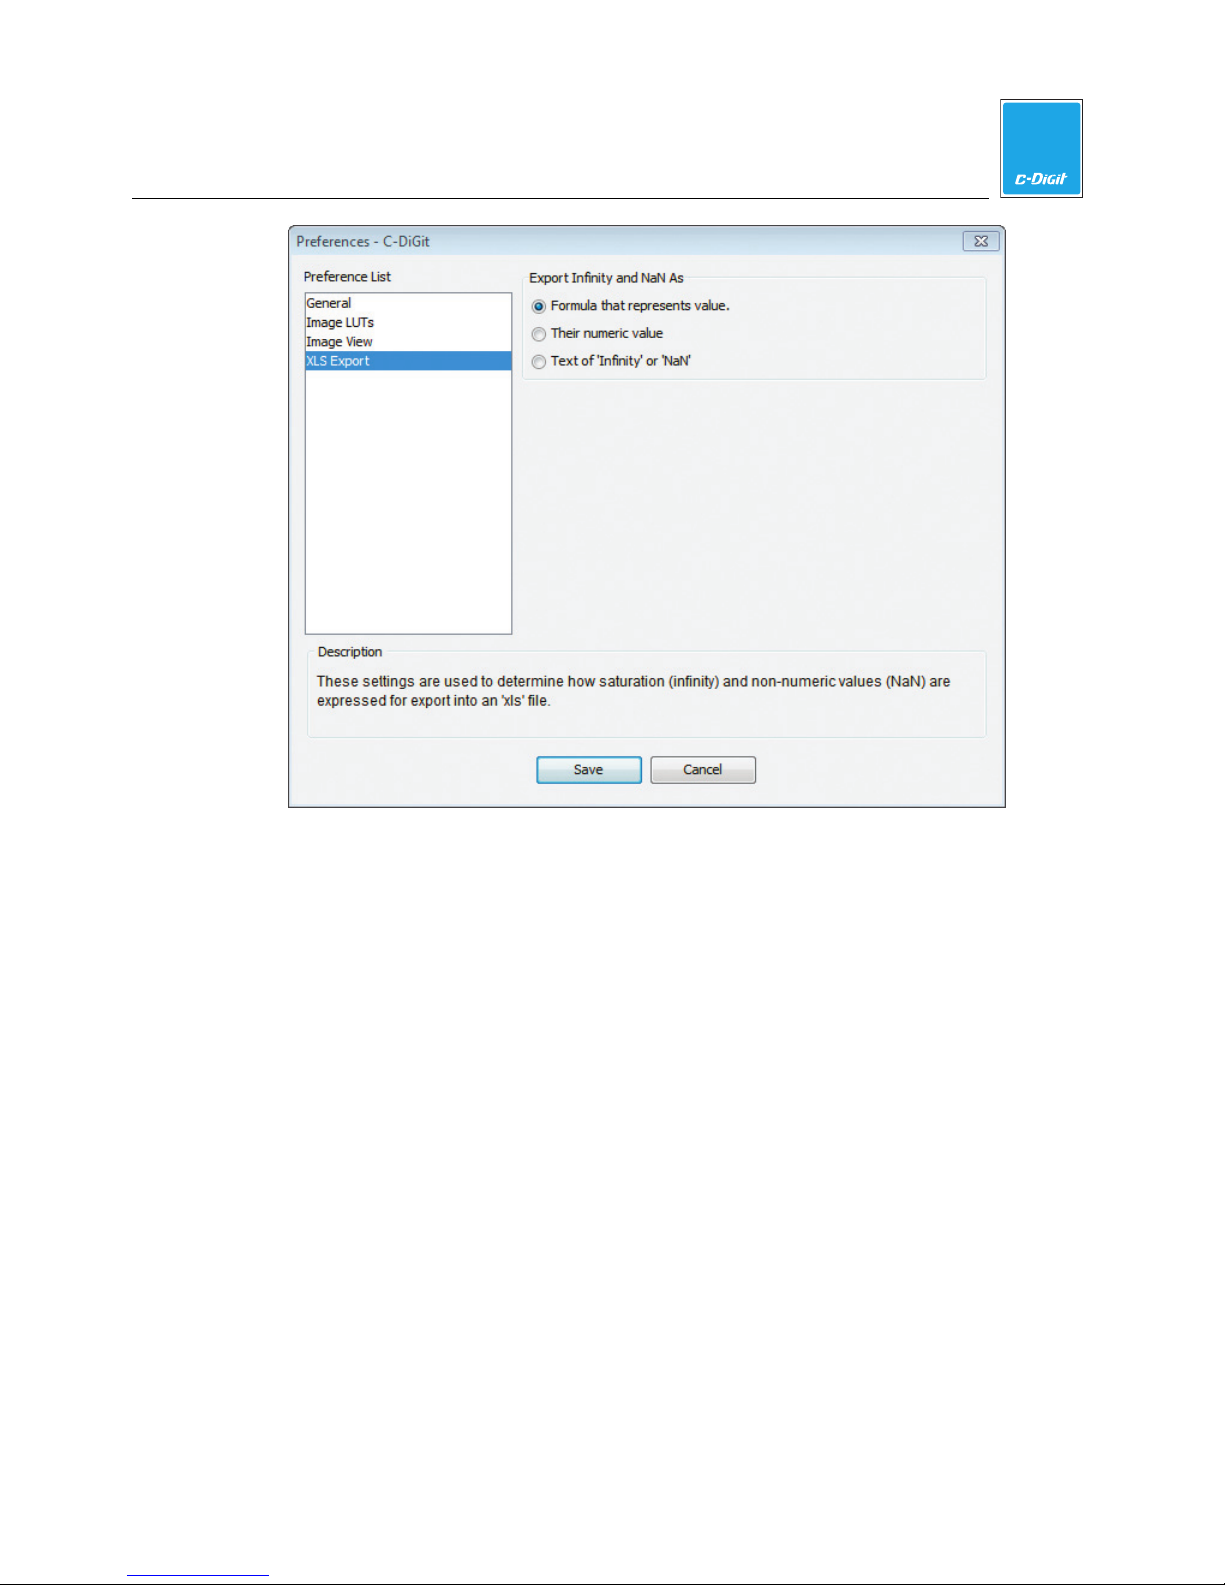
XLS Export
Specifies how saturation (infinity) and non-numeric values (NaN) are expressed
when exporting into an Excel (.xls) spreadsheet file.
C-DiGit User Manual 4-27
Page 60
4
Image Studio Software
Viewing and Manipulating Image Data
The rightmost panel in the main window contains an area that has three tabbed
panels that allow you to view and/or manipulate the selected images; Image Look
Up Tables (LUTs), Profiles, and Concentration.
Image LUTs
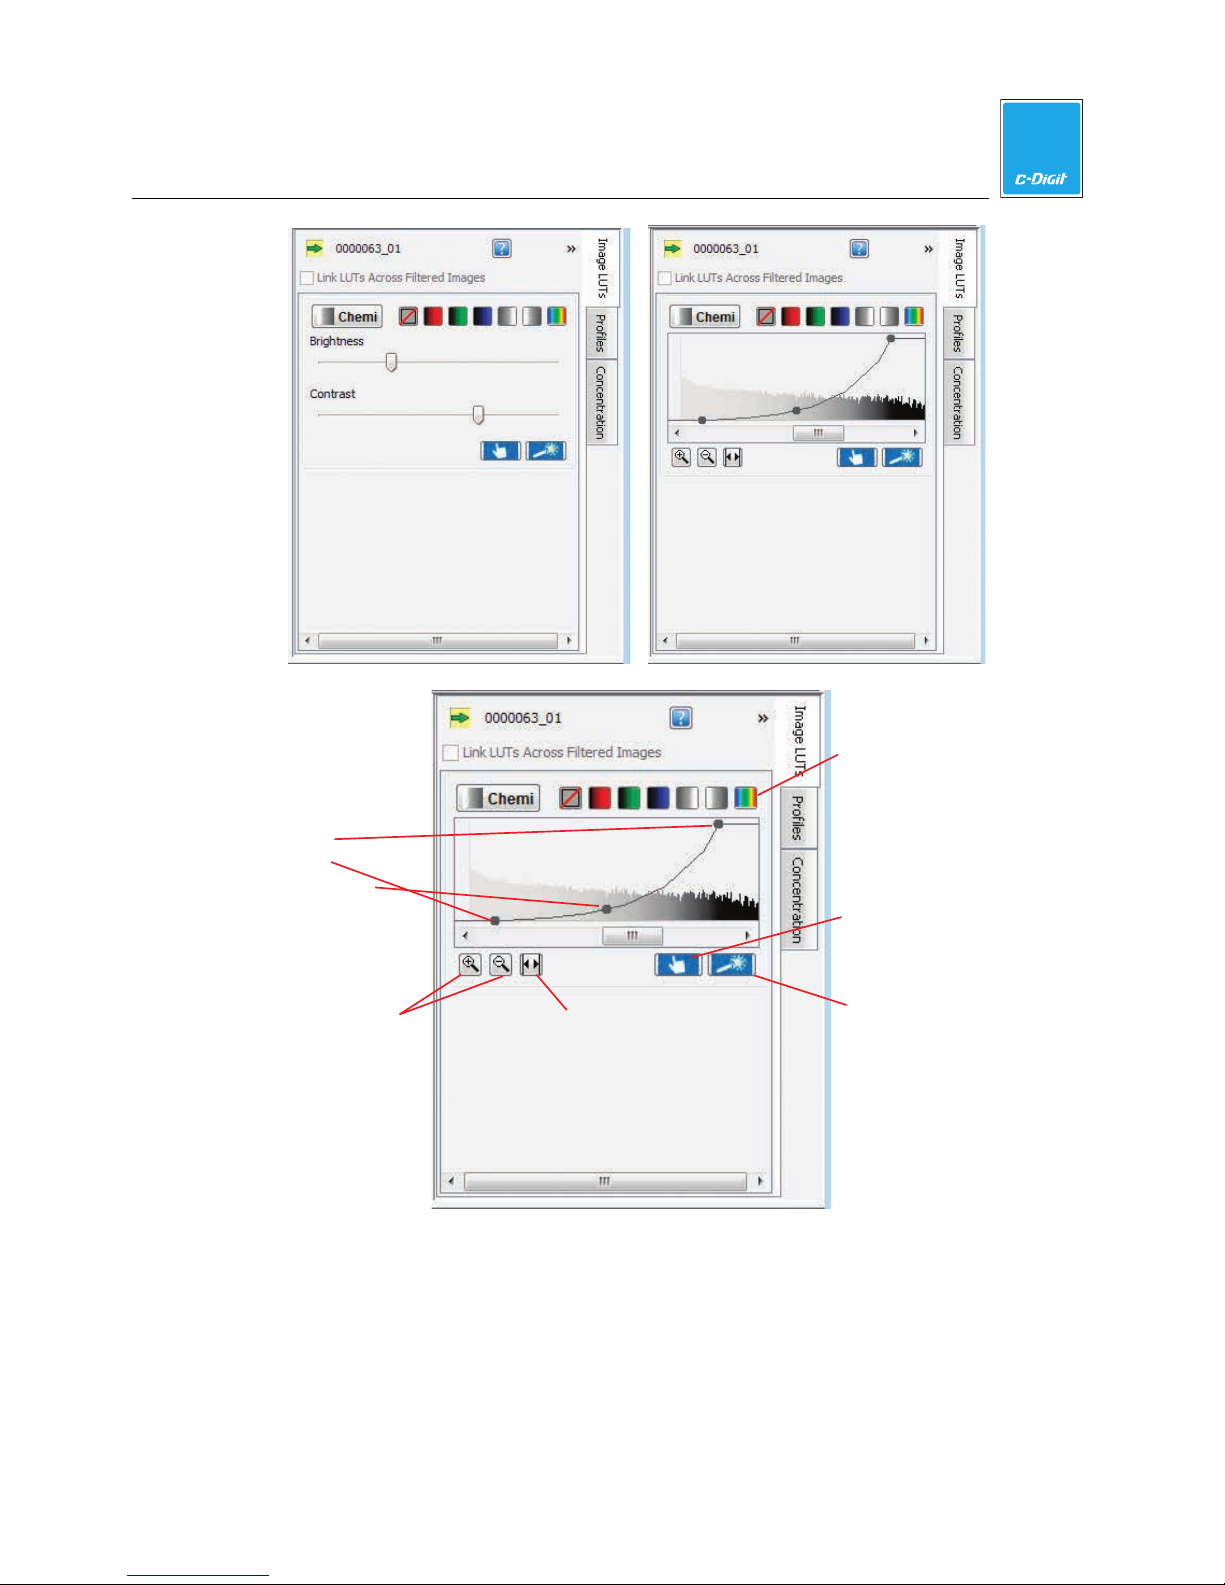
The Look Up Table Panel (or LUT Panel) allows you to edit the parameters that are
used to display the selected image in the image view.
You can view the Image Look Up Tables as either slider bars (the default view,
below left) or as histograms overlaid with a curve (below right). To hide this view,
click the double arrows in the top right corner.
C-DiGit User Manual 4-28
Page 61
4
Image Studio Software
Color maps
Max,
min,
K values
Zoom in/out
buttons
The x-axis of the histogram panel represents the raw pixel values. The panel has a
bar graph displaying a histogram of the number of pixels with each raw value. The
higher the bar at a given location on the x-axis, the more pixels that contain that
particular intensity value. This histogram is shaded with the color map in use for
that channel. Also shown in the panel is an adjustable curve that maps raw data to
display data.
Histogram
Display full
histogram
Choose display
Adjust display
C-DiGit User Manual 4-29
Page 62
4
Image Studio Software
The adjustable curve overlaying the histogram represents how the raw data maps to
the display data. Adjust any of the three dots on the line (Min, Max, or K Value) to
optimize the displayed image. To view the numbers, hover the mouse over one of
the three circles on the line. The Max and Min numbers are displayed. The middle
circle also shows the K value, which is used to smoothly change between linear
(K=0) and logarithmic (K=1) mapping of the data onto the color maps.
Moving the Max Point to the left causes more of the intensity values to be mapped
to the brightest display values, making the bands brighter.
Moving the Min Point to the right shades more of the lower intensity values to
lower display values, creating a visually cleaner background.
Increasing the K value reduces the contrast between the higher and lower intensity
values, so less intense bands appear brighter while very bright bands are avoided.
Adjusting the Parameters
You can adjust the display parameters as described below.
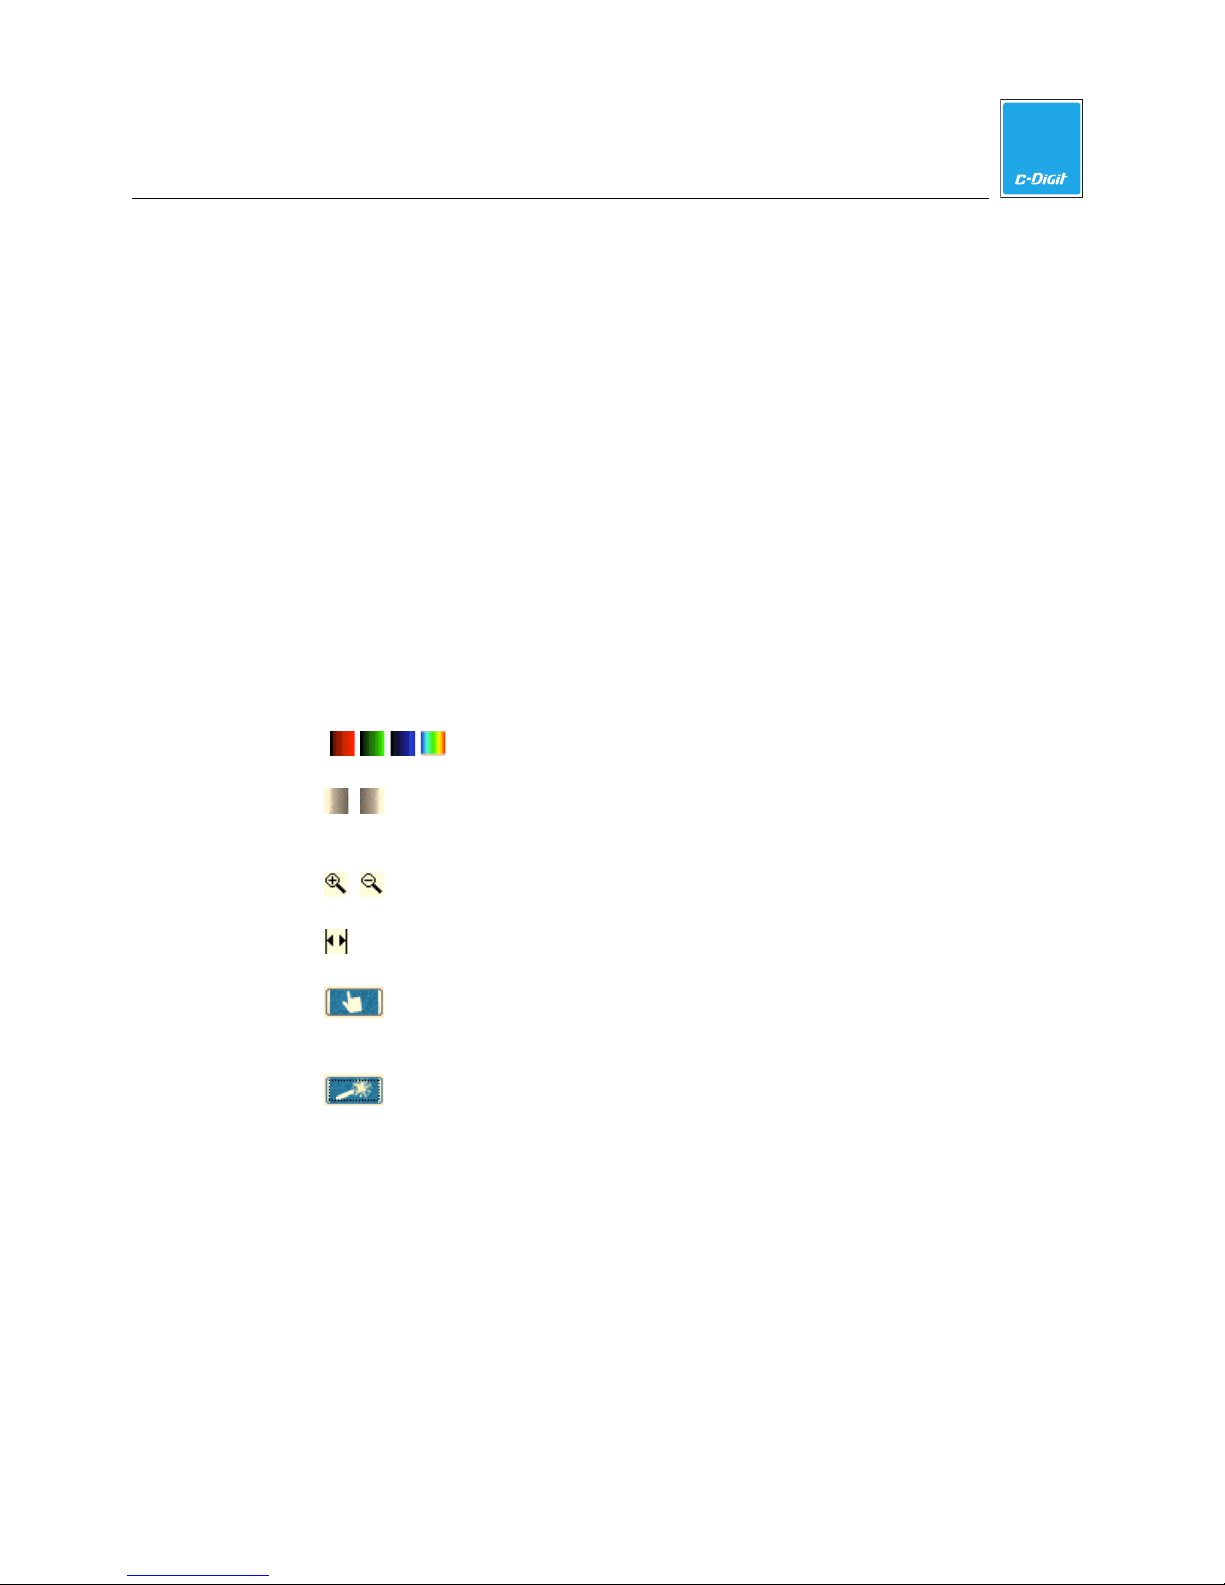
Use the color buttons to change the channel’s display color.
Use the gray scale buttons to display the channel in gray scale. This is
useful for displaying the image for reports that will be published.
Use the zoom buttons to zoom in or out on the range of pixel values.
Use the expand button to show the full histogram in full zoomed out view.
Use the Choose Display button to select the best display from six
choices.
Use the Adjust Display button to open a dialog in which to set the min
and max points of the display mapping.
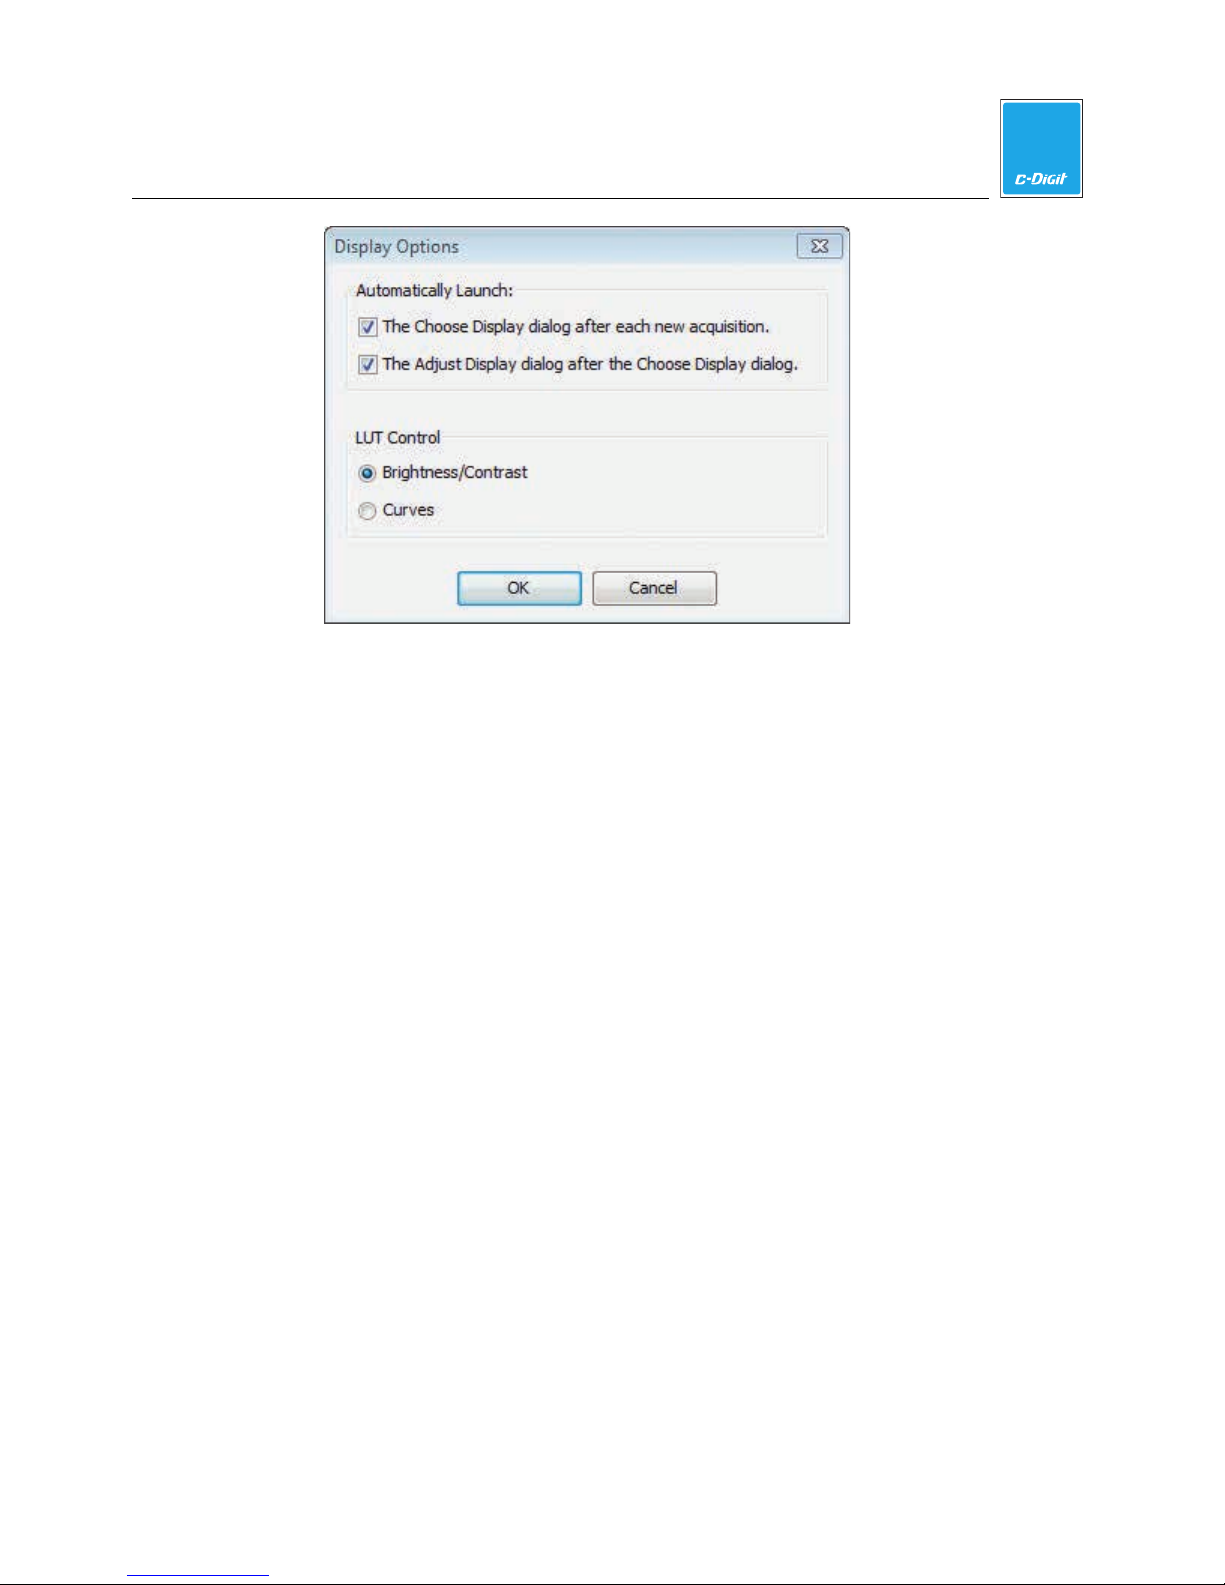
Note: The Choose Display and Adjust Display dialogs automatically open after
a scan. Click the arrow (>) in the Display group to open the Display Options
dialog and disable the checkboxes to disable this feature.
C-DiGit User Manual 4-30
Page 63
4
Image Studio Software
Link LUTs Across Filtered Images
The “Link LUTs Across Filtered Images” check box at the top of the LUT Panel
forces all images currently in the filtered Images Table to use the same curves as
those applied to the display of the selected image. When the Image LUTs are
linked, any changes that you make to the curves affect all images in the filtered
view regardless of the view mode (single image or multi-image).
Note: The checkbox is only enabled after a filter has been defined and applied to
the Images Table. It is grayed out if no filter has been applied.
The LUT values will differ depending on the instrument and acquisition settings
used. Linking the LUT values of images from different instruments, or from the
same instrument with different acquisition settings, will not provide accurate
comparisons.
Profiles
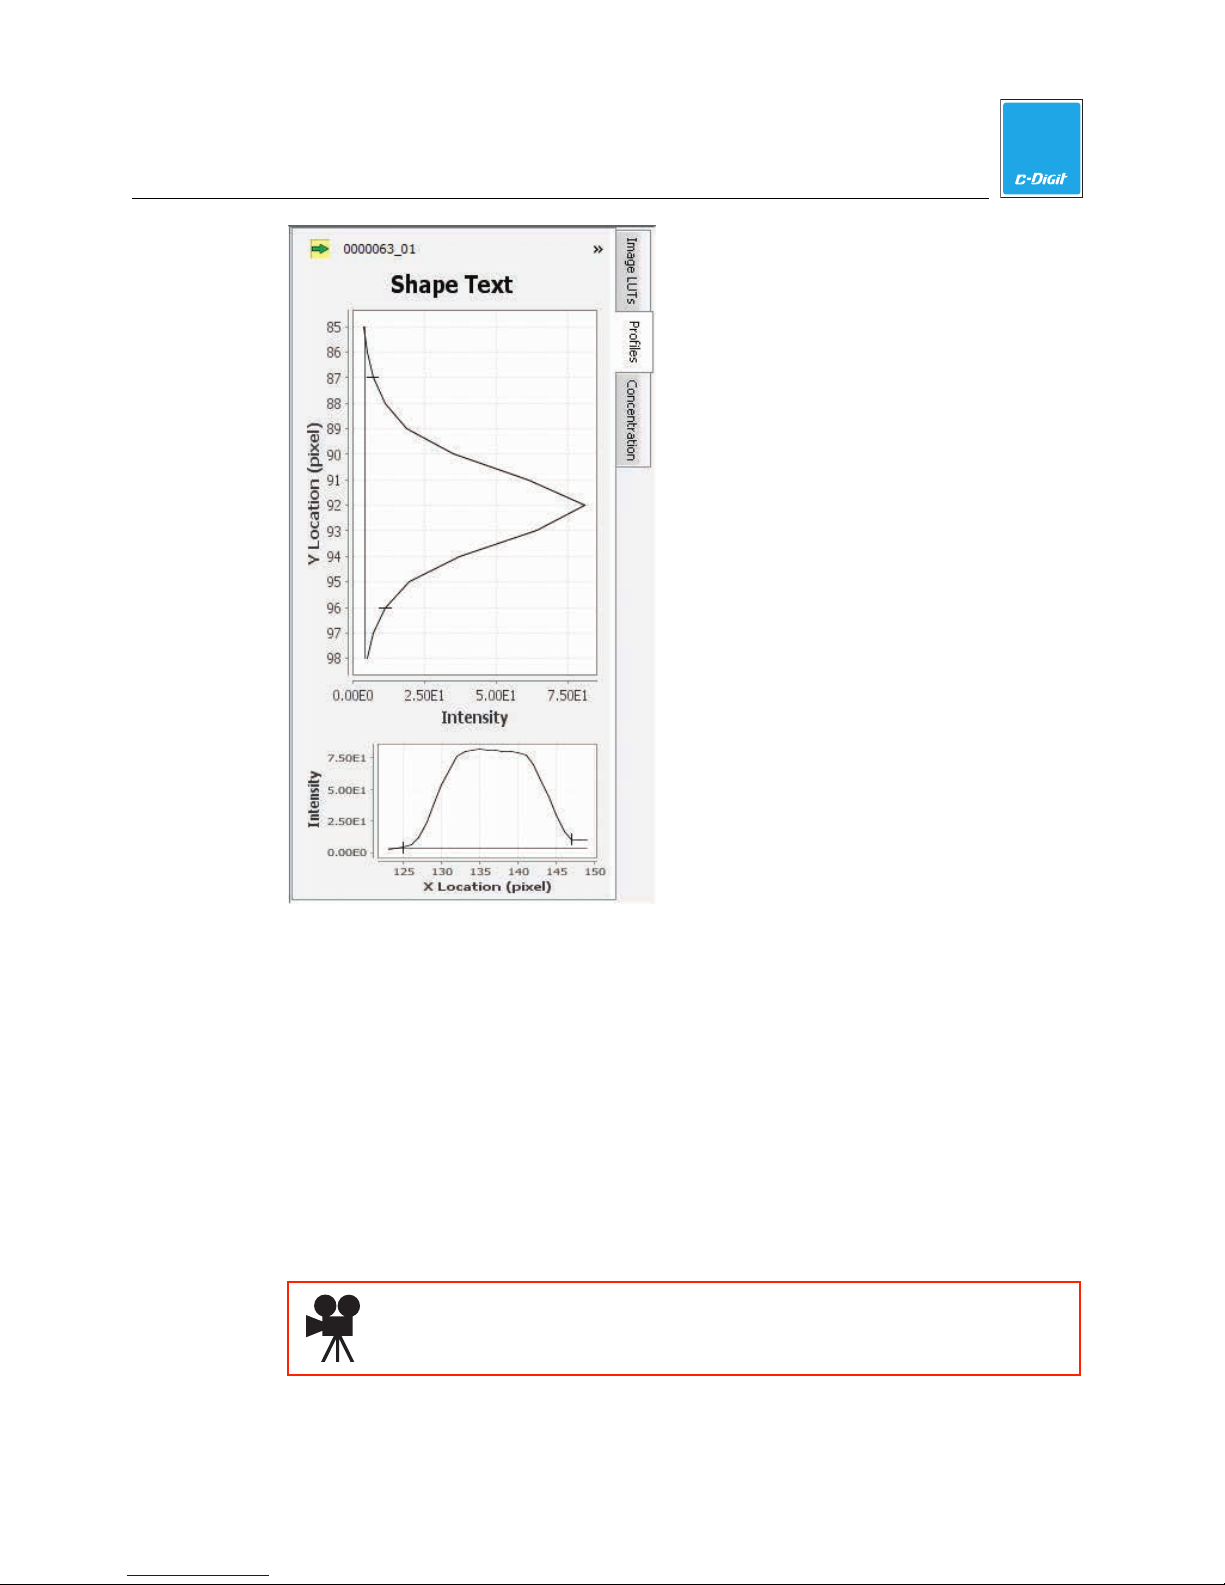
The Profiles tab displays a lane, band, or shape profile. When a band or shape is
selected, the profile is displayed corresponding to the band or shape.
C-DiGit User Manual 4-31
Page 64
4
Image Studio Software
1. Select a single band or shape and click the Profiles tab. The profile panel is
displayed.
2. The profile graphs map the intensity values of the selected shape(s), and show
the location of the highest intensity pixel along both x and y axes (X Location
and Y Location).
Concentration
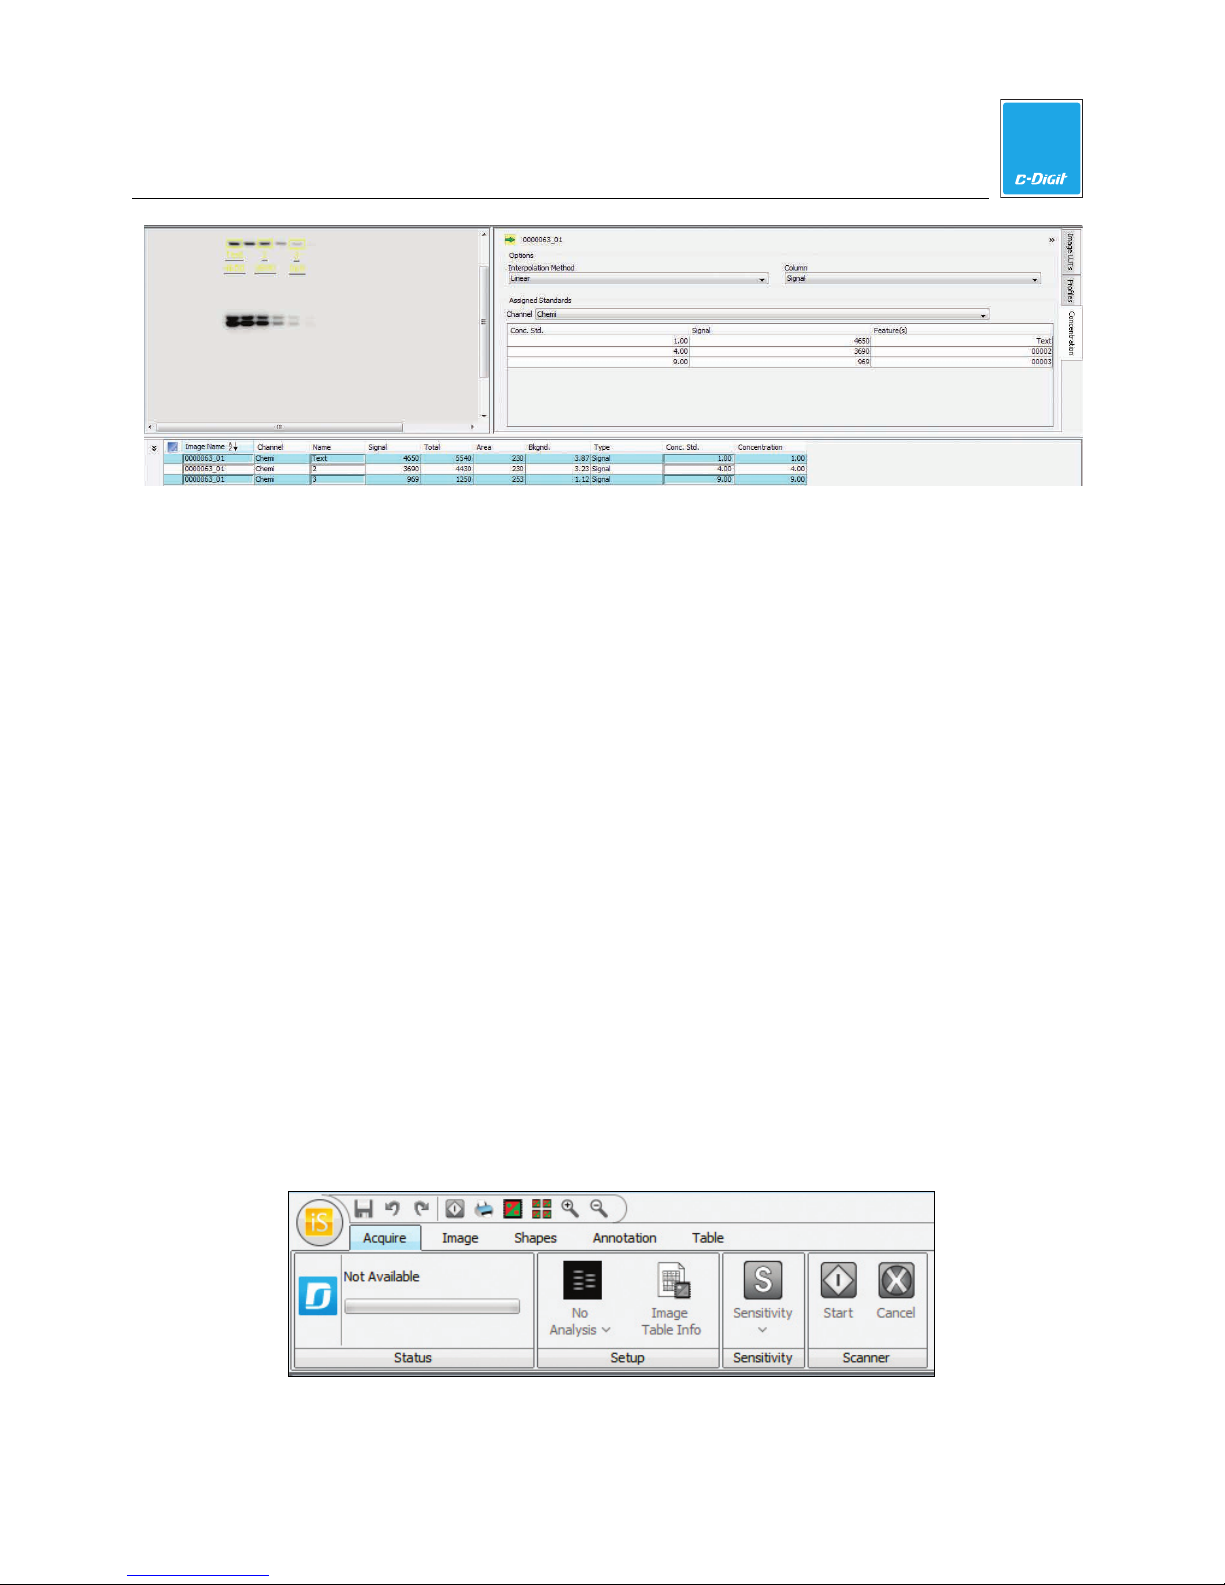
The Concentration tab allows you to view the concentration standards; the
standards and concentrations are entered into columns on the Shapes table; the
concentration of all other features on the image is then calculated and displayed in
the table. You can add concentration standards to any analysis.
Click here to watch a video that demonstrates how to quantify data.
C-DiGit User Manual 4-32
Page 65
4
Image Studio Software
To assign concentration standards:
1. Click the Shapes tab at the bottom of the window to open the Shapes table.
2. Click a feature on the image to highlight the row in the table.
3. Double-click the Conc. Std. field in the row.
4. Type a number in this field to order the concentration standards. Note: The
values of the standards must increase as the order increases.
5. Click the Concentration tab on the right side of the application window. The
assigned concentration standard should appear in the list.
6. Repeat steps 3 through 5 to add all of the concentration standards to the list.
7. The calculated concentrations for the other features appear in the Shapes table
in the Concentration column.
Acquire Ribbon
Click the Acquire tab to display the Acquire ribbon options. The Acquire ribbon is
used to set the parameters for capturing the image from the membrane on the
C-DiGit scanning surface.
C-DiGit User Manual 4-33
Page 66
4
Image Studio Software
Status
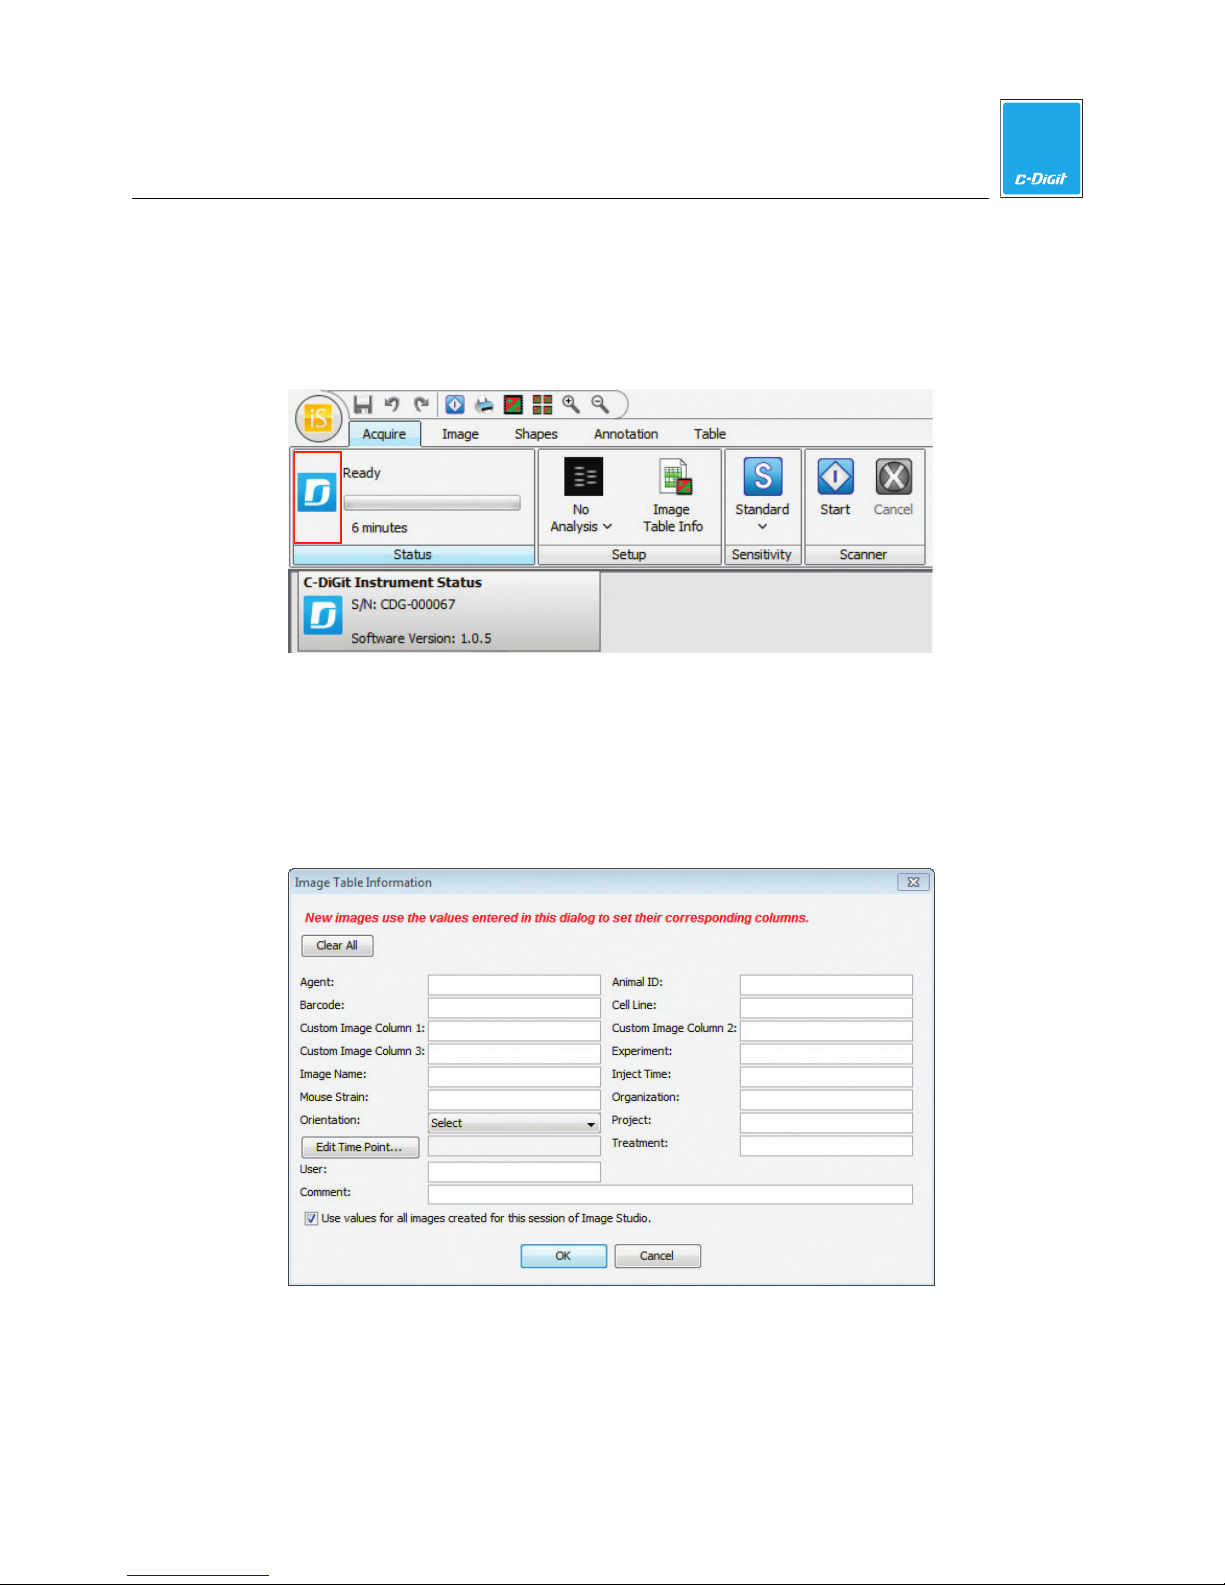
Mouse over the C-DiGit logo to display the C-DiGit Instrument Status bar, which
shows the serial number and instrument software version of the instrument that is
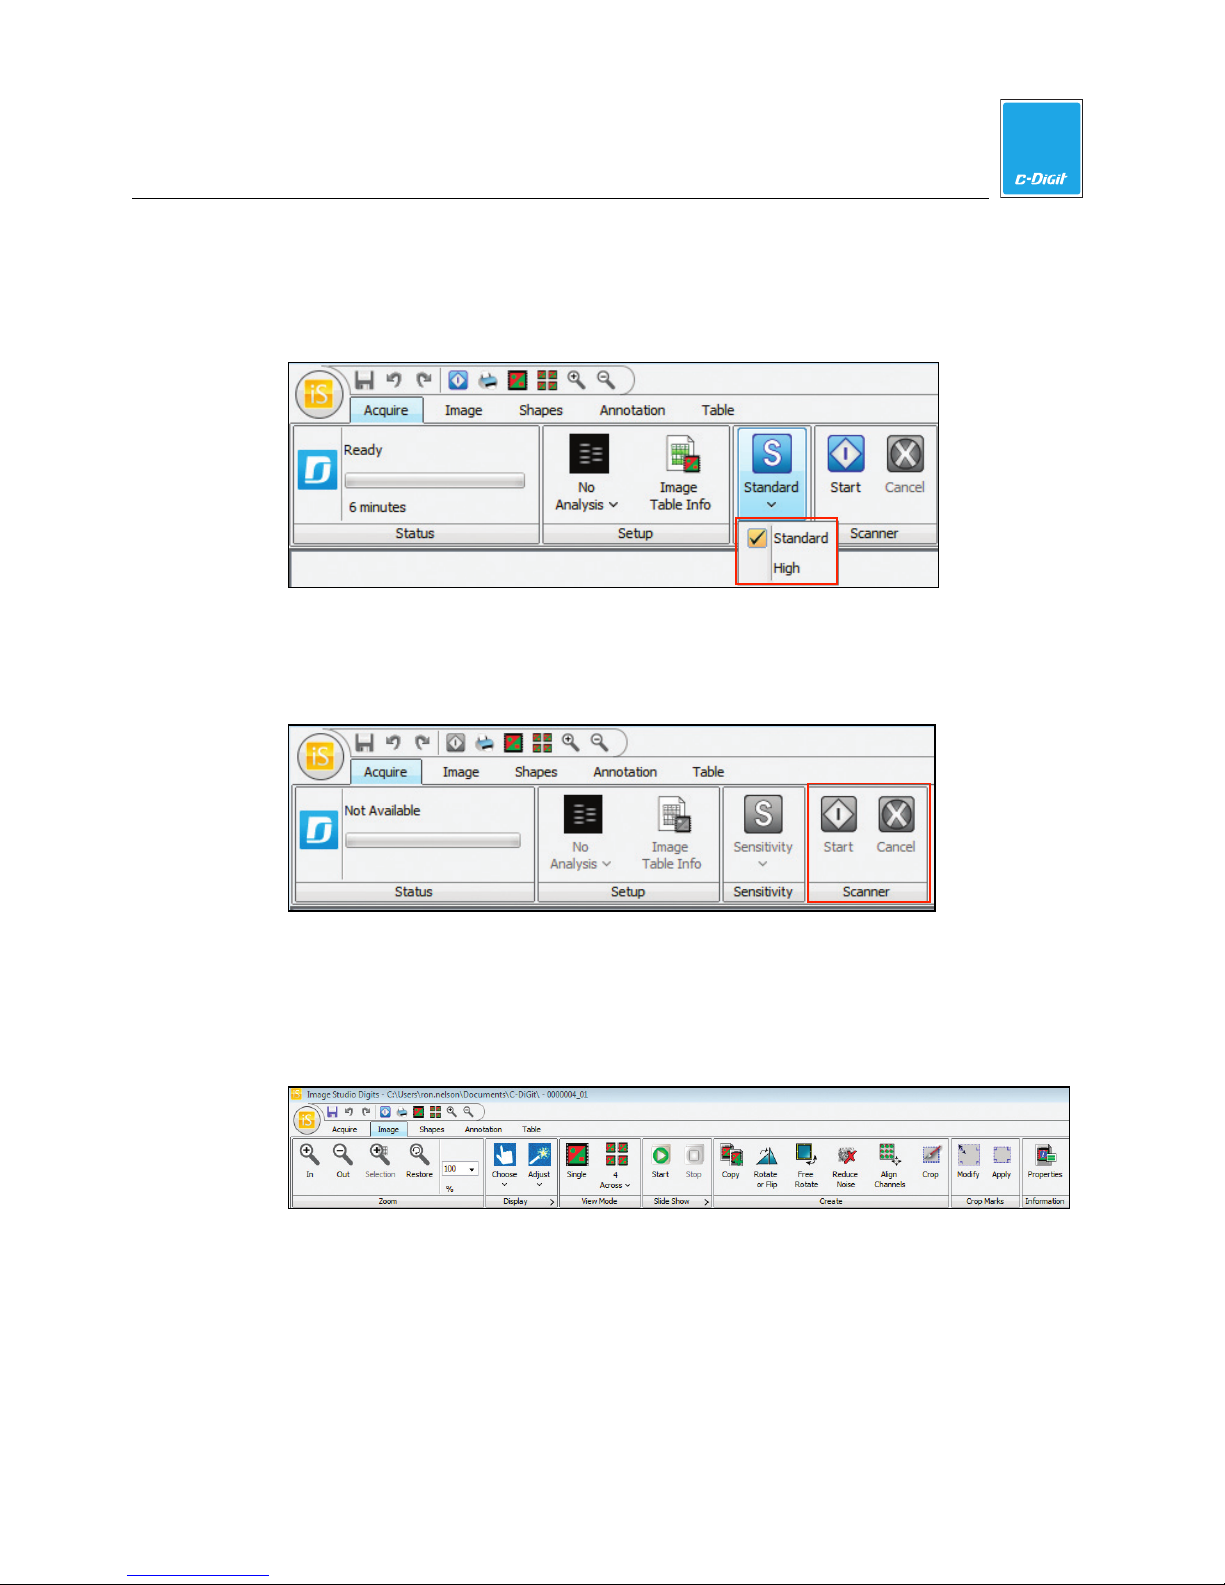
currently connected (below). If an instrument is not connected, the Status display
will show ‘Not Available’, as shown above.
Setup
No Analysis – An analysis is not performed after the image acquisition is finished.
Automated analysis options are not available with C-DiGit.
Image Table Info – Opens a dialog where you can enter initial values for the image
table columns (below).
The values entered in the dialog above are used for all new images created during
the current Image Studio session; this automates data entry for the table headers so
that you do not need to re-enter the information for each image.
C-DiGit User Manual 4-34
Page 67
4
Image Studio Software
Sensitivity
Sets the Sensitivity for the image acquisition, where an image acquired using
Standard sensitivity requires about 6 minutes, and an image acquired using High
sensitivity requires about 12 minutes.
Scanner
Click Start to begin the image acquisition. Click Cancel at any time to stop the
image acquisition and discard the image.
Image Ribbon
View the Image
Click the Image tab to display the Image ribbon options.
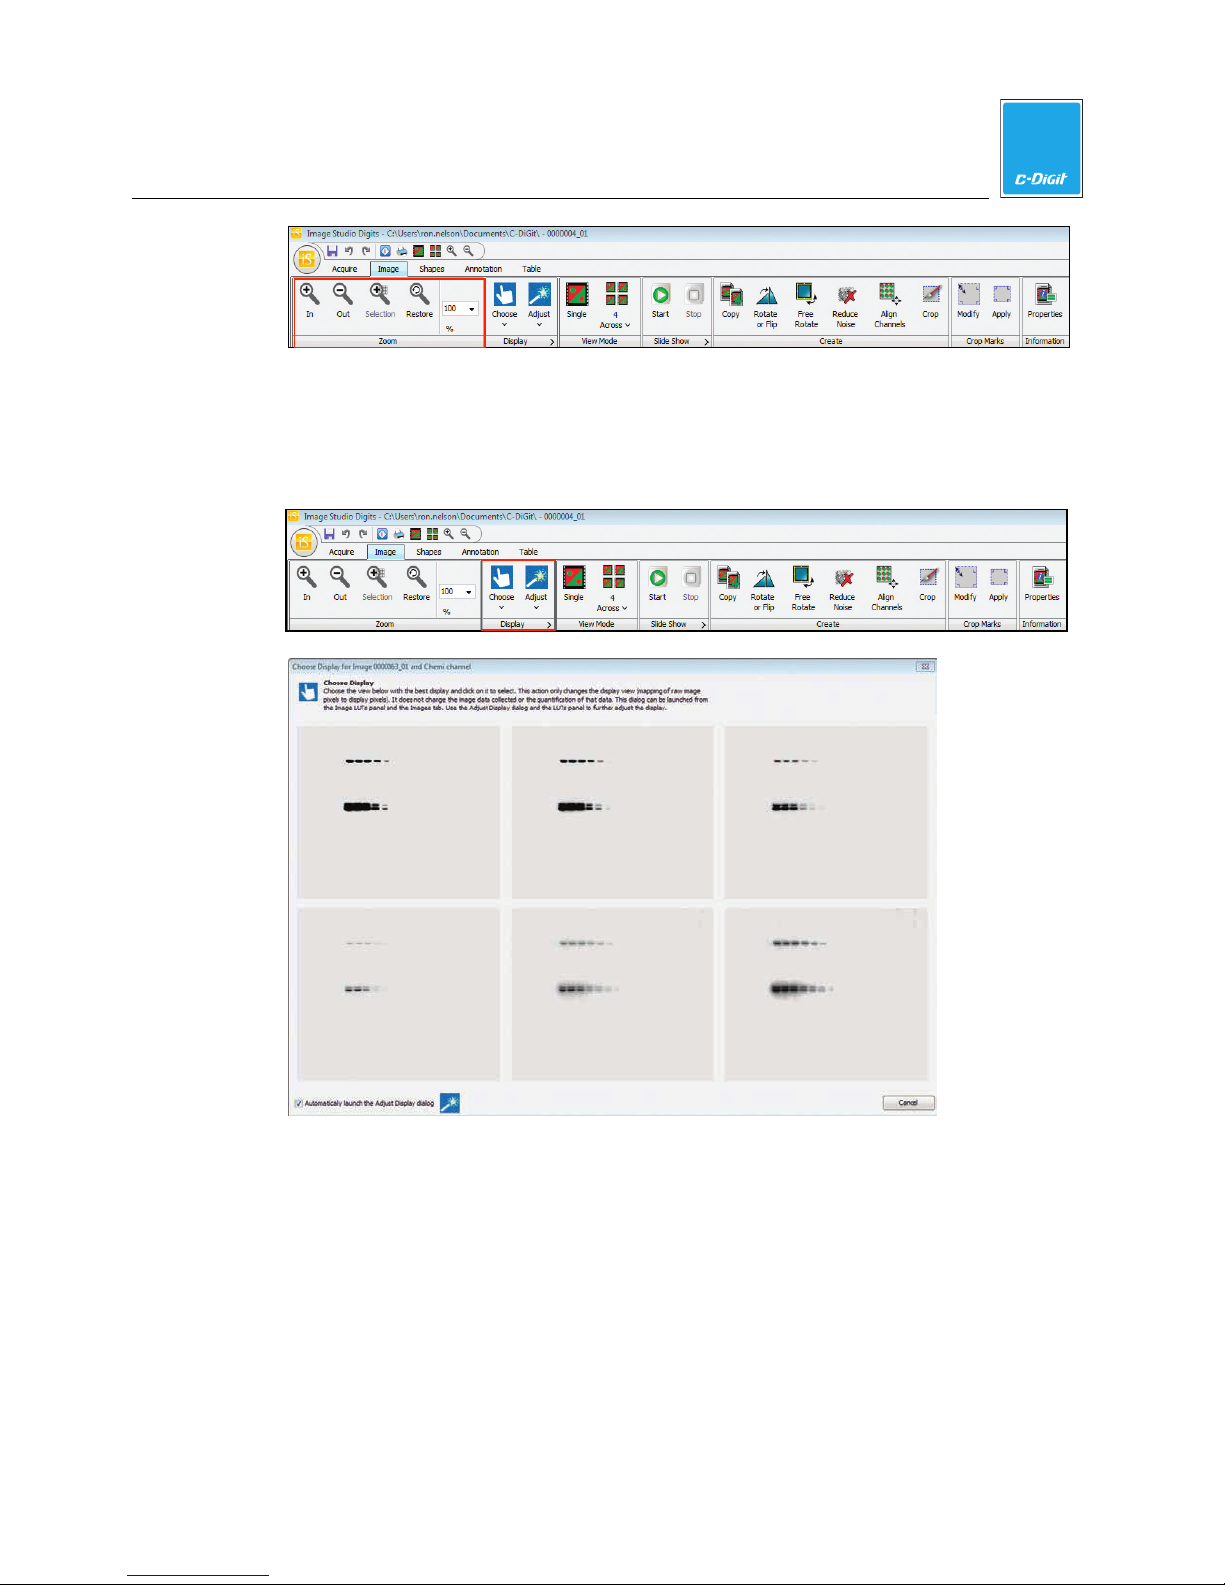
Zoom - Click the magnifier icons to enlarge or reduce the displayed image, or
choose the enlargement factor from the pull-down menu. You can also use the
mouse wheel or use the scroll function of a keypad to zoom in or out. Click
Restore to automatically fit the image to the window.
C-DiGit User Manual 4-35
Page 68
4
Image Studio Software
Display - The Choose and Adjust options (below) are alternate ways to adjust the
Look Up Tables (LUTs). Click Choose in the Display group and select the Chemi
Channel to open the Choose Display window, where six versions of the acquired
image are displayed, each using a different display algorithm.
1. Click the view with the best display. The Adjust Display dialog (below) will
open for further adjustment.
C-DiGit User Manual 4-36
Page 69
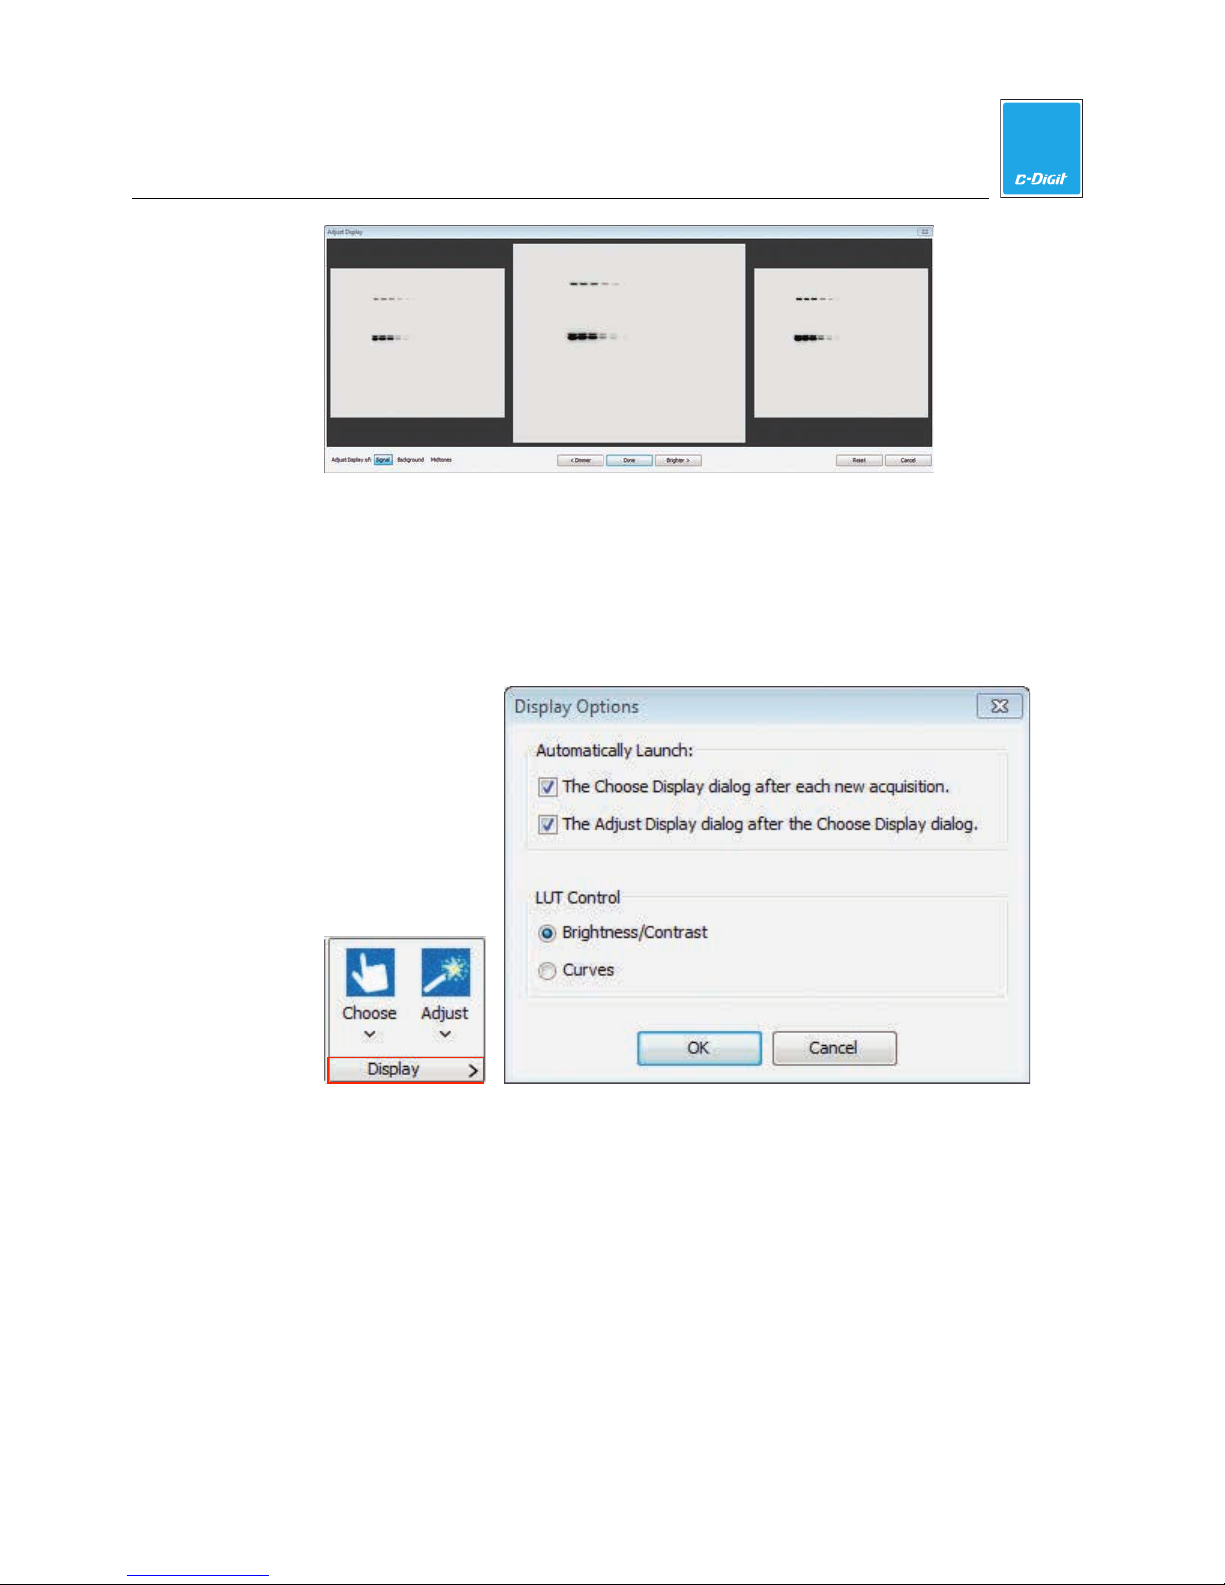
Image Studio Software
You can choose to not open the Adjust Display dialog automatically by
disabling the ‘Automatically launch the Adjust Display dialog’ checkbox at the
bottom of the Choose Display window. You can also click the arrow (>) on the
Display group on the Image ribbon (below) to open the Display Options dialog
and disable the automatic launch of either the Choose Display or Adjust
Display dialog(s).
4
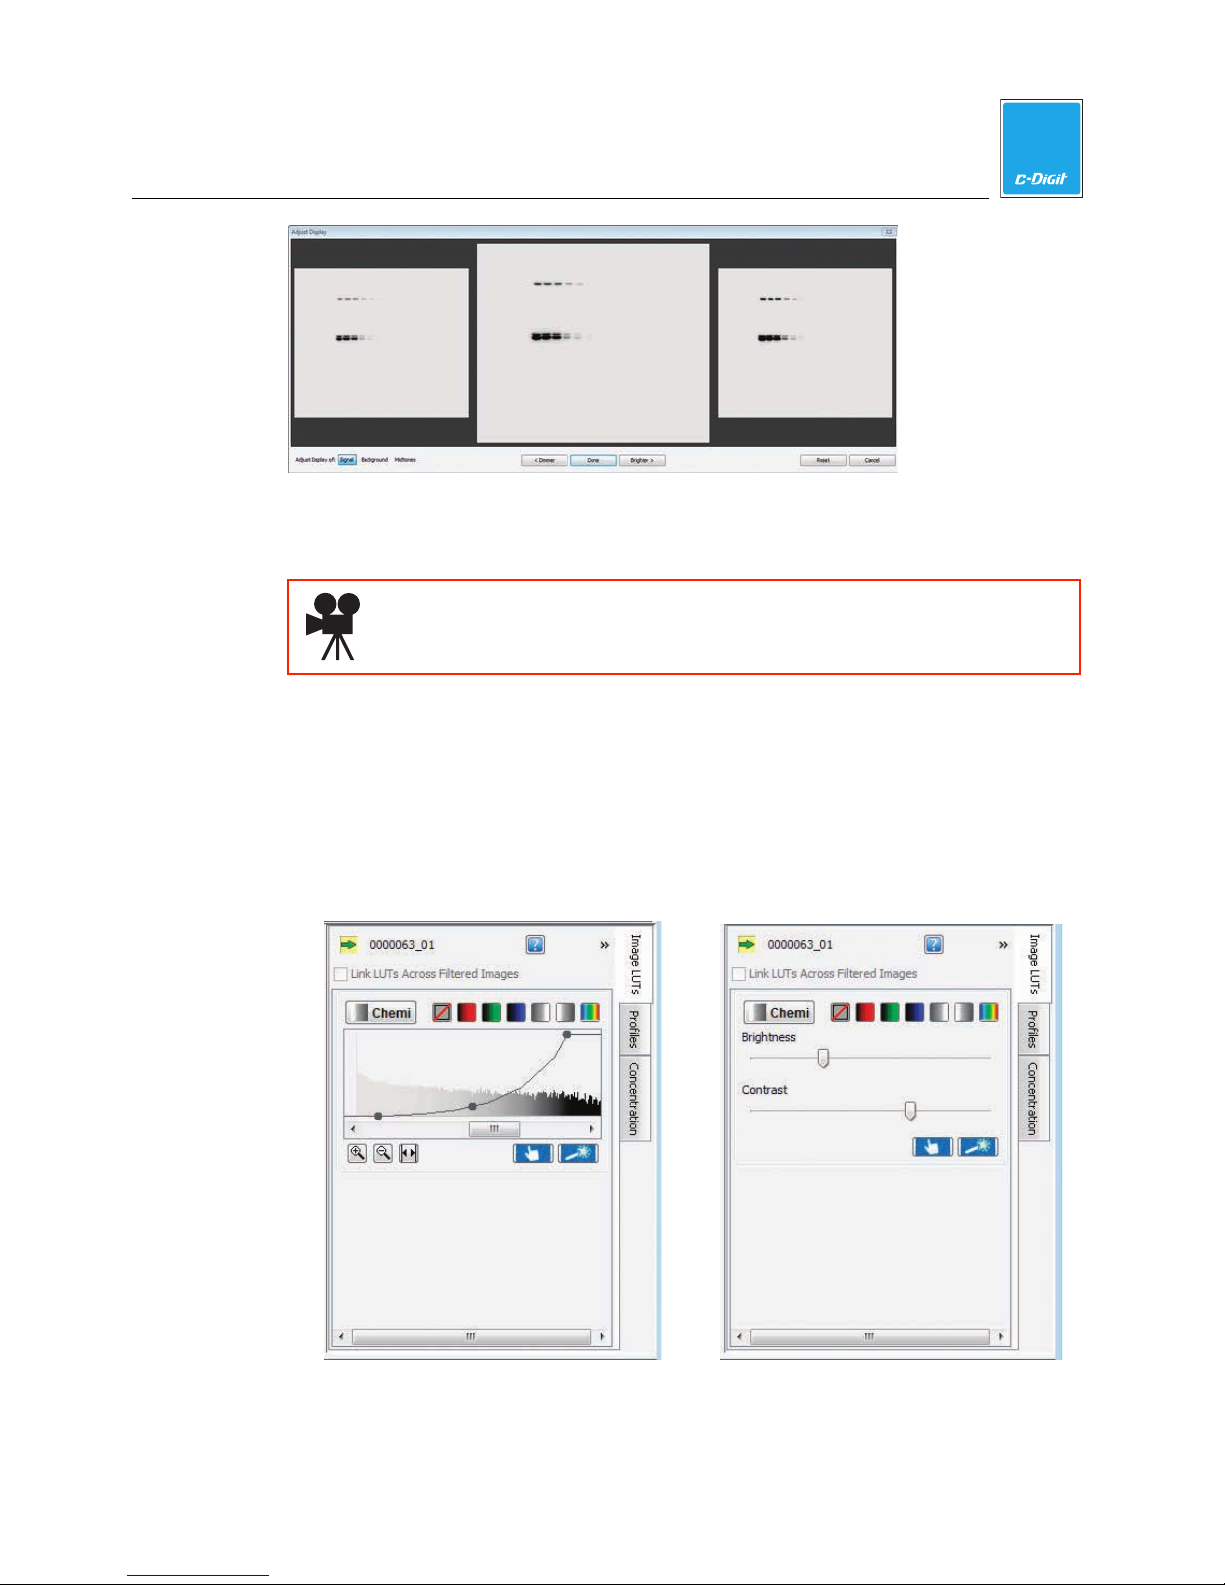
Click Adjust in the Display group and select the Chemi channel to open the Adjust
Display Assistant (below).
Select Signal at the bottom left to adjust the maximum point on the curve in the
Look Up Tables (below), Background to adjust the minimum point, or Midtones to
adjust the K value.
C-DiGit User Manual 4-37
Page 70
4
Image Studio Software
Click Dimmer or Brighter to change the visual appearance of the image. When
finished, click Done.
Click here to watch a video that demonstrates how to choose and adjust
the appearance of the image.
Adjust the Image Appearance
The Look Up Tables (LUTs) display histograms of the pixel intensities for the
acquired image. The LUTs are on the right side of the screen.
1. Click the Image LUTs tab to view the Image Look Up Tables as either
histograms overlaid with a curve (below left), or as slider bars (below right). To
hide this view, click the double arrows in the top right corner.
C-DiGit User Manual 4-38
Page 71
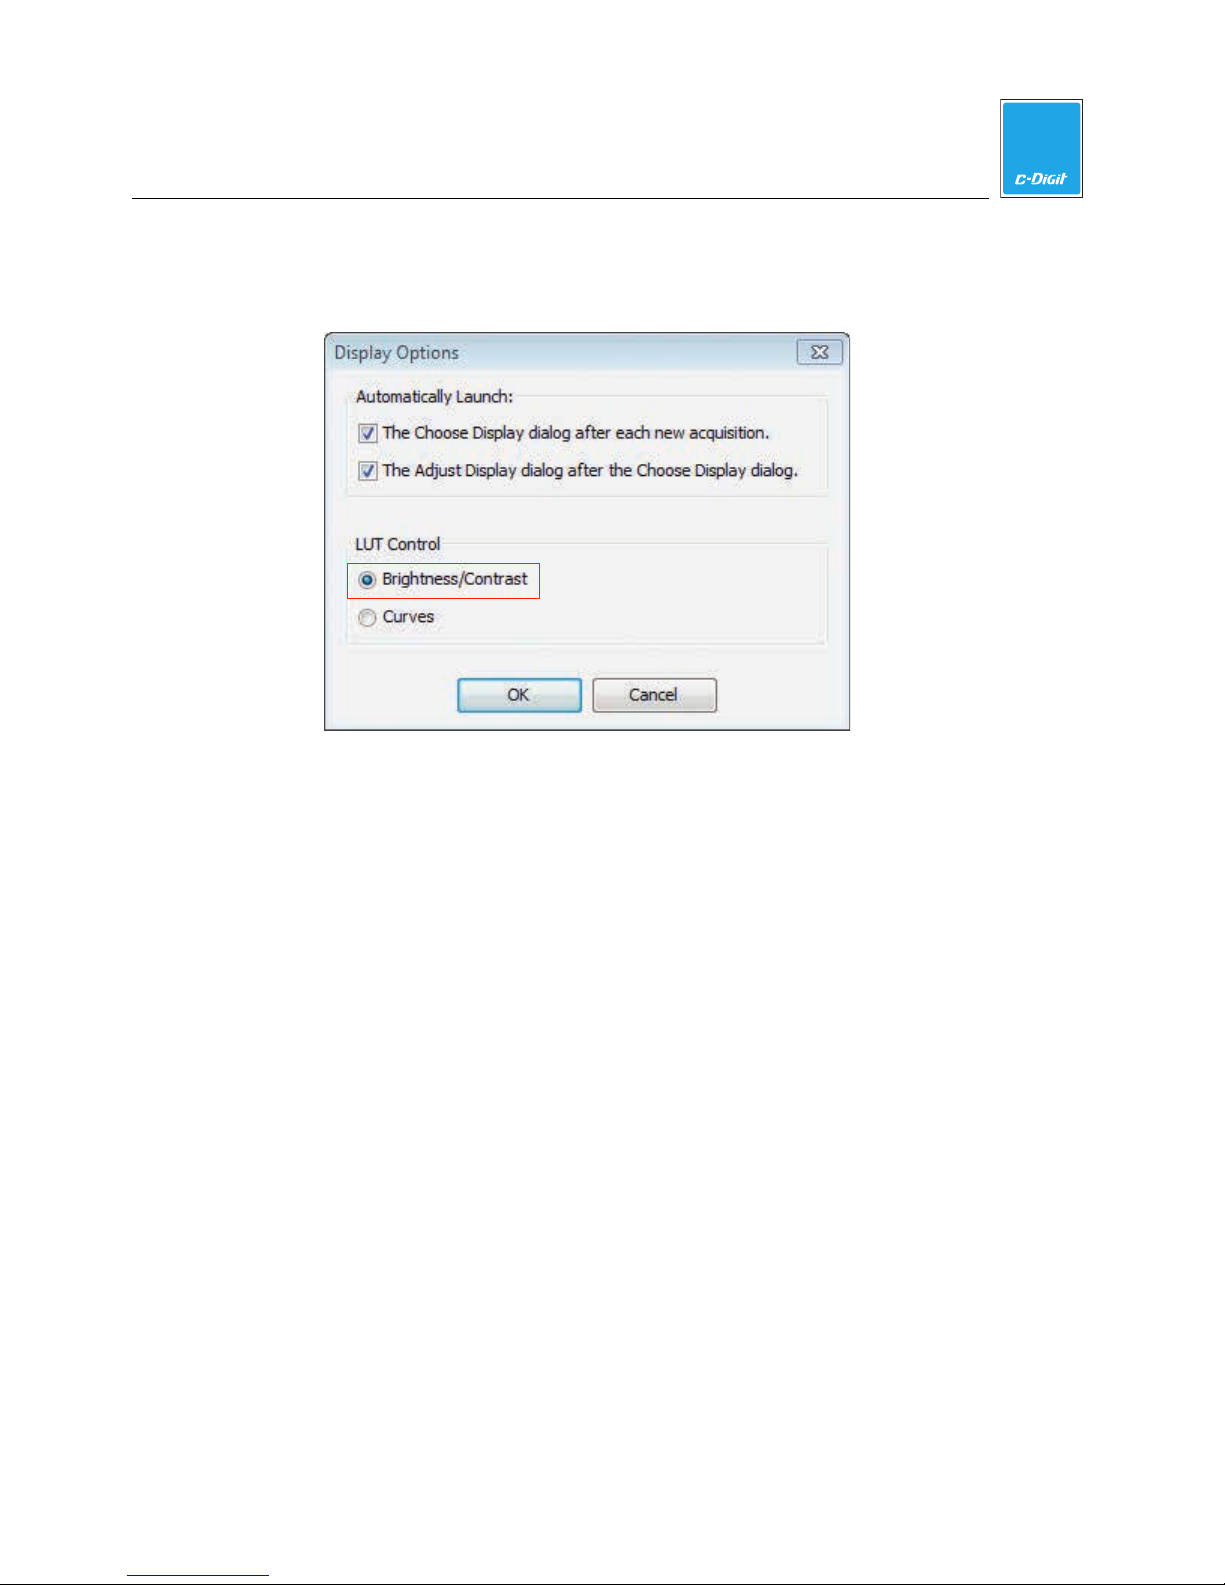
Image Studio Software
2. To change the Image LUTs from histograms (Curves) to Brightness/Contrast
sliders, and vice versa, click the arrow (>) on the Display group on the Image
ribbon to open the Display Options dialog.
4
3. Click the appropriate colored button above the graph to view a different color
scheme for each channel.
To adjust the intensity of the image in the histogram view:
a. Drag the left (min) dot on each graph to adjust the lower threshold of pixel
values that will shade to the same color on the viewed image. Shading the
lower intensity pixels to the same color will create a visually cleaner
background on the image.
Note: Changing the visual image will not change the data collected for that
image or the quantification of that data; it simply changes the mapping of raw
image pixels to display pixels.
b. The rightmost (max) dot on each graph adjusts the upper threshold of pixel
values that will shade to the same color on the viewed image.
c. Click and drag the middle dot on each graph vertically to change the K value.
Note: Further explanation of the K value can be found in the on-line Help system
by clicking the question mark in the upper right-hand corner of the screen.
To adjust the intensity of the image in the Brightness/Contrast view, click and drag
each slider bar.
C-DiGit User Manual 4-39
Page 72
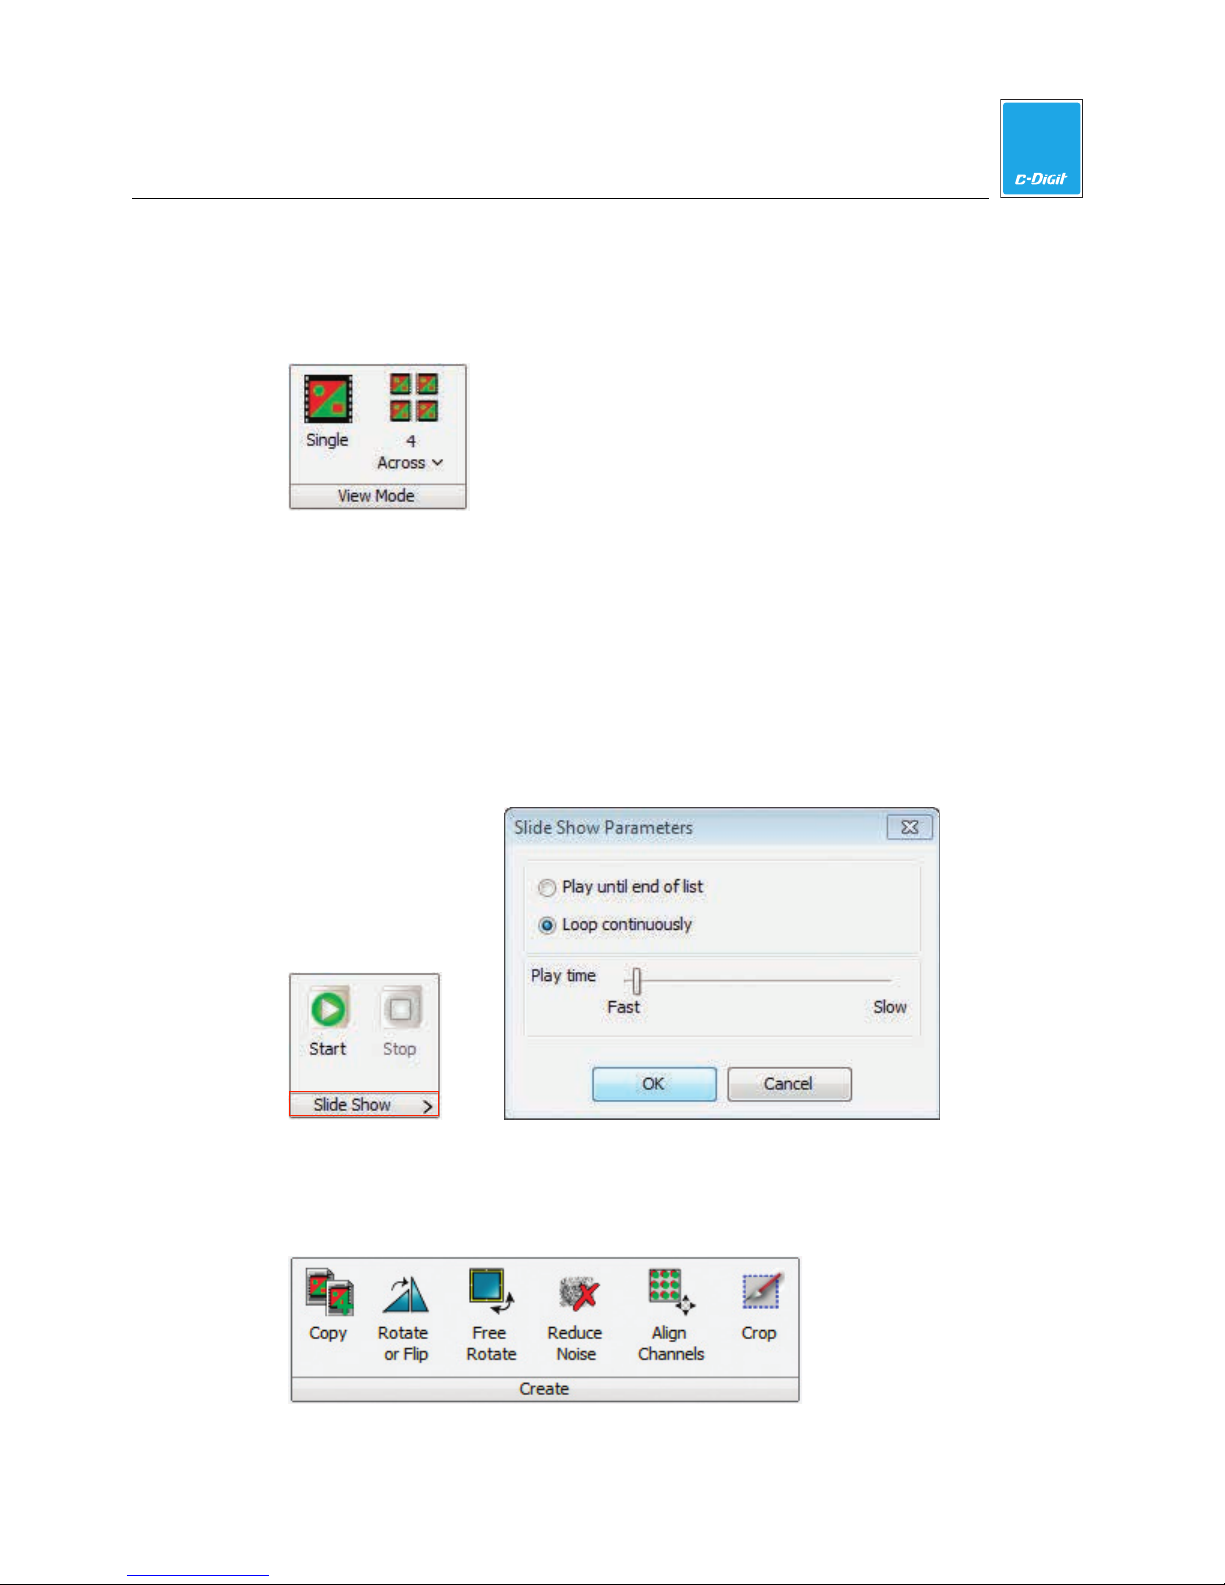
4
Image Studio Software
View Mode
Select Single in the View Mode group (below) to view and analyze a single image.
Click the Multi-Image View button and select the number of images to view from
the drop-down menu.
Note: Analyses cannot be performed in Multi-Image View.
Slide Show
Click Start to view the images in the Table sequentially. Click Stop to return to the
normal static view. Click the arrow (>) on the Slide Show group to open the Slide
Show Parameters menu. Choose to display the images in the Table and stop at the
end (Play until end of list), or return to the beginning of the table and continue
displaying the images (Loop continuously). Move the slider to adjust the time each
image is displayed.
Create
Click a button in the Create group to create a new image acquisition file with the
designated action applied. The original image acquisition remains unchanged.
C-DiGit User Manual 4-40
Page 73
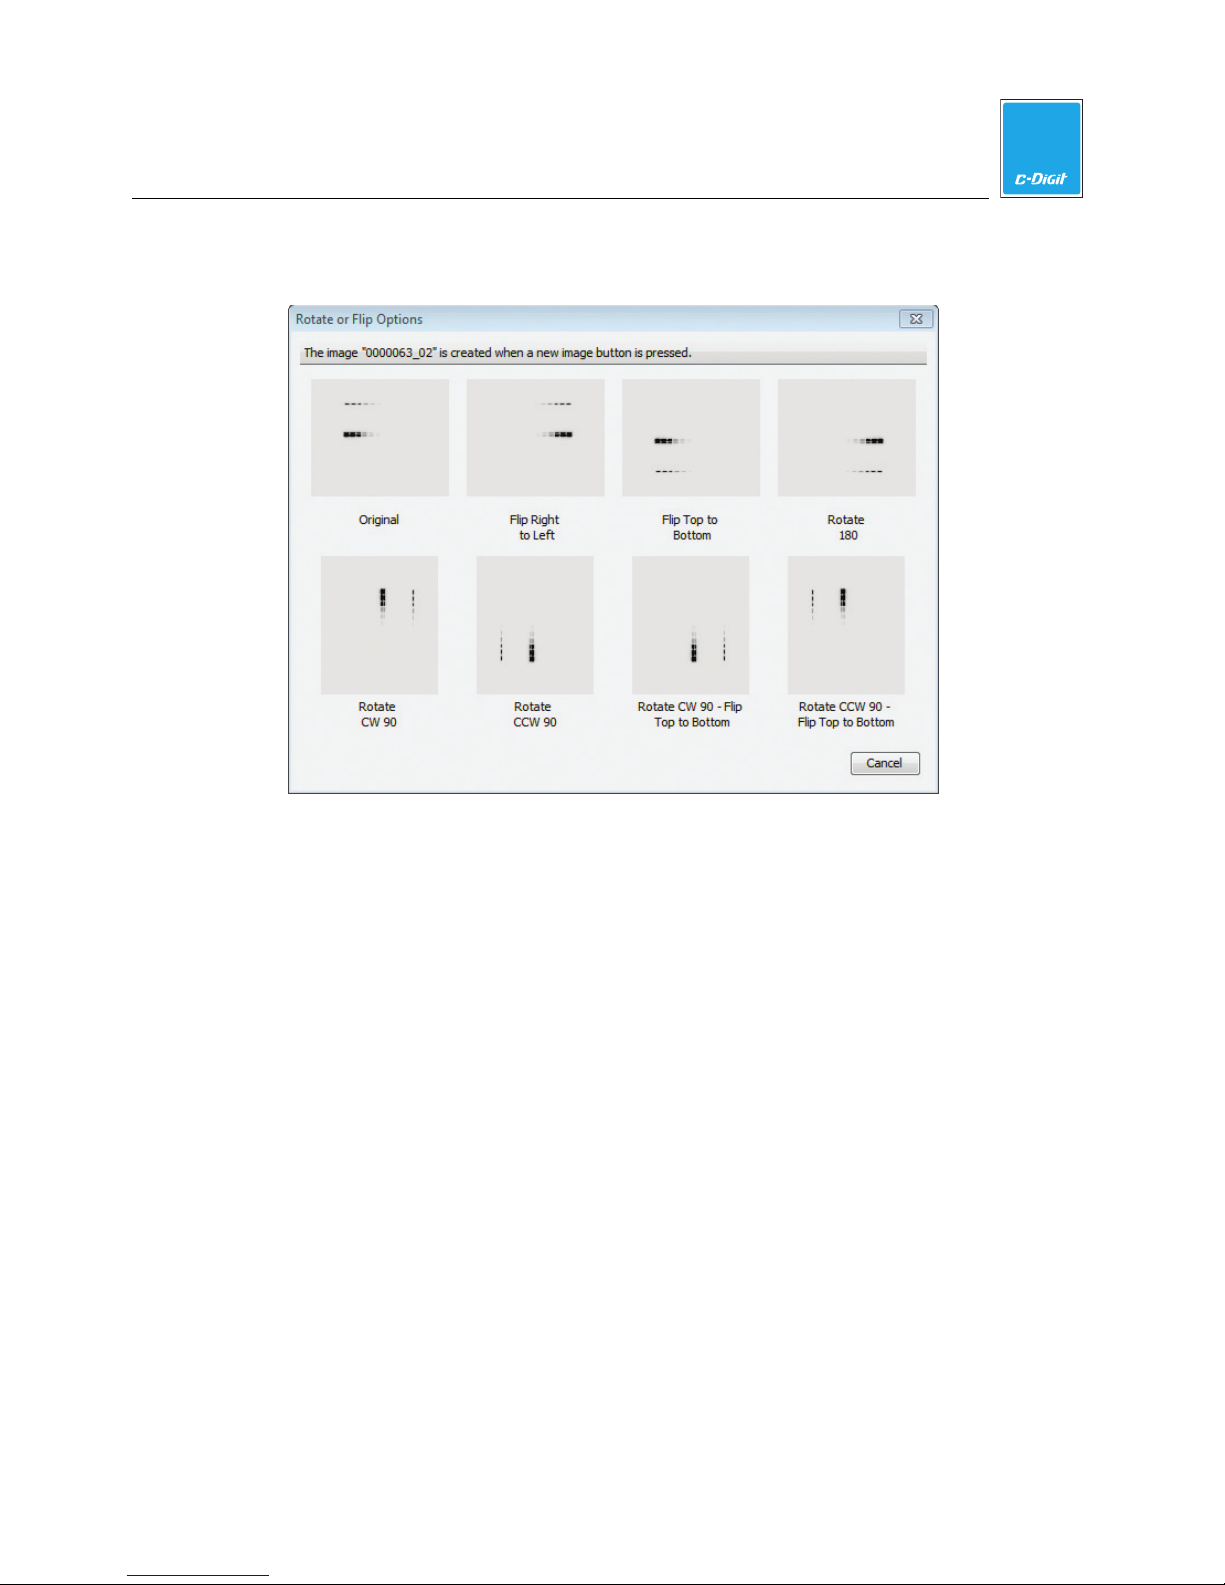
4
Image Studio Software
Click Copy to create a copy of the image. Click Rotate or Flip to open the Rotate or
Flip Options menu and select an orientation.
Click Free Rotate to open the Free Rotate Options dialog box and click the arrow
buttons to rotate the image clockwise or counterclockwise.
Warning: Free rotations change the image data for the new image and may affect
quantification results.
C-DiGit User Manual 4-41
Page 74
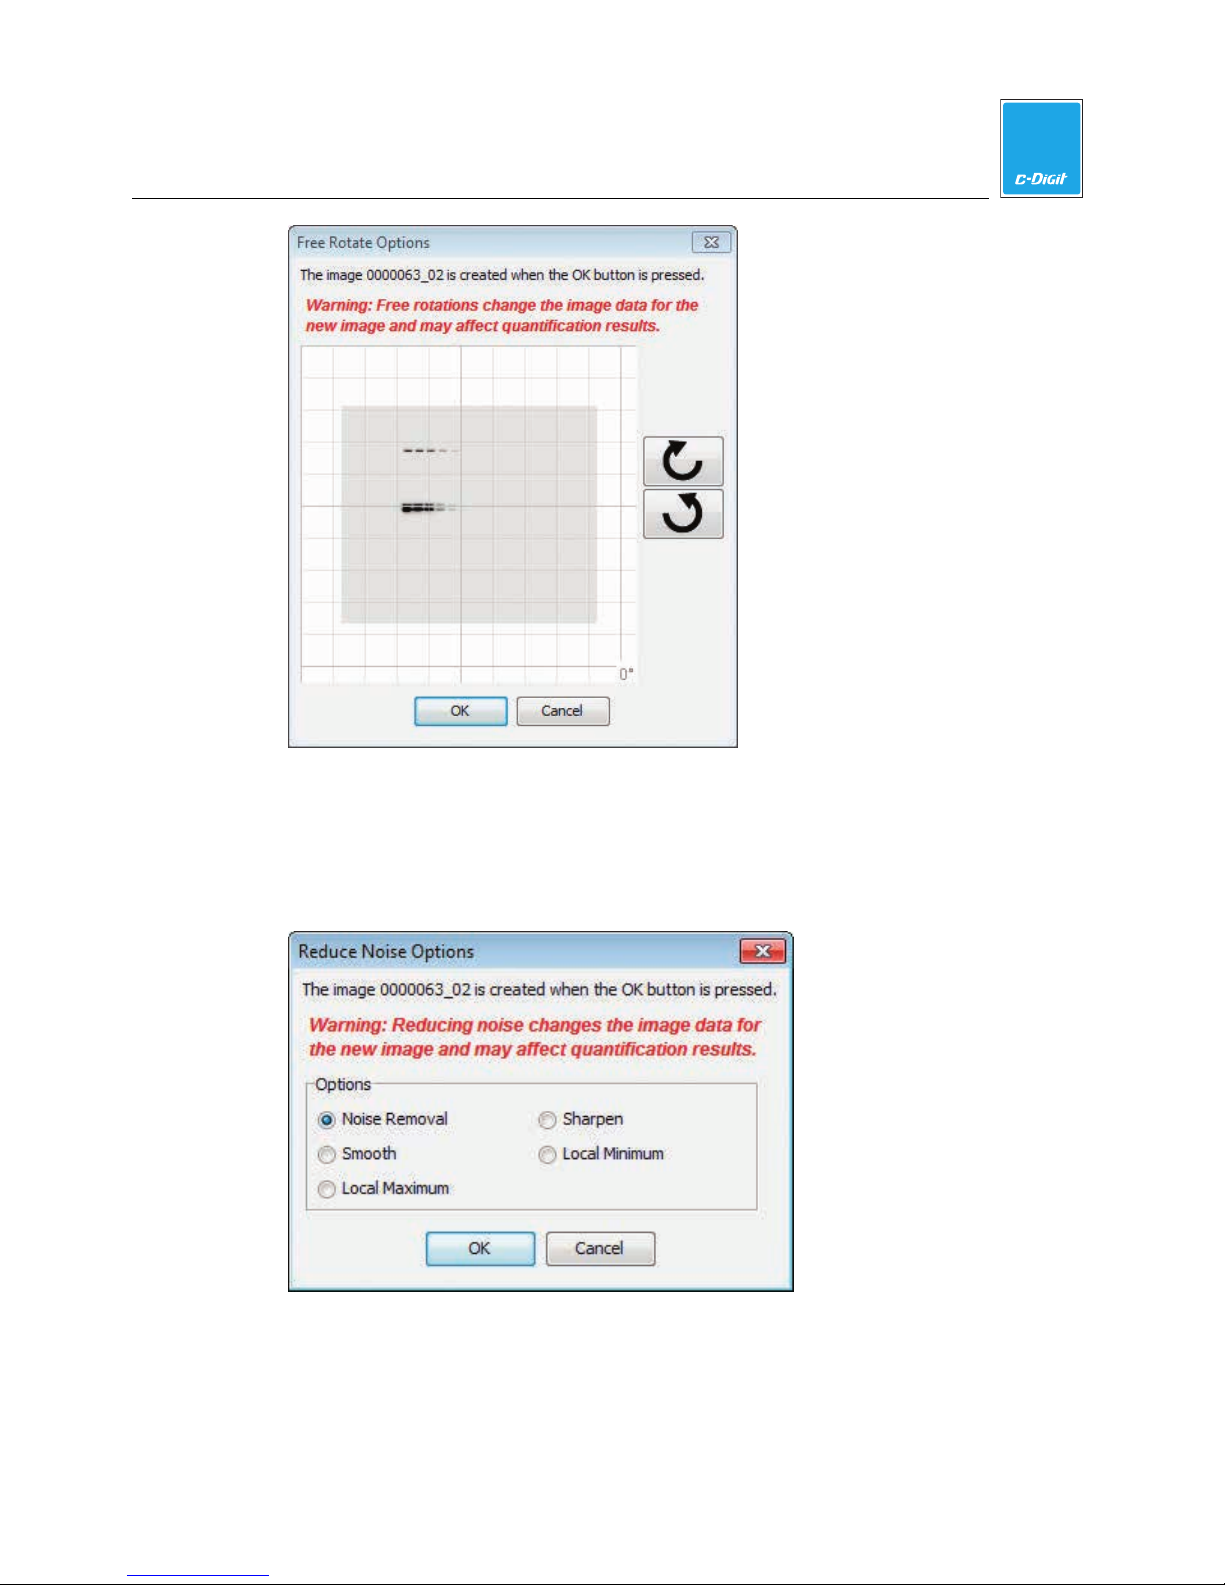
4
Image Studio Software
Click Reduce Noise to open the Reduce Noise Options dialog box and select an
option. Click OK.
Warning: Reducing noise changes the image data for the new image and may
affect quantification results.
The Align Channels dialog box has no functionality with C-DiGit.
C-DiGit User Manual 4-42
Page 75
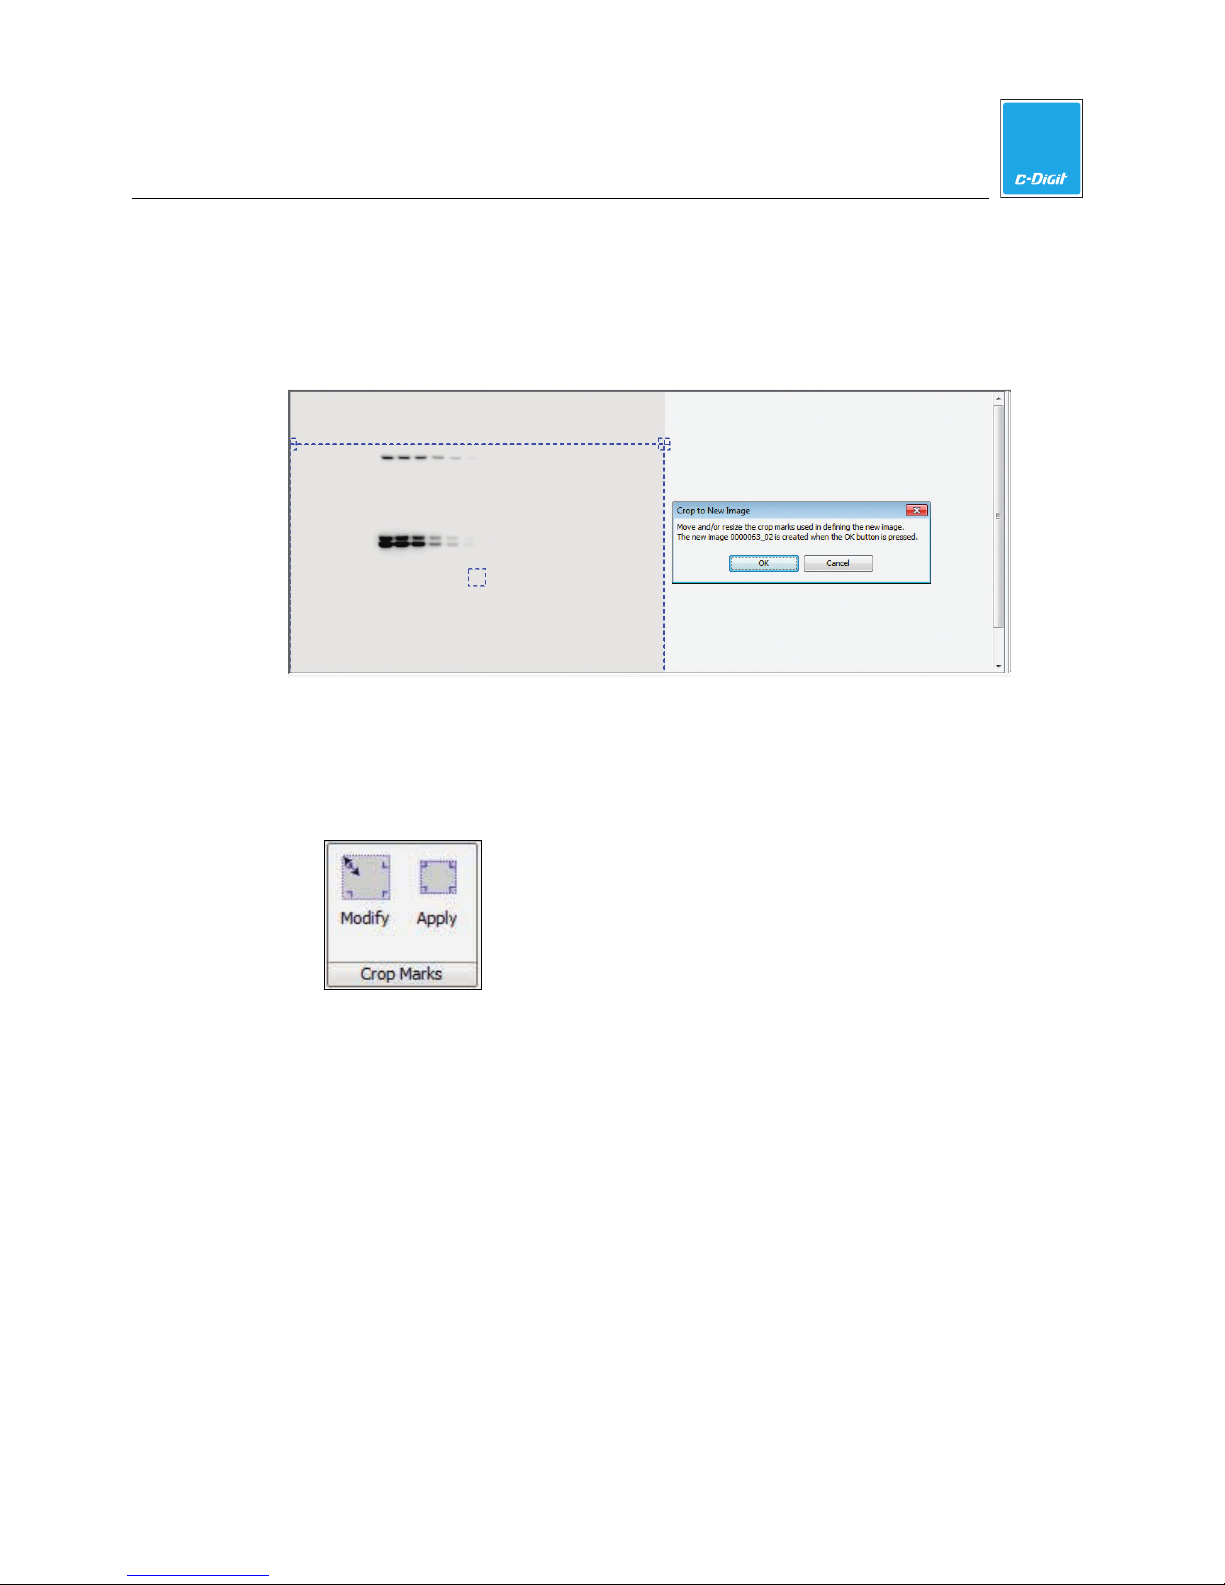
4
Image Studio Software
Crop the Image
Click Crop to create an image that contains only the area within the bounding box.
Adjust the crop area by dragging the bounding box at the corners or at the center.
Click OK to crop the image. A new, sequentially numbered image is created; the
original image is unchanged.
Crop Marks
Place crop marks on the image to indicate the area of the image to print or export.
These crop marks can apply to the selected image only, or to all images in the
Images table.
1. Click Apply to display the corners of the currently defined cropping area on the
image.
2. Click Modify to open the Edit Image Crop Marks dialog (below). Two boxes
appear as dotted lines on the image.
C-DiGit User Manual 4-43
Page 76
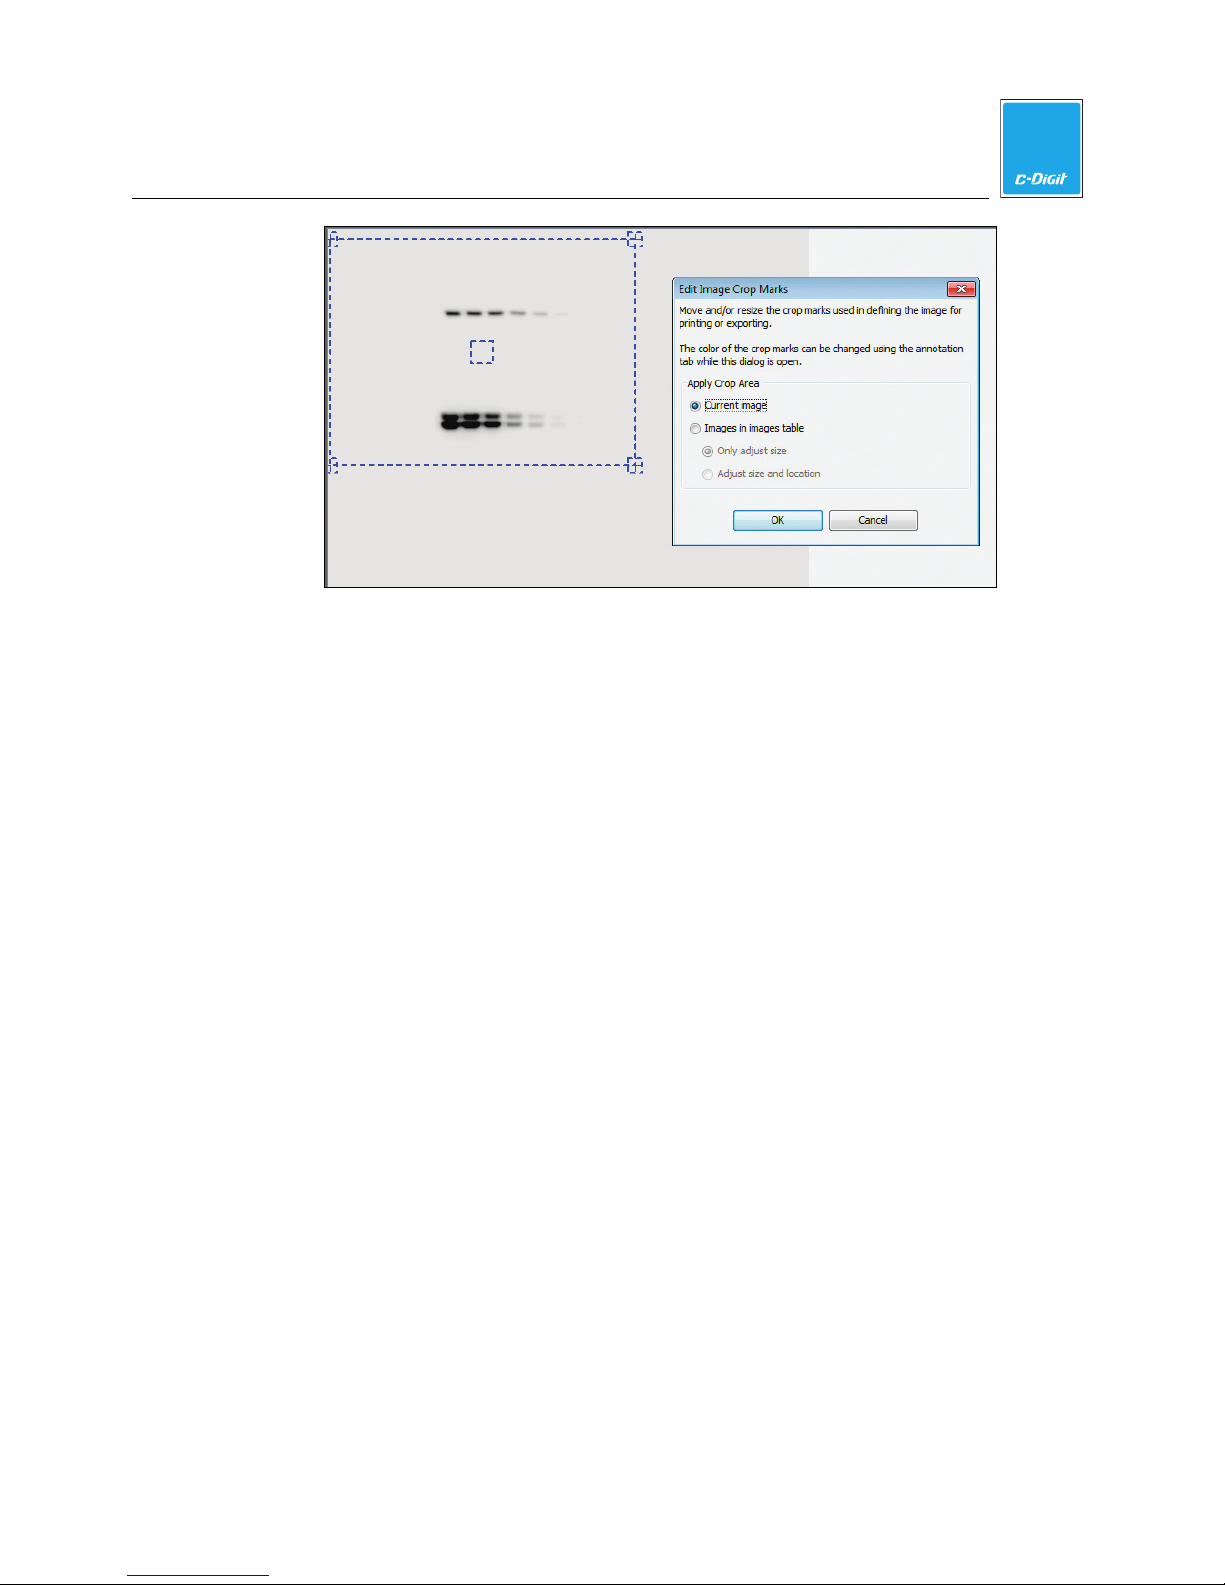
4
Image Studio Software
3. Drag the small box in the middle of the image to center the crop marks. Drag
the corners of the larger box to surround the marker and bands.
4. Click Current Image to mark this image with these crop marks and click OK.
Small crop marks indicating the corners of the cropped area appear on the
image at the new location.
Note: If Images in images table is selected, this cropping definition applies to all
images in the Images Table.
Note: The small crop marks appear on the image as long as Apply is selected. The
cropping definition will apply to any print or export action. To remove the small
crop marks and print or export the full image, click Apply again to toggle off.
C-DiGit User Manual 4-44
Page 77
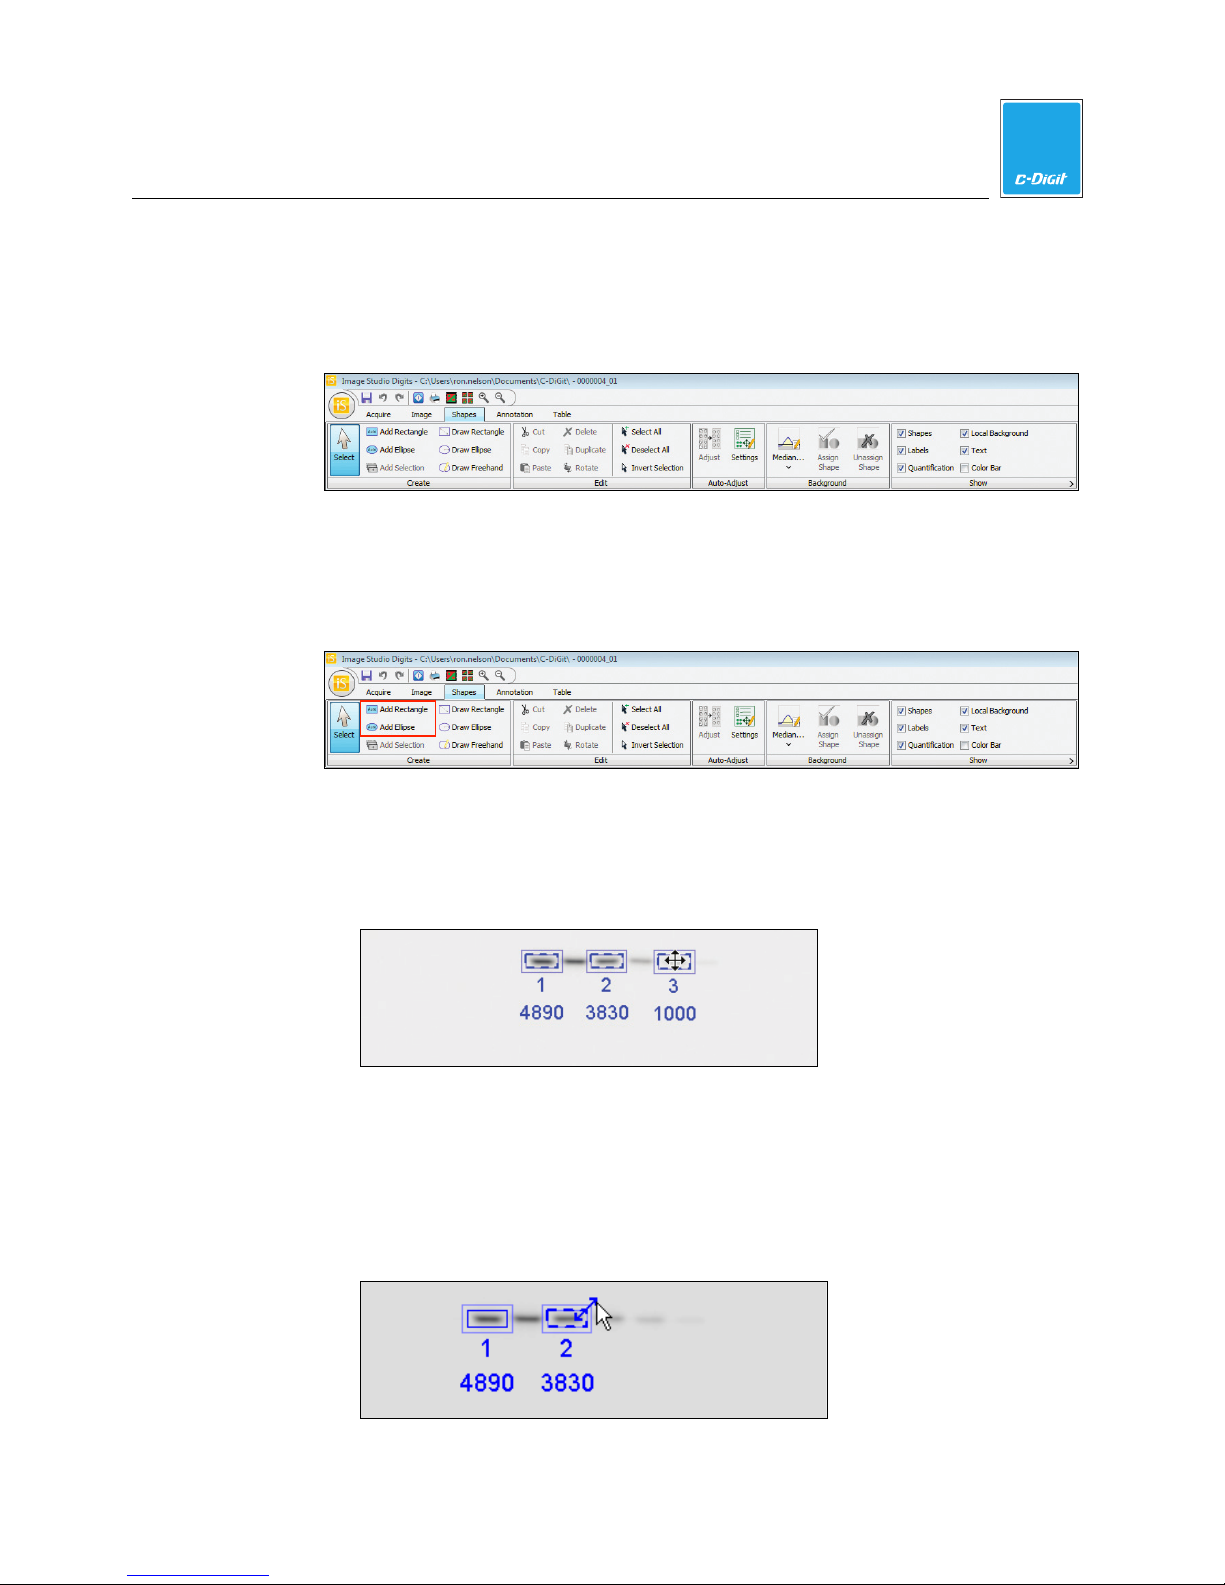
Image Studio Software
Data Analysis (Shapes and Annotation Ribbons)
Add and Manipulate Shapes Manually
1. Click the Shapes tab to open the Shapes ribbon.
2. Click Add Rectangle to add a rectangle to the image or Add Ellipse to add an
ellipse. Click in the center of a feature to place the rectangle or ellipse around
it. After adding the desired shapes, click Select or press the Esc key on your
keyboard to return the cursor to the selection tool.
4
3. To move or resize a shape, select the shape by clicking on it once. Dotted lines
indicate the shape is selected.
a. To move the shape, drag the four-pointed cursor within the selection shape.
b. To resize the shape, hover over any corner or side of the shape. Drag the
double-sided arrow to resize.
Note: To activate the double-sided arrow, the cursor must be on the
selection tool (click Select in the Shapes group or press the Esc key on the
keyboard).
C-DiGit User Manual 4-45
Page 78
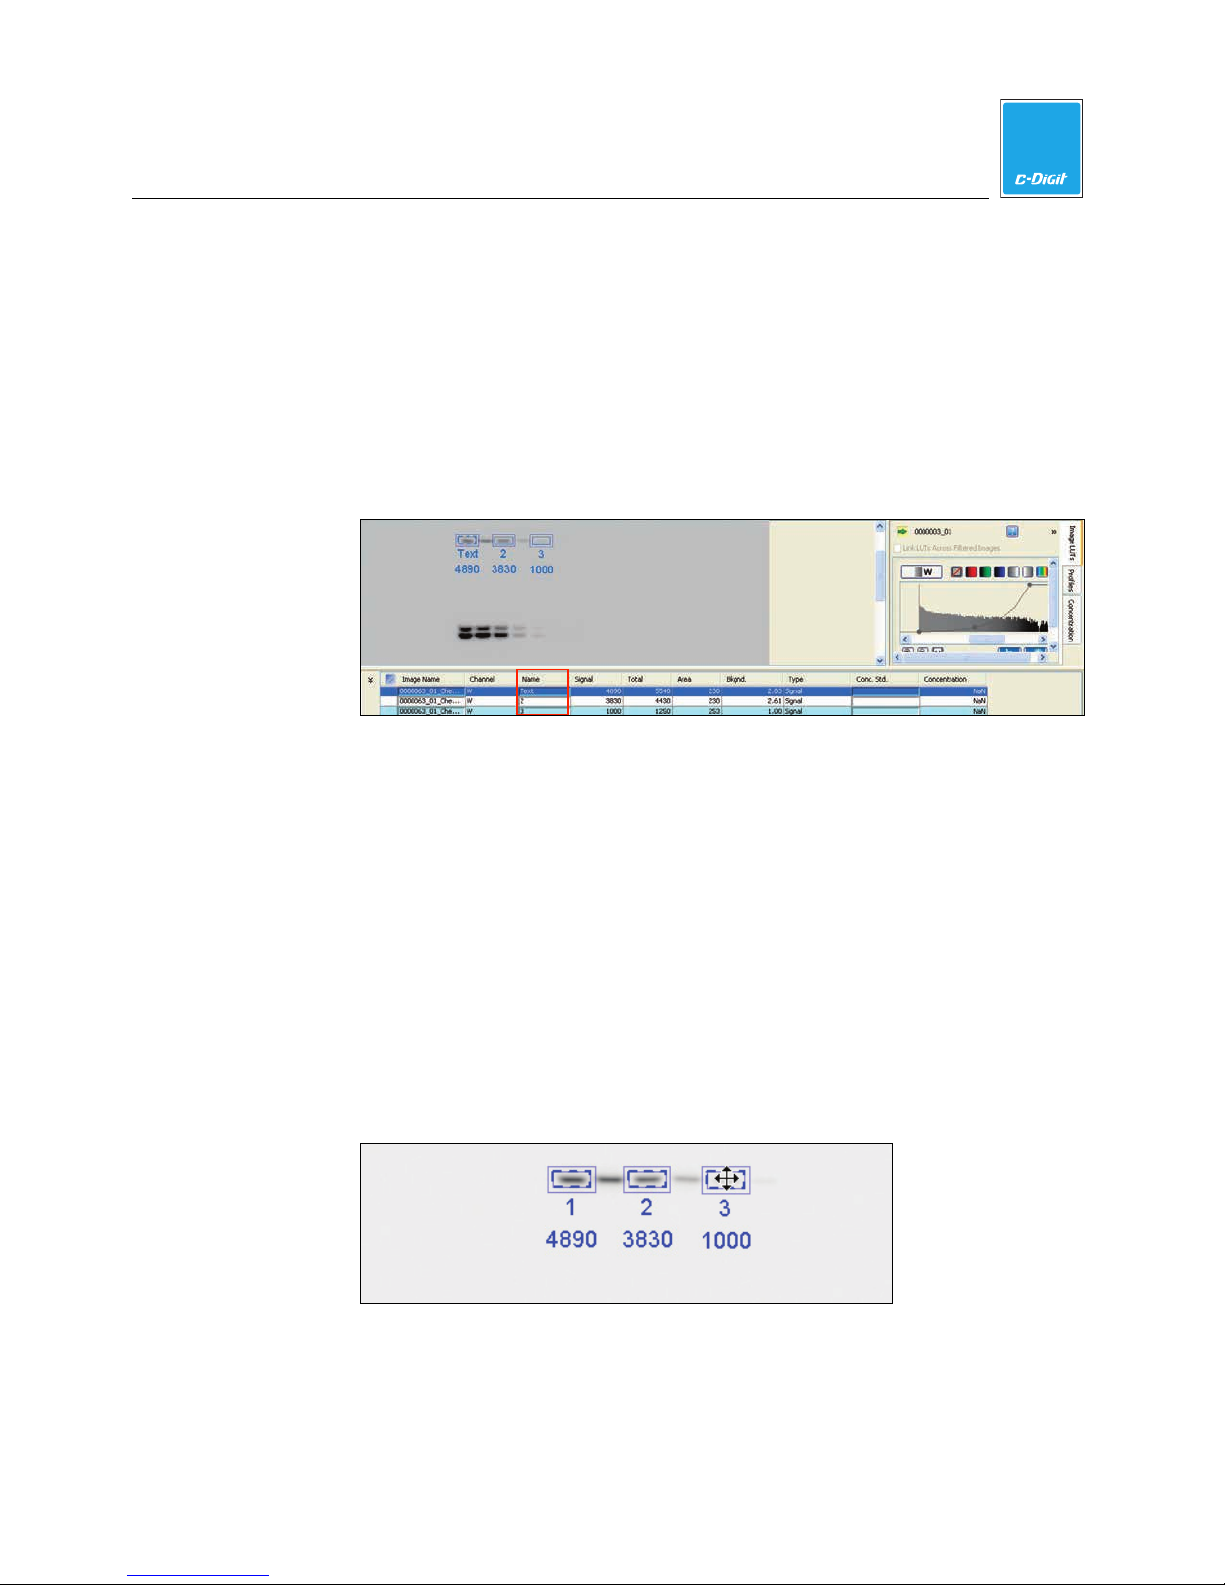
Image Studio Software
c. To view the shapes and labels on the image, enable the Shapes and Labels
check boxes in the Show group. Disable the check marks to remove the
shapes and labels from the image.
d. To edit the label, click the Shapes tab at the bottom of the screen to view
the Shapes Table. Under the Name column, double-click on the cell for the
selected shape and edit the text. Press Enter, and the new text will appear
on the image. To change the location of the label, click the small arrow on
the Show group to open the Image View Labels menu.
4
Note: You must press Enter or click on another cell in the Table to save the change
to the Table cell before saving the acquisition.
Note: Select Draw Rectangle, Draw Ellipse, or Draw Freehand to manually draw
shapes. Drag the mouse to create the shape. The resulting shape can be moved or
resized in the same way that an auto shape is moved or resized.
4. To quickly add shapes, use the Add Selection tool.
a. Drag a rectangle around the shapes to select them. Dotted lines indicate the
shapes are selected.
b. Click Add Selection in the Create group.
c. Click the image to add the shapes to the image.
d. To move the shapes, drag the four-pointed cursor that appears within either
shape. The selected shapes move together.
Note: You can also rotate shapes by selecting them, pressing the Ctrl key, and
scrolling with the mouse, or by clicking the Rotate button in the Edit group of the
Shapes tab.
C-DiGit User Manual 4-46
Page 79
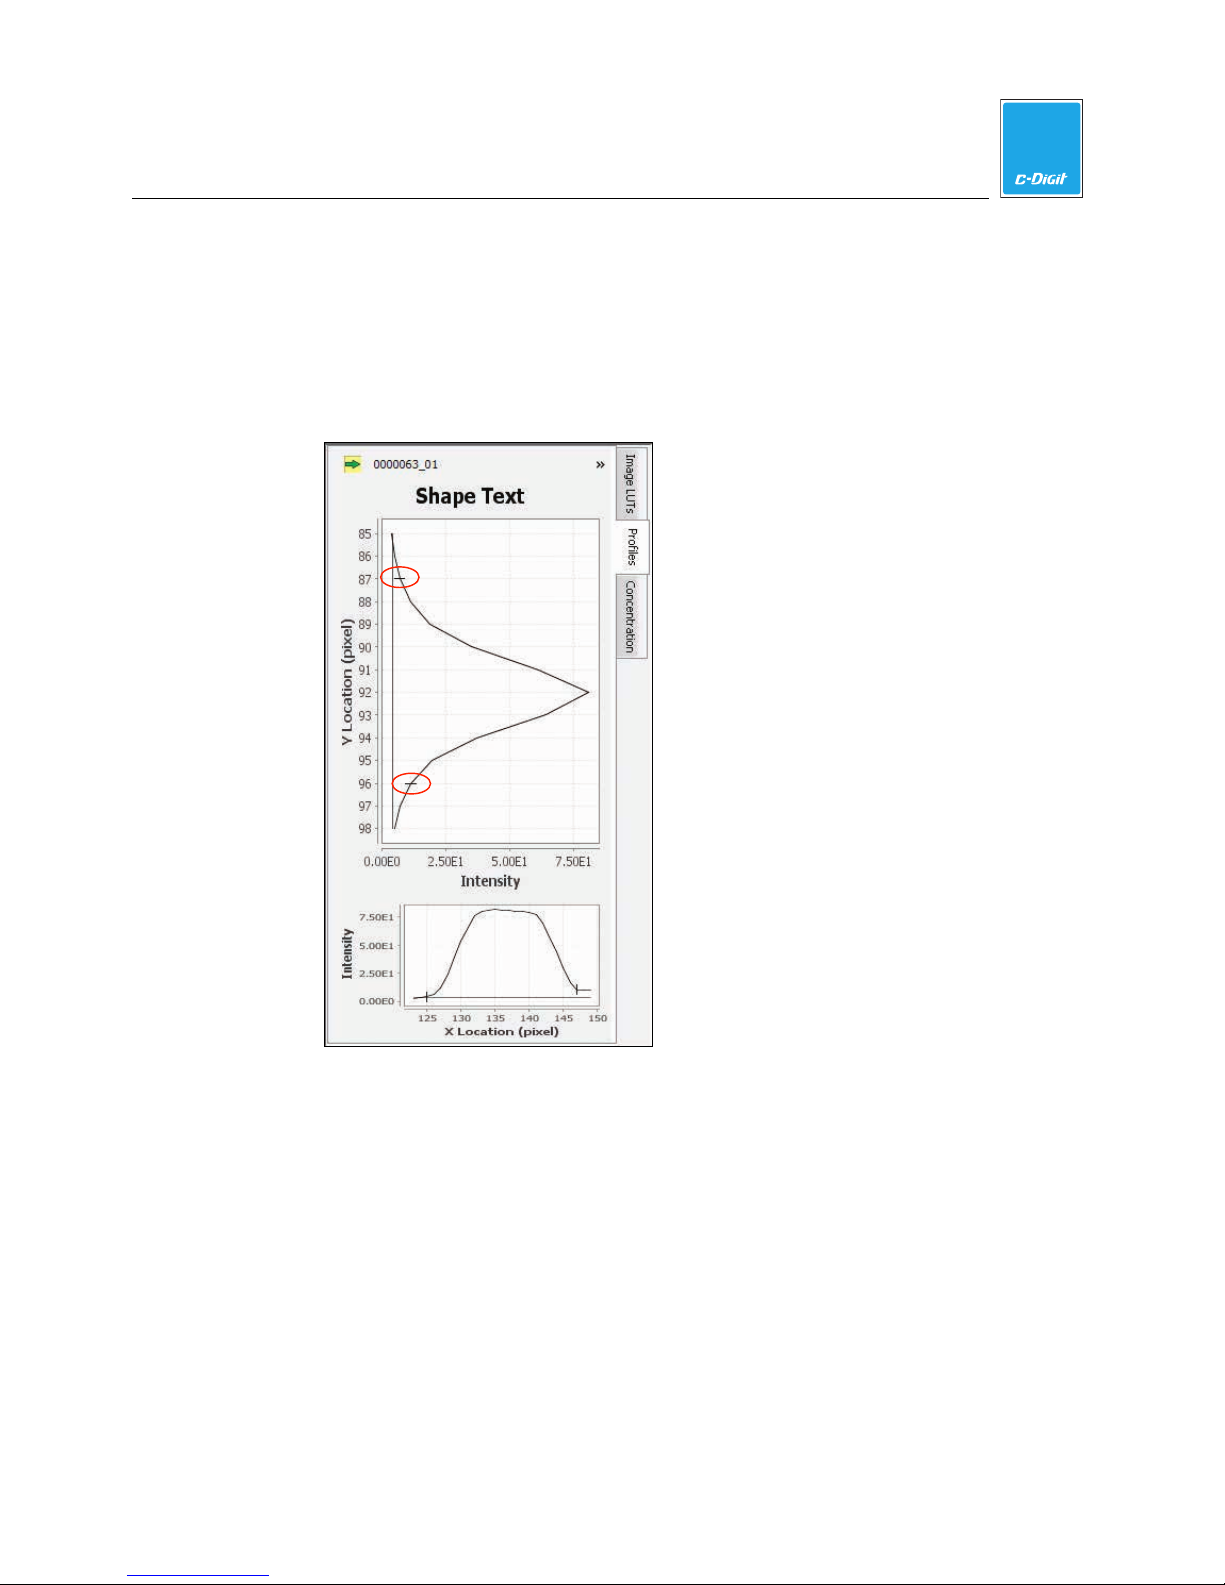
4
Image Studio Software
Profiles Tab
1. After creating at least one shape on an image, select a shape with the selection
arrow until it changes to a dashed line.
2. On the right side of the screen, click the Profiles tab to view two graphs of the
pixels within a selected shape. The top graph is a cross section of the pixel
intensities from top to bottom. The bottom graph is a cross section of the pixel
intensities from left to right.
3. Adjust the size of the selected shape by dragging the arrows on the corners of
the shape. Notice how the graph changes.
Note: The small black marks (circled in red above) indicate the boundaries of the
shape. Move the shape around the band so that the small black marks are close to
the edges of the peak to capture the entire signal for that band.
Auto Adjust
The software moves selected shapes to fully enclose areas of fluorescence near the
shapes.
1. Drag a rectangle around the shapes to select them. Dotted lines indicate the
shapes are selected.
C-DiGit User Manual 4-47
Page 80
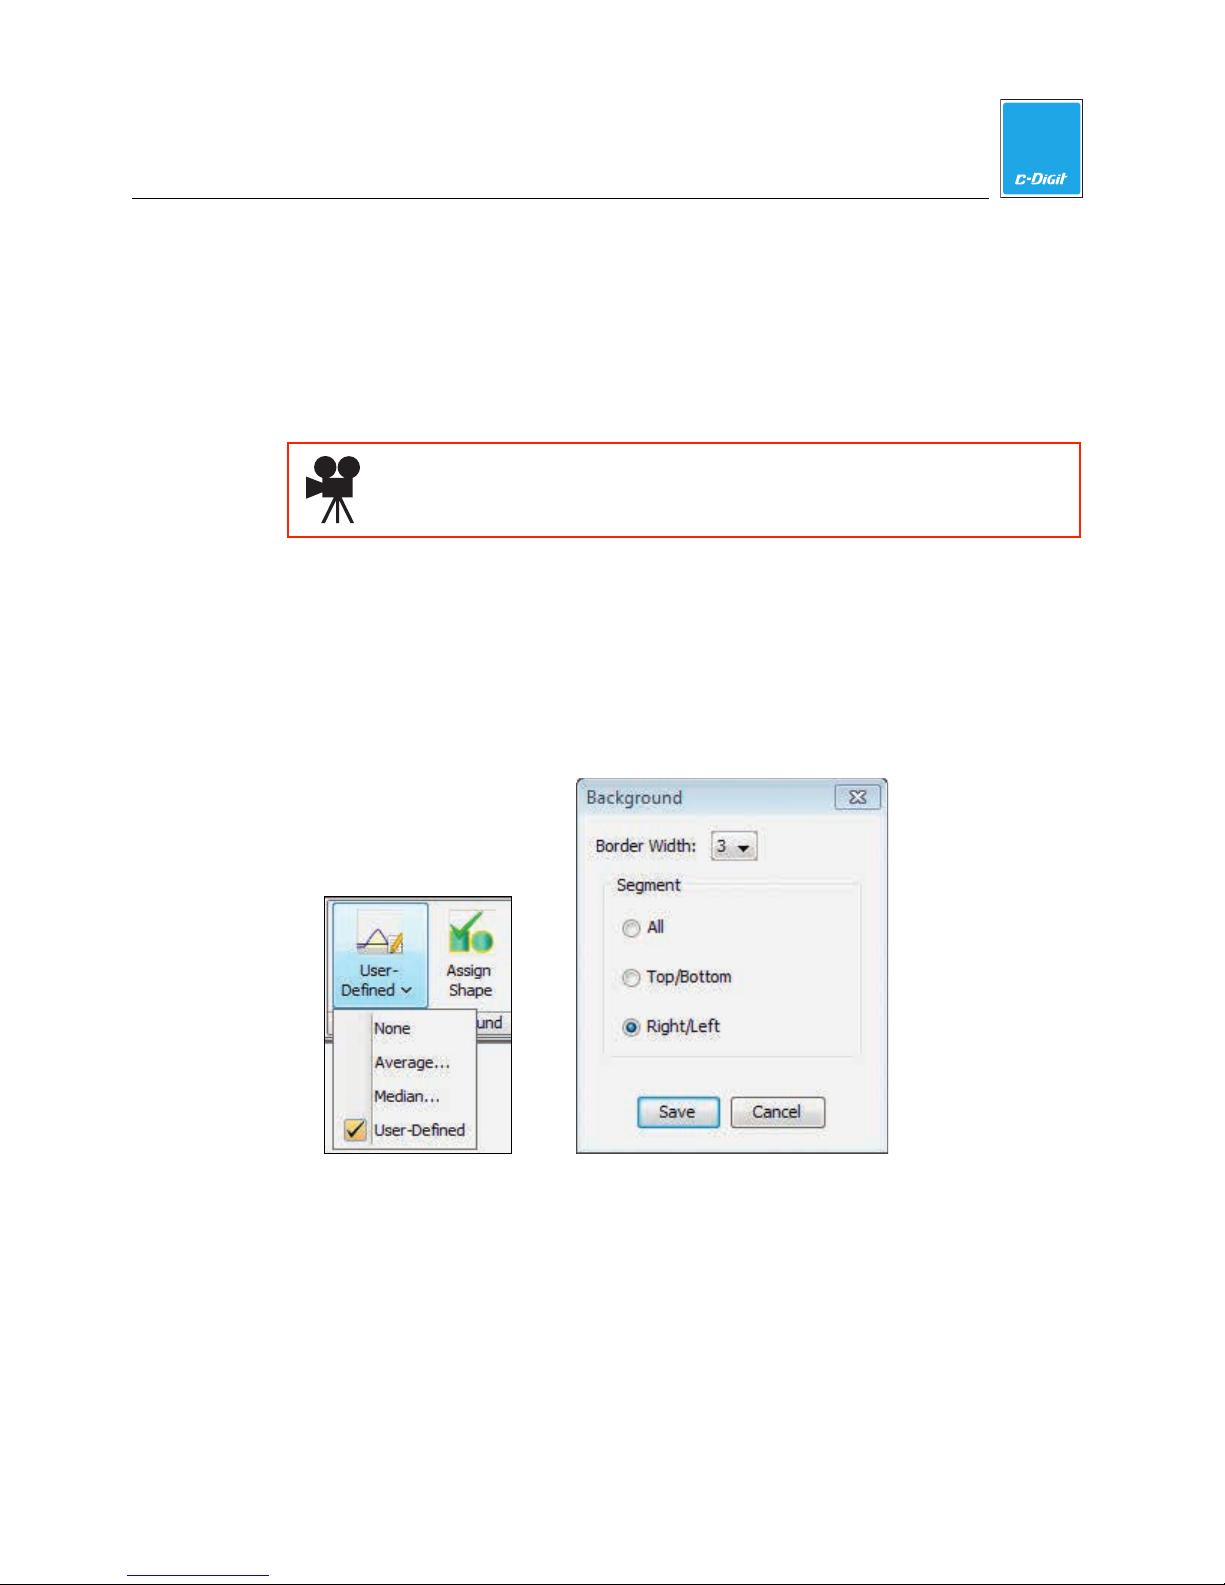
4
Image Studio Software
2. Click Auto Adjust and the shapes will move slightly to better enclose nearby
areas of fluorescence.
Subtract the Background
Subtract the background of the blot or gel from the shapes to obtain consistent
data. The software will not calculate Signal for the shapes if a background method
is not selected.
Click here to watch a video that demonstrates how to set the background
subtraction method.
1. Click the first button in the Background group and select Median from the dropdown menu to subtract the median value of the pixels in the background
segment. This method is useful if the pixel intensities in the background
segment are not uniform.
Note: Select Average for the Background Method to subtract the average value
of the pixels in the background segment.
2. In the Background dialog set the Border Width to 3 and select Right/Left to
select the segments on the left and right sides of the shape.
3. Click Save.
Note: The black line under the curves in the Profiles window delineates the
background that will be subtracted.
Subtract a User-Defined Background
A region of the image can be chosen for the background.
C-DiGit User Manual 4-48
Page 81
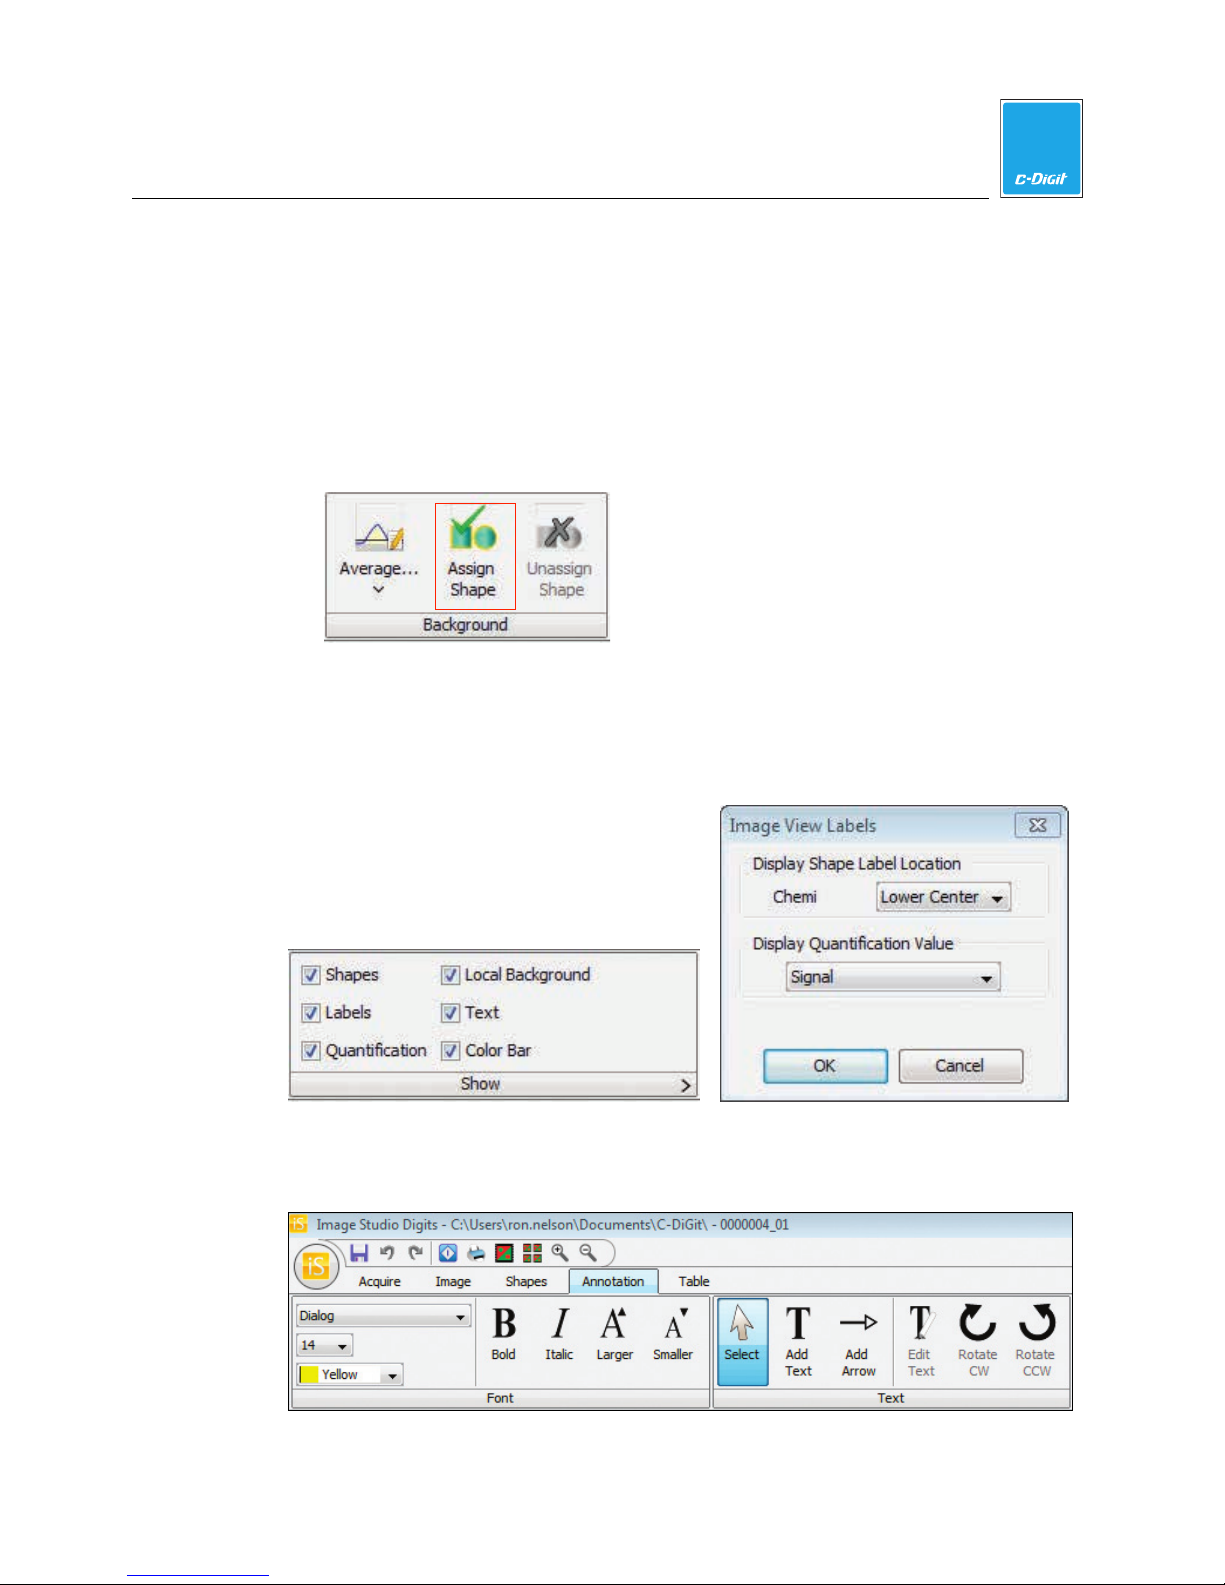
4
Image Studio Software
1. Click the first button in the Background group and select User-Defined from the
drop-down menu.
2. Using what you’ve learned from Add and Manipulate Shapes Manually in this
section, place a shape on the image in the region that you have chosen as the
background.
3. Select the shape by clicking on it with the selection arrow until the shape
outline toggles to a dashed line.
4. Click Assign Shape in the Background group.
Show
In the Show group, enable all check boxes, indicating all items will appear on the
image. To specify the location of the labels, click on the arrow at bottom right to
open the Image View Labels menu.
Annotate the Image
Click the Annotation tab to open the Annotation ribbon.
C-DiGit User Manual 4-49
Page 82
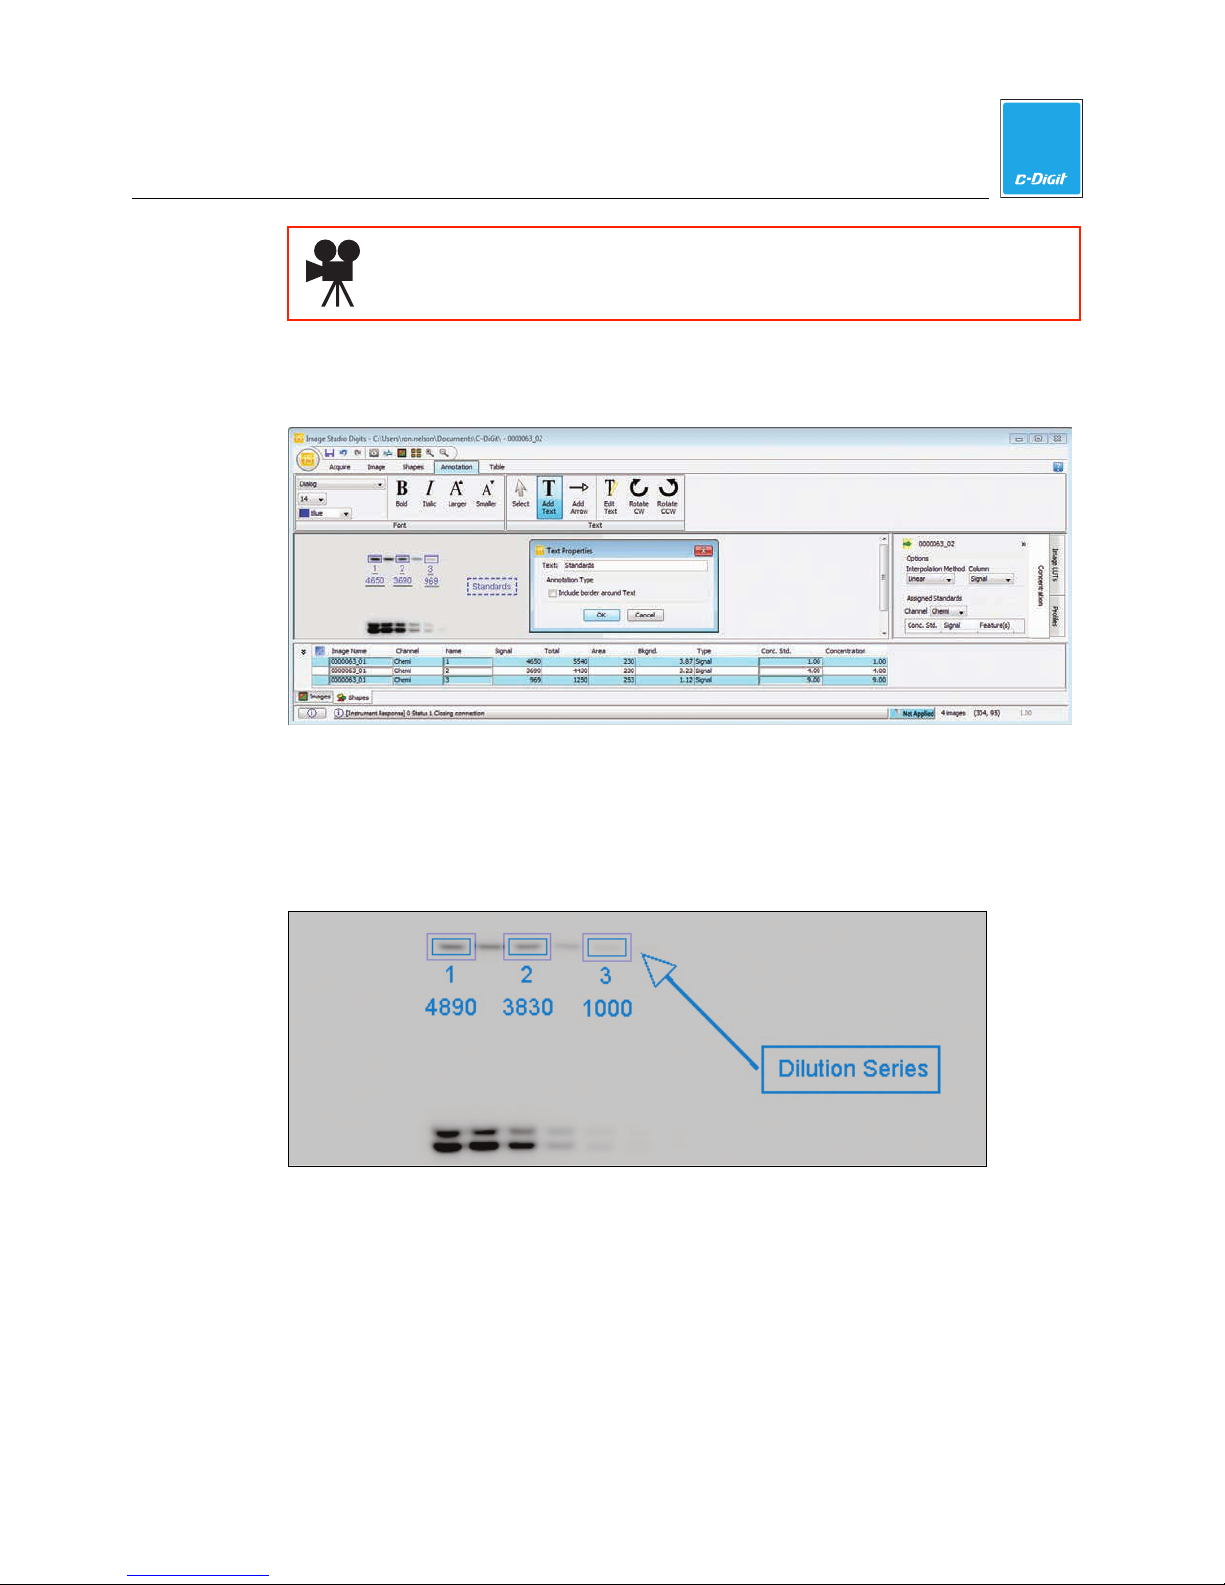
4
Image Studio Software
Click here to watch a video that demonstrates how to annotate images.
Click Add Text in the Text group and then click on the image. Type the desired text
in the Text: box. Click OK to add the text to the image.
Click Add Arrow and click on the image to add an arrow to the image. Click Select
or press the Esc key on the keyboard to toggle the cursor back to the selection tool.
Click the text or arrow that was added to the image with the selection tool. A
dashed box appears around the text or arrow. Use the tools in the Font group to
change the appearance of the text or arrow.
Click Rotate CW or Rotate CCW in the Text group to rotate the text or arrow. Click
Edit in the Text group to view the Text Properties menu for the selected item. Insert
different text or add a border to the text with this menu. If the selected item is an
arrow, click and drag the sides of the dashed box to change the size of the arrow.
C-DiGit User Manual 4-50
Page 83
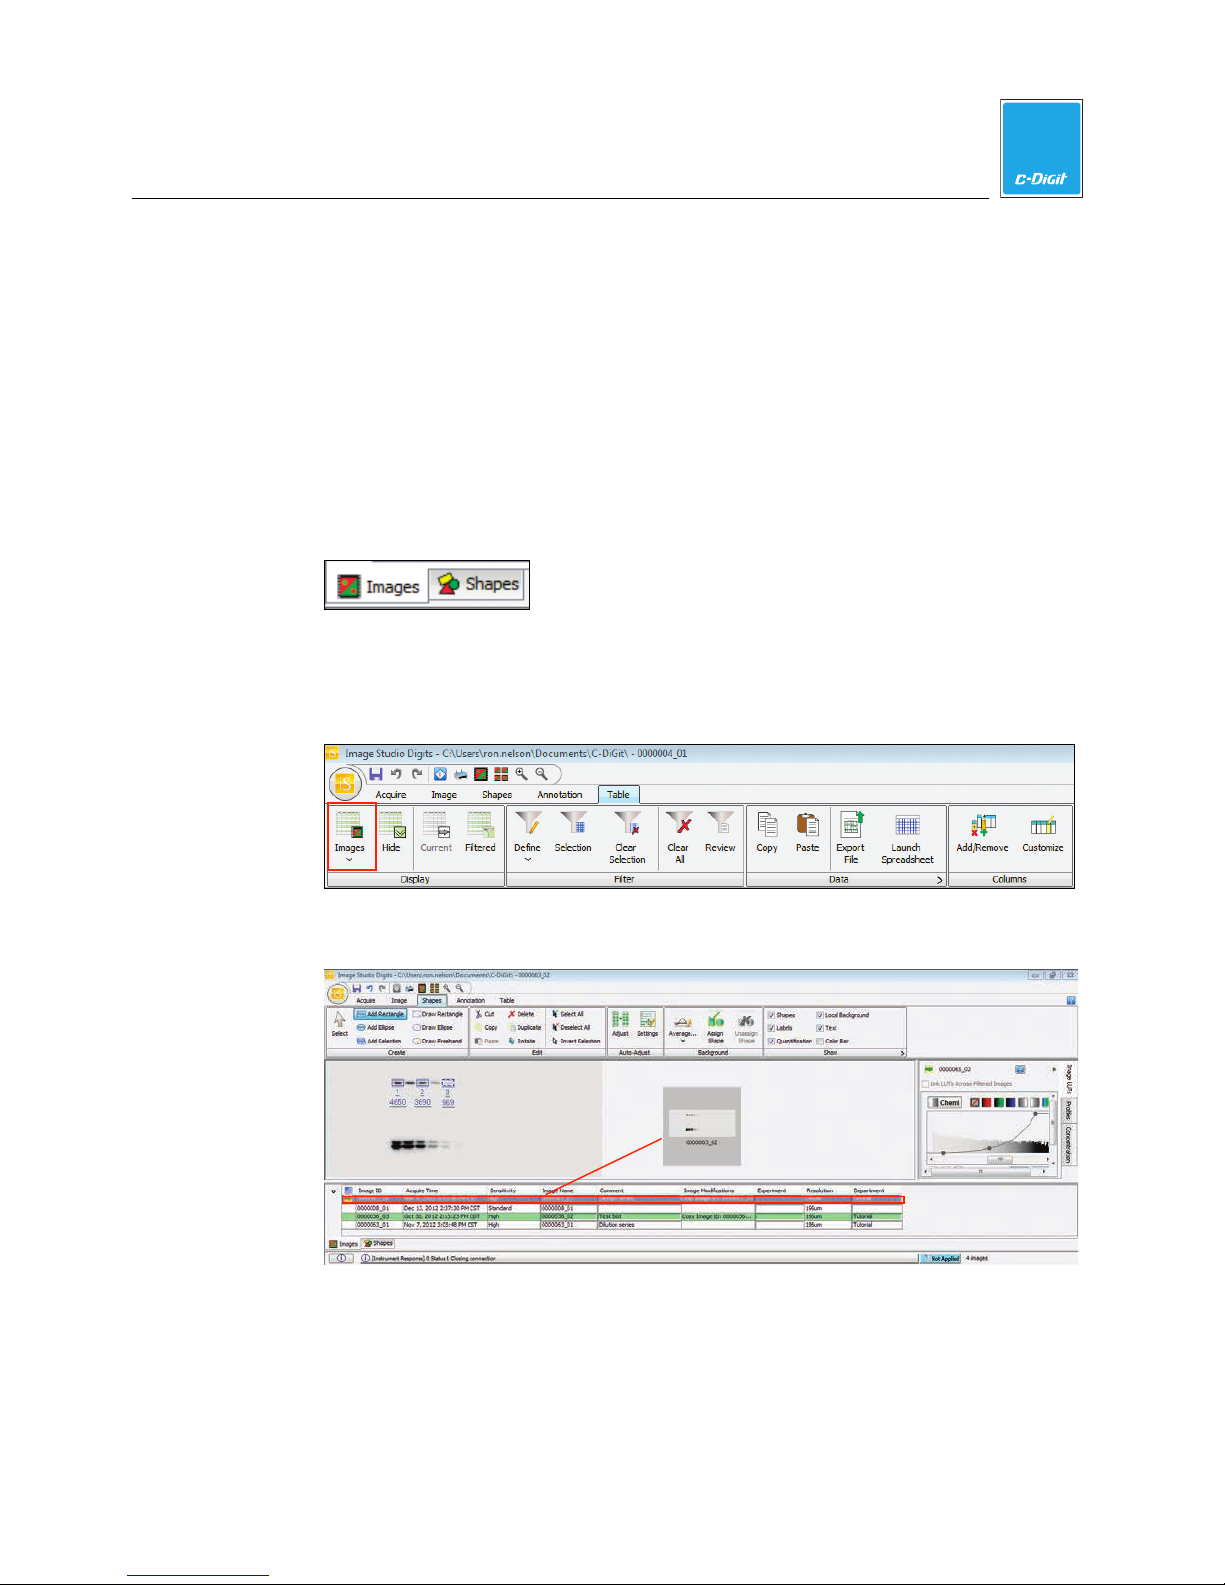
Tables and Table Ribbon
Image data are stored in the folder selected as the Work Area when Image Studio is
opened. The data are easily accessed in the Tables at the bottom of the main
window. In the Images Table, each row represents one image. Various fields in that
row contain identifying information about the image. These fields are grouped as
columns that can be moved, added, deleted, sorted, or filtered.
Images Table
1. Click the Images tab at the bottom of the main window to display the Images
Table. Click the double arrow to hide the Table from view.
Alternatively, click Table to open the Table ribbon and select Images from the
drop-down menu on the first button in the Display group. Click Hide to hide
the Table from view.
4
Image Studio Software
2. Mouse over any row to display a thumbnail of that image.
3. Click any cell to select the entire row and display that image in the window.
4. Click the corner button to select all of the images or press Ctrl+A on the
keyboard.
5. Right-click any cell to view a menu with options that include copy an image,
delete images, or view the properties of an image.
C-DiGit User Manual 4-51
Page 84
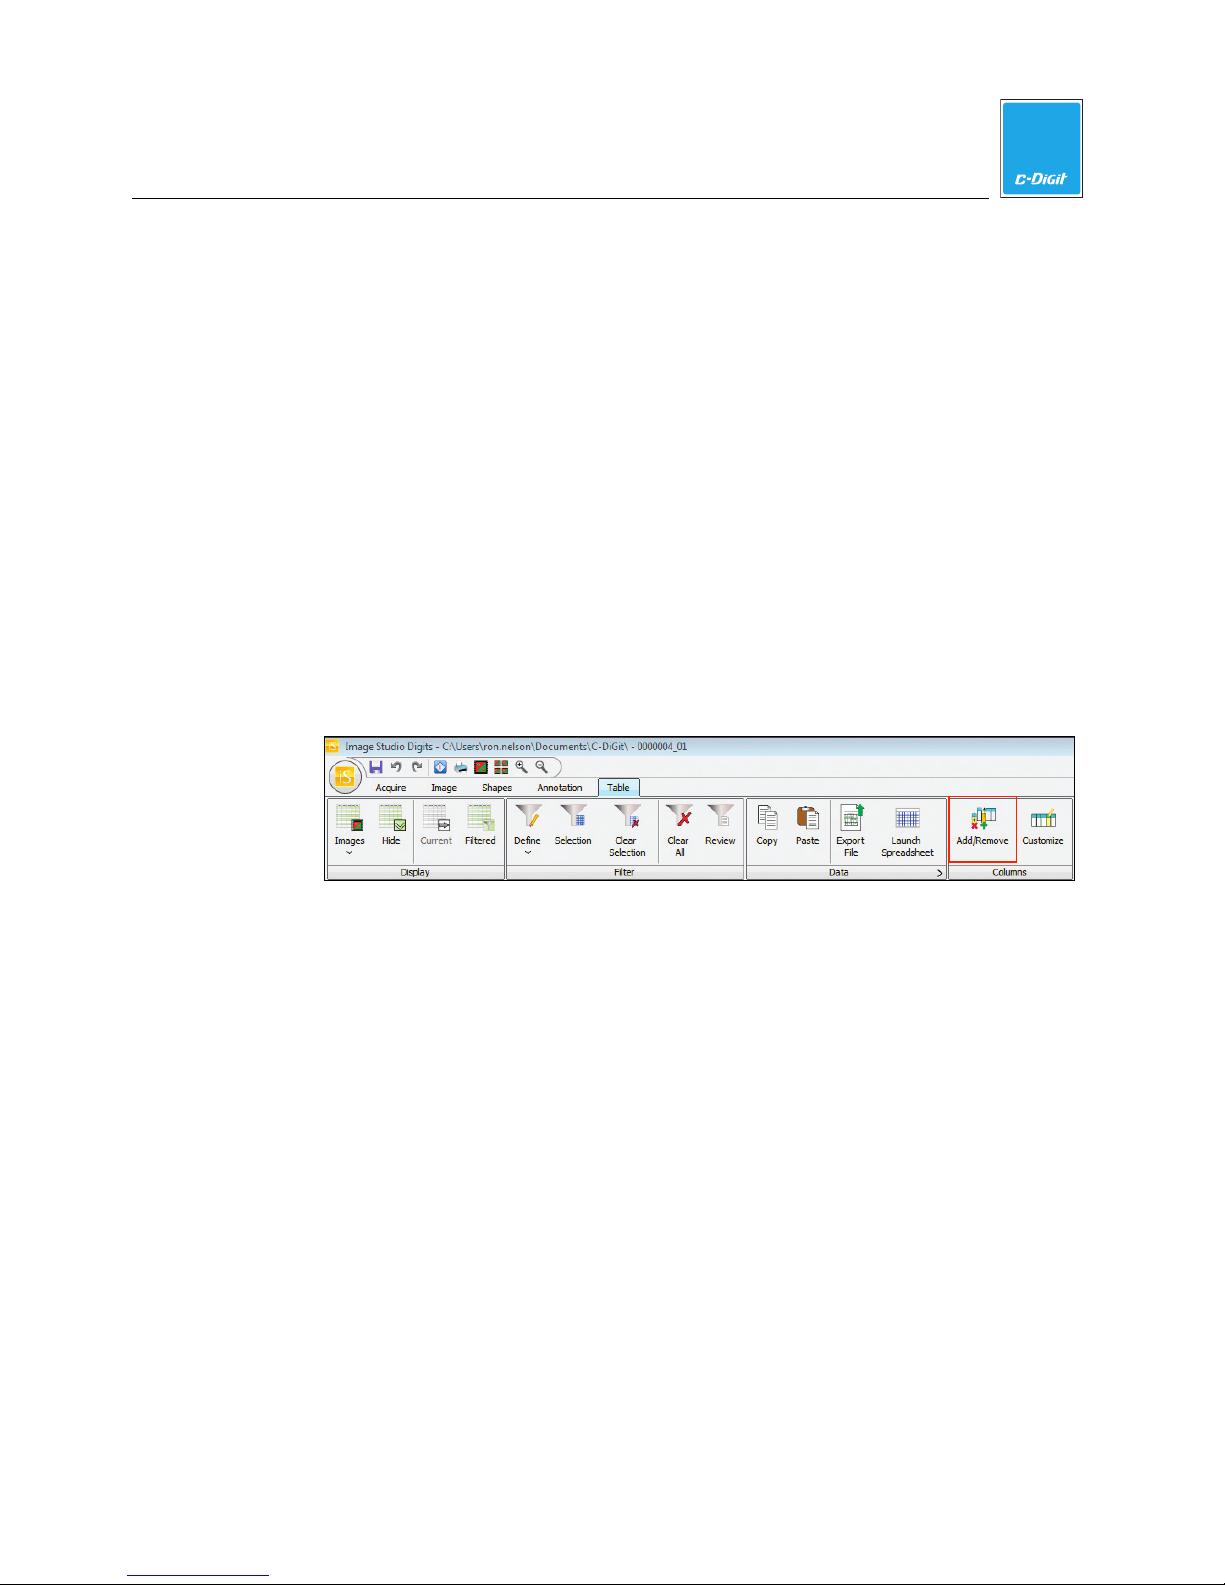
4
Image Studio Software
6. To move a column, drag the column header to the new location.
The fields in each row contain information about the image and are organized as
columns across all of the images. Some of the columns are properties of the image
and cannot be edited. Examples of these columns include Image ID, Acquire Time,
Channels, Resolution, and Instrument Name. Other columns can be edited with
information for that image.
7. To edit a field, double-click on the cell so that a cursor appears. If a cursor does
not appear, that field cannot be edited.
8. Add text where the cursor appears. Press Enter when complete.
Note: To easily find images later, enter identifying information in one or more
fields after acquiring an image.
Add or Delete a Column
1. Click the Table tab to view the Table ribbon.
2. Click Add/Remove in the Columns group.
3. To add an Experiment column, for example, enable the check box, indicating
that column will appear in the table.
4. To remove the Resolution column, for example, disable the check box and
remove that column from the table.
C-DiGit User Manual 4-52
Page 85
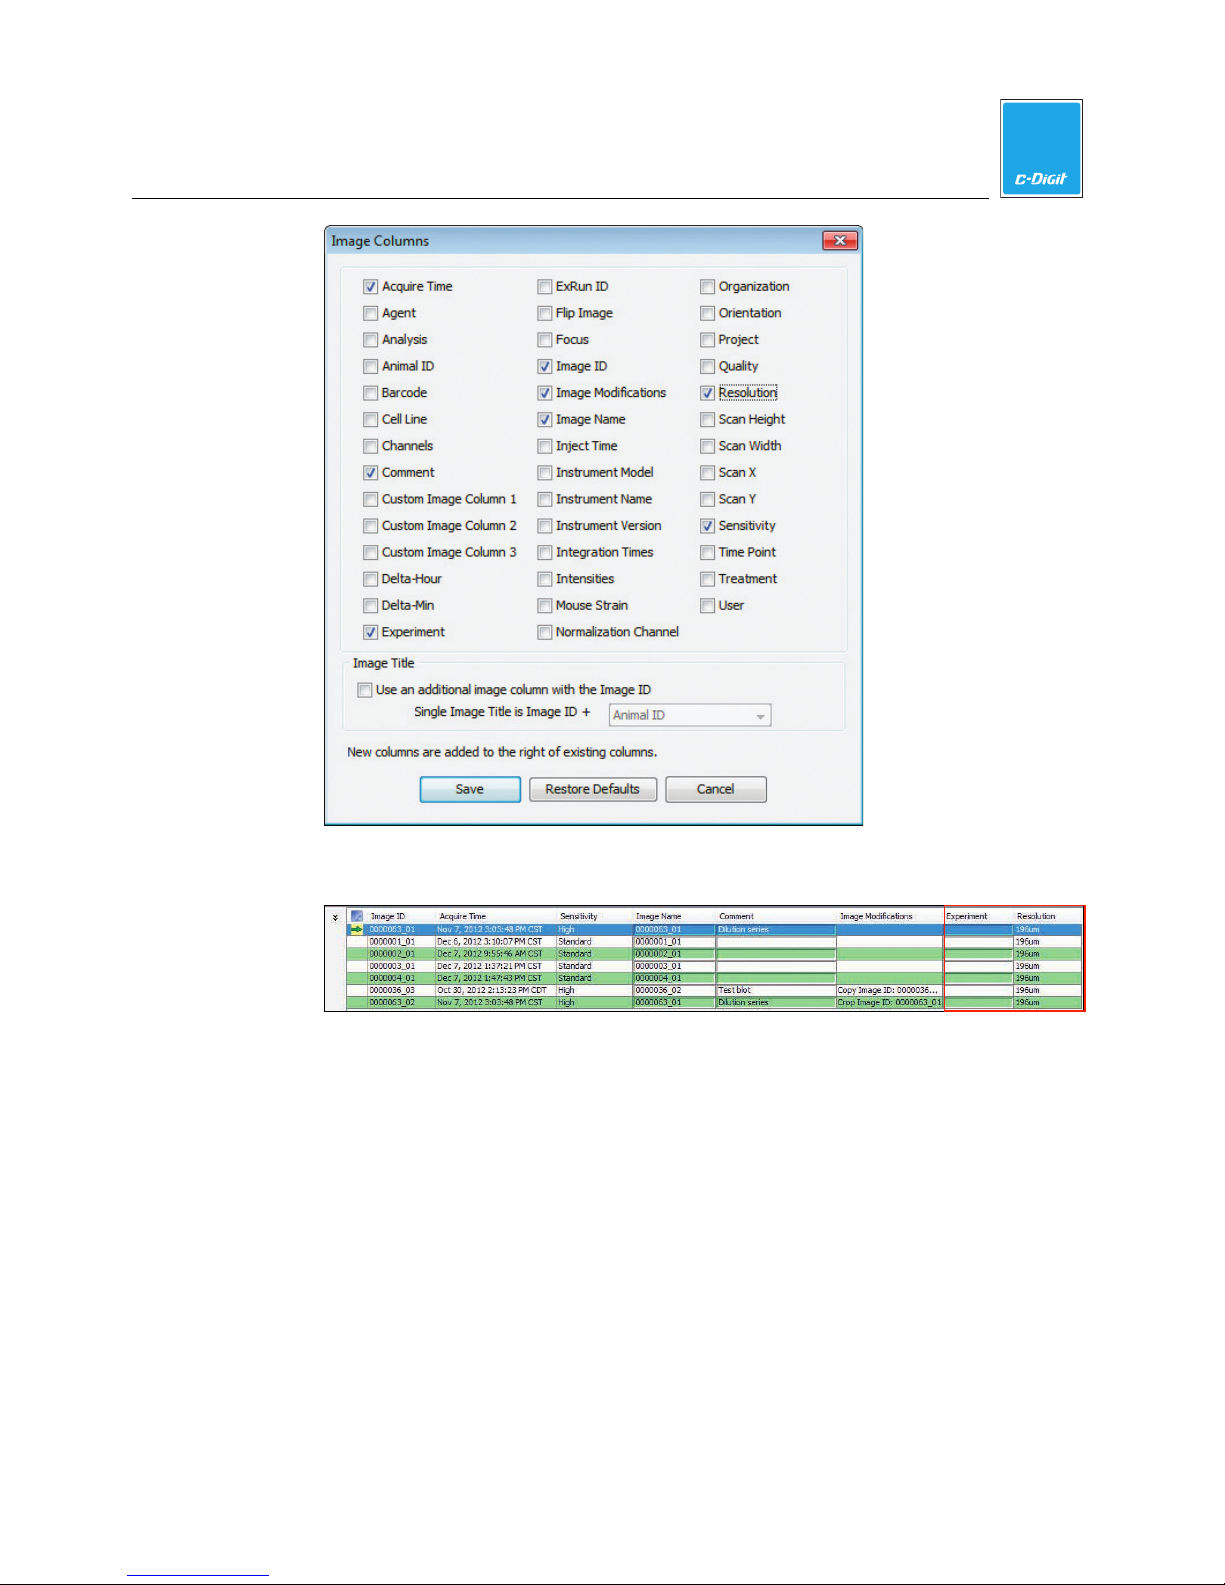
4
Image Studio Software
5. Click Save. The table with the added columns now appears as shown below.
Edit the Image Title
1. Click the Table tab to view the Table ribbon.
2. Click Add/Remove in the Columns group.
3. Click Use an additional image column with the Image ID to enable the check
box.
C-DiGit User Manual 4-53
Page 86
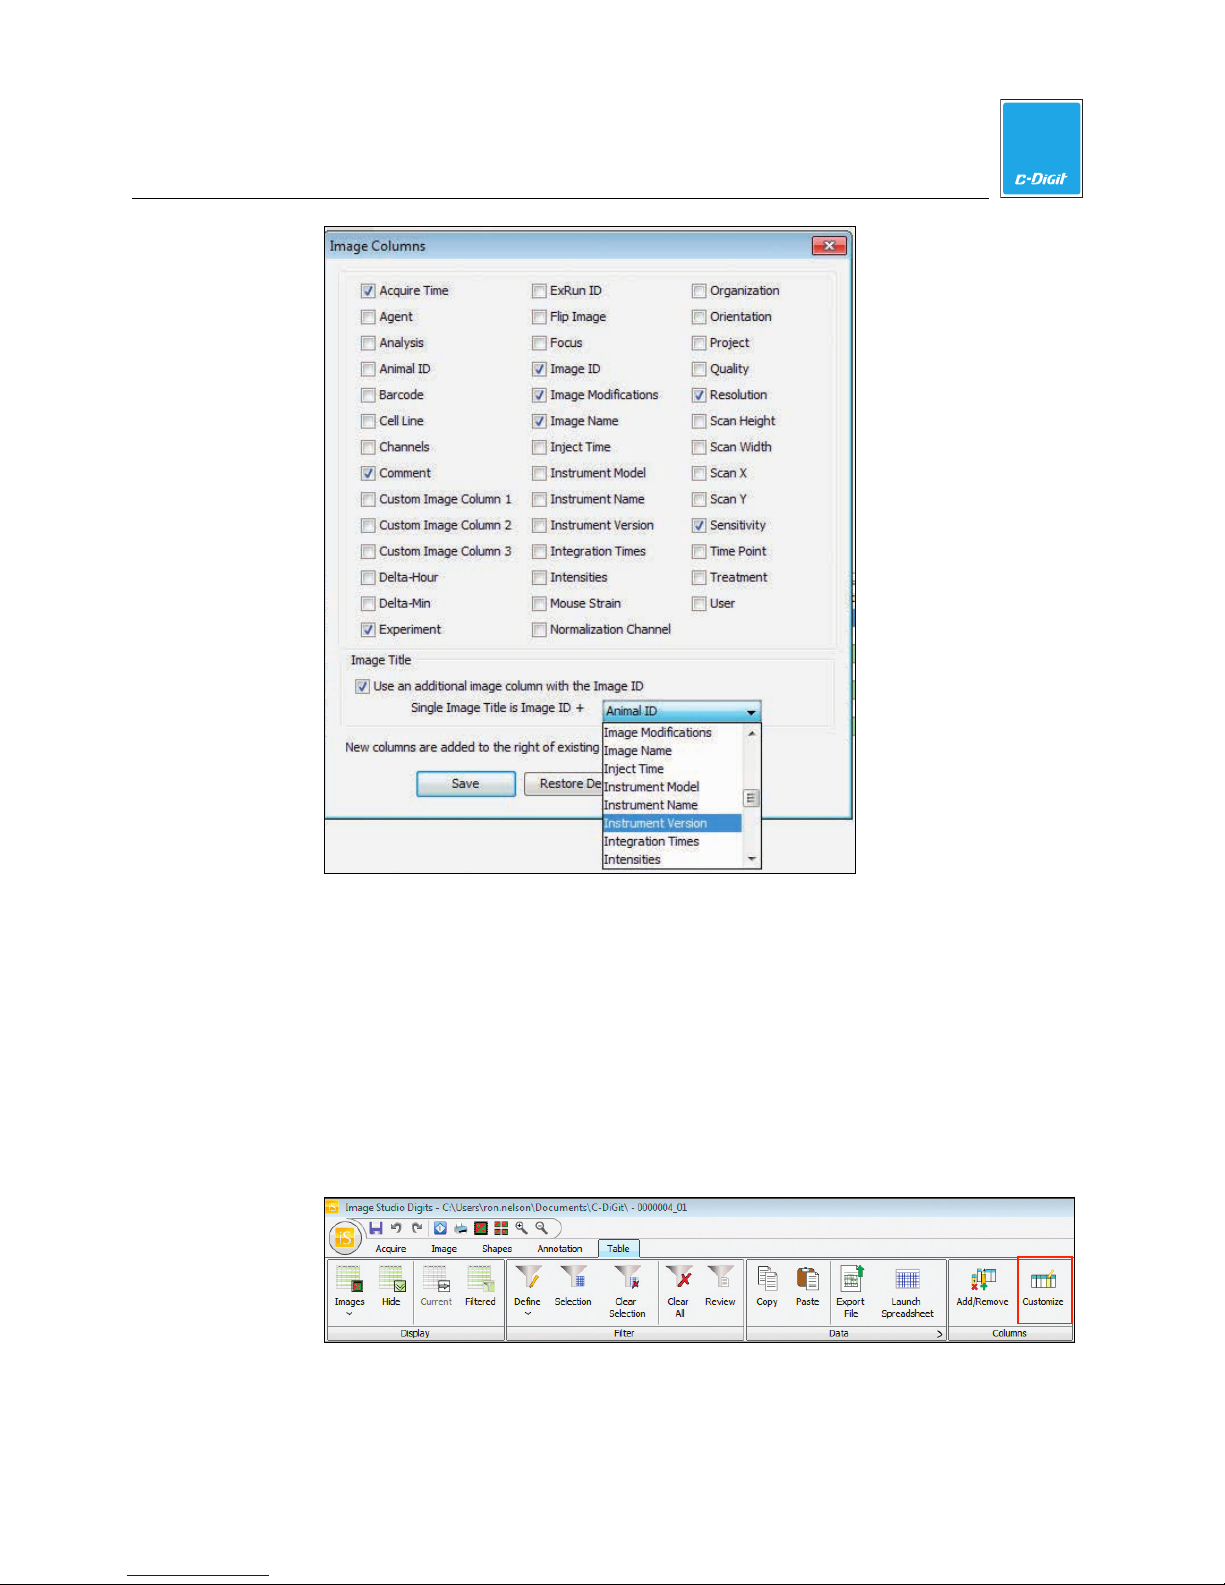
4
Image Studio Software
4. Click the down arrow in the selection box to choose a column to add to the
Image ID to form the Image Title.
5. Click Project. Text in the Project column will be added to the title of every
Image.
6. Click Save.
Add Custom Columns
1. Click the Table tab to view the Table ribbon.
2. Click the Customize icon in the Columns group to view the Custom Columns
menu.
3. In the Custom Columns menu, replace Custom Field0 with Department.
C-DiGit User Manual 4-54
Page 87
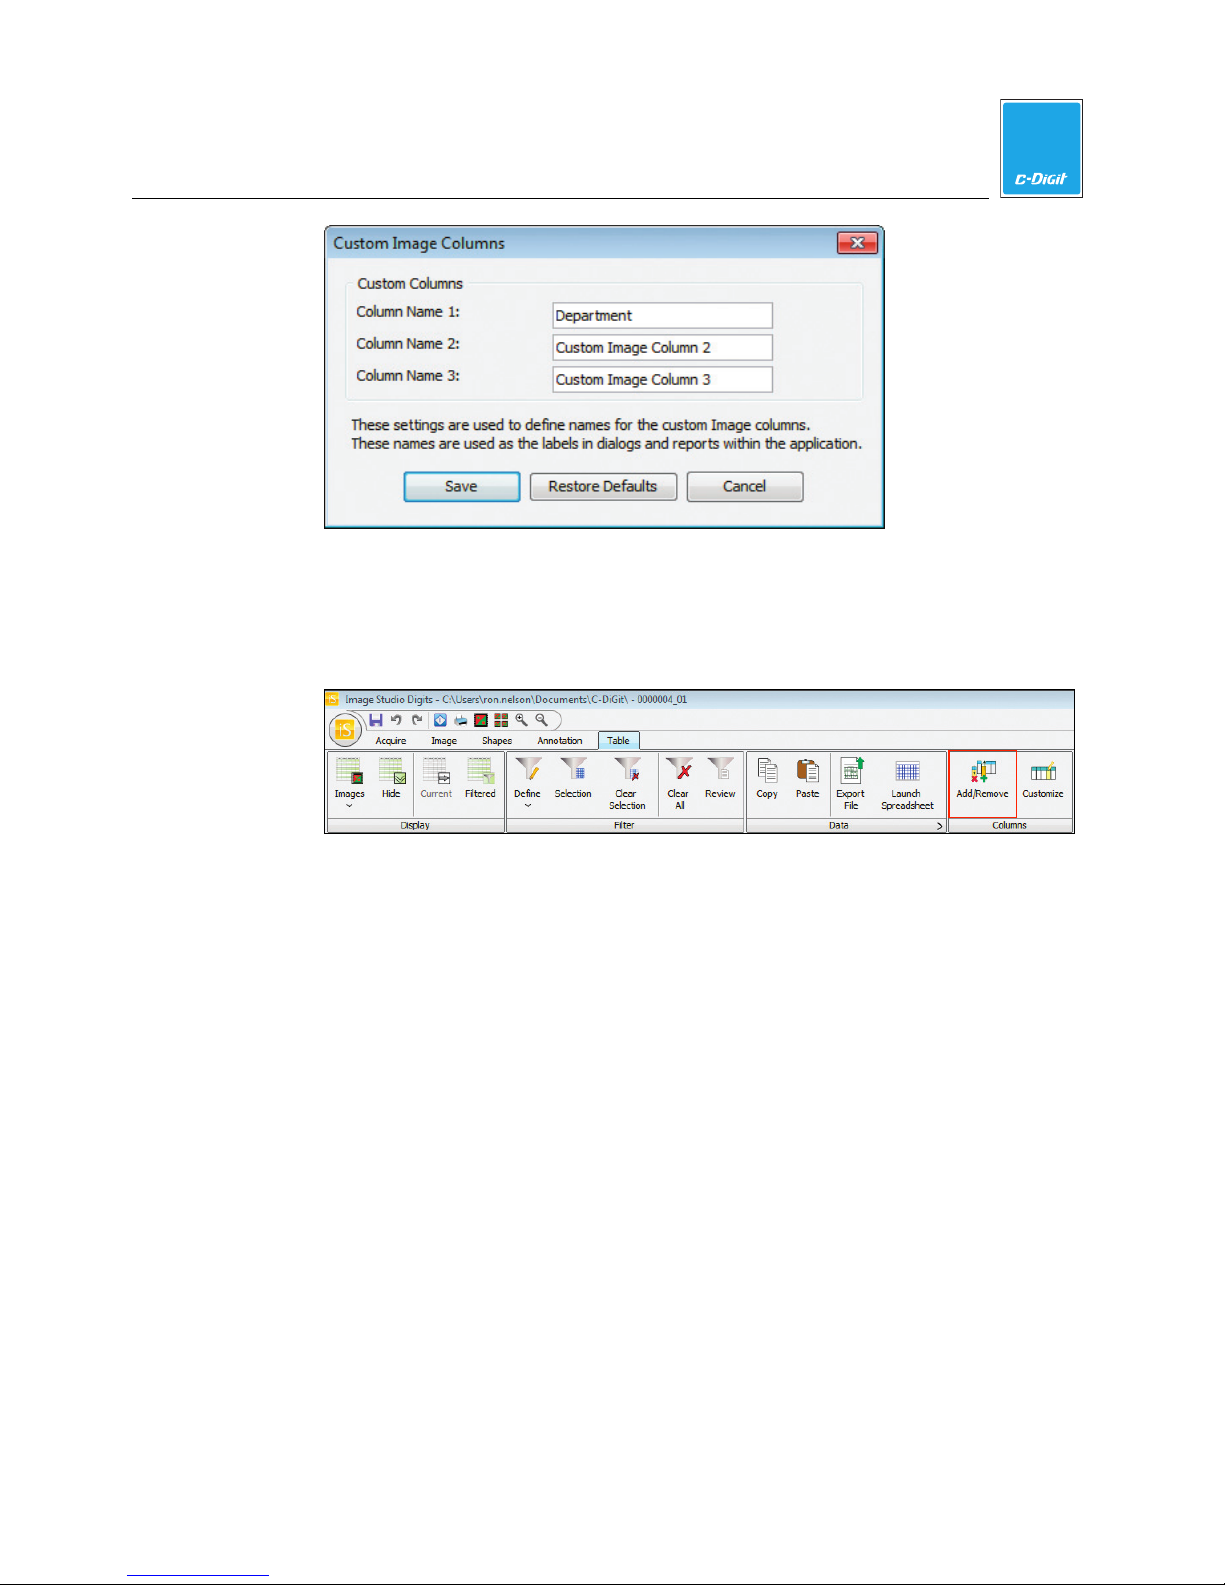
4
Image Studio Software
4. Click Save.
5. To add this custom column to the table, click the Table tab to view the Table
ribbon.
6. Click Add/Remove in the Columns group.
7. To add the Department column, click the column description to enable the
check box.
8. Click Save. The Department column will be added to the right of the existing
columns.
Paste Data in a Column
Use Paste in the Data group to quickly fill a column with information.
1. Double-click the first cell in the Department column so that a cursor appears in
the cell.
2. Type ‘Tutorial’ at the cursor position using the keyboard.
3. Drag the mouse over ‘Tutorial’ to highlight it. The cursor should still appear in
the cell.
4. Press Ctrl+C on the keyboard to copy the data to the clipboard.
5. Drag the mouse over the cells in the Department column (or press the Ctrl key
while clicking each cell once) to select which cells to fill with ‘Tutorial’.
6. Click Paste in the Data group, press Ctrl+V on the keyboard, or use the right-
click menu to paste the data in the selected cells.
C-DiGit User Manual 4-55
Page 88
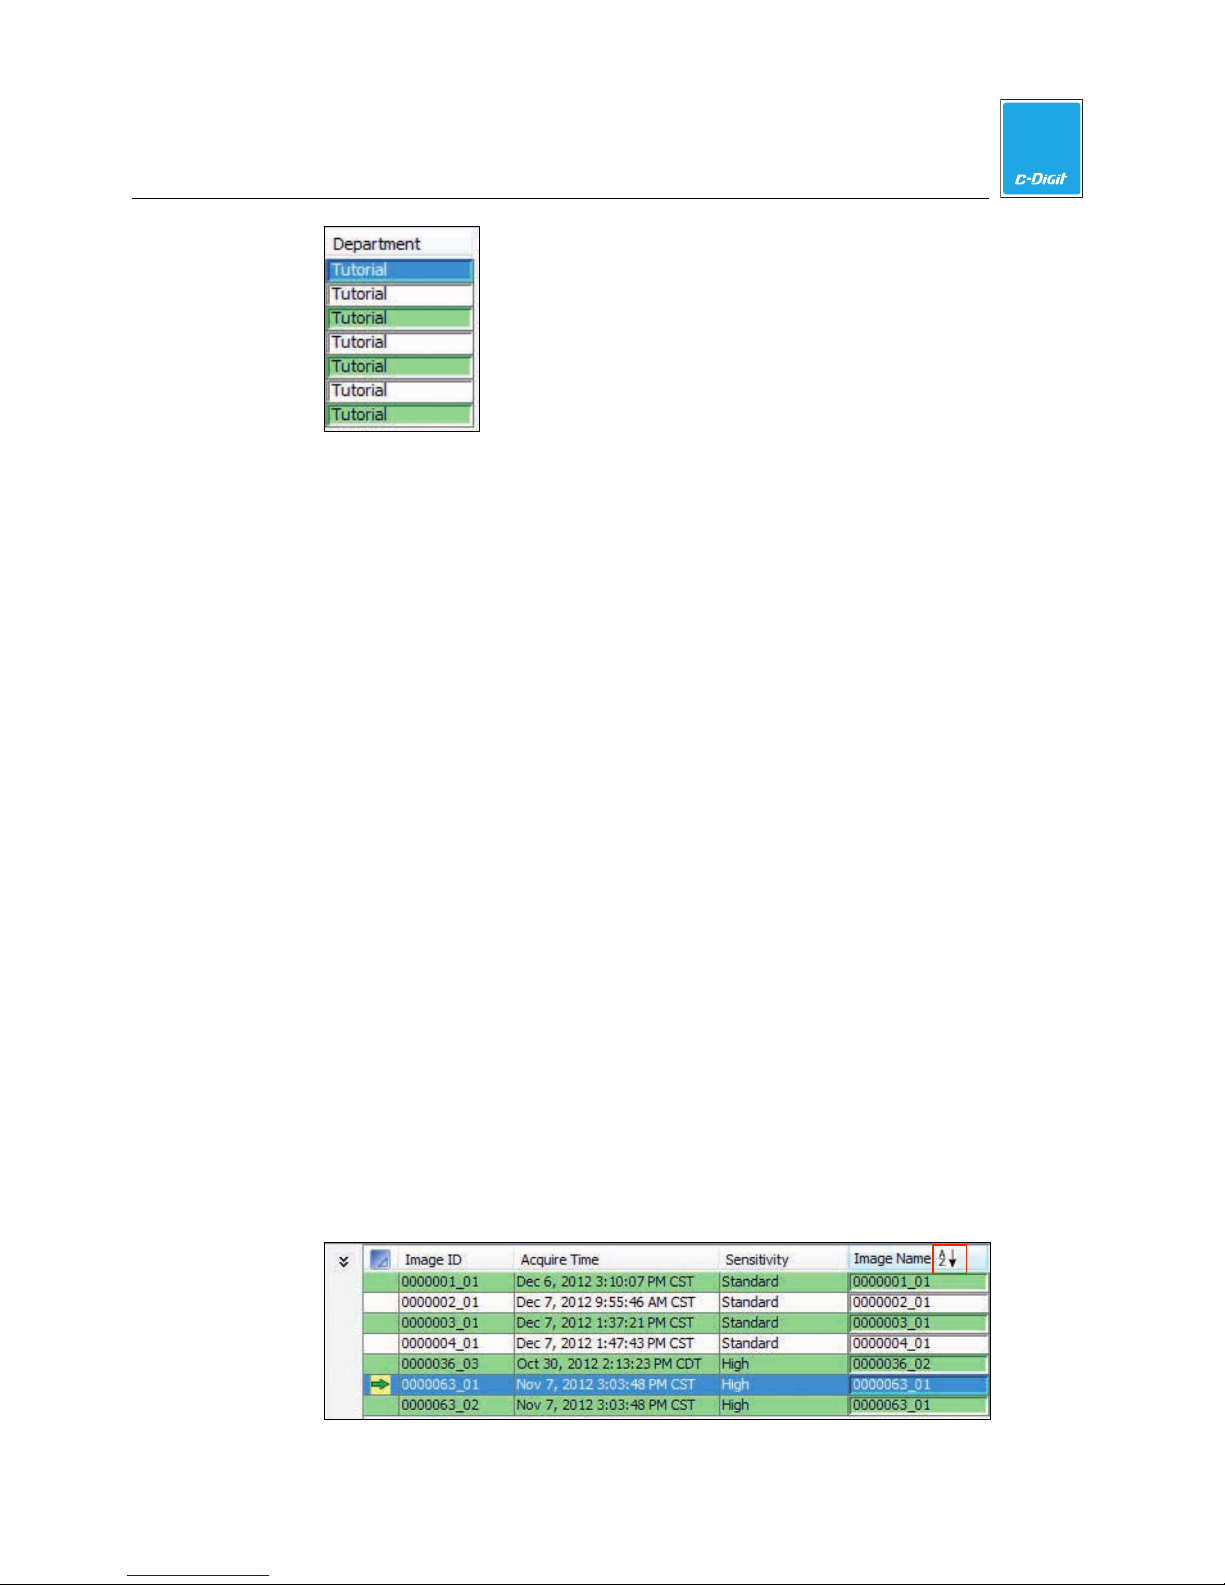
4
Image Studio Software
Paste Data from a Spreadsheet to a Column
1. In a spreadsheet, select data and press Ctrl+C on the keyboard to copy the data
to the clipboard.
2. In the Table, drag the mouse over the cells in the Department column (or press
the Ctrl key while clicking each cell once) to select which cells in a column to
place the data.
3. Click Paste in the Data group, press Ctrl+V on the keyboard, or use the right-
click menu to paste the data in the selected cells.
Copy Data to a Spreadsheet
Use Copy in the Data group to quickly copy rows to a spreadsheet.
1. Drag the mouse over the rows or press the Ctrl key while clicking on each row
once to select which rows to copy. To copy all rows, press Ctrl+A on the
keyboard.
2. Click Copy in the Data group, press Ctrl+C on the keyboard, or use the right-
click menu to copy the data to the clipboard.
3. In a spreadsheet, press Ctrl+V on the keyboard to paste the data in the selected
cells.
Note: The column headings will be pasted above the data.
Sort by Column
1. To sort by any column, click once on the header. The table will be sorted by
that column. Note: No change will be made if the fields in a column are all the
same.
2. To change the direction of sorting, click the small box in the header with the up
or down arrow. Or, right-click on the header and select Sort Ascending or Sort
Descending.
C-DiGit User Manual 4-56
Page 89
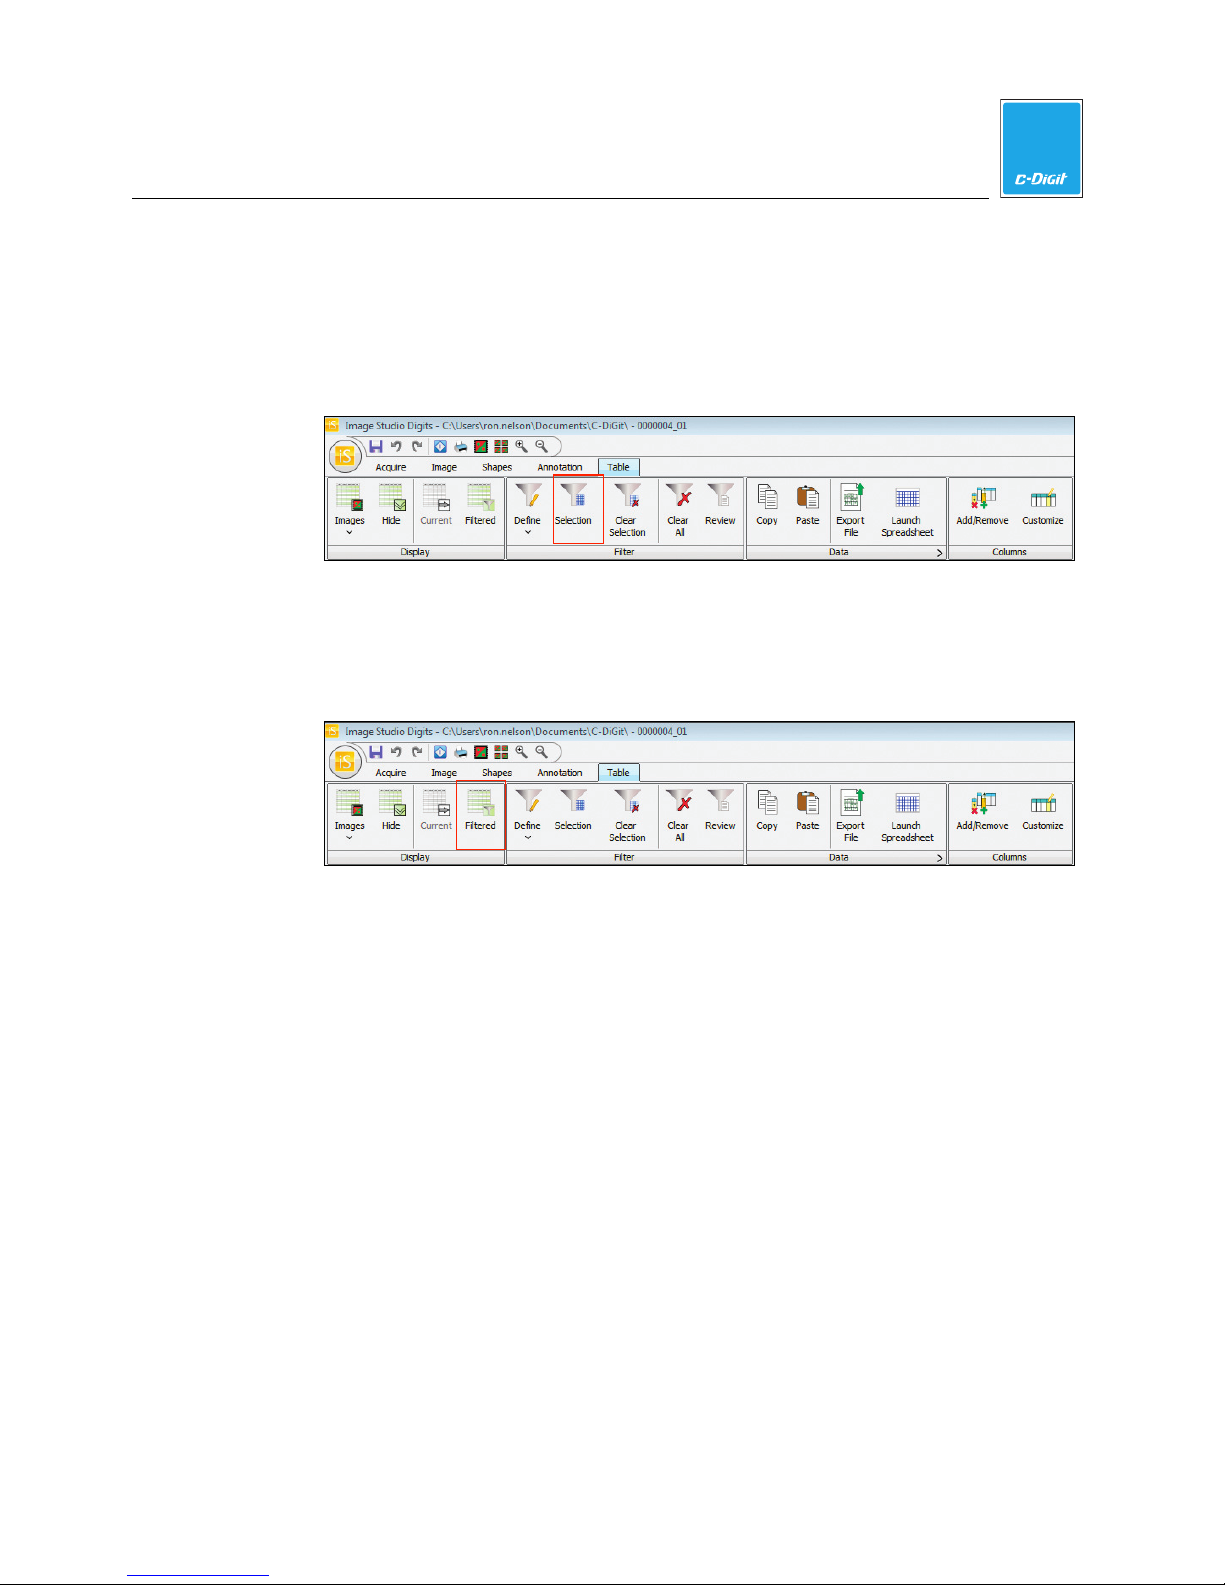
4
Image Studio Software
Filter the Table Manually
1. To manually choose images, drag to highlight the rows to select the desired
images. Or, select the desired images by pressing Ctrl on the keyboard and
clicking once on each row.
2. Click the Table tab to choose the Table ribbon.
3. Click Selection to show only the selected images in the table. The Filtered
button in the Display group will be highlighted.
4. Click the Filtered button to toggle between showing only the selected images
and showing all images in the table.
5. To remove the filter, click Clear Selection to remove only the Selection filter, or
Clear All to remove all filters currently applied.
Define Filters
One or more defined filters can be applied to the table to show only the images of
interest.
1. Click the Table tab to choose the Table ribbon.
2. Click Define to view the drop-down menu of all of the column headings. Select
Sensitivity to filter using the Sensitivity column.
C-DiGit User Manual 4-57
Page 90
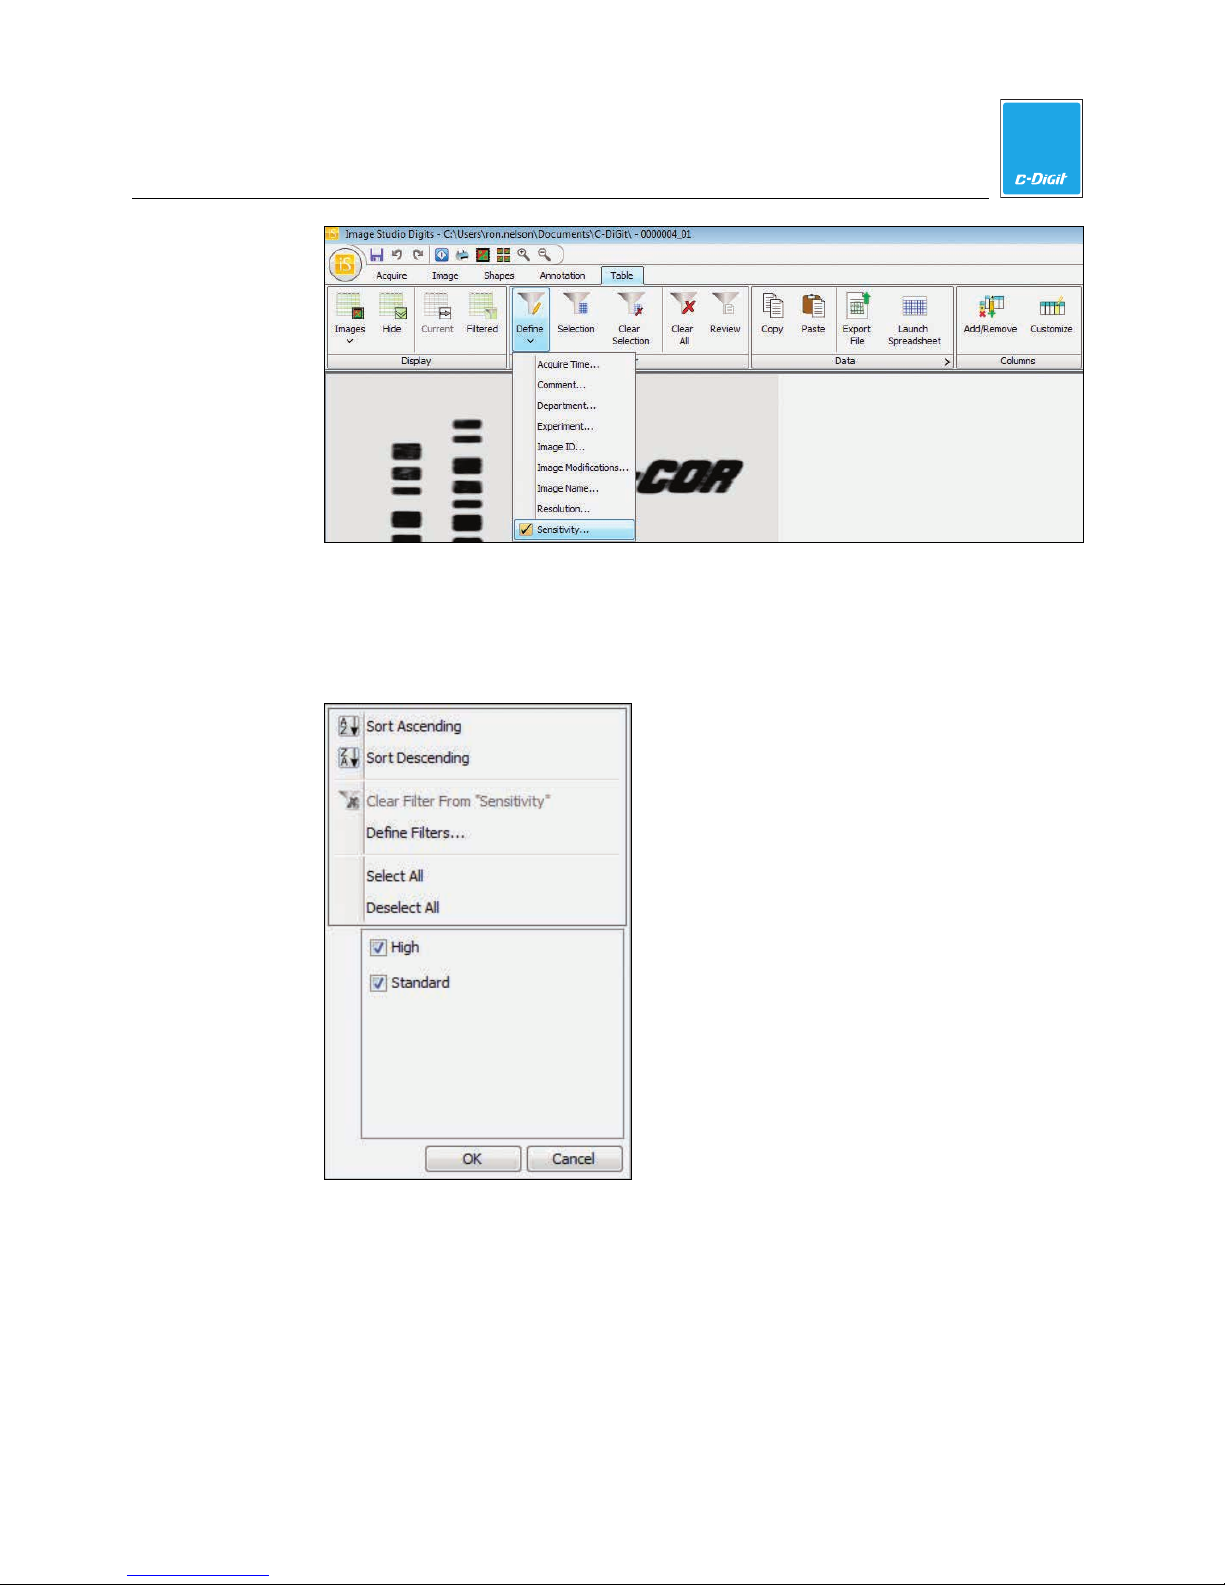
Image Studio Software
Note: Right-click on any column header in the Table to drop down a menu for
that column.
3. Deselect High by disabling the check box.
4
4. Click OK. Only images with Shapes with a Standard value in the Sensitivity
column will appear in the Table.
For more Filter Options…
1. Click Define Filters… in the Filter menu.
2. Click one of the filtering phrases to show the Column Filter Analysis menu.
3. Select filtering phrases from the drop-down menu by clicking on the arrows
next to each box, or type your own phrase.
C-DiGit User Manual 4-58
Page 91
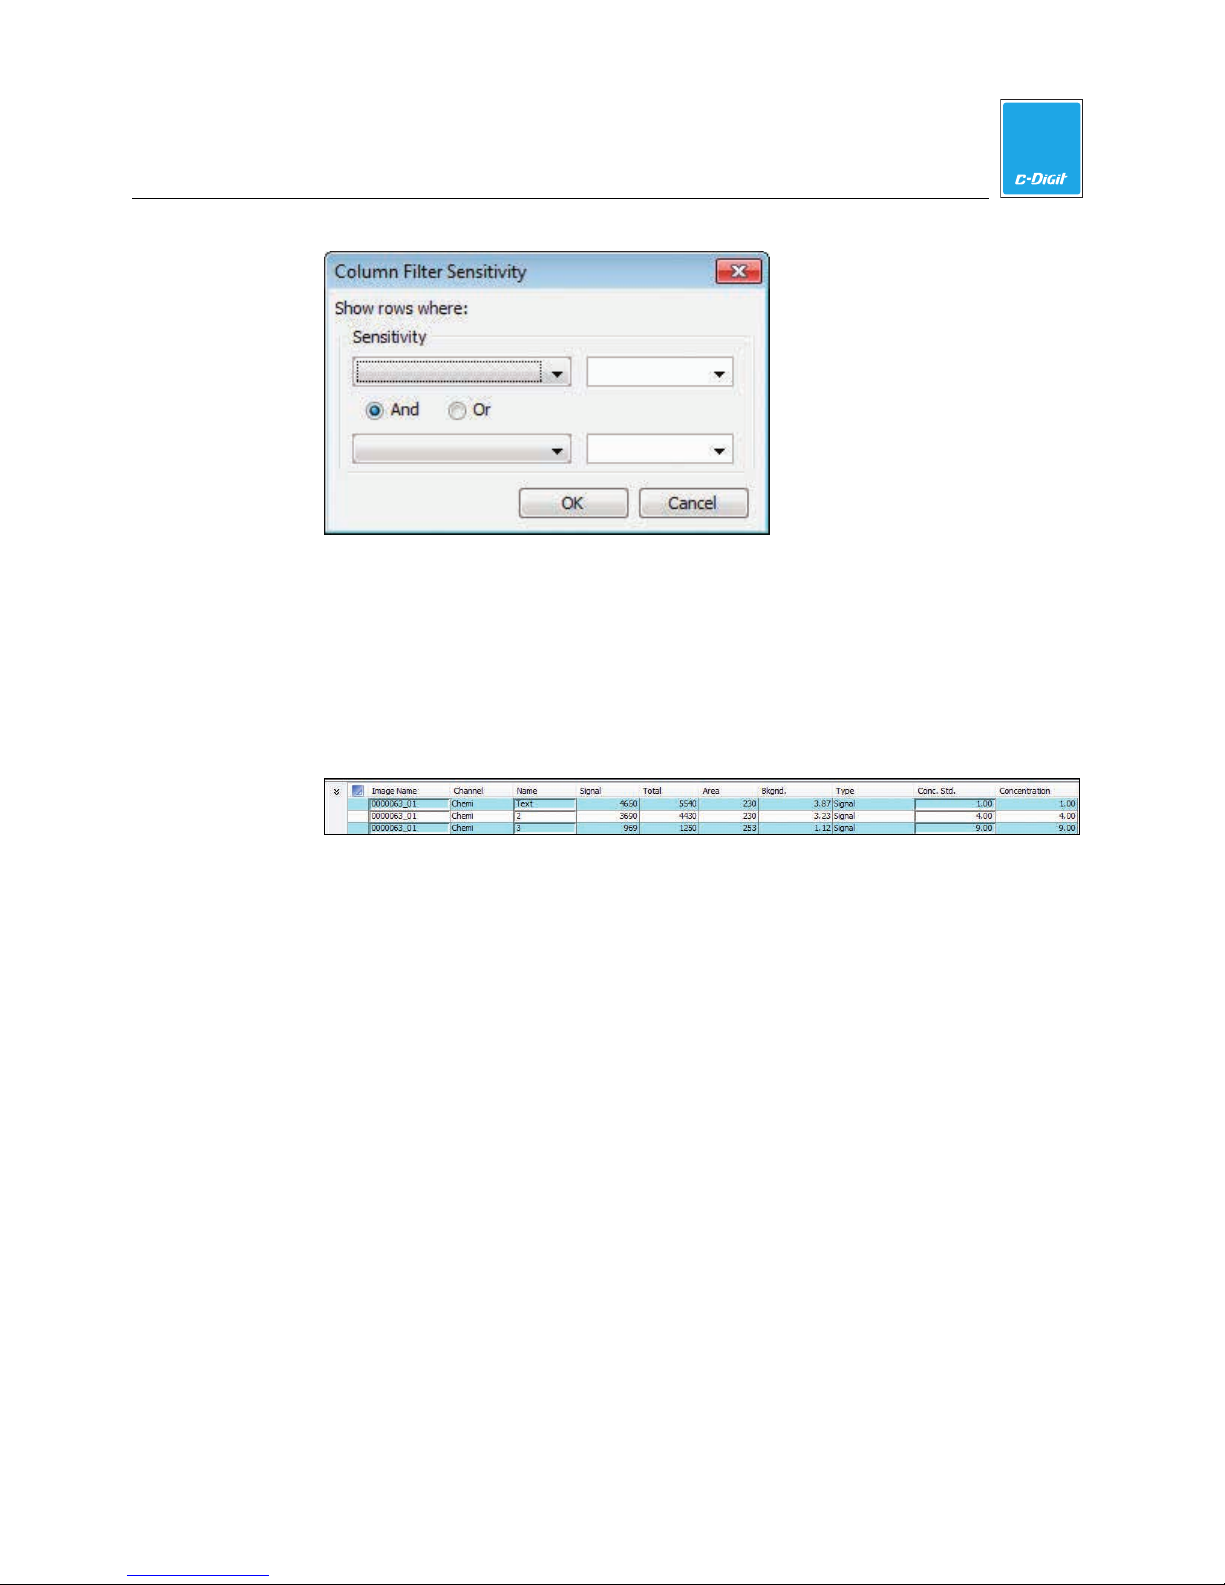
Image Studio Software
4. Click OK.
Note: If you close Image Studio, your filtering criteria are preserved.
View the Shapes Table
1. Click the Shapes tab at the bottom of the main window to view the data for
each shape.
4
2. The default columns are defined below.
a. Image Name - Original acquisition name
b. Channel - Chemi
c. Name - Shapes are assigned a number in sequential order. Double-click on
the number in the column to edit the shape name.
d. Signal - The Signal is the sum of the individual pixel intensity values (Total)
for a shape minus the product of the average intensity values of the pixels in
the background (Bkgnd.) and the total number of pixels enclosed by the
shape.
e. Total - Sum of the individual pixel intensities for the shape
f. Area - Total number of pixels enclosed by a shape
g. Bkgnd. - Designated background subtraction
h. Type - Signal or Background
i. Conc. Std. - Value of the concentration defined for this shape
j. Concentration - Calculated value of the concentration based on the
standards for the shape
3. Move, add, delete, sort, and filter the columns in the same way as in the Images
Table.
C-DiGit User Manual 4-59
Page 92
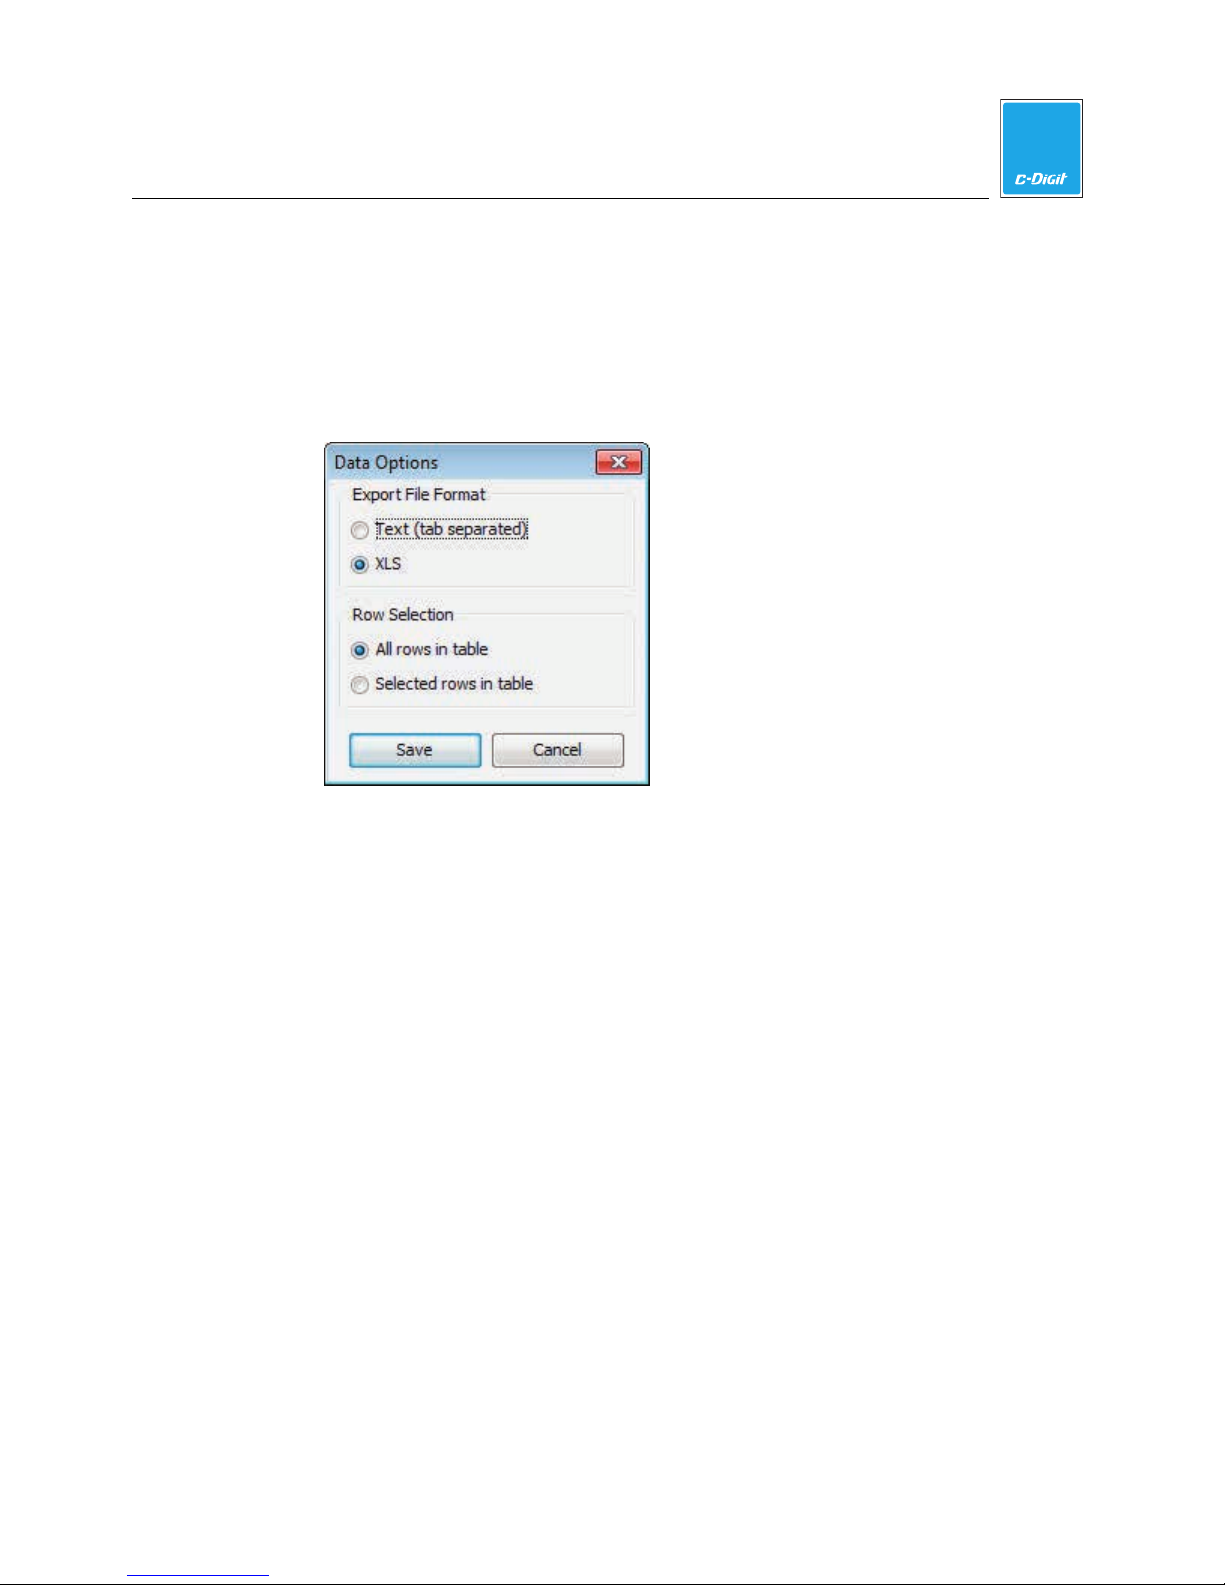
4
Image Studio Software
Exporting Data
Use Export File or Launch Spreadsheet in the Data group to prepare or open a ‘.xls’
file with the selected data.
Export File
1. Click the arrow (>) on the Data group to view the Data Options menu. Choose
the file format (text or xls) and whether to export all rows or only selected rows.
2. In the Table ribbon, click Export File to open the Table Export menu.
3. Select the folder destination. Click Save.
4. The file will be saved in the selected folder.
Launch Spreadsheet
1. Click the arrow (>) on the Data group to view the Data Options menu (see Step
1 above). Export all rows or selected rows. Click Save. If necessary, select the
rows in the table to export.
2. In the Table ribbon, click Launch Spreadsheet to open the Launch Spreadsheet
dialog.
C-DiGit User Manual 4-60
Page 93
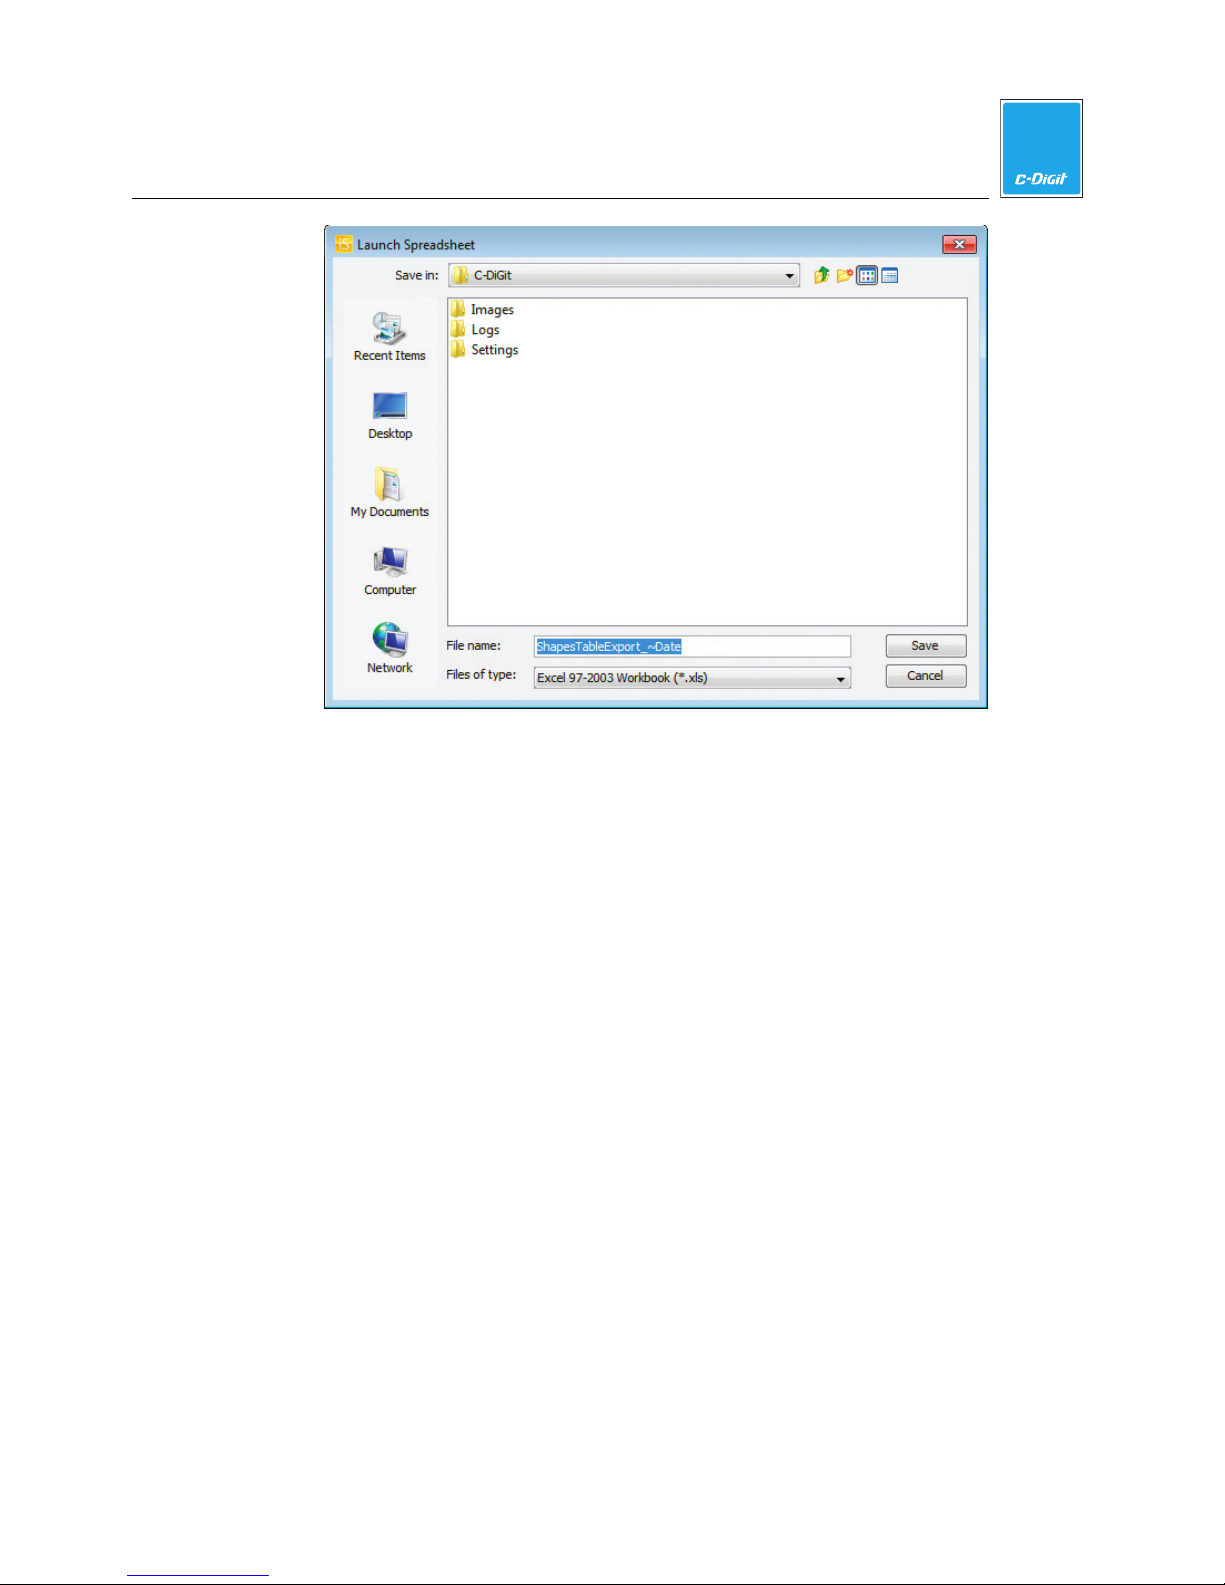
4
Image Studio Software
3. Select the folder destination and enter a file name. Click Save.
4. Any application that reads these types of files will open them with the selected
data and corresponding column headings.
C-DiGit User Manual 4-61
Page 94
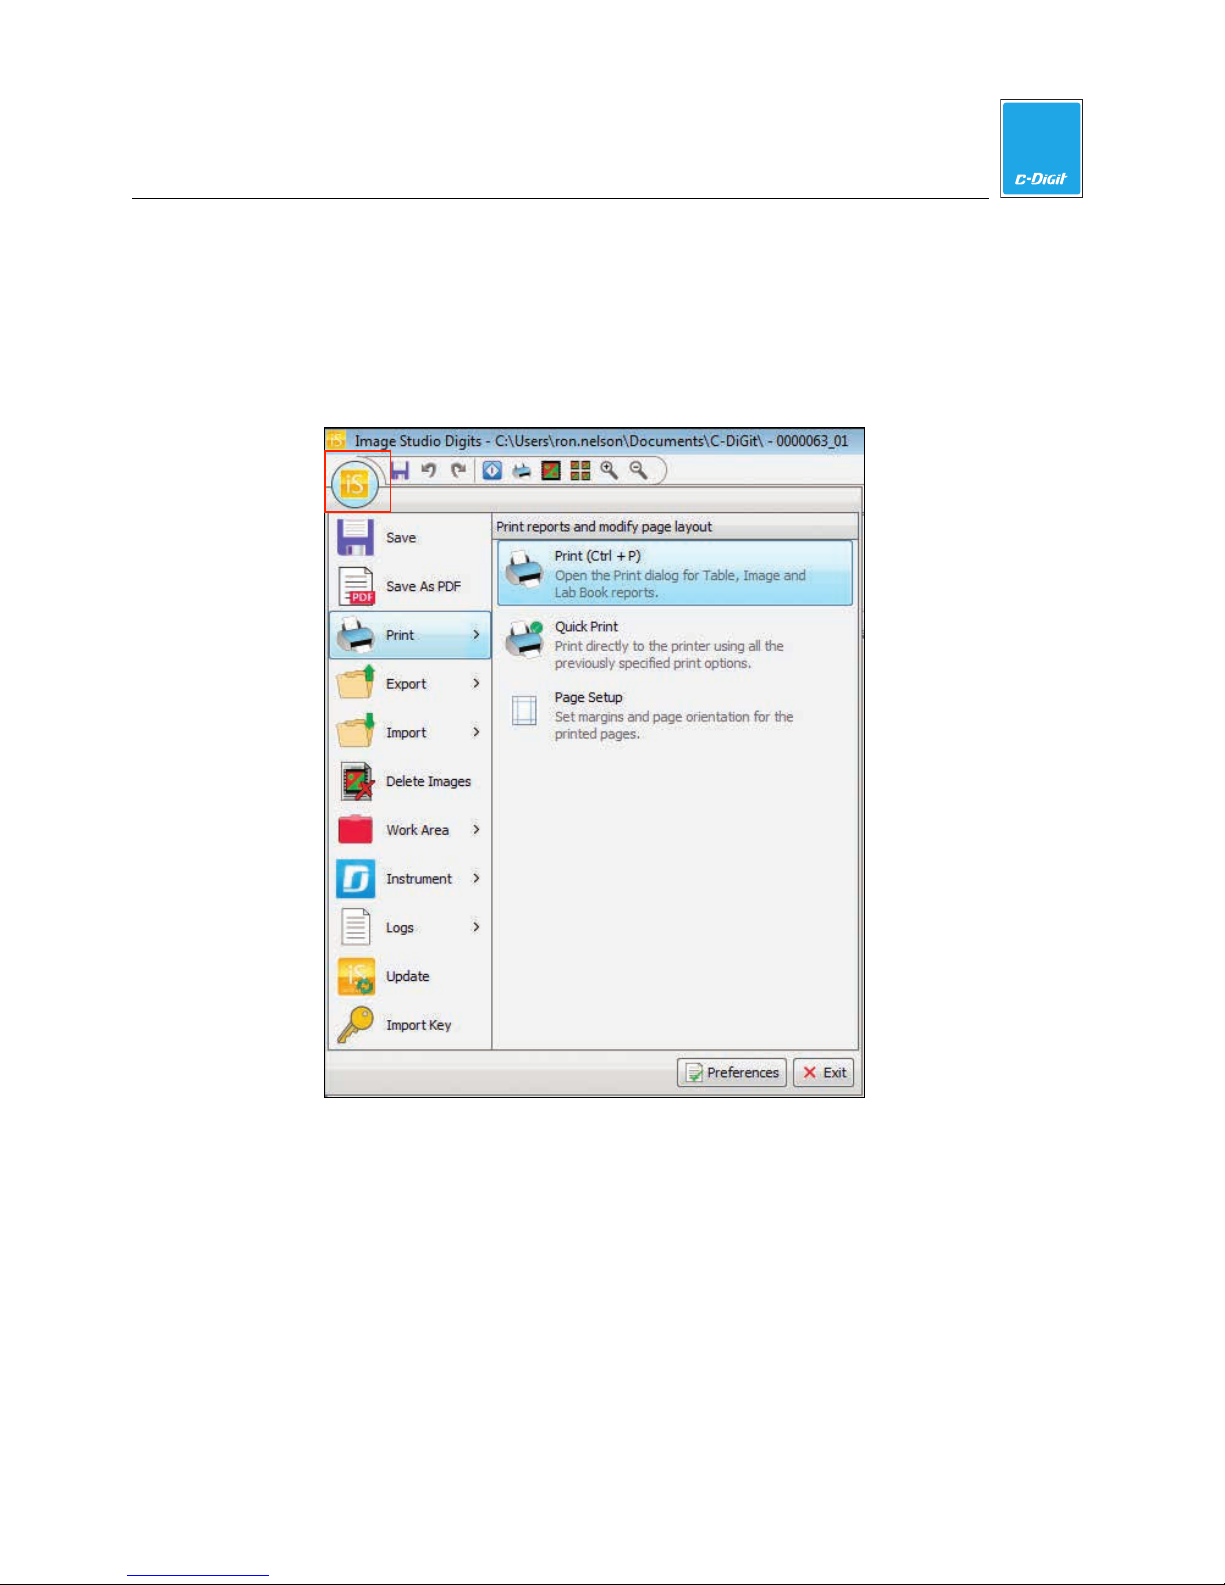
Print Images and Create Reports
Print an Image
1. To open the Print dialog, click the printer icon in the quick access tool bar,
press Ctrl+P on the keyboard, or click the Image Studio Application Button,
hover over Print, and click Print.
Image Studio Software
4
2. Choose your printer setup parameters and click Print to print the currently
displayed image.
C-DiGit User Manual 4-62
Page 95
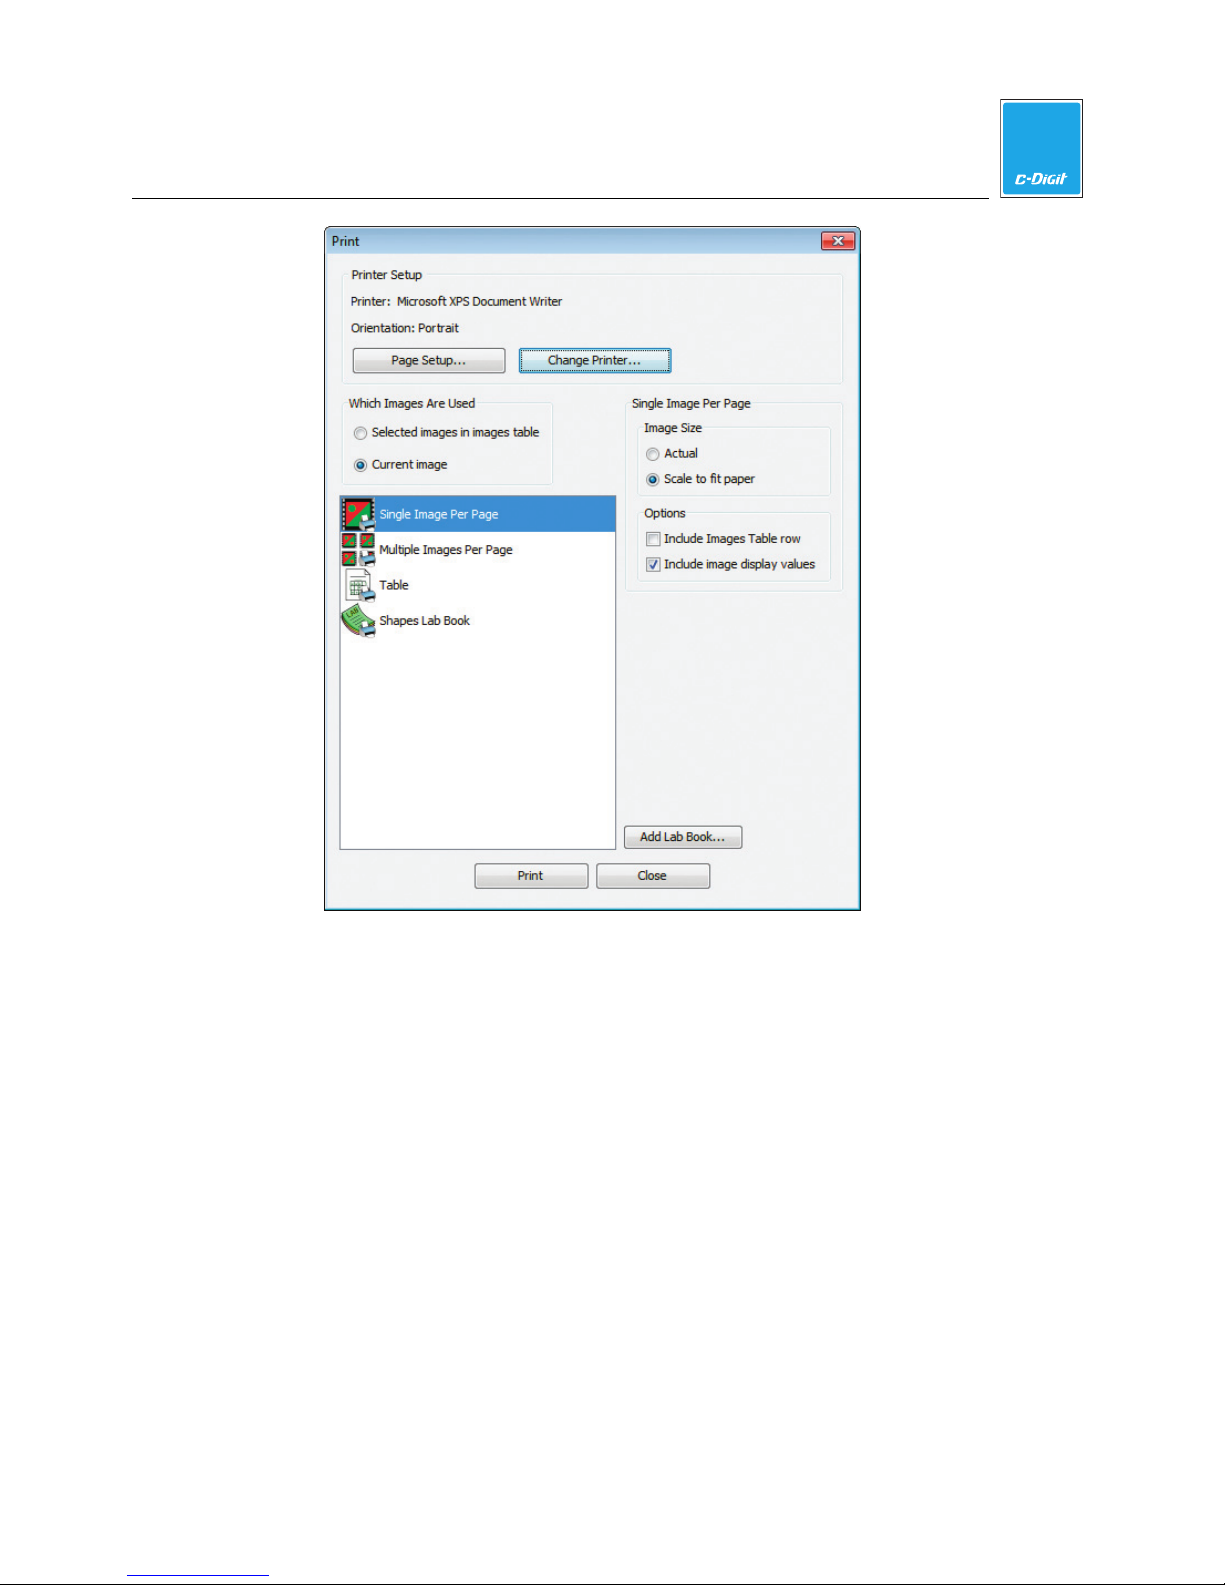
4
Image Studio Software
Save an Image as a PDF File
1. Click the Image Studio Application Button and select Save As PDF.
2. Click Save to save the current image in .pdf format.
C-DiGit User Manual 4-63
Page 96
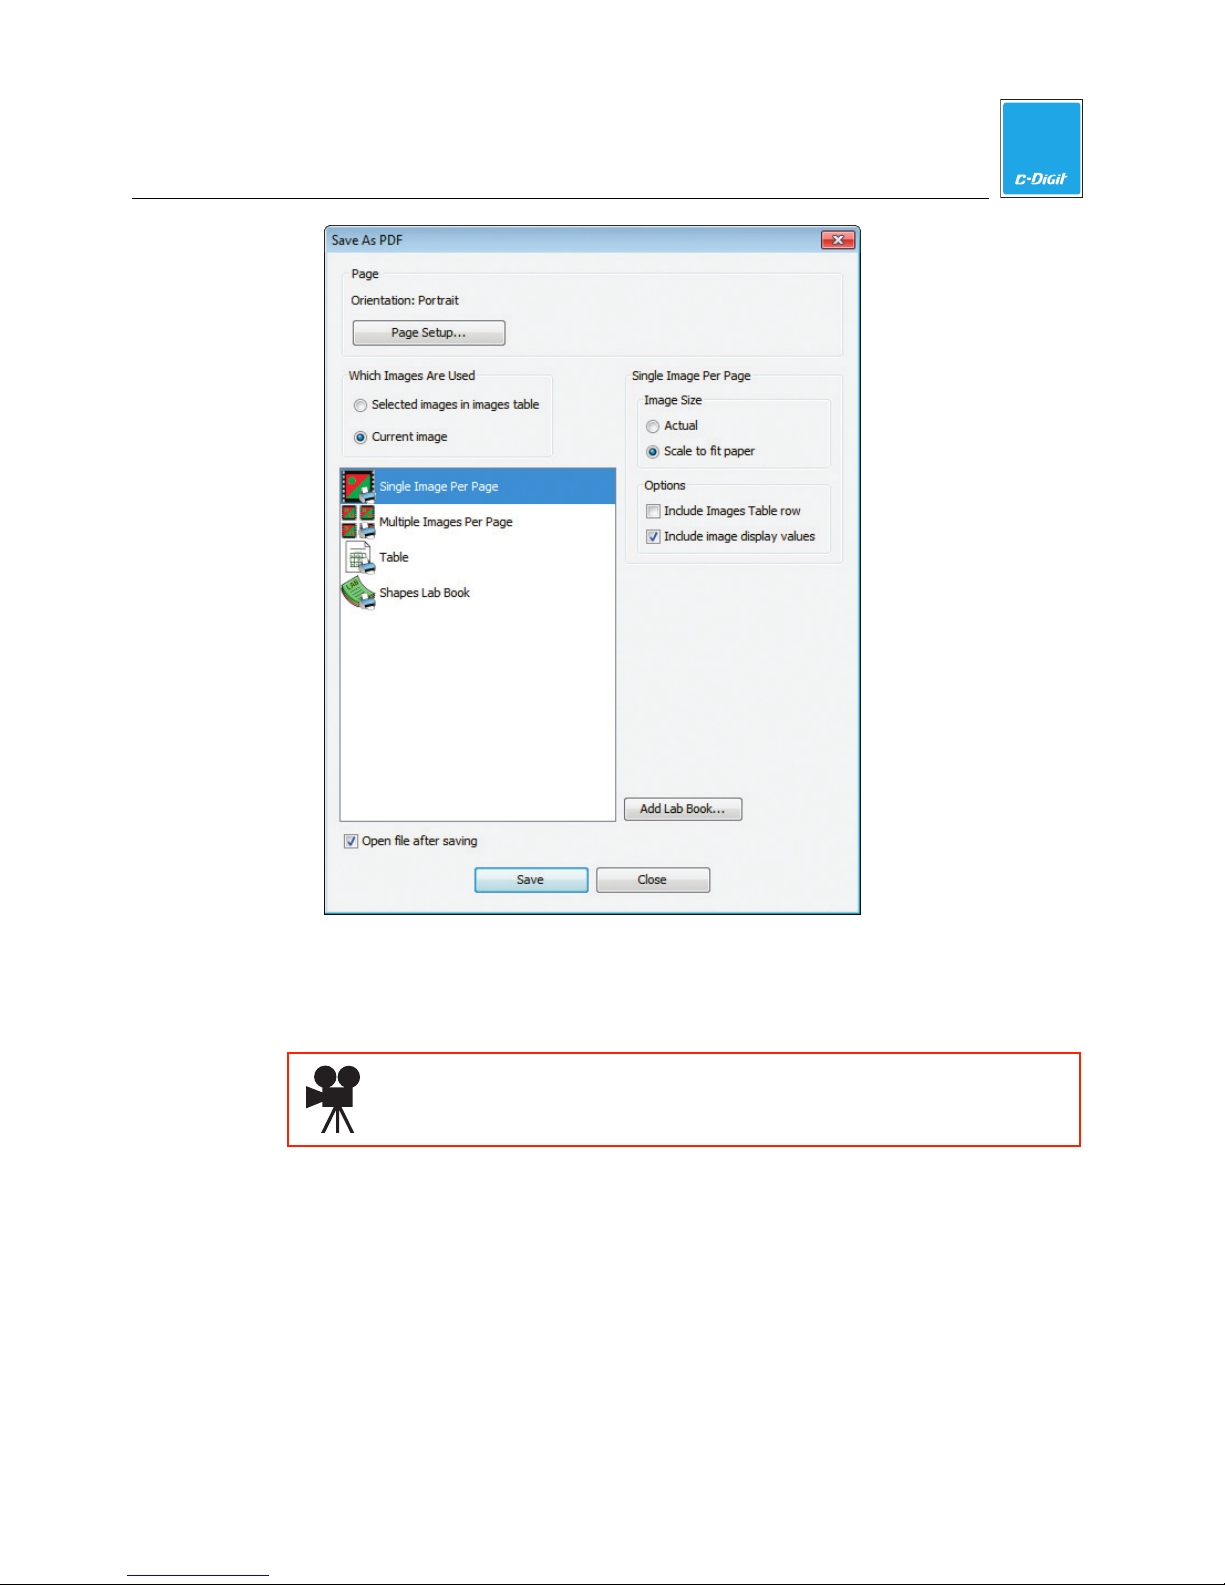
4
Image Studio Software
Print a Report
In the Print dialog, select Shapes Lab Book and click Print to print the default report
for the current image.
Click here to watch a video that demonstrates how to print lab reports.
C-DiGit User Manual 4-64
Page 97
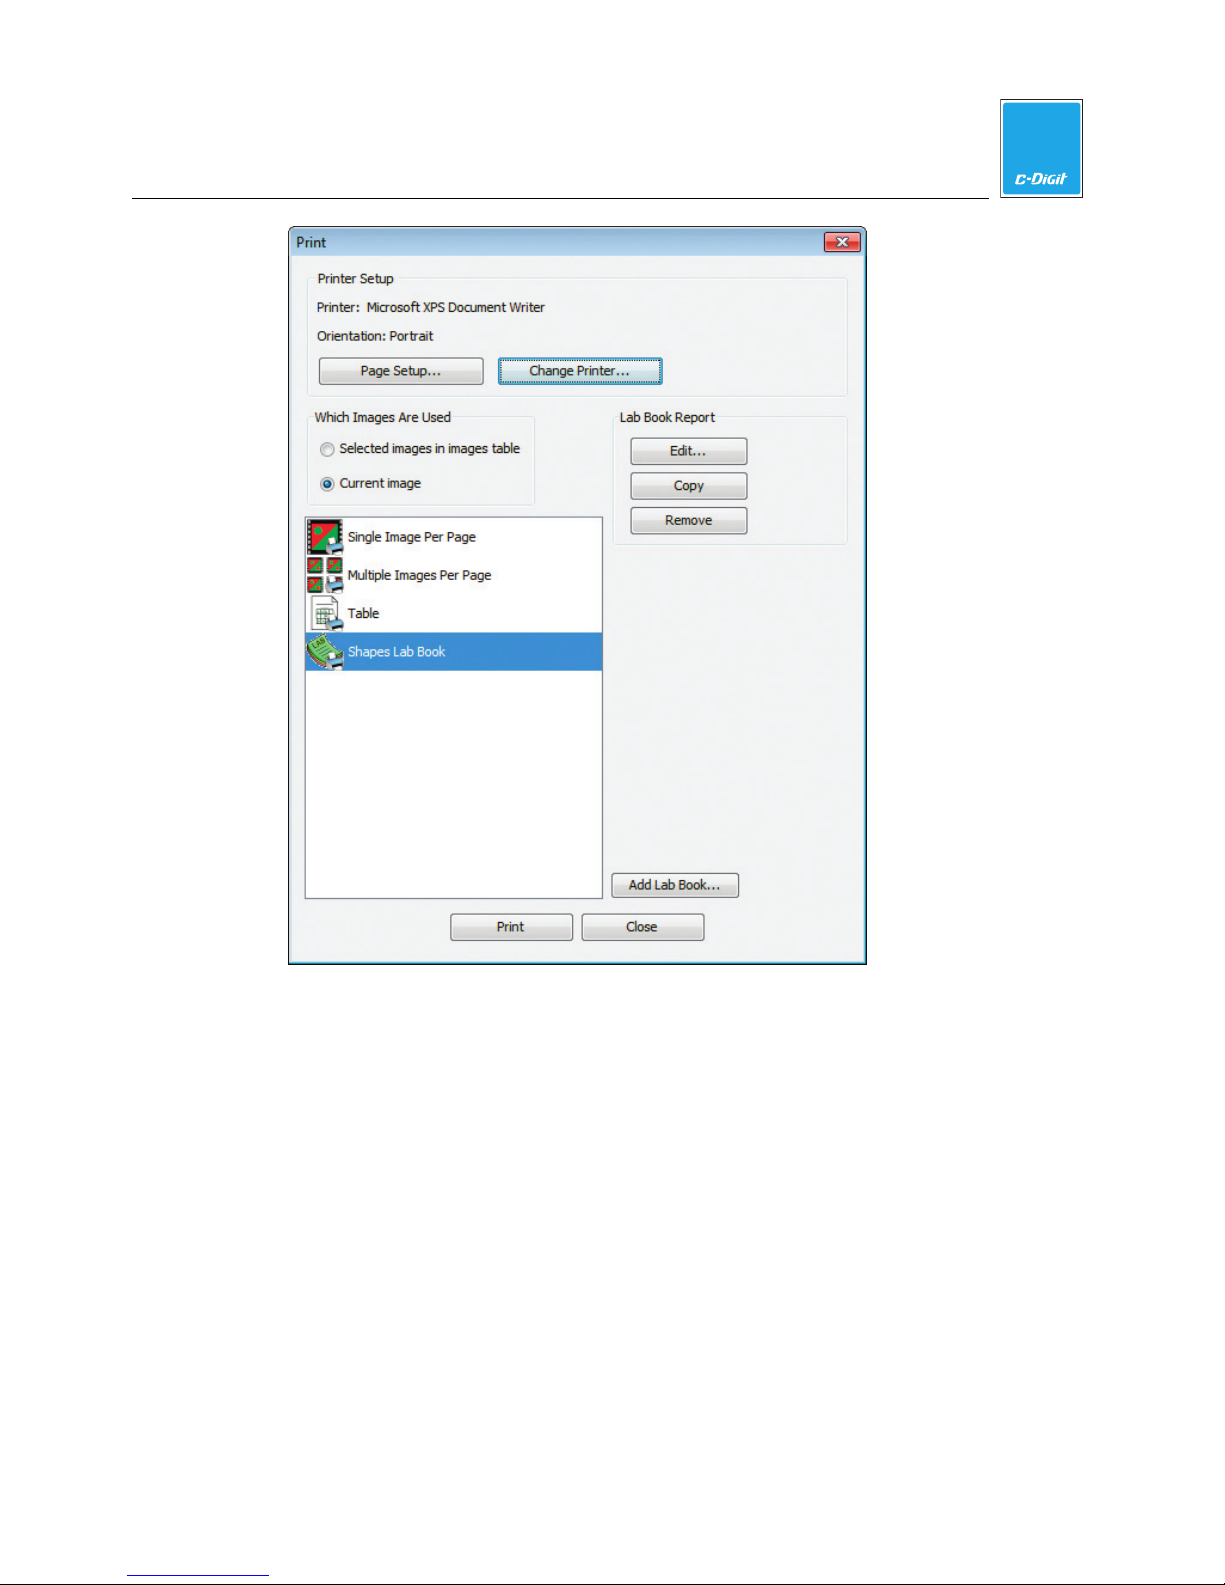
4
Image Studio Software
To create a custom report, click Add Lab Book… to open the Print Format builder
dialog (below).
C-DiGit User Manual 4-65
Page 98
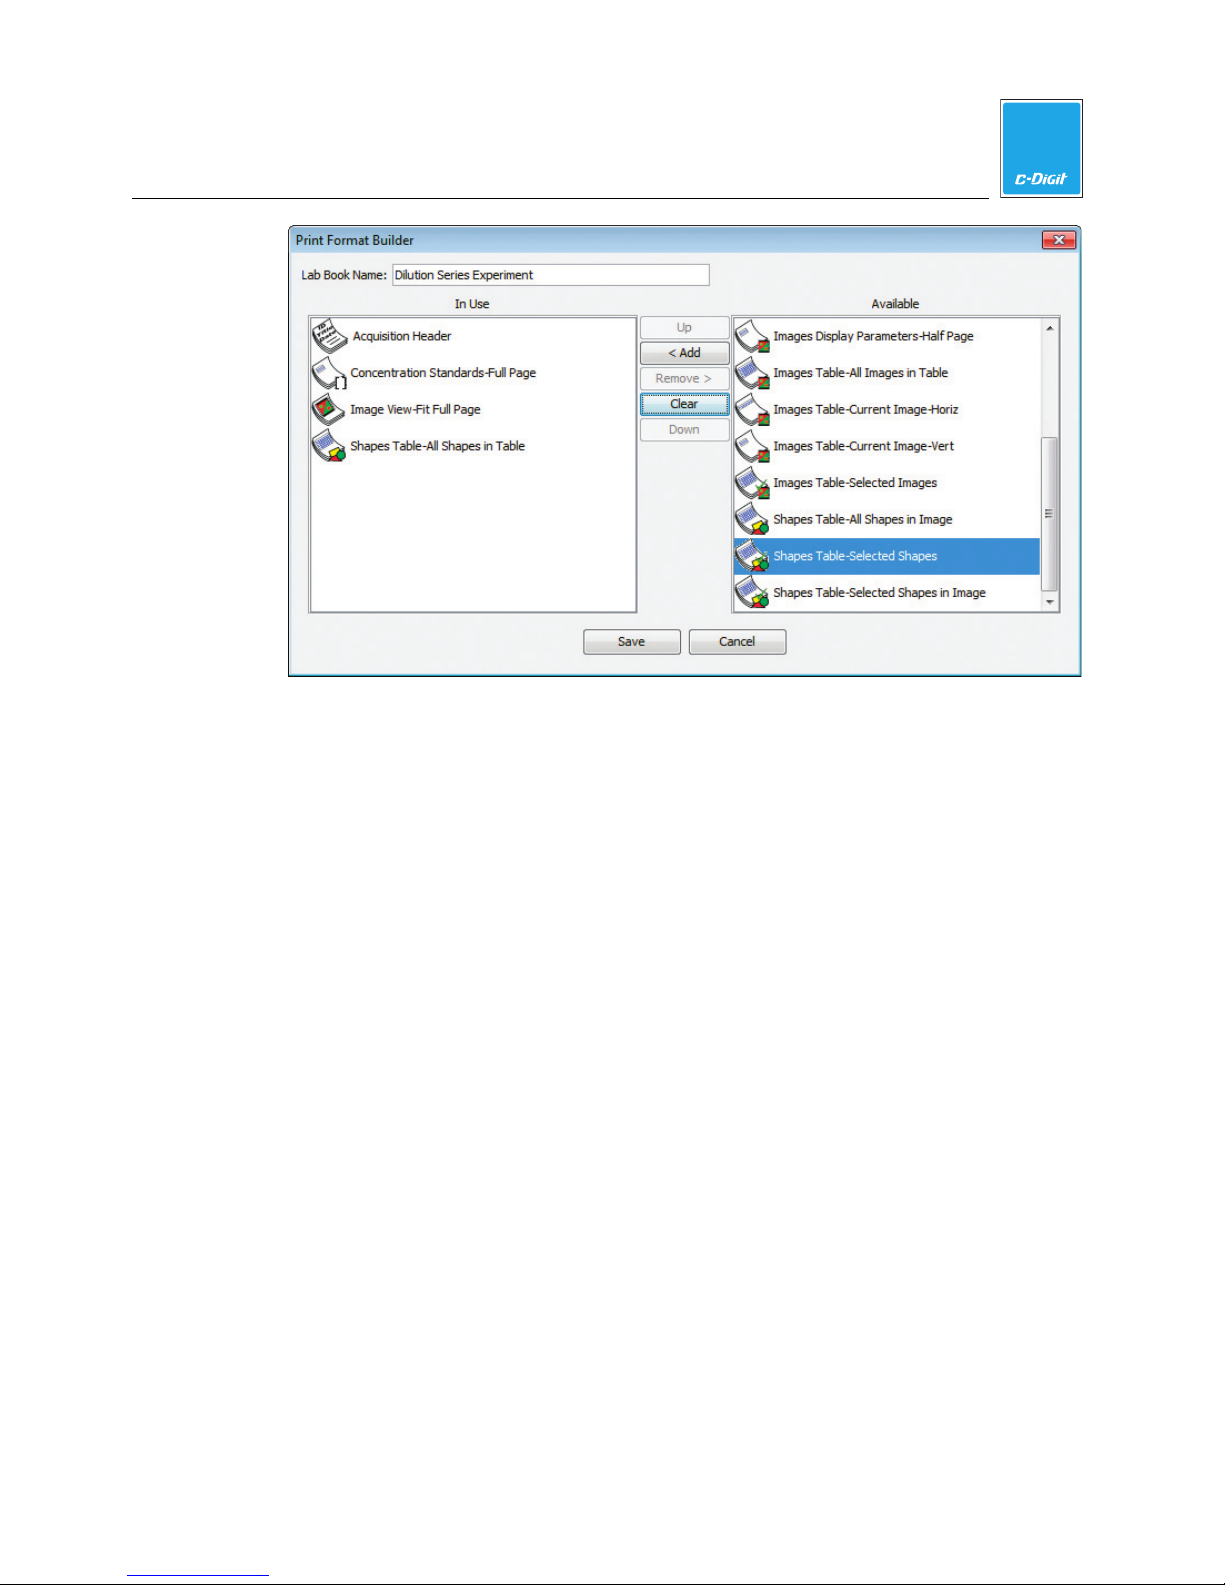
4
Image Studio Software
1. Type a report name in the Lab Book Name: field.
2. Items that are available to add to the report appear under Available in the righthand column. Select an item and click Add to move it to the In Use column on
the left.
3. Click Save to include the items in the In Use column in the report.
4. In the Print dialog, click Print to print the custom report for the current image.
Save a Report as a PDF File
1. Click the Image Studio Application Button and select Save As PDF.
2. In the Save as PDF dialog box, select Shapes Lab Book and click Save to save
the default report for the current image.
C-DiGit User Manual 4-66
Page 99
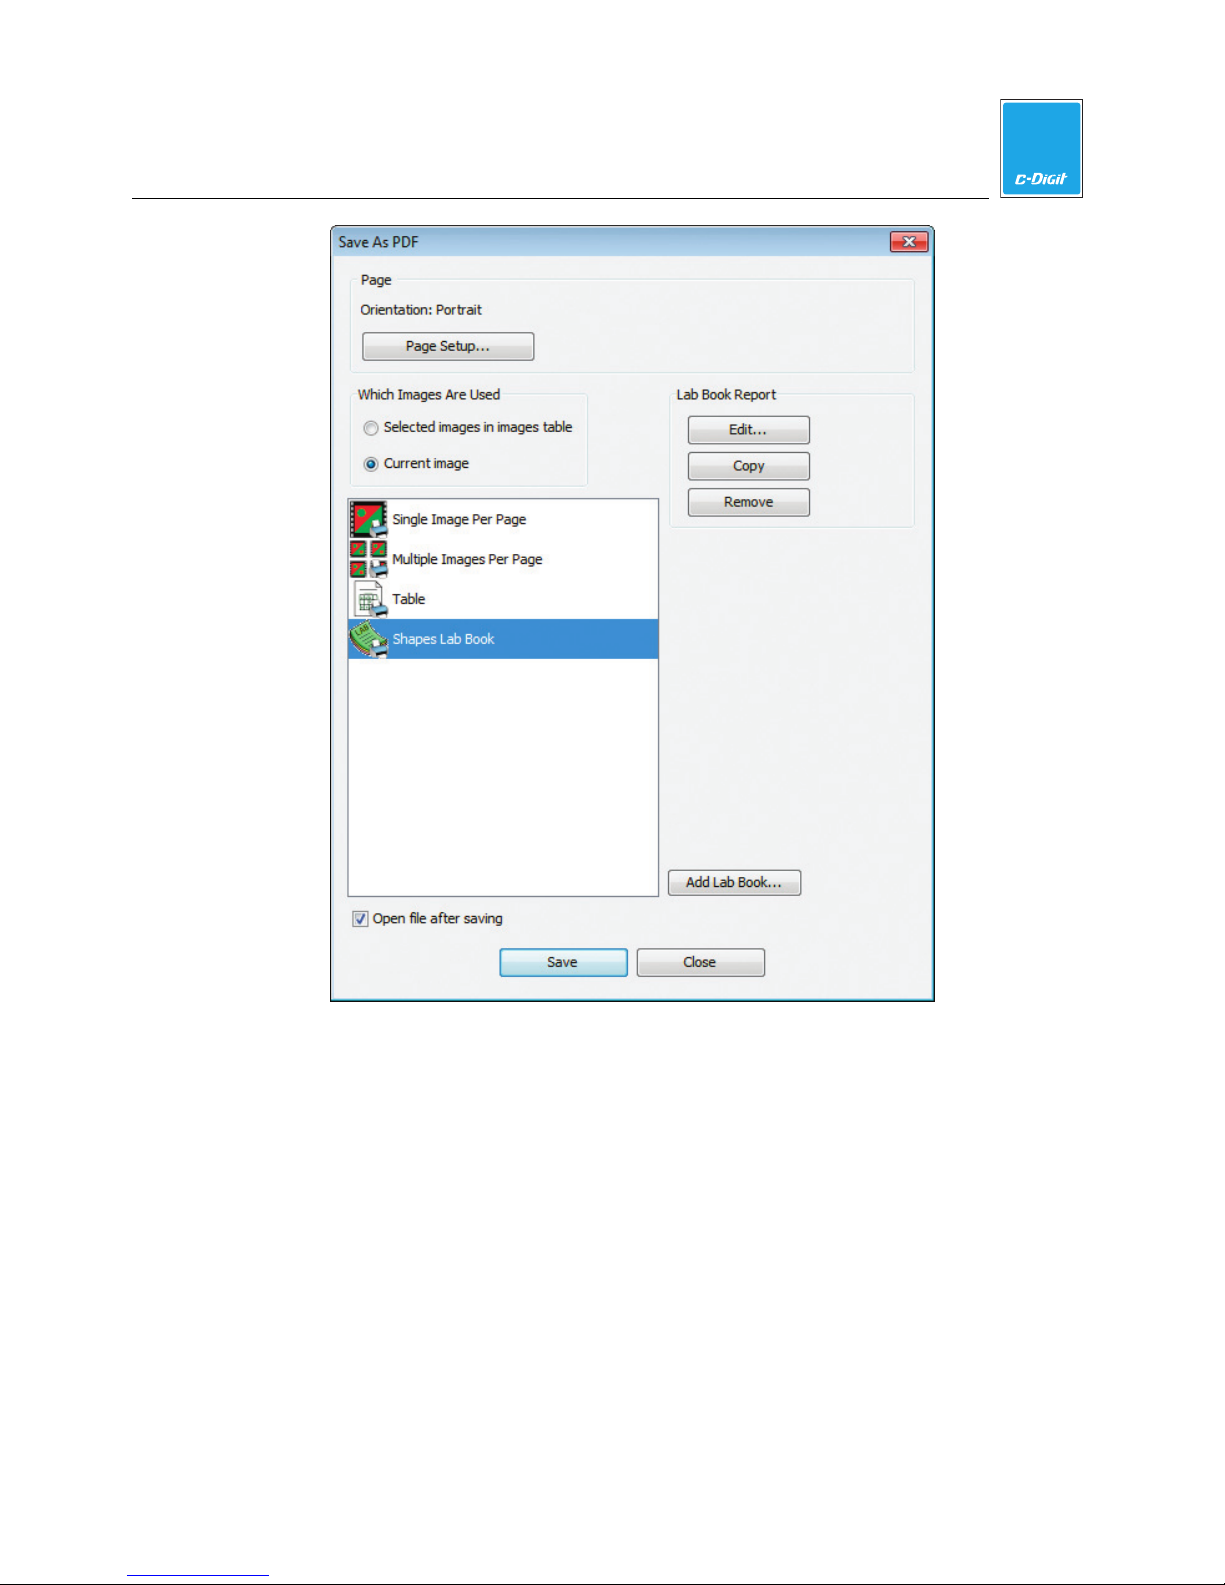
4
Image Studio Software
To create a custom report, click Add Lab Book… to open the Print Format builder
dialog. Follow the example above to create a custom report. Click Save.
C-DiGit User Manual 4-67
Page 100

5
Computer Connections &
Networking
The C-DiGit Blot Scanner uses IPv4 and IPv6 Link-Local Addressing to
automatically create an IP network without any user configuration or additional
servers. When using the Windows XP operating system, all communications are
made using IPv4 only. If you are using Windows Vista or Windows 7 and you
experience connection problems, be sure that IPv6 is enabled on the computer.
Note: Use only the supplied USB 2.0 Type A to Type B cable or Cat. 5E RJ-45
Ethernet cable to connect the C-DiGit Blot Scanner and computer. The Ethernet
port on the C-DiGit Blot Scanner is Auto-MDIX, so a crossover cable is not needed.
When Image Studio Application Software starts, it searches for and discovers any
C-DiGit Blot Scanners automatically. If only one instrument is found, Image Studio
Application Software establishes communication.
If more than one instrument is found, the user is presented with a list of instruments
and asked which to use.
Because the C-DiGit Blot Scanner is a networkable device, there are a variety of
connection and/or networking options available. Some networking configurations
may require assistance from your IT professional.
In general, there are three basic cabling configurations outlined below: 1) computer
is connected to C-DiGit directly via the USB cable included; 2) computer is
connected to C-DiGit directly via the Ethernet cable included, or; 3) computer and
C-DiGit are connected to an existing LAN via Ethernet cables.
C-DiGit User Manual 5-1
 Loading...