

Page 1
Laser Measurement System HPI-3D
User
manual
Page 2

www.lasertex.eu
Page 3

www.lasertex.eu
Laser measurements systems.
Measurement systems with data acquisition.
Laser technique.
Research and Development Company Ltd.
UL. RADZIONKOWSKA 17,
51-506 WROCLAW, POLAND
Tel/fax. 071-3466684
email: [email protected]
Laser Measurement System HPI-3D
User manual
Rev. E10
Wroclaw 2017
Page 4

CONTENTS
www.lasertex.eu
1. INTRODUCTION ................................................................................................... 1-1
A. SAFETY CONSIDERATIONS ..................................................................................... 1-1
B. WARNINGS ............................................................................................................ 1-2
C. COMPLIANCE INFORMATION ................................................................................ 1-2
2. QUICK START ....................................................................................................... 2-1
A. MAIN FEATURES .................................................................................................... 2-1
B. HOW IT WORKS ...................................................................................................... 2-1
i. Linear optics ...................................................................................................... 2-2
ii. Angular optics ................................................................................................... 2-2
iii. Wollaston optics ........................................................................................... 2-4
C. HOW TO START ...................................................................................................... 2-5
3. PREPARATIONS ................................................................................................... 3-1
A. SOFTWARE INSTALLATION .................................................................................... 3-1
B. ELEMENTS OF THE LASER SYSTEM ........................................................................ 3-9
C. INTERFEROMETER SETUP FOR MEASUREMENT ...................................................... 3-12
D. POWERING THE SYSTEM ON ................................................................................ 3-16
i. Starting hardware ........................................................................................... 3-16
ii. Starting software ............................................................................................. 3-16
E. GETTING BASIC INFORMATION FROM THE SYSTEM. ............................................ 3-18
F. RECORDING MODE .............................................................................................. 3-25
G. FLAT MIRROR MEASUREMENTS - OPTION ............................................................ 3-25
4. BEAM ALIGNMENT ............................................................................................. 4-1
Page 5

CONTENTS
www.lasertex.eu
A. INTRODUCTION ..................................................................................................... 4-1
B. ELECTRONIC ALIGNMENT TOOLS .......................................................................... 4-2
C. BASIC RULES OF BEAM ALIGNMENT ...................................................................... 4-2
D. PREPARATIONS ...................................................................................................... 4-4
i. Diaphragm ......................................................................................................... 4-4
ii. Laser head alignment elements .......................................................................... 4-6
iii. Electronic Beam Alignment tool ................................................................... 4-7
E. BEAM ALIGNMENT PROCESS FOR LINEAR OPTICS ................................................. 4-8
F. BEAM ALIGNMENT PROCESS FOR ANGULAR OPTICS ............................................. 4-9
G. BEAM ALIGNMENT PROCESS FOR WOLLASTON OPTICS ...................................... 4-12
H. BEAM ALIGNMENT OF LINEAR OPTICS WITH ANGLE ETALON ............................ 4-14
I. BEAM ALIGNMENT OF ANGULAR OPTICS WITH BEAM BENDER .............................. 4-17
i. Laser Head initially not aligned ...................................................................... 4-17
ii. Laser Head initially aligned ............................................................................ 4-20
5. MEASUREMENTS - POSITIONING ............................................................... 5-1
A. GENERAL DESCRIPTION ........................................................................................ 5-1
i. Positioning in brief ............................................................................................ 5-1
B. MEASUREMENT SETUP .......................................................................................... 5-4
i. Principles ........................................................................................................... 5-4
ii. Principles – base temperature compensation .................................................... 5-5
iii. Measurement Setup Preparations ................................................................. 5-6
C. SOFTWARE DESCRIPTION ..................................................................................... 5-10
i. Introduction..................................................................................................... 5-10
ii. Display Panel .................................................................................................. 5-10
iii. Positioning Plot Panel ................................................................................. 5-11
iv. Positioning Measurement Values Panel ......................................................... 5-12
v. Positioning Control Panel ............................................................................... 5-12
vi. Pull down menu - File ..................................................................................... 5-15
vii. CNC path generation .................................................................................. 5-15
viii. Compensation table preparation .................................................................. 5-17
Page 6

CONTENTS
www.lasertex.eu
ix. Pull down menu - Edit .................................................................................... 5-18
x. Machine error limits ........................................................................................ 5-19
xi. Positioning points generation ......................................................................... 5-21
xii. Configuration of Positioning measurement ................................................ 5-22
xiii. Pull down menu – Measurement ................................................................ 5-28
D. PREPARATIONS FOR MEASUREMENT ................................................................... 5-29
i. Measurement window ..................................................................................... 5-29
ii. 1D and 3D measurements ............................................................................... 5-30
iii. Measurements in machine coordinate system ............................................. 5-30
iv. Setting measurement points ............................................................................ 5-31
E. RULES OF AUTOMATIC POSITIONING MEASUREMENT ........................................ 5-31
F. REMARKS ON MEASUREMENTS AND ON DATA ANALYSIS .................................. 5-32
G. MACHINE ERROR COMPENSATION ..................................................................... 5-37
i. Absolute and Incremental data formats .......................................................... 5-38
ii. Siemens data format ........................................................................................ 5-39
iii. Fanuc data format ....................................................................................... 5-40
6. MEASUREMENTS – DYNAMIC POSITIONING ......................................... 6-1
A. GENERAL DESCRIPTION ........................................................................................ 6-1
i. Positioning in brief ............................................................................................ 6-1
B. MEASUREMENT SETUP .......................................................................................... 6-4
i. Principles ........................................................................................................... 6-4
ii. Principles – base temperature compensation .................................................... 6-5
iii. Measurement Setup Preparations ................................................................. 6-6
C. SOFTWARE DESCRIPTION ....................................................................................... 6-9
i. Introduction..................................................................................................... 6-10
ii. Display Panel .................................................................................................. 6-10
iii. Positioning Plot Panel ................................................................................. 6-11
iv. Positioning Control Panel ............................................................................... 6-12
v. Pull down menu - File ..................................................................................... 6-13
vi. CNC path generation ...................................................................................... 6-13
Page 7

CONTENTS
www.lasertex.eu
vii. Compensation table preparation .................................................................. 6-15
viii. Pull down menu - Edit ................................................................................ 6-16
ix. Configuration of Positioning measurement .................................................... 6-17
D. PREPARATIONS FOR MEASUREMENT ................................................................... 6-18
i. Measurement window ..................................................................................... 6-18
ii. Measurements in machine coordinate system ................................................. 6-19
E. RULES OF AUTOMATIC POSITIONING MEASUREMENT ........................................ 6-19
F. REMARKS ON MEASUREMENTS AND ON DATA ANALYSIS .................................. 6-20
G. MACHINE ERROR COMPENSATION ..................................................................... 6-21
i. Absolute and Incremental data formats .......................................................... 6-22
ii. Siemens data format ........................................................................................ 6-23
iii. Fanuc data format ....................................................................................... 6-24
7. MEASUREMENTS - STRAIGHTNESS ............................................................ 7-1
A. GENERAL DESCRIPTION ........................................................................................ 7-1
B. MEASUREMENT SETUP – ANGULAR OPTICS ......................................................... 7-1
i. Principles ........................................................................................................... 7-1
ii. Application Notes .............................................................................................. 7-4
iii. Measurement Setup Preparations ................................................................. 7-5
C. MEASUREMENT SETUP – WOLLASTON OPTICS ..................................................... 7-8
i. Principles ........................................................................................................... 7-8
ii. Application Notes ............................................................................................ 7-11
iii. Measurement Setup Preparations ............................................................... 7-12
D. MEASUREMENT SETUP – 3D METHOD ................................................................ 7-15
i. Principles ......................................................................................................... 7-15
ii. Application Notes ............................................................................................ 7-15
iii. Measurement Setup Preparations ............................................................... 7-16
E. SOFTWARE DESCRIPTION ..................................................................................... 7-18
i. Introduction..................................................................................................... 7-19
ii. Display Panel .................................................................................................. 7-20
iii. Straightness Plot Panel ............................................................................... 7-21
Page 8

CONTENTS
www.lasertex.eu
iv. Operation Mode Panel .................................................................................... 7-24
v. Straightness Measurement Values Panel ....................................................... 7-25
vi. Straightness Control Panel ............................................................................. 7-27
vii. Straightness pull-down menus .................................................................. 7-28
viii. Reports ......................................................................................................... 7-31
F. STRAIGHTNESS MEASUREMENTS PROCEDURE .................................................... 7-32
i. Measurement procedure – Angular optics - preparations .............................. 7-32
ii. Measurement procedure – Angular optics ...................................................... 7-34
iii. Measurement procedure – Wollaston optics – preparations ....................... 7-34
iv. Measurement procedure – Wollaston optics ................................................... 7-35
v. Measurement procedure – 3D method - preparations .................................... 7-35
vi. Measurement procedure – 3D method ............................................................ 7-35
8. MEASUREMENTS - FLATNESS ....................................................................... 8-1
A. GENERAL DESCRIPTION ........................................................................................ 8-1
B. MEASUREMENT SETUP .......................................................................................... 8-1
C. SOFTWARE DESCRIPTION ....................................................................................... 8-4
D. ALIGNMENT OF OPTICS FOR THE FLATNESS MEASUREMENTS .............................. 8-8
i. Optical path alignment of the axis “1”. ............................................................ 8-9
ii. Optical path alignment of the axes: “3”, “6”, “8”. ........................................... 8-9
iii. Optical path alignment of the axes: “5” and “7” ........................................ 8-10
iv. Optical path alignment of the axes: “2” and “4” ............................................ 8-11
E. MEASUREMENT PROCEDURE ............................................................................... 8-12
9. MEASUREMENTS – PITCH/YAW .................................................................... 9-1
A. GENERAL DESCRIPTION ........................................................................................ 9-1
B. MEASUREMENT SETUP .......................................................................................... 9-1
C. SOFTWARE DESCRIPTION ....................................................................................... 9-3
D. MEASUREMENT PROCEDURE ................................................................................. 9-8
10. MEASUREMENTS - SQUARENESS .......................................................... 10-1
A. GENERAL DESCRIPTION ...................................................................................... 10-1
Page 9

CONTENTS
www.lasertex.eu
B. MEASUREMENT SETUP ........................................................................................ 10-1
C. SOFTWARE DESCRIPTION ..................................................................................... 10-5
D. ALIGNMENT OF OPTICS FOR THE SQUARENESS MEASUREMENTS ....................... 10-9
E. MEASUREMENT PROCEDURE ............................................................................. 10-11
11. MEASUREMENTS - PARALLELISM ......................................................... 11-1
A. GENERAL DESCRIPTION ...................................................................................... 11-1
B. MEASUREMENT SETUP ........................................................................................ 11-1
C. SOFTWARE DESCRIPTION ..................................................................................... 11-5
D. ALIGNMENT OF OPTICS FOR THE PARALLELISM MEASUREMENTS ...................... 11-9
E. MEASUREMENT PROCEDURE ............................................................................. 11-12
12. MEASUREMENTS - VIBRATION .............................................................. 12-1
A. GENERAL DESCRIPTION ...................................................................................... 12-1
B. MEASUREMENT SETUP ........................................................................................ 12-1
C. SOFTWARE DESCRIPTION ..................................................................................... 12-4
D. MEASUREMENT PROCEDURE ............................................................................... 12-8
13. MEASUREMENTS - DYNAMIC ................................................................. 13-1
A. GENERAL DESCRIPTION ...................................................................................... 13-1
B. MEASUREMENT SETUP ........................................................................................ 13-1
i. Dynamic measurements of distance, velocity or acceleration ........................ 13-1
ii. Dynamic measurements of angle ................................................................... 13-4
iii. Dynamic measurements of straightness (Wollaston) ................................. 13-6
C. SOFTWARE DESCRIPTION ..................................................................................... 13-8
D. MEASUREMENT PROCEDURE ............................................................................. 13-12
14. MEASUREMENTS – ANGULAR POSITIONING .................................. 14-1
A. GENERAL DESCRIPTION ...................................................................................... 14-1
B. MEASUREMENT SETUP ........................................................................................ 14-1
i. Characteristics of Wally – Rotary Measurement System ............................... 14-3
ii. Theory of operation .......................................................................................... 14-6
iii. Rotary measurements – hardware preparations ......................................... 14-7
Page 10

CONTENTS
www.lasertex.eu
iv. Rotary measurements – battery charging...................................................... 14-10
v. Rotary measurements – elimination of error sources ................................... 14-10
C. SOFTWARE DESCRIPTION ................................................................................... 14-11
i. Connecting with Wally ................................................................................. 14-11
ii. Measurements of the rotation angle .............................................................. 14-12
iii. Measurements of angular positioning ...................................................... 14-15
iv. Pull down menu - File ................................................................................... 14-15
v. CNC path generation for in-axis measurements ........................................... 14-16
vi. CNC path generation for off-axis measurements .......................................... 14-19
vii. Pull down menu - Edit .............................................................................. 14-27
viii. Machine error limits .................................................................................. 14-29
ix. Positioning points generation ....................................................................... 14-30
x. Configuration of Positioning measurement .................................................. 14-31
xi. Pull down menu – Measurement .................................................................. 14-33
D. MEASUREMENT PROCEDURE ............................................................................. 14-34
i. Rules of automatic positioning measurement ............................................... 14-34
ii. Remarks on measurements and data analysis ............................................... 14-35
15. MEASUREMENTS - VELOCITY ................................................................. 15-1
A. GENERAL DESCRIPTION ...................................................................................... 15-1
B. MEASUREMENT SETUP ........................................................................................ 15-1
C. SOFTWARE DESCRIPTION ..................................................................................... 15-3
D. MEASUREMENT PROCEDURE ............................................................................... 15-8
16. CONNECTING LASER HEAD TO MACHINE ........................................ 16-1
A. GENERAL DESCRIPTION ...................................................................................... 16-1
B. EXTENSION CONNECTOR .................................................................................... 16-2
i. Extension Connector pinout ............................................................................ 16-2
ii. Extension Cable EX1 ....................................................................................... 16-3
iii. Encoder type outputs ................................................................................... 16-6
C. HPI-3D IN A MACHINE CONTROL LOOP ........................................................... 16-10
17. CONFIGURATION ........................................................................................ 17-1
Page 11

CONTENTS
www.lasertex.eu
18. PRINCIPLES OF OPERATION .................................................................... 18-1
A. THE RULES OF LASER DISPLACEMENT MEASUREMENTS ...................................... 18-1
B. THE CONSTRUCTION OF REAL INTERFEROMETERS .............................................. 18-2
C. THE INFLUENCE OF THE OUTSIDE CONDITIONS ON THE MEASUREMENT ACCURACY
18-5
D. THE ACCURACY OF LASER INTERFEROMETERS .................................................... 18-6
i. Errors caused by the environment .................................................................. 18-6
ii. Dead path error ............................................................................................... 18-6
iii. Cosine error ................................................................................................. 18-7
iv. Abbe error ........................................................................................................ 18-8
v. Laser stability error ......................................................................................... 18-9
vi. Other errors ..................................................................................................... 18-9
vii. A summary of laser measurement system errors ...................................... 18-10
19. TROUBLESHOOTING .................................................................................. 19-1
20. TECHNICAL DATA ....................................................................................... 20-1
A. SYSTEM SPECIFICATIONS ..................................................................................... 20-1
B. LASER HEAD ........................................................................................................ 20-1
C. LASER HEAD OUTPUTS - ANALOG ...................................................................... 20-2
D. LASER HEAD OUTPUTS – DIGITAL, TYPE 1 .......................................................... 20-2
E. LASER HEAD OUTPUTS – DIGITAL, TYPE 2 .......................................................... 20-2
F. LASER HEAD OUTPUTS – EXTENSION CONNECTOR PINOUT .............................. 20-3
G. SYSTEM WORK CONDITIONS ................................................................................ 20-4
H. POWER SUPPLY .................................................................................................... 20-4
I. PC INTERFACE ..................................................................................................... 20-4
J. ENVIRONMENT COMPENSATION ......................................................................... 20-4
21. INDEX ..................................................................................................................... 1
Page 12

INTRODUCTION
1-1 www.lasertex.eu
1
1. INTRODUCTION
Laser measurement system HPI-3D is a two frequency laser interferometer
intended to be used mainly in machine geometry measurements. Its small size and
low weight simplify transportation and make the instrument especially useful for
service applications. Software version for Windows XP/Vista/7/8 and automation of
many measurement processes make the interferometer easy to use. Software,
compliant with ISO 230-2 and similar norms, enable making rapports and diagrams.
It is possible to choose statistical results processing according to norms: ISO 230-2
(European), VDI/DGQ 3441 (German), NMTBA (USA), BSI BS 4656 Part 16 (British)
and PN-93 M55580 (Polish).
Laser Measurement System HPI-3D is highly configurable device although
already in its basic configuration it allows performing the complicated measurements
at highest possible precision. Available options will be described below in this user
manual.
Very good technical parameters of the interferometer allow using it in scientific
laboratories, for precision positioning, for scaling optical and magnetic measurement
systems, etc.
a. Safety considerations
The Laser Interferometer HPI-3D is a Safety Class I product designed and
tested in accordance with international safety standards. It is also a Class II Laser
product conforming to international laser safety regulations. The instrument and the
manual should be inspected and reviewed for safety markings and instructions
before operation.
Page 13

INTRODUCTION
1-2 www.lasertex.eu
1
b. Warnings
Although the laser measurement system HPI-3D is design to be used in harsh
environment, the following conditions must be met:
The Laser Head must not be put near strong magnetic fields.
The head should not be unscrewed from its base and if it is, it may not be put
on a heat sink (e.g. thick metal plate).
The head must not be thrown or dropped.
Keep the optical components clean and avoid scratching them.
When the optics is dusted, clean it with pure alcohol.
Do not use the system beyond its work conditions.
c. Compliance Information
Page 14

INTRODUCTION
1-3 www.lasertex.eu
1
EC-DECLARATION OF CONFORMITY 2012
Wroclaw, 2012-04-20
Manufacturer
LASERTEX Co LTD.
Radzionkowska 17
51-506 Wrocław
Poland
Hereby certifies on its sole responsibility that the following product:
Laser Measurement System HPI-3D
which is explicitly referred to by this Declaration meet the following directives and standard(s):
Directive 2006/95/EC
Electrical Apparatus
Low Voltage Directive
- EN 61010-1:2011
Directive 2006/42/EU
Machinery Directive
- EN 60825-1:2007
Directive 2004/108/EU
Electromagnetic Comatibility:
- EN 61326-1:2006
- EN 61000-4-2:2011
- EN 61000-4-6:2007
- EN 61000-4-8:2010
- EN 61000-4-11:2007
- EN 55011:2007
- EN 55022:2011
Documentation evidencing conformity with the requirements of the Directives is kept available for
inspection at the above Manufacture.
President, Janusz Rzepka PhD
Page 15

QUICK START
2-1 www.lasertex.eu
2
2. QUICK START
The information presented in this chapter is only for quick start. More detailed
information can be found in the following chapters.
a. Main features
The HPI-3D is a device for contact measurement of the velocity of the moving
object.
The device operates according to the laser interferometer principle (see
Principles of Operation chapter). The Doppler shift phenomenon is used.
The basic measurement unit is the wavelength of the laser, i.e. 632nm.
The functionality of the instrument depends on the type of used optical
components.
The HPI-3D is can be used either as a stand alone device or with a PC
computer and the dedicated HPI Software.
b. How it works
The HPI-3D measures shift of the moving element in relevance to the reference
element as shown in the figure 2.1. It is important to notice, that the relative
movement and not the absolute position of any of the elements is detected!
Page 16
QUICK START
2-2 www.lasertex.eu
2
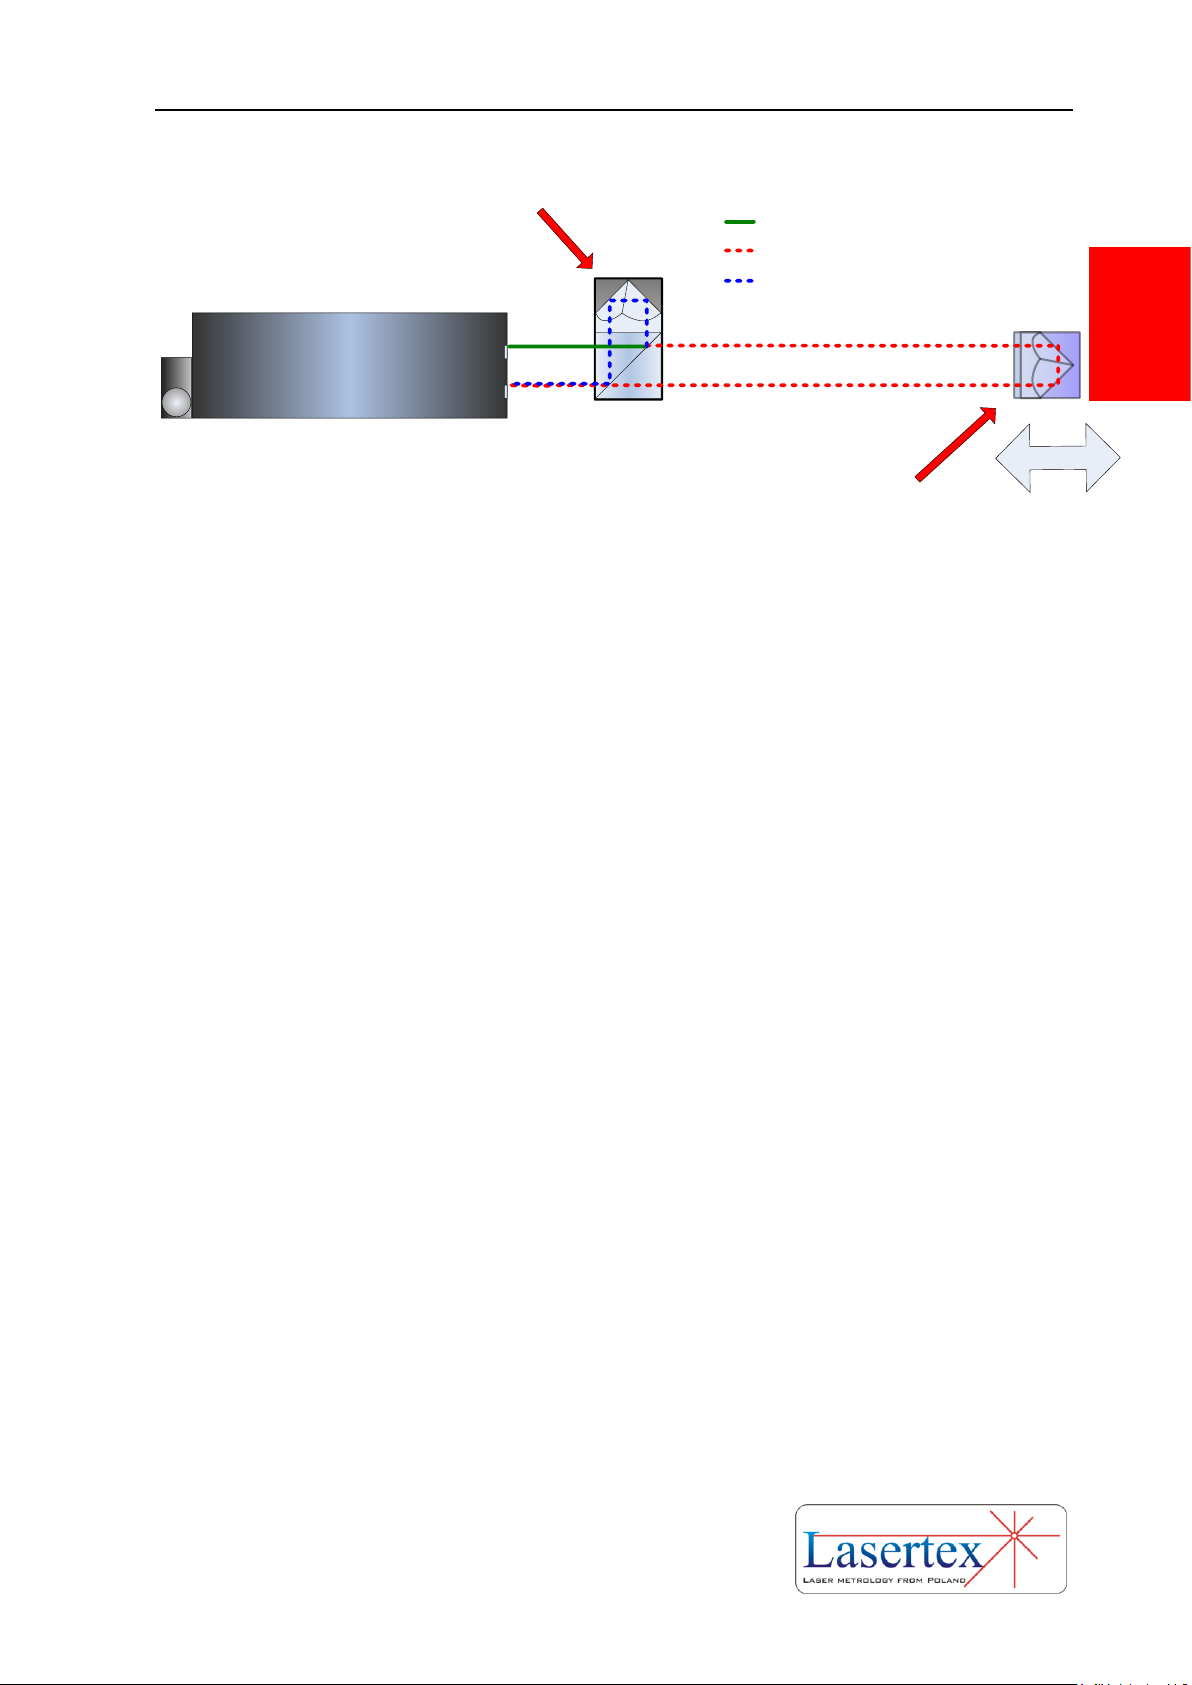
LASER HEAD
Horizontal & Vertical polarization
Horizontal polarization
Vertical polarization
Reference element
Moving element
FIG. 2.1. ILLUSTRATION OF THE PRINCIPLE OF OPERATION - LINEAR OPTICS
i. Linear optics
i. To the linear optics belong Linear Interferometer IL1 and Linear
Retroreflector RL1.
The operation of the HPI-3D with the linear optics used is shown in the figure
2.1. The laser outputs the laser beam consisting of two polarizations: Horizontal (H)
and Vertical (V). The Reference element (IL1) splits the beam into two parts. The H
polarized beam is reflected back to laser and the V polarized beam is directed into the
measurement path. The frequency of the V beam is changed according to the Doppler
Effect when the moving element is in motion.
The linear optics is mainly used for measurement of:
Shift
Velocity
Acceleration
Vibrations
Straightness with 3D method
Squareness with 3D method (RE3D element required)
Parallelism with 3D method (RE3D element required)
ii. Angular optics
To the angular optics belong Angular Interferometer IK1 and Angular
Retroreflector RK1.
Page 17
QUICK START
2-3 www.lasertex.eu
2
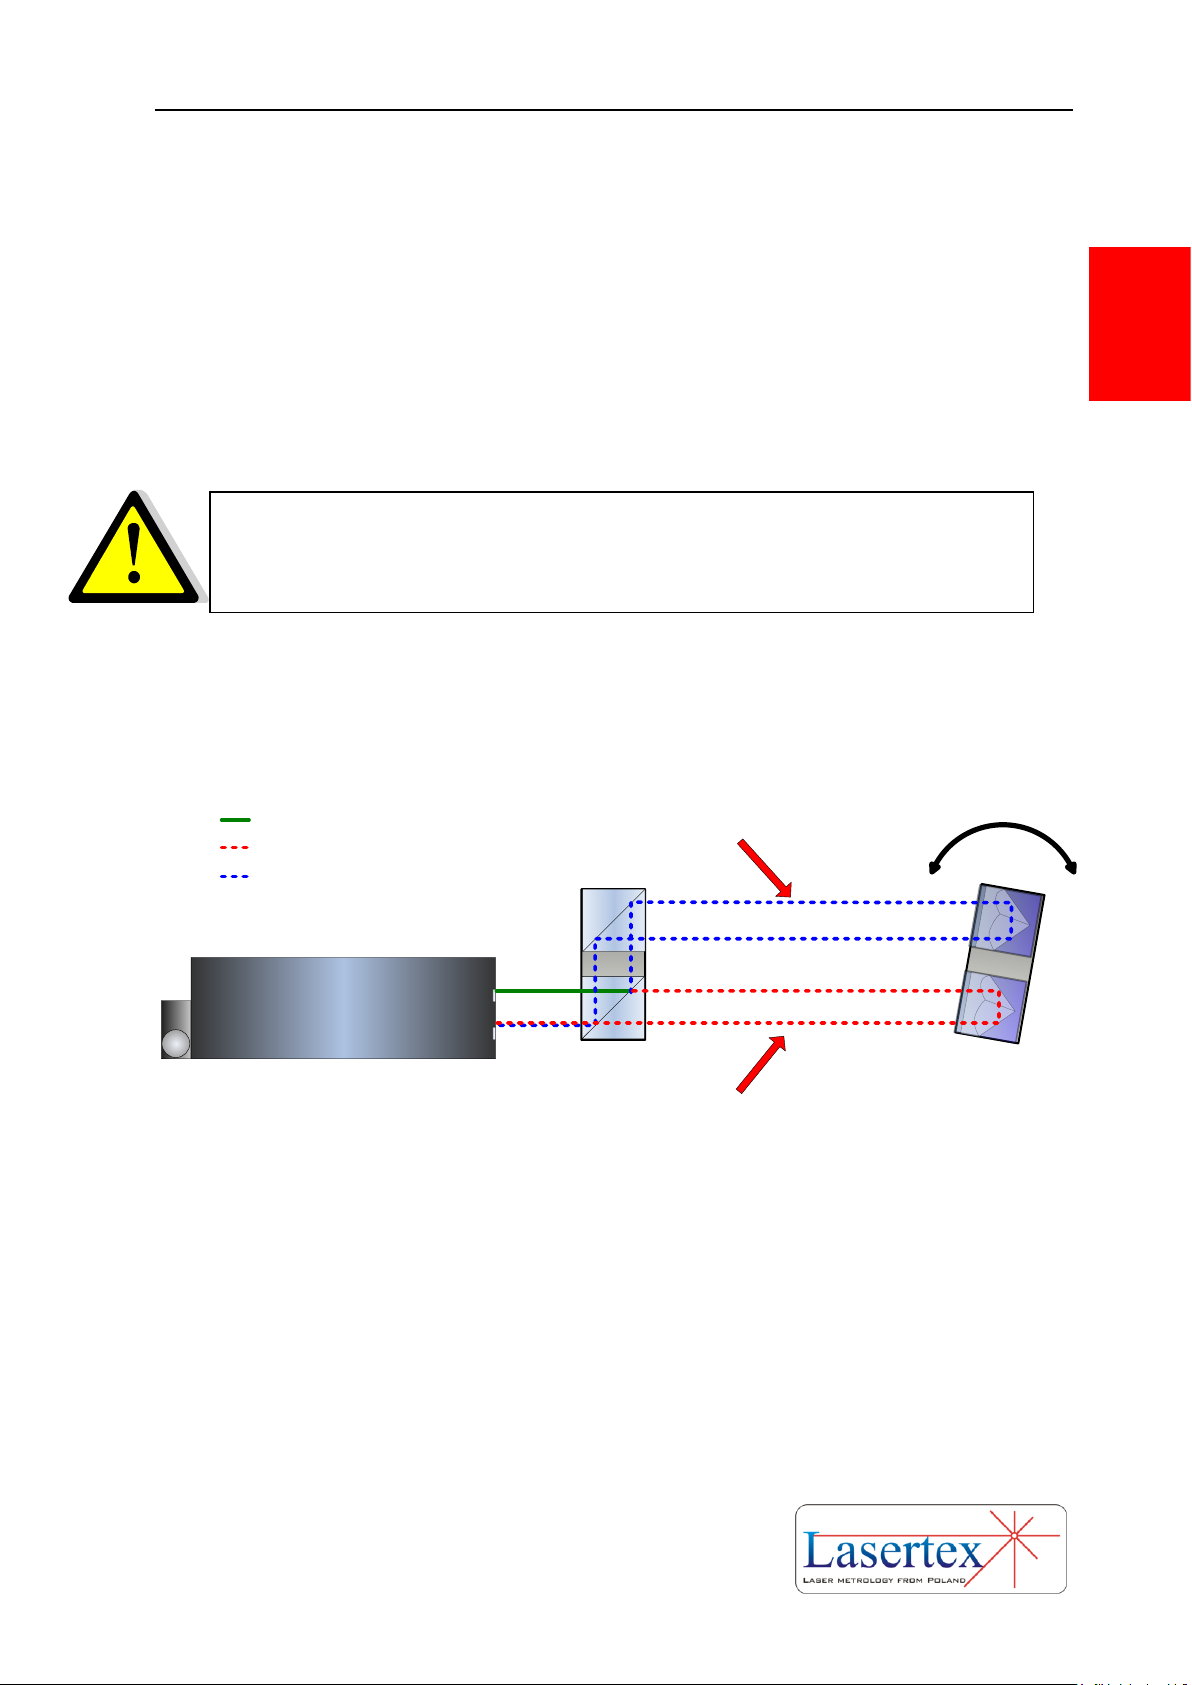
The operation of the HPI-3D with the angular optics used is shown in the
figure 2.2. The laser outputs the laser beam consisting of two polarizations:
Horizontal (H) and Vertical (V). The IK1 splits the beam into two parts. Both beams
are directed into the measurement path but are parallel shifted by 50.8 mm. The
frequency of both beams is changed according to the Doppler Effect when the RK1
element is in motion.
The frequency change of both beams is the same when RK1 and IK1 are shifted
linearly. In this case no measured signal is detected by the laser head.
The laser detects movement only when the IK1 and RK1 are rotated against
each other. In this case the frequency change of the H beam is different from the
frequency change of the V beam.
RK
1
IK1
LASER HEAD
Horizontal & Vertical polarization
Horizontal polarization
Vertical polarization
Beam Path 1
Beam Path 2
FIG.2.2. ILLUSTRATION OF THE PRINCIPLE OF OPERATION - ANGULAR OPTICS
The angular optics is mainly used for measurement of:
Small angles
Straightness with Angular method
Flatness
Pitch
Yaw
The laser head with angular optics is insensitive to linear
movements.
Page 18
QUICK START
2-4 www.lasertex.eu
2
iii. Wollaston optics
To the angular optics belong Wollaston Prism WP2 and Wollaston
Retroreflector WRP2.
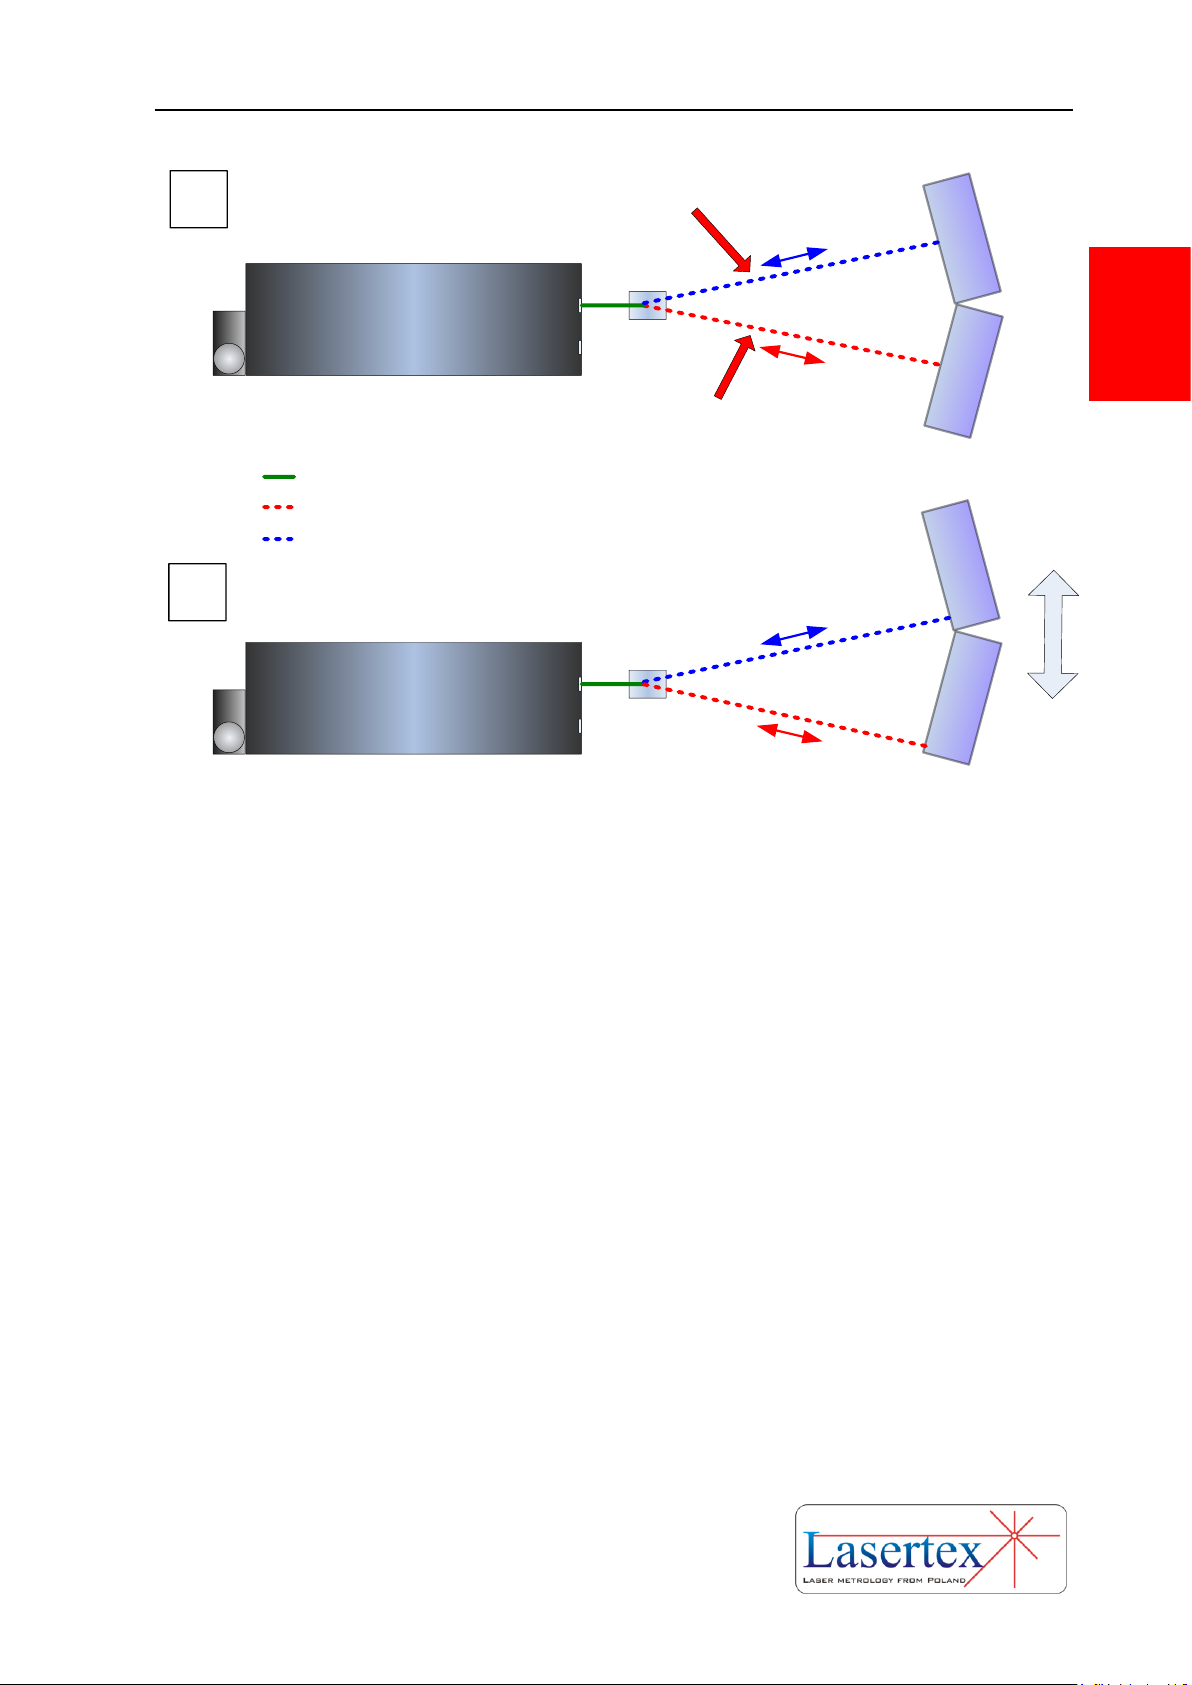
The operation of the HPI-3D with the Wollaston optics used is shown in the
figure 2.3. The laser outputs the laser beam consisting of two polarizations:
Horizontal (H) and Vertical (V). The WP2 splits the beam into two parts. Both beams
are directed into the measurement path. There is a certain angle between the beams.
The frequency of both beams is changed according to the Doppler Effect when the
WP2 element is in motion.
The frequency change of both beams is the same when WP2 and WP2 are
shifted linearly. In this case no measured signal is detected by the laser head.
The laser detects movement only when the WP2 is moved perpendicular to the
beam from the laser. In this case the frequency change of the H beam is different from
the frequency change of the V beam, because the lengths of beam paths 1 and 2 are
different – see figure 2.3
The laser head with Wollaston optics is insensitive to linear
movements.
Page 19
QUICK START
2-5 www.lasertex.eu
2
LASER HEAD
WP2
WRP2
LASER HEAD
WP2
WRP2
Horizontal & Vertical polarization
Horizontal polarization
Vertical polarization
Beam Path 1
Beam Path 2
A
B
FIG.2.3. ILLUSTRATION OF THE PRINCIPLE OF OPERATION - WOLLASTON OPTICS.
BEAMS RETURING TO THE LASER ARE IN THE PLANE OF THE DRAWING.
The Wollaston optics is mainly used for measurement of:
Straightness with Wollaston method
Axes squareness (with REW element)
Axes parallelism (with REW element)
c. How to start
Page 20
QUICK START
2-6 www.lasertex.eu
2
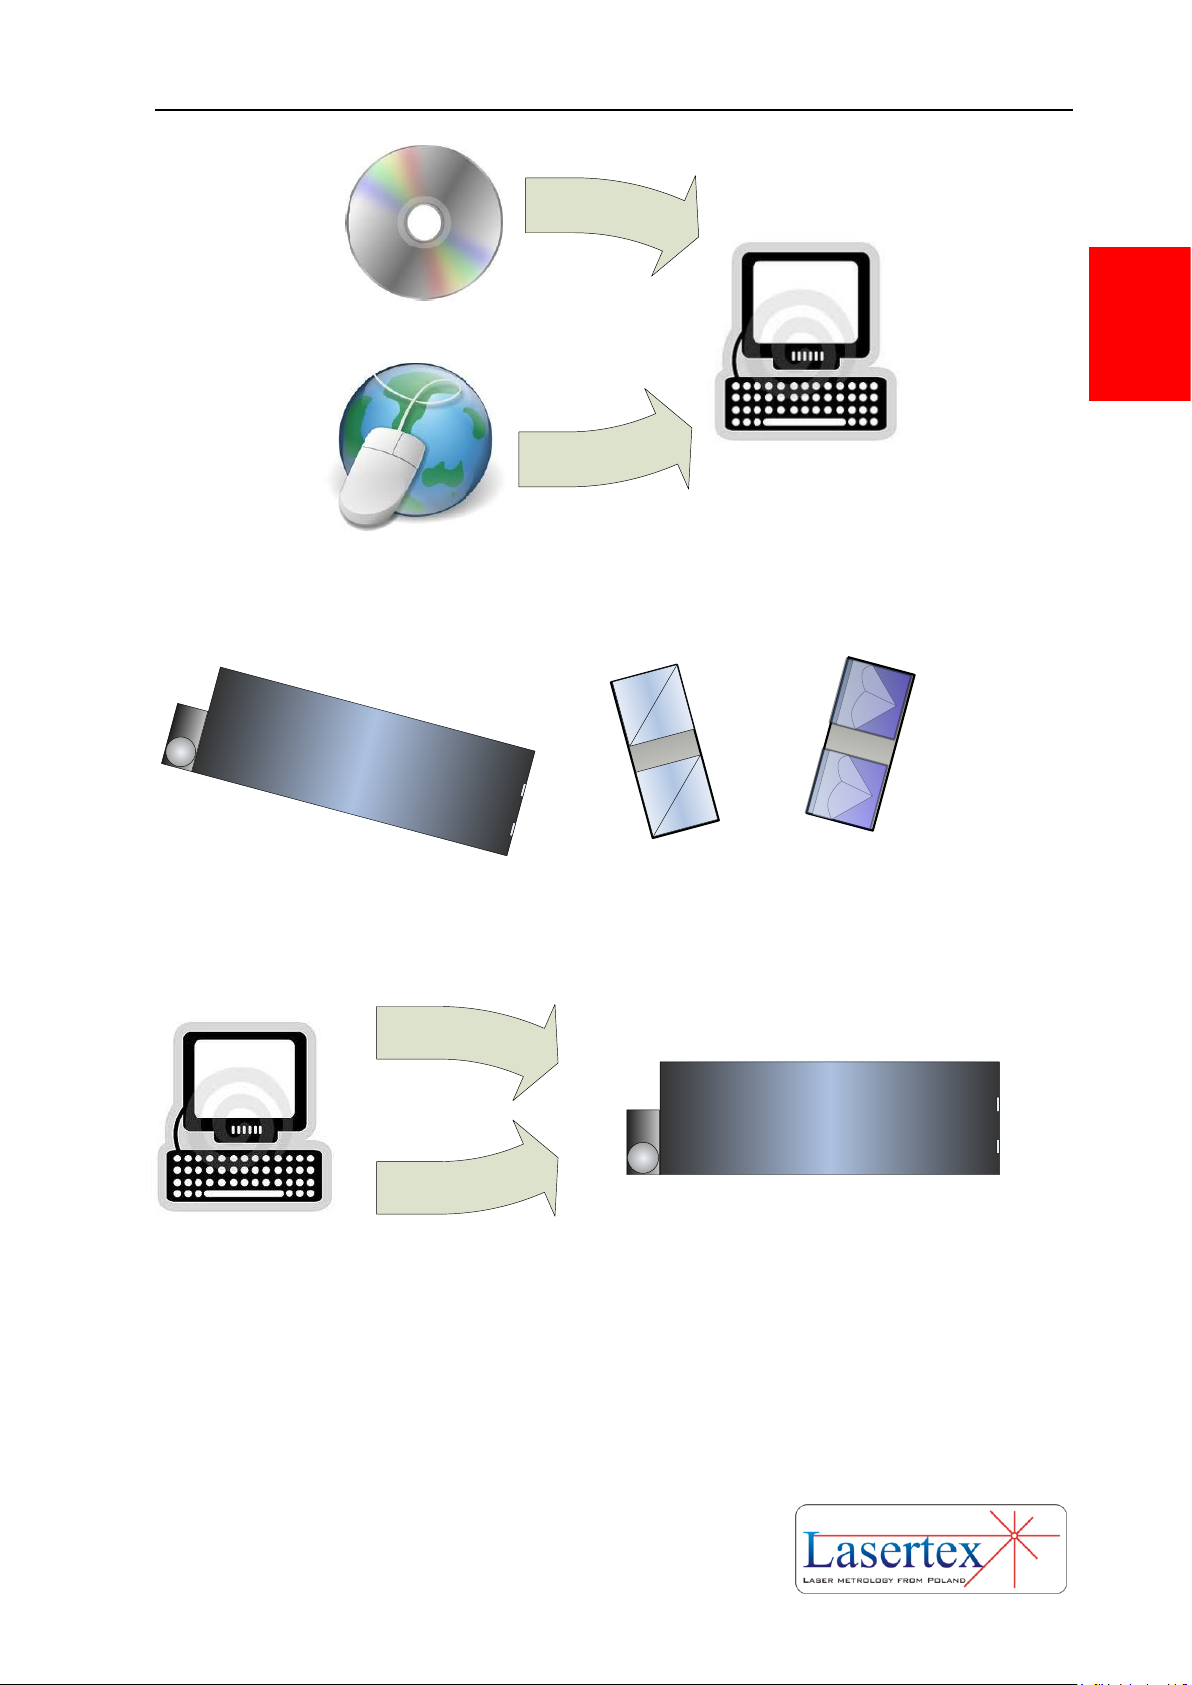
1. Install HPI software from CD or from www.lasertex.eu
LASER HEAD
2. Mount Laser Head, and optical elements on the measured
machine. Connect power supply to the Laser Head.
LASER HEAD
USB
Bluetooth
3. Run HPI Software and connect PC with laser over
USB or over Bluetooth interface
Page 21
QUICK START
2-7 www.lasertex.eu
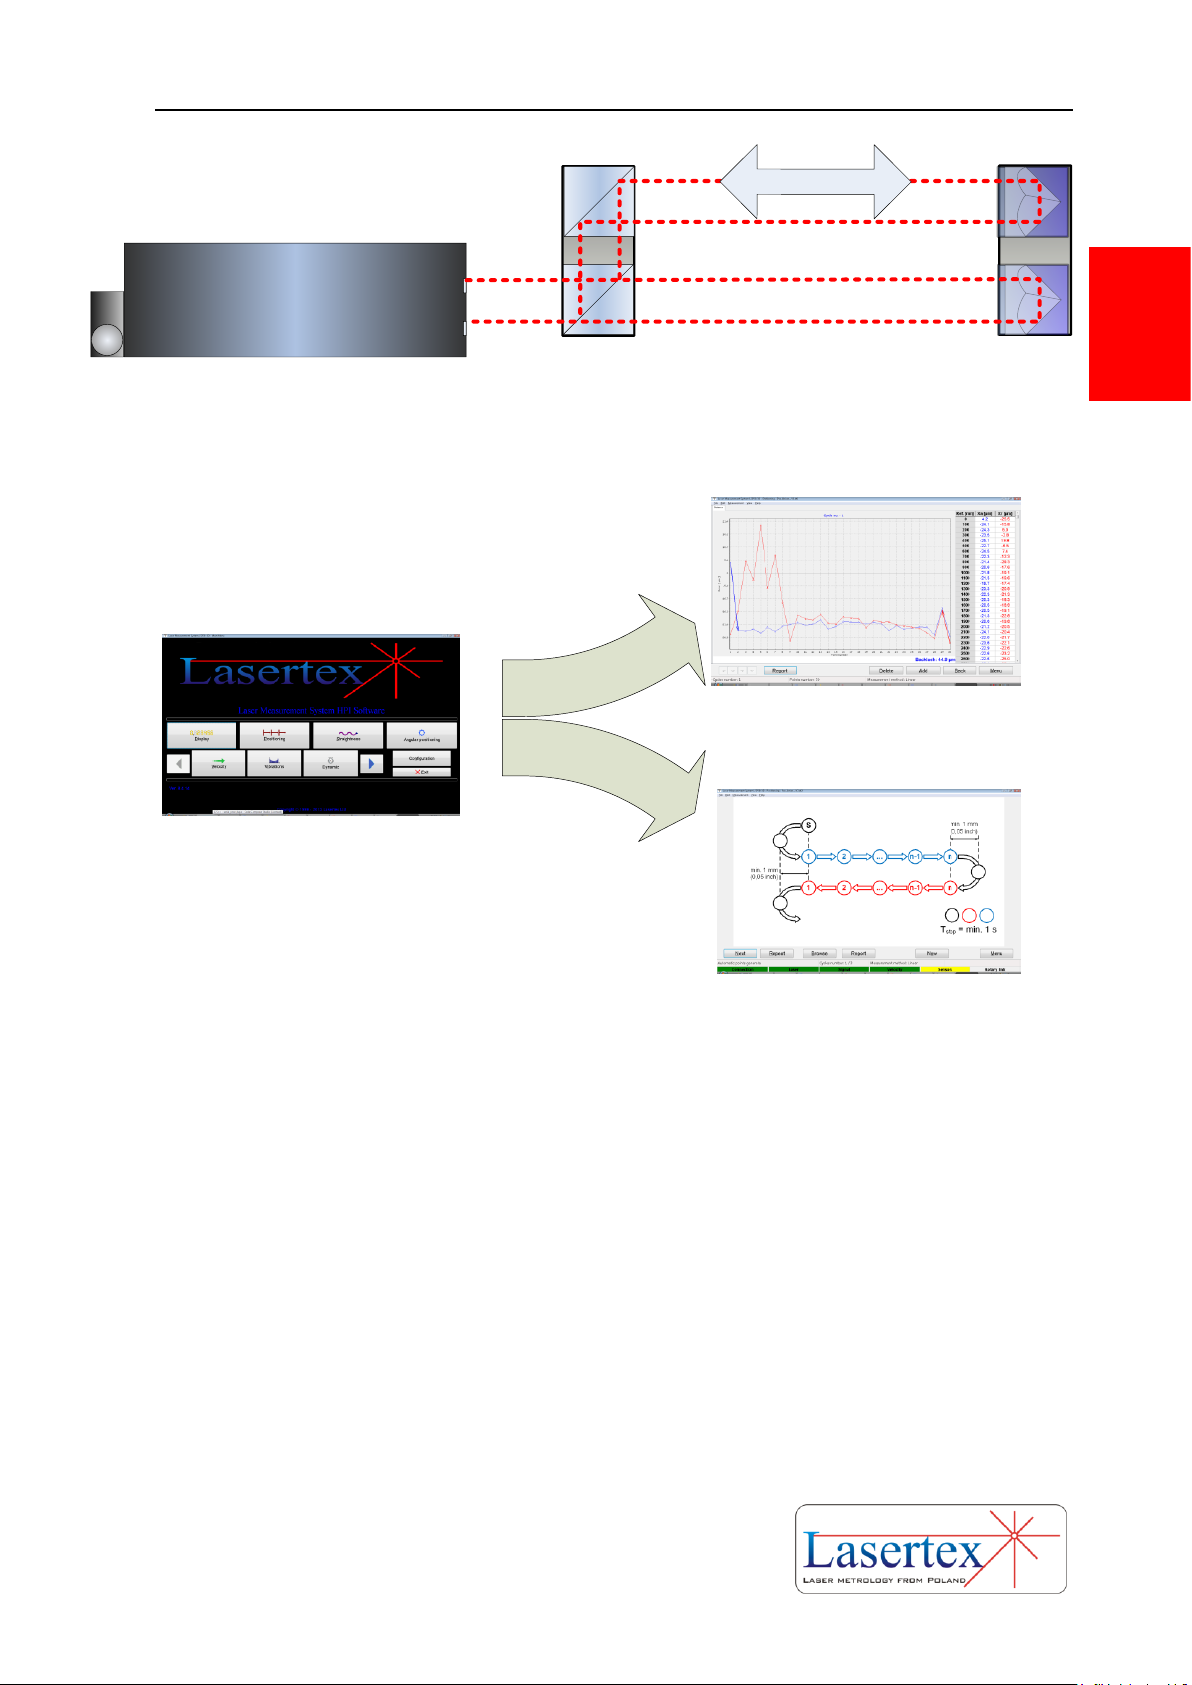
2
LASER HEAD
4. Align optical path
5. Start measurements
Page 22

PREPARATIONS
3-1 www.lasertex.eu
3
3. PREPARATIONS
The Laser Interferometer HPI-3D requires an installation of software "HPI
Software” on a hard disc of a PC computer. The hardware requirements are:
Windows XP/Vista/7/8 system,
CR-ROM
Pentium processor, 1 GHz or better
SVGA graphic card
USB 2.0 or Bluetooth 2.0
a. Software installation
The software installation package is located on the USB memory stick that is
included to the measurement system. HPI_Software_Install application can be
launched from the USB memory. The installation process should start automatically.
FIG. 3.1. ICON OF THE SETUP APPLICATION.
Following components have to be installed for proper operation of HPI-3D
system:
HPI Software application,
Directory of the languages Languages,
FTDI Driver for USB,
documents folder with the manual and other documents (depending on a
system version),
Database BDE (Borland Database Environments)
Page 23
PREPARATIONS
3-2 www.lasertex.eu
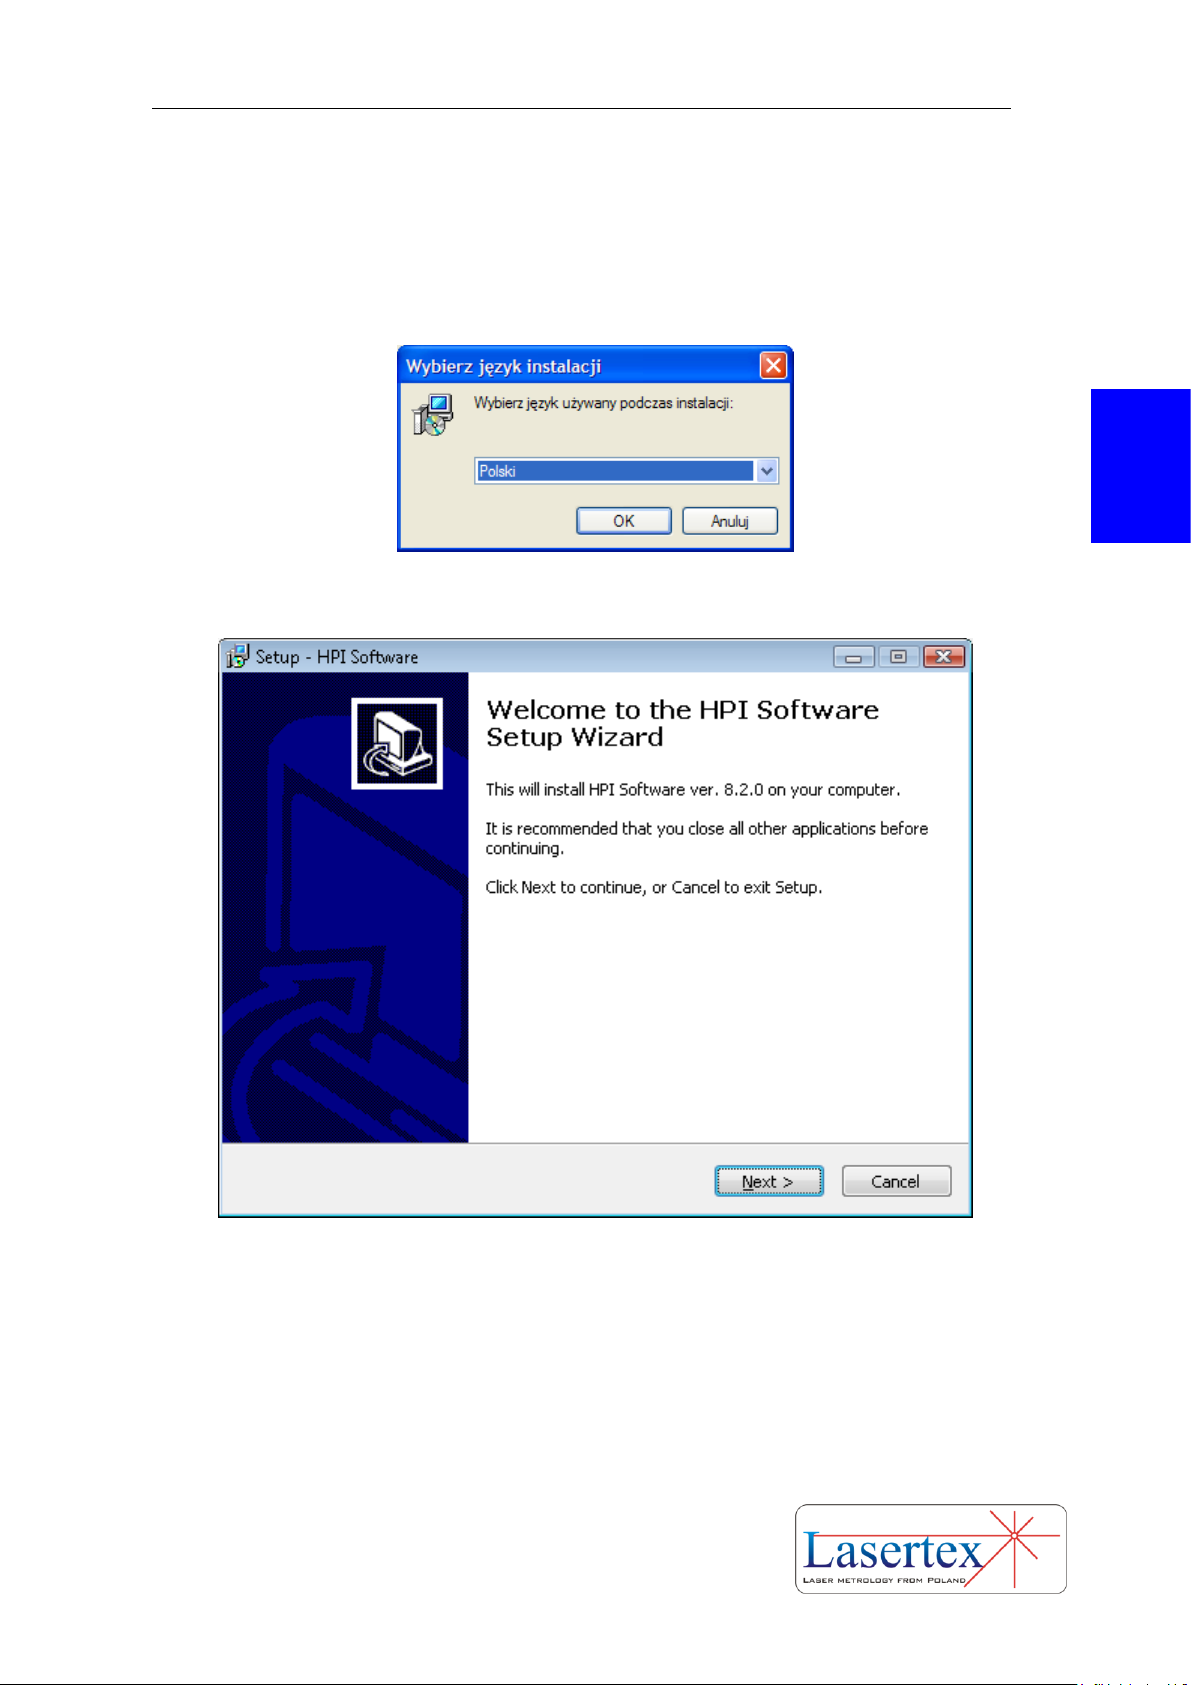
3
During the installation process necessary parameters have to be set by the user.
In the figure 3.2 there is shown a first windows that appears during installation. It
allows choosing the installation language.
FIG.3.2. INSTALLATION LANGUAGE SETUP WINDOW.
FIG.3.3. WELCOME WINDOW.
Page 24
PREPARATIONS
3-3 www.lasertex.eu
3
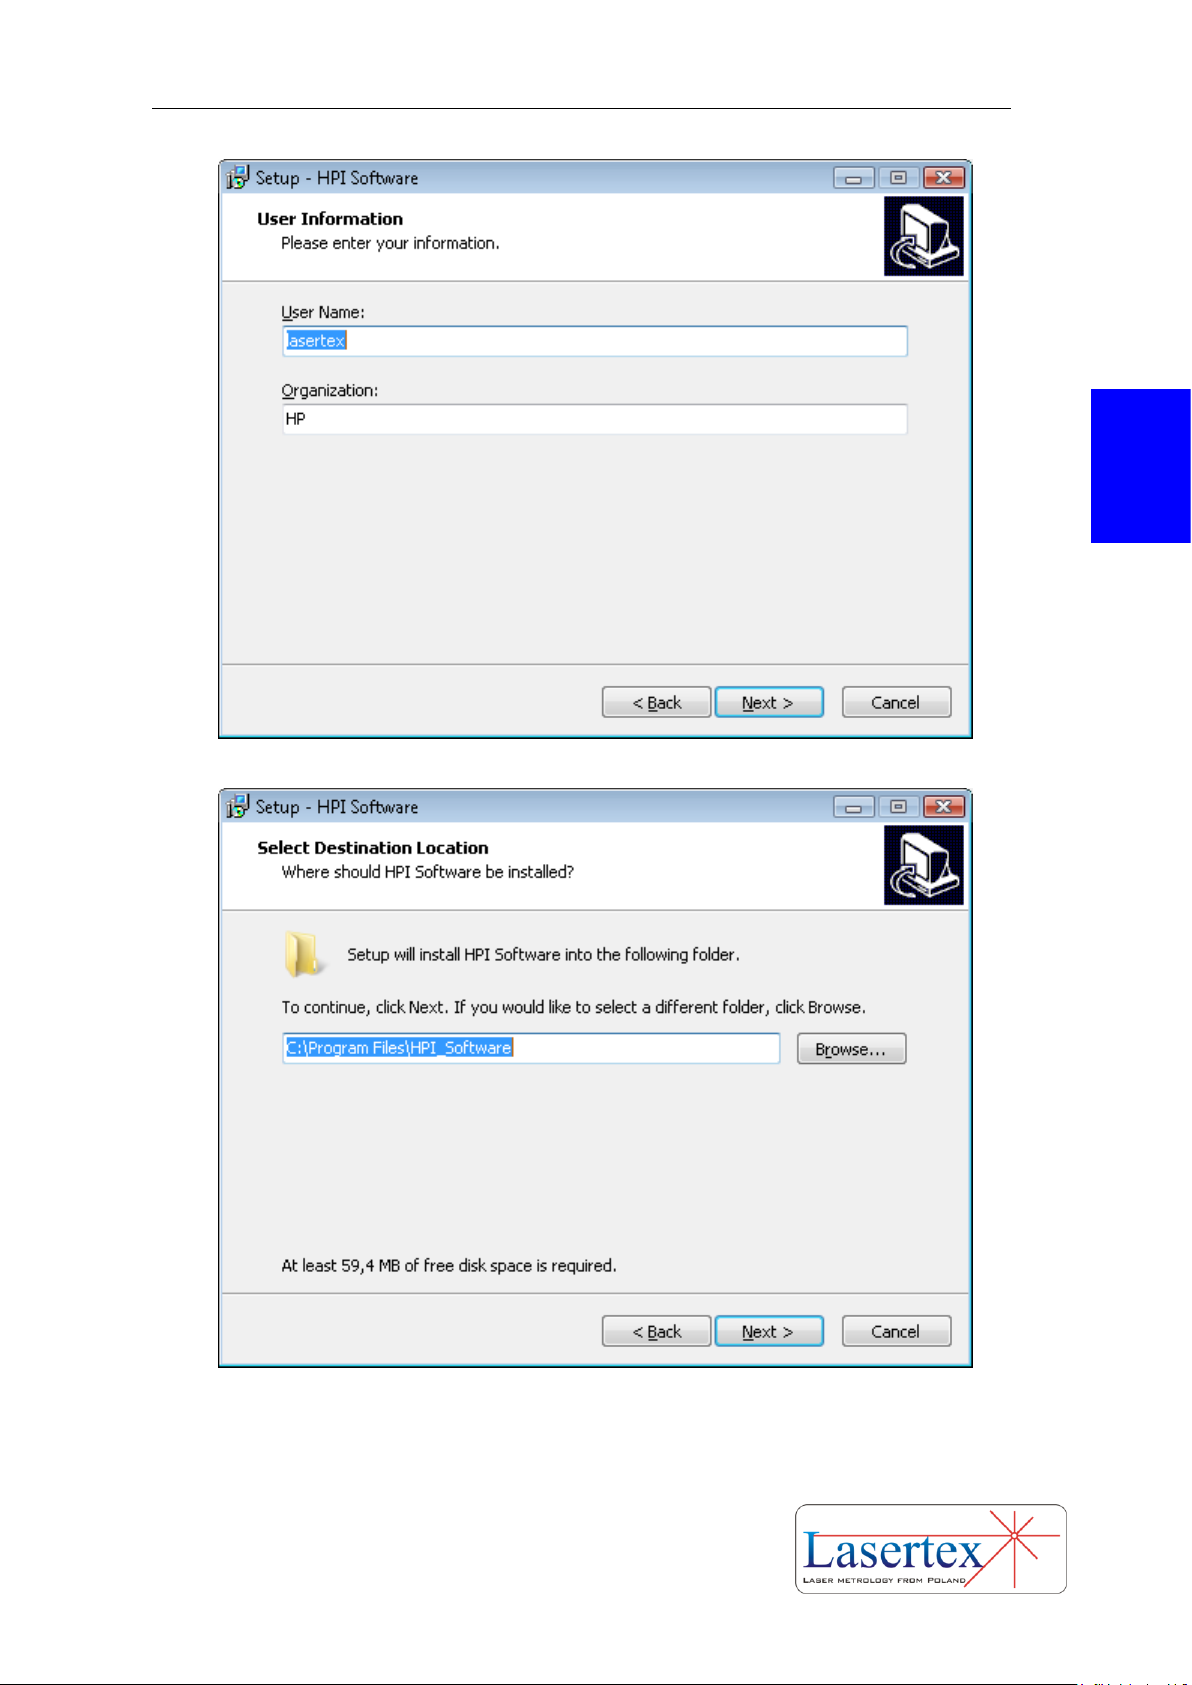
FIG.3.4. USER INFORMATION WINDOW.
FIG.3.5. PROGRAM DESTINATION FOLDER WINDOW.
Page 25
PREPARATIONS
3-4 www.lasertex.eu
3
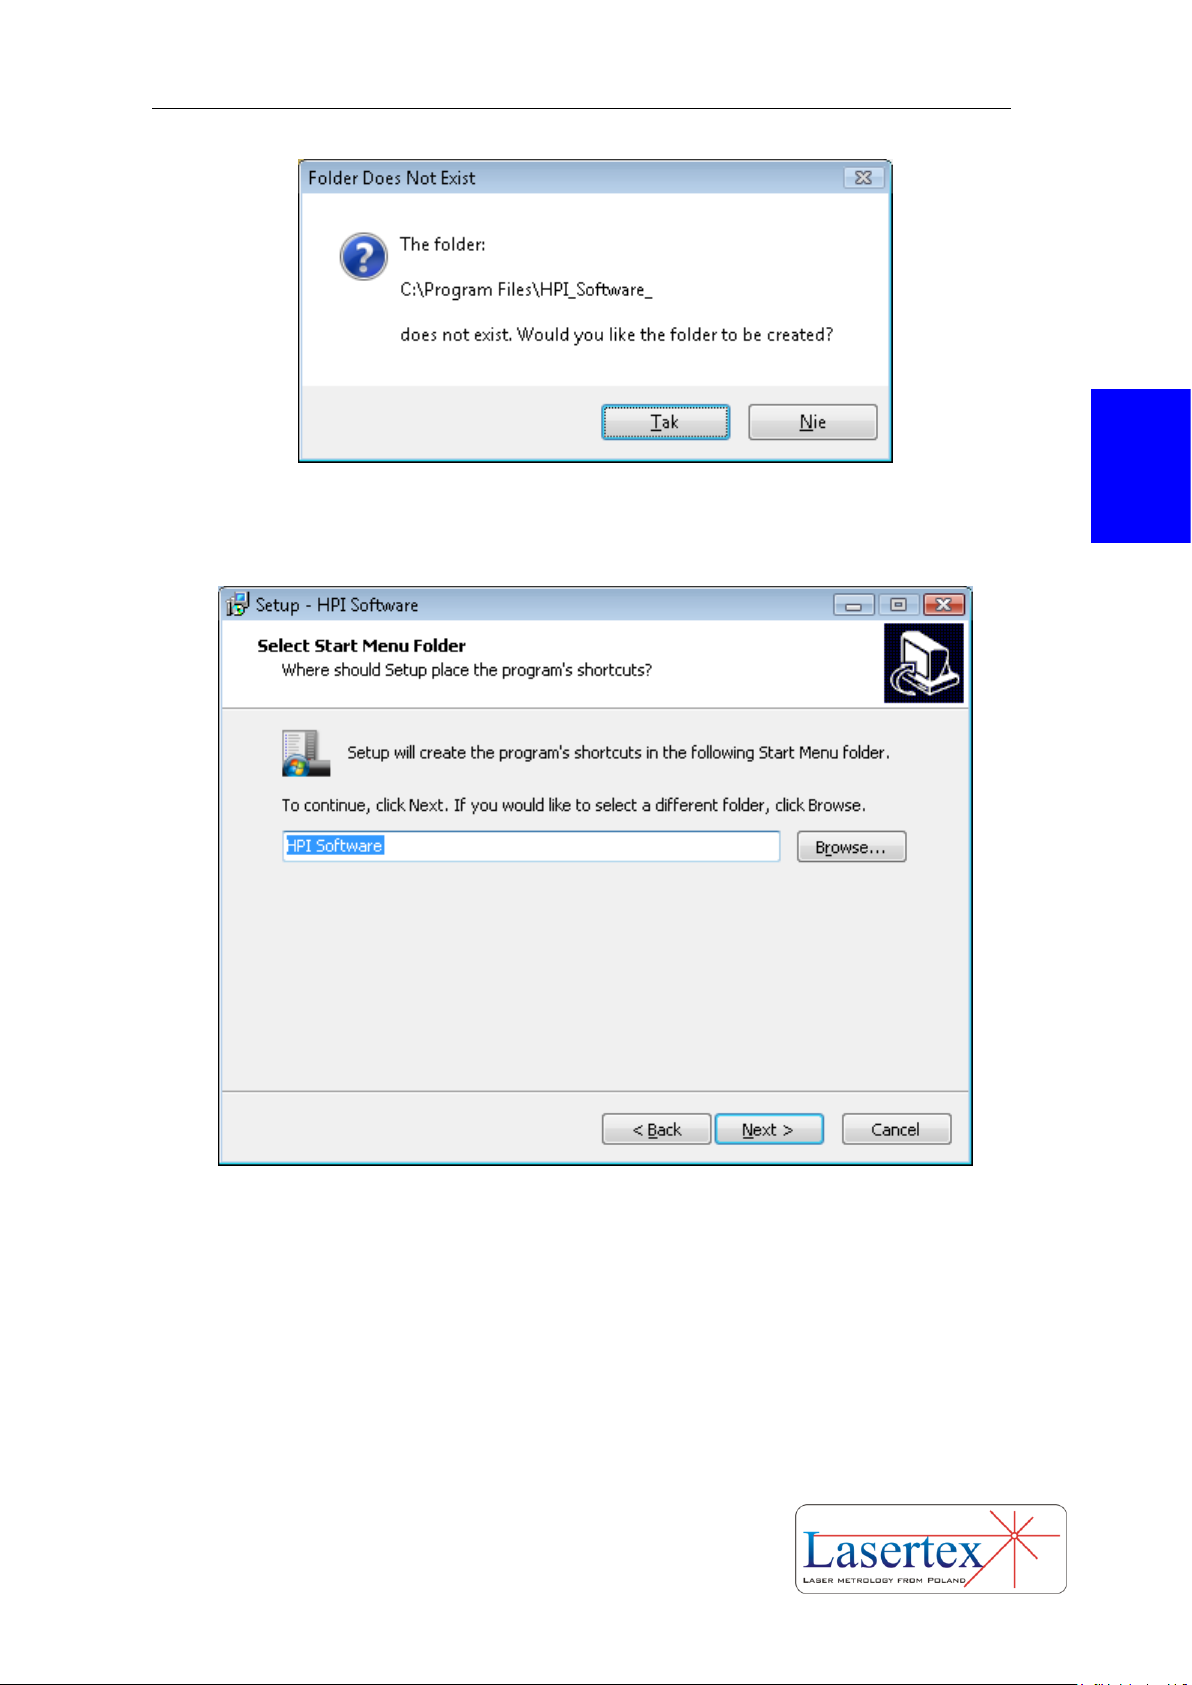
FIG.3.6. WINDOW APPEARING WHEN THE FOLDER NAME DOES NOT EXISTS IN THE CURRENT
INSTALLATION PATH.
FIG.3.7. MENU START FOLDER SLECTION WINDOW.
Page 26

PREPARATIONS
3-5 www.lasertex.eu
3
FIG.3.8. DESKTOP ICON SETUP WINDOW.
FIG.3.9. WINDOW WITH INSTALLATION INFORMATION.
Page 27
PREPARATIONS
3-6 www.lasertex.eu
3
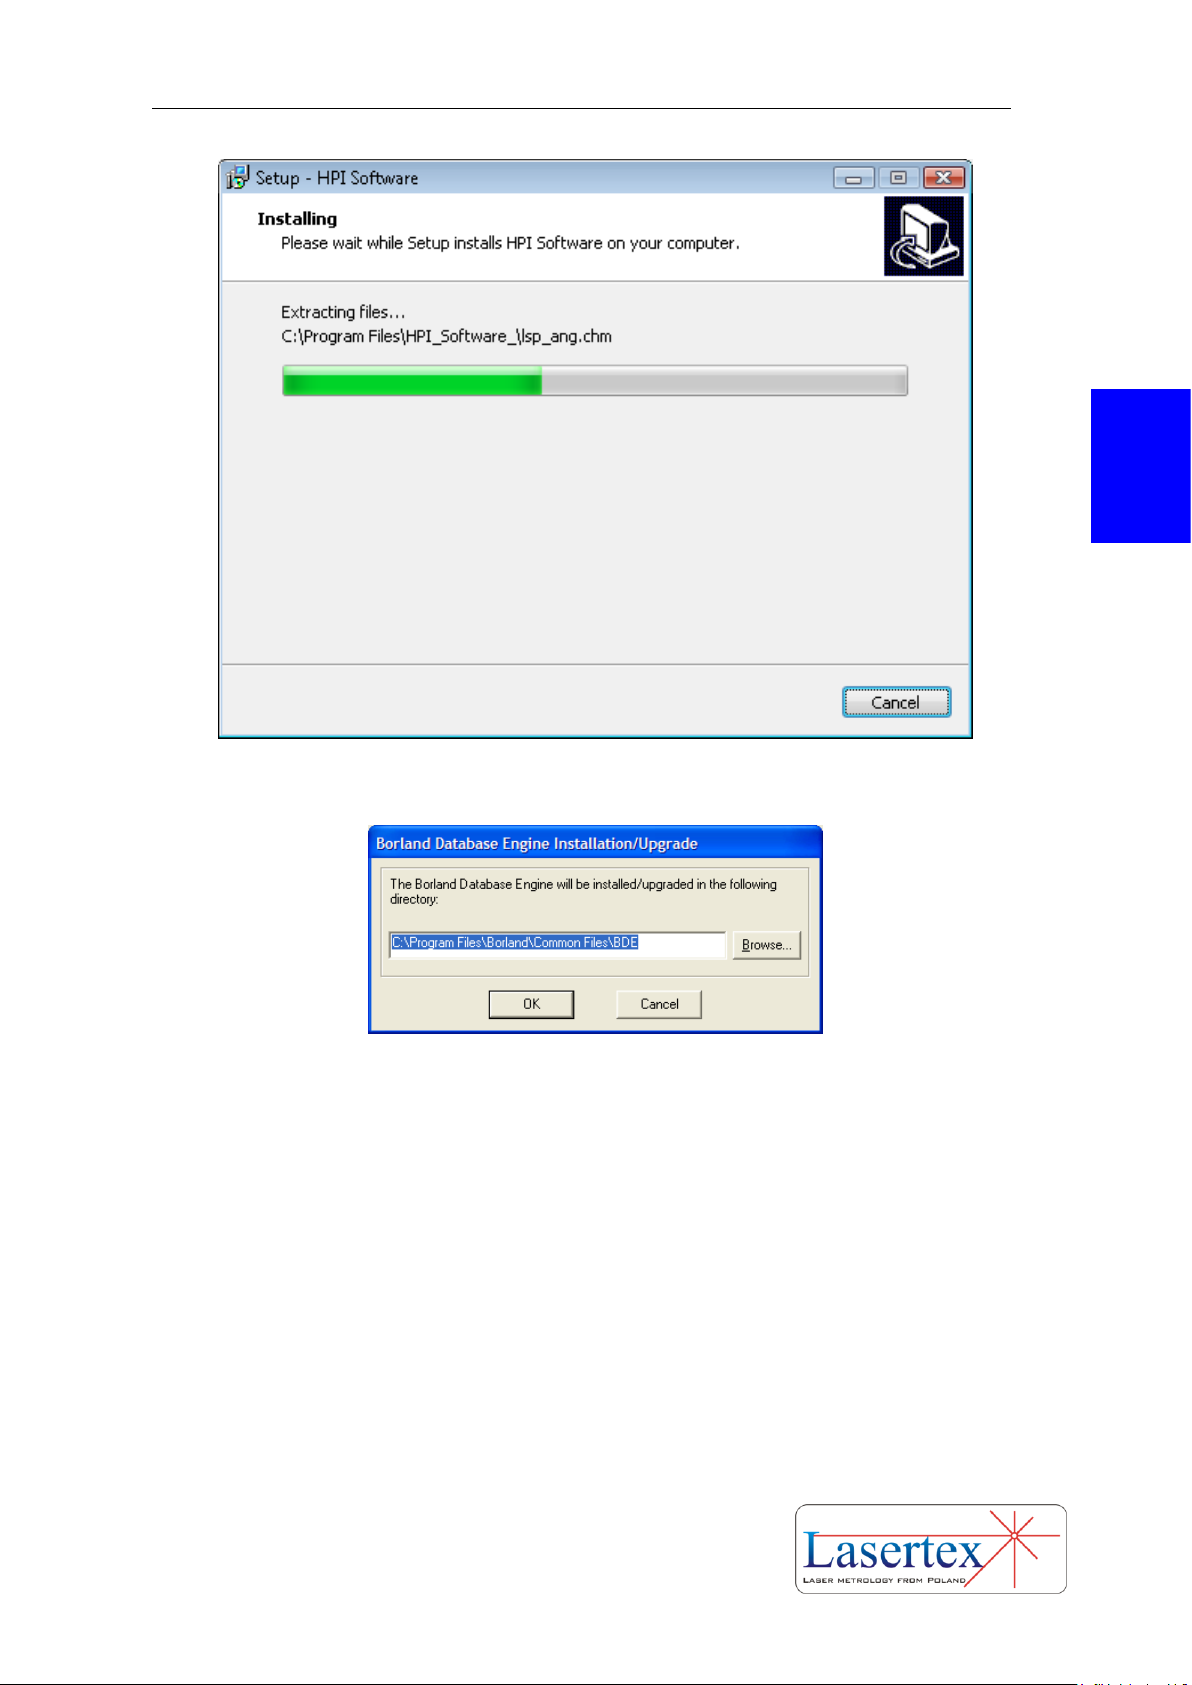
FIG.3.10. INSTALLATION WINDOW DURING DATA COPY OPERATION.
FIG.3.11. BDE (BORLAND DATABASE ENVIRONMENT) DESTINATION FOLDER WINDOW.
Page 28
PREPARATIONS
3-7 www.lasertex.eu
3
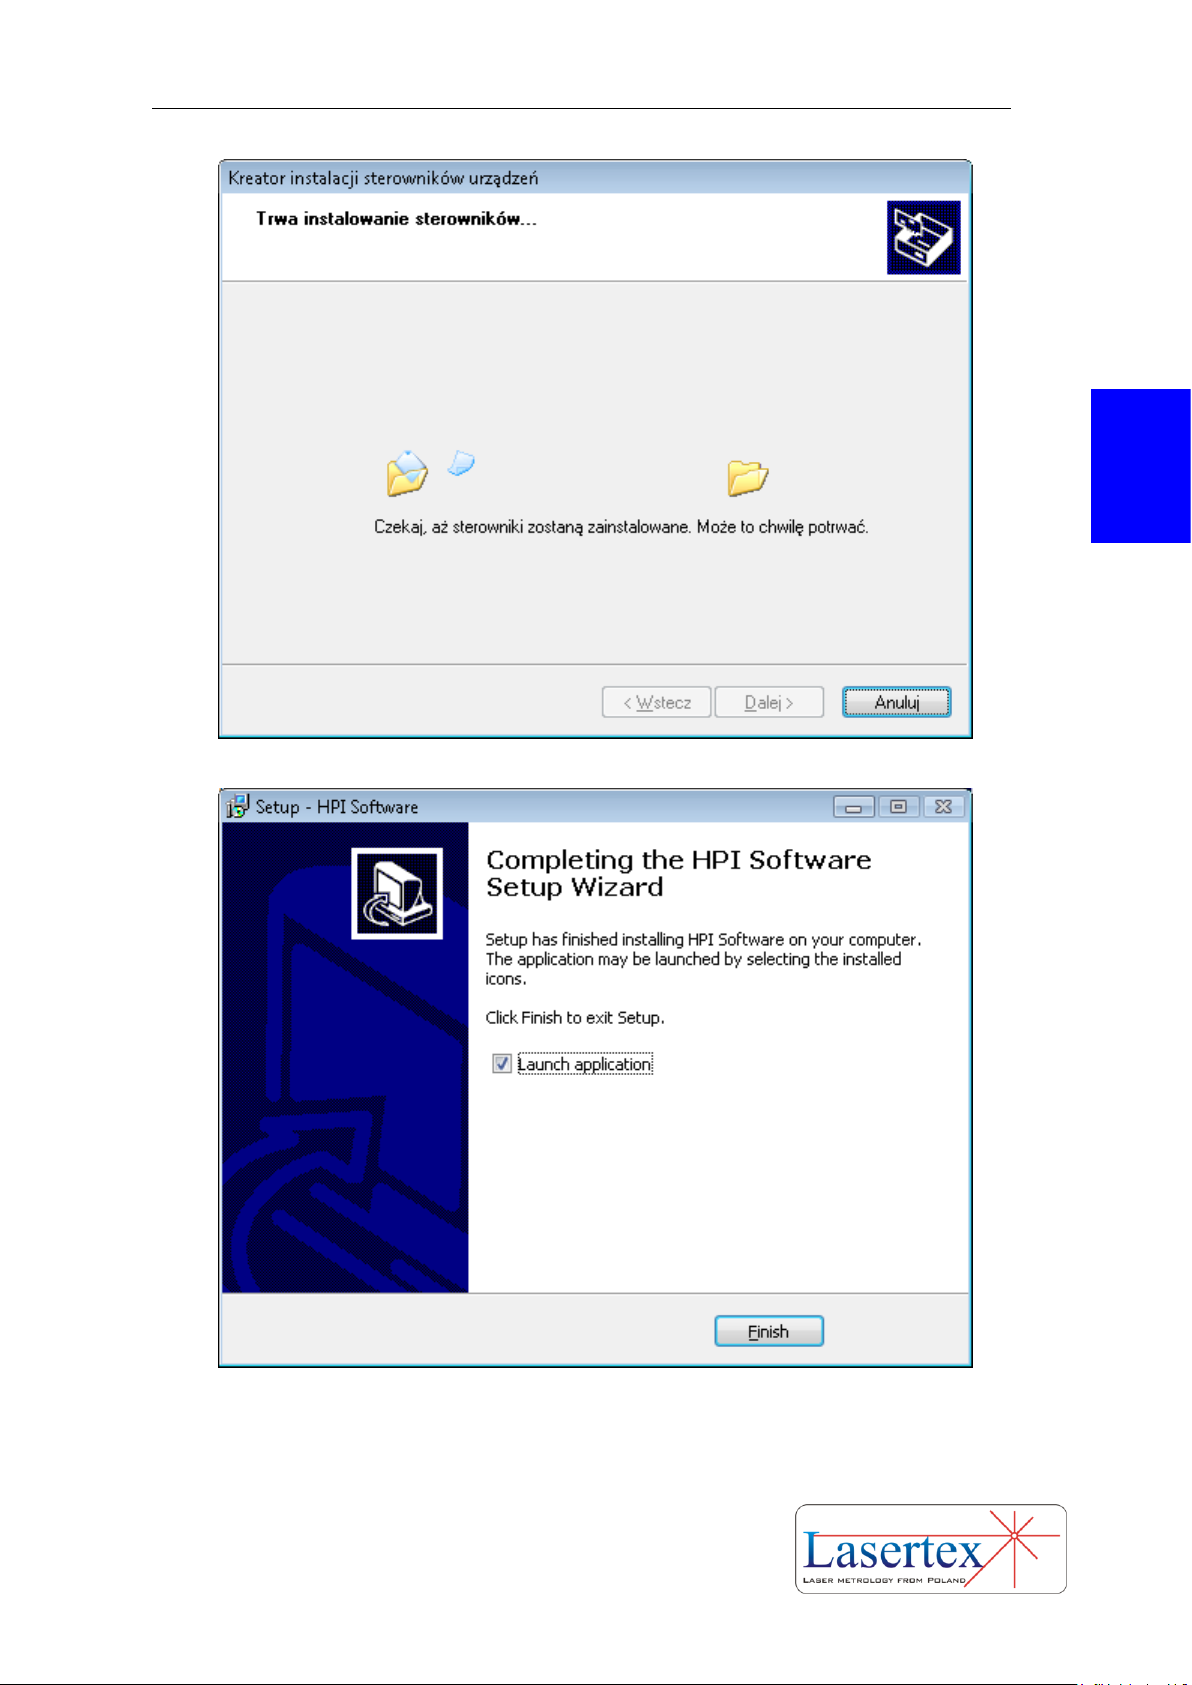
FIG.3.12. FTDI DRIVER INSTALLATION.
FIG.3.13. INSTALLATION SUMMARY WINDOW
Page 29
PREPARATIONS
3-8 www.lasertex.eu
3
In most cases, the installation is semi-automatic requiring only confirmation by
the Enter key.
When the software is installed on the computer, also drivers should be
installed. To complete this process, the system has to be connected by a USB cable to
your PC. Driver installation is performed automatically by Windows.
FIG.3.14. MESSAGE APPEARING WHEN THE NEW USB DEVICE IS FOUND.
FIG.3.15. MESSAGE APPEARING WHEN THE DRIVER FOR HPI-3D DEVICE IS INSTALLED.
The HPI Software application can be launched from the HPI Software folder
located in Programs tab in Windows Start Menu (assuming that the installation
settings are not changed). The application can also be launched from the desktop, if
the shortcut is created during installation.
FIG.3.16. ICON OF HPI SOFTWARE APPLICATION.
In order to uninstall the HPI Software application please choose Uninstall HPI
Software from Menu Start.
FIG.3.17. ICON OF HPI SOFTWARE DEINSTALLATION APPLICATION
Page 30
PREPARATIONS
3-9 www.lasertex.eu
3
b. Elements of the Laser System
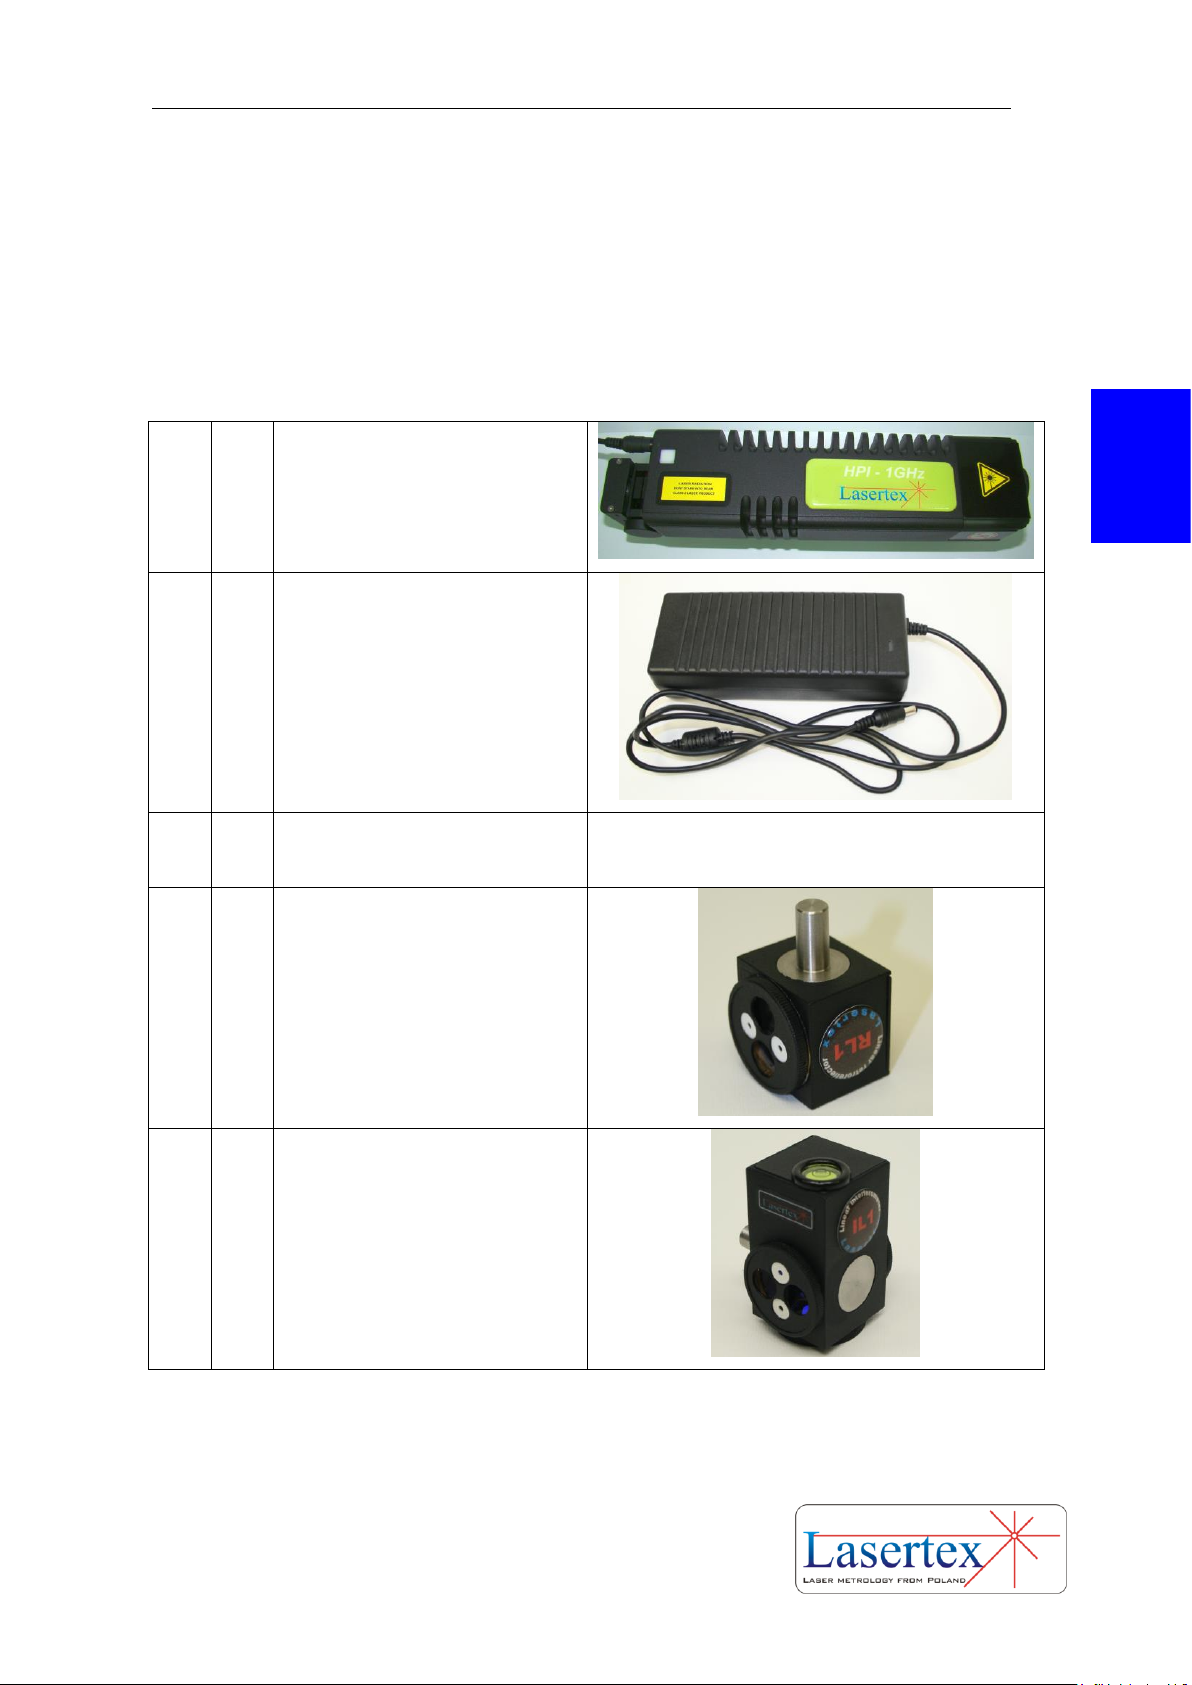
Number of the system elements is configurable and its configuration is related
to the required application. Following items are included in the standard set (for
linear measurements):
1.
1
pcs
Laser head
2.
1
pcs
Power Supply
3.
1
pcs
Tripod stand
4.
1
pcs
Linear retro-
reflector RL1
5.
1
pcs
Linear
interferometer IL1
Page 31
PREPARATIONS
3-10 www.lasertex.eu
3
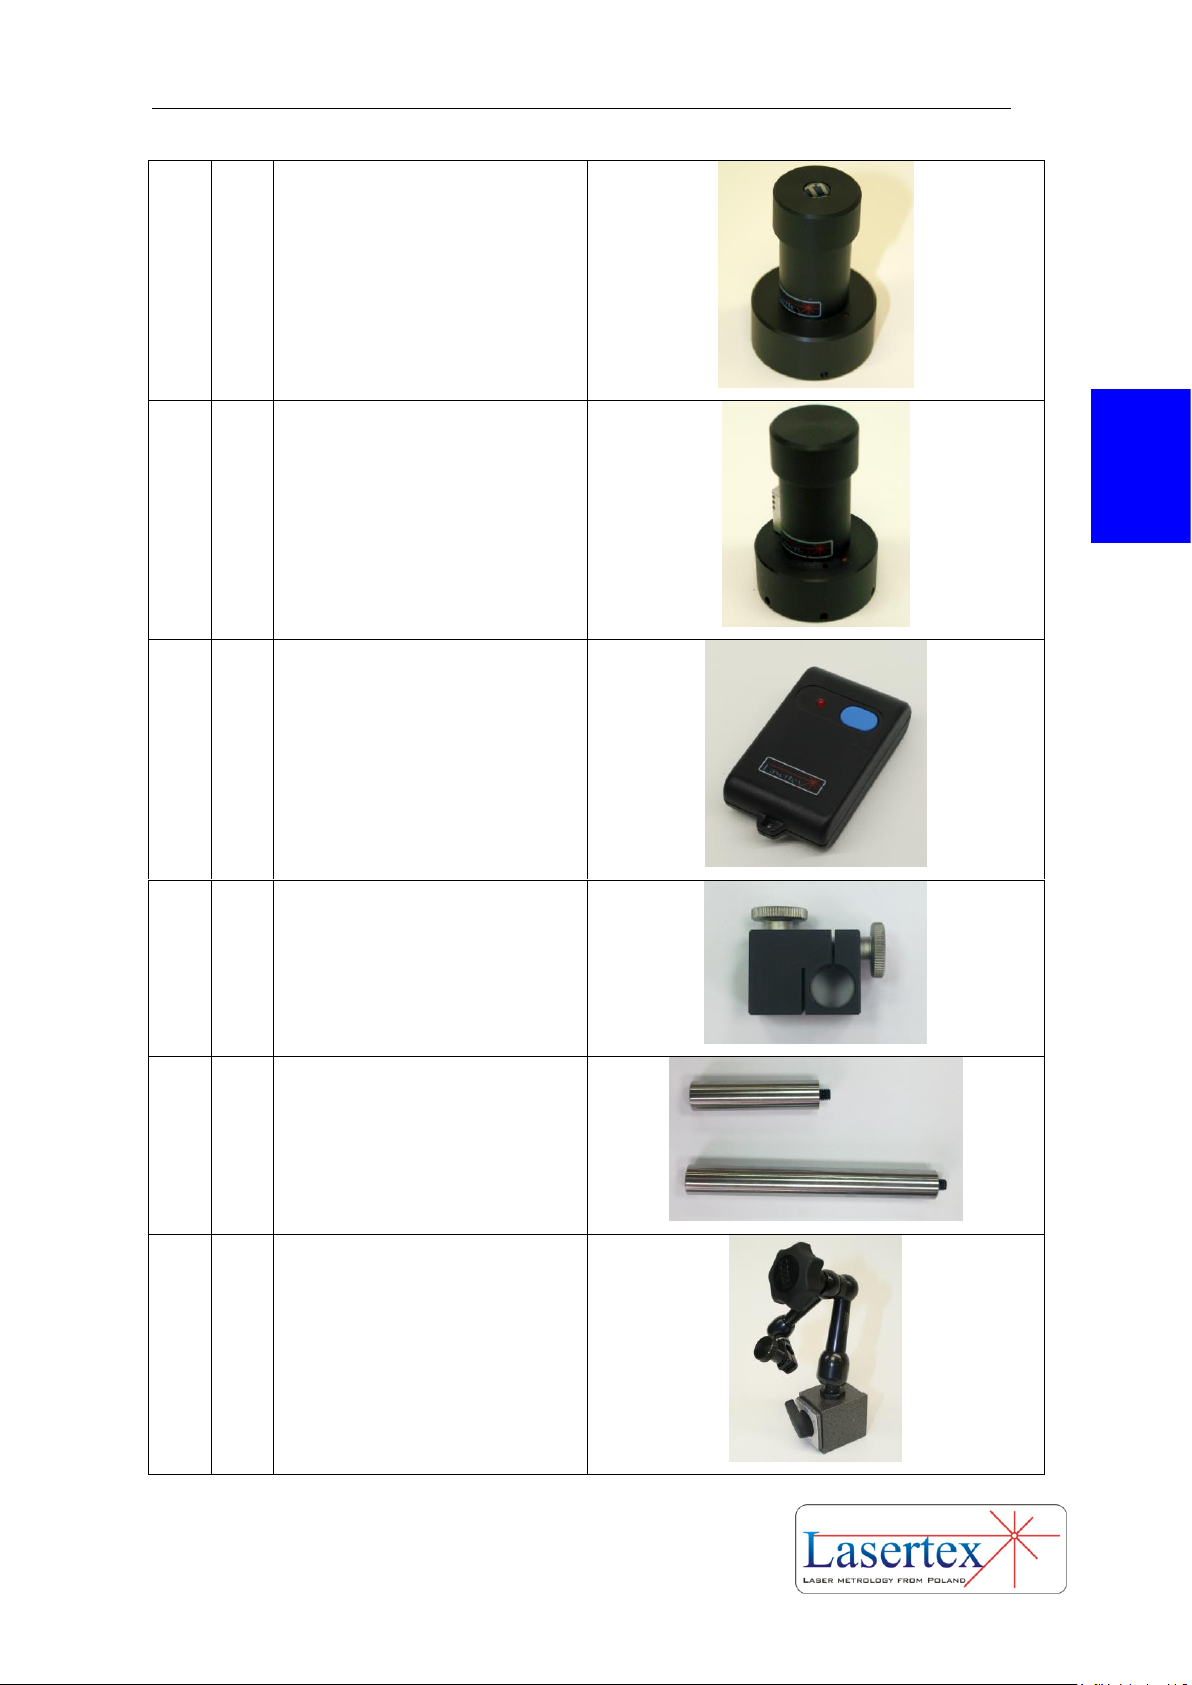
6.
3
pcs
Base
temperature sensor
7.
1
pcs
Air
temperature sensor
8.
1
pcs
Wireless strobe
9.
2
pcs
Holding
block HB1
10.
2
pcs
Stainless rod
SR1
11.
2
pcs
Magnetic
holder UM2
Page 32
PREPARATIONS
3-11 www.lasertex.eu
3
12.
1
pcs
USB Type B
Cable
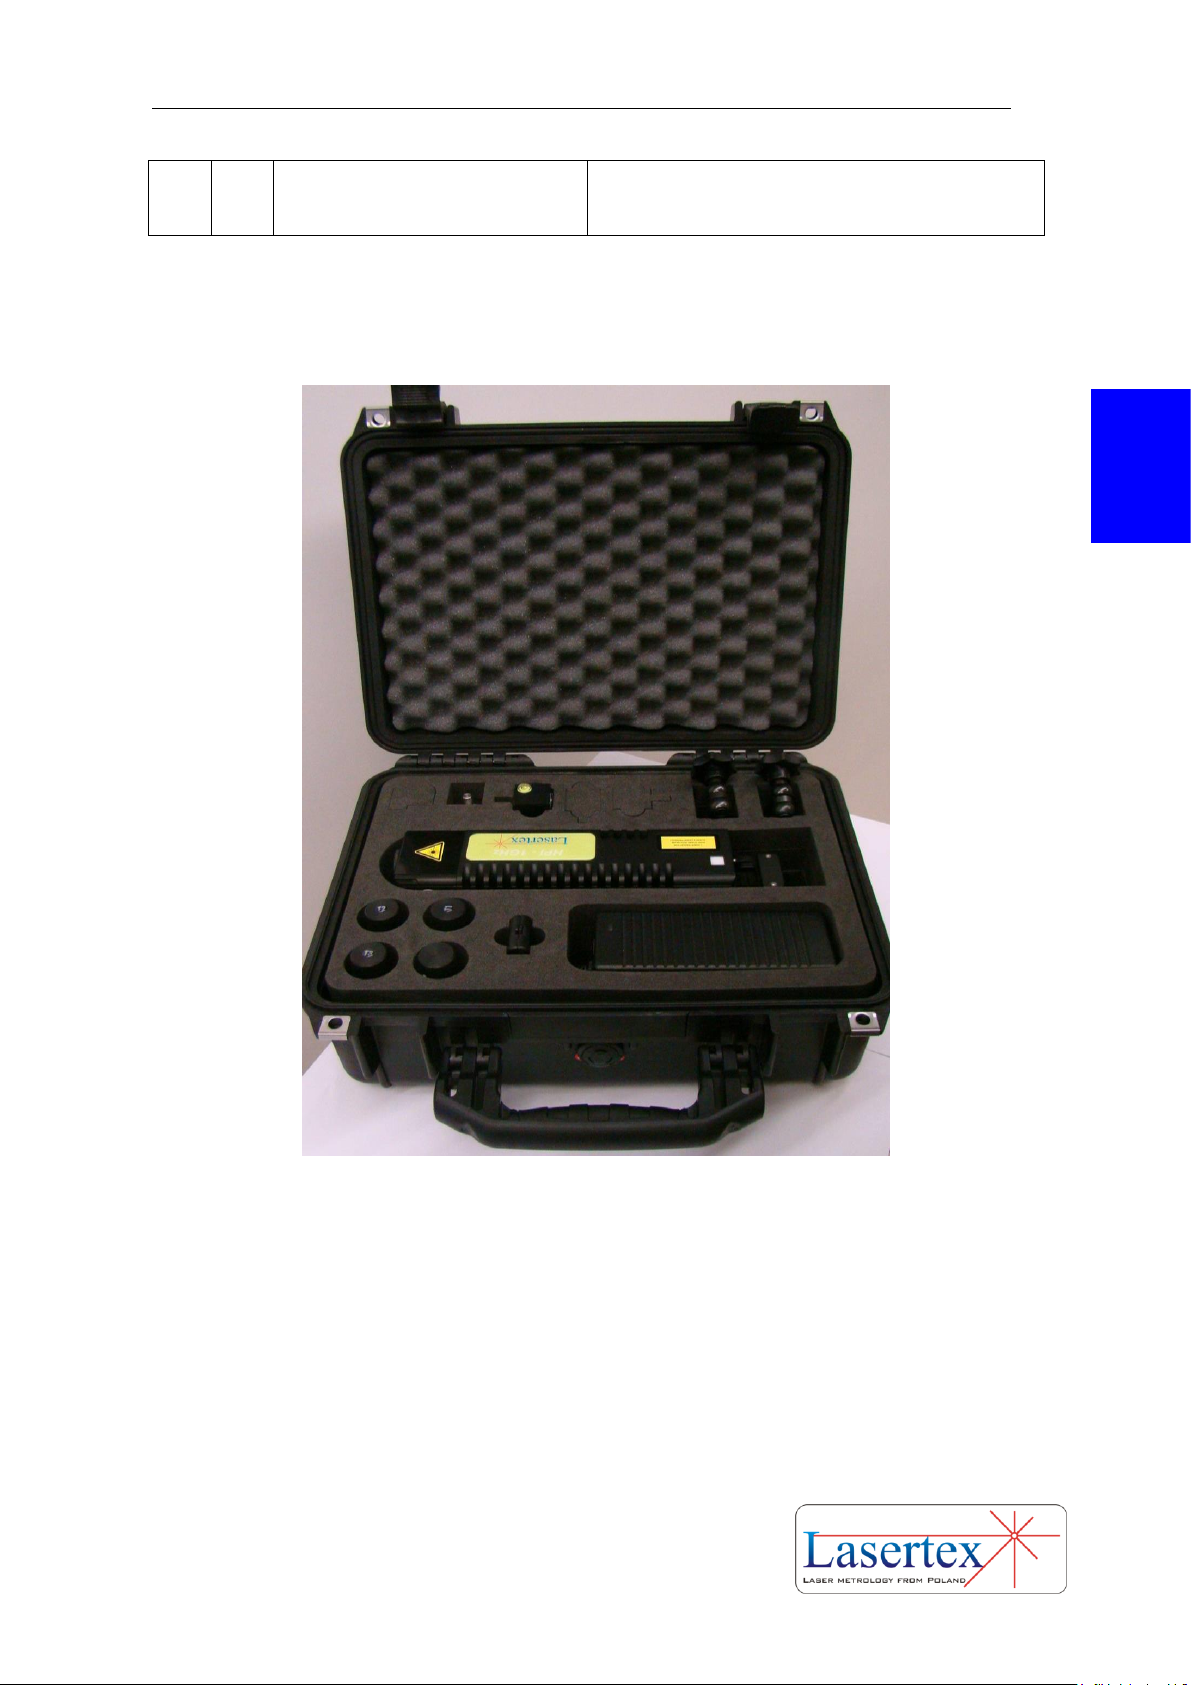
In the figure 3.18 there is shown a suitcase for transport and storage of the
interferometer system.
FIG.3.18. THE SUITCASE FOR TRANSPORT AND STORAGE OF THE INTERFEROMETER
SYSTEM.
Additional elements for angular measurements are:
1 x Angular Interferometer IK1,
1 x Angular Retro-reflector RK1,
2 x Beam directing mirror ZK1,
1 x Rotary table RE1.
Additional elements for straightness measurements are:
Page 33

PREPARATIONS
3-12 www.lasertex.eu
3
1 x Wollaston Prism WP2,
1 x Wollaston Retroprism WRP2.
Additional elements for squareness measurements are:
1 x Right Angle Etalon for 3D measurements RE3D,
1 x Right Angle Etalon for Wollaston measurements REW.
c. Interferometer setup for measurement
The Laser Interferometer HPI-3D is supplied from autonomous 24VDC/5A
Power Supply. Communication with a PC computer is performed by USB or
Bluetooth interface. The USB connection is faster thus it gives more possibilities in
some measurements (i.e. Vibration or Dynamic).
Before starting the measurements the Laser Head (1) should be placed on the
Tripod stand (3) and connected to the Power Supply connector on the back of the laser
head. The Laser Head can be also placed directly on the machine because it is
equipped with magnetic base.
If the USB connection is used then the USB cable (10) should be connected to
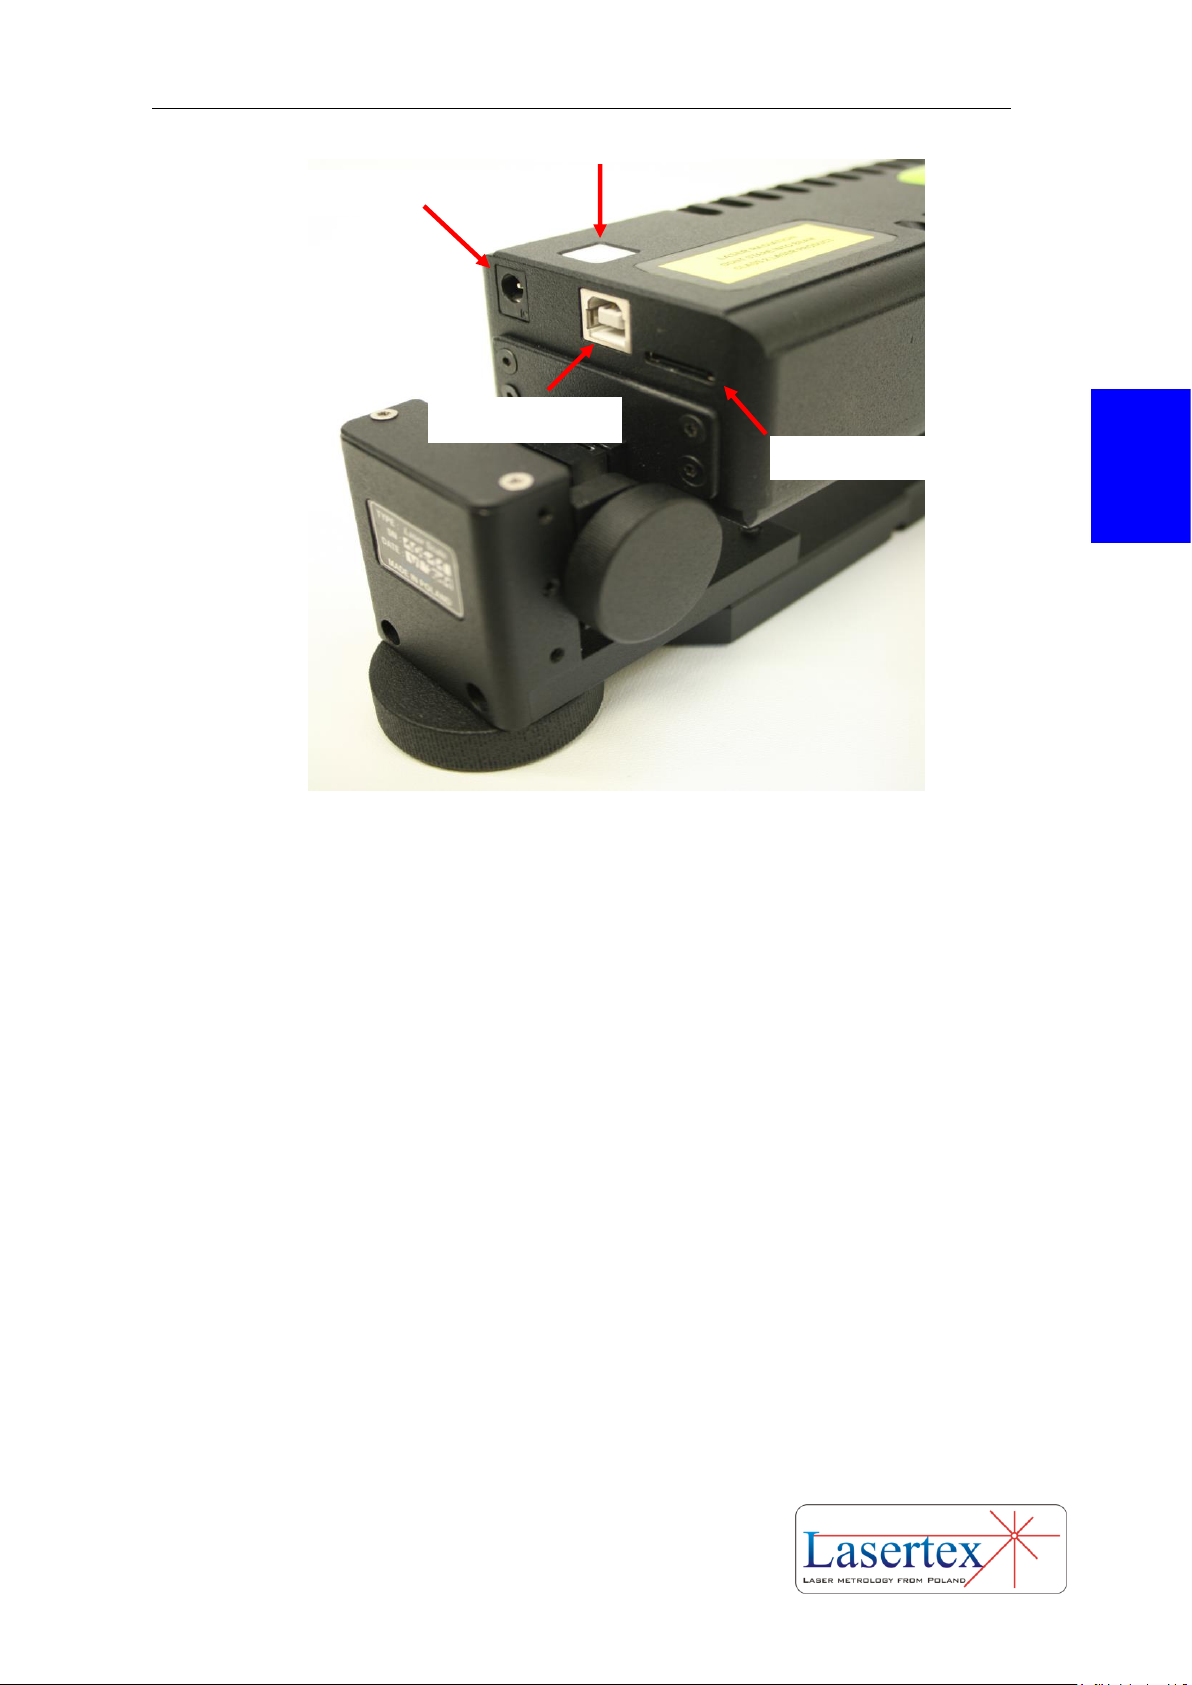
the male socket on the back panel of the Laser Head (fig. 3.19). The second end of the
cable should be plugged into the USB socket of a PC computer. For the Bluetooth
connection only power connection is necessary.
Page 34
PREPARATIONS
3-13 www.lasertex.eu
3
FIG.3.19. CONNECTIONS OF THE HPI-3D.
Through the Extension Connector it is possible to drive many peripherals
directly from the laser head. This give huge possibilities of customization of the usage
of the laser interferometer – e.g. in emulation of glass scales, driving stepping motors,
dynamic measurements, etc. Standard connector pinout is described in Technical
Data at the end of this manual.
Environmental (6) and base temperature (7) sensors are connected to the Laser
Head wirelessly. The sensors are maintenance free – they do require neither
switching on/off nor charging. When the Laser Head is not powered they remain in
power down mode. Sensors can only “wake up” and start to measure when the Laser
Head is powered by the Power Supply unit.
Sensors are powered from 1/2AA 3.6V lithium battery (number 14250). It can
be replaced, when the battery strength monitor on Display screen (see below in this
Chapter) shows that it is depleted, after removing the cap of the sensor. The battery
life time in the power down mode only is more than 30000 hours. The combined life
time of the battery for the sensor is 10000 hours.
Wireless Strobe is used to manually capture points during measurements (see
appropriate chapter).
Power Button
Power Connector
Extension Connector
USB Connector
Page 35

PREPARATIONS
3-14 www.lasertex.eu
3
The Power Button is used for switching the laser on or off and for signalization
of the internal state of the laser. The meaning of the signaling of the Power Button is
described in the table 3.1.
Page 36

PREPARATIONS
3-15 www.lasertex.eu
3
Power Button state
State description
Red
Laser head powered on properly. Laser not working
Red – blinking fast
Laser head powered on properly but main CPU
firmware is corrupted. Firmware programming
necessary.
Orange / Green
blinking slow
Laser switched on; Stabilization phase 1
Orange / Green
blinking fast
Laser switched on; Stabilization phase 2
Green -
blinking
Laser switched on; Stabilization phase 3
Orange
Laser stabilizes. Beam path unaligned.
Green
Laser stabilizes. Beam path aligned. System ready
for measurements!
TAB.3.1. POWER BUTTON LED STATES
Page 37
PREPARATIONS
3-16 www.lasertex.eu
3
d. Powering the system on
i. Starting hardware
The HPI-3D has only one soft-switch on the top of the laser head. Starting the
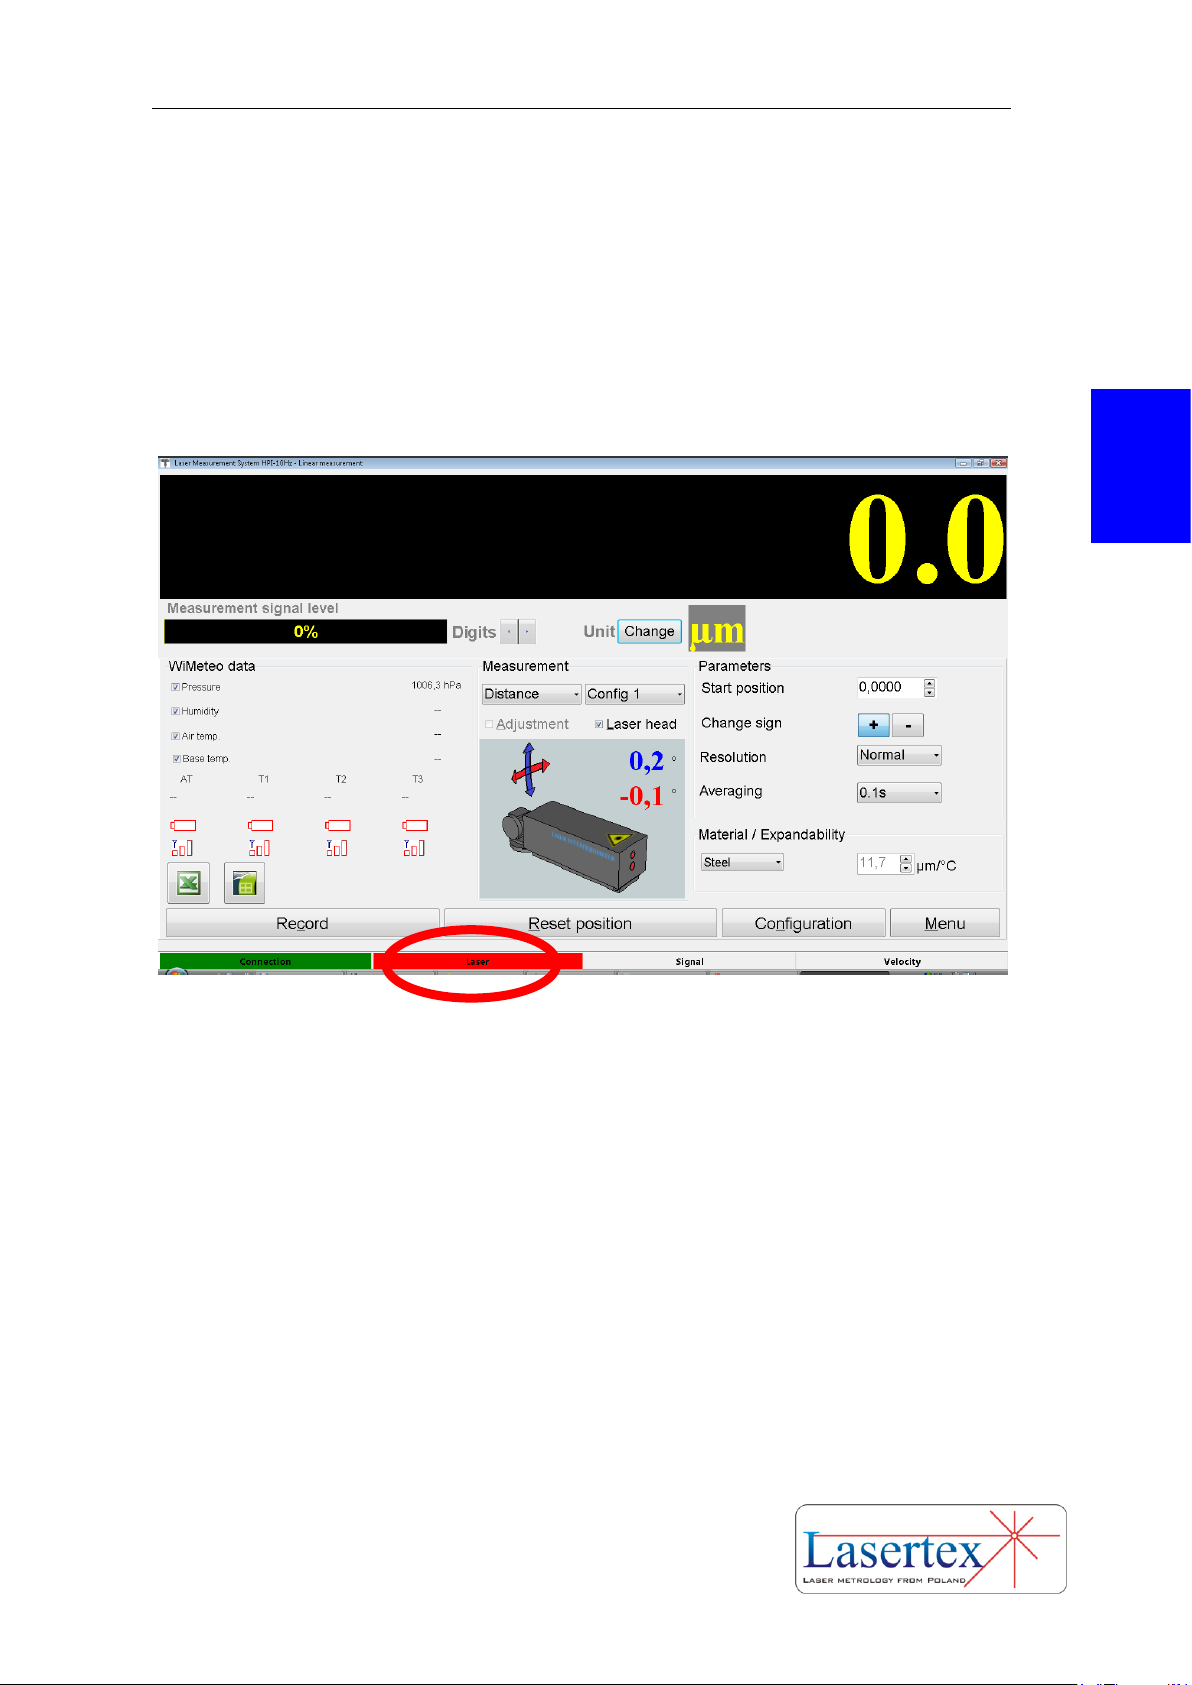
laser is possible by holding the Power Button for 3 seconds (see figure 3.19) or from the
LSP software by clicking on the bottom bar of the screen in “Laser” text (see fig. 3.20).
FIG.3.20. POWER SWITCH OF THE HPI-3D
ii. Starting software
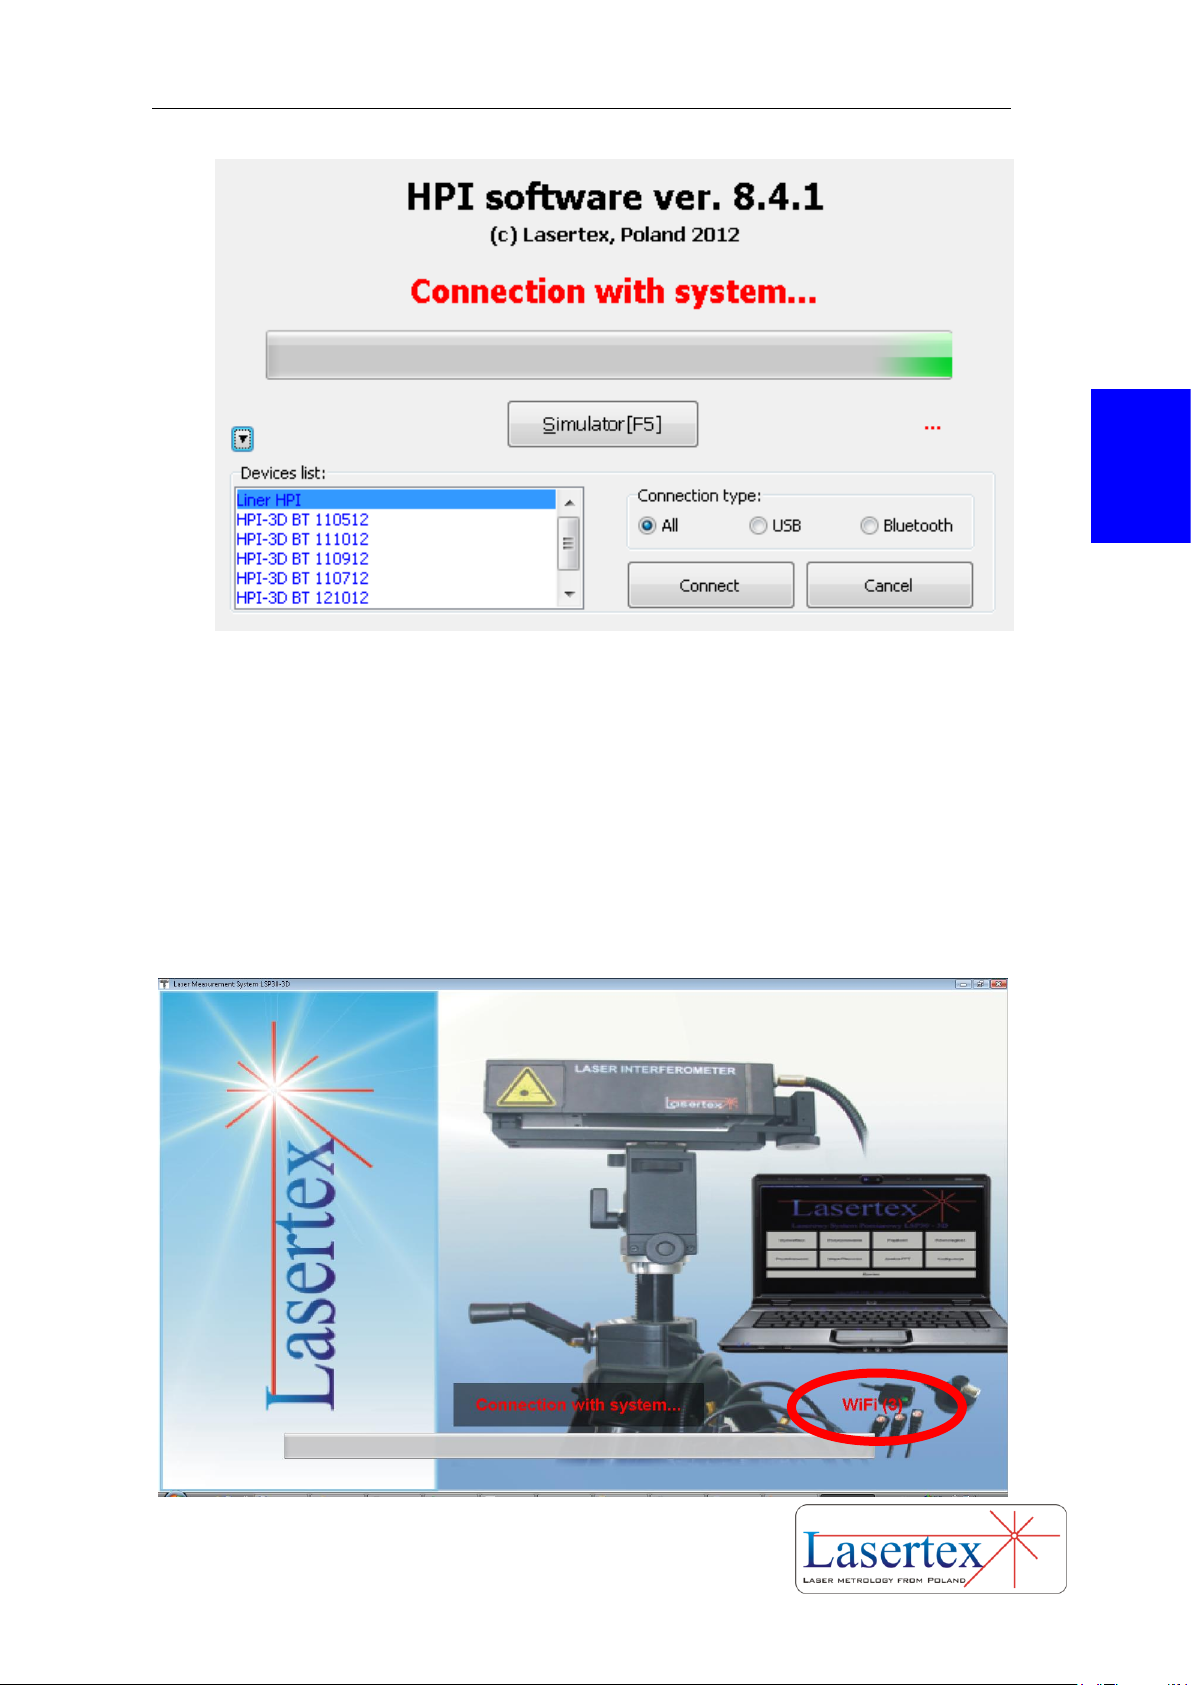
When the software starts a splash screen appears (figure 3.21). Pressing F5 on
the PC keyboard or the button marked Simulator causes the software to switch into
simulation mode – connection to a HPI-3D device is emulated even if there is a real
device connected to the computer!
In the bottom part of the splash screen there are shown all HPI-3D devices
currently connected to the PC either by Bluetooth or USB interface. The devices
paired up with the PC over Bluetooth are visible in blue. Devices connected over USB
are shown in red.
Page 38
PREPARATIONS
3-17 www.lasertex.eu
3
FIG.3.21. SPLASH SCREEN
After the splash screen a connection screen appears (figure 3.22) where the
connection trials are shown. In the right bottom part there is shown the interface over
which the software is actually trying to obtain a connection (see a red circle in the
figure 3.22). After software installation, by default, the first trials are made over USB
interface. When there is a successful connection made over other interfaces then the
“successful” interface is taken as a first choice in next runs.
Page 39
PREPARATIONS
3-18 www.lasertex.eu
3
FIG.3.22. CONNECTION SCREEN
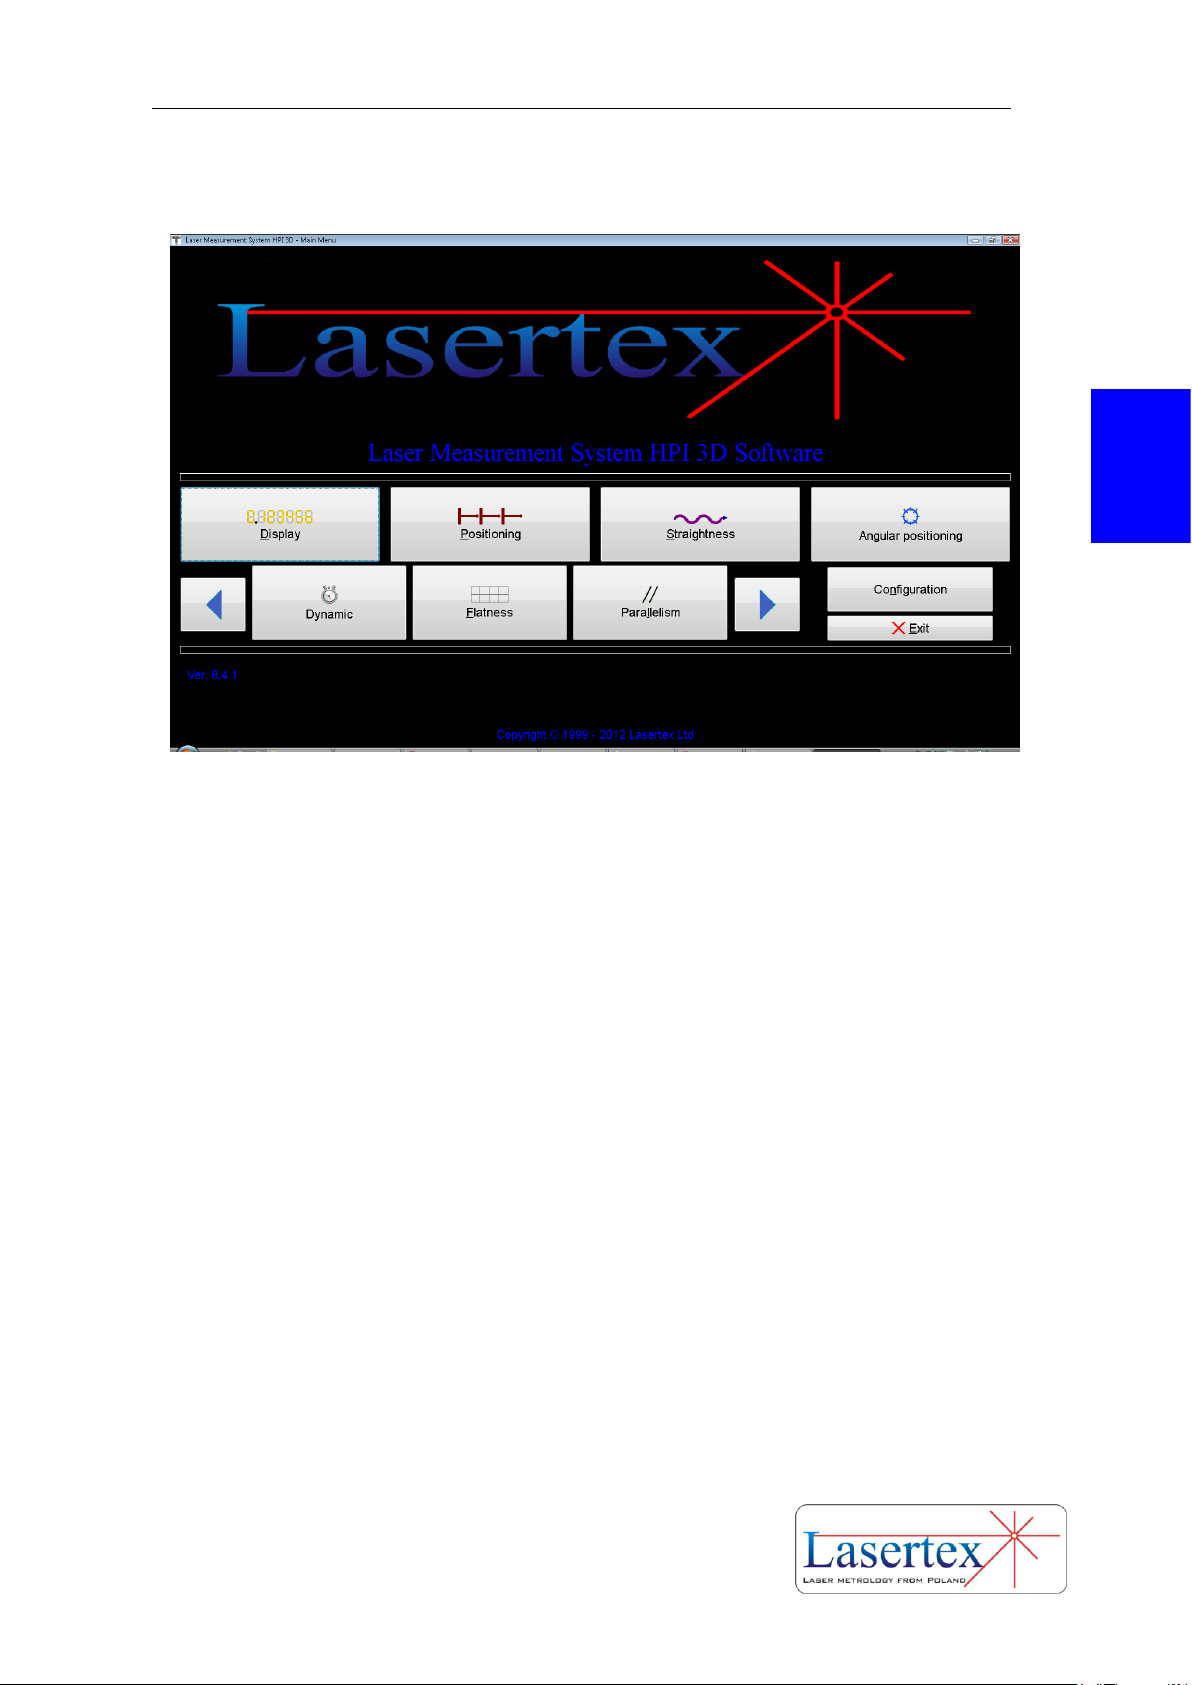
FIG.3.23. MAIN MENU
After the connection screen there the Main Menu appears as shown in the
figure 3.23. There are two rows of buttons. Button Display opens the window with
basic control of the laser operation. It is described in details later in this Chapter.
Button Configuration opens configuration window. Pressing Exit button closes the
application.
Other buttons open measurement screens. All options are described in details
in following Chapters. Because of abundance of measurement types offered by the
HPI-3D, some of the options are not visible and can be reached by using the buttons
with arrows in the second row.
Connection problems troubleshooting is described in the Troubleshooting
chapter.
e. Getting basic information from the system.
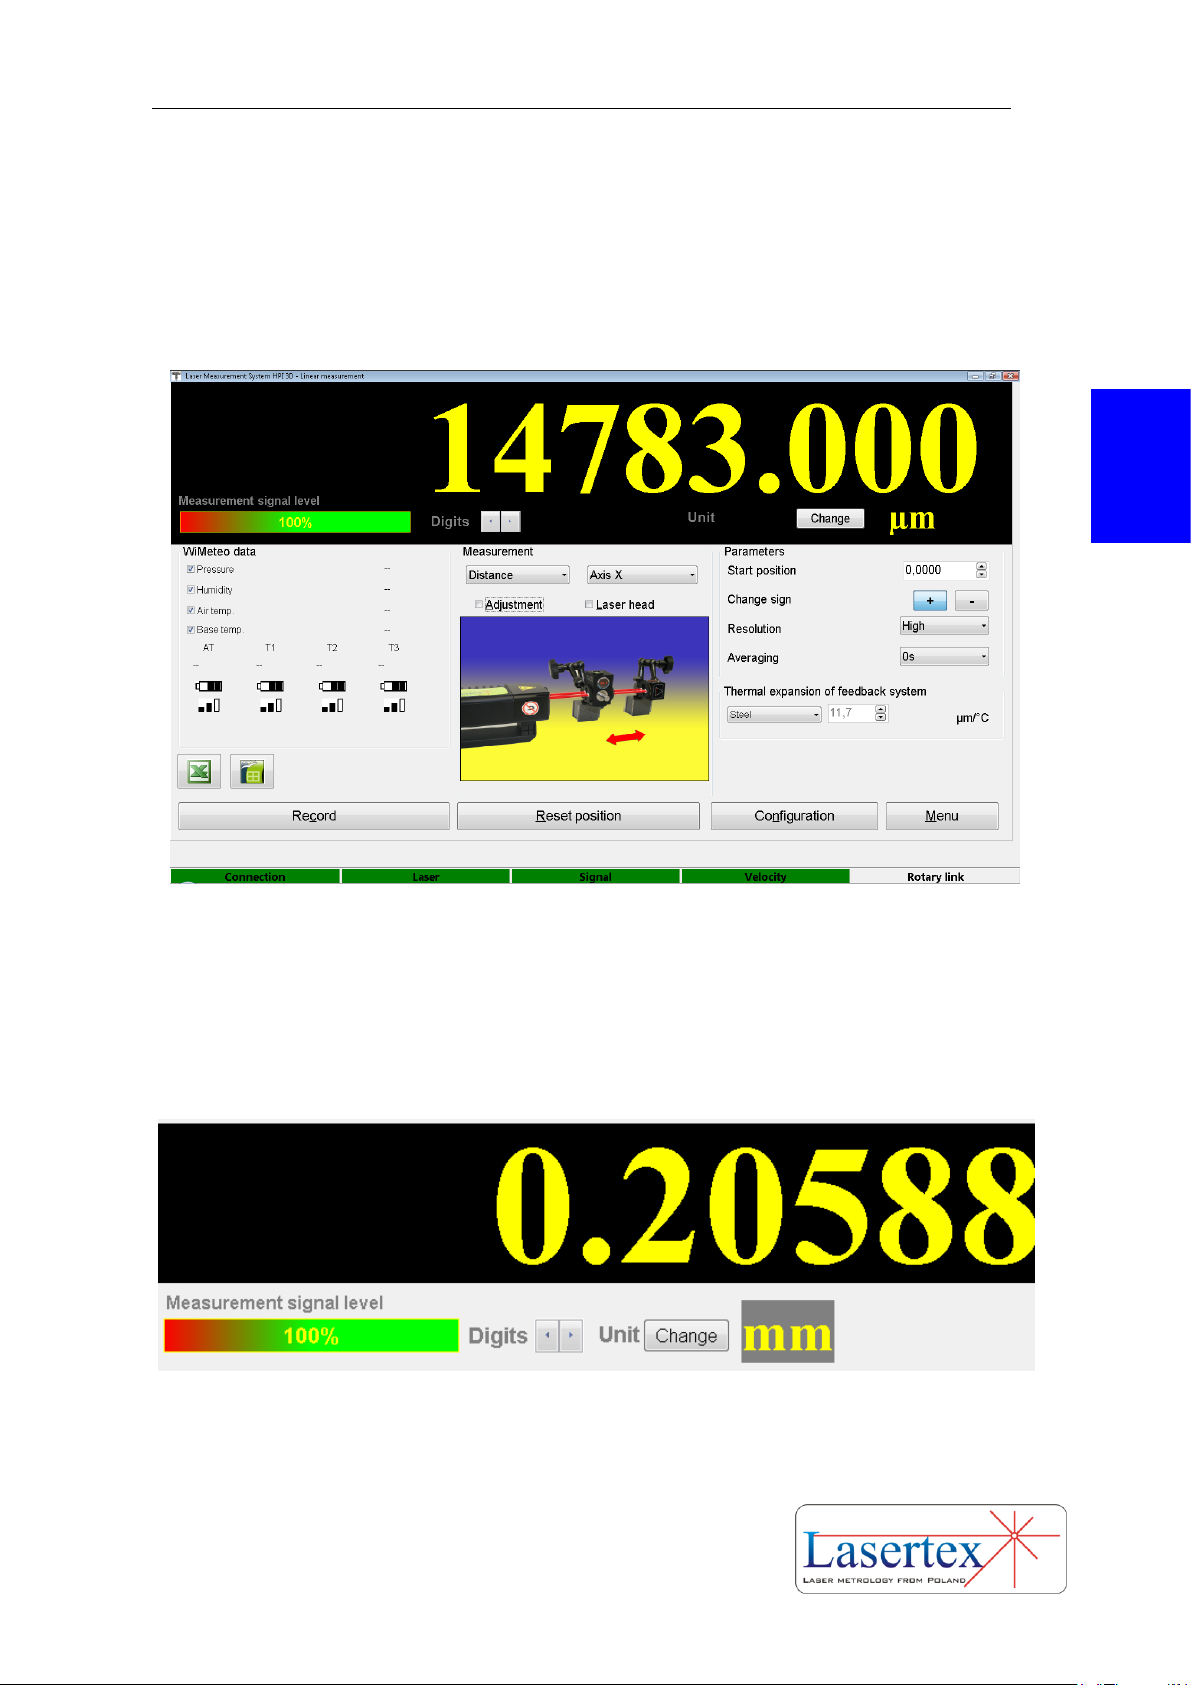
When the software is launched and the system is connected the option Display
in the Main Menu should be chosen. The window shown in the figure 3.24 appears.
If the output beam of the laser is properly redirected to the Laser Head (e.g. with the
use of the retroreflector RL1) and laser maintain the stabilization (Laser status bar is
Page 40
PREPARATIONS
3-19 www.lasertex.eu
3
green), the Beam Strength (a green indicator on the screen) shows 100% of the signal
level. If the laser heats up to maintain the stabilization the Beam Strength appears
and disappears. The speed of changes is related to the temperature of the laser.
During the heating up the system is ready for the alignment of the optical path (see
chapter 4).
FIG.3.24. DISPLAY WINDOW
On the Display screen there are a status bar and four panels:
- Panel (figure 3.25) where are presented a digital result of the measurement
and the signal level. There are also located buttons for changing the Units and a
number of displayed Digits in the result.
FIG.3.25. PANEL WITH MAIN DISPLAY
Page 41
PREPARATIONS
3-20 www.lasertex.eu
3
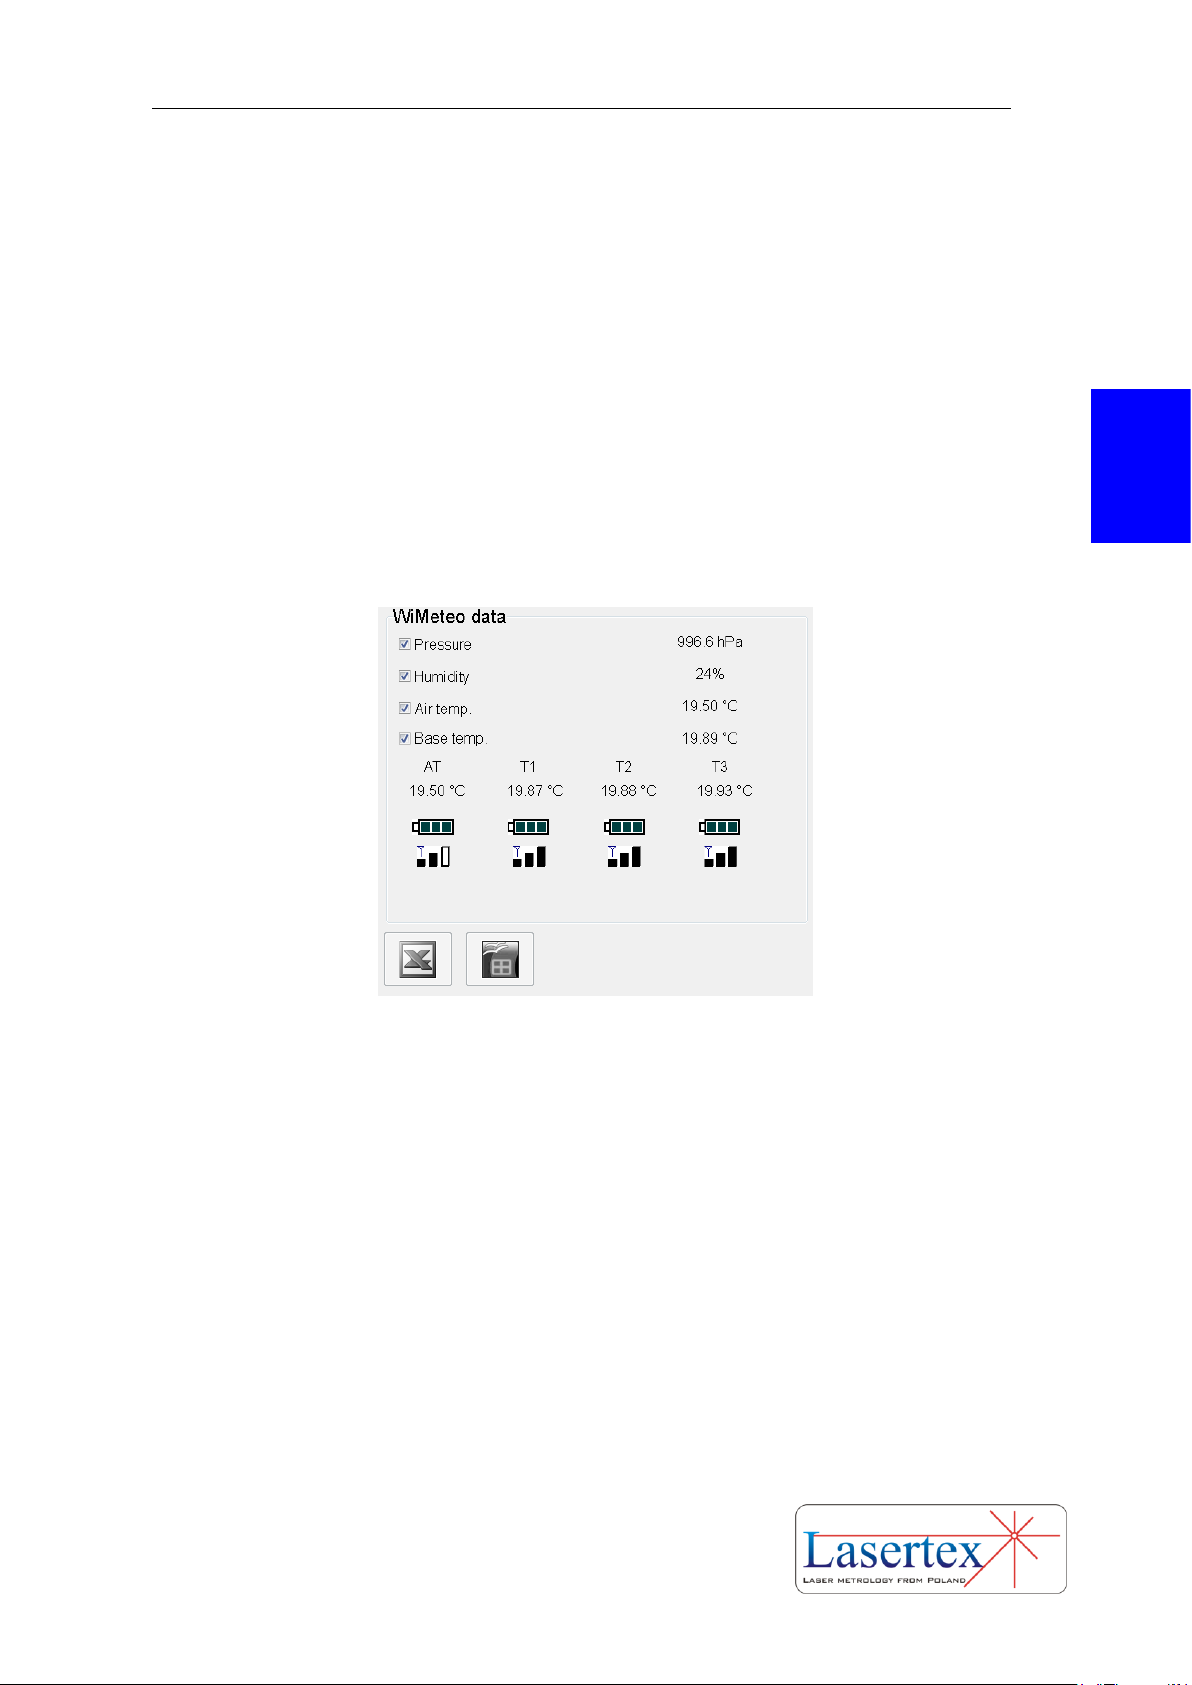
- Panel Environment (figure 3.26) where data obtained from the
Environmental Compensation Unit (ECU) is shown. On the screen there are
presented: temperature, pressure and humidity of the atmosphere (Pressure,
Humidity, and Air Temp.) and temperature of the base which is measured by three
base temperature sensors and averaged (Average temp., T1, T2 and T3). For each
sensor the battery voltage and signal strength are presented. Data from
Environmental Compensation Unit can be also controlled by the user. It is possible
switch off the data coming from ECU and insert parameters of the atmosphere
manually. In the lower left corner there are icons setting up a link to Microsoft Excel
or OpenOffice Calc (if installed). This link allows registering measurement in Excel or
Calc by each STROBE button press.
FIG.3.26. ENVIRONEMNTAL PANEL
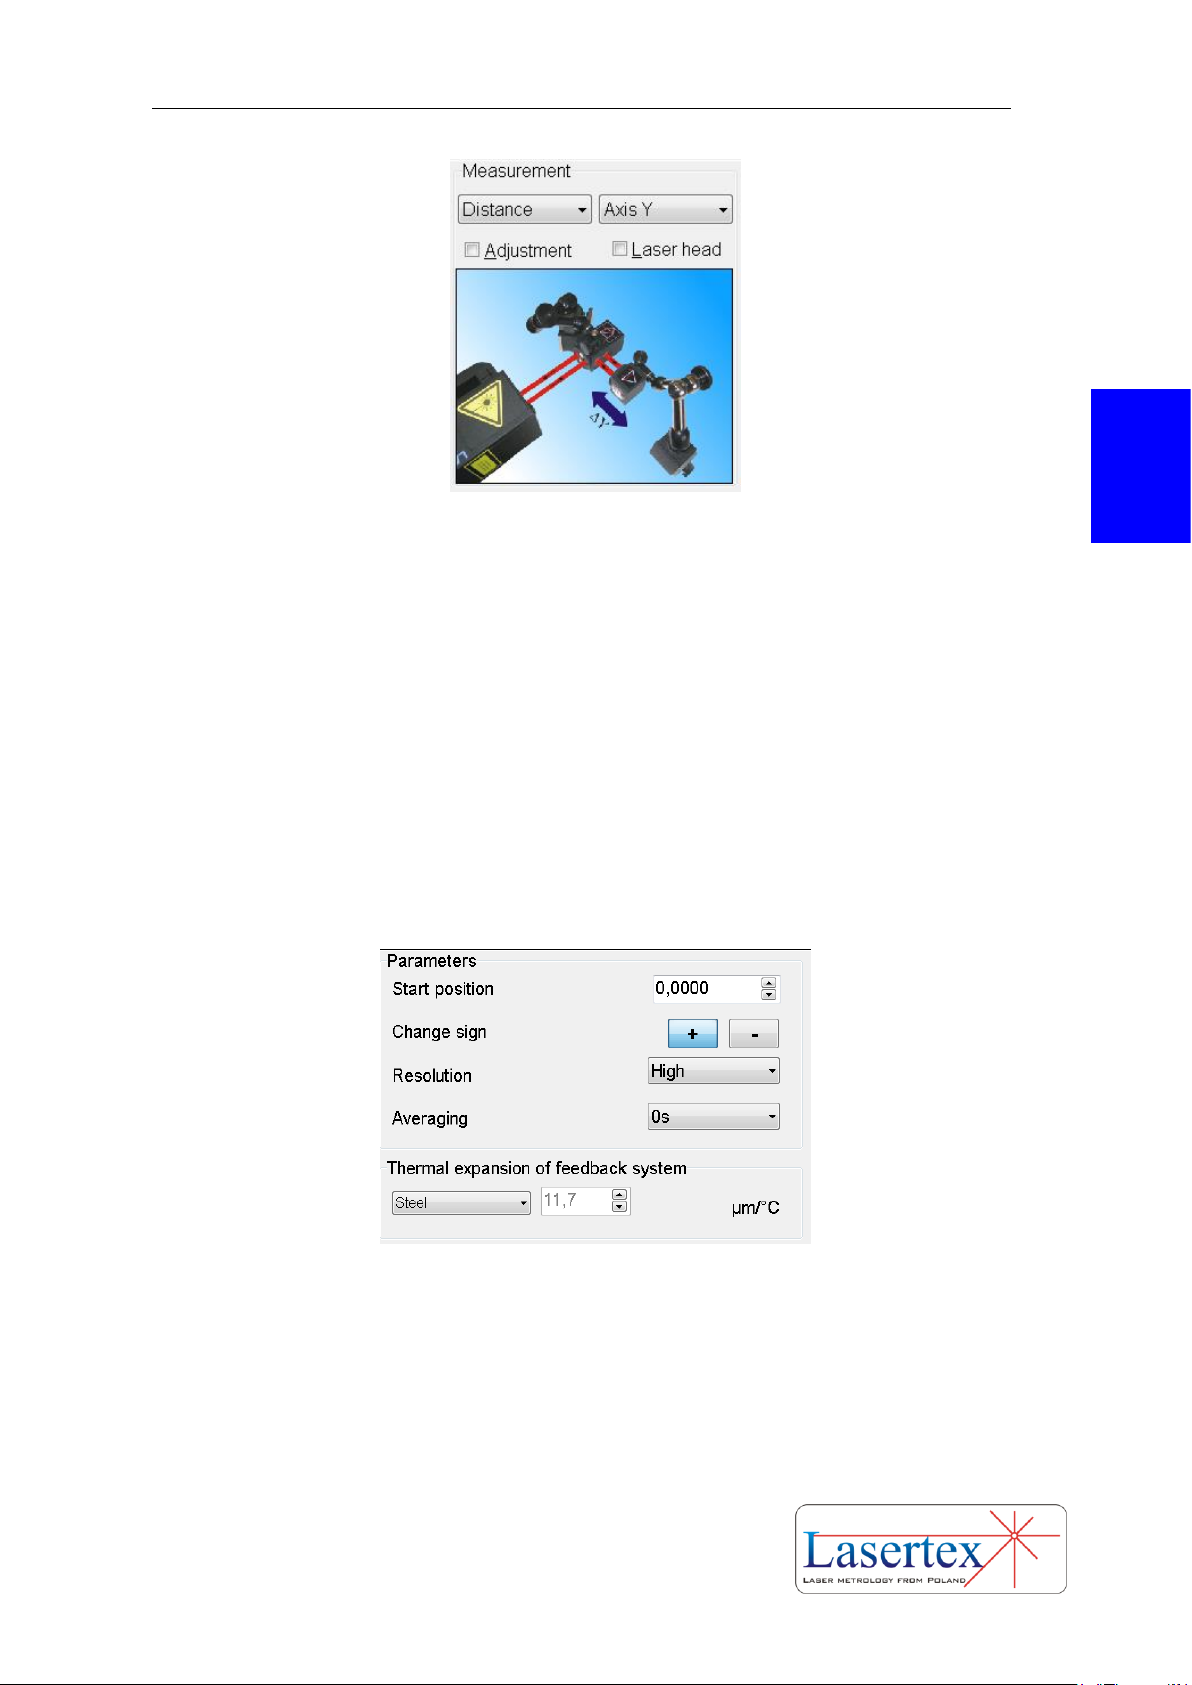
- Measurement Panel (figure 3.27) contains basic information about current
measurement. With the left drop-down list the type of the measurement is changed.
Right drop-down list is used for an axis selection. If Adjustment or Laser head
checkbox is not ticked, the pictorial view of optical configuration is presented. It
reflects measurement type (i.e. distance, speed, angle, straightness) and axis (i.e. X, Y,
Z). Adjustment and Laser head options are selected by the checkboxes located on the
panel. However only one of them can be active, because they are mutually exclusive.
Both options are very helpful in optical path alignment process (see chapter 4).
Page 42
PREPARATIONS
3-21 www.lasertex.eu
3
FIG.3.27. MEASUREMENT PANEL
- Panel Parameters (figure 3.28) is used for configuration of the
measurement system. Change sign option selects whether enlarging distances
between the retro-reflector and the interferometer gives positive (default “+”) or
negative result on the display. Thermal expansion of feedback system option is used
to select the material from which a feedback measurement system of the measured
machine is made of. Setting the proper value of the expansion coefficient is very
important to obtain the highest accuracy of the system. Option User makes it possible
to enter any value of the thermal expandability coefficient. Resolution enables to
change between High (0.1 nm) and Normal (1 nm) system resolution.
FIG.3.28. PARAMETERS PANEL
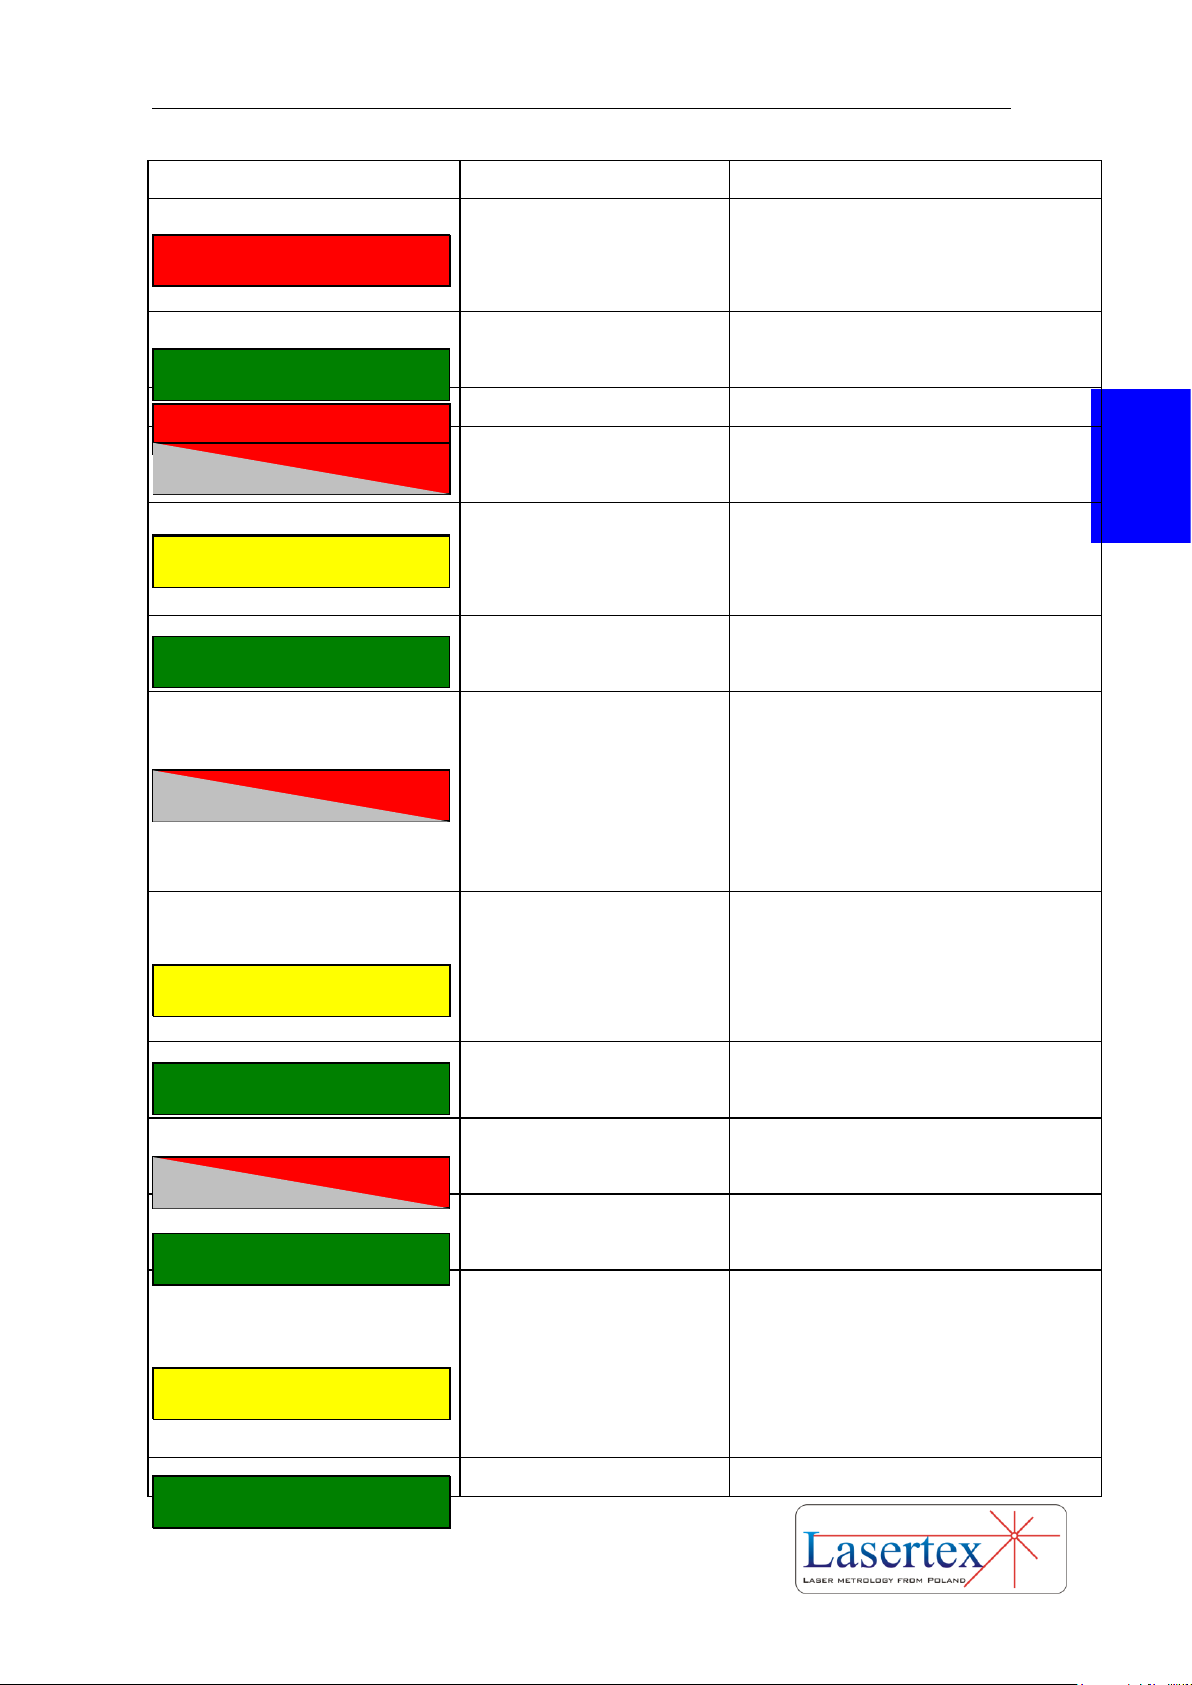
Status Bar (figure 3.24) presents state of the Laser Head and state of the
measurements. There are four fields: Connection, Laser, Signal and Velocity. In
proper operation they should all be green. In table 3.2 there are shown the possible
states of the fields.
Page 43
PREPARATIONS
3-22 www.lasertex.eu
3
Field
State description
Required action
No connection to the Laser
Head
Click on the field to open
Configuration window. Restart the
connection
Laser Head is connected to
the computer properly
No action necessary
Laser Head off
Click on the field to switch the laser on
Laser Head on but not
ready
Wait for the laser to become ready
Laser Head near unstable
region.
Finish performed measurements and
click on the field to allow the head to
find new stable point
Laser Head works well
No action necessary
Beam strength too week.
Using beam indicator adjust optical
components to obtain satisfactorily
beam strength, then click on the field to
reset the error
Beam strength fine but
not calibrated
Beam path between IL1 and RL1
optical components should be
obstructed for a while so the laser can
calibrate beam parameters
Beam strength fine
No action necessary
Velocity of the registered
movement too high
Click on the field to reset the error
Velocity of the registered
movement in range
No action necessary
No measuring sensors
detected
At least 3 minutes after powering up
the laser head:
- Check if sensors are close enough to
the laser head;
- Check/replace sensors batteries;
At least one sensor is
No action necessary
Connection
Connection
Laser
Laser
Laser
Laser
Signal
Signal
Laser
Velocity
Velocity
Sensors
Sensors
Page 44

PREPARATIONS
3-23 www.lasertex.eu
3
working
Rotary encoder not
detected
Check if rotary encoder is switched on
Rotary encoder present. No
link to rotary set.
Double click on the field for the laser to
set the link to rotary
Rotary link set
No action necessary
TAB.3.2. STATUS BAR STATES
If measurements are performed with automatic compensation of the
atmosphere parameters and the compensation of the base temperatures, one should:
Place the air temperature and humidity sensors THS on the machine in
the vicinity of the laser beam.
place the sensors of the base temperature along the measured axis on
the machine base
Measurements performed without automatic compensation are referred to
normal conditions: temperature 20 °C, pressure 1013.25 hPa, humidity 50 %.
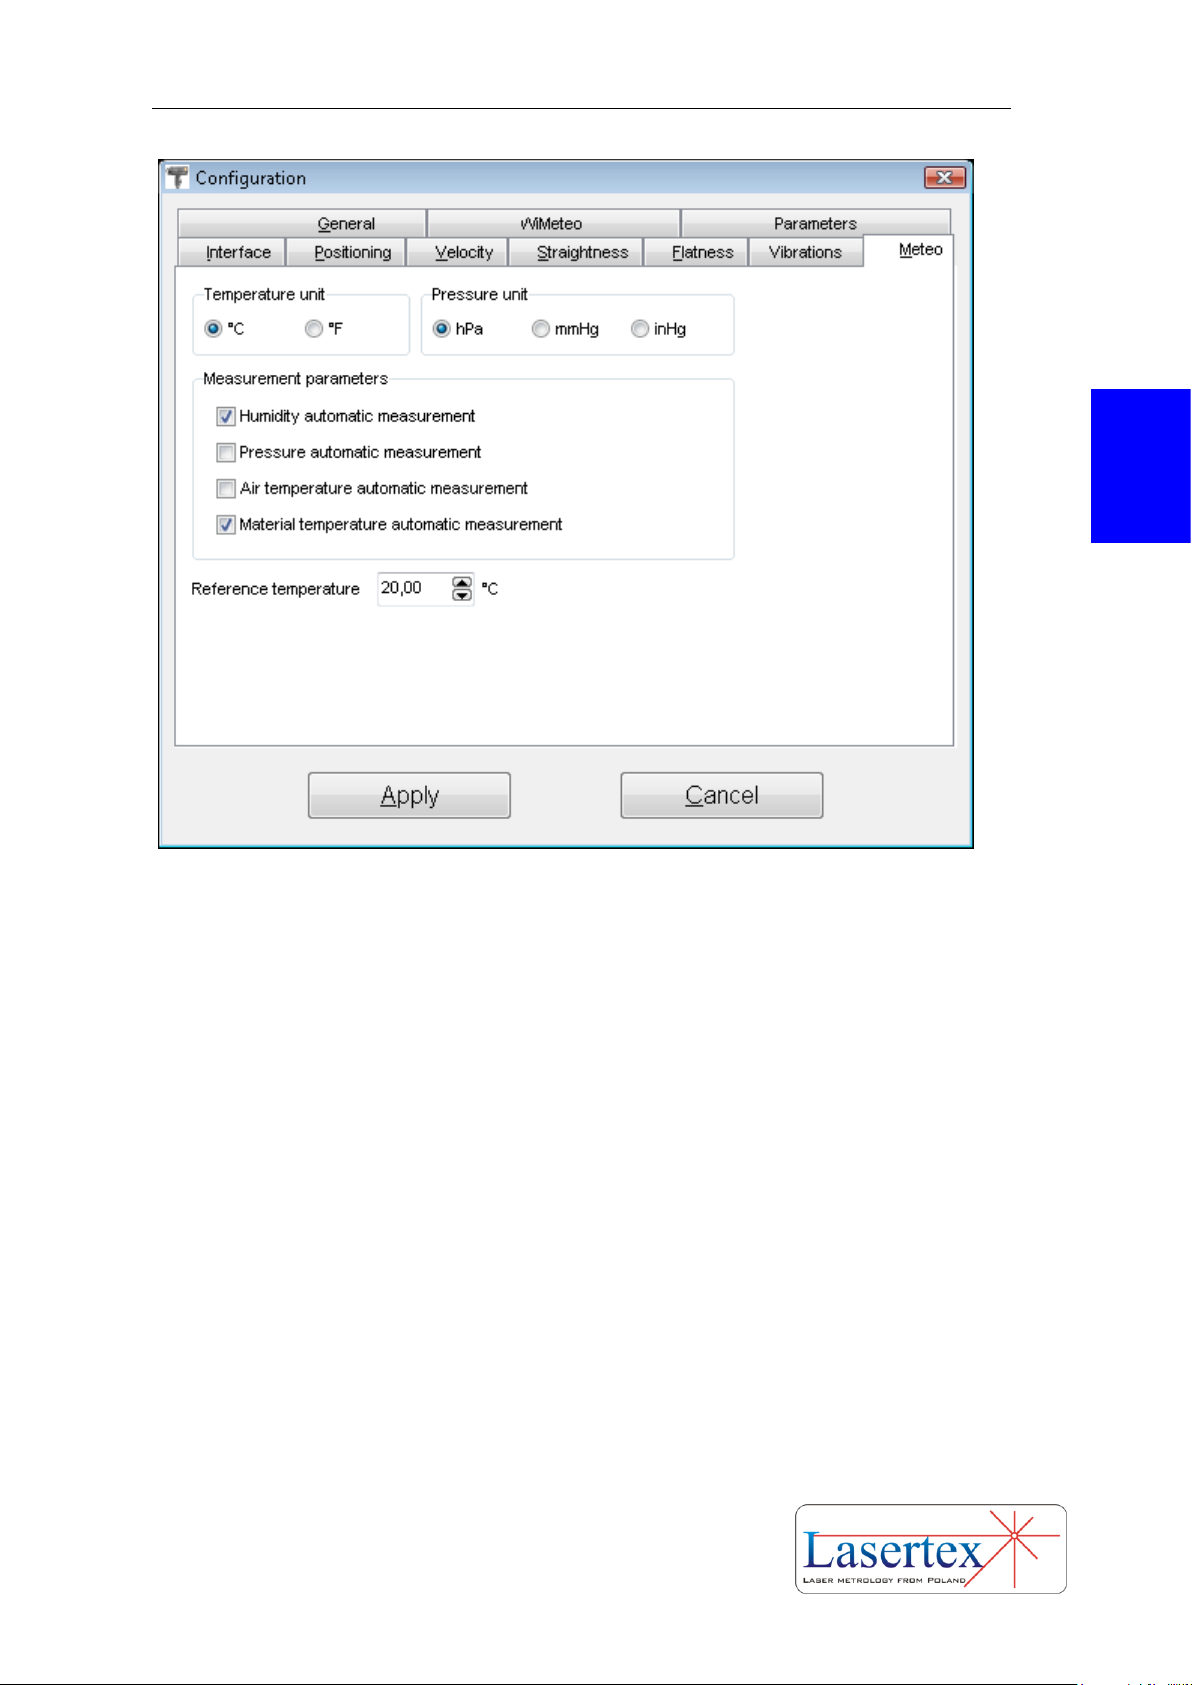
The measured machine is compensated to the temperature set in the Reference
temperature edit box, located in the Configuration->Meteo panel (see figure 3.29). By
default the reference temperature is set to 20 degrees C and should not be change
unless necessary.
Rotary
Rotary
Rotary
Page 45
PREPARATIONS
3-24 www.lasertex.eu
3
FIG. 3.29. CONFIGURATION WINDOW – METEO PANEL
Page 46
PREPARATIONS
3-25 www.lasertex.eu
3
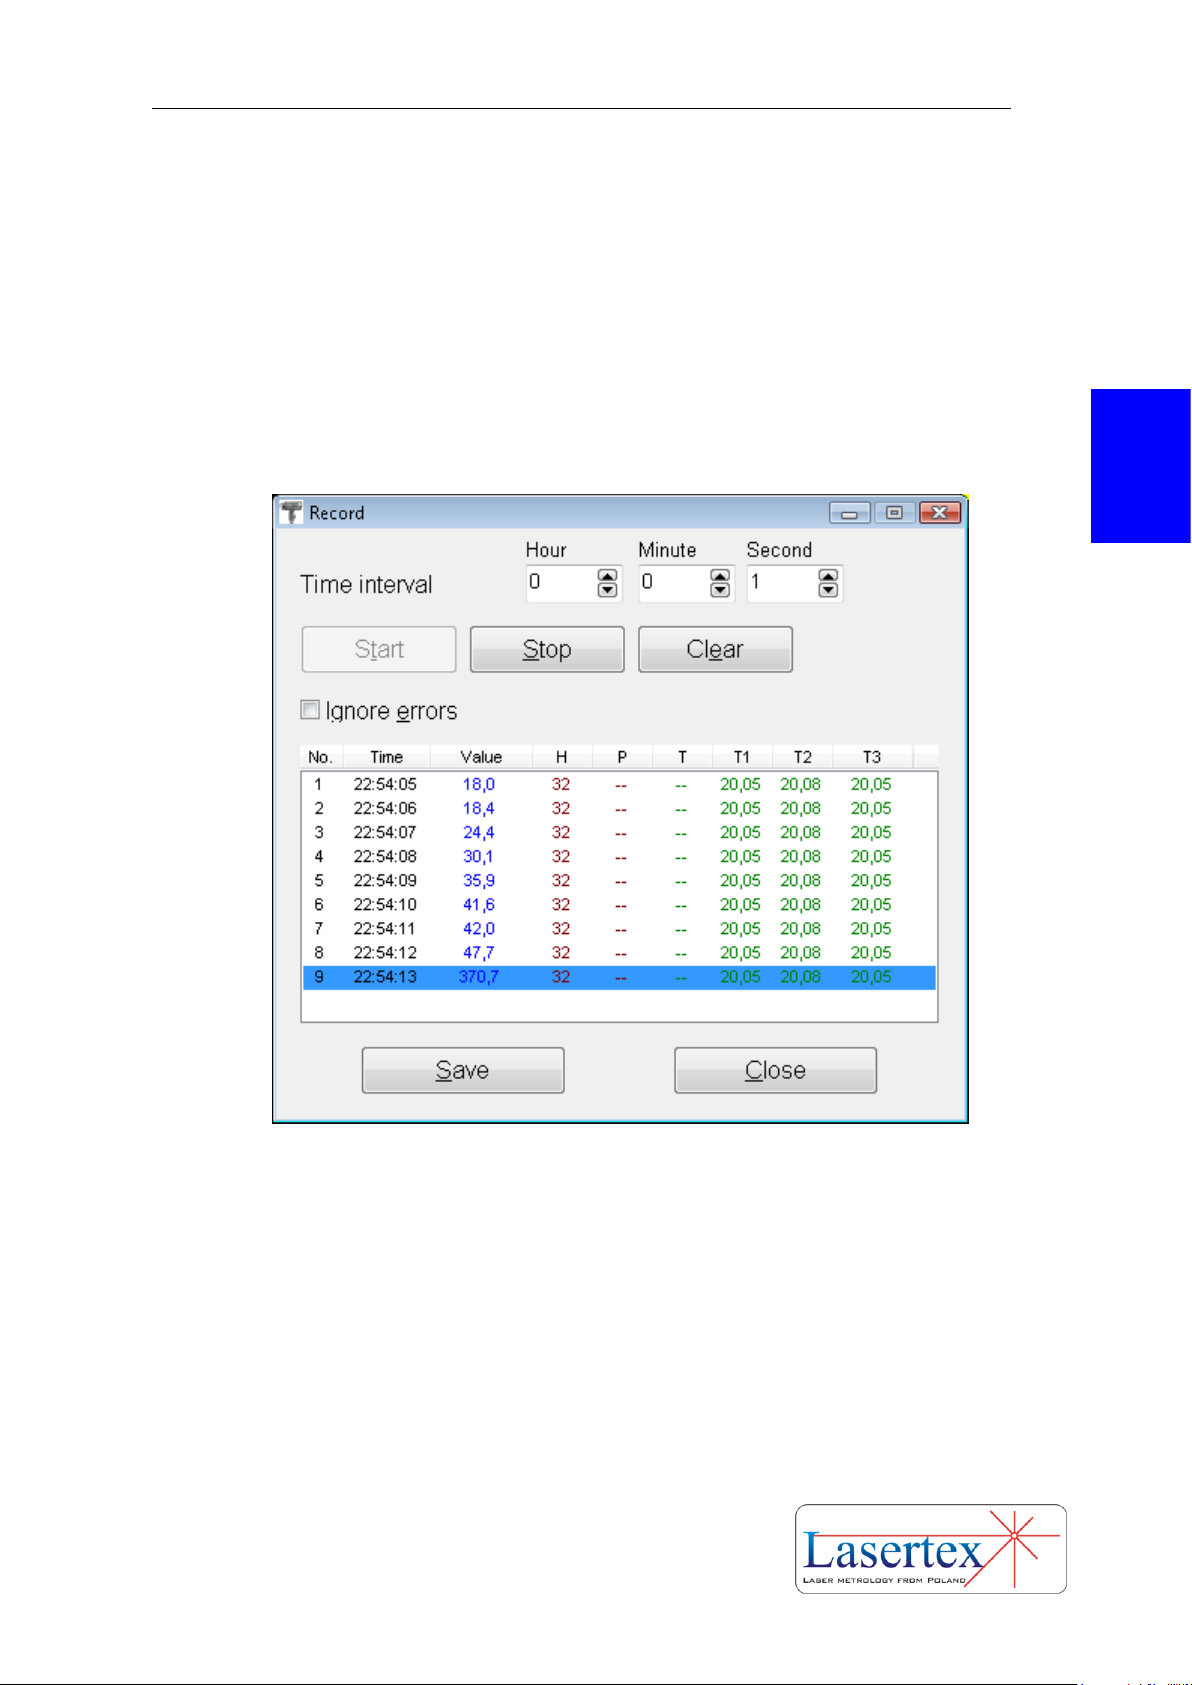
f. Recording mode
The long term changes of the length of machine axes under changes of
temperature condition may give the information about thermal properties of the
machine. This kind of measurements called “Recording mode” may be chosen by
pressing RECORD button on the Display screen. This switches the system into the
data recorder mode. The time interval of the records could be programmed from the
computer by setting a required value.
FIG.3.30. RECORDING DATA MODE WINDOW
Pressing “End Recording” finishes the data recording. The results can be saved
with the choice of “Save to file”. In fig. 3.30 the example of Data Record is presented.
g. Flat mirror measurements - option
The flat mirror measurements option enables to measure the displacement,
velocity, positioning, and vibrations of a flat surface. The surface should have a
mirror quality (surface flatness λ/8) and the reflection coefficient not less than 50%.
Page 47
PREPARATIONS
3-26 www.lasertex.eu
3
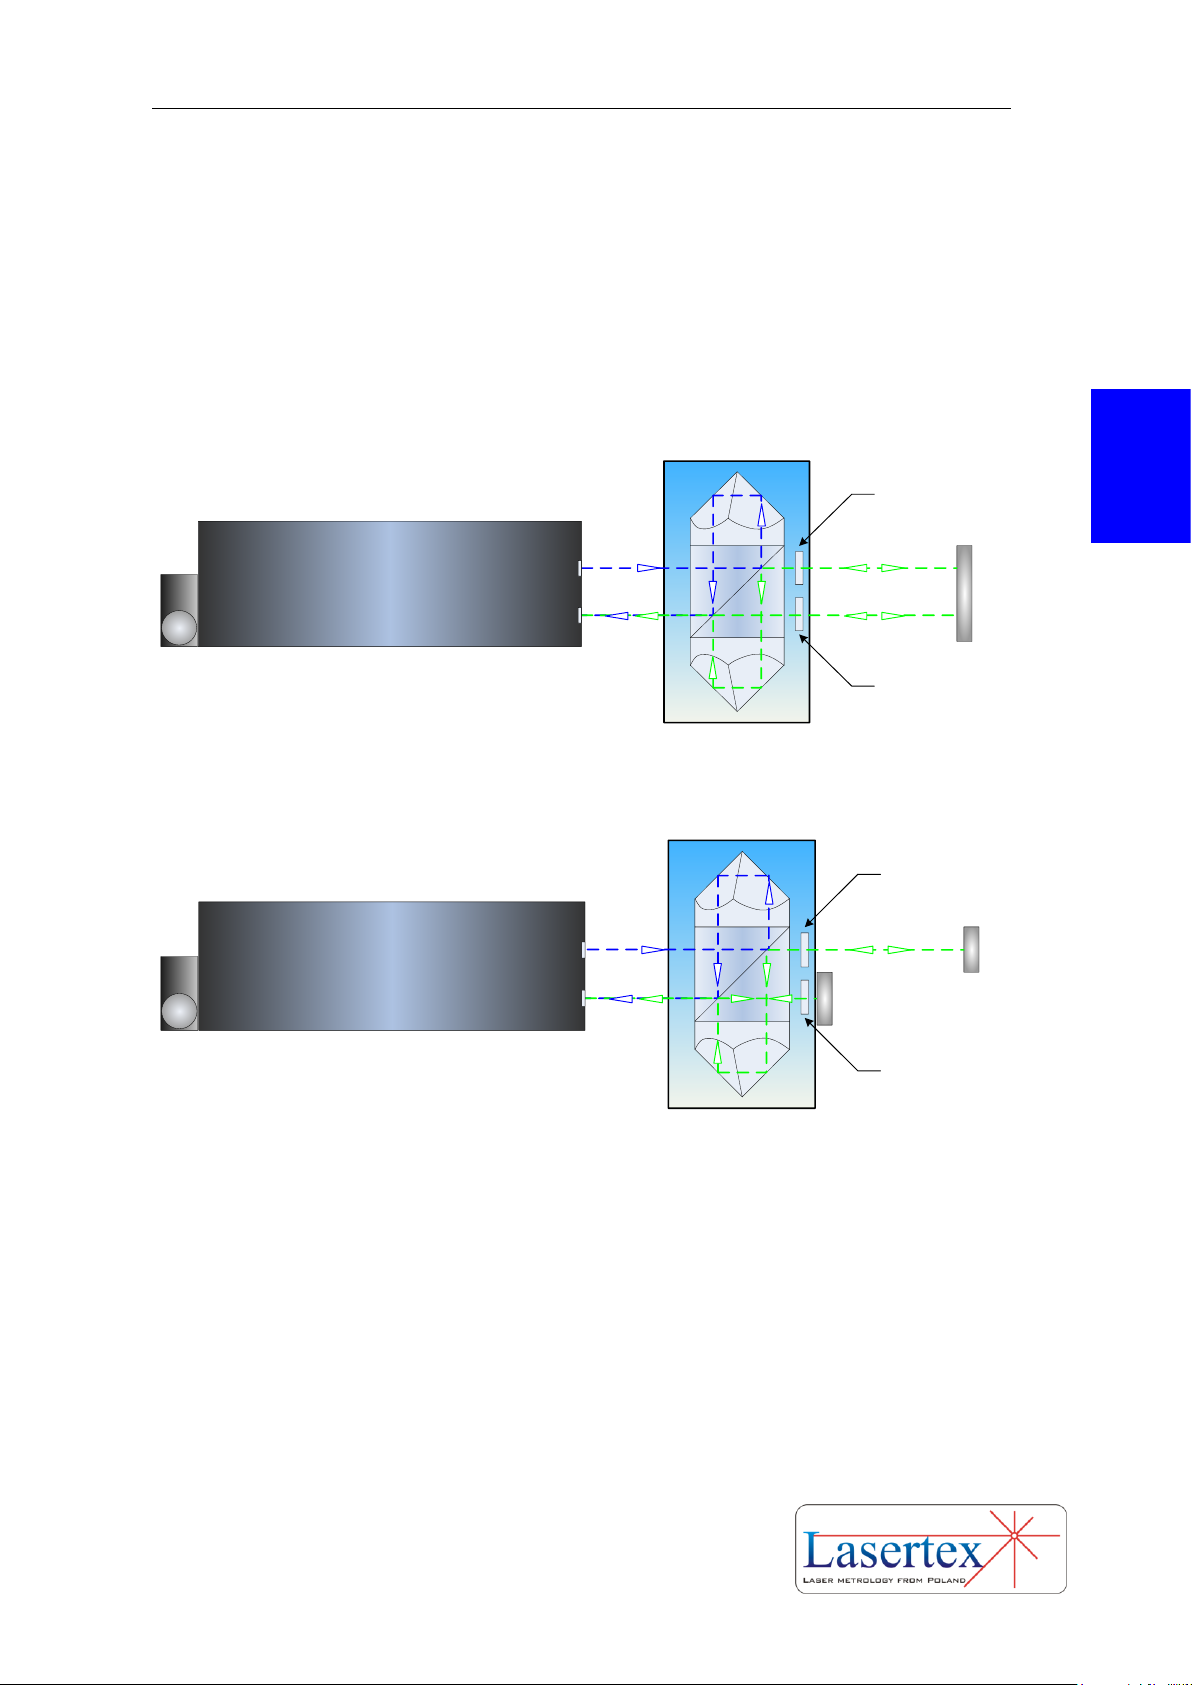
The aluminum, gold or dielectric mirror mounted to the moving part is suggested.
There are two possible configurations: double pass setup Fig. 3.31 and single pass
setup 3.32. The resolution of the double pass setup is two times bigger than the single
pass. The setup consists of the laser head, the flat mirror interferometer FMI and the
flat mirror. In order to obtain correct result of measurements with double-pass flat
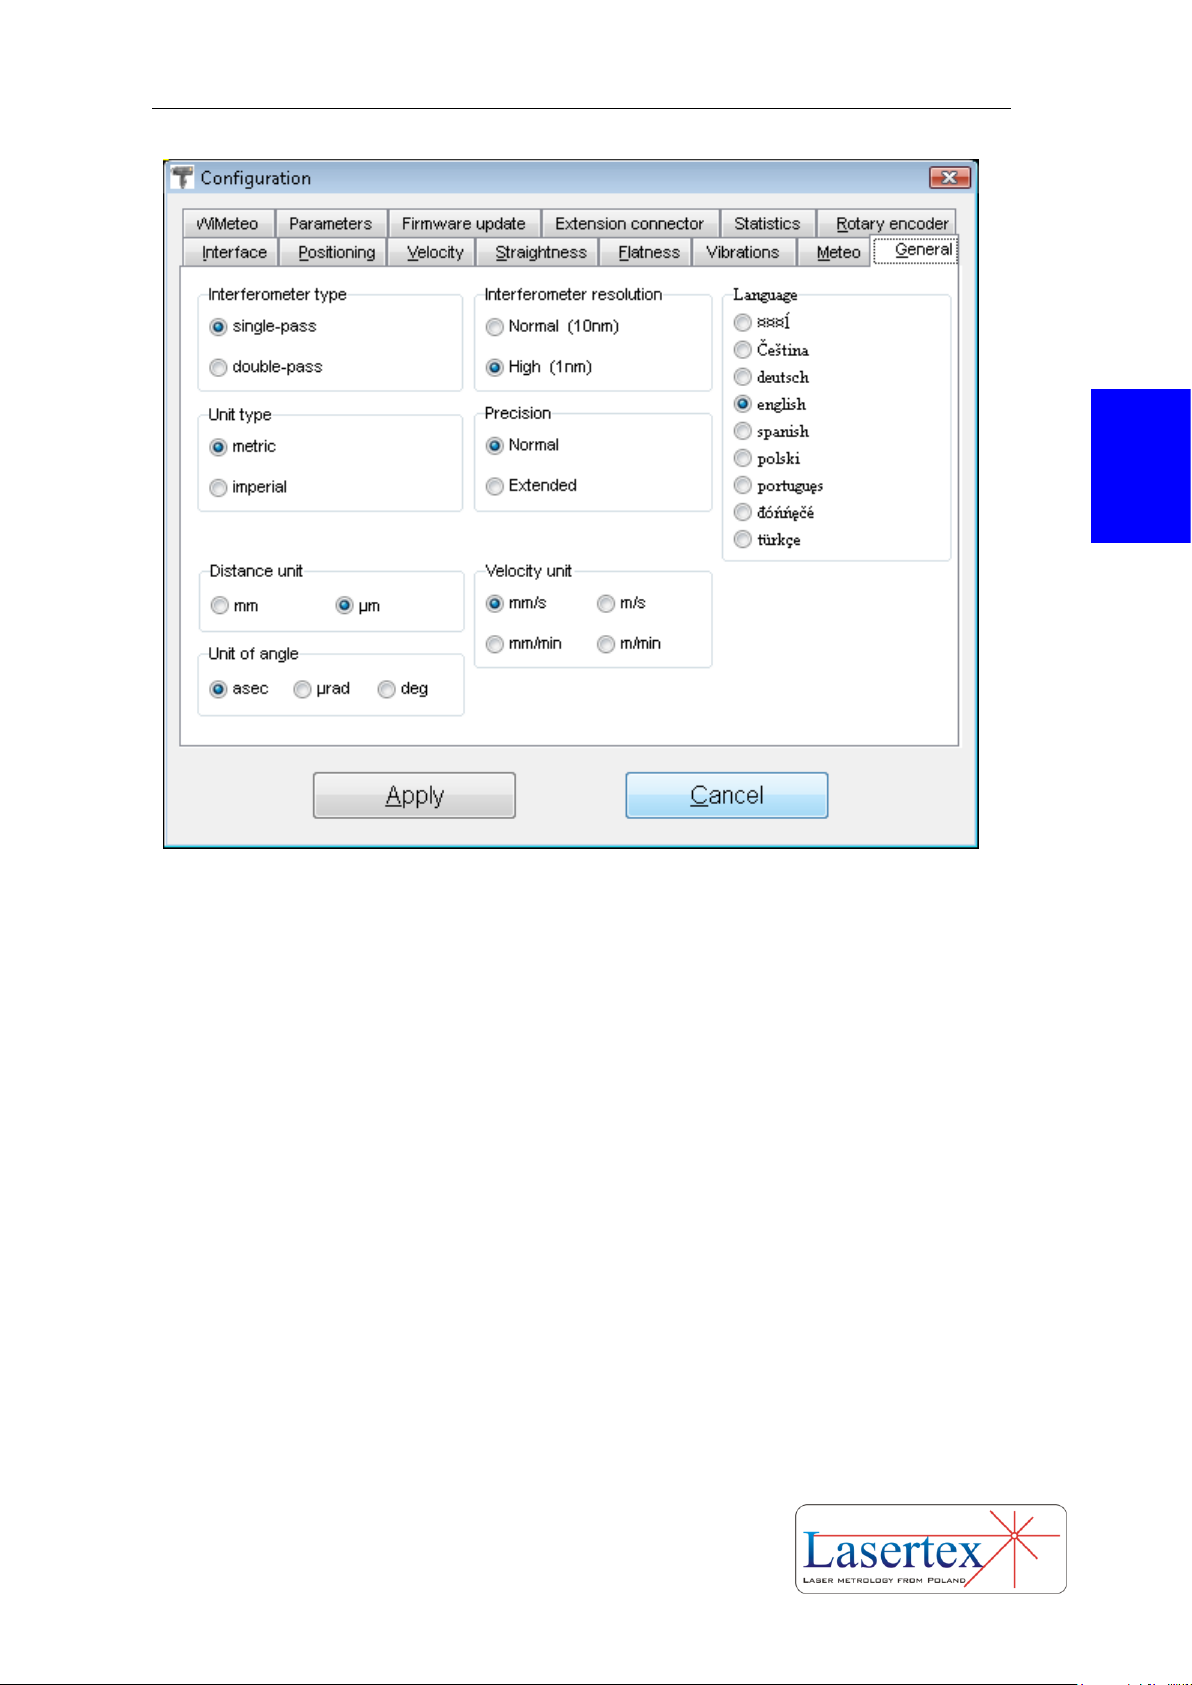
mirror configuration, the option double-pass in the Configuration window should be
chosen (fig. 3.33).
l/4
l/4
Flat mirror
LASER HEAD
FIG. 3.31. DOUBLE PASS FLAT MIRROR INTERFREOMETER
l/4
l/4
Flat mirror
LASER HEAD
Flat mirror
FIG. 3.32. SINGLE PASS FLAT MIRROR INTERFREOMETER
Page 48
PREPARATIONS
3-27 www.lasertex.eu
3
FIG. 3.39. CONFIGURATION WINDOW – INTERFEROMETER TYPR CHOICE
Page 49
BEAM ALIGNMENT
4-1 www.lasertex.eu
4
4. BEAM ALIGNMENT
a. Introduction
Beam alignment is a process in which the user, with the use of certain
mechanical arrangements, makes the direction of the laser beam parallel to the
direction of the movement in a measured axis. If the beam is not correctly aligned an
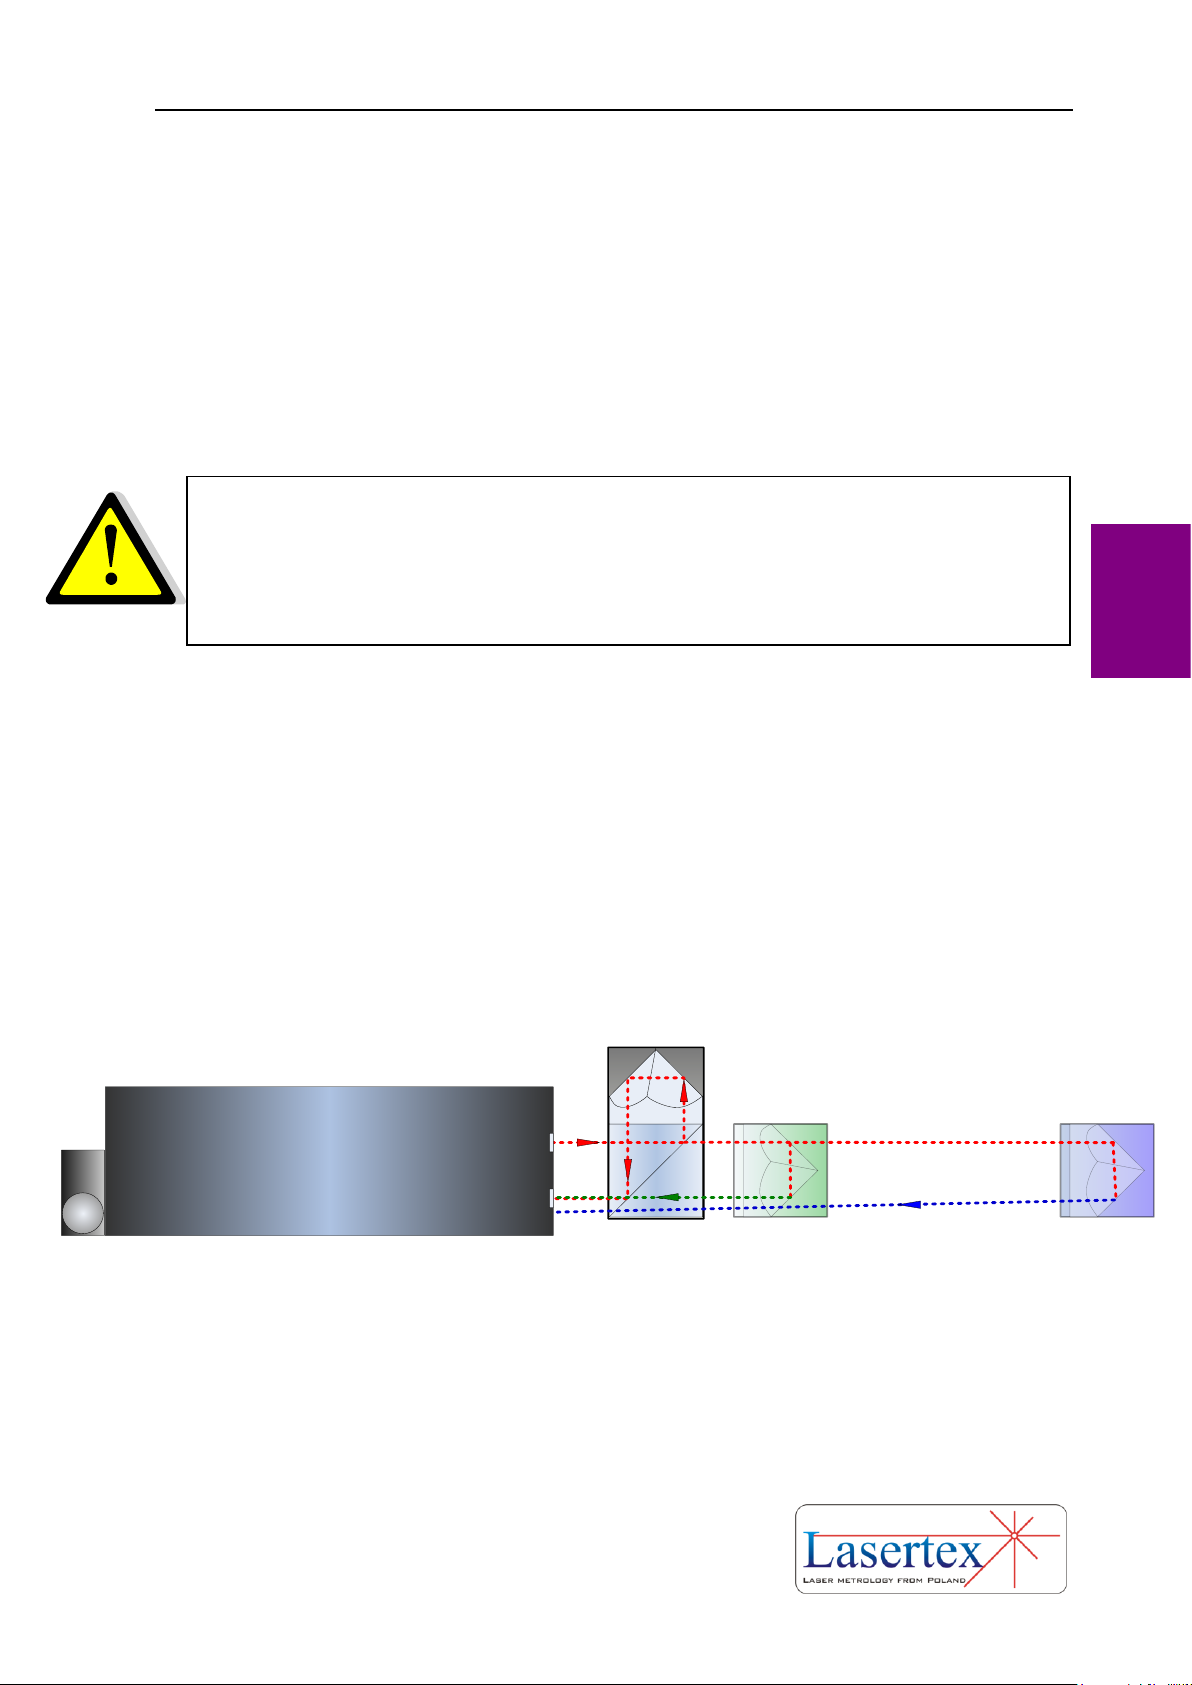
effect like the one shown on Fig.4.1 may happen, i.e. the position of the beam
returning on the detector in the Laser Head from the moving retroreflector may vary
with the position of the retroreflector resulting in a cosine error (see chapter 17)
and/or misalignment of the optical path (no Beam Strength).
LASER HEAD
FIG.4.1. ILLUSTRATION OF BEAM MISALIGNMENT
The alignment of the optical set up should be conducted in the option Display.
It can be done during Laser Head heating. Final check should be made when the
system is ready to work.
The alignment of the optical path difficult and laborious part of
the whole measurement process. Be very careful reading this
chapter!
Page 50

BEAM ALIGNMENT
4-2 www.lasertex.eu
4
b. Electronic alignment tools
The beam path alignment process is usually time consuming so in order to
simplify and speed it up the HPI-3D provides, together with standard mechanical
elements like diaphragms, three unique electronic tools.
The first is a function of electronic position of the laser head in space –
Display/Laser Head. This option is a useful tool for the alignment of laser head
position in space.
Another useful and unique tool supporting alignment is the Electronic Beam
Alignment switched on in Display/Alignment option. With this tool the position of
the beams returning to the laser can be controlled very accurately.
The third tool is the Electronic Beam Indicator showing if the beam returning to
the laser is strong enough to make proper measurements. For indicating the beam
strength the physical Power Button on the laser head is used. When the laser is ready
for operation then this button stops blinking but turns orange or green. The second
color means the proper value of beam level.
c. Basic rules of beam alignment
With the HPI-3D there are delivered three main types of optical components:
linear optics, angular optics, Wollaston optics. Although the elements seem different
the beam path alignment is similar for all cases. In the points below the process is
described in more details with explanation of differences for the different types of
optics.
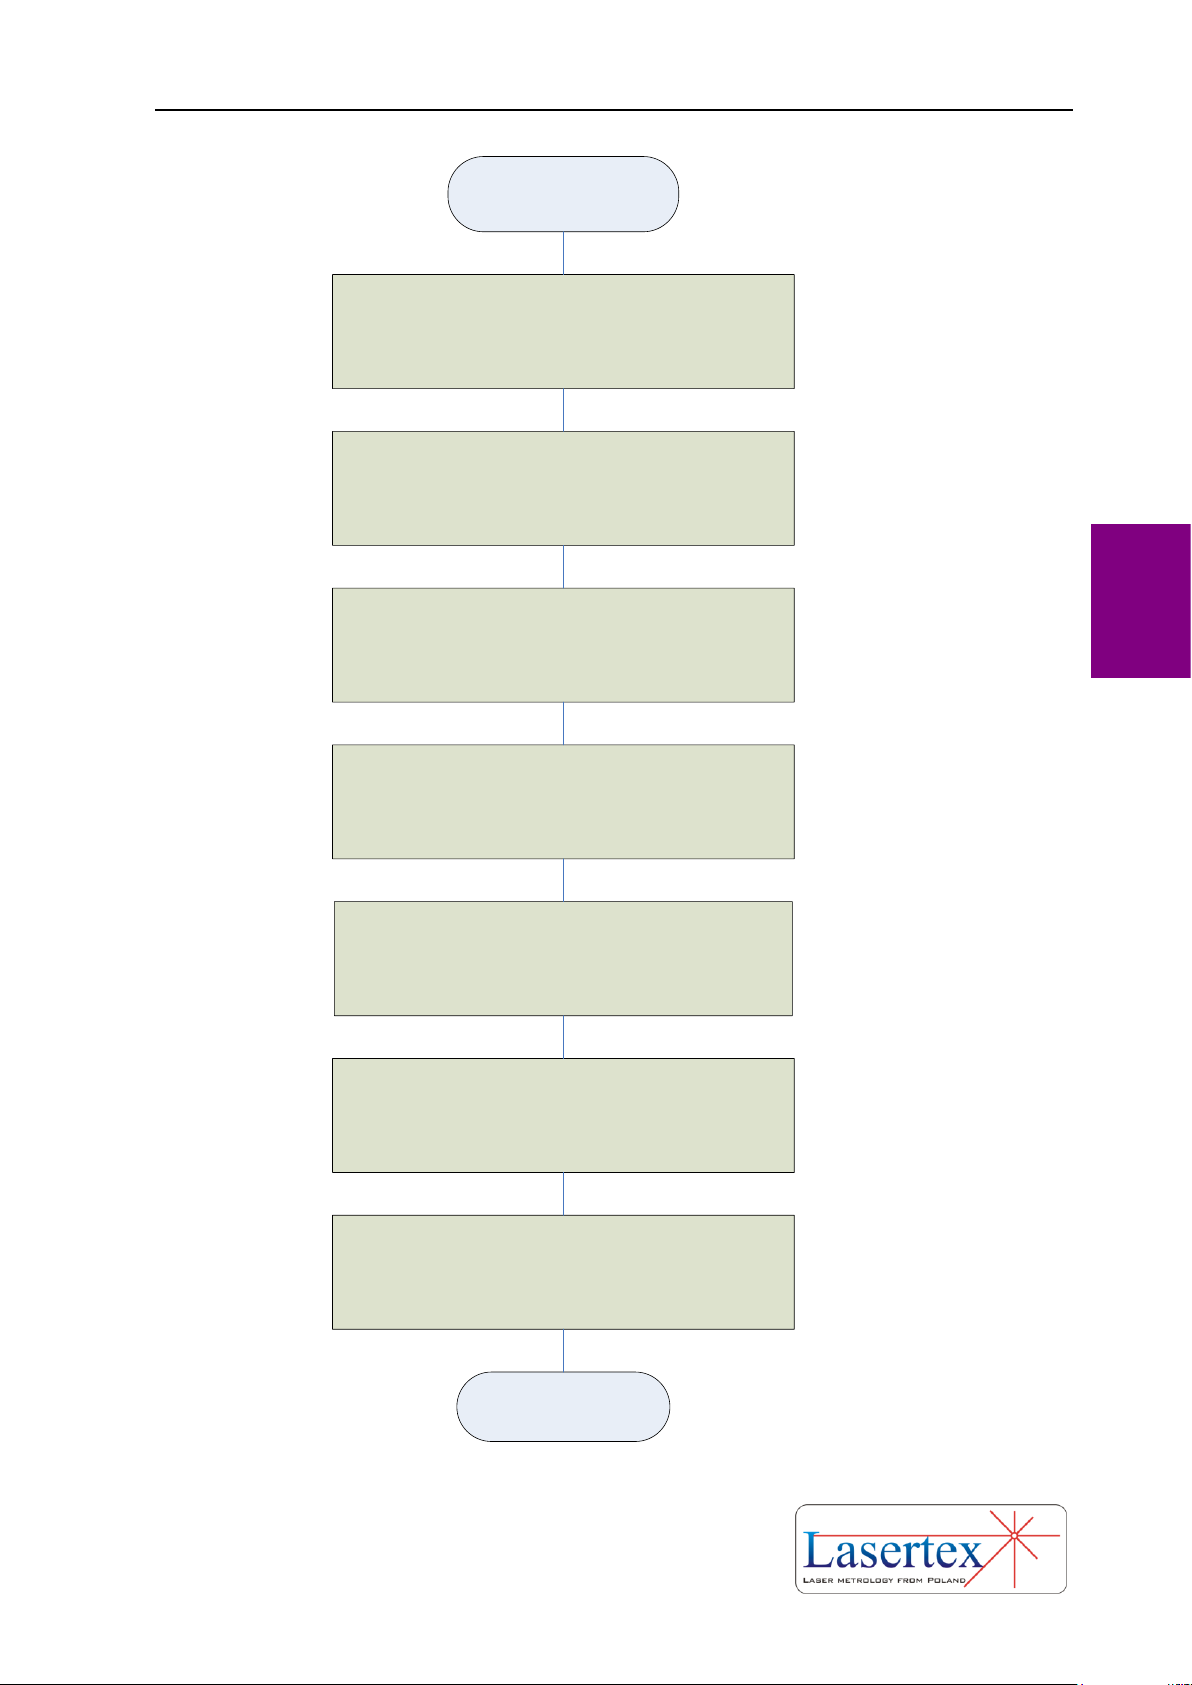
In the Figure 4.2 there is shown a block diagram of the basic rules of beam path
alignment. All points are covered in details in the paragraphs below.
Page 51
BEAM ALIGNMENT
4-3 www.lasertex.eu
4
Start
Set the laser head firmly on the tripod or on the
machine bench
Switch the laser on and set the position of the
laser so the beam is parallel to the measurement
axis
Set proper optical components along the laser
beam path.
Move the optical components along the
measurement axis and regulate the position of
the laser head so the beam always returns to the
laser – use diaphragms
Repeat previous point with the use of Electronic
Beam Alignment tool – (diaphragms in „work”
position)
Control the strength of the returning beam either
wirh Electronic Beam Indicator on the laser or
with software beam indicator on the PC
Correct position of the laser if necessary
Stop
FIG.4.2. BASIC BEAM ALIGNMENT RULES
Page 52
BEAM ALIGNMENT
4-4 www.lasertex.eu
4
d. Preparations
The Laser Head should be firmly attached to the tripod or put directly on the
machine bench. The tripod should not touch the machine as it may cause vibration of
the Laser Head and the optical path. Special attention should be paid not to move the
legs of the tripod during the measurements. The alignment process would have to be
repeated then.
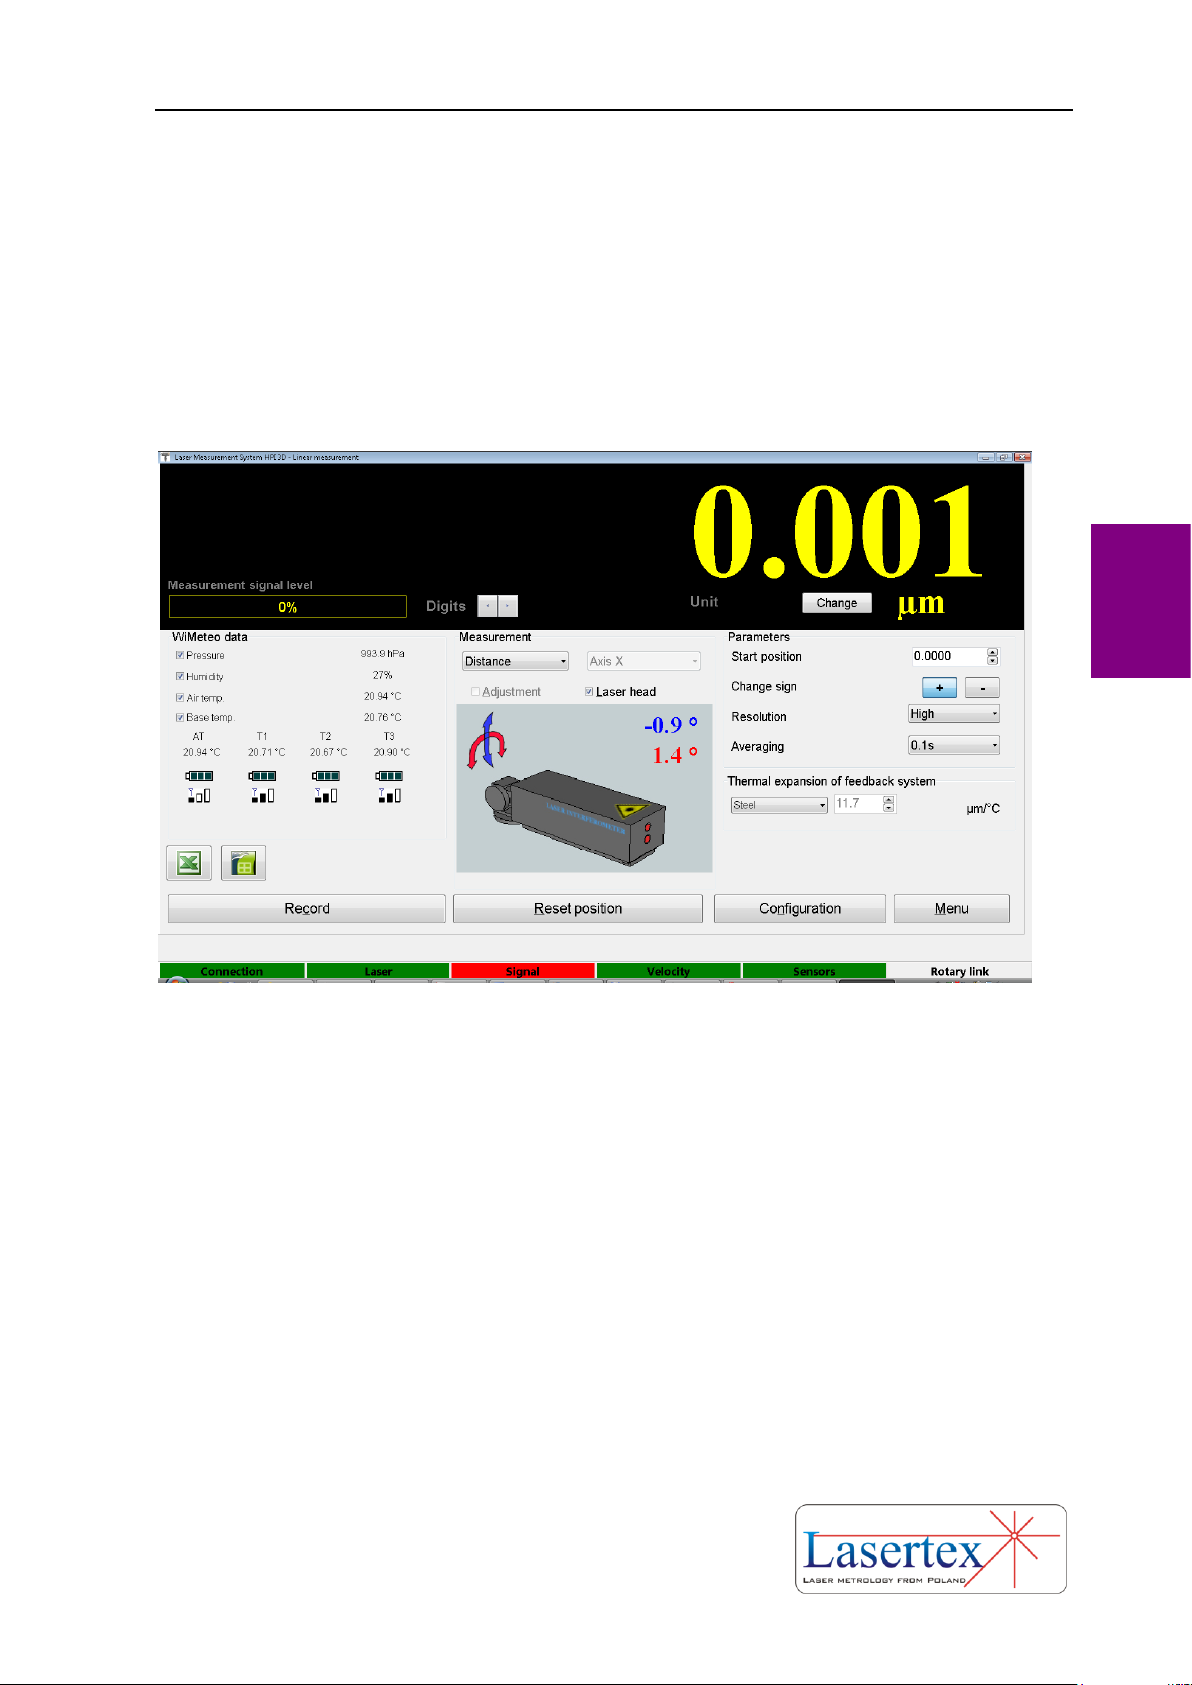
FIG. 4.3 ILUSTRATION OF THE FUNCTION LASER HEAD
The mechanical elements of the tripod help in the adjustment process. The
tripod must be leveled, and after that with the function Laser Head the position of
Laser Head must be set according to the angle of the measurement path.
i. Diaphragm
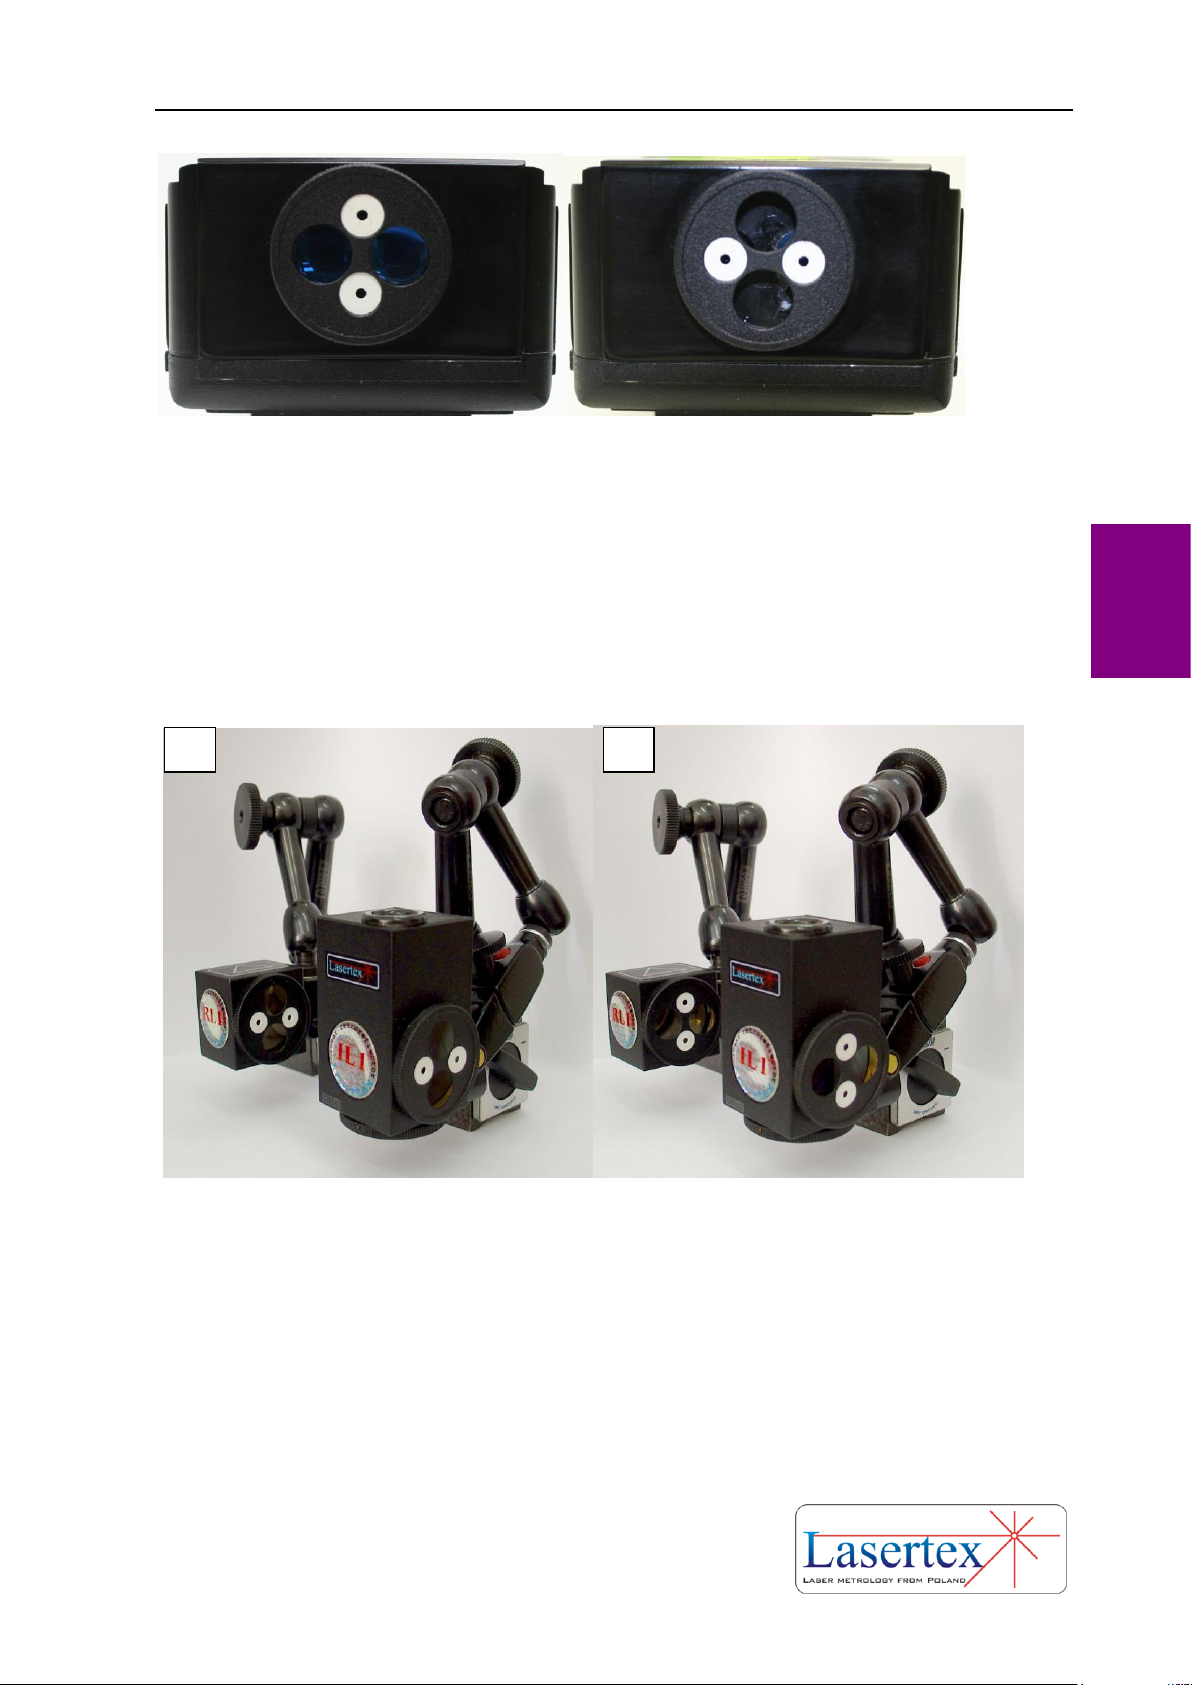
The diaphragm of the laser beam on the front panel of the Laser Head (figure
4.4) helps in the process of alignment. The diaphragm can be placed in two positions:
" Alignment" – the laser beam goes out through opening in the diaphragm
about 2 mm diameter,
" Measurement" from the Laser Head goes out beam about 8 mm diameter,
Page 53
BEAM ALIGNMENT
4-5 www.lasertex.eu
4
FIG.4.4. DIAPHRAGM POSITIONS. A) MEASUREMENT, B) ALIGNMENT
During transportation or when system is not used, correct position of
diaphragm is alignment position. In this position optics is safe from getting dirty,
covering with dust and accidental damage during transportation.
The Diaphragms are also used on most available optical components – see
figure 4.5 – with the exception of Wollaston optics.
FIG.4.5. DAPHRAGMS: ALIGNMENT POSITION (A) AND WORK POSITION (B)
If it is required then the diaphragms can be taken off and put back later on.
A
B
Page 54
BEAM ALIGNMENT
4-6 www.lasertex.eu
4
ii. Laser head alignment elements
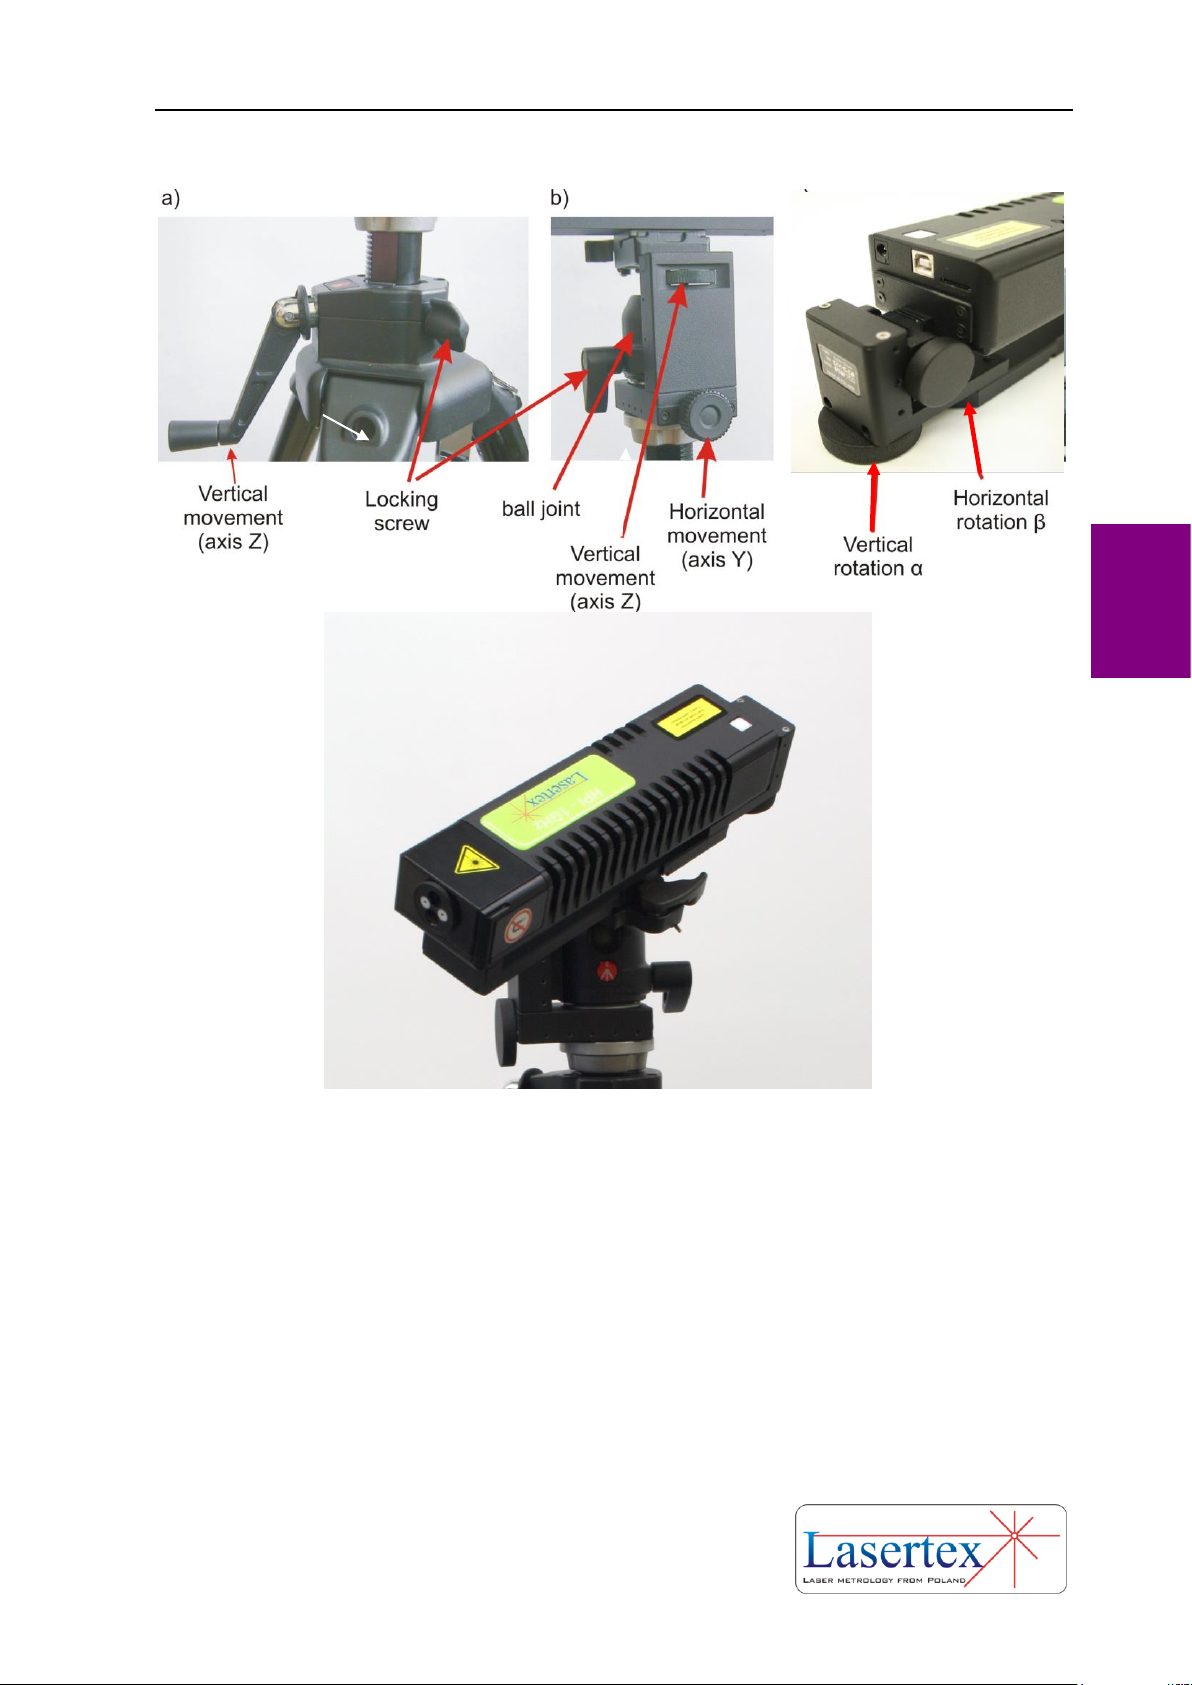
FIG.4.5. THE LASER HEAD ALIGNMENT ELEMENTS
In order to set the position of the beam in space properly the laser head has a
few regulation elements as shown in the figure 4.5. The elements are placed on the
swivel head of the tripod (figure 4.5a and 4.5b) and on the base of the laser head
(figure 4.5c).
Elements placed on the tripod are in general used for linear vertical and
horizontal movement of the beam position, while the elements available on the laser
head base are for angular vertical and horizontal movement of the beam.
Z Aligment
Page 55
BEAM ALIGNMENT
4-7 www.lasertex.eu
4
iii. Electronic Beam Alignment tool
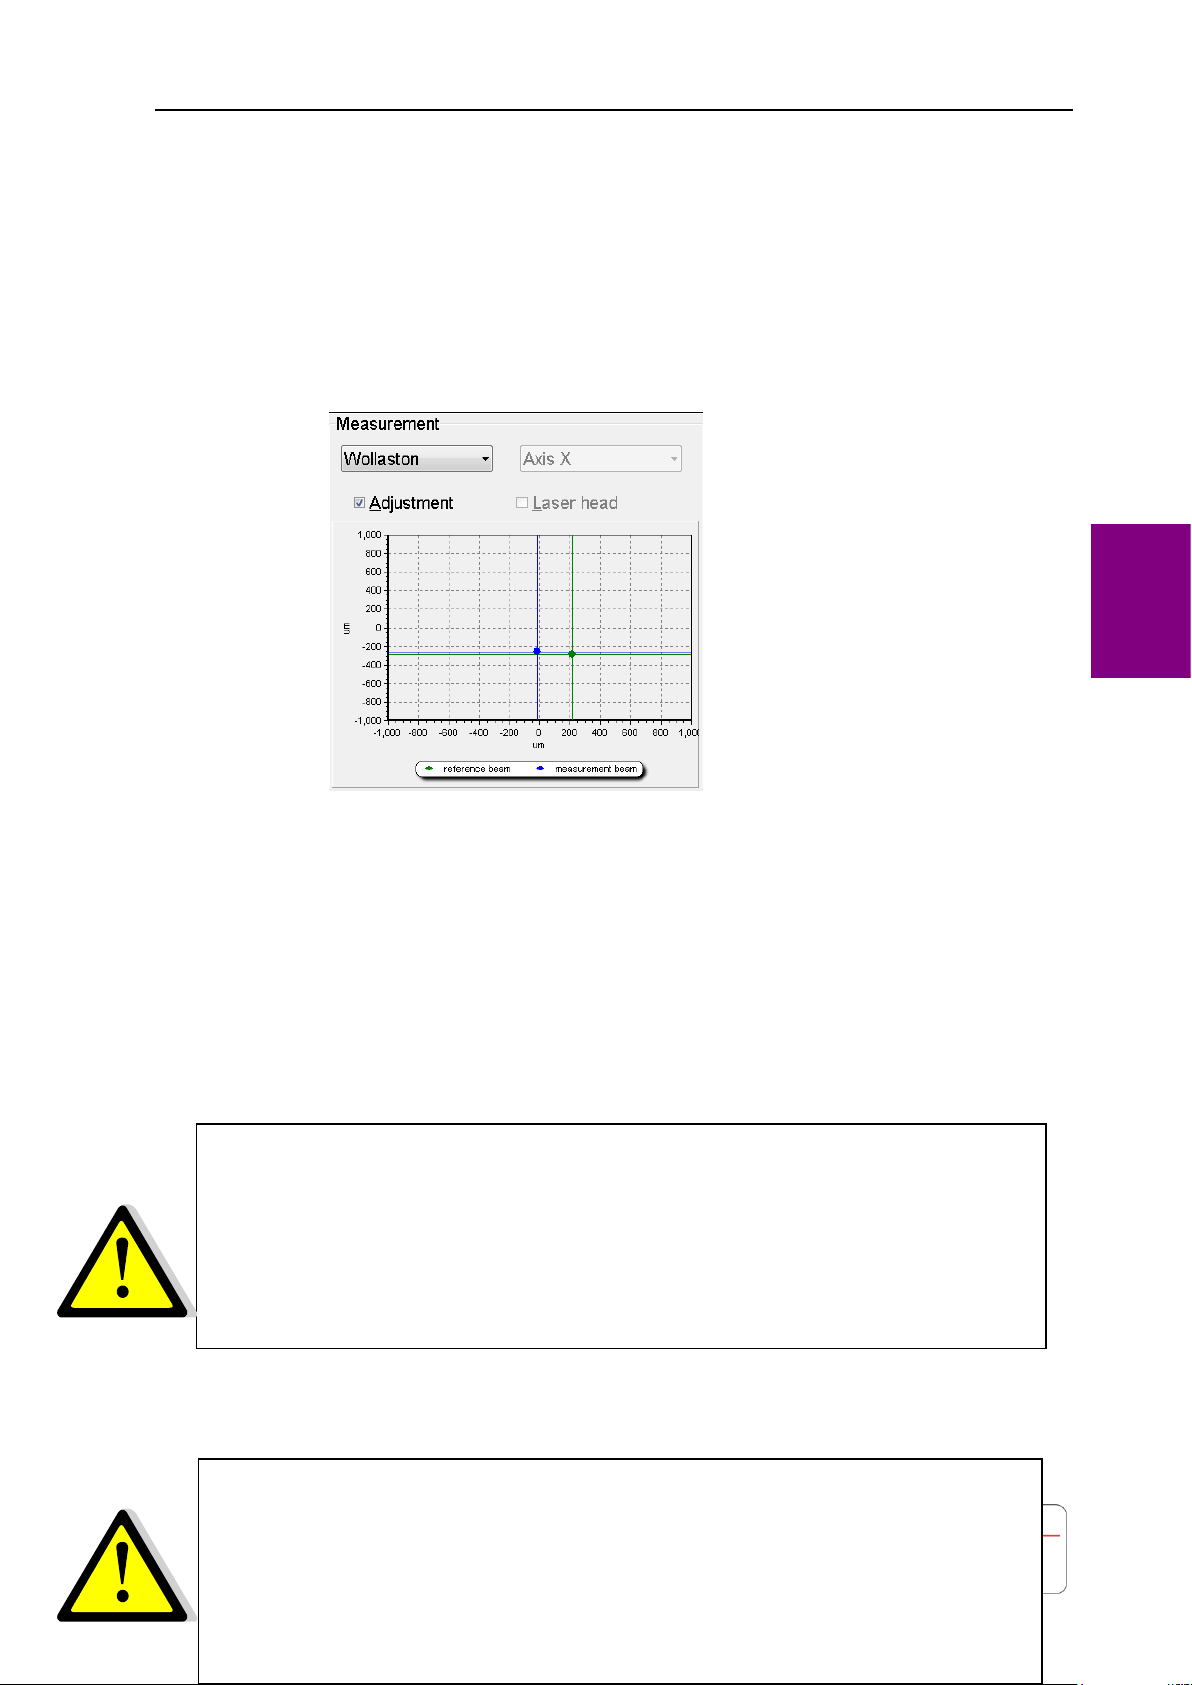
One of the unique features of the HPI-3D laser is the Electronic Beam
Alignment tool. This is a software tool displaying the position of the beams returning
to the laser. The tool can be activated in the Display option by checking Adjustment
check box in the Measurement panel – see figure 4.6.
FIG.4.6. ELECTRONIC BEAM ALIGNMENT TOOL
The tool shows two crosses: green and blue. The green cross shows the position
of the reference beam, while the blue one the position of the measurement beam.
The exact meaning of the crosses depends on the type of used optical
components. The terms “reference beam” and “measurement beam” have sense only
for linear optics. In this case the “reference beam” means the beam “from” IL1
element while “measurement beam” is the beam reflected back by RL1.
Each time the optical configuration of linear optics is
changed it is required to stop the beam between IL1 and RL1 for
2-3 seconds. Laser needs this operation to conduct calibration
procedures.
Attention! It is inadmissible to place one of optical
elements (i.e. RL1 or IL1) outside the machine on an additional
stand – the system measures then also displacements of the
machine in relation to the stand!).
Page 56
BEAM ALIGNMENT
4-8 www.lasertex.eu
4
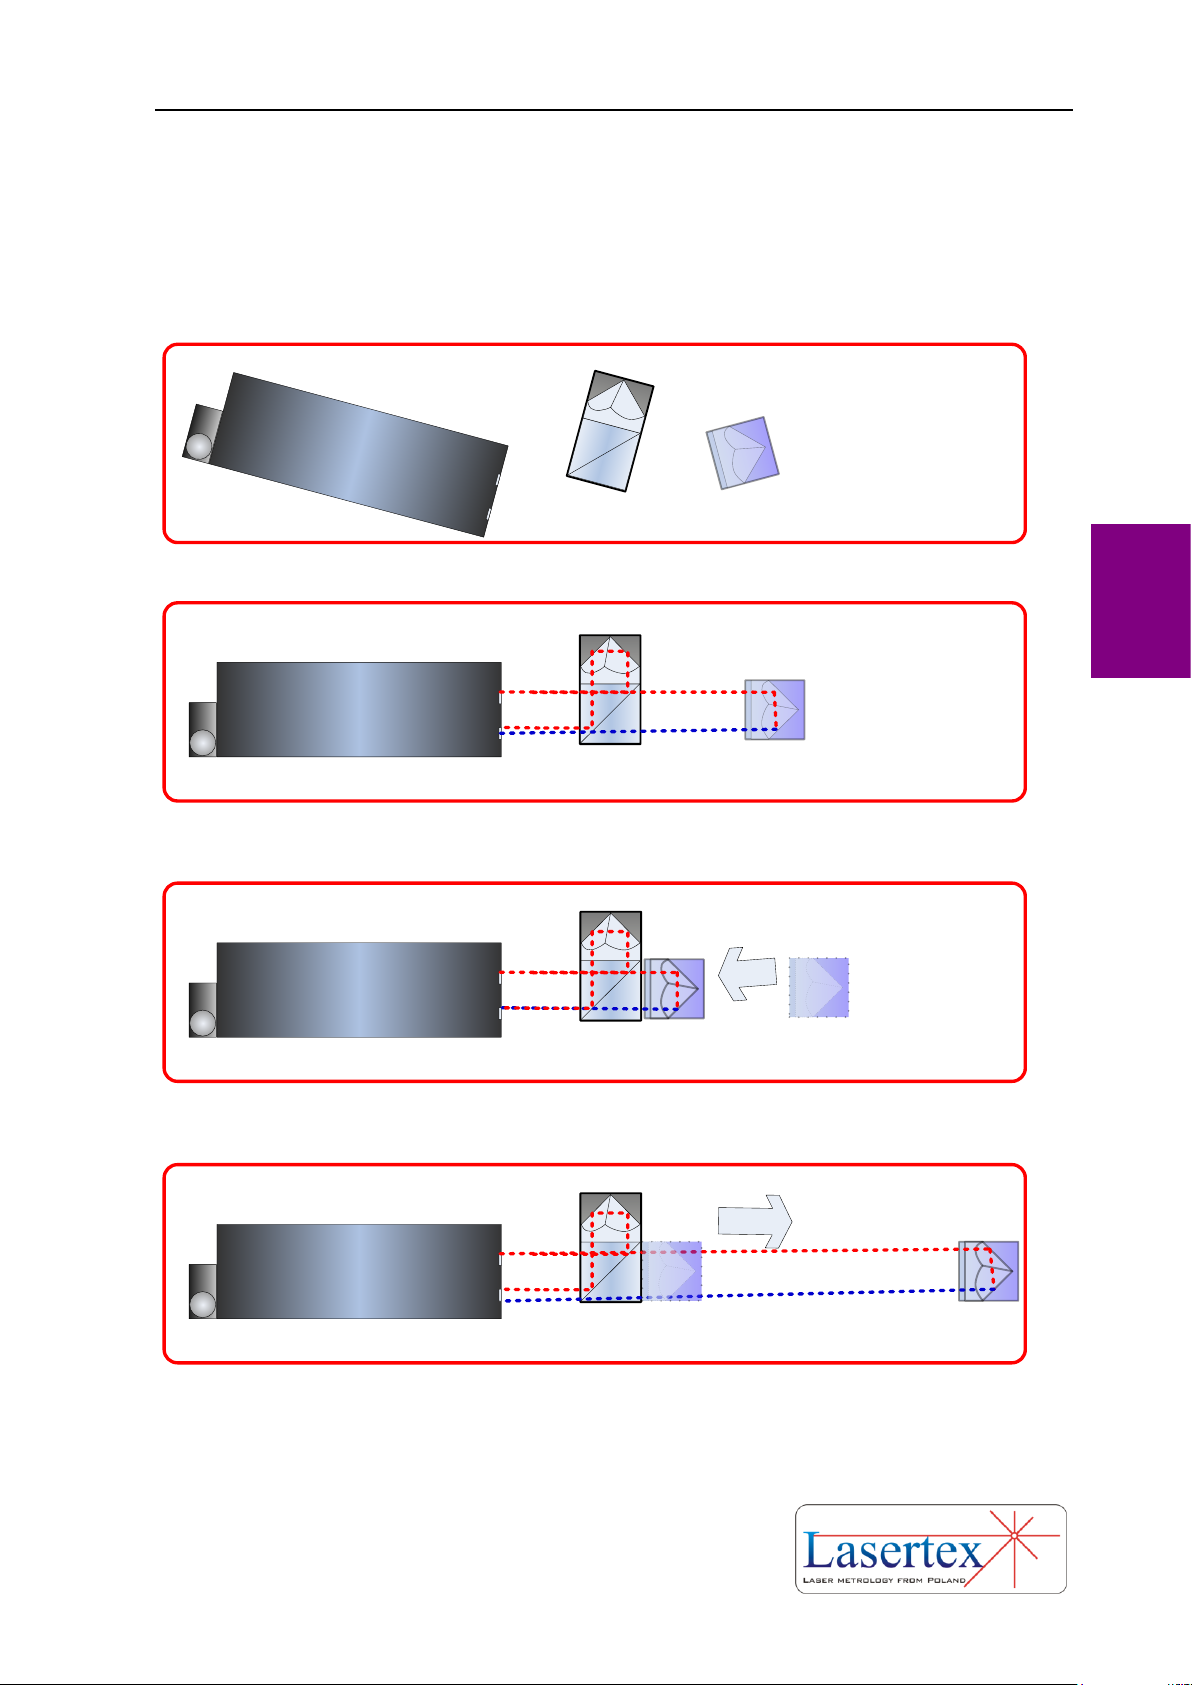
e. Beam alignment process for linear optics
LASER HEAD
1. Mount Laser Head, IL1 and RL1 on the measured machine
LASER HEAD
2. Turn on the laser and align all elements along the measurement
axis
LASER HEAD
3. Move the RL1 very close to IL1 (they can touch each other). Set
their initial position so the beam returns back to the laser.
LASER HEAD
4. Move the RL1 from the IL1
Page 57
BEAM ALIGNMENT
4-9 www.lasertex.eu
4
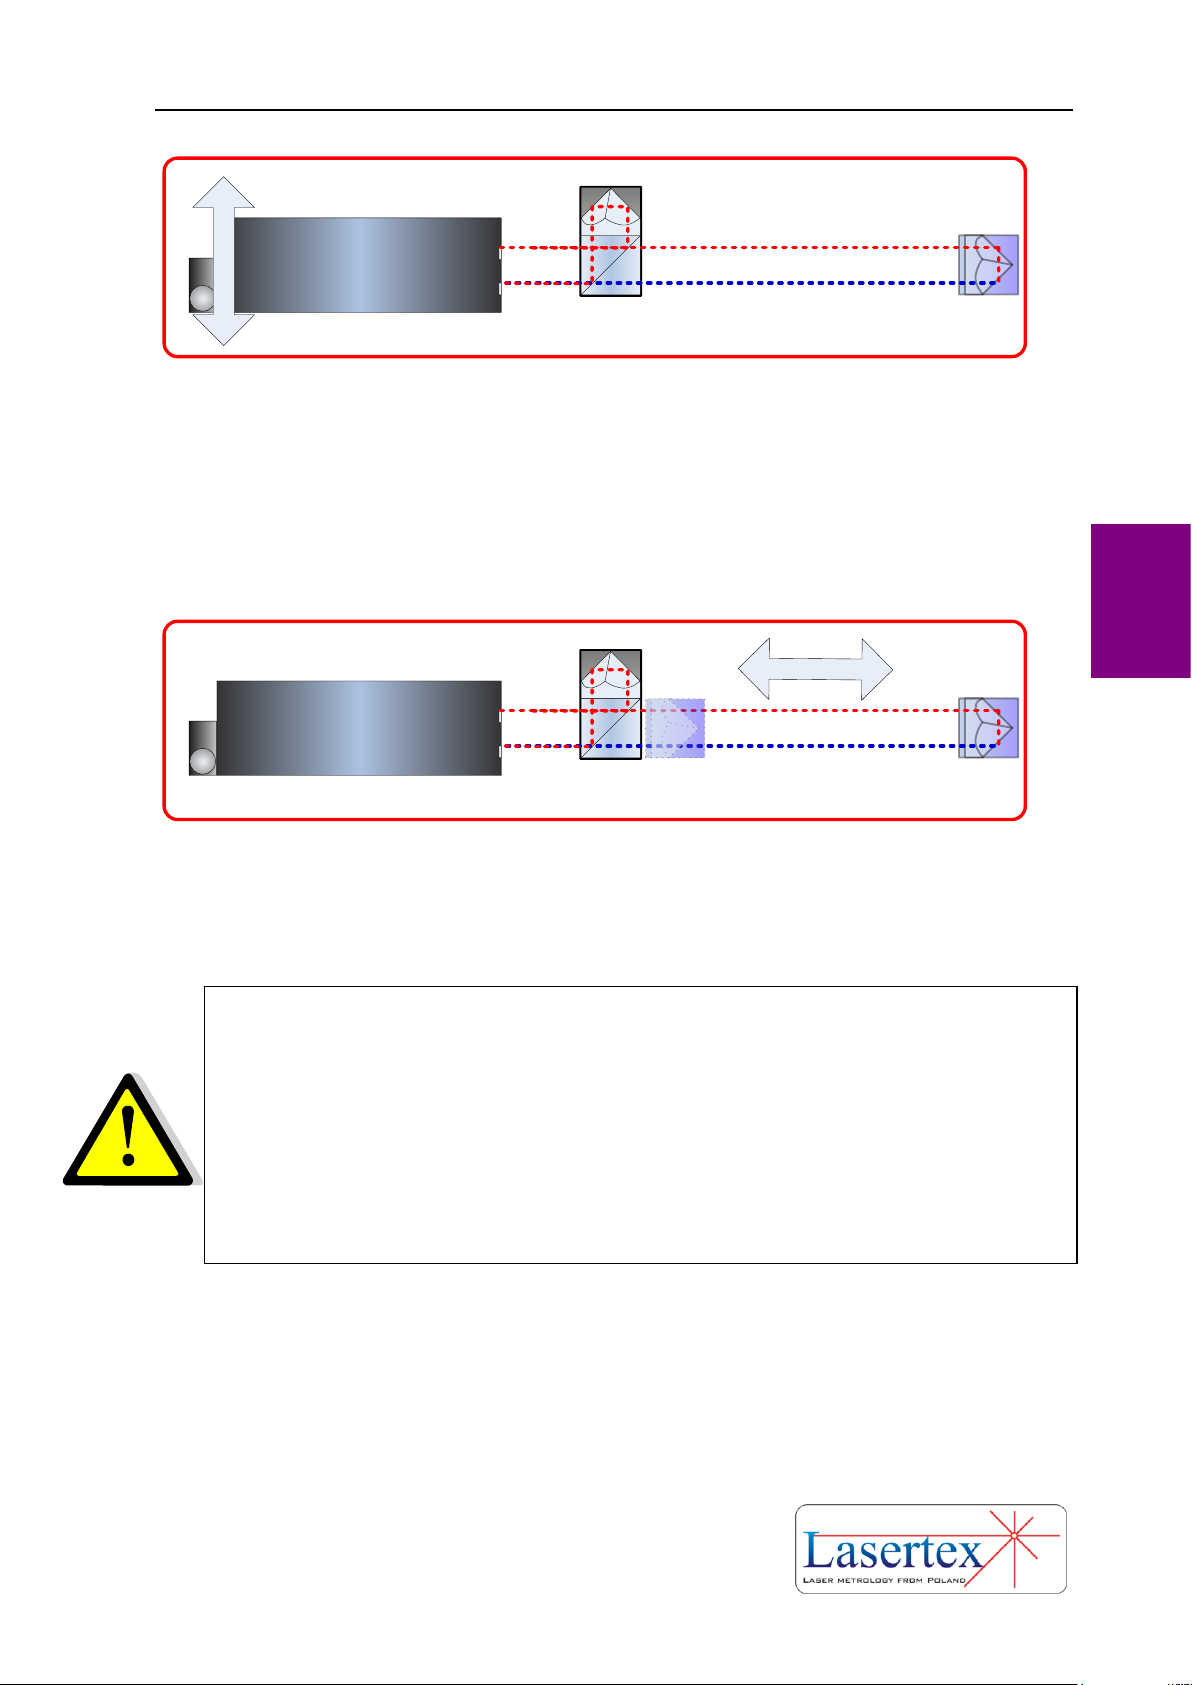
LASER HEAD
5. By regulation of the laser head position align the beam path so that
both beam overlap on the input of the laser.
REMARK 1: With angular regulation the position of the beam from RL1
should be regulated. Position of the beam returning from IL1 should be
regulated with mechanical components on the tripod.
REMARK 2: If the laser head is mounted directly on the machine then
the position of the beam returning from IL1 should regulated by direct
movement of the IL1 component.
LASER HEAD
6. Move the RL1 back to IL1 (the components must not touch!) and
check the quality of the beam path alignment. Use availble electronic
tools – Beam Level Indicator and Electronic Beam Alignment Tool.
f. Beam alignment process for angular optics
Attention! The position when the interferometer touches the
retro-reflector can serve only to adjust. Be sure that during
measurements in extreme nearest measuring position the retro-
reflector does not touch the interferometer, because it can be a
source of measuring errors.
Page 58
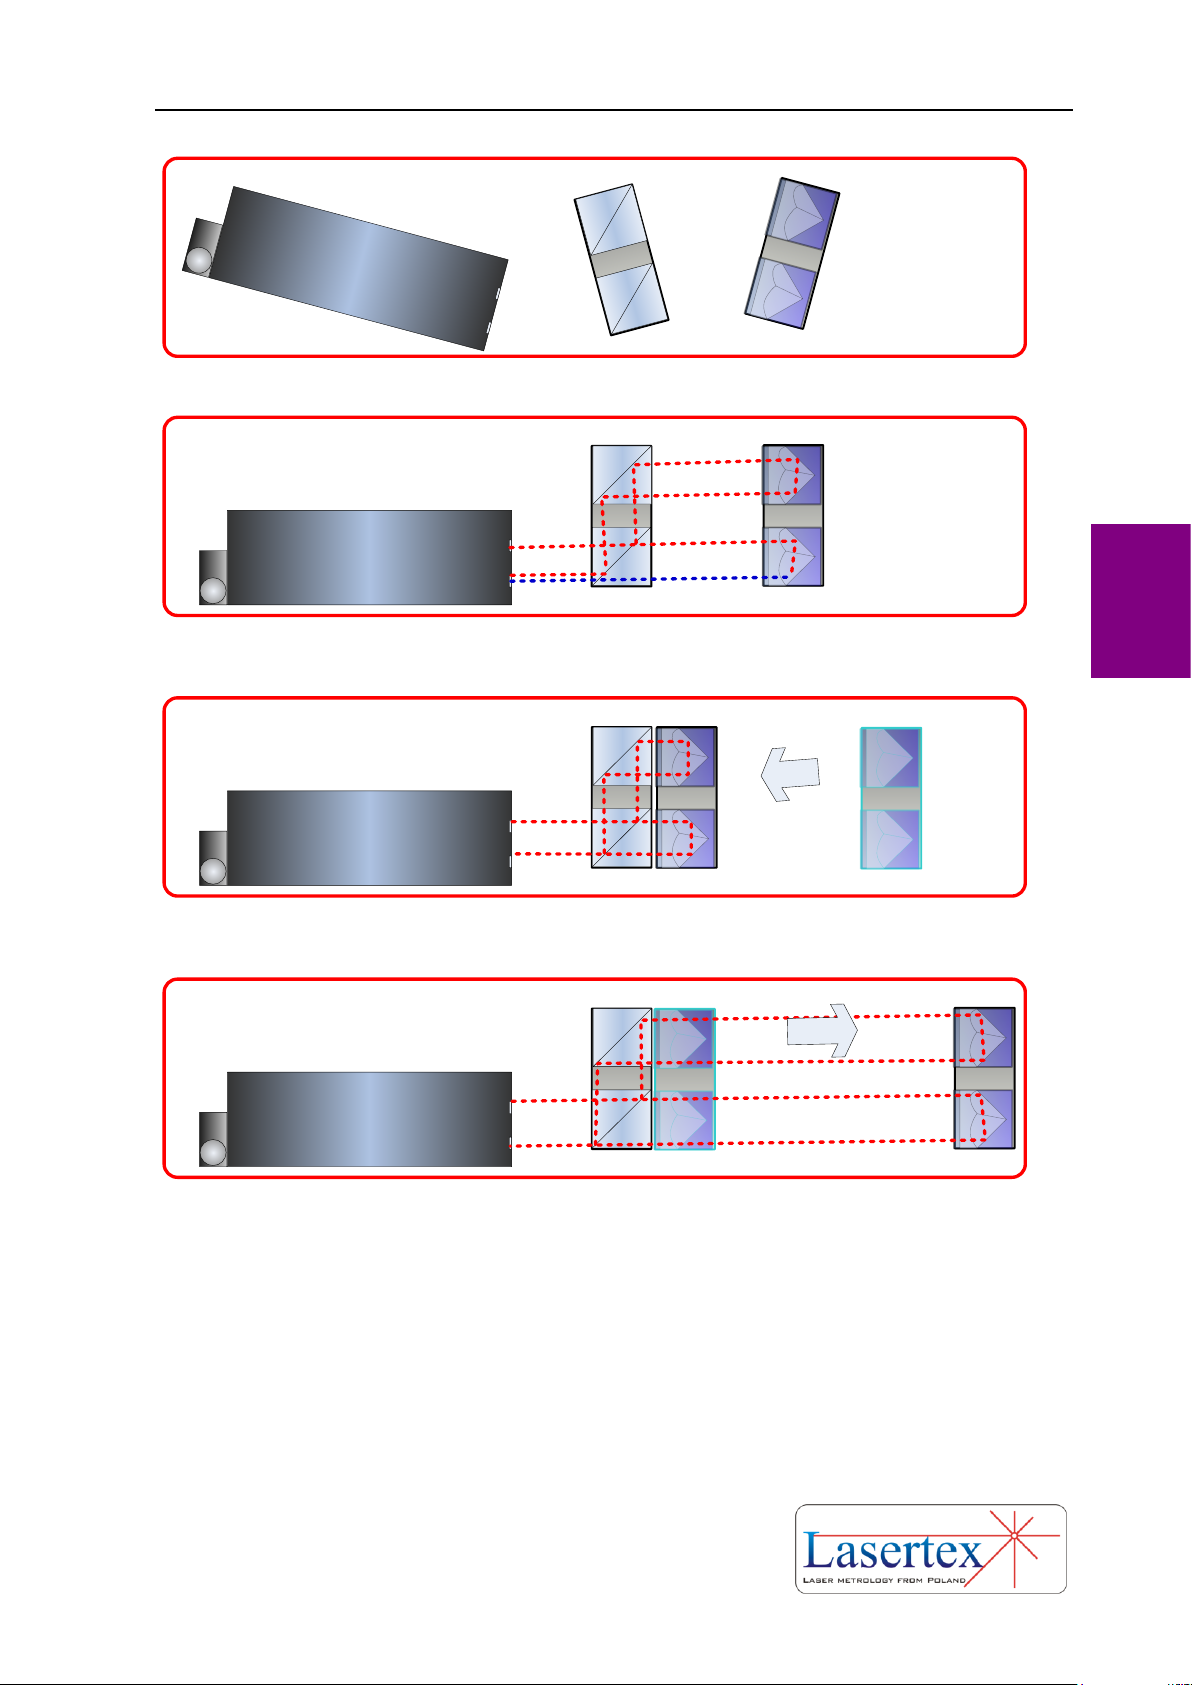
BEAM ALIGNMENT
4-10 www.lasertex.eu
4
LASER HEAD
1. Mount Laser Head, IK1 and RK1 on the measured machine
IK
1
RK
1
RK1
IK1
LASER HEAD
2. Turn on the laser and align all elements along the measurement
axis
RK1
IK1
LASER HEAD
3. Move the RK1 very close to IK1 (they can touch each other). Set
their initial position so the beam returns back to the laser.
RK1
RK1
IK1
LASER HEAD
4. Move the RK1 from IK1.
RK1
Page 59
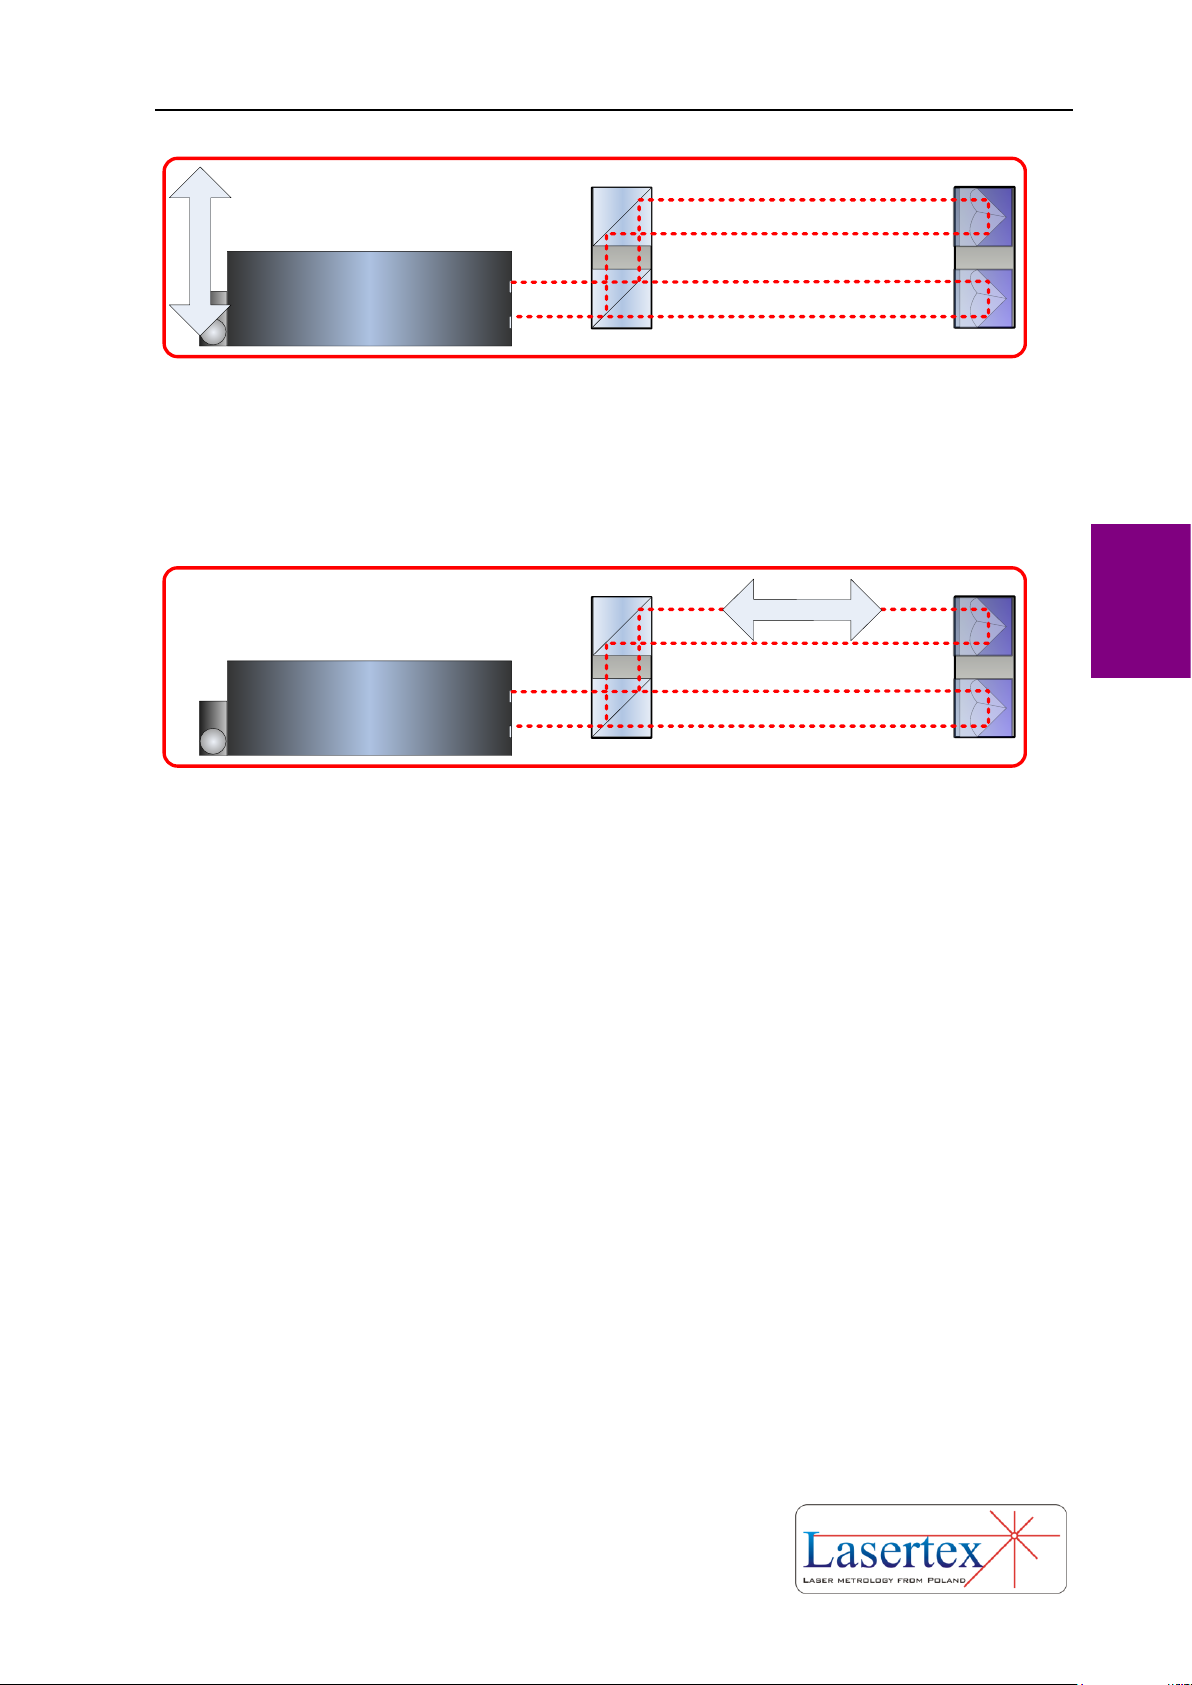
BEAM ALIGNMENT
4-11 www.lasertex.eu
4
RK1
IK1
LASER HEAD
5. By regulation of the laser head position align the beam path so that
both beam overlap on the input of the laser.
REMARK: If the beams do not overlap then it means that the IK1 is
rotated against RK1. Check the roll of laser head against IK1 and RK1
– it should be zero!
RK1
IK1
LASER HEAD
6. Move the RK1 back to IK1 (the components must not touch!) and
check the quality of the beam path alignment. Use available electronic
tools – Beam Level Indicator and Electronic Beam Alignment Tool.
Page 60
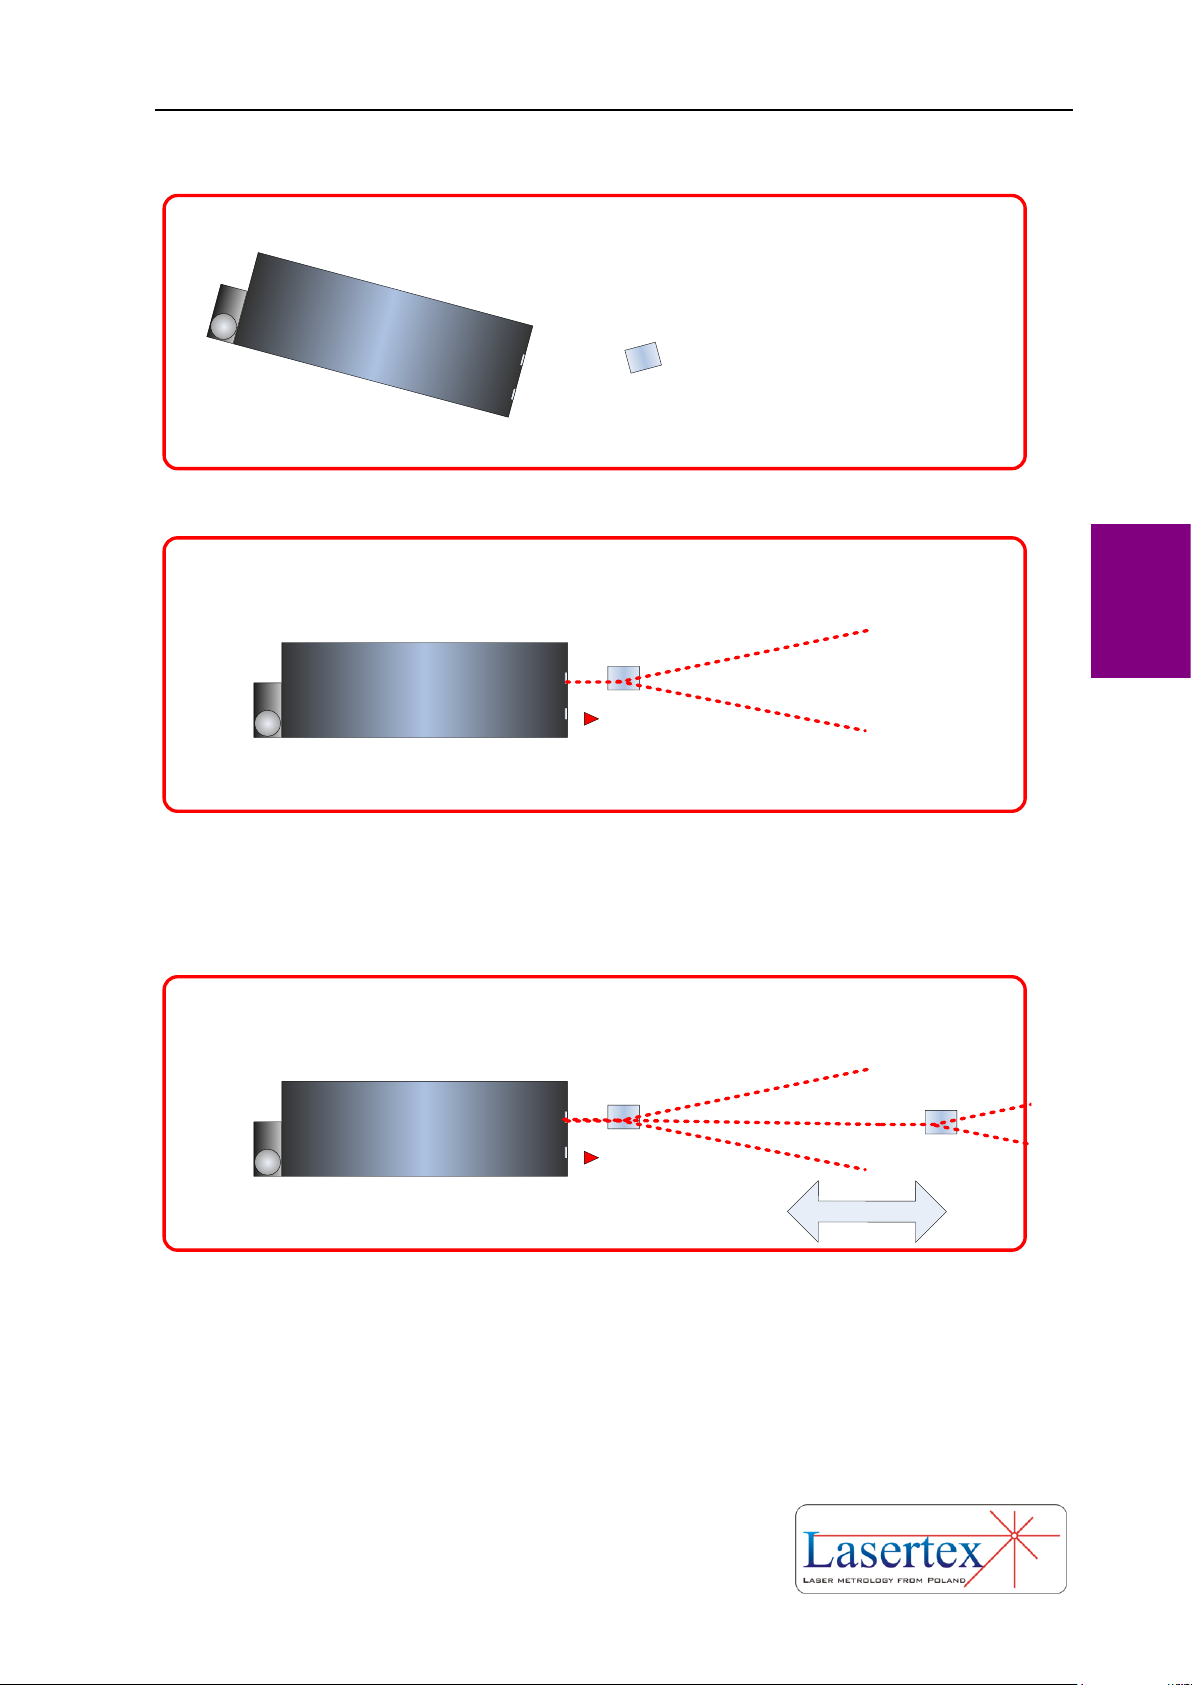
BEAM ALIGNMENT
4-12 www.lasertex.eu
4
g. Beam alignment process for Wollaston optics
LASER HEAD
1. Mount Laser Head and WP2 on the measured machine
WP
2
LASER HEAD
WP2
2. Turn on the laser. Switch diaphragms both on the WP2 and the
laser head to the alignment position. Insert the WP2 in the laser beam
path so that the beam passes through the middle of both diaphragms
of the WP2
LASER HEAD
WP2
3. Move the WP2 along the measurement axis. Aling the laser position
so that the beam passes always through the middle of the WP2
diaphragms.
WP2
Page 61
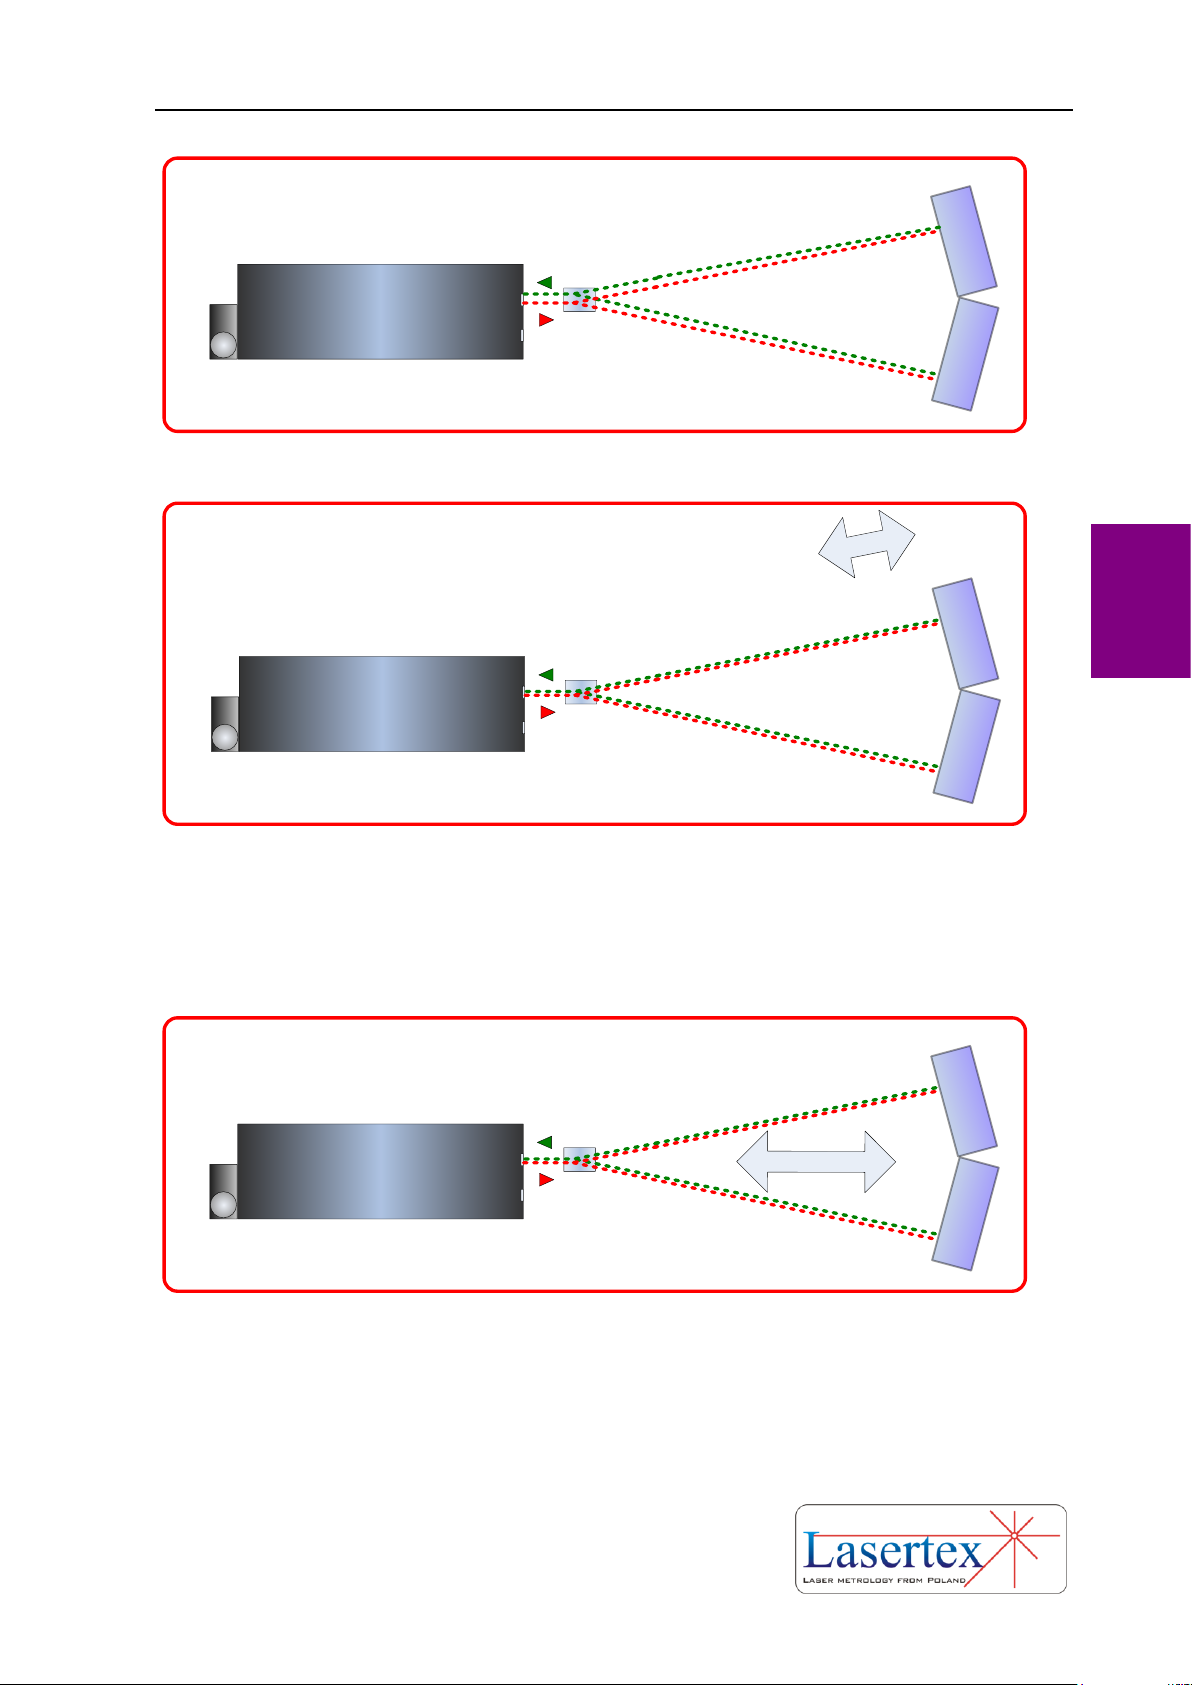
BEAM ALIGNMENT
4-13 www.lasertex.eu
4
LASER HEAD
WP2
WRP2
4. Insert WRP2 at the end of the measurement path.
LASER HEAD
WP2
WRP2
5. Regulate the angle of the WRP2 (with the large knob on the top) so
that the reflected beam returns to the laser head
LASER HEAD
WP2
WRP2
6. Move the WRP2 back to WP2 (not closer than 30 cm) and check the quality of
the beam path alignment. Use available electronic tools – Beam Level Indicator
and Electronic Beam Alignment Tool – the beams on the Alignment Tool have to
overlap!. If they not over lap then rotate the WP2 so they are onto each other.
Page 62
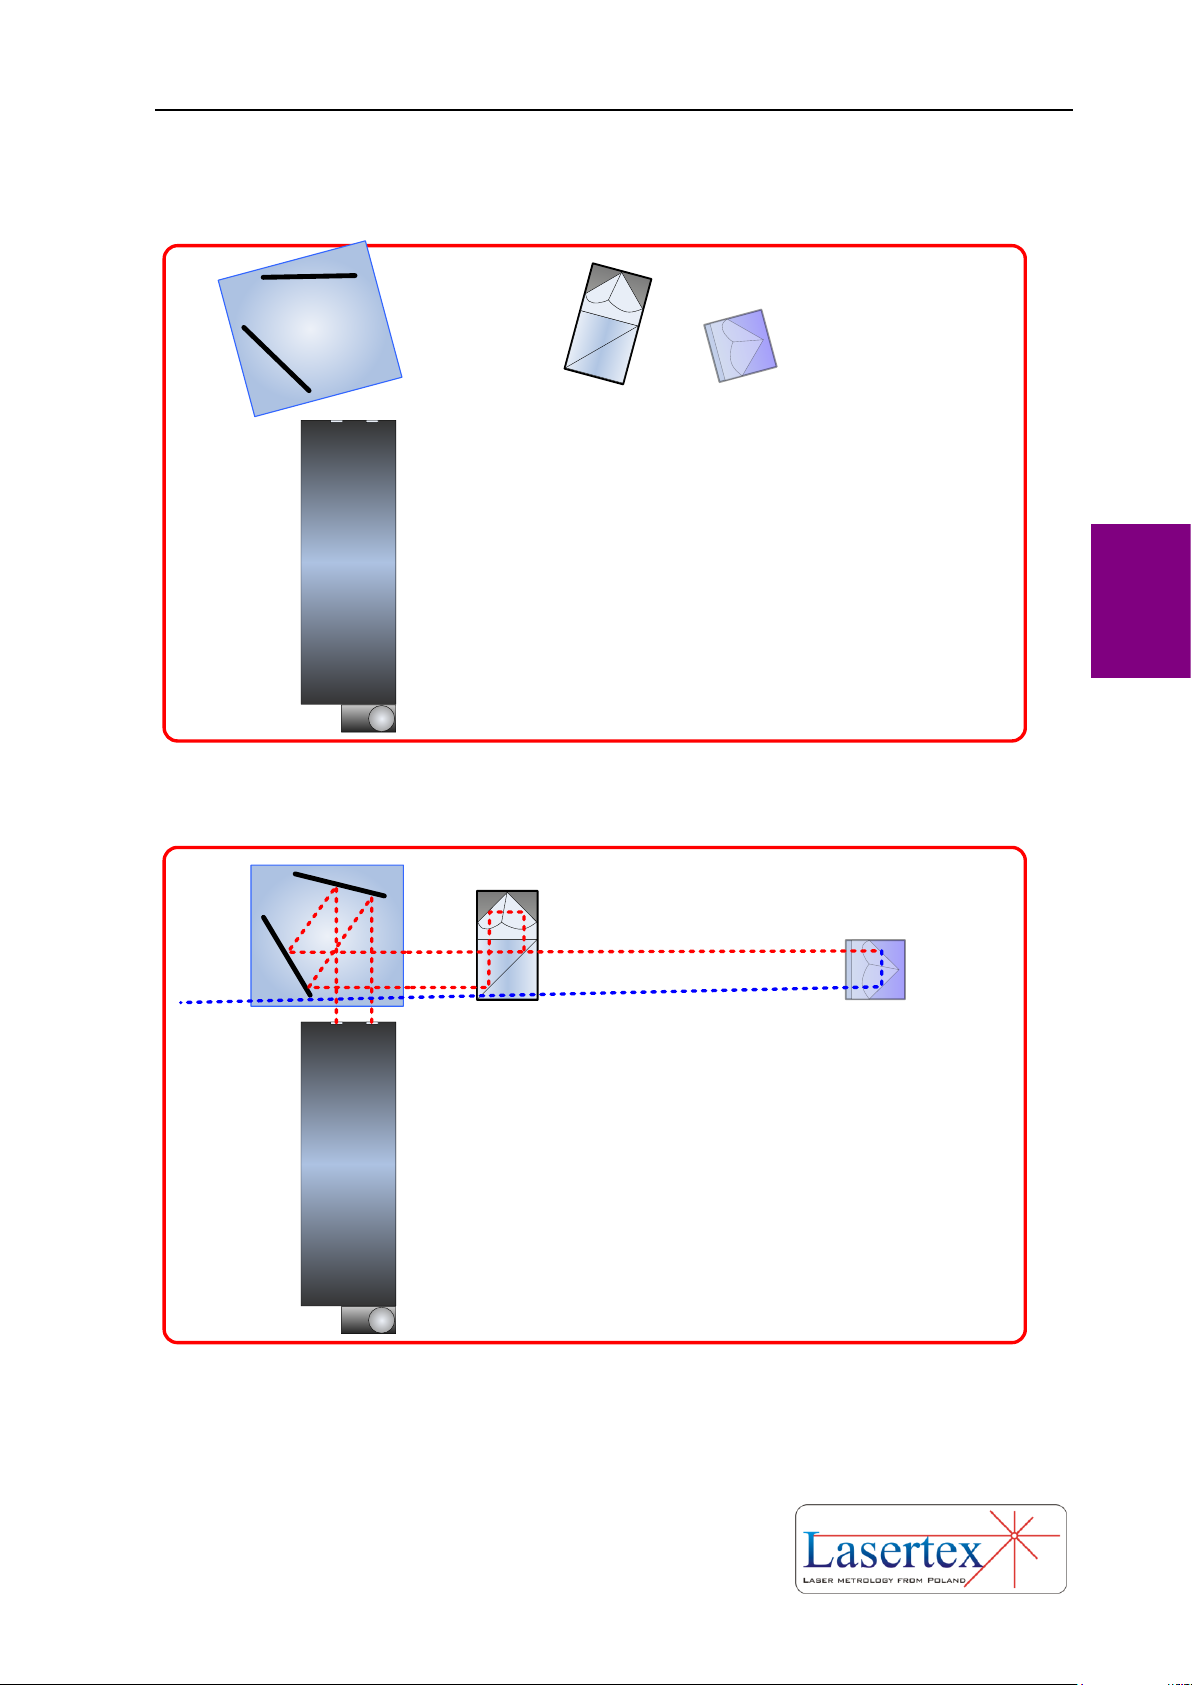
BEAM ALIGNMENT
4-14 www.lasertex.eu
4
h. Beam alignment of linear optics with angle etalon
LASER HEAD
1. Mount Laser Head, IL1, RL1 and RE3D on the measured machine
RE
3
D
LASER HEAD
RE3D
2. Turn on the laser and align all elements along the measurement axis
Page 63
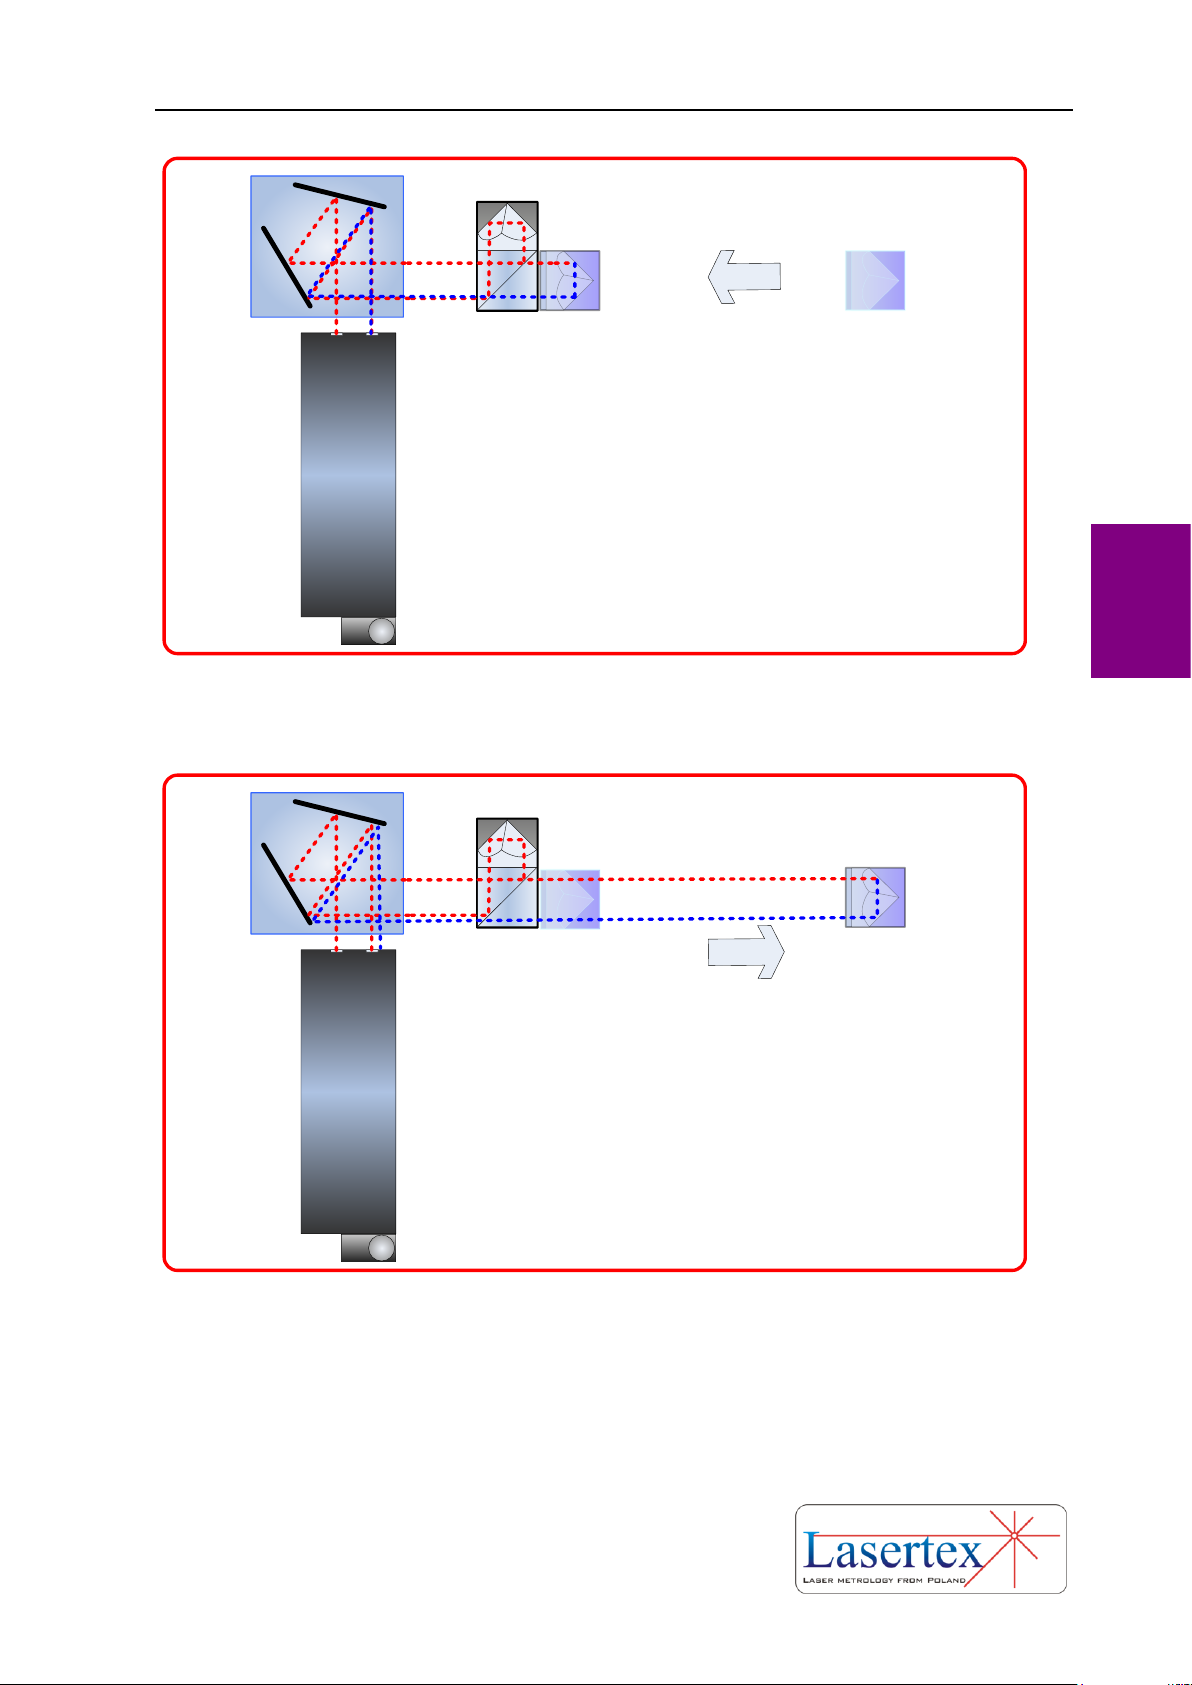
BEAM ALIGNMENT
4-15 www.lasertex.eu
4
LASER HEAD
RE3D
3. Move the RL1 very close to IL1 (they can touch each other). Set
their initial position so the beam returns back to the laser.
LASER HEAD
RE3D
4. Move RL1 from IL1
Page 64
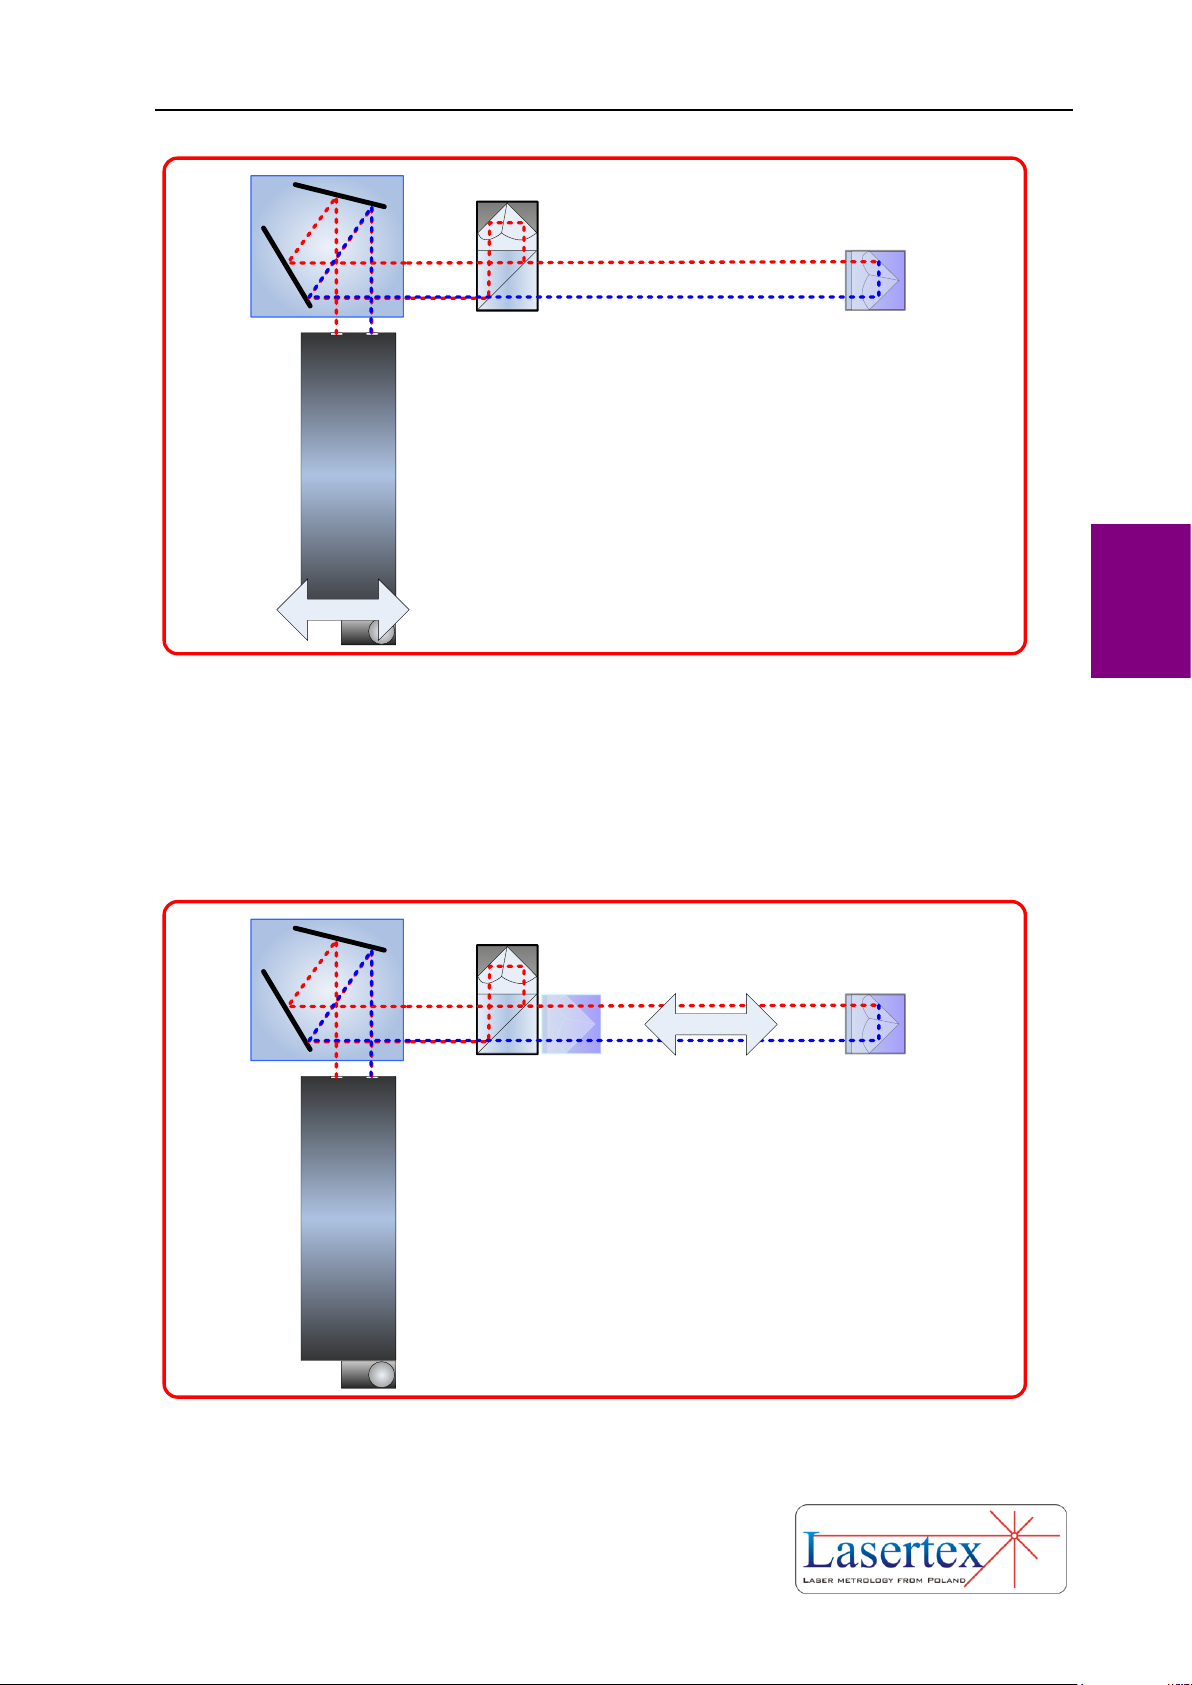
BEAM ALIGNMENT
4-16 www.lasertex.eu
4
LASER HEAD
RE3D
5. By regulation of the laser head position align the beam path so that both
beams overlap on the input of the laser.
REMARK 1: With angular regulation the position of the beam from RL1
should be regulated. Position of the beam returning from IL1 should be
regulated with mechanical components on the tripod.
REMARK 2: If the laser head is mounted directly on the machine then the
position of the beam returning from IL1 should be regulated by direct
movement of the IL1 component.
LASER HEAD
RE3D
6. Move the RK1 back to IK1 (the components must not touch!) and
check the quality of the beam path alignment. Use available electronic
tools – Beam Level Indicator and Electronic Beam Alignment Tool.
Page 65
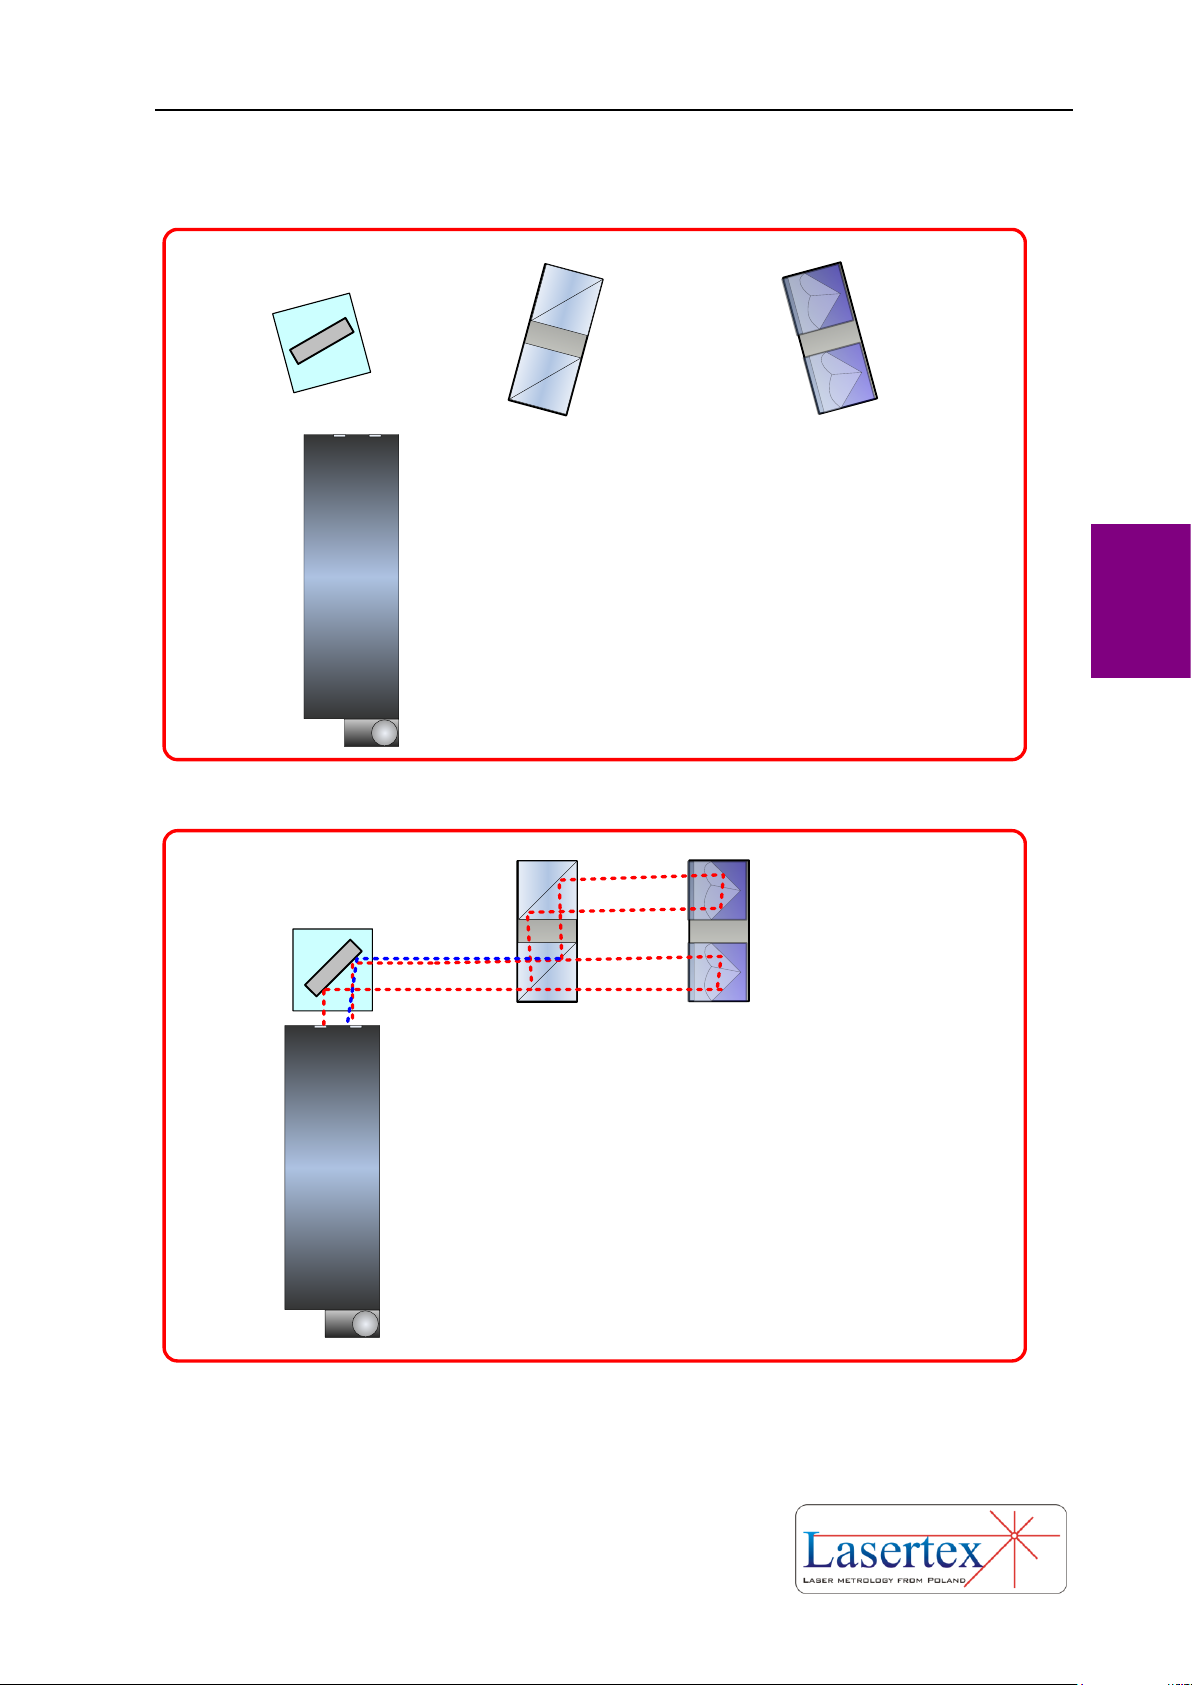
BEAM ALIGNMENT
4-17 www.lasertex.eu
4
i. Beam alignment of angular optics with beam bender
i. Laser Head initially not aligned
LASER HEAD
IK
1
RK
1
ZK1
1. Mount Laser Head, IK1, RK1 and ZK1 on the measured machine
ZK1
RK1
IK1
LASER HEAD
2. Turn on the laser and align all elements along the measurement axis
Page 66
BEAM ALIGNMENT
4-18 www.lasertex.eu
4
ZK1
LASER HEAD
RK1
IK1
RK1
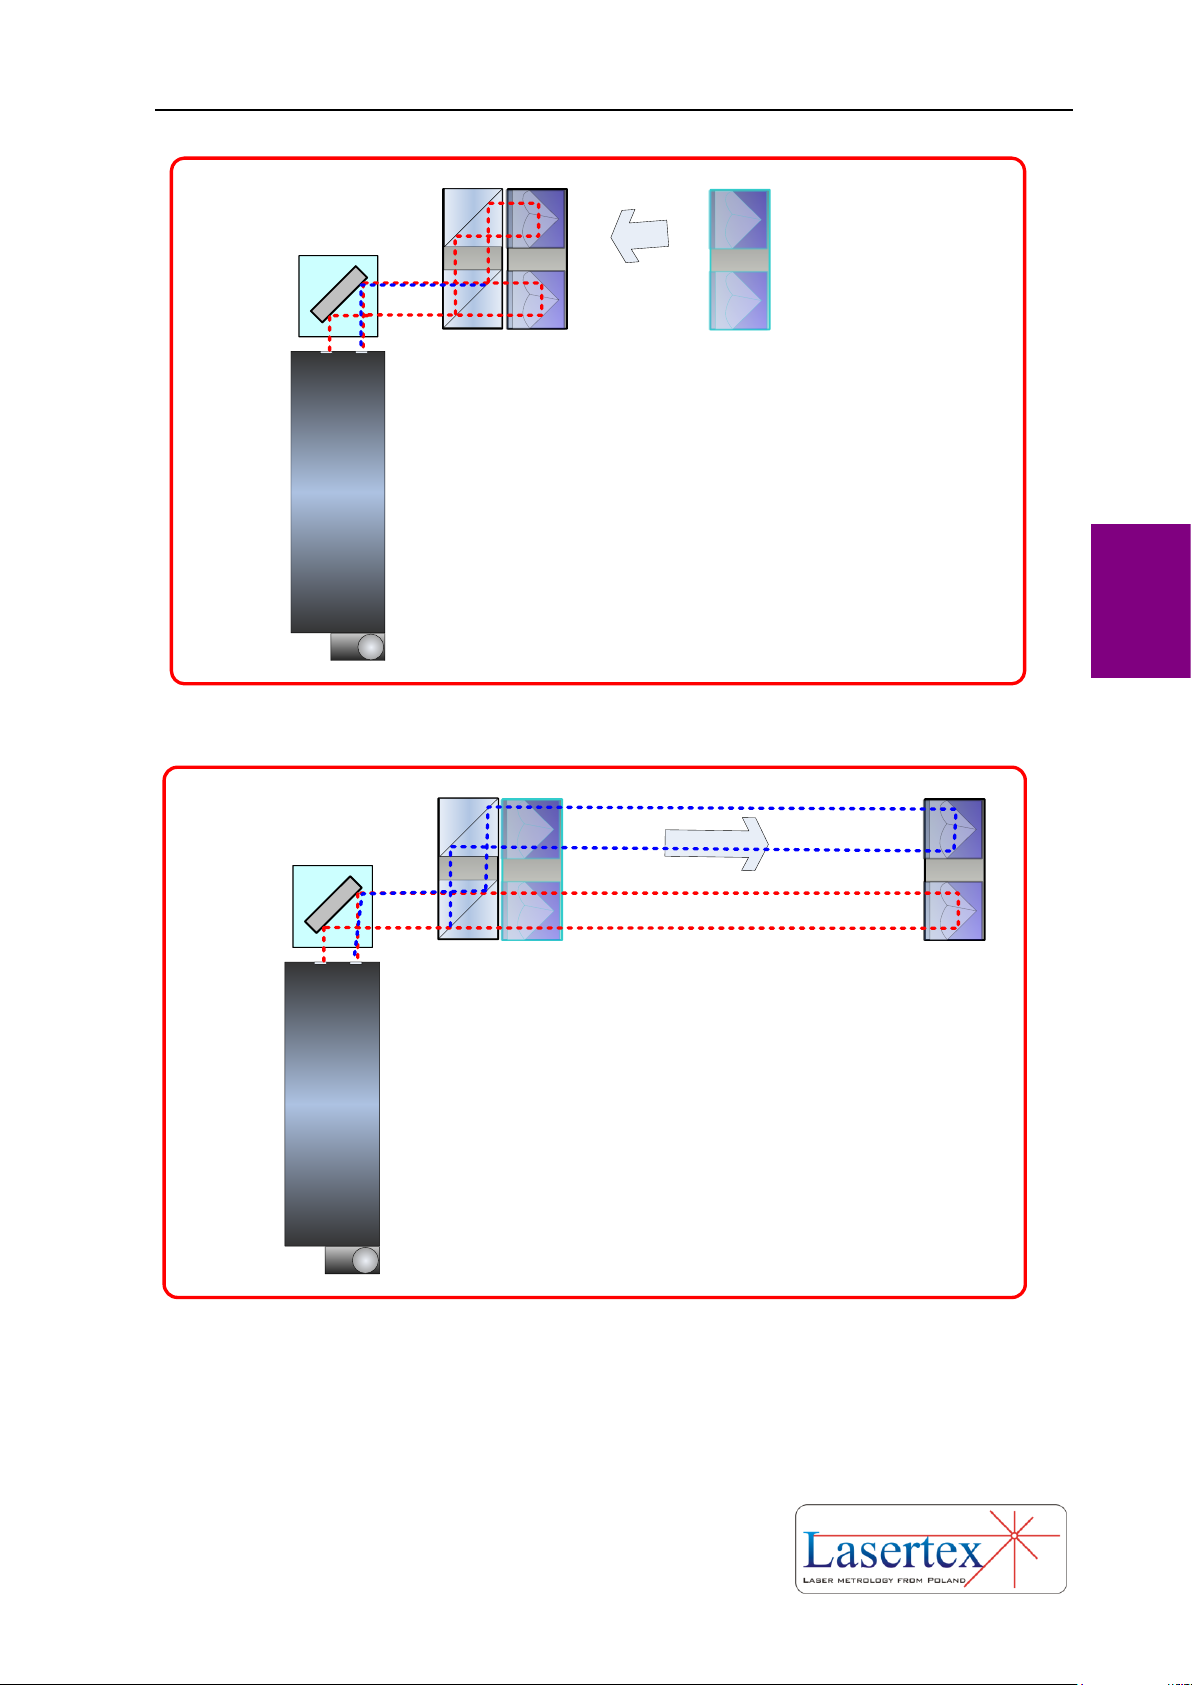
3. Move the RK1 very close to IK1 (they can touch each other). Set their
initial position and the position of ZK1 so the beam returns back to the laser.
ZK1
LASER HEAD
RK1
IK1
RK1
4. Move the RK1 from IK1.
Page 67
BEAM ALIGNMENT
4-19 www.lasertex.eu
4
ZK1
LASER HEAD
RK1
IK1
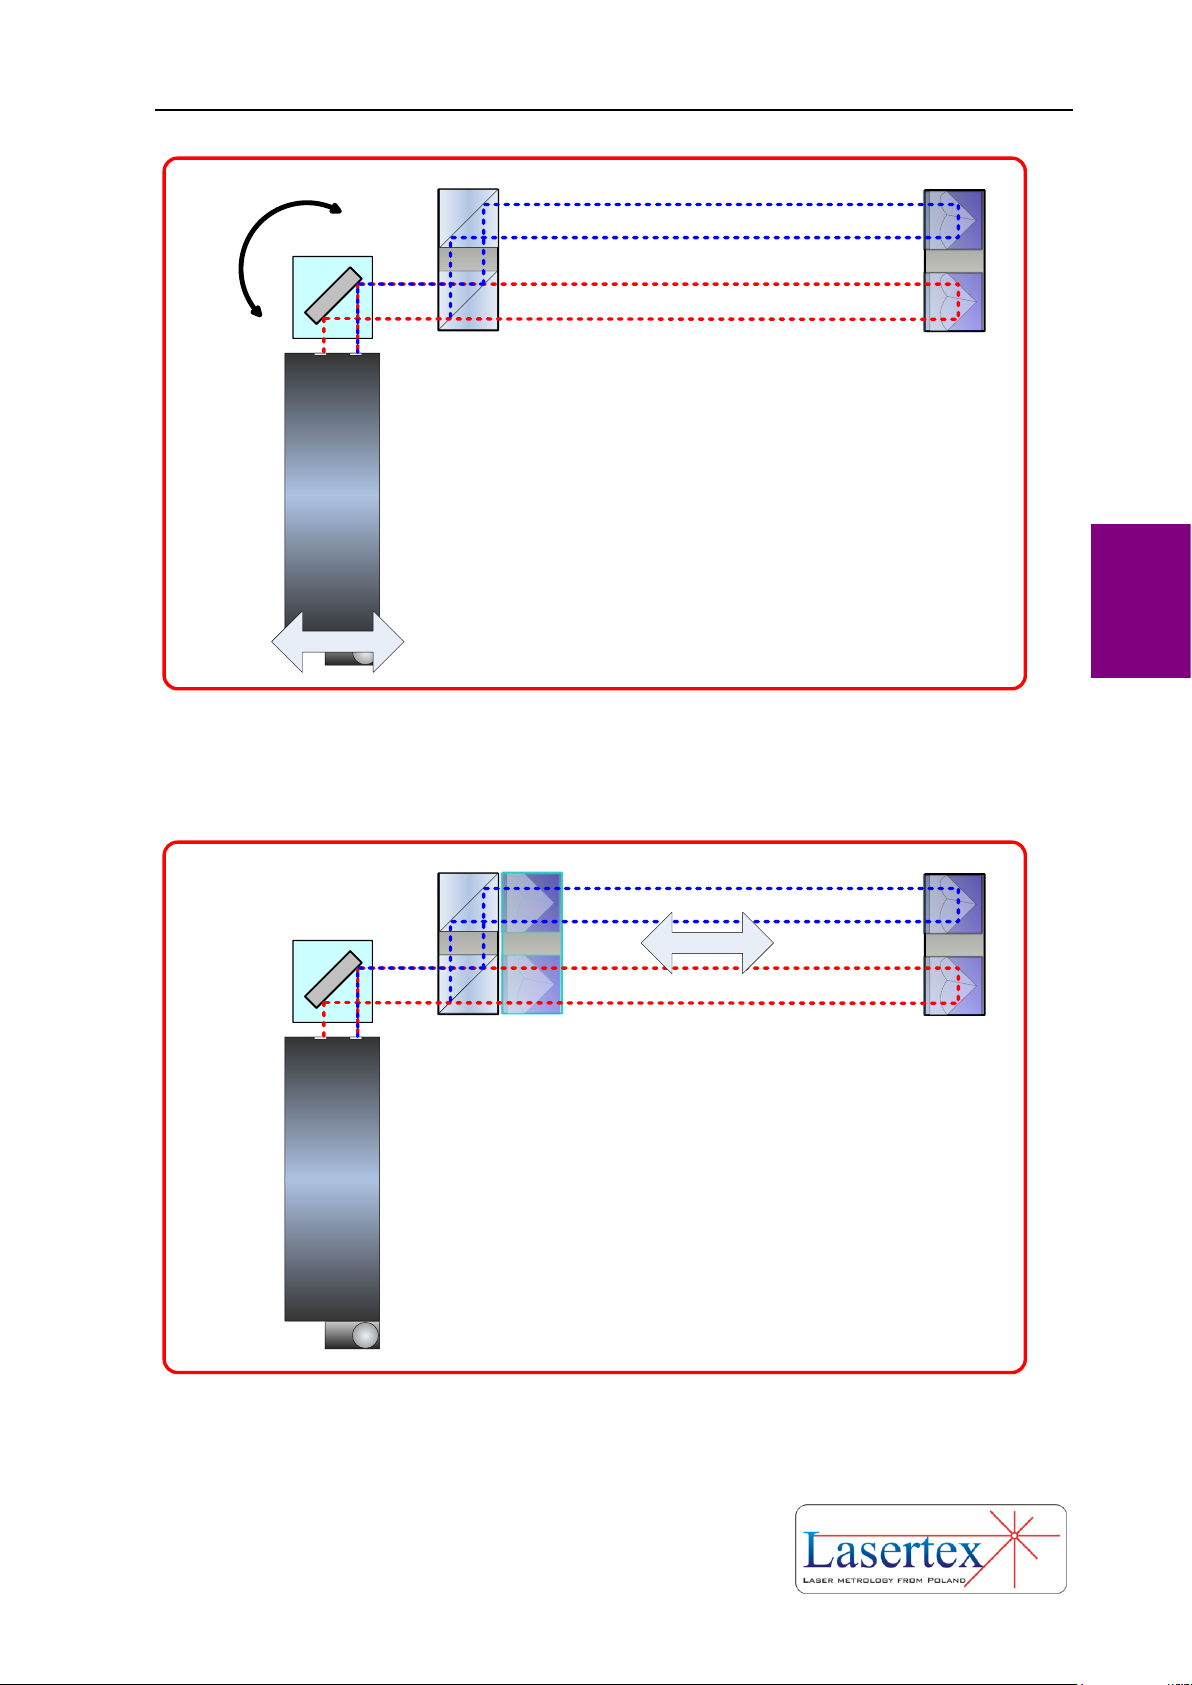
5. By regulation of the laser head position align the beam path so that both beams
overlap on the input of the laser. Instead of regulating the position of the laser head
it is possible to regulate the ZK1 – in many situations it would be faster!
REMARK: If the beams do not overlap then it means that the IK1 is rotated against
RK1. Check the roll of laser head against IK1 and RK1 – it should be zero!
RK1
ZK1
LASER HEAD
RK1
IK1
6. Move the RK1 back to IK1 (the components must not touch!) and
check the quality of the beam path alignment. Use available electronic
tools – Beam Level Indicator and Electronic Beam Alignment Tool.
Page 68
BEAM ALIGNMENT
4-20 www.lasertex.eu
4
ii. Laser Head initially aligned
ZK1
RK1
IK1
LASER HEAD
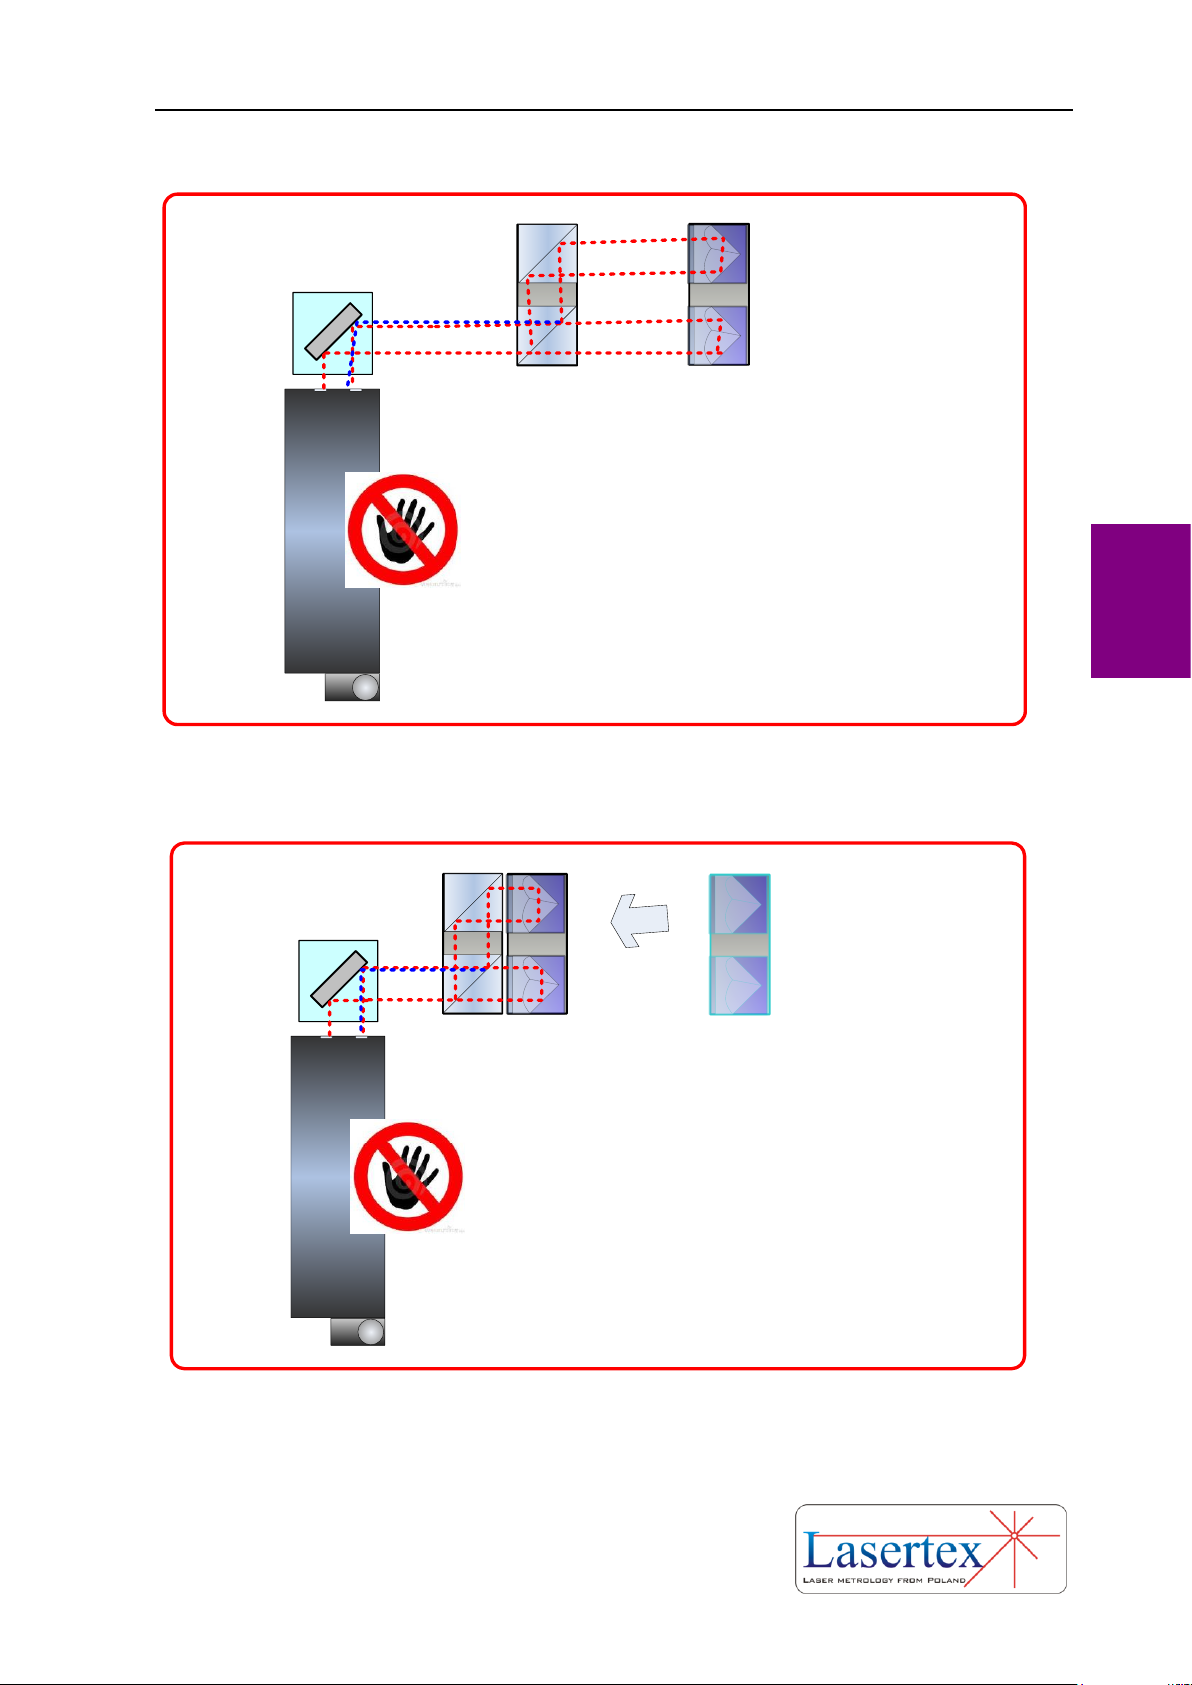
1. Align all elements (ZK1, IK1, RK1) along the new measurement axis.
DO NOT TOUCH the laser head
ZK1
LASER HEAD
RK1
IK1
RK1
2. Move the RK1 very close to IK1 (they can touch each other). Set their
initial position and the position of ZK1 so the beam returns back to the laser.
Page 69
BEAM ALIGNMENT
4-21 www.lasertex.eu
4
ZK1
LASER HEAD
RK1
IK1
RK1
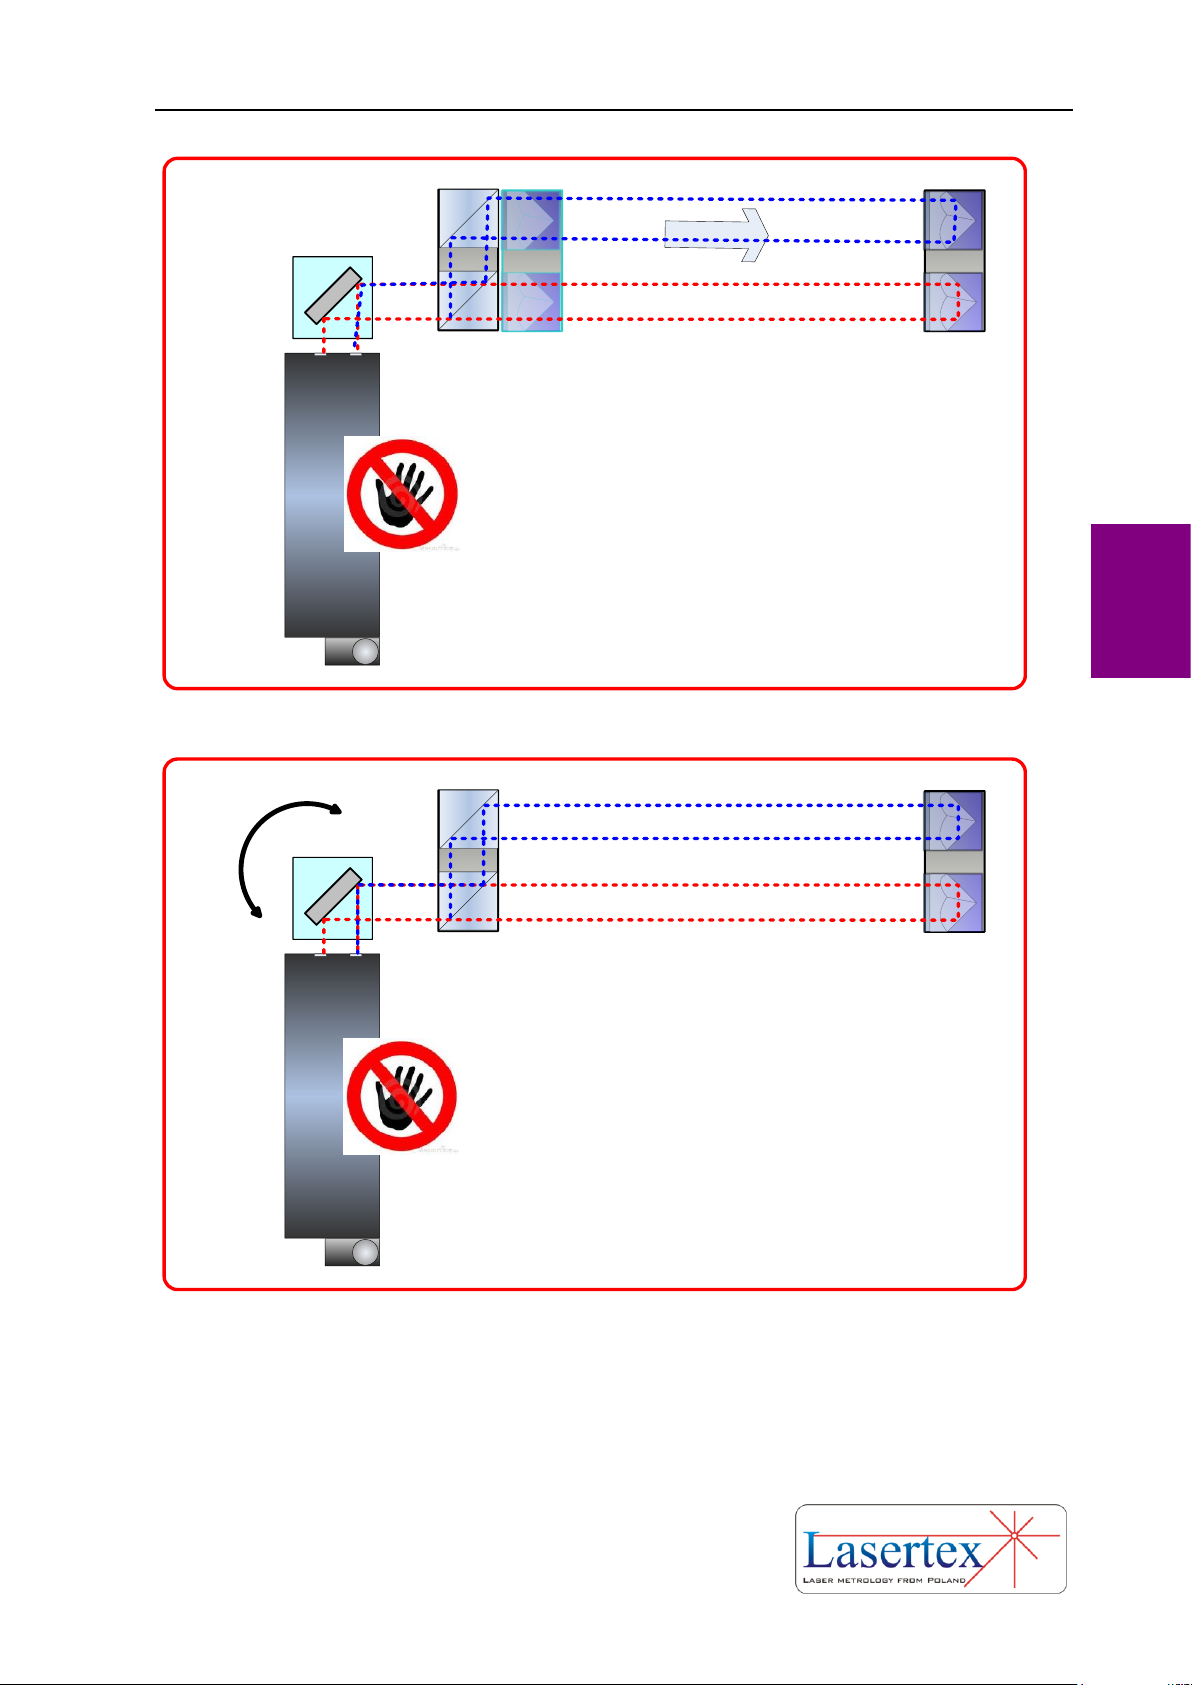
3. Move the RK1 from IK1.
ZK1
LASER HEAD
RK1
IK1
4. By regulation of the ZK1 position align the beam path so that both beam overlap
on the input of the laser. DO NOT TOUCH the laser head.
REMARK: If the beams do not overlap then it means that the IK1 is rotated against
RK1. Check the roll of laser head against IK1 and RK1 – it should be zero!
Page 70
BEAM ALIGNMENT
4-22 www.lasertex.eu
4
RK1
ZK1
LASER HEAD
RK1
IK1
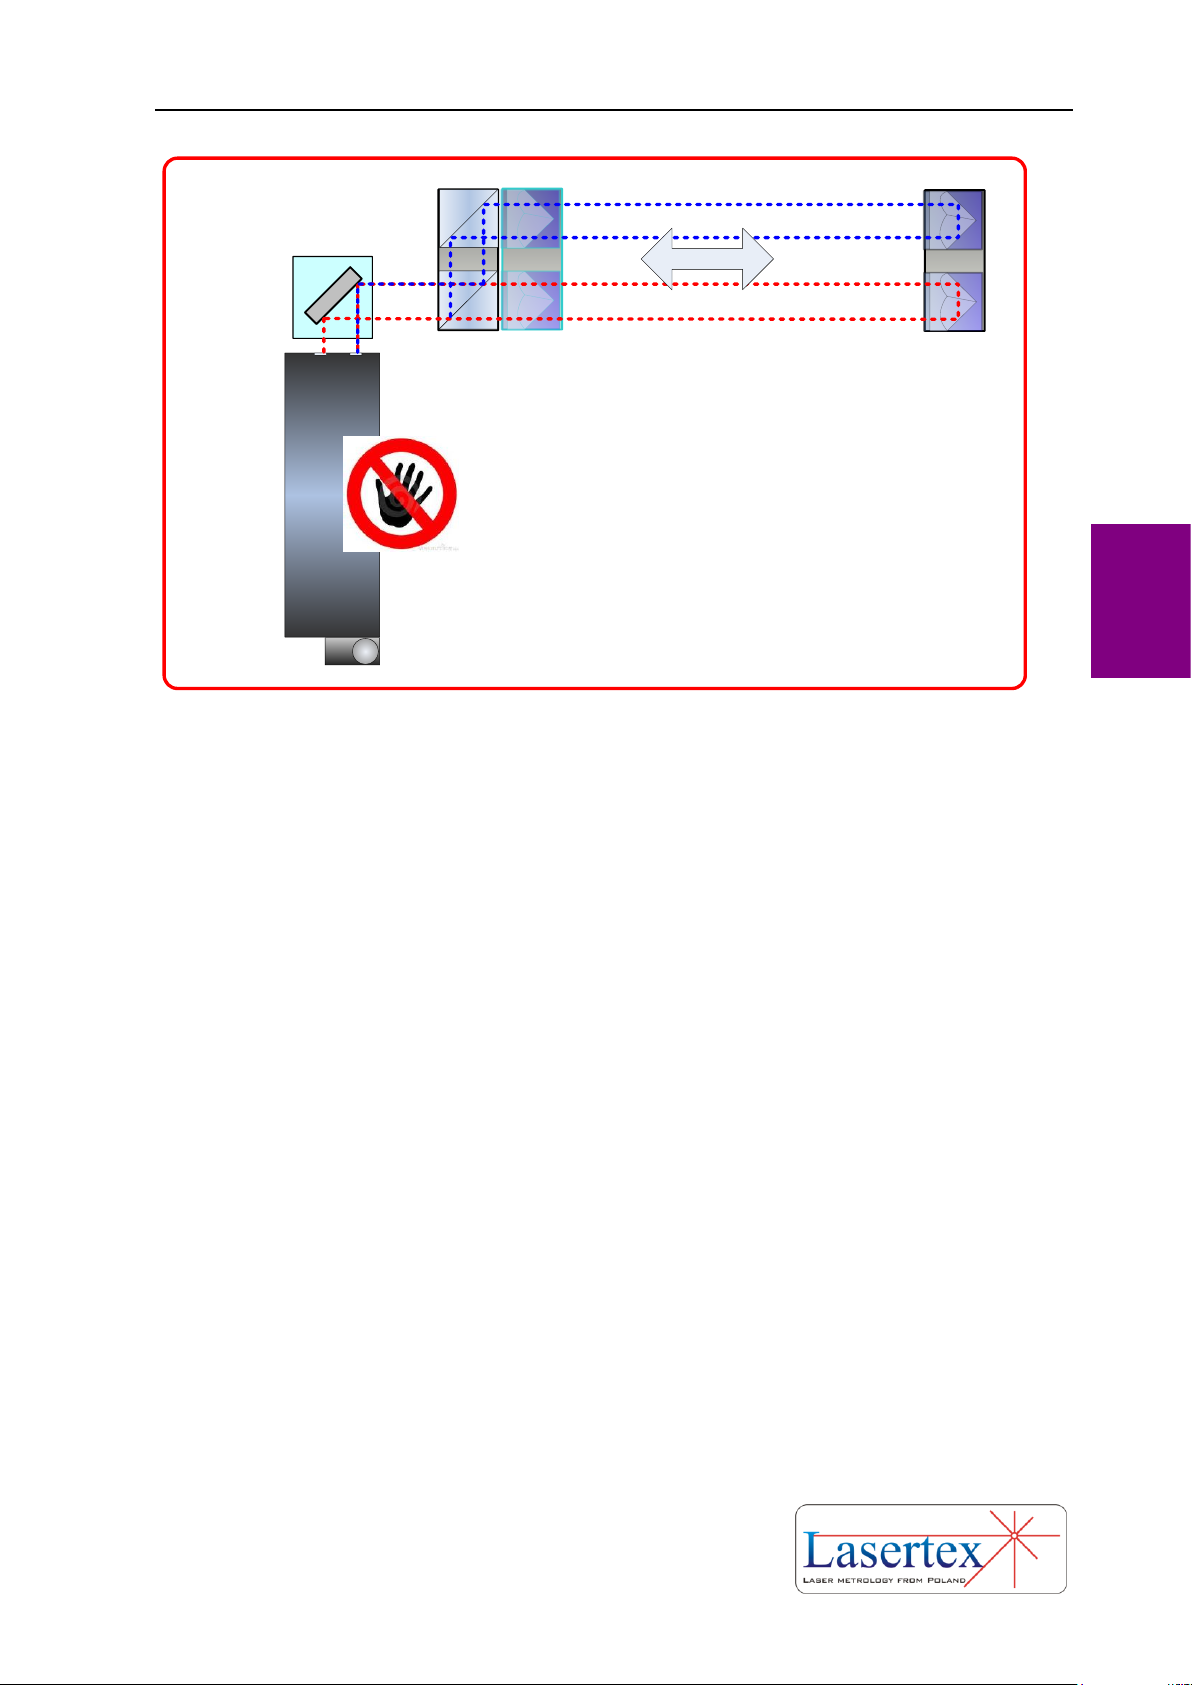
5. Move the RK1 back to IK1 (the components must not touch!) and
check the quality of the beam path alignment. Use available electronic
tools – Beam Level Indicator and Electronic Beam Alignment Tool.
Page 71

MEASUREMENTS - POSITIONING
5-1 www.lasertex.eu
5
5. MEASUREMENTS - POSITIONING
a. General Description
The linear positioning measurement is the most advanced option of linear
measurements. It is also the most common form of laser interferometer
measurements performed on machines. The laser system measures linear positioning
accuracy, repeatability and backlash by comparing the position to which the machine
moves (i.e. the position displayed on the machine’s readout) with the true position
measured by the interferometer.
The HPI-3D device offers a unique feature of simultaneous measurement of
positioning and estimation of straightness in horizontal and vertical planes. This 3D
feature simplifies and significantly speeds up the process of machine geometry
testing and improves measurement accuracy thanks to elimination of the cosine error.
i. Positioning in brief
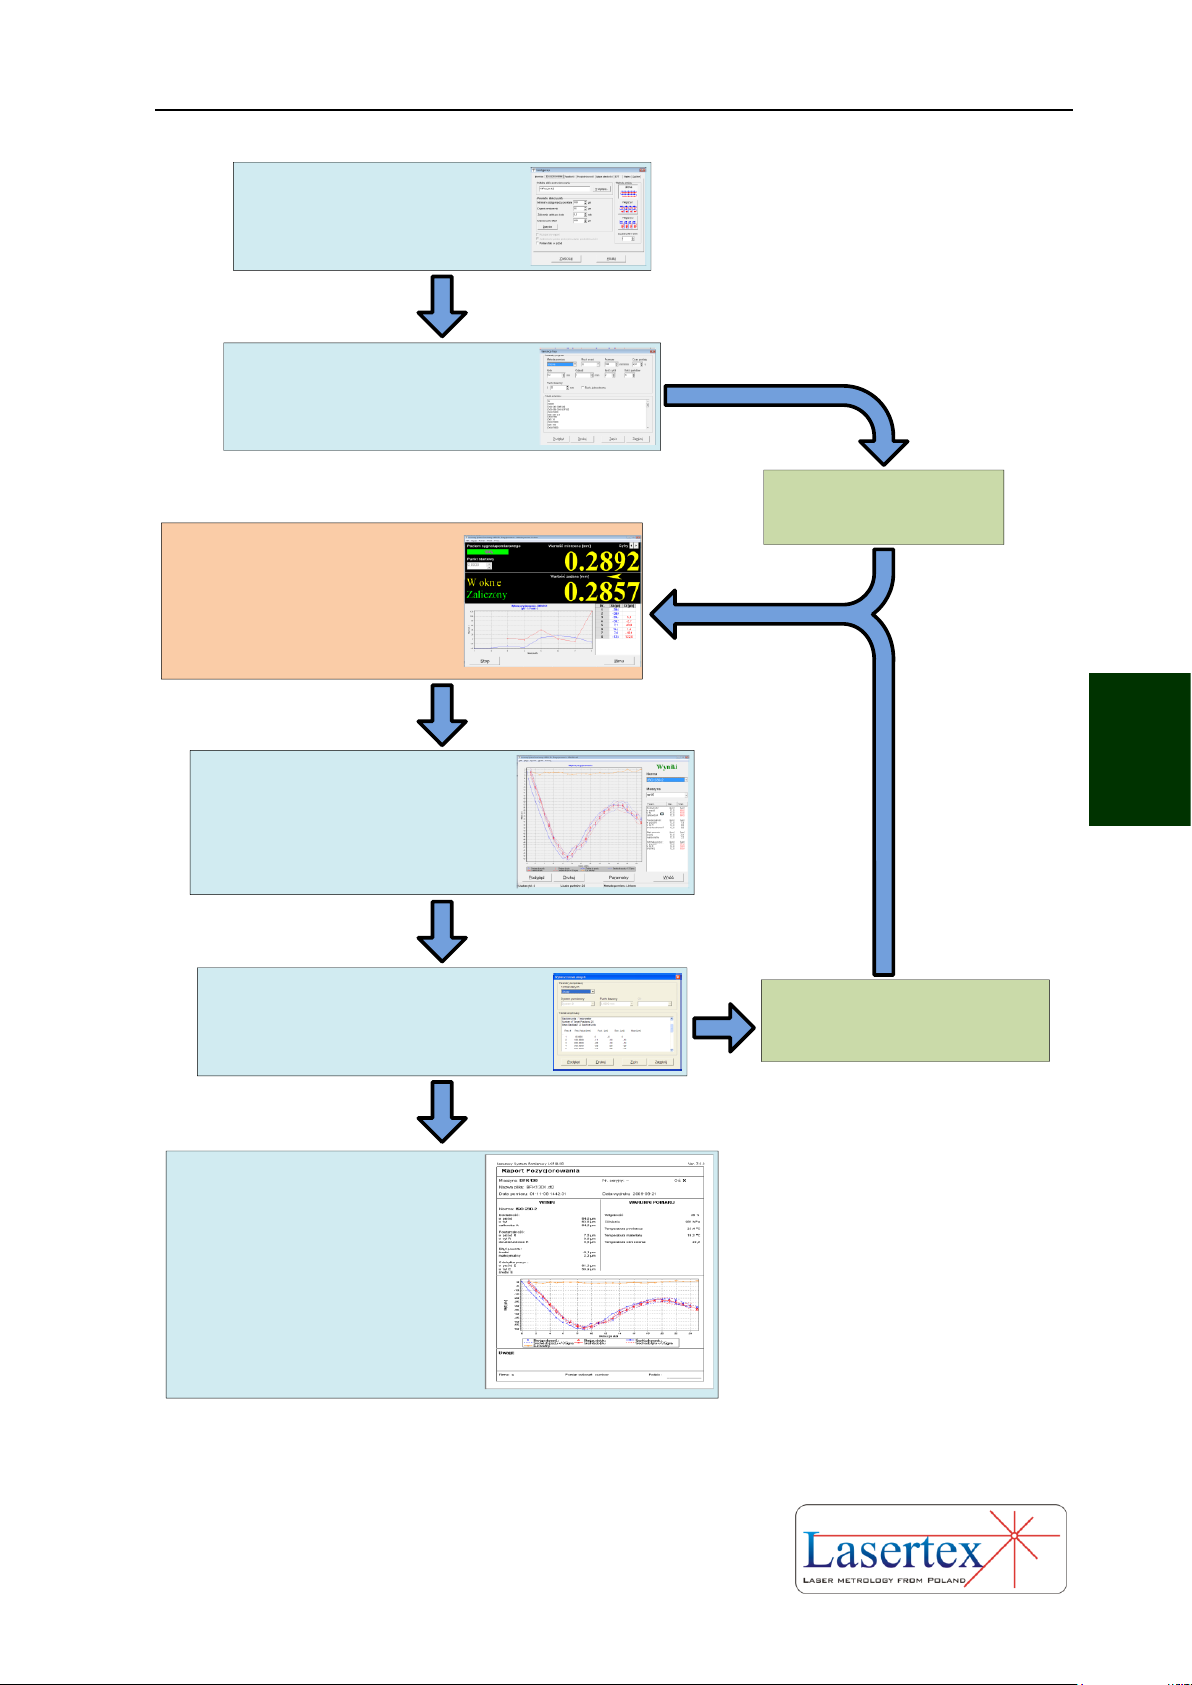
In the Figure 5.1 there is shown the block diagram of the linear positioning
error correction algorithm. Following the presented algorithm it is easy to correct any
numerically controlled machine.
In the first step there can be chosen some measurements options. In most cases
this step can be omitted. Next in the software there should be generated the program
for machine movement (G Codes). The generated program drives the machine in
compliance with the ISO230-2 standard.
After starting the uploaded program on the tested machine the measurements
can also be started in the HPI Software. No user attendance is necessary during
measurement process.
Page 72

MEASUREMENTS - POSITIONING
5-2 www.lasertex.eu
5
After the measurement finishes there can be generated a special file for
compensation of the machine control. After uploading the file, the machine
positioning should be measured again to obtain the end results. The end results can
be stored or printed.
All measurement steps are described in much greater detail inside the Chapter.
Page 73
MEASUREMENTS - POSITIONING
5-3 www.lasertex.eu
5
Performing linear positioning
measurement by starting machine
and pressing START in HPI
Software (no user attendance
during measurements necessary!)
Printing error report according to
a chosen standard
(NMTBA, ISO, VDI/DGQ, BSI, PN, JIS)
Error compensation table generation
in a format best suited the corrected
machine
(linear, incremental, Siemes, HP, Fanuc)
Loading G-Code program into
machine
Downloading corrections into
machine (if necessary)
Positioning method choice:
- linear
- pendulum
- pilgrim standard
- pilgrim effective
G-Codes program generation for CMM
or CNC machines in LSP30-3D software
Error report generation according to a
chosen standard
(NMTBA, ISO, VDI/DGQ, BSI, PN, JIS)
FIG.5.1 LINEAR POSITION ERROR CORRECTION PROCEDURE
Page 74
MEASUREMENTS - POSITIONING
5-4 www.lasertex.eu
5
b. Measurement Setup
i. Principles
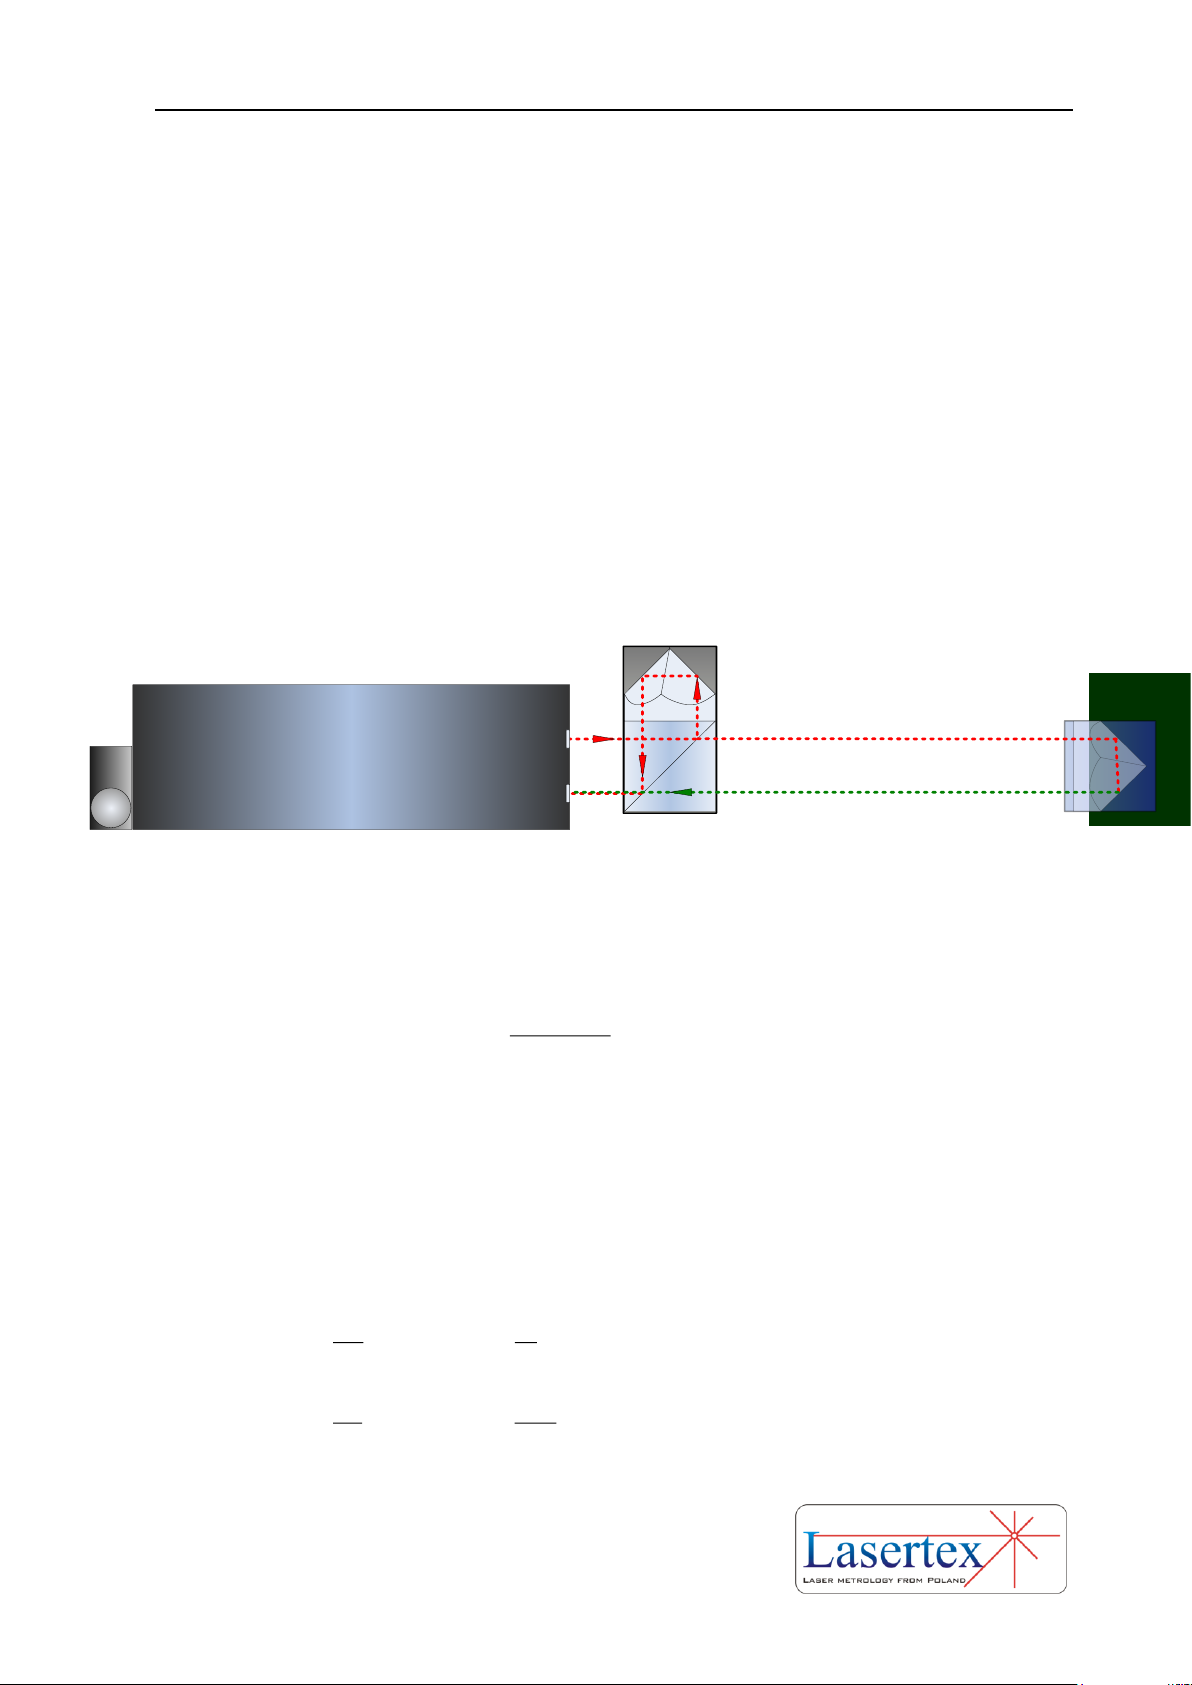
The Positioning measurement is the very basic measurement performed with
the linear optical components: linear retroreflector RL1 and the linear interferometer
IL1. Any change in the distance between IL1 and RL1 is detected by the laser head
and shown in the HPI Software.
As it is illustrated in the Figure 5.2 both elements are normally aligned along
the laser beam. Although IL1 is usually treated as a reference element with the
movement of the RL1 measured but the configuration can also be reverse, i.e. RL1 can
be stationary with IL1 being translated.
LASER HEAD
IL1 RL1
FIG.5.2 OPTICAL PATH SET UP FOR POSITIONING MEASUREMENTS- SCHEMATIC
The distance L measured in the linear configuration depends significantly on
the actual wavelength
l
air
of the laser beam with the formula
),,(
**
HPTn
NNL
vac
air
l
l
(5.1)
,where N denotes the number of interference fringes,
l
vac
is the laser
wavelength measured in vacuum and n(T,P,H) is the refraction coefficient of the air.
The wavelength changes with the fluctuations of the parameters of the air:
humidity, pressure and humidity. From the experimental formulas (see Chapter 17) it
may be obtained the refraction coefficient dependences on T, P and H in usual
conditions (T=293K, P=1000hPa, H=50%):
KT
n 1
10*93,0
6
hPaP
n 1
10*27,0
6
Page 75

MEASUREMENTS - POSITIONING
5-5 www.lasertex.eu
5
%
1
10*96,0
8
H
n
The changes of the wavelength are compensated automatically by the HPI-3D
laser head only if the TH sensor is used properly, i.e. placed near the laser beam path.
The air pressure is measured inside the laser head.
ii. Principles – base temperature compensation
One of the important factors limiting the precision of every machine is the
temperature. In the Figure {2} there is schematically shown a milling machine. On the
machine there is a work table with a workpiece. There is also schematically shown
the measurement subsystem of the machine, i.e. the Scale. The position encoder
(marked as Scale) is the part that is connected to the CNC control. It can be of
different construction – magnetic, glass, laser, etc. Its expansion is corrected with
positive sign in order to force the CNC control to leave the table in the same position
despite the thermal expansion of the scale.
Page 76
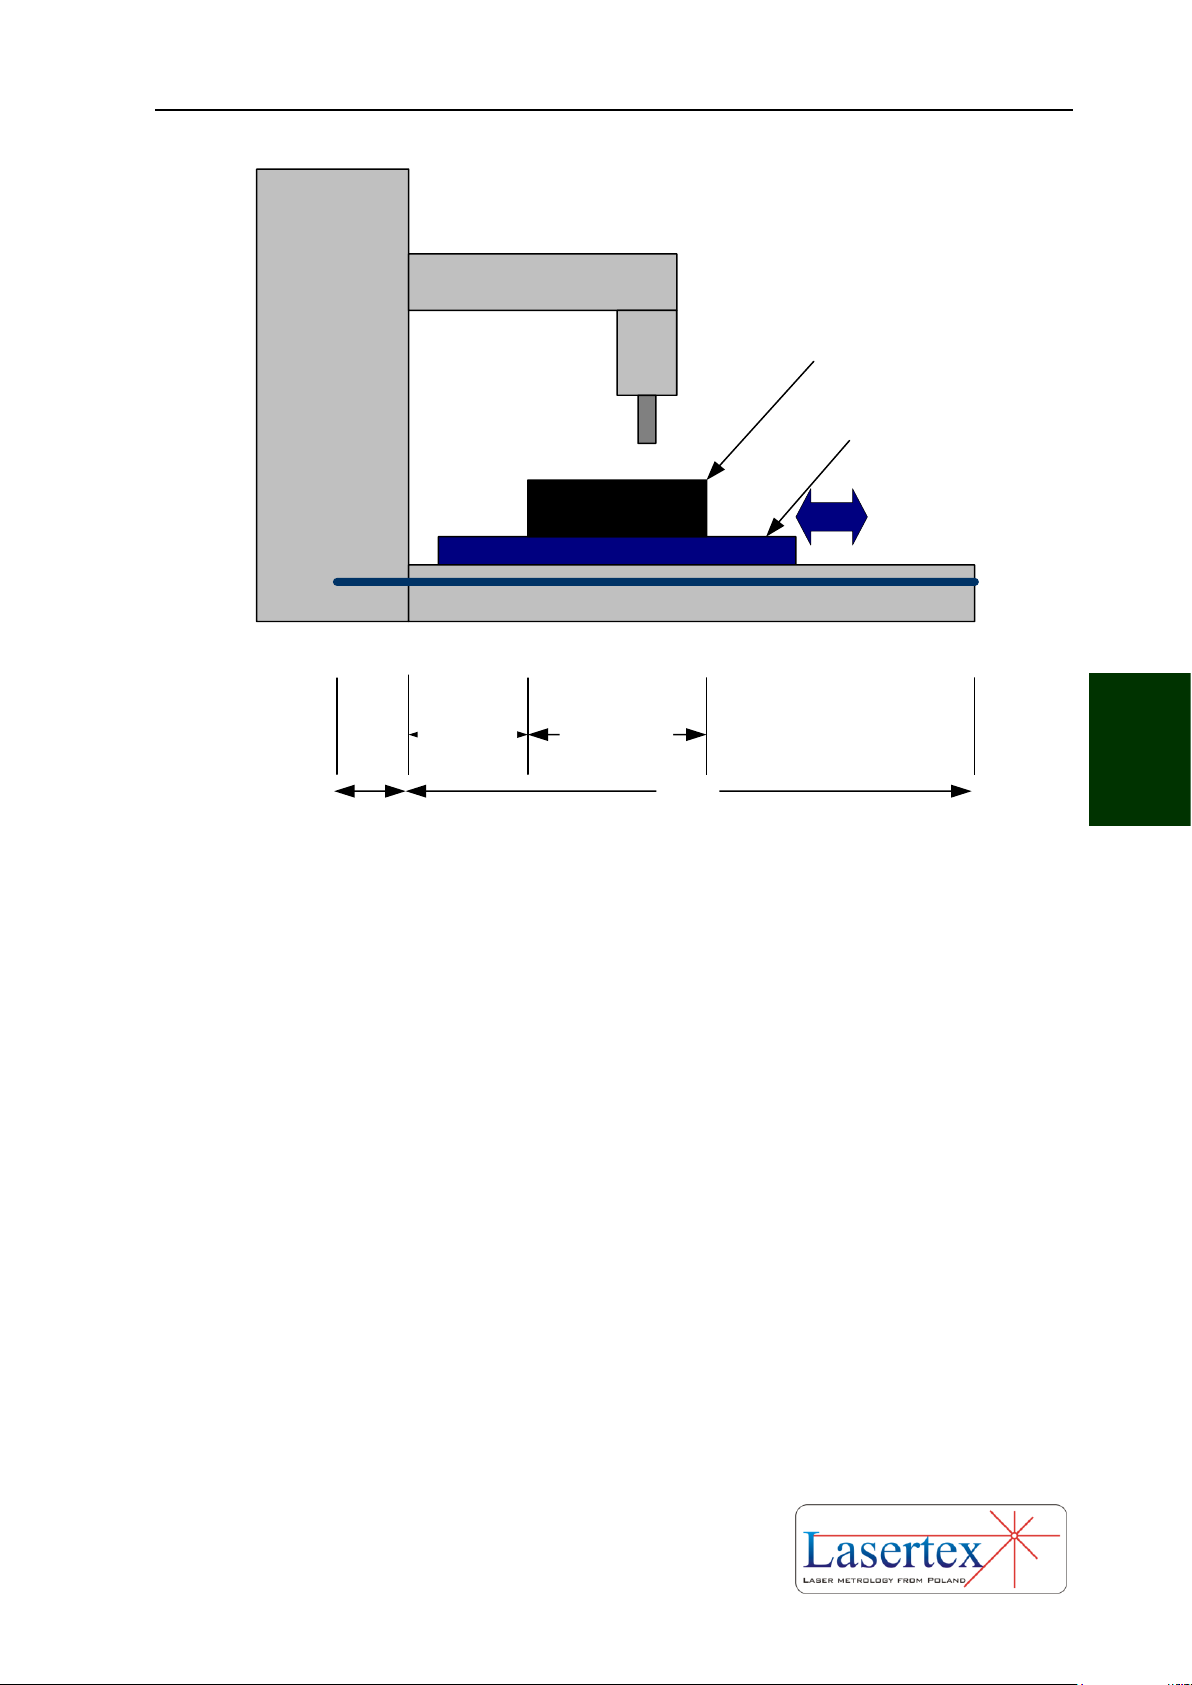
MEASUREMENTS - POSITIONING
5-6 www.lasertex.eu
5
Scale
0
Scale deadpath
workpiece
Workpie.
offset
Table
Workpiece
FIG.5.3 BASE EXPANDABILITY COMPENSATION - NOTATION
The important parameters in the Scale length compensation are:
- scale thermal expandability factor in [ppm] or [m/(m*K)] units; for glass
scales it can have very low value
- scale deadpath – the length of the non-used scale part or the distance
between the beginning of the scale and the Zero mark.
The HPI-3D is capable of automatic compensation of the thermal
expandability of the Scale. The user has only to properly use Base Temperature
sensors (i.e. place them as close to the machine measurement system as possible) and
to set the thermal expandability value of the Scale.
iii. Measurement Setup Preparations
For positioning measurements linear optics should be used. Necessary
components are (see also figures 5.2 to 5.5):
Page 77

MEASUREMENTS - POSITIONING
5-7 www.lasertex.eu
5
Laser Head
Power Supply
Linear interferometer IL1
Linear retro-reflector RL1
Air temperature sensor TH (Important!!!)
At least one Base temperature sensor (T1, T2 or T3) (Important!!!)
Optional elements are:
USB cable
Manual Strobe
Magnetic holder UM2
Tripod stand
Positioning measurements require optical elements IL1 and RL1 to be aligned
along laser beam as shown in the figure 5.2. Each of the elements can be moved.
During positioning measurements the Abbe, Dead Path and Cosine errors (for
details – see the Chapter 17) have to be taken into consideration. The usage of the air
temperature sensor and at least one base temperature sensor (T1 or T2 or T3) is
absolutely necessary! More than one base temperature sensor should be used on
long measurement axes, especially where a temperature gradient is possible.
Page 78
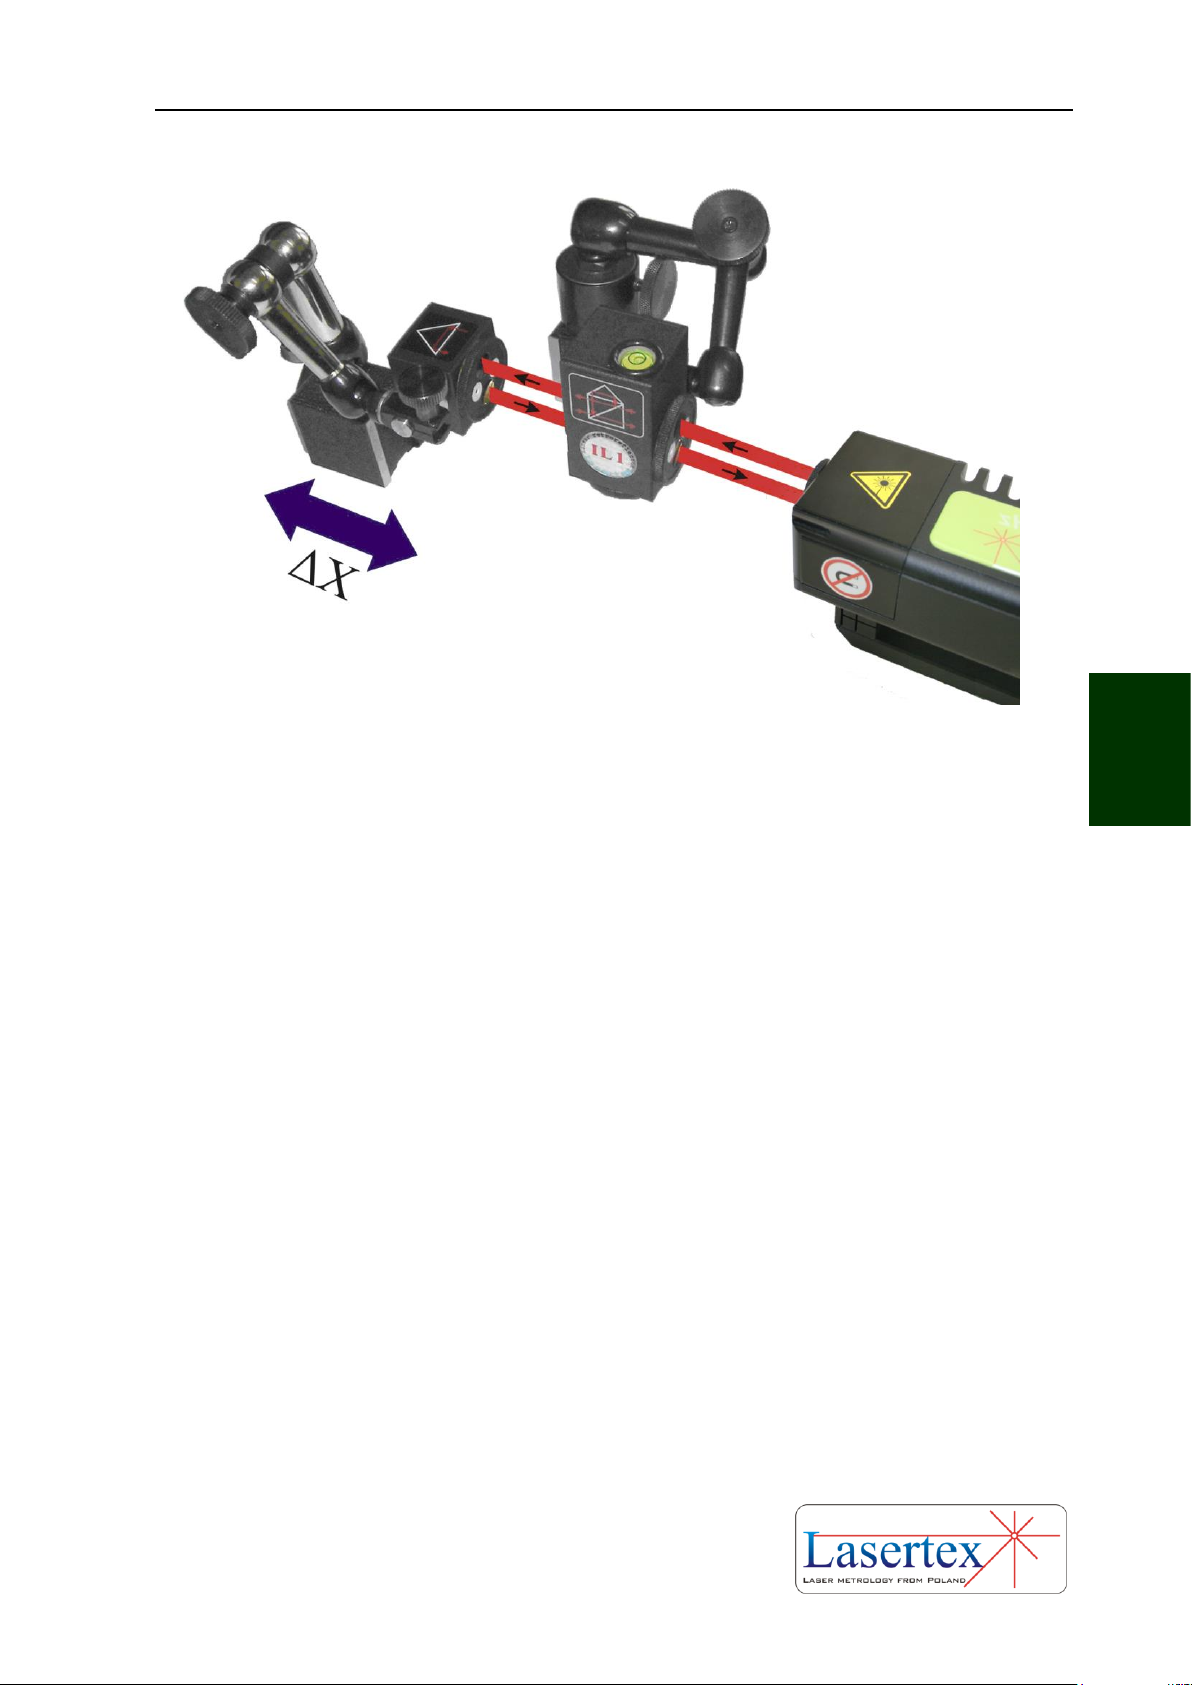
MEASUREMENTS - POSITIONING
5-8 www.lasertex.eu
5
FIG.5.3 OPTICAL PATH SET UP FOR POSITIONING MEASUREMENTS IN X AXIS
If only one base temperature sensor is used then all unused sensors should be
switched off in the HPI Software. Otherwise the base temperature value would be
false and the measurement would yield improper results. Switch singular sensors can
be performed in the Display menu by clicking the value fields of the T1, T2 or T3
sensors in the WiMeteo panel.
Positioning measurements can be performed not only along the laser beam (as
shown in figures 5.2 and 5.3) but also in directions perpendicular to the laser beam.
These configurations are shown in figures 5.4 and 5.5. In those two configurations the
laser beam has to enter the IL1 from the bottom of the element. Only the retro-
reflector RL1 can be moved.
Page 79
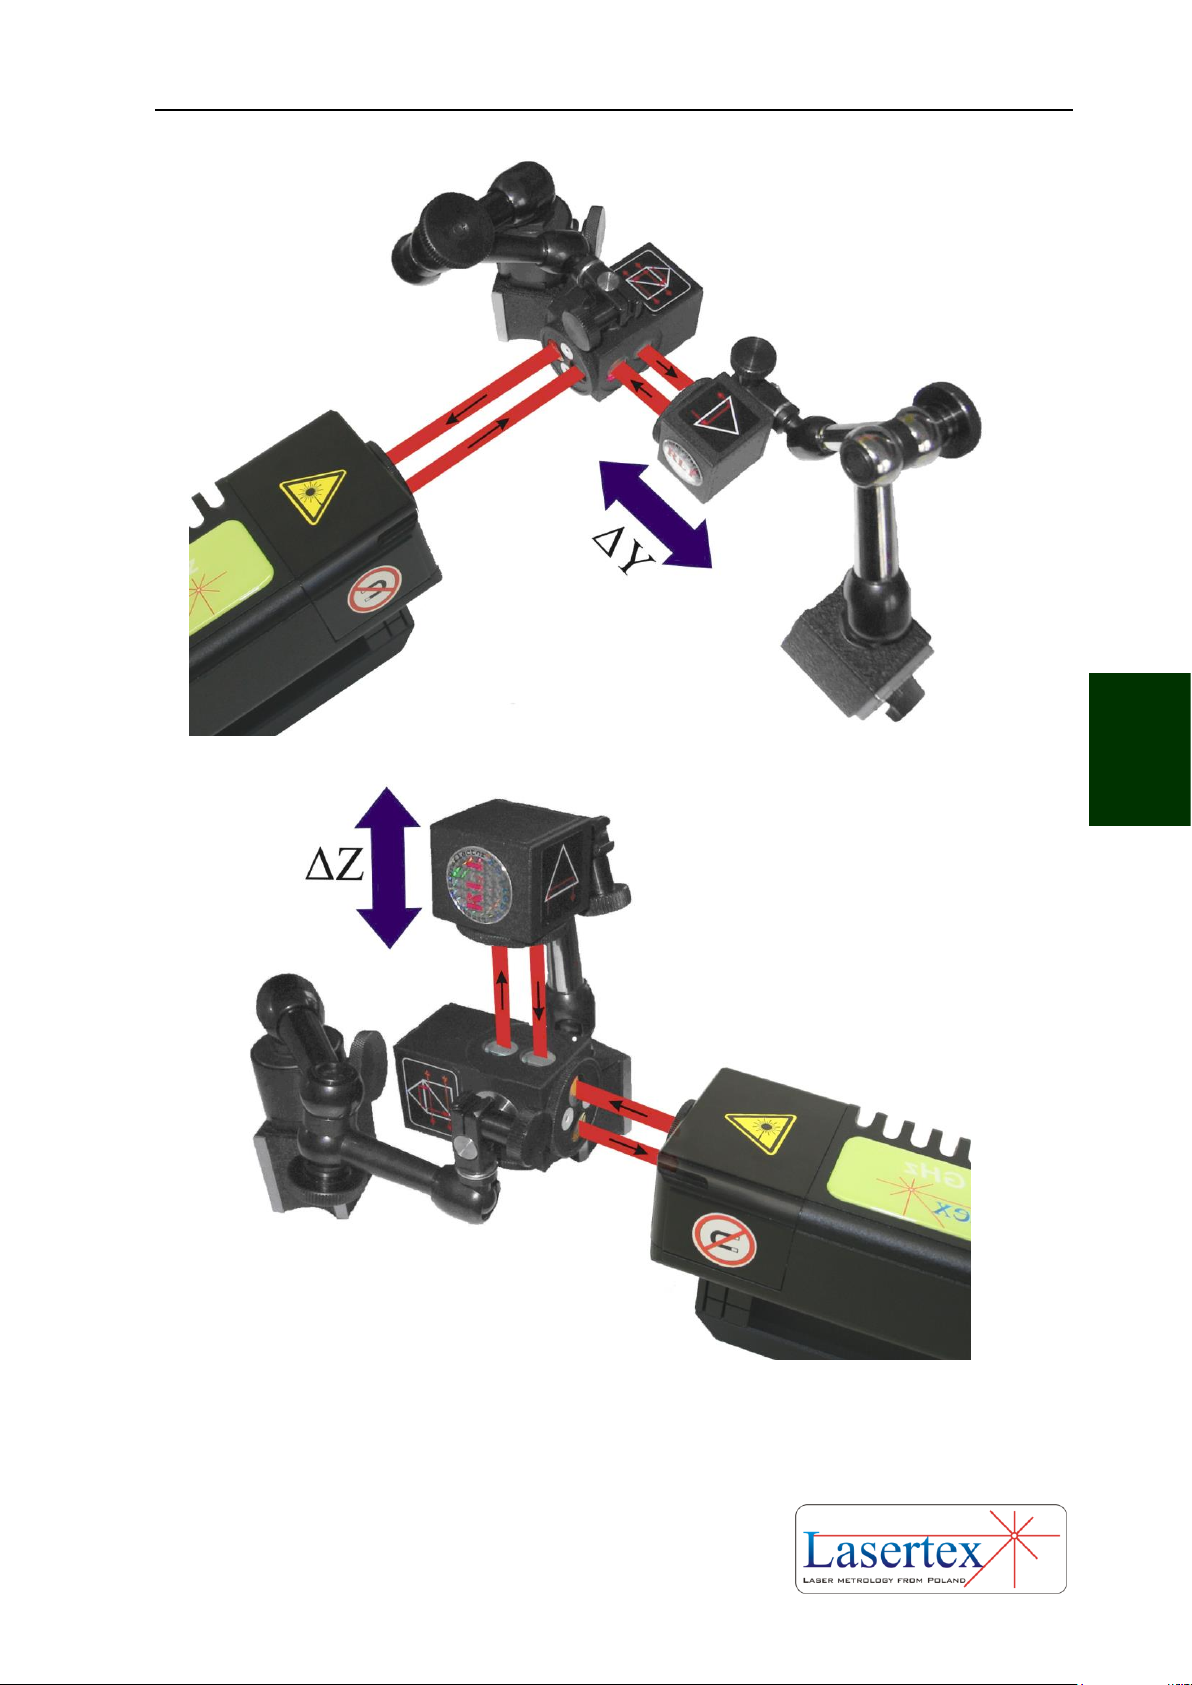
MEASUREMENTS - POSITIONING
5-9 www.lasertex.eu
5
FIG.5.4. OPTICAL PATH SET UP FOR POSITIONING MEASUREMENTS IN Y AXIS
FIG.5.5. OPTICAL PATH SET UP FOR POSITIONING MEASUREMENTS IN Z AXIS
Page 80
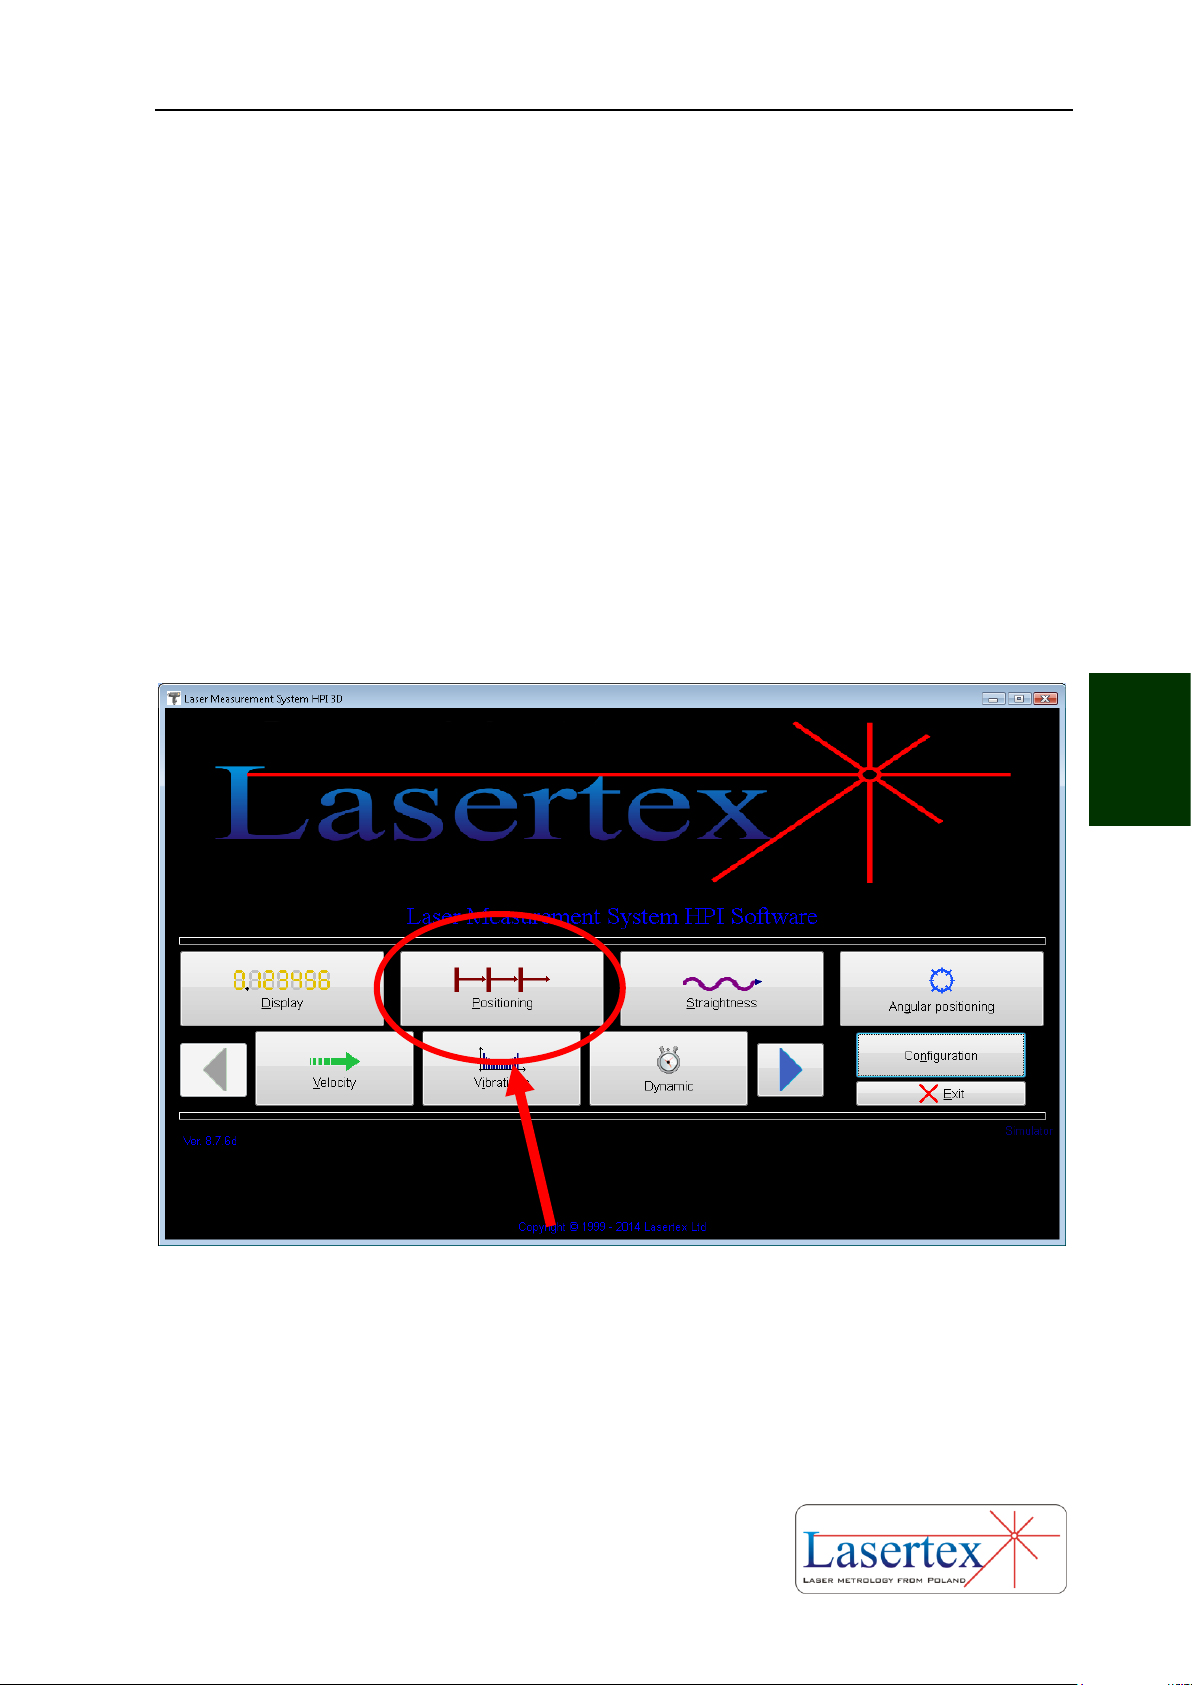
MEASUREMENTS - POSITIONING
5-10 www.lasertex.eu
5
c. Software description
i. Introduction
In order to start Positioning measurements in the Main Menu the Positioning
button should be pressed (Figure 5.6). On the screen there should appear a Linear
positioning window as shown in the Fig. 5.7. The window consists of a pull-down
menu and four panels:
1) Display panel – presents information about current distance, target
distance and measurement signal level;
2) Positioning plot panel;
3) Positioning results panel
4) Panel with control buttons and status information.
FIG.5.6 MAIN MENU
ii. Display Panel
The top part of the Display Panel (block 1 of figure 5.7) is used for basic control
of the laser operation. Through this panel it is possible to monitor the quality of the
Page 81
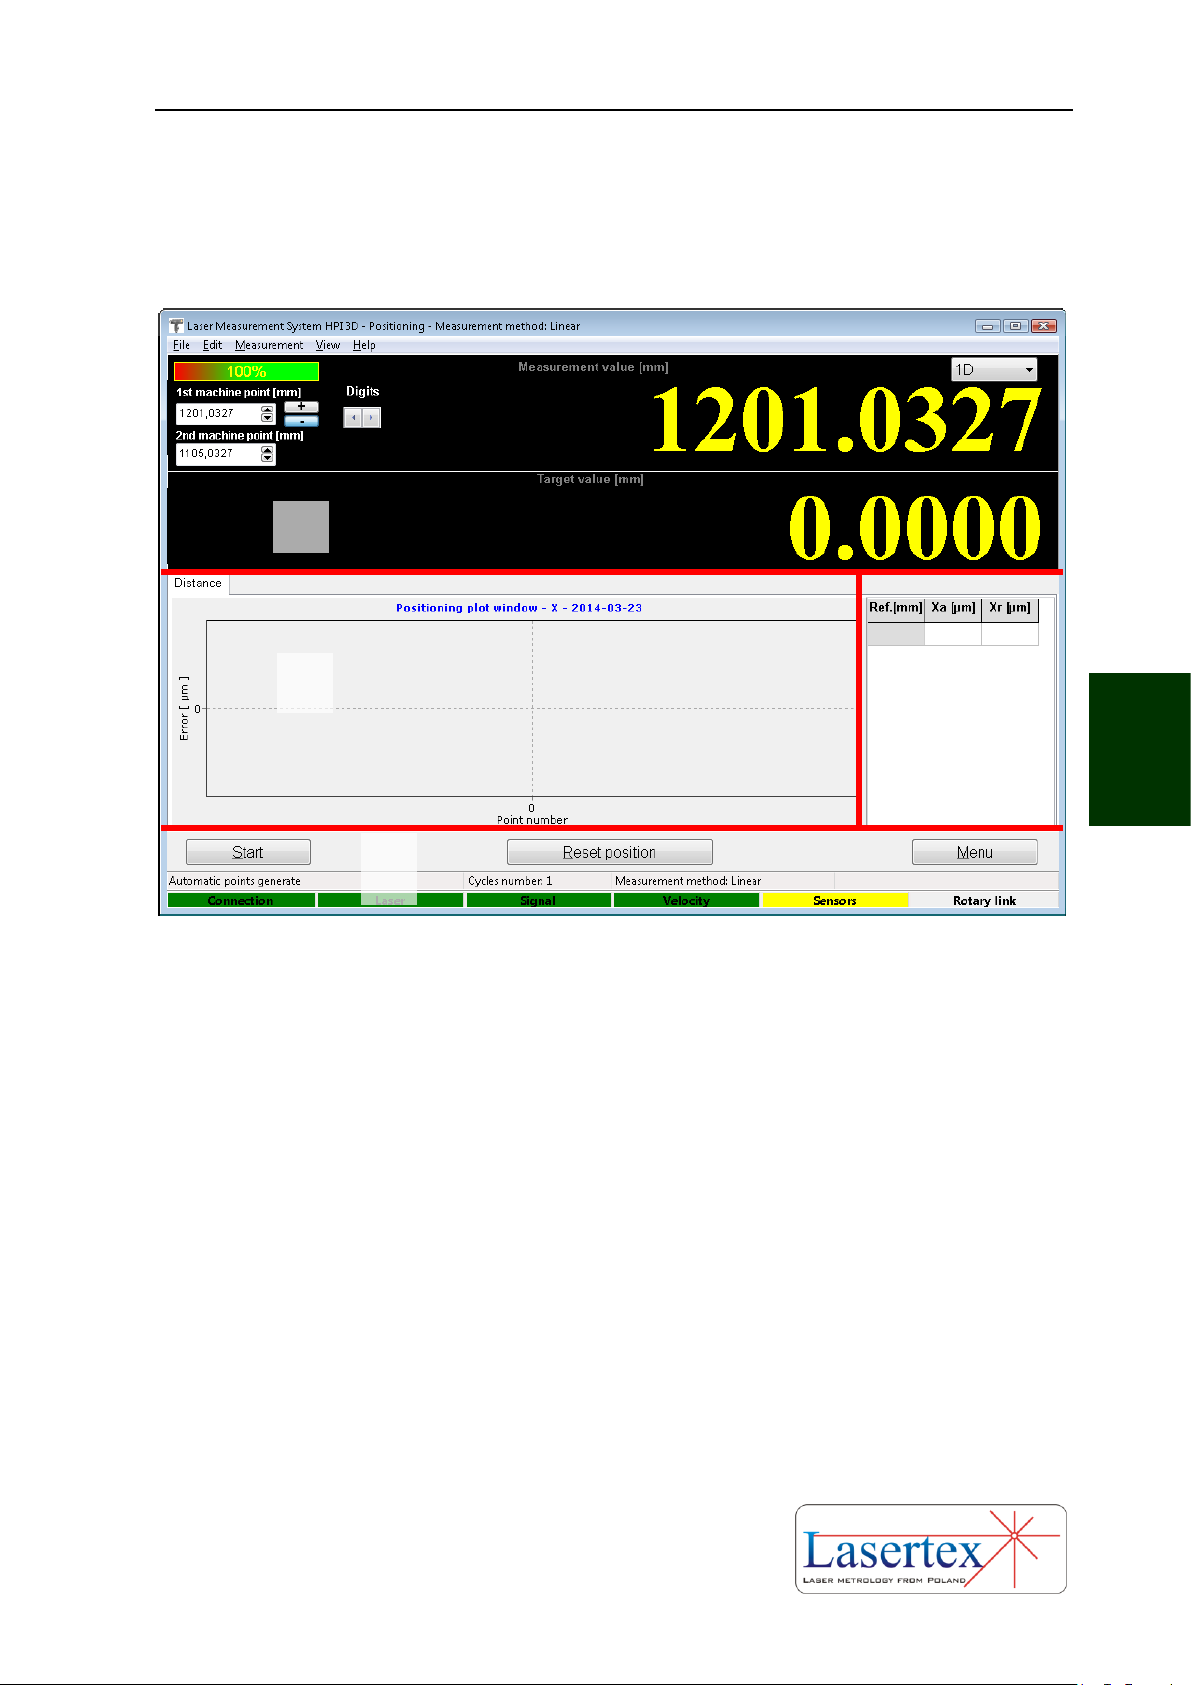
MEASUREMENTS - POSITIONING
5-11 www.lasertex.eu
5
input signal, i.e. the beam strength and the current value measured by the laser.
Number of displayed digits can also be modified.
FIG.5.7 LINEAR POSITIONING WINDOW
In the top left corner of the Panel there are two fields named 1st measurement
point and 2nd measurement point allowing tying the coordinate system of the laser with
the coordinate system of the measured machine. This option is described in more
details below in the Chapter. Also later in the chapter there is described an option for
switching between 1D and 3D positioning.
iii. Positioning Plot Panel
On the chart drawn in the Positioning Plot Panel there are shown information
about the measured deviation between the real and the desired translation of the
machine. On the plot the points are placed in two colors: the deviations measured
during forward movement of the machine is shown with blue circles while the
deviations measured during reverse movement are shown with red triangles. The
2
3
4
Page 82
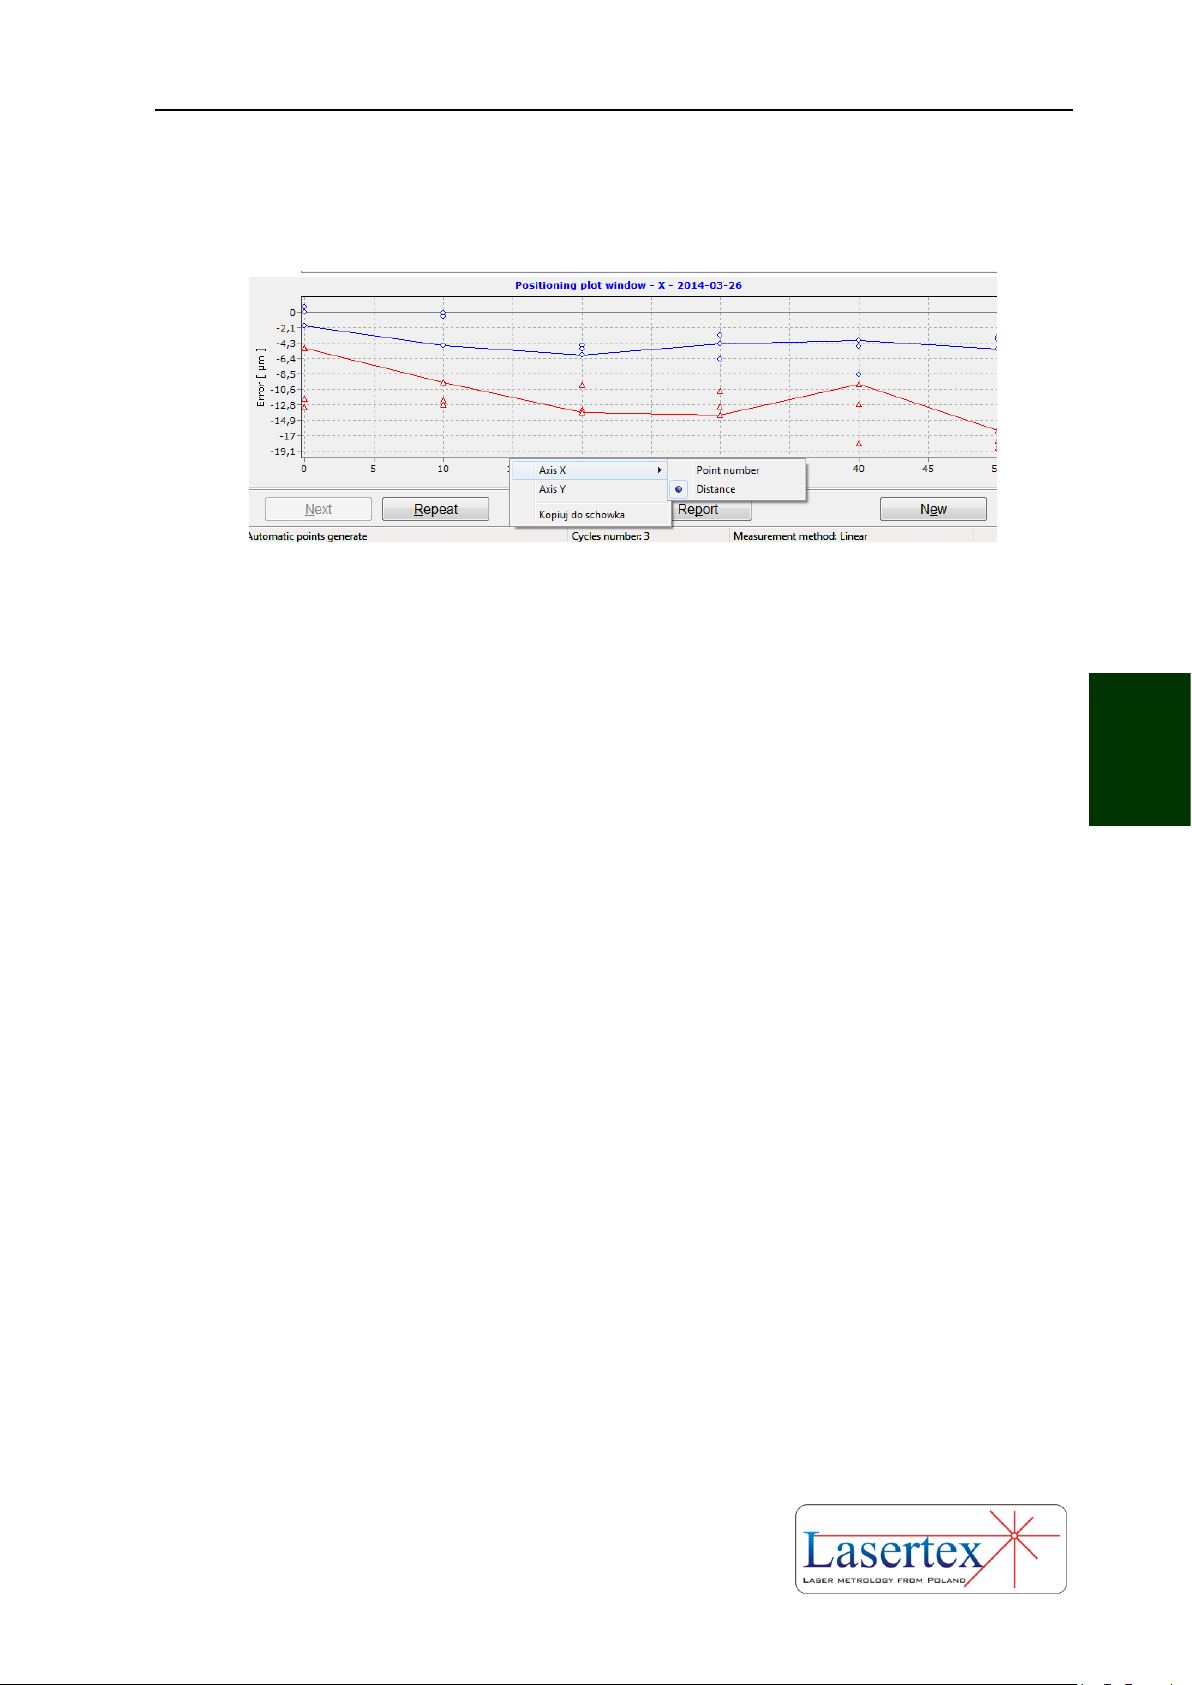
MEASUREMENTS - POSITIONING
5-12 www.lasertex.eu
5
points for the current measurement series are connected with the solid line (see
Figure 5.8).
FIG.5.8. PLOT WITH POSITIONING MEASUREMENT RESULTS
Although the scale of the Y axis is set automatically by default but it is possible
to set the display limits manually by choosing an Axis Y option from the pull-down
menu (see Figure 5.8). Values in the axis X can be displayed either in the distance
units or as numbers of measurement points.
iv. Positioning Measurement Values Panel
In the Values Panel there are displayed numerical values of the positioning
measurements (Figure 5.11). These are the values from the current measurement
series and these are shown on the Positioning Plot as points connected with the solid
line.
The unit of the distance can be changed, independently on the unit of the chart,
by clicking with the left mouse button on the distance (i.e. Ref.) column of the chart.
There are two possibilities: true value of the distance or point number.
v. Positioning Control Panel
Positioning Control Panel is comprised of three main parts (Figure 5.11):
Line with control buttons
Line with measurement status information
Line with laser status information.
Page 83

MEASUREMENTS - POSITIONING
5-13 www.lasertex.eu
5
The functionality of the line with the buttons changes with the current
measurement state. In the Figure 5.9 there are shown various appearances of the
control part of the Control Panel.
FIG.5.9 CONTROL PANEL – DIFFERENT MODES. CLARIFICATIONS IN TEXT
Case A appears when there is no measurement in progress and no data were
read from a file. In this mode it is possible either to start the measurement (“Start”), to
reset the main counter (“Reset position”) or to return to the main menu of the
program (“Menu”).
Case B appears during measurements. The measurement can be stopped
directly (“Stop”) or indirectly (“Menu”). After pressing the “Menu” button the
software always asks if the measurement is to be stopped first.
Case C is visible during analyses of the obtained results. If there are measured
fewer series than the desired limit than the button “Next” becomes active. Pressing
this button starts the measurement. The results obtained during the measurement
will be added to the thus far registered results. Pressing “Repeat” button also starts
new measurement but the results would supersede the results of the last
measurement series. By pressing “New” button all registered results are cleared and
a new measurement is started.
A
B
C
Page 84
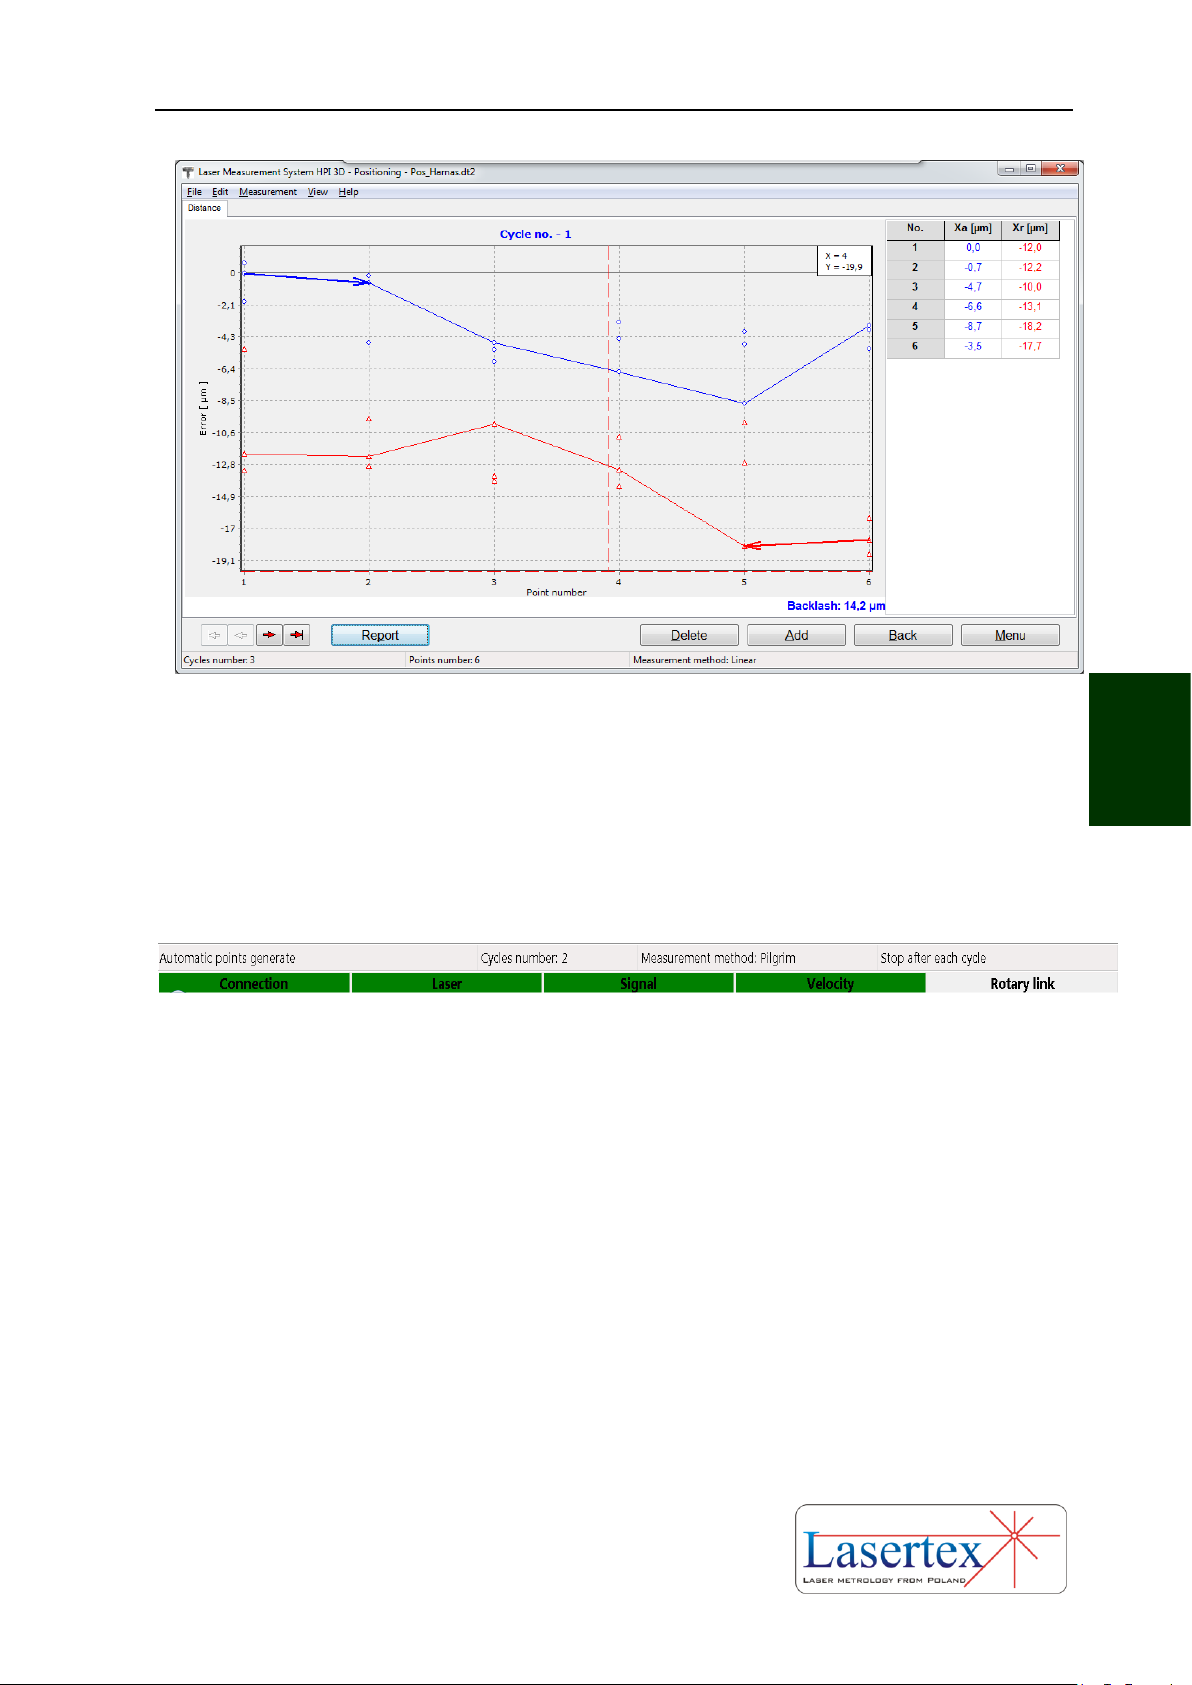
MEASUREMENTS - POSITIONING
5-14 www.lasertex.eu
5
FIG.5.10. DATA BROWSING WINDOW
Button “Browse” opens the results browse window (Figure 5.10). The
functionality of this window is show in more details later in the Chapter. Pressing
“Report” opens Linear Positioning Report Window as shown in the Figure 5.34.
FIG.5.11. STATUS BARS IN POSITIONING WINDOW
In the bottom part of the Positioning Control Panel there can be found two
status lines. The upper one is presenting a configuration of the positioning
measurements, the lower the state of the laser system
In the first field of the upper line there is an information about the points
capture method (manual or automatic). The next field informs about number of
cycles in series (number of cycles executed one after one, if not active is the option
Stop After Cycle). In the third field there is shown the information about
measurement method selected in the Configuration.
The bottom line shows information common to all options of the HPI Software,
i.e. the state of Connection, Laser, Signal, Sensors and Rotary encoder. The
functionality of the line is described in another Chapter.
Page 85
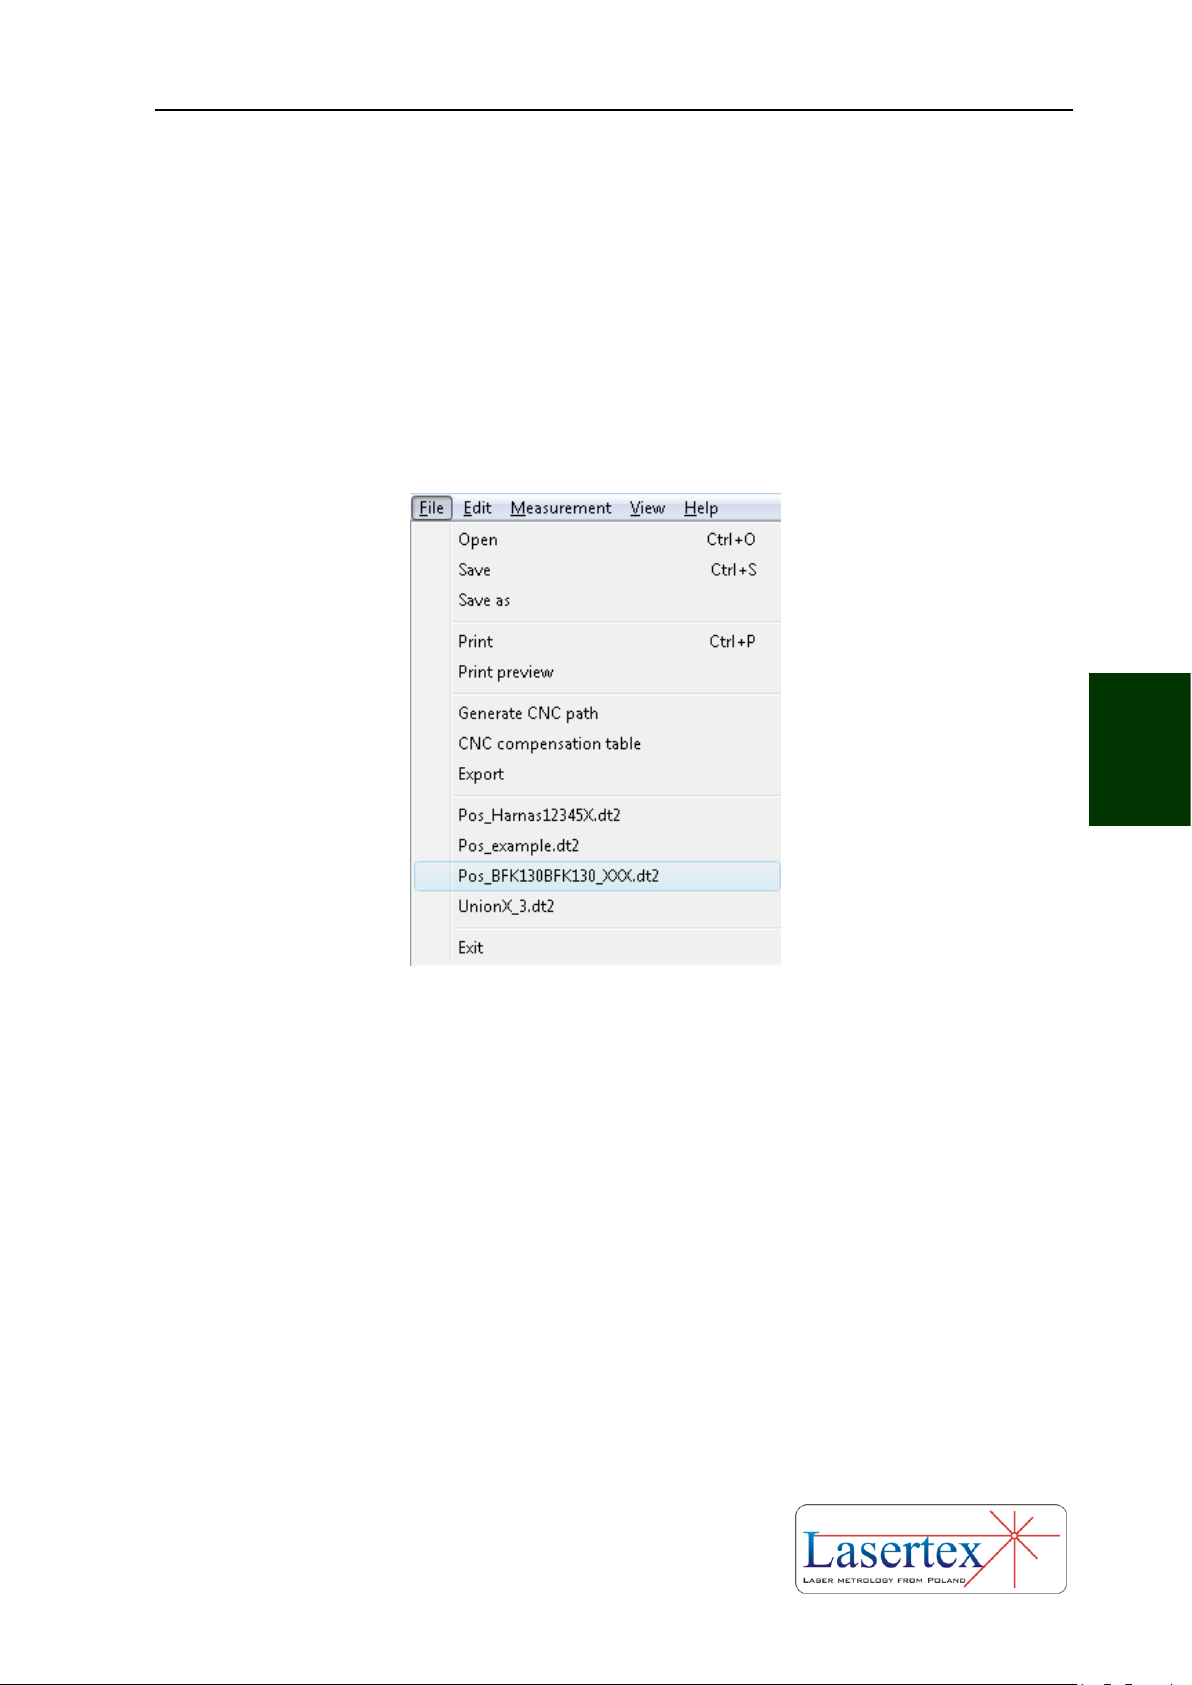
MEASUREMENTS - POSITIONING
5-15 www.lasertex.eu
5
vi. Pull down menu - File
The menu bar consists of following options: File, Edit, Measurement, View,
Help. In the File menu (figure 5.12) can be found commands for reading measured
data from a file, saving the data to a file, printing measurements results or exporting
them to a file.
FIG.5.12. POSITIONING PULL-DOWN MENU FILE
Other important commands available in the File menu are options for
generating CNC path and preparing compensation table.
vii. CNC path generation
CNC path generation options allows automatic preparation, by the HPI-3D
software, the G-code program compatible with most CNC control systems. The
options of the path generation are set in the separate window as shown in the figure
5.13.
In the upper part of the window the machine movement parameters are set. In
the lower part the generated program can be viewed end edited. The results can be
saved to a text file or previewed and printed.
Page 86
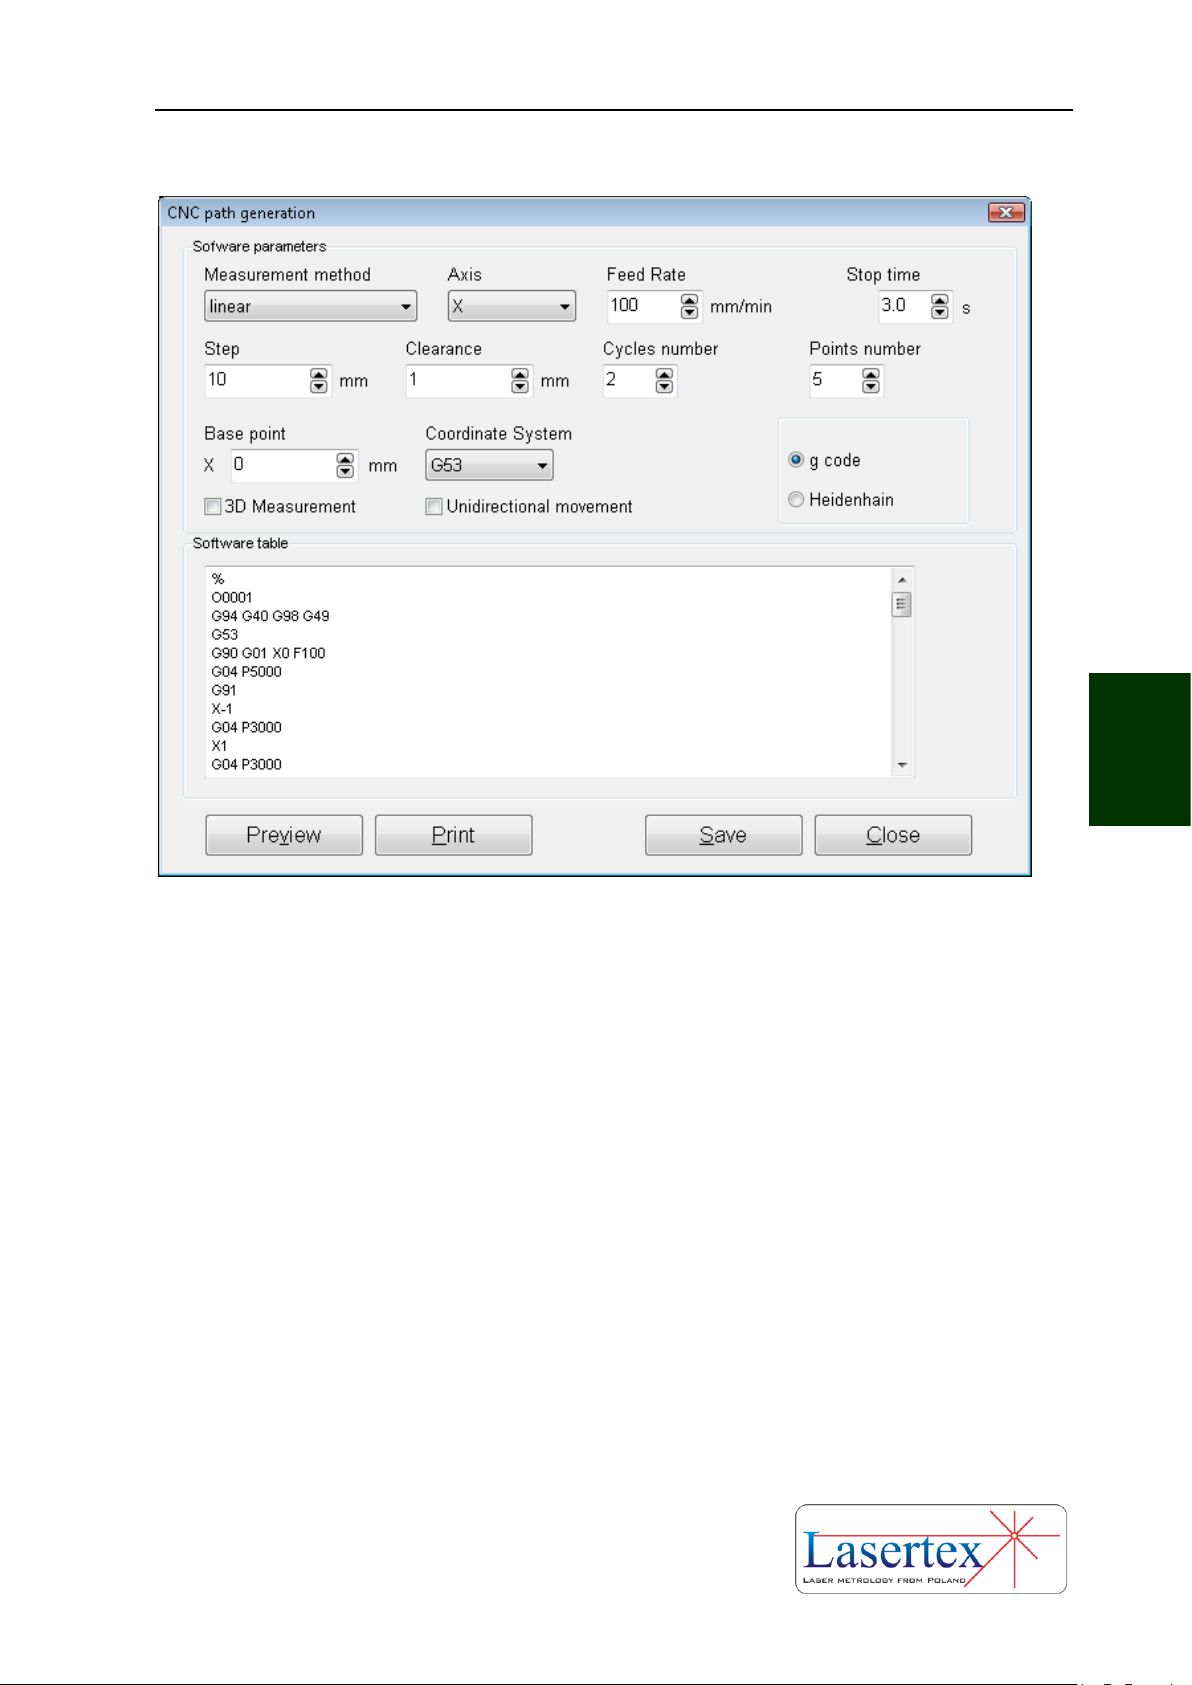
MEASUREMENTS - POSITIONING
5-16 www.lasertex.eu
5
FIG.5.13. CNC PATH GENERATION WINDOW
Following parameters in Software parameters panel should be configured in
order to generate the proper code:
Measurement method - should be set accordingly with the chosen
measurement method (see below). Choice must be made between
linear, pendulum, pilgrim effective and pilgrim standard;
Axis – the measured machine movement axis should be chosen (X, Y, Z,
U, V, W, A, B, C).
Feed Rate – the maximum machine feed rate in the chosen axis during
measurements can be modified. The chosen value cannot be greater
than machine limitations (see manual of the tested machine) and laser
limitation (7 m/s = 420000 mm/min).
Stop Time – the time the machine stops at every measurement point.
This time is necessary for the HPI Software to capture measurement
point. The proper value of this parameter depends on the tested
Page 87

MEASUREMENTS - POSITIONING
5-17 www.lasertex.eu
5
machine and on Point Capture parameters of the laser (described later
in this chapter).
Step – the distance between measurement points.
Clearance – additional machine movement used to compensate
backlash. The chosen value should be large enough for the proper
backlash compensation of the machine.
Cycles number – sets the number of generated movement cycles. For
proper calculation of statistical parameters in Report the number of
measurement cycles should be not lower than three. The more
measurement cycles is chosen the better characterization of the
machine is done but the longer the measurement process lasts. The
number of cycles should be the same with the value in Configuration-
>Positioning->Cycles in series.
Points number – sets the number of measurement points.
Base point – the initial position of the machine in its own coordinate
system.
Coordinate system – if used, the proper coordinate system should be
chosen.
3D Measurement – if checked then the Stop Time value is
automatically increased to make the simultaneous 3D measurements
possible (3D module requires additional 2 seconds stop time during
each point capture).
Unidirectional movement – if checked then the g-code program is
generated only for machine movement in one direction. This option is
useful for rapid estimation of machine geometry and for very long
machines. Should not be used for normal measurements.
g code/Heidenhain – it is possible either to generate the standard G-
code program or a version compatible with Heidenhain machine
controls.
viii. Compensation table preparation
Page 88
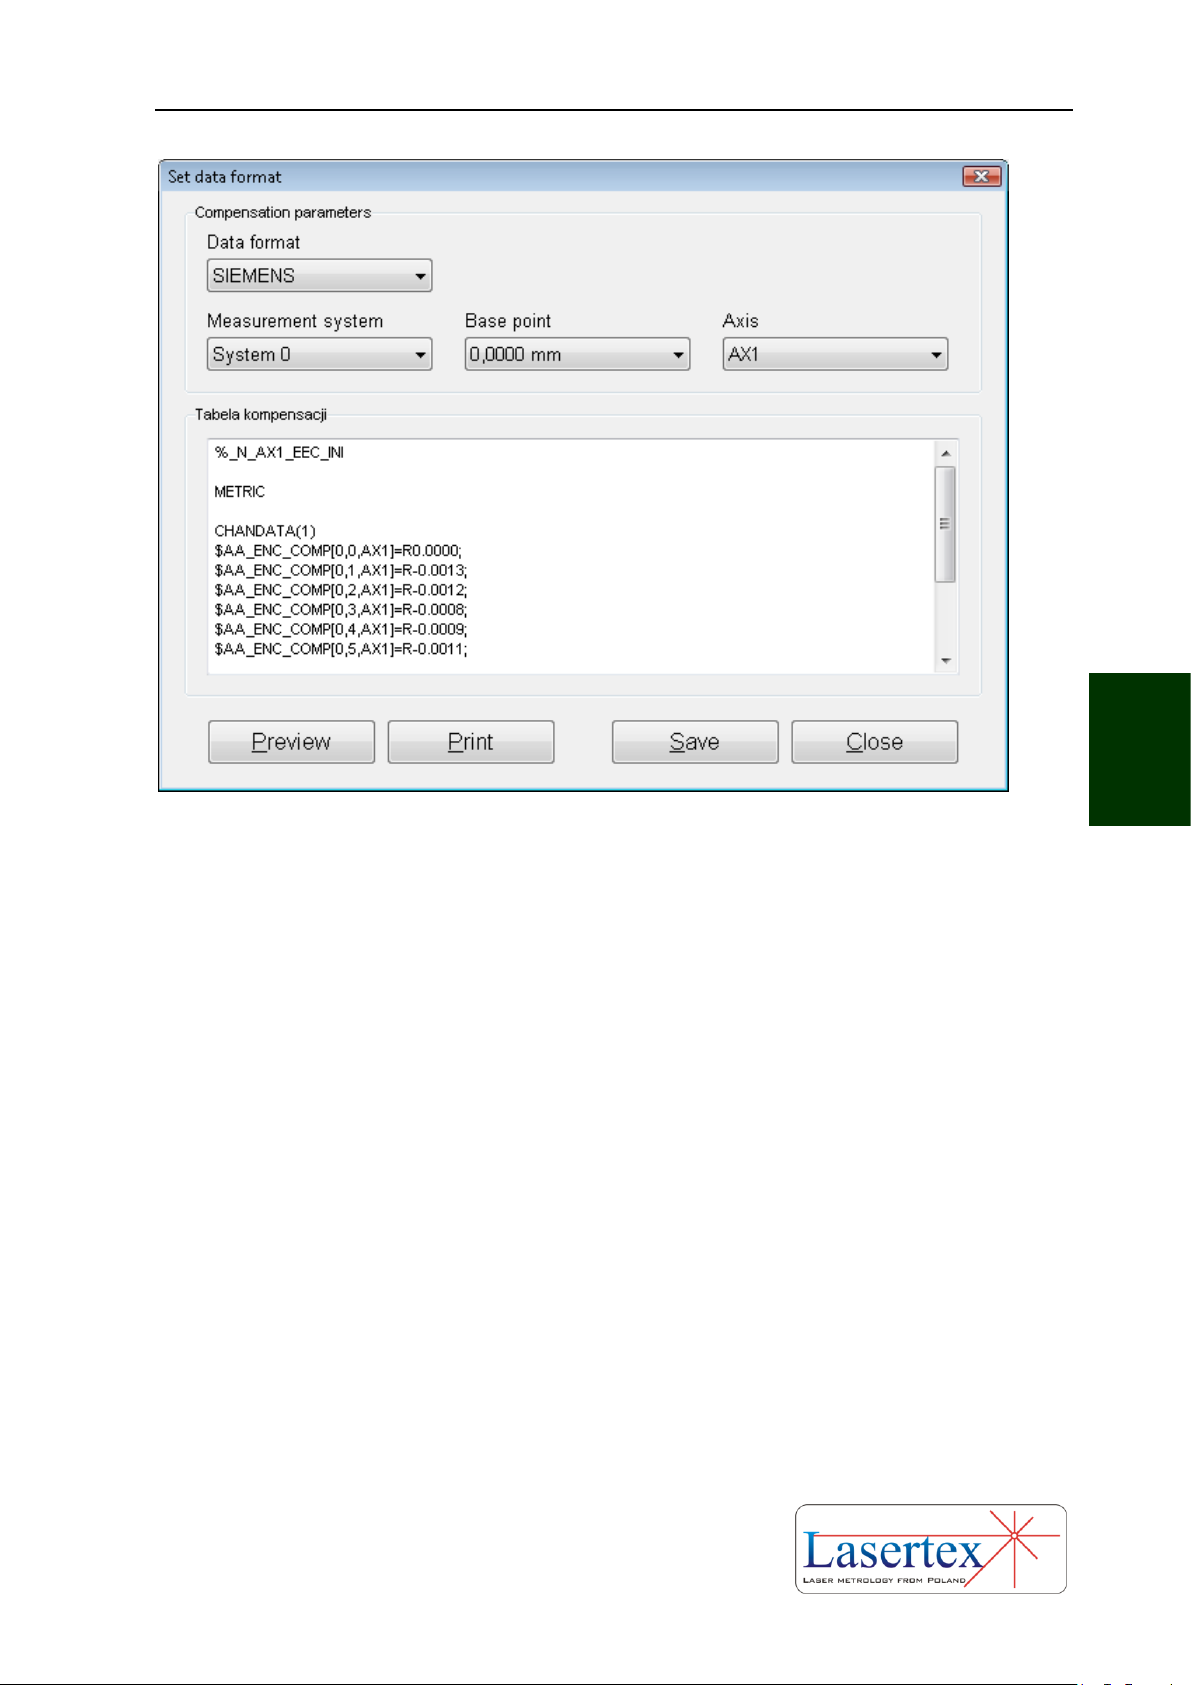
MEASUREMENTS - POSITIONING
5-18 www.lasertex.eu
5
FIG.5.14. COMPENSATION TABLE PREPARATION WINDOW
Compensation table preparation (figure 5.14) is an option used when
measurement is finished (before measurement start it is not enabled). The
measurement results are used by the software to calculate errors and generate the
compensation values for the machine control system. Suitable format of the
compensation table for machine control system has to be selected from Data format
drop-down list. Together with the data format additional parameters are configured.
The option is described in more detail in the end of the chapter.
ix. Pull down menu - Edit
In the pull-down menu option Edit (fig. 5.15) there are options for setting
measured machine data (Fig 5.16), defining machine error limits (fig. 5.17),
previewing obtained positioning results, editing positioning points (when option
Target Points from List from menu Measurement is active) and changing overall
positioning configuration.
Page 89
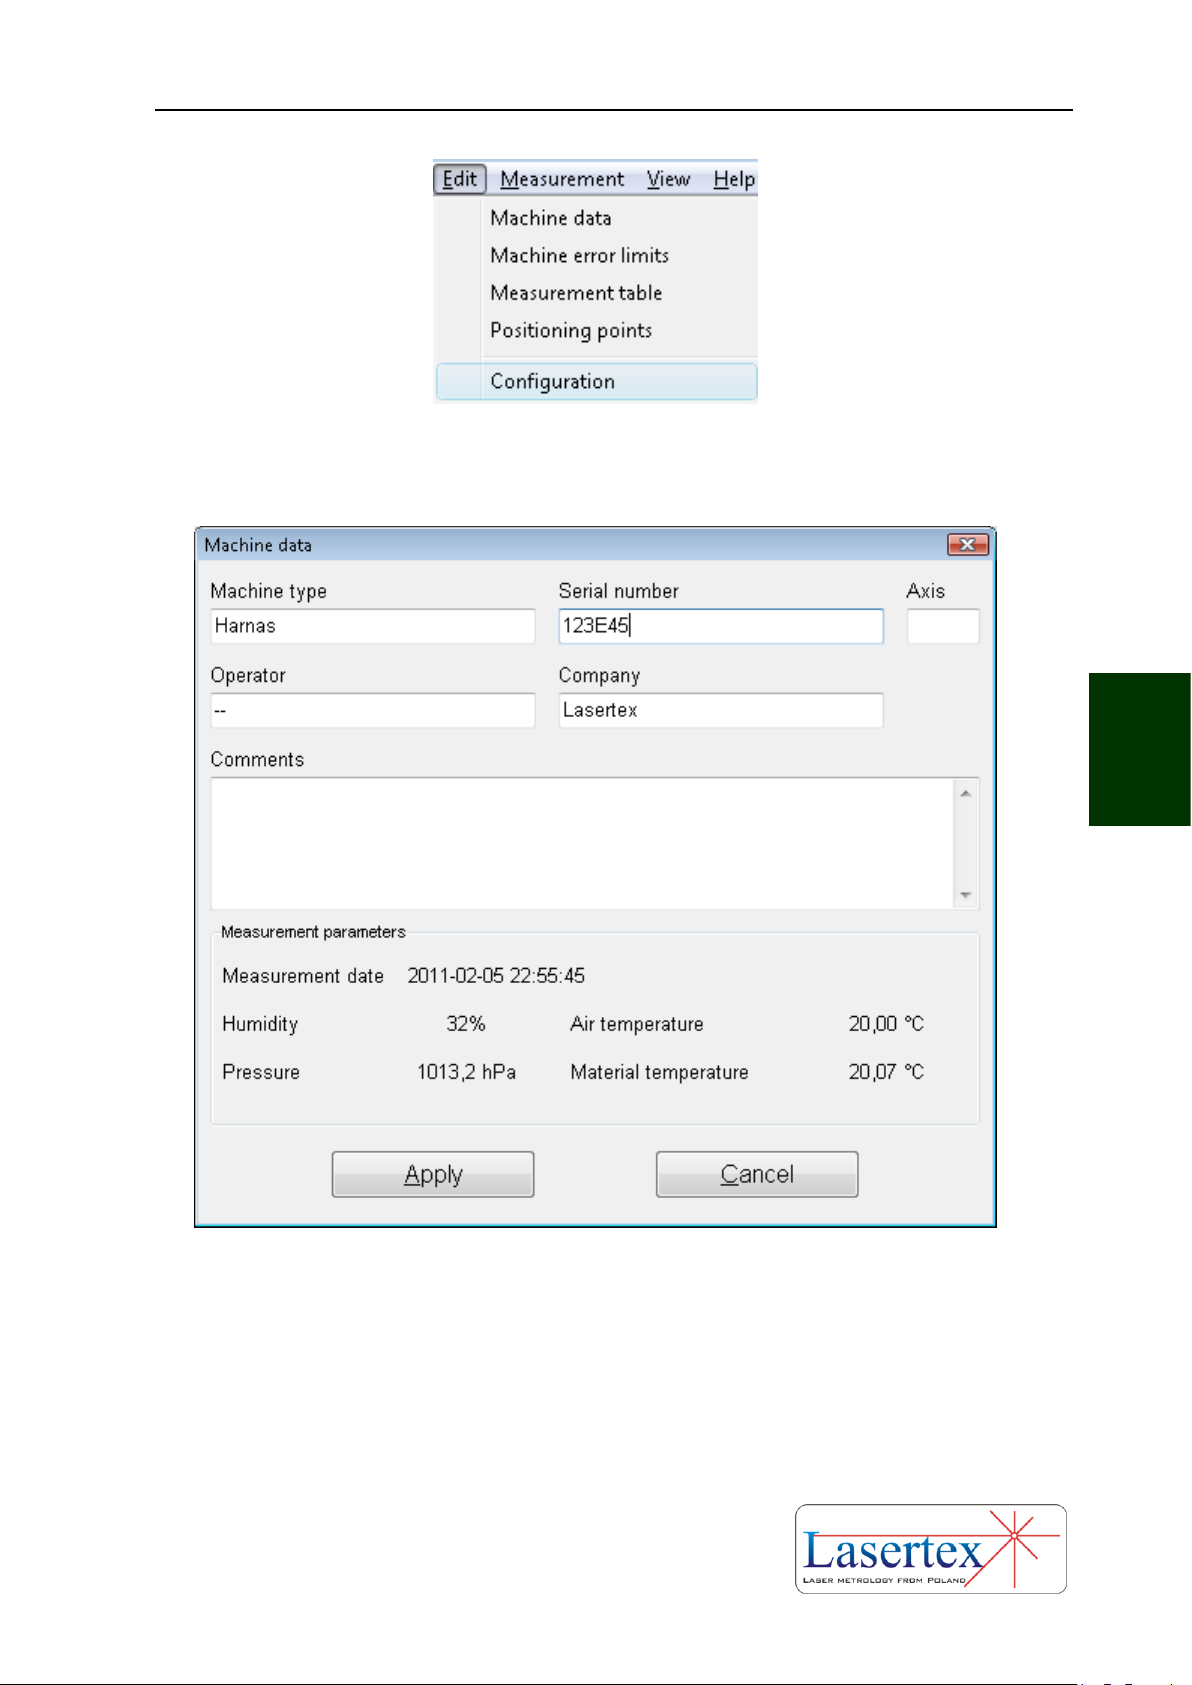
MEASUREMENTS - POSITIONING
5-19 www.lasertex.eu
5
FIG.5.15. POSITIONING PULL-DOWN MENU EDIT
FIG.5.16 MACHINE DATAWINDOW
x. Machine error limits
In the Edit option the user can setup allowable error limits of the machine for
different norms (option Machine error limits - Fig. 5.17). The results of the whole
Page 90
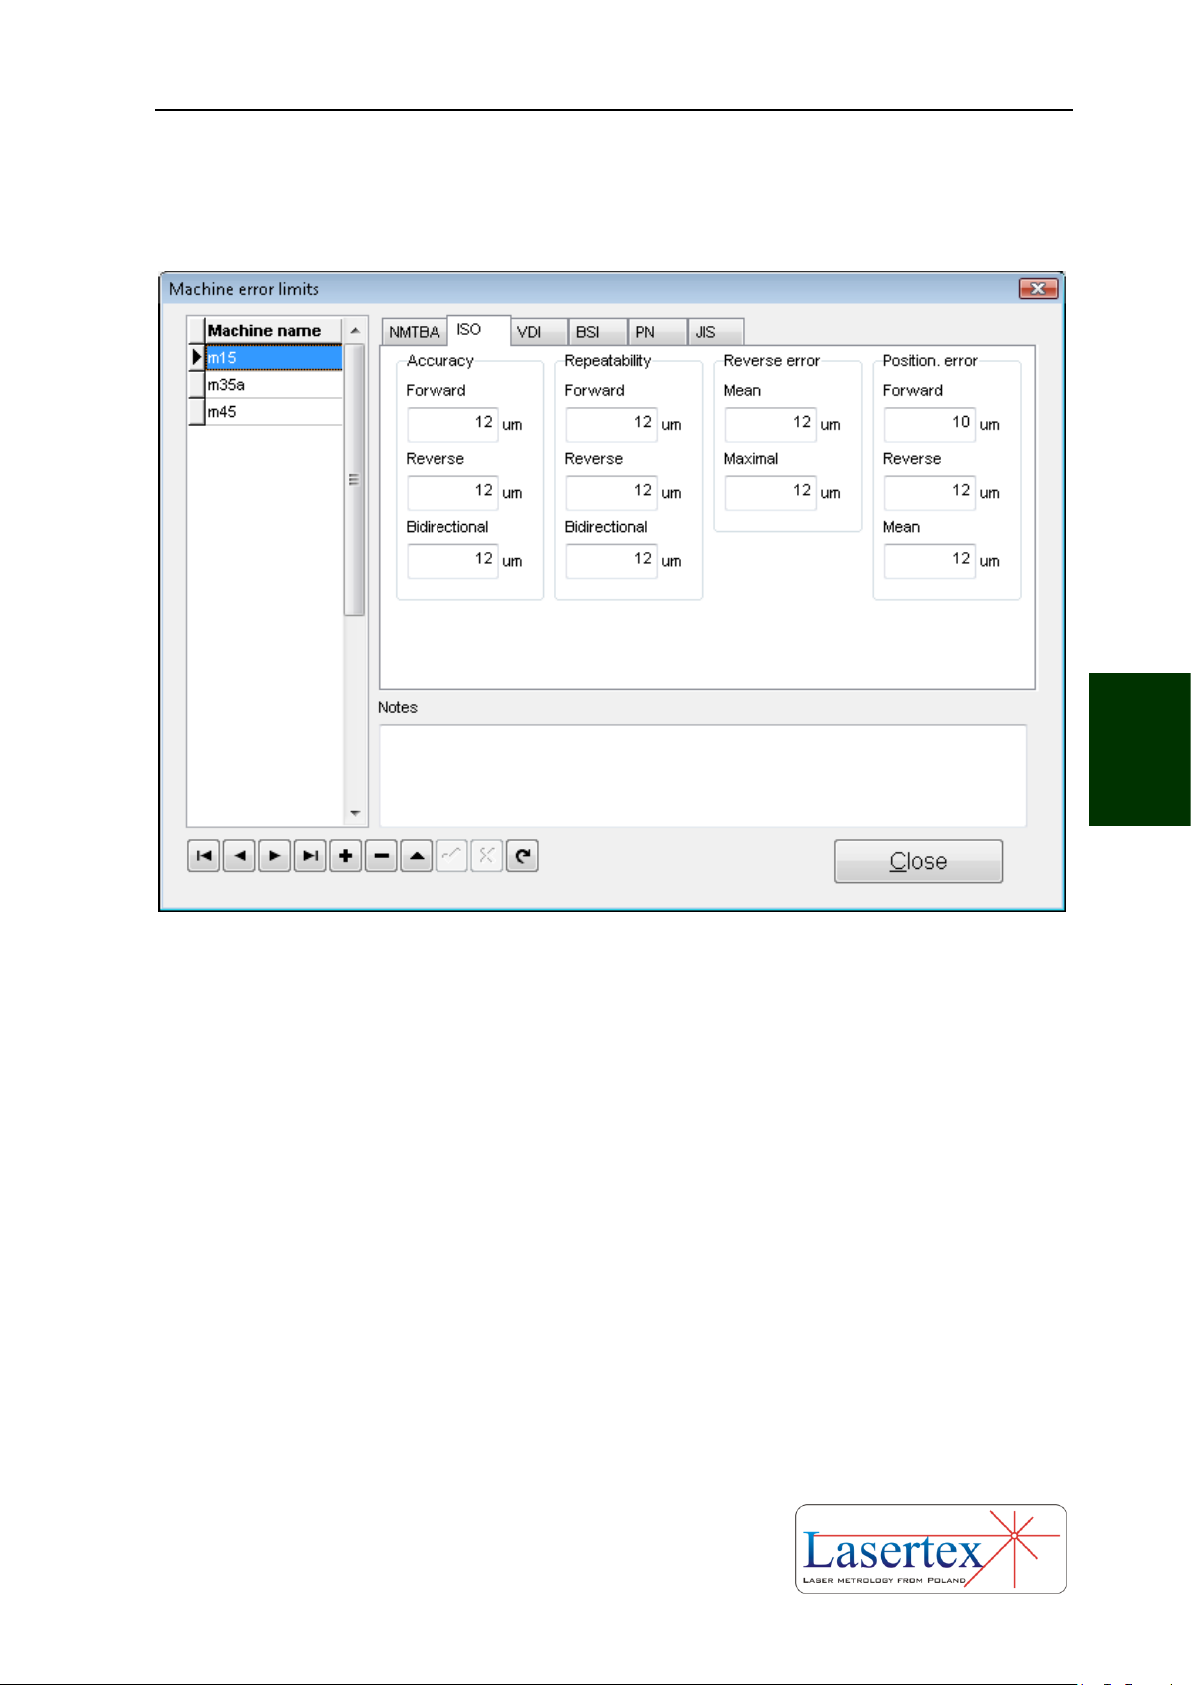
MEASUREMENTS - POSITIONING
5-20 www.lasertex.eu
5
linear positioning measurements are compared with these limits (see Fig. 5.18). This
option is especially useful when there are checked many machines of the same type
and the same requirements on their accuracy are expected.
FIG.5.17. MACHINE ERROR LIMITS WINDOW
Page 91

MEASUREMENTS - POSITIONING
5-21 www.lasertex.eu
5
FIG.5.18. MACHINE ERROR LIMITS COMPARATION PANEL
xi. Positioning points generation
Page 92
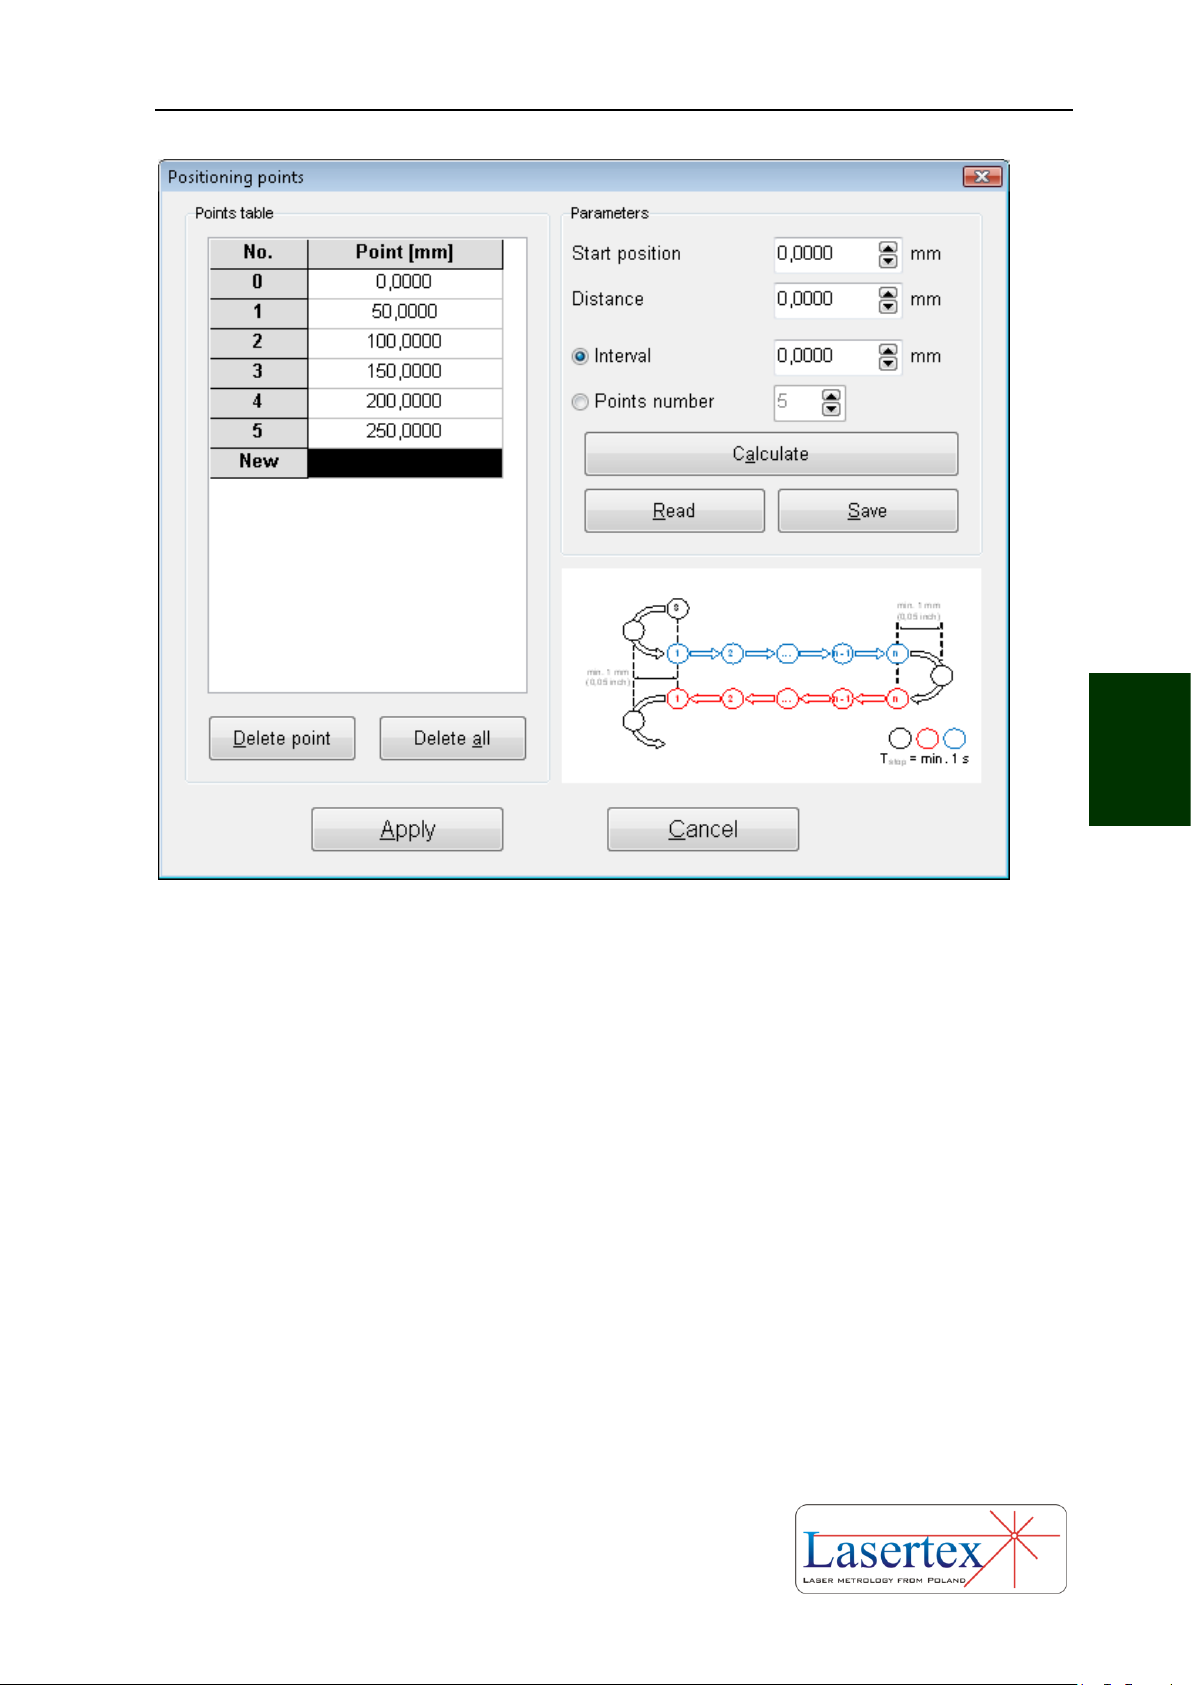
MEASUREMENTS - POSITIONING
5-22 www.lasertex.eu
5
FIG.5.19. POSITIONING POINTS GENERATION WINDOW
If option Target Points from List from menu Measurement is active, then the
program expects the measured machine to stop in points defined in the Positioning
points window as shown in the figure 5.19. Points can be entered manually or can be
generated from the input parameters: start position (can be negative), distance (must
be positive) and interval (must be positive) or number of points. The points are
calculated when Calculate button is pressed. Obtained points can be saved to a file.
xii. Configuration of Positioning measurement
Page 93
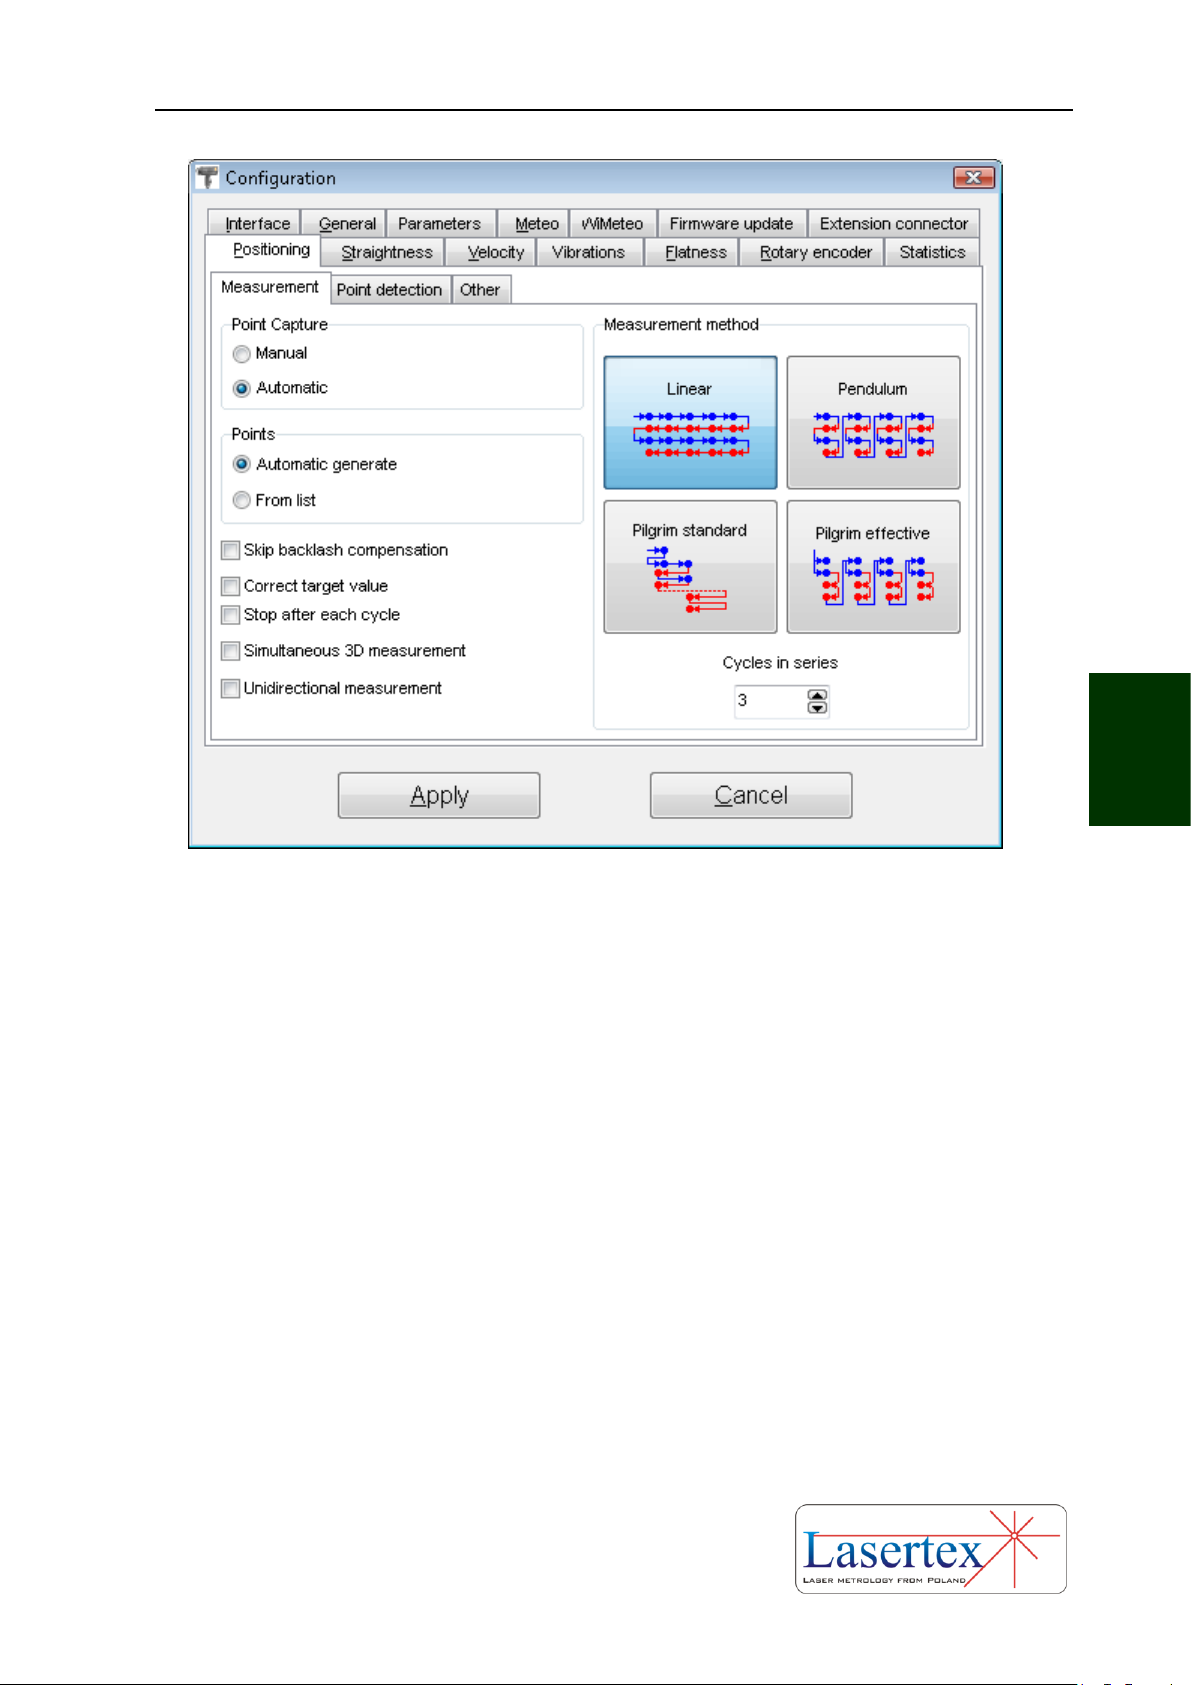
MEASUREMENTS - POSITIONING
5-23 www.lasertex.eu
5
FIG.5.20 LINEAR POSITIONING COFIG WINDOW
In the Positioning tab in the Configuration window the important options of
the linear positioning measurements (Fig. 5.20) can be set.
In the Measurement tab the user can choose the main parameters of the
positioning measurement. The parameters grouped in the Point detection tab change
the behavior of the software during point capture process.
There are four available methods for checking machine’s positioning: Linear,
Pendulum, Pilgrim Standard and Pilgrim Effective (buttons in Measurement method
panel). The directions of the expected movement of the machine are shown in the
pictograms and in figures 5.21, 5.22, 5.23 and 5.24. Usually the Linear method is used.
In the Cycles in series field the number of complete measurements cycles is set.
The greater number of cycles is used the better result is achieved. At least three cycles
are recommended for proper calculation of statistics.
Page 94
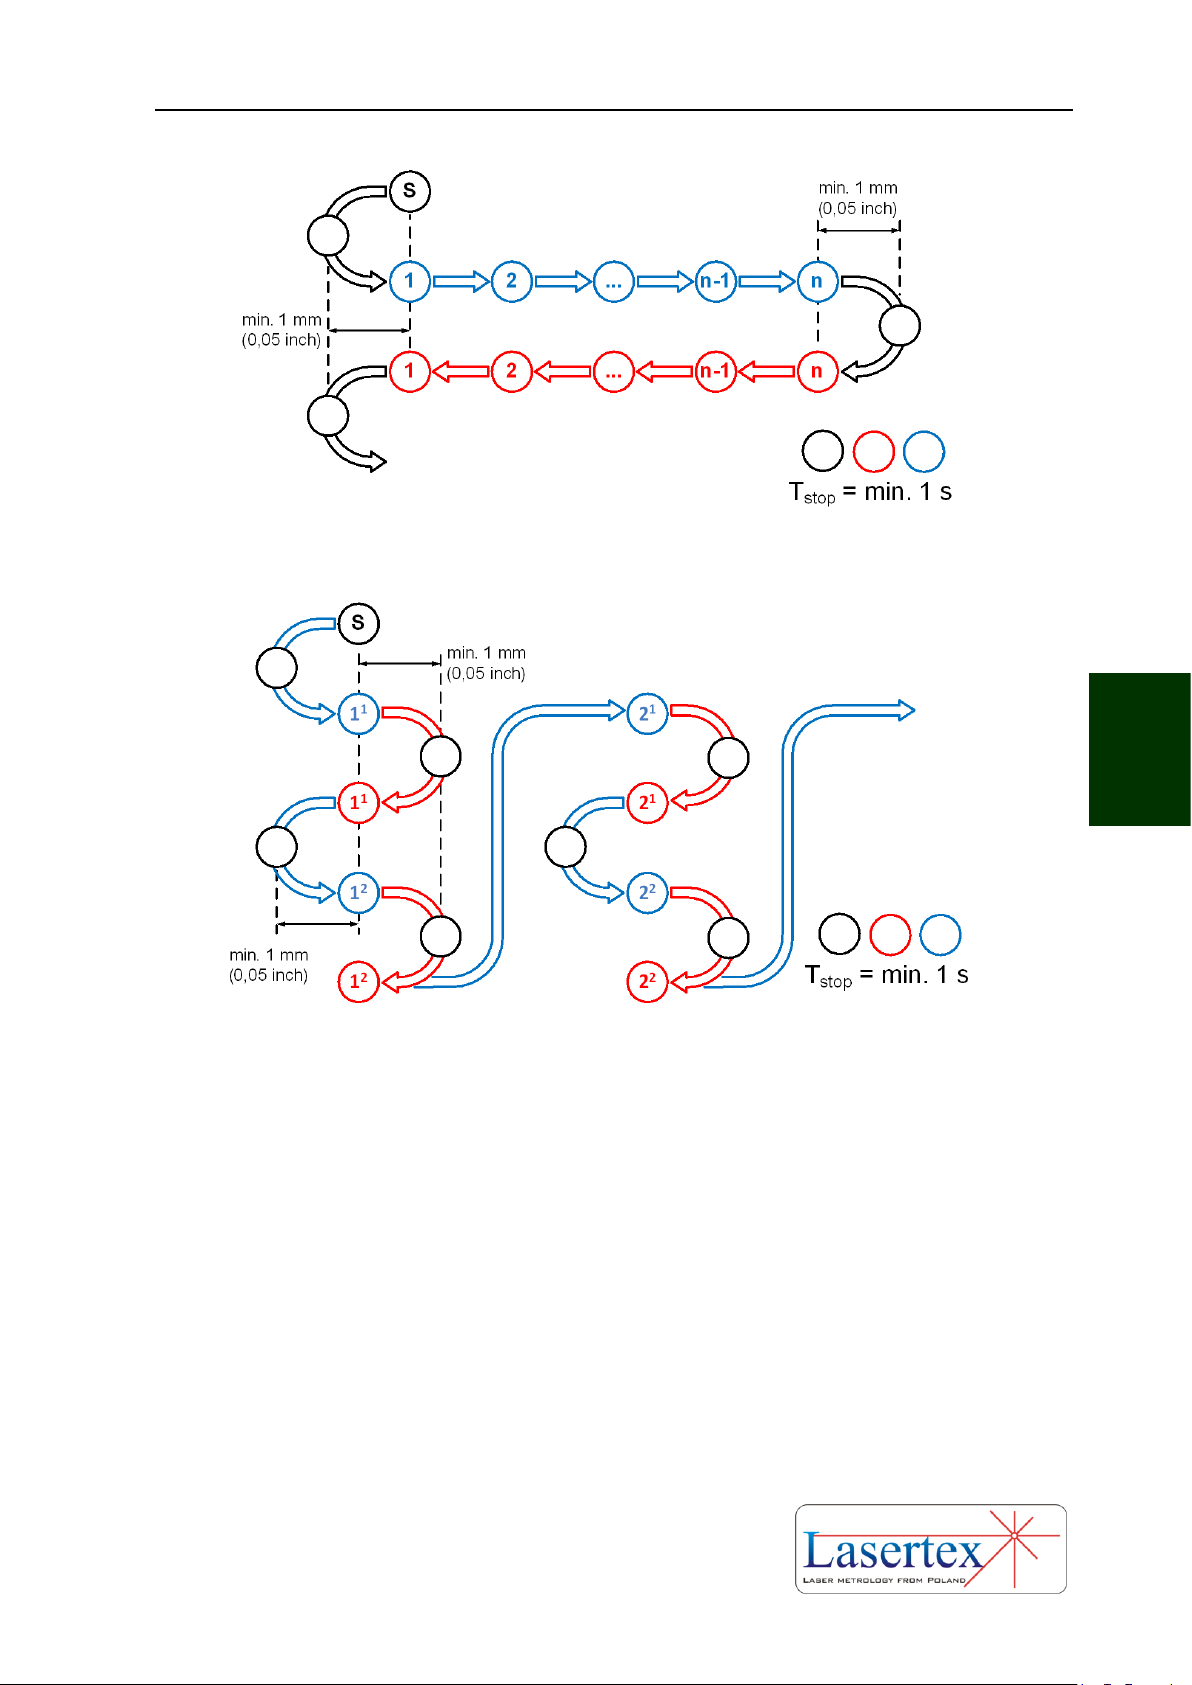
MEASUREMENTS - POSITIONING
5-24 www.lasertex.eu
5
FIG.5.21. MACHINE MOVEMENT IN THE LINEAR MODE (S – STARTING POINT)
FIG.5.22. MACHINE MOVEMENT IN THE PENDULUM MODE (S – STARTING POINT)
Page 95
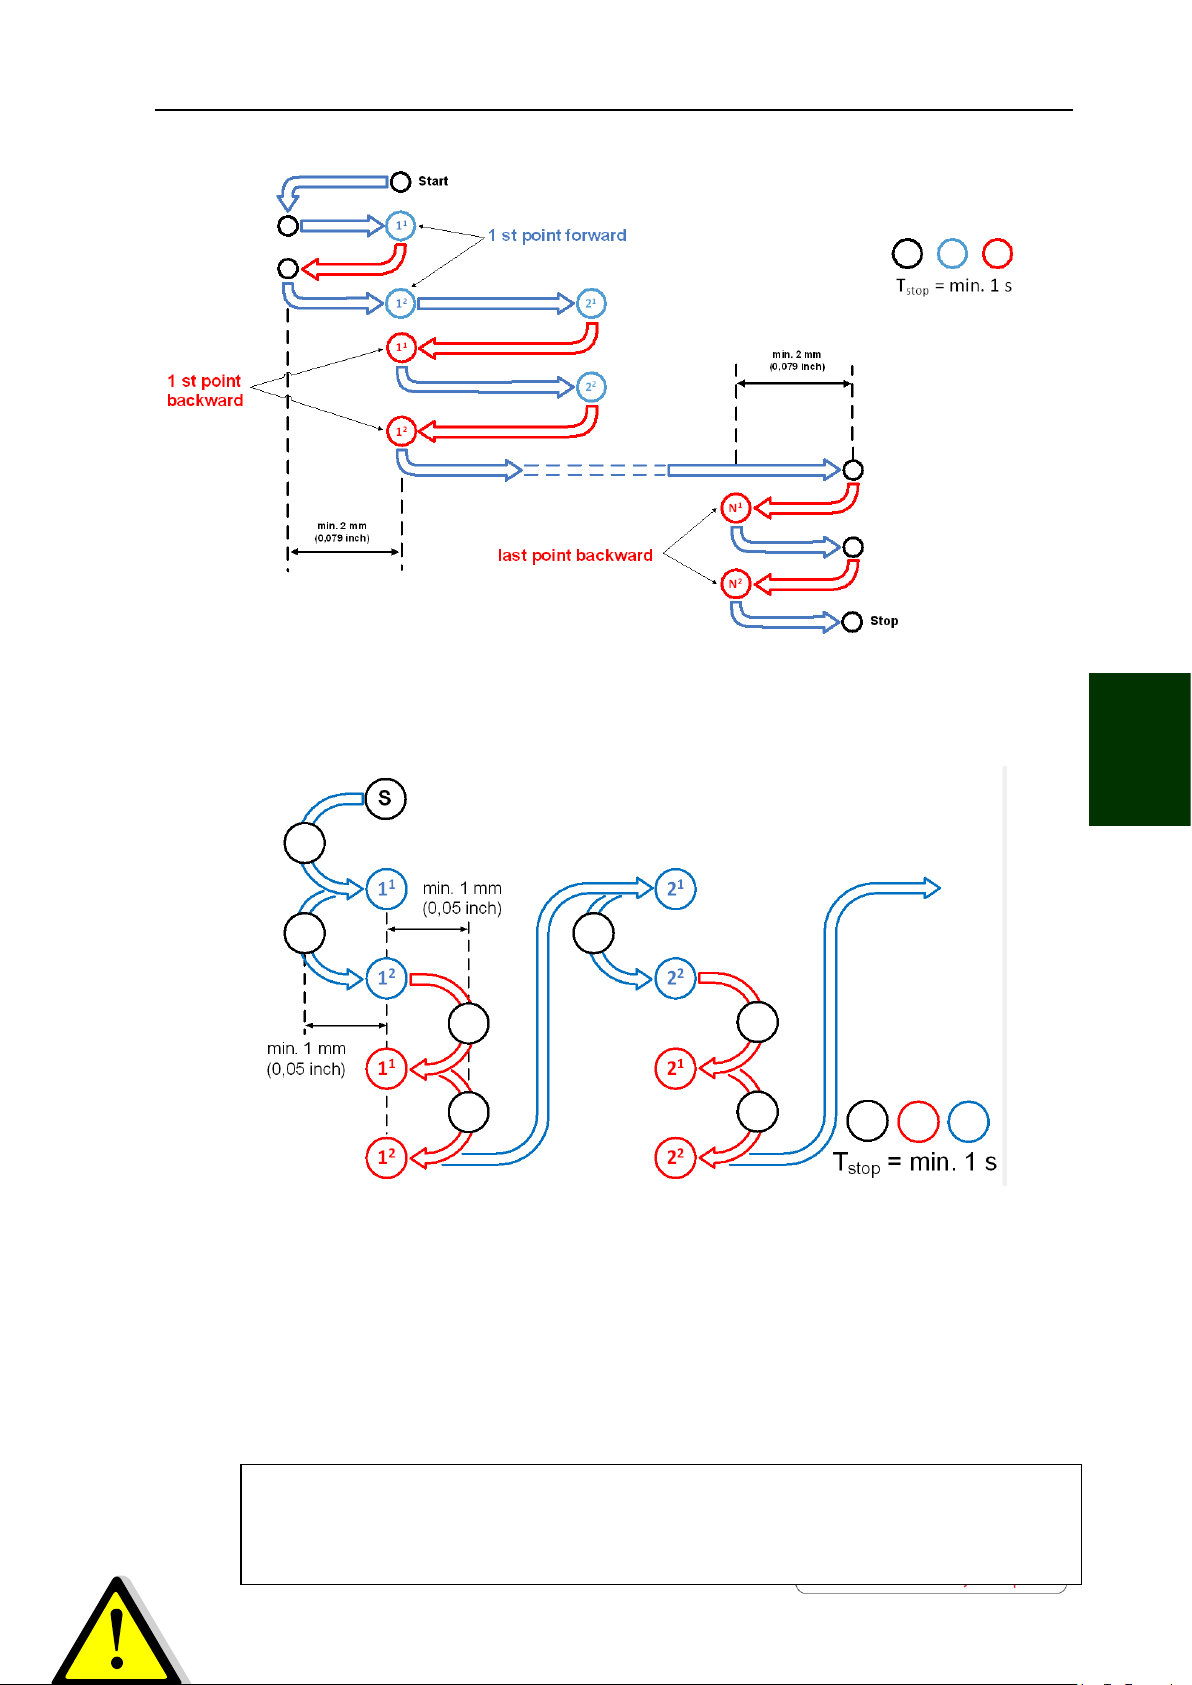
MEASUREMENTS - POSITIONING
5-25 www.lasertex.eu
5
FIG.5.23. MACHINE MOVEMENT IN THE PILGRIM STANDARD MODE (S – STARTING
POINT)
FIG.5.24. MACHINE MOVEMENT IN THE PILGRIM EFFECTIVE MODE (S – STARTING
POINT)
Measurement points can be either captured manually (with keyboard space or
Strobe button) or captured automatically by the software. For automatic capture
parameters set in the Point detection tab are used.
For numerically controlled machines the Automatic point
capture and Automatic point generation should be chosen.
Page 96

MEASUREMENTS - POSITIONING
5-26 www.lasertex.eu
5
Measurement points can be automatically detected by the software during
measurement process or can be edited manually. The manual point list edition is
described later in this chapter.
Set of checkboxes allow further modification of the positioning process
Skip backlash compensation – if checked then the software does not
expect the machine to make the backlash compensation movement
(from point S to point 1 in the figures 5.21 – 5.24). When manual point
capture option is chosen then there is no backlash compensation at the
first measurement point!
Correct target value – if checked then the software confirms laser
measured distance value of each captured point. Option usable for
non-numeric machines.
Stop after each cycle – if checked then the measurements is stopped
automatically after full measurement cycle (i.e. when machine returns
back to position 0). The option is useful when intermediate results are
to be viewed and analyzed.
Simultaneous 3D measurement – if checked then, during positioning
measurements also a 3D straightness measurements are performed.
Longer machine stop time in measurement points is required.
Unidirectional measurements – if checked then the measurement is
finished when machine return movement is detected and not when the
machine returns back to zero.
Page 97
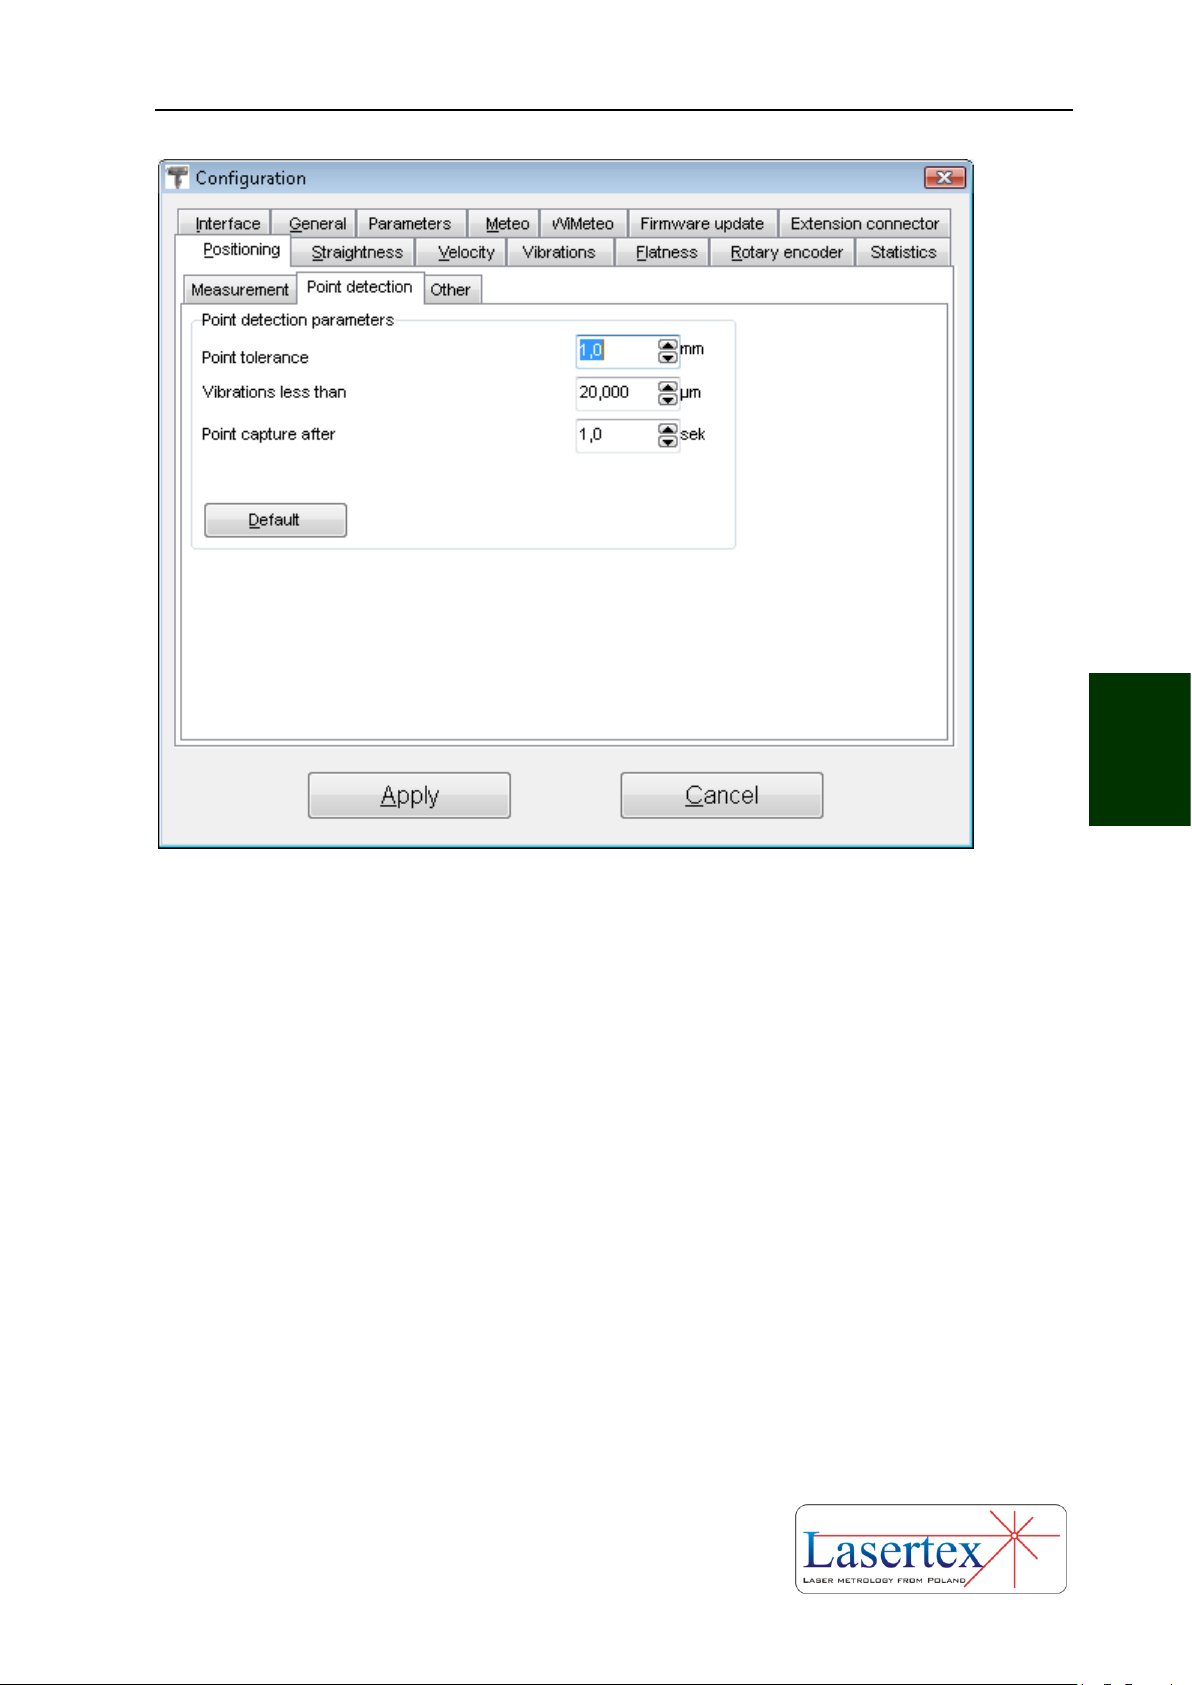
MEASUREMENTS - POSITIONING
5-27 www.lasertex.eu
5
FIG.5.25. LINEAR POSITIONING COFIG WINDOW – POINT DETECTION
The options available in the Point detection tab are usable only when
Automatic Point Capture option is chosen. They define the conditions under which
the software captures the measurement points.
A point is captured when the measured distance vibrations are lower than
Vibration less than value after time defined in Point capture after. The measurement
point value is rounded with tolerance set in Point tolerance.
For example if the Point tolerance is set to 1.0 mm and laser measures 50.11mm,
then a desired measurement point of 50.00 mm is taken with machine error of 0.11
mm. In the case when laser measures 60.61 mm the measurement point of 61.00 mm
is taken with machine error of -0.39 mm.
In the case when the Point tolerance is set to 0.2 mm and laser measures
50.11mm, then a desired measurement point of 50.20 mm is taken with machine error
of -0.09 mm. In the case when laser measures 60.61mm the measurement point of
60.60 mm is taken with machine error of 0.01 mm.
Page 98
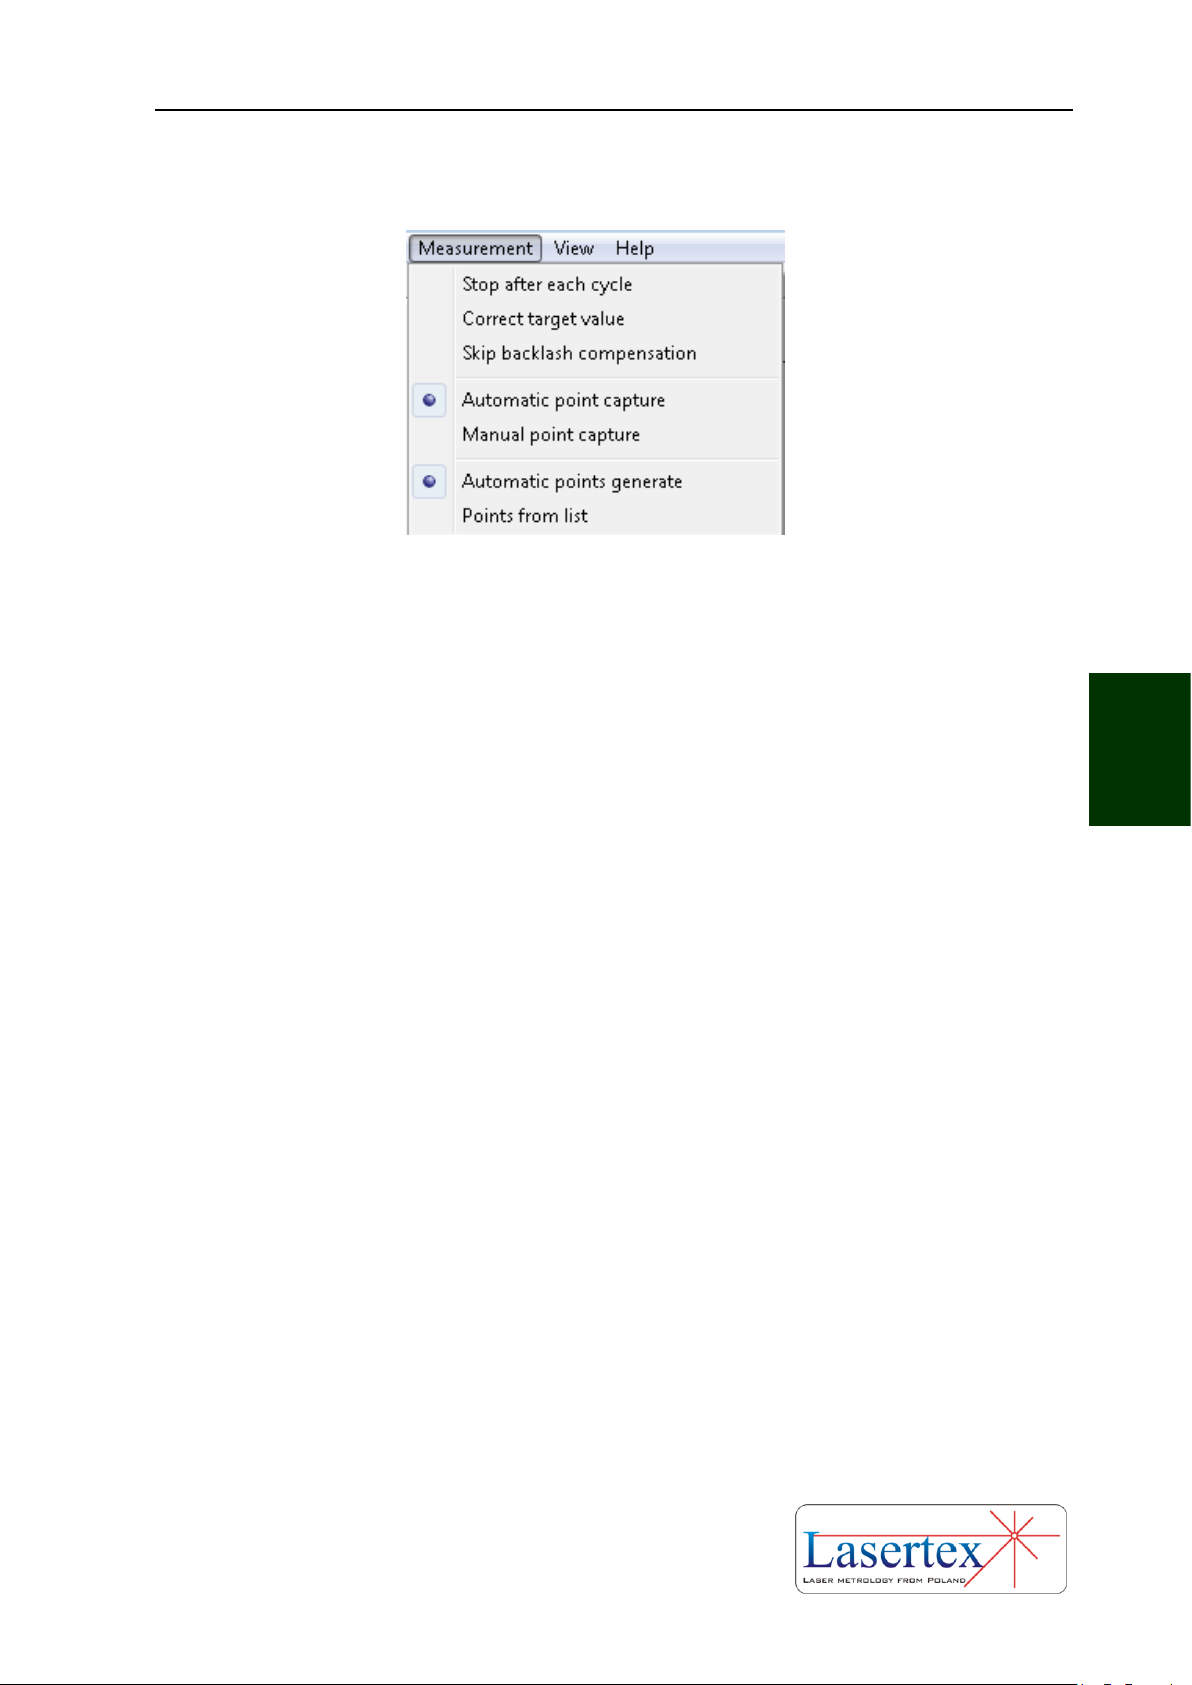
MEASUREMENTS - POSITIONING
5-28 www.lasertex.eu
5
xiii. Pull down menu – Measurement
FIG.5.26. POSITIONING PULL-DOWN MENU MEASUREMENT
Measurement menu includes the options related to the measurement process:
Stop after each cycle – if this option is active program breaks the measurement
when a measuring cycle is completed; if it is not active the configured number of
cycles is executed.
Correct target value – setting this option enables to change an earlier defined
distance value of a measuring point during the measurement process. Before the
point is captured, appears a window in which a new distance value can be written. In
the edit field there are only marked places after comma what causes that it is not
necessary to write the whole distance.
Skip backlash compensation – if checked then the software does not expect
the machine to make the backlash compensation movement (from point S to point 1
in the figures 5.21 – 5.24).
Automatic point capture – program captures measurement points
automatically using settings from Configuration. In this mode the system itself
recognizes the moment of stop, the value of target point, the direction of movement
and the series number. Option exclusive with “Manual point capture”.
Manual point capture – measured points are captured by the program when a
Manual Capture button, Space key or a remote Strobe button is pressed. Option
exclusive with “Automatic point capture”.
Automatic points generate – positioning points are calculated automatically by
the program. Points calculation is performed in first measuring cycle. Option
exclusive with “Points from list”.
Points from list – when this option is selected on the screen appears a window
for positioning points edition. This window enables to write or calculate distance
Page 99
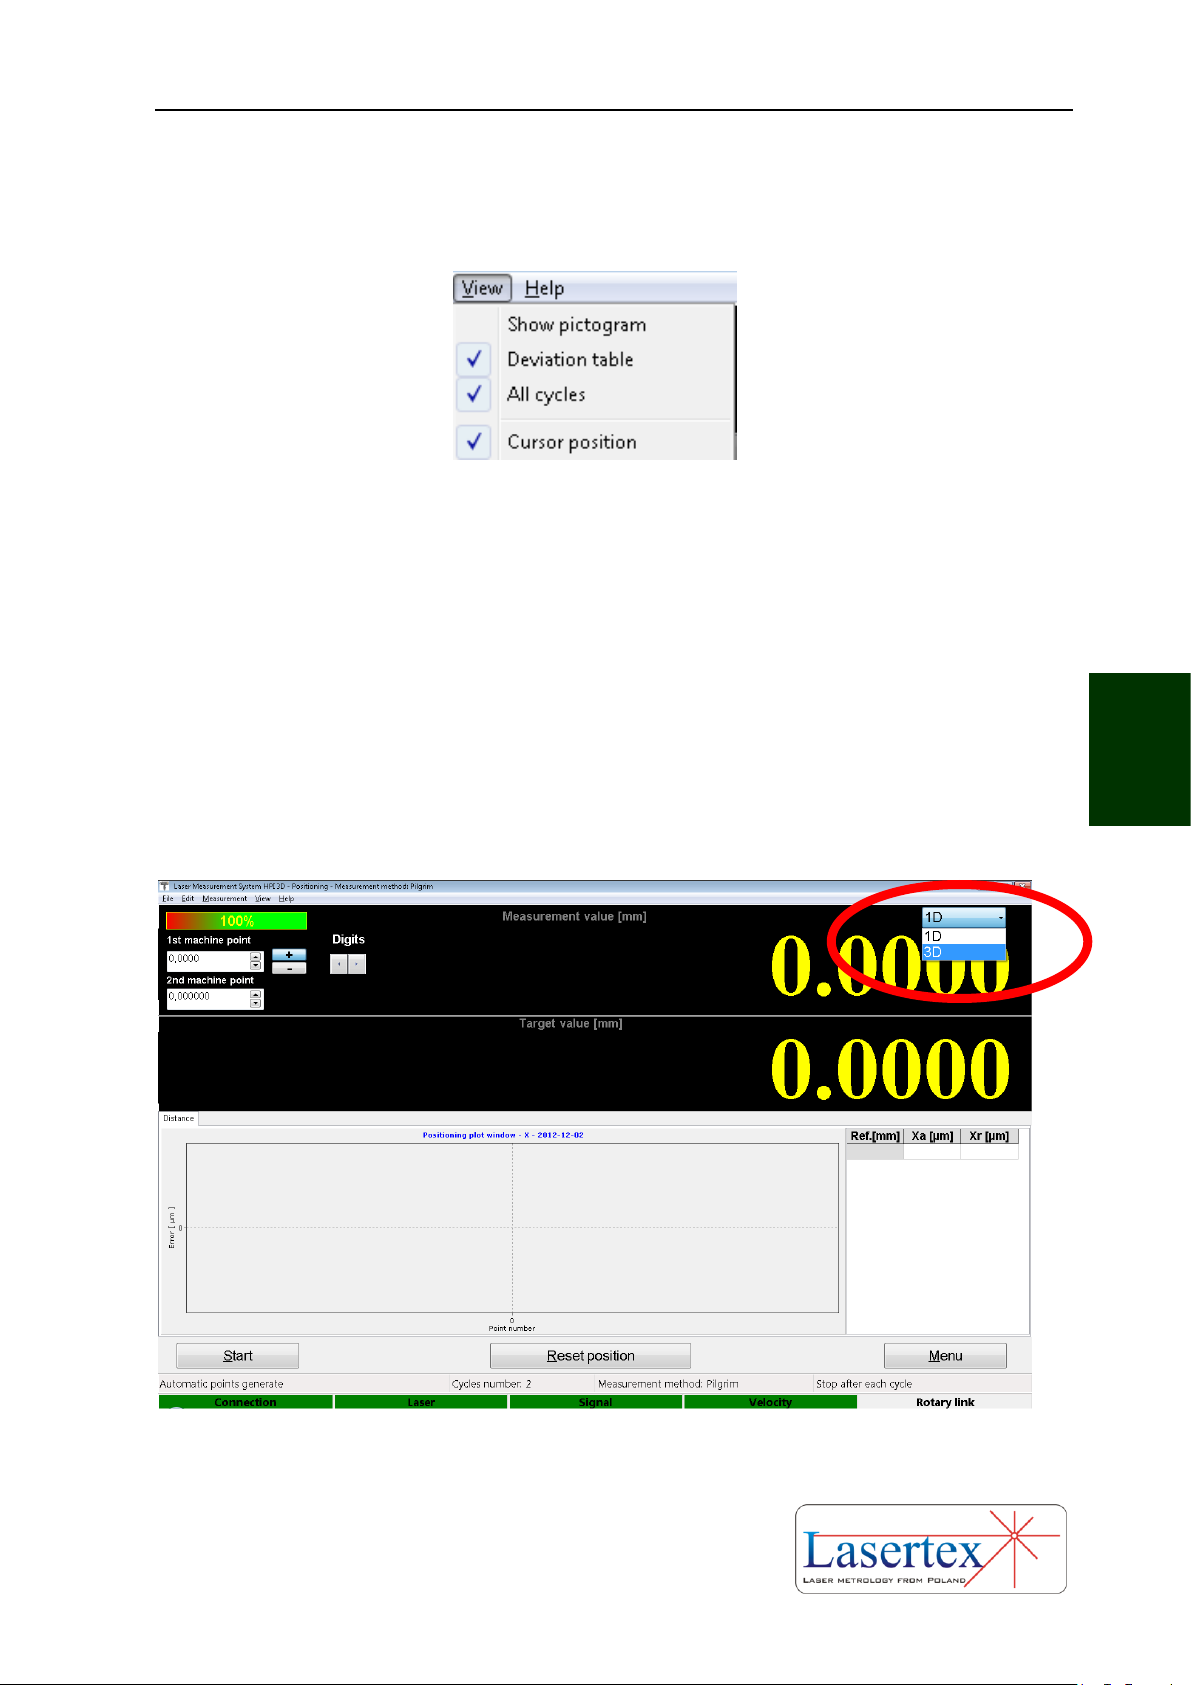
MEASUREMENTS - POSITIONING
5-29 www.lasertex.eu
5
values for positioning points which are compared to measured points during
positioning measurement. Option exclusive with “Automatic points generate”.
FIG.5.27. POSITIONING PULL-DOWN MENU VIEW
View menu is used to switch on or off a Deviation table and to switch on
drawing on the graph points from All cycles (active cycle is drawn using solid line
but remaining cycles are illustrated using only points). Show pictogram command is
used to present a schematic diagram of selected measurement method.
d. Preparations for measurement
i. Measurement window
FIG.5.28 CHOICE BETWEEN 1D AND 3D POSITIONING
Page 100
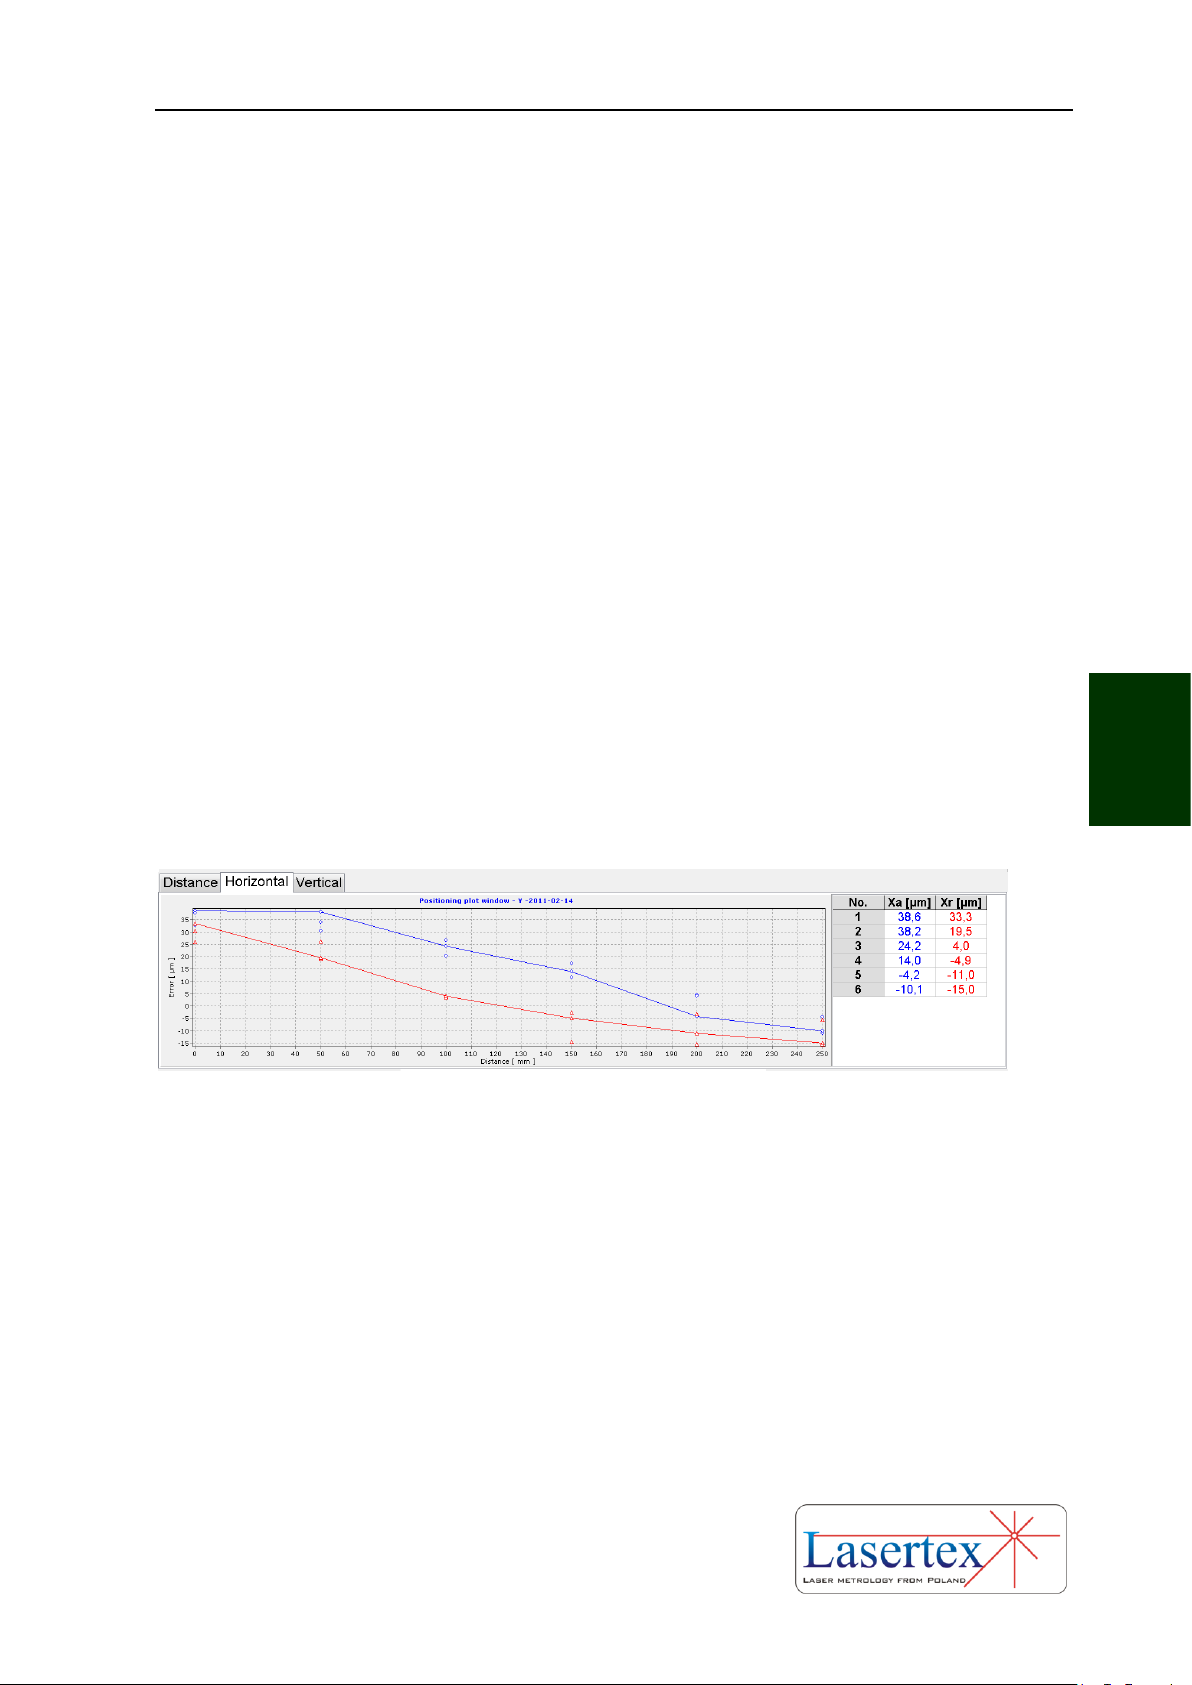
MEASUREMENTS - POSITIONING
5-30 www.lasertex.eu
5
If the system is ready to work, then two digital displays and the gauge of
measuring signal level appear on the screen. On the upper display the measured
value is shown. On the bottom display the value of the target position (read from
data points table or appointed automatically) is shown. Under the displays on the
left side there is shown a graph on which the results of measurements are shown. On
the right side an Error Table can be found. Under the graph three buttons can be
found:
Start - beginning of the measurement,
Reset Position – resetting the measured value and the button
Menu - allowing returning to the Main menu.
ii. 1D and 3D measurements
In the right upper corner of the main positioning window (see figure 5.28)
there is placed the button for choosing if the laser measures only the positioning
(“1D”) or if the 3D axes straightness is measured simultaneously (“3D”). If the “3D”
option is chosen, together with the positioning data, the straightness data in
horizontal and vertical planes are gathered.
FIG.5.29. 3D DATA BROWSING
All measured data can be browsed during measurements by changing data
panels (figure 5.29). The data from actual measurement series are shown in the table
and on the chart connected with lines. Points from previous obtained series are
visible on the chart as blue circles or red triangles.
iii. Measurements in machine coordinate system
 Loading...