

Page 1
1910-MN
2.13.12
Page 2

Page 3

CONTENTS
GENERAL INFORMATION
Packaging & Delivery ...................................................................................... 3
General Precautions ...................................................................................... 3
Safety Precautions ......................................................................................... 3
Limits of Liability ............................................................................................. 4
Warranty ......................................................................................................... 4
Register Your Meter ......................................................................................... 4
Specifi cations ................................................................................................ 5
Statistical and Technical Defi nitions ............................................................... 6
Contents and Accessories ............................................................................. 7
EPA Compliance ............................................................................................ 8
CE Compliance .............................................................................................. 8
IP 67 Certifi cation ............................................................................................ 8
CHEMICAL TESTING
Water Sampling for Chemical Analysis .......................................................... 9
Filtration ....................................................................................................... 10
An Introduction to Colorimetric Analysis ..................................................... 11
Reagent Blank ............................................................................................. 12
Colorimeter Tubes & Chamber ................................................................... 12
Meter Care .................................................................................................... 12
Selecting an Appropriate Wavelength ........................................................ 12
Calibration .................................................................................................... 13
Calibration Curves ....................................................................................... 13
Standard Additions ...................................................................................... 16
Sample Dilution & Volumetric Measurements ............................................ 17
Interferences ................................................................................................ 18
Stray Light Interference ............................................................................... 18
OPERATION OF THE SMART 3 COLORIMETER
Overview ...................................................................................................... 20
Components ................................................................................................ 20
GENERAL OPERATING PROCEDURES
The Keypad ................................................................................................. 21
Sample Holders ............................................................................................ 21
The Display & the Menus ............................................................................ 22
Looping Menus ............................................................................................. 24
TESTING
Testing Menu ............................................................................................... 25
Page 4

Test Sequences ........................................................................................... 26
General Testing Procedures ........................................................................ 26
Testing With LaMotte Pre-Programmed Tests ............................................. 27
Calibrating LaMotte Pre-Progammed Tests ................................................. 29
Measuring in the Absorbance Mode ............................................................ 34
EDITING MENU
Editing a Sequence ..................................................................................... 36
Adding a Test ............................................................................................... 38
Deleting a Test ............................................................................................... 40
Edit User Tests ............................................................................................. 42
Naming the Test ........................................................................................... 44
Selecting the Vial and Wavelength ............................................................. 47
Entering a Two Point Calibration ................................................................. 48
Entering a Multiple Point Calibration ............................................................. 52
Selecting the Numerical Format of the Result ............................................. 55
Selecting Units of Concentration ................................................................. 56
Setting the Clock .......................................................................................... 57
Logging Data ................................................................................................ 58
Factory Setup ............................................................................................... 59
Setting the Power Save Function ................................................................. 59
Setting the Backlight Time ............................................................................ 61
Selecting a Language ................................................................................... 62
COMPUTER CONNECTION
PC Link .......................................................................................................... 64
Output .......................................................................................................... 64
Computer Connection .................................................................................. 64
SMARTLink 3 ................................................................................................. 64
BATTERY
Battery/AC Operation .................................................................................... 65
Battery Replacement ..................................................................................... 65
MAINTENANCE
Cleaning ...................................................................................................... 66
Repairs .......................................................................................................... 66
Meter Disposal .............................................................................................. 66
TROUBLESHOOTING
Error Messages ............................................................................................ 67
Troubleshooting Guide ................................................................................. 67
SMART3 COLORIMETER TEST PROCEDURES
APPENDIX
Page 5

GENERAL INFORMATION
PACKAGING & DELIVERY
Experienced packaging personnel at LaMotte Company assure adequate
protection against normal hazards encountered in transportation of shipments.
After the product leaves the manufacturer, all responsibility for its safe delivery
is assured by the transportation company. Damage claims must be fi led
immediately with the transportation company to receive compensation for
damaged goods.
Should it be necessary to return the instrument for repair or servicing, pack
instrument carefully in a suitable container with adequate packing material.
A return authorization number must be obtained from LaMotte Company by
calling 1-800-344-3100 or emailing tech@lamotte.com. Attach a letter with the
authorization number to the shipping carton which describes the kind of trouble
experienced. This valuable information will enable the service department to
make the required repairs more effi ciently.
GENERAL PRECAUTIONS
Before attempting to set up or operate this instrument it is important to read the
instruction manual. Failure to do so could result in personal injury or damage to
the equipment.
The SMART3 Colorimeter should not be stored or used in a wet or corrosive
environment. Care should be taken to prevent water or reagent chemicals from
wet colorimeter tubes from entering the colorimeter chamber.
NEVER PUT WET TUBES IN COLORIMETER.
SAFETY PRECAUTIONS
Read the labels on all LaMotte reagent containers prior to use. Some containers
include precautionary notices and fi rst aid information. Certain reagents are
considered hazardous substances and are designated with a * in the instruction
manual. Material Safety Data Sheets (MSDS) can be found at www.lamotte.
com. Read the MSDS before using these reagents. Additional emergency
information for all LaMotte reagents is available 24 hours a day from the Poison
Control Center listed in the front of the phone book or by contacting the 24
hour emergency line for ChemTel 1-800-255-3924 (USA, Canada, Puerto Rico);
locations outside the North American Continent 813-248-0585 (call collect). Be
prepared to supply the name and four-digit LaMotte code number found on the
container label or at the top of the MSDS or in the contents list of the procedure.
LaMotte reagents are registered with a computerized poison control information
system available to all local poison control centers.
Keep equipment and reagent chemicals out of the reach of young children.
SMART3 Colorimeter 11.10 3
Page 6

LIMITS OF LIABILITY
Under no circumstances shall LaMotte Company be liable for loss of life,
property, profi ts, or other damages incurred through the use or misuse of its
products.
WARRANTY
LaMotte Company warrants this instrument to be free of defects in parts and
workmanship for 2 years from the date of shipment. If it should become
necessary to return the instrument for service during or beyond the warranty
period, contact our Technical Service Department at 1-800-344-3100 or
tech@lamotte.com for a return authorization number or visit www.lamotte.
com for troubleshooting help. The sender is responsible for shipping charges,
freight, insurance and proper packaging to prevent damage in transit. This
warranty does not apply to defects resulting from action of the user such
as misuse, improper wiring, operation outside of specifi cation, improper
maintenance or repair, or unauthorized modifi cation. LaMotte Company
specifi cally disclaims any implied warranties or merchantability or fi tness for
a specifi c purpose and will not be liable for any direct, indirect, incidental or
consequential damages. LaMotte Company’s total liability is limited to repair
or replacement of the product. The warranty set forth above is inclusive and no
other warranty, whether written or oral, is expressed or implied.
REGISTER YOUR METER
To register your meter with the LaMotte Service Department, go to
www.lamotte.com and choose SUPPORT on the top navigation bar.
4 SMART3 Colorimeter 02.12
Page 7

SPECIFICATIONS
INSTRUMENT TYPE: Colorimeter
Readout 160 x 100 backlit LCD, 20 x 6 line graphical display
Wavelengths 428 nm, 525 nm, 568 nm, 635 nm
Wavelength Accuracy ±2% FS
Readable Resolution Determined by reagent system
Wavelength Bandwidth 10 nm typical
Photometric Range –2 to +2 AU
Photometric Precision ± 0.001 AU at 1.0 AU
Photometric Accuracy ±0.005 AU at 1.0 AU
Sample Chamber Accepts 25 mm diameter fl at-bottomed test tubes, 10
mm square cuvettes, 16 mm COD test tubes
Light Sources 4 LEDs
Detectors 4 silicon photodiodes
Modes Pre-programmed tests, absorbance, %T
Pre-Programmed Tests YES, with automatic wavelength selection
User Defi ned Tests Up to 25 user tests can be input
Languages English, Spanish, French, Portuguese, Italian,
Chinese, Japanese
USB Port Mini B
Power Requirements USB wall adapter, USB computer connection or
lithium ion rechargeable battery
Battery Charge Life: Approximately 380 tests with backlight
on to 1000 tests with backlight off. (Signal averaging
disabled).
Battery Life: Approximately 500 charges.
Electrical Rating Provided on nameplate label
Data Logger 500 test results stored for download to a PC
Waterproof IP67 with USB port plug in place
Dimensions (LxWxH) 3.5 x 7.5 x 2.5 inches, 8.84 x 19.05 x 6.35 cm
Weight 13 oz, 362 g (meter only)
SMART3 Colorimeter 02.12 5
Page 8

STATISTICAL & TECHNICAL DEFINITIONS RELATED TO
PRODUCT SPECIFICATIONS
Method Detection Limit (MDL): “The method detection limit (MDL) is defi ned
as the minimum concentration of a substance that can be measured and
reported with 99% confi dence that the analyte concentration is greater than
zero and is determined from analysis of a sample in a given matrix containing
the analyte.”1 Note that, “As Dr. William Horwitz once stated, ‘In almost all cases
when dealing with a limit of detection or limit of determination, the primary
purpose of determining that limit is to stay away from it.’”
2
Accuracy: Accuracy is the nearness of a measurement to the accepted or true
value.3 The accuracy can be expressed as a range, about the true value, in
which a measurement occurs (i.e. ±0.5 ppm). It can also be expressed as the
% recovery of a known amount of analyte in a determination of the analyte (i.e.
103.5 %).
Resolution: Resolution is the smallest discernible difference between any
two measurements that can be made.4 For meters this is usually how many
decimal places are displayed. (i.e. 0.01). Note that the resolution many change
with concentration or range. In some cases the resolution may be less than the
smallest interval, if it is possible to make a reading that falls between calibration
marks. A word of caution, that resolution has very little relationship to accuracy
or precision. The resolution will always be less than the accuracy or precision
but it is not a statistical measure of how well a method of analysis works. The
resolution can be very, very good and the accuracy and precision can be very
bad! This is not a useful measure of the performance of a test method.
Repeatability: Repeatability is the within-run precision.5 A run is a single data
set, from set up to clean up. Generally, one run occurs on one day. However,
for meter calibrations, a single calibration is considered a single run or data set,
even though it may take 2 or 3 days.
Reproducibility: Reproducibility is the between-run precision.
6
Detection Limit (DL): The detection limit (DL) for the 2020we/wi
is defi ned as the minimum value or concentration that can be determined by the
meter, which is greater than zero, independent of matrix, glassware, and other
sample handling sources of error. It is the detection limit for the optical system of
the meter.
1
CFR 40, part 136, appendix B
2
Statistics in Analytical Chemistry: Part 7 – A Review, D. Coleman and L Vanatta,
American Laboratory, Sept 2003, P. 31.
3
Skoog, D.A., West, D. M., Fundamental of Analytical Chemistry, 2nd ed., Holt
Rinehart and Winston, Inc, 1969, p. 26.
4
Statistics in Analytical Chemistry: Part 7 – A Review, D. Coleman and L Vanatta,
American Laboratory, Sept 2003, P. 34.
6 SMART3 Colorimeter 11.10
Page 9

5
Jeffery G. H., Basset J., Mendham J., Denney R. C., Vogel’s Textbook of
Quantitative Chemical Analysis, 5th ed., Longman Scientifi c & Technical, 1989, p.
130.
6
Jeffery G. H., Basset J., Mendham J., Denney R. C., Vogel’s Textbook of
Quantitative Chemical Analysis, 5th ed., Longman Scientifi c & Technical, 1989, p.
130
CONTENTS AND ACCESSORIES
CONTENTS
SMART3 Colorimeter
Test Tubes, with Caps
COD/UDV Adapter
USB Wall Adapter
USB Cable
SMART3 Colorimeter Quick Start Guide
SMART3 Colorimeter Manual
ACCESSORIES
Test Tubes, with Caps Code 0290-6
Replacement Chamber Code 3-0038
USB Cable Code 1720
USB Wall Adapter Code 1721
COD/UDV Adapter Code 1724
Car Charger Code 5-0132
SMARTLink3 Program (CD) Code 1901-CD
Small Field Carrying Case
Code 1910-GCS150
(37.5 27.5 x 13.75 cm)
Large Field Carrying Case
Code 1910-GCS440
(45 x 32.5 x 20 cm)
SMART3 Colorimeter 02.12 7
Page 10

EPA COMPLIANCE
The SMART3 Colorimeter is an EPA-Accepted instrument. EPA-Accepted
means that the instrument meets the requirements for instrumentation as found
in test procedures that are approved for the National Primary Drinking Water
Regulations (NPDWR) or National Pollutant Discharge Elimination System
(NPDES) compliance monitoring programs. EPA-Accepted instruments may be
used with approved test procedures without additional approval.
CE COMPLIANCE
The SMART3 Colorimeter has earned the European CE Mark of Compliance for
electromagnetic compatibility and safety. The Declaration of Conformity for the
SMART3 colorimeter is available at www.lamotte.com.
IP67 CERTIFICATION
The SMART3 meets IP67 standards for protection against dust and immersion
only when the USB port plug is in place. Documentation is available at www.
lamotte.com.
8 SMART3 Colorimeter 11.10
Page 11

CHEMICAL TESTING
WATER SAMPLING FOR CHEMICAL ANALYSIS
Taking Representative Samples
The underlying factor to be considered for any type of water sampling is whether
or not the sample is truly representative of the source. To properly collect a
representative sample:
• Sample as frequently as possible.
• Collect a large sample or at least enough to conduct whatever tests are
necessary.
• Make a composite sample for the same sampling area.
• Handle the sample in such a way as to prevent deterioration or
contamination before the analysis is performed.
• Perform analysis for dissolved gases such as dissolved oxygen, carbon
dioxide, and hydrogen sulfi de immediately at the site of sampling. Samples
for testing these factors, as well as samples for pH, cannot be stored for
later examination.
• Make a list of conditions or observations which may affect the sample.
Other considerations for taking representative samples are dependent
upon the source of the sample. Taking samples from surface waters
involves different considerations than taking samples from impounded and
sub-surface waters.
Sampling of Open Water Systems
Surface waters, such as those found in streams and rivers, are usually well
mixed. The sample should be taken downstream from any tributary, industrial
or sewage pollution source. For comparison purposes samples may be taken
upstream and at the source of the pollution before mixing.
In ponds, lakes, and reservoirs with restricted fl ow, it is necessary to collect a
number of samples in a cross section of the body of water, and where possible
composite samples should be made to ensure representative samples.
To collect samples from surface waters, select a suitable plastic container with
a tight fi tting screw cap. Rinse the container several times with the sample
to be tested, then immerse the container below the surface until it is fi lled to
overfl owing and replace the cap. If the sample is not to be tested immediately,
pour a small part of the sample out and reseal. This will allow for any expansion.
Any condition which might affect the sample should be listed.
Sub-surface sampling is required to obtain a vertical profi le of streams, lakes,
ponds, and reservoirs at specifi c depths. This type of sampling requires more
sophisticated sampling equipment.
For dissolved oxygen studies, or for tests requiring small sample sizes, a Water
SMART3 Colorimeter 11.10 9
Page 12

Sampler (LaMotte Code 1060) will serve as a subsurface or in-depth sampler.
This weighted device is lowered to the sampling depth and allowed to rest at
this depth for a few minutes. The water percolates into the sample chamber
displacing the air which bubbles to the surface. When the bubbles cease to rise,
the device has fl ushed itself approximately fi ve times and it may be raised to
the surface for examination. The inner chamber of the sampling device is lifted
out and portions of the water sample are carefully dispensed for subsequent
chemical analysis.
A Snap-Plunger Water Sampler (LaMotte Code 1077) is another “in-depth”
sampling device which is designed to collect large samples which can be used
for a multitude of tests. Basically, this collection apparatus is a hollow cylinder
with a spring loaded plunger attached to each end. The device is cocked
above the surface of the water and lowered to the desired depth. A weighted
messenger is sent down the calibrated line to trip the closing mechanism
and the plungers seal the sample from mixing with intermediate layers as it is
brought to the surface. A special drain outlet is provided to draw off samples for
chemical analysis.
Sampling of Closed System
To obtain representative samples from confi ned water systems, such as
pipe lines, tanks, vats, fi lters, water softeners, evaporators and condensers,
different considerations are required because of chemical changes which occur
between the inlet and outlet water. One must have a basic understanding of the
type of chemical changes which occur for the type of equipment used. Also,
consideration should be given to the rate of passage and retaining time for the
process water.
Temperature changes play an important part in deciding exactly what test
should be performed. Process water should be allowed to come to room
temperature, 20–25°C, before conducting any tests.
When drawing off samples from an outlet pipe such as a tap, allow sample to
run for several minutes, rinsing the container several times before taking the fi nal
sample. Avoid splashing and introduction of any contaminating material.
FILTRATION
When testing natural waters that contain signifi cant turbidity due to suspended
solids and algae, fi ltration is an option. Reagent systems, whether EPA,
Standard Methods, LaMotte or any others, will generally only determine
dissolved constituents. Both EPA and Standard Methods suggest fi ltration
through a 0.45 micron fi lter membrane, to remove turbidity, for the determination
of dissolved constituents.** To test for total constituents, organically bound and
suspended or colloidal materials, a rigorous high temperature acid digestion is
necessary.
**LaMotte offers a fi ltering apparatus: syringe assembly (Code 1050) and
membrane fi lters, 0.45 micron, (Code 1103).
10 SMART3 Colorimeter 11.10
Page 13

AN INTRODUCTION TO COLORIMETRIC ANALYSIS
Most test substances in water are colorless and undetectable to the human
eye. To test for their presence we must fi nd a way to “see” them. The SMART3
Colorimeter can be used to measure any test substance that is itself colored or
can be reacted to produce a color. In fact a simple defi nition of colorimetry is
“the measurement of color” and a colorimetric method is “any technique used
to evaluate an unknown color in reference to known colors”. In a colorimetric
chemical test the intensity of the color from the reaction must be proportional
to the concentration of the substance being tested. Some reactions have
limitations or variances inherent to them that may give misleading results. Many
such interferences are discussed with each particular test instruction. In the
most basic colorimetric method the reacted test sample is visually compared to
a known color standard. However, accurate and reproducible results are limited
by the eyesight of the analyst, inconsistencies in the light sources, and the
fading of color standards.
To avoid these sources of error, a colorimeter can be used to photoelectrically
measure the amount of colored light absorbed by a colored sample in reference
to a colorless sample (blank).
White light is made up of many different colors or wavelengths of light. A
colored sample typically absorbs only one color or one band of wavelengths
from the white light. Only a small difference would be measured between white
light before it passes through a colored sample versus after it passes through
a colored sample. The reason for this is that the one color absorbed by the
sample is only a small portion of the total amount of light passing through the
sample. However, if we could select only that one color or band of wavelengths
of light to which the test sample is most sensitive, we would see a large
difference between the light before it passes through the sample and after it
passes through the sample.
The SMART3 Colorimeter passes one of four colored light beams through
one of four optical fi lters which transmits only one particular color or band
of wavelengths of light to the photodectector where it is measured. The
difference in the amount of colored light transmitted by a colored sample is a
measurement of the amount of colored light absorbed by the sample. In most
colorimetric tests the amount of colored light absorbed is directly proportional
to the concentration of the test factor producing the color and the path length
through the sample. However, for some tests the amount of colored light
absorbed is inversely proportional to the concentration.
The choice of the correct wavelength for testing is important. It is interesting to
note that the wavelength that gives the most sensitivity (lower detection limit)
for a test factor is the complementary color of the test sample. For example the
Nitrate-Nitrogen test produces a pink color proportional to the nitrate-nitrogen
concentration in the sample (the greater the nitrate-nitrogen concentration, the
darker the pink color). A wavelength in the green region should be selected to
analyze this sample since a pinkish-red solution absorbs mostly green light.
SMART3 Colorimeter 11.10 11
Page 14

REAGENT BLANK
Some tests will provide greater accuracy if a reagent blank is determined to
compensate for any color or turbidity resulting from the reagents themselves. A
reagent blank is performed by running the test procedure on demineralized or
deionized water. Use sample water to SCAN BLANK. Insert the reacted reagent
blank in the colorimeter chamber and select SCAN SAMPLE. Note result of
reagent blank. Perform the tests on the sample water as described. Subtract
results of reagent blank from all subsequent test results. NOTE: Some tests
require a reagent blank to be used to SCAN BLANK.
COLORIMETER TUBES AND CHAMBER
Colorimeter tubes and colorimeter chambers which have been scratched
through excessive use should be discarded and replaced with new ones. Dirty
tubes should be cleaned on both the inside and outside. Fingerprints on the
exterior of the tubes can cause excessive light scattering and result in errors.
Handle the tubes carefully, making sure the bottom half of the tube is not
handled.
LaMotte Company makes every effort to provide high quality colorimeter tubes.
However, wall thicknesses and diameter of tubes may still vary slightly. This may
lead to slight variations in results (e.g. if a tube is turned while in the sample
chamber, the reading will likely change slightly). To eliminate this error put the
tubes into the sample chamber with the same orientation every time.
The tubes that are included with the colorimeter have an index mark to facilitate
this. If possible, use the same tube to SCAN BLANK and SCAN SAMPLE.
METER CARE
The optical system of the SMART3 must be kept clean and dry for optimal
performance. Dry the colorimeter tubes before placing them in the chamber to
avoid introducing moisture. For best results store the instrument in a area that is
dry and free from aggressive chemical vapors.
SELECTING AN APPROPRIATE WAVELENGTH
The most appropriate wavelength to use when creating a calibration curve
is usually the one which gives the greatest change from the lowest reacted
standard concentration to the highest reacted standard concentration. However,
the absorbance of the highest reacted standard concentration should never
be greater than 2.0 absorbance units. Scan the lowest and highest reacted
standards at different wavelengths using the absorbance mode to fi nd the
wavelength which gives the greatest change in absorbance without exceeding
2.0 absorbance units. Use this wavelength to create a calibration curve.
12 SMART3 Colorimeter 02.12
Page 15

Below is a list of suggested wavelengths for the color of the reacted samples.
Use these as a starting point.
Sample Color Wavelength Range
Yellow 428
Pink 525
Red 568
Green and Blue 635
CALIBRATION
As with all pre-calibrated meters, it is highly recommended, even if not required
by regulations, that the user periodically verify the performance of the meter
by running standards with a predetermined concentration. Results outside of
specifi cation are an indication that the meter needs to be adjusted. This can be
done following the user calibration described on page 28. If the user calibration
fails to properly adjust the meter then the meter should be returned to LaMotte
Company for recalibration. (See page 65).
CALIBRATION CURVES
The SMART3 Colorimeter contains tests for the LaMotte reagent systems. The
fi rst step in using a non-LaMotte reagent system with your SMART3 Colorimeter
is to create a calibration curve for the reagent system. To create a calibration
curve, prepare standard solutions of the test factor and use the reagent system
to test the standard solutions with the SMART3 Colorimeter. Select a wavelength
for the test as described above.
Plot the results (in ABS or %Transmittance) versus concentration to create
a calibration curve. The calibration curve may then be used to identify the
concentration of an unknown sample by testing the unknown, reading
Absorbance or %T, and fi nding the corresponding concentration from the curve.
The linear range of the reagent system can be determined and this information
can be used to input a User Test into the SMART3 Colorimeter (see Edit User
Tests, page 41).
PROCEDURE
Prepare 5 or 6 standard solutions of the factor being tested. The concentration
of these standards should be evenly distributed throughout the range of the
reagent system, and should include a 0 ppm standard (distilled water). For
instance, the solutions could measure 0, 10%, 30%, 50%, 70%, and 90% of the
system’s maximum range.
1. Turn on the SMART3 Colorimeter. Select the appropriate wavelength from the
absorbance mode. Be sure to select the appropriate wavelength for the color
produced by the reagent system.
2. Use the unreacted 0 ppm standard to standardize the colorimeter by using it
SMART3 Colorimeter 11.10 13
Page 16
to scan blank.
3. Following the individual reagent system instructions, react each standard
solution beginning with 0 ppm. Continue with standards in increasing
concentration. Record the reading and the standard solution concentration
on a chart. Readings can be recorded as percent transmittance (%T) or
absorbance (A).
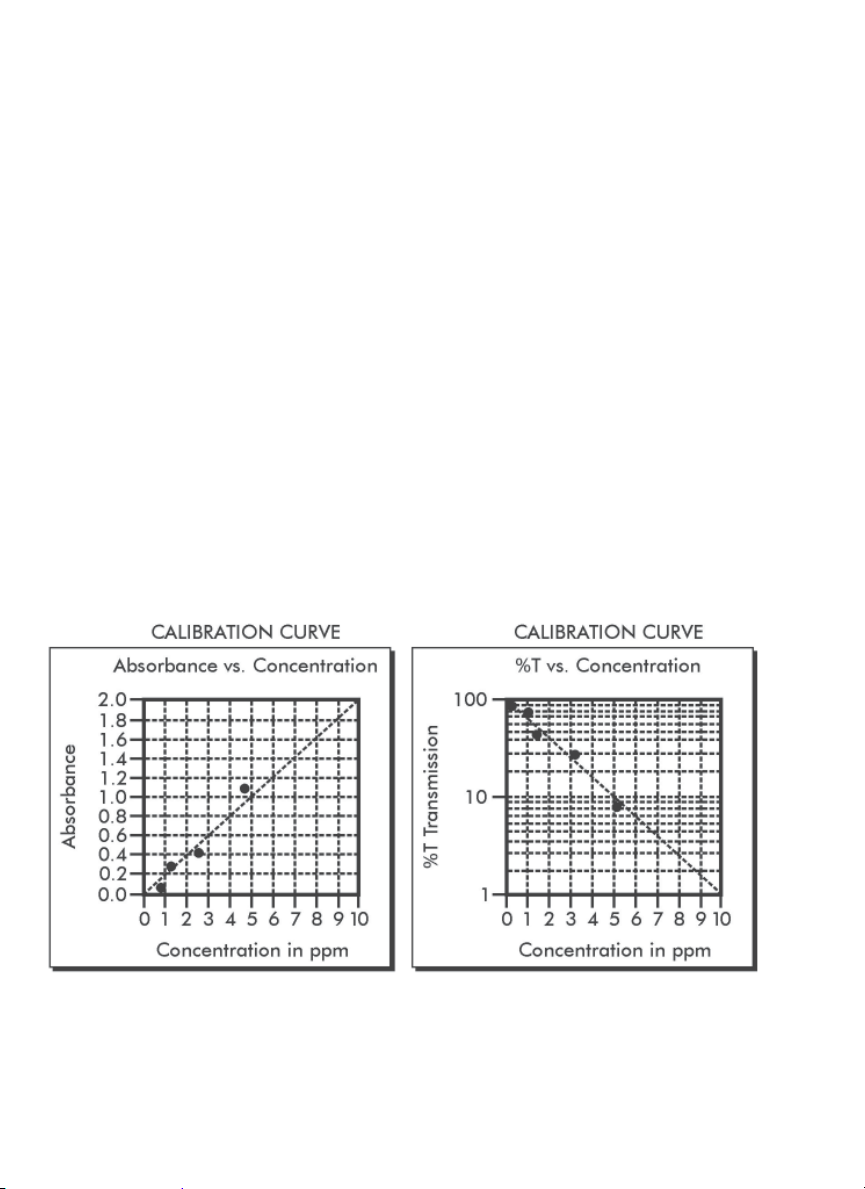
4. Plot results on graph paper or computer using any available plotting
program. If results are as %T versus concentration, semilog graph paper
must be used. Plot the standard solution concentrations on the horizontal,
linear axis, and the %T on the vertical, logarithmic axis. If results are as
absorbance versus standard solution concentration, simple linear graph
paper can be used. Plot the standard solution concentration on the
horizontal axis, and the absorbance on the vertical axis.
5. After plotting the results, draw a line, or curve, of best fi t through the
plotted points. The best fi t may not connect the points. There should be
approximately an equal number of points above the curve as below the
curve. Some reagent systems will produce a straight line, while others
produce a curve. Many computer spreadsheet programs can produce the
curve of best fi t by regression analysis of the standard solution data.
NOTE: Only reagent systems which produce a straight line can be used for a
User Test.
A sample of each type of graph appears below:
14 SMART3 Colorimeter 11.10
Page 17
PREPARING DILUTE STANDARD SOLUTIONS
Standard solutions should be prepared to create a calibration curve. Standard
solutions can be prepared by diluting a known concentrated standard by
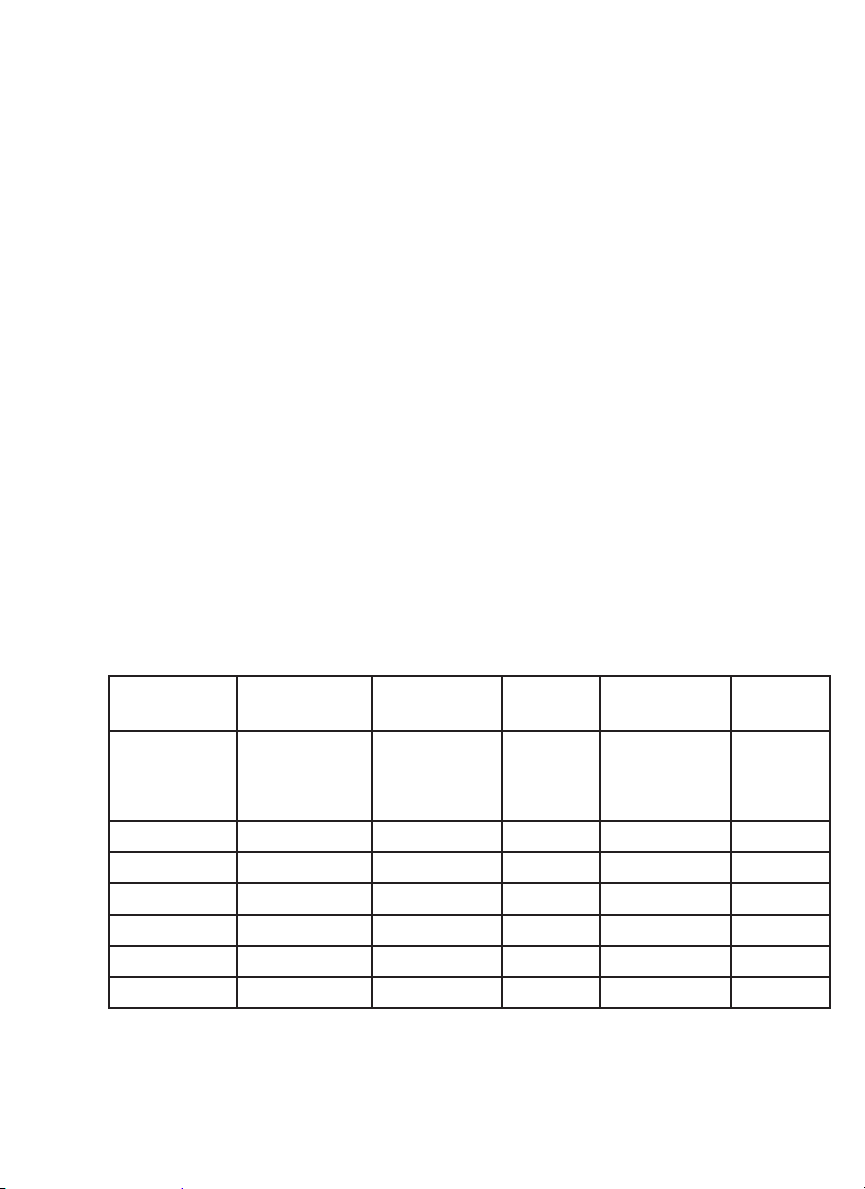
specifi ed amounts. A chart or computer spreadsheet can be created to
determine the proper dilutions. Use volumetric fl asks and volumetric pipets for
all dilutions.
1. In Column A – Record the maximum concentration of test as determined by
the range and path length.
2. In Column B – Record the percent of the maximum concentration the
standard solution will be.
3. In Column C – Calculate the fi nal concentration of the diluted standard
solutions by multiplying the maximum concentration (In Column A) by the %
of maximum concentration divided by 100. (C = A x
4. In Column D – Record the fi nal volume of the diluted sample (i.e. volume of
volumetric fl ask).
5. In Column E – Record the concentration of the original standard.
6. In Column F – Calculate the milliliters of original standard required (F = (C x
D
/E)).
B
/
).
100
A sample chart appears below:
A B C =
Maximum
concentration
of test
% of Maximum
concentration
A x B/
concentration
of Diluted
Standard
Final
100
D E F =
Volume of
Standard
Concentration
of Original
Standard
C x D/E
mL of
Original
Standard
Required
10.0 ppm 90 9.0 ppm 100 mL 1000 ppm 0.90 mL
10.0 ppm 70 7.0 ppm 100 mL 1000 ppm 0.70 mL
10.0 ppm 50 5.0 ppm 100 mL 1000 ppm 0.50 mL
10.0 ppm 30 3.0 ppm 100 mL 1000 ppm 0.30 mL
10.0 ppm 10 1.0 ppm 100 mL 1000 ppm 0.10 mL
10.0 ppm 0 0 ppm 100 mL 1000 ppm 0 mL
SMART3 Colorimeter 11.10 15
Page 18

STANDARD ADDITIONS
A common method to check the accuracy and precision of a test is by standard
additions. In this method a sample is tested to determine the concentration
of the test substance. A second sample is then “spiked” by the addition of a
known quantity of the test substance. The second sample is then tested. The
determined concentration of the spiked sample should equal the concentration
of the fi rst plus the amount added with the spike. The procedure can be
repeated with larger and larger “spikes.” If the determined concentrations do not
equal the concentration of the sample plus that added with the “spike”, then an
interference may exist.
For example, a 10.0 mL water sample was determined to contain 0.3 ppm iron.
To a second 10.0 mL sample, 0.1 mL of 50 ppm iron standard was added. The
concentration of iron due to the “spike” was (0.10 mL x 50 ppm)/10.0 mL = 0.50
ppm. The concentration of iron determined in the spiked sample should be 0.3
+ 0.5 = 0.8 ppm iron. (Note: any error due to the increased volume from the
“spike” is negligible).
LaMotte offers a line of calibration standards which can be used to generate
calibration curves and perform standard additions.
16 SMART3 Colorimeter 11.10
Page 19
SAMPLE DILUTION TECHNIQUES & VOLUMETRIC
MEASUREMENTS
If a test result using the SMART3 Colorimeter gives an over range message
then the the sample must be diluted. The test should be repeated on the diluted
sample to obtain a reading which is in the concentration range for the test.
(Note: This is not true for colorimetric determination of pH.)
Example:
Measure 5 mL of the water sample into a graduated cylinder. Add
demineralized water until the cylinder is fi lled to the 10 mL line. The sample
has been diluted by one-half, and the dilution factor is therefore 2. Perform
the test procedure, then multiply the resulting concentration by 2 to obtain
the test result.
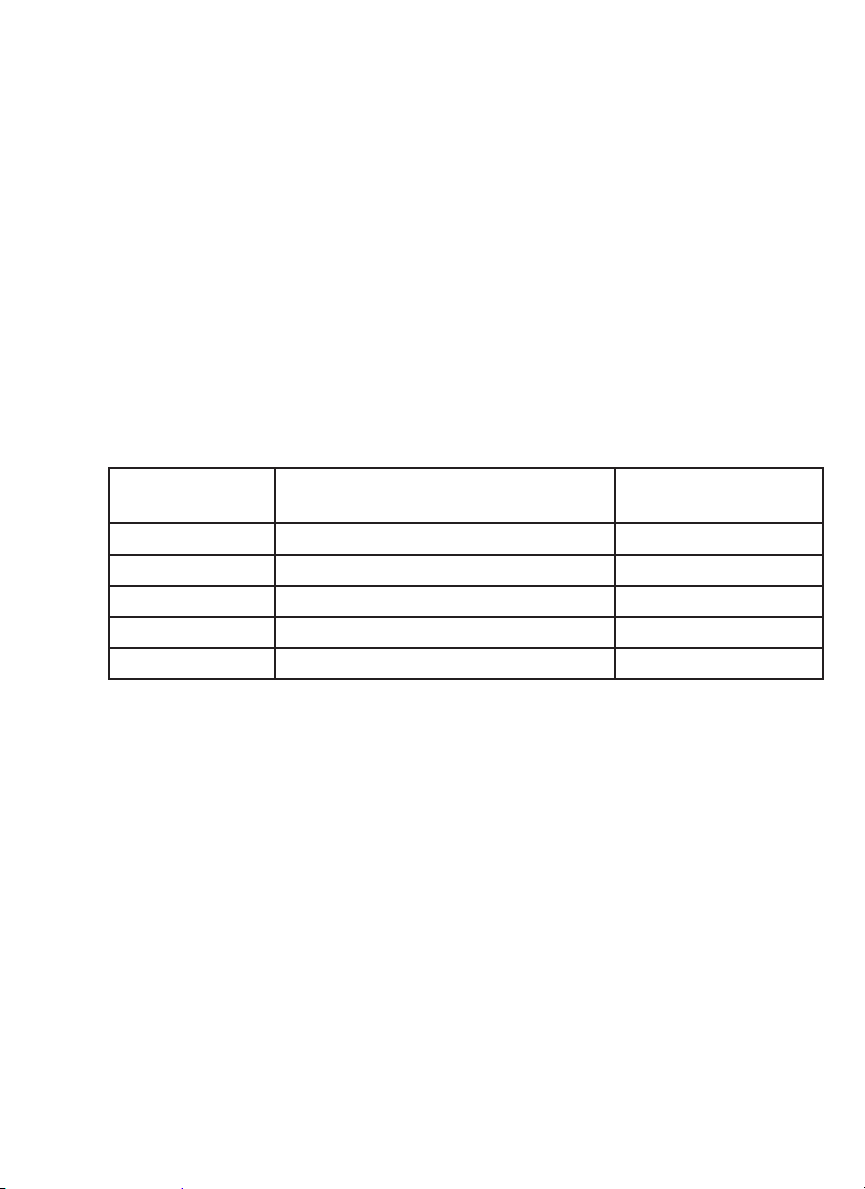
The following table gives quick reference guidelines on dilutions of various
proportions. All dilutions are based on a 10 mL volume, so several dilutions will
require small volumes of the water sample. Graduated pipets should be used for
all dilutions.
Deionized Water to
Size of Sample
10 mL 0 mL 1
5 mL 5 mL 2
2.5 mL 7.5 mL 4
1 mL 9 mL 10
0.5 mL 9.5 mL 20
Bring Volume to 10 mL Multiplication Factor
If the above glassware is not available, dilutions can be made with the
colorimeter tube. Fill the tube to the 10 mL line with the sample then transfer
it to another container. Add 10 mL volumes of demineralized water to the
container and mix. Transfer back 10 mL of the diluted sample to the tube and
follow the test procedure. Continue diluting and testing until a reading, which
is in the concentration range for the test, is obtained. Be sure to multiply the
concentration found by the dilution factor (the number of total 10 mL volumes
used).
Example:
10 mL of sample is diluted with three 10 mL volumes of demineralized water;
the dilution factor is four.
SMART3 Colorimeter 11.10 17
Page 20

INTERFERENCES
LaMotte reagent systems are designed to minimize most common interferences.
Each individual test instruction discusses interferences unique to that test. Be
aware of possible interferences in the water being tested.
The reagent systems also contain buffers to adjust the water sample to the ideal
pH for the reaction. It is possible that the buffer capacity of the water sample
may exceed the buffer capacity of the reagent system and the ideal pH will not
be obtained. If this is suspected, measure the pH of a reacted distilled water
reagent blank using a pH meter. This is the ideal pH for the test. Measure the pH
of a reacted water sample using the pH meter. If the pH is signifi cantly different
from the ideal value, the pH of the sample should be adjusted before testing.
Interferences due to high concentration of the substance being tested, can be
overcome by sample dilution (see page 16)
STRAY LIGHT INTERFERENCE
When scanning samples in 16 mm tubes, such as COD, the sample chamber
lid can not be closed. The COD adapter minimizes stray light. To further reduce
stray light interference, do not scan sample in direct sunlight.
18 SMART3 Colorimeter 11.10
Page 21

OPERATION OF THE
SMART3 COLORIMETER
OVERVIEW
The SMART3 is a portable, microprocessor controlled, direct reading
colorimeter. It has a graphical liquid crystal display and 6 button keypad. These
allow the user to select options from the menu driven software, to directly read
test results or to review stored results of previous tests in the data logger. The
menus can be displayed in seven different languages.
The test library consists of over 80 LaMotte tests and 25 “User Tests”. The
LaMotte tests are precalibrated for LaMotte reagent systems.The colorimeter
displays the result of these tests directly in units of concentration. The 25 “User
Tests” may be used to enter additional calibrations. All of these tests may be
arranged in any of 3 sequences. These sequences can be modifi ed a limitless
number of times to meet changing testing needs.
The optics feature 4 different colored LEDs. Each LED has a corresponding
silicon photoiode with an integrated interference fi lter. The interference fi lters
select a narrow band of light from the corresponding LED for the colorimetric
measurements. The microporcessor automatically selects the correct LED/
photodiode combination for the test.
A USB wall adapter, USB computer connection or lithium battery powers the
SMART3.
A USB port on the back of the meter allows an interface of the meter with a
Windows-based computer for real-time data acquisition and data storage using
a PC. The SMART3 may be interfaced with any Windows-based computer by
using the LaMotte SMARTLink3 Program.
SMART3 Colorimeter 11.10 19
Page 22
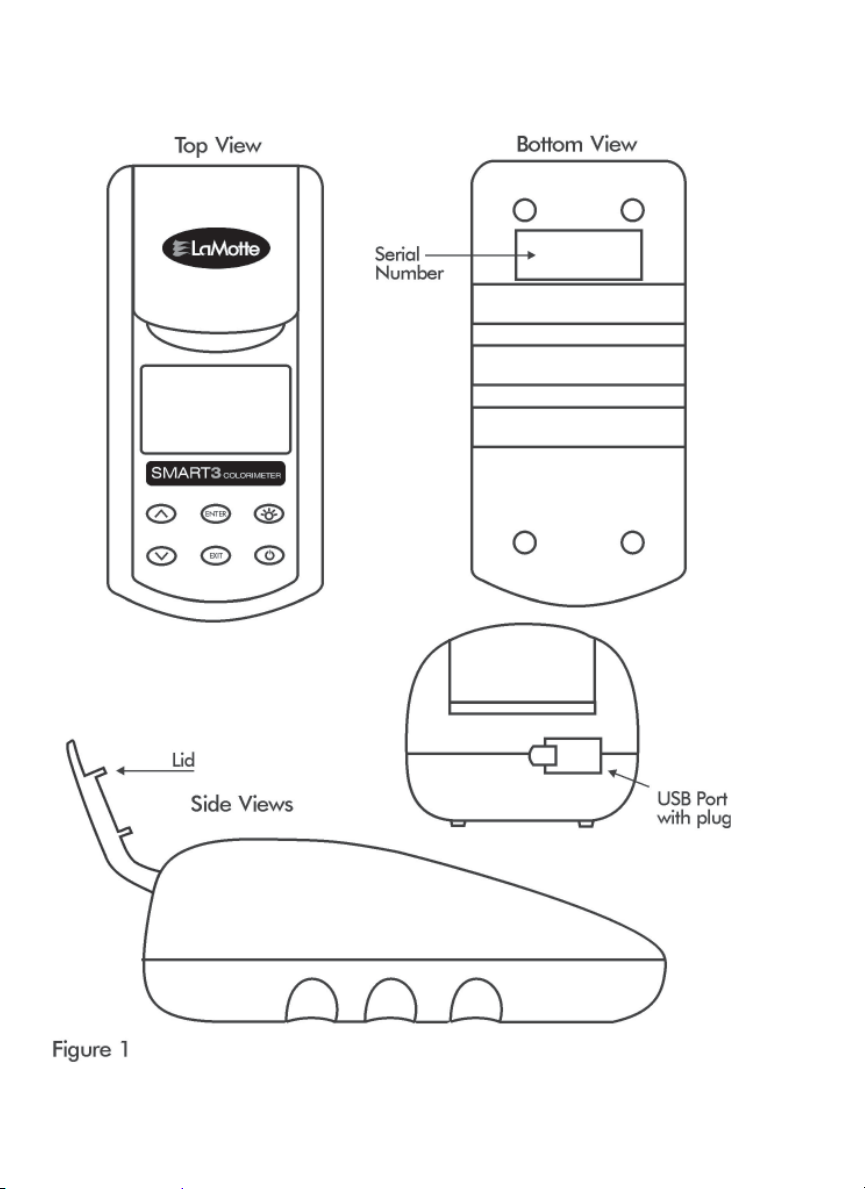
COMPONENTS
Figure 1 shows a diagram of the SMART3 Colorimeter and its components.
20 SMART3 Colorimeter 11.10
Page 23
GENERAL OPERATING PROCEDURES
The operation of the SMART3 Colorimeter is controlled by a microprocessor.
The microprocessor is programmed with menu driven software. A menu is
a list of choices. This allows a selection of various tasks for the colorimeter
to perform, such as, scan blank, scan sample, and edit test sequences. The
keypad is used to make menu selections which are viewed in the display. There
are three selections accessible from the Main Menu: Testing Menu, Editing
Menu and Run PC Link.
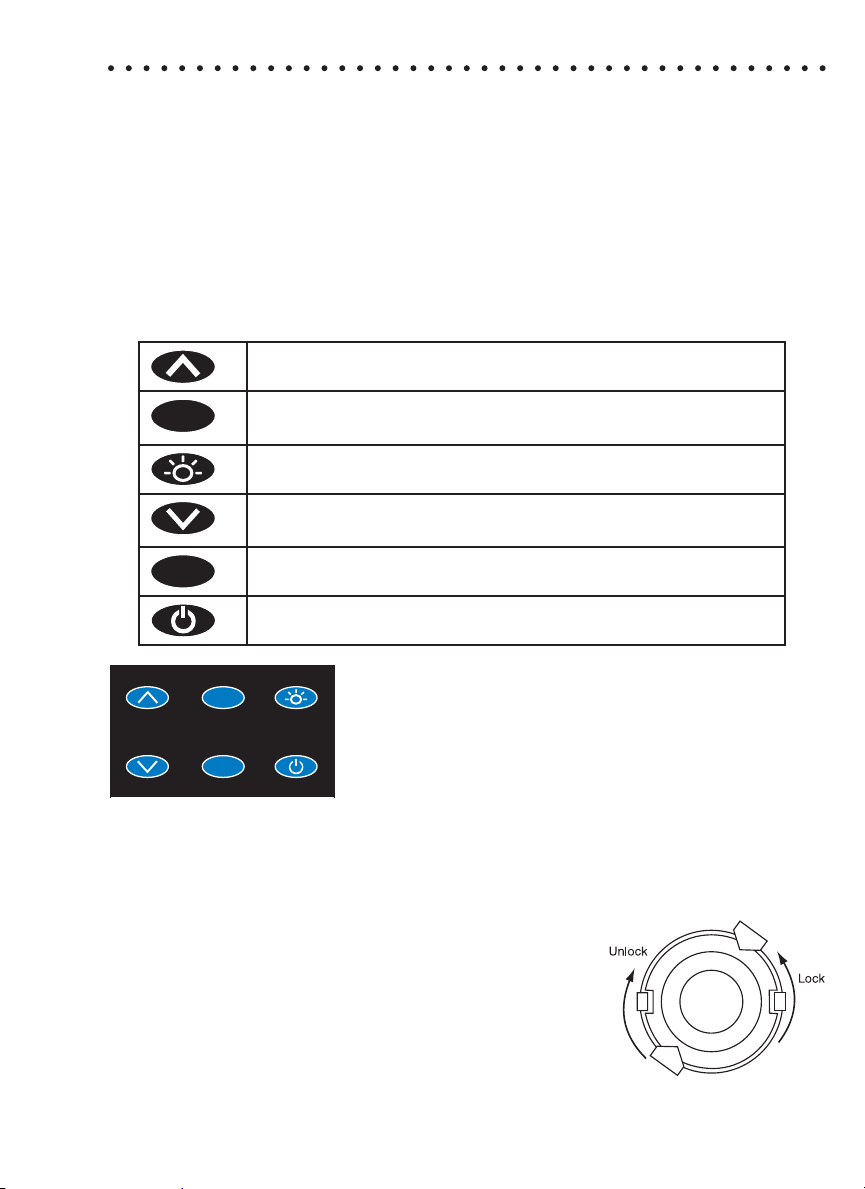
THE KEYPAD
The keypad has 6 buttons which are used to perform specifi c tasks.
This button will scroll up through a list of menu selections.
ENTER
The button is used to select choices in a menu viewed in
the display.
This button controls the backlight on the display.
This button will scroll down through a list of menu
selections.
EXIT
This button exits to the previous menu.
This button turns the meter on or off.
ENTER
EXIT
SAMPLE HOLDERS
The sample chamber is designed for 25 mm round tubes. An adapter to hold 16
mm COD tubes and 1 cm square UDV cuvettes is included.
Position the COD/UDV Adapter (Code 1724) so that
the notches in the adapter fi t around the posts on
the chamber. Turn the adapter counterclockwise until
the arrows are at the top and bottom of the chamber
and the adapter is locked into place. Turn the adapter
clockwise to unlock the adapter and remove it from
the chamber.
SMART3 Colorimeter 11.10 21
Page 24
THE DISPLAY & THE MENUS
The display allows menu selections to be viewed and selected. These selections
instruct the SMART3 to perform specifi c tasks. The menus are viewed in the
display using two general formats that are followed from one menu to the next.
Each menu is a list of choices or selections.
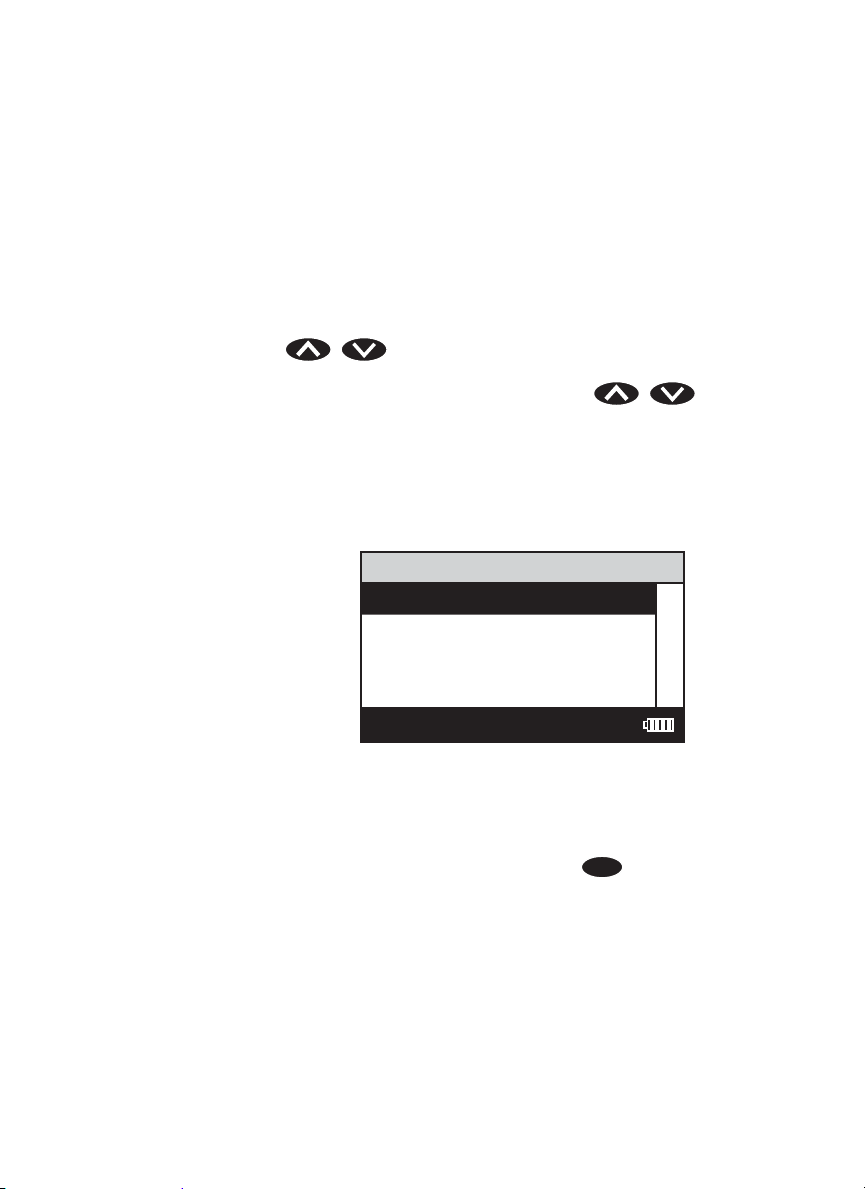
The display has a header line at the top and a footer line at the bottom. The
header displays the title of the current menu. The footer line displays the time
and the date, the data logger status and the battery status. The menu selection
window is in the middle of the display between the header and the footer.
The menu selection window displays information in two general formats. In the
fi rst format only menu selections are displayed. Up to 4 lines of menu selections
may be displayed. If more selections are available they can be viewed by
pressing the arrow buttons
the menu selection window. Think of the menu selections as a vertical list in
the display that moves up or down each time an arrow button is
pressed. Some menus in the SMART3 are looping menus. The top and bottom
menu choices are connected in a loop. Scrolling down past the bottom of the
menu will lead to the top of the menu. Scrolling up past the top of the menu will
lead to the bottom of the menu.
Main Window Selection First Choice
to scroll the other menu selections into
Header Menu Title
Second Choice
Third Choice
Another
Footer
12:00:00 001/500
And Another
And So On
A black bar will indicate the menu choice. As the menu is scrolled through, the
black bar will highlight different menu choices. Pressing the
ENTER
button will
select the menu choice that is indicated by the black bar.
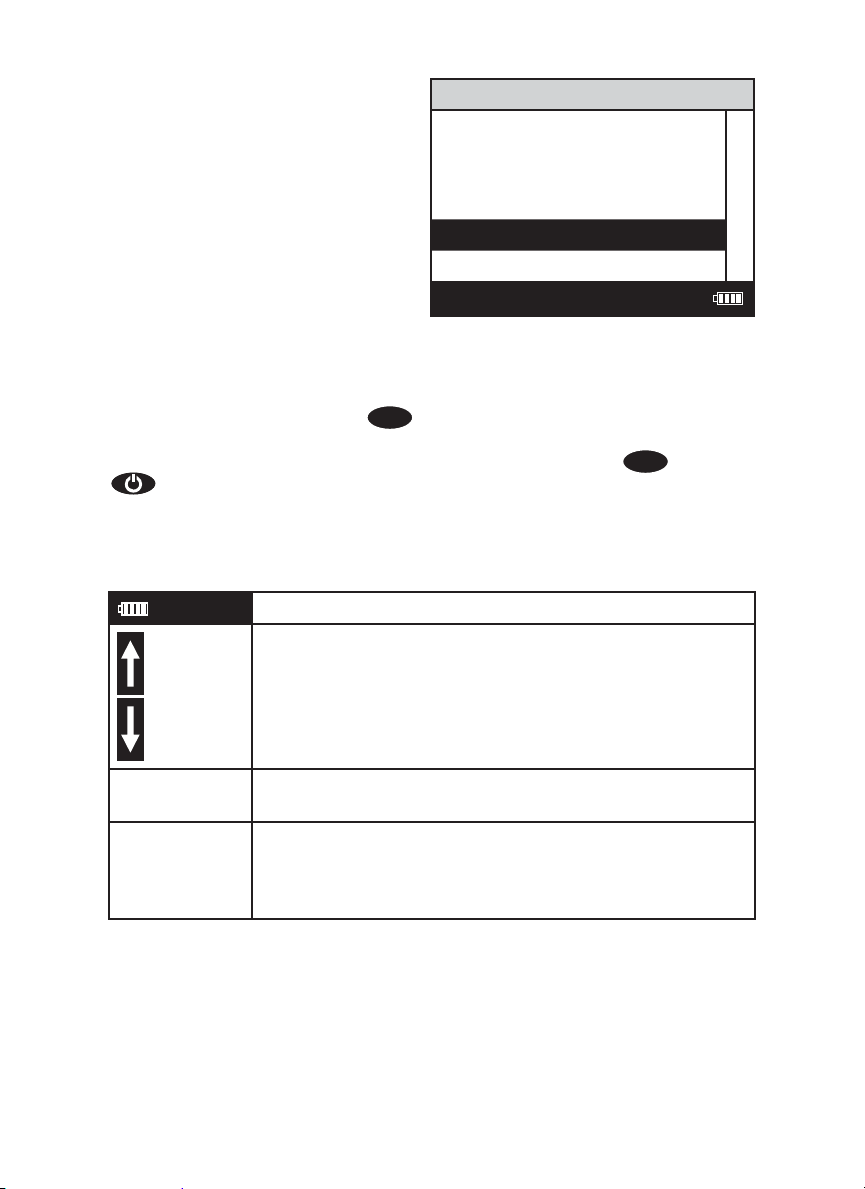
In the second format the menu choice window takes advantage of the graphical
capabilities of the display. Large format graphic information, such as test results
or error messages or the LaMotte logo is displayed. The top two lines of the
display are used to display information in a large, easy to read format. The
menus work in the same way as previously described but two lines of the menu
are visible at the bottom of the display.
22 SMART3 Colorimeter 11.10
Page 25
Header Menu Title
Message or Result Window
Result or
Message
Another
Main Window Selection And Another
Footer
12:00:00 001/500
And So On
Last Choice
As described previously, the
current menu and a return to the previous menu. This allows a rapid exit from an
inner menu to the main menu by repeatedly pushing the
at any time will turn the SMART3 off.
The display may show the following messages:
Battery Status
More choices are available and can be viewed by
scrolling up and/or down through the display.
Header Identifi es the current menu and information on units
and reagent systems if applicable.
Footer In the data logging mode the number of the data point
is displayed and the total number of data points in the
memory will be shown. The footer also shows current
time and battery status
EXIT
button allows an exit or escape from the
EXIT
button. Pushing
SMART3 Colorimeter 11.10 23
Page 26
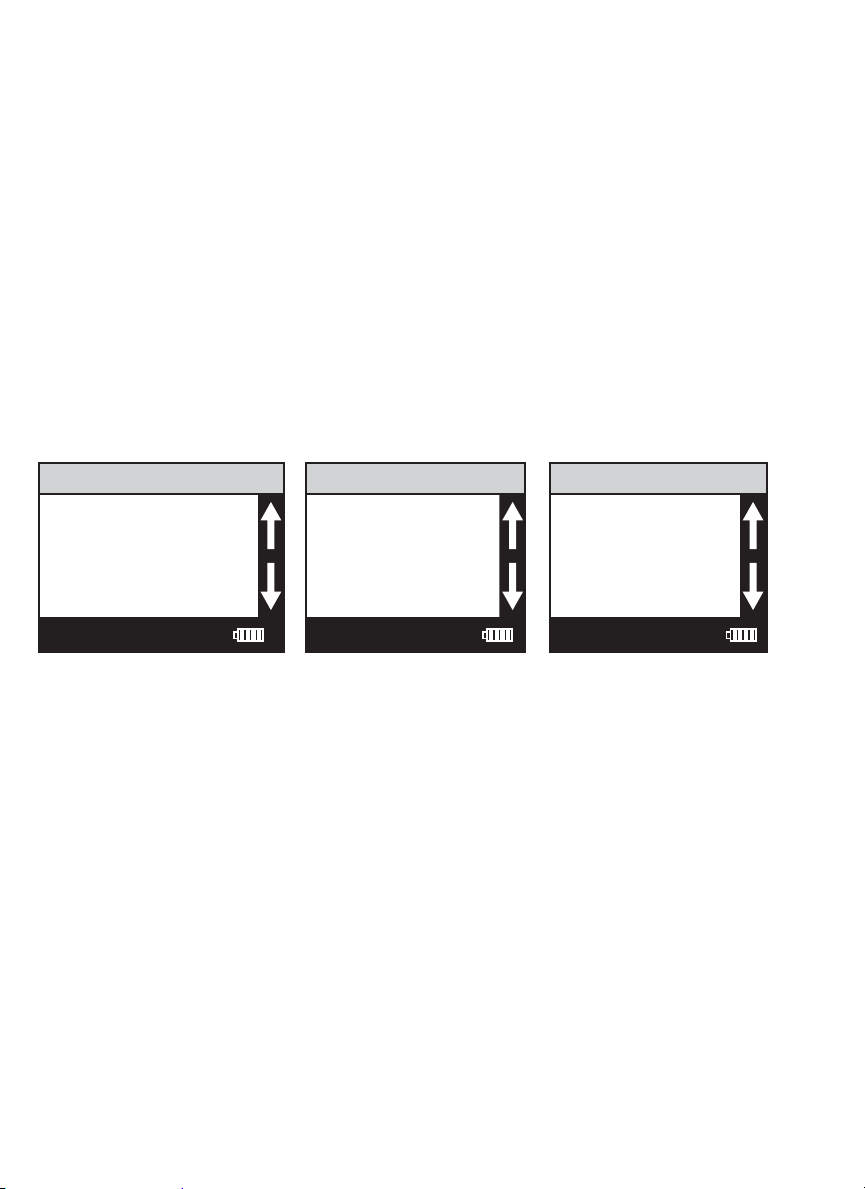
LOOPING MENUS
Long menus, such as All Tests, incorporate a looping feature which allows
the user to quickly reach the last choice in the menu from the fi rst choice. In
a looping menu the last choices in the menu are above the fi rst choice and
scrolling upward moves through the menu in reverse order. Scrolling downward
moves through the menu from fi rst choice to last but the menu starts over
following the last choice. So all menu choices can be reached by scrolling in
either direction. The diagrams below demonstrate a looping menu.
AND SO ON AND SO ON AND SO ON
: : : : : : : : :
: : : : : : : : :
THIRD TO LAST LAST CHOICE LAST CHOICE
SECOND TO LAST AND SO ON AND SO ON
LAST CHOICE : : : : : :
TESTING MENU TESTING MENU TESTING MENU
FIRST CHOICE : : : : : :
SECOND CHOICE THIRD TO LAST THIRD TO LAST
THIRD CHOICE SECOND TO LAST SECOND TO LAST
ANOTHER LAST CHOICE LAST CHOICE
12:00:00 001/500 12:00:00 001/500 12:00:00 001/500
AND ANOTHER FIRST CHOICE FIRST CHOICE
AND SO ON SECOND CHOICE SECOND CHOICE
: : : THIRD CHOICE THIRD CHOICE
: : : ANOTHER ANOTHER
LAST CHOICE AND ANOTHER AND ANOTHER
24 SMART3 Colorimeter 11.10
Page 27
TESTING
TESTING MENU
The Testing Menu is used to run all LaMotte pre-programmed tests, User Tests
and Absorbance tests at one of four wavelengths. Testing from any of three
sequences can also be done.
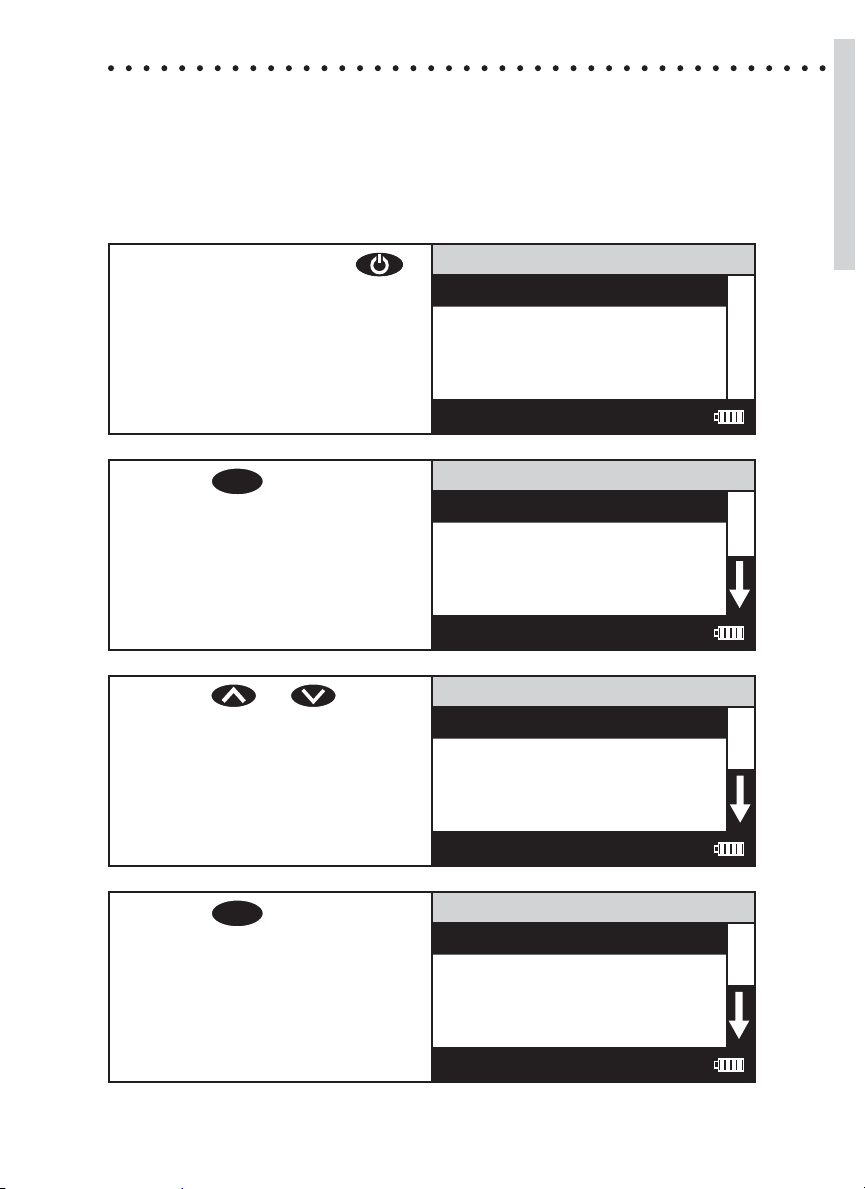
1. Press and briefl y hold
to turn the meter on. The
LaMotte logo screen will
appear for about 3 seconds
and the Main Menu will
appear.
2. Press
ENTER
to select Testing
Menu.
Testing Menu
Editing Menu
Run PC Link
12:00:00 001/500
All Tests Menu
Sequence 1
Sequence 2
Sequence 3
12:00:00 001/500
Main Menu
Testing Menu
Testing
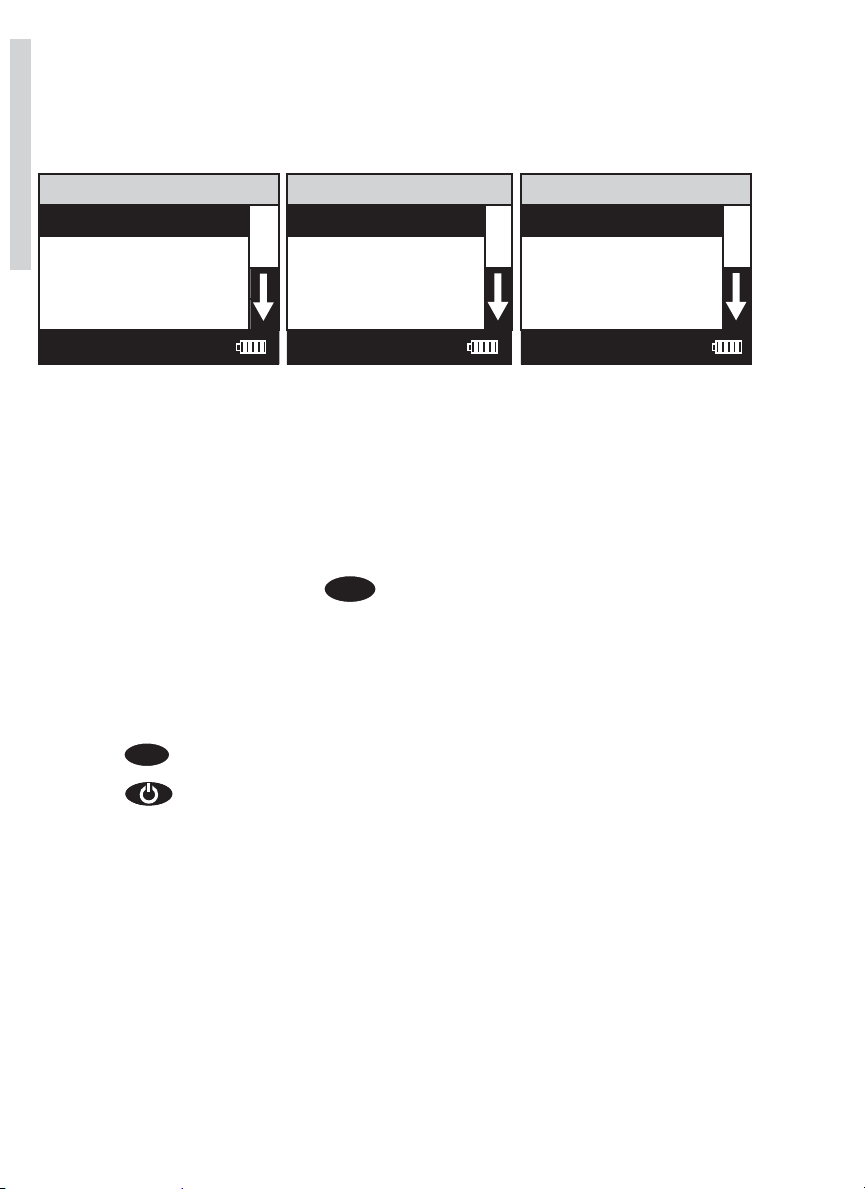
3. Press or to scroll
to desired option. All Tests
contains all of the available
pre-programmed tests. The
three sequences have user
selected tests. Absorbance
has %T/ABS tests.
4. Press
ENTER
to select the
option.
All Tests Menu
Sequence 1
Sequence 2
Sequence 3
12:00:00 001/500
001 Alkalinity UDV
Testing Menu
All Tests
002 Aluminum
003 Ammonia-N LRF
004 Ammonia-N LRS
12:00:00 001/500
SMART3 Colorimeter 11.10 25
Page 28
TEST SEQUENCES
Sequence 1, Sequence 2, And Sequence 3 are alterable sequences. They may
be edited using the Editing Menu. Any of the LaMotte pre-programmed tests or
User Tests may be placed in these sequences in whatever testing order that is
preferred. Some examples of typical sequences are given below.
Testing
Sequence 1 Sequence 2 Sequence 3
015 Chlorine F UDV 002 Aluminum 003 Ammonia-N LRF
079 Phosphate HR 035 Cyanuric Acid 032 Cu UDV
009 Benzotriazole 053 Iron Phenanthro 064 Nitrate-N LR
076 pH UDV 055 Manganese LR 067 Nitrite-N LR
12:00:00 001/500 12:00:00 001/500 12:00:00 001/500
061 Molybdenum HR 064 Nitrate-N LR 074 pH PR
086 Silica HR 067 Nitrite-N LR 078 Phosphate LR
045 Hydrazine 077 Phenol 085 Silica LR
032 Cu UDV 078 Phosphate LR
051 Iron Bipyridyl 090 Sulfi de LR
These alterable sequences allow a series of tests to be setup that are run
frequently. The order of the individual tests in the sequence is determined by the
ENTER
user. After running a test, press
to select the next test in the sequence.
Continue this pattern until the entire sequence has been completed.
All Tests is a fi xed sequence containing the LaMotte pre-programmed tests, User
Tests, and Absorbance tests.
Modifi cation of the alterable sequences is accomplished through the Editing
Menu. This menu is explained in greater detail in Editing Menu (p. 35).
Pressing
EXIT
while in a sequence menu will escape back to the Testing Menu.
Pressing the at any time will turn the colorimeter off.
GENERAL TESTING PROCEDURES
The following are some step by step examples of how to run tests from the
Testing Menu. These test procedures are designed to be used with LaMotte
SMART Reagent Systems.
LaMotte Company continuously updates the list of pre-programmed tests as
the calibrations become available. Pre-programmed calibrations can be added
to the SMART3 Colorimeter in the fi eld. A Windows-based computer running a
Windows Operating System is required.
Call LaMotte Technical Services at 1-800-344-3100 (410-778-3100 outside the
USA) or email at tech@lamotte.com for a current list of available calibrations
and downloading instructions.
26 SMART3 Colorimeter 11.10
Page 29

TESTING WITH LaMOTTE PRE-PROGRAMMED TESTS
1. Press and briefl y hold
to turn the meter on. The
LaMotte logo screen will
appear for about 3 seconds
and the Main Menu will
appear.
2. Press
ENTER
to select Testing
Menu.
3. Press
ENTER
to select All Tests
Menu.
Main Menu
Testing Menu
Editing Menu
Run PC Link
12:00:00 001/500
Testing Menu
All Test Menu
Sequence 1
Sequence 2
Sequence 3
12:00:00 001/500
All Tests
001 Alkalinity UDV
002 Aluminum
003 Ammonia-N LRF
004 Ammonia-N LRS
12:00:00 001/500
Testing
4. Press or to scroll
to the desired test.
001 Alkalinity UDV
All Tests
002 Aluminum
003 Ammonia-N LRF
004 Ammonia-N LRS
12:00:00 001/500
5. Press
ENTER
to select the test.
002 Aluminum
Scan Bank
Scan Sample
12:00:00 001/500
SMART3 Colorimeter 11.10 27
Page 30
6. Insert the blank into the
chamber. Close the lid.Press
ENTER
to scan the blank. The
screen wil display Blank
Done for about 1 second and
then return to the Test Menu.
Testing
002 Aluminum
Scan Blank
Scan Sample
12:00:00 001/500
7. Insert the reacted sample
into the chamber. Close
the lid. Press
the sample. The screen will
display READING for about 1
second. The result will appear
on the screen.
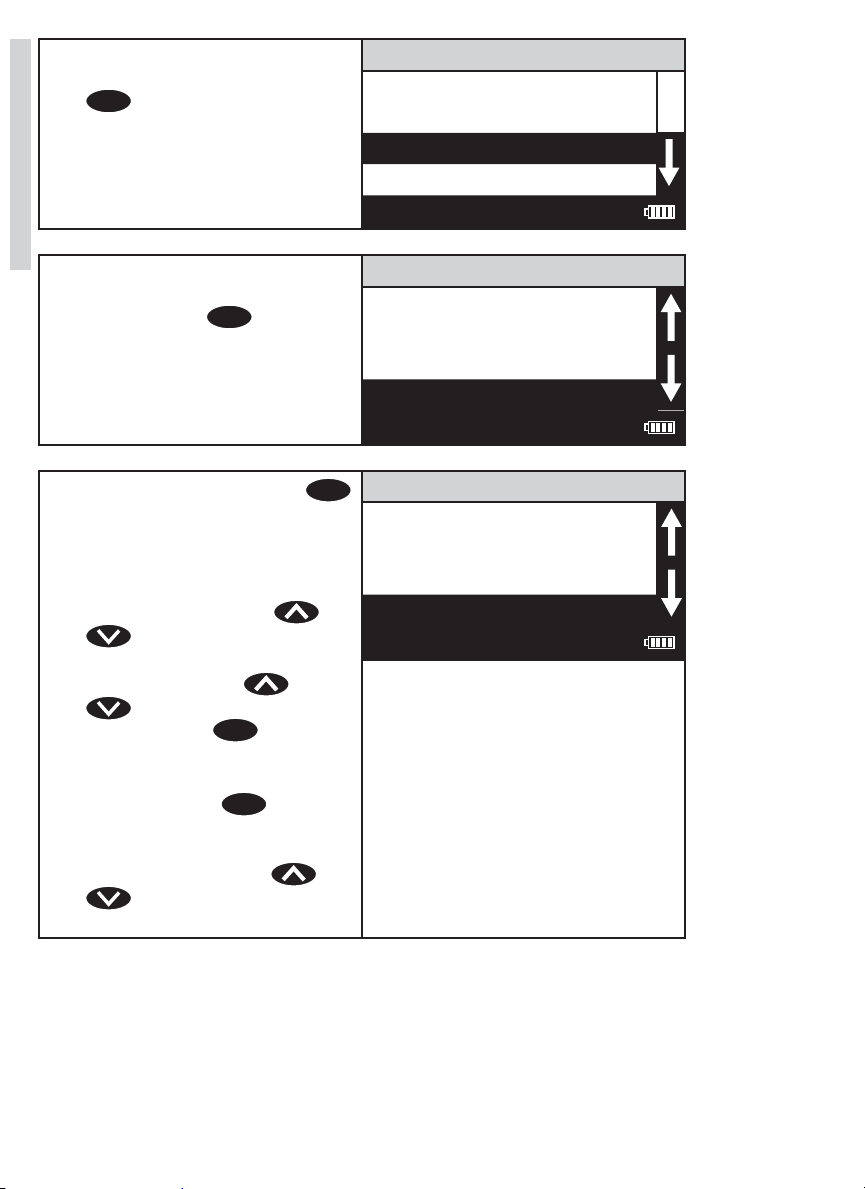
8. To repeat the test, press
to scan the sample again. The
last blank scaned is used by
the colorimeter for repeated
scans. A different blank can
be used by pressing or
to scroll to Scan Blank
and then scanning another
blank. Scroll with or
and make another
selection with
or Absorbance of the last test
can be viewed by choosing
%T/Abs. Press
escape to previous menus.
NOTE: The menus loop in
this screen so either or
will lead to the menu
selection needed.
ENTER
ENTER
EXIT
to scan
. The %T
to
ENTER
002 Aluminum
1.00 ppm
Scan Blank
Scan Sample
12:00:00 001/500
002 Aluminum
1.00 ppm
Scan Bank
Scan Sample
12:00:00 001/500
28 SMART3 Colorimeter 11.10
Page 31

CALIBRATING LaMOTTE PRE-PROGRAMMED TESTS
The LaMotte Pre-Programmed Tests have been pre-calibrated. Recalibration of
the pre-programmed tests by the user is not possible. However, a procedure
to standardize the calibration can be performed to obtain the most accurate
readings or to meet regulatory requirements.
The LaMotte Pre-Programmed tests are standardized with one standard
solution. To standardize over the full range of the test, the concentration of
the standard should be chosen from the high end of the range. Alternatively, if
samples do not cover the full range of the test, a standard should be chosen
that is close to the concentration of the samples.
The standardization procedure should be followed as often as required by
regulations and laws for compliance monitoring.
In the example below, the Aluminum calibration will be standardized.
Prepare a standard solution to be tested. In this example, 0.30 ppm aluminum.
Testing
1. Press and briefl y hold
to turn the meter on. The
LaMotte logo screen will
appear for about 3 seconds
and the Main Menu will
appear.
2. Press
ENTER
to select Testing
Menu.
3. Press
ENTER
to select All Tests
Menu.
Main Menu
Testing Menu
Editing Menu
Run PC LINK
12:00:00 001/500
Testing Menu
All Test Menu
Sequence 1
Sequence 2
Sequence 3
12:00:00 001/500
All Tests
001 Alkalinity UDV
002 Aluminum
003 Ammonia-N LRF
004 Ammonia-N LRS
12:00:00 001/500
SMART3 Colorimeter 11.10 29
Page 32

4. Press or to scroll
to the desired test factor.
Testing
All Tests
001 Alkalinity UDV
002 Aluminum
003 Ammonia-N LRF
004 Ammonia-N LRS
12:00:00 001/500
5. Press
ENTER
to select the test.
6. Follow the test procedure
in the manual to test the
prepared standard. Insert the
blank into the chamber. Close
the lid. Press
ENTER
to scan
the blank. The screen will
display Blank Done for about
1 second and then return to
the Test Menu.
7. Insert the reacted standard
solution into the chamber.
Close the lid. Press
ENTER
to
scan the sample. The screen
will display Reading for about
1 second. The result will
appear on the screen.
002 Aluminum
Scan Blank
Scan Sample
12:00:00 001/500
002 Aluminum
Scan Blank
Scan Sample
12:00:00 001/500
002 Aluminum
0.28 ppm
Scan Blank
Scan Sample
12:00:00 001/500
30 SMART3 Colorimeter 11.10
Page 33

8. The displayed result can now
be standardized. Press
or to scroll to calibrate.
002 Aluminum
0.28 ppm
%T/Abs
Calibrate
12:00:00 001/500
Testing
9. Press
10. Press or to scroll
11. Press
ENTER
to select
Calibrate. A reverse font
(dark background with light
characters) will appear to
indicate that the reading can
be adjusted.
to the concentration of the
prepared standard, 0.30 in
this example.
NOTE: A maximum
adjustment of 10% is possible.
If an adjustment of over 10%
is attempted, Overrange will
be displayed.
ENTER
to select
Calibrate. Two menu choices
will be offered, set calibration
and factory setting.
002 Aluminum
0.28 ppm
%T/Abs
Calibrate
12:00:00 001/500
002 Aluminum
0.30 ppm
%T/Abs
Calibrate
12:00:00 001/500
002 Aluminum
0.30 ppm
Set Calibration
Factory Setting
12:00:00 001/500
SMART3 Colorimeter 11.10 31
Page 34

12. Press
ENTER
to select Set
Calibration and save the
calibration. Or press
to scroll to Factory Setting.
Press
Setting to revert to the factory
Testing
ENTER
to select Factory
calibration. The screen will
display Storing... for about
1 second and the test menu
will appear. The calibration
has now been standardized
and the meter can be used for
testing. The standardization
can be removed by repeating
the calibration and selecting
Factory Setting.
002 Aluminum
Scan Blank
Scan Sample
12:00:00 001/500
32 SMART3 Colorimeter 11.10
Page 35

MEASURING IN THE ABSORBANCE MODE
1. Press and briefl y hold
to turn the meter on. The
LaMotte logo screen will
appear for about 3 seconds
and the Main Menu will
appear.
2. Press
ENTER
to select Testing
Menu.
3. Press or to scroll
to Absorbance.
Main Menu
Testing Menu
Editing Menu
Run PC Link
12:00:00 001/500
Testing Menu
All Test Menu
Sequence 1
Sequence 2
Sequence 3
12:00:00 001/500
Testing Menu
Sequence 1
Sequence 2
Sequence 3
Absorbance
12:00:00 001/500
Testing
4. Press
Absorbance.
ENTER
to select
101 Absorbance 428
Absorbance
102 Absorbance 525
103 Absorbance 568
104 Absorbance 635
12:00:00 001/500
SMART3 Colorimeter 11.10 33
Page 36

5. Press or to scroll
to desired wavelength.
Testing
Absorbance
101 Absorbance 428
102 Absorbance 525
103 Absorbance 568
104 Absorbance 635
12:00:00 001/500
6. Press
ENTER
to select the
wavelength.
7. Insert the blank. Close the lid.
Press
ENTER
to scan the blank.
The screen wil display Blank
Done for about 1 second
and return to the Absorbance
menu.
8. Insert the reacted sample.
Press
ENTER
to scan the
sample. The screen will
display Reading for about 1
second. The result will appear
on the screen.
102 Absorbance 525
Scan Blank
Scan Sample
12:00:00 001/500
102 Absorbance 525
Scan Blank
Scan Sample
12:00:00 001/500
102 Absorbance 525
0.425
Scan Blank
Scan Sample
12:00:00 001/500
34 SMART3 Colorimeter 11.10
Page 37

9. To repeat the test, press
to scan the sample again. The
last blank scanned is used by
the colorimeter for repeated
scans. A different blank can
be used by pressing or
to scroll to Scan Blank
and then scanning another
blank. Scroll with
and make another
selection with
Absorbance of the last test can
be viewed by choosing
%T/Abs. Press
escape to previous menus.
NOTE: The menus loop in
this screen so either or
will lead to the menu
selection needed.
NOTE: The calibrate function
does not work in the
Absorbance mode.
ENTER
EXIT
.The %T or
to
or
ENTER
102 Absorbance 525
0.425
Scan Blank
Scan Sample
12:00:00 001/500
Next Test
Previous Test
%T/Abs
Calibrate
Testing
SMART3 Colorimeter 11.10 35
Page 38

EDITING MENU
The Editing Menu allows the user to edit sequences, edit user tests, set the
clock, edit the logging function, access factory setting, set the power saving
function, set the backlight time, and select a language.
The default factory settings are:
Date Format MM-DD-YYYY
Logging Enabled
Power Save 5 minutes
Backlight 10 seconds
Language English
EDITING A SEQUENCE
The Edit Sequence menu allows three alterable test sequences (Sequence 1,
Sequence 2, Sequence 3) to be edited.
Editing/Set Up
1. Press and briefl y hold
to turn the meter on. The
LaMotte logo screen will
appear for about 3 seconds
and the Main Menu will
Testing Menu
Editing Menu
Run PC Link
Main Menu
appear.
12:00:00 001/500
2. Press or to scroll
to the Editing Menu.
Testing Menu
Main Menu
Editing Menu
Run PC Link
12:00:00 001/500
3. Press
Menu.
ENTER
to select Editing
Edit Sequences
Editing Menu
Edit User Test
Set Clock
Logging
12:00:00 001/500
36 SMART3 Colorimeter 11.10
Page 39

4. Press
Sequences.
ENTER
to select Edit
Edit Sequences
Edit Sequence 1
Edit Sequence 2
Edit Sequence 3
12:00:00 001/500
5. Press or to scroll
to the desired sequence.
6. Press
ENTER
to select the
sequence to be edited.
Edit Sequences
Edit Sequence 1
Edit Sequence 2
Edit Sequence 3
12:00:00 001/500
EDIT SEQUENCE 2
015 Chlorine F UDV
079 Phosphate HR
009 Benzotriazole
076 pH UDV
12:00:00 001/500
Editing/Set Up
SMART3 Colorimeter 11.10 37
Page 40

ADDING OR DELETING A TEST
There are three ways to alter a sequence: Insert Before, Insert After, and Delete.
Insert Before adds a new test to the sequence before the selected test. Insert
After adds a new test to the sequence after the selected test. Delete is used to
remove an existing test from a sequence.
ADDING A TEST
Below is a step-by-step example of how to add a test to SEQUENCE 2 starting
from the EDIT SEQUENCE 2 menu.
1. To add a test before or after
an existing test, press
or to scroll to the
existing test.
Editing/Set Up
2. Press
ENTER
to select the
existing test.
3. Press or to scroll
to Insert Before or Insert
After.
EDIT SEQUENCE 2
015 Chlorine F UDV
079 Phosphate HR
009 Benzotriazole
076 pH UDV
12:00:00 001/500
Add or Delete
Insert Before
Insert After
Delete
12:00:00 001/500
Add or Delete
Insert Before
Insert After
Delete
12:00:00 001/500
4. Press
ENTER
to select the
option, Insert Before, in this
example. The All Test Menu
will appear.
001 Alkalinity
002 Aluminum
003 Ammonia-N LRF
All Tests
004 Ammonia-N LRS
12:00:00 001/500
38 SMART3 Colorimeter 11.10
Page 41

5. Press or to scroll
to the test that will be added
to the sequence. In this
example, Aluminum.
All Tests
001 Alkalinity UDV
002 Aluminum
003 Ammonia-N LRF
004 Ammonia-N LRS
12:00:00 001/500
6. Press
ENTER
to select the test.
The sequence will appear in
the Edit Sequence menu and
the new test will be added to
the sequence. All changes
in the sequence will be
automatically saved.
7. Press
EXIT
to exit the Edit
Sequence menu and return
to the Editing Menu.
8. Press
ENTER
to select Edit
Sequences to continue
editing the sequences or
press
EXIT
to return to the
Main Menu.
EDIT SEQUENCE 2
015 Chlorine F UDV
079 Phosphate HR
002 Aluminum
009 Benzotriazole
12:00:00 001/500
Editing Menu
Edit Sequences
Edit User Test
Set Clock
Logging
12:00:00 001/500
Main Menu
Testing Menu
Editing Menu
Run PC Link
Editing/Set Up
12:00:00 001/500
SMART3 Colorimeter 11.10 39
Page 42

DELETING A TEST
Below is a step-by-step example of how to delete a test in SEQUENCE 2 starting
from the EDIT SEQUENCE 2 menu.
1. To delete a test, press
or to scroll to the test in
the sequence.
2. Press
Editing/Set Up
ENTER
to select the test.
3. Press or to scroll
to Delete.
EDIT SEQUENCE 2
015 Chlorine F UDV
079 Phosphate HR
002 Aluminum
009 Benzotriazole
12:00:00 001/500
Add or Delete
Insert Before
Insert After
Delete
12:00:00 001/500
Add or Delete
Insert Before
Insert After
Delete
12:00:00 001/500
4. Press
ENTER
to select Delete.
The sequence will appear
in the EDIT SEQUENCE
menu and the selected test
will have been deleted. All
015 Chlorine F UDV
079 Phosphate HR
002 Aluminum
EDIT SEQUENCE 2
changes to the sequence
will automatically have been
saved.
40 SMART3 Colorimeter 11.10
12:00:00 001/500
Page 43

5. Press
EXIT
to exit the Edit
Sequence menu and return
to the Editing Menu.
Editing Menu
Edit Sequences
Edit User Test
Set Clock
Logging
12:00:00 001/500
6. Press
ENTER
to select Edit
Sequences to continue
editing the sequences or
press
EXIT
to return to the
Main Menu.
Main Menu
Testing Menu
Editing Menu
Run PC Link
12:00:00 001/500
Editing/Set Up
SMART3 Colorimeter 11.10 41
Page 44

EDIT USER TESTS
If a test other than the LaMotte programmed tests is performed regularly, a
calibration for it may be entered in one of the 25 User Tests. These tests are
originally named “User Test 1 - 25”. It will be possible to rename the test, select
a wavelength, enter a new calibration, select the number of decimal places
used to display the results, and select the units. A User Test may be added for a
reagent system for which no precalibrated test exists. A calibration of a LaMotte
reagent system may also be entered. The calibration of a User Test can be
changed at any time.
The User Tests have the ability to handle 2 data points. The colorimeter will
determine the absorbance of the standards and calculate a response that
will be stored to determine the concentration of future samples of unknown
concentration. These standards should cover all the concentrations for the
range of the test being performed and be scanned beginning with the low
concentration and fi nishing with the high concentration (for more information
about this, see CALIBRATION CURVES, page 12). Prepare these standards prior
to entering a new calibration.
NOTE: A calibration procedure must be performed before using any of the User
Editing/Set Up
Tests.
The User Tests can be placed in any of the alterable sequences using Edit
Sequences.
1. Press and briefl y hold
to turn the meter on. The
LaMotte logo screen will
appear for about 3 seconds
and the Main Menu will
Testing Menu
Editing Menu
Run PC Link
Main Menu
appear.
12:00:00 001/500
2. Press or to scroll
to the Editing Menu.
Testing Menu
Main Menu
Editing Menu
Run PC Link
12:00:00 001/500
42 SMART3 Colorimeter 11.10
Page 45

3. Press
ENTER
to select Editing
Menu. Press to scroll to
Edit User Test.
Editing Menu
Edit Sequences
Edit User Test
Set Clock
Logging
12:00:00 001/500
4. Press
ENTER
to select Edit
User Test.
5. Press or to scroll
to the desired user test.
6. Press
ENTER
to select the User
Test.
Edit User Test
105 USER TEST 01
106 USER TEST 02
107 USER TEST 03
108 USER TEST 04
12:00:00 001/500
Edit User Test
108 USER TEST 04
109 USER TEST 05
110 USER TEST 06
111 USER TEST 07
12:00:00 001/500
111 USER TEST 07
Name the Test
Select Vial/WL
STD Calibration
Enter Constants
Editing/Set Up
12:00:00 001/500
SMART3 Colorimeter 11.10 43
Page 46

NAMING THE TEST
A User Test can be up to 16 characters long. The menu choices for each
character are 26 upper case letters A to Z, 26 lower case letters a to z, ten
numerals 0 to 9, a space, a dash (-) and a decimal point (.). The existing name is
displayed on the bottom line of the display. The character which is to be edited
will blink and that character is also displayed in the center of the display. The
character can be changed by using or to scroll to other characters.
ENTER
Use
pressing
to select a character. The edited name is saved at any time by
EXIT
or by pressing
ENTER
after selecting the sixteenth character.
1. From the User Test menu,
press to scroll to Name
the Test.
Editing/Set Up
2. Press
ENTER
to select Name
the Test. A reverse font
(dark background with a
light character) will appear
to indicate the character that
will be adjusted. The same
character will also appear in
the center of the display.
3. Press or to scroll
to the desired character. In
this example, the test name
will be H2O.
111 USER TEST 07
Name the Test
Select Vial/WL
STD Calibration
Enter Constants
12:00:00 001/500
Name the Test
R S T U V W X
111 U SER TEST 07
12:00:00 001/500
Name the Test
E F G H I J K
111 U SER TEST 07
12:00:00 001/500
44 SMART3 Colorimeter 11.10
Page 47

4. Press
ENTER
to save the
character and move to the
next character.
Name the Test
P Q R S T U V
111 H S ER TEST 07
12:00:00 001/500
5. Press or to scroll
to the desired character.
6. Press
ENTER
to save the
character and move to the
next character.
7. Press or to scroll
to the desired character.
Name the Test
Editing/Set Up
. 0 1 2 3 4 5
111 H S ER TEST 07
12:00:00 001/500
Name the Test
L M N E P Q R
111 H2 E R TEST 07
12:00:00 001/500
Name the Test
L M N O P Q R
111 H2 O R TEST 07
12:00:00 001/500
SMART3 Colorimeter 11.10 45
Page 48

8. Press
ENTER
to save the
character. Repeat the
procedure until the test name
is complete. To remove
a character, change the
character to a space (located
after the letter z). Press
to save the name. The sreen
will display Storing... and the
test name for about 1 second
and the meter will return to
the Edit Test menu.
Editing/Set Up
EXIT
111 H2O
Name the Test
Select Vial/WL
STD Calibration
Enter Constants
12:00:00 001/500
46 SMART3 Colorimeter 11.10
Page 49

SELECTING THE VIAL AND WAVELENGTH
The SMART3 Colorimeter accepts three different vials (the 25 mm 0290 tube,
UDVs and COD tubes) at 4 different wavelengths (428, 525, 560, and 635 nm).
The colorimeter uses different settings for each of the twelve combinations of
vial and wavelength. These twelve settings are called channels. Choose the
channel with the correct wavelength and vial for the test.
1. From the User Test menu,
press or to scroll
to Select Vial/WL.
2. Press
ENTER
to select Select
Vial/WL.
3. Press or to select
the channel with the desired
wavelingth and vial size
combination.
111 H2O
Name the Test
Select Vial/WL
STD Calibration
Enter Constants
12:00:00 001/500
Select Channel
Ch1 428nm 25mm
Ch2 525nm 25mm
Ch3 635nm 25mm
Ch4 568nm 25mm
12:00:00 001/500
Select Channel
Ch1 428nm 25mm
Ch2 525nm 25mm
Ch3 635nm 25mm
Ch4 568nm 25mm
12:00:00 001/500
Editing/Set Up
4. Press
ENTER
to select the
channel. The screen will
display Storing... for about
1 second and the meter will
return to the Edit Test menu.
Name the Test
Select Vial/WL
STD Calibration
111 H2O
Enter Constants
12:00:00 001/500
SMART3 Colorimeter 11.10 47
Page 50

ENTERING A TWO POINT CALIBRATION
The SMART3 Colorimeter can scan two reacted standards and create a
calibration curve. To prepare a calibration curve with multiple data points see
Entering a Multiple Calibration Curve (pg. 51).
1. From the User Test menu,
press or to
scroll to STD (Standard)
Calibration.
2. Press
ENTER
to select STD
Calibration. The screen will
display Low Standard for
about 1 second and then
Editing/Set Up
display the Low Standard
screen. A reverse font (dark
background with a light
character) will appear to
indicate the character that
will be adjusted. The same
character will also appear in
the center of the display.
3. Press or to scroll
to the fi rst character of the
low concentration. In this
example, 1.00 ppm.
111 H2O
Name the Test
Select Vial/WL
STD Calibration
Enter Constants
12:00:00 001/500
Low Standard
9 . – 0 1 2 3
0 0.000000
12:00:00 001/500
Low Standard
. – 0 1 1 2 3
0 .000000
12:00:00 001/500
48 SMART3 Colorimeter 11.10
Page 51

4. Press
ENTER
to save the
character and move to the
next character.
Low Standard
7 8 9 . – 0 1
1 . 000000
12:00:00 001/500
5. Press or to scroll
to the desired character.
6. Press
ENTER
to save the
character and move to the
next character.
7. Press or to scroll
to the desired character.
Low Standard
Editing/Set Up
7 8 9 . – 0 1
1 . 000000
12:00:00 001/500
Low Standard
9 . – 0 1 2 3
1. 0 00000
12:00:00 001/500
Low Standard
9 . – 0 1 2 3
1. 0 00000
12:00:00 001/500
SMART3 Colorimeter 11.10 49
Page 52

8. Press
ENTER
to save the
character. Repeat the
procedure until the low
concentration value is
complete. After the fi nal
character is complete the
meter will save the low
concentration value. The
screen will display High
Standard for about 1 minute
and the meter will display
the High Standard screen. A
reverse font (dark background
with a light character)
will appear to indicate
the character that will be
adjusted. The same character
will appear in the center of the
Editing/Set Up
display.
High Standard
9 . – 0 1 2 3
.0000
0
12:00:00 001/500
9. Use or and
to select the characters for the
high concentration value. In
this example, 7.5 ppm.
10. After the fi nal character is
entered the meter will save
the high concentration value.
The screen will display
instructions for completing the
calibration procedure.
ENTER
High Standard
9 . – 0 1 2 3
7.50000 0
12:00:00 001/500
Insert Blank
<Enter> continue
12:00:00 001/500
50 SMART3 Colorimeter 11.10
Page 53

11. Insert the blank. Press
ENTER
The screen will display Blank
Done... for about 1 second
and the Insert Low Standard
screen will appear.
12. Insert the low standard. Press
ENTER
. The screen will display
Reading... for about 1 second
and the Insert High Standard
screen will be displayed.
.
Insert Low Standard
<Enter> continue
12:00:00 001/500
Insert High Standard
<Enter> continue
12:00:00 001/500
Editing/Set Up
13. Insert the high standard.
ENTER
Press
. The screen will
display Reading... for about
1 second and the meter will
return to the Edit Test menu.
111 H2O
Name the Test
Select Vial/WL
STD Calibration
Enter Constants
12:00:00 001/500
SMART3 Colorimeter 11.10 51
Page 54

ENTERING A MULTIPLE POINT CALIBRATION
The SMART3 can directly create a 2 point calibration curve. (See Entering a
Two Point Calibration on page 47.) To create a multiple point calibration curve,
constants obtained from a linear regression of multiple data points can be
entered into the SMART 3.
1. Scan reactions of multiple concentrations at the appropriate wavelength in the
absorbance mode on the SMART3.
2. Plot the concentration (y axis) versus absorbance (x axis) in a program
capable of linear regression such as Excel.
3. Enter the constants obtained from the linear regression equation into the
SMART3.
For Example:
3
y = 0.001x
K0 = – 0.049
K1 = 0.181
Editing/Set Up
K2 = – 0.017
K3 = 0.001
OR (Over Range) = 10
– 0.017x2 + 0.181x – 0.049
1. From the User Test menu,
press or to scroll
to Enter Constants.
Name the Test
Select Vial/WL
111 H2O
STD Calibration
Enter Constants
12:00:00 001/500
2. Press
Constants.
ENTER
to select Enter
K0=0.00000
K1=0.00000
K2=0.00000
K3=0.00000
OR=100.00000
12:00:00 001/500
52 SMART3 Colorimeter 11.10
Page 55

3. Press
ENTER
to begin entering
the values for the constants. A
reverse font (dark background
with a light character)
will appear to indicate
the character that will be
adjusted. The same character
will also appear in the center
of the display.
Enter K0
9 . – 0 1 2 3
.00000
0
12:00:00 001/500
4. Press or to scroll
to the fi rst character of K0. In
this example, – 0.049.
5. Press
ENTER
to save the
character and move to the
next character.
6. Press or to scroll
to the next character.
Enter K0
Editing/Set Up
8 9 . – 1 2 3
0 .00000
12:00:00 001/500
Enter K0
7 8 9 . – 0 1
– . 00000
12:00:00 001/500
Enter K0
9 . – O 1 2 3
– . 00000
12:00:00 001/500
7. Press
ENTER
to save the
Enter K0
character and move to the
next character. Press
or
to scroll to the next
character.
SMART3 Colorimeter 11.10 53
7 8 9 . – 0 1
– 0 0 0000
12:00:00 001/500
Page 56

8. Press
ENTER
to save the
character. Repeat the
procedure until the K0 value
is complete. After the fi nal
character is complete the
meter will save the K0 value
and the meter will display K1
screen.
Enter K1
9 . – 0 1 2 3
.00000
0
12:00:00 001/500
9. Use , and
to select the characters for
the remaining values: K1, K2,
K3, and over range. In this
example, 10 ppm.
Editing/Set Up
10. After the fi nal character is
entered the meter will save
the constants. The screen will
display Storing... and return
to the Edit Test menu.
ENTER
Enter Overrange
9 . – 0 1 2 3
10.00000 0
12:00:00 001/500
111 H2O
Name the Test
Select Vial/WL
STD Calibration
Enter Constants
12:00:00 001/500
54 SMART3 Colorimeter 11.10
Page 57

SELECTING THE NUMERICAL FORMAT OF THE
RESULT
To input tests with very different ranges, the number of decimal places displayed
for a result can be selected. A test which ranges from 20 to 1000 ppm should
not be displayed with three decimal places. A test with a range from 0.010 to
0.500 needs three decimal places (the microprocessor will always calculate
the concentration to many more signifi cant fi gures than will be displayed). The
choice of 0, 1, 2, or 3 decimal places are available.
1. From the User Test menu,
press or to scroll
to Decimal Places.
2. Press
ENTER
to select Decimal
Places.
3. Press or to scroll
to the desired number of
decimal places.
111 H2O
Select Vial/WL
STD Calibration
Enter Constants
Decimal Places
12:00:00 001/500
Decimal Places?
None 0
One 0.0
Two 0.00
Three 0.000
12:00:00 001/500
Decimal Places?
None 0
One 0.0
Two 0.00
Three 0.000
12:00:00 001/500
Editing/Set Up
4. Press
ENTER
to select the
decimal places. The screen
wil display Storing... for about
1 second and the meter will
return to the Edit Test menu.
Select Vial/WL
STD Calibration
Enter Constants
111 H2O
Decimal Places
12:00:00 001/500
SMART3 Colorimeter 11.10 55
Page 58

SELECTING THE UNITS OF CONCENTRATION
The SMART3 Colorimeter has seven options for units of concentration. They are
No Units, ppm, FAU, pH, ppb, ppt and mgL.
1. From the User Menu, press
to scroll to Select
Units.
2. Press
ENTER
to select Select
Units.
Editing/Set Up
3. Press or to scroll
to the desired units.
111 H2O
STD Calibration
Enter Constants
Decimal Places
Select Units
12:00:00 001/500
Select Units
No Units
ppm
pH
FAU
12:00:00 001/500
Select Units
No Units
ppm
pH
FAU
12:00:00 001/500
4. Press
ENTER
to select the
units. The screen will display
Storing... for about 1 second
and the meter will return to
the Edit Test menu.
STD Calibration
Enter Constants
Decimal Places
111 H2O
Select Units
12:00:00 001/500
56 SMART3 Colorimeter 11.10
Page 59

SETTING THE CLOCK
Setting the clock allows the correct time and date stamp to be stored with each
reading in the data logger.
1. From the Editing Menu, press
or to scroll to Set
Clock.
2. Press
ENTER
to select
Set Clock. The date is
displayed as month-dayyear. The time is displayed
as hours:minutes:seconds
AM/PM. Press or
to scroll to the appropriate
character. Press
ENTER
to
select the character. The
curser will move to the next
character. Set all characters
in the same manner. The
character menu is a scrolling
menu.
Editing Menu
Edit Sequences
Edit User Test
Set Clock
Logging
12:00:00 001/500
Editing/Set Up
Set Time
Date: MM-DD-YYYY
Time: HH-MM-SS AM/PM
12:00:00 001/500
3. Press
ENTER
to select the fi nal
character. The time and date
will be saved and the meter
will return to the Edit Test
menu.
Edit Sequences
Edit User Test
Set Clock
Editing Menu
Logging
12:00:00 001/500
SMART3 Colorimeter 11.10 57
Page 60

LOGGING DATA
The default setting for the data logger is enabled. The meter will log the last 500
data points. The counter in the center bottom of the display will show how many
data points have been logged. The display will show 500+ when the data logger
has exceeded 500 points and the data points are being overwritten.
1. From the Editing Menu, press
or to scroll to
Logging.
2. Press
ENTER
to select
Logging.
Editing/Set Up
3. Press or to scroll
to desired function.
Editing Menu
Edit Sequence
Edit User Test
Set Clock
Logging
12:00:00 001/500
Logging
Display Test Log
Enable Logging
Disable Logging
Erase Log
12:00:00 001/500
Logging
Display Test Log
Enable Logging
Disable Logging
Erase Log
12:00:00 001/500
4. Press
ENTER
. The screen will
display Storing... for about
1 second and return to the
Logging menu.
Display Test Log
Enable Logging
Disable Logging
Logging
Erase Log
12:00:00 001/500
58 SMART3 Colorimeter 11.10
Page 61

5. Press
Editing Menu.
EXIT
to return to the
Edit Sequence
Editing Menu
Edit User Test
Set Clock
Logging
12:00:00 001/500
FACTORY SETUP
The Factory Setup menu is used in manufacturing of the SMART3 Colorimeter.
This menu is not for use by the operator in the fi eld.
SETTING POWER SAVE
The power saving Auto Shutoff feature will turn the meter off when a button has
not been pushed for a set amount of time. The default setting is disabled. To
change the setting:
Editing/Set Up
1. From the Editing Menu, press
or to scroll to Set
PWR Save.
2. Press
ENTER
to select Set
PWR Save.
3. Press or to scroll
to desired function.
Editing Menu
Set Clock
Logging
Factory Setup
Set PWR Save
12:00:00 001/500
Auto Shutoff
Disable
5 Minutes
15 Minutes
30 Minutes
12:00:00 001/500
Auto Shutoff
Disable
5 Minutes
15 Minutes
30 Minutes
12:00:00 001/500
SMART3 Colorimeter 11.10 59
Page 62

4. Press
ENTER
. The screen will
display Storing... for about
1 second and the meter will
return to the Editing Menu.
Editing/Set Up
Editing Menu
Set Clock
Logging
Factory Setup
Set PWR Save
12:00:00 001/500
60 SMART3 Colorimeter 11.10
Page 63

SETTING THE BACKLIGHT TIME
The backlight illuminates the display for enhanced viewing. The default setting is
10 seconds. If Button Control is chosen the backlight button on the key pad will
act as an on/off switch and the backlight will remain on or off when the meter is
being used. When one of the other settings – 10, 20 or 30 seconds – is chosen,
the display will be illuminated for the specifi ed amount of time after any button is
pressed.
NOTE: The backlight feature uses a signifi cant amount of power. The longer the
backlight is on, the more frequently the battery will have to be charged if the
USB/Wall Adapter is not being used.
1. From the Editing Menu, press
or to scroll to
Backlight Time.
2. Press
ENTER
to select Set
Backlight Time.
3. Press or to scroll
to desired option.
Editing Menu
Logging
Factory Setup
Set PWR Save
Set Backlight Time
12:00:00 001/500
Backlight Time
Button Control
10 seconds
20 seconds
30 seconds
12:00:00 001/500
Backlight Time
Button Control
10 seconds
20 seconds
30 seconds
12:00:00 001/500
Editing/Set Up
4. Press
ENTER
. The screen will
display Storing... for about
1 second and the meter will
return to the Editing Menu.
Logging
Factory Setup
Set PWR Save
Editing Menu
Set Backlight Time
12:00:00 001/500
SMART3 Colorimeter 11.10 61
Page 64

SELECTING A LANGUAGE
There are seven languages available in the SMART3: English, Spanish, French,
Portuguese, Italian, Chinese, and Japanese.
1. From the Editing Menu, press
or to scroll to
Select Language.
2. Press
ENTER
to select Select
Language.
Editing/Set Up
3. Press or to scroll
to desired language.
Editing Menu
Factory Setup
Set PWR Save
Set Backlight Time
Select Language
12:00:00 001/500
Select Language
English
Spanish
French
Portugese
12:00:00 001/500
Select Language
English
Spanish
French
Portugese
12:00:00 001/500
4. Press
ENTER
. The screen will
display Storing... for about
1 second and the meter will
return to the Editing Menu.
Factory Setup
Set PWR Save
Set Backlight Time
Editing Menu
Select Language
12:00:00 001/500
62 SMART3 Colorimeter 11.10
Page 65

NOTE: If meter unintentionally switches to another language, use the procedure
above to reset the meter to the desired language. For example, to reset the
meter to English:
1. Turn meter on.
2. Press one time. Press
3. Press
4. Press
seven times. Press
ENTER
.
ENTER
.
ENTER
.
Editing/Set Up
SMART3 Colorimeter 11.10 63
Page 66

COMPUTER CONNECTION
PC LINK
The SMART3 may be interfaced with any Windows-based computer by using
the LaMotte SMARTLink 3 Program and USB Cable. The program will store
test information and results in a database. To transfer data from the meter to a
computer, plug the smaller end of the USB cable (USB mini B connector) into
the meter and the larger end of the USB cable (USB Type A connector) into a
USB port on a computer. The SMART3 will send the following data: test name,
wavelength, concentration, transmittance, absorbance, sample, blank, time of
test, and date of test.
OUTPUT
USB
COMPUTER CONNECTION
USB Type A, USB mini B, Order Cable Code 1720.
SMARTLINK3
SmartLink3 records the above data and appends a test ID# which uniquely
identifi es the test in the database, the serial number of the meter, and a site
ID# which can be used to associate the test record with a site or customer via
the SmartLink3 program. It also stores a “test number” which is useful for the
SMART3.
64 SMART3 Colorimeter 11.10
Page 67

BATTERY
BATTERY/AC OPERATION
The SMART3 may be operated on battery power, using a USB wall adapter or
USB computer connection. If using the meter as a bench top unit, use the wall
adapter if possible to extend the battery life. The meter will remain on when the
USB adapter is used.
To charge the battery with the wall adapter, plug the smaller end of the USB
cable (USB mini B connector) into the meter and the larger end of the USB
cable (USB Type A connector) into the wall adapter. Plug the wall adapter into
an AC outlet. Reinsert the USB port plug after charging.
To charge the battery from a computer, plug the smaller end of the USB cable
(USB mini B connector) into the meter and the larger end of the USB cable (USB
Type A connector) into a USB port on a computer.
The battery icon will show no bars and fl ash when the unit fi rst turns on. Then
the indicator will indicate the battery status by showing 0, 1, 2, 3 or 4 bars.
It will take 5 hours to fully charge a low battery. The battery icon will fl ash when
the battery is charging. The battery icon will show four bars and stop fl ashing
when it is fully charged. The charging circuit will automatically switch to a fl oat
charge when the battery is fully charged. The charger may remain connected.
Some computers will NOT supply power to their USB ports during standby
operation. The wall adapter will charge the unit continuously.
The battery icon will show no bars and continuously fl ash if the battery is getting
low but the unit will still operate normally. A “Low Battery” message on the
status bar of the display will replace the time when the battery voltage is too
low for proper operation and accuracy may be degraded. A “Shutdown Low
Batt” message on the display will appear for a few seconds before the power is
switched off when the battery is too low to operate the unit.
To extend the battery life:
• Shut down the unit with the power switch when not taking measurements
or use the power save option to have the unit automatically turn off after 5
minutes.
• Store the unit in a cool dry place.
• Fully charge the battery before storing the unit for extended periods of time.
• Limit backlight use. The unit consumes 3X normal power with the backlight
on. Set the backlight time option to 10 seconds, or select “Button Control”
and keep the backlight off.
Battery replacement: The lithium ion battery used in this unit should last for
many years with normal use. When it no longer powers the unit long enough to
meet testing requirements it will need to be replaced. Lithium ion batteries that
are properly charged and stored do not usually lose all capacity; they just have
SMART3 Colorimeter 11.10 65
Page 68

less capacity after hundreds of charge cycles. This unit uses a custom battery
assembly that is only available from LaMotte Company. Battery replacement
must be performed at a LaMotte authorized repair facility. The water resistant
housing of this meter should not be opened by the user. Contact LaMotte
Company by phone (1-800-344-3100) or email (tech@lamotte.com) for a return
authorization number.
MAINTENANCE
CLEANING
Clean the exterior housing with a damp, lint-free cloth. Do not allow water
to enter the light chamber or any other parts of the meter. To clean the light
chamber and optics area, point a can of compressed air into the light chamber
and blow the pressurized air into the light chamber. Use a cotton swab
dampened with Windex® window cleaner to gently swab the interior of the
chamber. Do not use alcohol; it will leave a thin residue over the optics when
dry.
REPAIRS
Should it be necessary to return the meter for repair or servicing, pack the
meter carefully in a suitable container with adequate packing material. A return
authorization number must be obtained from LaMotte Company by calling 800344-3100 (US only) or 410-778-3100, faxing 410-778-6394, or emailing tech@
lamotte.com. Often a problem can be resolved over the phone or by email. If
a return of the meter is necessary, attach a letter with the return authorization
number, meter serial number, a brief description of problem and contact
information including phone and FAX numbers to the shipping carton. This
information will enable the service department to make the required repairs
more effi ciently.
METER DISPOSAL
Waste Electrical and Electronic Equipment (WEEE)
Natural resources were used in the production of this equipment. This
equipment may contain materials that are hazardous to health and the
environment. To avoid harm to the environment and natural resources, the use
of appropriate take-back systems is recommended. The crossed out wheeled
bin symbol on the meter encourages the use of these systems when disposing
of this equipment.
Take-back systems will allow the materials to be reused or recycled in a way that
will not harm the environment. For more information on approved collection,
reuse, and recycling systems contact local or regional waste administration or
recycling services.
66 SMART3 Colorimeter 11.10
Page 69

TROUBLESHOOTING
ERROR MESSAGES
OVER RANGE
If the message OVERRANGE is displayed when scanning a sample, the
sample may be over range or under range. If the sample is over range the
sample should be diluted and tested again (see Sample Dilution Techniques
and Volumetric Measurements, page 16).
If overrange is displayed, press
ENTER
to continue testing on
diluted samples.
Note: After pressing
ENTER
, the
overrange cncentration will be
displayed. This concentration is
an approximation only.
Overrange
<Enter> continue
Scan Blank
Scan Sample
12:00:00 001/500
002 Aluminum
CALIBRATION
As with all pre-calibrated meters, it is highly recommended, even if not required
by regulations, that the user periodically verify the performance of the meter
by running standards with a predetermined concentration. Results outside of
specifi cation are an indication that the meter needs to be adjusted. This can be
done following the user calibration described on page 28. If the user calibration
fails to properly adjust the meter then the meter should be returned to LaMotte
Company for recalibration. (See page 65).
STRAY LIGHT
The SMART3 Colorimeter should have no problems with stray light. Make sure
that the sample compartment lid is always fully closed, except when testing
COD with the adapter.
SMART3 Colorimeter 11.10 67
Page 70

TROUBLESHOOTING GUIDE
PROBLEM REASON SOLUTION
Flashing
Low battery. Readings
are reliable.
“Low Battery” Battery voltage is very
low. Readings are not
reliable.
“Shut Down Low
Batt” Shut Down
Battery is too low to
operate the unit.
“Overrange” Sample is outside of
acceptable range.
Charge battery or use
USB wall/computer
adapter.
Charge battery or use
USB wall/computer
adapter.
Charge battery or use
USB wall/computer
adapter.
Dilute sample and test
again.
Unusually large
negative or
positive readings
when performing
calibration
Incorrect standards
used to calibrate
meter.
Use fresh 0.0 standard
in clean tube. Reset
meter to factory default
settings. Recalibrate
meter.
68 SMART3 Colorimeter 11.10
Page 71

1910-TEST
02.13.12
Page 72

Page 73

SMART3 COLORIMETER
REAGENT SYSTEMS
SMART3 REAGENT SYSTEMS LIST
LaMotte Company continuously updates the list of pre-programmed tests as the
calibrations become available. Pre-programmed calibrations can be added to the
SMART3 Colorimeter in the fi eld. A Windows-based computer running a Windows
Operating System and an 8 pin mini-DIN/9 pin F D-submin serial cable (order Code
1771) are required.
Call LaMotte Technical Services at 1-800-344-3100 (410-778-3100 outside the
USA) or email at tech@lamotte.com for a current list of available calibrations and
downloading instructions.
Range
Test Factor (Test #)
Alkalinity-UDV (001) 0–200 10 Unit Dose Vials (1) 50
Aluminum (002) 0.00–0.30 0.01 Eriochrome Cyanine R (4) 50
Ammonia NitrogenLow Range, Fresh Water (003)
Ammonia NitrogenLow Range, Salt Water (004)
Ammonia NitrogenHigh Range (005)
Barium 0-200 5 Barium Chloride (1) 50
Benzotriazole (009) 0.0–30.0 0.5 UV Photolysis (3) 50
Biguanide (006) 0–70 2 Colorimetric (1) 50
Borate-UDV (007) 0.0–80.0 5.0 Unit Dose Vial (1) 50
Boron (008) 0.00-0.80 0.05 Azomethine-H (2) 50
Bromine-Low Range (010) 0.00–9.00 0.1 DPD (3) 100
Bromine-UDV (011) 0.0–20.0 0.25 DPD (1) 50
Cadmium (012) 0.00–1.00 0.04 PAN (4) 50
Carbohydrazide (013)
See Oxygen Scavengers
Chloride-TesTab (020) 0.0–30.0 0.4 Argentometric (1) 50
Chlorine-Liquid DPD (017) 0.00–4.00 0.03 DPD (3) 144
Chlorine-Tablet DPD (014) 0.00–4.00 0.03 DPD (3) 100
Chlorine-Free-UDV (015) 0.00–10.00 0.10 DPD (1) 50
Chlorine-Total-UDV (18) 0.00–10.00 0.10 DPD (1) 50
Chlorine Dioxide (019) 0.00–8.00 0.10 DPD (2) 100
Chromium, Hexavalent (021) 0.00–1.00 0.01 Diphenylcarbohydrazide (1) 50
Chromium, Hex, Tri, Total (021) 0.00–1.00 0.01 Diphenylcarbohydrazide (5) 50
(ppm) MDL Test Method (# of Reagents)
0.00–1.00 0.05 Salicylate (3) 25
0.00–1.00 0.10 Salicylate (3) 25
0.00–4.00 0.05 Nesslerization (2) 50
0.000–0.900 0.01 Iron Reduction (3) 100
# of
Tests
Page 74

Cobalt (023) 0.00–2.00 0.04 PAN (3) 50
COD-Low Range (024) 0–150 7.5 Digestion (1) 25
COD-Standard Range (025) 0-1500 40 Digestion (1) 25
COD-High Range (026) 0–15000 400 Digestion (1) 25
Color (027) 0–1000 20 Platinum Cobalt (0) –
Copper-BCA-Low Range (028) 0.00–3.50 0.04 Bicinchoninic Acid (1) 50
Copper-Cuprizone (030) 0.00–2.50 0.03 Cuprizone (2) 50
Copper-DDC (031) 0.00–7.00 0.10 Diethyldithiocarbamate (1) 50
Copper-UDV (032) 0.0–4.0 0.1 Bicinchoninic Acid (1) 50
Cyanide (034) 0.00-0.50 0.01 Pyridine-Barbituric Acid (5) 50
Cyanuric Acid (035) 5–200 10 Melamine (1) 50
Cyanuric Acid-UDV (036) 5–150 10 Melamine (1) 50
DEHA (037)
See Oxygen Scavengers
Dissolved Oxygen (038) 0.0–10.0 0.6 Winkler Colorimetric (3) 100
Erythorbic Acid (049)
See Oxygen Scavengers
Fluoride (040) 0.00–2.00 0.10 SPADNS (2) 50
Hardness (Total) UDV (043) 0–450 10 Unit dose Vial (1) 50
Hydrazine (045) 0.00–1.00 0.01 P-dimethyl-
Hydrogen PeroxideLow Range (046)
Hydrogen PeroxideHigh Range (047)
Hydrogen Peroxide-Shock (048) 0–300 5 DPD (2) 100
Hydroquinone (049)
See Oxygen Scavengers
Iodine (050) 0.00–14.00 0.15 DPD (2) 100
Iron-Bipyridyl (051) 0.00–6.00 0.10 Bipyridyl (2) 50
Iron-Total, Ferrous, Ferric (053) 0.00–5.00 0.06 1,10 Phenanthroline (2) 50
Iron-UDV (052) 0.00–10.00 0.05 Bipyridyl (1) 50
Lead (054) 0.00–5.00 0.10 PAR (5) 50
Manganese-Low Range (055) 0.00–0.70 0.01 PAN (3) 50
Manganese-High Range (056) 0.0–15.0 – Periodate (2) 50
Mercury (057) 0.00–1.50 0.01 TMK (3) 50
Methylethylketoxime (058)
See Oxygen Scavengers
Molybdenum-High Range (061) 0.0–50.0 0.6 Thioglycolate (3) 50
Nickel (063) 0.00–8.00 0.15 Dimethylglyoxime (6) 50
0.000–0.700 0.01 Iron Reduction (3) 100
0.00–3.00 0.02 Iron Reduction (3) 100
50
aminobenzaldehyde (2)
0.00–1.50 0.02 DPD (2) 100
0.0–80.0 0.5 DPD (2) 50
0.00–2.00 0.01 Iron Reduction (3) 100
0.00–3.00 0.01 Iron Reduction (3) 100
Page 75

Nitrate Nitrogen-Low Range (064) 0.00–3.00 0.10 Cadmium Reduction (2) 20
Nitrate TesTab (065) 0-60 5 Zinc Reduction (1) 50
Nitrate-UDV (066) 0.00-80.0 2 Zinc Reduction (1) 100
Nitrite Nitrogen-Low Range (067) 0.00–0.80 0.02 Diazotization (2) 20
Nitrogen, Total (069) 3-25 mg/L 3 mg/L Chromotropic Acid/Digestion
(6)
Oxygen Scanvengers various various DEHA (3) 50
Ozone-DPD (070) 0.00–3.00 0.03 DPD (3) 144
Ozone-Low Range (071) 0.00–0.40 0.02 Indigo Trisulfonate (3) 100
Ozone-High Range (072) 0.00–3.00 0.05 Indigo Trisulfonate (3) 20
pH-Chlorophenol Red (073) 5.0–6.8 – Chlorophenol Red (1) 100
pH-Phenol Red (074) 6.6–8.4 – Phenol Red (1) 100
pH-Thymol Blue (075) 8.0–9.6 – Thymol Blue (1) 100
Phenol (077) 0.00-6.00 0.05 Aminoabtipyrine (2) 50
Phosphate-Low Range (078) 0.00–3.00 0.05 Ascorbic Acid Reduction (2) 25
Phosphate-High Range (079) 0.0–70.0 0.5 Vanodomolybd-
phosphoric Acid (1)
Phosphorus, ppb (080) 0–3000 ppb 50 Ascorbic Acid/Reduction (5) 50
Phosphorus, Total, Low Range
(081)
Phosphorus,
Total, High-Range (082)
Potassium (083) 0.0-10.0 0.8 Tetraphenylboron (2) 100
Silica-Low Range (085) 0.0–4.0 0.05 Heteropoly Blue (4) 50
Silica-High Range (086) 0–75 0.5 Silicomolybdate (3) 50
Sulfate-High Range (089) 0–100 3 Barium Chloride (1) 50
Sulfi de-Low Range (090) 0.00–1.50 0.06 Methylene Blue (3) 50
Surfactants (094) 0.00-8.00 0.75 Bromphenol Blue (3) 100
Tannin (096) 0.0–10.0 0.1 Tungsto-molybdophosphoric
Tolytriazole (009)
See Benzotriazole
Turbidity (098) 0.0–30.0 FTU 3 Absorption (0) –
Zinc-Low Range (099) 0.00–3.00 0.05 Zincon (6) 50
0.00–3.50
mg/L
0.0–70.0
mg/L
0.0–30.0 0.5 UV Photolysis (3) 50
0.50 Ascorbic Acid/Digestion 25
5 Molybdovanadate/Digestion
(5)
Acid (2)
25
25
25
50
Page 76

Page 77

ALKALINITY–UDV
UNIT DOSE VIALS • CODE 4318-J
QUANTITY CONTENTS CODE
1 Alkalinity Unit Dose Vials, 20 pouches 4318-J
Equipment needed but not supplied:
STANDARD ACCESSORY PACKAGE · CODE 1961
1 Package of 3 Vials (empty) 0156
1 Syringe, 3 mL, plastic 1184
1 Foil Storage Bag 9467
Or:
ADVANCED ACCESSORY PACKAGE · CODE 1962
1 Pipettor, 3mL 30528
1 Pipet Tip (0-5 mL) 30695
1 Cuvette Rack 31695
1 Package of 3 Vials (empty) 0156
1 Foil Storage Bag 9467
Test Procedures
APPLICATION: Drinking and surface waters; swimming pool water.
RANGE: 0–200 ppm as CaCO
3
MDL: 10 ppm
METHOD The sample is added to a buffered indicator reagent.
The color that develops, ranging from yellow to blue, will
indicate the amount of alkalinity in the sample.
SAMPLE HANDLING
& PRESERVATION:
Samples should be analyzed as soon as possible after
collection. Sample may be refrigerated for 24 hours.
INTERFERENCES: Quats and poly quats at high concentrations will interfere.
SMART3 Test Procedures 11.10 ALKALINITY, UDV
Page 78

PROCEDURE
Use COD/UDV adapter
1. Press and hold until colorimeter turns on.
2. Press
3. Select ALL TESTS (or another sequence containing 001 Alkalinity UDV) from
4. Scroll to and select 001 Alkalinity UDV from menu.
5. Rinse a clean vial (0156) with sample water.
6. Use the syringe (1184) to add 3 mL of sample to the vial.
7. Insert the vial into chamber, close lid and select SCAN BLANK.
8. Remove vial from the colorimeter.
9. Use the syringe (1184) to add 3 mL of sample to an Alkalinity-UDV vial (4318).
10. Wait 90 seconds.
11. Invert vial 3 times to mix.
12. Insert tube into chamber, close lid and select SCAN SAMPLE. Record result.
13. Press
NOTES: For best possible results, a reagent blank should be determined to
account for any contribution to the test result by the reagent system. To determine
the reagent blank, follow the above test procedure to scan a distilled or deionized
Test Procedures
water blank. Then follow the above procedure to perform the test on a distilled or
deionized water sample. This test result is the reagent blank. Subtract the reagent
blank from all subsequent test results of unknown samples. It is necessary to
determine the reagent blank only when a new lot number of reagents is obtained.
ENTER
to select TESTING MENU.
TESTING MENU.
NOTE: If powder residue remains in the bottom of the vial after inverting, invert
once more and tap bottom of vial sharply once or twice to dislodge powder.
Mix.
to turn the colorimeter off or press
EXIT
to exit to a previous
menu or make another menu selection.
UDVs from opened pouches should be used promptly. Store unused vials from
opened pouches in the Foil Storage Bag (9467) to extend the shelf life of the
reagent. Generally, UDVs stored in the bag should be used within 10 days if the
humidity is less than 50% and within 5 days if humidity is greater than 50%. The Foil
Storage Bag contains a desiccant pack with indicator. When the indicator in the
window turns from blue to pink, the bag should be replaced.
ALKALINITY, UDV SMART3 Test Procedures 11.10
Page 79

ALUMINUM
ERIOCHROME CYANINE R METHOD
CODE 364I-01-SC
QUANTITY CONTENTS CODE
5 g *Aluminum Inhibitor Reagent *7865-C
2 x 120 mL *Aluminum Buffer Reagent *7866-J
120 mL Aluminum Indicator Reagent 7867-J
15 mL Aluminum Complexing Reagent 7868-E
1 Spoon, 0.05 g, plastic 0696
2 Pipets, 1.0 mL, plastic 0354
1 Test Tube, glass, 5 mL w/cap 0230
*WARNING: Reagents marked with an * are considered to be potential health
hazards. To view or print a Material Safety Data Sheet (MSDS) for these reagents
go to www.lamotte.com. To obtain a printed copy, contact LaMotte by e-mail,
phone or fax.
Aluminum is the third most common element in the earth’s crust, which accounts
for its wide appearance in many water supplies. Aluminum exists in water as
soluble salts, colloidal compounds, and insoluble compounds. In wastewater that
has been treated by alum coagulation it will appear in one or more of the above
forms. Properly treated drinking water should have an aluminum concentration
below 0.05 mg/L.
Test Procedures
APPLICATION: Drinking, surface, and saline waters; domestic and
industrial wastewater.
RANGE: 0.00–0.30 ppm Aluminum
MDL: 0.01 ppm
METHOD: Aluminum ions buffered to a pH of 6.0 react with
Eriochrome Cyanine R dye to produce a pink to red
complex in proportion to the concentration.
SAMPLE HANDLING
& PRESERVATION:
INTERFERENCES: Fluoride and polyphosphate will interfere. Interference
SMART3 Test Procedures 11.10 ALUMINUM
Collect sample in acid washed glass or plastic bottle.
Analyze as soon as possible.
from iron and manganese is eliminated by the addition of
an inhibitor.
Page 80

PROCEDURE
1. Press and hold until colorimeter turns on.
2. Press
3. Select ALL TESTS (or another sequence containing 002 Aluminum).
4. Scroll to and select 002 Aluminum from menu.
5. Rinse a clean colorimeter tube (0290) with sample water. Fill to the 10 mL line
6. Insert tube into colorimeter chamber and select SCAN BLANK.
7. Rinse a clean test tube (0230) with sample water. Fill to the 5 mL line with
8. Remove tube from colorimeter. Empty sample from tube (0290).
9. Add 5 mL sample from test tube (0230) to empty tube (0290).
10. Use the 0.05 g spoon (0696) to add one measure of *Aluminum Inhibitor
11. Use a 1.0 mL pipet (0354) to add 2 mL of *Aluminum Buffer Reagent (7866).
12. Use a second 1.0 mL pipet (0354) to add 1 mL of Aluminum Indicator Reagent
13. At end of 5 minute waiting period, mix, insert tube into chamber, close lid and
14. Press
NOTE: For the best possible results, a reagent blank should be determined to
account for any contribution to the test result by the reagent system. To determine
the reagent blank, follow the above test procedure to scan a distilled or deionized
Test Procedures
water blank. Add 5 drops of Aluminum Complexing Reagent (7868). Then follow the
above procedure to perform the test on a distilled or deionized water sample. This
test result is the reagent blank. Subtract the reagent blank from all subsequent test
results of unknown samples. It is necessary to determine the reagent blank only
when a new lot number of reagents is obtained.
ENTER
to select TESTING MENU.
with sample.
sample.
Reagent (7865). Cap and mix to dissolve powder.
Cap and mix.
(7867). Cap and mix contents. Wait 5 minutes for maximum color development.
select SCAN SAMPLE. Record result.
to turn the colorimeter off or press
EXIT
to exit to a previous
menu or make another menu selection.
ALUMINUM SMART3 Test Procedures 11.10
Page 81

AMMONIA NITROGEN - LOW RANGE
SALICYLATE METHOD • CODE 3659-01-SC
QUANTITY CONTENTS CODE
60 mL *Salicylate Ammonia #1 *3978-H
10 g *Salicylate #2 *7457-D
2 x 5 g *Salicylate #3 Reagent Powder *7458-C
1 Spoon, 0.1 g, plastic 0699
1 Spoon, 0.15 g, plastic 0727
1 Pipet, 1.0 mL, plastic 0354
*WARNING: Reagents marked with an * are considered to be potential health
hazards. To view or print a Material Safety Data Sheet (MSDS) for these reagents
go to www.lamotte.com. To obtain a printed copy, contact LaMotte by e-mail,
phone or fax.
Ammonia nitrogen is present in various concentrations in many surface and ground
water supplies. Any sudden change in the concentration of ammonia nitrogen
in a water supply is cause for suspicion. A product of microbiological activity,
ammonia nitrogen is sometimes accepted as chemical evidence of pollution when
encountered in natural waters.
Ammonia is rapidly oxidized in natural water systems by special bacterial groups
that produce nitrite and nitrate. This oxidation requires that dissolved oxygen be
available in the water. Ammonia is an additional source of nitrogen as a nutrient
which may contribute to the expanded growth of undesirable algae and other forms
of plant growth that overload the natural system and cause pollution.
Test Procedures
APPLICATION: Low concentrations of ammonia in fresh, brackish and salt
water; fresh and salt water aquariums.
RANGE: 0.00 - 1.00 ppm Ammonia-Nitrogen
MDL: 0.05 ppm Fresh Water
0.10 ppm Salt Water
METHOD: Salicylate and ammonia react at high pH in the presence
of a chlorine donor and an iron catalyst to form a blue
indophenol dye, the concentration of which is proportional
to the ammonia concentration in the sample.
SAMPLE HANDLE &
PRESERVATION:
INTERFERENCES: There are few interferences in most natural waters. High
SMART3 Test Procedures 11.10 AMMONIA NITROGEN, Low Range
Ammonia solutions tend to be unstable and should be
analyzed immediately. Samples may be stored for 24 hours
at 4°C or 28 days at –20°C.
concentrations of reducing agents, such as hydrazine,
react with the chlorine donor and can result in negative
interferences. Color and turbidity can also interfere.
Page 82

PROCEDURE - FRESH WATER
1. Press and hold until colorimeter turns on.
2. Press
3. Select ALL TESTS (or another sequence containing 003 Ammonia-N LRF)
4. Scroll to and select 003 Ammonia-N LRF from menu.
5. Rinse a clean tube (0290) with sample water. Fill to the 10 mL line with sample.
6. Insert tube into chamber, close lid and select SCAN BLANK. (See Note.)
7. Remove tube from colorimeter. Use the 1.0 mL plastic pipet (0354) to add 2.0
8. Use the 0.15 g spoon (0727) to add two measures of *Salicylate #2 Reagent
9. At end of 1 minute waiting period use 0.1 g spoon (0699) to add two measures
10. At the end of the 12 minute waiting period, immediately mix and insert tube into
11. Press
CALCULATIONS:
ENTER
to select TESTING MENU.
from TESTING MENU.
mL of *Salicylate Ammonia #1 (3978). Cap and mix.
(7457). Cap and mix until dissolved. Wait 1 minute.
of *Salicylate #3 Reagent Powder (7458). Cap and shake vigorously for at
least 30 seconds and all solid has dissolved. Wait 12 minutes for maximum
color development.
chamber, close lid and select SCAN SAMPLE. Record result.
to turn colorimeter off or press
EXIT
to exit to a previous menu or
make another menu selection.
To express results as Unionized Ammonia (NH3):
ppm Unionized Ammonia (NH3) =
ppm Ammonia-Nitrogen (NH3–N) x 1.2
Test Procedures
To express results as Ionized Ammonia (NH4):
ppm Ionized Ammonia (NH
+
) =
4
ppm Ammonia-Nitrogen (NH3–N) x 1.3
To determine the percentages of Unionized and Ionized Ammonia-Nitrogen, consult
the Appendix.
NOTE: It is strongly suggested that a reagent blank be determined to account for
any contribution to the test result by the reagent system. To determine the reagent
blank, follow the above test procedure to scan a distilled or deionized water blank.
Then follow the above procedure to perform the test on a distilled or deionized
water sample. This test result is the reagent blank. Subtract the reagent blank from
all subsequent test results of unknown samples. It is necessary to determine the
reagent blank only when a new lot number of reagents is obtained.
PROCEDURE - SALT WATER
AMMONIA NITROGEN, Low Range SMART3 Test Procedures 11.10
Page 83

1. Press and hold until colorimeter turns on.
2. Press
ENTER
to select TESTING MENU.
3. Select ALL TESTS (or another sequence containing 004 Ammonia-N LRS)
from TESTING MENU.
4. Scroll to and select 004 Ammonia-N LRS from menu.
5. Rinse a clean tube (0290) with sample water. Fill to the 10 mL line with sample.
6. Insert tube into chamber, close lid and select SCAN BLANK. (See Note.)
7. Remove tube from colorimeter. Use the 1.0 mL plastic pipet (0354) to add 2.0
mL of *Salicylate Ammonia #1 (3978). Cap and mix.
8. Use the 0.15 g spoon (0727) to add two measures of *Salicylate #2 Reagent
(7457). Cap and mix until dissolved. Wait 1 minute.
9. At end of 1 minute waiting period use 0.1 g spoon (0699) to add two measures
of *Salicylate #3 Reagent Powder (7458). Cap and shake vigorously for at
least 30 seconds and all solid has dissolved. Wait 20 minutes for maximum
color development.
10. At the end of the 20 minute waiting period, immediately mix and insert tube into
chamber, close lid and select SCAN SAMPLE. Record result.
11. Press to turn colorimeter off or press
EXIT
to exit to a previous menu or
make another menu selection.
CALCULATIONS:
To express results as Unionized Ammonia (NH3):
Test Procedures
ppm Unionized Ammonia (NH3) =
ppm Ammonia-Nitrogen (NH3–N) x 1.2
To express results as Ionized Ammonia (NH4):
ppm Ionized Ammonia (NH
4
+
) =
ppm Ammonia-Nitrogen (NH3–N) x 1.3
To determine the percentages of Unionized and Ionized Ammonia-Nitrogen, consult
the Appendix.
NOTE: It is strongly suggested that a reagent blank be determined to account for
any contribution to the test result by the reagent system. To determine the reagent
blank, follow the above test procedure to scan a distilled or deionized water blank.
Then follow the above procedure to perform the test on a distilled or deionized
water sample. This test result is the reagent blank. Subtract the reagent blank from
all subsequent test results of unknown samples. It is necessary to determine the
reagent blank only when a new lot number of reagents is obtained.
SMART3 Test Procedures 11.10 AMMONIA NITROGEN, Low Range
Page 84

AMMONIA NITROGEN - HIGH RANGE
NESSLERIZATION METHOD •CODE 3642-SC
QUANTITY CONTENTS CODE
30 mL Ammonia Nitrogen Reagent #1 V-4797-G
2 x 30 mL *Ammonia Nitrogen Reagent #2 *V-4798-G
1 Pipet, 1 mL, plastic 0354
*WARNING: Reagents marked with an * are considered to be potential health
hazards. To view or print a Material Safety Data Sheet (MSDS) for these reagents
go to www.lamotte.com. To obtain a printed copy, contact LaMotte by e-mail,
phone or fax.
Ammonia nitrogen is present in various concentrations in many surface and ground
water supplies. Any sudden change in the concentration of ammonia nitrogen
in a water supply is cause for suspicion. A product of microbiological activity,
ammonia nitrogen is sometimes accepted as chemical evidence of pollution when
encountered in natural waters.
Ammonia is rapidly oxidized in natural water systems by special bacterial groups
that produce nitrite and nitrate. This oxidation requires that dissolved oxygen be
available in the water. Ammonia is an additional source of nitrogen as a nutrient
which may contribute to the expanded growth of undesirable algae and other forms
of plant growth that overload the natural system and cause pollution.
APPLICATION: Drinking, surface, and saline waters; domestic and
industrial wastes.
RANGE: 0.00–4.00 ppm Ammonia Nitrogen
MDL: 0.05 ppm
Test Procedures
METHOD: Ammonia forms a colored complex with Nessler’s
Reagent in proportion to the amount of ammonia
present in the sample. Rochelle salt is added to
prevent precipitation of calcium or magnesium in
undistilled samples.
SAMPLE HANDLING &
PRESERVATION:
INTERFERENCES: Sample turbidity and color may interfere. Turbidity
Ammonia solutions tend to be unstable and should
be analyzed immediately. Sample may be stored for
24 hours at 4°C or 28 days at –20°C.
may be removed by a fi ltration procedure. Color
interference may be eliminated by blanking the
instrument with a sample blank.
AMMONIA NITROGEN, Low Range SMART3 Test Procedures 11.10
Page 85

PROCEDURE
1. Press and hold until colorimeter turns on.
2. Press
3. Scroll to and select ALL TESTS (or another sequence containing 005
4. Scroll to and select 005 Ammonia-N HR from menu.
5. Rinse a clean tube (0290) with sample water. Fill to the 10 mL line with sample.
6. Insert tube into chamber, close lid and select SCAN BLANK. (See Note)
7. Remove tube from colorimeter. Add 8 drops of Ammonia Nitrogen Reagent #1
8. Use the 1.0 mL pipet (0354) to add 1.0 mL of *Ammonia Nitrogen Reagent #2
9. At end of the 5 minute waiting period, immediately mix, insert tube into
10. Press
CALCULATIONS:
ENTER
to select TESTING MENU.
Ammonia-N HR) from TESTING MENU.
(V-4797). Cap and mix. Wait 1 minute.
(V-4798). Cap and mix. Allow 5 minutes for maximum color development.
chamber, close lid and select SCAN SAMPLE. Record result.
to turn the colorimeter off or press the
EXIT
exit to a previous
menu or make another menu selection.
To express results as Unionized Ammonia (NH3):
ppm Unionized Ammonia (NH3) =
ppm Ammonia-Nitrogen (NH3–N) x 1.2
To express results as Ionized Ammonia (NH4):
ppm Ionized Ammonia (NH
4
+
) =
ppm Ammonia-Nitrogen (NH3–N) x 1.3
To determine the percentages of Unionized and Ionized Ammonia-Nitrogen, consult
the Appendix.
NOTE: It is strongly suggested that a reagent blank be determined to account for
any contribution to the test result by the reagent system. To determine the reagent
blank, follow the above test procedure to scan a distilled or deionized water blank.
Then follow the above procedure to perform the test on a distilled or deionized
water sample. This test result is the reagent blank. Subtract the reagent blank from
all subsequent test results of unknown samples. It is necessary to determine the
reagent blank only when a new lot number of reagents is obtained.
SMART3 Test Procedures 11.10 AMMONIA NITROGEN, High Range
Test Procedures
Page 86

Test Procedures
AMMONIA NITROGEN, High Range SMART3 Test Procedures 11.10
Page 87

BARIUM
BARIUM CHLORIDE METHOD • CODE 3638-SC
QUANTITY CONTENTS CODE
50 g Barium Reagent Powder 6330-H
1 Spoon, 0.5g, plastic 0698
*WARNING: Reagents marked with an * are considered to be potential health
hazards. To view or print a Material Safety Data Sheet (MSDS) for these reagents go
to www.lamotte.com. To obtain a printed copy, contact LaMotte by e-mail, phone or
fax.
Barium is a naturally occurring metal that is found in rocks and, in trace amounts, in
natural waters. A barium concentration above 2 ppm in drinking water is a classifi ed
as a contaminant. Barium sulfate is used in the medical fi eld as an X-ray radio
contrast agent for imaging the gastrointestinal tract. Barium has many industrial
applications. It is used in the manufacture of paints, brakes, root canal fi llings,
glass, and motor oil detergents. Barium nitrate imparts a bright yellow-green color to
fi reworks and fl ares. Barium sulfate is a component of oil well drilling mud which is
used to lubricate drill bits. Barium is also a constituent of some electro ceramics and
high temperature yttrium barium copper oxide (YBCO) superconductors.
APPLICATION: Industrial
RANGE: 0 – 200 ppm barium
MDL: 5 ppm
METHOD: Barium is precipitated in an acid medium with
sodium sulfate to form a barium sulfate suspension in
proportion to the amount of barium present.
SAMPLE HANDLING &
PRESERVATION:
INTERFERENCES: Suspended matter and color interference may be
SMART3 Test Procedures 02.12 BARIUM
Barium samples may be preserved by refrigeration at
4°C up to 7 days in glass or plastic containers without
any change in concentration.
removed by a fi ltration step. Silica in excess of 500
mg/L will interfere. Check for stray light interference
(see page 69).
Test Procedures
Page 88

PROCEDURE
1. Press and hold until colorimeter turns on.
2. Press
3. Select ALL TESTS (or another sequence containing 018 Barium) from TESTING
4. Scroll to and select 018 Barium from menu.
5. Rinse a tube (0290) with sample water. Fill to the 10 mL line with sample.
6. Insert the tube into chamber, close the lid and select SCAN BLANK.
7. Remove the tube from the colorimeter.
8. Use the 0.5 g spoon (0698) to add one measure of Barium Reagent Powder
9. Insert tube into chamber, close lid and select SCAN SAMPLE. Record result in
10. Press
NOTE: A while fi lm is deposited on the inside of test tubes as a result of the barium
test. Thoroughly clean and rinse test tubes after each test.
ENTER
to select Testing Menu.
MENU.
(6330). Cap and mix by inverting for one minute.
ppm barium.
to turn the colorimeter off or press
or make another menu selection.
EXIT
to exit to a previous menu
For the most accurate results, samples and reactions should be at 25 ±4°C.
Test Procedures
BARIUM SMART3 Test Procedures 02.12
Page 89

BENZOTRIAZOLE/TOLYLTRIAZOLE
UV Photolysis Method • CODE 4047
QUANTITY CONTENTS CODE
15 g *Benzotriazole Reagent *3818-E
25 mL Potassium Sodium Tartrate Solution 7841WT-G
25 mL *Sulfuric Acid *6139WT-G
1 pH Test Papers, 1–11 2956
1 Spoon, 0.25 g, plastic 0695
1 Erlenmeyer Flask, 25 mL, glass 2-2109
1 Graduated Cylinder, 25 mL, glass 0417
*WARNING: Reagents marked with an * are considered to be potential health
hazards. To view or print a Material Safety Data Sheet (MSDS) for these reagents
go to www.lamotte.com. To obtain a printed copy, contact LaMotte by e-mail,
phone or fax.
Equipment needed but not supplied:
1 UV Shielding Goggles 31041
1 Pen-Ray UV Lamp 31041-1
1 Pen-Ray Lamp Power Source 31041-2
Test Procedures
Proper safety precautions must be followed when using the Pen-Ray UV lamp and
power source (31041-1 and 31041-2) to prevent eye and skin damage. Always
wear the UV Shielding Goggles (31041) while the lamp is turned on. Never handle
the lamp itself; always hold it by the socket. Wipe the lamp dry with a clean, soft
tissue after each test. Do not operate the lamp outside the Erlenmeyer Flask fi lled
with water.
Benzotriazole and tolyltriazole form strong complexes with metals. They are used in
antifreeze for cars, lubricating oil, and photographic anti-fogging agents. In cooling
water systems benzotriazole and tolyltriazole are used as corrosion and rust
inhibitors together with many kinds of scale inhibitors, bactericides and algaecides.
SMART3 Test Procedures 11.10 BENZOTRIAZOLE/TOLYTRIAZOLE
Page 90

APPLICATION: Corrosion and rust inhibitors in cooling water systems
RANGE: 0.0 – 30.0 ppm Benzotriazole
0.0 – 30.0 ppm Tolyltriazole
MDL: 0.5 ppm Benzotriazole
0.5 ppm Tolyltriazole
METHOD: Benzotriazole and tolyltriazole are UV-photolyzed in a
buffered solution with a pH between 4 and 6. A yellow
color develops in proportion to the concentration of triazole
present.
SAMPLE
HANDLING &
Samples should be analyzed as soon as possible after
collection.
PRESERVATION:
INTERFERENCES: Tolyltriazole with interfere in the benzotriazole test.
Benzotriazole will interfere in the tolyltriazole test. Strong
reducing or oxidizing agents will interfere.
Test Procedures
BENZOTRIAZOLE/TOLYTRIAZOLE SMART3 Test Procedures 11.10
Page 91

BENZOTRIAZOLE PROCEDURE
1. Press and hold until colorimeter turns on.
2. Press
3. Select ALL TESTS (or another sequence containing 009 Benzotriazole)from
4. Scroll to and select 009 Benzotriazole from menu.
5. Rinse a tube (0290) with sample water. Fill to 10 mL with sample.
6. Insert the tube into chamber, close lid and select SCAN BLANK.
7. Remove the tube from colorimeter. Discard the sample.
8. Adjust the sample water temperature to between 20 and 25°C if necessary.
9. Fill the graduated cylinder (0417) to the 25 mL line with sample water. Transfer
10. Use the pH Test Paper (2956) to check the pH of the sample. If the pH is not
11. Add 10 drops of Potassium Sodium Tartrate (7841WT).
12. Use the 0.25 g spoon (0695) to add one measure of *Benzotriazole Reagent
13. Replace the fl ask in the slot in the case. Insert the Pen-Ray Lamp (31041-1)
14. Fill a test tube (0290) to the 10 mL line with the digested sample. Cap tube.
15. Insert tube into chamber, close lid and select SCAN SAMPLE. Record result in
16. Press
NOTE: For best possible results, a reagent blank should be determined to account
for any contribution to the test result by the reagent system. To determine the
reagent blank, follow the above test procedure to scan a distilled or deionized
water blank. Then follow the above procedure to perform the test on a distilled or
deionized water sample. This test result is the reagent blank. Subtract the reagent
blank from all subsequent test results of unknown samples. It is necessary to
determine the reagent blank only when a new lot number of reagents is obtained.
ENTER
to select Testing Menu.
TESTING MENU.
to the Erlenmeyer Flask (2-2109).
between 4 and 6, add one drop of *Sulfuric Acid, 1.0N (6139). Swirl to mix.
Continue adding *Sulfuric Acid, 1.0N (6139) one drop at a time, swirling to mix
and checking the pH after each drop, until the pH is between 4 and 6.
(3818). Swirl to mix until the powder has dissolved.
into the fl ask. Plug in the Pen-Ray Power Source (31041-2) and turn the lamp
on for exactly 5 minutes. Remove the lamp from the fl ask. Rinse and wipe the
lamp dry.
ppm Benzotriazole.
to turn the colorimeter off or press
EXIT
to exit to a previous
menu or make another menu selection.
Test Procedures
SMART3 Test Procedures 11.10 BENZOTRIAZOLE/TOLYTRIAZOLE
Page 92

TOLYLTRIAZOLE PROCEDURE
1. Press and hold until colorimeter turns on.
2. Press
3. Select ALL TESTS (or another sequence containing 097 Tolyltriazole) from
4. Scroll to and select 097 Tolyltriazole from menu.
5. Rinse a tube (0290) with sample water. Fill to 10 mL with sample.
6. Insert the tube into chamber, close lid and select SCAN BLANK.
7. Remove the tube from colorimeter. Discard the sample.
8. Adjust the sample water temperature to between 20 and 25°C if necessary.
9. Fill the graduated cylinder (0417) to the 25 mL line with sample water. Transfer
10. Use the pH Test Paper (2956) to check the pH of the sample. If the pH is not
11. Add 10 drops of Potassium Sodium Tartrate (7841WT).
12. Use the 0.25 g spoon (0695) to add one measure of *Benzotriazole Reagent
13. Replace the fl ask in the slot in the case. Insert the Pen-Ray Lamp (31041-1)
14. Fill a test tube (0290) to the 10 mL line with the digested sample. Cap tube.
15. Insert tube into chamber, close lid and select SCAN SAMPLE. Record result in
Test Procedures
16. Press
NOTE: For best possible results, a reagent blank should be determined to account
for any contribution to the test result by the reagent system. To determine the
reagent blank, follow the above test procedure to scan a distilled or deionized
water blank. Then follow the above procedure to perform the test on a distilled or
deionized water sample. This test result is the reagent blank. Subtract the reagent
blank from all subsequent test results of unknown samples. It is necessary to
determine the reagent blank only when a new lot number of reagents is obtained.
ENTER
to select Testing Menu.
TESTING MENU.
to the Erlenmeyer Flask (2-2109).
between 4 and 6, add one drop of *Sulfuric Acid, 1.0N (6139). Swirl to mix.
Continue adding *Sulfuric Acid, 1.0N (6139) one drop at a time, swirling to mix
and checking the pH after each drop, until the pH is between 4 and 6.
(3818). Swirl to mix until the powder has dissolved.
into the fl ask. Plug in the Pen-Ray Power Source (31041-2) and turn the lamp
on for exactly 5 minutes. Remove the lamp from the fl ask. Rinse and wipe the
lamp dry.
ppm Tolyltriazole.
to turn the colorimeter off or press
EXIT
to exit to a previous
menu or make another menu selection.
BENZOTRIAZOLE/TOLYTRIAZOLE SMART3 Test Procedures 11.10
Page 93

BIGUANIDE
COLORIMETRIC METHOD • CODE 4044
QUANTITY CONTENTS CODE
2 X 60 mL Biguanide Indicator 3994-H
1 Pipet, plastic, 1.0 mL 0354
Biguanide is a non-chlorine, non-bromine chemical sanitizer. It is more stable
than chlorine or bromine and has little chemical odor. Biguanide is an effective
bacteriacide but, unlike chlorine and bromine, it does not destroy organic
contaminants. Therefore, hydrogen peroxide is added to biguanide pools on a
regular basis to eliminate organic contaminants. The optimum recommended level
of biguanide is 30 to 50 ppm.
APPLICATION: Swimming pools
RANGE: 0–70 ppm Biguanide
MDL: 2 ppm
METHOD: Biguanide complexes with the proprietary indicator to
produce a colored solution. The color ranges from yellow
through green to blue depending on the biguanide
concentration.
SAMPLE
HANDLING &
PRESERVATION:
INTERFERENCES: The only interfering substances that are likely to be
Samples should be analyzed as soon as possible.
encountered in pool water are oxidized manganese and
oxidizing agents, such as chlorine, bromine and ozone.
Test Procedures
SMART3 Test Procedures 11.10 BIGUANIDE
Page 94

PROCEDURE
1. Press and hold until colorimeter turns on.
2. Press
3. Select ALL TESTS (or another sequence containing 006 Biguanide) from
4. Scroll to and select 006 Biguanide from menu.
5. Rinse a tube (0290) with sample water. Fill to 10 mL with sample.
6. Insert the tube into chamber, close lid and select SCAN BLANK.
7. Remove the tube from colorimeter.
8. Use the 1.0 mL pipet (0354) to add 2.0 mL of Biguanide Indicator (3994). Cap
9. Wait 1 minute.
10. Insert the tube into chamber. Close lid.
11. Select SCAN SAMPLE. Record result in ppm Biguanide
12. Press
NOTE: For best possible results, a reagent blank should be determined to account
for any contribution to the test result by the reagent system. To determine the
reagent blank, follow the above test procedure to scan a distilled or deionized
water blank. Then follow the above procedure to perform the test on a distilled or
deionized water sample. This test result is the reagent blank. Subtract the reagent
blank from all subsequent test results of unknown samples. It is necessary to
determine the reagent blank only when a new lot number of reagents is obtained.
Test Procedures
ENTER
to select Testing Menu.
TESTING MENU.
and invert three times to mix.
to turn the colorimeter off or press
menu or make another menu selection.
EXIT
to exit to a previous
BIGUANIDE SMART3 Test Procedures 11.10
Page 95

BORATE - UDV
UNIT DOSE VIALS • CODE 4322-J
QUANTITY CONTENTS CODE
50 Borate UDV, 20 pouches 4322-J
Equipment needed but not supplied:
STANDARD ACCESSORY PACKAGE · CODE 1961
1 Package of 3 Vials (empty) 0156
1 Syringe, 3 mL, plastic 1184
1 Foil Storage Bag 9467
Or:
ADVANCED ACCESSORY PACKAGE · CODE 1962
1 Pipettor, 3mL 30528
1 Pipet Tip (0-5 mL) 30695
1 Cuvette Rack 31695
1 Package of 3 Vials (empty) 0156
1 Foil Storage Bag 9467
Test Procedures
Some swimming pools use a borate buffering system. Borates lower the level
of carbon dioxide in the pool, which slows algae growth. This results in a lower
chlorine requirement. Free chlorine levels in pools with borate systems can be
maintained at 1.0 ppm.
Small amounts of boron are necessary for plant growth but large amounts can be
toxic. In humans, boron aids in the uptake of calcium and the production of strong
bones. An excess of boron can affect the central nervous system resulting in a
syndrome known as borism. Some natural waters may contain small amounts of
boron. Large concentrations may be due to industrial effl uent entering waterways.
Boron compounds are used in cleaning compounds, paper and paints, fertilizers,
glass and ceramics, fi re retardants and the production of alloys. In the atomic
energy fi eld, boron is a component of neutron shields and nuclear reactors.
SMART3 Test Procedures 11.10 BORATE, UDV
Page 96

APPLICATION: swimming pools, surface and saline waters, hydroponic
solutions, industrial waste.
RANGE: 0.00 – 80.0 ppm boron
MDL: 5 ppm
METHOD: Borate reacts with a selective boron indicator powder to
form a colored complex at pH 7.2 to 7.4 in proportion to
the concentration of boron present.
SAMPLE HANDLING &
PRESERVATION:
Store samples in polyethylene bottles. Do not use
borate detergents or glassware.
INTERFERENCES: Interferences in swimming pool water are unlikely.
Test Procedures
BORATE, UDV SMART3 Test Procedures 11.10
Page 97

PROCEDURE
Use COD/UDV adapter
1. Press until colorimeter turns on.
2. Press
3. Select ALL TESTS (or another sequence containing 007 Borate UDV) from
4. Scroll to and select 007 Borate UDV from menu.
5. Rinse a clean vial (0156) with sample water.
6. Use the syringe (1184) to add 3mL of sample to the vial.
7. Insert the vial into chamber, close the lid and select SCAN BLANK.
8. Remove the vial from the colorimeter.
9. Use the syringe (1184) to add 3mL of sample to a Borate UDV vial (4322).
10. Wait 3 minute.
11. Invert the vial three times to mix.
12. Immediately insert tube into chamber, close lid and select SCAN SAMPLE.
13. Press
NOTE: For best possible results, a reagent blank should be determined to account
for any contribution to the test result by the reagent system. To determine the
reagent blank, follow the above test procedure to scan a distilled or deionized
water blank. Then follow the above procedure to perform the test on a distilled or
deionized water sample. This test result is the reagent blank. Subtract the reagent
blank from all subsequent test results of unknown samples. It is necessary to
determine the reagent blank only when a new lot number of reagents are obtained.
ENTER
to select Testing Menu.
TESTING MENU.
NOTE: If powder residue remains in the bottom of the vial after inverting or air
bubbles form, invert once more and tap bottom of vial sharply once or twice to
dislodge powder and bubbles. Mix.
Record result in ppm borate.
to turn the colorimeter off or press
EXIT
to exit to a previous
menu or make another menu selection.
Test Procedures
NOTE: UDVs from opened pouches should be used promptly. Store unused vials
from opened pouches in the Foil Storage Bag (9467) to extend the shelf life of the
reagent. Generally, UDVs stored in the bag should be used within 10 days if the
humidity is less than 50% and within 5 days if humidity is greater than 50%. The Foil
Storage Bag contains a desiccant pack with indicator. When the indicator in the
window turns from blue to pink, the bag should be replaced.
SMART3 Test Procedures 11.10 BORATE, UDV
Page 98

Test Procedures
BORATE, UDV SMART3 Test Procedures 11.10
Page 99

BORON
AZOMETHINE-H METHOD · CODE 4868-01
QUANTITY CONTENTS CODE
120 mL *Boron Buffer *4869-J
10 g *Boron Indicator Powder *4870-D
1 Pipet, plastic, 1.0 mL 0354
1 Spoon, 0.15 g 0727
1 Dark storage chamber, brown 0108
*WARNING: Reagents marked with an * are considered to be potential health
hazards. To view or print a Material Safety Data Sheet (MSDS) for these reagents go
to www.lamotte.com. To obtain a printed copy, contact LaMotte by e-mail, phone or
fax.
Small amounts of boron are necessary for plant growth but large amounts can be
toxic. In humans, boron aids in the uptake of calcium and the production of strong
bones. An excess of boron can affect the central nervous system resulting in a
syndrome known as borism. Some natural waters may contain small amounts of
boron. Large concentrations may be due to industrial effl uent entering waterways.
Boron compounds are used in cleaning compounds, paper and paints, fertilizers,
glass and ceramics, fi re retardants and the production of alloys. In the atomic
energy fi eld, boron is a component of neutron shields and nuclear reactors. Some
swimming pools use boron buffering systems.
Test Procedures
APPLICATION: Surface and saline waters, hydroponic solutions, industrial
waste, swimming pools.
RANGE: 0.00–0.80 ppm Boron
MDL: 0.05
METHOD: Azomethine-H and borate form a yellow complex at pH 6
in proportion to the concentration of boron present.
SAMPLE HANDLING
& PRESERVATION:
INTERFERENCES: Interferences in drinking water are unlikely. Manganese,
SMART3 Test Procedures 2.11 BORON
Store samples in polyethylene bottles. Do not use borate
detergents or glassware.
zirconium, chromium, titanium, copper, vanadium,
aluminum, beryllium and iron may cause high results.
Page 100

PROCEDURE
1. This test requires a Reagent Blank. Rinse a tube (0290) with clear, colorless,
boron free water. Fill to 10 mL line with clear, colorless, boron free water.
2. Use the 1.0 mL pipet (0354) to add 2 mL of *Boron Buffer (4869). Cap and mix.
3. Use the 0.15 g spoon (0727) to add one level measure of *Boron Indicator
Powder (4870). Press full spoon against side of jar to compress powder. Scrape
off excess powder on inside neck of bottle. Tap excess off spoon handle.
4. Cap and shake vigorously for 30 seconds.
5. Insert the tube into meter chamber. Close lid.
6. Start a timer set for 30 minutes. Do not open the lid during the waiting time. The
reaction is photosensitive.
7. Rinse a clean tube (0290) with Sample Water. Fill to the 10 mL line with sample
water. Repeat steps 2–4.
8. Insert the tube into the Dark Storage Chamber (0108). Close top.
9. Start a second timer set for 30 minutes. Do not open the chamber during the
waiting time. The reaction is photosensitive.
10. When 2 minutes remain on the fi rst timer (Reagent Blank), press and hold ON
button until colorimeter turns on.
11. Press and hold
12. Press
ENTER
to select TESTING MENU.
13. Select ALL TESTS (or another sequence containing 008 Boron) from TESTING
MENU.
14. Scroll to and select 008 Boron from menu.At the end of the Reagent Blank 30
minute waiting period, remove Reagent Blank tube from meter chamber. Invert
several times to mix.
Test Procedures
15. Insert the tube into meter chamber, close lid and select SCAN BLANK.
16. Remove the tube from colorimeter.
17. At the end of the Sample Water 30 minute waiting period, remove Sample Water
tube from Dark Storage Chamber. Invert several times to mix.
18. Insert tube into meter chamber, close lid and select SCAN SAMPLE. Record
result in ppm boron.
19. Press to turn colorimeter off or press the
or make another menu selection.
until colorimeter turns on.
EXIT
to exit to a previous menu
BORON SMART3 Test Procedures 2.11
 Loading...