

Page 1

OPERATOR’S
MANUAL
v3.0 and higher • Printed 2.11
2000-01-MN
Page 2

CONTENTS
GENERAL INFORMATION
Packaging & Delivery .................................................................................... 4
General Precautions ...................................................................................... 4
Safety Precautions ........................................................................................ 4
Limits of Liability ............................................................................................ 5
Warranty ......................................................................................................... 5
Specifi cations ................................................................................................ 6
Statistical and Technical Defi nitions
Related to Product Specifi cations ................................................................ 6
Contents and Accessories ............................................................................. 8
EPA Compliance ............................................................................................ 8
CE Compliance .............................................................................................. 8
CHEMICAL TESTING
Water Sampling for Chemical Analysis ......................................................... 9
Filtration ....................................................................................................... 10
An Introduction to Colorimetric Analysis & Spectroscopy ......................... 11
Reagent Blank ............................................................................................. 12
Spectrophotometer Tubes ........................................................................... 12
Selecting an Appropriate Wavelength ........................................................ 12
Calibration Curves ....................................................................................... 13
Preparing Dilute Standard Solutions............................................................ 15
Standard Additions ...................................................................................... 15
Sample Dilution Techniques & Volumetric Measurements ......................... 16
Interferences ................................................................................................ 17
Stray Light Interference ............................................................................... 17
OPERATION OF THE SMART SPECTRO
SPECTROPHOTOMETER
Overview ...................................................................................................... 18
Power Supply ............................................................................................... 18
Components ................................................................................................ 19
Quick Start ................................................................................................... 20
GENERAL OPERATING PROCEDURES
The Keypad ................................................................................................. 22
Sample Holders ............................................................................................ 22
The Display & the Menus ............................................................................ 23
Page 3

CALIBRATION
Calibrate Wavelength .................................................................................. 24
PROGRAMMED TESTS
Introduction ................................................................................................. 25
Sequences of Tests ..................................................................................... 26
General Testing Procedures ........................................................................ 27
Testing with the Programmed Tests ............................................................ 27
SETUP & EDIT SEQUENCES & USER TESTS
Edit a Sequence .......................................................................................... 30
Adding or Deleting Tests ............................................................................. 31
Edit User Tests ............................................................................................. 35
Naming the Test ................................................................................. 37
Selecting the Wavelength .................................................................. 39
Entering a New Calibration ................................................................ 40
Selecting the Numerical Format of the Result .................................. 43
MEASURING IN THE %T/ABS MODE
44
PC LINK
Output .......................................................................................................... 46
Computer Connection ................................................................................. 46
EDIT CLOCK 47
ENERGY MODE 48
STORE METHOD 49
TEST MODE 50
BATTERY OPERATION
Charging the Batteries ................................................................................ 51
Running the SMART Spectro Using Batteries ............................................ 51
MAINTENANCE
Cleaning ...................................................................................................... 52
Light Bulb .................................................................................................... 52
Clock Battery ............................................................................................... 52
Meter Disposal .............................................................................................. 53
TROUBLESHOOTING GUIDE
Error Messages ........................................................................................... 54
Helpful Hints ................................................................................................ 55
SMART SPECTRO TEST PROCEDURES
APPENDIX
Page 4

GENERAL INFORMATION
PACKAGING & DELIVERY
Experienced packaging personnel at LaMotte Company assure adequate
protection against normal hazards encountered in transportation of shipments.
After the product leaves the manufacturer, all responsibility for its safe delivery
is assured by the transportation company. Damage claims must be fi led
immediately with the transportation company to receive compensation for
damaged goods.
Should it be necessary to return the instrument for repair or servicing, pack
instrument carefully in suitable container with adequate packing material. A
return authorization number must be obtained from LaMotte Company by
calling 1-800-344-3100. Attach a letter with the authorization number to the
shipping carton which describes the kind of trouble experienced. This valuable
information will enable the service department to make the required repairs
more effi ciently.
GENERAL PRECAUTIONS
Before attempting to set up or operate this instrument it is important to read the
instruction manual. Failure to do so could result in personal injury or damage to
the equipment.
The SMART Spectro should not be stored or used in a wet or corrosive
environment. Care should be taken to prevent water or reagent chemicals from
wet spectrophotometer tubes from entering the SMART Spectro chamber.
NEVER PUT WET TUBES IN SPECTROPHOTOMETER.
SAFETY PRECAUTIONS
Read the labels on all LaMotte reagent containers prior to use. Some containers
include precautionary notices and fi rst aid information. Certain reagents are
considered hazardous substances and are designated with a * in the instruction
manual. Material Safety Data Sheets (MSDS) available at www.lamotte.com.
Read the accompanying MSDS before using these reagents. Additional
emergency information for all LaMotte reagents is available 24 hours a day from
the Poison Control Center listed in the front of the phone book or by contacting
the 24 hour emergency line for ChemTel 1-800-255-3924 (USA, Canada,
Puerto Rico); locations outside the North American continent 813-248-0585.
Be prepared to supply the name and four-digit LaMotte code number found on
the container label or at the top of the MSDS or in the contents list for the test
procedure. LaMotte reagents are registered with a computerized poison control
information system available to all local poison control centers.
Keep equipment and reagent chemicals out of the reach of young children.
4 SMART Spectro Operator’s Manual 2.11
Page 5

LIMITS OF LIABILITY
Under no circumstances shall LaMotte Company be liable for loss of life,
property, profi ts, or other damages incurred through the use or misuse of their
products.
WARRANTY
LaMotte Company warrants this instrument to be free of defects in parts
and workmanship for 2 years from the date of shipment. If it should become
necessary to return the instrument for service during or beyond the warranty
period, contact our Technical Service Department at 1-800-344-3100 for a
return authorization number or visit www.lamotte.com for troubleshooting help.
The sender is responsible for shipping charges, freight, insurance and proper
packaging to prevent damage in transit. This warranty does not apply to defects
resulting from action of the user such as misuse, improper wiring, operation
outside of specifi cation, improper maintenance or repair, or unauthorized
modifi cation. LaMotte Company specifi cally disclaims any implied warranties
or merchantability or fi tness for a specifi c purpose and will not be liable for any
direct, indirect, incidental or consequential damages. LaMotte Company’s total
liability is limited to repair or replacement of the product. The warranty set forth
above is inclusive and no other warranty, whether written or oral, is expressed or
implied.
SMART Spectro Operator’s Manual 2.11 5
Page 6

SPECIFICATIONS
INSTRUMENT TYPE: Single beam spectrophotometer
Readout 5 line, 18 character per line LCD
Wavelengths 350-1000 nm
Wavelength Accuracy ± 2 nm
Wavelenth Resolution 1 nm
Wavelength Bandwidth 5 nm (max)
Photometric Range 0-125%T, –0.1-2.5A
Photometric Accuracy ± 0.005A
Photometric Stray Light <0.5%T
Dispersive Device 1200 Lines/mm ruled grating
Sample Chamber Accepts 25 mm diameter fl at-bottomed test tubes,
10 mm square cuvettes, 16 mm COD test tubes
Source Lamp Quartz halogen
Modes %/T, ABS, pre-programmed tests
Pre-Programmed Tests YES, with automatic wavelength selection
Languages English or Chinese
User Defi ned Tests Up to 25 user tests can be input
RS232 Port 8 pin mDIN
Power Requirements Battery Operation (optional): Ni-Metal Hydride
battery pack Line Operation: 110/220V, 50/60 Hz
Dimensions 36 cm (wide) x 28 cm (deep) x 17 cm (tall)
Weight 10.3 lbs, 4.65 kgs
STATISTICAL AND TECHNICAL DEFINITIONS
RELATED TO PRODUCT SPECIFICATIONS
Method Detection Limit (MDL): “The method detection limit (MDL) is defi ned as
the minimum concentration of a substance that can be measured and reported
with 99% confi dence that the analyte concentration is greater than zero and is
determined from analysis of a sample in a given matrix containing the analyte.”1
Note that, “As Dr. William Horwitz once stated, ‘In almost all cases when
dealing with a limit of detection or limit of determination, the primary purpose of
determining that limit is to stay away from it.’”
1. CFR 40, part 136, appendix B
2. Statistics in Analytical Chemistry: Part 7 – A Review, D. Coleman and
L Vanatta, American Laboratory, Sept 2003, P. 31.
6 SMART Spectro Operator’s Manual 2.11
2
Page 7

Precision: Precision is the numerical agreement between two or more
measurements.3 The precision can be reported as a range for a measurement
(difference between the min and max). It can also be reported as the standard
deviation or the relative standard deviation. It is a measure of how close together
the measurements are, not how close they are to the correct or true value. The
precision can be very good and the accuracy very bad. This is a useful measure
of the performance of a test method.
3. Skoog, D.A., West, D. M., Fundamental of Analytical Chemistry, 2nd ed.,
Holt Rinehart and Winston, Inc, 1969, p. 26.
Accuracy: Accuracy is the nearness of a measurement to the accepted or true
value.4 The accuracy can be expressed as a range, about the true value, in
which a measurement occurs (i.e. ±0.5 ppm). It can also be expressed as the
% recovery of a know amount of analyte in a determination of the analyte (i.e.
103.5 %). This is a useful measure and what most customers are interested in
when they want to know about the performance of a test method.
4. Skoog D.A., West D. M., Fundamental of Analytical Chemistry, 2nd ed., Holt
Rinehart and Winston, Inc, 1969, p. 26.
Resolution: Resolution is the smallest discernible difference between any two
measurements that can be made.5 For meters this is usually how many decimal
places are displayed. (i.e. 0.01). For titrations and various comparators it is the
smallest interval the device is calibrated or marked to (i.e. 1 drop = 10 ppm,
0.2 ppm for a DRT, or ±half a unit difference for an octaslide or color chart).
Note that the resolution many change with concentration or range. In some
cases the resolution may be less than the smallest interval, if it is possible to
make a reading that falls between calibration marks. This is often done with
various comparators. One caveat is, that resolution has very little relationship
to accuracy or precision. The resolution will always be less than the accuracy
or precision but it is not a statistical measure of how well a method of analysis
works. The resolution can be very very good and the accuracy and precision
can be very, very bad! This is not a useful measure of the performance of a test
method.
5. Statistics in Analytical Chemistry: Part 7 – A Review, D. Coleman and
L Vanatta, American Laboratory, Sept 2003, P. 34.
Sensitivity: Sensitivity is the resolution based on how this term is used in
LaMotte catalogs. This term is not listed in any of the references. Sometimes it is
used for detection limit. It is a confusing term and should be avoided.
Repeatability: Repeatability is the within-run precision.6 A run is a single data
set, from set up to clean up. Generally, one run occurs on one day. However,
for meter calibrations, a single calibration is considered a single run or data set,
even though it may take 2 or 3 days.
6. Jeffery G. H., Basset J., Mendham J., Denney R. C., Vogel’s Textbook of
Quantitative Chemical Analysis, 5th ed., Longman Scientifi c & Technical,
1989, p. 130.
SMART Spectro Operator’s Manual 2.11 7
Page 8

Reproducibility: Reproducibility is the between-run precision.
7
7. Jeffery G. H., Basset J., Mendham J., Denney R. C., Vogel’s Textbook of
Quantitative Chemical Analysis, 5th ed., Longman Scientifi c & Technical, 1989,
p. 130.
CONTENTS AND ACCESSORIES
CONTENTS
SMART Spectro Spectrophotometer Battery Charger
Test Tubes, with Caps Power Supply, 110/220V
Sample Cell Holder, Universal SMART Spectro Quick Start Guide
Sample Cell Holder, 10 mm Square SMART Spectro Manual
Power Cable
NOTE: The battery pack is not included and must be purchased separately. An
empty slot is located in the original foam for the battery pack.
ACCESSORIES
Battery Pack with Holder (rechargeable) Code 2000-BP
Carrying Case Code 2000-CS
SMARTLink 2 Software with Cable
(compact disk)
Code 1912-CD
EPA COMPLIANCE
The SMART Spectro is an EPA-Accepted instrument. EPA-Accepted means
that the instrument meets the requirements for instrumentation as found in
test procedures that are approved for the National Primary Drinking Water
Regulations (NPDWR) or National Pollutant Discharge Elimination System
(NPDES) compliance monitoring programs. EPA-Accepted instruments may be
used with approved test procedures without additional approval.
CE COMPLIANCE
The SMART Spectrophotometer has been independently tested and has earned
the European CE Mark of Compliance for electromagnetic compatibility and
safety. To view the Declaration of Conformity go to www.lamotte.com.
8 SMART Spectro Operator’s Manual 2.11
Page 9

CHEMICAL TESTING
WATER SAMPLING FOR CHEMICAL ANALYSIS
Taking Representative Samples
The underlying factor to be considered for any type of water sampling is whether
or not the sample is truly representative of the source. To properly collect a
representative sample:
• Sample as frequently as possible.
• Collect a large sample or at least enough to conduct whatever tests are
necessary.
• Make a composite sample for the same sampling area.
• Handle the sample in such a way as to prevent deterioration or
contamination before the analysis is performed.
• Perform analysis for dissolved gases such as dissolved oxygen, carbon
dioxide, and hydrogen sulfi de immediately at the site of sampling. These
factors, as well as samples for pH testing, cannot be stored for later
examination.
• Make a list of conditions or observations which may affect the sample.
Other considerations for taking representative samples are dependent
upon the source of the sample. Taking samples from surface waters
involves different considerations than taking samples from impounded and
sub-surface waters.
Sampling of Open Water Systems
Surface waters, such as those found in streams and rivers, are usually well
mixed. The sample should be taken downstream from any tributary, industrial
or sewage pollution source. For comparison purposes samples may be taken
upstream and at the source of the pollution.
In ponds, lakes, and reservoirs with restricted fl ow, it is necessary to collect a
number of samples in a cross section of the body of water, and where possible
composite samples should be made to ensure representative samples.
To collect samples from surface waters, select a suitable plastic container with
a tight fi tting screw cap. Rinse the container several times with the sample
to be tested, then immerse the container below the surface until it is fi lled to
overfl owing and replace the cap. If the sample is not to be tested immediately,
pour a small part of the sample out and reseal. This will allow for any expansion.
Any condition which might affect the sample should be listed.
Sub-surface sampling is required to obtain a vertical profi le of streams, lakes,
ponds, and reservoirs at specifi c depths. This type of sampling requires more
sophisticated sampling equipment.
For dissolved oxygen studies, or for tests requiring small sample sizes, a Water
SMART Spectro Operator’s Manual 2.11 9
Page 10

Sampler (LaMotte Code 1060) will serve as a sub-surface or in-depth sampler.
This weighted device is lowered to the sampling depth and allowed to rest at
this depth for a few minutes. The water percolates into the sample chamber
displacing the air which bubbles to the surface. When the bubbles cease to rise,
the device has fl ushed itself approximately fi ve times and it may be raised to
the surface for examination. The inner chamber of the sampling device is lifted
out and portions of the water sample are carefully dispensed for subsequent
chemical analysis.
A Snap-Plunger Water Sampler (LaMotte Code 1077) is another “in-depth”
sampling device which is designed to collect large samples which can be used
for a multitude of tests. Basically, this collection apparatus is a hollow cylinder
with a spring loaded plunger attached to each end. The device is cocked
above the surface of the water and lowered to the desired depth. A weighted
messenger is sent down the calibrated line to trip the closing mechanism
and the plungers seal the sample from mixing with intermediate layers as it is
brought to the surface. A special drain outlet is provided to draw off samples for
chemical analysis.
Sampling of Closed System
To obtain representative samples from confi ned water systems, such as
pipe lines, tanks, vats, fi lters, water softeners, evaporators and condensers,
different considerations are required because of chemical changes which occur
between the inlet and outlet water. One must have a basic understanding of the
type of chemical changes which occur for the type of equipment used. Also,
consideration should be given to the rate of passage and retaining time for the
process water.
Temperature changes play an important part in deciding exactly what test
should be performed. Process water should be allowed to come to room
temperature, 20–25°C, before conducting any tests.
When drawing off samples from an outlet pipe such as a tap, allow sample to
run for several minutes, rinsing the container several times before taking the fi nal
sample. Avoid splashing and introduction of any contaminating material.
FILTRATION
When testing natural waters that contain signifi cant turbidity due to suspended
solids and algae, fi ltration is an option. Reagent systems, whether EPA,
Standard Methods, LaMotte or any others, will generally only determine
dissolved constituents. Both EPA and Standard Methods suggest fi ltration
through a 0.45 micron fi lter membrane, to remove turbidity, for the determination
of dissolved constituents.** To test for total constituents, organically bound and
suspended or colloidal materials, a rigorous high temperature acid digestion is
necessary.
**LaMotte offers a fi ltering apparatus: syringe assembly (Code 1050) and
membrane fi lters, 0.45 micron, (Code 1103).
10 SMART Spectro Operator’s Manual 2.11
Page 11

AN INTRODUCTION TO COLORIMETRIC ANALYSIS &
SPECTROSCOPY
Most test substances in water are colorless and undetectable to the human
eye. To test for their presence we must fi nd a way to “see” them. The LaMotte
SMART Spectro can be used to measure any test substance that is itself colored
or can be reacted to produce a color. In fact a simple defi nition of colorimetry is
“the measurement of color” and a colorimetric method is “any technique used
to evaluate an unknown color in reference to known colors”. In a colorimetric
chemical test the intensity of the color from the reaction must be proportional
to the concentration of the substance being tested. Some reactions have
limitations or variances inherent to them that may give misleading results. Many
such interferences are discussed with each particular test instruction. In the
most basic colorimetric method the reacted test sample is visually compared to
a known color standard. However, accurate and reproducible results are limited
by the eyesight of the analyst, inconsistencies in the light sources, and the
fading of color standards.
To avoid these sources of error, a colorimeter or spectrophotometer can be used
to photoelectrically measure the amount of colored light absorbed by a colored
sample in reference to a colorless sample (blank).
White light is made up of many different colors or wavelengths of light. A
colored sample typically absorbs only one color or one band of wavelengths
from the white light. Only a small difference would be measured between white
light before it passes through a colored sample versus after it passes through
a colored sample. The reason for this is that the one color absorbed by the
sample is only a small portion of the total amount of light passing through the
sample. However, if we could select only that one color or band of wavelengths
of light to which the test sample is most sensitive, we would see a large
difference between the light before it passes through the sample and after it
passes through the sample.
The SMART Spectro uses a quartz halogen lamp as the source of white light.
The white light passes through an entrance slit and is focused on a ruled grating
consisting of 1200 lines/mm. The grating causes the light to be dispersed into
various component wavelengths. The monochromator design allows the user to
select which specifi c wavelength of interest will be passed through the exit slit
and through the sample. The use of mirrors and additional fi lters prevents light
of undesired wavelengths (overtones, stray light) from making it to the sample. A
photodetector measures the amount of light which passes through the sample.
The difference in the amount of monochromatic light transmitted through a
colorless sample (blank) and the amount of monochromatic light transmitted
through a test sample is a measurement of the amount of monochromatic
light absorbed by the sample. In most colorimetric tests the amount of
monochromatic light absorbed is directly proportional to the concentration of
the test factor producing the color and the path length through the sample.
However, for a few tests the relationship is reversed and the amount of
monochromatic light absorbed is inversely proportional to the concentration of
the test factor.
SMART Spectro Operator’s Manual 2.11 11
Page 12

The choice of the correct wavelength for testing is important. It is interesting to
note that the wavelength that gives the most sensitivity (lower detection limit)
for a test factor is the complementary color of the test sample. For example
the Nitrate-Nitrogen test produces a pink color proportional to the nitrate
concentration in the sample (the greater the nitrate concentration, the darker the
pink color). A wavelength in the green region should be selected to analyze this
sample since a pinkish-red solution absorbs mostly green light.
REAGENT BLANK
Some tests will provide greater accuracy if a reagent blank is determined to
compensate for any color or turbidity resulting from the reagents themselves.
A reagent blank is performed by running the test procedure on 10 mL of
demineralized or deionized water. Use sample water to SCAN BLANK. Insert
the reacted reagent blank in the colorimeter chamber and select SCAN
SAMPLE. Note result of reagent blank. Perform the tests on the sample water as
described. Subtract results of reagent blank from all subsequent test results.
NOTE: Some tests require a reagent blank to be used to SCAN BLANK.
SPECTROPHOTOMETER TUBES
Spectrophotometer tubes which have been scratched through excessive use
should be discarded and replaced with new ones. Dirty tubes should be cleaned
on both the inside and outside. Fingerprints on the exterior of the tubes can
cause excessive light scattering and result in errors. Handle the tubes carefully,
making sure the bottom half of the tube is not handled.
LaMotte Company makes every effort to provide high quality spectrophoto-
meter tubes. However, wall thicknesses and diameter of tubes may still vary
slightly. This may lead to slight variations in results (e.g. if a tube is turned while
in the sample chamber, the reading will likely change slightly). To eliminate this
error put the tubes into the sample chamber with the same orientation every
time.
The tubes that are included with the spectrophotometer have an index mark
to facilitate this. If possible, use the same tube to SCAN BLANK and SCAN
SAMPLE.
SELECTING AN APPROPRIATE WAVELENGTH
The most appropriate wavelength to use when creating a calibration curve
is usually the one which gives the greatest change from the lowest reacted
standard concentration to the highest reacted standard concentration. However,
the absorbance of the highest reacted standard concentration should never
be greater than 2.0 absorbance units. Scan the lowest and highest reacted
standards at different wavelengths using the %T/ABS mode to fi nd the
wavelength which gives the greatest change in absorbance without exceeding
2.0 absorbance units. Use this wavelength to create a calibration curve.
12 SMART Spectro Operator’s Manual 2.11
Page 13

Below is a list of suggested wavelength ranges for the color of the reacted
samples. Use these as a starting point.
Sample Color Wavelength Range
Yellow 350-450
Yellow-Orange 450-490
Orange 490-510
Pink 510-570
Red 570-600
Green and Blue 600-750
CALIBRATION CURVES
The SMART Spectro contains precalibrated tests for the LaMotte reagent
systems. The fi rst step in using a non-LaMotte reagent system with the SMART
Spectro is to create a calibration curve for the reagent system. To create a
calibration curve, prepare standard solutions of the test factor and use the
reagent system to test the standard solutions with the SMART Spectro.
Plot the results (in ABS or %Transmittance) versus concentration to create
a calibration curve. The calibration curve may then be used to identify the
concentration of an unknown sample by testing the unknown, reading
Absorbance or %T, and fi nding the corresponding concentration from the curve.
The linear range of the reagent system can be determined and this information
can be used to input a User Test into the SMART Spectro (see EDIT USER
TESTS, page 35).
PROCEDURE
1. Prepare 5 or 6 standard solutions of the factor being tested. The
concentration of these standards should be evenly distributed throughout the
range of the reagent system, and should include a 0 ppm standard (distilled
water). For instance, the solutions could measure 0, 10%, 30%, 50%, 70%,
and 90% of the system’s maximum range.
2. Turn on the SMART Spectro. Select the appropriate %T/ABS wavelength from
the %T/ABS mode. Be sure to select the appropriate wavelength for the color
produced by the reagent system.
3. Use the unreacted 0 ppm standard to standardize the spectrophotometer by
using it to scan blank.
4. Following the individual reagent system instructions, react each standard
solution including 0 ppm. Record the reading and the standard solution
concentration on a chart. Readings can be recorded as percent
transmittance (%T) or absorbance (A).
SMART Spectro Operator’s Manual 2.11 13
Page 14
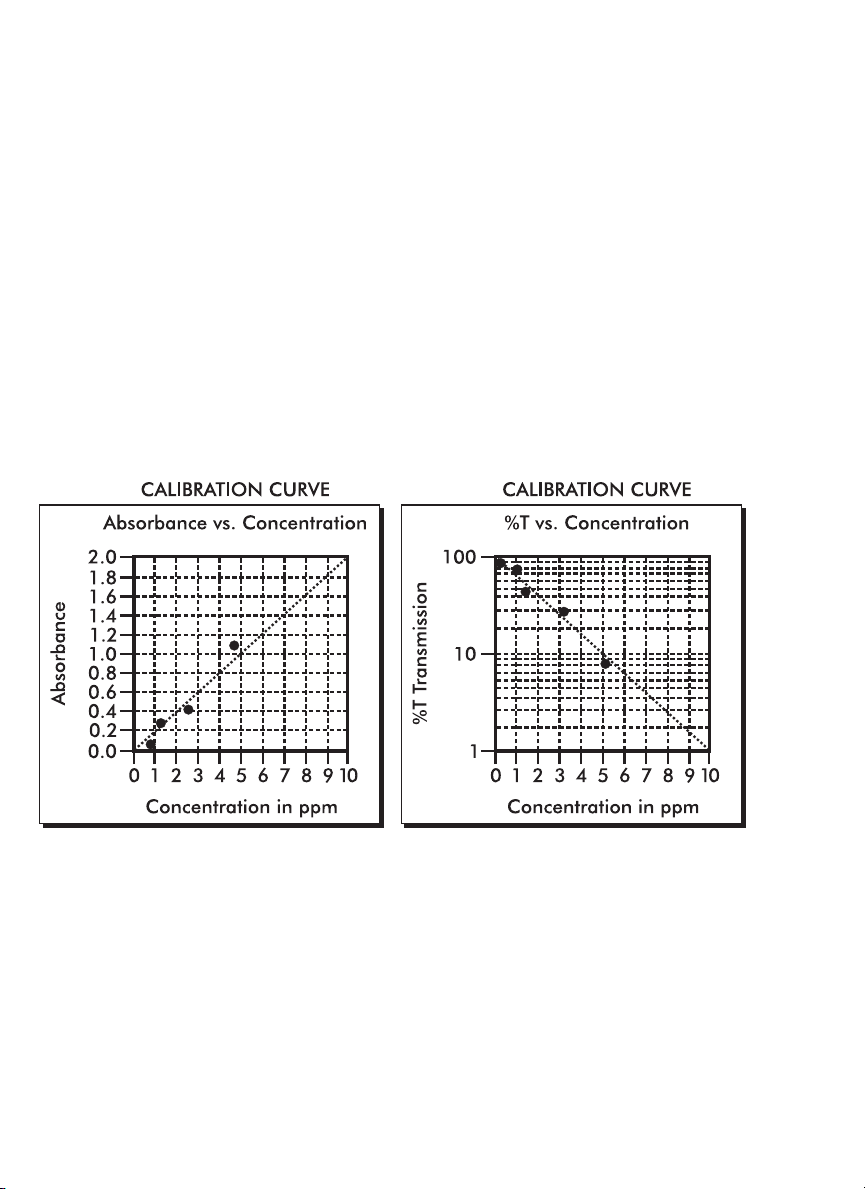
5. Plot results on graph paper or computer using any available plotting
program. If results are as %T versus concentration, semilog graph paper
must be used. Plot the standard solution concentrations on the horizontal,
linear axis, and the %T on the vertical, logarithmic axis. If results are as
absorbance versus standard solution concentration, simple linear graph
paper can be used. Plot the standard solution concentration on the
horizontal axis, and the absorbance on the vertical axis.
6. After plotting the results, draw a line, or curve, of best fi t through the
plotted points. The best fi t may not connect the points. There should be
approximately an equal number of points above the curve as below the
curve. Some reagent systems will produce a straight line, while others
produce a curve. Many computer spreadsheet programs can produce the
curve of best fi t by regression analysis of the standard solution data.
A sample of each type of graph appears below:
14 SMART Spectro Operator’s Manual 2.11
Page 15

PREPARING DILUTE STANDARD SOLUTIONS
Standard solutions should be prepared to create a calibration curve. Standard
solutions can be prepared by diluting a known concentrated standard by
specifi ed amounts. A chart or computer spreadsheet can be created to
determine the proper dilutions. Use volumetric fl asks and volumetric pipets for
all dilutions.
1. In Column A – Record the maximum concentration of test as determined by
the range and path length.
2. In Column B – Record the percent of the maximum concentration the
standard solution will be.
3. In Column C – Calculate the fi nal concentration of the diluted standard
solutions by multiplying the maximum concentration (In Column A) by the %
of maximum concentration divided by 100. (C = A x ).
4. In Column D – Record the fi nal volume of the diluted sample (i.e. volume of
volumetric fl ask).
5. In Column E – Record the concentration of the original standard.
6. In Column F – Calculate the milliliters of original standard required (C x D/E
= F).
A sample chart appears below:
A B C=A x B/100 D E F=C x D/E
Maximum
concentration
of test
% of Maximum
concentration
Final concentration
of Diluted Standard
Volume of
Standard
Concentration
of Original
Standard
10.0 ppm 90 9.0 ppm 100 mL 1000 ppm 0.90 mL
10.0 ppm 70 7.0 ppm 100 mL 1000 ppm 0.70 mL
10.0 ppm 50 5.0 ppm 100 mL 1000 ppm 0.50 mL
10.0 ppm 30 3.0 ppm 100 mL 1000 ppm 0.30 mL
10.0 ppm 10 1.0 ppm 100 mL 1000 ppm 0.10 mL
10.0 ppm 0 0 ppm 100 mL 1000 ppm 0 mL
mL of
Original Standard
Required
STANDARD ADDITIONS
A common method to check the accuracy and precision of a test is by standard
additions. In this method a sample is tested to determine the concentration
of the test substance. A second sample is then “spiked” by the addition of a
known quantity of the test substance. The second sample is then tested. The
determined concentration of the spiked sample should equal the concentration
of the fi rst plus the amount added with the spike. The procedure can be
repeated with larger and larger “spikes.” If the determined concentrations do not
SMART Spectro Operator’s Manual 2.11 15
Page 16

equal the concentration of the sample plus that added with the “spike”, then an
interference may exist.
For example, a 10.0 mL water sample was determined to contain 0.3 ppm iron.
To a second 10.0 mL sample, 0.1 mL of 50 ppm iron standard was added. The
concentration of iron due to the “spike” was (0.10 mL x 50 ppm)/10.0 mL = 0.50
ppm. The concentration of iron determined in the spiked sample should be 0.3
+ 0.5 = 0.8 ppm iron.
(Note: any error due to the increased volume from the “spike” is negligible).
LaMotte offers a line of calibration standards which can be used to generate
calibration curves and perform standard additions.
SAMPLE DILUTION TECHNIQUES & VOLUMETRIC
MEASUREMENTS
If a test result using the SMART gives an OUT OF RANGE message then the
sample concentration could be over range or under range. If it is over range, the
sample must be diluted. Then the test should be repeated on the diluted sample
to obtain a reading which is in the concentration range for the test. (Note: This is
not true for colorimetric determination of pH.)
Example:
Measure 5 mL of the water sample into a graduated cylinder. Add demineralized
water until the cylinder is fi lled to the 10 mL line. The sample has been diluted
by one-half, and the dilution factor is therefore 2. Perform the test procedure,
then multiply the resulting concentration by 2 to obtain the test result.
The following table gives quick reference guidelines on dilutions of various
proportions. All dilutions are based on a 10 mL volume, so several dilutions will
require small volumes of the water sample. Graduated pipets should be used for
all dilutions.
Size of Sample Deionized Water to Bring
Volume to 10 mL
10 mL 0 mL 1
5 mL 5 mL 2
2.5 mL 7.5 mL 4
1 mL 9 mL 10
0.5 mL 0.5 mL 20
If the above glassware is not available, dilutions can be made with the
spectrophotometer tube. Fill the tube to the 10 mL line with the sample then
transfer it to another container. Add 10 mL volumes of demineralized water to
the container and mix. Transfer back 10 mL of the diluted sample to the tube
and follow the test procedure. Continue diluting and testing until a reading,
16 SMART Spectro Operator’s Manual 2.11
Multiplication Factor
Page 17

which is in the concentration range for the test, is obtained. Be sure to multiply
the concentration found by the dilution factor (the number of total 10 mL
volumes used).
Example:
10 mL of sample is diluted with three 10 mL volumes of demineralized water; the
dilution factor is four.
INTERFERENCES
LaMotte reagent systems are designed to minimize most common interferences.
Each individual test instruction discusses interferences unique to that test. Be
aware of possible interferences in the water being tested.
The reagent systems also contain buffers to adjust the water sample to the ideal
pH for the reaction. It is possible that the buffer capacity of the water sample
may exceed the buffer capacity of the reagent system and the ideal pH will not
be obtained. If this is suspected, measure the pH of a reacted distilled water
reagent blank using a pH meter. This is the ideal pH for the test. Measure the pH
of a reacted water sample using the pH meter. If the pH is signifi cantly different
from the ideal value, the pH of the sample should be adjusted before testing.
Chlorine interferences can be removed with the use of glycine. Very high levels
of chloramines may interfere if the test result is not read immediately. Oxidized
manganese interferes but can be removed with arsenite. Bromine and iodine
interferes but can be removed with a thioacetamide blank correction.
Interferences due to high concentration of the substance being tested, can be
overcome by sample dilution (see page 16).
STRAY LIGHT INTERFERENCE
Normal indoor lighting causes no interference with the SMART. Always be sure
the sample chamber lid is closed when scanning blanks or samples.
SMART Spectro Operator’s Manual 2.11 17
Page 18

OPERATION OF THE SMART SPECTRO
OVERVIEW
The SMART Spectro is a portable, microprocessor controlled, direct reading,
single beam spectrophotometer. It has a 5 line, 18 character liquid crystal
display for alphabetical and numerical messages. The operation is controlled
with the keypad through menu driven software in response to selections shown
on the display.
The test library consists of over 80 LaMotte tests and 25 “User Tests”. The
spectrophotometer is also capable of running %T/Absorbance tests over the
entire wavelength range of 350 - 1000 nm. The LaMotte tests are precalibrated
for LaMotte reagent systems. The spectrophotometer displays the results of
these tests directly in units of concentration. The 25 “User Tests” may be used
to enter additional calibrations. All of these tests may be arranged in any of 3
sequences. These sequences can be modifi ed a limitless number of times to
meet changing testing needs.
The optics feature a quartz halogen bulb as a light source with a minimum
life expectancy of 1000 hours. The incident white light is dispersed into its
component wavelengths by a 1200 lines/mm ruled grating. The microprocessor
controls the positioning of the grating, automatically positioning the grating to
the correct wavelength for the test that has been selected. The monochromatic
light is passed through the sample cell and is detected by a silicon photodiode.
The SMART Spectro is powered by an AC adapter that automatically recognizes
the input voltage (110/220V) and converts it to the 12V needed to run the
instrument. An optional battery pack is available for use where portability is
important. To save power an automatic shut-off feature can be utilized (Energy
Savings Mode).
A RS-232 serial port on the back of the spectrophotometer, and optional
software, allows the spectrophotometer to be interfaced with a Winows-based
personal computer for real time data acquisition and data storage. This port also
allows an interface with a RS-232 serial printer.
Due to its portability, alternate power sources, and rugged construction, the
SMART Spectro is ideal for lab and fi eld use.
POWER SOURCE
To use the SMART Spectro with an AC power supply:
1. Plug the Power Supply into the AC Adapter socket on the back of the SMART
Spectro.
2. Connect the Power Cable to the Power Supply and an electrical outlet.
To use the Battery Pack, see page 51.
18 SMART Spectro Operator’s Manual 2.11
Page 19
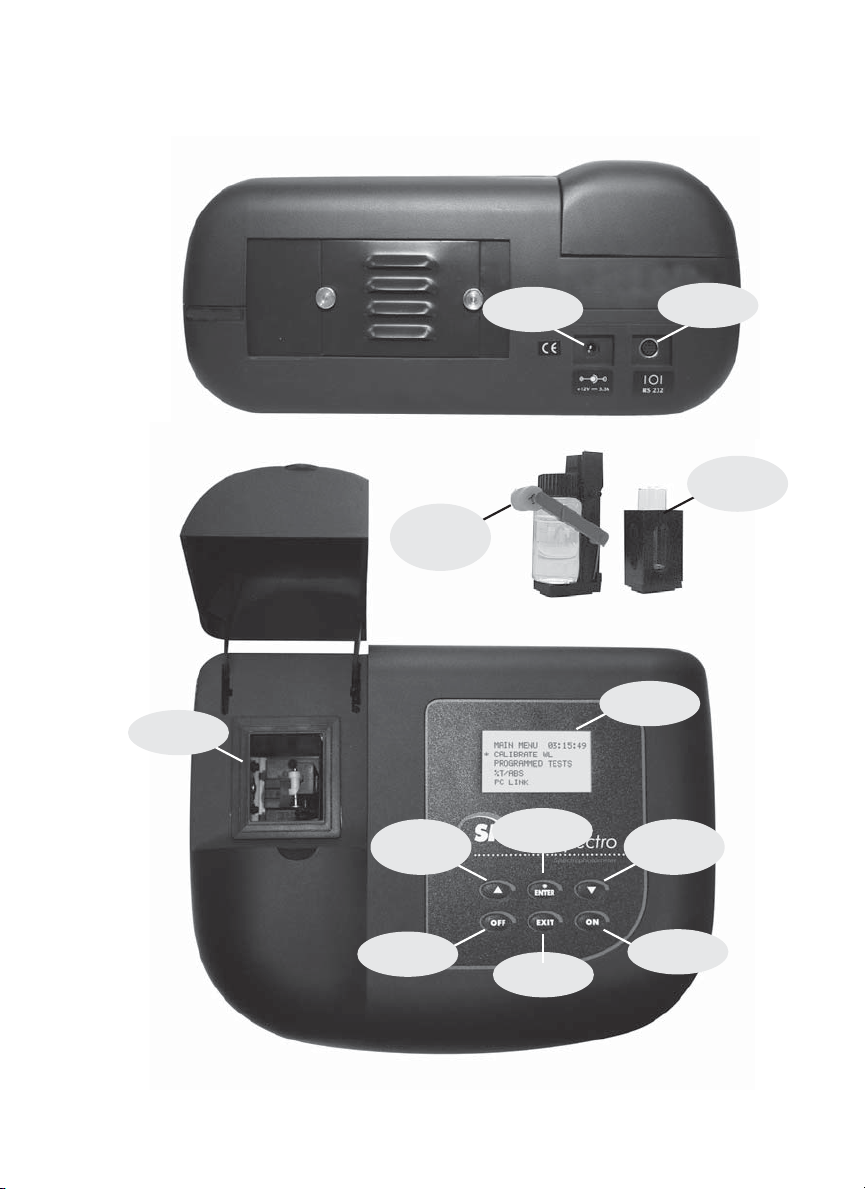
COMPONENTS
Figure 1 shows a diagram of the SMART Spectro and the components.
Chamber
25mm
Round Cell
in Universal
Adapter
Scroll
Between
Choices
AC Adapter
Socket
Make
Selections
Display
Between
Choices
Serial Port
Scroll
RS232
10mm
Square Cell
in Adapter
Turn O
the Spectro
Exit
Menus
Turn On
the Spectro
Figure 1
SMART Spectro Operator’s Manual 2.11 19
Page 20

QUICK START
1. Press ON. The LaMotte logo
screen will appear for about 2
seconds and the MAIN MENU will
appear.
2. Press or to scroll to
PROGRAMMED TESTS.
3. Press *ENTER to select
PROGRAMMED TESTS.
4. Press to scoll to ALL
TESTS.
MAIN MENU 12:00:01
CALIBRATE WL
*
PROGRAMMED TESTS
%T/ABS
PC LINK
MAIN MENU 12:00:01
CALIBRATE WL
PROGRAMMED TESTS
*
%T/ABS
PC LINK
PROGRAMMED TESTS
SEQUENCE 1
*
SEQUENCE 2
SEQUENCE 3
ALL TESTS
PROGRAMMED TESTS
SEQUENCE 1
SEQUENCE 2
SEQUENCE 3
ALL TESTS
*
5. Press *ENTER to select ALL
TESTS.
20 SMART Spectro Operator’s Manual 2.11
ALL TESTS
1 Alkalinity-UDV
*
2 Aluminum
3 Ammonia-N L F
4 Ammonia-N L S
Page 21

6. PresS or to scroll to the
desired test.
ALL TESTS
1 Alkalinity-UDV
2 Aluminum
*
3 Ammonia-N L F
4 Ammonia-N L s
7. Press *ENTER to select the
test.
8. Insert the blank. Press *ENTER to
scan the blank.
9. Insert the reacted sample. Press
*ENTER to scan the sample. The
result will be displayed.
After obtaining test results, scroll with
with *ENTER. Press EXIT to escape to previous menu.
2 Aluminum
SCAN BLANK
*
SCAN SAMPLE
END 535 NM
2 Aluminum
SCAN BLANK
SCAN SAMPLE
*
END 535 NM
2 Aluminum
T = 16.5%T
A = 0.7834A
C = 1.28 PPM
PRINT PRESS ENTER
or , and make another selection
SMART Spectro Operator’s Manual 2.11 21
Page 22

GENERAL OPERATING PROCEDURES
The operation of the SMART Spectro is controlled by a microprocessor. The
microprocessor is programmed with menu driven software. A menu is a list
of choices. This allows a selection of various tasks for the spectrophotometer
to perform, such as, scan blank, scan sample, and edit test sequences. The
keypad is used to make menu selections which are viewed in the display.
There are eight selections accessible from the MAIN MENU - CALIBRATE WL,
PROGRAMMED TESTS, %T/ABS, PC LINK, EDIT CLOCK, ENERGY MODE,
STORE METHOD, and TEST MODE.
THE KEYPAD
The keypad has 6 buttons which are used to perform specifi c tasks.
ON This button is used to turn the spectrophotometer on.
This button will cause the display to scroll up in a list of menu
choices. It will move to the beginning of a list viewed in the display.
It will auto scroll when held down.
This button will cause the display to scroll down through a list of
menu choices. It will move to the end of a list viewed in the display.
It will auto scroll when held down.
*
ENTER
EXIT This button is an EXIT or ESCAPE button. When pressed, the
OFF This button turns the spectrophotometer off.
This button is used to select the menu choice adjacent to the “*” in
a menu viewed in the display.
display will EXIT from the current menu and go to the previous
menu.
SAMPLE HOLDERS
The SMART Spectro Spectrophotometer is supplied with two removable sample
cell holders. Each holder is secured in the chamber with a single screw. The
square sample holder should be positioned so the arrow on the top is pointing
toward the left. The square sample holder will hold 10 mm square cuvettes. The
universal sample holder should be positioned with the V-channel toward the
right side of the chamber. The universal sample holder will hold round tubes of
varying diameters. When using the universal adapter, the tube should be placed
between the white roller on the spring-loaded arm and the v-channel on the
right-hand side of the adapter. Press the tube down on the white roller to retract
the arm.
22 SMART Spectro Operator’s Manual 2.11
Page 23

THE DISPLAY & THE MENUS
The display allows menu selections to be viewed and chosen. These choices
instruct the spectrophotometer to perform specifi c tasks. The menus are viewed
in the display using a general format which is followed from one menu to the
next. Each menu is a list of choices or selections.
There are fi ve lines in the display. The top line in each menu is a title or pertinent
instruction. The top line does not change unless a new menu is selected. The
second line is used in two ways. One way is to display additional information if
the top line is insuffi cient. The second line is also used to display menu choices.
The three additional lines are also used for menu choices.
DISPLAY
TESTING MENU Title or InstrucƟ on
FIRST CHOICE
SECOND CHOICE Menu Choice Window
THIRD CHOICE
AND ANOTHER
AND SO ON
END OF LIST
Think of the menu choices as a vertical list in the display which moves up or
down each time an arrow button is pressed. This list or menu is viewed through
a window, the menu choice window, in the display. Pushing the arrow buttons
brings another portion of the menu into menu choice window. This is referred to
as scrolling through the menu.
TESTING MENU TESTING MENU TESTING MENU
* FIRST CHOICE SECOND CHOICE ANOTHER
SECOND CHOICE * ANOTHER AND ANOTHER
ANOTHER AND ANOTHER * AND SO ON
AND ANOTHER AND SO ON END OF LIST
AND SO ON END OF LIST
END OF LIST
An asterisk, “*”, will start in the far left position of the top line in the menu choice
window. As the menu is scrolled through, different choices appear next to the
“*”. The “*” in the display corresponds with the *ENTER button. Pushing the
*ENTER button selects the menu choice which is adjacent to the “*” in the
menu choice window.
As described previously, the EXIT button allows an exit or escape from the
current menu and a return to the previous menu. This allows a rapid exit from an
SMART Spectro Operator’s Manual 2.11 23
Page 24

inner menu to the MAIN MENU by repeatedly pushing the EXIT button. Pushing
OFF at any time will turn the spectrophotometer off.
CALIBRATION
CALIBRATE WAVELENGTH
The Calibrate Wavelength (CALIBRATE WL) mode is used to establish or
re-establish the accuracy of the wavelength selection process. Normally, the
Calibrate Wavelength procedure should be run after the SMART Spectro is
turned ON and allowed to warm up for 15 minutes or if operating conditions
(temperature, humidity, etc.) change signifi cantly.
For fi eld use, when operating with the battery, calibrate wavelength prior to
going into the fi eld using AC power. This will increase battery life in the fi eld.
Alternatively calibrate wavelength in the fi eld immediately before testing. Turn
Spectro on immediately before scanning blank. Calibrate wavelength just before
scanning blank.
1. Press ON. The LaMotte logo
screen will appear for about 2
seconds and the MAIN MENU will
appear.
2. Press or to scroll to
CALIBRATE WL.
3. Press *ENTER to select
CALIBRATE WL.
The Calibrate Wavelength procedure takes about 1-2 minutes to be completed.
During the calibration, the Spectro will display two numbers at the bottom of the
screen. The fi rst number is fi xed. The second number will change and can have
a range of values. The microprocessor will move the grating in search of the
position that gives a very specifi c maximum light intensity. The microprocessor
MAIN MENU 12:00:01
CALIBRATE WL
*
PROGRAMMED TESTS
%T/ABS
PC LINK
MAIN MENU 12:00:01
CALIBRATE WL
*
PROGRAMMED TESTS
%T/ABS
PC LINK
MAIN MENU 12:00:01
CALIBRATE WL
*
PROGRAMMED TESTS
%T/ABS
PC LINK
24 SMART Spectro Operator’s Manual 2.11
Page 25
will then move the grating a precise predetermined amount from this position.
This precise movement will cause the grating to be positioned at 546 nm every
time. Once calibrated the wavelength displayed during testing is accurate to ±2
nm. When the wavelength calibration is complete the display will go back to the
Main Menu.
PROGRAMMED TESTS
INTRODUCTION
The PROGRAMMED TESTS mode is used to run all LaMotte pre-programmed
tests and USER TESTS. This is also where USER TESTS and SEQUENCES are
set-up and edited.
1. Press ON. The LaMotte logo
screen will appear for about 2
seconds and the MAIN MENU will
appear.
2. Press or to scroll to
PROGRAMMED TESTS.
3. Press *ENTER to select
PROGRAMMED TESTS. In
the PROGRAMMED TESTS
menu there are three alterable
sequences and one ALL TESTS
fi xed sequence as well as the EDIT
function.
MAIN MENU 12:00:01
CALIBRATE WL
*
PROGRAMMED TESTS
%T/ABS
PC LINK
MAIN MENU 12:00:01
CALIBRATE WL
PROGRAMMED TESTS
*
%T/ABS
PC LINK
MAIN MENU 12:00:01
CALIBRATE WL
*
PROGRAMMED TESTS
%T/ABS
PC LINK
SMART Spectro Operator’s Manual 2.11 25
Page 26

SEQUENCES OF TESTS
SEQUENCE 1, SEQUENCE 2, and SEQUENCE 3 are alterable sequences.
They may be edited using the EDIT function mode. Any of the LaMotte preprogrammed tests or User Tests may be placed in these sequences in whatever
testing order that is preferred. Some examples of typical sequences are given
below.
SEQUENCE 1 SEQUENCE 2 SEQUENCE 3
* 60 Molybdenum LR * 1 Aluminum * 3 Ammonia-N L F
79 Phosphate 35 Cyanide 32 Copper DDC
9 Bromine LR 41 Fluoride 64 Nitrate-N LR
76 pH TB 53 Iron Phen 67 Nitrite-N LR
15 Chlorine 55 Manganese L 74 pH CPR
86 Silica HI 64 Nitrate N LR 78 Phosphate L
45 Hydrazine 26 COD Low 85 Silica Lo
32 Copper DDC 77 Phenols END OF LIST
51 Iron Bipyr 78 Phosphate L
END OF LIST 90 Sulfi de LR
END OF LIST
NOTE: Sequences always end with END OF LIST to indicate that there are no
more tests in the sequence.
These alterable sequences allow a series of tests to be setup that are run
frequently. The order of the individual tests in the sequence is determined by the
user. After running a test, press EXIT to escape back to the Sequence menu.
Move the down to the next test listed and press *ENTER. Continue this
pattern until the entire sequence has been completed.
ALL TESTS is a fi xed sequence containing the LaMotte pre-programmed tests
and User Tests.
Modifi cation of the alterable sequence is accomplished through the EDIT
function. This function is explained in detail in the section titled EDIT.
It should be noted that if a %T/ABS test is to be included in a sequence, the
%T/ABS test must fi rst be setup as a User Test (but no actual calibration needs
to be performed, only select a name and wavelength).
Pressing the EXIT button while in a sequence menu will escape back to the
PROGRAMMED TESTS menu.
Pressing the OFF button at any time will turn the SMART Spectro off.
26 SMART Spectro Operator’s Manual 2.11
Page 27
GENERAL TESTING PROCEDURES
The following are some step by step examples of how to run tests from the
PROGRAMMED TESTS menu. These test procedures are designed to be used
with LaMotte SMART Spectro reagent systems.
TESTING WITH THE LaMOTTE PROGRAMMED TESTS
1. Press ON. The LaMotte logo
screen will appear for about 2
seconds and the MAIN MENU will
appear.
2. Press or to scroll to
PROGRAMMED TESTS.
3. Press *ENTER to select
PROGRAMMED TESTS.
4. Press to scroll to ALL
TESTS.
MAIN MENU 12:00:01
CALIBRATE WL
*
PROGRAMMED TESTS
%T/ABS
PC LINK
MAIN MENU 12:00:01
CALIBRATE WL
PROGRAMMED TESTS
*
%T/ABS
PC LINK
PROGRAMMED TESTS
SEQUENCE 1
*
SEQUENCE 2
SEQUENCE 3
ALL TESTS
PROGRAMMED TESTS
SEQUENCE 1
SEQUENCE 2
SEQUENCE 3
ALL TESTS
*
SMART Spectro Operator’s Manual 2.11 27
Page 28

5. Press *ENTER to select ALL
TESTS.
ALL TESTS
1 Alkalinity-UDV
*
2 Aluminum
3 Ammonia-N L F
4 Ammonia-N L S
6. Press or to scroll to the
desired test.
7. Press *ENTER to select the test.
The SMART Spectro is ready to
scan. The proper wavelength has
been selected.
8. Insert the blank. Press *ENTER
to scan the blank. The blank has
been stored.
9. Insert the reacted sample. Press
*ENTER to scan the sample. The
result will be displayed.
ALL TESTS
1 Alkalinity-UDV
2 Aluminum
*
3 Ammonia-N L F
4 Ammonia-N L S
2 Aluminum
SCAN BLANK
*
SCAN SAMPLE
END 535 NM
2 Aluminum
SCAN BLANK
SCAN SAMPLE
*
END 535 NM
2 Aluminum
T = 16.5%T
A = 0.7834A
C = 1.28 PPM
PRINT PRESS ENTER
28 SMART Spectro Operator’s Manual 2.11
Page 29

10. Press *ENTER to print the result
when connected to a printer or
computer. To repeat the test,
press EXIT to escape the test
screen, then press *ENTER to
scan the sample again. The last
blank scanned is used to zero
the spectrophotometer for repeat
scans. A different blank can be
used by pressing the button to
scroll back to SCAN BLANK and
then scanning another blank.
Press EXIT to escape back to the PROGRAMMED TESTS menu if no more
samples are to be scanned for this test factor.
SMART Spectro Operator’s Manual 2.11 29
Page 30

SETUP & EDIT SEQUENCES
& USER TESTS
The EDIT menu allows any of the three alterable test sequences (SEQUENCE
1, SEQUENCE 2, and SEQUENCE 3) and any of the 25 User Tests in the
ALL TESTS fi xed sequence to be edited. This feature allows a sequence or
test which is used frequently to be set-up for easy access. The order of the
sequence can be arranged to suit the needs of the user. Any combination, and
any order of tests from ALL TESTS (including User Tests), may be placed into
these sequences.
EDIT A SEQUENCE
1. Go to the PROGRAMMED TESTS
menu. Press or to scroll to
EDIT.
2. Press *ENTER to select EDIT. EDIT
PROGRAMMED TESTS
SEQUENCE 1
SEQUENCE 2
SEQUENCE 3
EDIT
*
EDIT SEQUENCE 1
*
EDIT SEQUENCE 2
EDIT SEQUENCE 3
EDIT USER TESTS
30 SMART Spectro Operator’s Manual 2.11
Page 31

ADDING OR DELETING TESTS
There are two ways to alter a sequence - INSERT and DELETE.
INSERT is used to add a new test to a sequence and to place the new test
before an existing test in a sequence.
DELETE is used to remove an existing test from a sequence.
Below is a step by step example of how to ADD a test to SEQUENCE 3 starting
from the EDIT menu.
1. Press to scroll to the sequence
to be edited.
2. Press *ENTER to select the
sequence to be edited.
3. Press *ENTER to select END OF
LIST.
4. Press *ENTER to select INSERT to
insert a test into the sequence.
EDIT
EDIT SEQUENCE 1
EDIT SEQUENCE 2
EDIT SEQUENCE 3
*
EDIT USER TESTS
EDIT SEQUENCE 3
END OF LIST
*
EDIT SEQUENCE 3
INSERT
*
DELETE
END OF LIST
INSERT
1 Alkalinity-UDV
*
2 Aluminum
3 Ammonia-N L F
4 Ammonia-N L S
SMART Spectro Operator’s Manual 2.11 31
Page 32

5. Press or to scroll to the
desired test.
INSERT
1 Alkalinity-UDV
2 Aluminum
*
3 Ammonia-N L F
4 Ammonia-N LF
6. Press *ENTER to select the test
and insert it before END OF LIST.
The meter will return to the EDIT
SEQUENCE 3 menu.
7. Press *ENTER to select the fi rst
test in the sequence and allow a
second test to be inserted above it
on the list.
8. Press *ENTER to insert a test
above the fi rst test.
9. Press or to scroll to the
desired test.
EDIT SEQUENCE 3
2 Aluminum
*
END OF LIST
EDIT SEQUENCE 3
INSERT
*
DELETE
2 Aluminum
INSERT
1 Alkalinity-UDV
*
2 Aluminum
3 Ammonia-N L F
4 Ammonia-N LF
INSERT
75 pH PR
76 pH TB
77 Phenol
78 Phosphate L
*
32 SMART Spectro Operator’s Manual 2.11
Page 33

10. Press *ENTER to add the second
test to the list above the fi rst test
in the sequence. SEQUENCE 3
has now been modifi ed and will
remain until it is deleted again.
To run a test in SEQUENCE 3 go
to the PROGRAMMED TESTS
menu. Press EXIT to exit the EDIT
SEQUENCE 3 menu and return
to the EDIT menu. Press EXIT to
exit the EDIT menu. The meter will
save any changes and go to the
PROGRAMED TESTS menu.
Below is an example of how to DELETE a test from SEQUENCE 3, which was
just created, starting from the EDIT menu.
EDIT SEQUENCE 3
78 Phosphate L
*
2 Aluminum
END OF LIST
1. Press to scroll to the sequence
to be edited.
2. Press *ENTER to select the
sequence to be edited.
3. Press or to scroll to the test
to be deleted.
EDIT
EDIT SEQUENCE 1
EDIT SEQUENCE 2
EDIT SEQUENCE 3
*
EDIT USER TESTS
EDIT SEQUENCE 3
78 Phosphate L
*
2 Aluminum
END OF TEST
EDIT SEQUENCES
78 Phosphate L
2 Aluminum
*
END OF LIST
SMART Spectro Operator’s Manual 2.11 33
Page 34

4. Press *ENTER to select the test to
be deleted.
EDIT SEQUENCE 3
INSERT
*
DELETE
2 Aluminum
5. Press or to scroll to
DELETE.
6. Press *ENTER to select DELETE.
Sequence 3 has now been
modifi ed and will remain until
it is edited again. To run a test
in SEQUENCE 3 go to the
PROGRAMMED TESTS menu.
Press ENTER to exit the EDIT
SEQUENCE 3 menu to the
EDIT menu. Press EXIT to exit
the EDIT menu. The meter will
save any changes and go the
PROGRAMMED TESTS menu.
EDIT SEQUENCE 3
INSERT
DELETE
*
2 Aluminum
EDIT SEQUENCE 3
78 Phosphate L
*
END OF LIST
34 SMART Spectro Operator’s Manual 2.11
Page 35

EDIT USER TESTS
If a test other than the LaMotte programmed tests is performed regularly, a
calibration for it may be entered in one of the 25 User Tests. These tests are
originally named “User Test 1 - 25”. It will be possible to rename the test, select
a wavelength, enter a new calibration and select the number of decimal places
used to display the results. A User Test may be added for a reagent system for
which no precalibrated test exists. A calibration of a LaMotte reagent system
may also be entered. The calibration of a User Test can be changed at any time.
The User Tests have the ability to handle between 1 and 8 data points. The
curve fi tting options of linear least squares or linear least squares through zero
are available. This requires that the test have a linear calibration, if accurate
results are expected. The spectrophotometer will determine the Absorbance
of the standards and calculate a response that will be stored to determine the
concentration of future samples of unknown concentration. These standards
should cover all the concentrations for the range of the test being performed
and be scanned beginning with the lowest concentration and fi nishing with
the highest concentration (for more information about this, see CALIBRATION
CURVES, page 13). Prepare these solutions prior to entering a new calibration.
NOTE: A calibration procedure must be performed before using any of the
User Tests. If a User Test is selected before a calibration has been entered the
message not yet available press exit please will appear.
The User Tests can be placed in any of the alterable sequences using the EDIT
mode.
1. Go to PROGRAMMED TESTS
menu. Press to scroll to
EDIT.
2. Press *ENTER to select EDIT. EDIT
SMART Spectro Operator’s Manual 2.11 35
PROGRAMMED TESTS
SEQUENCE 2
SEQUENCE 3
ALL TESTS
EDIT
*
EDIT SEQUENCE 1
*
EDIT SEQUENCE 2
EDIT SEQUENCE 3
EDIT USER TESTS
Page 36

3. Press to scroll to EDIT USER
TESTS.
EDIT
EDIT SEQUENCE 1
EDIT SEQUENCE 2
EDIT SEQUENCE 3
EDIT USER TESTS
*
4. Press *ENTER to select EDIT
USER TESTS.
5. Press or to scroll to the user
test to be edited.
6. Press *ENTER to select the user
test to be edited.
NOTE: The menu allows a test
to be renamed, a wavelength to
be selected, reacted standards
to be scanned and the numerical
format of the displayed test result
to be selected. After editing any
one of these menu choices the
display will return to this menu.
Any menu choice can be edited
at any time by selecting it. The
normal procedure would be to
start with NAME THE TEST, then
SELECT WAVELENGTH, then
NEW CALIBRATION, and then
FORMAT RESULT.
EDIT
101 User Test 1
*
102 User Test 2
103 User Test 3
104 User Test 4
EDIT
101 User Test 1
102 User Test 2
*
103 User Test 3
104 User Test 4
102 User Test 2
*
NAME THE TEST
SELECT WL
NEW CALIBRATION
FORMAT RESULT
36 SMART Spectro Operator’s Manual 2.11
Page 37

NAMING THE TEST
A NAME can be up to 14 characters long. The menu choices for each character
are 26 letters A to Z, ten numerals 0 to 9, a space, a dash, a decimal point, and
a ! as a terminator. Selecting the terminator indicates the end of the name and
stores the name. The terminator, !, is the fi rst menu choice since it is the one
character that will always have to be selected. It is before the letter A. DO NOT
CHOOSE THE ! UNTIL THE NAMING OF THE TEST HAS BEEN COMPLETED.
The terminator should be selected following the end of the name. It must be the
last character selected.
1. The user test to be edited has
been selected.
102 User Test 2
*
NAME THE TEST
SELECT WL
NEW CALIBRATION
FORMAT RESULT
2. Press *ENTER to select NAME
THE TEST. Press to scroll to
CHANGE. (Select KEEP to go
back to the User Test menu.)
3. Press *ENTER to select
CHANGE.
NAME THE TEST
KEEP
*
CHANGE
END OF LIST
NAME THE TEST
102
!
ABCDEFGHIJKLMNOPQRS
TUVWXYZ0123456789-.
SMART Spectro Operator’s Manual 2.11 37
Page 38

4. Select the characters in the name
one at a time, from left to right. In
this example the new test name will
be H2O. Press to scroll right
to the fi rst character. Selection of
characters is controlled by moving
the curser over the top of the letter
to be chosen. Press *ENTER with
the curser over the character to
select it. The character will appear
now in the line next to the test
number. Continue in this fashion
until entire name is entered. Press
EXIT to delete/erase any incorrect
entry and start over. Select ! at
the end of the name to save the
name. The display will return to the
NAME THE TEST menu. Select
KEEP to save the name and return
to the User Test menu. Note that
the 102 is named H2O.
102 H2O
NAME THE TEST
*
SELECT WL
NEW CALIBRATION
FORMAT RESULT
38 SMART Spectro Operator’s Manual 2.11
Page 39

SELECTING THE WAVELENGTH
1. Scroll to SELECT WL. 102 H2O
NAME THE TEST
*
SELECT WL
NEW CALIBRATION
FORMAT RESULT
2. Press *ENTER to select SELECT
WL.
3. Press or to scroll to desired
wavelength.
4. Press *ENTER to save the
wavelength. The display will return
to the USER TEST menu.
SELECT WL
546 NM
SET PRESS ENTER
SELECT WL
560 NM
SET PRESS ENTER
102 H2O
*
NAME THE TEST
SELECT WL
NEW CALIBRATION
FORMAT RESULT
SMART Spectro Operator’s Manual 2.11 39
Page 40

ENTERING A NEW CALIBRATION
1. Press to scroll to NEW
CALIBRATION.
102 H2O
NAME THE TEST
SELECT WL
2. Press *ENTER to select NEW
CALIBRATION.
3. Press or to select the
number of data points that will
be used to create the calibration
curve. The maximum number of
data points is 8.
4. Press *ENTER to save the
selection.
*
*
NEW CALIBRATION
FORMAT RESULT
INPUT DATA NUMBERS
DATA NUMBERS = 5
SET PRESS ENTER
INPUT DATA NUMBERS
DATA NUMBERS = 6
SET PRESS ENTER
NEW CALIBRATION
ENTER STD.1
ENTER STD.2
ENTER STD.3
ENTER STD.4
5. Press *ENTER to select the fi rst
data point.
40 SMART Spectro Operator’s Manual 2.11
ENTER STD. 1
SCAN BLANK
*
STD.1 =
!0123456789.
Page 41

6. Place a blank in the sample
chamber. Press *ENTER to SCAN
BLANK. (STD. 1 is always a blank.)
The display will indicate that the
blank is being scanned. The
display will indicate BLANKED. A
cursor will appear on the character
selection line.
ENTER STD. 1
SCAN BLANK
*
STD.1 =
!
0123456789.
7. Place the reacted standard of
the lowest concentration in the
chamber. Press or to enter
the concentration of the standard
by selecting the characters with
the cursor.
8. After the concentration has been
entered, scroll to !. Press *ENTER.
The standard will be scanned
and the absorbance will be
displayed.
9. Press EXIT to return to the New
Calibration menu.
ENTER STD. 1
SCAN BLANK
*
STD.1 =
!0123456789
ENTER STD. 1
BLANKED
*
STD.1 = 1.0
A=0.0016A
NEW CALIBRATION
ENTER STD. 1
*
ENTER STD. 2
ENTER STD. 3
ENTER STD. 4
10. Press ENTER and use the same
procedure to scan the second
data point. Repeat the procedure
until the data from all of the
standards has been entered into
the calibration.
Note: Input the number of data
points previously selected.
For example, when inputting 6
standards ignore the request for
ENTER STD. 7.
SMART Spectro Operator’s Manual 2.11 41
NEW CALIBRATION
ENTER STD. 4
ENTER STD. 5
ENTER STD. 6
ENTER STD. 7
*
Page 42

11. Press to scroll to
CALCULATE.
NEW CALIBRATION
ENTER STD. 6
ENTER STD. 7
ENTER STD. 8
CALCULATE
*
12. Press *ENTER to select
CALCULATE.
13. Press *ENTER to select the
desired curve fi t.
Note: 1 DEGREE THRU.0 calculates the best straight line fi t through the data
points and intersects with the origin at 0 ppm, 0 absorbance. This is a classical
Beers Law calibration. If a one point calibration has been performed, the 1
DEGREE THRU.0 curve fi t must be chosen. 1 DEGREE calculates the best
straight line fi t but without forcing the line through the origin. The minimum
number of standards needed for a calibration is one for 1 DEGREE THRU.0 and
two for 1 DEGREE.
NOTE: 2 DEGREE and 3 DEGREE calculations are not available yet.
14. Press *ENTER to select the
desired curve fi t type. The display
will show the constraints for the
best fi t line.
SELECT DEGREES
1 DEGREE THRU.0
1 DEGREE
2 DEGREE
3 DEGREE
*
SELECT DEGREES
1 DEGREE THRU.0
1 DEGREE
*
2 DEGREE
3 DEGREE
KO=0.0000E +00
K1=0.3068E +0A
K2=0.0000E +00
K3=0.0000E+0A
Press EXIT return
42 SMART Spectro Operator’s Manual 2.11
Page 43

15. Press EXIT to return to the
SELECT DEGREES menu. Press
EXIT again to return to INPUT
DATA NUMBERS. Press EXIT
again to return to the USER TEST
menu.
*
102 H2O
NAME THE TEST
SELECT WL
NEW CALIBRATION
FORMAT RESULT
SELECTING THE NUMERICAL FORMAT OF THE
RESULT
To input tests with very different ranges, the number of decimal places displayed
for a result can be selected. A test which ranges from 20 to 1000 ppm should
not be displayed with three decimal places. A test with a range from 0.010 to
0.500 needs three decimal places (the microprocessor will always calculate the
concentration to many more signifi cant fi gures than will be displayed). Menu
choices of 0, 1, 2, or 3 decimal places will be given for the display.
*
102 H2O
NAME THE TEST
SELECT WL
NEW CALIBRATION
FORMAT RESULT
1. Press to scroll to FORMAT
RESULTS.
2. Press *ENTER to select FORMAT
RESULTS.
3. Press or to select the
number of decimal places to be
displayed.
SMART Spectro Operator’s Manual 2.11 43
DECIMAL PLACES?
0 PLACES
1 PLACE
2 PLACES
3 PLACES
DECIMAL PLACES?
0 PLACES
1 PLACE
*
2 PLACES
3 PLACES
Page 44

4. Press *ENTER to select the
number format.
*
102 H2O
NAME THE TEST
SELECT WL
NEW CALIBRATION
FORMAT RESULT
5. Press EXIT to return to EDIT USER
TEST menu. Press EXIT again to
escape to EDIT menu and again to
return to the PROGRAMMED TEST
menu.
Note: Test 102 was USER TEST 1
and now is H2O. It is still a USER
TEST because its calibration can
be changed but it has a different
name.
*
102 H2O
NAME THE TEST
SELECT WL
NEW CALIBRATION
FORMAT RESULT
MEASURING IN THE %T/ABS MODE
1. Press ON. The LaMotte logo
screen will appear for about 2
seconds and the MAIN MENU will
appear.
2. Press or to scroll to
%T/ABS.
MAIN MENU 12:00:01
CALIBRATE WL
*
PROGRAMMED TESTS
%T/ABS
PC LINK
MAIN MENU 12:00:01
CALIBRATE WL
PROGRAMMED TESTS
%T/ABS
*
PC LINK
3. Press *ENTER to select %T/
ABS.
44 SMART Spectro Operator’s Manual 2.11
%T/ABS 560NM
SELECT WL
*
SCAN BLANK
SCAN SAMPLE
END OF LIST
Page 45

4. Press *ENTER to select SELECT
WL
5. Press or to scroll to desired
wavelength.
SELECT WL
WL=560 NM
*
SELECT WL
*
WL=600 NM
6. Press *ENTER to select the
wavelength. The meter is ready to
scan.
7. Insert the blank into the chamber.
Press *ENTER to scan the blank.
Note: For most %T/ABS tests, a
clear colorless water blank should
be used.
8. Insert a reacted sample into the
chamber. Press *ENTER to scan
the sample.
At this point, it is possible to scan another sample, scan another blank, or select
another wavelength. To print the results to a connected computer or serial
printer, press *ENTER and return to previous menu. Press EXIT to escape to
previous menu.
%T/ABS 600 NM
SELECT WL
SCAN BLANK
*
SCAN SAMPLE
END OF LIST
%T/ABS 600 NM
SELECT WL
SCAN BLANK
SCAN SAMPLE
*
END OF LIST
%T/ABS 600 NM
T=90.7%T
A=0.0424A
PRINT PRESS ENTER
If no more samples are to be scanned, press EXIT to return to the MAIN MENU
or press OFF to turn off the spectrophotometer.
SMART Spectro Operator’s Manual 2.11 45
Page 46

PC LINK
The SMART Spectro may be interfaced with any Windows-based program by
using the LaMotte SMARTLink2 Program and Interface Cable (Code 1912-3) and
compact disk (Code 1912-CD). The program stores customer information and
test data in a database. It can be used to download data stored in the SMART
Spectro data logger for each test site.
The spectrophotometer may also be interfaced with an RS-232 serial printer,
using an interface cable (Code 1772) and setting the printer confi guration to the
Output below (see Computer Connection, below).
Choose PC LINK from the Main Menu. The user has the option to download the
last 25 results or the entire data logging buffer (500 results). Downloading does
not delete or empty the data logger.
OUTPUT
RS-232 compatible, asynchronous serial, 9600 baud, no parity, 8 data bits, 1
stop bit.
COMPUTER CONNECTION
RS-232 interface connection, 8 pin mini-DIN/9 pin F D-submin. (Code 1772)
46 SMART Spectro Operator’s Manual 2.11
Page 47

EDIT CLOCK
The clock information is used to time stamp the data points in the data logger.
1. Press ON. The LaMotte logo
screen will appear for about 2
seconds and the MAIN MENU will
appear.
2. Press or to scroll to
EDIT CLOCK.
3. Press *ENTER to select EDIT
CLOCK. The display will show
seconds-minutes-hours-monthday-year.
Note: Hours are in a 24 hour
format.
4. Press or to scroll to adjust
the seconds to the correct time.
MAIN MENU 12:00:01
CALIBRATE WL
*
PROGRAMMED TESTS
%T/ABS
PC LINK
MAIN MENU 12:00:01
PROGRAMMED TESTS
%T/ABS
PC LINK
EDIT CLOCK
*
EDIT CLOCK
46-09-14-08-09-2010
SET SECONDS: 26
SET PRESS ENTER
EDIT CLOCK
43-09-14-08-09-2010
SET SECONDS: 43
SET PRESS ENTER
5. Press *ENTER to save the second
setting.
SMART Spectro Operator’s Manual 2.11 47
EDIT CLOCK
43-09-14-08-09-2010
SET MINUTES: 09
SET PRESS ENTER
Page 48

6. Follow the procedure to set the
minutes, hour, month, day, and
year. Press EXIT to return to the
MAIN MENU.
ENERGY MODE
MAIN MENU 14:09:43
CALIBRATE WL
*
PROGRAMMED TESTS
%T/ABS
PC LINK
1. Press ON. The LaMotte logo
screen will appear for about 2
seconds and the MAIN MENU will
appear.
2. Press or to scroll to
ENERGY MODE.
3. Press *ENTER to select ENERGY
MODE.
4. Press or to select the
desired mode. In the NORMAL
mode the meter will remain on until
OFF is pressed. This is the default
setting. In the energy saving SAVE
mode, the meter will turn off 10
minutes after the last button press.
The SAVE mode will conserve
battery and lamp life.
MAIN MENU 12:00:01
CALIBRATE WL
*
PROGRAMMED TESTS
%T/ABS
PC LINK
MAIN MENU 12:00:01
%T/ABS
PC LINK
EDIT CLOCK
ENERGY MODE
*
ENERGY MODE
SAVE
NORMAL
*
END OF LIST
ENERGY MODE
SAVE
*
NORMAL
END OF LIST
48 SMART Spectro Operator’s Manual 2.11
Page 49

5. Press EXIT to return to the MAIN
MENU.
STORE METHOD
MAIN MENU 12:00:01
CALIBRATE WL
*
PROGRAMMED TESTS
%T/ABS
PC LINK
1. Press ON. The LaMotte logo
screen will appear for about 2
seconds and the MAIN MENU will
appear.
2. Press or to scroll to
STORE METHOD.
3. Press *ENTER to select STORE
METHOD.
4. Press or to select the
desired store method. In the
AUTO method, all results will
automatically be stored in the data
logger. This is the default setting.
In the MANUAL method, the user
will be prompted after each test
to decide whether to store the
result.
MAIN MENU 12:00:01
CALIBRATE WL
*
PROGRAMMED TESTS
%T/ABS
PC LINK
MAIN MENU 12:00:01
PC LINK
EDIT CLOCK
ENERGY MODE
STORE METHOD
*
STORE METHOD
AUTOMATIC
*
MANUAL
END OF LIST
STORE METHOD
AUTOMATIC
*
MANUAL
END OF LIST
SMART Spectro Operator’s Manual 2.11 49
Page 50

5. Press *ENTER to select the store
method and return to the MAIN
MENU.
MAIN MENU 12:00:01
CALIBRATE WL
*
PROGRAMMED TESTS
%T/ABS
PC LINK
TEST MODE
Select TEST MODE from the Main Menu. Test Mode allows the user to change
the way that blanking and reading of results is carried out during the %T/ABS
testing. It does not affect any of the Pre-programmed tests. REGULAR is the
default test mode and should be used whenever the blank is clear or has less
absorbance than the samples. This will be the case most of the time. In the
rare instances where the blank will be darker or have more absorbance than the
samples the Test Mode must be switched to REVERSE to avoid error messages
and incorrect readings. Always reset the test mode to REGULAR at the end of
each testing session.
The Test Mode should always be reset to REGULAR at the end of each testing
session.
1. Press ON. The LaMotte logo
screen will appear for about 2
seconds and the MAIN MENU will
appear.
2. Press or to scroll to
TEST MODE.
3. Press *ENTER to select TEST
MODE.
50 SMART Spectro Operator’s Manual 2.11
MAIN MENU 12:00:01
CALIBRATE WL
*
PROGRAMMED TESTS
%T/ABS
PC LINK
MAIN MENU 12:00:01
EDIT CLOCK
ENERGY MODE
STORE METHOD
TEST MODE
*
TEST MODE
REGULAR
*
REVERSE
END OF LIST
Page 51

4. Press or to select the
desired test mode.
TEST MODE
REGULAR
*
REVERSE
END OF LIST
5. Press *ENTER to select the test
mode and return to the MAIN
MENU.
MAIN MENU 12:00:01
CALIBRATE WL
*
PROGRAMMED TESTS
%T/ABS
PC LINK
BATTERY OPERATION
The SMART Spectro can be run using battery power. The battery pack
consists of a rechargeable Ni-metal hydride battery pack. The battery pack
is not included in the standard meter package and must be purchased as an
accessory (Code 2000-BP). The battery charger/adapter used with the optional
battery pack comes standard with each SMART Spectro.
CHARGING THE BATTERY PACK
1. Connect the Power Supply to the Battery Charger.
2. Connect the Battery Charger to the Battery Pack.
3. The battery pack will automatically charge. (For older battery packs with a
switch, move the switch to the CHARGING position.) A full charge will require
about 5 hours.
RUNNING THE SMART SPECTRO USING BATTERIES
Connect the Battery Pack to the SMART Spectro.
CAUTION: Do not connect the Power Supply directly to the Battery Pack. The
connectors will not fi t. Don’t force them.
SMART Spectro Operator’s Manual 2.11 51
Page 52

MAINTENANCE
CLEANING
Clean with a damp, lint-free cloth.
DO NOT ALLOW WATER TO ENTER THE SPECTROPHOTOMETER CHAMBER
OR ANY OTHER PARTS OF THE METER.
LIGHT BULB
The quartz halogen bulb in the SMART Spectro has an approximate life of 1000
hours. If a test is performed and there is no response and the unit is receiving
adequate power, the light bulb may need to be re-secured or replaced. With the
meter power ON check the rear lamp access panel to see if any light acan be
observed through the vents. If the lamp is not ON it is either loose or burnt out.
To determine if the lamp is loose, remove the vented panel on the back of the
meter. Loosen both thumb screws, noting that the thumb screws do not remove
from the unit completely; they are attached to the removable metal plate. Use a
clean, folded paper towel to gently push the lamp and see if it lights up. If so, it
was merely loose and can be fi rmly pushed into its socket. If the lamp doesn’t
light up, it should be replaced. Contact LaMotte Technical Service at 1-800-3443100 ext 2, or eamil tech@lamotte.com for a Return Authorization number and
service by LaMotte personnel. Or order LaMotte code# 27290-03 for a 10-watt
replacement lamp and replacement instructions.
CLOCK BATTERY (RAM BATTERY)
The Smart Spectro date/clock function is powered by its own battery. This
battery should be replaced about every 3 years. If the date or clock function
stops or if you receive the message “Warning RAM Battery Low” you should
replace the RAM battery as follows, or contact the LaMotte Technical Service
Department by phone at 1-800-344-3100, fax 410-778-6394 or email tech@
lamotte.com
Directions for opening the SMART Spectro meter housing
1. Before proceeding, unplug the Spectro AC power supply.
2. Turn the meter over and use a long neck (4” shaft) Phillips head screw
driver to unscrew all 4 screws located in the recessed cavities. Note; do not
remove the four screws that secure the rubber “feet” to the bottom of the
Spectro.
3. Holding the top and bottom together, carefully turn the meter over again.
The screws will fall out of the recessed cavity.
4. Carefully lift the top cover off. It is not necessary to disconnect any cables or
wires.
CAUTION: Be careful. The electronic circuits are static sensitive. DO NOT
52 SMART Spectro Operator’s Manual 2.11
Page 53

touch the electronic components. You do not need to touch the electronic
components to replace the RAM battery.
If you will be touching the electronic components for any other reason, you
must wear a grounding strap. If such a strap is not available then take every
precaution possible to ground yourself before and during any contact with
the electronic components by holding onto a grounded metal pipe or other
grounded piece of metal. If this is not possible then at least touch a grounded
piece of metal just prior to handling any components or touching the boards.
Improper grounding can allow static buildup to short the components. LaMotte
Company is not responsible for any such damages.
Directions for Replacing the RAM Battery
1. The battery is a 3V coin battery on the top circuit board, about the size of a
dime. It is a model CR1220 or BR1225. Replace the battery with the same
model type.
2. Unplug the battery by popping it out of its holder. A small insulated, fl at head
screw driver may be used to help remove the old battery.
3. Plug in the new battery with positive side facing up.
Assembly of the housing top and bottom
1. Reassemble the spectro housing. When putting the top and bottom back
together be careful about the alignment of the metal panel on the back of the
Spectro (lamp access panel). There are slots for this panel in both the top
and bottom part of the housing.
2. Secure the top to the bottom using all 4 screws.
METER DISPOSAL
Waste Electrical and Electronic Equipment (WEEE)
Natural resources were used in the production of this equipment. This
equipment may contain materials that are hazardous to health and the
environment. To avoid harm to the environment and natural resources, the use
of appropriate take-back systems is recommended. The crossed out wheeled
bin symbol on the meter encourages you to use these systems when disposing
of this equipment.
Take-back systems will allow the materials to be reused or recycled in a way that
will not harm the environment. For more information on approved collection,
reuse, and recycling systems contact your local or regional waste administration
or recycling service.
SMART Spectro Operator’s Manual 2.11 53
Page 54

TROUBLESHOOTING GUIDE
ERROR MESSAGES
OUT OF RANGE
If the message OUT OF RANGE is displayed when scanning a sample, the
sample may be over range or under range. If the sample is over range the
sample should be diluted and tested again (see Sample Dilution Techniques &
Volumetric Measurements, page16).
BATTERY (optional)
If the symbol BAT appears in the upper left corner of the display when using the
battery pack, the battery needs to be charged. The SMART Spectro will turn off if
the battery power becomes too low.
ERROR 1 TROUBLE WITH FILTER
There is a problem with fi lter positioning. This could be due to a dead motor,
bad connection to the motor, or a bad positioning detector. Contact LaMotte
Technical Service for help.
ERROR 2 TROUBLE WITH SWITCH
There is a problem with the grating positioning. This could be due to a dead
stepping motor, bad connection to stepping motor, or a bad micro switch.
Contact LaMotte Technical Service for help.
ERROR 3 TROUBLE WITH LIGHT
There is a problem locating the zero order light during wavelength calibration.
Contact LaMotte Technical Service for help.
WARNING SIGNAL TOO WEAK
Not enough light is getting to the detector. Check light path for blockage. Check
lamp position. Try recalibrating wavelength.
WARNING SIGNAL TOO STRONG
This can be an indication that the meter was accidently shut-off during
wavelength calibration. Shut meter off and restart.
WARNING RAM BATTERY LOW
Clock battery needs to be replaced soon. If it fails all user tests and Data log
Data will be lost. Unit can be run without this battery. Just use line power and
leave unit on.
54 SMART Spectro Operator’s Manual 2.11
Page 55

HELPFUL HINTS
POWER
The power supply has an internal switch that handles both 110V and 220V input.
STRAY LIGHT
The SMART Spectro should have no problems with stray light. Make sure that
the sample compartment lid is always fully closed.
ACCIDENTAL LOSS OF POWER
If for any reason the meter experiences a loss of power during wavelength
calibration, the next time the meter is powered up a wavelength calibration will
automatically be performed.
SMART Spectro Operator’s Manual 2.11 55
Page 56

TEST
PROCEDURES
v3.0 and higher • Printed 2.11
2000-01-MN
Page 57

SPECTROPHOTOMETER
REAGENT SYSTEMS LIST
Call LaMotte Technical Services at 1-800-344-3100 (410-778-3100 outside the
USA) or email at tech@lamotte.com for a current list of available calibrations and
downloading instructions.
Range
Test Factor (Test #)
Alkalinity-UDV (2) 0–200 15 Unit Dose Vials (1) 100
Aluminum (1) 0.00–0.30 0.01 Eriochrome Cyanine R (4) 50
Ammonia NitrogenLow Range, Fresh Water (3)
Ammonia NitrogenLow Range, Salt Water (4)
Ammonia NitrogenHigh Range (5)
Benzotriazole (009) 0.0–30.0 1.0 UV Photolysis (3) 50
Biguanide (7) 0–70 5 Colorimetric 50
Boron (8) 0.00-0.80 0.05 Azomethine-H (2) 25
Bromine-Low Range (010) 0.00–9.00 0.04 DPD (3) 100
Bromine-UDV (11) 0.0–20.0 0.3 DPD (1) 100
Cadmium (12) 0.00–1.00 0.02 PAN (4) 50
Carbohydrazide (013)
See Oxygen Scavengers
Calcium & Magnesium (Total),
Hardness-UDV
Chloride-TesTab (21) 0.0–50.0 0.5 Argentometric (1) 50
Chlorine-Tablet DPD (014) 0.00–4.00 0.02 DPD (3) 100
Chlorine-Free-UDV (16) 0.00–10.00 0.10 DPD (1) 100
Chlorine-Total-UDV (18) 0.00–10.00 0.10 DPD (1) 100
Chlorine-Liquid DPD (17) 0.00–4.00 0.025 DPD (3) 144
Chlorine Dioxide (019) 0.00–7.00 0.04 DPD (2) 100
Chromium, Hexavalent (22) 0.00–1.00 0.01 Diphenylcarbohydrazide 50
Chromium, Hex, Tri, Total (22) 0.00–1.00 0.01 Diphenylcarbohydrazide 50
Chromium-TesTab (23) 0.00-1.00 0.01 Diphenylcarbohydrazide 50
Cobalt (24) 0.00–2.00 0.02 PAN (3) 50
COD-Low Range (25) 0–150 5 Digestion (1) 25
COD-Standard Range (26) 0-1500 20 Digestion (1) 25
COD-High Range (27) 0–15,000 500 Digestion (1) 25
(ppm) MDL
0.00–1.00 0.02 Salicylate (3) 25
0.00–1.00 0.10 Salicylate (3) 25
0.00–4.00 0.05 Nesslerization (2) 50
0.000–0.900 0.005 Iron Reduction (3) 100
10-500 10 Unit Dose Vial (1) 100
Test Method (# of
Reagents)
# of
Tests
Page 58

Color (28) 0–1,000 15 Platinum Cobalt (0) –
Copper-BCA-Low Range (29) 0.00–3.50 0.05 Bicinchoninic Acid (1) 50
Copper-Cuprizone (31) 0.00–2.00 0.01 Cuprizone (2) 50
Copper-DDC (32) 0.00–6.00 0.05 Diethyldithiocarbamate (1) 50
Copper-UDV (33) 0.00–4.00 0.20 Bicinchoninic Acid (1) 100
Cyanide (35) 0.00-0.50 0.50 Pyridine-Barbituric Acid 100
Cyanuric Acid (36) 0–200 16 Melamine (1) 40
Cyanuric Acid-UDV (37) 0–150 5 Melamine (1) 100
DEHA (037)
See Oxygen Scavengers
Dissolved Oxygen (39) 0.0–12.0 0.25 Winkler Colorimetric (3) 100
Erythorbic Acid (049)
See Oxygen Scavengers
Fluoride (41) 0.00–2.00 0.05 SPADNS (2) 50
Hardness (Total) UDV (043) 10–500 10 Unit dose Vial (1) 100
Hydrazine (45) 0.000–0.750 0.010 P-dimethyl-
Hydrogen PeroxideLow Range (46)
Hydrogen PeroxideHigh Range (47)
Hydrogen Peroxide-Shock (48) 0–225 4 DPD (2) 100
Hydroquinone (049)
See Oxygen Scavengers
Iodine (050) 0.00–14.00 0.08 DPD (2) 100
Iron-Bipyridyl (51) 0.00–6.00 0.06 Bipyridyl (2) 50
Iron-Phenanthroline (53) 0.00–4.50 0.04 1,10 Phenanthroline (2) 50
Iron-UDV (52) 0.00–10.00 0.07 Bipyridyl (1) 100
Lead (54) 0.00–5.00 0.10 PAR (5) 50
Manganese-Low Range (55) 0.00–0.50 0.02 PAN (3) 50
Manganese-High Range (56) 0.0–15.0 0.3 Periodate (2) 50
Mercury (57) 0.00–1.50 0.02 TMK (3) 50
Methylethylketoxime (058)
See Oxygen Scavengers
Molybdenum-High Range (61) 0.0–30.0 0.2 Thioglycolate (3) 50
Nickel (63) 0.00–8.00 0.06 Dimethylglyoxime (6) 50
Nitrate-TesTab (66) 0-60 2.5 Zinc Reucion (1) 50
0.000–0.700 0.005 Iron Reduction (3) 100
0.00–3.00 0.02 Iron Reduction (3) 100
50
aminobenzaldehyde (2)
0.00–1.50 0.02 DPD (2) 100
0–60 1 DPD (2) 50
0.00–1.80 0.01 Iron Reduction (3) 100
0.00–3.00 0.02 Iron Reduction (3) 100
Page 59

Nitrate NitrogenLow Range (64)
Nitrite-TesTab (69) 0.00-1.25 0.025 Zinc Reduction (1) 50
Nitrite NitrogenLow Range (67)
Nitrogen, Total (62) 0-25 mg/L 2 mg/L Chromotropic Acid/
Oxygen Scanvengers various various DEHA (3) 50
Ozone-Low Range (071) 0.00–0.40 0.02 Indigo Trisulfonate (3) 100
Ozone-High Range (072) 0.00–1.50 0.05 Indigo Trisulfonate (3) 20
pH-Chlorophenol Red (073) 5.0-7.0 – Chlorophenol Red (1) 100
pH-Phenol Red (074) 6.6–8.4 – Phenol Red (1) 100
pH-Thymol Blue (075) 8.0–9.5 – Thymol Blue (1) 100
Phenol (77) 0.00-6.00 0.05 Aminoantipyrine (3) 50
Phosphate-Low Range (78) 0.00–3.00 0.04 Ascorbic Acid Reduction
Phosphate-High Range (79) 0.0–70.0 1.0 Vanodomolybd-
Phosphorus, Total, Low Range
(82)
Phosphorus,
Total, High-Range (83)
Potassium (81) 0.0-10.0 0.5 Tetraphenolboron (2) 100
Silica-Low Range (85) 0.00–2.50 0.03 Heteropoly Blue (4) 50
Silica-High Range (86) 0–50 1 Silicomolybdate (3) 50
Sulfate-High Range (89) 5–100 5 Barium Chloride (1) 100
Sulfi de-Low Range (90) 0.00–1.00 0.02 Methylene Blue (3) 50
Surfactants (94) 0.00-8.00 0.5 Bromphenol Blue (3) 50
Tannin (96) 0.0–10.0 0.2 Tungsto-
Tolytriazole (009)
See Benzotriazole
Turbidity (98) 2-400 FTU 2 FTU Absorption (0) –
Zinc-Low Range (99) 0.00–3.00 0.025 Zincon (6) 50
0.00–3.00 0.05 Cadmium Reduction (2) 20
0.00–0.80 0.02 Diazotization (2) 20
Digestion (6)
(2)
phosphoric Acid (1)
0.00–3.00
mg/L
0.0–70.0
mg/L
0.0–30.0 1.0 UV Photolysis (3) 50
0.07 Ascorbic Acid/Digestion 25
5.0
mg/L
Molybdovanadate/
Digestion (5)
molybdophosphoric
Acid (2)
25
50
50
25
50
Page 60

ALKALINITY, UDV
UNIT DOSE VIAL METHOD • CODE 4318-J-01
QUANTITY CONTENTS CODE
1 Alkalinity Unit Dose Vials, 20 pouches 4318-J
Equipment needed but not supplied:
STANDARD ACCESSORY PACKAGE • CODE 1961
1 Package of 3 Vials (empty) 0156
1 Syringe, 6 mL, plastic 1184
1 Foil Storage Bag 9467
Or:
ADVANCED ACCESSORY PACKAGE • CODE 1962
1 Pipettor 30528
1 Pipet Tip (0-5 mL) 30695
1 Cuvette Rack 31695
1 Package of 3 Vials (empty) 0156
1 Foil Storage Bag 9467
*WARNING: Reagents marked with an * are considered to be potential health
hazards. To view or print a Material Safety Data Sheet (MSDS) for these reagents
go to www.lamotte.com. To obtain a printed copy, contact LaMotte by e-mail,
phone or fax.
Test Procedures
Alkalinity is a measure of the acid-neutralizing capacity of water that enables it
to resist abrupt changes in pH. It is the sum of all titratable bases. Alkalinity is
signifi cant in maintaining proper pH levels in natural water; water used for irrigation,
swimming pools, industrial processes and wastewater treatment processes.
The presence of buffering materials in natural waters helps to neutralize acids as
they are added to, or created in, the water ecosystem. A Total Alkalinity of 100 to
200 ppm will stabilize the pH level in a stream. In swimming pools, total alkalinity
is commonly known as a pH stabilizer because, when the alkalinity is at a proper
level, a consistent pH level can be maintained while treatment chemicals or fresh
make-up water is added. In industrial situations, alkalinity is an important factor in
preventing fl uctuating pH levels that can damage equipment and corrode pipes.
SMART Spectro Test Procedures 2.11 ALKALINITY, UDV
Page 61

APPLICATION: Drinking and surface water and swimming pool water
RANGE: 0–200 ppm as CaCO
3
MDL: 15 ppm
METHOD: The sample is added to a buffered indicator reagent.
The color that develops, ranging from yellow to blue, will
indicate the amount of alkalinity in the sample.
SAMPLE HANDLING
& PRESERVATION:
Samples should be analyzed as soon as possible after
collection. Sample may be refrigerated for 24 hours.
INTERFERENCES: Quats and poly quats at high concentrations will
interfere.
Test Procedures
ALKALINITY, UDV SMART Spectro Test Procedures 2.11
Page 62

PROCEDURE
1. Use 10 mm square cell adapter
2. Press and hold ON button until spectrophotometer turns on.
3. Scroll to and select PROGRAMMED TESTS.
4. Scroll to and select ALL TESTS (or another sequence containing
2 Alk-UDV) from TESTING MENU.
5. Scroll to and select 2 Alk-UDV from menu.
6. Rinse a clean vial (0156) with sample water.
7. Use the syringe (1184) to add 3 mL of sample to the vial.
8. Insert the vial into chamber, close lid and select SCAN BLANK.
9. Remove vial from Spectro.
10. Use the syringe (1184) to add 3 mL of sample to a Alk UDV vial (4318).
11. Wait 2 minutes.
12. Invert vial 3 times to mix.
NOTE: If powder residue remains in the bottom of the vial after inverting or air
bubbles form, invert once more and tap bottom of vial sharply once or twice to
dislodge powder and bubbles. Mix.
13. Insert tube into chamber, close lid and select SCAN SAMPLE. Record
result.
14. Press OFF button to turn the spectrophotometer off or press EXIT button to
exit to a previous menu or make another menu selection.
NOTES: For best possible results, a reagent blank should be determined to
account for any contribution to the test result by the reagent system. To determine
the reagent blank, follow the above test procedure to scan a distilled or deionized
water blank. Then follow the above procedure to perform the test on a distilled or
deionized water sample. This test result is the reagent blank. Subtract the reagent
blank from all subsequent test results of unknown samples. It is necessary to
determine the reagent blank only when a new lot number of reagents is obtained.
Test Procedures
UDVs from opened pouches should be used promptly. Store unused vials from
opened pouches in the Foil Storage Bag (9467) to extend the shelf life of the
reagent. Generally, UDVs stored in the bag should be used within 10 days if the
humidity is less than 50% and within 5 days if humidity is greater than 50%. The
Foil Storage Bag contains a dessicant pack with indicator. When the indicator in the
window turns from blue to pink, the bag should be replaced.
SMART Spectro Test Procedures 2.11 ALKALINITY, UDV
Page 63

Test Procedures
ALKALINITY, UDV SMART Spectro Test Procedures 2.11
Page 64

ALUMINUM
ERIOCHROME CYANINE R METHOD • CODE 364I-SC
QUANTITY CONTENTS CODE
5 g * Aluminum Inhibitor Reagent *7865-C
2 x 120 mL * Aluminum Buffer Reagent *7866-J
120 mL Aluminum Indicator Reagent 7867-J
15 mL Aluminum Complexing Reagent 7868-E
1 Spoon, 0.1 g, plastic 0699
1 Spoon, 0.05 g, plastic 0696
2 Pipets, 1.0 mL, plastic 0354
1 Test Tube, glass, 5 mL w/cap 0230
*WARNING: Reagents marked with an * are considered to be potential health
hazards. To view or print a Material Safety Data Sheet (MSDS) for these reagents
go to www.lamotte.com. To obtain a printed copy, contact LaMotte by e-mail,
phone or fax.
Aluminum is the third most common element in the earth’s crust, which accounts
for its wide appearance in many water supplies. Aluminum exists in water as
soluble salts, colloidal compounds, and insoluble compounds. In wastewater that
has been treated by alum coagulation it will appear in one or more of the above
forms. Properly treated drinking water should have an aluminum concentration
below 0.05 mg/L.
Test Procedures
APPLICATION: Drinking, surface, and saline waters; domestic and
industrial wastewater.
RANGE: 0.00–0.30 ppm Aluminum
MDL: 0.01 ppm
METHOD: Aluminum ions buffered to a pH of 6.0 react with
Eriochrome Cyanine R dye to produce a pink to red
complex in proportion to the concentration.
SAMPLE HANDLING
& PRESERVATION:
INTERFERENCES: Fluoride and polyphosphate will interfere. Interference
SMART Spectro Test Procedures 2.11 ALUMINUM
Collect sample in acid washed glass or plastic bottle.
Analyze as soon as possible.
from iron and manganese is eliminated by the addition
of an inhibitor.
Page 65

PROCEDURE
Use universal sample holder.
1. Press and hold ON button until spectrophotometer turns on.
2. Scroll to and select PROGRAMMED TESTS.
3. Scroll to and select ALL TESTS (or another sequence containing
1 Aluminum).
4. Scroll to and select 1 Aluminum from menu.
5. Rinse a clean Spectro tube (0290) with sample water. Fill to the 10 mL line with
sample.
6. Insert tube into Spectro chamber and select SCAN BLANK.
7. Rinse a clean test tube (0230) with sample water. Fill to the 5 mL line with
sample.
8. Remove tube from Spectro. Empty sample from Spectro tube (0290).
9. Add 5 mL sample from test tube (0230) to empty Spectro tube (0290).
10. Use the 0.05 g spoon (0696) to add one measure of *Aluminum Inhibitor
Reagent (7865). Cap and mix to dissolve powder.
11. Use a 1.0 mL pipet (0354) to add 2 mL of *Aluminum Buffer Reagent (7866).
Cap and mix.
12. Use a second 1.0 mL pipet (0354) to add 1 mL of Aluminum Indicator
Reagent (7867). Cap and mix contents. Wait 5 minutes for maximum color
development.
13. At end of 5 minute waiting period, mix, insert tube into chamber, close lid and
select SCAN SAMPLE. Record result.
14. Press OFF button to turn the spectrophotometer off or press EXIT button to
Test Procedures
exit to a previous menu or make another menu selection.
NOTE: For the best possible results, a reagent blank should be determined to
account for any contribution to the test result by the reagent system. To determine
the reagent blank, follow the above test procedure to scan a distilled or deionized
water blank. Add 5 drops of Aluminum Complexing Reagent (7868). Then follow
the above procedure to perform the test on a distilled or deionized water sample.
This test result is the reagent blank. Subtract the reagent blank from all subsequent
test results of unknown samples. It is necessary to determine the reagent blank
only when a new lot number of reagents is obtained.
ALUMINUM SMART Spectro Test Procedures 2.11
Page 66

AMMONIA-NITROGEN, LOW RANGE
SALICYLATE METHOD • CODE 3659-01-SC
QUANTITY CONTENTS CODE
60 mL *Salicylate Ammonia #1 *3978-H
10 g *Salicylate #2 *7457-D
2 x 5 g *Salicylate #3 Reagent Powder *7458-C
1 Spoon, 0.1 g, plastic 0699
1 Spoon, 0.15 g, plastic 0727
1 Pipet, 1.0 mL, plastic 0354
*WARNING: Reagents marked with an * are considered to be potential health
hazards. To view or print a Material Safety Data Sheet (MSDS) for these reagents
go to www.lamotte.com. To obtain a printed copy, contact LaMotte by e-mail,
phone or fax.
Ammonia nitrogen is present in various concentrations in many surface and ground
water supplies. Any sudden change in the concentration of ammonia nitrogen
in a water supply is cause for suspicion. A product of microbiological activity,
ammonia nitrogen is sometimes accepted as chemical evidence of pollution when
encountered in natural waters.
Ammonia is rapidly oxidized in natural water systems by special bacterial groups
that produce nitrite and nitrate. This oxidation requires that dissolved oxygen be
available in the water. Ammonia is an additional source of nitrogen as a nutrient
which may contribute to the expanded growth of undesirable algae and other forms
of plant growth that overload the natural system and cause pollution.
Test Procedures
SMART Spectro Test Procedures 2.11 AMMONIA-NITROGEN, Low Range
Page 67

APPLICATION: Low concentrations of ammonia in fresh, brackish and salt
water; fresh and salt water aquariums.
RANGE: 0.00–1.00 ppm Ammonia-Nitrogen
MDL: 0.02 ppm Fresh Waer
0.10 ppm Salt Water
METHOD: Salicylate and ammonia react at high pH in the presence
of a chlorine donor and an iron catalyst to form a blue
indophenol dye, the concentration of which is proportional
to the ammonia concentration in the sample.
SAMPLE HANDLE &
PRESERVATION:
Ammonia solutions tend to be unstable and should be
analyzed immediately. Samples may be stored for 24
hours at 4°C or 28 days at –20°C.
INTERFERENCES: There are few interferences in most natural waters. High
concentrations of reducing agents, such as hydrazine,
react with the chlorine donor and can result in negative
interferences. Color and turbidity can also interfere.
Test Procedures
AMMONIA-NITROGEN, Low Range SMART Spectro Test Procedures 2.11
Page 68

PROCEDURE–FRESH WATER
Use universal sample holder.
1. Press and hold ON button until spectrophotometer turns on.
2. Scroll to and select PROGRAMMED TESTS from menu.
3. Scroll to and select ALL TESTS (or another sequence containing
3 Ammonia-N LF) from TESTING MENU.
4. Scroll to and select 3 Ammonia-N LF from menu.
5. Rinse a clean tube (0290) with sample water. Fill to the 10 mL line with
sample.
6. Insert tube into chamber, close lid and select SCAN BLANK. (See Note.)
7. Remove tube from Spectro. Use the 1.0 mL plastic pipet (0354) to add 2.0 mL
of *Salicylate Ammonia #1 (3978). Cap and mix.
8. Use the 0.15 g spoon (0727) to add two measures of *Salicylate #2 Reagent
(7457). Cap and mix until dissolved. Wait 1 minute.
9. At end of 1 minute waiting period use 0.1 g spoon (0699) to add two measures
of *Salicylate #3 Reagent Powder (7458). Cap and shake vigorously for at
least 30 seconds and all solid has dissolved. Wait 12 minutes for maximum
color development.
10. At the end of 12 minute waiting period, mix, insert tube into chamber, close lid
and select SCAN SAMPLE. Record result.
11. Press OFF button to turn spectrophotometer off or press EXIT button to exit to
a previous menu or make another menu selection.
Test Procedures
CALCULATIONS:
To express results as Unionized Ammonia (NH
):
3
ppm Unionized Ammonia (NH3) =
ppm Ammonia-Nitrogen (NH3–N) x 1.2
To express results as Ionized Ammonia (NH4):
ppm Ionized Ammonia (NH4+) =
ppm Ammonia-Nitrogen (NH3–N) x 1.3
NOTES: For the best possible results, a reagent blank should be determined to
account for any contribution to the test result by the reagent system. To determine
the reagent blank, follow the above test procedure to scan a distilled or deionized
water blank. Then follow the above procedure to perform the test on a distilled or
deionized water sample. This test result is the reagent blank. Subtract the reagent
blank from all subsequent test results of unknown samples. It is necessary to
determine the reagent blank only when a new lot number of reagents is obtained.
SMART Spectro Test Procedures 2.11 AMMONIA-NITROGEN, Low Range
Page 69

To determine the percentage of Ammonia-Nitrogen that is unionized and ionized,
consult the Appendix.
PROCEDURE–SALT WATER
Use universal sample holder.
1. Press and hold ON button until spectrophotometer turns on.
2. Scroll to and select PROGRAMMED TESTS from menu.
3. Scroll to and select ALL TESTS (or another sequence containing
4 Ammonia-N LS) from TESTING MENU.
4. Scroll to and select 4 Ammonia-N LS from menu.
5. Rinse a clean tube (0290) with sample water. Fill to the 10 mL line with
sample.
6. Insert tube into chamber, close lid and select SCAN BLANK. (See Note.)
7. Remove tube from Spectro. Use the 1.0 mL plastic pipet (0354) to add 2.0 mL
of *Salicylate Ammonia #1 (3978). Cap and mix.
8. Use the 0.15 g spoon (0727) to add two measures of *Salicylate #2 Reagent
(7457). Cap and mix until dissolved. Wait 1 minute.
9. At end of 1 minute waiting period use 0.1 g spoon (0699) to add two measures
of *Salicylate #3 Reagent Powder (7458). Cap and shake vigorously for at
least 30 seconds and all solid has dissolved. Wait 20 minutes for maximum
color development.
10. At the end of 20 minute waiting period, mix, insert tube into chamber, close lid
and select SCAN SAMPLE. Record result.
11. Press OFF button to turn spectrophotometer off or press EXIT button to exit to
Test Procedures
a previous menu or make another menu selection.
AMMONIA-NITROGEN, Low Range SMART Spectro Test Procedures 2.11
Page 70

CALCULATIONS:
To express results as Unionized Ammonia (NH3):
ppm Unionized Ammonia (NH3) =
ppm Ammonia-Nitrogen (NH3–N) x 1.2
To express results as Ionized Ammonia (NH4):
ppm Ionized Ammonia (NH4+) =
ppm Ammonia-Nitrogen (NH3–N) x 1.3
NOTES: For the best possible results, a reagent blank should be determined to
account for any contribution to the test result by the reagent system. To determine
the reagent blank, follow the above test procedure to scan a distilled or deionized
water blank. Then follow the above procedure to perform the test on a distilled or
deionized water sample. This test result is the reagent blank. Subtract the reagent
blank from all subsequent test results of unknown samples. It is necessary to
determine the reagent blank only when a new lot number of reagents is obtained.
To determine the percentage of Ammonia-Nitrogen that is unionized and ionized,
consult the Appendix.
Test Procedures
SMART Spectro Test Procedures 2.11 AMMONIA-NITROGEN, Low Range
Page 71

Test Procedures
AMMONIA-NITROGEN, Low Range SMART Spectro Test Procedures 2.11
Page 72

AMMONIA-NITROGEN, HIGH RANGE
NESSLERIZATION METHOD • CODE 3642-SC
QUANTITY CONTENTS CODE
30 mL Ammonia Nitrogen Reagent #1 V-4797-G
2 x 30 mL *Ammonia Nitrogen Reagent #2 *V-4798-G
1 Pipet, 1 mL, plastic 0354
*WARNING: Reagents marked with an * are considered to be potential health
hazards. To view or print a Material Safety Data Sheet (MSDS) for these reagents
go to www.lamotte.com. To obtain a printed copy, contact LaMotte by e-mail,
phone or fax.
Ammonia nitrogen is present in various concentrations in many surface and ground
water supplies. Any sudden change in the concentration of ammonia nitrogen
in a water supply is cause for suspicion. A product of microbiological activity,
ammonia nitrogen is sometimes accepted as chemical evidence of pollution when
encountered in natural waters.
Ammonia is rapidly oxidized in natural water systems by special bacterial groups
that produce nitrite and nitrate. This oxidation requires that dissolved oxygen be
available in the water. Ammonia is an additional source of nitrogen as a nutrient
which may contribute to the expanded growth of undesirable algae and other forms
of plant growth that overload the natural system and cause pollution.
APPLICATION: Drinking, surface, and saline waters; domestic and
industrial wastes.
RANGE: 0.00–4.00 ppm Ammonia Nitrogen
MDL: 0.05 ppm
METHOD: Ammonia forms a colored complex with Nessler’s
Reagent in proportion to the amount of ammonia
present in the sample. Rochelle salt is added to prevent
precipitation of calcium or magnesium in undistilled
samples.
SAMPLE HANDLING &
PRESERVATION:
INTERFERENCES: Sample turbidity and color may interfere. Turbidity may
Ammonia solutions tend to be unstable and should be
analyzed immediately. Sample may be stored for 24
hours at 4°C or 28 days at –20°C.
be removed by a fi ltration procedure. Color interference
may be eliminated by blanking the instrument with a
sample blank.
Test Procedures
SMART Spectro Test Procedures 2.11 AMMONIA-NITROGEN, High Range
Page 73

PROCEDURE
Use universal sample holder.
1. Press and hold ON button until spectrophotometer turns on.
2. Scroll to and select PROGRAMMED TESTS.
3. Scroll to and select ALL TESTS (or another sequence containing
5 Ammonia-N H) from TESTING MENU.
4. Scroll to and select 5 Ammonia-N H from menu.
5. Rinse a clean tube (0290) with sample water. Fill to the 10 mL line with
sample.
6. Insert tube into chamber, close lid and select SCAN BLANK. (See Note)
7. Remove tube from Spectro. Add 8 drops of Ammonia Nitrogen Reagent #1
(V-4797). Cap and mix. Wait 1 minute.
8. Use the 1.0 mL pipet (0354) to add 1.0 mL of *Ammonia Nitrogen Reagent #2
(V-4798). Cap and mix. Allow 5 minutes for maximum color development.
9. At end of 5 minute waiting period, mix, insert tube into chamber, close lid and
select SCAN SAMPLE. Record result.
10. Press OFF button to turn the spectrophotometer off or press the EXIT button
exit to a previous menu or make another menu selection.
CALCULATIONS:
To express results as Unionized Ammonia (NH
):
3
ppm Unionized Ammonia (NH3) =
ppm Ammonia-Nitrogen (NH3–N) x 1.2
To express results as Ionized Ammonia (NH4):
Test Procedures
ppm Ionized Ammonia (NH4+) =
ppm Ammonia-Nitrogen (NH3–N) x 1.3
NOTES: For the best possible results, a reagent blank should be determined to
account for any contribution to the test result by the reagent system. To determine
the reagent blank, follow the above test procedure to scan a distilled or deionized
water blank. Then follow the above procedure to perform the test on a distilled or
deionized water sample. This test result is the reagent blank. Subtract the reagent
blank from all subsequent test results of unknown samples. It is necessary to
determine the reagent blank only when a new lot number of reagents is obtained.
To determine the percentage of Ammonia-Nitrogen that is unionized and ionized,
consult the Appendix.
AMMONIA-NITROGEN, High Range SMART Spectro Test Procedures 2.11
Page 74

BIGUANIDE
COLORIMETRIC METHOD • CODE 4044
QUANTITY CONTENTS CODE
2 X 60 mL Biguanide Indicator 3994-H
1 Pipet, plastic, 1.0 mL 0354
Biguanide is a non-chlorine, non-bromine chemical sanitizer. It is more stable
than chlorine or bromine and has little chemical odor. Biquanide is an effective
bacteriacide but, unlike chlorine and bromine, it does not destroy organic
contaminants. Therefore, hydrogen peroxide is added to biguanide pools on a
regular basis to eliminate organic contaminants. The optimum recommended level
of biguanide is 30 to 50 ppm.
APPLICATION: Swimming pools
RANGE: 0-70 ppm
MDL: 5 ppm
METHOD: Biguanide complexes with the proprietary indicator to
produce a colored solution. The color ranges from yellow
through green to blue depending on the biguanide
concentration.
SAMPLE HANDLING
& PRESERVATION:
INTERFERENCES: The only interfering substances that are likely to be
Samples should be analyzed as soon as possible.
encountered in pool water are oxidized manganese and
oxidizing agents, such as chlorine, bromine and ozone.
Test Procedures
SMART Spectro Test Procedures 2.11 BIGUANIDE
Page 75

PROCEDURE
Use universal sample holder
1. Press and hold ON button until spectrophotometer turns on.
2. Scroll to and select PROGRAMMED TESTS.
3. Select ALL TESTS (or another sequence containing 7 Biguanide from
TESTING MENU.
4. Scroll to and select 7 Biguanide from menu.
5. Rinse a tube (0290) with sample water. Fill to 10 mL with sample.
6. Insert the tube into chamber, close lid and select SCAN BLANK.
7. Remove the tube from colorimeter.
8. Use the 1.0 mL pipet (0354) to add 2.0 mL of Biguanide Indicator (3994). Cap
and invert three times to mix.
9. Wait 1 minute.
10. Insert the tube into chamber. Close lid.
11. Select SCAN SAMPLE. Record result in ppm Biguanide
12. Press OFF button to turn the spectrophotometer off or press EXIT button to
exit to a previous menu or make another menu selection.
NOTE: For best possible results, a reagent blank should be determined to account
for any contribution to the test result by the reagent system. To determine the
reagent blank, follow the above test procedure to scan a distilled or deionized
water blank. Then follow the above procedure to perform the test on a distilled or
deionized water sample. This test result is the reagent blank. Subtract the reagent
blank from all subsequent test results of unknown samples. It is necessary to
Test Procedures
determine the reagent blank only when a new lot number of reagents is obtained.
BIGUANIDE SMART Spectro Test Procedures 2.11
Page 76

BORON
AZOMETHINE-H METHOD • CODE 4868
QUANTITY CONTENTS CODE
120 mL *Boron Buffer *4869-J
10 g *Boron Indicator Powder *4870-D
1 Pipet, plastic, 1.0 mL 0354
1 Spoon, 0.15 g 0727
1 Dark Storage Chamber, brown 0108
*WARNING: Reagents marked with an * are considered to be potential health
hazards. To view or print a Material Safety Data Sheet (MSDS) for these reagents
go to www.lamotte.com. To obtain a printed copy, contact LaMotte by e-mail,
phone or fax.
Small amounts of boron are necessary for plant growth but large amounts can be
toxic. In humans, boron aids in the uptake of calcium and the production of strong
bones. An excess of boron can affect the central nervous system resulting in a
syndrome known as borism. Some natural waters may contain small amounts of
boron. Large concentrations may be due to industrial effl uent entering waterways.
Boron compounds are used in cleaning compounds, paper and paints, fertilizers,
glass and ceramics, fi re retardants and the production of alloys. In the atomic
energy fi eld, boron is a component of neutron shields and nuclear reactors. Some
swimming pools use boron buffering systems.
Test Procedures
APPLICATION: Surface and saline waters, hydroponic solutions,
industrial waste, swimming pools.
RANGE: 0.00–0.80 ppm Boron
MDL: 0.05 ppm
METHOD: Azomethine-H and borate form a yellow complex at pH 6
in proportion to the concentration of boron present.
SAMPLE HANDLING
& PRESERVATION:
INTERFERENCES: Interferences in drinking water are unlikely. Manganese,
SMART Spectro Test Procedures 2.11 BORON
Store samples in polyethylene bottles. Do not use borate
detergents or glassware.
zirconium, chromium, titanium, copper, vanadium,
aluminum, beryllium and iron may cause high results.
Page 77

PROCEDURE
Use universal sample holder
1. This test requires a Reagent Blank. Rinse a tube (0290) with clear, colorless,
boron free water. Fill to 10 mL line with clear, colorless, boron free water.
2. Use the 1.0 mL pipet (0354) to add 2 mL of *Boron Buffer (4869). Cap and
mix.
3. Use the 0.15 g spoon (0727) to add one level measure of *Boron Indicator
Powder (4870). Press full spoon against side of jar to compress powder.
Scrape off excess powder on inside neck of bottle. Tap excess off spoon
handle.
4. Cap and shake vigorously for 30 seconds.
5. Insert the tube into meter chamber. Close lid.
6. Start a timer set for 30 minutes. Do not open the lid during the waiting time.
The reaction is photosensitive.
7. Rinse a clean tube (0290) with Sample Water. Fill to the 10 mL line with sample
water. Repeat steps 2-4.
8. Insert the tube into the Dark Storage Chamber (29849). Close top.
9. Start a second timer set for 30 minutes. Do not open the chamber during the
waiting time. The reaction is photosensitive.
10. When 2 minutes remain on the fi rst timer (Reagent Blank), press and hold ON
button until spectrophotometer turns on.
11. Scroll to and select PROGRAMMED TESTS.
12. Scroll to and select ALL TESTS (or another sequence containing 8 Boron)
from TESTING MENU.
13. Scroll to and select 8 Boron from menu.
Test Procedures
14. At the end of the Reagent Blank 30 minute waiting period, remove Reagent
Blank tube from meter chamber. Invert several times to mix.
15. Insert the tube into meter chamber, close lid and select SCAN BLANK.
16. Remove the tube from spectrophotometer.
17. At the end of the Sample Water 30 minute waiting period, remove Sample
Water tube from Dark Storage Chamber. Invert several times to mix.
18. Insert tube into meter chamber, close lid and select SCAN SAMPLE. Record
result in ppm boron.
19. Press OFF button to turn the spectrophotometer off or press EXIT button to
exit to a previous menu or make another menu selection.
BORON SMART Spectro Test Procedures 2.11
Page 78

BROMINE, UDV
DPD UNIT DOSE VIAL METHOD • CODE 4311-J
QUANTITY CONTENTS CODE
1 *Free Chlorine Unit Dose Vials, 20 pouches *4311-J
Equipment needed but not supplied:
STANDARD ACCESSORY PACKAGE • CODE 1961
1 Package of 3 Vials (empty) 0156
1 Syringe, 3 mL, plastic 1184
1 Foil Storage Bag 9467
Or:
ADVANCED ACCESSORY PACKAGE • CODE 1962
1 Pipettor, 3 mL 30528
1 Pipet Tip (0-5 mL) 30695
1 Cuvette Rack 31695
1 Package of 3 Vials (empty) 0156
1 Foil Storage Bag 9467
*WARNING: Reagents marked with an * are considered to be potential health
hazards. To view or print a Material Safety Data Sheet (MSDS) for these reagents
go to www.lamotte.com. To obtain a printed copy, contact LaMotte by e-mail,
phone or fax.
Test Procedures
Like chlorine, bromine is an effective germicidal agent employed in drinking water
treatment, pool and spa water sanitation, food service sanitation, and other public
health applications.
SMART Spectro Test Procedures 2.11 BROMINE, UDV
Page 79

APPLICATION: Drinking, surface, and saline waters; domestic and
industrial waters and wastes.
RANGE: 0.0 – 22.0 ppm Bromine
MDL: 0.3 ppm
METHOD: In buffered sample bromine reacts with diethyl-p-
phenylene diamine (DPD) to produce a pink-red color in
proportion to the concentration of bromine present.
SAMPLE HANDLING
& PRESERVATION:
Bromine in aqueous solutions is not stable, and the
bromine content of samples or solutions, particularly
weak solutions, will rapidly decrease. Exposure to sunlight
or agitation will accelerate the reduction of bromine
present in such solutions. For best results start analysis
immediately after sampling. Samples to be analyzed for
bromine cannot be preserved or stored.
INTERFERENCES: The only interfering substance likely to be encountered
in water is oxidized manganese. The extent of this
interference can be determined by treating a sample with
sodium arsenite to destroy the bromine present so that
the degree of interference can be estimated.
Iodine and chlorine can also interfere, but these are
not normally present unless they have been added as
sanitizers.
Test Procedures
BROMINE, UDV SMART Spectro Test Procedures 2.11
Page 80

PROCEDURE
Use 10 mm square cell adapter
1. Press and hold ON button until spectrophotometer turns on.
2. Scroll to and select PROGRAMMED TESTS.
3. Scroll to and select ALL TESTS (or another sequence containing
11 Bromine-UDV) from TESTING MENU.
4. Scroll to and select 11 Bromine-UDV from menu.
5. Rinse a clean vial (0156) with sample water.
6. Use the syringe (1184) to add 3mL of sample to the vial.
7. Insert the vial into chamber, close the lid and select SCAN BLANK.
8. Remove the vial from the Spectro.
9. Use the syringe (1184) to add 3mL of sample to a *Free Chlorine UDV
(4311).
10. Shake vigorously until powder dissolves completely.
NOTE: If powder residue remains in the bottom of the vial after inverting or air
bubbles form, invert once more and tap bottom of vial sharply once or twice to
dislodge powder and bubbles. Mix.
11. Immediately insert tube into chamber, close lid and select SCAN SAMPLE.
Record result in ppm bromine.
12. Press OFF button to turn the spectrophotometer off or press EXIT button to
exit to a previous menu or make another menu selection.
Test Procedures
NOTE: For best possible results, a reagent blank should be determined to account
for any contribution to the test result by the reagent system. To determine the
reagent blank, follow the above test procedure to scan a distilled or deionized
water blank. Then follow the above procedure to perform the test on a distilled or
deionized water sample. This test result is the reagent blank. Subtract the reagent
blank from all subsequent test results of unknown samples. It is necessary to
determine the reagent blank only when a new lot number of reagents is obtained.
NOTE: UDVs from opened pouches should be used promptly. Store unused vials
from opened pouches in the Foil Storage Bag (9467) to extend the shelf life of the
reagent. Generally, UDVs stored in the bag should be used within 10 days if the
humidity is less than 50% and within 5 days if humidity is greater than 50%. The
Foil Storage Bag contains a desiccant pack with indicator. When the indicator in the
window turns from blue to pink, the bag should be replaced.
SMART Spectro Test Procedures 2.11 BROMINE, UDV
Page 81

Test Procedures
BROMINE, UDV SMART Spectro Test Procedures 2.11
Page 82

CADMIUM
PAN METHOD • CODE 4017-01
QUANTITY CONTENTS CODE
60 mL Buffered Ammonia Reagent 4020-H
15 mL Sodium Citrate, 10% 6253-E
30 mL *PAN Indicator *4021-G
30 mL Stabilizing Reagent 4022-G
1 Pipet, 1.0 mL, plastic 0354
2 Pipet, 0.5 mL, plastic 0369
*WARNING: Reagents marked with an * are considered to be potential health
hazards. To view or print a Material Safety Data Sheet (MSDS) for these reagents
go to www.lamotte.com. To obtain a printed copy, contact LaMotte by e-mail,
phone or fax.
Cadmium is used in batteries, paint pigments, electroplating processes, and
with other metals in the preparation of alloys. The solubility of cadmium in natural
water is proportional to the hardness or alkalinity of the water. Cadmium is not an
essential nutrient for plants and animals. It is extremely toxic and can accumulate in
the kidneys and liver.
APPLICATION: Drinking and surface waters; domestic and industrial
wastewater.
RANGE: 0.00–1.00 Cadmium
MDL: 0.02 ppm
METHOD: PAN (1-(2-Pyridylazo)-2-Naphthol) forms a red complex
with Cadmium (Cd+2) at a pH of 10.
SAMPLE HANDLING &
PRESERVATION:
INTERFERENCES: Ag
Analyze sample as soon as possible. If sample must be
stored, acidify with nitric acid to a pH below 2.
+2
, Co+2, Cu+2, Mn+2, Ni+2, Zn+2, Y+3, In
+3
Test Procedures
SMART Spectro Test Procedures 2.11 CADMIUM
Page 83

PROCEDURE
1. Use universal sample holder.
2. Press and hold ON button until spectrophotometer turns on.
3. Scroll to and select PROGRAMMED TESTS.
4. Scroll to and select ALL TESTS (or another sequence containing
12 Cadmium) from TESTING MENU.
5. Scroll to and select 12 Cadmium from menu.
6. Rinse a tube (0290) with sample water. Fill to the 10 mL line with sample.
7. Insert the tube into chamber, close lid and select SCAN BLANK.
8. Remove tube from Spectro. Use the 1.0 mL pipet (0354) to add 1.0 mL of
*Buffered Ammonia Reagent (4020). Swirl to mix.
9. Add two drops of Sodium Citrate, 10% (6253). Swirl to mix.
10. Use a 0.5 mL pipet (0369) to add 0.5 mL of PAN Indicator (4021). Swirl to
mix.
11. Use a 0.5 mL pipet (0369) to add 0.5 mL Stabilizing Reagent (4022). Cap and
mix.
12. Immediately insert tube into chamber, close lid and select SCAN SAMPLE.
Record result.
13. Press OFF button to turn the spectrophotometer off or press EXIT button to
exit to a previous menu or make another menu selection.
NOTE: For best possible results, a reagent blank should be determined to account
for any contribution to the test result by the reagent system. To determine the
reagent blank, follow the above test procedure to scan a distilled or deionized
water blank. Then follow the above procedure to perform the test on a distilled or
deionized water sample. This test result is the reagent blank. Subtract the reagent
Test Procedures
blank from all subsequent test results of unknown samples. It is necessary to
determine the reagent blank only when a new lot number of reagents is obtained.
CADMIUM SMART Spectro Test Procedures 2.11
Page 84

CALCIUM & MAGNESIUM (TOTAL)
HARDNESS, UDV
UNIT DOSE VIAL METHOD • CODE 4309-J
QUANTITY CONTENTS CODE
1 Calcium Hardness Unit Dose Vials, 20 pouches 4309-J
Equipment needed but not supplied:
STANDARD ACCESSORY PACKAGE • CODE 1961
1 Package of 3 Vials (empty) 0156
1 Syringe, 3 mL, plastic 1184
1 Foil Storage Bag 9467
Or:
ADVANCED ACCESSORY PACKAGE • CODE 1962
1 Pipettor, 3 mL 30528
1 Pipet Tips (0-5 mL) 30695
1 Cuvette Rack 31695
1 Package of 3 Vials (empty) 0156
1 Foil Storage Bag 9467
Test Procedures
*WARNING: Reagents marked with an * are considered to be potential health
hazards. To view or print a Material Safety Data Sheet (MSDS) for these reagents
go to www.lamotte.com. To obtain a printed copy, contact LaMotte by e-mail,
phone or fax.
APPLICATION: Drinking and surface waters; swimming pool water.
RANGE: 10–500 as CaCO
MDL: 10 ppm
METHOD: Calcium and magnesium react in a strongly buffered
medium with an indicator to develop a pale purple color
in proportion to the concentration.
SAMPLE HANDLING &
PRESERVATION:
INTERFERENCES: Heavy metals will interfere.
SMART Spectro Test Procedures 2.11 CALCIUM & MAGNESIUM HARDNESS, UDV
Samples should be analyzed as soon as possible after
collection. If storage is necessary, add 0.5 mL of 20
% hydrochloric acid per 100 mL of sample. However,
the added acid will have to be neutralized with NaOH
before testing.
Total Hardness
3
Page 85

PROCEDURE
Use 10 mm square cell adapter
1. Press and hold ON button until spectrophotometer turns on.
2. Scroll to and select PROGRAMMED TESTS.
3. Scroll to and select ALL TESTS (or another sequence containing
13 Ca&Mg Hard-UDV) from TESTING MENU.
4. Scroll to and select 13 Ca&Mg Hard-UDV from menu.
5. Rinse a clean vial (0156) with sample water.
6. Use the syringe (1184) to add 3mL of sample to the vial.
7. Insert the vial into chamber, close lid and select SCAN BLANK.
8. Remove vial from Spectro.
9. Use the syringe (1184) to add 3mL of sample to a Calcium Hardness UDV vial
(4309).
10. Shake vigorously for 10 seconds.
NOTE: If powder residue remains in the bottom of the vial after shaking, or if
air bubbles form, invert vial once more and tap bottom of vial sharply once or
twice to dislodge powder or bubbles. Mix.
11. Insert tube into chamber, close lid and select SCAN SAMPLE. Record
result.
12. Press OFF button to turn the spectrophotometer off or press EXIT button to
exit to a previous menu or make another menu selection.
NOTES: For best possible results, a reagent blank should be determined to
account for any contribution to the test result by the reagent system. To determine
the reagent blank, follow the above test procedure to scan a distilled or deionized
water blank. Then follow the above procedure to perform the test on a distilled or
Test Procedures
deionized water sample. This test result is the reagent blank. Subtract the reagent
blank from all subsequent test results of unknown samples. It is necessary to
determine the reagent blank only when a new lot number of reagents is obtained.
UDVs from opened pouches should be used promptly. Store unused vials from
opened pouches in the Foil Storage Bag (9467) to extend the shelf life of the
reagent. Generally, UDVs stored in the bag should be used within 10 days if the
humidity is less than 50% and within 5 days if humidity is greater than 50%. The Foil
Storage Bag contains a desiccant pack with indicator. When the indicator in the
window turns from blue to pink, the bag should be replaced.
CALCIUM & MAGNESIUM HARDNESS, UDV SMART Spectro Test Procedures 2.11
Page 86

CHLORIDE, TESTAB
ARGENTOMETRIC TESTAB METHOD • CODE 3693-SC
QUANTITY CONTENTS CODE
50 *Chloride Spectrophotometric Grade Tablets *3885A-H
1 Tablet Crusher 0175
*WARNING: Reagents marked with an * are considered to be potential health
hazards. To view or print a Material Safety Data Sheet (MSDS) for these reagents
go to www.lamotte.com. To obtain a printed copy, contact LaMotte by e-mail,
phone or fax.
Chloride is one of the major anions found in water and sewage. The presence of
chlorides in large amounts may be due to the natural process of water passing
through salt formations in the earth, or it may be evidence of the intrusion of
seawater or pollution from industrial processes or domestic wastes. The salt
content of water affects the distribution of plant and animal life in an aquatic
system, based on the amount of salt they can tolerate.
APPLICATION: Drinking, surface, and saline waters; domestic and
industrial wastewaters.
RANGE: 0.0–30.0 ppm Chloride
MDL: 0.5 ppm
METHOD: Silver nitrate reacts with chloride to form turbid silver
chloride in proportion to the amount of chloride in the
sample.
SAMPLE HANDLING
& PRESERVATION:
INTERFERENCES: Substances in amounts normally found in drinking water
Collect samples in clean, chemically-resistant glass or
plastic containers. No preservative is needed if sample is
to be stored.
will not interfere. Bromide, iodide, cyanide, sulfi de,
thiosulfate, sulfi de and orthophosphate will interfere.
Test Procedures
SMART Spectro Test Procedures 2.11 CHLORIDE, TesTab
Page 87

PROCEDURE
Use universal sample holder
1. Press and hold ON button until spectrophotometer turns on.
2. Scroll to and select PROGRAMMED TESTS.
3. Scroll to and select ALL TESTS (or another sequence containing
21 Chloride-TT) from TESTING MENU.
4. Scroll to and select 21 Chloride-TT from menu.
5. Rinse a tube (0290) with sample water. Fill to 10 mL with sample.
6. Insert the tube into chamber, close lid and select SCAN BLANK.
7. Remove the tube from Spectro.
8. Add one *Chloride Spectrophotometric Grade Tablet (3885A).
9. Use Tablet Crusher (0175) to crush tablet.
10. Cap tube.
11. Invert 2 times.
12. Wait 3 minutes. Do NOT mix.
13. Insert tube into chamber, close lid and select SCAN SAMPLE. Record result
in ppm chloride.
14. Press OFF button to turn the colorimeter off or press EXIT button to exit to a
previous menu or make another menu selection.
NOTE: For best possible results, a reagent blank should be determined to account
for any contribution to the test result by the reagent system. To determine the
reagent blank, follow the above test procedure to scan a distilled or deionized
water blank. Then follow the above procedure to perform the test on a distilled or
deionized water sample. This test result is the reagent blank. Subtract the reagent
Test Procedures
blank from all subsequent test results of unknown samples.
The reagent system is temperature sensitive. The calibration is for 25ºC. If sample
is at 30ºC, multiply resulting ppm by 1.1. If the sample is at 20ºC, multiply resulting
ppm by 0.9.
CHLORIDE, TesTab SMART Spectro Test Procedures 2.11
Page 88

CHLORINE, BROMINE, IODINE
DPD METHOD • CODE 3643-SC
QUANTITY CONTENTS CODE
100 * DPD #1 Instrument Grade Tablets *6903A-J
100 *DPD #3 Instrument Grade Tablets *6197A-J
15 mL Glycine Solution 6811-E
1 Tablet Crusher 0175
*WARNING: Reagents marked with an * are considered to be potential health
hazards. To view or print a Material Safety Data Sheet (MSDS) for these reagents
go to www.lamotte.com. To obtain a printed copy, contact LaMotte by e-mail,
phone or fax.
All water for cities and communities must be sanitized; even waters that come from
clean sources, protected watersheds, reservoirs, and deep wells, are commonly
sanitized to assure safety. Chlorine is the most commonly used sanitizer for several
reasons: it is effective against a wide range of microorganisms, the cost is low, and
the methods of applying it have been well developed. If an adequate concentration
of chlorine is present in the water for a few minutes, disease producing bacteria
will be destroyed. A number of conditions affect the sanitizing action of chlorine. In
municipal systems these can be controlled so that if chlorine is detectable, it can
be assumed that bacteria have been killed. The factors that infl uence the rate of
kill are temperature, pH, presence of other materials that react with chlorine, time,
and the concentrations of the various chlorine combinations that are formed in the
water with ammonia and other substances that react with chlorine.
Test Procedures
The fact that chlorine can be easily detected and measured makes chlorine a
favorite water sanitizer of those concerned with the public safety of water supplies.
Chlorine concentrations in the range of 0.1 to 0.4 parts per million are usually
maintained in municipal supplies.
Chlorine can be added in the form of chlorine gas, liquid sodium hypochlorite
(bleach), granular calcium hypochlorite or as organic chlorine compounds.
Chlorine is not present in natural water supplies; if it is present it is the result of
chlorination of a water supply or of chlorinated compounds being discharged as
waste from industrial operations. The presence of chlorine in concentrations above
0.5 parts per million should be considered evidence of pollution from chlorine
treated effl uents or from a process in which high concentrations of chlorine are
used.
SMART Spectro Test Procedures 2.11 CHLORINE, BROMINE, IODINE
Page 89

APPLICATION: Drinking, surface, and saline waters; swimming
pool water; domestic and industrial wastes.
RANGE: 0.00–4.00 ppm Chlorine
MDL: 0.02 ppm
METHOD: In the absence of iodide, free available chlorine
reacts instantly with DPD to produce a red color.
Subsequent addition of potassium iodide evokes a
rapid color response from the combined forms of
chlorine (chloramines).
SAMPLE HANDLING &
PRESERVATION:
Chlorine in aqueous solutions is not stable, and
the chlorine content of samples or solutions,
particularly weak solutions, will rapidly decrease.
Exposure to sunlight or agitation will accelerate
the reduction of chlorine present in such solutions.
For best results, start analysis immediately after
sampling. Samples to be analyzed for chlorine
cannot be preserved or stored.
INTERFERENCE: The only interfering substance likely to be
encountered in water is oxidized manganese.
The extent of this interference can be determined
by treating a sample with sodium arsenite to
destroy the chlorine present so that the degree of
interference can be measured.
Iodine and bromine can give a positive
interference, but these are not normally present
unless they have been added as sanitizers.
Test Procedures
CHLORINE-BROMINE-IODINE SMART Spectro Test Procedures 2.11
Page 90

PROCEDURE–FREE CHLORINE
Use universal sample holder.
1. Press and hold ON button until spectrophotometer turns on.
2. Scroll to and select PROGRAMMED TESTS.
3. Scroll to and select ALL TESTS (or another sequence containing
15 Chlorine) from TESTING MENU.
4. Scroll to and select 15 Chlorine from menu.
5. Rinse a clean tube (0290) with sample water. Fill to the 10 mL line with
sample.
6. Insert tube into chamber, close lid and select SCAN BLANK.
7. Remove tube from Spectro and pour off all but a suffi cient amount of sample
water to cover a tablet. Add one *Chlorine DPD #1 Instrument Grade Tablet
(6903A). Crush tablet with a tablet crusher (0175), then add sample water
until tube is fi lled to 10 mL line. Cap tube and shake until tablet has dissolved.
Solution will turn pink if free chlorine is present. Wait 15 seconds, but no longer
than 30 seconds. Mix.
8. Insert tube into chamber, close lid and select SCAN SAMPLE.
PROCEDURE–COMBINED CHLORINE
Use universal sample holder.
9. Add one *Chlorine DPD #3 Instrument Grade Tablet (6197A) to sample from
Step 8 above. Crush tablet with tablet crusher (0175). Cap tube and shake until
tablet dissolves. An increase in color represents combined chlorine.
NOTE: For wastewater samples, Standard Methods for the Examination
of Water and Wastewater recommends waiting 2 minutes for full color
development.
10. Insert sample into chamber, close lid and select SCAN SAMPLE. Record
result as Total Chlorine.
11. Subtract free chlorine reading from total chlorine reading to obtain
concentration of combined chlorine.
12. Press the OFF button to turn off the spectrophotometer or press the EXIT
button to exit to a previous menu or make another menu selection.
SMART Spectro Test Procedures 2.11 CHLORINE, BROMINE, IODINE
Test Procedures
Page 91

BROMINE
Like chlorine, bromine is an effective germicidal agent employed in drinking water
treatment, pool and spa water sanitation, food service sanitation, and other public
health applications.
APPLICATION: Drinking, surface, and saline waters; swimming pool
water; domestic and industrial waters and wastes.
RANGE: 0.00–9.00 ppm Bromine
MDL: 0.04 ppm
METHOD: In buffered sample bromine reacts with diethyl-p-
phenylene diamine (DPD) to produce a pink-red color in
proportion to the concentration of bromine present.
SAMPLE HANDLING &
PRESERVATION:
INTERFERENCE: The only interfering substance likely to be encountered
Bromine in aqueous solutions is not stable, and the
bromine content of samples or solutions, particularly
weak solutions, will rapidly decrease. Exposure to
sunlight or agitation will accelerate the reduction of
bromine present in such solutions. For best results start
analysis immediately after sampling. Samples to be
analyzed for bromine cannot be preserved or stored.
in water is oxidized manganese. The extent of this
interference can be determined by treating a sample
with sodium arsenite to destroy the bromine present so
that the degree of interference can be estimated.
Iodine and chlorine can also interfere, but these are
not normally present unless they have been added as
sanitizers.
Test Procedures
CHLORINE, BROMINE, IODINE SMART Spectro Test Procedures 2.11
Page 92

PROCEDURE A: BROMINE (NO CHLORINE)
Use universal sample holder.
1. Press and hold ON button until spectrophotometer turns on.
2. Scroll to and select PROGRAMMED TESTS.
3. Scroll to and select ALL TESTS (or another sequence containing
9 Bromine-LR) from TESTING MENU.
4. Scroll to and select 9 Bromine-LR from menu.
5. Rinse a clean tube (0290) with sample water. Fill to the 10 mL line with
sample.
6. Insert tube into chamber, close lid and select SCAN BLANK.
7. Remove tube from Spectro. Pour out all but a suffi cient amount of sample
water to cover a tablet. Add one *DPD #1 Instrument Grade Tablet (6903A).
Crush tablet with tablet crusher (0175), then add sample water until tube is
fi lled to 10 mL line. Cap tube and shake until tablet is dissolved. Solution will
turn pink if bromine is present. Wait 15 seconds. Mix.
8. Insert tube into chamber, close lid and select SCAN SAMPLE.
9. Press OFF button to turn spectrophotometer off or press the EXIT button to
exit to a previous menu or make another menu selection.
PROCEDURE B: BROMINE IN THE PRESENCE OF
CHLORINE
Test Procedures
Use universal sample holder.
1. Press USE button to turn on colorimeter.
2. Scroll to and select ALL TESTS (or another sequence containing
9 Bromine-LR) from TESTING MENU.
3. Scroll to and select 9 Bromine-LR from menu.
4. Rinse a clean tube (0290) with sample water. Fill to the 10 mL line with
sample.
5. Insert tube into chamber close lid and select SCAN BLANK.
6. Rinse a second clean tube (0290) with sample water. Fill to the 10 mL line with
sample. Add 5 drops of Glycine Solution (6811). Cap and mix.
7. Remove blank from Spectro. Pour out all of the sample water. To this tube
add just enough of Glycine treated sample (Step 6) to cover a tablet. Add
one *Chlorine DPD#1 Instrument Grade Tablet (6903A). Crush tablet with a
tablet crusher (0175). Add all remaining Glycine-treated sample. Cap tube and
shake until tablet dissolves. Solution will turn pink if bromine is present. Wait 15
seconds. Mix.
SMART Spectro Test Procedures 2.11 CHLORINE, BROMINE, IODINE
Page 93

8. Insert tube into chamber, close lid and select SCAN SAMPLE.
9. Press OFF button to exit to previous menu or make another menu
selection.
PROCEDURE C: FREE AVAILABLE, TOTAL AVAILABLE
& COMBINED CHLORINE IN THE PRESENCE OF
BROMINE
1. Perform the test for free and combined chlorine as previously described.
2. Perform the test for bromine in the presence of chlorine.
3. Calculations:
Residual Bromine (ppm) = Reading BR
Free Chlorine in the Presence of Bromine = Free Chlorine – 0.45 (Reading BR)
Total Chlorine in the Presence of Bromine = Total Chlorine – 0.45 (Reading BR)
Combined Chlorine in the Presence of Bromine = Total Chlorine – Free Chlorine
NOTE: Combined chlorine is not affected by the presence of bromine, so the
calculation is the same as when only chlorine is present.
Test Procedures
CHLORINE, BROMINE, IODINE SMART Spectro Test Procedures 2.11
Page 94

IODINE
Like chlorine and bromine, iodine is an effective germicidal agent employed in
drinking water treatment, pool and spa water sanitation, food service sanitation,
and other public health applications.
APPLICATION: Drinking, surface, and saline waters; swimming pool
water; domestic and industrial wastes.
RANGE: 0.00–14.00 ppm Iodine
MDL: 0.08 ppm
METHOD: In a buffered sample iodine reacts with diethyl-p-
phenylene-diamine (DPD) to produce a pink-red color in
proportion to the concentration of iodine present.
SAMPLE HANDLING &
PRESERVATION:
INTERFERENCE: The only interfering substance likely to be encountered
Iodine in aqueous solutions is not stable, and the iodine
content of samples or solutions, particularly weak
solutions, will rapidly decrease. Exposure to sunlight
or agitation will accelerate the reduction of iodine
present in such solutions. For best results start analysis
immediately after sampling. Samples to be analyzed for
iodine cannot be preserved or stored.
in water is oxidized manganese. The extent of this
interference can be determined by treating a sample
with sodium arsenite to destroy the iodine present so
that the degree of interference can be measured.
Test Procedures
Chlorine and bromine can give a positive interference,
but these are not normally present unless they have
been added as sanitizers.
SMART Spectro Test Procedures 2.11 CHLORINE, BROMINE, IODINE
Page 95

PROCEDURE
Use universal sample holder.
1. Press and hold ON button until spectrophotometer turns on.
2. Scroll to and select PROGRAMMED TESTS.
3. Scroll to and select ALL TESTS (or another sequence containing
50 Iodine) from TESTING MENU.
4. Scroll to and select 50 Iodine from menu.
5. Rinse a clean tube (0290) with sample water. Fill tube to the 10 mL line with
sample.
6. Insert tube into chamber, close lid and select SCAN BLANK.
7. Remove tube from Spectro. Pour off all but a suffi cient amount of sample water
to cover a tablet. Add one *DPD #1 Tablet Instrument Grade (6903A). Crush
tablet with tablet crusher (0175). Add sample water until tube is fi lled to 10
mL line. Cap and shake until tablet dissolves. Solution will turn pink if iodine is
present. Wait 15 seconds. Mix.
8. Insert tube into chamber, close lid and select SCAN SAMPLE. Record
result.
9. Press OFF button to turn spectrophotometer off or press EXIT button to exit to
a previous menu or make another menu selection.
Test Procedures
CHLORINE, BROMINE, IODINE SMART Spectro Test Procedures 2.11
Page 96

CHLORINE-FREE, UDV
DPD UNIT DOSE VIAL METHOD • CODE 4311-J
QUANTITY CONTENTS CODE
1 *Free Chlorine Unit Dose Vials, 20 pouches *4311-J
Equipment needed but not supplied:
STANDARD ACCESSORY PACKAGE • CODE 1961
1 Package of 3 Vials (empty) 0156
1 Syringe, 3 mL, plastic 1184
1 Foil Storage Bag 9467
Or:
ADVANCED ACCESSORY PACKAGE • CODE 1962
1 Pipettor 30528
1 Pipet Tips (0-5 mL) 30695
1 Cuvette Rack 31695
1 Package of 3 Vials (empty) 0156
1 Foil Storage Bag 9467
*WARNING: Reagents marked with an * are considered to be potential health
hazards. To view or print a Material Safety Data Sheet (MSDS) for these reagents
go to www.lamotte.com. To obtain a printed copy, contact LaMotte by e-mail,
phone or fax.
Test Procedures
All water for cities and communities must be sanitized; even waters that come from
clean sources, protected watersheds, reservoirs, and deep wells, are commonly
sanitized to assure safety. Chlorine is the most commonly used sanitizer for several
reasons: it is effective against a wide range of microorganisms, the cost is low, and
the methods of applying it have been well developed. If an adequate concentration
of chlorine is present in the water for a few minutes, disease producing bacteria
will be destroyed. A number of conditions affect the sanitizing action of chlorine. In
municipal systems these can be controlled so that if chlorine is detectable, it can
be assumed that bacteria have been killed. The factors that infl uence the rate of
kill are temperature, pH, presence of other materials that react with chlorine, time,
and the concentrations of the various chlorine combinations that are formed in the
water with ammonia and other substances that react with chlorine.
The fact that chlorine can be easily detected and measured makes chlorine a
favorite water sanitizer of those concerned with the public safety of water supplies.
Chlorine concentrations in the range of 0.1 to 0.4 parts per million are usually
maintained in municipal supplies.
Chlorine can be added in the form of chlorine gas, liquid sodium hypochlorite
SMART Spectro Test Procedures 2.11 CHLORINE-FREE, UDV
Page 97

(bleach), granular calcium hypochlorite or as organic chlorine compounds.
Chlorine is not present in natural water supplies; if it is present it is the result of
chlorination of a water supply or of chlorinated compounds being discharged as
waste from industrial operations. The presence of chlorine in concentrations above
0.5 parts per million should be considered evidence of pollution from chlorine
treated effl uents or from a process in which high concentrations of chlorine are
used.
APPLICATION: Drinking, surface, and saline waters; domestic and
industrial wastes.
RANGE: 0.00–10.00 ppm
MDL: 0.10 ppm
METHOD: In the absence of iodide, free available chlorine reacts
instantly with DPD to produce a red color. Subsequent
addition of potassium iodide evokes a rapid color
response from the combined forms of chlorine
(chloramines).
SAMPLE HANDLING
& PRESERVATION:
Chlorine in aqueous solutions is not stable, and the
chlorine content of samples or solutions, particularly
weak solutions, will rapidly decrease. Exposure to
sunlight or agitation will accelerate the reduction of
chlorine present in such solutions. For best results, start
analysis immediately after sampling. Samples to be
analyzed for chlorine cannot be preserved or stored.
INTERFERENCES: The only interfering substance likely to be encountered
in water is oxidized manganese. The extent of this
interference can be determined by treating a sample with
sodium arsenite to destroy the chlorine present so that
the degree of interference can be measured.
Test Procedures
Iodine and bromine can give a positive interference, but
these are not normally present unless they have been
added as sanitizers.
CHLORINE-FREE, UDV SMART Spectro Test Procedures 2.11
Page 98

PROCEDURE
Use 10 mm square cell adapter
1. Press and hold ON button until spectrophotometer turns on.
2. Scroll to and select PROGRAMMED TESTS.
3. Scroll to and select ALL TESTS (or another sequence containing
16 Cl Free-UDV) from TESTING MENU.
4. Scroll to and select 16 Cl Free-UDV from menu.
5. Rinse a clean vial (0156) with sample water.
6. Use the syringe (1184) to add 3mL of sample to the vial.
7. Insert the vial into chamber, close the lid and select SCAN BLANK.
8. Remove the vial from the Spectro.
9. Use the syringe (1184) to add 3mL of sample to a *Free Chlorine UDV
(4311).
10. Shake vigorously until powder dissolves completely.
NOTE: If powder residue remains in the bottom of the vial after inverting or air
bubbles form, invert once more and tap bottom of vial sharply once or twice to
dislodge powder and bubbles. Mix.
11. Immediately insert tube into chamber, close lid and select SCAN SAMPLE.
Record result in ppm free chlorine.
12. Press OFF button to turn the spectrophotometer off or press EXIT button to
exit to a previous menu or make another menu selection.
NOTES: For best possible results, a reagent blank should be determined to
account for any contribution to the test result by the reagent system. To determine
the reagent blank, follow the above test procedure to scan a distilled or deionized
water blank. Then follow the above procedure to perform the test on a distilled or
deionized water sample. This test result is the reagent blank. Subtract the reagent
blank from all subsequent test results of unknown samples. It is necessary to
determine the reagent blank only when a new lot number of reagents is obtained.
Test Procedures
UDVs from opened pouches should be used promptly. Store unused vials from
opened pouches in the Foil Storage Bag (9467) to extend the shelf life of the
reagent. Generally, UDVs stored in the bag should be used within 10 days if the
humidity is less than 50% and within 5 days if humidity is greater than 50%. The Foil
Storage Bag contains a desiccant pack with indicator. When the indicator in the
window turns from blue to pink, the bag should be replaced.
SMART Spectro Test Procedures 2.11 CHLORINE-FREE, UDV
Page 99

Test Procedures
CHLORINE-FREE, UDV SMART Spectro Test Procedures 2.11
Page 100

CHLORINE
LIQUID DPD METHOD • CODE 4859
QUANTITY CONTENTS CODE
30 mL DPD 1A Free Chlorine Reagent P-6740-G
30 mL *DPD 1B Free Chlorine Reagent *P-6741-G
30 mL *DPD 3 Total Chlorine Reagent *P-6743-G
*WARNING: Reagents marked with an * are considered to be potential health
hazards. To view or print a Material Safety Data Sheet (MSDS) for these reagents
go to www.lamotte.com. To obtain a printed copy, contact LaMotte by e-mail,
phone or fax.
All water for cities and communities must be sanitized; even waters that come from
clean sources, protected watersheds, reservoirs, and deep wells, are commonly
sanitized to assure safety. Chlorine is the most commonly used sanitizer for several
reasons: it is effective against a wide range of microorganisms, the cost is low, and
the methods of applying it have been well developed. If an adequate concentration
of chlorine is present in the water for a few minutes, disease producing bacteria
will be destroyed. A number of conditions affect the sanitizing action of chlorine. In
municipal systems these can be controlled so that if chlorine is detectable, it can
be assumed that bacteria have been killed. The factors that infl uence the rate of
kill are temperature, pH, presence of other materials that react with chlorine, time,
and the concentrations of the various chlorine combinations that are formed in the
water with ammonia and other substances that react with chlorine.
Test Procedures
The fact that chlorine can be easily detected and measured makes chlorine a
favorite water sanitizer of those concerned with the public safety of water supplies.
Chlorine concentrations in the range of 0.1 to 0.4 parts per million are usually
maintained in municipal supplies.
Chlorine can be added in the form of chlorine gas, liquid sodium hypochlorite
(bleach), granular calcium hypochlorite or as organic chlorine compounds.
Chlorine is not present in natural water supplies; if it is present it is the result of
chlorination of a water supply or of chlorinated compounds being discharged as
waste from industrial operations. The presence of chlorine in concentrations above
0.5 parts per million should be considered evidence of pollution from chlorine
treated effl uents or from a process in which high concentrations of chlorine are
used.
SMART Spectro Test Procedures 2.11 CHLORINE, DPD Liquid
 Loading...