

Page 1

SR1 Audio Analyzer
Operation Manual
Stanford Research Systems
Audio
Revision 3.0.0 January, 2014
Distribution in the UK & Ireland
Lambda Photometrics Limited
Lambda House Batford Mill
Harpenden Herts AL5 5BZ
United Kingdom
E: info@lambdaphoto.co.uk
W: www.lambdaphoto.co.uk
T: +44 (0)1582 764334
F: +44 (0)1582 712084
Characterisation,
Measurement &
Analysis
Page 2

SR1 Operation Manual2
© 2014 Stanford Research Systems
Table of Contents
Foreword 0
Part I Getting Started
6
................................................................................................................................... 61 Unpacking and Safety
................................................................................................................................... 8
2 Manua l Revision History
................................................................................................................................... 9
3 Overview
................................................................................................................................... 13
4 User Interface
................................................................................................................................... 19
5 A Quick Example...
Part II SR1 Operation
28
................................................................................................................................... 281 File Menu
.......................................................................................................................................................... 29Save SR1 Configuration
.......................................................................................................................................................... 30
Save Partial Configuration
.......................................................................................................................................................... 31
Load Configuration
.......................................................................................................................................................... 32
Print SR1 Scre en
.......................................................................................................................................................... 33
Print Setup
................................................................................................................................... 342 Edit Menu
................................................................................................................................... 35
3 Panels Menu
.......................................................................................................................................................... 36Analog Gene rator Panel
......................................................................................................................................................... 41
Analog Generator Units
......................................................................................................................................................... 43
Analog Generator Wav eforms
.......................................................................................................................................................... 57
Digital Ge nerator Panel
......................................................................................................................................................... 60
Digital Gener ator Units
......................................................................................................................................................... 62
Digital Gener ator Wavef orms
.......................................................................................................................................................... 76
Analog Inputs Panel
.......................................................................................................................................................... 79
Digital I/O Panel
.......................................................................................................................................................... 87
Channel Status Panel
.......................................................................................................................................................... 90
Use r Status Pane l
.......................................................................................................................................................... 91
Sw e ep Pane l
.......................................................................................................................................................... 98
Settling Panel
.......................................................................................................................................................... 100
Monitors Pane l
.......................................................................................................................................................... 102
Multitone Pane l
.......................................................................................................................................................... 105
Clock Reference Panel
................................................................................................................................... 1074 Analyzers Menu
.......................................................................................................................................................... 108Com m on An alyze r Features
......................................................................................................................................................... 110
Analyzer Units
.......................................................................................................................................................... 115
Time Domain Detector
.......................................................................................................................................................... 127
FFT (Single Channel)
.......................................................................................................................................................... 141
FFT (Dual Channel)
.......................................................................................................................................................... 157
THD Analyze r
.......................................................................................................................................................... 161
IMD Analyze r
.......................................................................................................................................................... 165
Multitone Analyz er
.......................................................................................................................................................... 171
Histogram Analyzer
.......................................................................................................................................................... 175
Octave Analyze r
.......................................................................................................................................................... 177
Jitte r Analyze r
.......................................................................................................................................................... 183
Dig it iz e r
Page 3

3Contents
© 2014 Stanford Research Systems
................................................................................................................................... 1915 Displays Menu
.......................................................................................................................................................... 192Graph
......................................................................................................................................................... 199
Trace Calculator
.......................................................................................................................................................... 202
Bar Ch ar t
.......................................................................................................................................................... 205
Dig itiz e r Di s p la y
.......................................................................................................................................................... 212
Other Dis play M enu Options
................................................................................................................................... 2136 Tools Menu
.......................................................................................................................................................... 214Preferences Panel
.......................................................................................................................................................... 220
Eve nts Panel
.......................................................................................................................................................... 226
Switcher Configuration Panel
.......................................................................................................................................................... 230
Hardware Status
.......................................................................................................................................................... 231
Ne tworking
......................................................................................................................................................... 231
Network Setup
......................................................................................................................................................... 232
Netw ork Places
......................................................................................................................................................... 233
Map Netw ork Drive
......................................................................................................................................................... 233
Remo ve Ne tw o rk Driv e
......................................................................................................................................................... 234
Share SR1
.......................................................................................................................................................... 236
Compute r Functions
......................................................................................................................................................... 236
Pr inters Panel
......................................................................................................................................................... 237
Eje ct Dr iv e
......................................................................................................................................................... 237
Pow er Options
......................................................................................................................................................... 238
Date Time
......................................................................................................................................................... 238
Virtual Keyboard
......................................................................................................................................................... 238
Updating SR1
................................................................................................................................... 2417 Automation Menu
.......................................................................................................................................................... 242Remote Inte rface Panel
.......................................................................................................................................................... 243
Scripting Window
.......................................................................................................................................................... 252
Learning Mode
................................................................................................................................... 2538 Quick Measurement Menu
.......................................................................................................................................................... 254Setup Panel
.......................................................................................................................................................... 255
SNR Pan e l
.......................................................................................................................................................... 257
Re ference Panel
.......................................................................................................................................................... 259
Level Panel
.......................................................................................................................................................... 261
THD+N Pa ne l
.......................................................................................................................................................... 263
Frequency Res ponse Panel
.......................................................................................................................................................... 265
Distortion Pane l
.......................................................................................................................................................... 267
IMD Panel
.......................................................................................................................................................... 269
Crosstalk Panel
.......................................................................................................................................................... 271
Interchannel Phase Panel
.......................................................................................................................................................... 273
In/Out Phas e
.......................................................................................................................................................... 275
Automated Measurements and Reports
................................................................................................................................... 2789 Setups Me nu
.......................................................................................................................................................... 279Analog-Analog
.......................................................................................................................................................... 281
Analog-Digital
.......................................................................................................................................................... 283
Digital-Analog
.......................................................................................................................................................... 285
Dig it al -Di gi ta l
.......................................................................................................................................................... 287
Digital IO
................................................................................................................................... 28810 Help Menu
Part III SR1 Reference
291
................................................................................................................................... 2911 Front Panel Description
Page 4

SR1 Operation Manual4
© 2014 Stanford Research Systems
................................................................................................................................... 2932 Rear Panel Descritpion
................................................................................................................................... 296
3 Specifications
................................................................................................................................... 305
4 Filter Reference
................................................................................................................................... 306
5 File Reference
................................................................................................................................... 310
6 Hardw are Reference
Index 312
Page 5

Part
I
Getting Started
Audio
Page 6

SR1 Operation Manual6
© 2014 Stanford Research Systems
1 Getting Started
1.1 Unpacking and Safety
Removing the Instrument From Its Shipping Container
Use care in removing the instrument from its shipping container. The SR1 weighs approximat ely 50 lbs,
and can be awkward to handle while being removed from the box. In partic ular, please tak e care that the
front panel LCD sc reen is not damaged while unpac king. Retain the original packing materials in case
the unit ever needs to be returned for service.
Connecting The Power Cord
Your SR1 was shipped with a power cord appropriate to your location. SR1 operates from a 100V, 120V,
220V or 240V nominal AC power source with a line frequency of 50 or 60 Hz. Before connecting the
power cord to the rear panel power entry module, please ensure the the LINE VOLTAGE SELECTOR
card, located in the rear panel fuse holder, is set so that the correct AC input voltage value is vis ible.
The fuse rating should also be checked t o see if it matches the line voltage setting. For 100V/120V
operation a 4A fuse is used. For 220V/240V a 2A should be installed. The instrument has a 3-wire power
cord. Be sure to connect it to a properly grounded outlet t o guard against elect rical shock.
After connecting the power cord to an AC power source, the unit can be turned on by pressing the power
button at the lower left of the front panel. The green power LED above the power button illuminates to
indicate the unit is on. After turning the power on the unit will take about 50 seconds to run through its
boot-up sequence before it is ready for use.
Safety
Dangerous voltages, capable of causing injury or death, are present in this inst rument.
Use extreme caution whenever the instrument cover is removed. Do not remove the
instrument's cover while the power cord is connected to a live outlet. Do not expose the
instrument to rain or exc essive moisture. Do not attempt to disconnect the internal
cooling fans or block the fan vents.
Service
Refer all servicing to qualified, SRS-authorized service personnel. Do not attempt to substitute parts or
perform any unauthorized modification to the instrument. Contact SRS for inst ructions on how to return
the ins trument for authorized service, calibration, or adjus tment.
Stanford Research Systems
1290-D Rea mw ood Ave.
Sunnyvale, CA, 94089
USA
p
hone 408.744.9040
email info
@
thinksrs.com
web www.thinksrs.com
Page 7

Getting Started 7
© 2014 Stanford Research Systems
Page 8

SR1 Operation Manual8
© 2014 Stanford Research Systems
1.2 Manual Revision History
Copyright © 2009-2014 Stanford Research Systems, Inc.
All rights reserved
No part of this manual may be reproduced or transmitted in any form or by any means, electronic or
mechanical, including photocopying, recording, or by any information storage and retrieval system
without permission in writing from Stanford Research Syst ems, Inc.
Manua l Revision History
Version Date Author Comments
1.0 1/06 jahan Original Version
2.0 7/09 ajm Preliminary Version shipped with first SR1s
2.1 10/09 ajm 2nd Preliminary version
2.2 12/09 ajm Complete Through Tools Menu
2.3 1/10 ajm Complete Manual
2.4 3/10 ajm For SR1 v 1.1
2.5 3/10 ajm Minor Printing Corrections
2.6 5/10 ajm Updated for SR1 v1.1.6
2.7 7/10 ajm Updated for SR1 v1.2
2.8 6/11 ajm Updated for SR1 v1.4
3.0 1/14 ajm Updated for SR1 v2.1.13
Copyright and Trademark Acknowledgements
Windows is a trademark of the Microsoft Corporation
Apache Xerces
Copyright 1999-2007 The Apache Software Foundation
This product includes software developed at The Apache Software Foundation (http:/ /www.apache.org/).
Portions of this software were originally based on the following:
- Software copyright (c) 1999, IBM Corporation., http:// www.ibm.com.
- Software copyright (c) 1999, Sun Microsystems., http://www.sun.com.
- Voluntary contributions made by Paul Eng on behalf of the Apache Software Foundation that were
originally developed at iClic k, Inc., software copyright (c) 1999.
NI-De vice
Copyright © 2009 National Instruments Corporation, All Rights Reserved
FastReport
Copyright © 2009 Fast Reports , Inc., All Rights Reserved
Page 9

Getting Started 9
© 2014 Stanford Research Systems
1.3 Overview
SR1 is versatile and complex instrument capable of making a wide a variety of precision audio
measurements in both the analog and digital domains. The following is a brief introduct ion to t he different
pieces of SR1 and their capabilities.
Measurement Setups
SR1 includes pre-configured setups for many common audio measurements. To get up and running
quickly, see the Setups Menu
.
Generators
SR1 contains precise and flexible analog and digital audio generators. Eac h generator is built around
several core waveforms which can be either generated individually or combined in the generator and
output as a composit e signal. For the Analog Generator, the core waveforms include Sine, Low-Disortion
Sine, Phased Sine, Noise, USASI Noise, Squarewave, Ramp (triangle), FFT Chirp, Multitone, Arbit rary,
and Constant (offset). The analog generator can be output either as a balanced or unbalanced signal and
ouputs a maximum peak output voltage of 20 V (unbalanc ed) or 40 V (balanced).
The Digital Generator offers the same core waveforms as the analog generator and additionally offers a
number of waveforms optimized for digital interface test ing including Digit al Constant, Digital Counter,
Walking Bits, and a J-test waveform designed to test the jitter susc eptibility of devices.
Analog Inputs
SR1 offers both balanced and unbalanced analog inputs with full scale input ranges from 160 Vrms down
to 62 mVrms. SR1's analog inputs are autoranging, meaning that for most input signals, the analyzer
automatically s ets the input range without any user interaction.
Digital Audio Inputs and Outputs
SR1 has 2 sets of XLR and BNC connectors and is c ompatible with both consumer and professional
digital audio signals from 50 mVpp up to 10.2 Vpp. All significant parameters of the digital audio carrier
signal are measured including s ignal amplitude, digital audio effective sampling frequency, and input/
output delay. Status bit s are fully decoded in both the the professional and consumer standards. User
bits are also display ed in raw binary format.
Several impairment signals can be applied to the output digital audio carrier inc luding Common Mode
Sinewave, Normal Mode Noise, and Jit ter. Jitter waveforms include Sine, Square, Noise, and Bandpass
Noise with a peak jitter amplitude of ~13UI.
Analyzers
There are 8 different types of Analyzers in SR1, s ummarized below.
Time Domain Detector Makes wideband amplitude, ratio, and THD+N measurements. The time
domain detector signal chain includes bandpass or notch filters, bandwidt h
limiting filters, and a variety of different weighting filters. Peak , RMS and
Quasi-Peak responses are selectable
FFT (1 ch) Provides single-channel FFT functionality.Measurements inc lude power
spectrum, time record, phase. Both zoom (changing the FFT frequency
range) and heterodyne (moving t he FFT frequency range) are included.
FFT (2 ch) Provides dual-channel FFT functionality.Meas urements include power
spectrum and time record for both channels, plus frequency response
Page 10

SR1 Operation Manual10
© 2014 Stanford Research Systems
(transfer func tion), and interchannel phase. Zoom (changing the FFT
frequency range) is supported in the dual-channel analy zer.
THD Ana lyze r Makes frequency selective Total Harmonic Distortion (THD) measurements,
both ratio and absolut e. Includes the ability to measure only selected
harmonics.
IMD Analyzer Makes st andard Intermodulation Distortion measurements including
SMPTE/DIN, CCIF (difference frequency), and DIM/TIM.
Multitone Analyzer Makes single-shot multitone measurements allowing fast measurements of
common audio parameters including noise, distortion, and level.
Jitter Analyze r Measures the jitter of the digital audio c arrier in both the time and frequency
domain including variable high and low pass filtering.
Histogram Analyzer Creates histograms of the analog and digital audio input s ignals.
Octave Analyzer Displays 1, 1/3, and 1/12 fractional octave spectra.
Each type of analyzer has a c orresponding panel with the appropriate controls for that analyz er and
readouts for the analyz er's measurements. At any instant, there are two active analy zers, designated A0
and A1. The user can select the ty pe of A0 and A1 from any of the allowed analyzer types. Each
analyzer has c ontrols which set the input domain to analog or digital audio and s elect the appropriate
input c hannel.
For analog inputs SR1 offers an additional choice between two Analog-to-Digital c onverters, each
optimized for different meas urements . The high-bandwidth (Hi BW) 16-bit ADC operates at a fixed
sampling rate of 512 kHz. The high-resolution (Hi Res) ADC is a 24-bit converter which operates at fix ed
sampling rates of 128 kHz and 64 kHz and and variable rates which can be sync hronized with the digital
audio output or input s ignal to perform cross-domain measurements.
Sweeps and Free Run
SR1 operates in two different measurement modes: free-run and sweep. In free-run mode the analyzers
make continuous measurements and continually updates the measurement results on the analyzer
panels.The second mode, sweep mode, requires that several options be s et. First , a sweep source must
be configured which determines whether SR1 will be sweeping an internal parameter (e.g. generator
frequency) over a specified range, an externally measured parameter (e.g. input frequency), or at regular
time intervals. Once the s weep source is configured the user must s elect the measurements (up to 6)
that will be recorded during the sweep. Swept measurements mus t be settled to be included in the
sweep meaning that t he transient variability of the measurement must drop below a user set value before
being included in the sweep result. Sweep sources and data are setup on the Sweep Panel
, while
Settling parameters are set in the Settling
panel.
Displays
Three different types of displays are available for graphically displaying measurement data. The graph is
the main display ty pe and is capable of displaying many different live and off-line data t races both.
Graphs include cursors for reading out absolute and delta values, the ability to export to bitmap and
Windows Metafiles, movable onscreen annotations, and a variety of data calculations (smoothing,
linearit y, maximum and minimum, etc.) for manipulating data. The Bar Chart
is a simpler display
optimized for displaying a single measurement value which reports the instantaneous value of the
measurement as well as maximum, minimum, and standard deviation. The Digit izer Display
is designed
to work with the optional digitizer and displays various meas urements calculated by the digitiz er
including full-color eye diagrams.
Page 11

Getting Started 11
© 2014 Stanford Research Systems
Digitizer (Optional)
The optional digitizer digitizes the digital audio carrier signal at an 80 MHz s ampling rate. The digitizer
calculates the overall clock rate of the signal as well as jitter as a function of time and probability
density for pulse width, pulse amplitude, input amplitude, and jitter amplitude. The digitizer als o
calculates the s pectra of both the carrier signal as well as the jitter signal. Finally the digitizer calculates
an eye diagram which shows the probability of the carrier signal as a function of amplitude and time. The
off-line measurements made by the digitizer complement the real-time jitter measurement capabilities of
the Jitter Analyzer.
Remote Interfacing
SR1 Supports a variety of remote interfaces:
IEEE-488.2 (GPIB)
SR1 has a rear-panel IEEE-488 connector and fully supports the IEEE-488.2 standard. All instrument
features c an be set and queried from the remote interface.
Serial
GPIB c ommands may also be sent over the rear-panel serial connec tor which supports baud rates up to
115.2 kBaud.
TCP/IP
GPIB c ommands may also be sent over a TCP/IP network via the rear-panel ethernet connector. SR1
follows the VXI-11 standard for the transmission of commands over TCP/IP.
COM
SR1 is fully COM enabled allowing applications such as Visual Basic to set and query instrument
internals. COM enabled applications may also control and query the instrument remotely over ethernet.
Not that firewall settings may need to changed to fully enable this functionality .
Page 12

SR1 Operation Manual12
© 2014 Stanford Research Systems
Page 13

Getting Started 13
© 2014 Stanford Research Systems
1.4 User Interface
The SR1 audio analyzer user interface is based on software that runs on the Microsoft Windows
operating system. As such, the basic user interface, based on standard Windows menus and controls,
should be familiar to most users who have used Microsoft Windows. The s ame software that runs on the
instrument is available for free download from Stanford Research Syst ems (www.thinksrs.com
) and can
be run on any W indows PC. While no measurements can be made while running on a PC, this mode is
perfect for offline viewing of saved datafiles or simply becoming familiar with the software.
Like all Windows software, operating SR1 requires a point ing device and a means of entering text and
numeric data. The instrument provides several options depending on the intended environment.
External Mouse and Keyboard Control
SR1 can be used with an external mouse and keyboard. The mouse and keyboard must be connect ed
to the rear-panel connectors before the instrument is turned on to be properly recognized by the
instrument. Operation with an external mouse and keyboard is convenient when SR1 will be used in a
benchtop environment.
Using the Trackpad
For situations where it's inconvenient to use an external mouse (e.g. rac kmount), SR1 has a front-panel
trackpad which can be used as a pointing device. (Note that the trackpad is always active, even when an
external mouse is connected.) To use the trackpad, drag your finger over the surface of the pad to move
the cursor on the s creen. To "left-click" gently tap your finger. To "double-click" tap your finger twice.
Finally, to "right-click" tap your finger in the upper-right triangle (colored in a light er shade of gray).
Using the Front-Panel Keypad
The front-panel keypad provides a convenient way to enter numeric values as well to access some
commonly used SR1 functions without having to reach for the mous e or keyboard.
Page 14

SR1 Operation Manual14
© 2014 Stanford Research Systems
Standard Function of Keypad Keys
Key Function
Nume ric Entry Ke ys
Numbers 0-9 Enters the c orresponding digit at the current cursor position.
. (Decimal Point) Enters the decimal point at the c urrent cursor position.
± Changes the sign of the number in the current entry field.
Backspace. Deletes the character to the left of the cursor.
Exp Inserts the "E" character at the current cursor position allowing entry in
scientific notation: e.g. 1.2E3
Esc Aborts numeric entry and returns the value in the selected field to the
previous value.
micro
inserts the "u" modifier at the cursor position, interpreted as x10-6.
milli
inserts the "m" modifier at the cursor position, interpreted as x10-3.
kilo
inserts the "k" modifier at the curs or posit ion, interpreted as x103.
Mega
inserts the "M" modifier at the cursor position, interpreted as x106.
Enter Finishes entering the new value.
Function Keys
Page Rotates through the seven pages of the page control on the SR1 screen.
(Tab Left /Right)
Moves the control with "focus" either to the next or previous control.
Sweep
Starts a Sweep. Equivalent to press ing the button on the speedbar.
Pause Pauses and resumes both sweeps and free-run mode. Equivalent to pressing
the
and but tons on the speedbar.
Run
Starts free-run mode. Equivalent to pressing on the speedbar.
Translate graph left/right. Once pressed, the keys will move the
data in t he current graph left and right. Press "Esc" to exit this mode.
Zoom X-axis. Once press ed the keys will zoom the X-axis in and
out. Press "Esc" to exit this mode.
AutoScale. Autoscales the X and Y ax es of the c urrently selected graph.
Max Moves the active cursor in the current graph to the position corresponding to
the maximum value displayed in the graph.
Cursor If the selec ted graph cursor is off, this key turns cursors on. If they are on,
this key toggles the active cursor between the two cursors.
Alt Selec ts the Alt function (written in Green above the keys) for the keypad
keys.
Alt-Function Keys
Menu Moves focus to the main menu. Once Menu is pressed, the knob and enter
keys can be used to acces s the main menu s elections without us ing a
pointing devic e.
Sticky Normally, the knob varies whatever control on the screen currently has focus.
Press Sticky to "Stick" the knob to the current control. Even when focus is
moved to a different control the knob continues to modify the sticky control.
The sticky control is drawn with a
yellow background. Press sticky again to
Page 15

Getting Started 15
© 2014 Stanford Research Systems
exit sticky mode.
Local Upon receipt of a command from one of the remote interfaces SR1 is placed
in "Remote" mode. Using this key returns the unit to local c ontrol.
Ref AutoReference. The contents of the currently focused control is examined. If
it is a frequency, the frequency is moved to the frequency reference of the
selected analyzer. The analyzer, A0 or A1 is selected by press ing the
keys after pressing "Ref". If the contents of the currently focus ed
window is not a frequency then the contents of the A and B levels for the
selected analyzer will be transferred to the dBrA and dBrB references (either
analog or digit al, depending on the analyzer input.)
Hex,
Hex Digits A-F
Hex Entry mode. Places a "0x" charact er in the c urrently focused c ontrol to
begin hexadecimal entry. In this mode, the "A", "B", "C","D","E", and "F"
characters above the micro, milli, kilo, meta, Exp, and Page keys are act ive
allowing the entry of a hexadecimal value. Hex Entry mode is terminated
when "Enter" is pressed.
Generator
After pressing this key press to open the analog generator panel or
to open the digital generator panel.
Analy zer
After pressing Analyzer press to open t he A0 panel or to open the
A1 panel.
Alpha Calls up the virtual keyboard.
Translate graph up-down. Once press ed, the keys will move the
data in t he current graph up and down. Press "Esc" to exit this mode.
Zoom Y-axis. Once pressed the keys will zoom the Y-axis in and
out. Press "Esc" to exit this mode.
Autoscale X, Y
After pressing the key, use t he keys to select autoscale of either
the the X or Y axis.
Min Moves the active cursor in the current graph to the position c orresponding to
the minimum displayed value in the graph.
Help Brings up the online help.
Using the Knob
Turning the knob modifies the currently focused control. If the control is a unit entry control, the knob
increments and decrements its value with an appropriate resolution. If the control is a drop-down list the
knob cycles through the entries in the list. Three different knob acceleration profiles c an be selected
from the preferences panel
. A control can be selected as "Sticky" in which case the knob will continue
to control it even though focus is given to another control. When cursors on a graph are active the knob
controls the active cursor position.
Using the Virtual Keyboard
For situations where it's necessary to enter text into a cont rol and an ext ernal key board is not available
the Virtual Keyboard can be selected from the SR1 keypad
or from the Tools Menu. The virtual keyboard
offers the full functionality of a standard PC keyboard but c an be operated with just a mouse or the
trackpad.
Page 16

SR1 Operation Manual16
© 2014 Stanford Research Systems
Keyboard Shortcuts
A number of keyboard shortcuts are available (us ing either an external keyboard or the virtual key board)
to simplify the execution of common functions.
Key Sequence Action
<Ctrl> 1-7 Selec t the designated page (1-7) on the page control as the active page.
<Ctrl> D Opens the digital generator panel.
<Ctrl> G Opens the analog generator panel.
<Ctrl> I Opens the digital i/o panel.
<Ctrl> A Opens the analog inputs panel.
<Ctrl> M Opens the monitors panel.
<Ctrl> W Opens t he sweep controller panel.
<Ctrl> T Opens the scripting window.
<Ctrl> [ Opens the A0 analyzer panel.
<Ctrl> ] Opens the A1 analyzer panel.
F4 Auto-reference analyz er A0. Moves the current A0 level A and B values to the dBrA
and dBrB reference values.
<Ctrl> F4 Auto-referenc e analyzer A1.Moves the current A1 level A and B values to the dBrA
and dBrB reference values.
F12 Emergenc y shutoff. Turns off all channels of the analog and digital generators.
<Ctrl> F12 Restore generators. Turns on generator channels that were turned off with F12.
Scripting Window Shortcuts
<Ctrl> S Save the current script.
<Ctrl> O Open a script.
<Ctrl> N Create a new script.
<Ctrl> C Copy selected text to the clipboard.
<Ctrl> X Cut selected tex t and copy to the clipboard.
<Ctrl> V Paste clipboard text at the cursor location.
<Ctrl> F Brings up the dialog for finding text in the script.
<Ctrl> R Brings up the dialog for finding and replacing text in the s cript.
<Ctrl> P Prints the current script.
Page 17

Getting Started 17
© 2014 Stanford Research Systems
Unit Entries
The Unit Entry is a type of control used extensively throughout SR1 that allows entry of numeric data in
a range of different unit s. The example below shows the generator amplitude control for example. W hen
the down-arrow
is clic ked, a the current value of the
entry is shown in the drop-down lis t expressed in each of the allowed units. Selecting a different unit
makes it the current unit for subs equent entries. To enter a new value into a unit entry first click
anywhere on the current text, and then enter a new numeric value followed by an optional modifier
character. The allowed modifiers are:
Character Modifier Numeric Value
f femto
x10
-15
p pico
x10
-12
n nano
x10
-9
u micro
x10
-6
m milli
x10
-3
k kilo
x10
3
M mega
x10
6
G giga
x10
9
T tera
x10
12
(Note that the front-panel k eypad contains dedicated keys for the unit-modifiers just to the right of the
Enter key.) To complete the entry press the "Enter" k ey on the front panel or an external keyboard. To
abort the entry press the "Esc" key on t he keypad or keyboard.
Somet imes the precision of the value represented by a unit entry may exceed the number of digits
displayed. To s ee the value of any unit entry displayed with full double precision hold the cursor over the
unit ent ry— the full double precision value will be shown as a "hint."
Unit Displays
Unit Displays are the controls with a black bac kground and green text which are used to display
measurement results and other quantit ies whose value can't be changed by the user. As with unit
entries , the units of the unit display can be changed by using the mouse or trackpad to click on the
at the right of the control and select a unit from the drop-down list. Right-clic king the Unit Display brings
up a menu which offers some more options:
Page 18

SR1 Operation Manual18
© 2014 Stanford Research Systems
Normally the Unit Display auto-selects the appropriate unit-modifier for the currently displayed value. For
instance 1.2x10
-6
Vrms would be displayed as 1.2 Vrms. There are situations where it might be
desirable to lock the unit-modifier selection. For instance we might want the display to readout as
0.0012 mVrms. To do this, select the appropriate modifier from the right-click menu. Select "Aut o" from
the right-click menu to return to normal operation.
The second feature offered by Unit Displays is selected in the bottom half of the right-click menu. In
"Standard" mode, the Unit Display displays each new value that is sent to it . If one of the other modes
are selec ted, the current value of the display is saved as the "reference" and subsequent updates are
displayed as follows:
Mode Operation
Standard Each update to the Unit Display's value is displayed.Data is displayed in Green.
Max Updates are display ed only if they are greater than the reference value. When the
data exceeds the reference that data becomes the new reference value. Data is
displayed in Re d.
Min Updates are display ed only if they are less than the reference value. When the
data is less than the reference that data becomes the new referenc e. Data is
displayed in Bl ue .
Delta The difference between the update value and the reference value is displayed.
Data is displayed in Purple.
To reset the reference double-click the display .
Like unit entries, it is possible to s ee the value represented by a unit display with full double precision by
holding the cursor over the unit display— the double precision value will be shown as a "hint."
Page 19

Getting Started 19
© 2014 Stanford Research Systems
1.5 A Quick Example...
In this example we'll use the analog generator to c reate a signal with a known amount of distortion and
we'll use the Time Domain Detector to measure the distortion and the FFT analyzer to look at the
distortion in the frequency domain. To begin, turn on SR1 and wait for the instrument to finish its s tartup
sequence. No external cables will be necessary for this demo. Feel free to use the front panel trackpad
and keypad keys to control the instrument, or if you've got an external mouse and key board you can
those. We won't go into ex cruciating detail on how to select items and use the controls because they're
standard Windows controls and their operation should be familiar.
Start out by using the speedbar at the top of the SR1 screen to open the Analog Inputs panel and the
Analog Generator panel, and from the Analyzers menu, set Analyzer 0 to Time Domain Detec tor. Thes e
three panels may automatically open when SR1 is powered up.
SR1 Spe edbar
Note that the icons for the Analog Inputs panels and the Analog Generator panel are both orange . SR1
uses orange to denote items associated with the analog domain and blue to denote items ass ociated
with the digital audio domain. Most panels have color bars under the title of the panel indicating the
domain associated with the panel.
The three panels y ou've jus t opened should look like this:
Now let's configure the instrument for this example. On the Analog Inputs panel, change the Input
Source for both channels from BNC to GenMon. With the inputs set to GenMon the Ch. A analog input
is directly connected t o the Ch. A generator output and the Ch. B analog input is directly connec ted to
the Ch. B generator output. Leave the "Auto" box checked for each of the range c ontrols. With Auto
Range on, SR1 automatically adjusts the range to the optimum value for the c urrent input signal. Note
that the ranges are set to their minimum value (62.5 mVrms) and the Input Level indicators are showing
blue (below half scale). That's because the generator hasn't been set up yet.
Page 20

SR1 Operation Manual20
© 2014 Stanford Research Systems
Take a look at the Analog Generator panel. We haven't selec ted any waveforms yet, so the tab cont rol at
the bottom only contains the configuration tab. By default, the generator is in "Mono" mode which
means that the same waveform will be output on the A and B channels . W e can adjust the channel
amplitudes s eparately, but the waveform is the s ame. (In "Stereo" mode we can select different
waveforms for A and B but we don't need to do that for this example.) Now press the "New" button on the
Analog Generator panel. This brings up the menu of available waveforms. From the Sine submenu
choose "Normal Sine". After the Sine waveform shows up in the tab control set an amplitude of 1Vrms.
Note how the range c ontrols on the Analog Input panel both move to the 1 Vrms input range and the
Input Level indicators turn green, indicating the ranges are optimally adjus ted. (The Input Level indicators
are also visible at the bottom right of the SR1 screen.) Now we can add a little bit of distortion to t he
signal. Pres s the "New" button again on the Analog Generator panel and once again select a "Normal
Sine". This time set the frequency to 2 k Hz and the amplitude to 1 mVrms. We've just illustrated a key
feature of the SR1 generator's architecture— the ability to combine several waveforms in the generator.
The 1 kHz 1 Vrms signal and the 2 k Hz 1 mVrms signals are added in the generator. Using this
technique an almos t infinite variety of waveforms c an be created in the generator to suit almost any test
situation.
Now let's measure the properties of the signals just created. Look at the Time Domain Detector panel
and change the source from Digital A to Analog A. The "Converter" field will read "HiRes" indicating that
the analy zer is using SR1's 24-bit High-Resolution converter. The current s ampling rate for this converter,
64 kHz, is displayed in the "Fs" field next to the converter selection. SR1 uses two high quality analogto-digital converters (ADCs) for analysis of analog signals— a 24bit high-resolution converter that can
operate over a variety of sampling rates and a 16 bit high-bandwidth converter that operates at a fixed
sampling rate of 512 kHz giving the instrument an analog bandwidth of 200 kHz. The differences between
the two converters will be discussed in detail later but for now we can leave the converter selection at
"HiRes."
Press the
button at the top left of the screen to start the measurements. Note that the Status
Indicator at the bottom left of the screen. SR1 operates in two distinct measurement modes. In "Free
Run" mode, which we jus t started, all the analyzers make continuous measurements and cont inuously
update the results on the analyzer panels and displays . This mode is us eful for benchtop ex ploration like
we're doing now. "Sweep" mode is a more structured measurement mode in which the instrument
sweeps a certain parameter and only measures data at certain defined values of that parameter. Sweep
mode is more useful for repetitive testing to standards. We'll do a sweep at the end of this demo as an
example. For now observe how in Free-Run mode the analyz er's level and amplit ude displays are
continuously updated.
To measure the " distorted" sine signal we've c reated, select "THD+N Ratio" as the Measurement in the
Time Domain Detector. Change the units of the Amplitude display to dB, and the three panels should
appear as they do below:
Page 21

Getting Started 21
© 2014 Stanford Research Systems
When " THD+N" ratio is selected, the analyzer inserts a deep notch filter at the frequency of the
fundamental. In this case, becaus e the notch filter is set to be tuned to the measured frequency, it is s et
at the 1 kHz dominant frequency of our generator signal. The Time Domain detect or then performs an
RMS integration of the remaining signal, which is distortion plus noise, and displays the ratio of that
signal to the total amplitude of the input Note that the measured THD+N ratio is -60 dB. (1 mV / 1 V =
60 dB).
To show how much more SR1 brings to a standard distortion meas urement s elect the second analy zer
(A1) as the FFT1 analyzer. W hen the panel is displayed, change the source of the Analyzer to "Other
Analy zer". In this mode the FFT analyzer and the Time Domain Analyzer work as a team; the FFT
analyzer looking at the notch filtered signal from the Time Domain Detector. Take a look at the
information displayed on the FFT1 analyzer panel:
Like all analyzers t he input s ource is displayed at the upper left. The analyzer sampling rate is displayed
at the upper right. Because we've connec ted the FFT analyzer to the output of the Time Domain Detector
Page 22

SR1 Operation Manual22
© 2014 Stanford Research Systems
the sampling rate for the FFT analyzer is also 64 kHz. Just underneath is the control for setting the
number of FFT lines (resolution). The resolution can be set to values between 256 lines and 32k lines.
Unlike most Audio Analyzers, SR1's FFT analyzer doesn't operate at a fixed frequency range from DC to
Fs/2. The Bandwidth control allows s etting the meas urement range to Fs/2, Fs/4, etc., all the way down
to Fs /2048. The full FFT resolution is applied to this narrower frequency range, which can be moved to
any position in the range of DC to Fs/2 using the "S tart," "Center," and "End" controls. We will illustrate
this shortly.
Averaging can be applied t o the FFT t o lower the shot-to-shot variation in the noise, or in some cases to
actually lower the amount of noise. Select 5 averages in the "# Avgs" field to create a nice stable FFT
display.
To display the FFT results we'll need to create a graph. Click on "Page 2" of the page control to give us
some room for the graph and click on the
icon to create a new graph. Maximize the graph with the
standard maximize c ontrol in the upper right. Now we need to add some data to the graph. Clic k the
"Plus" sign icon at the top left of the graph to add a trace to the graph. The "Add Trace" menu appears.
Open the "A1 FFT" node to see the measurements produced by the A1 FFT analyz er.
Note that scalar measurements, like frequency or level, are denoted with the icon while vector
measurements like s pectra are accompanied by the
icon. Selec t "Power Spectrum", click ok, and
the FFT will appear. Since we're looking at a very wide dynamic range, some logarithmic units will help.
Click on the "Ymax " Unit Entry and change the Y units to " dBVrms". Now click the "Log" box in the X
axis row to select a logarithmic X-axis. Click on the
icon (autoscale) on the graph speedbar to
autoscale the display. Now turn on the graph cursors by clic king the
icon. Use the knob or the
mouse to drag cursors as shown below. The graph should look like this:
Page 23

Getting Started 23
© 2014 Stanford Research Systems
Now we're ready to zoom in on a portion of the the distortion product s pectrum. Go back to Page 1 of
the page control, and in the bandwidth control of the FFT analyz er selec t 500 Hz.In the "Center
Frequency " field s elect 1 kHz. We're narrowing the bandwidth by a factor of 64, still using 1k FFT lines,
and centering the new bandwidth on the notc hed out fundamental. Go back to Page 2, autoscale the
spectrum, which should now look like this:
Page 24

SR1 Operation Manual24
© 2014 Stanford Research Systems
Note how more detail is resolved inside the notch. Go back to the FFT analyzer on page 1 and press the
"Baseband" button to return the analy zer to it's full measurment range. We're now ready for the las t step
in the demonstration.
Setting Up a Sweep
On page 1 click on the icon to open the sweep controller panel.W e're going to sweep the amplitude
of our "distortion" sine wave and record the measured THD+N from the Time Domain Detector: Clic k on
the Sweep Source button to bring up the sweep source selection menu:
SR1 has 3 main ty pes of sweep sources: Time Sweeps, where the s weep occurs at fix ed time intervals,
Internal Sweeps, where the s weep occurs at fixed values of some internal parameter, and External
Sweeps, where the sweep occurs at fixed values of some externally measured parameter. Since we're
going to s weeping the amplitude of the sinewave we created in the generator, this will be an "Internal"
sweep. Open the Internal node on the tree, and then open the AnlgGen (Analog Generator) node to show
the associated parameters that can be swept. Note that there are two sine amplitudes and frequencies
shown, Sine(0) and Sine(1). That's because we created two sinewaves in the generator. The first, Sine
(0), refers to the 1 kHz fundamental. The second, Sine(1) is the "distortion" s inewave whose amplitude
we're going to sweep. Double-click on ChA:Sine(1):Amp to select it and return to the sweep panel:
Page 25

Getting Started 25
© 2014 Stanford Research Systems
Selec t the start amplit ude as 100 uVrms and the stop amplitude as 100 mVrms. Leave the number of
sweep steps at 30, but select "Log Step Size." Next we need to select that data that will be measured
in the s weep. Up to 6 separate measurements can be recorded at each sweep point. Click on the
Sweep Data "()..." to specify the sweep data. From the Sweep Data Selection menu, open the A0 node
since the measurement we're going to record, THD+N, is made by the currently active Time Domain
Detector on A0:
Page 26

SR1 Operation Manual26
© 2014 Stanford Research Systems
Selec t Analog THD Ratio A by double-clicking it. We're now ready to set up the graph to display our
sweep.
Return to Page 2 of the page control. In the t race listing panel at the bottom of the graph unclick the
Power Spec trum trace that we were looking at previously. Now use the "Plus" button at the top of the
display to add another trace to graph. This time open the "Sweep" node and selec t "THD Ratio A".
Selec t a log X-axis (to match the log sweep we just specified, and s elect dB as the Y-axis units with the
unit ent ry controls. Select a Y axis range from -95 to -10 dB. Now start the sweep by pressing the
"Sweep" button on the front panel. After a few seconds you'll see the results of the sweep:
This, of course, is exactly what we expect. At an amplitude of 100 uVrms, the THD+N is simply 20*log
(100 uV/1V) = -80 dB. At the other of the s weep the the THD+N is 20*log( .1V / 1V) = -20 dB.
This quick example only scratches the surface of SR1's capabilities, but should give you a feeling for
how the ins trument operates.
Page 27

Part
II
SR1 Operation
Audio
Page 28

SR1 Operation Manual28
© 2014 Stanford Research Systems
2 SR1 Operation
2.1 File Menu
The File Menu contains options for saving and recalling instrument configurations and also for printing.
Save SR1
Configuration
Saves the entire inst rument s etup to a configuration file.
Save Partial
Configuration
Saves the entire inst rument s etup to a configuration file.
Load Configuration Loads set up information from a configuration file.
Print SR1 Screen Prints the currently displayed screen to the currently selected printer.
Print Setup Displays the standard Windows Print Setup dialog allowing the selec tion of
an installed printer and paper options.
Page 29

SR1 Operation 29
© 2014 Stanford Research Systems
2.1.1 Save SR1 Configuration
Selecting File Save SR1 Configuration saves the entire instrument setup to an SR1 configuration
file. Configuration files are XML files whose structure is detailed in the SR1 File Reference
. The default
extension for configuration files is ".XML".All operating parameters, as well as the the pos ition of all
panels and display s are recorded in the configuration file. After loading the file the instrument state will
be exactly what it was when saved.
The trace data option governs how SR1 will save data stored in graphs. "Never Save" means that no
graph data will be saved along with the configuration file. The file, in t his case, is a pure "settings" file.
"Always Save" means that all graph data, including live measurements, will be saved with the
configuration file. "Save if Offline" means that only offline graph data, such as reference curves or limits,
will be saved with the configuration.
Page 30

SR1 Operation Manual30
© 2014 Stanford Research Systems
2.1.2 Save Partial Configuration
Selecting File Save Partial Configuration allows a choice of which portions of the ins trument setup
will be saved to the SR1 configuration file. After selecting this option, the Save Partial Configuration
dialog box is diplayed.
Selec t the portions of the instrument configuration to save and click "OK" to display the s tandard SR1
file save dialog box .
Page 31

SR1 Operation 31
© 2014 Stanford Research Systems
2.1.3 Load Configuration
File Load Configuration loads the instrument's configuration based on the values found in the file
selected with the standard Windows file open dialog box. After selecting the file, a dialog is displayed
allowing s election of individual configuration areas. The default is to load all the configuration information
in the file. Only configuration areas found in the s elected file have a clickable checkbox, the rest are
grayed out.
Selec t the portions of the instrument configuration to load and click "OK" .
Page 32

SR1 Operation Manual32
© 2014 Stanford Research Systems
2.1.4 Print SR1 Screen
File Print SR1 Screen prints the full main window of the program, including menus and borders, to
the current printer. Printer and paper options are selected from the File
Print Setup dialog. Note that
File
Print SR1 Screen always prints the entire screen exactly as it appears. Other options are
available for more formatted printing and ex porting of data from displays
.
Page 33

SR1 Operation 33
© 2014 Stanford Research Systems
2.1.5 Print Setup
File Print Setup displays the s tandard Windows print setup dialog box.
When running the SR1 program from a W indows c omputer, use whatever printers have already been
installed. When using the SR1 instrument, use the Tools
menu to connect SR1 to a network and install
and configure network printers .
Page 34

SR1 Operation Manual34
© 2014 Stanford Research Systems
2.2 Edit Menu
The Edit menu supplies the standard Windows edit ing functions: Cut, Copy, Pas te, and Delete.
Cut Deletes the c urrently selec ted text and c opies it to the clipboard.
Copy Copies the currently selected text to the clipboard without deleting it.
Paste Copies the clipboard contents to the current cursor location.
Delete Deletes the currently selected text wit hout copying it to the clipboard.
Note that in addition to being useful for transferring text, the edit commands may be used to transfer
Graph Traces between different graphs
.
Page 35

SR1 Operation 35
© 2014 Stanford Research Systems
2.3 Panels Menu
The Panels menu provides access to the various panels which c ontrol the operation of the instrument.
SR1 panels are fixed size windows— they're not resiz able. They can be minimiz ed, maximized, or
closed with the standard Windows tools :
.
Multiple copies of the s ame panel may be maint ained on different pages of the main display. In general,
changes made to a panel on one page are automatically updated on t he other pages.
Panels are color coded according to the domain to which they apply. Panels relevant to the digital
domain have a light blue bar under the title bar
.
Panels which are relevant t o the analog domain have an orange bar under the title.
Analy zer Panels, which can operate in either domain, have either the light blue or orange bar depending
on whether the analyzer is operating in the digital or analog domain.
The following panel selections are available from the panels menu.
Analog Generator
Panel
Controls the operation of SR1's Analog Generator.
Digital Generator
Panel
Controls the operation of SR1's Digital Audio Generator.
Analog Inputs Panel Configures t he analog inputs.
Digital I/O Panel Configures the Digital Audio Carrier Input and Output configuration.
Sweep Panel Sets up one or two dimensional sweeps.
Settling Panel Configure the settling parameters for sweep measurements.
Monitors Panel Configures the source and level for the monitor outputs.
Multitone Panel Configures the analyzer and generator settings for multitone measurements.
Clock Reference Panel Locks the SR1 system clock to a variety of external sources.
Page 36

SR1 Operation Manual36
© 2014 Stanford Research Systems
2.3.1 Analog Generator Panel
The Analog Generator Panel controls the operation of SR1's analog generator. The generator can be
populated with many different waveforms— sines, square waves, ramps, etc. Many of the waveforms can
be combined by the generator. For instanc e, if the generator is populated with sinewave and noise, than
the output will be the sum of the sinewave and noise signals. The amplitudes of each component of the
composite signal are adjustable separately as is the overall amplitude of the combined signal. Some
waveforms, (USASI noise, for instance) are special-purpose test signals and may not be combined with
other waveforms.
The tabs corresponding to each particular waveform are described in Analog Generator Waveforms
section. This sec tion des cribes the controls and settings of the analog generator that are relevant to all
waveforms.
Note that the SR1 Analog Generator is completely separate and independent of the Digital Audio
Generator. The t wo generators operate simultaneously and independently with different waveforms.
Output Controls
Fs c ontrols the output sampling rate and D/A converter selection for the analog generator. SR1 uses
two different types of D/A converters to generate high-quality analog waveforms, a 16-bit converter
operating at a fixed output sampling rate of 512 kHz and a 24-bit converter which operates at a variety
of sampling rates. Each converter has advantages depending on the specific application. See the
Specifications
section for detailed information on each of the converters.
512 kHz Selects the Hi-Bandwidth 16-bit converter operating at a fixed output rate of 512 kHz.
This setting allows a maximum waveform frequency of 200 kHz.
128 kHz Selects the Hi-Resolution 24-bit converter operating at a fix ed sample rate of 128 kHz
providing a maximum waveform frequency of 57.6 kHz
64 kHz Selects the Hi-Resolution 24-bit converter operating at a fix ed sample rate of 64 kHz
Page 37

SR1 Operation 37
© 2014 Stanford Research Systems
providing a maximum waveform frequency of 28.8 kHz
OSR Synchronizes the sampling rate of the analog generator to the digital audio output
sampling rate set in the Digital I/O
panel.This setting is useful for performing cros s-
domain measurements using the FFT Chirp waveform or Multitone
techniques.
Maximum waveform frequency is 45% of the digital audio sampling rate.
ISR Synchronizes the sampling rate of the analog generator to the sample rate of the
received Digital Audio signal. Maximum waveform frequency is 45% of the digit al audio
sampling frequency.
Mode c ontrols the output mode of the Analog Generator.
Mono The same waveform is output to both the A and B channels. The amplitude of each
channel is still separately adjus table, but the waveform is the same.
Stereo Each channel can be configured with a different waveform.
Output Configuration selects the output connector configuration. (See the diagram below)
Unbal Gnd. Outputs to the both the XLR and BNC connectors . The BNC shield and XLR pin 3(-) are
connected to chass is ground through a 5
resis tor. XLR pin 1 is connected directly to
chassis ground. The BNC center pin and XLR pin 2 bot h are connected to the
unbalanced signal.
Unbal Floa t Outputs to the both the XLR and BNC connectors. The BNC shield and XLR pin 3(-) are
connected to chass is ground through a high impedanc e (~100k,1uF). XLR pin 1 is
connected directly to chassis ground. The BNC center pin and XLR pin 2 both are
connected to the unbalanced signal.
Bal Gnd. Outputs to only the XLR connectors. XLR pin 1 is connected directly to chassis ground.
XLR pins 2(+) and 3(-) c arry the balanced s ignal whic h is symmetric around chas sis
ground.
Bal Floa t Outputs to only the XLR connectors. XLR pin 1 is connected directly to c hassis ground.
XLR pins 2(+) and 3(-) c arry the balanced s ignal whic h is unreferenced to chassis
ground.
Bal Com mon Similar to Balanced Ground except that t he same signal is present on pins 2 and 3.
This allows testing the Common Mode Rejec tion Ratio of external devic es.
Page 38

SR1 Operation Manual38
© 2014 Stanford Research Systems
Analog Gene rator Output Connections
Output Impedance selects the Analog Generator output impedance.
Page 39

SR1 Operation 39
© 2014 Stanford Research Systems
25 , 75 , 600 Allowed impedance values for unbalanced out puts
50 , 150 , 600 Allowed impedance values for balanced outputs
Waveform Controls
The New button displays the Waveform Selection Submenu.
The selected waveform will either be added to the output for one or both channels depending on the
Mode setting. Certain waveforms (for instance Low Distortion Sine) cannot be combined with other
waveforms. When one of these waveforms is selected all of the current waveforms are deleted. Other
waveforms simply add to the current output when selected.
The Delete button deletes the currently selected waveform.
The A/B selection buttons only appear when the generator Mode is set to Stereo. The buttons
determine which channel a newly added waveform will appear on. When the mode is c hanged to stereo,
any waveforms present will be assigned to channel A. When the mode is changed from stereo to mono,
all channel B waveforms are deleted and the channel A waveforms are output on both channels.
Amplitude Controls
The Channel Gain control varies modifies the total output amplitude for the channel from 0% to 1000%
of the sum of the waveform amplitudes for that channel. The Total Channel Amplitude control display s
that value. For instance, if the channel has 2 sine waveforms, one with an amplitude of 1 Vp, and the
second with an amplitude of 3 Vp, and if the Channel Gain control is set to 50%, then Total Channe l
Amplitude will display 2 Vp. In general, The A and B channels can have separate Channel Gains,
however, if the A/B Lock checkbox is checked, the A and B values are always the same. If the sum of
the waveform amplitudes exceeds the maximum output voltage of the generator, then the Channel Gain
will automatically adjust to a value such that the total output amplitude reamains within range.
Auto-On affects the behavior of the generator output during a sweep
. If Auto-On is checked the
Page 40

SR1 Operation Manual40
© 2014 Stanford Research Systems
generator output will automatically turn on (if it was off) at the beginning of a sweep and turn off when the
sweep is completed.
The large green/red On/Off buttons turn on and off their respective channels, while the Invert buttons
invert the output for each channel.
Reference Controls
The Reference controls allow setting several parameters used in the computation of different generator
amplitude units. See the Generator Units section for a complete description of all these units. Note that
there is one set of referenc es for both generator channels.
Burst Controls
The SR1 Analog Generator implement s two different types of burst functionality. Sy nchronous Burst
provides a burst sine wave with a variety of triggering options where the burst transitions are guaranteed
to be synchronous with the zero crossings of the sine wave. This ty pe of burst is implemented in SR1 as
a separate waveform. SR1 also offers the capability of bursting any waveform that can be configured in
the generator, although with no guarantee that bursting will occur at zero-crossings. This type of burst
will be referred to as "generator burst " as opposed to sync hronous burst.
Generator Burst Mode selects t he burst triggering mode
Timed The waveform outputs at the high amplitude then the low amplitude and repeats. The
total period is determined by the Burst Period control. The high-amplitude fraction of the
period is determined by the Burst Duty Cycle.
Gated (hi) The waveform amplitude is determined by the TTL gating signal applied to the rear-
panel TTL burst trigger input. When the ext ernal signal is high the generator output is at
the high amplitude, when the external signal is lo the generator runs at the lo
amplitude. Burst Period and Burst Duty Cycle are ignored.
Gated (lo) The waveform amplitude is determined by the TTL gating signal applied to the rear-
panel TTL burst trigger input. When the ext ernal signal is lo the generator output is at
the high amplitude, when the external signal is high the generator runs at the lo
amplitude. Burst Period and Burst Duty Cycle are ignored.
Shaped Similar to Timed Burst ex cept that a c osine-squared window is applied to the signal
through the "hi" portion of the burst.
Triggered The output is zero until a TTL rising edge is detected at the rear panel burst trigger
input. The output then goes high for the interval specified by Burst Period.
Lo Amp selects the lo burst amplitude as a fraction of the original generator amplitude. For Triggered
Page 41

SR1 Operation 41
© 2014 Stanford Research Systems
Bursts the lo amplitude is fixed at zero.
Burst Pe riod controls the duration of triggered bursts and the total on/ off period for Timed and Shaped
bursts.
Burst Duty Cycle c ontrols the fraction of the burst period during which the generator output is at the hi
amplitude.
EQ Controls
Certain waveforms c an have their amplitudes s caled as a function of frequency according to the
information contained in an EQ File. EQ files are XML files which specify a relative frequency respons e
as a function of frequency by either interpolating a table of (frequency, respons e) pairs or by calculation
from a set of pole and zero locations. The structure of EQ Files is detailed in the File Reference
section.
Use the
button to open a file dialog to spec ify the EQ File. Check the Invert EQ box to have the
amplitude sc aled by the inverse of the EQ file respons e. W aveforms that are capable of being used with
EQ files will have an "EQ" checkbox in their waveform tab. This box must be checked for EQ to be active
regardless of whether an EQ file is selected in the file selection control. W hen an EQ file is selected and
the checkbox is checked the amplitude control in the waveform tab will continue to s how the constant
user-selected waveform amplitude, however, the Total Channel Amplitude control will display the
amplitude with the EQ response included.
2.3.1.1
Analog Generator Units
The amplitude and frequency of generator waveforms can be spec ified using a variet y of units all of which
are useful in different audio test scenarios. Because of the large number of waveforms that SR1 can
generate and because it's useful to define amplitude in a way that simplifies the coupling between the
details of the waveform and its amplitude, SR1 us es the following two conventions for analog generator
amplitudes:
1. Analog generator amplitudes, regardless of the waveform or the units they are expressed in, refer to
the peak value of the waveform. W hen waveforms are combined in the generator, the amplitudes add
simply, regardless of the phase relation of the waveforms.
2. RMS units always, regardless of waveform, have the same relat ion to peak units that they do for a
sine wave.
Thus, a square wave with instantaneous amplitude of ±1V is said to have an amplitude of 1 Vp, or .707
Vrms even though this is not the actual value of the RMS amplitude derived from a computation. While
this may seem counterintuitive it simplifies the s pecification of amplitude units and is the c onvention
used by most audio tes t equipment.
The following table desc ribes t he units available for setting the amplitude of analog generator waveforms.
Unit
Description
Vp Volts Peak, or s imply volts. (The p is added to reduce ambiguity with other volt-oriented
units ) An analog waveform with an amplitude of 1 Vp has an ins tantaneous peak value of 1
Volt.
Vrms A sine wave with an amplitude of 1.414 Vp has an RMS amplitude of 1 Vrms. In SR1,
Page 42

SR1 Operation Manual42
© 2014 Stanford Research Systems
Unit Description
Vrms and Vp always have this fix ed relationship. Irrespective of waveform, 1 Vrms = 1.414
Vp.
Vpp Similar to rms, Vpp (Volts peak-to-peak) has the same relation t o Vp that it does for a
sinewave. Thus, 1Vpp = .5 Vp.
dBVrms Decibels relative to 1 Vrms. A s ignal wit h an amplitude of -20 dBVrms has a peak
amplitude of 100 mVrms or 141.4 mVp.
dBu Decibels relative t o 0.7746 Vrms. Note that even though historically the value of 0.7746
Vrms was chosen because it represents the voltage required to dissipate 1 mW in a 600
load, in SR1 dBu specifies an open-circuit voltage without regard to the actual load
connected to the output.
dBr Decibels relative to the dBr Referenc e specified in the References Box.
dBm Decibels relat ive to 1 mW into a load specified by the dBm Reference in the References
Box. Specifying t he waveform amplitude in dB m asks SR1 to set the amplitude necessary
to deliver a certain amount of power to a specified load tak ing into account the output
impedance of the generator. If the amplit ude is measured across the open-circuited output
terminals with a high-impedanc e meter, you may get a different result.
W Watts into a load s pecified by the dBm Reference in the References Box. Specifying the
waveform amplitude in dBm asks SR1 to set the amplitude necessary to deliver a certain
amount of power to a specified load taking into account the output impedance of the
generator. If the amplitude is measured ac ross the open-circuited output terminals with a
high-impedance meter, you may get a different result.
The value of "0" has no exact representation in dB units. When a generator amplitude of
0 is shown in a control displaying dB units the value "-1000 dB" is shown (which may
display as "-1.0 kdB". This is not meant to imply an actual value of negative 1000 dB
but merely to provide a convenient way to represent 0 in dB units.
Analog Generator Frequency Units
The following table desc ribes t he units used by SR1 in setting the frequency of digital generator
waveforms. All frequency units except Hz mak e use of the Frequency Reference which is set in the
References Box
on the Analog Generator Panel.
Unit
Description
Hz The fundamental unit of frequency. 1 Hz = 1 cycle-per-second.
F/R Ratio relative to the Frequency Reference. A value of 3 F/R with reference of 2 kHz gives a
waveform frequency of 6 kHz.
dHz Difference relative to the Frequency Reference. A value of 500 dHz wit h a reference of 2
kHz gives a waveform frequency of 2.5 kHz.
%F re f Percent of the Frequency Reference. A frequency value of 50 %Fref with a reference value
of 10 kHz gives a waveform frequency of 5 kHz.
cents A "cent" is a logarithmic unit which represents 1/100 of a semit one of the musical scale.
12 semitones make up an octave. Thus a cent is 1/1200 of an octave.
octaves An octave is a factor of 2 in frequency. Thus, a frequency value of 3 octaves with a
reference of 1 kHz gives a waveform frequency of 8 kHz.
Page 43

SR1 Operation 43
© 2014 Stanford Research Systems
Unit Description
decades An decade is a factor of 10 in frequency. Thus, a frequency value of 2 decades with a
reference of 2 kHz gives a waveform frequency of 200 kHz.
2.3.1.2 Analog Generator Wave forms
SR1's Analog Generator is capable of generating an enormous variety of different audio waveforms, from
simple ultra- lo-distortion sines to complex synchronous multitone waveforms. Because of its unique
archit ecture which allows different waveforms to be combined the generator offers almost limit less
flexibility in providing the perfect audio test output. In this section each waveform, the building blocks of
the generator output, will be described in detail.
Sine Waveform Tab
When a waveform is added to the generator output using the Waveform Controls, the associated
waveform tab shows up on t he generator panel. For inst ance, the Sine Waveform tab is shown above. If
the Generator is in t he stereo output mode (separate waveforms for each channel) the tab title contains a
channel designator indicating which channel the waveform is associated with. If the generator is in mono
output mode, the channel designator is omitted and the title contains jus t the name of the waveform.
Some of the controls found on the waveform tabs are common to many waveforms. These will be
described first to avoid repetition.
Controls Common to Most Waveforms
The Waveform On c heckbox turns the selected waveform on and off. If the selected waveform is
currently the only waveform in the generator, checking and unchecking this box has the same effect as
turning on and off the generator using the Amplitude Controls
or by simply setting the waveform
amplitude to zero and back. When the generator is outputting a combined waveform this checkbox
allows the selected waveform to be toggled on and off while still outputting the remainder of the
waveforms.
The EQ checkbox appears for only certain waveforms. If EQ is check ed, and an EQ file is selected on
the generator panel, the actual generated amplitude for the waveform will be the nominal amplitude
multiplied by the frequency response of the EQ file at the current frequency.
Page 44

SR1 Operation Manual44
© 2014 Stanford Research Systems
The Waveform Amplitude control sets the peak amplitude of most waveforms.
The Waveform Frequency control sets the frequency of many waveforms .
Generator Trigger
Certain generator waveforms c an generate a trigger, known as a "generator trigger" whic h can be used
by the analyzers to synchronize the analyzer to a certain portion of the waveform. Triggering is a
complex subject (which is fully described in the Analyzers
section), and there are many different
possible analy zer trigger sources besides generator trigger, so in this section the disc ussion will be
limited to those waveforms that provide generator triggers, and where in the waveform the trigger
generated. When the generator is c onfigured with multiple waveforms, the first waveform whic h is
generator-trigger capable will be the source of all generator triggers.
The Analog Generator Waveforms
In the following list, waveforms that may not be combined with other waveforms are marked with an
asterisk (*) next to their names.
Normal Sine
Low Distortion Sine*
The sine wave is the most basic audio test waveform. Sine waveforms are specified only by their
amplitude and frequency. The Normal Sine waveform may be combined with other waveforms. The Low
Dist ortion Sine waveform uses additional signal proces sing to obtain ultra-low distortion sine waves.
Because this extra signal processing would interfere with other waveforms, the Low Distortion Sine may
not be combined with other waveforms.
Low Distortion Sine and Phase
Due to the additional signal processing used to obtain ultra low distortion outputs, significant (~10º)
phase differences may exist between the A and B channel outputs when the low distortion waveform is
selected. For this reason it is not recommended to use low distortion sine for testing phase.
Page 45

SR1 Operation 45
© 2014 Stanford Research Systems
Phased Sine*
The phased sine waveform cons ists of two s ines, one on channel A and one on Channel B with a
specified phase differenc e between them. This waveform may not be combined with other waveforms.
Synchronous Burst Sine*
The synchronous burst sine is a sinewave capable of fast s witching between two amplitude levels.
Amplitude shifts occur synchronously with the zero-crossings of the sinewave . In addition to t he
standard amplitude and frequency controls, the Synchronous Burs t Sine tab contains several controls
which govern the burst options:
Burst Type selects the burst triggering mode
Internal The sine output alt ernates between the hi and lo amplitudes Both the hi and lo intervals
are integer numbers of cycles of the sine. The total period is determined by the Burst
Rep. Ra te control. The Hi amplitude interval is determined by the Burst On Time
control.
Ext. Gated The waveform amplitude is determined by the TTL gating signal applied to the rear-
panel TTL burst trigger input. When the ext ernal signal is high the generator output is
set to the high amplitude, when the ex ternal signal is lo the generator switches to the
lo amplitude. Amplitude swit ching is performed synchronous with the sine zerocrossings regardless of the actual moment at which the external gating signal
switches.
Ext.
Triggered
The output is at the lo amplitude until a TTL rising edge is detected at t he rear panel
burst trigger input. At the next zero c rossing the output then goes high for the number
of cycles specified by Burst On Time .
Burst Repeti tion Rate is only valid for internal bursts. It sets the total on/off period of the burst cycle.
The rate may be entered as a number of cycles, a frequency, or a time interval. In the latter two cases
the value will be rounded to the nearest integer number of cycles.
Burst On Ti me . For internal bursts, Burst On Time specifies the number of cycles the sine is at the
Page 46

SR1 Operation Manual46
© 2014 Stanford Research Systems
high amplitude during the burst cycle. For externally triggered bursts the Burst On Time specifies the
number of cycles the sine is output at the high amplitude following a trigger.
Lo Amplitude s pecifies the burst "Lo Amplitude" as a fraction of the nominal waveform amplitude.
Synchronous Burst Sine, Re petition Rate = 6 cycle s, Bur st On Time = 2cycle s
The green burst indicator will flash when the burst is triggered in either the Ext . Gated or Ext. Triggered
modes. The red burst error indic ator will flash in the externally triggered mode to indicate a rate error
condition.
Noise
The noise waveform outputs random nois e with an almost-gaussian amplitude probability density
function with several options. (A true gaussian probability density function has finite probability for any
amplitude, no matter how large, which is impractical for a physical device.)
Amplitude c ontrols , as with all SR1 waveforms, the peak value of the noise out put. The crest factor of
the nois e waveform, the ratio of the peak value to the rms value of the nois e, is approximately 4.
The Repeat checkbox governs the repetition interval of the generated nois e. If not checked the repeat
interval is sufficiently long that it won't observable under mos t conditions . If, however, it is desired for the
noise to repeat after a fixed interval, check the Repeat box and enter the Repeat interval below it. If
Repeat is selected, the noise waveform produces a generator trigger each time a waveform repeat is
initiated.
The Pink checkbox specifies that the noise output should be filtered by a 3 dB/octave "pink ing" filter.
While the power contained in a whit e noise signal is linearly proportional to the measurement bandwidth,
pink noise will have equal power in equal logarithmic frequency intervals, e.g. the power contained in the
100 Hz to 200 Hz interval will be the same as the power contained in the 10 k Hz to 20 kHz interval.
White or Pink noise can be further filtered according to the c ontrols in the filter group.
Page 47

SR1 Operation 47
© 2014 Stanford Research Systems
Noise Filter
None White or Pink noise is directly output without further filtering.
Lowpa ss The white or pink noise is filtered with a 4th order Butterworth lowpass filter at the
frequency s pecified in the filter frequency control.
Highpass The white or pink noise is filtered with a 4th order Butterworth hipass filter at the
frequency s pecified in the filter frequency control.
1/3 Octa ve The white or pink noise is filtered wit h a 4th order 1/3 oc tave bandwidth Butterworth
bandpass filter at the frequency specified in the filter frequency c ontrol.
The noise waveform outputs a generator trigger when only when "Repeat" is checked. The
trigger occurs each time the waveform is repeated.
MLS Noise
The MLS noise waveform output s a Maximum Length Sequenc e with a specified repetition interval and
frequency profile. MLS waveforms are typic ally used as a stimulus in impuls e response measurements
where several special properties of the MLS (the autocorrelation of an MLS sequence is a delt a function)
simplify the calc ulation of the impulse response. Because SR1 uses a full 2-channel FFT analyzer to
make impulse response measurements it is not necessary to use MLS noise as a stimulus— any
broadband signal will work. Nevertheless SR1 includes the MLS waveform because of its his toric al
association with impulse response measurements.
Amplitude c ontrols , as with all SR1 waveforms, the peak value of the noise out put. The crest factor of
the MLS waveform, which is essentially a square wave, is close to 1.
The Length selection controls the length of the MLS sequence. Selecting "13," for example, chooses an
MLS s equence whose repetition interval is 2
13
-1 samples.
The Pink checkbox specifies that the noise output should be filtered by a 3 dB/octave "pink ing" filter.
While the power contained in a whit e noise signal is linearly proportional to the measurement bandwidth,
pink noise will have equal power in equal logarithmic frequency intervals, e.g. the power contained in the
100 Hz to 200 Hz interval will be the same as the power contained in the 10 k Hz to 20 kHz interval.
The MLS noise waveform output s a generator trigger each t ime the MLS cycle repeats.
Page 48

SR1 Operation Manual48
© 2014 Stanford Research Systems
USASI Noise*
USASI noise is a special type of filtered noise designed to mimic the content of audio program material.
USASI noise is typically used in testing broadcast transmitters to measure compliance with
transmission bandwidth requirements . Because the frequency c ontent of USASI noise is fixed, only an
amplitude control appears on the waveform tab. USASI noise may be used in conjunction with generator
bursting
to generate a burst USASI signal suit able for transmitter testing.
Freque ncy Spe ctrum of USASI Noise : 100 Hz 6dB/oct hipas s + 320 Hz 6 dB/oct lopass
Square Wave*
SR1 square waves us es special hardware to generate clean analog square waves. As a result, s quare
waves may not be combined with other waveforms in the analog generator. The square wave frequency is
limited to a maximum of 50 kHz regardless of the selected analog generator sampling rate. Because of
the finit e bandwidth of the analog generator, square waves will have finite risetime and overshoot
depending on the frequency and the s elected D/A converter.
Page 49

SR1 Operation 49
© 2014 Stanford Research Systems
Ramp
The ramp waveform cons ists of repetitive runs of integer numbers of "rising" and "falling" samples to
produce triangle-like output waveforms. Because the runs are restricted to integer number of samples,
the Ramp Frequency and Ramp Fractional Rise Time have limited resolution which is a function of the
selected generator sample rate. The lowest amplitude sample has the value assigned in the Low
Amplitude c ontrol. The highest amplitude s ample has the value given in the High Amplitude c ontrol.
1 kHz Ramp with Vm ax=+1,Vmin=-1,25% Rise Tim e
The ramp waveform generates a generator trigger each time the ramp begins its rising
segment.
Arbitrary Waveform
The arbitrary waveform plays a sequence of values found in a user supplied table. Arbitrary waveform files
are simple ASCII files with one or more columns of floating point numbers representing t he values of the
Page 50

SR1 Operation Manual50
© 2014 Stanford Research Systems
arbitrary waveform at each sampling interval.. Use t he button to open a file dialog to select an
arbitrary waveform file. If multiple columns are detected in the file, SR1 displays a dialog asking whic h
column to load. The number of points read from the table is then displayed in the corresponding control.
The amplitude entered in the Arb amplitude control is assigned t o the max imum value found in the table.
The absolute s caling of the table values does not affec t the output waveform. Thus t he following table of
values in the file:
0, 0.1, 0.2, 0.3, 0.4, 0.5,
produces a linear ramp from 0 to 2.0 Vrms if the amplitude control is set to 2.0 Vrms. The maximum
amplitude for arbitrary waveforms is half that of sinewaves due to the fact that non-bandlimited arbitrary
waveforms may ex hibit overshoot.
The Output Rate control governs how fast table points are output. At 100% the output rate is 1 table
point per output sample. At 200% the generator skips a table point and outputs every other table point
each output sample. For fractional output rates the waveform is interpolated. So at 50% Output Rate the
generator outputs a table point, then and interpolated point and then the next table point. Bandlimited
interpolation is used where memory allows. Otherwise linear interpolation is used. A maximum table
length of 128 kpoints is allowed, subject to other waveforms or instrument features us ing the DSP
memory.
The arbitrary waveform generates a generator trigger each time the output returns to the
beginning of the t able.
FFT Chirp
The FFT Chirp waveform is designed to work in combination with one of SR1's FFT Analyzers. The c hirp
waveform provides a tone ex actly at the bin c enter of each the FFT Analyzer's analysis bins. In the
default case, each tone has equal amplitude, however, the Chirp waveform can be us ed with generator
EQ to generate chirp signals with custom tailored frequency response.
Chirp signals are useful for quickly measuring the frequency response of a device under test . Unlike
noise signals which are not deterministic and require long averaging times to measure frequency
response, a chirp signal can precisely measure frequency response in a single FFT record.
The Chirp waveform is sync hronized to the settings of a partic ular FFT analyzer. If the resolution or
frequency s pan of that analyzer changes, the chirp waveform automatically reconfigures to provide a full
set of bin-center tones. If t he corresponding analyz er is set to "show aliased lines
" the chirp outputs a
tone in every single FFT bin, from near DC to Fs/2. If "show aliased lines " is off, the chirp outputs tones
from near DC up to the alias limit for the analyzer's selected converter and frequency span. See the FFT
Page 51

SR1 Operation 51
© 2014 Stanford Research Systems
Analy zer section for more details on these topics. Becaus e of the sy nchronous nature of the chirp
signal, a uniform window should be selected in the analyzer when using the chirp waveform.
Selec tion of the associated FFT Analyz er is done with the Chirp Source control.
Chirp Source Associated Analyzer
A0: FFT1 Analyzer 0, Single Channel FFT Analyzer
A0: FFT2 Analyzer 0, Dual Channel FFT Analy zer
A1: FFT0 Analyzer 1, Single Channel FFT Analyzer
A1: FFT1 Analyzer 1, Dual Channel FFT Analy zer
Synchronous chirp generation requires there to be a relationship between the selected generator
sampling frequency and the ass ociated analyzer sampling frequency. In general, the two frequencies
need to be eit her exactly the same or some integer multiple of one another. If the generator and analyzer
sampling frequencies are incompatible, the "Compliance" led will glow red and no waveform will be
output. The compliance led may also show red if SR1 runs out of table memory to create a long chirp
signal (say for a large number of FFT lines, or when large amounts of fft zoom are used. The chirp
waveform may attempt to use interpolation in situations when not enough memory is available for the
complete table, in which case the "Compliance" led will glow yellow. Some degradation of flatness c an
be expected in this c ase.
Using t he chirp signal it is possible to make cross domain measurements of both amplitude and phase.
For instance when testing a D/A c onverter a chirp can be output in the digital domain, and the D/A
frequency res ponse and phase recorded in the analog domain. To ensure cross-domain sampling rate
compatibility use the following sampling rate selections for the generator and analyzer.
Type of Mea surement Ge nerator Fs Analyzer Fs
Analog Source,
Digital Measurement
(ADC)
Selec t Digital ISR as the analog
generator Fs.
Selec t Digital as the Analyzer s ource
which aut omatically choos es ISR as
the analy zer Fs.
Digital Source, Analog
Measurement (D/A)
Selec t the desired digital audio
output frequency using the Digital I/
O panel.
Selec t the Analog Hi-Res converter on
the analy zer panel and set the Hi-Res
converter Fs to Digital OSR or digital
OSRx2 using the Analog Inputs panel.
Because the sync hronous chirp source has a time-dependent amplitude profile, it may fool the
input aut oranging cont rol into switching ranges too frequently. Depending on the FFT bandwidth
(which determines the chirp length) it may be us eful to turn off input autoranging when using the
synchronous chirp signal.
For the s ame reason, be sure to select the " Uniform" window when using the synchronous
chirp. Window functions attenuate the beginning and the end of the timre record for the FFT
analyzers which when using the chirp means that certain frequencies will be attenuated more
than others. This destroy s the "flat" nature of the synchronous chirp signal.
Using Chirp With Eq and Inverse Eq
By using the EQ feature of the generator it is possible to tailor a stimulus with a precisely defined
frequency profile. EQ files spec ify a relative frequency response as a function of frequency. The format of
EQ files is described in the SR1 File Reference
. W hen an EQ file is on the Configuration tab of the
generator panel, the amplitude in each frequency bin will be multiplied by the frequency response of the
EQ file at that frequency. If t he "Invert EQ" checkbox is c hecked, the amplitude in each bin will be
Page 52

SR1 Operation Manual52
© 2014 Stanford Research Systems
multiplied by the inverse of the frequency response of the EQ file.
When EQ is selected with chirp, the "Variable Sweep Rate" feature is enabled. Selecting Variable
Sweep Rate c hanges the chirp sweep rate to equalize the time domain amplitude in a chirp with variable
frequency domain amplitude.
For instance, the graph above shows the time response of a chirp weighted with the CCIR EQ curve.
The yellow trace was taken with Variable Sweep rate off, and the green with Variable Sweep Rate on.
Even though the two chirps have identical amplitudes in the frequency domain notice how more uniform
and how much lower the crest factor the variable sweep rate chirp has. The lower crest factor makes it
much more suitable waveform for audio testing.
The chirp waveform outputs a generator trigger once each cycle. Be sure to use generator
trigger as the analy zer trigger source when using the c hirp waveform with the FFT analyzer.
Log-sine Chirp*
The log-sine chirp waveform is designed to work in c ombination the dual-channel FFT analyzer to make
impulse respons e measurements. The log-sine chirp waveform is a sinusoid whose frequency is swept in
a logarithmic fashion over the frequency span of its ass ociated FFT analyz er. The log-sine chirp
waveform has a "pink" frequency roll off of 3 dB/oct.
The log-sine chirp waveform is synchroniz ed to the settings of a particular FFT analyzer. If the resolution
or frequency s pan of that analyzer changes, the log-sine chirp waveform automatically reconfigures to
Page 53

SR1 Operation 53
© 2014 Stanford Research Systems
sweep over the frequency span of the selected analyzer. Because of the synchronous nature of the c hirp
signal, a uniform window should be selected in the analyzer when using the log-sine chirp waveform.
Selec tion of the associated FFT Analyz er is done with the Chirp Source control.
Chirp Source Associated Analyzer
A0: FFT1 Analyzer 0, Single Channel FFT Analyzer
A0: FFT2 Analyzer 0, Dual Channel FFT Analy zer
A1: FFT0 Analyzer 1, Single Channel FFT Analyzer
A1: FFT1 Analyzer 1, Dual Channel FFT Analy zer
If the analyz er span is set to frequencies which are unreachable with the current generator sampling the
"Compliance" led will glow red and no waveform will be output.
Be sure to select the "Uniform" window when using the log-sine c hirp. W indow functions
attenuate the beginning and the end of the time record which means that some frequencies will
be attenuated more than others by the window.
The advantages using log-sine chirps for impulse response measurements are detailed by Miller and
Massarini ("Transfer Function Meas urements with Sweeps", J. Audio Eng. Soc., vol. 49, pp. 443-471,
June 2001.) They report better results us ing log-sine stimulus compared to MLS s timulus for a wide
range of audio DUTs. One particular advantage concerns the unique ability of the log-sine chirp to
differentiate between the linear and non-linear portions of the DUT response. Because of the properties of
the group delay of the log-sine chirp waveform, harmonic responses appear offs et in time relative to the
linear response. This can be clearly s een in this impulse response measurement of a consumer stereo
amplifier:
When t he purely linear response is gated and transformed bac k into the frequency domain a much better
measurement of the DUT frequency response is obtained. (This is detailed in the FFT2 analyzer
discuss ion. See "Meas urement of audio equipment with log-swept sine chirps", by Thomas Kite,
Presented at the 117th AES Convention, San Francisco, CA, October 2004 for a concise explanation of
the unique group-delay properties of the log-sine chirp.)
The log-sine chirp waveform outputs a generator trigger at the beginning of each FFT time
record. Be sure to use generator trigger as the analyzer trigger source when using the logsine chirp waveform with the FFT analyzer.
Page 54

SR1 Operation Manual54
© 2014 Stanford Research Systems
MultiTone*
Like FFT Chirp, the MultiTone Waveform is a special waveform containing a series of tones that are
generated in s ynchronous fashion to ensure bin-center plac ement in the MultiTone Analyzer
. Using the
MultiTone generator and analyz er many different characteristics of a device—nois e, distortion, frequency
response, can be measured quic kly and simultaneous ly without the need for multiple swept
measurements.
All of the details of the multitone waveform— tone frequency and amplitude, phase, etc . are configured
using the MultiTone Configuration Panel
. As a result, only the amplitude is specified on the waveform
tab. The Export button allows t he current multitone waveform to be saved in arbitrary waveform format for
off-line analys is. Because of the special properties of the MultiTone waveform it may not be combined
with other waveforms. The Multitone waveform cannot be selected from the analog generator panel
unless the MultiTone configuration panel specifies the use of the analog generator.
The MultiTone waveform outputs a generator trigger once eac h cycle. When performing
multitone analysis with the local SR1 generator be sure to use generator trigger as the
analyzer trigger s ource to ensure proper phase calibration.
IMD Waveform*
IMD Tab for SMPTE/DIN
And for CCIF
The IMD Waveform can be configured to output the three classic audio IMD tes t signals— SMPTE,
CCIF, and DIM.
Page 55

SR1 Operation 55
© 2014 Stanford Research Systems
IMD Type
SMPTE/DIN Combines a High Frequency Sinewave with a low frequency sinewave. For a generator Fs
of 512 kHz t he low frequency can be set between 10 Hz and 1 k Hz. The High Frequency
can be anywhere down to 5x the low frequency. The Amplitude Ratio (low freq/high freq)
can be set to either 1:1 or 4:1 with the Amplitude Ratio control.
CCIF/DFD Two sines centered around the Center Frequency separated in frequency by the IM
frequency. The amplitude ratio is fixed at 1: 1.
DIM B Outputs a ~14 kHz sinewave and ~2.96
kHz squarewave. Squarewave is filtered
with a s ingle pole 30 k Hz filter.
For all the DIM options the ratio of the
squarewave to sinewave peak-to-peak
amplitudes is 4:1. Because the s quarewave
needs to be "perfect" frequency, with an
exactly equal number of positive and negative
samples, the exac t squarewave frequency is
chosen by the generator, depending on t he
generator Fs, to be as close as possible to the
squarewave frequenc y given by the standard.
The sinewave frequency is then s et in the same
ratio to the squarewave frequency as would be
for the signals in the standard.
DIM 30 Outputs a ~15 kHz sinewave and ~ 3.15
kHz squarewave. Squarewave is filtered
with a s ingle pole 30 k Hz filter.
DIM 100 Outputs a ~15 kHz sinewave and ~ 3.15
kHz squarewave. Squarewave is filtered
with a s ingle pole 100 k Hz filter.
IMD tab for DIM selection
In all cases the Total Amplitude control sets the c ombined amplitude of all signals .
The IMD waveform is designed to be used with the IMD analyzer. The analyzer automatically determines
the type of IMD signal is being generated and automat ically configures itself for the correct analysis. See
the IMD Analyzer
section for more details.
Polarity Check Waveform
Page 56

SR1 Operation Manual56
© 2014 Stanford Research Systems
The polarity check waveform uses a phased combination of two sine waves to produce a deliberately
asymmetric waveform that points "up". When this waveform is applied to a device under test it is easy to
see if the devic e properly maintains or inverts polarity by checking the output waveform us ing the time
record of the FFT Analyzer
. If the output waveform still points "up" the device maintains polarity. If the
waveform points "down" the device is inverting.
Polarity Wavefor m Non-Inve rted
...And Inverted
Constant (Offset)
The constant waveform simply adds a DC offs et to the output. The offset can be set anywhere over the
full positive and negative range of the generator output. Offset waveforms take up space in the
generator's D/A converter and reduce the resolution available to ot her waveforms. For the best distortion
and noise keep the offset as small as possible.
Page 57
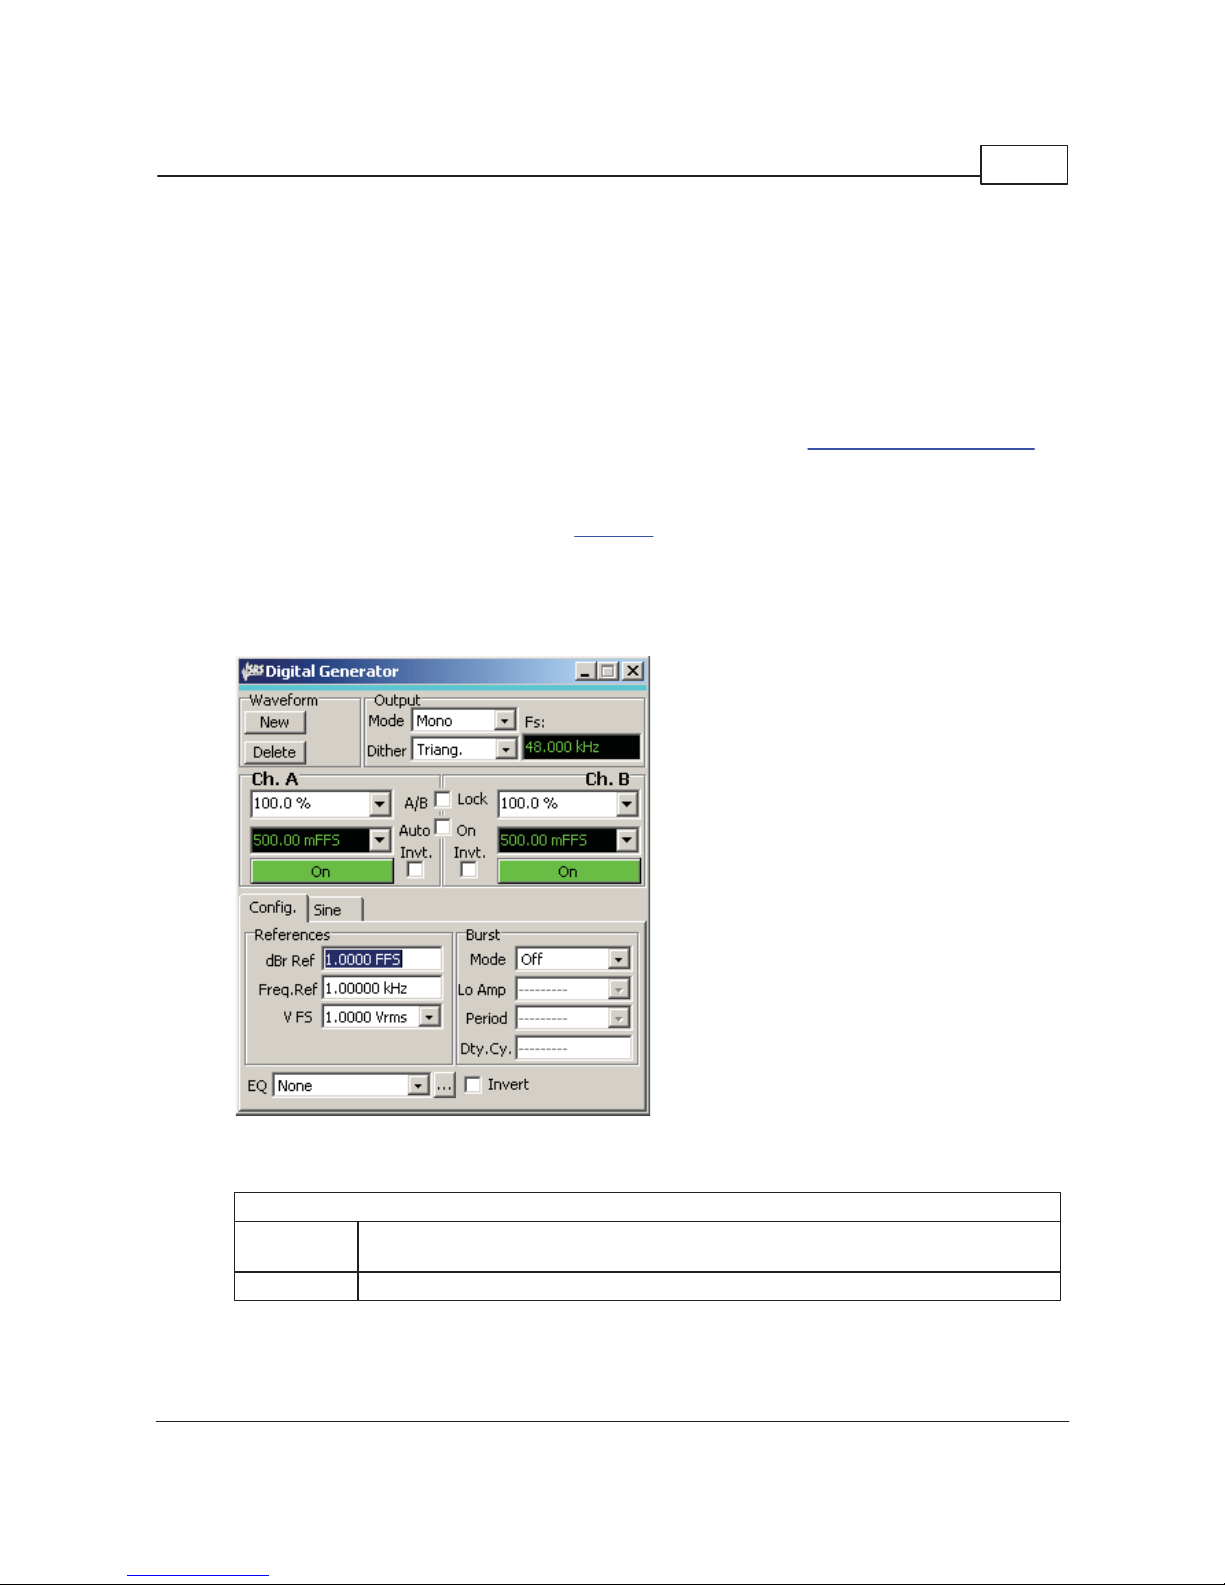
SR1 Operation 57
© 2014 Stanford Research Systems
2.3.2 Digital Generator Panel
The Digital Generator Panel controls the operation of SR1's digital audio generator. The generator can be
populated with many different waveforms— sines, square waves, ramps, etc. Many of the waveforms can
be combined by the generator. For instanc e, if the generator is populated with sinewave and noise, than
the output will be the sum of the sinewave and noise signals. The amplitudes of each component of the
composite signal are adjustable separately as is the overall amplitude of the combined signal. Some
waveforms, (USASI noise, for instance) are special-purpose test signals and may not be combined with
other waveforms.
The tabs corresponding to each particular waveform are described in the Digital Generator W aveforms
section. This sec tion des cribes the controls and settings of the digital generator that are relevant to all
waveforms.Note that the controls on the generator panel and the waveform tabs are mainly c oncerned
with the properties of the embedded digit al audio output— controls which govern the properties of the
digital audio carrier signal are found on the Digital I/O
panel.
The SR1 Digital Generator is separate and independent from the Analog Generator. The two generators
operate simultaneously and independently with different waveforms. The two generators, however, do
share memory used for arbitrary waveforms and FFT chirps. Deleting an arbitrary waveform in the analog
generator mak es memory available for the digital generator and vice versa.
Output Controls
Mode c ontrols the output mode of the Digital Generator.
Mono The same waveform is output to both the A and B channels. The amplitude of each
channel is still separately adjus table, but the waveform is the same.
Stereo Each channel can be configured with a different waveform.
Page 58

SR1 Operation Manual58
© 2014 Stanford Research Systems
Dither c ontrols the type of dither us ed by the Digital Generator. The digital generator generates the
waveform internally with higher precision than the maximum 24-bit digital output word. Noise with the
selected probability distribution is added to the internal representation, and the result is truncated to the
width s pecified in the Digital I/O Output Resolution control.
Off No dither is used in calculating the output word.
Triangular Dither with a triangular probability distribution and a width of ±1 lsb is added to the
signal.
Rectangular Dither with a rectangular probability distribution and a width of ±1/2 lsb is added to the
signal.
Fs displays the current generator output sampling rate. This value is c hosen on the Digit al I/O panel.
Waveform Controls
The New button displays the Waveform Selection Submenu.
The selected waveform will either be added to the output for one or both channels depending on the
Mode setting. Certain waveforms (for instance USASI Noise) cannot be combined with other waveforms.
When one of these waveforms is selected all of the current waveforms are deleted. Other waveforms
simply add t o the current output when selected. See the Digit al Audio Waveform
section for a detailed
description of all available waveforms.
The Delete button deletes the currently selected waveform.
The A/B selection buttons only appear when the generator Mode is set to Stereo. The buttons
determine which channel a newly added waveform will appear on. When the mode is c hanged to stereo,
any waveforms present will be assigned to channel A. When the mode is changed from stereo to mono,
all channel B waveforms are deleted and the channel A waveforms are output on both channels.
Page 59

SR1 Operation 59
© 2014 Stanford Research Systems
Amplitude Controls
The Channel Gain control varies modifies the total output amplitude for the channel from 0% to 1000%
of the sum of the waveform amplitudes for that channel. The Total Channel Amplitude control display s
that value. For instance, if the channel has 2 sine waveforms, one with an amplitude of .3 FFS, and the
second with an amplitude of .5 FFS, and if the Channel Gain control is set to 50% , then Total
Channel Amplitude will display .4 FFS. In general the A and B channels can have separate Channe l
Gains, however, if the A/B Lock checkbox is checked, the A and B values are always the same. Auto-
On affects the behavior of the generator output during a sweep
. If Auto-On is checked the generator
output will automatically turn on at the beginning of a sweep (if it was turned off) and turn off when the
sweep is completed.
The large green/red On/Off buttons turn on and off their respective channels, while the Invert buttons
invert the output for each channel.
Reference Controls
The Reference controls allow setting several parameters used in the computation of different generator
amplitude units. See the Digital Generator Units
section for a complete description of all these units.
Note that there is one set of references for both generator channels.
Burst Controls
The SR1 Digital Generator implements a Timed Burst mode which switches the overall amplitude of the
combined waveform output between two different values.
Burst Mode turns the burst feature on and off.
Lo Amp selects the lo burst amplitude as a fraction of the original generator amplitude.
Burst Pe riod controls the total hi+lo period of the burst cycle. This value may be entered in seconds or
in cycles of the current waveform.
Burst Duty Cycle c ontrols the fraction of the burst period during which the generator output is at the hi
amplitude.
Page 60

SR1 Operation Manual60
© 2014 Stanford Research Systems
Burs t Digital Noise, Period = 20 ms , Duty Cycle = 25%
Lo Amplitude = 10%
EQ Controls
Certain waveforms c an have their amplitudes s caled as a function of frequency according to the
information contained in an EQ File. EQ files are XML files which specifiy a relative frequency response
as a function of frequency by either interpolating a table of (frequency, respons e) pairs or by calculation
from a set of pole and zero locations. The structure of EQ Files is detailed in the File Reference
section.
Use the
button to open a file dialog to spec ify the EQ File. Check the Invert EQ box to have the
amplitude sc aled by the inverse of the EQ file respons e. W aveforms that are capable of being used with
EQ files will have an "EQ" checkbox in their waveform tab. This box must be checked for EQ to be active
regardless of whether an EQ file is selected in the file selection control. W hen an EQ file is selected and
the checkbox is checked the amplitude control in the waveform tab will continue to s how the constant
user-selected waveform amplitude, however, the Total Channel Amplitude control will display the
amplitude with the EQ response included.
2.3.2.1
Digital Generator Units
The amplitude and frequency of generator waveforms can be spec ified using a variet y of units all of which
are useful in different audio test scenarios. Because of the large number of waveforms that SR1 can
generate and because it's useful to define amplitude in a way that simplifies the coupling between the
details of the waveform and its amplitude, SR1 us es the following two conventions for digital generator
amplitudes:
1. Digital generator amplitudes , regardles s of the waveform or the units t hey are expressed in, refer to
the peak value of the waveform. W hen waveforms are combined in the generator, the amplitudes add
simply, regardless of the phase relation of the waveforms.
2. RMS and Peak-to-peak unit s always, regardless of waveform, have the same relation to peak units
that they do for a sine wave. In other words, think of rms and peak-to-peak units as s imply units with
a a fixed scale relative to peak units rather than as a quantity derived through a calc ulation on the
waveform.
The following table desc ribes t he units available for setting the amplitude of digital generator waveforms.
Page 61

SR1 Operation 61
© 2014 Stanford Research Systems
Unit Description
FFS According to AES17-1998 (r2004), "Full-scale amplitude is the amplitude of a 997 Hz
sinewave whose positive peak value reaches the positive digital full scale leaving the
negative maximum code unused." The FFS (Fraction Full Scale) unit expresses the peak
amplitude of any SR1 generator waveform relative to this definition of full-sc ale amplitude.
When dither is on, full scale amplitude is reduced s ymmetrically by 1 bit to allow for
dither. Small values of FFS may be expressed as mFFS (milli-FFS) or uFFS (microFFS).
%F S Same as FFS (above) but ex pressed as a percentage of full-scale amplitude. 50 %FS = .5
FFS.
Vrms This digital waveform amplitude unit is directly convertible to FFS depending on the value
of the V FS (Volts Full Scale) set in the references
section of the digital generator panel..
If the value of V FS is 2 Vrms, for instance, then an amplitude of 1 Vrms corresponds to
an amplitude of .5 FFS. These units allow digital amplitudes to be ex pressed as analog
voltages as is often useful when working with D/A converters where the V FS value can be
thought of as the DAC's full scale output volt age.
Vp This unit of digital wave form amplitude is convertible to FFS depending on the value of the
V FS (Volts Full Scale) reference
and the fixed relations hip of peak voltage to rms voltage
for a sinewave. If the value of V FS is 1 Vrms, for instance, then an amplitude of 1.414 Vp
would correspond to an amplitude of 1 Vrms which in turn would correspond to an
amplitude of 1 FFS.
Vpp This unit of digital wave form amplitude is convertible to FFS depending on the value of the
V FS (Volts Full Scale) reference
and the fixed relations hip of peak voltage to peak -topeak voltage for a sinewave. If the value of V FS is 1 Vrms , for instance, then an
amplitude of 2.0 Vpp would correspond to an amplitude of 1 Vrms which in turn would
correspond to an amplitude of 1 FFS.
dec The peak value of the waveform expressed as a decimal code. The convers ion of decimal
code to FFS depends on the setting of the Output Resolution in the Digital I/O
panel. For
the default 24-bit output resolution setting 1FFS = 2
23
-1 = 8,388,607 dec.
hex The peak value of the waveform expressed as a hexadec imal code. The conversion of
hexidecimal code to FFS depends on the set ting of the Output Resolution in the Digital I/
O panel. For the default 24-bit output resolution setting 1FFS = 223-1 = 0x 7fffff hex.
dBFS Decibels relative to the full scale amplitude definition. (See FFS above) For instance, 0.1
FFS = -20 dBFS. (20*log10(0.1))
dBV Decibels relative to the Vrms value calculated with the V FS (Volts Full Scale) reference
set in the digital generator panel. For example, with a V FS value of 2 Vrms an amplitude
of -20 dBVrms corresponds to .1 Vrms which in turn corresponds to an amplitude of 0.05
FFS.
dBu Decibels relative t o 0.7746 Vrms. (Hiistorically the value of 0.7746 Vrms represents the
voltage required to dissipate 1 mW in a 600
load.) If V FS is s et to 1 Vrms than an
amplidue of 0 dBu correesponds to 0.7746 which in turn corresponds to 0.7746 FFS.
dBr Decibels relative to the dBr reference set in the references section of the digital generator
panel. The dBr reference is always set in units of FFS. Thus, with the dBr reference set to
.5 FFS, an amplitude of 0 dBr corresponds to .5 FFS.
Bits Computed from dBFS using the relation bits = 1.76 + (dBFS/6.02). For instance, half
scale (-6.02 dBFS) is 0.76 bits.
Digital Generator Frequency Units
The following table desc ribes t he units used by SR1 in setting the frequency of analog generator
Page 62

SR1 Operation Manual62
© 2014 Stanford Research Systems
waveforms. All frequency units except Hz mak e use of the Frequency Reference which is set in the
References Box on the
Digital Generator Panel.
Unit
Description
Hz The fundamental unit of frequency. 1 Hz = 1 cycle-per-second.
F/R Ratio relative to the Frequency Reference. A value of 3 F/R with reference of 2 kHz gives a
waveform frequency of 6 kHz.
dHz Difference relative the Frequency Reference. A value of 500 dHz with a reference of 2 kHz
gives a waveform frequency of 2.5 kHz.
%F re f Percent of the Frequency Reference. A frequency value of 50 %Fref with a reference value
of 10 kHz gives a waveform frequency of 5 kHz.
cents A "cent" is a logarithmic unit which represents 1/100 of a semit one of the musical scale.
12 semitones make up an octave. Thus a cent is 1/1200 of an octave.
octaves An octave is a factor of 2 in frequency. Thus, a frequency value of 3 octaves with a
reference of 1 kHz gives a waveform frequency of 8 kHz.
decades An decade is a factor of 10 in frequency. Thus, a frequency value of 2 decades with a
reference of 2 kHz gives a waveform frequency of 200 kHz.
2.3.2.2 Digita l Ge ne ra tor W aveforms
SR1's Digital Generator is capable of generating an enormous variety of different audio waveforms, from
simple sines to complex synchronous multitone waveforms . Because of it s unique architec ture which
allows different waveforms to be combined the generator offers almos t limitless flexibility in providing the
perfect audio test output. In this section each waveform, t he building blocks of the generator output, will
be described in detail.
Sine Waveform Tab
When a waveform is added to the generator output using the Waveform Controls, the associated
waveform tab shows up on t he generator panel. For inst ance, the Sine Waveform tab is shown above. If
the Generator is in t he stereo output mode (separate waveforms for each channel) the tab title contains a
channel designator indicating which channel the waveform is associated with. If the generator is in mono
output mode, the channel designator is omitted and the title contains jus t the name of the waveform.
Some of the controls found on the waveform tabs are common to many waveforms. These will be
described first to avoid repetition.
Controls Common to Most Waveforms
The Waveform On c heckbox turns the selected waveform on and off. When the generator is outputting
Page 63

SR1 Operation 63
© 2014 Stanford Research Systems
a combined waveform this checkbox allows the selected waveform to be toggled on and off while still
outputting the remainder of the waveforms.
The EQ checkbox appears for only certain waveforms. If EQ is check ed, and an EQ file is selected on
the generator panel, the actual generated amplitude for the waveform will be the nominal amplitude
multiplied by the frequency response of the EQ file at the current frequency.
The Waveform Amplitude control sets the peak amplitude of most waveforms in one of the digital
generator amplitude units. Becaus e generator amplitudes refer to peak waveform values, amplitudes
cannot exceed 1 FFS regardles s of waveform.
The Waveform Frequency control sets the frequency of many waveforms in one of the digital generator
frequency units. Digital generator frequencies range from 10 Hz up to Fs/2 where Fs is the current digital
output sampling rate (OSR). The current OSR is display ed at the top of the digital generator panel.
Generator Trigger
Certain generator waveforms c an generate a trigger, known as a "generator trigger" whic h can be used
by the analyzers to synchronize the analyzer to a certain portion of the waveform. Triggering is a
complex subject (which is fully described in the Analyzers
section), and there are many different
possible analy zer trigger sources besides generator trigger. In this sec tion the discuss ion of triggering
will be limited to those waveforms which provide generator triggers, and where in those waveform is t he
trigger occurs. When the generator is configured with multiple waveforms , the first waveform which is
generator-trigger capable will be the source of all generator triggers.
The Digital Generator Waveforms
In the following list, waveforms that may not be combined with other waveforms are marked with an
asterisk (*) next to their names.
Sine
The sine wave is the most basic audio test waveform. Sine waveforms are specified only by their
amplitude and frequency. The Normal Sine waveform may be combined with other waveforms.
Page 64

SR1 Operation Manual64
© 2014 Stanford Research Systems
Phased Sines*
The phased sine waveform cons ists of two s ines, one on channel A and one on Channel B with a
specified phase differenc e between them. This waveform may not be combined with other waveforms.
Phases may be entered in any 360º interval (for instance 0º to 360º or -180º to 180º) specified on the
Preferences Panel
.
Noise
The noise waveform outputs random nois e with an almost-gaussian amplitude probability density
function with several options. (A true gaussian probability density function has finite probability for any
amplitude, no matter how large, which is impractical for a physical device.)
Amplitude c ontrols , as with all SR1 waveforms, the peak value of the noise out put. The crest factor of
the nois e waveform, i.e. the ratio of the peak value to the rms value of the nois e, is approximately 4.
The Repeat checkbox governs the repetition interval of the generated nois e. If not checked the repeat
interval is sufficiently long that it won't observable under mos t conditions . If, however, it is desired for the
noise to repeat after a fixed interval check the Repeat box and enter the Repeat interval below it.If
Repeat is selected, the noise waveform produces a generator trigger each time a waveform repeat is
initiated.
The Pink checkbox specifies that the noise output should be filtered by a 3 dB/octave "pink ing" filter.
While the power contained in a whit e noise signal is linearly proportional to the measurement bandwidth,
pink noise will have equal power in equal logarithmic frequency intervals, e.g. the power contained in the
100 Hz to 200 Hz interval will be the same as the power contained in the 10 k Hz to 20 kHz interval.
White or Pink noise can be further filtered according to the c ontrols in the filter group.
Noise Filter
None White or Pink noise is directly output without further filtering.
Lowpa ss The white or pink noise is filtered with a 4th order Butterworth lowpass filt er at the
frequency s pecified in the filter frequency control.
Page 65

SR1 Operation 65
© 2014 Stanford Research Systems
Highpass The white or pink noise is filtered with a 4th order Butterworth hipass filter at the
frequency s pecified in the filter frequency control.
1/3 Octa ve The white or pink noise is filtered wit h a 4th order 1/3 oc tave bandwidth Butterworth
bandpass filter at the frequency specified in the filter frequency c ontrol.
MLS Noise*
The MLS noise waveform output s a Maximum Length Sequenc e with a specified repetition interval and
frequency profile. MLS waveforms are typic ally used as a stimulus in impuls e response measurements
where several special properties of the MLS (the autocorrelation of an MLS sequence is a delt a function)
simplify the calc ulation of the impulse response. Because SR1 uses a full 2-channel FFT analyzer to
make impulse response measurements it is not necessary to use MLS noise as a stimulus— any
broadband signal will work. Nevertheless SR1 includes the MLS waveform because of its his toric al
association with impulse response measurements.
Amplitude c ontrols , as with all SR1 waveforms, the peak value of the noise out put. The crest factor of
the MLS waveform, which is essentially a square wave, is close to 1.
The Length selection controls the length of the MLS sequence. Selecting "13," for example, chooses an
MLS s equence whose repetition interval is 2
13
-1 samples.
The Pink checkbox specifies that the noise output should be filtered by a 3 dB/octave "pink ing" filter.
While the power contained in a whit e noise signal is linearly proportional to the measurement bandwidth,
pink noise will have equal power in equal logarithmic frequency intervals, e.g. the power contained in the
100 Hz to 200 Hz interval will be the same as the power contained in the 10 k Hz to 20 kHz interval.
USASI Noise*
USASI noise is a special type of filtered noise designed to mimic the content of audio program material.
USASI noise is typically used in testing broadcast transmitters to measure compliance with
transmission bandwidth requirements . Because the frequency c ontent of USASI noise is fixed, only an
Page 66

SR1 Operation Manual66
© 2014 Stanford Research Systems
amplitude control appears on the waveform tab. USASI noise may be used in conjunction with generator
bursting
to generate a burst USASI signal suit able for transmitter testing.
Freque ncy Spe ctrum of USASI Noise : 100 Hz 6dB/oct hipas s + 320 Hz 6 dB/oct lopass
Square Wave
Perfect digital square waves (equal integer numbers of up and down samples) are possible only for a
limited number of frequencies for each digit al OSR. If Precision Frequencies is chec ked, square wave
frequencies will be limited to these "perfect" frequencies. If Precis ion Frequencies is unchec ked, the
digital generator will interpolate a square wave at any frequency with significantly less fidelity t o an ideal
square wave.
Ramp
The ramp waveform cons ists of repetitive runs of integer numbers of "rising" and "falling" samples to
produce triangle-like output waveforms. Because the runs are restricted to integer number of samples,
the Ramp Frequency and Ramp Fractional Rise Time have limited resolution which is a function of the
selected generator sample rate. The lowest amplitude sample has the value assigned in the Low
Page 67

SR1 Operation 67
© 2014 Stanford Research Systems
Amplitude c ontrol. The highest amplitude s ample has the value given in the High Amplitude c ontrol.
The ramp waveform generates a generator trigger each time the ramp begins its rising
segment.
Arbitrary Waveform
The arbitrary waveform plays a sequence of values found in a user supplied table. Arbitrary waveform files
are simple ASCII files with one or more columns of floating point numbers representing t he values of the
arbitrary waveform at each sampling interval.. Use t he
button to open a file dialog to select an
arbitrary waveform file. If multiple columns are detected in file, SR1 displays a dialog asking which
column to load. The number of table points read from the table is then displayed in the corresponding
control.
The amplitude entered in the Arb amplitude control is assigned t o the max imum value found in the table.
The absolute s caling of the table values does not affec t the output waveform. However, when operating at
arbitrary output rates the SR1 interpolates t he user supplied table and normalizes to the peak
interpolated value thereby insuring that the peak amplitude remains constant at different output rates.
Thus the following table of values in the file:
0, 0.1, 0.2, 0.3, 0.4, 0.5,
produces a linear ramp from 0 to 0.2 FFS if the amplitude control is set to 0.2 FFS.
The Output Rate control governs how fast table points are output. At 100% the output rate is 1 table
point per output sample. At 200% the generator outputs every other table point each output sample. For
fractional output rates the waveform is interpolated. So at 50% Output Rate the generator outputs a table
point, then and interpolated point and then the next table point.
The arbitrary waveform generates a generator trigger each time the output returns to the
beginning of the t able.
Page 68

SR1 Operation Manual68
© 2014 Stanford Research Systems
FFT Chirp
The FFT Chirp waveform is designed to work in combination with one of SR1's FFT Analyzers. The c hirp
waveform provides a tone ex actly at the bin c enter of each the FFT Analyzer's analysis bins. In the
default case, each tone has equal amplitude, however, the Chirp waveform can be us ed with generator
EQ to generate chirp signals with custom tailored frequency response.
Chirp signals are useful for quickly measuring the frequency response of a device under test . Unlike
noise signals which are not deterministic and require long averaging times to measure frequency
response, a chirp signal can precisely measure frequency response in a single FFT record.
The Chirp waveform is sync hronized to the settings of a partic ular FFT analyzer. If the resolution or
frequency s pan of that analyzer changes, the chirp waveform automatically reconfigures to provide a full
set of bin-center tones. If t he corresponding analyz er is set to "show aliased lines
" the chirp outputs a
tone in every single FFT bin, from near DC to Fs/2. If "show aliased lines " is off, the chirp outputs tones
from near DC up to the alias limit for the analyzer's selected converter and frequency span. See the FFT
Analy zer section for more details on these topics. Becaus e of the sy nchronous nature of the chirp
signal, a uniform window should be selected in the analyzer when using the chirp waveform.
Selec tion of the associated FFT Analyz er is done with the Chirp Source control.
Chirp Source
Associated Analyzer
A0: FFT1 Analy zer 0, Single Channel FFT Analyz er
A0: FFT2 Analy zer 0, Dual Channel FFT Analyzer
A1: FFT0 Analy zer 1, Single Channel FFT Analyz er
A1: FFT1 Analy zer 1, Dual Channel FFT Analyzer
Synchronous chirp generation requires there to be a relationship between the selected generator
sampling frequency and the ass ociated analyzer sampling frequency. In general, the two frequencies
need to be eit her exactly the same or some integer multiple of one another. If the generator and analyzer
sampling frequencies are incompatible, the "Compliance" led will glow red and no waveform will be
output. The compliance led may also show red if SR1 runs out of table memory to create a long chirp
signal (say for a large number of FFT lines, or when large amounts of fft zoom are used. The chirp
waveform may attempt to use interpolation in situations when not enough memory is available for the
complete table, in which case the "Compliance" led will glow yellow. Some degradation of flatness c an
be expected in this c ase.
Using t he chirp signal it is possible to do cross domain measurements of both amplitude and phase. For
instance when testing a D/A converter a chirp can be output in the digital domain, and the D/A frequency
response and phase recorded in the analog domain. See t he SR1 Applications Manual for more
information. To ensure cross-domain sampling rate compatibility use the following sampling rate
selections for the generator and analyzer.
Page 69

SR1 Operation 69
© 2014 Stanford Research Systems
Type of Mea surement Generator Fs Analyzer Fs
Analog Source,
Digital Measurement
(ADC)
Selec t Digital ISR as the analog
generator Fs.
Selec t Digital as the Analyzer s ource
which aut omatically choos es ISR as
the analy zer Fs.
Digital Source, Analog
Measurement (D/A)
Selec t the desired digital audio
output frequency using the Digital
I/O panel.
Selec t the Analog Hi-Res converter on
the analy zer panel and set the Hi-Res
converter Fs to Digital OSR using the
Analog Inputs panel.
The chirp waveform generates a generator trigger once each cycle. Be sure to use the
generator trigger as the analyzer trigger source when using FFT chirp.
Log-sine Chirp
The log-sine chirp waveform is designed to work in c ombination the dual-channel FFT analyzer to make
impulse respons e measurements. The log-sine chirp waveform is a sinusoid whose frequency is swept in
a logarithmic fashion over the frequency span of its ass ociated FFT analyz er. The log-sine chirp
waveform has a "pink" frequency roll off of 3 dB/oct.
The log-sine chirp waveform is synchroniz ed to the settings of a particular FFT analyzer. If the resolution
or frequency s pan of that analyzer changes, the log-sine chirp waveform automatically reconfigures to
sweep over the frequency span of the selected analyzer. Because of the synchronous nature of the c hirp
signal, a uniform window should be selected in the analyzer when using the log-sine chirp waveform.
Selec tion of the associated FFT Analyz er is done with the Chirp Source control.
Chirp Source Associated Analyzer
A0: FFT1 Analyzer 0, Single Channel FFT Analyzer
A0: FFT2 Analyzer 0, Dual Channel FFT Analy zer
A1: FFT0 Analyzer 1, Single Channel FFT Analyzer
A1: FFT1 Analyzer 1, Dual Channel FFT Analy zer
If the analyz er span is set to frequencies which are unreachable with the current generator sampling the
"Compliance" led will glow red and no waveform will be output.
Page 70

SR1 Operation Manual70
© 2014 Stanford Research Systems
Be sure to select the "Uniform" window when using the log-sine c hirp. W indow functions
attenuate the beginning and the end of the time record which means that some frequencies will
be attenuated more than others by the window.
The advantages using log-sine chirps for impulse response measurements are detailed by Miller and
Massarini ("Transfer Function Meas urements with Sweeps", J. Audio Eng. Soc., vol. 49, pp. 443-471,
June 2001.) They report better results us ing log-sine stimulus compared to MLS s timulus for a wide
range of audio DUTs. One particular advantage concerns the unique ability of the log-sine chirp to
differentiate between the linear and non-linear portions of the DUT response. Because of the properties of
the group delay of the log-sine chirp waveform, harmonic responses appear offs et in time relative to the
linear response. This can be clearly s een in this impulse response measurement of a consumer stereo
amplifier shown below:
When t he purely linear response is gated and transformed bac k into the frequency domain a much better
measurement of the DUT frequency response is obtained. (This is detailed in the FFT2 analyzer
discuss ion. See "Meas urement of audio equipment with log-swept sine chirps", by Thomas Kite,
Presented at the 117th AES Convention, San Francisco, CA, October 2004 for a concise explanation of
the unique group-delay properties of the log-sine chirp.)
The log-sine chirp waveform outputs a generator trigger at the beginning of each FFT time
record. Be sure to use generator trigger as the analyzer trigger source when using the logsine chirp waveform with the FFT analyzer.
MultiTone*
Like FFT Chirp, the MultiTone Waveform is a special waveform containing a series of tones that
generated in s ynchronous fashion to ensure bin-center plac ement in the MultiTone Analyzer
. Using the
MultiTone generator and analyz er many different characteristics of a device— e.g. noise, distortion,
frequency res ponse, cans be measured quic kly and simultaneously without the need for multiple swept
Page 71

SR1 Operation 71
© 2014 Stanford Research Systems
measurements.
All of the details of the multitone waveform— tone frequency and amplitude, phase, etc . are configured
using the MultiTone Configuration Panel
. As a result, only the amplitude is specified on the waveform
tab. The Export button allows t he current multitone waveform to be saved in arbitrary waveform format for
off-line analys is. Because of the special properties of the MultiTone waveform it may not be combined
with other waveforms.If the generator domain on the MultiTone configuration panel is not set as "Digital"
then the MultiTone waveform cannot be selected in the digital generator.
IMD Waveform*
IMD Tab for SMPTE/DIN
And for CCIF
The IMD Waveform can be configured to output the three classic audio IMD tes t signals— SMPTE,
CCIF, and DIM.
IMD Type
SMPTE/DIN Combines a High Frequency Sinewave with a low frequency sinewave. For a generator Fs
of 192 kHz t he low frequency can be set between 10 Hz and 1 k Hz. The High Frequency
can be anywhere down to 5x the low frequency. The Amplitude Ratio (low freq/high freq)
can be set to either 1:1 or 4:1 with the Amplitude Ratio control.
CCIF/DFD Outputs two sines centered around the Center Frequency separated in frequency by the
IM frequency. The amplitude ratio is fixed at 1: 1.
DIM Outputs a ~14 kHz s inewave and ~2.96
kHz squarewave. Squarewave is filtered
with a s ingle pole 30 k Hz filter.
For all the DIM options the ratio of the
squarewave to sinewave peak-to-peak
amplitudes is 4:1. Because the s quare needs
to be "perfect" frequency, with an exactly equal
number of positive and negative s amples, the
exact squarewave frequency is chosen by the
generator, depending on the generator Fs, to
be as close as possible to the squarewave
frequency s pecified by the s tandard.The
sinewave frequency is then set in the same
ratio to the square wave frequency as would be
for the signals in the standard.
Note that the DIM waveform cannot be
generated if the digital audio generator
bandwidth is sufficiently low. (OSR<~30 kHz)
Page 72

SR1 Operation Manual72
© 2014 Stanford Research Systems
IMD tab for DIM selection
In all cases the Total Amplitude control sets the c ombined amplitude of all signals .
The IMD waveform is designed to be used with the IMD analyzer. The analyzer automatically determines
the type of IMD signal is being generated and automat ically configures itself for the correct analysis. See
the IMD Analyzer
section for more details.
Polarity Check Waveform
The polarity check waveform uses a phased combination of two sine waves to produce a deliberately
asymmetric waveform that points "up". When this waveform is applied to a device under test it is easy to
see if the devic e properly maintains or inverts polarity by checking the output waveform us ing the time
record of the FFT Analyzer
. If the output waveform still points "up" the device maintains polarity. If the
waveform points "down" the device is inverting.
Polarity Wavefor m Non-Inve rted
...And Inverted
Page 73

SR1 Operation 73
© 2014 Stanford Research Systems
Special Digital Test Waveforms
SR1's digital audio generator includes several waveforms that are specific to the digital audio domain, i.e.
they have no analog c ounterparts. These waveforms generate specific bit patterns in the embedded
digital audio output signal. As such, they cannot be combined with other signals . Dither is not added to
the special digital test waveforms.
Digital Constant*
The digital c onstant outputs a fixed bit pattern to the audio data portion of each digital output sample.
The constant can be specified as a hex word, or in any of the standard digital generator amplitude units.
The polarity of the constant c an be controlled with the radio butt ons at the bottom of the panel.
Digital Count*
The Digital Count waveform implements a counter which operates between two user specified values.
The generator outputs each value for the number of samples specified in t he "Samples/ Point" control
before incrementing the value by one. When the final value has been output for "Samples/Point"
samples, the count er output resets to the initial value.
Rotate Bits
The Rotating Bits waveform output s a pattern composed of all zeros and a single "one" (if "Ones" is
selected), or all ones and a single "zero" (if "Zeros" is selec ted). The pattern is output for the number of
Page 74
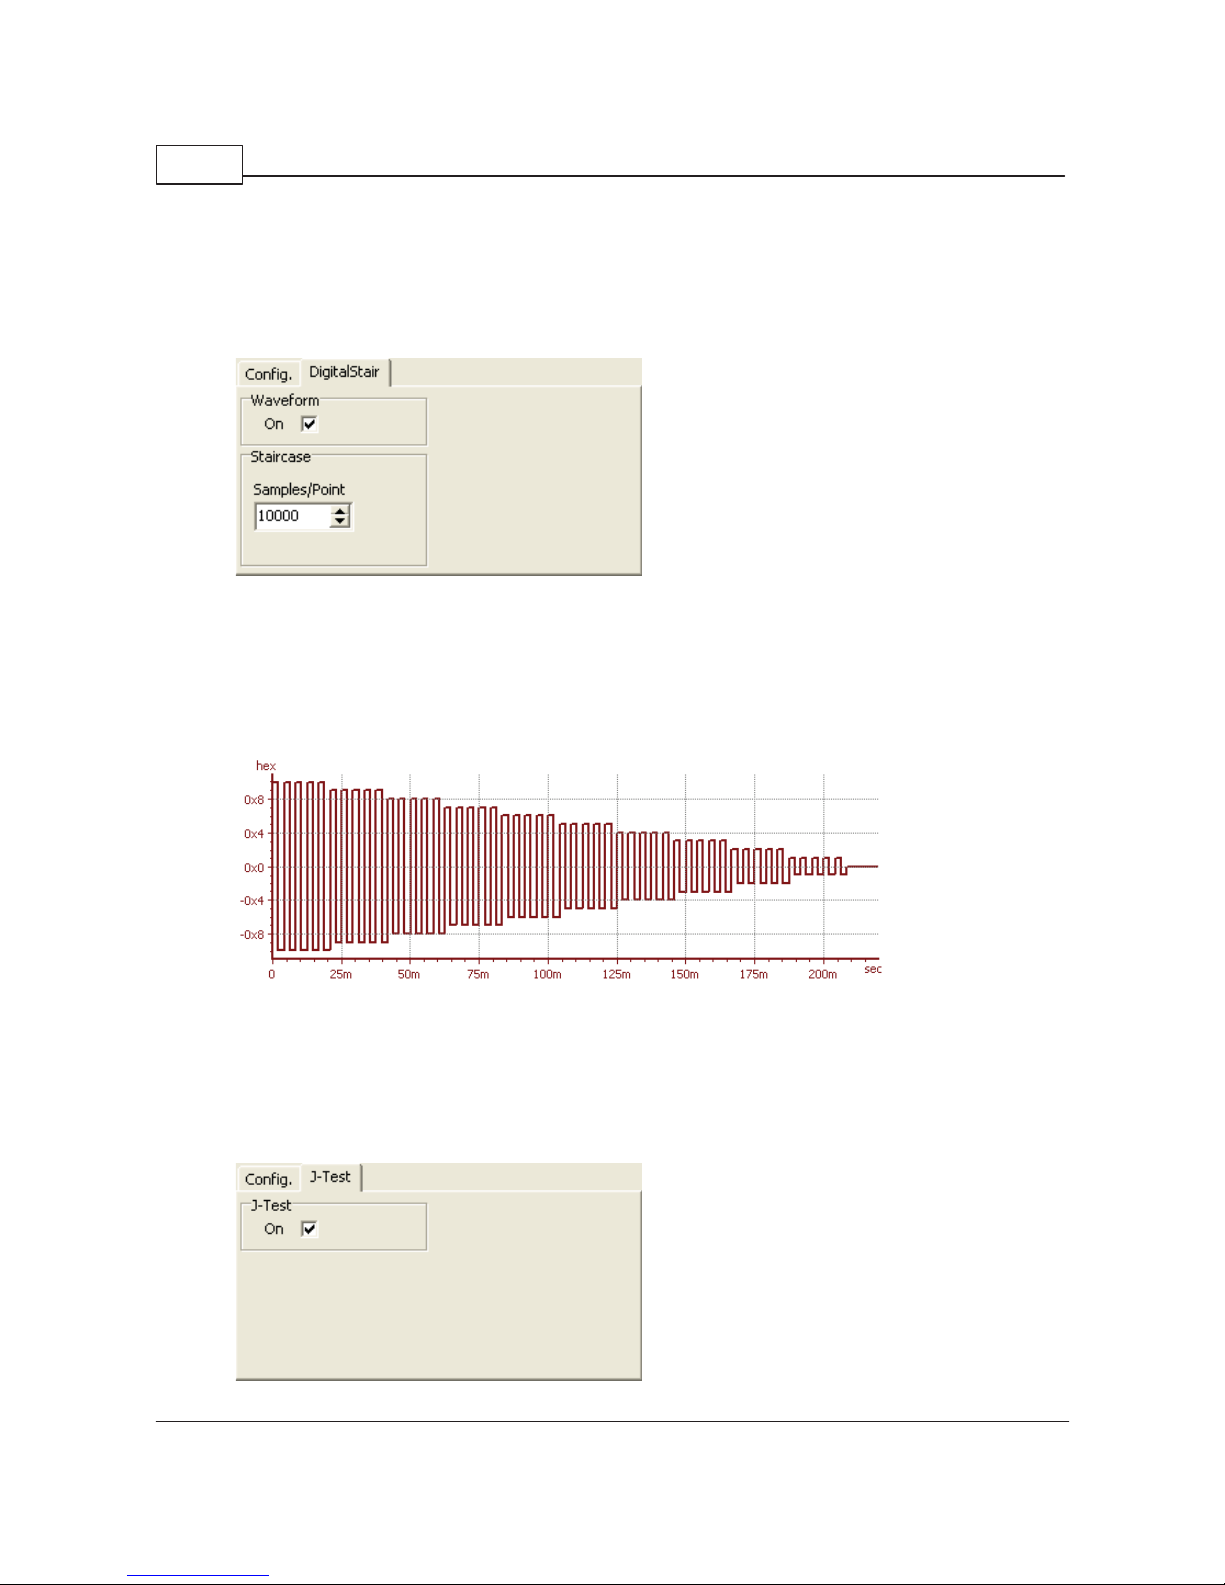
SR1 Operation Manual74
© 2014 Stanford Research Systems
samples specified in the "Dwell" control and the the pattern is shifted left by one bit. When the one/zero
is shifted out of the leftmos t bit of the digit al audio word it rotates back into the rightmos t bit of the word.
Using t he Rotating Bits generator and the Active Bits display on the Digital I/O panel is a s imple
method for detecting stuck or cross-linked bits in digital audio equipment.
Digital Staircase
The Digital Staircase waveform is a s pecial digital-only waveform which is useful for testing D/A
converters. The staircase waveform output s 5 complete square wave cycles of the ten smallest digital
codes in suc cession followed by an equivalent interval of digit al zero. The length of each half-cylce of a
square wave is equal to the digital audio sampling interval times the value of "Samples/Point" parameter
on the waveform panel. Thus, in the example below, each half cycle of the square wave is 100/48 kHz =
2.083 msec and therefore the time spent at each code is 5x 2x2.083 msec = 20.83 msec as can be
seen in the graph.
Digital Stair case , Fs=48kHz , Samples /Point = 100
When obs erving the digital st aircas e using the FFT time record, be s ure to enable the analyz er trigger
and set the trigger source to generator. This will ensure that the beginning of the time record is
synchroniz ed with the beginning of the staircase.
J-Test
Page 75

SR1 Operation 75
© 2014 Stanford Research Systems
The JTest waveform, conceived of by the lat e Julian Dunn, is designed to excite jitter due intersymbol
interference in digital audio signal paths with reduced bandwdiths, such as long c ables. The Jtest
waveform is primarily a square wave at OSR/4, but the dc level is slightly shifted every 192 samples. The
resulting jitter will occur at OSR/192 and can be seen with the Jitter Analyzer
, or the Digitizer.
Page 76

SR1 Operation Manual76
© 2014 Stanford Research Systems
2.3.3 Analog Inputs Panel
The analog inputs panel controls and monitors the configuration of SR1's XLR and BNC analog inputs.
The first tab on the panel, Analog Inputs, contains mos t of the c onfiguration controls. Note that Channel
A and Channel B analog inputs can be c onfigured separately. The Range box contains a checkbox to
enable autoranging of the corresponding input. In general, autoranging should be left on, however, for
certain low frequencies or slowly-varying input signals it can be useful to turn off autoranging and set the
range manually to avoid unnecessary range jumping. The Input Range control displays the current input
range when autoranging is on and allows entry of the range, in Vrms or dBVrms, when autoranging is off.
The smallest input range allowed by SR1 is 62.5 mVrms, the largest is 160 Vrms.
In the Input Configuration box is the control to s et the input connector:
Input Configuration: Connector
BNC Select the BNC connector for the corresponding channel. Do not apply balanced
inputs to the BNC connectors as the BNC outer conductor is connected to analyzer
ground.
XLR Select the XLR connector for the corresponding channel.The impedance control
allows the input impedance to be varied between 300
, 600 , and "Hi-Z" (~100 k
). It is poss ible to use unbalanced inputs with the XLR connectors.
Gen. Mon. The input is connected directly to the c orresponding c hannel of the Analog
Generator.
Digital Audio
Common Mode
This special s etting allows the analog input to look at the common mode signal
present at the balanced digital audio connector. The common mode signal can then
be measured or displayed. This c an be useful in diagnosing noise problems with
the digital audio input.
Page 77

SR1 Operation 77
© 2014 Stanford Research Systems
Input Configuration: Coupling
DC DC coupling of the analog inputs.
AC AC coupling of the analog inputs with ~1. 7 Hz corner frequency.
To the left of the controls for each channel is the visual level indicator for that channel. The blue led
glows when the input level is below approximately half-scale. The green led glows when the input level is
between half scale and full s cale, and the red led glows when the input exceeds full s cale. If the red led
glows c ontinuously then the signal either exceeds the input range of the instrument, or in the case of no
autoranging, the range needs to be manually adjusted. Note that the input level indicators are also
displayed at the bottom of SR1's main window so that they are vis ible even when the Analog Inputs
Panel is not displayed.
ChA ChB
| |
Analog Level Indicators
When a pot entially damaging high voltage is detec ted at the input SR1 automatically s witches the input
range to the largest possible value (160 Vrms) and removes any termination res istors selected by the
user in order to protect the ins trument. If this occurs, t he input voltage range will be shown in red as
shown below:
Remove the input and reset the range manually to restore normal operation.
Hi-Res Converter Sampling Rate Selection
The second tab of the Analog Input Panel contains a single c ontrol t o select the sampling rate of the HiResolut ion ADC. SR1's analyzers use two different high-quality audio ADC's— the 16-bit "highbandwidth" converter operating at a fixed sampling rate of 512 kHz, and the 24-bit "high-resolution"
converter which can operate at a variety of sampling rates
Analog Inputs: Hi-Resolution Converter Sampling Rate
128 kHz The converter runs at a fixed 128 kHz sampling rate.
64 kHz The converter runs at a fixed 64 kHz sampling rate.
Digital OSR The converter runs at the Digital Audio Output Sampling rate that is set in the
Digital I/O
panel.
Digital OS Rx2 The converter runs at twice the Digital Audio Output Sampling rate that is set in
the Digit al I/O
panel.
The last t wo settings are useful for making cross -domain measurements of D/A c onverters using FFT
Chirp or Multitone signals where the stimulus is generated in the digital domain but the measured signal
is in the analog domain. Using Digital OSR or Digital OSRx2 as the c onverter sample rate maintains
synchronic ity between the generator and the analy zer.
Page 78
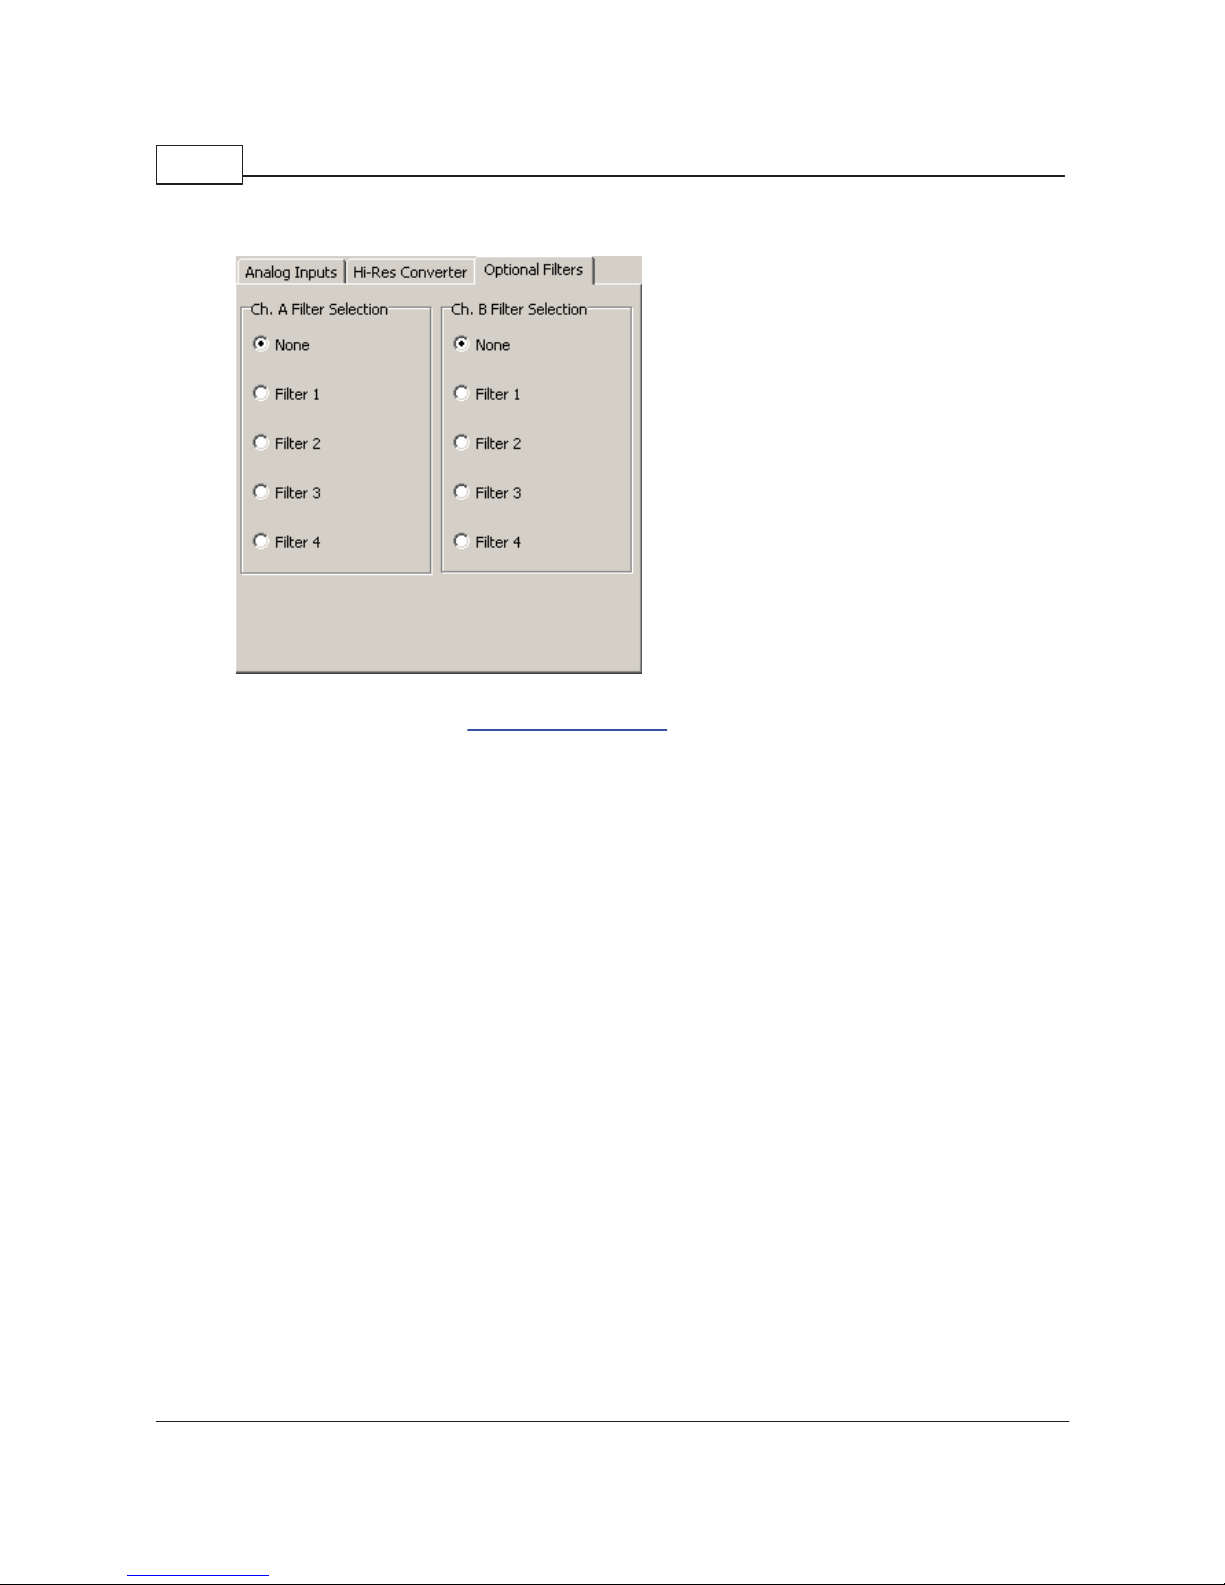
SR1 Operation Manual78
© 2014 Stanford Research Systems
Optional Input Filters
The final tab on the Analog Inputs Panel contains the selection controls for the Optional Filters on the
analog input boards. See the SR1 Hardware Reference
for details on the optional filters.
Page 79

SR1 Operation 79
© 2014 Stanford Research Systems
2.3.4 Digital I/O Panel
SR1's digital audio inputs and outputs work with both the AES/EBU and S/PDIF standards for digital
audio over a wide range of sampling rates from 24 kHz to 216 kHZ. SR1 also mak es a variety of digital
audio carrier measurement s including carrier amplitude, sampling freqency, and output-input delay.
Finally, to test susceptibility of devices to carrier degradation SR1 provides number of different types of
carrier impairments including jitter, common and normal mode interference, and variable rise times. All
these functions are controlled from the three tabs of the Digital I/O panel.
Output Configuration Controls
Selec t the output source as either BNC (Unbalanced) or XLR (balanced). Although the digital audio
signal is always output to both connec tors, the displayed amplitude is only calibrated for chos en
connector. Amplitude ranges from 2 mVpp to 2.55 Vpp can be select ed for the BNC outputs while
amplitudes from 10 mVpp to 10.2 Vpp are available for the XLR outputs. Output amplitudes are
calibrated only when the outputs are correctly terminated, i.e. 75
for unbalanced outputs and 110 for
balanced outputs.
Selecting Dual-Connector sets the digital audio output to dual-connector mode. In normal digital audio
data streams each frame contains a pair of samples , one left and one right. In dual-connector mode
each data stream outputs a set of succ essive samples for a single channel with an effective single
channel sampling rate of twice the frame rate. In dual-connector mode the left channel is output on C1
and the right channel on C2.
The Optica l indicator indicates whether the TOSLINK (Optical) output is active. The indicator glows
green
to indicate that the optical output is active and red to indicate that optical
output may not work correctly.
FS Invert controls the polarity of the of the rear-panel Frame Sync signal. This signal is normally high
during the first (left) s ubframe of each digital audio frame. Checking the box inverts this polarity.
Page 80

SR1 Operation Manual80
© 2014 Stanford Research Systems
Output Sample Rates can be chosen for single connector outputs between 24 kHz and 216 kHz. For
dual-connec tor outputs t he range is 54 k Hz to 216 kHz. Note that for dual connector outputs the chosen
sample rate is the effective sample rate of the two digital audio streams, not the physical frame rate for
each connector.
The pre-emphasis control is included for future expansion. In the current vers ion of SR1 pre-emphasis is
not implemented and is fixed at "None".
Output resolution can be set between 8 and 24 bits. The embedded digital audio signal is truncated to
the specified number of bits after any dither s elected in the Digital Generator
panel is applied.
Input Configuration Controls
Selec t the input connector from one of the following:
Digital Audio Input Connector
XLR Selects the balanced (XLR) connectors as the input source.
BNC Selects the unabalanced (BNC) connec tors as the input source.
Optical Selects the TOSLINK optic al connector as the input source.
GenMon The digital audio input is c onnected directly to the output of the digital generator.
The Dual-connector checkbox selects dual-connector input mode. In dual connec tor mode SR1 expects
two digital audio data streams (left on C1, right on C2) on the selected connectors (either XLR or BNC)
with eac h frame containing 2 suc cessive samples of the same channel. If the input is s et to GenMon
then the input dual-c onnector mode is slaved to the output dual-connector mode.
Checking the Square Wave box tells SR1 that the input signal is not an AES/EBU or consumer digital
audio signal but simply a square wave signal. When square wave is checked none of the analy sis
capabilities related to the embedded digital audio data stream or the channel status bits are active.
However, the amplitude and frequency of square wave signals is meas ured, and square wave signals can
be used as an input to the Digit izer or Jitter Analyzer for jitter analysis.
Checking Terminate terminates the XLR inputs with 110
and the BNC inputs with 75 .
Checking EQ inserts a high-pass equalization circuit into the signal path. EQ can be selected only with
XLR and BNC inputs. The frequenc y response of the EQ circuit is given in AES3-2003 in section 8.3.4.
Sugge s ted Eq Character istic for 48 kHz OSR
Page 81

SR1 Operation 81
© 2014 Stanford Research Systems
The purpose of equalizat ion is to reverse the lo-pass degradation of the digital audio carrier which results
from transmission over long cable runs:
Original Digital Audio Carrier
After Long Cable Run (Using SR1's CableSim)
Long Cable Run + Input EQ
Digital Input Sample Rate Controls
Selec t the Digital Audio Input Sampling Rate ISR used by all digital domain analyzers . The ISR
determines frequency range and resolution for all frequency domain analyzers with digital audio inputs.
Page 82

SR1 Operation Manual82
© 2014 Stanford Research Systems
Digital Audio Input Sampling Rate
GeneratorFsDigital Audio Input Sampling Rate (ISR) is set to the Digital Audio Out put Sampling Rate
(OSR)
MeasuredFsISR is set to the value measured by SR1.
Status Bits The s ample rate embedded in the digital audio channel s tatus is used as the ISR.
User
Refere nce
The ISR is set to a fixed user-entered value.
Digital Input Signal Controls
The embedded digital audio signal may be A C or DC coupled. AC coupling inserts a DC blocking filter
into t he signal path with a pole at ~4 Hz.
The Deemphasis control is included for future expansion and is not implemented in the current version
of SR1.
Input Resolution may be set between 8 and 24 bits . The input data is truncated to the selected value.
Digital Audio Status Panel
The Digital Audio Status Panel at the bottom indicates the current status of the received digital audio
signal. It consis ts of 6 indicators, eac h of which glows green when the corresponding status condition is
"good" and red when the status condition changes to "bad." The 6 status c onditions detec ted are:
Status
Condition
Meaning
CRC For AES/EBU digital audio streams an 8-bit CRC code is generated from the
received channel status bits in each block and compared to the value stored in the
last byte of the channel status bloc k. A red indic ator indicates a CRC mismatch.
Lock Green Indicates that the digital audio receiver is locked to an input data st ream. Red
indicates no lock.
Validity Red indicates that the validity bit has been set in one of the received sub-frames
Confidence This indic ator glows red when either the Unlock or Bi-phase error is detected.
Coding Bi-phase error. A valid digital audio signal remains at the same amplitude for no
longer than two Unit Intervals (UIs) (Ex cept during preambles). A red indicator
indicates that this c ondition has been violated.
Parity Eac h digital audio subframe contains a parity bit which summarizes the parity of the
remainder of the bits in the subframe. A red parity indic ator means that the received
parity bit does not match the parity computed in the remainder of the subframe.
Carrier Status Tab
Page 83

SR1 Operation 83
© 2014 Stanford Research Systems
Carrie r Level dis plays the measured peak-to-peak amplitude of the digital audio carrier. The displayed
value is only meaningful when the input connector is set to BNC or XLR— for optical or GenMon inputs
the dis play shows the amplitude of an internal signal.
Measured Fs displays the measured frame rate of the digital audio signal. For single connector digital
audio inputs this will be equal to the effec tive sampling rate of the digital audio dat a. For dual-connector
digital inputs this value will be half the effective sampling rate. When "Square W ave" is check ed on the
input c onfiguration panel, the frequency reported is simply t he measured frequency of the input s quare
wave.
Delay measures the delay spec ified by the Delay Mode control. W hen Delay Mode is set to DigOut>DigIn the Delay field displays the delay from the z -preamble (beginning of digital audio block) of the
digital audio output signal to the z-preamble of the digital audio input signal. When When Delay Mode is
set to RefOut->DigIn the Delay field display s the delay from the z-preamble of the rear-panel digital audio
reference output to the z-preamble of the digital audio input signal.Both thes e values can be used to
measure the transmission delay through a device depending on whether the rear-panel reference or the
main digital audio output is used as a source.
Status Bits Controls
The Channel Status But ton dis plays the Channel Status Panel.
The User Stat us Button displays the User Status Panel.
Highlight Differences controls how status bits are displayed on the User and Channel St atus panels
None No fields are highlighted.
Diff from Output Highlights received status fields that differ from the corresponding output s tatus
fields.
Diff from Other
Ch.
Highlights received s tatus fields that differ from the corresponding received status
field in the other channel.
Page 84

SR1 Operation Manual84
© 2014 Stanford Research Systems
Reserved In
Use
Highlights status fields marked "reserved" in the s tandard but which contain non-zero
values.
Data/Active Bits Display
The Data/Ac tive Bits indicator display s 2 rows of indicators, c orresponding to the 24 data bits of each
digital audio channel. The color of each indicator indicates the status of that bit over 1 digit al audio bloc k
(1 block contains 192 frames) . Red indic ates that the bit does not change value over one block. This
can be an indication that the bit is "stuc k." Dark Green indicates that the bit changes value over the
block. Bright green indicates that the bit is "on" in the first frame of the block.
Because the data/active bits display requires ex amination of the embedded digital audio signal,
it is only active if one of the active analyzers, A0 or A1, currently has digital audio selected as
its input. If none of the analy zer is currently look ing at digital audio, the indicator will be grayed
and inactive.
Output Impairment Tab
Invert inverts the polarity of the digital audio output carrier signals. Properly operating digital audio
equipment should be immune to an overall polarity inversion.
Page 85

SR1 Operation 85
© 2014 Stanford Research Systems
Invalid (A or B) sets the Validity bit (bit 28) in each corresponding subframe of the digital audio output
signal. The validity bit has no fixed meaning, but has been used to signal conditions inc luding non-audio
data, non linear-pcm data, overload, etc.
Cable Sim applies the cable s imulator circuit to the digital audio out put (BNC and XLR). The cable
simulator is a low-pass filter designed to mimic the signal degradation caused by approximately 1000m
of cable. See the discussion of EQ
for an illustration of the effect of the cable simulator.
Checking Common Mode Sine applies a sinewave to both pins 2 and 3 of the XLR outputs. The BNC
outputs are not affected. The sinewave is variable in frequency from 10 Hz to 100 kHz and in amplitude
from 0 Vpp to 20 Vpp. Such a signal is useful for testing the immunity of digit al audio equipment with
balanced inputs to common mode pickup.
Norm al Mode Noise can be applied to the XLR and BNR outputs. Normal mode nois e is white noise
with a bandwidth of approximat ely 20 MHz. For BNC outputs the noise is simply added to the output.
For XLR signals the signal is added as a "balanced" s ignal-- with positive polarity to pin 2(+) and with
negative polarity to pin 3 (-) . The maximum noise amplit ude is 640 mV for BNC outputs and 2.5 Vpp for
XLR outputs.
Rise/Fall Time varies the of the digital audio outputs (BNC and XLR). The risetime may be varied
between 5 ns, 10 ns, 20 ns, 30ns, and c ontinuously from 40 ns to 400 ns .
Jitter Controls
SR1 is capable of generating a wide variety of jitter waveforms, frequencies, and amplitudes. Jitter
represents the deviations of transitions in the digital audio c arrier signal from their ideal times. SR1 has
two main methods for viewing jitter. The Jitter Analyzer
uses a phased-loc k-loop to demodulate the jit ter
present in the digital audio input carrier and display it in both the time and frequency domains. The
Digitiz er
records a digitized version of the input carrier and uses mathematical techniques to extract the
jitter.
Note that it is easily possible to generate more jitter than can be tolerated at SR1's digital audio inputs.
The digital audio inputs will not lock if too much jitter is applied.
Jitte r W aveform
None The digital audio output is un-jittered.
Sine The digital audio carrier is modulated with sinusoidal jitt er with a frequency between
2 Hz and 200 kHz.
Square Wave
Jitte r
Applies squarewave jitter with frequencies between 2 Hz and 40 kHz.
Uniform Noise Applies white, gauss ian noise jitter.
Bandpass Noise Applies 1/3 Octave bandpass noise jitter at the selected frequency.
Chirp The chirp is a special jitter source des igned to work with the frequency domain Jitter
Analy zer. The chirp signal outputs an equal amount of power in each FFT bin of the
Jitter Analyzer, y ielding a " flat" jitter spectrum. When a device is placed between the
digital audio output and input t he jitter sus ceptibility at all frequencies c an be
simultaneous ly measured eliminating the need for time-consuming swept
measurements.
The maximum amplitude for all jitter waveforms is 13 UI. Note that all jitter amplitudes are set in peak
seconds or peak UIs. The UI is the smallest time scale on whic h the digital audio c arrier signal changes.
The length of a UI can be derived from the sampling frequency by the formula: UI = 1/(Fs * 128). The
number 128 can be arrived at by remembering that each digital audio frame contains 2 s ubframes (left
Page 86

SR1 Operation Manual86
© 2014 Stanford Research Systems
and right) each with 32 bits and that each bit represent s 2 UIs in biphase encoding (2*32*2 = 128).
Jitte r EQ. Sine and square jitter can be set to have a variable amplitude as a function of frequency by
specifying a Jit ter EQ file. EQ files are XML files which specifiy a relative frequency response as a
function of frequency by either interpolating a table of (frequency, response) pairs or by calculation from
a set of pole and zero locations. The structure of EQ Files is detailed in the File Reference
section. Use
the
button to open a file dialog to spec ify the EQ File. Although the jitter amplitude control will
continue to display the nominal amplitude value, the actual output jit ter amplitude will be the nominal
value multiplied by the EQ file response at the current sine or squarewave frequency .
Rea r Pa ne l Clock Jitter, if enabled, applies the currently selected jitter to the rear-panel Master Clock
Output. If disabled, the Master Clock outputs t he un-jittered digital audio bit-clock.
Page 87

SR1 Operation 87
© 2014 Stanford Research Systems
2.3.5 Channel Status Panel
The channel status panel displays received channel status information and controls the transmitted
channel status information. Channel s tatus information is organized according to either the AES/EBU
professional standard or the SPDIF consumer standard. SR1 relies on AES3-2003 and AES-2id-2006 for
the profess ional standard and IEC60958-3 as the source for the consumer standard.
Channel Status Panel (Consum er M ode)
Page 88

SR1 Operation Manual88
© 2014 Stanford Research Systems
Channel Status Panel (Professional Mode)
The channel status panel is divided into 3 main areas. On the upper left are the c ontrols governing the
transmitted status information.On the upper right are the displays indicating the received status
information for channels A and B. The bottom of the panel contains the hexadecimal representation of
each of the 23 t ransmitted and rec eived status bytes for both channel A and B.
Transmitted Status Bits
The top 3 radio buttons determine whether the remainder of the transmit stat us controls refer to channel
A, B, or both channels. The next control down determines whether the status bytes are trans mitted in
professional or consumer standards. The panel redraws its elf as shown above according to the selected
standard. Changes made to the transmit status controls are immediately reflected in the hexadecimal
status display along the bot tom of the panel. However, changes made to the hexadecimal transmit panel
are not reflected back in the s tatus controls. The status controls and the hexadecimal status panel
remain out of sync until the next time a stat us control is changed when transmitted status reverts to the
state reflect ed by the controls.
Professional Transmit Status Bits
For professional mode only , bytes 14 to 17 spec ify the local sample addres s code and bytes 18-21
specify the time-of-day sample address code. These 4 byte counter values can be specified and
additionally, if the "increment" checkbox to t he right of each entry is chec ked, SR1 will increment the
transmitted value by 1 each digital audio block .
The confidence flags are defined by the professional standard to indicate whether the information carried
by the channel status data is reliable. Like the "validity" flag, t heir sens e is reversed from the name, i.e.
setting the confidence flag to 1 indicates lack of confidence. The grouping of the 4 confidence flags is
Page 89

SR1 Operation 89
© 2014 Stanford Research Systems
mirrored on the professional receive panel by 4 indic ators which glow red if the corresponding flag is set
and green if it is not.
The profes sional standard defines byte 23 as a cyclic redundanc y check (CRC) charac ter. SR1 allows
several options for the trans mission of the CRC byte.
CRC controls the transmission of byte 23.
Static The same byte is transmitted with every digital audio block. The value of the byte is
whatever was being transmitted when the CRC mode was s et to satatic.
Correct The correc t CRC by te is s ent with each digital audio block.
Incorrect A changing, inc orrect CRC byte is sent with each digit al audio block.
Ze ro The CRC byte is set to zero.
Received Status Bits
The grouping of the received status dis play for both professional and consumer modes is shown above.
The topmost display shows the c urrent mode alongside an indicator which glows red if the validity flag for
that channel is set. In professional mode, CRC errors are not shown on the status panel but instead on
the Digital Audio St atus Panel
at the bottom of the Digital I/O panel. Received status bits can be
highlighted to call out differences between transmit and receive status or to indicate differences in
received status between the two channels. Highlighting is controlled from the Digital I/O
panel.
Differences are highlighted in yellow.
Page 90

SR1 Operation Manual90
© 2014 Stanford Research Systems
2.3.6 User Status Panel
The user status bits panel displays the transmitted and displayed user status bit s for both channels
grouped as 23 bytes.
Sinc e no universal standard for the formatting or meaning of the user status bits transmitted with digital
audio data, the status bits are presented as raw hexadecimal numbers. The "byte-number" (starting from
the beginning of the digital audio block) is given in red on the lowest line. Within eac h byte, the most
significant bit of the hexadecimal word corresponds to the user bit furthest from the start of the block .
Thus, setting the value in byte 1 to 80 sets user bit number 15 (out of 184 ) high. The top line of values
for each channel allows s etting of each trans mitted user bit. The bottom line of hex numbers indicates
the current values for each of the received user bits.
Received user bits can be highlighted in yellow when they differ from the corresponding transmit ted bit or
when they differ from the corresponding received bit on the other channel. The Highlight Differences
control on the 2nd tab of the Digit al I/O
panel controls highlighting in the user status panel and the
channel status panel.
Page 91

SR1 Operation 91
© 2014 Stanford Research Systems
2.3.7 Sweep Panel
Sweep Concepts
SR1 operates in two different modes, Free Run and Sweep. In Free Run mode the analyzers make
measurements continuously and update measurement results on displays and panels as each new
measurement is available. This is convenient way to use the instrument in a benchtop set ting while
debugging hardware or quick ly measuring the performance of a new device.
Sweep is a more structured operating mode suitable for formal, repetitive testing to standards. Sweeps
involve choosing a sweep source and sweep data. The sweep source defines the "X-axis" of the s weep
— it specifies a series of points at which SR1 will take measurements. There are four types of sweep
sources: time sweeps, in which measurements are made at specified time intervals , internal sweeps,
in which measurements are made at fixed values of some internal parameter, such as generator
frequency, external sweeps, where measurements are made at specified values of some externally
measured parameter, and finally switcher sweeps, where measurements are made over some set of
inputs and outputs switched by external hardware.
Configuring a sweep als o involves selecting the sweep data. Unlike free run mode, where all
measurements are continuously updated, in a sweep SR1 only computes the set of measurements
selected as sweep data. Additionally in a sweep, each sweep data measurement needs to settle before
the instrument will move to the next sweep point. A "settled" measurement is a measurement whose
variability has decreased below a user-configured threshold and is considered suitable for final results.
Each SR1 measurement can have completely different settling parameters, all configured on the Settling
Panel. Note that settling is never applied to measurements when SR1 is running in free run mode.
The Inner and Outer Sweep Axes
SR1 allows both one and two dimensional sweeps with a separate sweep source for each dimension.
The two sweep dimensions are referred to as the "outer" and "inner" sweeps. Both the inner and outer
sweeps may be s wept alone, with no sweep source s et for the other axes. When us ed together the inner
sweep is performed for each value of the outer sweep. This allows, for instance, a dist ortion s weep to be
made over both frequency and amplitude. Certain restrictions apply to the type of sweep source that can
be used for each s weep dimension. Switcher sweeps can only be us ed on the outer sweep axis, while
external sweeps can only be selec ted on the inner sweep axis.
Starting and Stopping Sweeps and Free Run
To start free run mode, pres s the free run start but ton, or the <Run> key on the keypad. While in
free run mode press the pause button, , whic h then changes to the resume button, , which
resumes free run measurements. (This is equivalent to using the <Pause> button on the keypad.)
To start a sweep, press the sweep start button, , or press the <Sweep> key on the keypad. During
the sweep, the pause/resume function is controlled by the
and but tons as it is for free run.
When t he sweep is complete, the sweep done indicator,
is display ed.
The current sweep/free run status is always shown at the bottom of the screen.
Page 92

SR1 Operation Manual92
© 2014 Stanford Research Systems
The Sweep Panel
Configuring the Sweep Source
Pressing the Source... button opens the Sweep Source Selection Window.
The different sweep sources are organized in a tree structure. Click on the appropriate source: Time,
Internal, External, or Switcher Channels to display the options relevant for that particular source.
Page 93

SR1 Operation 93
© 2014 Stanford Research Systems
Configuring Internal Sweeps
Internal sweeps are perhaps the most common type of sweep used in audio measurements. In an
internal sweep SR1 sweeps some internal parameter, for instance the analog generator sine frequency,
for a fixed number of points between two endpoint values. The progression of the sweep can be linear or
logarithmic. When the sweep source selection window is displayed, click ing on Internal displays the
major subsections of SR1 containing sweepable parameters.Only the currently active generator and
analyzer parameters are visible, so it's important to set up any generators and analyzers before
configuring t he sweep. Clicking on an individual parameter sets that parameter as the sweep source
Inte rnal Swe ep Contr ols
When a s ource parameter is s elected, the limits c ontrols will display the default limits for that
parameter. Any limits within the allowed range can be selected. When the sweep is started the s elected
source parameter will be set to the "Start" value and when the sweep is finished the source parameter
will have the "Stop" value. The "Stop" value can be greater or less than t he "Start" value, i.e. both
forwards and backwards sweeps are allowed. "# Steps" s ets the number of steps in the sweep (the
number of points in the s weep is t he number of steps+1 s ince the sweep always includes the st art and
end points ). W hen it is selected, the Step Size parameter will automatically adjust to a step which
covers the selected source parameter range in that number of steps. If "Log Step Siz e" is unchec ked,
then the sweep progression is linear— the source parameter is incremented by the Step Size after eac h
sweep point . If "Log St ep Siz e" is checked, the sweep progression is logarithmic and the sourc e
parameter is multiplied by the sweep increment after each s weep point. If the log or linear step size is
entered, the # Steps parameter will be adjusted to a value which covers the selected range with the
chosen sweep increment, up to a maximum number of 10,000 sweep points.
When an internal sweep is finis hed, the values of all swept parameters are returned to what they were
before the sweep was started.
Internal Table Sweeps
In addition t o setting the sweep limits and step size, the X-axis points for an internal sweep can be
explicitly s et using a Table Sweep. To setup a table sweep create an ASCII text file with the desired
sweep parameter values in one column. Then select the file using the file dialog box opened by the
button. When a table sweep is selected the Start/Stop values and the #S teps/Step Size entries are
ignored– the s weep simply proceeds from one table value t o the next until the table ends.
Configuring Time Sweeps
In a time s weep, the sweep x-axis is based on the pass age of time rather than the progression of some
parameter value. The start and stop time determine the time of the first and last measurements taken in
the sweep. The step s ize determines the amount of time between sweep points. If the amount of time
necessary to obtain settled sweep data exceeds the s tep size, SR1 can take two different actions
depending on whether the sweep source was chosen as "Intersample Delay" or "Absolute Time." If the
source is "Intersample Delay," SR1 always waits at least a step size after getting settled sweep data
before beginning a new measurement. If "Absolute Time" is chosen, the analyzer will begin a new
measurement immediately after finishing the previous meas urement if necessary. Note that in both
Page 94

SR1 Operation Manual94
© 2014 Stanford Research Systems
cases, the final number of points in the sweep may be less than "#Steps " if the amount of time
necessary to obtain settled data is significant.
Configuring External Sweeps
External sweeps allow SR1's measurement of an external parameter to determine the the sweep X-axis.
For instance, one may want to meas ure the characteristics of an external sweep generator not
controlled by SR1. When performing an external sweep, SR1 measures the frequency of the external
source and then determines when that frequency meets preset c riteria for starting the sweep, ending the
sweep, or beginning a new sweep point. When SR1 measures the external s weep source, it requires
that the reading be Settled. Refer to the Settling Panel
for information on the different types of settling
To configure an external sweep first make sure that the appropriate analyzers are active to make the
measurement on which the external sweep will be based. For instance to sweep based on a measured
amplitude the Time Domain Detector should be s elected. Now click on the "External" node in the sweep
source selec tion window. When the "External" branch of the s weep source tree is opened, the various
measurements that can be used as external sweep sourc es are dis played. Click on the desired
measurement.
The sweep source selection parameters are now displayed.
In an external sweep, the Start, Stop, and Spacing parameters can all be thought of as "des ired" values
rather than guaranteed values because SR1 has no control over the ex ternal s weep source. However,
Page 95

SR1 Operation 95
© 2014 Stanford Research Systems
SR1 monitors the swept measurement and attempts to make the act ual sweep X-axis correspond as
closely as possible to these values . The spacing of the st eps in an external sweep can either be
specified as a percentage ("Relative Value" checked) or as an absolute value ("Relative Value"
unchecked).
It can be us eful to condition the external sweep's search for a new sweep point on the value of another
measurement. For instance, if both the amplitude and frequency of the ext ernal sourc e varies there may
be no point in searching for a new frequency sweep-point if the amplitude is zero. SR1 handles this
situation by allowing the setting of a "Minimum Level" measurement. Click the Minimum Level "Meas..."
button to open a window allowing the selection of any SR1 measurement to act as a qualifier for external
sweeps. The analyzer will then need to obtain a settled value of the selected meas urement that is
greater than the specified minimum value before finding a new value of the actual sweep parameter.
The "External Settings " tab on the Sweep Panel contains a number of additional controls whic h govern
the starting and stopping of external s weeps.
The "Start Sweep At " parameter controls the starting of the ext ernal sweep.
Start Sweep At...
Within Tolerance The ex ternal s weep starts when a settled measurement of the sweep source is
within tolerance (±) of the "Start" value of the sweep.
Within Tolerance
or Beyond
The external s weep starts when a settled measurement of the sweep source is
within tolerance (±) of the "Start" value of the sweep, or greater than the "Start"
value.
First Se ttle d
Reading
The sweep starts at the first settled measurement of the sweep source regardless
of the relation of that value to the " Start" paramet er.
Once the external sweep is started SR1 monitors the sweep source for a settled measurement. The
value of the settled meas urement is compared to the last sweep point and if it exceeds the "Spacing"
value, a new point is declared. External s weeps are unidirectional. The direction is determined by the
relative values of the "Start" and "Stop" parameters. Only settled readings that exceed the spacing in the
direct ion of the sweep will result in a new sweep point.
The external s weep ends when...
Stop Sweep At...
Within Tolerance The ex ternal s weep ends after a settled measurement of the sweep source is within
toleranc e of the "Stop" value of the sweep
Return to Within
Tolerance
The external s weep stops when a settled measurement of the sweep source is
within tolerance (±) of the "Stop" value of the sweep, or greater than the "Stop"
value.
Page 96

SR1 Operation Manual96
© 2014 Stanford Research Systems
Configuring Switcher Sweeps
SR1 is designed t o work with the SR10, SR11, and SR12 Audio Switchers to allow users to switch both
outputs from and inputs to SR1 during a sweep to enable testing of multiple devices. Configuration of a
swit ch network, including identification of the physic al switch boxes and s pecification of communic ation
protocols, is performed on the Switc her Configuration Panel
. After configuring the details of the switcher
network each input and output is ass igned a logical channel number. For purposes of discussing the
swit cher sweep all we need to know is the range of logical c hannel numbers for both the inputs and
outputs; the details of the switcher network configuration will be left to the discussion of the Switcher
Configuration Panel.
Switcher sweeps can only be configured on the outer sweep axis. The typical meas urement
configuration will be to first sweep the input or output to a particular device (outer ax is) and then perform
the sweep which represents the actual measurement being performed on the inner axis. To select a
swit cher sweep double click on the "Switcher" node in the sweep source selection for the out er sweep
axis. This display s the switcher sweep source panel:
There are two tabs on the switcher sweep source panel, one for inputs and one for outputs. Inputs and
outputs can be swept simultaneously if the corresponding switcher hardware has been configured on
the Switc her Configuration Panel
. On each tab the network selection determines whether unbalanced
(BNC) or balanced (XLR) inputs or outputs will be swept. The number of steps determines how many
points will be taken. (The number of points is the number of steps plus one, i.e. a sweep of one step
contains two points, the initial and final ones.) On both the input and output tabs the chec kboxes for A
and B determine whether the A channel, B channel, or both will be swept. If the checkbox is checked
then the corresponding up-down control will be enabled allowing setting of the initial logical channel for
each channel. At each step in the sweep the logical channel c onnected to each check ed input or output
will be incremented by the amount specified by the "in steps of " control.
For example, consider the output s weep specified by the panel illustrated above. At each point in t he
sweep the logical channel connections to the A and B outputs will be:
Sweep Point
0 (Initial
State)
1 2 3 4
5 (Final
State)
A Logical
Channel
1 3 5 7 9 11
B Logical
Channel
2 4 6 8 10 12
This represents a typical stereo sweep of a single switcher with 12 channels. If a single c hannel sweep
were desired the "B" sweep could be unchecked and the channel inc rement reduced to one thereby
enabling up to 11 sweep steps on a single device. Adding more devices in the Switcher Configuration
Panel will increase the available range of logical channel numbers and increase the number of possible
steps in the sweep.
When t he "Bus" box is check ed (output switcher sweeps only), all the out put channels are
simultaneous ly connected to SR1's output except the one channel that is being sweep. This is useful for
testing crosstalk of multiple devic es.
Page 97

SR1 Operation 97
© 2014 Stanford Research Systems
Configuring Sweep Data
After a new sweep X-axis point is determined according to the selected Sweep Source, SR1 begins to
search for settled values of each of the s weep data measurements . Up to 6 measurements may be
selected for each sweep. To selec t the sweep data measurements, clic k on the numbered box in the
sweep data section of the sweep panel. This opens a tree dis play of all the available measurement
selections. Click on the measurement to add it to the sweep, or click on " None" to remove the current
measurement from the s weep. Only measurements from the currently active analyzers will be shown, so
it's important to set up the analyzers before configuring the sweep.
Other Sweep Parameters
"Pre-Sweep Delay" sets a fixed delay between the time when the sweep starts and the time when the
analyzer begins measruing the first data point. "Measurement Timeout" sets the maximum time that the
analyzer waits for settled measurements, if a settled measurement is not returned in this time interval
the analy zer skips that point and moves on. Checking "Rpt" (Repeat) causes the s weep to automatic ally
restart as s oon as it finishes the current sweep.
Sweeps and Events
SR1's Event panel allows a number of user-defined actions to be associated with the oc currence of
certain events. Actions include logging the occurrence to a text file, running a script, or triggering a COM
event. Sweeps define several such events: Sweep Start, Sweep New Point Start, Sweep New Point
Timeout, Sweep New Point Done, and Sweep Finished.
Page 98

SR1 Operation Manual98
© 2014 Stanford Research Systems
2.3.8 Settling Panel
While in sweep mode SR1 requires all measurements to "s ettle" before adding them to the s weep.
Settling insures that the variability for the measurement, whether intrinsic to the measurement or due to
transients arising from the s weep, is reduced to a predetermined level. Each measurement can have a
different settling profile, each characterized by a precision, number of points, profile, threshold, and
delay.
Precision
The precision parameter sets t he amplitude scale for what is considered a settled meas urement. If the
value of the most recent measurement is y, then another measurement is considered to be within
toleranc e if its value falls in t he range of y×(1 ± precision). Tightening the precision window increases
the precision of the final sweep data at the expense of having to pos sibly wait longer for a settled
measurement .The "correct" value of the precision depends on the measurement and application and
can usually only be determined by experimentation– the tight tolerance that might be appropriate for
measuring the flatnes s of a filter passband with sub-dB precision is probably too restrictive for broadband
noise measurements.
Profile
The settling profile, along with the value of nPoints, defines an algorithm whic h determines whether an
measurement is settled. Each of the settling profiles is des cribed below:
Settling Profile Description
None No settling is performed when this profile is selec ted. The most recent
measurement is always considered settled and added to the sweep
Exponential In exponential settling the mos t recent measurement point is compared with the
last nPoint s-1 previous measurements. For the measurement to be considered
"settled," the previous point must be within tolerance of the c urrent point. The 2nd-
Page 99

SR1 Operation 99
© 2014 Stanford Research Systems
previous point must be within twice the tolerance of of the current point, the 3rdprevious point within 3 times the tolerance, etc. This is the mos t "lenient" of the
settling profiles and reflects the fact that the variability of many measurements
decreases as a function of time after a trans ient c hange.
Flat The measurement is considered settled using the flat profile when the previous
nPoints measurements are all wit hin tolerance of the current measurement. This
is the "strictist" of all the settling profiles.
Sequential The measurement is considered settled if the c urrent meas urement is within
toleranc e of the previous point, the previous point is within the tolerance of the
next previous point, etc., for a total of nPoints.
Average The result of the last nPoints measurements are averaged together and the
average result is cons idered the s ettled value
Delay
The delay parameters sets the amount of time after the s weep source has changed t o a new value
before the analyzer begins to look for a settled measurement. If the sweep appears "glitchy" due to
transients from the moving sweep source, inc reasing the delay value can somet imes help to clean up
the sweep.
Threshold
At very low levels, the tolerance window y×(1 ± precision) becomes very small and it is possible that
some measurements will not settle. The threshold parameter sets a minimum value for the tolerance
window such that if y×tolerance<threshold, the tolerance window becomes y±threshold.
Page 100

SR1 Operation Manual100
© 2014 Stanford Research Systems
2.3.9 Monitors Panel
The Monitor Panel controls a number of functions related to SR1's speaker/headphone output and the
rear panel analyzer monit or outputs. Several different signals can be routed to the speaker/headphones.
Some of these sources a monophonic, and are sent to both channels of the headphones and to the
single speaker. Stereo sources are routed to both channels of the headphone output, and the left and
right c hannels are summed and s ent to the speak er. The volume of both the headphone and speaker
outputs is controlled from the front panel volume knob.
Headphone/Speaker Source (* indicates stereo source)
Analog Gen. A The speaker and both headphone channels are fed the current output of the analog
generator A c hannel.
Analog Gen. B The speaker and both headphone channels are fed the current output of the analog
generator B c hannel.
Analog Gen. A/B*The left and right headphone channels are fed the A and B channels of the analog
generator, the speaker is fed the summed A+B signal.
Analog Level A The speak er and both headphone channels are fed the s ignal input on the analog A
channel.
Analog Level B The speak er and both headphone channels are fed the s ignal input on the analog B
channel.
Analog Level A/B*The left and right headphone channels are fed the analog input A and B channels,
the speaker is fed the summed A+B signal.
Digital Le vel A The speaker and both headphone channels are fed the embedded digital audio input
signal channel A.
Digital Le vel B The speaker and both headphone channels are fed the embedded digital audio input
signal channel B.
Digital Le vel A/B*The left and right headphone channels are fed the A and B channels of the
embedded digital audio input signal, the speaker is fed the summed A+B signal.
 Loading...