

Page 1
System Event Log Troubleshooting
Guide for Intel® S5500/S3420 series
Server Boards
Intel order number G74211-001
Revision 1.0
August 2012
Enterprise Platforms and Services Division – Marketing
Page 2

Disclaimers System Event Log Troubleshooting Guide for Intel® S5500/S3420 series Server Boards
Disclaimers
Information in this document is provided in connection with Intel® products. No license, express or implied, by
estoppel or otherwise, to any intellectual property rights is granted by this document. Except as provided in Intel
Terms and Conditions of Sale for such products, Intel® assumes no liability whatsoever, and Intel® disclaims any
express or implied warranty, relating to sale and/or use of Intel® products including liability or warranties relating to
fitness for a particular purpose, merchantability, or infringement of any patent, copyright, or other intellectual property
right. Intel® products are not intended for use in medical, lifesaving, or life sustaining applications. Intel® may make
changes to specifications and product descriptions at any time, without notice.
Designers must not rely on the absence or characteristics of any features or instructions marked “reserved” or
“undefined.” Intel
incompatibilities arising from future changes to them.
This document contains information on products in the design phase of development. Do not finalize a design with
this information. Revised information will be published when the product is available. Verify with your local sales office
that you have the latest datasheet before finalizing a design.
The product may contain design defects or errors known as errata which may cause the product to deviate from the
published specifications. Current characterized errata are available on request.
This document and the software described in it are furnished under license and may only be used or copied in
accordance with the terms of the license. The information in this manual is furnished for informational use only, is
subject to change without notice, and should not be construed as a commitment by Intel Corporation. Intel
Corporation assumes no responsibility or liability for any errors or inaccuracies that may appear in this document or
any software that may be provided in association with this document.
Except as permitted by such license, no part of this document may be reproduced, stored in a retrieval system, or
transmitted in any form or by any means without the express written consent of Intel Corporation.
®
reserves these for future definition and shall have no responsibility whatsoever for conflicts or
®
’s
Intel, Pentium, Itanium, and Xeon are trademarks or registered trademarks of Intel Corporation.
*Other brands and names may be claimed as the property of others.
Copyright © Intel Corporation 2012. All rights reserved.
ii Intel order number G74211-001 Revision 1.0
Page 3

System Event Log Troubleshooting Guide for Intel® S5500/S3420 series Server Boards Revision History
Date
Revision
Number
Modifications
August 2012
1.0
Initial draft.
Revision History
Revision 1.0 Intel order number G74211-001 iii
Page 4

Table of Contents System Event Log Troubleshooting Guide for Intel® S5500/S3420 series Server Boards
Table of Contents
1. Introduction ........................................................................................................................ 1
1.1 Purpose .................................................................................................................. 1
1.2 Industry Standard ................................................................................................... 1
1.2.1 Intelligent Platform Management Interface (IPMI) ................................................... 1
1.2.2 Baseboard Management Controller (BMC) ............................................................. 2
1.2.3 Intel® Intelligent Power Node Manager version 1.5 ................................................. 3
2. Basic decoding of a SEL Record ....................................................................................... 4
2.1 Default values in the SEL records .......................................................................... 4
3. Sensor Cross Reference List ............................................................................................. 8
3.1 BMC owned Sensors (GID = 0020h) ...................................................................... 8
3.2 BIOS POST owned Sensors (GID = 0001h) ......................................................... 12
3.3 BIOS SMI owned Sensors (GID = 0033h) ............................................................ 12
3.4 Hot Swap Controller Firmware owned Sensors (GID = 00C0h/00C2h) ................. 14
3.5 Node Manager/ME Firmware owned Sensors (GID = 002Ch) .............................. 16
3.6 Microsoft* OS owned Events (GID = 0041) .......................................................... 17
3.7 Linux* Kernel Panic Events (GID = 0021) ............................................................. 18
4. Power Subsystems ........................................................................................................... 19
4.1 Voltage Sensors ................................................................................................... 19
4.2 Power Unit ........................................................................................................... 23
4.2.1 Power Unit Status Sensor .................................................................................... 23
4.2.2 Power Unit Redundancy Sensor........................................................................... 24
4.3 Power Supply ....................................................................................................... 25
4.3.1 Power Supply Status Sensors .............................................................................. 26
4.3.2 Power Supply AC Power Input Sensors ............................................................... 27
4.3.3 Power Supply Current Output % Sensors ............................................................. 28
4.3.4 Power Supply Temperature Sensors .................................................................... 29
5. Cooling subsystem .......................................................................................................... 31
5.1 Fan sensors ......................................................................................................... 31
5.1.1 Fan Speed Sensors.............................................................................................. 31
5.1.2 Fan Presence and Redundancy Sensors ............................................................. 32
5.2 Temperature Sensors ........................................................................................... 35
5.2.1 Regular Temperature sensors .............................................................................. 36
5.2.2 Thermal Margin Sensors ...................................................................................... 37
5.2.3 Processor Thermal Control % Sensors................................................................. 39
5.2.4 Discrete Thermal Sensors .................................................................................... 40
6. Processor subsystem ...................................................................................................... 42
6.1 Processor Status Sensor ...................................................................................... 42
6.2 Catastrophic Error Sensor .................................................................................... 44
6.2.1 Catastrophic Error Sensor– Next Steps ................................................................ 44
iv Intel order number G74211-001 Revision 1.0
Page 5

System Event Log Troubleshooting Guide for Intel® S5500/S3420 series Server Boards Table of Contents
6.3 CPU Missing Sensor ............................................................................................ 45
6.3.1 CPU Missing Sensor – Next Steps ....................................................................... 45
6.4 QuickPath Interconnect Error Sensors ................................................................. 45
6.4.1 QPI Correctable Error Sensor .............................................................................. 46
6.4.2 QPI Non-Fatal Error Sensor ................................................................................. 47
6.4.3 QPI Fatal and Fatal #2 ......................................................................................... 48
7. Memory subsystem ................................................................................................ .......... 50
7.1 Memory RAS Mirroring and Sparing ..................................................................... 50
7.1.1 Mirroring Configuration Status .............................................................................. 50
7.1.2 Mirrored Redundancy State Sensor ..................................................................... 52
7.1.3 Sparing Configuration Status ................................................................................ 54
7.1.4 Sparing Redundancy State Sensor ...................................................................... 56
7.2 ECC and Address Parity ...................................................................................... 58
7.2.1 Memory Correctable and Uncorrectable ECC Error .............................................. 58
7.2.2 Memory Address Parity Error ............................................................................... 60
8. PCI Express and Legacy PCI subsystem ........................................................................ 63
8.1 PCI Express Errors............................................................................................... 63
8.1.1 PCI Express Correctable errors ............................................................................ 63
8.1.2 PCI Express Fatal Errors ...................................................................................... 65
8.1.3 Legacy PCI Errors ................................................................................................ 67
9. System BIOS events ......................................................................................................... 69
9.1 System Events ..................................................................................................... 69
9.1.1 System Boot ......................................................................................................... 69
9.1.2 Timestamp Clock Synchronization ....................................................................... 69
9.2 System Firmware Progress (Formerly Post Error) ................................................ 71
9.2.1 System Firmware Progress (Formerly Post Error) – Next Steps ........................... 71
10. Chassis subsystem .......................................................................................................... 78
10.1 Physical Security .................................................................................................. 78
10.1.1 Chassis Intrusion .................................................................................................. 78
10.1.2 LAN Leash lost ..................................................................................................... 78
10.2 FP (NMI) Interrupt ................................................................................................ 79
10.2.1 FP (NMI) Interrupt – Next Steps ........................................................................... 80
10.3 Button Press Events ............................................................................................. 80
11. Miscellaneous events ....................................................................................................... 82
11.1 IPMI Watchdog ..................................................................................................... 82
11.2 SMI Timeout ......................................................................................................... 83
11.2.1 SMI Timeout – Next Steps.................................................................................... 84
11.3 System Event Log Cleared ................................................................................... 84
11.4 System Event – PEF action .................................................................................. 85
11.4.1 System Event – PEF Action – Next Steps ............................................................ 85
12. Hot Swap Controller events ............................................................................................. 86
Revision 1.0 Intel order number G74211-001 v
Page 6

Table of Contents System Event Log Troubleshooting Guide for Intel® S5500/S3420 series Server Boards
12.1 HSC Backplane Temperature Sensor .................................................................. 86
12.2 HSC Drive Slot Status Sensor .............................................................................. 87
12.2.1 HSC Drive Slot Status Sensor – Next Steps ......................................................... 88
12.3 HSC Drive Presence Sensor ................................................................................ 88
12.3.1 HSC Drive Presence Sensor – Next Steps ........................................................... 89
13. Manageability Engine (ME) events .................................................................................. 90
13.1 Node Manager Exception Event ........................................................................... 90
13.1.1 Node Manager Exception Event – Next Steps ...................................................... 91
13.2 Node Manager Health Event ................................................................................ 91
13.2.1 Node Manager Health Event – Next Steps ........................................................... 92
13.3 Node Manager Operational Capabilities Change .................................................. 93
13.3.1 Node Manager Operational Capabilities Change – Next Steps ............................ 94
13.4 Node Manger Alert Threshold Exceeded .............................................................. 95
13.4.1 Node Manger Alert Threshold Exceeded – Next Steps ......................................... 96
14. Microsoft Windows* Records .......................................................................................... 97
14.1 Boot up Event Records ........................................................................................ 97
14.2 Shutdown Event Records ..................................................................................... 99
14.3 Bug Check/Blue Screen Event Records ............................................................. 102
15. Linux* Kernel Panic Records ......................................................................................... 104
vi Intel order number G74211-001 Revision 1.0
Page 7

System Event Log Troubleshooting Guide for Intel® S5500/S3420 series Server Boards List of Tables
List of Tables
Table 1: SEL Record Format ....................................................................................................... 4
Table 2: Event Request Message Event Data Field Contents ..................................................... 6
Table 3: OEM SEL Record (Type C0h-DFh) ............................................................................... 7
Table 4: OEM SEL Record (Type E0h-FFh) ................................................................................ 7
Table 5: BMC owned Sensors ..................................................................................................... 8
Table 6: BIOS POST owned Sensors ....................................................................................... 12
Table 7: BIOS SMI owned Sensors ........................................................................................... 13
Table 8: Hot Swap Controller Firmware owned Sensors ........................................................... 14
Table 9: Management Engine Firmware owned Sensors .......................................................... 16
Table 10: Microsoft* OS owned Events ..................................................................................... 17
Table 11: Linux* Kernel Panic Events ....................................................................................... 18
Table 12: Voltage Sensors Typical Characteristics ................................................................... 19
Table 13: Voltage Sensors Event Triggers – Description .......................................................... 20
Table 14: Voltage Sensors – Next Steps ................................................................................... 20
Table 15: Power Unit Status Sensors Typical Characteristics ................................................... 23
Table 16: Power Unit Status Sensor – Sensor Specific Offsets – Next Steps ............................ 24
Table 17: Power Unit Redundancy Sensors Typical Characteristics ......................................... 24
Table 18: Power Unit Redundancy Sensor – Event Trigger Offset – Next Steps ....................... 25
Table 19: Power Supply Status Sensors Typical Characteristics ............................................... 26
Table 20: Power Supply Status Sensor – Sensor Specific Offsets – Next Steps ....................... 26
Table 21: Power Supply AC Power Input Sensors Typical Characteristics ................................ 27
Table 22: Power Supply AC Power Input Sensor – Event Trigger Offset – Next Steps .............. 28
Table 23: Power Supply Current Output % Sensors Typical Characteristics ............................. 28
Table 24: Power Supply Current Output % Sensor – Event Trigger Offset – Next Steps ........... 29
Table 25: Power Supply Temperature Sensors Typical Characteristics .................................... 29
Table 26: Power Supply Temperature Sensor – Event Trigger Offset – Next Steps .................. 30
Table 27: Fan Speed Sensors Typical Characteristics .............................................................. 31
Table 28: Fan Speed Sensor – Event Trigger Offset – Next Steps ............................................ 32
Table 29: Fan Presence Sensors Typical Characteristics ......................................................... 32
Table 30: Fan Presence Sensors – Event Trigger Offset – Next Steps ..................................... 33
Table 31: Fan Redundancy Sensors Typical Characteristics ..................................................... 34
Table 32: Fan Redundancy Sensor – Event Trigger Offset – Next Steps .................................. 35
Table 33: Temperature Sensors Typical Characteristics ........................................................... 36
Table 34: Temperature Sensors Event Triggers – Description .................................................. 36
Table 35: Temperature Sensors – Next Steps........................................................................... 37
Table 36: Thermal Margin Sensors Typical Characteristics ....................................................... 37
Table 37: Thermal Margin Sensors Event Triggers – Description .............................................. 38
Table 38: Thermal Margin Sensors – Next Steps ...................................................................... 38
Table 39: Processor Thermal Control % Sensors Typical Characteristics ................................. 39
Revision 1.0 Intel order number G74211-001 vii
Page 8

List of Tables System Event Log Troubleshooting Guide for Intel® S5500/S3420 series Server Boards
Table 40: Processor Thermal Control % Sensors Event Triggers – Description ........................ 39
Table 41: Processor Thermal Control % Sensors – Next Steps ................................................ 40
Table 42: Discrete Thermal Sensors Typical Characteristics ..................................................... 40
Table 43: Discrete Thermal Sensors – Next Steps .................................................................... 41
Table 44: Process Status Sensors Typical Characteristics ........................................................ 42
Table 45: Processor Status Sensors – Next Steps .................................................................... 43
Table 46: Catastrophic Error Sensor Typical Characteristics..................................................... 44
Table 47: CPU Missing Sensor Typical Characteristics ............................................................. 45
Table 48: QPI Correctable Error Sensor Typical Characteristics ............................................... 46
Table 49: QPI Non-Fatal Error Sensor Typical Characteristics .................................................. 47
Table 50: QPI Fatal Error Sensor Typical Characteristics ......................................................... 48
Table 51: QPI Fatal #2 Error Sensor Typical Characteristics..................................................... 48
Table 52: Mirroring Configuration Status Sensor Typical Characteristics .................................. 50
Table 53: Mirroring Configuration Status Sensor Event Trigger Offset – Next Steps ................. 51
Table 54: Mirrored Redundancy State Sensor Typical Characteristics ...................................... 52
Table 55: Mirrored Redundancy State Sensor Event Trigger Offset – Next Steps ..................... 54
Table 56: Sparing Configuration Status Sensor Typical Characteristics .................................... 54
Table 57: Sparing Configuration Status Sensor Event Trigger Offset – Next Steps ................... 55
Table 58: Sparing Redundancy State Sensor Typical Characteristics ....................................... 56
Table 59: Sparing Redundancy State Sensor Event Trigger Offset – Next Steps ...................... 57
Table 60: Correctable and Uncorrectable ECC Error Sensor Typical Characteristics ................ 58
Table 61: Correctable and Uncorrectable ECC Error Sensor Event Trigger Offset – Next Steps59
Table 62: Address Parity Error Sensor Typical Characteristics ................................................. 60
Table 63: PCI Express Correctable Error Sensor Typical Characteristics .................................. 63
Table 64: PCI Express Correctable Error Sensor Event Trigger Offset – Next Steps ................ 64
Table 65: PCI Express Fatal Error Sensor Typical Characteristics ............................................ 65
Table 66: PCI Express Fatal Error Sensor Event Trigger Offset – Next Steps ........................... 66
Table 67: Legacy PCI Error Sensor Typical Characteristics ...................................................... 67
Table 68: Legacy PCI Error Sensor Event Trigger Offset – Next Steps ..................................... 68
Table 69: System Event Sensor Typical Characteristics ........................................................... 70
Table 70: POST Error Sensor Typical Characteristics ............................................................... 71
Table 71: POST Error Codes .................................................................................................... 72
Table 72: Physical Security Sensor Typical Characteristics ...................................................... 78
Table 73: Physical Security Sensor Event Trigger Offset – Next Steps ..................................... 79
Table 74: FP (NMI) Interrupt Sensor Typical Characteristics ..................................................... 79
Table 75: Button Press Events Sensor Typical Characteristics ................................................. 80
Table 76: IPMI Watchdog Sensor Typical Characteristics ......................................................... 82
Table 77: IPMI Watchdog Sensor Event Trigger Offset – Next Steps ........................................ 83
Table 78: SMI Timeout Sensor Typical Characteristics ............................................................. 83
Table 79: System Event Log Cleared Sensor Typical Characteristics ....................................... 84
Table 80: System Event – PEF Action Sensor Typical Characteristics ...................................... 85
viii Intel order number G74211-001 Revision 1.0
Page 9

System Event Log Troubleshooting Guide for Intel® S5500/S3420 series Server Boards List of Tables
Table 81: HSC Backplane Temperature Sensor Typical Characteristics ................................... 86
Table 82: HSC Backplane Temperature Sensor – Event Trigger Offset – Next Steps ............... 87
Table 83: HSC Drive Slot Status Sensor Typical Characteristics .............................................. 87
Table 84: HSC Drive Presence Sensor Typical Characteristics ................................................. 88
Table 85: Node Manager Exception Sensor Typical Characteristics ......................................... 90
Table 86: Node Manager Health Event Sensor Typical Characteristics ..................................... 91
Table 87: Node Manager Operational Capabilities Change Sensor Typical Characteristics ...... 93
Table 88: Node Manager Alert Threshold Exceeded Sensor Typical Characteristics ................ 95
Table 89: Boot up Event Record Typical Characteristics ........................................................... 97
Table 90: Boot up OEM Event Record Typical Characteristics .................................................. 98
Table 91: Shutdown Reason Code Event Record Typical Characteristics ................................. 99
Table 92: Shutdown Reason OEM Event Record Typical Characteristics ................................. 99
Table 93: Shutdown Comment OEM Event Record Typical Characteristics ............................ 100
Table 94: Bug Check/Blue Screen – OS Stop Event Record Typical Characteristics .............. 102
Table 95: Bug Check/Blue Screen code OEM Event Record Typical Characteristics .............. 102
Table 96: Linux* Kernel Panic Event Record Characteristics .................................................. 104
Table 97: Linux* Kernel Panic String Extended Record Characteristics .................................. 105
Revision 1.0 Intel order number G74211-001 ix
Page 10

System Event Log Troubleshooting Guide for Intel® S5500/S3420 series Server Boards Introduction
1. Introduction
The server management hardware that is part of Intel® server boards and Intel® server platforms
serves as a vital part of the overall server management strategy. The server management
hardware provides essential information to the system administrator and provides the
administrator the ability to remotely control the server, even when the operating system is not
running.
The Intel® server boards and Intel® server platforms offer comprehensive hardware and
software based solutions. The server management features make the servers simple to manage
and provide alerting on system events. From entry to enterprise systems, good overall server
management is essential to reducing overall total cost of ownership.
This Troubleshooting Guide is intended to help the users better understand the events that are
logged in the Baseboard Management Controllers (BMC) System Event Logs (SEL) on these
Intel® server boards.
There are separate User’s Guide that covers the general server management and the server
management software offered on Intel® server boards and Intel® server platforms.
Server boards currently supported by this document:
Intel® S3200/X38ML server boards
Intel® S5500/S3420 series server boards.
1.1 Purpose
The purpose of this document is to list all possible events generated by the Intel® platform. It
may be possible that other sources (not under our control) also generate events, which will not
be described in this document.
1.2 Industry Standard
1.2.1 Intelligent Platform Management Interface (IPMI)
The key characteristic of the Intelligent Platform Management Interface (IPMI) is that the
inventory, monitoring, logging, and recovery control functions are available independent of the
main processors, BIOS, and operating system. Platform management functions can also be
made available when the system is in a powered down state.
IPMI works by interfacing with the BMC, which extends management capabilities in the server
system and operates independent of the main processor by monitoring the on-board
instrumentation. Through the BMC, IPMI also allows administrators to control power to the
server, and remotely access BIOS configuration and operating system console information.
IPMI defines a common platform instrumentation interface to enable interoperability between:
Revision 1.0 Intel order number G74211-001 1
Page 11

Introduction System Event Log Troubleshooting Guide for Intel® S5500/S3420 series Server Boards
The baseboard management controller and chassis
The baseboard management controller and systems management software
Between servers
IPMI enables the following:
Common access to platform management information, consisting of:
- Local access from systems management software
- Remote access from LAN
- Inter-chassis access from Intelligent Chassis Management Bus
- Access from LAN, serial/modem, IPMB, PCI SMBus*, or ICMB, available even if the
processor is down
IPMI interface isolates systems management software from hardware.
Hardware advancements can be made without impacting the systems management
software.
IPMI facilitates cross-platform management software.
You can find more information on IPMI at the following URL:
http://www.intel.com/design/servers/ipmi
1.2.2 Baseboard Management Controller (BMC)
A baseboard management controller (BMC) is a specialized microcontroller embedded on most
Intel® Server Boards. The BMC is the heart of the IPMI architecture and provides the
intelligence behind intelligent platform management, that is, the autonomous monitoring and
recovery features implemented directly in platform management hardware and firmware.
Different types of sensors built into the computer system report to the BMC on parameters such
as temperature, cooling fan speeds, power mode, operating system status, and so on. The BMC
monitors the system for critical events by communicating with various sensors on the system
board; it sends alerts and logs events when certain parameters exceed their preset thresholds,
indicating a potential failure of the system. The administrator can also remotely communicate
with the BMC to take some corrective action such as resetting or power cycling the system to
get a hung OS running again. These abilities save on the total cost of ownership of a system.
For Intel® server boards and Intel® Server platforms, the BMC supports the industry-standard
IPMI 2.0 Specification, enabling you to configure, monitor, and recover systems remotely.
1.2.2.1 System Event Log (SEL)
The BMC provides a centralized, non-volatile repository for critical, warning, and informational
system events called the System Event Log or SEL. By having the BMC manage the SEL and
logging functions, it helps to ensure that ‘post-mortem’ logging information is available should a
failure occur that disables the systems processor(s).
2 Intel order number G74211-001 Revision 1.0
Page 12

System Event Log Troubleshooting Guide for Intel® S5500/S3420 series Server Boards Introduction
The BMC allows access to SEL from in-band and out-of-band mechanisms. There are various
tools and utilities that can be used to access the SEL. There is the Intel® SELViewer and
multiple open sourced IPMI tools.
1.2.3 Intel
®
Intelligent Power Node Manager version 1.5
Intel® Intelligent Power Node Manager version 1.5 (NM) is a platform resident technology that
enforces power and thermal policies for the platform. These policies are applied by exploiting
subsystem knobs (such as processor P and T states) that can be used to control power
consumption. Intel® Intelligent Power Node Manager enables data center power and thermal
management by exposing an external interface to management software through which platform
policies can be specified. It also enables specific data center power management usage models
such as power limiting.
The configuration and control commands are used by the external management software or
BMC to configure and control the Intel® Intelligent Power Node Manager feature. Since Platform
Services firmware does not have any external interface, external commands are first received
by the BMC over LAN and then relayed to the Platform Services firmware over IPMB channel.
The BMC acts as a relay and the transport conversion device for these commands. For
simplicity, the commands from the management console might be encapsulated in a generic
CONFIG packet format (config data length, config data blob) to the BMC so that the BMC
doesn’t even have to even parse the actual configuration data.
BMC provides the access point for remote commands from external management SW and
generates alerts to them. Intel® Intelligent Power Node Manager on Intel® Manageability Engine
(Intel® ME) is an IPMI satellite controller. A mechanism needs to exist to forward commands to
Intel® ME and send response back to originator. Similarly events from Intel® ME have to be sent
as alerts outside of BMC. It is the responsibility of BMC to implement these mechanisms for
communication with Intel® Intelligent Power Node Manager.
The full specification can be downloaded from the following link:
http://www.intel.com/content/dam/doc/technical-specification/intelligent-power-node-manager-15-specification.pdf
Revision 1.0 Intel order number G74211-001 3
Page 13

Basic decoding of a SEL Record
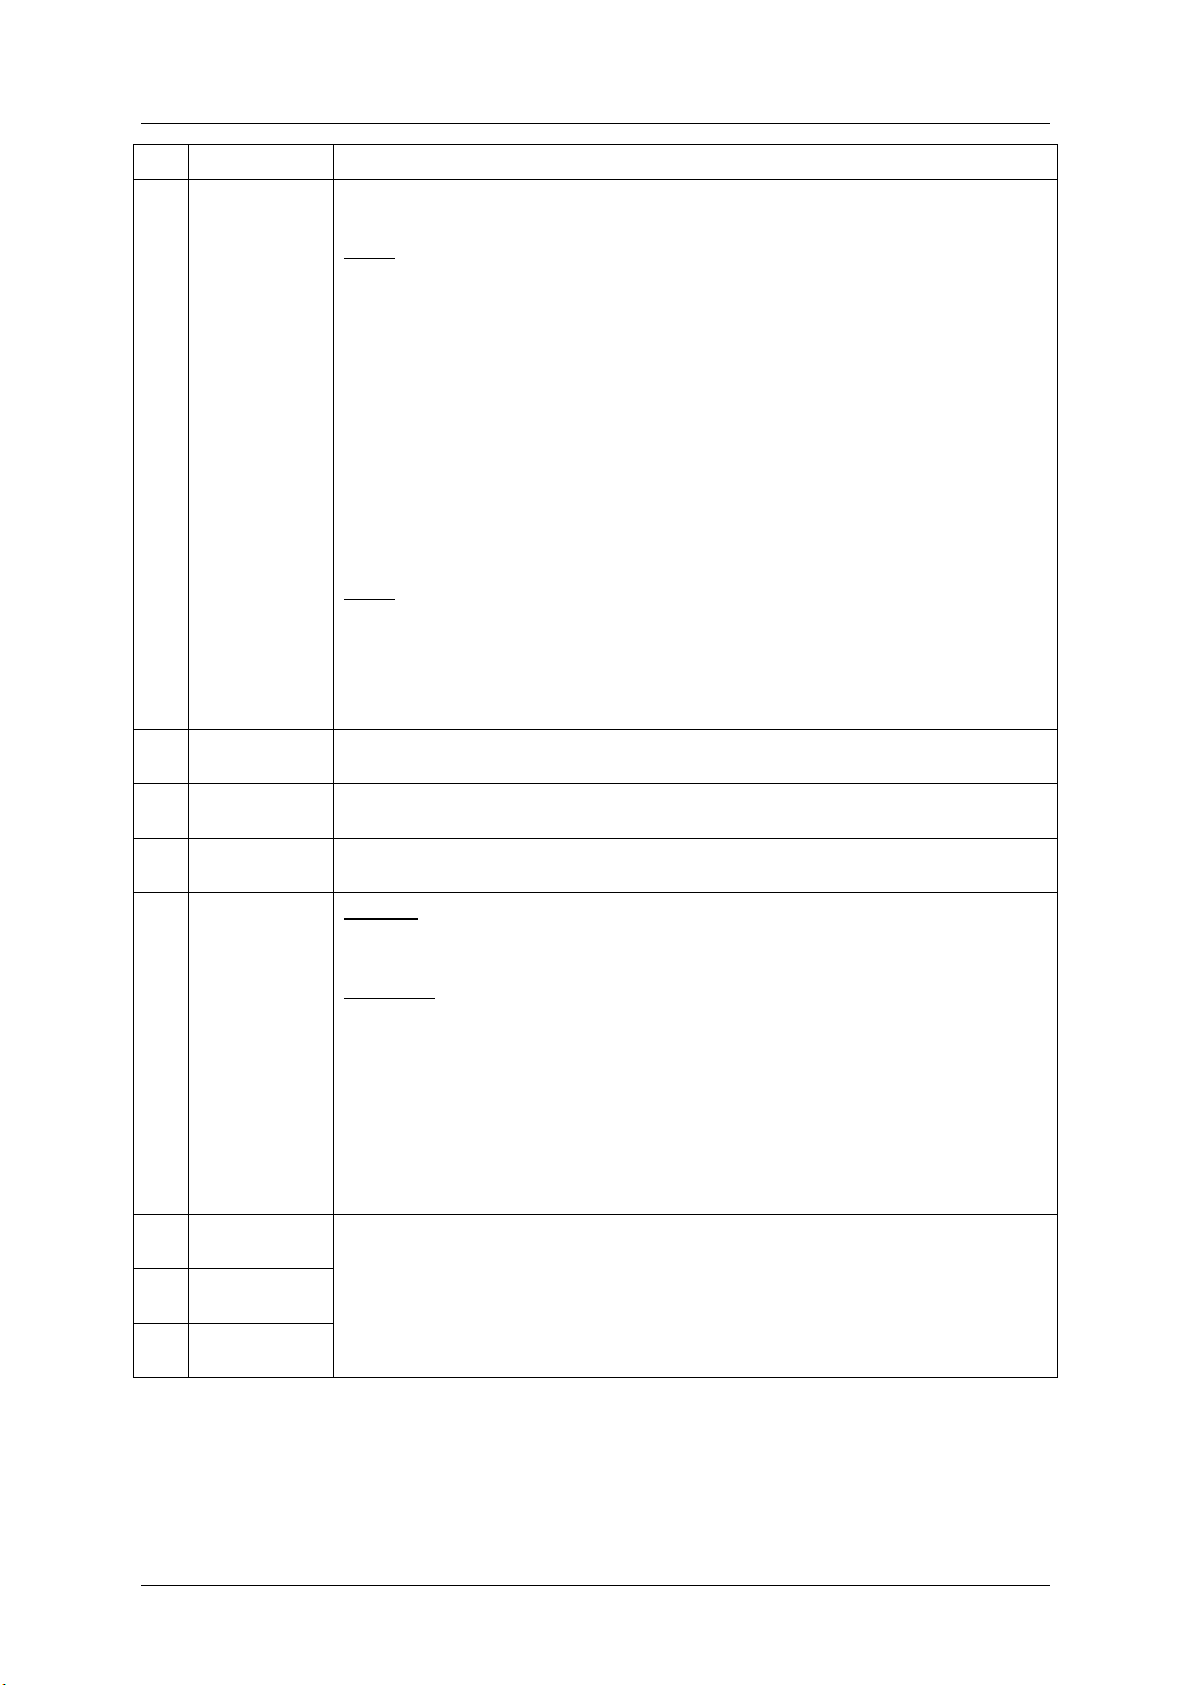
Byte
Field
Description
1 2 Record ID
(RID)
ID used for SEL Record access.
3
Record Type
(RT)
[7:0] - Record Type
02h = system event record
C0h-DFh = OEM timestamped, bytes 8-16 OEM defined (See Table 3)
E0h-FFh = OEM non-timestamped, bytes 4-16 OEM defined (See Table 4)
4
5
6
7
Timestamp
(TS)
Time when event was logged. LS byte first.
Example: TS:[29][76][68][4C] = 4C687629h = 1281914409 =Sun, 15 Aug 2010 23:20:09
UTC
Note: There are various websites that will convert the raw number to a date/time.
System Event Log Troubleshooting Guide for Intel® S5500/S3420 series Server Boards
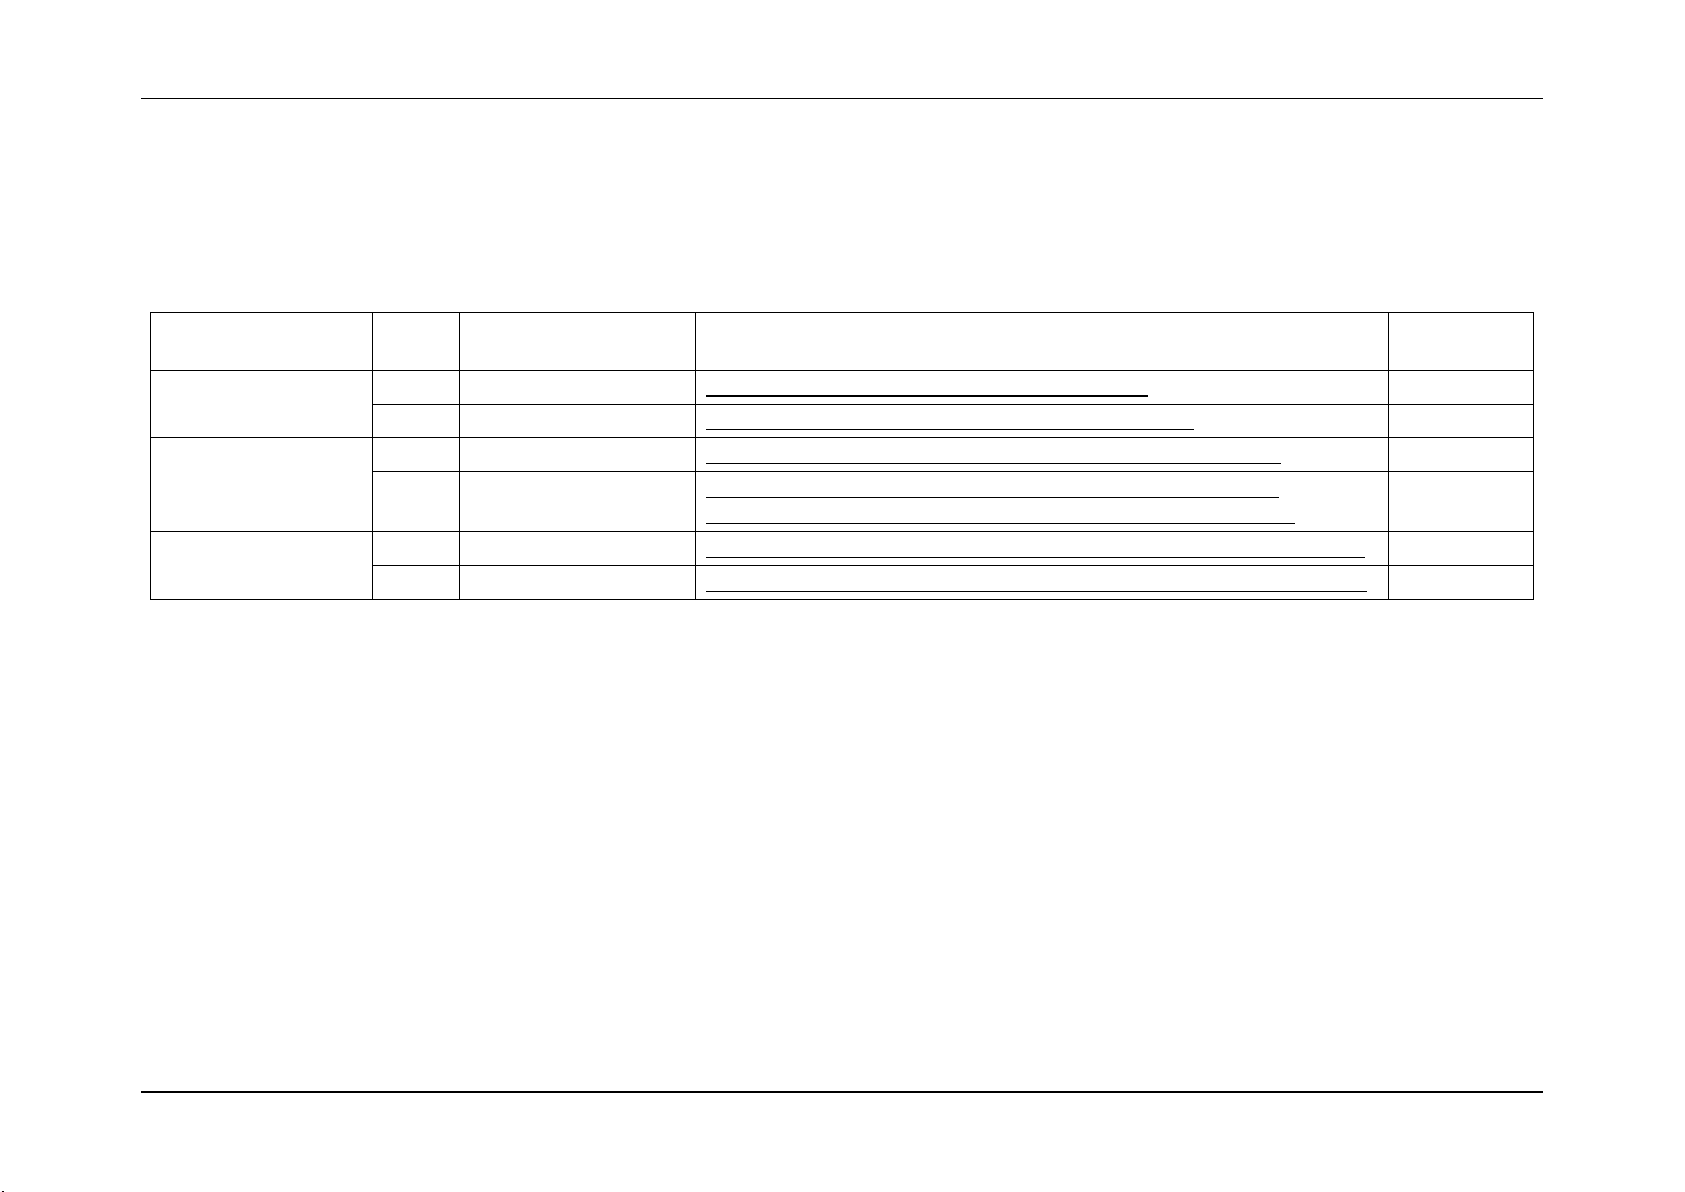
2. Basic decoding of a SEL Record
The System Event Log (SEL) record format is defined in the IPMI Specification. The
following section provides a basic definition for each of the fields in a SEL. For more details
see the IPMI Specification.
The definitions for the standard SEL can be found in Table 1.
The definitions for the OEM defined event logs can be found in Table 3 and Table 4.
2.1 Default values in the SEL records
Unless otherwise noted in the event record descriptions the following are the default values
in all SEL entries.
Byte [3] = Record Type (RT) = 02h = system event record
Byte [9:8] = Generator ID = 0020h = BMC Firmware
Byte [10] = Event Message Revision (ER) = 04h = IPMI 2.0
Table 1: SEL Record Format
4 Intel order number G74211-001 Revision 1.0
Page 14
System Event Log Troubleshooting Guide for Intel® S5500/S3420 series Server Boards
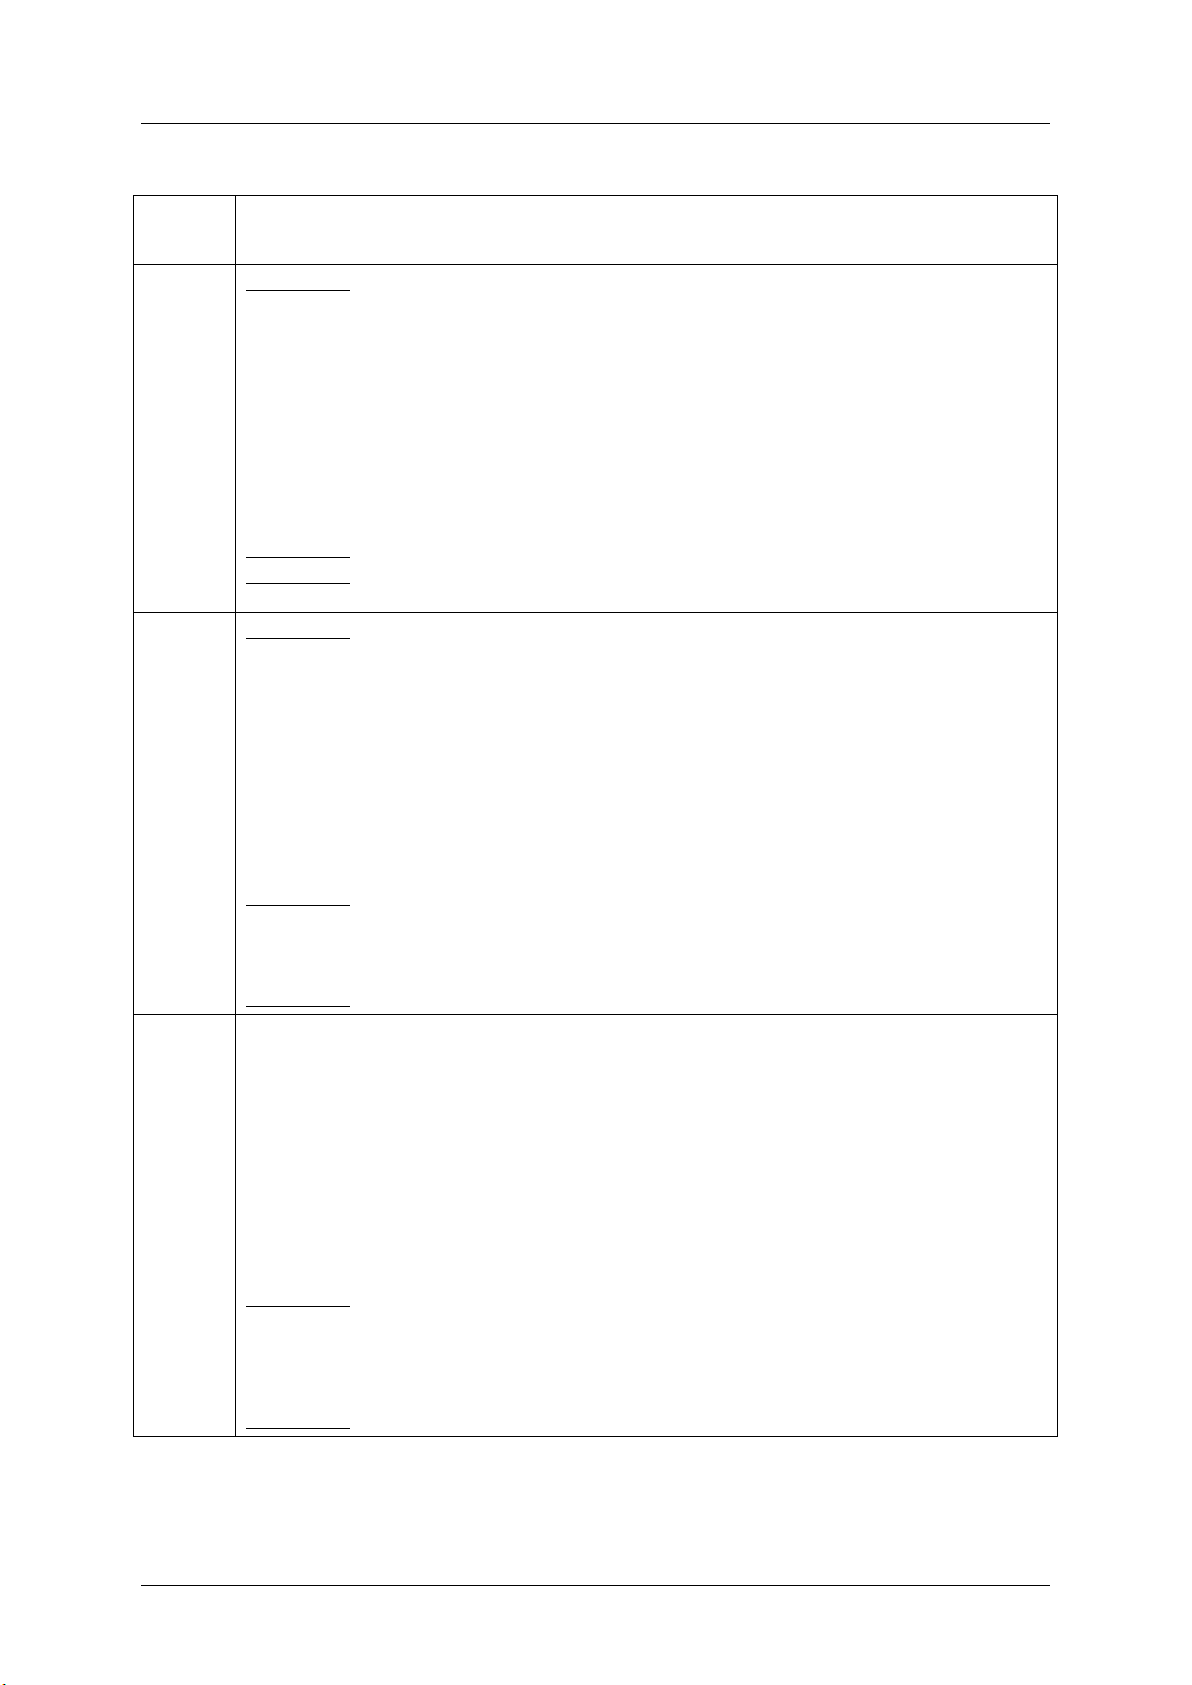
Byte
Field
Description
8 9 Generator ID
(GID)
RqSA and LUN if event was generated from IPMB.
Software ID if event was generated from system software.
Byte 1
[7:1] - 7-bit I2C. Slave Address, or 7-bit system software ID
[0] 0b = ID is IPMB Slave Address
1b = system software ID
Software ID values:
0001h – BIOS POST for POST errors, RAS Configuration/State,
Timestamp Synch, OS Boot events
0033h – BIOS SMI Handler
0020h – BMC Firmware
002Ch – ME Firmware
0041h – Server Management Software
00C0h – HSC Firmware – HSBP A
00C2h = HSC Firmware – HSBP B
Byte 2
[7:4] - Channel number. Channel that event message was received over. 0h if the event
message was received from the system interface, primary IPMB, or internally generated
by the BMC.
[3:2] - reserved. Write as 00b.
[1:0] - IPMB device LUN if byte 1 holds Slave Address. 00b otherwise.
10
EvM Rev
(ER)
Event Message format version. 04h = IPMI v2.0; 03h = IPMI v1.0
11
Sensor Type
(ST)
Sensor Type Code for sensor that generated the event
12
Sensor #
(SN)
Number of sensor that generated the event (From SDR)
13
Event Dir |
Event Type
(EDIR)
Event Dir
[7] - 0b = Assertion event.
1b = Deassertion event.
Event Type
Type of trigger for the event, for example, critical threshold going high, state asserted,
and so on. Also indicates class of the event. For example, discrete, threshold, or OEM.
The Event Type field is encoded using the Event/Reading Type Code.
[6:0] - Event Type Codes
01h = Threshold (States = 0x00 – 0x0b)
02h – 0ch = Discrete
6Fh = Sensor-Specific
70-7Fh = OEM
14
Event Data 1
(ED1)
Per Table 2: Event Request Message Event Data Field Contents
15
Event Data 2
(ED2)
16
Event Data 3
(ED3)
Basic decoding of a SEL Record
Revision 1.0 Intel order number G74211-001 5
Page 15
Basic decoding of a SEL Record
Sensor
Class
Event Data
Threshold
Event Data 1
[7:6] - 00b = unspecified Event Data 2
01b = trigger reading in Event Data 2
10b = OEM code in Event Data 2
11b = sensor-specific event extension code in Event Data 2
[5:4] - 00b = unspecified Event Data 3
01b = trigger threshold value in Event Data 3
10b = OEM code in Event Data 3
11b = sensor-specific event extension code in Event Data 3
[3:0] - Offset from Event/Reading Code for threshold event.
Event Data 2 – reading that triggered event, FFh or not present if unspecified.
Event Data 3 – threshold value that triggered event, FFh or not present if unspecified. If present,
Event Data 2 must be present.
discrete
Event Data 1
[7:6] - 00b = unspecified Event Data 2
01b = previous state and/or severity in Event Data 2
10b = OEM code in Event Data 2
11b = sensor-specific event extension code in Event Data 2
[5:4] - 00b = unspecified Event Data 3
01b = reserved
10b = OEM code in Event Data 3
11b = sensor-specific event extension code in Event Data 3
[3:0] - Offset from Event/Reading Code for discrete event state
Event Data 2
[7:4] - Optional offset from ‘Severity’ Event/Reading Code. (0Fh if unspecified).
[3:0] - Optional offset from Event/Reading Type Code for previous discrete event state. (0Fh if
unspecified.)
Event Data 3 – Optional OEM code. FFh or not present if unspecified.
OEM
Event Data 1
[7:6] - 00b = unspecified in Event Data 2
01b = previous state and/or severity in Event Data 2
10b = OEM code in Event Data 2
11b = reserved
[5:4] - 00b = unspecified Event Data 3
01b = reserved
10b = OEM code in Event Data 3
11b = reserved
[3:0] - Offset from Event/Reading Type Code
Event Data 2
[7:4] - Optional OEM code bits or offset from ‘Severity’ Event/Reading Type Code. (0Fh if
unspecified).
[3:0] - Optional OEM code or offset from Event/Reading Type Code for previous event state. (0Fh if
unspecified).
Event Data 3 - Optional OEM code. FFh or not present or unspecified
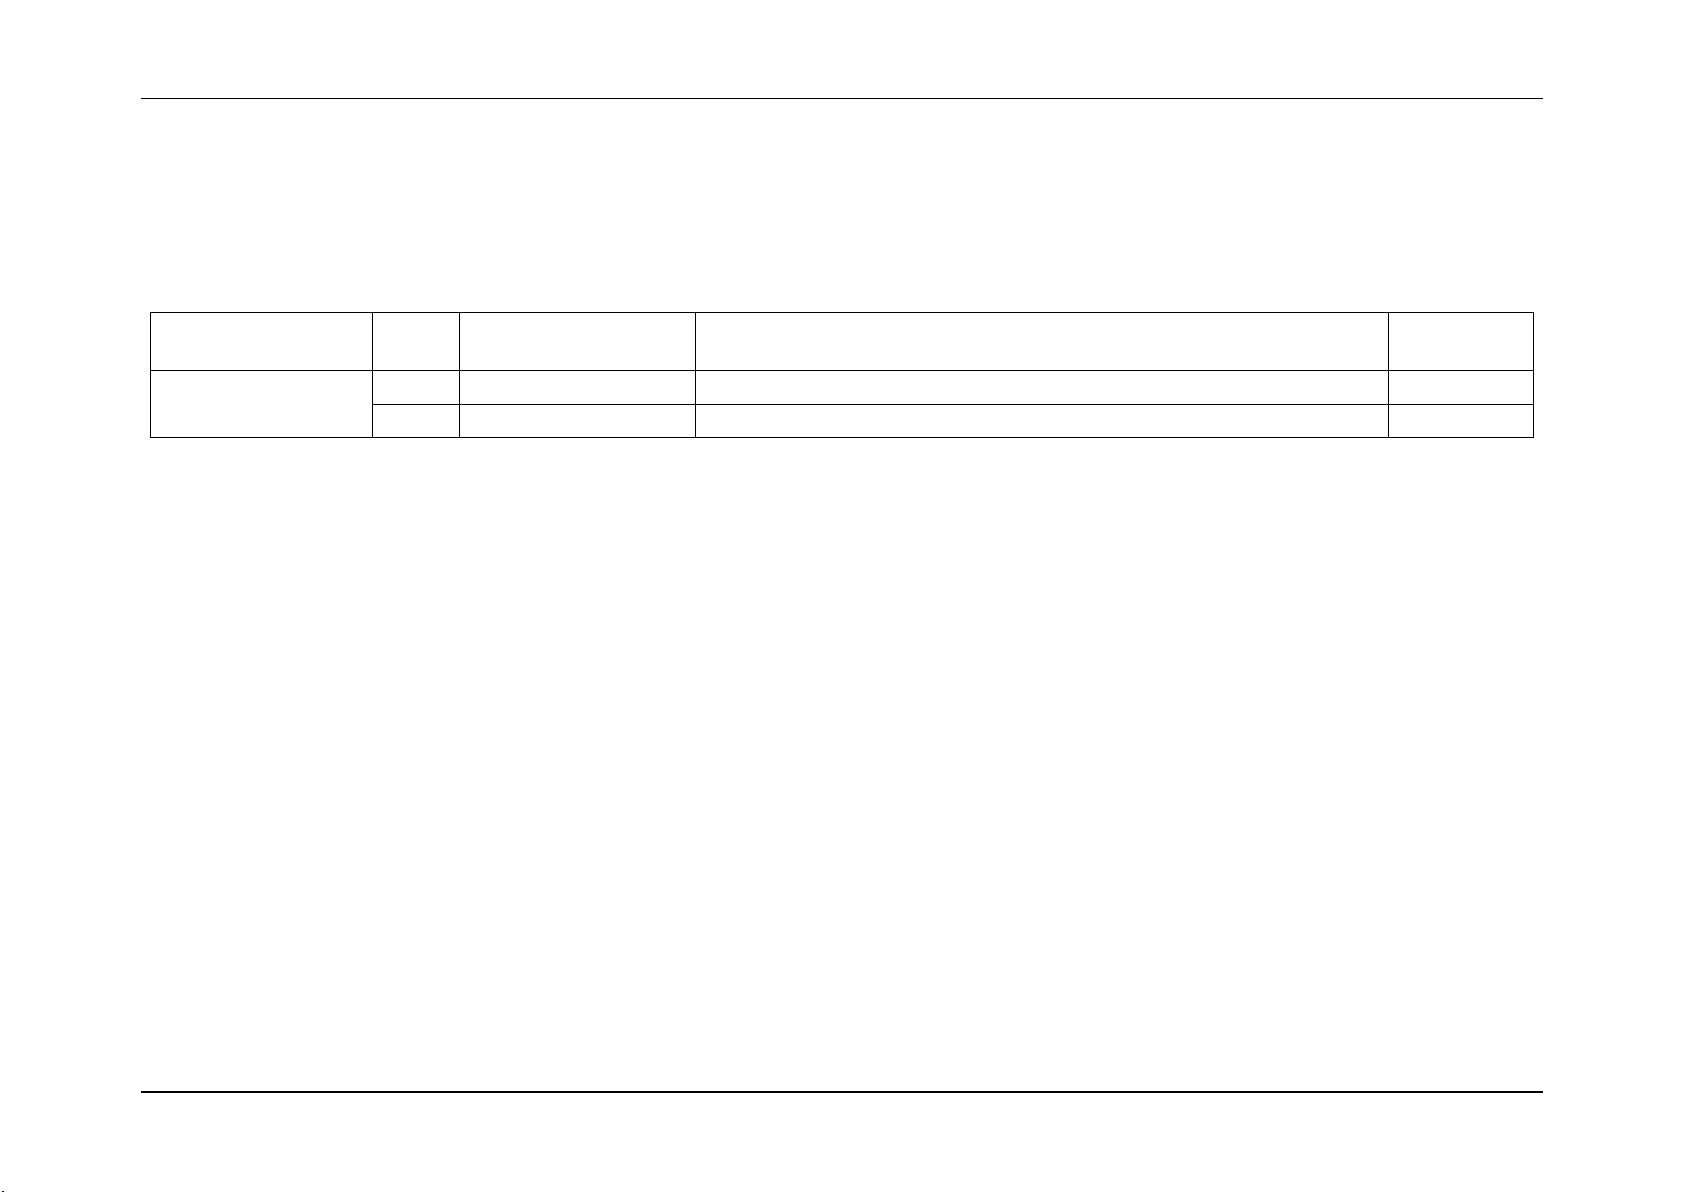
System Event Log Troubleshooting Guide for Intel® S5500/S3420 series Server Boards
Table 2: Event Request Message Event Data Field Contents
6 Intel order number G74211-001 Revision 1.0
Page 16

System Event Log Troubleshooting Guide for Intel® S5500/S3420 series Server Boards
Byte
Field
Description
1 2 Record ID
(RID)
ID used for SEL Record access.
3
Record Type
(RT)
[7:0] - Record Type
C0h-DFh = OEM timestamped, bytes 8-16 OEM defined
4
5
6
7
Timestamp
(TS)
Time when event was logged. LS byte first.
Example: TS:[29][76][68][4C] = 4C687629h = 1281914409 =Sun, 15 Aug 2010
23:20:09 UTC
Note: There are various websites that will convert the raw number to a date/time.
8
9
10
Manufacturer ID
LS Byte first. The manufacturer ID is a 20-bit value that is derived from the IANA
‘Private Enterprise’ ID.
Most significant four bits = reserved (0000b).
000000h = unspecified. 0FFFFFh = reserved.
This value is binary encoded.
For example the ID for the IPMI forum is 7154 decimal, which is 1BF2h, which would
be stored in this record as F2h, 1Bh, 00h for bytes 8 through 10, respectively.
11
12
13
14
15
16
OEM Defined
OEM Defined. This is defined according to the manufacturer identified by the
Manufacturer ID field.
Byte
Field
Description
1 2 Record ID
(RID)
ID used for SEL Record access.
3
Record Type
(RT)
[7:0] - Record Type
E0h-FFh = OEM system event record
4
5
6
7
8
9
10
11
12
13
14
15
16
OEM
OEM Defined. This is defined by the system integrator.
Basic decoding of a SEL Record
Table 3: OEM SEL Record (Type C0h-DFh)
Table 4: OEM SEL Record (Type E0h-FFh)
Revision 1.0 Intel order number G74211-001 7
Page 17
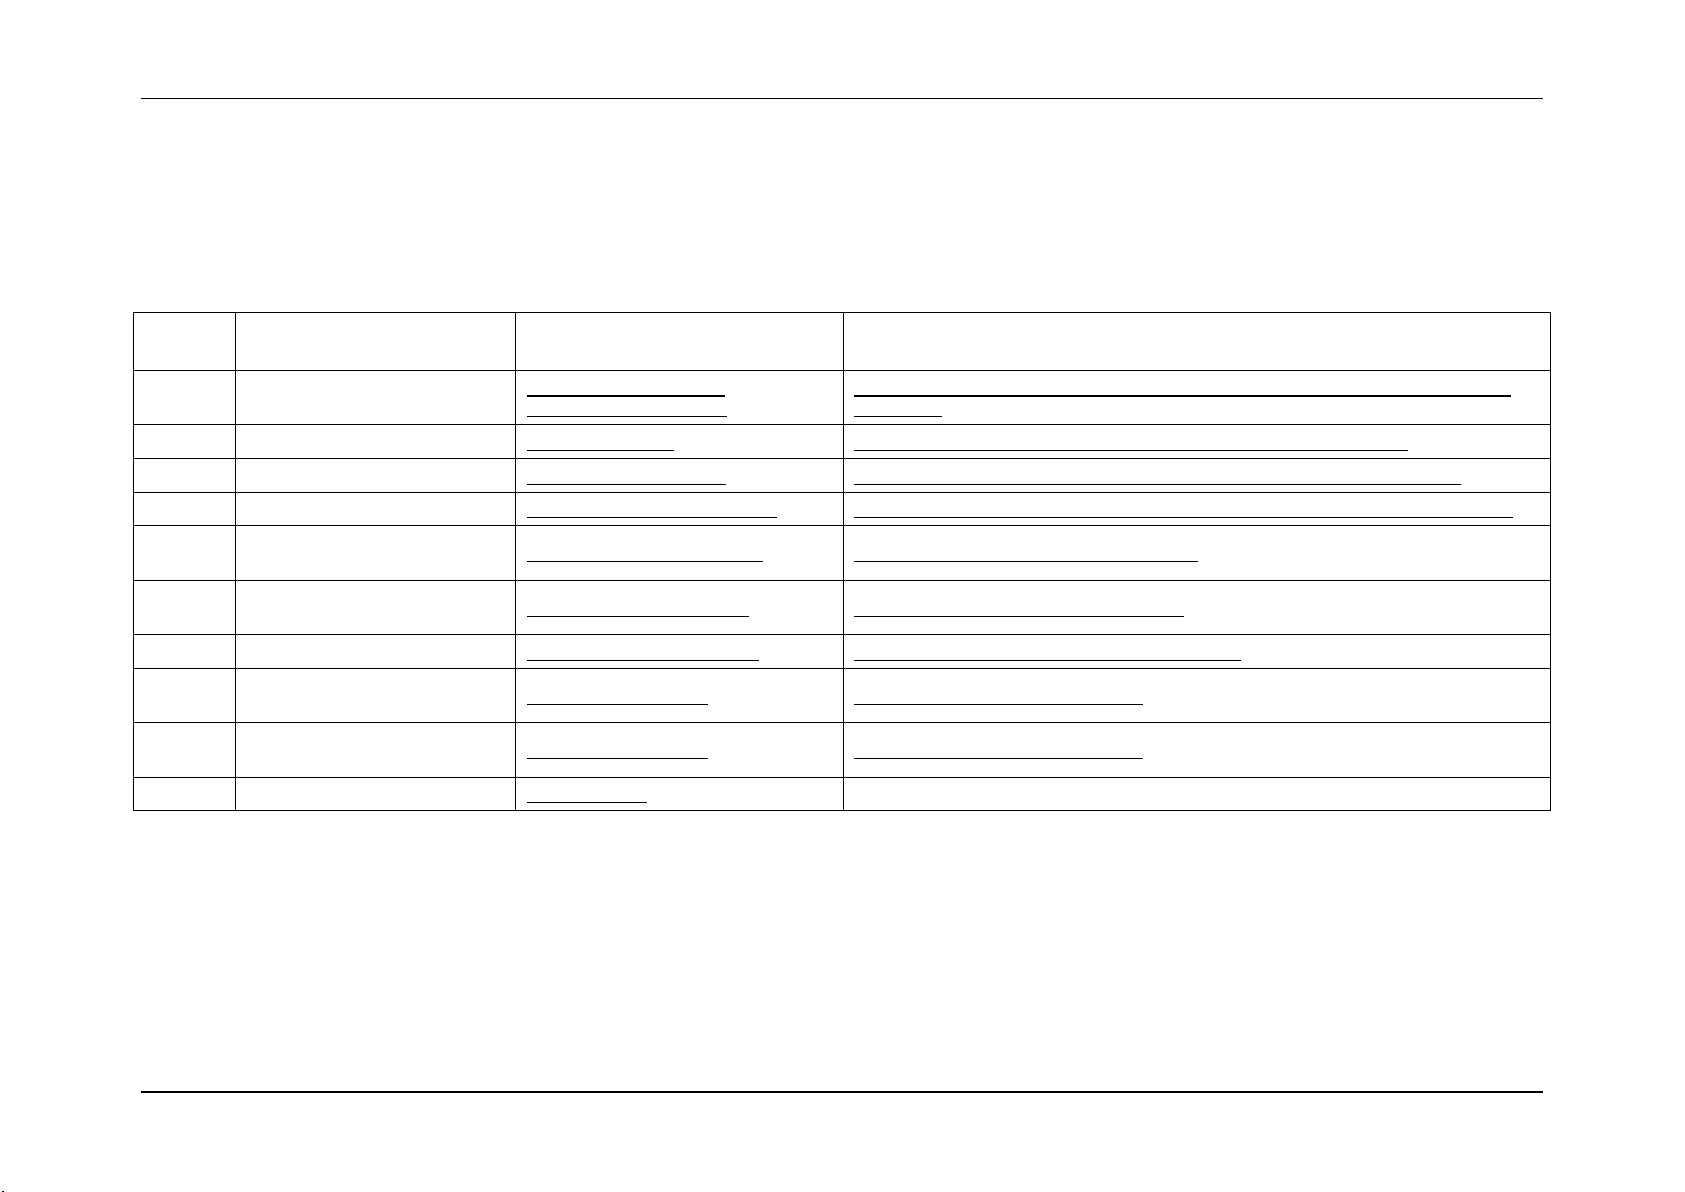
Sensor Cross Reference List System Event Log Troubleshooting Guide for Intel® S5500/S3420 series Server Boards
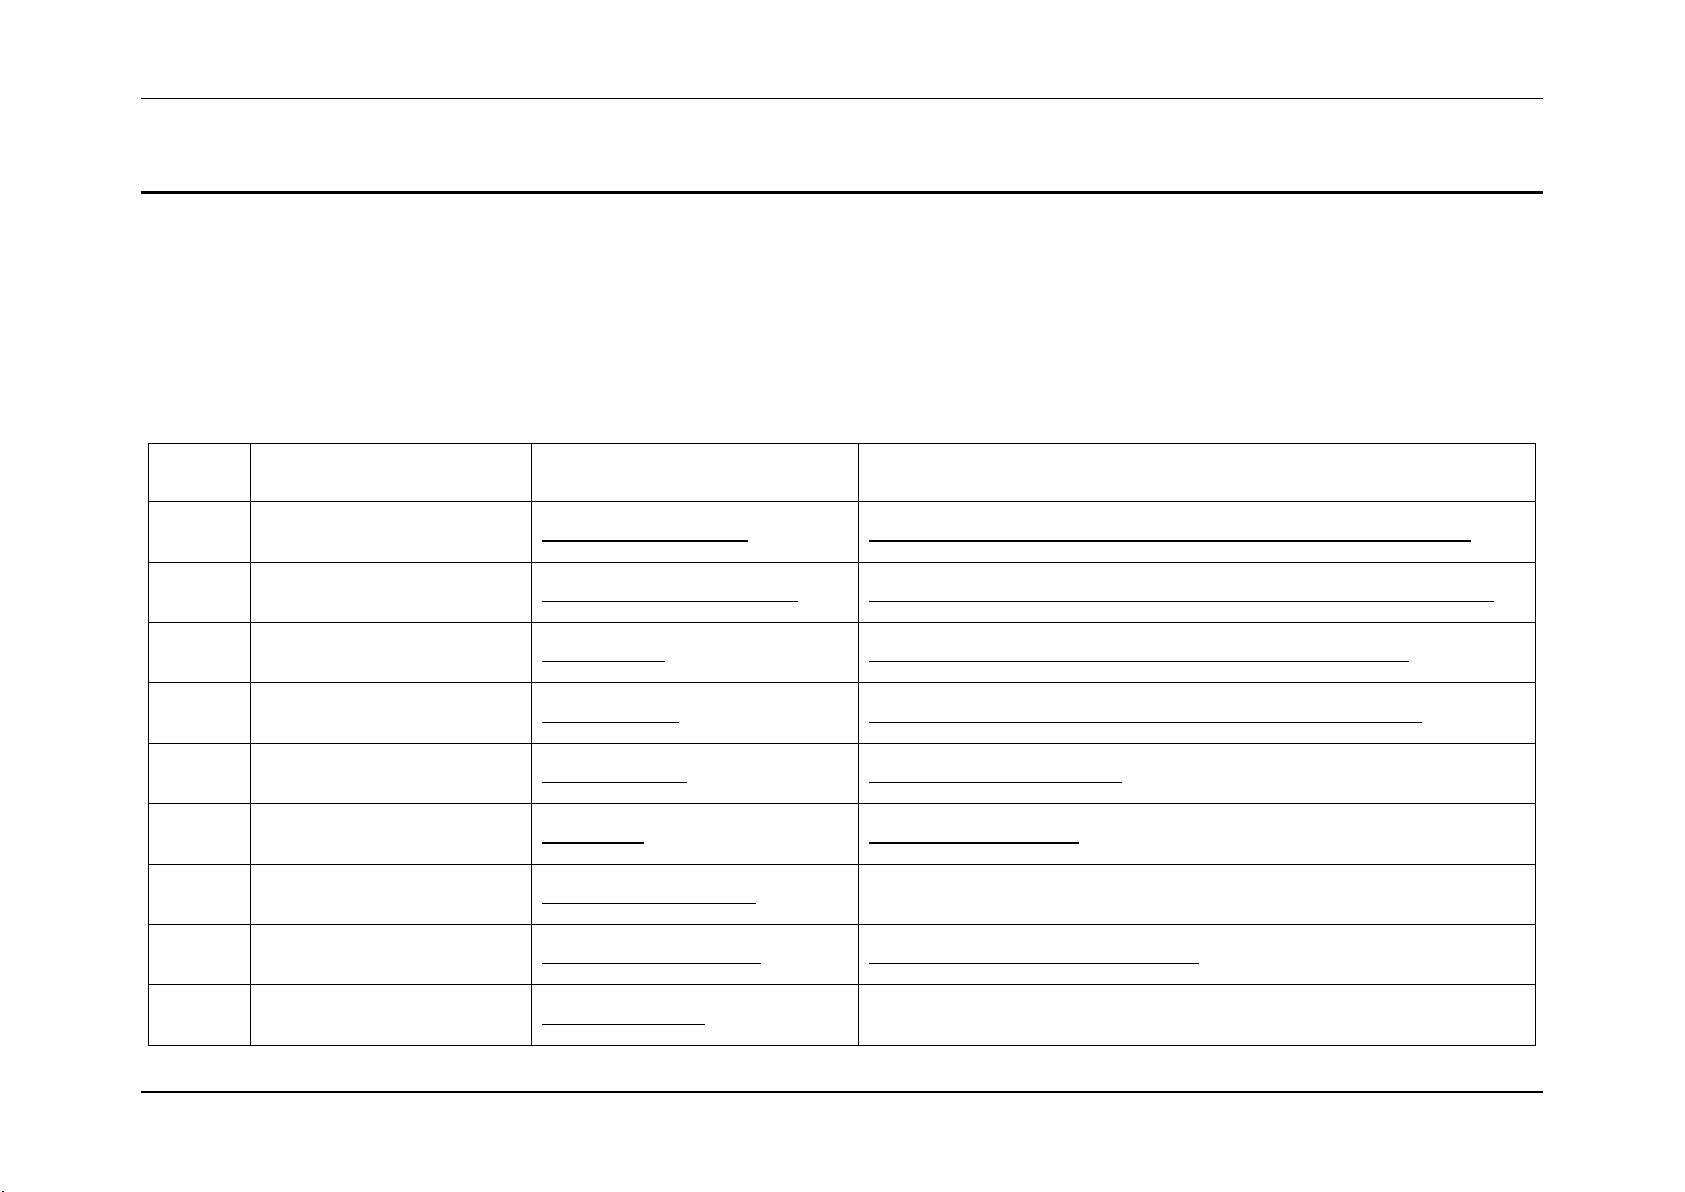
Sensor
Number
Sensor Name
Details Section
Next Steps
01h
Power Unit Status
(Pwr Unit Status)
Power Unit Status Sensor
Table 16: Power Unit Status Sensor – Sensor Specific Offsets – Next Steps
02h
Power Unit Redundancy
(Pwr Unit Redund)
Power Unit Redundancy Sensor
Table 18: Power Unit Redundancy Sensor – Event Trigger Offset – Next Steps
03h
IPMI Watchdog
(IPMI Watchdog)
IPMI Watchdog
Table 77: IPMI Watchdog Sensor Event Trigger Offset – Next Steps
04h
Physical Security
(Physical Scrty)
Physical Security
Table 73: Physical Security Sensor Event Trigger Offset – Next Steps
05h
FP Interrupt
(FP NMI Diag Int)
FP (NMI) Interrupt
FP (NMI) Interrupt – Next Steps
06h
SMI Timeout
(SMI Timeout)
SMI Timeout
SMI Timeout – Next Steps
07h
System Event Log
(System Event Log)
System Event Log Cleared
Not applicable
08h
System Event
(System Event)
System Event – PEF action
System Event – PEF Action – Next Steps
09h
Button Press Event
(Button Press)
Button Press Events
Not applicable
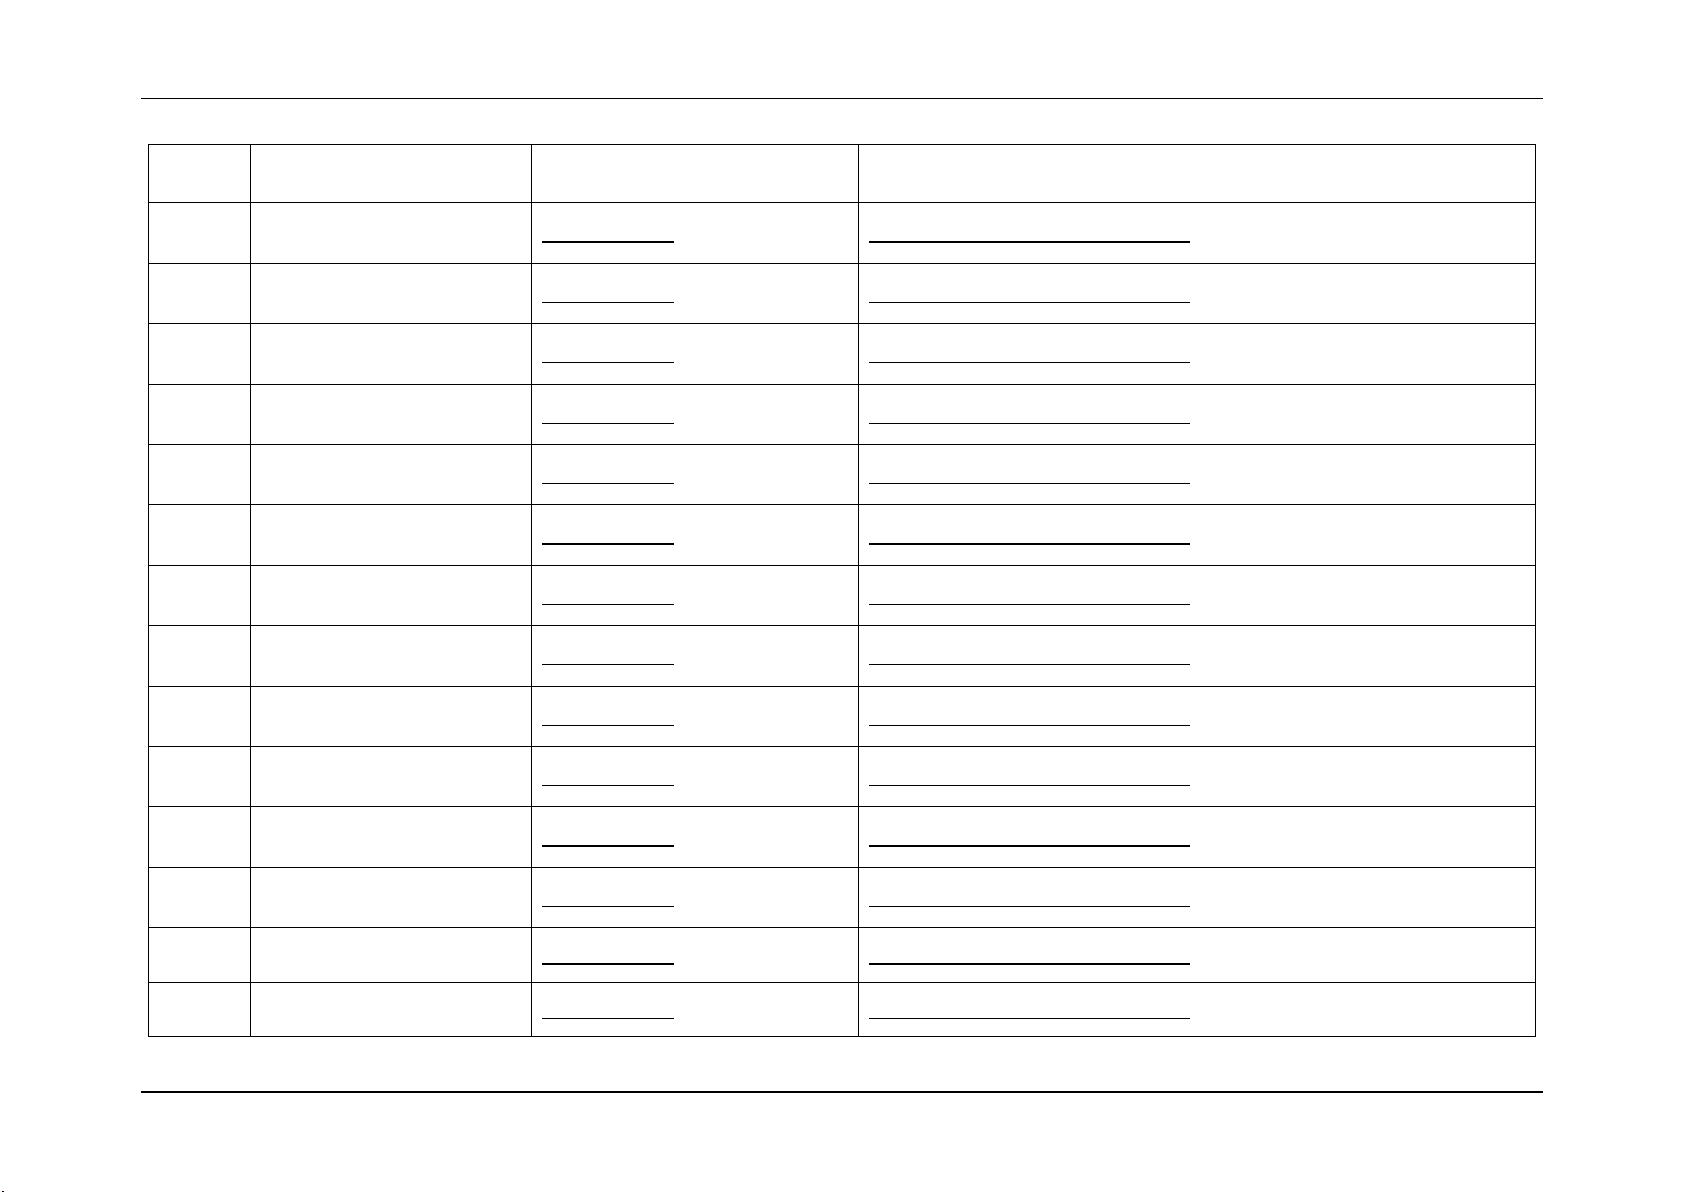
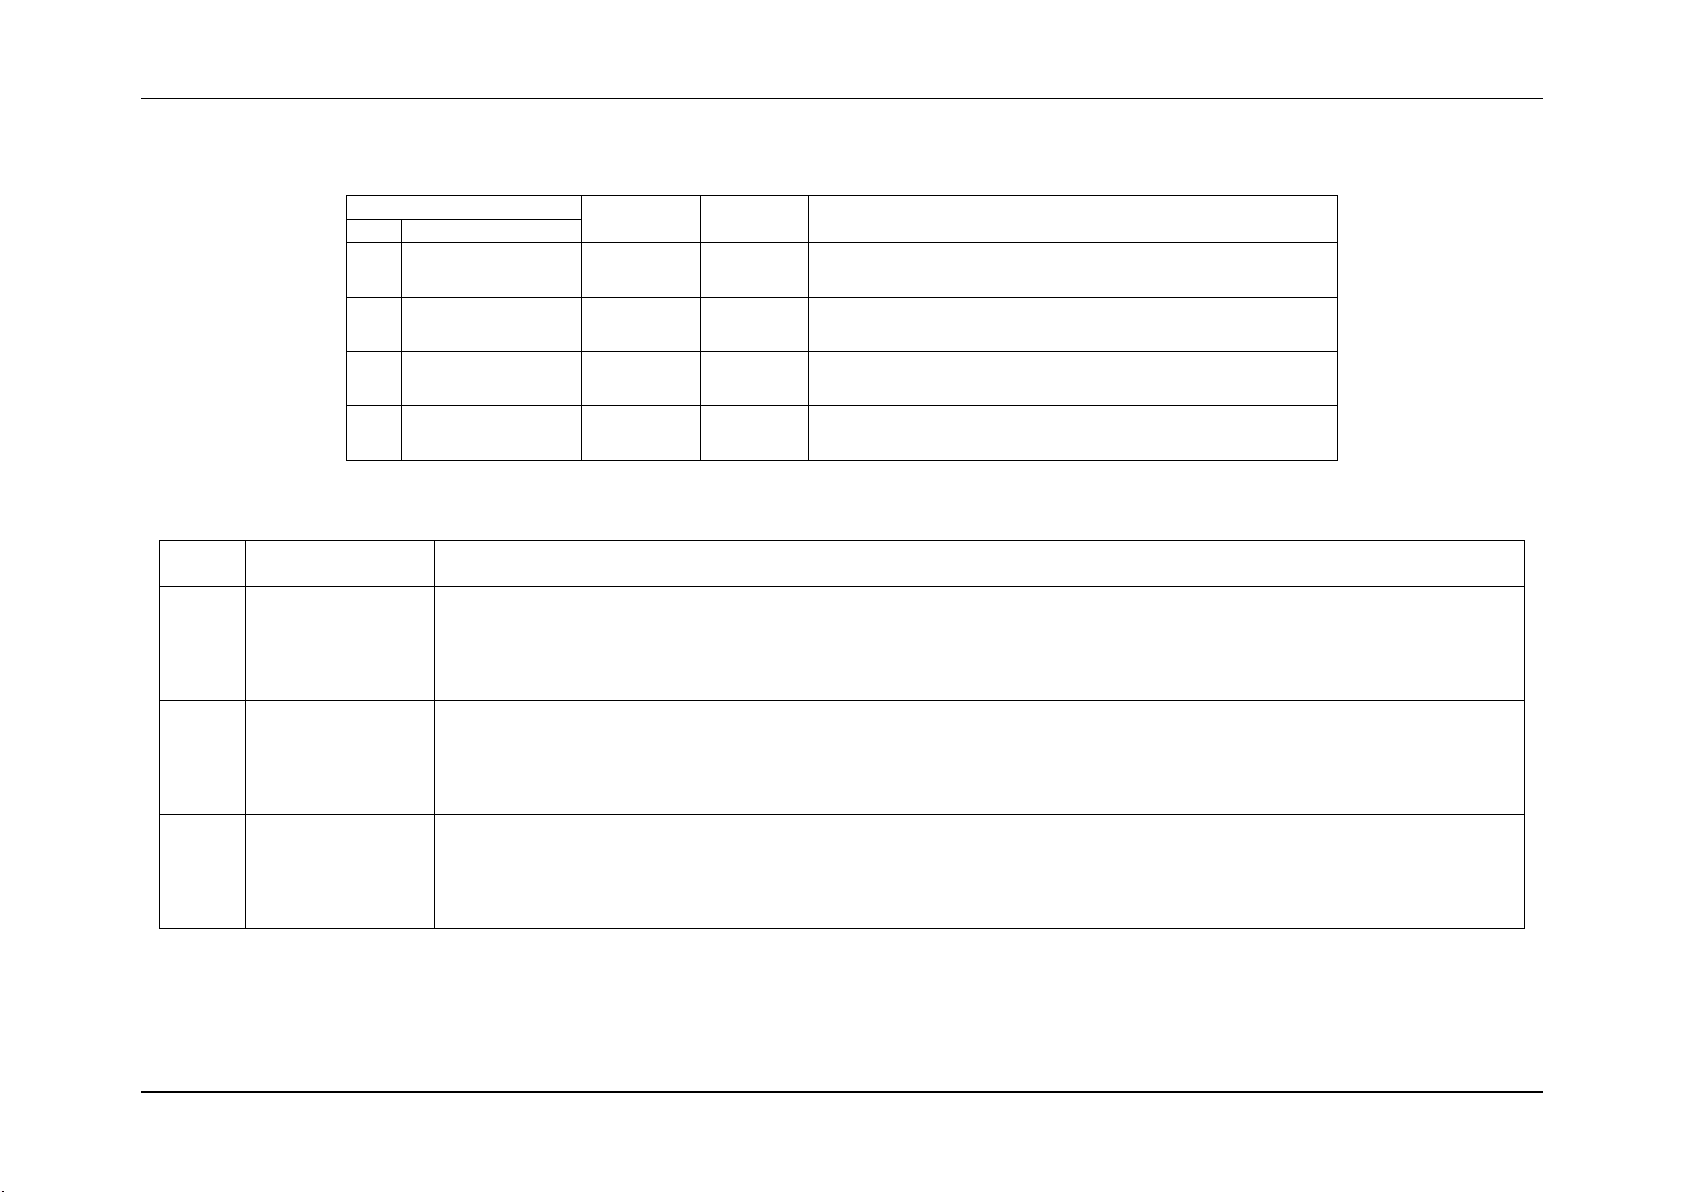
3. Sensor Cross Reference List
This section contains a cross reference to help find details on any specific SEL entry.
3.1 BMC owned Sensors (GID = 0020h)
The following table can be used to find the details of sensors owned by the BMC:
Table 5: BMC owned Sensors
8 Intel order number G74211-001 Revision 1.0
Page 18
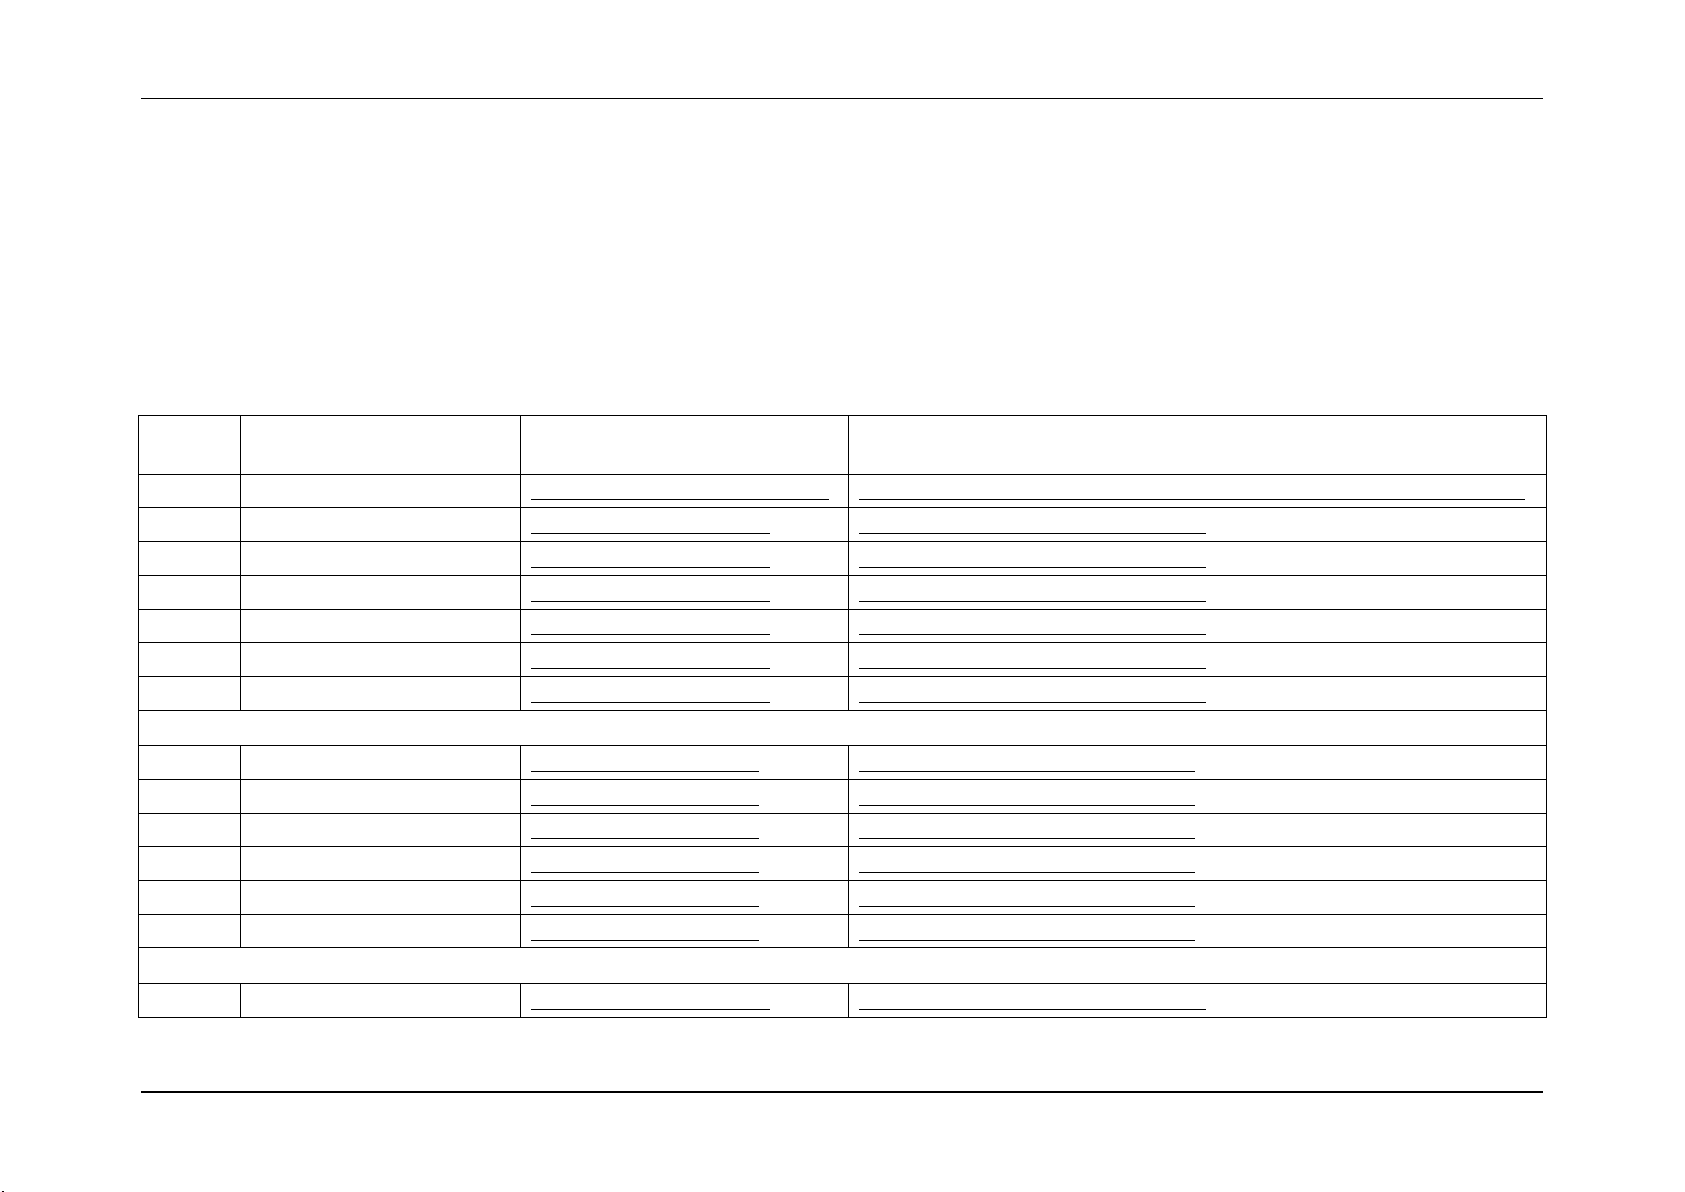
System Event Log Troubleshooting Guide for Intel® S5500/S3420 series Server Boards Sensor Cross Reference List
Sensor
Number
Sensor Name
Details Section
Next Steps
10h
BB +1.1V IOH
(BB +1.1V IOH)
Voltage Sensors
Table 14: Voltage Sensors – Next Steps
11h
BB +1.1V P1 Vccp
(BB +1.1V P1 Vccp)
Voltage Sensors
Table 14: Voltage Sensors – Next Steps
12h
BB +1.1 P2 Vccp
(BB +1.1V P2 Vccp)
Voltage Sensors
Table 14: Voltage Sensors – Next Steps
13h
BB +1.5V P1 DDR3
(BB +1.5V P1 DDR3)
Voltage Sensors
Table 14: Voltage Sensors – Next Steps
14h
BB +1.5V P2 DDR3
(BB +1.5V P2 DDR3)
Voltage Sensors
Table 14: Voltage Sensors – Next Steps
15h
BB +1.8V AUX
(BB +1.8V AUX)
Voltage Sensors
Table 14: Voltage Sensors – Next Steps
16h
BB +3.3V
(BB +3.3V)
Voltage Sensors
Table 14: Voltage Sensors – Next Steps
17h
BB +3.3V STBY
(BB +3.3V STBY)
Voltage Sensors
Table 14: Voltage Sensors – Next Steps
18h
BB +3.3V Vbat
(BB +3.3V Vbat)
Voltage Sensors
Table 14: Voltage Sensors – Next Steps
19h
BB +5.0V
(BB +5.0V)
Voltage Sensors
Table 14: Voltage Sensors – Next Steps
1Ah
BB +5.0V STBY
(BB +5.0V STBY)
Voltage Sensors
Table 14: Voltage Sensors – Next Steps
1Bh
BB +12.0V
(BB +12.0V)
Voltage Sensors
Table 14: Voltage Sensors – Next Steps
1Ch
BB -12.0V
(BB -12.0V)
Voltage Sensors
Table 14: Voltage Sensors – Next Steps
1Dh
BB +1.35V P1 LV DDR3
(BB +1.35v P1 MEM)
Voltage Sensors
Table 14: Voltage Sensors – Next Steps
Revision 1.0 Intel order number G74211-001 9
Page 19
Sensor Cross Reference List System Event Log Troubleshooting Guide for Intel® S5500/S3420 series Server Boards
Sensor
Number
Sensor Name
Details Section
Next Steps
1Eh
BB +1.35V P2 LV DDR3
(BB +1.35v P2 MEM)
Voltage Sensors
Table 14: Voltage Sensors – Next Steps
20h
Baseboard Temperature
(Baseboard Temp)
Regular Temperature sensors
Table 35: Temperature Sensors – Next Steps
21h
Front Panel Temperature
(Front Panel Temp)
Regular Temperature sensors
Table 35: Temperature Sensors – Next Steps
22h
IOH Thermal Margin
(IOH Therm Margin)
Thermal Margin Sensors
Table 38: Thermal Margin Sensors – Next Steps
23h
Processor 1 Memory Thermal
Margin
(Mem P1 Thrm Mrgn)
Thermal Margin Sensors
Table 38: Thermal Margin Sensors – Next Steps
24h
Processor 2 Memory Thermal
Margin
(Mem P2 Thrm Mrgn)
Thermal Margin Sensors
Table 38: Thermal Margin Sensors – Next Steps
30h–39h
Fan Tachometer Sensors
(Chassis specific
sensor names)
Fan Speed Sensors
Table 28: Fan Speed Sensor – Event Trigger Offset – Next Steps
40h–45h
Fan Present Sensors
(Fan x Present)
Fan Presence and Redundancy
Sensors
Table 30: Fan Presence Sensors – Event Trigger Offset – Next Steps
46h
Fan Redundancy
(Fan Redundancy)
Fan Presence and Redundancy
Sensors
Table 32: Fan Redundancy Sensor – Event Trigger Offset – Next Steps
50h
Power Supply 1 Status
(PS1 Status)
Power Supply Status Sensors
Table 16: Power Unit Status Sensor – Sensor Specific Offsets – Next Steps
51h
Power Supply 2 Status
(PS2 Status)
Power Supply Status Sensors
Table 16: Power Unit Status Sensor – Sensor Specific Offsets – Next Steps
52h
Power Supply 1
AC Power Input
(PS1 Power In)
Power Supply AC Power Input
Sensors
Table 22: Power Supply AC Power Input Sensor – Event Trigger Offset – Next
Steps
53h
Power Supply 2
AC Power Input
(PS2 Power In)
Power Supply AC Power Input
Sensors
Table 22: Power Supply AC Power Input Sensor – Event Trigger Offset – Next
Steps
10 Intel order number G74211-001 Revision 1.0
Page 20
System Event Log Troubleshooting Guide for Intel® S5500/S3420 series Server Boards Sensor Cross Reference List
Sensor
Number
Sensor Name
Details Section
Next Steps
54h
Power Supply 1 +12V % of
Maximum Current Output
(PS1 Curr Out %)
Power Supply Current Output %
Sensors
Table 24: Power Supply Current Output % Sensor – Event Trigger Offset – Next
Steps
55h
Power Supply 2 +12V % of
Maximum Current Output
(PS2 Curr Out %)
Power Supply Current Output %
Sensors
Table 24: Power Supply Current Output % Sensor – Event Trigger Offset – Next
Steps
56h
Power Supply 1 Temperature
(PS1 Temperature)
Power Supply Temperature Sensors
Table 26: Power Supply Temperature Sensor – Event Trigger Offset – Next Steps
57h
Power Supply 2 Temperature
(PS2 Temperature)
Power Supply Temperature Sensors
Table 26: Power Supply Temperature Sensor – Event Trigger Offset – Next Steps
60h
Processor 1 Status
(P1 Status)
Processor Status Sensor
Table 45: Processor Status Sensors – Next Steps
61h
Processor 2 Status
(P2 Status)
Processor Status Sensor
Table 45: Processor Status Sensors – Next Steps
62h
Processor 1 Thermal Margin
(P1 Therm Margin)
Thermal Margin Sensors
Table 38: Thermal Margin Sensors – Next Steps
63h
Processor 2 Thermal Margin
(P2 Therm Margin)
Thermal Margin Sensors
Table 38: Thermal Margin Sensors – Next Steps
64h
Processor 1 Thermal Control %
(P1 Therm Ctrl %)
Processor Thermal Control %
Sensors
Table 41: Processor Thermal Control % Sensors – Next Steps
65h
Processor 2 Thermal Control %
(P2 Therm Ctrl %)
Processor Thermal Control %
Sensors
Table 41: Processor Thermal Control % Sensors – Next Steps
Revision 1.0 Intel order number G74211-001 11
Page 21
Sensor Cross Reference List System Event Log Troubleshooting Guide for Intel® S5500/S3420 series Server Boards
Sensor
Number
Sensor Name
Details Section
Next Steps
66h
Processor 1 VRD Temp
(P1 VRD Hot)
Discrete Thermal Sensors
Table 43: Discrete Thermal Sensors
67h
Processor 2 VRD Temp
(P2 VRD Hot)
Discrete Thermal Sensors
Table 43: Discrete Thermal Sensors
68h
Catastrophic Error
(CATERR)
Catastrophic Error Sensor
Catastrophic Error Sensor– Next Steps
69h
CPU Missing
(CPU Missing)
CPU Missing Sensor
CPU Missing Sensor – Next Steps
6Ah
IOH Thermal Trip
(IOH Thermal Trip)
Discrete Thermal Sensors
Table 43: Discrete Thermal Sensors
Sensor
Number
Sensor Name
Details Section
Next Steps
01h
Mirroring Redundancy State
Mirrored Redundancy State Sensor
Table 55: Mirrored Redundancy State Sensor Event Trigger Offset – Next Steps
06h
POST Error
System Firmware Progress (Formerly
Post Error)
System Firmware Progress (Formerly Post Error) – Next Steps
11h
Sparing Redundancy State
Sparing Redundancy State Sensor
Table 59: Sparing Redundancy State Sensor Event Trigger Offset – Next Steps
12h
Mirroring Configuration Status
Mirroring Configuration Status
Table 53: Mirroring Configuration Status Sensor Event Trigger Offset – Next Steps
13h
Sparing Configuration Status
Sparing Configuration Status
Table 57: Sparing Configuration Status Sensor Event Trigger Offset – Next Steps
83h
System Event
System Events
Not applicable
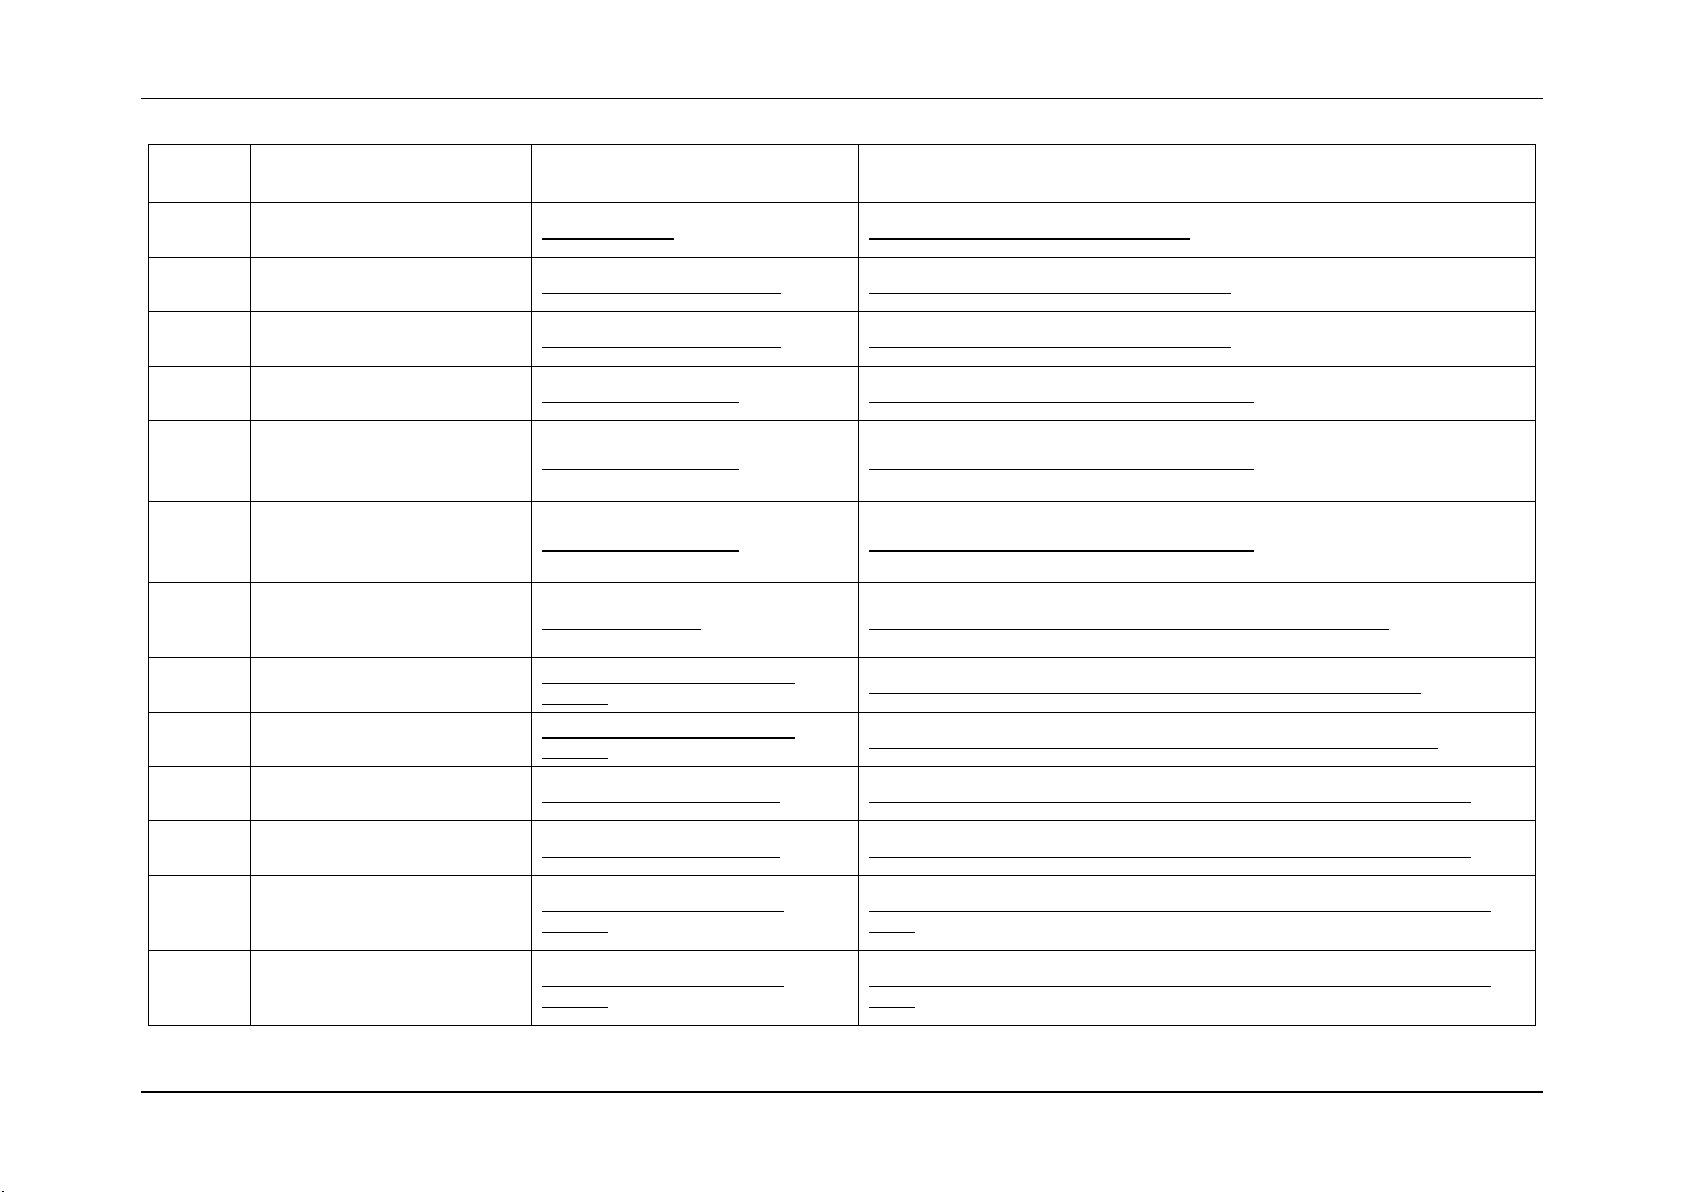
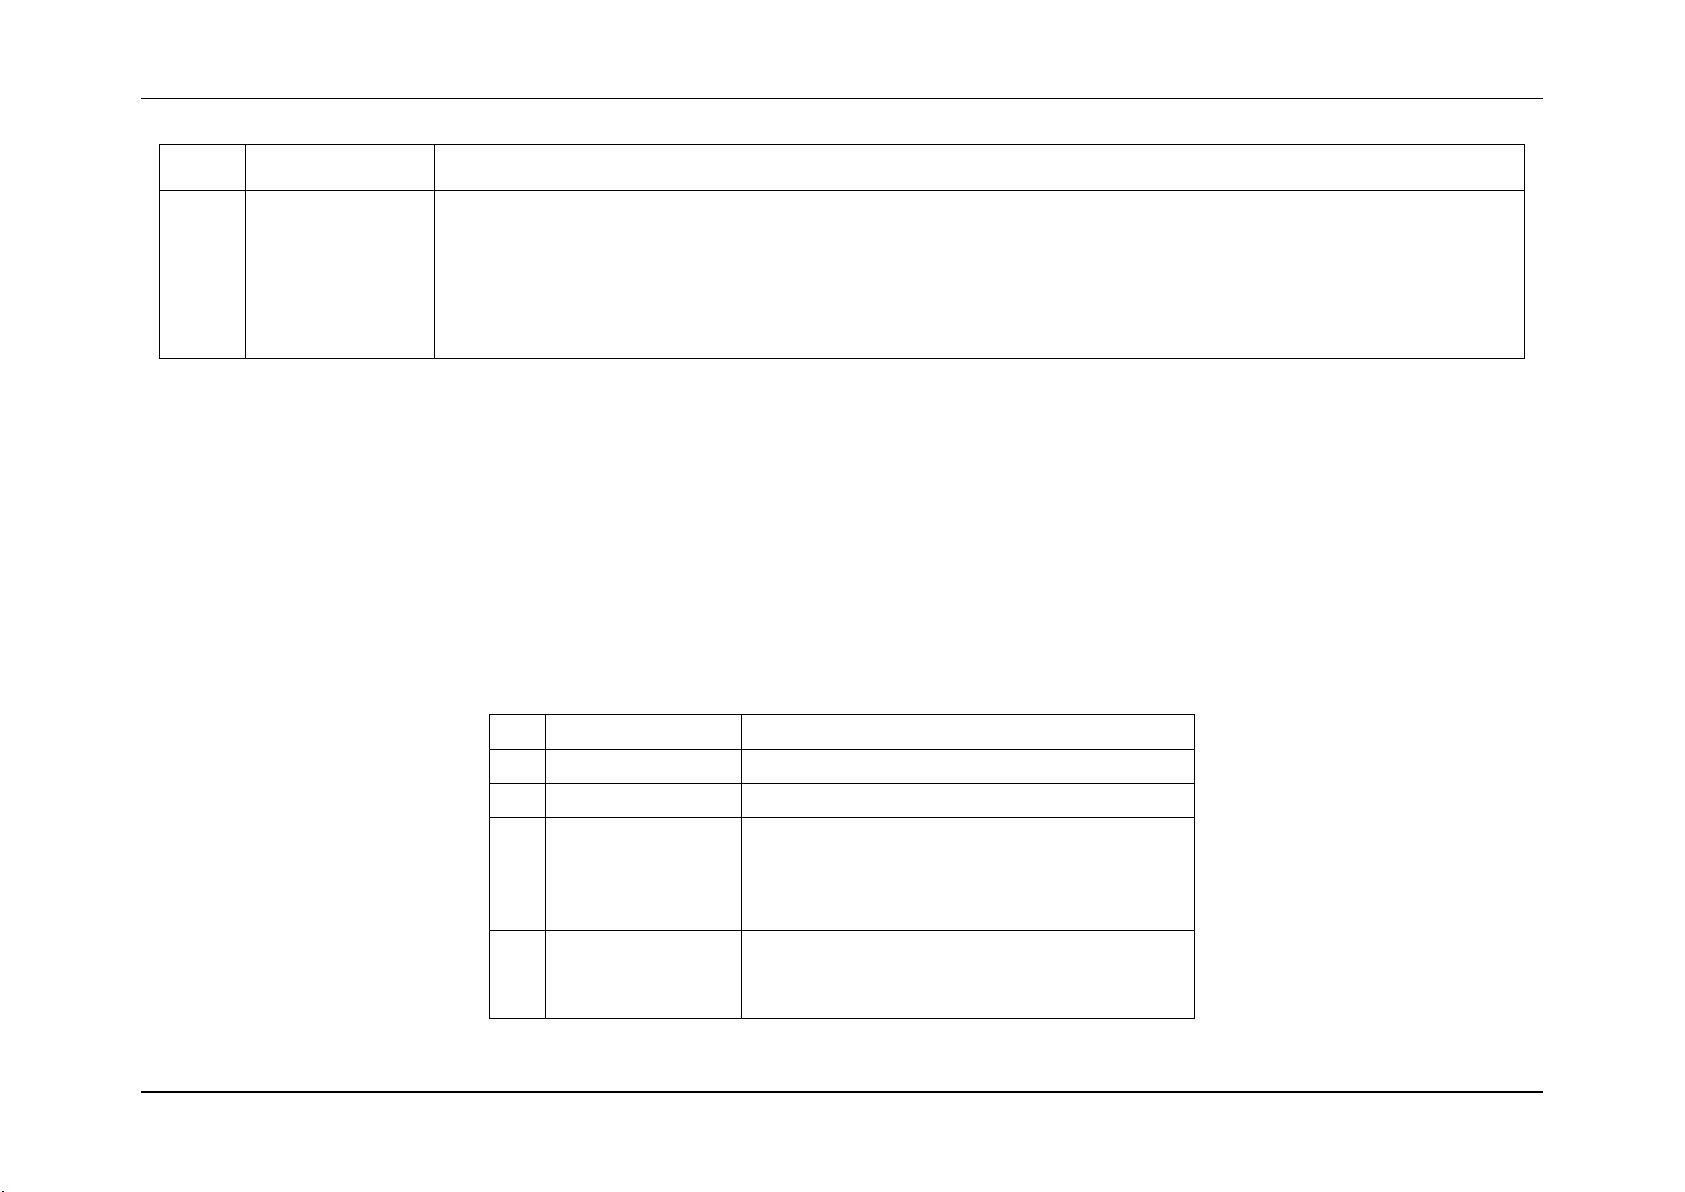
3.2 BIOS POST owned Sensors (GID = 0001h)
The following table can be used to find the details of sensors owned by BIOS POST.
Table 6: BIOS POST owned Sensors
12 Intel order number G74211-001 Revision 1.0
Page 22
System Event Log Troubleshooting Guide for Intel® S5500/S3420 series Server Boards Sensor Cross Reference List
Sensor
Number
Sensor Name
Details Section
Next Steps
02h
Memory ECC Error
Memory Correctable and
Uncorrectable ECC Error
Table 61: Correctable and Uncorrectable ECC Error Sensor Event Trigger Offset –
Next Steps
03h
Legacy PCI Error
Legacy PCI Errors
Table 68: Legacy PCI Error Sensor Event Trigger Offset – Next Steps
04h
PCI Express Fatal Error
PCI Express Fatal Errors
Table 66: PCI Express Fatal Error Sensor Event Trigger Offset – Next Steps
05h
PCI Express Correctable Error
PCI Express Correctable errors
Table 64: PCI Express Correctable Error Sensor Event Trigger Offset – Next Steps
06h
Intel® QuickPath Interface
Correctable Error
QPI Correctable Error Sensor
QPI Correctable Error Sensor – Next Steps
07h
Intel® QuickPath Interface Nonfatal Error
QPI Non-Fatal Error Sensor
QPI Non-Fatal Error Sensor – Next Steps
14h
Memory Address Parity Error
Memory Address Parity Error
Memory Address Parity Error Sensor Next Steps
17h
Intel® QuickPath Interface Fatal
Error
QPI Fatal and Fatal #2
QPI Fatal and Fatal #2 – Next Steps
18h
Intel® QuickPath Interface
Fatal2 Error
QPI Fatal and Fatal #2
QPI Fatal and Fatal #2 – Next Steps
83h
System Event
System Events
Not applicable
3.3 BIOS SMI owned Sensors (GID = 0033h)
The following table can be used to find the details of sensors owned by BIOS SMI.
Table 7: BIOS SMI owned Sensors
Revision 1.0 Intel order number G74211-001 13
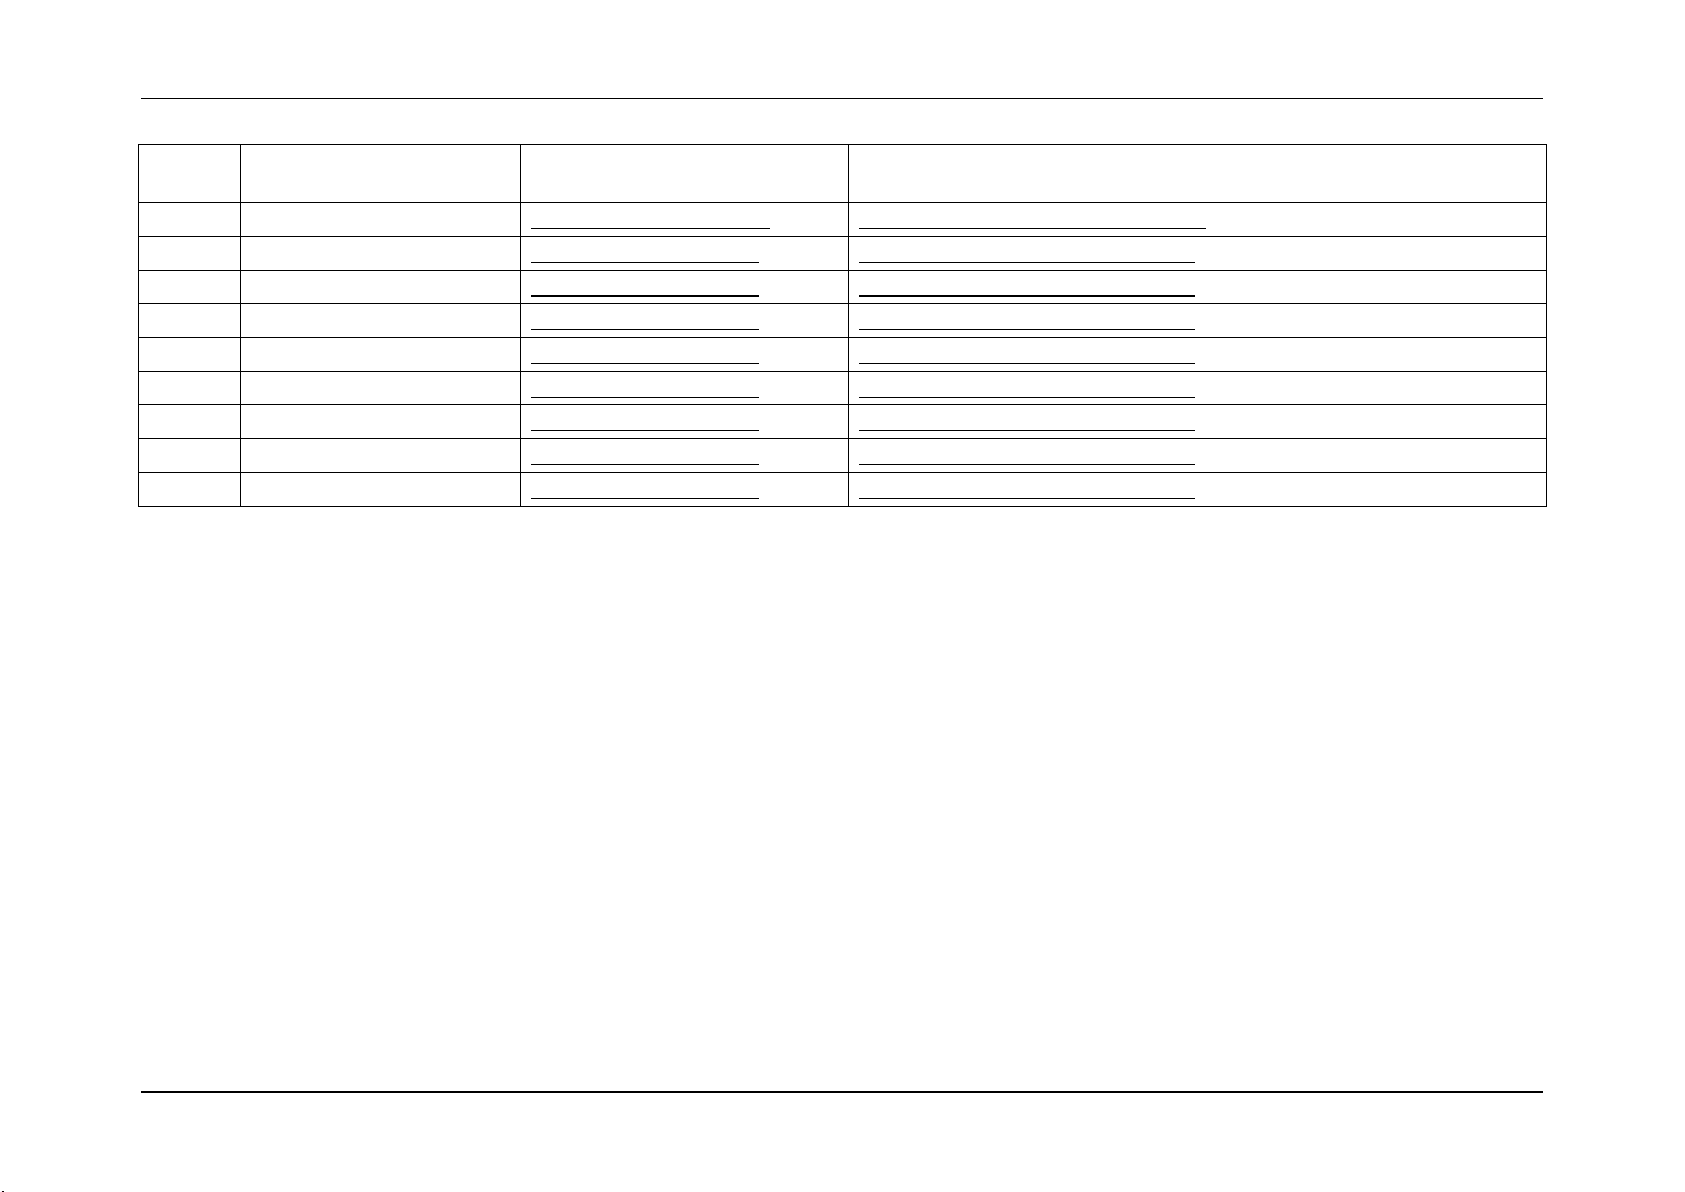
Page 23
Sensor Cross Reference List System Event Log Troubleshooting Guide for Intel® S5500/S3420 series Server Boards
Sensor
Number
Sensor Name
Details Section
Next Steps
01h
Backplane Temperature
HSC Backplane Temperature Sensor
Table 82: HSC Backplane Temperature Sensor – Event Trigger Offset – Next Steps
02h
Drive Slot 0 Status
HSC Drive Slot Status Sensor
HSC Drive Slot Status Sensor – Next Steps
03h
Drive Slot 1 Status
HSC Drive Slot Status Sensor
HSC Drive Slot Status Sensor – Next Steps
04h
Drive Slot 2 Status
HSC Drive Slot Status Sensor
HSC Drive Slot Status Sensor – Next Steps
05h
Drive Slot 3 Status
HSC Drive Slot Status Sensor
HSC Drive Slot Status Sensor – Next Steps
06h
Drive Slot 4 Status
HSC Drive Slot Status Sensor
HSC Drive Slot Status Sensor – Next Steps
07h
Drive Slot 5 Status
HSC Drive Slot Status Sensor
HSC Drive Slot Status Sensor – Next Steps
6 Slot HSBP
08h
Drive Slot 0 Presence
HSC Drive Presence Sensor
HSC Drive Presence Sensor – Next Steps
09h
Drive Slot 1 Presence
HSC Drive Presence Sensor
HSC Drive Presence Sensor – Next Steps
0Ah
Drive Slot 2 Presence
HSC Drive Presence Sensor
HSC Drive Presence Sensor – Next Steps
0Bh
Drive Slot 3 Presence
HSC Drive Presence Sensor
HSC Drive Presence Sensor – Next Steps
0Ch
Drive Slot 4 Presence
HSC Drive Presence Sensor
HSC Drive Presence Sensor – Next Steps
0Dh
Drive Slot 5 Presence
HSC Drive Presence Sensor
HSC Drive Presence Sensor – Next Steps
8 Slot HSBP
08h
Drive Slot 6 Status
HSC Drive Slot Status Sensor
HSC Drive Slot Status Sensor – Next Steps
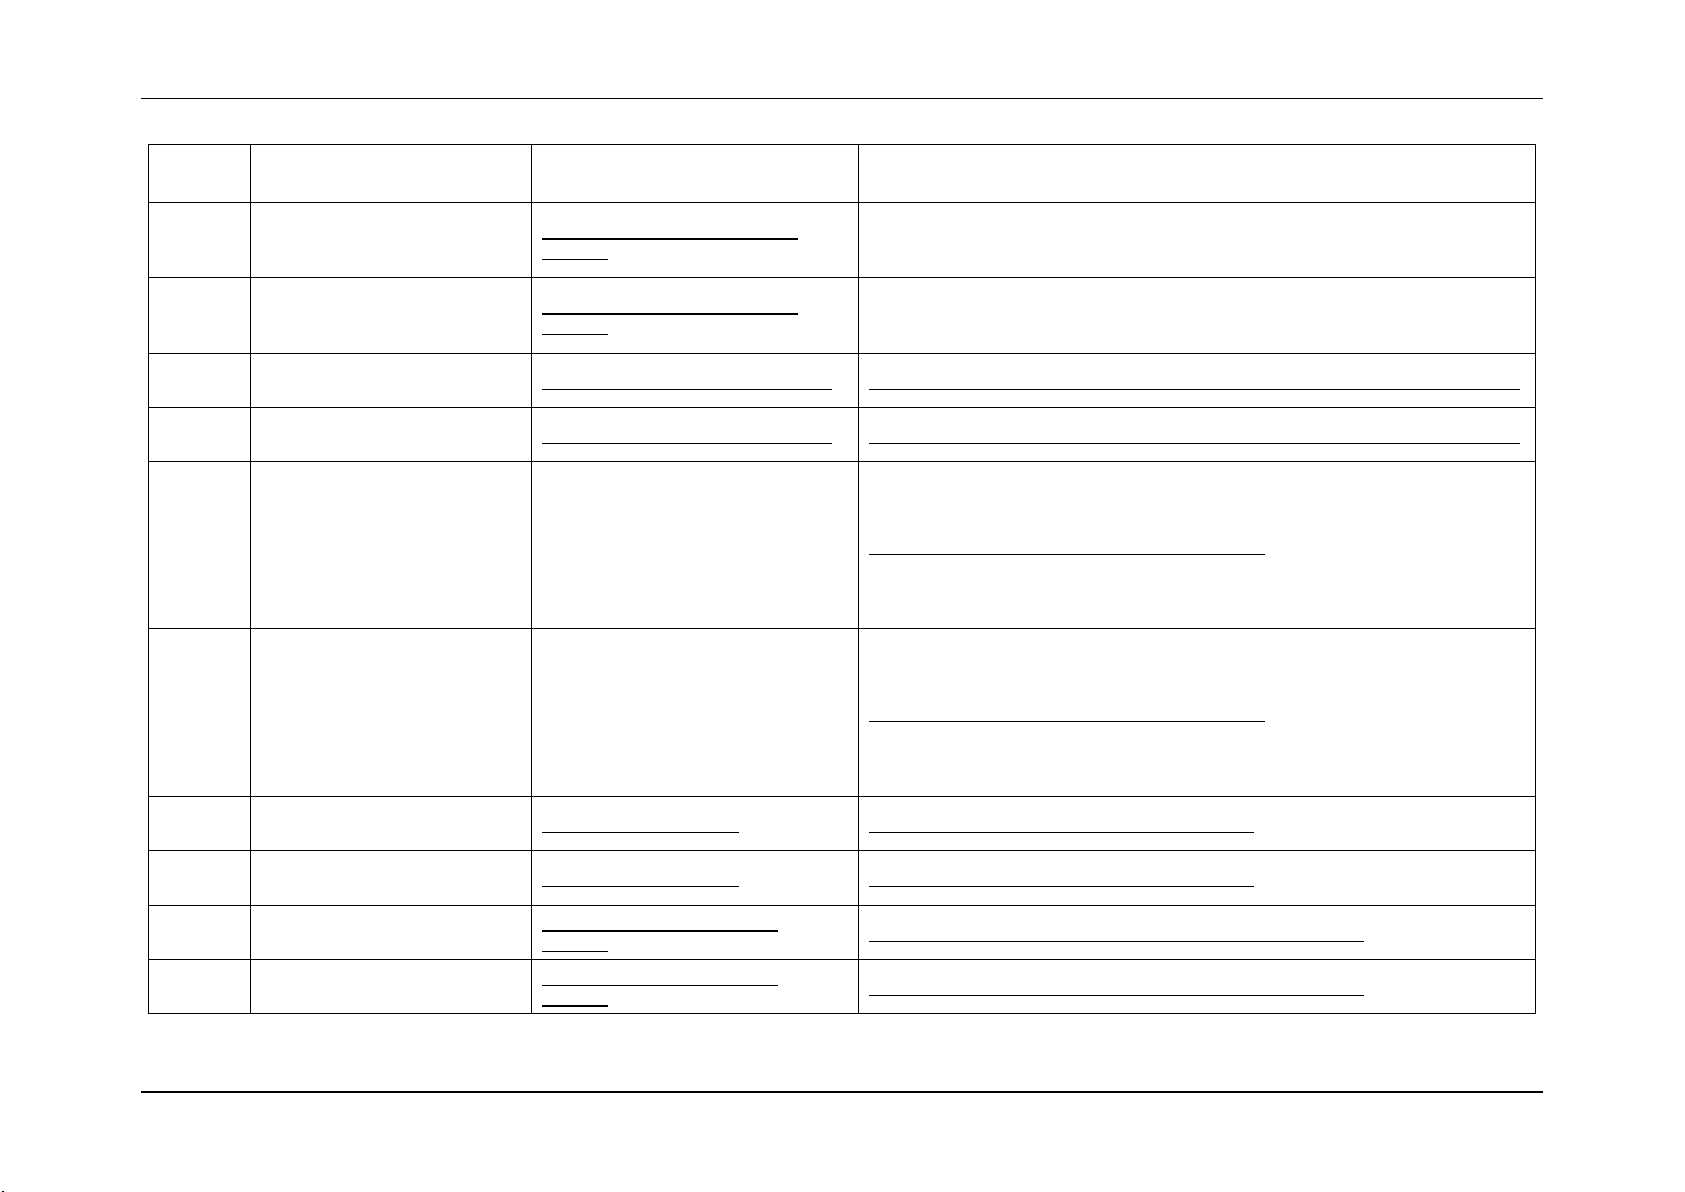
3.4 Hot Swap Controller Firmware owned Sensors (GID = 00C0h/00C2h)
The following table can be used to find the details of sensors owned by the Hot Swap Controller (HSC) firmware. The HSC firmware resides on
a Hot Swap Back Planes (HSBP). There can be up to two HSBP in a system. Each HSBP will have its own GID.
00C0h = HSC Firmware – HSBP A
00C2h = HSC Firmware – HSBP B
Table 8: Hot Swap Controller Firmware owned Sensors
14 Intel order number G74211-001 Revision 1.0
Page 24
System Event Log Troubleshooting Guide for Intel® S5500/S3420 series Server Boards Sensor Cross Reference List
Sensor
Number
Sensor Name
Details Section
Next Steps
09h
Drive Slot 7 Status
HSC Drive Slot Status Sensor
HSC Drive Slot Status Sensor – Next Steps
0Ah
Drive Slot 0 Presence
HSC Drive Presence Sensor
HSC Drive Presence Sensor – Next Steps
0Bh
Drive Slot 1 Presence
HSC Drive Presence Sensor
HSC Drive Presence Sensor – Next Steps
0Ch
Drive Slot 2 Presence
HSC Drive Presence Sensor
HSC Drive Presence Sensor – Next Steps
0Dh
Drive Slot 3 Presence
HSC Drive Presence Sensor
HSC Drive Presence Sensor – Next Steps
0Eh
Drive Slot 4 Presence
HSC Drive Presence Sensor
HSC Drive Presence Sensor – Next Steps
0Fh
Drive Slot 5 Presence
HSC Drive Presence Sensor
HSC Drive Presence Sensor – Next Steps
10h
Drive Slot 6 Presence
HSC Drive Presence Sensor
HSC Drive Presence Sensor – Next Steps
11h
Drive Slot 7 Presence
HSC Drive Presence Sensor
HSC Drive Presence Sensor – Next Steps
Revision 1.0 Intel order number G74211-001 15
Page 25
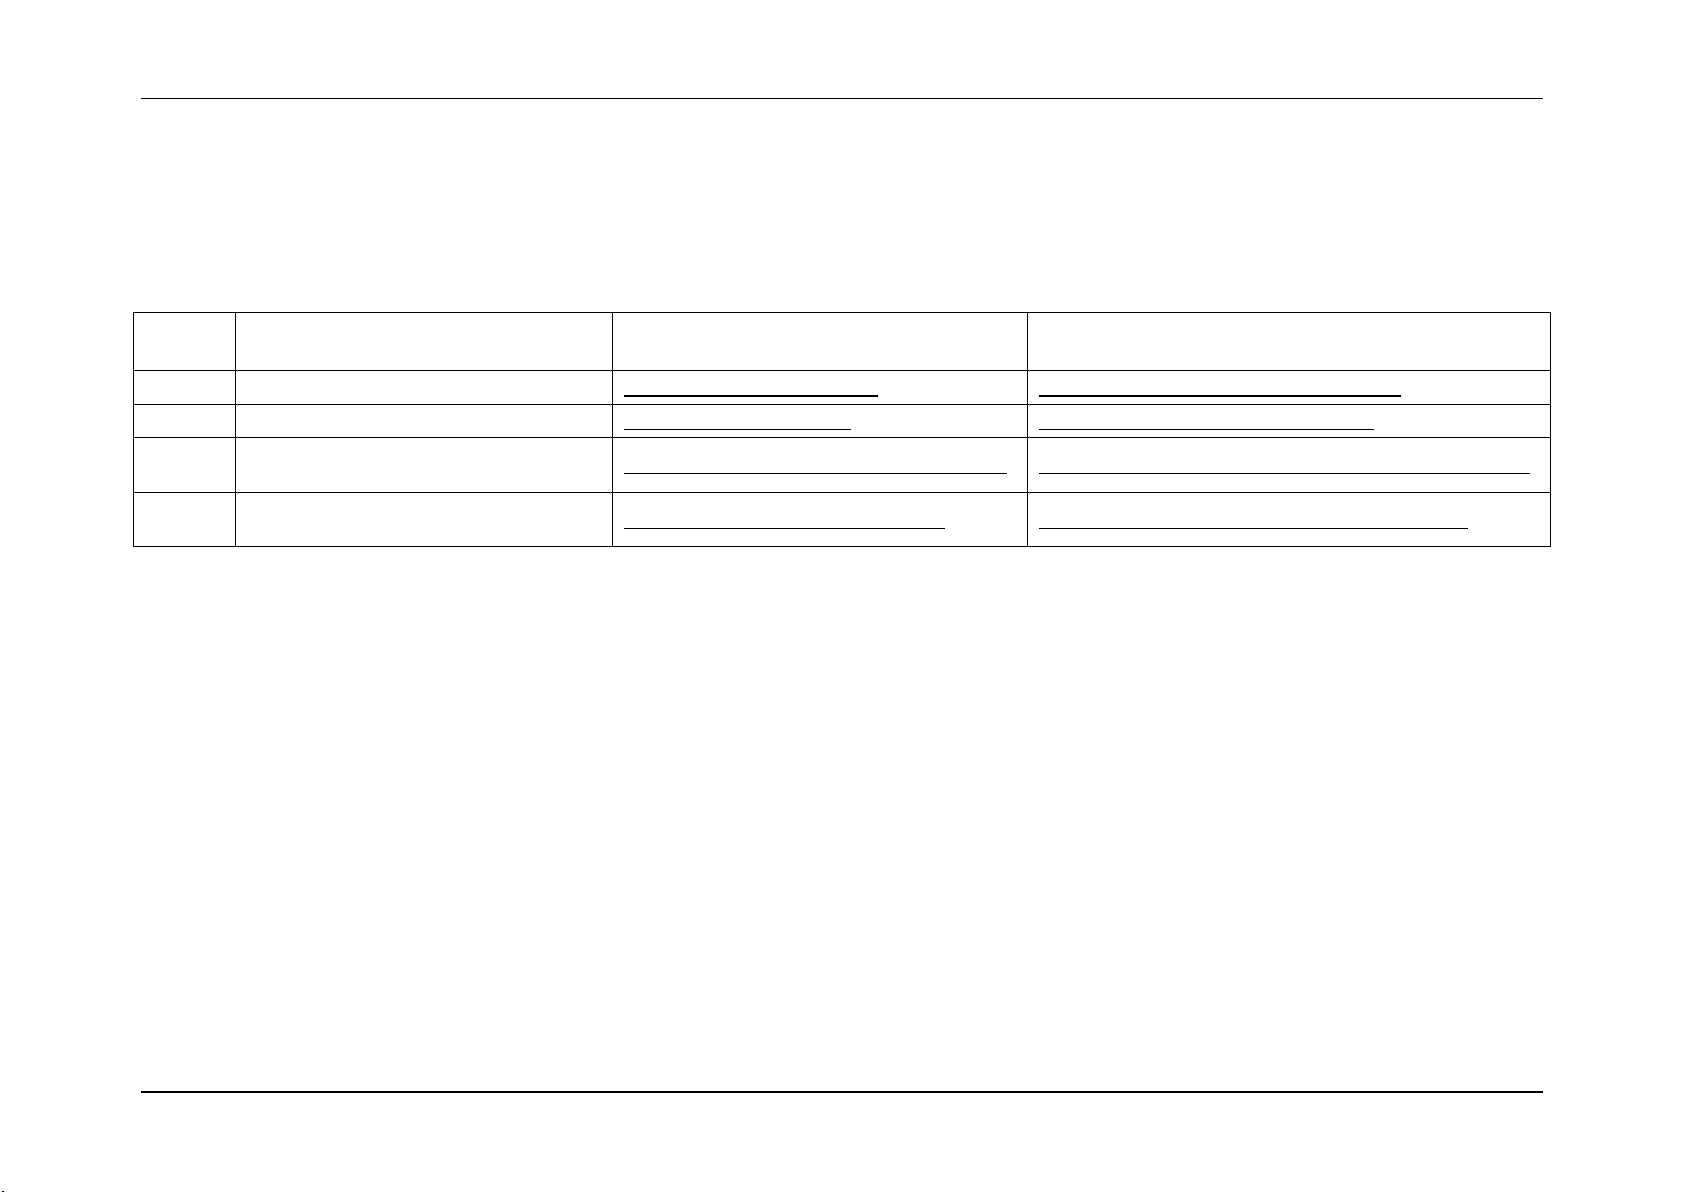
Sensor Cross Reference List System Event Log Troubleshooting Guide for Intel® S5500/S3420 series Server Boards
Sensor
Number
Sensor Name
Details Section
Next Steps
18h
Node Manager Exception Events
Node Manager Exception Event
Node Manager Exception Event – Next Steps
19h
Node Manager Health Events
Node Manager Health Event
Node Manager Health Event – Next Steps
1Ah
Node Manager Operational Capabilities
Change Events
Node Manager Operational Capabilities Change
Node Manager Operational Capabilities Change – Next Steps
1Bh
Node Manager Alert Threshold Exceeded
Events
Node Manger Alert Threshold Exceeded
Node Manger Alert Threshold Exceeded – Next Steps
3.5 Node Manager/ME Firmware owned Sensors (GID = 002Ch)
The following table can be used to find the details of sensors owned by the Node Manager/Management Engine (ME) firmware.
Table 9: Management Engine Firmware owned Sensors
16 Intel order number G74211-001 Revision 1.0
Page 26
System Event Log Troubleshooting Guide for Intel® S5500/S3420 series Server Boards Sensor Cross Reference List
Sensor Name
Record
Type
Sensor Type
Details Section
Next Steps
Boot Event
02h
1Fh = OS Boot
Table 89: Boot up Event Record Typical Characteristics
Not applicable
DCh
Not applicable
Table 90: Boot up OEM Event Record Typical Characteristics
Shutdown Event
02h
20h = OS Stop/Shutdown
Table 91: Shutdown Reason Code Event Record Typical Characteristics
Not applicable
DDh
Not applicable
Table 92: Shutdown Reason OEM Event Record Typical Characteristics
Table 93: Shutdown Comment OEM Event Record Typical Characteristics
Not applicable
Bug Check/Blue Screen
02h
20h = OS Stop/Shutdown
Table 94: Bug Check/Blue Screen – OS Stop Event Record Typical Characteristics
Not applicable
DEh
Not applicable
Table 95: Bug Check/Blue Screen code OEM Event Record Typical Characteristics
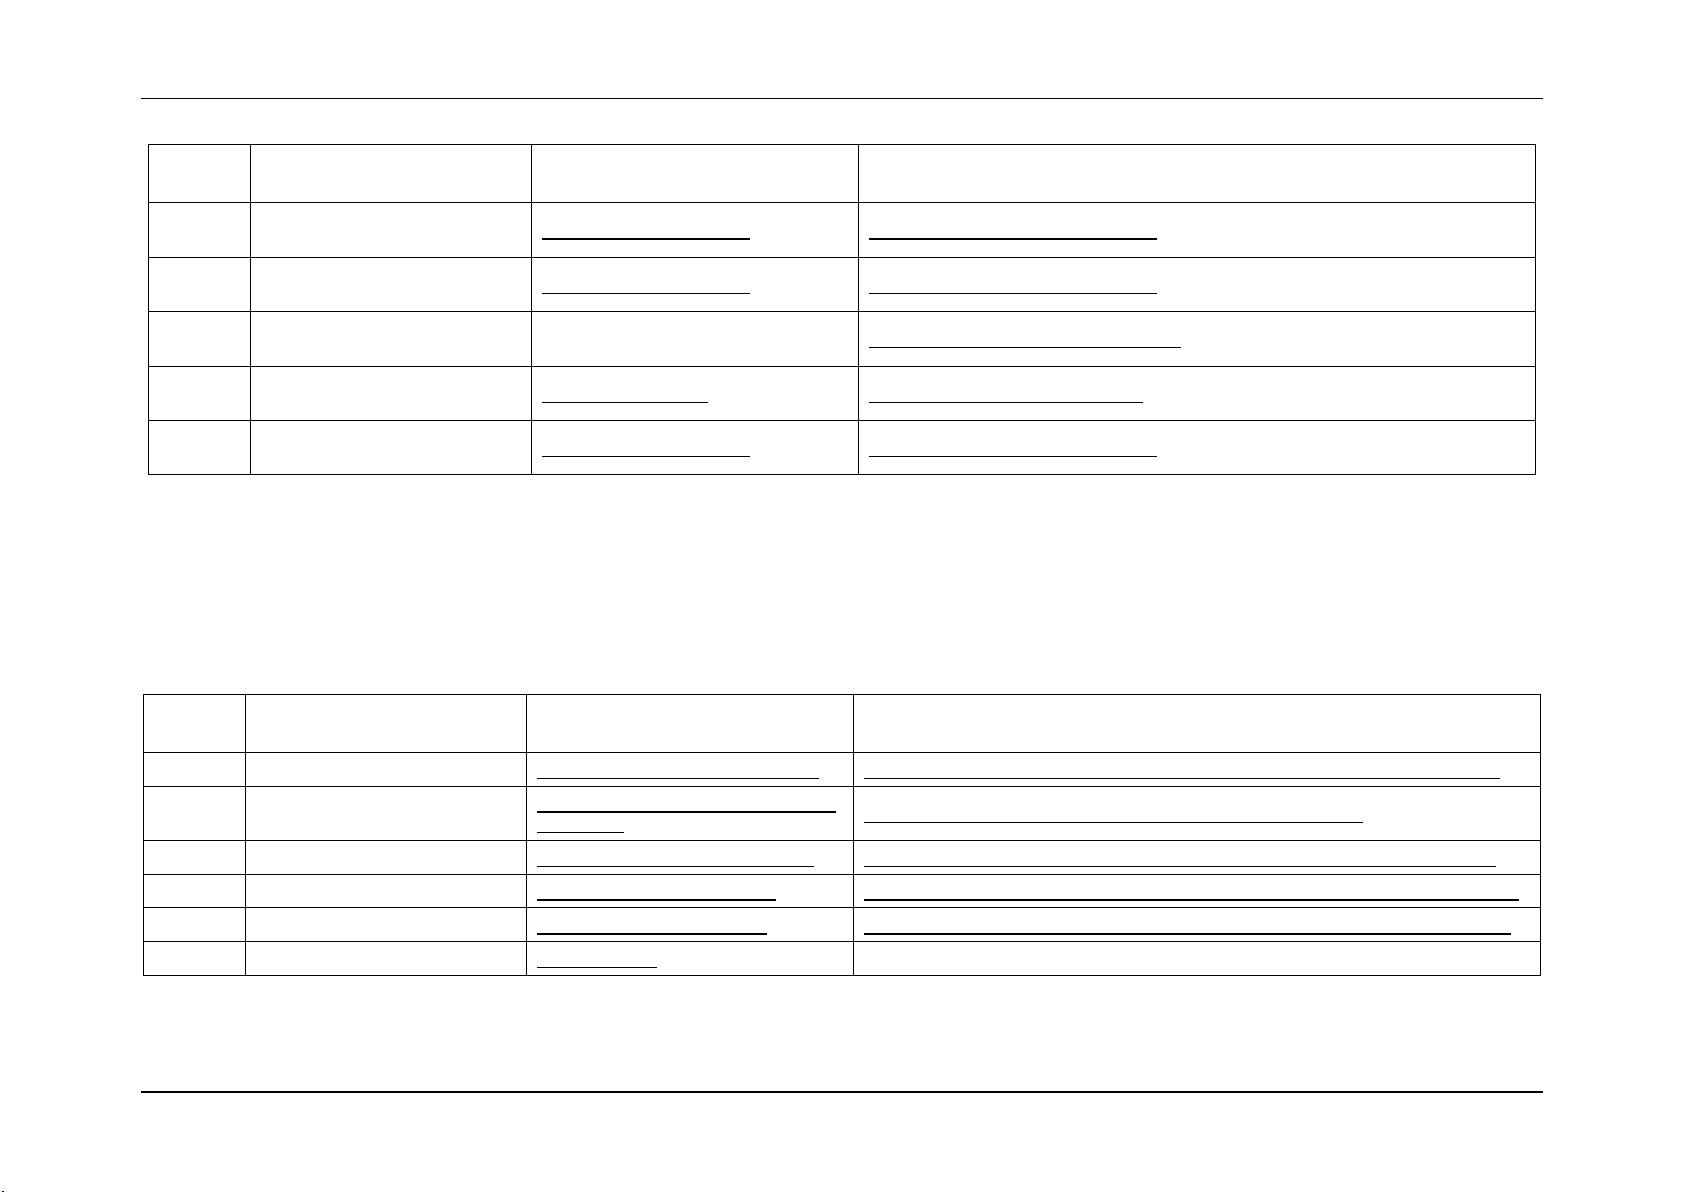
3.6 Microsoft* OS owned Events (GID = 0041)
The following table can be used to find the details of records that are owned by the Microsoft* Operating System (OS).
Table 10: Microsoft* OS owned Events
Revision 1.0 Intel order number G74211-001 17
Page 27
Sensor Cross Reference List System Event Log Troubleshooting Guide for Intel® S5500/S3420 series Server Boards
Sensor Name
Record
Type
Sensor Type
Details Section
Next Steps
Linux* Kernel Panic
02h
20h = OS Stop/Shutdown
Table 96: Linux* Kernel Panic Event Record Characteristics
Not applicable
F0h
Not applicable
Table 97: Linux* Kernel Panic String Extended Record Characteristics
3.7 Linux* Kernel Panic Events (GID = 0021)
The following table can be used to find the details of records that can be generated when there is a Linux* Kernel panic.
Table 11: Linux* Kernel Panic Events
18 Intel order number G74211-001 Revision 1.0
Page 28

System Event Log Troubleshooting Guide for Intel® S5500/S3420 series Server Boards Power Subsystems
Byte
Field
Description
11
Sensor Type
02h = Voltage
12
Sensor Number
See Table 14
13
Event Direction and
Event Type
[7] Event direction
0b = Assertion Event
1b = Deassertion Event
[6:0] Event Type = 01h (Threshold)
14
Event Data 1
[7:6] – 01b = Trigger reading in Event Data 2
[5:4] – 01b = Trigger threshold in Event Data 3
[3:0] – Event Triggers as described in Table 13
15
Event Data 2
Reading that triggered event
16
Event Data 3
Threshold value that triggered event
4. Power Subsystems
The BMC monitors the power subsystem including power supplies, select onboard voltages, and related sensors.
4.1 Voltage Sensors
The BMC monitors the main voltage sources in the system, including the baseboard, memory, and processors, using IPMI compliant
analog/threshold sensors.
Note: A voltage error could be caused by the device supplying the voltage or by the device using the voltage. For each sensor it will be noted
who is supplying the voltage and who is using it.
Table 12: Voltage Sensors Typical Characteristics
The following table describes the severity of each of the event triggers for both assertion and for deassertion.
Revision 1.0 Intel order number G74211-001 19
Page 29
Power Subsystems System Event Log Troubleshooting Guide for Intel® S5500/S3420 series Server Boards
Event Trigger
Assertion
Severity
Deassert
Severity
Description
Hex
Description
00h
Lower non critical
going low
Degraded
OK
The voltage has dropped below its lower non critical threshold.
02h
Lower critical
going low
non-fatal
Degraded
The voltage has dropped below its lower critical threshold.
07h
Upper non critical
going high
Degraded
OK
The voltage has gone over its upper non critical threshold.
09h
Upper critical
going high
non-fatal
Degraded
The voltage has gone over its upper critical threshold.
Sensor
Number
Sensor Name
Next Steps
10h
BB +1.1V IOH
This 1.1V line is supplied by the main board.
This 1.1V line is used by the I/O hub (IOH)
1. Ensure all cables are connected correctly.
2. If the issue remains, replace the motherboard.
11h
BB +1.1V P1 Vccp
This 1.1V line is supplied by the main board.
This 1.1V line is used by processor 1.
1. Ensure all cables are connected correctly.
2. Cross test processor if possible. If the issue remains with the socket, replace the main board, otherwise the processor.
12h
BB +1.1V P2 Vccp
This 1.1V line is supplied by the main board.
This 1.1V line is used by processor 2.
1. Ensure all cables are connected correctly.
2. Cross test processor if possible. If the issue remains with the socket, replace the main board, otherwise the processor.
Table 13: Voltage Sensors Event Triggers – Description
Table 14: Voltage Sensors – Next Steps
20 Intel order number G74211-001 Revision 1.0
Page 30

System Event Log Troubleshooting Guide for Intel® S5500/S3420 series Server Boards Power Subsystems
Sensor
Number
Sensor Name
Next Steps
13h
BB +1.5V P1 DDR3
This 1.5V line is supplied by the main board.
This 1.5V line is used by the memory on processor 1.
1. Ensure all cables are connected correctly.
2. Check the DIMMs are seated properly.
3. Cross test DIMMs. If the issue remains with the DIMMs on this socket, replace the main board, otherwise replace the DIMM.
14h
BB +1.5V P2 DDR3
This 1.5V line is supplied by the main board.
This 1.5V line is used by the memory on processor 2.
1. Ensure all cables are connected correctly.
2. Check the DIMMs are seated properly.
3. Cross test DIMMs. If the issue remains with the DIMMs on this socket, replace the main board, otherwise the DIMM.
15h
BB +1.8V AUX
+1.8V is supplied by the main board.
+1.8V is used by the onboard NIC and I/O hub.
1. Ensure all cables are connected correctly.
2. If the issue remains, replace the main board.
16h
BB +3.3V
+3.3V is supplied by the power supplies
+3.3V is used by the PCIe and PCI-X slots.
1. Ensure all cables are connected correctly.
2. Reseat any PCI cards, try other slots.
3. If the issue follows the card, swap it, otherwise, replace the main board.
4. If the issue remains, replace the power supplies.
17h
BB +3.3V STBY
+3.3V Stby is supplied by the main board.
+3.3V Stby is used by the BMC, On-board NIC, IOH, and ICH.
1. Ensure all cables are connected correctly.
2. If the issue remains, replace the board.
3. If the issue remains, replace the power supplies.
18h
BB +3.3V Vbat
+3.3V Vbat is supplied by the CMOS battery when power is off and by the main board when power is on.
+3.3V Vbat is used by the CMOS and related circuits.
1. Replace the CMOS battery. Any battery of type CR2032 can be used.
2. If error remains (unlikely), replace the board.
Revision 1.0 Intel order number G74211-001 21
Page 31

Power Subsystems System Event Log Troubleshooting Guide for Intel® S5500/S3420 series Server Boards
Sensor
Number
Sensor Name
Next Steps
19h
BB +5.0V
+5.0V is supplied by the power supplies
+5.0V is used by the PCI slots.
1. Ensure all cables are connected correctly.
2. Reseat any PCI cards, try other slots.
3. If the issue follows the card, swap it, otherwise, replace the main board.
4. If the issue remains, replace the power supplies.
1Ah
BB +5.0V STBY
+5.0V STBY is supplied by the power supplies
+5.0V STBY is used to generate other standby voltages.
1. Ensure all cables are connected correctly.
2. If the issue remains, replace the board.
3. If the issue remains, replace the power supplies.
1Bh
BB +12.0V
+12V is supplied by the power supplies
+12V is used by SATA drives, Fans, and PCI cards. In addition it is used to generate various processor voltages.
1. Ensure all cables are connected correctly.
2. Check connections on fans and HDD's.
3. If the issue follows the component, swap it, otherwise, replace the board.
4. If the issue remains, replace the power supplies.
1Ch
BB -12.0V
-12V is supplied by the power supplies
-12V is used by the serial port and by PCI cards. In addition it is used to generate various processor voltages.
1. Ensure all cables are connected correctly.
2. Reseat any PCI cards, try other slots.
3. If the issue follows the card, swap it, otherwise, replace the main board.
4. If the issue remains, replace the power supplies.
1Dh
BB +1.35 P1 Mem
This 1.35V line is supplied by the main board.
This 1.35V line is used by low voltage memory on processor 1.
1. Ensure all cables are connected correctly.
2. Check the DIMMs are seated properly.
3. Cross test DIMMs.
4. If the issue remains with the DIMMs on this socket, replace the main board, otherwise the DIMM.
22 Intel order number G74211-001 Revision 1.0
Page 32
System Event Log Troubleshooting Guide for Intel® S5500/S3420 series Server Boards Power Subsystems
Sensor
Number
Sensor Name
Next Steps
1Eh
BB +1.35 P2 Mem
This 1.35V line is supplied by the main board.
This 1.35V line is used by low voltage memory on processor 2.
1. Ensure all cables are connected correctly.
2. Check the DIMMs are seated properly.
3. Cross test DIMMs
4. If the issue remains with the DIMMs on this socket, replace the main board, otherwise the DIMM.
Byte
Field
Description
11
Sensor Type
09h = Power Unit
12
Sensor Number
01h
13
Event Direction and
Event Type
[7] Event direction
0b = Assertion Event
1b = Deassertion Event
[6:0] Event Type = 6Fh (Sensor Specific)
14
Event Data 1
[7:6] – 00b = Unspecified Event Data 2
[5:4] – 00b = Unspecified Event Data 3
[3:0] = Sensor Specific offset as described in Table 9
4.2 Power Unit
The power unit monitors the power state of the system and logs the state changes in the SEL.
4.2.1 Power Unit Status Sensor
The power unit status sensor monitors the power state of the system and logs state changes. Expected power on events such as DC ON/OFF
are logged and unexpected events are also logged, such as AC loss and power good loss.
Table 15: Power Unit Status Sensors Typical Characteristics
Revision 1.0 Intel order number G74211-001 23
Page 33

Power Subsystems System Event Log Troubleshooting Guide for Intel® S5500/S3420 series Server Boards
Byte
Field
Description
15
Event Data 2
Not used
16
Event Data 3
Not used
Sensor Specific Offset
Description
Next Steps
Hex
Description
00h
Power down
System is powered down
Informational Event
04h
A/C Lost
AC removed
Informational Event
05h
Soft Power Control
Failure
Generally means power good was lost
in the system, causing a shutdown.
This could be cause by the power supply subsystem or system components
1. Verify all power cables and adapters are connected properly (AC cables as well as the cables
between PSU and system components).
2. Cross test PSU if possible.
3. Replace power subsystem.
06h
Power Unit Failure
Power subsystem experienced a
failure
Indicates a power supply failed.
1. Remove and reapply AC power.
2. If power supply still fails, replace it.
Byte
Field
Description
11
Sensor Type
09h = Power Unit
12
Sensor Number
02h
Table 16: Power Unit Status Sensor – Sensor Specific Offsets – Next Steps
4.2.2 Power Unit Redundancy Sensor
This sensor is enabled on systems that support redundant power supplies. When a system has AC applied or if it loses redundancy of the
power supplies a message will get logged into the SEL.
Table 17: Power Unit Redundancy Sensors Typical Characteristics
24 Intel order number G74211-001 Revision 1.0
Page 34

System Event Log Troubleshooting Guide for Intel® S5500/S3420 series Server Boards Power Subsystems
Byte
Field
Description
13
Event Direction and
Event Type
[7] Event direction
0b = Assertion Event
1b = Deassertion Event
[6:0] Event Type = 0Bh (Generic Discrete)
14
Event Data 1
[7:6] – 00b = Unspecified Event Data 2
[5:4] – 00b = Unspecified Event Data 3
[3:0] – Event Trigger Offset as described in Table 18
15
Event Data 2
Not used
16
Event Data 3
Not used
Event Trigger Offset
Description
Next Steps
Hex
Description
00h
fully redundant
System is fully operational
Informational Event
01h
redundancy lost
System is not running in redundant
power supply mode
This event should be accompanied by specific power supply errors (AC
lost, PSU failure, and so on). Troubleshoot these events accordingly
02h
redundancy degraded
03h
non-redundant, sufficient from redundant
04h
non-redundant, sufficient from insufficient
05h
non-redundant, insufficient
06h
non-redundant, degraded from fully redundant
07h
redundant, degraded from non-redundant
Table 18: Power Unit Redundancy Sensor – Event Trigger Offset – Next Steps
4.3 Power Supply
The BMC monitors the power supply subsystem.
Revision 1.0 Intel order number G74211-001 25
Page 35

Power Subsystems System Event Log Troubleshooting Guide for Intel® S5500/S3420 series Server Boards
Byte
Field
Description
11
Sensor Type
08h = Power Supply
12
Sensor Number
50h = Power Supply 1 Status
51h = Power Supply 2 Status
13
Event Direction and
Event Type
[7] Event direction
0b = Assertion Event
1b = Deassertion Event
[6:0] Event Type = 6Fh (Sensor Specific)
14
Event Data 1
[7:6] – 00b = Unspecified Event Data 2
[5:4] – 00b = Unspecified Event Data 3
[3:0] = Sensor Specific offset as described in Table 20
15
Event Data 2
Not used
16
Event Data 3
Not used
Sensor Specific Offset
Description
Next Steps
Hex
Description
00h
Presence
Power supply detected
Informational Event
01h
Failure
Power supply failed
Indicates a power supply failed.
1) Remove and reapply AC.
2) If power supply still fails, replace it.
4.3.1 Power Supply Status Sensors
These sensors report the status of the power supplies in the system. When a system first AC applied or removed it can log an event. Also if
there is a failure, predictive failure, or a configuration error it can log an event.
Table 19: Power Supply Status Sensors Typical Characteristics
26 Intel order number G74211-001 Revision 1.0
Table 20: Power Supply Status Sensor – Sensor Specific Offsets – Next Steps
Page 36

System Event Log Troubleshooting Guide for Intel® S5500/S3420 series Server Boards Power Subsystems
Sensor Specific Offset
Description
Next Steps
Hex
Description
02h
Predictive Failure
Typically means a fan inside the power supply is not cooling the
power supply. It may indicate the fan is failing.
Replace power supply
03h
A/C lost
AC removed
Informational Event.
06h
Configuration error
Power supply configuration is not supported
Indicates that at least one of the supplies is not correct for your system
configuration.
1) Remove the power supply and verify compatibility.
2) If power supply is compatible it may be faulty. Replace it.
Byte
Field
Description
11
Sensor Type
0Bh = Other Units
12
Sensor Number
52h = Power Supply 1 AC Power Input
53h = Power Supply 2 AC Power Input
13
Event Direction and
Event Type
[7] Event direction
0b = Assertion Event
1b = Deassertion Event
[6:0] Event Type = 01h(Threshold)
14
Event Data 1
[7:6] – 01b = Trigger reading in Event Data 2
[5:4] – 01b = Trigger threshold in Event Data 3
[3:0] – Event Trigger Offset as described in Table 22
15
Event Data 2
Reading that triggered event
16
Event Data 3
Threshold value that triggered event
4.3.2 Power Supply AC Power Input Sensors
These sensors will log an event when a power supply in the system is exceeding its AC power in threshold.
Table 21: Power Supply AC Power Input Sensors Typical Characteristics
Revision 1.0 Intel order number G74211-001 27
Page 37

Power Subsystems System Event Log Troubleshooting Guide for Intel® S5500/S3420 series Server Boards
Event Trigger Offset
Assertion
Severity
Deassert
Severity
Description
Next Steps
Hex
Description
07h
Upper non
critical going high
Degraded
OK
PMBus* feature to monitor power
supply power consumption.
If you see this event, the system is pulling too much power on the input for the
PSU rating.
1. Verify the power budget is within the specified range.
2. Check http://www.intel.com/p/en_US/support/ for the power budget tool
for your system.
09h
Upper critical
going high
non-fatal
Degraded
Byte
Field
Description
11
Sensor Type
03h = Current
12
Sensor Number
54h = Power Supply 1 Current Output %
55h = Power Supply 2 Current Output %
13
Event Direction and
Event Type
[7] Event direction
0b = Assertion Event
1b = Deassertion Event
[6:0] Event Type = 01h (Threshold)
14
Event Data 1
[7:6] – 01b = Trigger reading in Event Data 2
[5:4] – 01b = Trigger threshold in Event Data 3
[3:0] – Event Trigger Offset as described in Table 24
15
Event Data 2
Reading that triggered event
The following table describes the severity of each of the event triggers for both assertion and for deassertion.
Table 22: Power Supply AC Power Input Sensor – Event Trigger Offset – Next Steps
4.3.3 Power Supply Current Output % Sensors
PMBus* compliant power supplies may monitor the current output of the main 12v voltage rail and report the current usage as a percentage of
the maximum power output for that rail.
Table 23: Power Supply Current Output % Sensors Typical Characteristics
28 Intel order number G74211-001 Revision 1.0
Page 38

System Event Log Troubleshooting Guide for Intel® S5500/S3420 series Server Boards Power Subsystems
Byte
Field
Description
16
Event Data 3
Threshold value that triggered event
Event Trigger Offset
Assertion
Severity
Deassert
Severity
Description
Next Steps
Hex
Description
07h
Upper non critical
going high
Degraded
OK
PMBus* feature to monitor power
supply power consumption.
If you see this event, the system is using too much power on the output for
the PSU rating.
1. Verify the power budget is within the specified range.
2. Check http://www.intel.com/p/en_US/support/ for the power
budget tool for your system.
09h
Upper critical
going high
non-fatal
Degraded
Byte
Field
Description
11
Sensor Type
01h = Temperature
12
Sensor Number
56h = Power Supply 1 Temperature
57h = Power Supply 2 Temperature
13
Event Direction and
Event Type
[7] Event direction
0b = Assertion Event
1b = Deassertion Event
[6:0] Event Type = 01h (Threshold)
The following table describes the severity of each of the event triggers for both assertion and for deassertion.
Table 24: Power Supply Current Output % Sensor – Event Trigger Offset – Next Steps
4.3.4 Power Supply Temperature Sensors
The BMC will monitor one power supply temperature sensor for each installed PMBus* compliant power supply.
Table 25: Power Supply Temperature Sensors Typical Characteristics
Revision 1.0 Intel order number G74211-001 29
Page 39

Power Subsystems System Event Log Troubleshooting Guide for Intel® S5500/S3420 series Server Boards
Byte
Field
Description
14
Event Data 1
[7:6] – 01b = Trigger reading in Event Data 2
[5:4] – 01b = Trigger threshold in Event Data 3
[3:0] – Event Trigger Offset as described in Table 26
15
Event Data 2
Reading that triggered event.
16
Event Data 3
Threshold value that triggered event.
Event Trigger Offset
Assertion
Severity
Deassert
Severity
Description
Next Steps
Hex
Description
07h
Upper non
critical going
high
Degraded
OK
An upper non-critical
or critical temperature
threshold has been
crossed.
1. Check for clear and unobstructed airflow into and out of chassis.
2. Ensure SDR is programmed and correct chassis has been selected.
3. Ensure there are no fan failures.
4. Ensure the air used to cool the system is within the thermal specifications for the system
(typically below 35°C).
09h
Upper critical
going high
non-fatal
Degraded
The following table describes the severity of each of the event triggers for both assertion and for deassertion.
Table 26: Power Supply Temperature Sensor – Event Trigger Offset – Next Steps
30 Intel order number G74211-001 Revision 1.0
Page 40

System Event Log Troubleshooting Guide for Intel® S5500/S3420 series Server Boards Cooling subsystem
Byte
Field
Description
11
Sensor Type
04h = Fan
12
Sensor Number
30h – 39h (Chassis specific)
13
Event Direction and
Event Type
[7] Event direction
0b = Assertion Event
1b = Deassertion Event
[6:0] Event Type = 01h (Threshold)
14
Event Data 1
[7:6] – 01b = Trigger reading in Event Data 2
[5:4] – 01b = Trigger threshold in Event Data 3
[3:0] – Event Trigger Offset as described in Table 28
15
Event Data 2
Reading that triggered event
16
Event Data 3
Threshold value that triggered event
5. Cooling subsystem
5.1 Fan sensors
There are three types of fan sensors that can be present on Intel® server systems: speed, presence and redundancy. The last two are only
present in systems with hot-swap redundant fans.
5.1.1 Fan Speed Sensors
Fan speed sensors monitor the rpm signal on the relevant fan headers on the platform. Fan speed sensors are threshold-based sensors.
Usually they only have lower (critical) thresholds set, so that a SEL entry is only generated should the fan spin too slowly.
Table 27: Fan Speed Sensors Typical Characteristics
The following table describes the severity of each of the event triggers for both assertion and for deassertion.
Revision 1.0 Intel order number G74211-001 31
Page 41

Cooling subsystem System Event Log Troubleshooting Guide for Intel® S5500/S3420 series Server Boards
Event Trigger Offset
Assertion
Severity
Deassert
Severity
Description
Next Steps
Hex
Description
00h
Lower non critical
going low
Degraded
OK
The fan speed has dropped below
its lower non critical threshold.
A fan speed error on a new system build is typically not caused by the fan
spinning too slowly, instead it is caused by the fan being connected to the wrong
header (the BMC expects them on certain headers for each chassis and will log
this event if there is no fan on that header).
1. Refer to the Quick Start Guide or the Service Guide to identify the correct
fan headers to use.
2. Ensure the latest FRUSDR update has been run and the correct chassis
was detected or selected.
3. If you are sure this was done, the event may be a sign of impending fan
failure (although this would only normally apply if the system has been in
use for a while). Replace the fan.
02h
Lower critical
going low
non-fatal
Degraded
The fan speed has dropped below
its lower critical threshold.
Byte
Field
Description
11
Sensor Type
04h = Fan
12
Sensor Number
40h – 45h (Chassis specific)
Table 28: Fan Speed Sensor – Event Trigger Offset – Next Steps
5.1.2 Fan Presence and Redundancy Sensors
Fan presence sensors are only implemented for hot-swap fans, and require an additional pin on the fan header. Fan redundancy is an
aggregate of the fan presence sensors and will warn when redundancy is lost. Typically the redundancy mode on Intel® servers is an n+1
redundancy (if one fan fails there are still sufficient fans to cool the system, but it is no longer redundant) although other modes are also
possible.
Table 29: Fan Presence Sensors Typical Characteristics
32 Intel order number G74211-001 Revision 1.0
Page 42

System Event Log Troubleshooting Guide for Intel® S5500/S3420 series Server Boards Cooling subsystem
Byte
Field
Description
13
Event Direction and
Event Type
[7] Event direction
0b = Assertion Event
1b = Deassertion Event
[6:0] Event Type = 08h (Generic ‘digital’ Discrete)
14
Event Data 1
[7:6] – 00b = Unspecified Event Data 2
[5:4] – 00b = Unspecified Event Data 3
[3:0] – Event Trigger Offset as described in Table 30
15
Event Data 2
Not used
16
Event Data 3
Not used
Event Trigger Offset
Assertion
Severity
Deassert
Severity
Description
Next Steps
Hex
Description
01h
Device
Present
OK
Degraded
Assertion –A fan was inserted. This
event may also get logged when the
BMC initializes when AC is applied.
Informational only
Deassert – A fan was removed, or
was not present at the expected
location when the BMC initialized
These events only get generated in systems with hot-swappable fans, and normally
only when a fan is physically inserted or removed. If fans were not physically removed:
1. Use the Quick Start Guide to check if the right fan headers were used.
2. Swap the fans round to see if the problem stays with the location, or follows
the fan.
3. Replace fan or fan wiring/housing depending on the outcome of step 2.
4. Ensure the latest FRUSDR update has been run and the correct chassis was
detected or selected.
The following table describes the severity of each of the event triggers for both assertion and for deassertion.
Table 30: Fan Presence Sensors – Event Trigger Offset – Next Steps
Revision 1.0 Intel order number G74211-001 33
Page 43

Cooling subsystem System Event Log Troubleshooting Guide for Intel® S5500/S3420 series Server Boards
Byte
Field
Description
11
Sensor Type
04h = Fan
12
Sensor Number
46h
13
Event Direction and
Event Type
[7] Event direction
0b = Assertion Event
1b = Deassertion Event
[6:0] Event Type = 0Bh (Generic Discrete)
14
Event Data 1
[7:6] – 00b = Unspecified Event Data 2
[5:4] – 00b = Unspecified Event Data 3
[3:0] – Event Trigger Offset as described in Table 32
15
Event Data 2
Not used
16
Event Data 3
Not used
Table 31: Fan Redundancy Sensors Typical Characteristics
34 Intel order number G74211-001 Revision 1.0
Page 44

System Event Log Troubleshooting Guide for Intel® S5500/S3420 series Server Boards Cooling subsystem
Event Trigger Offset
Description
Next Steps
Hex
Description
00h
fully redundant
System has lost one or more fans and is running in nonredundant mode. There are enough fans to keep the system
properly cooled, but fan speeds will boost.
Fan redundancy loss indicates failure of one or more fans.
Look for lower (non) critical fan errors, or fan removal errors in the SEL,
to indicate which fan is causing the problem, and follow the
troubleshooting steps for these event types.
01h
redundancy lost
02h
redundancy degraded
03h
non-redundant,
sufficient from
redundant
04h
non-redundant,
sufficient from
insufficient
05h
non-redundant,
insufficient
System has lost fans and may no longer be able to cool itself
adequately. Overheating may occur if this situation remains for a
longer period of time.
06h
non-redundant,
degraded from fully
redundant
System has lost one or more fans and is running in nonredundant mode. There are enough fans to keep the system
properly cooled, but fan speeds will boost.
07h
redundant, degraded
from non-redundant
System has lost one or more fans and is running in a degraded
mode, but still is redundant. There are enough fans to keep the
system properly cooled.
The following table describes the severity of each of the event triggers for both assertion and for deassertion.
Table 32: Fan Redundancy Sensor – Event Trigger Offset – Next Steps
5.2 Temperature Sensors
There are a variety of temperature sensors that can be implemented on Intel® server systems. They are split into three types: Regular
temperature sensors, thermal margin sensors, and discrete temperature sensors. Each of them has their own types of events that can be
logged.
Revision 1.0 Intel order number G74211-001 35
Page 45

Cooling subsystem System Event Log Troubleshooting Guide for Intel® S5500/S3420 series Server Boards
Byte
Field
Description
11
Sensor Type
01h = Temperature
12
Sensor Number
See Table 35
13
Event Direction and
Event Type
[7] Event direction
0b = Assertion Event
1b = Deassertion Event
[6:0] Event Type = 01h (Threshold)
14
Event Data 1
[7:6] – 01b = Trigger reading in Event Data 2
[5:4] – 01b = Trigger threshold in Event Data 3
[3:0] – Event Trigger Offset as described in Table 34
15
Event Data 2
Reading that triggered event.
16
Event Data 3
Threshold value that triggered event.
Event Trigger
Assertion
Severity
Deassert
Severity
Description
Hex
Description
00h
Lower non critical
going low
Degraded
OK
The temperature has dropped below its lower non critical threshold.
02h
Lower critical
going low
non-fatal
Degraded
The temperature has dropped below its lower critical threshold.
07h
Upper non critical
going high
Degraded
OK
The temperature has gone over its upper non critical threshold.
5.2.1 Regular Temperature sensors
Regular temperature sensors are sensors that report an actual temperature. These are linear, threshold based sensors. In most Intel® server
systems, there are at least two sensors defined: front panel temperature and baseboard temperature. Both these sensors typically have upper
and lower thresholds set – upper to warn in case of an over-temperature situation, lower to warn against sensor failure (temperature sensors
typically read out 0 if they stop working).
Table 33: Temperature Sensors Typical Characteristics
36 Intel order number G74211-001 Revision 1.0
Table 34: Temperature Sensors Event Triggers – Description
Page 46

System Event Log Troubleshooting Guide for Intel® S5500/S3420 series Server Boards Cooling subsystem
Event Trigger
Assertion
Severity
Deassert
Severity
Description
Hex
Description
09h
Upper critical
going high
non-fatal
Degraded
The temperature has gone over its upper critical threshold.
Sensor Name
Sensor
number
Next Steps
Baseboard Temp
20h
1. Check for clear and unobstructed airflow into and out of chassis.
2. Ensure SDR is programmed and correct chassis has been selected.
3. Ensure there are no fan failures.
4. Ensure the air used to cool the system is within the thermal specifications for the system (typically below 35°C).
Front Panel Temp
21h
If the front panel temperature reads zero, check:
1. It is connected properly.
2. The FRUSDR has been programmed correctly for your chassis.
If the front panel temperature is too high:
Check the cooling of your server room.
Byte
Field
Description
11
Sensor Type
01h = Temperature
12
Sensor Number
See Table 38
Table 35: Temperature Sensors – Next Steps
5.2.2 Thermal Margin Sensors
Margin sensors are also linear sensors but typically report a negative value. This is not an actual temperature, but in fact an offset to a critical
temperature. Example sensors are Processor Thermal Margin, Memory Thermal Margin and IOH Thermal margin. Values reported should be
seen as number of degrees below a critical temperature for the particular component.
Table 36: Thermal Margin Sensors Typical Characteristics
Revision 1.0 Intel order number G74211-001 37
Page 47

Cooling subsystem System Event Log Troubleshooting Guide for Intel® S5500/S3420 series Server Boards
Byte
Field
Description
13
Event Direction and
Event Type
[7] Event direction
0b = Assertion Event
1b = Deassertion Event
[6:0] Event Type = 01h (Threshold)
14
Event Data 1
[7:6] – 01b = Trigger reading in Event Data 2
[5:4] – 01b = Trigger threshold in Event Data 3
[3:0] – Event Triggers as described in Table 37
15
Event Data 2
Reading that triggered event.
16
Event Data 3
Threshold value that triggered event.
Event Trigger
Assertion
Severity
Deassert
Severity
Description
Hex
Description
07h
Upper non critical
going high
Degraded
OK
The thermal margin has gone over its upper non critical threshold.
09h
Upper critical
going high
non-fatal
Degraded
The thermal margin has gone over its upper critical threshold.
Sensor
Number
Sensor Name
Next Steps
22h
IOH Therm Margin
1. Check for clear and unobstructed airflow into and out of chassis.
2. Ensure SDR is programmed and correct chassis has been selected.
3. Ensure there are no fan failures.
4. Ensure the air used to cool the system is within the thermal specifications for the system (typically below 35°C).
23h
Mem P1 Therm Margin
24h
Mem P2 Therm Margin
62h
P1 Therm Margin
Not a logged SEL event. Sensor is used for thermal management of the processor.
63h
P2 Therm Margin
Table 37: Thermal Margin Sensors Event Triggers – Description
Table 38: Thermal Margin Sensors – Next Steps
38 Intel order number G74211-001 Revision 1.0
Page 48

System Event Log Troubleshooting Guide for Intel® S5500/S3420 series Server Boards Cooling subsystem
Byte
Field
Description
11
Sensor Type
01h = Temperature
12
Sensor Number
See Table 41
13
Event Direction and
Event Type
[7] Event direction
0b = Assertion Event
1b = Deassertion Event
[6:0] Event Type = 01h (Threshold)
14
Event Data 1
[7:6] – 01b = Trigger reading in Event Data 2
[5:4] – 01b = Trigger threshold in Event Data 3
[3:0] – Event Triggers as described in Table 40
15
Event Data 2
Reading that triggered event.
16
Event Data 3
Threshold value that triggered event.
Event Trigger
Assertion
Severity
Deassert
Severity
Description
Hex
Description
07h
Upper non critical
going high
Degraded
OK
The thermal margin has gone over its upper non critical threshold.
09h
Upper critical
going high
non-fatal
Degraded
The thermal margin has gone over its upper critical threshold.
5.2.3 Processor Thermal Control % Sensors
Processor Thermal Control % sensors report the percentage of the time that the processor is throttling its performance due to thermal issues. If
this is not addressed the processor could overheat and shut down the system to protect itself from damage
Table 39: Processor Thermal Control % Sensors Typical Characteristics
Table 40: Processor Thermal Control % Sensors Event Triggers – Description
Revision 1.0 Intel order number G74211-001 39
Page 49

Cooling subsystem System Event Log Troubleshooting Guide for Intel® S5500/S3420 series Server Boards
Sensor
Number
Sensor Name
Next Steps
64h
P1 Therm Ctl %
These events normally only happens due to failures of the thermal solution:
1. Verify heat sink is properly attached and has thermal grease.
2. If system has a heat sink fan, ensure the fan is spinning.
3. Check all system fans are operating properly.
4. Check that the air used to cool the system is within limits (typically 35°C).
65h
P2 Therm Ctl %
Byte
Field
Description
11
Sensor Type
01h = Temperature
12
Sensor Number
See Table 43
13
Event Direction and
Event Type
[7] Event direction
0b = Assertion Event
1b = Deassertion Event
[6:0] Event Type = See Table 43
14
Event Data 1
[7:6] – 00b = Unspecified Event Data 2
[5:4] – 00b = Unspecified Event Data 3
[3:0] – Event Trigger Offset as described in Table 43
15
Event Data 2
Not used
16
Event Data 3
Not used
Table 41: Processor Thermal Control % Sensors – Next Steps
5.2.4 Discrete Thermal Sensors
Discrete thermal sensors do not report a temperature at all – instead they report an overheating event of some kind. Examples as VRD Hot
(voltage regulator is overheating) or processor Thermal Trip (the processor got so hot that its over-temperature protection was triggered and
the system was shut down to prevent damage).
Table 42: Discrete Thermal Sensors Typical Characteristics
40 Intel order number G74211-001 Revision 1.0
Page 50

System Event Log Troubleshooting Guide for Intel® S5500/S3420 series Server Boards Cooling subsystem
Sensor
Number
Sensor Name
Event
Type
Event Trigger Offset
Description
Next Steps
Hex
Description
66h
P1 VRD Hot
05h
01h
Limit Exceeded
Processor1 voltage
regulator overheated
1. Check for clear and unobstructed airflow into and out of chassis.
2. Ensure SDR is programmed and correct chassis has been selected.
3. Ensure there are no fan failures.
4. Ensure the air used to cool the system is within the thermal
specifications for the system (typically below 35°C).
67h
P2 VRD Hot
Processor2 voltage
regulator overheated
6ah
IOH Thermal Trip
03h
01h
State Asserted
I/O Hub (IOH) overheated
Table 43: Discrete Thermal Sensors – Next Steps
Revision 1.0 Intel order number G74211-001 41
Page 51

Processor subsystem System Event Log Troubleshooting Guide for Intel® S5500/S3420 series Server Boards
Byte
Field
Description
11
Sensor Type
07h = Processor
12
Sensor Number
See Table 45
13
Event Direction and
Event Type
[7] Event direction
0b = Assertion Event
1b = Deassertion Event
[6:0] Event Type = 6Fh (Sensor Specific)
14
Event Data 1
[7:6] – 00b = Unspecified Event Data 2
[5:4] – 00b = Unspecified Event Data 3
[3:0] – Event Trigger Offset as described in Table 45
15
Event Data 2
Not used.
16
Event Data 3
Not used.
6. Processor subsystem
Intel® servers report several processor-centric sensors in the SEL.
8.1 Processor Status Sensor
The status sensor reports processor presence or a thermal trip condition. Each processor has a status sensor.
Table 44: Process Status Sensors Typical Characteristics
42 Intel order number G74211-001 Revision 1.0
Page 52

System Event Log Troubleshooting Guide for Intel® S5500/S3420 series Server Boards
Sensor
Number
Sensor Name
Event Trigger Offset
Description
Next Steps
Hex
Description
60h
P1 Status
01h
Thermal trip
The processor exceeded the
maximum temperature.
This event normally only happens due to failures of the thermal solution:
1. Verify heatsink is properly attached and has thermal grease.
2. If system has a heatsink fan, ensure the fan is spinning.
3. Check all system fans are operating properly
4. Check that the air used to cool the system is within limits (typically 35°C)
07h
State Asserted
Indicates processor is present
61h
P2 Status
01h
Thermal trip
The processor exceeded the
maximum temperature.
07h
State Asserted
Indicates processor is present
Table 45: Processor Status Sensors – Next Steps
Processor subsystem
Revision 1.0 Intel order number G74211-001 43
Page 53

Processor subsystem System Event Log Troubleshooting Guide for Intel® S5500/S3420 series Server Boards
Byte
Field
Description
11
Sensor Type
07h = Processor
12
Sensor Number
68h
13
Event Direction and
Event Type
[7] Event direction
0b = Assertion Event
1b = Deassertion Event
[6:0] Event Type = 6Fh (Sensor Specific)
14
Event Data 1
[7:6] – 00b = Unspecified Event Data 2
[5:4] – 00b = Unspecified Event Data 3
[3:0] – Event Trigger Offset = 01h (State Asserted)
15
Event Data 2
Not used.
16
Event Data 3
Not used.
8.2 Catastrophic Error Sensor
When the Catastrophic Error signal (CATERR#) stays asserted, it is a sign that something serious has gone wrong in the hardware. The BMC
monitors this signal and reports when it stays asserted.
Table 46: Catastrophic Error Sensor Typical Characteristics
8.2.1 Catastrophic Error Sensor– Next Steps
This error is typically caused by other platform components.
1. Check for other errors near the time of the CATERR event.
2. Verify all peripherals are plugged in and operating correctly, particularly Hard Drives, Optical Drives, and I/O.
3. Update system firmware and drivers.
44 Intel order number G74211-001 Revision 1.0
Page 54

System Event Log Troubleshooting Guide for Intel® S5500/S3420 series Server Boards
Byte
Field
Description
11
Sensor Type
07h = Processor
12
Sensor Number
69h
13
Event Direction and
Event Type
[7] Event direction
0b = Assertion Event
1b = Deassertion Event
[6:0] Event Type = 6Fh (Sensor Specific)
14
Event Data 1
[7:6] – 00b = Unspecified Event Data 2
[5:4] – 00b = Unspecified Event Data 3
[3:0] – Event Trigger Offset = 01h (State Asserted)
15
Event Data 2
Not used.
16
Event Data 3
Not used.
Processor subsystem
8.3 CPU Missing Sensor
The CPU Missing sensor is a discrete sensor reporting the processor is not installed. The most common instance of this event is due to a
processor populated in the incorrect socket.
Table 47: CPU Missing Sensor Typical Characteristics
8.3.1 CPU Missing Sensor – Next Steps
Verify the processor is installed in the correct slot.
8.4 QuickPath Interconnect Error Sensors
The Intel® QuickPath Interconnect (QPI) bus on Intel® S5500/S3420 series server boards is the interconnection between processors and to the
chipset. The QPI Error sensors are all reported by the BIOS SMI Handler to the BMC so the Generator ID will be 33h.
Revision 1.0 Intel order number G74211-001 45
Page 55

Processor subsystem System Event Log Troubleshooting Guide for Intel® S5500/S3420 series Server Boards
Byte
Field
Description
8
9
Generator ID
0033h = BIOS SMI Handler
11
Sensor Type
13h = Critical Interrupt
12
Sensor Number
06h
13
Event Direction and
Event Type
[7] Event direction
0b = Assertion Event
1b = Deassertion Event
[6:0] Event Type = 72h (OEM Discrete)
14
Event Data 1
[7:6] – 10b = OEM code in Event Data 2
[5:4] – 00b = Unspecified Event Data 3
[3:0] – Event Trigger Offset = Reserved
15
Event Data 2
0-3 = CPU1-4
16
Event Data 3
Not used.
8.4.1 QPI Correctable Error Sensor
The system detected an error and corrected it. This is an informational event.
Table 48: QPI Correctable Error Sensor Typical Characteristics
8.4.1.1 QPI Correctable Error Sensor – Next Steps
This is an Informational event only. Correctable errors are acceptable and normal at a low rate of occurrence. If error continues:
1. Check the processor is installed correctly.
2. Inspect the socket for bent pins.
3. Cross test the processor if possible.
46 Intel order number G74211-001 Revision 1.0
Page 56

System Event Log Troubleshooting Guide for Intel® S5500/S3420 series Server Boards
Byte
Field
Description
8
9
Generator ID
0033h = BIOS SMI Handler
11
Sensor Type
13h = Critical Interrupt
12
Sensor Number
07h
13
Event Direction and
Event Type
[7] Event direction
0b = Assertion Event
1b = Deassertion Event
[6:0] Event Type = 73h (OEM Discrete)
14
Event Data 1
[7:6] – 10b = OEM code in Event Data 2
[5:4] – 00b = Unspecified Event Data 3
[3:0] – Event Trigger Offset = Reserved
15
Event Data 2
0-3 = CPU1-4
16
Event Data 3
Not used.
8.4.2 QPI Non-Fatal Error Sensor
The system detected a QPI non-fatal error that is recoverable. This is an informational event.
Table 49: QPI Non-Fatal Error Sensor Typical Characteristics
Processor subsystem
8.4.2.1 QPI Non-Fatal Error Sensor – Next Steps
This is an Informational event only. Non-Fatal errors are acceptable and normal at a low rate of occurrence. If error continues:
1. Check the processor is installed correctly.
2. Inspect the socket for bent pins.
3. Cross test the processor if possible.
Revision 1.0 Intel order number G74211-001 47
Page 57

Processor subsystem System Event Log Troubleshooting Guide for Intel® S5500/S3420 series Server Boards
Byte
Field
Description
8
9
Generator ID
0033h = BIOS SMI Handler
11
Sensor Type
13h = Critical Interrupt
12
Sensor Number
17h
13
Event Direction and
Event Type
[7] Event direction
0b = Assertion Event
1b = Deassertion Event
[6:0] Event Type = 74h (OEM Discrete)
14
Event Data 1
[7:6] – 10b = OEM code in Event Data 2
[5:4] – 00b = Unspecified Event Data 3
[3:0] – Event Trigger Offset = Reserved
15
Event Data 2
0-3 = CPU1-4
16
Event Data 3
Not used.
Byte
Field
Description
8
9
Generator ID
0033h = BIOS SMI Handler
11
Sensor Type
13h = Critical Interrupt
12
Sensor Number
18h
8.4.3 QPI Fatal and Fatal #2
The system detected a QPI fatal or non-recoverable error. This is a fatal error.
Table 50: QPI Fatal Error Sensor Typical Characteristics
The QPI Fatal #2 Error is a continuation of QPI Fatal Error.
48 Intel order number G74211-001 Revision 1.0
Table 51: QPI Fatal #2 Error Sensor Typical Characteristics
Page 58

System Event Log Troubleshooting Guide for Intel® S5500/S3420 series Server Boards
Byte
Field
Description
13
Event Direction and
Event Type
[7] Event direction
0b = Assertion Event
1b = Deassertion Event
[6:0] Event Type = 74h (OEM Discrete)
14
Event Data 1
[7:6] – 10b = OEM code in Event Data 2
[5:4] – 00b = Unspecified Event Data 3
[3:0] – Event Trigger Offset = Reserved
15
Event Data 2
0-3 = CPU1-4
16
Event Data 3
Not used.
8.4.3.1 QPI Fatal and Fatal #2 – Next Steps
This is an Informational event only. Correctable errors are acceptable and normal at a low rate of occurrence. If error continues:
1. Check the processor is installed correctly.
2. Inspect the socket for bent pins.
3. Cross test the processor if possible.
Processor subsystem
Revision 1.0 Intel order number G74211-001 49
Page 59
Memory subsystem System Event Log Troubleshooting Guide for Intel® S5500/S3420 series Server Boards
Byte
Field
Description
8
9
Generator ID
0001h = BIOS POST
11
Sensor Type
0ch = Memory
12
Sensor Number
12h
9. Memory subsystem
Intel® servers report memory errors, status, and configuration in the SEL.
9.1 Memory RAS Mirroring and Sparing
“Memory RAS Configuration Status” refers to the BIOS sending the current RAS mode and RAS operational state to the BMC to log into the
SEL as a SEL record. This allows a remote software/application to query and retrieve the system memory state.
The memory configuration state sensors are “virtual” sensors. In other words, these sensors are owned and controlled completely by the BIOS,
independently of the BMC.
The RAS configuration and state definitions are aligned with the definitions within the Intelligent Platform Management Interface Specification,
Version 2.0. Accordingly, these sensors are read as “Status” and “Redundancy” sensors (Event/Reading Type 0x09 and 0x0B respectively).
Sensor Number 12h (Event Type 0x09) – Mirroring Configuration Status
Sensor Number 01h (Event Type 0x0B) – Mirroring Redundancy State
Sensor Number 13h (Event Type 0x09) – Sparing Configuration Status
Sensor Number 11h (Event Type 0x0B) – Sparing Redundancy State
9.1.1 Mirroring Configuration Status
This sensor provides the Mirroring mode RAS configuration status.
50 Intel order number G74211-001 Revision 1.0
Table 52: Mirroring Configuration Status Sensor Typical Characteristics
Page 60

System Event Log Troubleshooting Guide for Intel® S5500/S3420 series Server Boards Memory subsystem
Byte
Field
Description
13
Event Direction and
Event Type
[7] Event direction
0b = Assertion Event
1b = Deassertion Event
[6:0] Event Type = 09h (digital Discrete)
14
Event Data 1
[7:6] – 10b = OEM code in Event Data 2
[5:4] – 00b = Unspecified Event Data 3
[3:0] – Event Trigger Offset as described in Table 53
15
Event Data 2
Not used.
16
Event Data 3
Not used.
Event Trigger Offset
Description
Next Steps
Hex
Description
01h
The system has been configured into
Mirrored Channel RAS Mode.
User enabled mirrored channel
mode in setup.
Informational event only.
00h
The system has been configured out
of Mirrored Channel RAS Mode.
Mirrored channel mode is
disabled (either in setup or due
to unavailability of memory at
post, in which case post error
8500 is also logged).
1. If this event is accompanied by a post error 8500, there was a problem applying the
mirroring configuration to the memory. Check for other errors related to the memory
and troubleshoot accordingly.
2. If there is no post error then mirror mode was simply disabled in bios setup and this
should be considered informational only.
Table 53: Mirroring Configuration Status Sensor Event Trigger Offset – Next Steps
Revision 1.0 Intel order number G74211-001 51
Page 61

Memory subsystem System Event Log Troubleshooting Guide for Intel® S5500/S3420 series Server Boards
Byte
Field
Description
8
9
Generator ID
0001h = BIOS POST
11
Sensor Type
0ch = Memory
12
Sensor Number
01h
13
Event Direction and
Event Type
[7] Event direction
0b = Assertion Event
1b = Deassertion Event
[6:0] Event Type = 0Bh (Generic Discrete)
14
Event Data 1
[7:6] – 10b = OEM code in Event Data 2
[5:4] – 10b = OEM code in Event Data 3
[3:0] – Event Trigger Offset as described in Table 55
9.1.2 Mirrored Redundancy State Sensor
This sensor provides the RAS Redundancy state for the Memory Mirrored Channel Mode.
Table 54: Mirrored Redundancy State Sensor Typical Characteristics
52 Intel order number G74211-001 Revision 1.0
Page 62

System Event Log Troubleshooting Guide for Intel® S5500/S3420 series Server Boards Memory subsystem
Byte
Field
Description
15
Event Data 2
[7:4] - If Domain Instance Type (ED3) is set to Local, this field specifies the mirroring domain local sub-instances – which channels are
included in this sub-instance:
0000b – Reserved
0001b – {Ch A, Ch B}
0010b – {Ch A, Ch C}
0011b – {Ch B, Ch C}
0100b - 1110b – Reserved
If Domain Instance Type (ED3) is set to Global, this field specifies the 0-based Socket ID of the first participant processor in this
mirroring domain global instance.
A value of 1111b indicates that this field is unused and does not contain valid data.
[3:0] – If Domain Instance Type (ED3) is set to Local, this field specifies the sparing domain local sub-instances – which channels are
included in this sub-instance:
0000b – Reserved
0001b – {Ch A, Ch B, Ch C} (only configuration possible on Intel® S5500/S5520 Server Boards)
0010b - 1110b – Reserved
If Domain Instance Type (ED3) is set to Global, this field specifies the 0-based Socket ID of the first participant processor in this
sparing domain global instance.
A value of 1111b indicates that this field is unused and does not contain valid data.
16
Event Data 3
[7] – Domain Instance Type
0b: Local memory sparing domain instance. This SEL pertains to a local memory mirroring domain that is restricted to memory
mirroring pairs within a processor socket only.
1b: Global memory sparing domain instance. This SEL pertains to a global memory mirroring domain that pertains to memory
mirroring between processor sockets.
[6:4] – Reserved
[3:0] – 0-based Instance ID of this sparing domain
Revision 1.0 Intel order number G74211-001 53
Page 63

Memory subsystem System Event Log Troubleshooting Guide for Intel® S5500/S3420 series Server Boards
Event Trigger Offset
Description
Next Steps
Hex
Description
01h
Memory is configured in Mirrored
Channel Mode, and the memory is
operating in the fully redundant
state.
System boots with mirrored
channel mode active; one
entry per processor.
Informational event.
00h
Memory is configured in Mirrored
Channel Mode, and the memory
has lost redundancy and is
operating in the degraded state.
One of the channels in the
mirror pair is taken offline loss of mirror - one entry only
for affected processor.
This event should be accompanied by memory errors indicating the source of the
issue. Troubleshoot accordingly (probably replace affected DIMM).
Byte
Field
Description
8
9
Generator ID
0001h = BIOS POST
11
Sensor Type
0ch = Memory
12
Sensor Number
13h
13
Event Direction and
Event Type
[7] Event direction
0b = Assertion Event
1b = Deassertion Event
[6:0] Event Type = 09h (digital Discrete)
14
Event Data 1
[7:6] – 10b = OEM code in Event Data 2
[5:4] – 00b = Unspecified Event Data 3
[3:0] – Event Trigger Offset as described in Table 57.
15
Event Data 2
Not used.
Table 55: Mirrored Redundancy State Sensor Event Trigger Offset – Next Steps
9.1.3 Sparing Configuration Status
This sensor provides the Spare Channel mode RAS Configuration status.
Table 56: Sparing Configuration Status Sensor Typical Characteristics
54 Intel order number G74211-001 Revision 1.0
Page 64

System Event Log Troubleshooting Guide for Intel® S5500/S3420 series Server Boards Memory subsystem
Byte
Field
Description
16
Event Data 3
Not used.
Event Trigger Offset
Description
Next Steps
Hex
Description
01h
The system has configured into
Spare Channel RAS mode.
Sparing mode is enabled in
setup.
Informational event only.
00h
The system has configured out of
Spare Channel RAS mode
Sparing mode is disabled,
either from setup or due to
error in which case post error
8500 also occurs.
1. If this event is accompanied by a post error 8500, there was a problem applying
the sparing configuration to the memory. Check for other errors related to the
memory and troubleshoot accordingly.
2. If there is no post error then sparing mode was simply disabled in bios setup and
this should be considered informational only.
Table 57: Sparing Configuration Status Sensor Event Trigger Offset – Next Steps
Revision 1.0 Intel order number G74211-001 55
Page 65

Memory subsystem System Event Log Troubleshooting Guide for Intel® S5500/S3420 series Server Boards
Byte
Field
Description
8
9
Generator ID
0001h = BIOS POST
11
Sensor Type
0ch = Memory
12
Sensor Number
11h
13
Event Direction and
Event Type
[7] Event direction
0b = Assertion Event
1b = Deassertion Event
[6:0] Event Type = 0Bh (Generic Discrete)
14
Event Data 1
[7:6] – 10b = OEM code in Event Data 2
[5:4] – 10b = OEM code in Event Data 3
[3:0] – Event Trigger Offset as described in Table 59
15
Event Data 2
[7:4] – If Domain Instance Type (ED3) is set to Local, this field specifies the 0-based Socket ID of the processor that contains the sparing
domain local sub-instances.
A value of 1110b indicates that the sparing configuration specified in Bits [3:0] applies globally to all sockets in the system.
If Domain Instance Type (ED3) is set to Global, this field specifies the 0-based Socket ID of the second participant processor in this
sparing domain global instance.
A value of 1111b indicates that this field is unused and does not contain valid data.
[3:0] – If Domain Instance Type (ED3) is set to Local, this field specifies the sparing domain local sub-instances – which channels are
included in this sub-instance:
0000b – Reserved
0001b – {Ch A, Ch B, Ch C} (only configuration possible on Intel® S5500/S5520 Server Boards)
0010b - 1110b – Reserved
If Domain Instance Type (ED3) is set to Global, this field specifies the 0-based Socket ID of the first participant processor in this
sparing domain global instance.
A value of 1111b indicates that this field is unused and does not contain valid data.
9.1.4 Sparing Redundancy State Sensor
This sensor provides the RAS Redundancy state for the Spare Channel Mode.
Table 58: Sparing Redundancy State Sensor Typical Characteristics
56 Intel order number G74211-001 Revision 1.0
Page 66

System Event Log Troubleshooting Guide for Intel® S5500/S3420 series Server Boards Memory subsystem
Byte
Field
Description
16
Event Data 3
[7] – Domain Instance Type
0b: Local memory sparing domain instance. This SEL pertains to a local memory sparing domain that is restricted to memory
sparing pairs within a processor socket only
1b: Global memory sparing domain instance. This SEL pertains to a global memory sparing domain that pertains to memory sparing
between processor sockets.
[6:4] – Reserved
[3:0] – 0-based Instance ID of this sparing domain
Event Trigger Offset
Description
Next Steps
Hex
Description
01h
Memory is configured in Spare
Channel Mode, and the memory is
operating in the fully redundant
state, with the spare channel
inactive and available.
System boots with spare
channel mode active, one
entry per processor
Informational event.
00h
Memory is configured in Spare
Channel Mode, and the memory
has lost redundancy and is
operating in the degraded state,
with the spare channel active and
used to replace a failed channel.
Spare channel replaces failing
channel; one SEL entry for
processor with failing memory
to signify loss of redundancy
This event should be accompanied by memory errors indicating the source of the
issue. Troubleshoot accordingly (probably replace affected DIMM).
Table 59: Sparing Redundancy State Sensor Event Trigger Offset – Next Steps
Revision 1.0 Intel order number G74211-001 57
Page 67

Memory subsystem System Event Log Troubleshooting Guide for Intel® S5500/S3420 series Server Boards
Byte
Field
Description
8
9
Generator ID
0033h = BIOS SMI Handler
11
Sensor Type
0ch = Memory
12
Sensor Number
02h
13
Event Direction and
Event Type
[7] Event direction
0b = Assertion Event
1b = Deassertion Event
[6:0] Event Type = 6Fh (Sensor Specific)
14
Event Data 1
[7:6] – 10b = OEM code in Event Data 2
[5:4] – 10b = OEM code in Event Data 3
[3:0] – Event Trigger Offset as described in Table 61
15
Event Data 2
[7:2] – Reserved. Set to 0.
[1:0] – The logical rank associated with the failed DDR3 DIMM
9.2 ECC and Address Parity
1. Memory data errors are logged as correctable or uncorrectable.
2. Uncorrectable errors are fatal.
3. Memory addresses are protected with parity bits and a parity error is logged. This is a fatal error.
9.2.1 Memory Correctable and Uncorrectable ECC Error
ECC errors are divided into Uncorrectable ECC Errors and Correctable ECC Errors. A “Correctable ECC Error” actually represents a threshold
overflow. More Correctable Errors are detected at the memory controller level for a given DIMM within a given timeframe. In both cases, the
error can be narrowed down to particular DIMM(s). The BIOS SMI error handler uses this information to log the data to the BMC SEL and
identify the failing DIMM module.
Table 60: Correctable and Uncorrectable ECC Error Sensor Typical Characteristics
58 Intel order number G74211-001 Revision 1.0
Page 68

System Event Log Troubleshooting Guide for Intel® S5500/S3420 series Server Boards Memory subsystem
Byte
Field
Description
16
Event Data 3
[7:5] – Indicates the Processor Socket to which the DDR3 DIMM having the ECC error is attached:
000b = Processor Socket 1
001b = Processor Socket 2
All other values are reserved.
[4:3] – Indicates the processor Memory Channel to which the failing DDR3 DIMM is attached:
00b = Channel A
01b = Channel B
10b = Channel C
11b is reserved.
[2:0] – Indicates the DIMM Socket on the channel to which the failing DDR3 DIMM is attached:
000b = DIMM Socket 1
001b = DIMM Socket 2
All other values are reserved.
Event Trigger Offset
Description
Next Steps
Hex
Description
01h
Uncorrectable ECC
Error.
An uncorrectable (multi-bit) ECC error has occurred. This is a fatal issue that will typically
lead to an OS crash (unless memory has been configured in a RAS mode). The system
will generate a CATERR# (catastrophic error) and an MCE (Machine Check Exception
Error).
While the error may be due to a failing DRAM chip on the DIMM, it could also be cause by
incorrect seating or improper contact between socket and DIMM, or by bent pins in the
processor socket.
1. If needed, decode DIMM location from hex
version of SEL.
2. Verify DIMM is seated properly.
3. Examine gold fingers on edge of DIMM to
verify contacts are clean.
4. Inspect processor socket this DIMM is
connected to for bent pins, and if found,
replace the board.
5. Consider replacing the DIMM as a
preventative measure. For multiple
occurrences, replace the DIMM.
Table 61: Correctable and Uncorrectable ECC Error Sensor Event Trigger Offset – Next Steps
Revision 1.0 Intel order number G74211-001 59
Page 69

Memory subsystem System Event Log Troubleshooting Guide for Intel® S5500/S3420 series Server Boards
Event Trigger Offset
Description
Next Steps
Hex
Description
00h
Correctable ECC
Error threshold
reached
There have been too many (10 or more) correctable ECC errors for this particular DIMM
since last boot. This event in itself does not pose any direct problems as the ECC errors
are still being corrected. Depending on the RAS configuration of the memory, the IMC may
take the affected DIMM offline
Even though this event doesn't immediately lead to
problems it can indicate one of the DIMM modules
is slowly failing. If this error occurs more than once:
1. If needed, decode DIMM location from hex
version of SEL.
2. Verify DIMM is seated properly.
3. Examine gold fingers on edge of DIMM to
verify contacts are clean.
4. Inspect processor socket this DIMM is
connected to for bent pins, and if found,
replace the board.
5. Consider replacing the DIMM as a
preventative measure. For multiple
occurrences, replace the DIMM.
Byte
Field
Description
8
9
Generator ID
0033h = BIOS SMI Handler
11
Sensor Type
0ch = Memory
12
Sensor Number
14h
9.2.2 Memory Address Parity Error
Address Parity errors are errors detected in the memory addressing hardware. Since these affect the addressing of memory contents, they can
potentially lead to the same sort of failures as ECC errors. They are logged as a distinct type of error since they affect memory addressing
rather than memory contents, but otherwise they are treated exactly the same as Uncorrectable ECC Errors. Address Parity errors are logged
to the BMC SEL, with Event Data to identify the failing address by channel and DIMM to the extent that it is possible to do so.
Table 62: Address Parity Error Sensor Typical Characteristics
60 Intel order number G74211-001 Revision 1.0
Page 70

System Event Log Troubleshooting Guide for Intel® S5500/S3420 series Server Boards Memory subsystem
Byte
Field
Description
13
Event Direction and
Event Type
[7] Event direction
0b = Assertion Event
1b = Deassertion Event
[6:0] Event Type = 6Fh (Sensor Specific)
14
Event Data 1
[7:6] – 10b = OEM code in Event Data 2
[5:4] – 10b = OEM code in Event Data 3
[3:0] – Event Trigger Offset = 02h
15
Event Data 2
[7:5] – Reserved. Set to 0.
[4] – Channel Information Validity Check:
0b = Channel Number in Event Data 3 Bits[4:3] is not valid
1b = Channel Number in Event Data 3 Bits[4:3] is valid
[3] – DIMM Information Validity Check:
0b = DIMM Slot ID in Event Data 3 Bits[2:0] is not valid
1b = DIMM Slot ID in Event Data 3 Bits[2:0] is valid
[2:0] – Error Type:
000b = Parity Error Type not known
001b = Data Parity Error (not used)
010b = Address Parity Error
All other values reserved.
Revision 1.0 Intel order number G74211-001 61
Page 71

Memory subsystem System Event Log Troubleshooting Guide for Intel® S5500/S3420 series Server Boards
Byte
Field
Description
16
Event Data 3
[7:5] – Indicates the Processor Socket to which the DDR3 DIMM having the ECC error is attached:
000b = Processor Socket 1
001b = Processor Socket 2
All other values are reserved.
[4:3] – Channel Number (if valid) on which the Parity Error occurred. This value will be indeterminate and
should be ignored if ED2 Bit [4] is 0b.
00b = Channel A
01b = Channel B
10b = Channel C
11b = reserved
[2:0] – DIMM Slot ID (If valid) of the specific DIMM that was involved in the transaction that led to the
parity error. This value will be indeterminate and should be ignored if ED2 Bit [3] is 0b.
000b = DIMM Socket 1
001b = DIMM Socket 2
All other values are reserved.
9.2.2.1 Memory Address Parity Error Sensor Next Steps
These are bit errors that are detected in the memory addressing hardware. An Address Parity Error implies that the memory address
transmitted to the DIMM addressing circuitry has been compromised, and data read or written are compromised in turn. An Address Parity
Error is logged as such in SEL but in all other ways is treated the same as an Uncorrectable ECC Error.
While the error may be due to a failing DRAM chip on the DIMM, it could also be caused by incorrect seating or improper contact between
socket and DIMM, or by bent pins in the processor socket.
1. If needed, decode DIMM location from hex version of SEL.
2. Verify DIMM is seated properly.
3. Examine gold fingers on edge of DIMM to verify contacts are clean.
4. Inspect processor socket this DIMM is connected to for bent pins, and if found, replace the board.
5. Consider replacing the DIMM as a preventative measure. For multiple occurrences, replace the DIMM.
62 Intel order number G74211-001 Revision 1.0
Page 72

System Event Log Troubleshooting Guide for Intel® S5500/S3420 series Server Boards PCI Express and Legacy PCI subsystem
Byte
Field
Description
8
9
Generator ID
0033h = BIOS SMI Handler
11
Sensor Type
13h = Critical Interrupt
12
Sensor Number
05h
13
Event Direction and
Event Type
[7] Event direction
0b = Assertion Event
1b = Deassertion Event
[6:0] Event Type = 71h (OEM Specific)
10. PCI Express and Legacy PCI subsystem
The PCI Express* (PCIe) Specification defines standard error types under the Advanced Error Reporting (AER) capabilities. The BIOS logs
AER events into the SEL.
The Legacy PCI Specification error types are PERR and SERR. These errors are supported and logged into the SEL.
10.1 PCI Express Errors
PCIe error events are either correctable (informational event) or fatal. In both cases information is logged to help identify the source of the PCIe
error and the bus, device, and function is included in the extended data fields. The PCIe devices are mapped in the operating system by bus,
device, and function. Each device is uniquely identified by the bus, device, and function. PCIe device information can be found in the operating
system.
10.1.1 PCI Express Correctable errors
When a PCI Express correctable error is reported to the BIOS SMI handler it will record the error using the following format.
Revision 1.0 Intel order number G74211-001 63
Table 63: PCI Express Correctable Error Sensor Typical Characteristics
Page 73

PCI Express and Legacy PCI subsystem System Event Log Troubleshooting Guide for Intel® S5500/S3420 series Server Boards
Byte
Field
Description
14
Event Data 1
[7:6] – 10b = OEM code in Event Data 2
[5:4] – 10b = OEM code in Event Data 3
[3:0] – Event Trigger Offset as described in Table 64
15
Event Data 2
PCI Bus number
16
Event Data 3
[7:3] – PCI Device number.
[2:0] – PCI Function number
Event Trigger Offset
Description
Next Steps
Hex
Description
00h
Receiver error
Correctable error occurred
Informational event only. Correctable errors are acceptable and normal at a low rate of
occurrence. If error continues:
1. Decode bus, device, and function to identify the card.
2. If this is an add/in card:
a. Verify card is inserted properly.
b. Install the card in another slot and check if the error follows the card or
stays with the slot.
c. Update all firmware and drivers, including non-Intel® components
3. If this is an onboard device:
a. Update all bios, firmware and drivers.
b. Replace the board.
01h
Bad DLLP error
Correctable bad DLLP occurred
02h
Bad TLLP error
Correctable bad TLP occurred
03h
REPLAY_NUM
Rollover Error
Correctable Replay event occurred
04h
REPLAY Timer
Timeout Error
Correctable Replay timeout event occurred
05h
Advisory non-fatal
Error (received
ERR_COR message)
Correctable advisory event occurred, typically
provided as notice to software driver
06h
Link bandwidth
changed
Link bandwidth changed
Table 64: PCI Express Correctable Error Sensor Event Trigger Offset – Next Steps
64 Intel order number G74211-001 Revision 1.0
Page 74

System Event Log Troubleshooting Guide for Intel® S5500/S3420 series Server Boards PCI Express and Legacy PCI subsystem
Byte
Field
Description
8
9
Generator ID
0033h = BIOS SMI Handler
11
Sensor Type
13h = Critical Interrupt
12
Sensor Number
04h
13
Event Direction and
Event Type
[7] Event direction
0b = Assertion Event
1b = Deassertion Event
[6:0] Event Type = 70h (OEM Specific)
14
Event Data 1
[7:6] – 10b = OEM code in Event Data 2
[5:4] – 10b = OEM code in Event Data 3
[3:0] – Event Trigger Offset as described in Table 66
15
Event Data 2
PCI Bus number
16
Event Data 3
[7:3] – PCI Device number
[2:0] – PCI Function number
10.1.2 PCI Express Fatal Errors
When a PCI Express fatal error is reported to the BIOS SMI handler it will record the error using the following format.
Table 65: PCI Express Fatal Error Sensor Typical Characteristics
Revision 1.0 Intel order number G74211-001 65
Page 75

PCI Express and Legacy PCI subsystem System Event Log Troubleshooting Guide for Intel® S5500/S3420 series Server Boards
Event Trigger Offset
Description
Next Steps
Hex
Description
00h
Data Link Layer Protocol Error
Indicates a CRC error detected during a DLLP transaction. This
means the transaction was corrupted.
1. Decode bus, device, and function to identify
the card.
2. If this is an add/in card:
a. Verify card is inserted properly.
b. Install the card in another slot and check
if the error follows the card or stays with
the slot.
c. Update all firmware and drivers,
including non-Intel® components.
3. If this is an onboard device:
a. Update all bios, firmware and drivers.
b. Replace the board.
01h
Surprise Link Down
The link was lost and is no longer functional. Requires a reboot to
bring the link back.
02h
Unexpected Completion
Indicates the device received a completion notification for a
transaction it does not recognize. This is a fatal error.
03h
Received Unsupported request condition on
inbound address decode with the exception
of SAD
Typically indicates a failure due to an incorrect address sent to the
target. This unknown address is a fatal error.
04h
Poisoned TLP Error
Typically indicates a parity error in a TLP transaction. This means
the data received is not correct.
05h
Flow Control Protocol Error
Indicates an error during initialization with the device not providing
enough flow control credits. This means the bus configuration is
incorrect and it cannot continue.
06h
Completion Timeout Error
Indicates a transaction did not complete in the specified amount of
time.
07h
Completer Abort Error
Indicates a transaction had unexpected content or format.
08h
Receiver Buffer Overflow Error
Indicates a synchronization problem between PCI Express devices.
Extremely rare.
09h
ACS Violation Error
Access Control Services, a transaction routing feature, failed.
0Ah
Malformed TLP Error
Indicates a transaction was sent with data exceeding the maximum
allowed number of bytes. This is not allowed and is a fatal error,
usually a firmware or driver problem.
0Bh
Received ERR_FATAL message from
downstream Error
Indicates a fatal error occurred and is being reported.
0Ch
Unexpected Completion Error
Indicates the device received a completion notification for a
transaction is does not recognize.
Table 66: PCI Express Fatal Error Sensor Event Trigger Offset – Next Steps
66 Intel order number G74211-001 Revision 1.0
Page 76

System Event Log Troubleshooting Guide for Intel® S5500/S3420 series Server Boards PCI Express and Legacy PCI subsystem
Event Trigger Offset
Description
Next Steps
Hex
Description
0Dh
Received ERR_NONFATAL Message Error
Indicates a non-fatal error is redefined as fatal, and is being
reported.
Byte
Field
Description
8
9
Generator ID
0033h = BIOS SMI Handler
11
Sensor Type
13h = Critical Interrupt
12
Sensor Number
03h
13
Event Direction and
Event Type
[7] Event direction
0b = Assertion Event
1b = Deassertion Event
[6:0] Event Type = 6Fh (Sensor Specific)
14
Event Data 1
[7:6] – 10b = OEM code in Event Data 2
[5:4] – 10b = OEM code in Event Data 3
[3:0] – Event Trigger Offset as described in Table 68
15
Event Data 2
PCI Bus number
16
Event Data 3
[7:3] – PCI Device number
[2:0] – PCI Function number
10.1.3 Legacy PCI Errors
Legacy PCI errors include PERR and SERR, both are fatal errors.
Table 67: Legacy PCI Error Sensor Typical Characteristics
Revision 1.0 Intel order number G74211-001 67
Page 77

PCI Express and Legacy PCI subsystem System Event Log Troubleshooting Guide for Intel® S5500/S3420 series Server Boards
Event Trigger Offset
Description
Next Steps
Hex
Description
04h
PERR#
Parity Error, PERR, asserted. This is a fatal error.
1. Decode bus, device, and function to identify the card.
2. If this is an add/in card:
a. Verify card is inserted properly.
b. Install the card in another slot and check if the error follows the card or stays with the slot.
c. Update all firmware and drivers, including non-Intel® components.
3. If this is an onboard device:
a. Update all bios, firmware and drivers.
b. Replace the board.
05h
SERR#
System Error, SERR, asserted. This is a fatal error.
Table 68: Legacy PCI Error Sensor Event Trigger Offset – Next Steps
68 Intel order number G74211-001 Revision 1.0
Page 78

System Event Log Troubleshooting Guide for Intel® S5500/S3420 series Server Boards System BIOS events
11. System BIOS events
There are a number of events that are owned by the system BIOS. These events can occur during Power On Self Test (POST) or when coming
out of a sleep state. Not all of these events signify errors. Some events are described in other chapters in this document (for example, memory
events).
11.1 System Events
These events can occur during POST or when coming out of a sleep state. These are informational events only.
1. When logging events during POST BIOS uses generator ID 0001h.
2. When coming out of a sleep state BIOS uses generator ID 0033h.
11.1.1 System Boot
The BIOS logs a system boot event every time the system boots. The event gets logged early during POST when BIOS – BMC communication
is first established. This event is not an error.
11.1.2 Timestamp Clock Synchronization
These events are use when the time between the BIOS and the BMC is synchronized. Two events are logged. BIOS does the first one to send
the time synch message to the BMC for synchronization, and the timestamp that message gets is unknown, that is, the timestamp in the log
could be anything since it gets the "before" timestamp.
So BIOS sends a second time synch message to get a "baseline" correct timestamp in the log. That is the "starting time".
For example, say that the time the BMC has is March 1, 2011 21:00. The BIOS time synch updates that to same date, 21:20 (BMC was running
behind). Without that 2nd time synch message, you don't know that the log time jumped ahead, and when you get the next log message it looks
like there was a 20-min delay during the boot for some unknown reason
Without that second time synch message, the time span to the next logged message is indeterminate. With the second time synch as a
baseline, the following log timestamps are always determinate.
Revision 1.0 Intel order number G74211-001 69
Page 79

System BIOS events System Event Log Troubleshooting Guide for Intel® S5500/S3420 series Server Boards
Byte
Field
Description
8
9
Generator ID
0001h = BIOS POST
0033h = BIOS SMI Handler
11
Sensor Type
12h = System Event
12
Sensor Number
83h
13
Event Direction and
Event Type
[7] Event direction
0b = Assertion Event
1b = Deassertion Event
[6:0] Event Type = 6Fh (Sensor Specific)
14
Event Data 1
[7:6] – 00b = Unspecified Event Data 2
[5:4] – 00b = Unspecified Event Data 3
[3:0] – Event Trigger Offset
01h = System Boot
05h = Timestamp Clock Synchronization
15
Event Data 2
For Event Trigger Offset 05h only (Timestamp Clock
Synchronization)
00h = 1st in pair
80h = 2nd in pair
16
Event Data 3
Not Used.
Table 69: System Event Sensor Typical Characteristics
70 Intel order number G74211-001 Revision 1.0
Page 80

System Event Log Troubleshooting Guide for Intel® S5500/S3420 series Server Boards System BIOS events
Byte
Field
Description
8
9
Generator ID
0001h = BIOS POST
11
Sensor Type
0Fh = System Firmware Progress (formerly POST
Error)
12
Sensor Number
06h
13
Event Direction and
Event Type
[7] Event direction
0b = Assertion Event
1b = Deassertion Event
[6:0] Event Type = 6Fh (Sensor Specific)
14
Event Data 1
[7:6] – 10b = OEM code in Event Data 2
[5:4] – 10b = OEM code in Event Data 3
[3:0] – Event Trigger Offset = 0
15
Event Data 2
Low Byte of POST Error Code
16
Event Data 3
High Byte of POST Error Code
11.2 System Firmware Progress (Formerly Post Error)
The BIOS logs any POST errors to the SEL. The two byte POST code gets logged in the ED2 and ED3 bytes in the SEL entry. This event will
be logged every time a POST error is displayed. Even though this event indicates an error, it may not be a fatal error. If this is a serious error,
there will typically also be a corresponding SEL entry logged for whatever was the cause of the error – this event may contain more information
about what happened than the POST error event.
Table 70: POST Error Sensor Typical Characteristics
11.2.1 System Firmware Progress (Formerly Post Error) – Next Steps
See the following table for POST error Codes:
Revision 1.0 Intel order number G74211-001 71
Page 81

System BIOS events System Event Log Troubleshooting Guide for Intel® S5500/S3420 series Server Boards
Error Code
Error Message
Response
0012
CMOS date/time not set
Major
0048
Password check failed
Major
0108
Keyboard component encountered a locked error.
Minor
0109
Keyboard component encountered a stuck key error.
Minor
0113
Fixed Media The SAS RAID firmware cannot run properly. The user should attempt to reflash the firmware.
Major
0140
PCI component encountered a PERR error.
Major
0141
PCI resource conflict
Major
0146
PCI out of resources error
Major
0192
Processor 0x cache size mismatch detected.
Fatal
0193
Processor 0x stepping mismatch.
Minor
0194
Processor 0x family mismatch detected.
Fatal
0195
Processor 0x Intel® QPI speed mismatch.
Fatal
0196
Processor 0x model mismatch.
Fatal
0197
Processor 0x speeds mismatched.
Fatal
0198
Processor 0x family is not supported.
Fatal
019F
Processor and chipset stepping configuration is unsupported.
Major
5220
CMOS/NVRAM Configuration Cleared
Major
5221
Passwords cleared by jumper
Major
5224
Password clear Jumper is Set.
Major
8160
Processor 01 unable to apply microcode update
Major
8161
Processor 02 unable to apply microcode update
Major
8180
Processor 0x microcode update not found.
Minor
8190
Watchdog timer failed on last boot
Major
Table 71: POST Error Codes
72 Intel order number G74211-001 Revision 1.0
Page 82

System Event Log Troubleshooting Guide for Intel® S5500/S3420 series Server Boards System BIOS events
Error Code
Error Message
Response
8198
OS boot watchdog timer failure.
Major
8300
Baseboard management controller failed self-test
Major
84F2
Baseboard management controller failed to respond
Major
84F3
Baseboard management controller in update mode
Major
84F4
Sensor data record empty
Major
84FF
System event log full
Minor
8500
Memory component could not be configured in the selected RAS mode.
Major
8501
DIMM Population Error.
Major
8502
CLTT Configuration Failure Error.
Major
8520
DIMM_A1 failed Self-Test (BIST).
Major
8521
DIMM_A2 failed Self-Test (BIST).
Major
8522
DIMM_B1 failed Self-Test (BIST).
Major
8523
DIMM_B2 failed Self-Test (BIST).
Major
8524
DIMM_C1 failed Self-Test (BIST).
Major
8525
DIMM_C2 failed Self-Test (BIST).
Major
8526
DIMM_D1 failed Self-Test (BIST).
Major
8527
DIMM_D2 failed Self-Test (BIST).
Major
8528
DIMM_E1 failed Self-Test (BIST).
Major
8529
DIMM_E2 failed Self-Test (BIST).
Major
852A
DIMM_F1 failed Self-Test (BIST).
Major
852B
DIMM_F2 failed Self-Test (BIST).
Major
8540
DIMM_A1 Disabled.
Major
8541
DIMM_A2 Disabled.
Major
8542
DIMM_B1 Disabled.
Major
8543
DIMM_B2 Disabled.
Major
Revision 1.0 Intel order number G74211-001 73
Page 83

System BIOS events System Event Log Troubleshooting Guide for Intel® S5500/S3420 series Server Boards
Error Code
Error Message
Response
8544
DIMM_C1 Disabled.
Major
8545
DIMM_C2 Disabled.
Major
8546
DIMM_D1 Disabled.
Major
8547
DIMM_D2 Disabled.
Major
8548
DIMM_E1 Disabled.
Major
8549
DIMM_E2 Disabled.
Major
854A
DIMM_F1 Disabled.
Major
854B
DIMM_F2 Disabled.
Major
8560
DIMM_A1 Component encountered a Serial Presence Detection (SPD) fail error.
Major
8561
DIMM_A2 Component encountered a Serial Presence Detection (SPD) fail error.
Major
8562
DIMM_B1 Component encountered a Serial Presence Detection (SPD) fail error.
Major
8563
DIMM_B2 Component encountered a Serial Presence Detection (SPD) fail error.
Major
8564
DIMM_C1 Component encountered a Serial Presence Detection (SPD) fail error.
Major
8565
DIMM_C2 Component encountered a Serial Presence Detection (SPD) fail error.
Major
8566
DIMM_D1 Component encountered a Serial Presence Detection (SPD) fail error.
Major
8567
DIMM_D2 Component encountered a Serial Presence Detection (SPD) fail error.
Major
8568
DIMM_E1 Component encountered a Serial Presence Detection (SPD) fail error.
Major
8569
DIMM_E2 Component encountered a Serial Presence Detection (SPD) fail error.
Major
856A
DIMM_F1 Component encountered a Serial Presence Detection (SPD) fail error.
Major
856B
DIMM_F2 Component encountered a Serial Presence Detection (SPD) fail error.
Major
85A0
DIMM_A1 Uncorrectable ECC error encountered.
Major
85A1
DIMM_A2 Uncorrectable ECC error encountered.
Major
85A2
DIMM_B1 Uncorrectable ECC error encountered.
Major
85A3
DIMM_B2 Uncorrectable ECC error encountered.
Major
85A4
DIMM_C1 Uncorrectable ECC error encountered.
Major
74 Intel order number G74211-001 Revision 1.0
Page 84

System Event Log Troubleshooting Guide for Intel® S5500/S3420 series Server Boards System BIOS events
Error Code
Error Message
Response
85A5
DIMM_C2 Uncorrectable ECC error encountered.
Major
85A6
DIMM_D1 Uncorrectable ECC error encountered.
Major
85A7
DIMM_D2 Uncorrectable ECC error encountered.
Major
85A8
DIMM_E1 Uncorrectable ECC error encountered.
Major
85A9
DIMM_E2 Uncorrectable ECC error encountered.
Major
85AA
DIMM_F1 Uncorrectable ECC error encountered.
Major
85AB
DIMM_F2 Uncorrectable ECC error encountered.
Major
8604
Chipset Reclaim of non-critical variables complete.
Minor
9000
Unspecified processor component has encountered a non-specific error.
Major
9223
Keyboard component was not detected.
Minor
9226
Keyboard component encountered a controller error.
Minor
9243
Mouse component was not detected.
Minor
9246
Mouse component encountered a controller error.
Minor
9266
Local Console component encountered a controller error.
Minor
9268
Local Console component encountered an output error.
Minor
9269
Local Console component encountered a resource conflict error.
Minor
9286
Remote Console component encountered a controller error.
Minor
9287
Remote Console component encountered an input error.
Minor
9288
Remote Console component encountered an output error.
Minor
92A3
Serial port component was not detected
Major
92A9
Serial port component encountered a resource conflict error
Major
92C6
Serial Port controller error
Minor
92C7
Serial Port component encountered an input error.
Minor
92C8
Serial Port component encountered an output error.
Minor
94C6
LPC component encountered a controller error.
Minor
Revision 1.0 Intel order number G74211-001 75
Page 85

System BIOS events System Event Log Troubleshooting Guide for Intel® S5500/S3420 series Server Boards
Error Code
Error Message
Response
94C9
LPC component encountered a resource conflict error.
Major
9506
ATA/ATPI component encountered a controller error.
Minor
95A6
PCI component encountered a controller error.
Minor
95A7
PCI component encountered a read error.
Minor
95A8
PCI component encountered a write error.
Minor
9609
Unspecified software component encountered a start error.
Minor
9641
PEI Core component encountered a load error.
Minor
9667
PEI module component encountered an illegal software state error.
Fatal
9687
DXE core component encountered an illegal software state error.
Fatal
96A7
DXE boot services driver component encountered an illegal software state error.
Fatal
96AB
DXE boot services driver component encountered invalid configuration.
Minor
96E7
SMM driver component encountered an illegal software state error.
Fatal
A000
TPM device not detected.
Minor
A001
TPM device missing or not responding.
Minor
A002
TPM device failure.
Minor
A003
TPM device failed self-test.
Minor
A022
Processor component encountered a mismatch error.
Major
A027
Processor component encountered a low voltage error.
Minor
A028
Processor component encountered a high voltage error.
Minor
A100
BIOS ACM Error
Major
A421
PCI component encountered a SERR error.
Fatal
A500
ATA/ATPI ATA bus SMART not supported.
Minor
A501
ATA/ATPI ATA SMART is disabled.
Minor
A5A0
PCI Express component encountered a PERR error.
Minor
A5A1
PCI Express component encountered a SERR error.
Fatal
76 Intel order number G74211-001 Revision 1.0
Page 86

System Event Log Troubleshooting Guide for Intel® S5500/S3420 series Server Boards System BIOS events
Error Code
Error Message
Response
A5A4
PCI Express IBIST error.
Major
A6A0
DXE boot services driver Not enough memory available to shadow a legacy option ROM.
Minor
B6A3
DXE boot services driver Unrecognized.
Major
Revision 1.0 Intel order number G74211-001 77
Page 87

Chassis subsystem System Event Log Troubleshooting Guide for Intel® S5500/S3420 series Server Boards
Byte
Field
Description
11
Sensor Type
05h = Physical Security
12
Sensor Number
04h
13
Event Direction and
Event Type
[7] Event direction
0b = Assertion Event
1b = Deassertion Event
[6:0] Event Type = 6Fh (Sensor Specific)
14
Event Data 1
[7:6] – 00b = Unspecified Event Data 2
[5:4] – 00b = Unspecified Event Data 3
[3:0] – Event Trigger Offset as described in Table 73
12. Chassis subsystem
The BMC monitors several aspects of the chassis. Next to logging when the power and reset buttons get pressed, the BMC also monitors
chassis intrusion if a chassis intrusion switch is included in the chassis; as well as looking at the network connections, and logging an event
whenever the physical network link is lost.
12.1 Physical Security
Two sensors are included in the physical security subsystem: chassis intrusion and LAN leash lost.
12.1.1 Chassis Intrusion
Chassis Intrusion is monitored on supported chassis, and the BMC logs corresponding events when the chassis lid is opened and closed.
12.1.2 LAN Leash lost
The LAN Leash lost sensor monitors the physical connection on the onboard network ports. If a LAN Leash lost event is logged this means the
network port lost its physical connection.
78 Intel order number G74211-001 Revision 1.0
Table 72: Physical Security Sensor Typical Characteristics
Page 88

System Event Log Troubleshooting Guide for Intel® S5500/S3420 series Server Boards Chassis subsystem
Byte
Field
Description
15
Event Data 2
Not used.
16
Event Data 3
Not used.
Event Trigger Offset
Description
Next Steps
Hex
Description
00h
chassis
intrusion
Somebody has opened the chassis (or the chassis
intrusion sensor is not connected)
1. Use the Quick Start Guide and the Service Guide to determine whether the chassis intrusion
switch is connected properly.
2. If this is the case, make sure it makes proper contact when the chassis is closed.
3. If this is also the case, someone has opened the chassis. Ensure nobody has access to the
system that shouldn't.
04h
LAN leash
lost
Someone has unplugged a LAN cable that was
present when the BMC initialized. This event gets
logged when the electrical connection on the NIC
connector gets lost.
This is most likely due to unplugging the cable but could also happen if there is an issue with cable
or switch.
1. Check the LAN cable and connector for issues.
2. Investigate switch logs where possible.
3. Ensure nobody has access to the server that shouldn't.
Byte
Field
Description
11
Sensor Type
13h = Critical Interrupt
12
Sensor Number
05h
Table 73: Physical Security Sensor Event Trigger Offset – Next Steps
12.2 FP (NMI) Interrupt
The front panel interrupt button (also referred to as NMI button) is a recessed button on the front panel that allows the user to force a critical
interrupt which causes a crash error or kernel panic.
Table 74: FP (NMI) Interrupt Sensor Typical Characteristics
Revision 1.0 Intel order number G74211-001 79
Page 89

Chassis subsystem System Event Log Troubleshooting Guide for Intel® S5500/S3420 series Server Boards
Byte
Field
Description
13
Event Direction and
Event Type
[7] Event direction
0b = Assertion Event
1b = Deassertion Event
[6:0] Event Type = 6Fh (Sensor Specific)
14
Event Data 1
[7:6] – 00b = Unspecified Event Data 2
[5:4] – 00b = Unspecified Event Data 3
[3:0] – Event Trigger Offset =0
15
Event Data 2
Not used.
16
Event Data 3
Not used.
Byte
Field
Description
11
Sensor Type
14h = Button / Switch
12
Sensor Number
09h
12.2.1 FP (NMI) Interrupt – Next Steps
The purpose of this button is for diagnosing software issues – when a critical interrupt is generated the OS typically saves a memory dump.
This allows for exact analysis of what is going on in system memory, which can be useful for software developers, or for troubleshooting OS,
software and driver issues.
If this button was not actually pressed, you should ensure there is no physical fault with the front panel.
This event only gets logged if a user pressed the NMI button, and although it causes the OS to crash, is not an error.
12.3 Button Press Events
The BMC logs when the front panel power and reset buttons get pressed. This is purely for informational purposes and these events do not
indicate errors.
80 Intel order number G74211-001 Revision 1.0
Table 75: Button Press Events Sensor Typical Characteristics
Page 90

System Event Log Troubleshooting Guide for Intel® S5500/S3420 series Server Boards Chassis subsystem
Byte
Field
Description
13
Event Direction and
Event Type
[7] Event direction
0b = Assertion Event
1b = Deassertion Event
[6:0] Event Type = 6Fh (Sensor Specific)
14
Event Data 1
[7:6] – 00b = Unspecified Event Data 2
[5:4] – 00b = Unspecified Event Data 3
[3:0] – Event Trigger Offset
0h = Power Button
2h = Reset Button
15
Event Data 2
Not used.
16
Event Data 3
Not used.
Revision 1.0 Intel order number G74211-001 81
Page 91

Miscellaneous events System Event Log Troubleshooting Guide for Intel® S5500/S3420 series Server Boards
Byte
Field
Description
11
Sensor Type
23h = Watchdog 2
12
Sensor Number
03h
13
Event Direction and
Event Type
[7] Event direction
0b = Assertion Event
1b = Deassertion Event
[6:0] Event Type = 6Fh (Sensor Specific)
14
Event Data 1
[7:6] – 00b = Unspecified Event Data 2
[5:4] – 00b = Unspecified Event Data 3
[3:0] – Event Trigger Offset as describe in Table 77
15
Event Data 2
Not used.
16
Event Data 3
Not used.
13. Miscellaneous events
The miscellaneous events section addresses sensors not easily grouped with other sensor types.
13.1 IPMI Watchdog
EPSD server systems support an IPMI watchdog timer, which can check to see if the OS is still responsive. The timer is disabled by default,
and would have to be enabled manually. It then requires an IPMI-aware utility in the operating system that will reset the timer before it expires.
If the timer does expire, the BMC can take action if it is configured to do so: (reset, power down, power cycle, or generate a critical interrupt)
Table 76: IPMI Watchdog Sensor Typical Characteristics
82 Intel order number G74211-001 Revision 1.0
Page 92

System Event Log Troubleshooting Guide for Intel® S5500/S3420 series Server Boards Miscellaneous events
Event Trigger Offset
Description
Next Steps
Hex
Description
00h
timer expired,
status only
Our server systems support a BMC watchdog timer, which can
check to see if the OS is still responsive. The timer is disabled by
default, and would have to be enabled manually. It then requires
an IPMI-aware utility in the operating system that will reset the
timer before it expires. If the timer does expire, the BMC can
take action if it is configured to do so: (reset, power down, power
cycle, or generate a critical interrupt)
If this event is being logged it is because the BMC has been configured to check the
watchdog timer.
1. Make sure you have support for this in your OS (typically using a third party
IPMI-aware utility like ipmitool or ipmiutil along with the openipmi driver).
2. If this is the case, then it is likely your OS has hung, and you should investigate
OS event logs to determine what may have caused this.
01h
hard reset
02h
power down
03h
power cycle
08h
timer interrupt
Byte
Field
Description
11
Sensor Type
F3h = SMI Timeout
12
Sensor Number
06h
13
Event Direction and
Event Type
[7] Event direction
0b = Assertion Event
1b = Deassertion Event
[6:0] Event Type = 03h (‘digital’ Discrete)
14
Event Data 1
[7:6] – 00b = Unspecified Event Data 2
[5:4] – 00b = Unspecified Event Data 3
[3:0] – Event Trigger Offset = 1 = State Asserted
15
Event Data 2
Not used.
Table 77: IPMI Watchdog Sensor Event Trigger Offset – Next Steps
13.2 SMI Timeout
SMI stands for system management interrupt and is an interrupt that gets generated so the processor can service server management events
(typically memory or PCI errors, or other forms of critical interrupts), in order to log them to the SEL. If this interrupt times out, the system is
frozen.
Table 78: SMI Timeout Sensor Typical Characteristics
Revision 1.0 Intel order number G74211-001 83
Page 93

Miscellaneous events System Event Log Troubleshooting Guide for Intel® S5500/S3420 series Server Boards
Byte
Field
Description
16
Event Data 3
Not used.
Byte
Field
Description
11
Sensor Type
10h = Event Logging Disabled
12
Sensor Number
07h
13
Event Direction and
Event Type
[7] Event direction
0b = Assertion Event
1b = Deassertion Event
[6:0] Event Type = 6Fh (Sensor Specific)
14
Event Data 1
[7:6] – 00b = Unspecified Event Data 2
[5:4] – 00b = Unspecified Event Data 3
[3:0] – Event Trigger Offset = 2 = Log area
reset/cleared
15
Event Data 2
Not used.
13.2.1 SMI Timeout – Next Steps
This event normally only occurs after another more critical event.
1. Check the SEL for any critical interrupts, memory errors, bus errors, PCI errors or any other serious errors.
2. If these are not present the system locked up before it was able to log the original issue. In this case, low level debug is normally required.
13.3 System Event Log Cleared
The BMC logs a SEL clear event. This would only ever be the first event in the SEL. Cause of this event is either a manual SEL clear using
Intel® SEL Viewer or some other IPMI aware utility, or is done in the factory as one of the last steps in the manufacturing process.
This is an informational event only.
Table 79: System Event Log Cleared Sensor Typical Characteristics
84 Intel order number G74211-001 Revision 1.0
Page 94

System Event Log Troubleshooting Guide for Intel® S5500/S3420 series Server Boards Miscellaneous events
Byte
Field
Description
16
Event Data 3
Not used.
Byte
Field
Description
11
Sensor Type
12h = System Event
12
Sensor Number
08h
13
Event Direction and
Event Type
[7] Event direction
0b = Assertion Event
1b = Deassertion Event
[6:0] Event Type = 6Fh (Sensor Specific)
14
Event Data 1
[7:6] – 00b = Unspecified Event Data 2
[5:4] – 00b = Unspecified Event Data 3
[3:0] – Event Trigger Offset = 4 = PEF Action
15
Event Data 2
Not used.
16
Event Data 3
Not used.
13.4 System Event – PEF action
The BMC is configurable to send alerts for events logged into the SEL. These alerts are called Platform Event Filters (PEF) and are disabled by
default. The user must configure and enable this feature. PEF events are logged if the BMC takes action due to a PEF configuration. The BMC
event triggering the PEF action will also be in the SEL.
This functionality is built into the BMC to allow it to send alerts (SNMP or other) for any event that gets logged to the SEL. PEF filters are turned
off by default and would have to be enabled manually using Intel® deployment assistant, Intel® syscfg utility, Intel® or manually.
Table 80: System Event – PEF Action Sensor Typical Characteristics
13.4.1 System Event – PEF Action – Next Steps
This event gets logged if the BMC takes an action due to PEF configuration. Actions can be sending an alert, or resetting, power cycling, or
powering down the system. There will be another event that has led to the action so you should investigate the SEL and PEF settings to identify
this event, and troubleshoot accordingly.
Revision 1.0 Intel order number G74211-001 85
Page 95

Hot Swap Controller events System Event Log Troubleshooting Guide for Intel® S5500/S3420 series Server Boards
Byte
Field
Description
8
9
Generator ID
00C0h = HSC Firmware – HSBP A
00C2h = HSC Firmware – HSBP B
11
Sensor Type
01h = Temperature
12
Sensor Number
01h
13
Event Direction and
Event Type
[7] Event direction
0b = Assertion Event
1b = Deassertion Event
[6:0] Event Type = 01h (Threshold)
14
Event Data 1
[7:6] – 01b = Trigger reading in Event Data 2
[5:4] – 01b = Trigger threshold in Event Data 3
[3:0] – Event Trigger Offset as described in Table 82
15
Event Data 2
Reading that triggered event.
16
Event Data 3
Threshold value that triggered event.
14. Hot Swap Controller events
The Hot Swap Controller (HSC) implements the same basic sensor model that is utilized by the other management controllers in the system.
Sensor model information is contained in the document Intelligent Platform Management Interface Specification. A common set of IPMI
commands is used for configuring the sensors and returning threshold status.
14.1 HSC Backplane Temperature Sensor
There is a thermal sensor on the Hot Swap Backplane to measure the ambient temperature.
Table 81: HSC Backplane Temperature Sensor Typical Characteristics
86 Intel order number G74211-001 Revision 1.0
Page 96

System Event Log Troubleshooting Guide for Intel® S5500/S3420 series Server Boards Hot Swap Controller events
Event Trigger
Assertion
Severity
Deassert
Severity
Description
Next Steps
Hex
Description
00h
Lower non critical
going low
Degraded
OK
The temperature has dropped below its lower non
critical threshold.
1. Check for clear and unobstructed airflow into and out of
chassis.
2. Ensure SDR is programmed and correct chassis has
been selected.
3. Ensure there are no fan failures.
4. Ensure the air used to cool the system is within the
thermal specifications for the system (typically below
35°C).
02h
Lower critical
going low
non-fatal
Degraded
The temperature has dropped below its lower critical
threshold.
07h
Upper non critical
going high
Degraded
OK
The temperature has gone over its upper non critical
threshold.
09h
Upper critical
going high
non-fatal
Degraded
The temperature has gone over its upper critical
threshold.
Byte
Field
Description
8
9
Generator ID
00C0h = HSC Firmware – HSBP A
00C2h = HSC Firmware – HSBP B
11
Sensor Type
0Dh = Drive Slot (Bay)
12
Sensor Number
6 Slot HSBP
8 Slot HSBP
02h = Drive Slot 0 Status
03h = Drive Slot 1 Status
04h = Drive Slot 2 Status
05h = Drive Slot 3 Status
06h = Drive Slot 4 Status
07h = Drive Slot 5 Status
02h = Drive Slot 0 Status
03h = Drive Slot 1 Status
04h = Drive Slot 2 Status
05h = Drive Slot 3 Status
06h = Drive Slot 4 Status
07h = Drive Slot 5 Status
08h = Drive Slot 6 Status
09h = Drive Slot 7 Status
Table 82: HSC Backplane Temperature Sensor – Event Trigger Offset – Next Steps
14.2 HSC Drive Slot Status Sensor
The HSC Drive Slot Status sensor will provide the current status for drives in each of the slots.
Table 83: HSC Drive Slot Status Sensor Typical Characteristics
Revision 1.0 Intel order number G74211-001 87
Page 97

Hot Swap Controller events System Event Log Troubleshooting Guide for Intel® S5500/S3420 series Server Boards
Byte
Field
Description
13
Event Direction and
Event Type
[7] Event direction
0b = Assertion Event
1b = Deassertion Event
[6:0] Event Type = 6Fh (Sensor Specific)
14
Event Data 1
40h = Failed Drive
15
Event Data 2
Not used.
16
Event Data 3
Not used.
Byte
Field
Description
8
9
Generator ID
00C0h = HSC Firmware – HSBP A
00C2h = HSC Firmware – HSBP B
11
Sensor Type
0Dh = Drive Slot (Bay)
12
Sensor Number
6 Slot HSBP
8 Slot HSBP
14.2.1 HSC Drive Slot Status Sensor – Next Steps
If during normal operation a drive gets reported as failed then ensure that the drive was seated properly and the drive carrier was properly
latched. If that does not work then replace the drive.
14.3 HSC Drive Presence Sensor
The HSC Drive Slot Presence sensor will provide the current presence state for drive in each of the slots. After an AC power cycle there will be
a SEL entry to report the presence of the drive in a slot and there will be another entry for any changes in the presence of drives after that.
88 Intel order number G74211-001 Revision 1.0
Table 84: HSC Drive Presence Sensor Typical Characteristics
Page 98

System Event Log Troubleshooting Guide for Intel® S5500/S3420 series Server Boards Hot Swap Controller events
Byte
Field
Description
08h = Drive Slot 0 Presence
09h = Drive Slot 1 Presence
0Ah = Drive Slot 2 Presence
0Bh = Drive Slot 3 Presence
0Ch = Drive Slot 4 Presence
0Dh = Drive Slot 5 Presence
0Ah = Drive Slot 0 Presence
0Bh = Drive Slot 1 Presence
0Ch = Drive Slot 2 Presence
0Dh = Drive Slot 3 Presence
0Eh = Drive Slot 4 Presence
0Fh = Drive Slot 5 Presence
10h = Drive Slot 6 Presence
11h = Drive Slot 7 Presence
13
Event Direction and
Event Type
[7] Event direction
0b = Assertion Event
1b = Deassertion Event
[6:0] Event Type = 08h (‘digital’ Discrete)
14
Event Data 1
[7:6] – 00b = Unspecified Event Data 2
[5:4] – 00b = Unspecified Event Data 3
[3:0] – Event Trigger Offset
0h = Device Removed/Device Absent.
1h= Device Inserted/Device Present
15
Event Data 2
Not used.
16
Event Data 3
Not used.
14.3.1 HSC Drive Presence Sensor – Next Steps
On AC power on the drive presence will be logged as an informational event.
If during normal operation a drive is removed or installed it will also log an event.
If you get a drive removed or installed without operator intervention then ensure that the drive was seated properly and the drive carrier was
properly latched.
Revision 1.0 Intel order number G74211-001 89
Page 99

Manageability Engine (ME) events System Event Log Troubleshooting Guide for Intel® S5500/S3420 series Server Boards
Byte
Field
Description
8
9
Generator ID
002Ch – ME Firmware
11
Sensor Type
DCh = OEM
12
Sensor Number
18h
13
Event Direction and
Event Type
[7] Event direction
0b = Assertion Event
1b = Deassertion Event
[6:0] Event Type = 72h (OEM)
14
Event Data 1
[7:6] – 10b = OEM code in Event Data 2
[5:4] – 10b = OEM code in Event Data 3
[3] – Node Manager Policy event
0 – Reserved
1 – Policy Correction Time Exceeded – policy did not meet the contract for the defined policy. The policy will continue to limit the
power or shutdown the platform based on the defined policy action.
[2] – Reserved
[1:0] – 00b
15
Event Data 2
[4:7] – Reserved
[0:3] – Domain Id (Currently, supports only one domain, Domain 0)
16
Event Data 3
Policy Id
15. Manageability Engine (ME) events
The Manageability Engine controls the PECI interface and also contains the Node Manager functionality.
15.1 Node Manager Exception Event
A Node Manager Exception Event will be sent each time when maintained policy power limit is exceeded over Correction Time Limit.
Table 85: Node Manager Exception Sensor Typical Characteristics
90 Intel order number G74211-001 Revision 1.0
Page 100

System Event Log Troubleshooting Guide for Intel® S5500/S3420 series Server Boards Manageability Engine (ME) events
Byte
Field
Description
8
9
Generator ID
002Ch – ME Firmware
11
Sensor Type
DCh = OEM
12
Sensor Number
19h
13
Event Direction and
Event Type
[7] Event direction
0b = Assertion Event
1b = Deassertion Event
[6:0] Event Type = 73h (OEM)
14
Event Data 1
[7:6] – 10b = OEM code in Event Data 2
[5:4] – 10b = OEM code in Event Data 3
[3:0] – Health Event Type =02h (Sensor Node Manager)
15.1.1 Node Manager Exception Event – Next Steps
This is an informational event. Next steps will depend on the policy that was set. See the Node Manager Specification for more details.
15.2 Node Manager Health Event
A Node Manager Health Event message provides a run-time error indication about Intel® Intelligent Power Node Manager’s health. Types of
service that can send an error are defined as follows:
Misconfigured policy Error reading power data
Error reading inlet temperature
Table 86: Node Manager Health Event Sensor Typical Characteristics
Revision 1.0 Intel order number G74211-001 91
 Loading...