

Page 1

System Event Log Troubleshooting
Guide for EPSD Platforms Based on
Intel® Xeon® Processor E5
4600/2600/2400/1600/1400
Product Families
Intel order number G90620-002
Revision 1.1
September 2013
Enterprise Platforms and Services Division – Marketing
Page 2

Revision History System Event Log Troubleshooting Guide for EPSD Platforms Based on Intel® Xeon® Processor E5
Date
Revision
Number
Modifications
January 2013
1.0
Initial release
September 2013
1.1
Added MIC Thermal Margin sensors C4 through C7.
Added MIC Status sensors A2, A3, A6, and A7.
Added voltage sensors EA, EB, EC, ED, and EF.
Corrected typographical errors.
Made corrections to Firmware Update Status table.
Made corrections to Catastrophic Error Sensor table.
Added support for S1400FP, S1400SP, S1600JP, and S4600LH.
4600/2600/2400/1600/1400 Product Families
Revision History
ii Intel order number G90620-002 Revision 1.1
Page 3

System Event Log Troubleshooting Guide for EPSD Platforms Based on Intel® Xeon® Processor E5
4600/2600/2400/1600/1400 Product Families Disclaimers
Disclaimers
INFORMATION IN THIS DOCUMENT IS PROVIDED IN CONNECTION WITH INTEL PRODUCTS. NO LICENSE,
EXPRESS OR IMPLIED, BY ESTOPPEL OR OTHERWISE, TO ANY INTELLECTUAL PROPERTY RIGHTS IS
GRANTED BY THIS DOCUMENT. EXCEPT AS PROVIDED IN INTEL'S TERMS AND CONDITIONS OF SALE FOR
SUCH PRODUCTS, INTEL ASSUMES NO LIABILITY WHATSOEVER AND INTEL DISCLAIMS ANY EXPRESS OR
IMPLIED WARRANTY, RELATING TO SALE AND/OR USE OF INTEL PRODUCTS INCLUDING LIABILITY OR
WARRANTIES RELATING TO FITNESS FOR A PARTICULAR PURPOSE, MERCHANTABILITY, OR
INFRINGEMENT OF ANY PATENT, COPYRIGHT OR OTHER INTELLECTUAL PROPERTY RIGHT.
A "Mission Critical Application" is any application in which failure of the Intel Product could result, directly or indirectly,
in personal injury or death. SHOULD YOU PURCHASE OR USE INTEL'S PRODUCTS FOR ANY SUCH MISSION
CRITICAL APPLICATION, YOU SHALL INDEMNIFY AND HOLD INTEL AND ITS SUBSIDIARIES,
SUBCONTRACTORS AND AFFILIATES, AND THE DIRECTORS, OFFICERS, AND EMPLOYEES OF EACH,
HARMLESS AGAINST ALL CLAIMS COSTS, DAMAGES, AND EXPENSES AND REASONABLE ATTORNEYS'
FEES ARISING OUT OF, DIRECTLY OR INDIRECTLY, ANY CLAIM OF PRODUCT LIABILITY, PERSONAL
INJURY, OR DEATH ARISING IN ANY WAY OUT OF SUCH MISSION CRITICAL APPLICATION, WHETHER OR
NOT INTEL OR ITS SUBCONTRACTOR WAS NEGLIGENT IN THE DESIGN, MANUFACTURE, OR WARNING OF
THE INTEL PRODUCT OR ANY OF ITS PARTS.
Intel may make changes to specifications and product descriptions at any time, without notice. Designers must not
rely on the absence or characteristics of any features or instructions marked "reserved" or "undefined". Intel reserves
these for future definition and shall have no responsibility whatsoever for conflicts or incompatibilities arising from
future changes to them. The information here is subject to change without notice. Do not finalize a design with this
information.
The products described in this document may contain design defects or errors known as errata which may cause the
product to deviate from published specifications. Current characterized errata are available on request.
Contact your local Intel sales office or your distributor to obtain the latest specifications and before placing your
product order.
Copies of documents which have an order number and are referenced in this document, or other Intel literature, may
be obtained by calling 1-800-548-4725, or go to: http://www.intel.com/design/literature.
Revision 1.1 Intel order number G90620-002 iii
Page 4

Table of Contents System Event Log Troubleshooting Guide for EPSD Platforms Based on Intel® Xeon® Processor E5
4600/2600/2400/1600/1400 Product Families
Table of Contents
1. Introduction .......................................................................................................................... 1
1.1 Purpose ................................................................................................................... 1
1.2 Industry Standard .................................................................................................... 2
1.2.1 Intelligent Platform Management Interface (IPMI) ................................................... 2
1.2.2 Baseboard Management Controller (BMC) ............................................................. 2
1.2.3 Intel® Intelligent Power Node Manager Version 2.0 ................................................. 3
2. Basic Decoding of a SEL Record ........................................................................................ 4
2.1 Default Values in the SEL Records ......................................................................... 4
2.2 Notes on SEL Logs and Collecting SEL Information ............................................. 10
2.2.1 Examples of Decoding BIOS Timestamp Events .................................................. 10
2.2.2 Example of Decoding a PCI Express* Correctable Error Events ........................... 11
2.2.3 Example of Decoding a Power Supply Predictive Failure Event............................ 12
3. Sensor Cross Reference List ............................................................................................ 13
3.1 BMC owned Sensors (GID = 0020h) ..................................................................... 13
3.2 BIOS POST owned Sensors (GID = 0001h) .......................................................... 24
3.3 BIOS SMI Handler owned Sensors (GID = 0033h) ................................................ 24
3.4 Node Manager / ME Firmware owned Sensors (GID = 002Ch or 602Ch) ............. 25
3.5 Microsoft* OS owned Events (GID = 0041) ........................................................... 26
3.6 Linux* Kernel Panic Events (GID = 0021) .............................................................. 26
4. Power Subsystems ............................................................................................................ 27
4.1 Threshold-based Voltage Sensors ........................................................................ 27
4.2 Voltage Regulator Watchdog Timer Sensor .......................................................... 33
4.2.1 Voltage Regulator Watchdog Timer Sensor – Next Steps ..................................... 34
4.3 Power Unit ............................................................................................................. 34
4.3.1 Power Unit Status Sensor ...................................................................................... 34
4.3.2 Power Unit Redundancy Sensor ............................................................................ 36
4.3.3 Node Auto Shutdown Sensor ................................................................................ 37
4.4 Power Supply ......................................................................................................... 38
4.4.1 Power Supply Status Sensors ............................................................................... 38
4.4.2 Power Supply Power In Sensors ........................................................................... 41
4.4.3 Power Supply Current Out % Sensors .................................................................. 42
4.4.4 Power Supply Temperature Sensors ..................................................................... 43
4.4.5 Power Supply Fan Tachometer Sensors ............................................................... 44
5. Cooling Subsystem ............................................................................................................ 45
5.1 Fan Sensors .......................................................................................................... 45
5.1.1 Fan Tachometer Sensors ...................................................................................... 45
5.1.2 Fan Presence and Redundancy Sensors .............................................................. 46
5.2 Temperature Sensors ............................................................................................ 49
iv Intel order number G90620-002 Revision 1.1
Page 5

System Event Log Troubleshooting Guide for EPSD Platforms Based on Intel® Xeon® Processor E5
4600/2600/2400/1600/1400 Product Families Table of Contents
5.2.1 Threshold-based Temperature Sensors ................................................................ 49
5.2.2 Thermal Margin Sensors ....................................................................................... 51
5.2.3 Processor Thermal Control Sensors ...................................................................... 53
5.2.4 Processor DTS Thermal Margin Sensors .............................................................. 55
5.2.5 Discrete Thermal Sensors ..................................................................................... 55
5.2.6 DIMM Thermal Trip Sensors .................................................................................. 57
5.3 System Air Flow Monitoring Sensor ....................................................................... 58
6. Processor Subsystem ........................................................................................................ 59
6.1 Processor Status Sensor ....................................................................................... 59
6.2 Catastrophic Error Sensor ..................................................................................... 61
6.3 CPU Missing Sensor .............................................................................................. 62
6.3.1 CPU Missing Sensor – Next Steps ........................................................................ 63
6.4 Quick Path Interconnect Sensors .......................................................................... 63
6.4.1 QPI Link Width Reduced Sensor ........................................................................... 63
6.4.2 QPI Correctable Error Sensor ................................................................................ 64
6.4.3 QPI Fatal Error and Fatal Error #2 ......................................................................... 65
6.5 Processor ERR2 Timeout Sensor .......................................................................... 67
6.5.1 Processor ERR2 Timeout – Next Steps ................................................................ 68
6.6 Processor MSID Mismatch Sensor ........................................................................ 68
6.6.1 Processor MSID Mismatch Sensor – Next Steps .................................................. 69
7. Memory Subsystem ........................................................................................................... 70
7.1 Memory RAS Configuration Status ........................................................................ 70
7.2 Memory RAS Mode Select .................................................................................... 72
7.3 Mirroring Redundancy State ................................ .................................................. 73
7.3.1 Mirroring Redundancy State Sensor – Next Steps ................................................ 74
7.4 Sparing Redundancy State .................................................................................... 74
7.4.1 Sparing Redundancy State Sensor – Next Steps .................................................. 76
7.5 ECC and Address Parity ........................................................................................ 76
7.5.1 Memory Correctable and Uncorrectable ECC Error .............................................. 76
7.5.2 Memory Address Parity Error ................................................................................ 78
8. PCI Express* and Legacy PCI Subsystem ....................................................................... 81
8.1 PCI Express* Errors ............................................................................................... 81
8.1.1 Legacy PCI Errors ................................................................................................. 81
8.1.2 PCI Express* Fatal Errors and Fatal Error #2 ........................................................ 82
8.1.3 PCI Express* Correctable Errors ........................................................................... 84
9. System BIOS Events .......................................................................................................... 87
9.1 System Events ....................................................................................................... 87
9.1.1 System Boot .......................................................................................................... 87
9.1.2 Timestamp Clock Synchronization ........................................................................ 87
9.2 System Firmware Progress (Formerly Post Error) ................................................. 89
Revision 1.1 Intel order number G90620-002 v
Page 6

Table of Contents System Event Log Troubleshooting Guide for EPSD Platforms Based on Intel® Xeon® Processor E5
4600/2600/2400/1600/1400 Product Families
9.2.1 System Firmware Progress (Formerly Post Error) – Next Steps ........................... 89
10. Chassis Subsystem ........................................................................................................... 97
10.1 Physical Security ................................................................................................... 97
10.1.1 Chassis Intrusion ................................................................................................... 97
10.1.2 LAN Leash Lost ..................................................................................................... 97
10.2 FP (NMI) Interrupt .................................................................................................. 98
10.2.1 FP (NMI) Interrupt – Next Steps ............................................................................ 99
10.3 Button Sensor ...................................................................................................... 100
11. Miscellaneous Events ................................ ...................................................................... 101
11.1 IPMI Watchdog .................................................................................................... 101
11.2 SMI Timeout ........................................................................................................ 102
11.2.1 SMI Timeout – Next Steps ................................................................................... 103
11.3 System Event Log Cleared .................................................................................. 103
11.4 System Event – PEF Action ................................................................................. 104
11.4.1 System Event – PEF Action – Next Steps ........................................................... 104
11.5 BMC Watchdog Sensor ....................................................................................... 105
11.5.1 BMC Watchdog Sensor – Next Steps .................................................................. 105
11.6 BMC FW Health Sensor ...................................................................................... 106
11.6.1 BMC FW Health Sensor – Next Steps ................................................................. 106
11.7 Firmware Update Status Sensor .......................................................................... 107
11.8 Add-In Module Presence Sensor ......................................................................... 108
11.8.1 Add-In Module Presence – Next Steps ................................................................ 108
11.9 Intel® Xeon Phi™ Coprocessor Management Sensors ......................................... 109
11.9.1 Intel® Xeon Phi™ Coprocessor (MIC) Thermal Margin Sensors ........................... 109
11.9.2 Intel® Xeon Phi™ Coprocessor (MIC) Status Sensors .......................................... 109
12. Hot-Swap Controller Backplane Events ......................................................................... 111
12.1 HSC Backplane Temperature Sensor ................................................................. 111
12.2 Hard Disk Drive Monitoring Sensor ..................................................................... 112
12.3 Hot-Swap Controller Health Sensor ..................................................................... 113
12.3.1 HSC Health Sensor – Next Steps ........................................................................ 114
13. Manageability Engine (ME) Events ................................................................................. 115
13.1 ME Firmware Health Event .................................................................................. 115
13.1.1 ME Firmware Health Event – Next Steps ............................................................ 115
13.2 Node Manager Exception Event .......................................................................... 117
13.2.1 Node Manager Exception Event – Next Steps .................................................... 117
13.3 Node Manager Health Event ............................................................................... 118
13.3.1 Node Manager Health Event – Next Steps .......................................................... 119
13.4 Node Manager Operational Capabilities Change ................................................ 120
13.4.1 Node Manager Operational Capabilities Change – Next Steps ........................... 121
13.5 Node Manger Alert Threshold Exceeded ............................................................. 122
vi Intel order number G90620-002 Revision 1.1
Page 7

System Event Log Troubleshooting Guide for EPSD Platforms Based on Intel® Xeon® Processor E5
4600/2600/2400/1600/1400 Product Families Table of Contents
13.5.1 Node Manger Alert Threshold Exceeded – Next Steps ....................................... 123
14. Microsoft Windows* Records .......................................................................................... 124
14.1 Boot up Event Records ................................ ........................................................ 124
14.2 Shutdown Event Records .................................................................................... 126
14.3 Bug Check / Blue Screen Event Records ............................................................ 128
15. Linux* Kernel Panic Records .......................................................................................... 130
Revision 1.1 Intel order number G90620-002 vii
Page 8

List of Tables System Event Log Troubleshooting Guide for EPSD Platforms Based on Intel® Xeon® Processor E5
4600/2600/2400/1600/1400 Product Families
List of Tables
Table 1. SEL Record Format ........................................................................................................ 4
Table 2: Event Request Message Event Data Field Contents ...................................................... 7
Table 3: OEM SEL Record (Type C0h-DFh) ................................................................................ 8
Table 4: OEM SEL Record (Type E0h-FFh) ................................................................................. 9
Table 5: BMC owned Sensors .................................................................................................... 13
Table 6: BIOS POST owned Sensors ......................................................................................... 24
Table 7: BIOS SMI Handler owned Sensors ............................................................................... 24
Table 8: Management Engine Firmware owned Sensors ........................................................... 25
Table 9: Microsoft* OS owned Events ........................................................................................ 26
Table 10: Linux* Kernel Panic Events ......................................................................................... 26
Table 11: Threshold-based Voltage Sensors Typical Characteristics......................................... 27
Table 12: Threshold-based Voltage Sensors Event Triggers – Description ............................... 28
Table 13: Threshold-based Voltage Sensors – Next Steps ........................................................ 28
Table 14: Voltage Regulator Watchdog Timer Sensor Typical Characteristics .......................... 34
Table 15: Power Unit Status Sensors Typical Characteristics .................................................... 35
Table 16: Power Unit Status Sensor – Sensor Specific Offsets – Next Steps ............................ 35
Table 17: Power Unit Redundancy Sensors Typical Characteristics .......................................... 36
Table 18: Power Unit Redundancy Sensor – Event Trigger Offset – Next Steps ....................... 37
Table 19: Node Auto Shutdown Sensor Typical Characteristics ................................................ 37
Table 20: Power Supply Status Sensors Typical Characteristics ............................................... 38
Table 21: Power Supply Status Sensor – Sensor Specific Offsets – Next Steps ....................... 39
Table 22: Power Supply Power In Sensors Typical Characteristics ........................................... 41
Table 23: Power Supply Power In Sensor – Event Trigger Offset – Next Steps ........................ 41
Table 24: Power Supply Current Out % Sensors Typical Characteristics .................................. 42
Table 25: Power Supply Current Out % Sensor – Event Trigger Offset – Next Steps ................ 42
Table 26: Power Supply Temperature Sensors Typical Characteristics ..................................... 43
Table 27: Power Supply Temperature Sensor – Event Trigger Offset – Next Steps .................. 43
Table 28: Power Supply Fan Tachometer Sensors Typical Characteristics ............................... 44
Table 29: Fan Tachometer Sensors Typical Characteristics ...................................................... 45
Table 30: Fan Tachometer Sensor – Event Trigger Offset – Next Steps ................................... 46
Table 31: Fan Presence Sensors Typical Characteristics .......................................................... 46
Table 32: Fan Presence Sensors – Event Trigger Offset – Next Steps ...................................... 47
Table 33: Fan Redundancy Sensors Typical Characteristics ..................................................... 47
Table 34: Fan Redundancy Sensor – Event Trigger Offset – Next Steps .................................. 48
Table 35: Temperature Sensors Typical Characteristics ............................................................ 49
Table 36: Temperature Sensors Event Triggers – Description ................................................... 50
Table 37: Temperature Sensors – Next Steps ............................................................................ 50
Table 38: Thermal Margin Sensors Typical Characteristics ....................................................... 51
viii Intel order number G90620-002 Revision 1.1
Page 9

System Event Log Troubleshooting Guide for EPSD Platforms Based on Intel® Xeon® Processor E5
4600/2600/2400/1600/1400 Product Families List of Tables
Table 39: Thermal Margin Sensors Event Triggers – Description .............................................. 52
Table 40: Thermal Margin Sensors – Next Steps ....................................................................... 52
Table 41: Processor Thermal Control Sensors Typical Characteristics ...................................... 53
Table 42: Processor Thermal Control Sensors Event Triggers – Description............................. 54
Table 43: Processor DTS Thermal Margin Sensors Typical Characteristics .............................. 55
Table 44: Discrete Thermal Sensors Typical Characteristics ..................................................... 56
Table 45: Discrete Thermal Sensors – Next Steps ..................................................................... 56
Table 46: DIMM Thermal Trip Typical Characteristics ................................................................ 57
Table 47: Process Status Sensors Typical Characteristics ........................................................ 59
Table 48: Processor Status Sensors – Next Steps ..................................................................... 60
Table 49: Catastrophic Error Sensor Typical Characteristics ..................................................... 61
Table 50: Catastrophic Error Sensor – Event Data 2 Values – Next Steps ................................ 61
Table 51: CPU Missing Sensor Typical Characteristics .............................................................. 62
Table 52: QPI Link Width Reduced Sensor Typical Characteristics ........................................... 63
Table 53: QPI Correctable Error Sensor Typical Characteristics ................................................ 64
Table 54: QPI Fatal Error Sensor Typical Characteristics .......................................................... 65
Table 55: QPI Fatal #2 Error Sensor Typical Characteristics ..................................................... 66
Table 56: Processor ERR2 Timeout Sensor Typical Characteristics .......................................... 68
Table 57: Processor MSID Mismatch Sensor Typical Characteristics ........................................ 69
Table 58: Memory RAS Configuration Status Sensor Typical Characteristics............................ 70
Table 59: Memory RAS Configuration Status Sensor – Event Trigger Offset – Next Steps ....... 71
Table 60: Memory RAS Mode Select Sensor Typical Characteristics ........................................ 72
Table 61: Mirroring Redundancy State Sensor Typical Characteristics ...................................... 73
Table 62: Sparing Redundancy State Sensor Typical Characteristics ....................................... 75
Table 63: Correctable and Uncorrectable ECC Error Sensor Typical Characteristics ................ 76
Table 64: Correctable and Uncorrectable ECC Error Sensor Event Trigger Offset – Next Steps77
Table 65: Address Parity Error Sensor Typical Characteristics .................................................. 78
Table 66: Legacy PCI Error Sensor Typical Characteristics ....................................................... 81
Table 67: PCI Express* Fatal Error Sensor Typical Characteristics ........................................... 82
Table 68: PCI Express* Fatal Error #2 Sensor Typical Characteristics ...................................... 83
Table 69: PCI Express* Correctable Error Sensor Typical Characteristics ................................ 85
Table 70: System Event Sensor Typical Characteristics ............................................................ 88
Table 71: POST Error Sensor Typical Characteristics ................................................................ 89
Table 72: POST Error Codes ...................................................................................................... 90
Table 73: Physical Security Sensor Typical Characteristics ....................................................... 97
Table 74: Physical Security Sensor Event Trigger Offset – Next Steps ..................................... 98
Table 75: FP (NMI) Interrupt Sensor Typical Characteristics ..................................................... 99
Table 76: Button Sensor Typical Characteristics ...................................................................... 100
Table 77: IPMI Watchdog Sensor Typical Characteristics ........................................................ 101
Table 78: IPMI Watchdog Sensor Event Trigger Offset – Next Steps ...................................... 102
Revision 1.1 Intel order number G90620-002 ix
Page 10

List of Tables System Event Log Troubleshooting Guide for EPSD Platforms Based on Intel® Xeon® Processor E5
4600/2600/2400/1600/1400 Product Families
Table 79: SMI Timeout Sensor Typical Characteristics ............................................................ 102
Table 80: System Event Log Cleared Sensor Typical Characteristics ...................................... 103
Table 81: System Event – PEF Action Sensor Typical Characteristics .................................... 104
Table 82: BMC Watchdog Sensor Typical Characteristics ....................................................... 105
Table 83: BMC FW Health Sensor Typical Characteristics ...................................................... 106
Table 84: Firmware Update Status Sensor Typical Characteristics .......................................... 107
Table 85: Add-In Module Presence Sensor Typical Characteristics ......................................... 108
Table 86: MIC Status Sensors - Typical Characteristics ........................................................... 109
Table 87: HSC Backplane Temperature Sensor Typical Characteristics ................................. 111
Table 88: HSC Backplane Temperature Sensor – Event Trigger Offset – Next Steps ............. 112
Table 89: Hard Disk Drive Monitoring Sensor Typical Characteristics................................ ...... 112
Table 90: Hard Disk Drive Monitoring Sensor - Event Trigger Offset – Next Steps .................. 113
Table 91: HSC Health Sensor Typical Characteristics ............................................................. 113
Table 92: ME Firmware Health Event Sensor Typical Characteristics...................................... 115
Table 93: ME Firmware Health Event Sensor – Next Steps ..................................................... 116
Table 94: Node Manager Exception Sensor Typical Characteristics ........................................ 117
Table 95: Node Manager Health Event Sensor Typical Characteristics ................................... 118
Table 96: Node Manager Operational Capabilities Change Sensor Typical Characteristics .... 120
Table 97: Node Manager Alert Threshold Exceeded Sensor Typical Characteristics .............. 122
Table 98: Boot up Event Record Typical Characteristics .......................................................... 124
Table 99: Boot up OEM Event Record Typical Characteristics ................................................ 125
Table 100: Shutdown Reason Code Event Record Typical Characteristics ............................. 126
Table 101: Shutdown Reason OEM Event Record Typical Characteristics ............................. 126
Table 102: Shutdown Comment OEM Event Record Typical Characteristics .......................... 127
Table 103: Bug Check/Blue Screen – OS Stop Event Record Typical Characteristics ............ 128
Table 104: Bug Check/Blue Screen code OEM Event Record Typical Characteristics ............ 129
Table 105: Linux* Kernel Panic Event Record Characteristics ................................................. 130
Table 106: Linux* Kernel Panic String Extended Record Characteristics ................................. 131
x Intel order number G90620-002 Revision 1.1
Page 11

System Event Log Troubleshooting Guide for EPSD Platforms Based on Intel® Xeon® Processor E5
4600/2600/2400/1600/1400 Product Families Introduction
1. Introduction
The server management hardware that is part of the Intel® Server Boards and Intel® Server
Platforms serves as a vital part of the overall server management strategy. The server
management hardware provides essential information to the system administrator and provides
the administrator the ability to remotely control the server, even when the operating system is
not running.
The Intel® Server Boards and Intel® Server Platforms offer comprehensive hardware and
software based solutions. The server management features make the servers simple to manage
and provide alerting on system events. From entry to enterprise systems, good overall server
management is essential to reduce overall total cost of ownership.
This Troubleshooting Guide is intended to help the users better understand the events that are
logged in the Baseboard Management Controllers (BMC) System Event Logs (SEL) on these
Intel® Server Boards.
There is a separate User’s Guide that covers the general server management and the server
management software offered on the Intel® Server Boards and Intel® Server Platforms.
Server boards currently supported by this document:
Intel® S1400FP Server Boards
Intel® S1400SP Server Boards
Intel® S1600JP Server Boards
Intel® S2400BB Server Boards
Intel® S2400EP Server Boards
Intel® S2400GP Server Boards
Intel® S2400LP Server Boards
Intel® S2400SC Server Boards
Intel® S2600CO Server Boards
Intel® S2600CP Server Boards
Intel® S2600GZ/S2600GL Server Boards
Intel® S2600IP Server Boards
Intel® S2600JF Server Boards
Intel® S2600WP Server Boards
Intel® S4600LH Server Boards
Intel® W2600CR Workstation Boards
1.1 Purpose
The purpose of this document is to list all possible events generated by the Intel platform. It may
be possible that other sources (not under our control) also generate events, which will not be
described in this document.
Revision 1.1 Intel order number G90620-002 1
Page 12

Introduction System Event Log Troubleshooting Guide for EPSD Platforms Based on Intel® Xeon® Processor E5
4600/2600/2400/1600/1400 Product Families
1.2 Industry Standard
1.2.1 Intelligent Platform Management Interface (IPMI)
The key characteristic of the Intelligent Platform Management Interface (IPMI) is that the
inventory, monitoring, logging, and recovery control functions are available independently of the
main processors, BIOS, and operating system. Platform management functions can also be
made available when the system is in a power-down state.
IPMI works by interfacing with the BMC, which extends management capabilities in the server
system and operates independently of the main processor by monitoring the on-board
instrumentation. Through the BMC, IPMI also allows administrators to control power to the
server, and remotely access BIOS configuration and operating system console information.
IPMI defines a common platform instrumentation interface to enable interoperability between:
The baseboard management controller and chassis
The baseboard management controller and systems management software
Between servers
IPMI enables the following:
Common access to platform management information, consisting of:
- Local access from systems management software
- Remote access from LAN
- Inter-chassis access from Intelligent Chassis Management Bus
- Access from LAN, serial/modem, IPMB, PCI SMBus*, or ICMB, available even if the
processor is down
IPMI interface isolates systems management software from hardware.
Hardware advancements can be made without impacting the systems management
software.
IPMI facilitates cross-platform management software.
You can find more information on IPMI at the following URL:
http://www.intel.com/design/servers/ipmi
1.2.2 Baseboard Management Controller (BMC)
A baseboard management controller (BMC) is a specialized microcontroller embedded on most
Intel® Server Boards. The BMC is the heart of the IPMI architecture and provides the
intelligence behind intelligent platform management, that is, the autonomous monitoring and
recovery features implemented directly in platform management hardware and firmware.
Different types of sensors built into the computer system report to the BMC on parameters such
as temperature, cooling fan speeds, power mode, operating system status, and so on. The BMC
monitors the system for critical events by communicating with various sensors on the system
2 Intel order number G90620-002 Revision 1.1
Page 13

System Event Log Troubleshooting Guide for EPSD Platforms Based on Intel® Xeon® Processor E5
4600/2600/2400/1600/1400 Product Families Introduction
board; it sends alerts and logs events when certain parameters exceed their preset thresholds,
indicating a potential failure of the system. The administrator can also remotely communicate
with the BMC to take some corrective action such as resetting or power cycling the system to
get a hung OS running again. These abilities save on the total cost of ownership of a system.
For Intel® Server Boards and Intel® Server Platforms, the BMC supports the industry standard
IPMI 2.0 Specification, enabling you to configure, monitor, and recover systems remotely.
1.2.2.1 System Event Log (SEL)
The BMC provides a centralized, non-volatile repository for critical, warning, and informational
system events called the System Event Log or SEL. By having the BMC manage the SEL and
logging functions, it helps to ensure that “post-mortem” logging information is available if a
failure occurs that disables the system processor(s).
The BMC allows access to SEL from in-band and out-of-band mechanisms. There are various
tools and utilities that can be used to access the SEL. There is the Intel® SELView utility and
multiple open sourced IPMI tools.
1.2.3 Intel
®
Intelligent Power Node Manager Version 2.0
Intel® Intelligent Power Node Manager Version 2.0 (NM) is a platform-resident technology that
enforces power and thermal policies for the platform. These policies are applied by exploiting
subsystem knobs (such as processor P and T states) that can be used to control power
consumption. Intel® Intelligent Power Node Manager enables data center power and thermal
management by exposing an external interface to management software through which platform
policies can be specified. It also enables specific data center power management usage models
such as power limiting.
The configuration and control commands are used by the external management software or
BMC to configure and control the Intel® Intelligent Power Node Manager feature. Because
Platform Services firmware does not have any external interface, external commands are first
received by the BMC over LAN and then relayed to the Platform Services firmware over IPMB
channel. The BMC acts as a relay and the transport conversion device for these commands. For
simplicity, the commands from the management console might be encapsulated in a generic
CONFIG packet format (configuration data length, configuration data blob) to the BMC so that
the BMC doesn’t even have to parse the actual configuration data.
The BMC provides the access point for remote commands from external management SW and
generates alerts to them. Intel® Intelligent Power Node Manager on Intel® Manageability Engine
(Intel® ME) is an IPMI satellite controller. A mechanism exists to forward commands to Intel® ME
and then sends the response back to originator. Similarly events from Intel® ME will be sent as
alerts outside of the BMC.
Revision 1.1 Intel order number G90620-002 3
Page 14

Basic Decoding of a SEL Record
Byte
Field
Description
1 2 Record ID
(RID)
ID used for SEL Record access.
3
Record Type
(RT)
[7:0] – Record Type
02h = System event record
C0h-DFh = OEM timestamped, bytes 8-16 OEM defined (See Table 3)
E0h-FFh = OEM non-timestamped, bytes 4-16 OEM defined (See Table 4)
4
5
6
7
Timestamp
(TS)
Time when event was logged. LS byte first.
Example: TS:[29][76][68][4C] = 4C687629h = 1281914409 = Sun, 15 Aug 2010
23:20:09 UTC
Note: There are various websites that will convert the raw number to a date/time.
System Event Log Troubleshooting Guide for EPSD Platforms Based on Intel® Xeon® Processor E5 4600/2600/2400/1600/1400 Product Families
2. Basic Decoding of a SEL Record
The System Event Log (SEL) record format is defined in the IPMI Specification. The following section provides a basic definition for
each of the fields in a SEL. For more details see the IPMI Specification.
The definitions for the standard SEL can be found in Table 1.
The definitions for the OEM defined event logs can be found in Table 3 and Table 4.
2.1 Default Values in the SEL Records
Unless otherwise noted in the event record descriptions the following are the default values in all SEL entries.
Byte [3] = Record Type (RT) = 02h = System event record
Byte [9:8] = Generator ID = 0020h = BMC Firmware
Byte [10] = Event Message Revision (ER) = 04h = IPMI 2.0
4 Intel order number G90620-002 Revision 1.1
Table 1. SEL Record Format
Page 15

System Event Log Troubleshooting Guide for EPSD Platforms Based on Intel® Xeon® Processor E5 4600/2600/2400/1600/1400 Product Families
Byte
Field
Description
8 9 Generator ID
(GID)
RqSA and LUN if event was generated from IPMB.
Software ID if event was generated from system software.
Byte 1
[7:1] – 7-bit I2C Slave Address, or 7-bit system software ID
[0] 0b = ID is IPMB Slave Address
1b = System software ID
Software ID values:
0001h – BIOS POST for POST errors, RAS Configuration/State,
Timestamp Synch, OS Boot events
0033h – BIOS SMI Handler
0020h – BMC Firmware
002Ch – ME Firmware
0041h – Server Management Software
00C0h – HSC Firmware – HSBP A
00C2h – HSC Firmware – HSBP B
Byte 2
[7:4] – Channel number. Channel that event message was received over. 0h if the event
message was received from the system interface, primary IPMB, or internally generated
by the BMC.
[3:2] – Reserved. Write as 00b.
[1:0] – IPMB device LUN if byte 1 holds Slave Address. 00b otherwise.
10
EvM Rev
(ER)
Event Message format version. 04h = IPMI v2.0; 03h = IPMI v1.0
11
Sensor Type
(ST)
Sensor Type Code for sensor that generated the event
12
Sensor #
(SN)
Number of sensor that generated the event (From SDR)
13
Event Dir |
Event Type
(EDIR)
Event Dir
[7] – 0b = Assertion event.
1b = Deassertion event.
Event Type
Type of trigger for the event, for example, critical threshold going high, state asserted,
and so on. Also indicates class of the event. For example, discrete, threshold, or OEM.
The Event Type field is encoded using the Event/Reading Type Code.
Basic Decoding of a SEL Record
Revision 1.1 Intel order number G90620-002 5
Page 16

Basic Decoding of a SEL Record
Byte
Field
Description
[6:0] – Event Type Codes
01h = Threshold (States = 0x00-0x0b)
02h-0ch = Discrete
6Fh = Sensor-Specific
70-7Fh = OEM
14
Event Data 1
(ED1)
Per Table 2
15
Event Data 2
(ED2)
16
Event Data 3
(ED3)
System Event Log Troubleshooting Guide for EPSD Platforms Based on Intel® Xeon® Processor E5 4600/2600/2400/1600/1400 Product Families
6 Intel order number G90620-002 Revision 1.1
Page 17

System Event Log Troubleshooting Guide for EPSD Platforms Based on Intel® Xeon® Processor E5 4600/2600/2400/1600/1400 Product Families
Sensor
Class
Event Data
Threshold
Event Data 1
[7:6] – 00b = Unspecified Event Data 2
01b = Trigger reading in Event Data 2
10b = OEM code in Event Data 2
11b = Sensor-specific event extension code in Event Data 2
[5:4] – 00b = Unspecified Event Data 3
01b = Trigger threshold value in Event Data 3
10b = OEM code in Event Data 3
11b = Sensor-specific event extension code in Event Data 3
[3:0] – Offset from Event/Reading Code for threshold event.
Event Data 2 – Reading that triggered event, FFh or not present if unspecified.
Event Data 3 – Threshold value that triggered event, FFh or not present if unspecified. If present, Event Data 2 must be present.
discrete
Event Data 1
[7:6] – 00b = Unspecified Event Data 2
01b = Previous state and/or severity in Event Data 2
10b = OEM code in Event Data 2
11b = Sensor-specific event extension code in Event Data 2
[5:4] – 00b = Unspecified Event Data 3
01b = Reserved
10b = OEM code in Event Data 3
11b = Sensor-specific event extension code in Event Data 3
[3:0] – Offset from Event/Reading Code for discrete event state
Event Data 2
[7:4] – Optional offset from “Severity” Event/Reading Code (0Fh if unspecified).
[3:0] – Optional offset from Event/Reading Type Code for previous discrete event state (0Fh if unspecified).
Event Data 3 – Optional OEM code. FFh or not present if unspecified.
OEM
Event Data 1
[7:6] – 00b = Unspecified in Event Data 2
01b = Previous state and/or severity in Event Data 2
10b = OEM code in Event Data 2
Basic Decoding of a SEL Record
Table 2: Event Request Message Event Data Field Contents
Revision 1.1 Intel order number G90620-002 7
Page 18

Basic Decoding of a SEL Record
Sensor
Class
Event Data
11b = Reserved
[5:4] – 00b = Unspecified Event Data 3
01b = Reserved
10b = OEM code in Event Data 3
11b = Reserved
[3:0] – Offset from Event/Reading Type Code
Event Data 2
[7:4] – Optional OEM code bits or offset from “Severity” Event/Reading Type Code (0Fh if unspecified).
[3:0] – Optional OEM code or offset from Event/Reading Type Code for previous event state (0Fh if unspecified).
Event Data 3 – Optional OEM code. FFh or not present if unspecified.
Byte
Field
Description
1 2 Record ID
(RID)
ID used for SEL Record access.
3
Record Type
(RT)
[7:0] – Record Type
C0h-DFh = OEM timestamped, bytes 8-16 OEM defined
4
5
6
7
Timestamp
(TS)
Time when event was logged. LS byte first.
Example: TS:[29][76][68][4C] = 4C687629h = 1281914409 = Sun, 15 Aug 2010
23:20:09 UTC
Note: There are various websites that will convert the raw number to a date/time.
8
9
10
Manufacturer ID
LS Byte first. The manufacturer ID is a 20-bit value that is derived from the IANA
“Private Enterprise” ID.
Most significant four bits = Reserved (0000b).
000000h = Unspecified. 0FFFFFh = Reserved.
This value is binary encoded.
For example the ID for the IPMI forum is 7154 decimal, which is 1BF2h, which will be
stored in this record as F2h, 1Bh, 00h for bytes 8 through 10, respectively.
System Event Log Troubleshooting Guide for EPSD Platforms Based on Intel® Xeon® Processor E5 4600/2600/2400/1600/1400 Product Families
Table 3: OEM SEL Record (Type C0h-DFh)
8 Intel order number G90620-002 Revision 1.1
Page 19

System Event Log Troubleshooting Guide for EPSD Platforms Based on Intel® Xeon® Processor E5 4600/2600/2400/1600/1400 Product Families
Byte
Field
Description
11
12
13
14
15
16
OEM Defined
OEM Defined. This is defined according to the manufacturer identified by the
Manufacturer ID field.
Byte
Field
Description
1 2 Record ID
(RID)
ID used for SEL Record access.
3
Record Type
(RT)
[7:0] – Record Type
E0h-FFh = OEM system event record
4
5
6
7
8
9
10
11
12
13
14
15
16
OEM
OEM Defined. This is defined by the system integrator.
Basic Decoding of a SEL Record
Table 4: OEM SEL Record (Type E0h-FFh)
Revision 1.1 Intel order number G90620-002 9
Page 20

Basic Decoding of a SEL Record
System Event Log Troubleshooting Guide for EPSD Platforms Based on Intel® Xeon® Processor E5 4600/2600/2400/1600/1400 Product Families
2.2 Notes on SEL Logs and Collecting SEL Information
Whenever you capture the SEL log, you should always collect both the text/human readable version and the hex version. Because
some of the data is OEM-specific, some utilities cannot decode the information correctly. In addition with some OEM-specific data
there may be additional variables that are not decoded at all.
An example of not decoding all of the information is the BIOS timestamp synchronization event log. This event can be logged by the
BIOS during POST or it can be logged by the BIOS SMI Handler when a system is requested to do a shutdown or a restart from the
operating system (OS). See section 2.2.1 for examples. Most utilities report this as just a BIOS event and do not differentiate
between the two. But sometimes it is useful because you can see the sequence of events better. For example if there are multiple
sequences of the timestamp synchronization events, was the power lost after booting to the OS and then the system restarted, was it
multiple POST events, or was it a restart from the OS?
An example of not decoding all the information is with the PCI Express* errors and some of the Power Supply events. For the PCI
Express* errors the type of error and the PCI Bus, Device, and Function are all a part of Event Data 1 through Event Data 3. See
section 2.2.2. For the Power Supply events when there is a failure, predictive failure, or a configuration error, Event Data 2 and Event
Data 3 hold additional information that describes the Power Supplies PMBus* Command Registers and values for that particular
event. See section 2.2.3.
2.2.1 Examples of Decoding BIOS Timestamp Events
The following are some samples of BIOS timestamp events during POST and during an OS shutdown.
2.2.1.1 BIOS POST Timestamp Events
RID[19][01] RT[02] TS[57][49][6A][4E] GID[01][00] ER[04] ST[12] SN[83] EDIR[6F] ED1[05] ED2[00] ED3[FF]
RID[1A][01] RT[02] TS[57][49][6A][4E] GID[01][00] ER[04] ST[12] SN[83] EDIR[6F] ED1[05] ED2[80] ED3[FF]
10 Intel order number G90620-002 Revision 1.1
RID (Record ID) = 0119h
RT (Record Type) = 02h = system event record
TS (Timestamp) = 4E6A4957h
GID (Generator ID = 0001h = BIOS POST
ER (Event Message Revision) = 04 = IPMI v2.0
ST (Sensor Type) = 12h = System Event (From IPMI Specification Table 42-3, Sensor Type Codes)
SN (Sensor Number = 83h
EDIR (Event Direction/Event Type) = 6fh; [7] = 0 = Assertion Event
[6:0] = 6fh = Sensor specific
ED1 (Event Data 1) = 05h = Timestamp Clock Synchronization
ED2 (Event Data 2) = 00h = First in pair
Page 21

System Event Log Troubleshooting Guide for EPSD Platforms Based on Intel® Xeon® Processor E5 4600/2600/2400/1600/1400 Product Families
Basic Decoding of a SEL Record
RID (Record ID) = 011Ah
RT (Record Type) = 02h = system event record
TS (Timestamp) = 4E6A4957h
GID (Generator ID = 0001h = BIOS POST
ER (Event Message Revision) = 04 = IPMI v2.0
ST (Sensor Type) = 12h = System Event (From IPMI Specification Table 42-3, Sensor Type Codes)
SN (Sensor Number = 83h
EDIR (Event Direction/Event Type) = 6fh; [7] = 0 = Assertion Event
ED1 (Event Data 1) = 05h = Timestamp Clock Synchronization
ED2 (Event Data 2) = 80h = Second in pair
[6:0] = 6fh = Sensor specific
2.2.1.2 BIOS SMI Handler Timestamp Events
RID[1F][00] RT[02] TS[C3][70][8D][4F] GID[33][00] ER[04] ST[12] SN[83] EDIR[6F] ED1[05] ED2[00] ED3[FF]
RID[20][00] RT[02] TS[C4][70][8D][4F] GID[33][00] ER[04] ST[12] SN[83] EDIR[6F] ED1[05] ED2[80] ED3[FF]
RID (Record ID) = 001Fh
RT (Record Type) = 02h = system event record
TS (Timestamp) = 4F8D70C3h
GID (Generator ID = 0033h = BIOS SMI Handler
ER (Event Message Revision) = 04 = IPMI v2.0
ST (Sensor Type) = 12h = System Event (From IPMI Specification Table 42-3, Sensor Type Codes)
SN (Sensor Number = 83h
EDIR (Event Direction/Event Type) = 6Fh; [7] = 0 = Assertion Event
[6:0] = 6fh = Sensor specific
ED1 (Event Data 1) = 05h = Timestamp Clock Synchronization
ED2 (Event Data 2) = 00h = First in pair
RID (Record ID) = 0020h
RT (Record Type) = 02h = system event record
TS (Timestamp) = 4F8D70C4h
GID (Generator ID = 0033h = BIOS SMI Handler
ER (Event Message Revision) = 04 = IPMI v2.0
ST (Sensor Type) = 12h = System Event (From IPMI Specification Table 42-3, Sensor Type Codes)
SN (Sensor Number = 83h
EDIR (Event Direction/Event Type) = 6fh; [7] = 0 = Assertion Event
[6:0] = 6fh = Sensor specific
ED1 (Event Data 1) = 05h = Timestamp Clock Synchronization
ED2 (Event Data 2) = 00h = First in pair
2.2.2 Example of Decoding a PCI Express* Correctable Error Events
The following is an example of decoding a PCI Express* correctable error event. For this particular event it recorded a receiver error
on Bus 0, Device 2, and Function 2. Note that correctable errors are acceptable and normal at a low rate of occurrence.
RID[27][00] RT[02] TS[0A][9B][2E][50] GID[33][00] ER[04] ST[13] SN[05] EDIR[71] ED1[A0] ED1[00] ED3[12]
RID (Record ID) = 0027h
Revision 1.1 Intel order number G90620-002 11
Page 22

Basic Decoding of a SEL Record
System Event Log Troubleshooting Guide for EPSD Platforms Based on Intel® Xeon® Processor E5 4600/2600/2400/1600/1400 Product Families
RT (Record Type) = 02h = system event record
TS (Timestamp) = 502E9B0Ah
GID (Generator ID = 0033h = BIOS SMI Handler
ER (Event Message Revision) = 04 = IPMI v2.0
ST (Sensor Type) = 13h = Critical Interrupt (From IPMI Specification Table 42-3, Sensor Type Codes)
SN (Sensor Number = 05h
EDIR (Event Direction/Event Type) = 71h; [7] = 0 = Assertion Event
ED1 (Event Data 1) = A0h; [7:6] = 10b = OEM code in Event Data 2
[5:4] – 10b = OEM code in Event Data 3
[3:0] – Event Trigger Offset = 0h = Receiver Error
ED2 (Event Data 2) = 00h; PCI Bus number = 0
ED3 (Event Data 3) = 12h; [7:3] – PCI Device number = 02h
[2:0] – PCI Function number = 2
[6:0] = 71h = OEM Specific for PCI Express* correctable errors
2.2.3 Example of Decoding a Power Supply Predictive Failure Event
The following is an example of decoding a Power Supply predictive failure event. For this example power supply 1 saw an A/C power
loss event with both the input under-voltage warning and fault events getting set. In most cases this means that the A/C power spiked
under the minimum warning and fault thresholds for over 20 milliseconds but the system remained powered on. If these events
continue to occur, it is advisable to check your power source.
RID[5D][00] RT[02] TS[D3][B1][AE][4E] GID[20][00] ER[04] ST[08] SN[50] EDIR[6F] ED1[A2] ED2[06] ED3[30]
RID (Record ID) = 005Dh
RT (Record Type) = 02h = system event record
TS (Timestamp) = 4EAEB1D3h
GID (Generator ID = 0020h = BMC
ER (Event Message Revision) = 04 = IPMI v2.0
ST (Sensor Type) = 08h = Power Supply (From IPMI Specification Table 42-3, Sensor Type Codes)
SN (Sensor Number = 50h = Power Supply 1
EDIR (Event Direction/Event Type) = 6Fh; [7] = 0 = Assertion Event
[6:0] = 6fh = Sensor specific
ED1 (Event Data 1) = A2h; [7:6] = 10b = OEM code in Event Data 2
[5:4] – 10b = OEM code in Event Data 3
[3:0] – Event Trigger Offset = 2h = Predictive Failure
ED2 (Event Data 2) = 06h = Input under-voltage warning
ED3 (Event Data 3) = 30h; From PMBus* Specification STATUS_INPUT command
[5] – VIN_UV_WARNING (Input Under-voltage Warning) = 1
[4] – VIN_UV_FAULT (Input Under-voltage Fault) = 1
12 Intel order number G90620-002 Revision 1.1
Page 23
System Event Log Troubleshooting Guide for EPSD Platforms Based on Intel® Xeon® Processor E5 4600/2600/2400/1600/1400 Product Families
Sensor
Number
Sensor Name
Details Section
Next Steps
01h
Power Unit Status
(Pwr Unit Status)
Power Unit Status Sensor
Table 16: Power Unit Status Sensor – Sensor Specific Offsets – Next
Steps
02h
Power Unit Redundancy
(Pwr Unit Redund)
Power Unit Redundancy Sensor
Table 18: Power Unit Redundancy Sensor – Event Trigger Offset – Next
Steps
03h
IPMI Watchdog
(IPMI Watchdog)
IPMI Watchdog
Table 78: IPMI Watchdog Sensor Event Trigger Offset – Next Steps
04h
Physical Security
(Physical Scrty)
Physical Security
Table 74: Physical Security Sensor Event Trigger Offset – Next Steps
05h
FP Interrupt
(FP NMI Diag Int)
FP (NMI) Interrupt
FP (NMI) Interrupt – Next Steps
06h
SMI Timeout
(SMI Timeout)
SMI Timeout
SMI Timeout – Next Steps
07h
System Event Log
(System Event Log)
System Event Log Cleared
Not applicable
08h
System Event
(System Event)
System Event – PEF Action
System Event – PEF Action – Next Steps
09h
Button Sensor
(Button)
Button Sensor
Not applicable
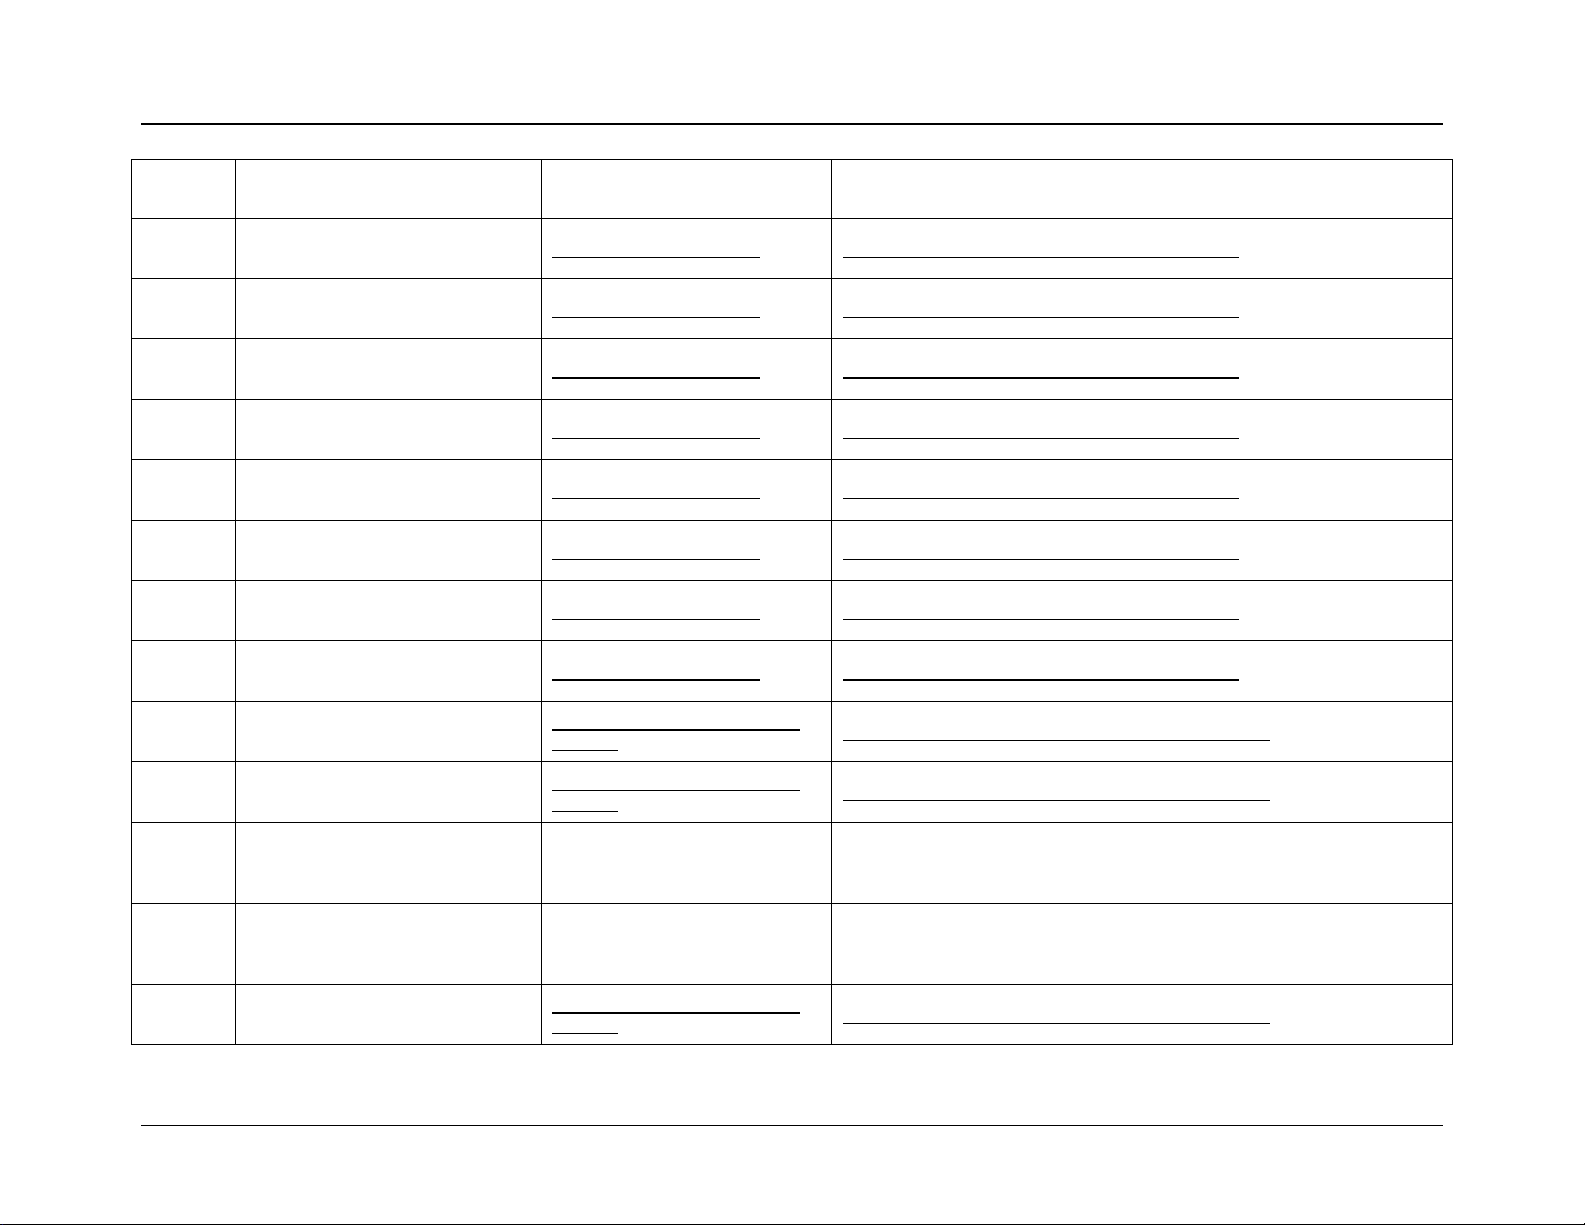
Sensor Cross Reference List
3. Sensor Cross Reference List
This section contains a cross reference to help find details on any specific SEL entry.
3.1 BMC owned Sensors (GID = 0020h)
The following table can be used to find the details of sensors owned by the BMC.
Table 5: BMC owned Sensors
Revision 1.1 Intel order number G90620-002 13
Page 24

Sensor Cross Reference List
Sensor
Number
Sensor Name
Details Section
Next Steps
0Ah
BMC Watchdog
(BMC Watchdog)
BMC Watchdog Sensor
BMC Watchdog Sensor – Next Steps
0Bh
Voltage Regulator Watchdog
(VR Watchdog)
Voltage Regulator Watchdog
Timer Sensor
Voltage Regulator Watchdog Timer Sensor – Next Steps
0Ch
Fan Redundancy
(Fan Redundancy)
Fan Presence and Redundancy
Sensors
Table 34: Fan Redundancy Sensor – Event Trigger Offset – Next Steps
0Dh
SSB Thermal Trip
(SSB Thermal Trip)
Discrete Thermal Sensors
Table 45: Discrete Thermal Sensors – Next Steps
0Eh
IO Module Presence
(IO Mod Presence)
Add-In Module Presence Sensor
Add-In Module Presence – Next Steps
0Fh
SAS Module Presence
(SAS Mod Presence)
Add-In Module Presence Sensor
Add-In Module Presence – Next Steps
10h
BMC Firmware Health
(BMC FW Health)
BMC FW Health Sensor
BMC FW Health Sensor – Next Steps
11h
System Airflow
(System Airflow)
System Air Flow Monitoring
Sensor
Not applicable
12h
Firmware Update Status
(FW Update Status)
Firmware Update Status Sensor
Not applicable
13h
IO Module2 Presence
(IO Mod2 Presence)
Add-In Module Presence Sensor
Add-In Module Presence – Next Steps
14h
Baseboard Temperature 5
(Platform Specific)
Threshold-based Temperature
Sensors
Table 37: Temperature Sensors – Next Steps
15h
Baseboard Temperature 6
(Platform Specific)
Threshold-based Temperature
Sensors
Table 37: Temperature Sensors – Next Steps
16h
IO Module2 Temperature
(I/O Mod2 Temp)
Threshold-based Temperature
Sensors
Table 37: Temperature Sensors – Next Steps
17h
PCI Riser 3 Temperature
(PCI Riser 3 Temp)
Threshold-based Temperature
Sensors
Table 37: Temperature Sensors – Next Steps
System Event Log Troubleshooting Guide for EPSD Platforms Based on Intel® Xeon® Processor E5 4600/2600/2400/1600/1400 Product Families
14 Intel order number G90620-002 Revision 1.1
Page 25
System Event Log Troubleshooting Guide for EPSD Platforms Based on Intel® Xeon® Processor E5 4600/2600/2400/1600/1400 Product Families
Sensor
Number
Sensor Name
Details Section
Next Steps
18h
PCI Riser 4 Temperature
(PCI Riser 4 Temp)
Threshold-based Temperature
Sensors
Table 37: Temperature Sensors – Next Steps
19h
Baseboard +1.05V Processor3
Vccp
(BB +1.05Vccp P3)
Threshold-based Voltage
Sensors
Table 13: Threshold-based Voltage Sensors – Next Steps
1Ah
Baseboard +1.05V Processor4
Vccp
(BB +1.05Vccp P4)
Threshold-based Voltage
Sensors
Table 13: Threshold-based Voltage Sensors – Next Steps
20h
Baseboard Temperature 1
(Platform Specific)
Threshold-based Temperature
Sensors
Table 37: Temperature Sensors – Next Steps
21h
Front Panel Temperature
(Front Panel Temp)
Threshold-based Temperature
Sensors
Table 37: Temperature Sensors – Next Steps
22h
SSB Temperature
(SSB Temp)
Threshold-based Temperature
Sensors
Table 37: Temperature Sensors – Next Steps
23h
Baseboard Temperature 2
(Platform Specific)
Threshold-based Temperature
Sensors
Table 37: Temperature Sensors – Next Steps
24h
Baseboard Temperature 3
(Platform Specific)
Threshold-based Temperature
Sensors
Table 37: Temperature Sensors – Next Steps
25h
Baseboard Temperature 4
(Platform Specific)
Threshold-based Temperature
Sensors
Table 37: Temperature Sensors – Next Steps
26h
IO Module Temperature
(I/O Mod Temp)
Threshold-based Temperature
Sensors
Table 37: Temperature Sensors – Next Steps
27h
PCI Riser 1 Temperature
(PCI Riser 1 Temp)
Threshold-based Temperature
Sensors
Table 37: Temperature Sensors – Next Steps
28h
IO Riser Temperature
(IO Riser Temp)
Threshold-based Temperature
Sensors
Table 37: Temperature Sensors – Next Steps
29h–2Bh
Hot-Swap Back Plane 1-3
Temperature
(HSBP 1-3 Temp)
HSC Backplane Temperature
Sensor
Table 88: HSC Backplane Temperature Sensor – Event Trigger Offset –
Next Steps
Sensor Cross Reference List
Revision 1.1 Intel order number G90620-002 15
Page 26
Sensor Cross Reference List
Sensor
Number
Sensor Name
Details Section
Next Steps
2Ch
PCI Riser 2 Temperature
(PCI Riser 2 Temp)
Threshold-based Temperature
Sensors
Table 37: Temperature Sensors – Next Steps
2Dh
SAS Module Temperature
(SAS Mod Temp)
Threshold-based Temperature
Sensors
Table 37: Temperature Sensors – Next Steps
2Eh
Exit Air Temperature
(Exit Air Temp)
Threshold-based Temperature
Sensors
Table 37: Temperature Sensors – Next Steps
2Fh
Network Interface Controller
Temperature
(LAN NIC Temp)
Threshold-based Temperature
Sensors
Table 37: Temperature Sensors – Next Steps
30h–3Fh
Fan Tachometer Sensors
(Chassis specific sensor names)
Fan Tachometer Sensors
Table 30: Fan Tachometer Sensor – Event Trigger Offset – Next Steps
40h–4Fh
Fan Present Sensors
(Fan x Present)
Fan Presence and Redundancy
Sensors
Table 32: Fan Presence Sensors – Event Trigger Offset – Next Steps
50h
Power Supply 1 Status
(PS1 Status)
Power Supply Status Sensors
Table 16: Power Unit Status Sensor – Sensor Specific Offsets – Next
Steps
51h
Power Supply 2 Status
(PS2 Status)
Power Supply Status Sensors
Table 16: Power Unit Status Sensor – Sensor Specific Offsets – Next
Steps
54h
Power Supply 1 AC Power Input
(PS1 Power In)
Power Supply Power In Sensors
Table 23: Power Supply Power In Sensor – Event Trigger Offset – Next
Steps
55h
Power Supply 2 AC Power Input
(PS2 Power In)
Power Supply Power In Sensors
Table 23: Power Supply Power In Sensor – Event Trigger Offset – Next
Steps
58h
Power Supply 1 +12V % of
Maximum Current Output
(PS1 Curr Out %)
Power Supply Current Out %
Sensors
Table 25: Power Supply Current Out % Sensor – Event Trigger Offset –
Next Steps
59h
Power Supply 2 +12V % of
Maximum Current Output
(PS2 Curr Out %)
Power Supply Current Out %
Sensors
Table 25: Power Supply Current Out % Sensor – Event Trigger Offset –
Next Steps
5Ch
Power Supply 1 Temperature
(PS1 Temperature)
Power Supply Temperature
Sensors
Table 27: Power Supply Temperature Sensor – Event Trigger Offset – Next
Steps
System Event Log Troubleshooting Guide for EPSD Platforms Based on Intel® Xeon® Processor E5 4600/2600/2400/1600/1400 Product Families
16 Intel order number G90620-002 Revision 1.1
Page 27

System Event Log Troubleshooting Guide for EPSD Platforms Based on Intel® Xeon® Processor E5 4600/2600/2400/1600/1400 Product Families
Sensor
Number
Sensor Name
Details Section
Next Steps
5Dh
Power Supply 2 Temperature
(PS2 Temperature)
Power Supply Temperature
Sensors
Table 27: Power Supply Temperature Sensor – Event Trigger Offset – Next
Steps
60h-68h
Hard Disk Drive 15 – 23 Status
(HDD 15 – 23 Status)
Hard Disk Drive Monitoring
Sensor
Table 90: Hard Disk Drive Monitoring Sensor - Event Trigger Offset – Next
Steps
69h-6Bh
Hot-Swap Controller 1-3 Status
(HSC1 – 3 Status)
Hot-Swap Controller Health
Sensor
HSC Health Sensor – Next Steps
70h
Processor 1 Status
(P1 Status)
Processor Status Sensor
Table 48: Processor Status Sensors – Next Steps
71h
Processor 2 Status
(P2 Status)
Processor Status Sensor
Table 48: Processor Status Sensors – Next Steps
72h
Processor 3 Status
(P3 Status)
Processor Status Sensor
Table 48: Processor Status Sensors – Next Steps
73h
Processor 4 Status
(P4 Status)
Processor Status Sensor
Table 48: Processor Status Sensors – Next Steps
74h
Processor 1 Thermal Margin
(P1 Therm Margin)
Thermal Margin Sensors
Table 40: Thermal Margin Sensors – Next Steps
75h
Processor 2 Thermal Margin
(P2 Therm Margin)
Thermal Margin Sensors
Table 40: Thermal Margin Sensors – Next Steps
76h
Processor 3 Thermal Margin
(P3 Therm Margin)
Thermal Margin Sensors
Table 40: Thermal Margin Sensors – Next Steps
77h
Processor 4 Thermal Margin
(P4 Therm Margin)
Thermal Margin Sensors
Table 40: Thermal Margin Sensors – Next Steps
78h-7Bh
Processor 1 – 3 Thermal Control %
(P1 – P4 Therm Ctrl %)
Processor Thermal Control
Sensors
Processor Thermal Control % Sensors – Next Steps
7Ch
Processor 1 ERR2 Timeout
(P1 ERR2)
Processor ERR2 Timeout Sensor
Processor ERR2 Timeout – Next Steps
7Dh
Processor 2 ERR2 Timeout
(P2 ERR2)
Processor ERR2 Timeout Sensor
Processor ERR2 Timeout – Next Steps
Sensor Cross Reference List
Revision 1.1 Intel order number G90620-002 17
Page 28
Sensor Cross Reference List
Sensor
Number
Sensor Name
Details Section
Next Steps
7Eh
Processor 3 ERR2 Timeout
(P3 ERR2)
Processor ERR2 Timeout Sensor
Processor ERR2 Timeout – Next Steps
7Fh
Processor 4 ERR2 Timeout
(P4 ERR2)
Processor ERR2 Timeout Sensor
Processor ERR2 Timeout – Next Steps
80h
Catastrophic Error
(CATERR)
Catastrophic Error Sensor
Table 50: Catastrophic Error Sensor – Event Data 2 Values – Next Steps
81h
Processor 1 MSID Mismatch
(P1 MSID Mismatch)
Processor MSID Mismatch
Sensor
Processor MSID Mismatch Sensor – Next Steps
82h
Processor Population Fault
(CPU Missing)
CPU Missing Sensor
CPU Missing Sensor – Next Steps
83h-86h
Processor 1 – 4 DTS Thermal
Margin
(P1 – P4 DTS Therm Mgn)
Processor DTS Thermal Margin
Sensors
Not applicable
87h
Processor 2 MSID Mismatch
(P2 MSID Mismatch)
Processor MSID Mismatch
Sensor
Processor MSID Mismatch Sensor – Next Steps
88h
Processor 3 MSID Mismatch
(P3 MSID Mismatch)
Processor MSID Mismatch
Sensor
Processor MSID Mismatch Sensor – Next Steps
89h
Processor 4 MSID Mismatch
(P4 MSID Mismatch)
Processor MSID Mismatch
Sensor
Processor MSID Mismatch Sensor – Next Steps
90h
Processor 1 VRD Temp
(P1 VRD Hot)
Discrete Thermal Sensors
Table 45: Discrete Thermal Sensors – Next Steps
91h
Processor 2 VRD Temp
(P2 VRD Hot)
Discrete Thermal Sensors
Table 45: Discrete Thermal Sensors – Next Steps
92h
Processor 3 VRD Temp
(P3 VRD Hot)
Discrete Thermal Sensors
Table 45: Discrete Thermal Sensors – Next Steps
93h
Processor 4 VRD Temp
(P4 VRD Hot)
Discrete Thermal Sensors
Table 45: Discrete Thermal Sensors – Next Steps
System Event Log Troubleshooting Guide for EPSD Platforms Based on Intel® Xeon® Processor E5 4600/2600/2400/1600/1400 Product Families
18 Intel order number G90620-002 Revision 1.1
Page 29
System Event Log Troubleshooting Guide for EPSD Platforms Based on Intel® Xeon® Processor E5 4600/2600/2400/1600/1400 Product Families
Sensor
Number
Sensor Name
Details Section
Next Steps
94h
Processor 1 Memory VRD Hot 0-1
(P1 Mem01 VRD Hot)
Discrete Thermal Sensors
Table 45: Discrete Thermal Sensors – Next Steps
95h
Processor 1 Memory VRD Hot 2-3
(P1 Mem23 VRD Hot)
Discrete Thermal Sensors
Table 45: Discrete Thermal Sensors – Next Steps
96h
Processor 2 Memory VRD Hot 0-1
(P2 Mem01 VRD Hot)
Discrete Thermal Sensors
Table 45: Discrete Thermal Sensors – Next Steps
97h
Processor 2 Memory VRD Hot 2-3
(P2 Mem23 VRD Hot)
Discrete Thermal Sensors
Table 45: Discrete Thermal Sensors – Next Steps
98h
Processor 3 Memory VRD Hot 0-1
(P3 Mem01 VRD Hot)
Discrete Thermal Sensors
Table 45: Discrete Thermal Sensors – Next Steps
99h
Processor 3 Memory VRD Hot 2-3
(P4 Mem23 VRD Hot)
Discrete Thermal Sensors
Table 45: Discrete Thermal Sensors – Next Steps
9Ah
Processor 4 Memory VRD Hot 0-1
(P4 Mem01 VRD Hot)
Discrete Thermal Sensors
Table 45: Discrete Thermal Sensors – Next Steps
9Bh
Processor 4 Memory VRD Hot 2-3
(P4 Mem23 VRD Hot)
Discrete Thermal Sensors
Table 45: Discrete Thermal Sensors – Next Steps
A0h
Power Supply 1 Fan Tachometer 1
(PS1 Fan Tach 1)
Power Supply Fan Tachometer
Sensors
Power Supply Fan Tachometer Sensors – Next Steps
A1h
Power Supply 1 Fan Tachometer 2
(PS1 Fan Tach 2)
Power Supply Fan Tachometer
Sensors
Power Supply Fan Tachometer Sensors – Next Steps
A2h
Intel® Xeon Phi™ Coprocessor
Status 1
(MIC 1 Status)
Intel® Xeon Phi™ Coprocessor
(MIC) Status Sensors
Intel® Xeon Phi™ Coprocessor (MIC) Status Sensors Next Steps
A3h
Intel® Xeon Phi™ Coprocessor
Status 2
(MIC 2 Status)
Intel® Xeon Phi™ Coprocessor
(MIC) Status Sensors
Intel® Xeon Phi™ Coprocessor (MIC) Status Sensors Next Steps
A4h
Power Supply 2 Fan Tachometer 1
(PS2 Fan Tach 1)
Power Supply Fan Tachometer
Sensors
Power Supply Fan Tachometer Sensors – Next Steps
Sensor Cross Reference List
Revision 1.1 Intel order number G90620-002 19
Page 30

Sensor Cross Reference List
Sensor
Number
Sensor Name
Details Section
Next Steps
A5h
Power Supply 2 Fan Tachometer 2
(PS2 Fan Tach 2)
Power Supply Fan Tachometer
Sensors
Power Supply Fan Tachometer Sensors – Next Steps
A6h
Intel® Xeon Phi™ Coprocessor
Status 3
(MIC 3 Status)
Intel® Xeon Phi™ Coprocessor
(MIC) Status Sensors
Intel® Xeon Phi™ Coprocessor (MIC) Status Sensors Next Steps
A7h
Intel® Xeon Phi™ Coprocessor
Status 4
(MIC 4 Status)
Intel® Xeon Phi™ Coprocessor
(MIC) Status Sensors
Intel® Xeon Phi™ Coprocessor (MIC) Status Sensors Next Steps
B0h
Processor 1 DIMM Aggregate
Thermal Margin 1
(P1 DIMM Thrm Mrgn1)
Thermal Margin Sensors
Table 40: Thermal Margin Sensors – Next Steps
B1h
Processor 1 DIMM Aggregate
Thermal Margin 2
(P1 DIMM Thrm Mrgn2)
Thermal Margin Sensors
Table 40: Thermal Margin Sensors – Next Steps
B2h
Processor 2 DIMM Aggregate
Thermal Margin 1
(P2 DIMM Thrm Mrgn1)
Thermal Margin Sensors
Table 40: Thermal Margin Sensors – Next Steps
B3h
Processor 2 DIMM Aggregate
Thermal Margin 2
(P2 DIMM Thrm Mrgn2)
Thermal Margin Sensors
Table 40: Thermal Margin Sensors – Next Steps
B4h
Processor 3 DIMM Aggregate
Thermal Margin 1
(P3 DIMM Thrm Mrgn1)
Thermal Margin Sensors
Table 40: Thermal Margin Sensors – Next Steps
B5h
Processor 3 DIMM Aggregate
Thermal Margin 2
(P3 DIMM Thrm Mrgn2)
Thermal Margin Sensors
Table 40: Thermal Margin Sensors – Next Steps
B6h
Processor 4 DIMM Aggregate
Thermal Margin 1
(P4 DIMM Thrm Mrgn1)
Thermal Margin Sensors
Table 40: Thermal Margin Sensors – Next Steps
System Event Log Troubleshooting Guide for EPSD Platforms Based on Intel® Xeon® Processor E5 4600/2600/2400/1600/1400 Product Families
20 Intel order number G90620-002 Revision 1.1
Page 31

System Event Log Troubleshooting Guide for EPSD Platforms Based on Intel® Xeon® Processor E5 4600/2600/2400/1600/1400 Product Families
Sensor
Number
Sensor Name
Details Section
Next Steps
B7h
Processor 4 DIMM Aggregate
Thermal Margin 2
(P4 DIMM Thrm Mrgn2)
Thermal Margin Sensors
Table 40: Thermal Margin Sensors – Next Steps
B8h
Node Auto-Shutdown Sensor
(Auto Shutdown)
Node Auto Shutdown Sensor
Node Auto Shutdown Sensor – Next Steps
BAh-BFh
Fan Tachometer Sensors
(Chassis specific sensor names)
Fan Tachometer Sensors
Table 30: Fan Tachometer Sensor – Event Trigger Offset – Next Steps
C0h-C3h
Processor 1 – 4 DIMM Thermal
Trip
(P1 – P4 Mem Thrm Trip)
DIMM Thermal Trip Sensors
DIMM Thermal Trip Sensors – Next Steps
C4h
Intel® Xeon Phi™ Coprocessor
Thermal Margin 1
(MIC 1 Margin)
Intel® Xeon Phi™ Coprocessor
(MIC) Thermal Margin Sensors
Not applicable
C5h
Intel® Xeon Phi™ Coprocessor
Thermal Margin 2
(MIC 2 Margin)
Intel® Xeon Phi™ Coprocessor
(MIC) Thermal Margin Sensors
Not applicable
C6h
Intel® Xeon Phi™ Coprocessor
Thermal Margin 3
(MIC 3 Margin)
Intel® Xeon Phi™ Coprocessor
(MIC) Thermal Margin Sensors
Not applicable
C7h
Intel® Xeon Phi™ Coprocessor
Thermal Margin 4
(MIC 4 Margin)
Intel® Xeon Phi™ Coprocessor
(MIC) Thermal Margin Sensors
Not applicable
C8h-CFh
Global Aggregate Temperature
Margin 1 -8
(Agg Therm Mrgn 1 – 8)
Thermal Margin Sensors
Table 40: Thermal Margin Sensors – Next Steps
D0h
Baseboard +12V
(BB +12.0V)
Threshold-based Voltage
Sensors
Table 13: Threshold-based Voltage Sensors – Next Steps
D1h
Baseboard +5V
(BB +5.0V)
Threshold-based Voltage
Sensors
Table 13: Threshold-based Voltage Sensors – Next Steps
Sensor Cross Reference List
Revision 1.1 Intel order number G90620-002 21
Page 32

Sensor Cross Reference List
Sensor
Number
Sensor Name
Details Section
Next Steps
D2h
Baseboard +3.3V
(BB +3.3V)
Threshold-based Voltage
Sensors
Table 13: Threshold-based Voltage Sensors – Next Steps
D3h
Baseboard +5V Stand-by
(BB +5.0V STBY)
Threshold-based Voltage
Sensors
Table 13: Threshold-based Voltage Sensors – Next Steps
D4h
Baseboard +3.3V Auxiliary
(BB +3.3V AUX)
Threshold-based Voltage
Sensors
Table 13: Threshold-based Voltage Sensors – Next Steps
D6h
Baseboard +1.05V Processor1
Vccp
(BB +1.05Vccp P1)
Threshold-based Voltage
Sensors
Table 13: Threshold-based Voltage Sensors – Next Steps
D7h
Baseboard +1.05V Processor2
Vccp
(BB +1.05Vccp P2)
Threshold-based Voltage
Sensors
Table 13: Threshold-based Voltage Sensors – Next Steps
D8h
Baseboard +1.5V P1 Memory AB
VDDQ
(BB +1.5 P1MEM AB)
Threshold-based Voltage
Sensors
Table 13: Threshold-based Voltage Sensors – Next Steps
D9h
Baseboard +1.5V P1 Memory CD
VDDQ
(BB +1.5 P1MEM CD)
Threshold-based Voltage
Sensors
Table 13: Threshold-based Voltage Sensors – Next Steps
DAh
Baseboard +1.5V P2 Memory AB
VDDQ
(BB +1.5 P2MEM AB)
Threshold-based Voltage
Sensors
Table 13: Threshold-based Voltage Sensors – Next Steps
DBh
Baseboard +1.5V P2 Memory CD
VDDQ
(BB +1.5 P2MEM CD)
Threshold-based Voltage
Sensors
Table 13: Threshold-based Voltage Sensors – Next Steps
DCh
Baseboard +1.8V Aux
(BB +1.8V AUX)
Threshold-based Voltage
Sensors
Table 13: Threshold-based Voltage Sensors – Next Steps
DDh
Baseboard +1.1V Stand-by
(BB +1.1V STBY)
Threshold-based Voltage
Sensors
Table 13: Threshold-based Voltage Sensors – Next Steps
DEh
Baseboard CMOS Battery
(BB +3.3V Vbat)
Threshold-based Voltage
Sensors
Table 13: Threshold-based Voltage Sensors – Next Steps
System Event Log Troubleshooting Guide for EPSD Platforms Based on Intel® Xeon® Processor E5 4600/2600/2400/1600/1400 Product Families
22 Intel order number G90620-002 Revision 1.1
Page 33

System Event Log Troubleshooting Guide for EPSD Platforms Based on Intel® Xeon® Processor E5 4600/2600/2400/1600/1400 Product Families
Sensor
Number
Sensor Name
Details Section
Next Steps
E4h
Baseboard +1.35V P1 Low Voltage
Memory AB VDDQ
(BB +1.35 P1LV AB)
Threshold-based Voltage
Sensors
Table 13: Threshold-based Voltage Sensors – Next Steps
E5h
Baseboard +1.35V P1 Low Voltage
Memory CD VDDQ
(BB +1.35 P1LV CD)
Threshold-based Voltage
Sensors
Table 13: Threshold-based Voltage Sensors – Next Steps
E6h
Baseboard +1.35V P2 Low Voltage
Memory AB VDDQ
(BB +1.35 P2LV AB)
Threshold-based Voltage
Sensors
Table 13: Threshold-based Voltage Sensors – Next Steps
E7h
Baseboard +1.35V P2 Low Voltage
Memory CD VDDQ
(BB +1.35 P2LV CD)
Threshold-based Voltage
Sensors
Table 13: Threshold-based Voltage Sensors – Next Steps
EAh
Baseboard +3.3V Riser 1 Power
Good
(BB +3.3 RSR1 PGD)
Threshold-based Voltage
Sensors
Table 13: Threshold-based Voltage Sensors – Next Steps
EBh
Baseboard +3.3V Riser 2 Power
Good
(BB +3.3 RSR2 PGD)
Threshold-based Voltage
Sensors
Table 13: Threshold-based Voltage Sensors – Next Steps
ECh
Baseboard +0.9V
(BB 0.9V Core IB)
Threshold-based Voltage
Sensors
Table 13: Threshold-based Voltage Sensors – Next Steps
EDh
Baseboard +1.8V
(BB 1.8V IB I/O)
Threshold-based Voltage
Sensors
Table 13: Threshold-based Voltage Sensors – Next Steps
EEh
Baseboard +1.1V
(BB 1.1V PCH)
Threshold-based Voltage
Sensors
Table 13: Threshold-based Voltage Sensors – Next Steps
EFh
Baseboard +1.2V
(BB +1.2V IB)
Threshold-based Voltage
Sensors
Table 13: Threshold-based Voltage Sensors – Next Steps
F0h-FEh
Hard Disk Drive 0 -14 Status
(HDD 0 – 14 Status)
Hard Disk Drive Monitoring
Sensor
Table 90: Hard Disk Drive Monitoring Sensor - Event Trigger Offset – Next
Steps
Sensor Cross Reference List
Revision 1.1 Intel order number G90620-002 23
Page 34

Sensor Cross Reference List
Sensor
Number
Sensor Name
Details Section
Next Steps
02h
Memory RAS Configuration Status
Memory RAS Configuration Status
Table 58: Memory RAS Configuration Status Sensor Typical
Characteristics
06h
POST Error
System Firmware Progress (Formerly Post
Error)
System Firmware Progress (Formerly Post Error) – Next Steps
09h
Intel® Quick Path Interface Link
Width Reduced
QPI Link Width Reduced Sensor
QPI Link Width Reduced Sensor – Next Steps
12h
Memory RAS Mode Select
Memory RAS Mode Select
Not applicable
83h
System Event
System Events
Not applicable
Sensor
Number
Sensor Name
Details Section
Next Steps
01h
Mirroring Redundancy State
Mirroring Redundancy State
Mirroring Redundancy State Sensor – Next Steps
02h
Memory ECC Error
Memory Correctable and Uncorrectable
ECC Error
Table 64: Correctable and Uncorrectable ECC Error Sensor
Event Trigger Offset – Next Steps
03h
Legacy PCI Error
Legacy PCI Errors
Legacy PCI Error Sensor – Next Steps
04h
PCI Express* Fatal Error
PCI Express* Fatal Errors and Fatal Error #2
PCI Express* Fatal Error and Fatal Error #2 Sensor – Next
Steps
05h
PCI Express* Correctable Error
PCI Express* Correctable Errors
PCI Express* Correctable Error Sensor – Next Steps
System Event Log Troubleshooting Guide for EPSD Platforms Based on Intel® Xeon® Processor E5 4600/2600/2400/1600/1400 Product Families
3.2 BIOS POST owned Sensors (GID = 0001h)
The following table can be used to find the details of sensors owned by BIOS POST.
Table 6: BIOS POST owned Sensors
3.3 BIOS SMI Handler owned Sensors (GID = 0033h)
The following table can be used to find the details of sensors owned by BIOS SMI Handler.
24 Intel order number G90620-002 Revision 1.1
Table 7: BIOS SMI Handler owned Sensors
Page 35

System Event Log Troubleshooting Guide for EPSD Platforms Based on Intel® Xeon® Processor E5 4600/2600/2400/1600/1400 Product Families
Sensor
Number
Sensor Name
Details Section
Next Steps
06h
Intel® Quick Path Interface
Correctable Error
QPI Correctable Error Sensor
QPI Correctable Error Sensor – Next Steps
07h
Intel® Quick Path Interface Fatal Error
QPI Fatal Error and Fatal Error #2
QPI Fatal Error and Fatal Error #2 – Next Steps
11h
Sparing Redundancy State
Sparing Redundancy State
Sparing Redundancy State Sensor – Next Steps
13h
Memory Parity Error
Memory Address Parity Error
Memory Address Parity Error Sensor – Next Steps
14h
PCI Express* Fatal Error#2
(continuation of Sensor 04h)
PCI Express* Fatal Errors and Fatal Error #2
PCI Express* Fatal Error and Fatal Error #2 Sensor – Next
Steps
17h
Intel® Quick Path Interface Fatal Error
#2
(continuation of Sensor 07h)
QPI Fatal Error and Fatal Error #2
QPI Fatal Error and Fatal Error #2 – Next Steps
83h
System Event
System Events
Not applicable
Sensor
Number
Sensor Name
Details Section
Next Steps
17h
ME Firmware Health Events
ME Firmware Health Event
ME Firmware Health Event – Next Steps
18h
Node Manager Exception Events
Node Manager Exception Event
Node Manager Exception Event – Next Steps
19h
Node Manager Health Events
Node Manager Health Event
Node Manager Health Event – Next Steps
1Ah
Node Manager Operational Capabilities
Change Events
Node Manager Operational Capabilities
Change
Node Manager Operational Capabilities Change – Next
Steps
1Bh
Node Manager Alert Threshold
Exceeded Events
Node Manger Alert Threshold Exceeded
Node Manger Alert Threshold Exceeded – Next Steps
Sensor Cross Reference List
3.4 Node Manager / ME Firmware owned Sensors (GID = 002Ch or 602Ch)
The following table can be used to find the details of sensors owned by the Node Manager / Management Engine (ME) firmware.
Revision 1.1 Intel order number G90620-002 25
Table 8: Management Engine Firmware owned Sensors
Page 36

Sensor Cross Reference List
Sensor Name
Record
Type
Sensor Type
Details Section
Next Steps
Boot Event
02h
1Fh = OS Boot
Table 98: Boot up Event Record Typical Characteristics
Not applicable
DCh
Not applicable
Table 99: Boot up OEM Event Record Typical Characteristics
Shutdown Event
02h
20h = OS Stop/Shutdown
Table 100: Shutdown Reason Code Event Record Typical Characteristics
Not applicable
DDh
Not applicable
Table 101: Shutdown Reason OEM Event Record Typical Characteristics
Table 102: Shutdown Comment OEM Event Record Typical Characteristics
Not applicable
Bug Check/Blue Screen
02h
20h = OS Stop/Shutdown
Table 103: Bug Check/Blue Screen – OS Stop Event Record Typical
Characteristics
Not applicable
DEh
Not applicable
Table 104: Bug Check/Blue Screen code OEM Event Record Typical
Characteristics
Sensor Name
Record
Type
Sensor Type
Details Section
Next Steps
Linux* Kernel Panic
02h
20h = OS Stop/Shutdown
Table 105: Linux* Kernel Panic Event Record Characteristics
Not applicable
F0h
Not applicable
Table 106: Linux* Kernel Panic String Extended Record Characteristics
System Event Log Troubleshooting Guide for EPSD Platforms Based on Intel® Xeon® Processor E5 4600/2600/2400/1600/1400 Product Families
3.5 Microsoft* OS owned Events (GID = 0041)
The following table can be used to find the details of records that are owned by the Microsoft* Operating System (OS).
Table 9: Microsoft* OS owned Events
3.6 Linux* Kernel Panic Events (GID = 0021)
The following table can be used to find the details of records that can be generated when there is a Linux* Kernel panic.
26 Intel order number G90620-002 Revision 1.1
Table 10: Linux* Kernel Panic Events
Page 37

System Event Log Troubleshooting Guide for EPSD Platforms Based on Intel® Xeon® Processor E5 4600/2600/2400/1600/1400 Product Families
Byte
Field
Description
11
Sensor Type
02h = Voltage
12
Sensor Number
See Table 13
13
Event Direction and
Event Type
[7] Event direction
0b = Assertion Event
1b = Deassertion Event
[6:0] Event Type = 01h (Threshold)
14
Event Data 1
[7:6] – 01b = Trigger reading in Event Data 2
[5:4] – 01b = Trigger threshold in Event Data 3
[3:0] – Event Triggers as described in Table 12
15
Event Data 2
Reading that triggered event
16
Event Data 3
Threshold value that triggered event
Power Subsystems
4. Power Subsystems
The BMC monitors the power subsystem including power supplies, select onboard voltages, and related sensors.
4.1 Threshold-based Voltage Sensors
The BMC monitors the main voltage sources in the system, including the baseboard, memory, and processors, using IPMI-compliant
analog/threshold sensors. Some voltages are only on specific platforms. For details check your platforms Technical Product
Specification (TPS).
Note: A voltage error can be caused by the device supplying the voltage or by the device using the voltage. For each sensor it will be
noted who is supplying the voltage and who is using it.
Table 11: Threshold-based Voltage Sensors Typical Characteristics
The following table describes the severity of each of the event triggers for both assertion and deassertion.
Revision 1.1 Intel order number G90620-002 27
Page 38

Power Subsystems
Event Trigger
Assertion
Severity
Deassert
Severity
Description
Hex
Description
00h
Lower non-critical
going low
Degraded
OK
The voltage has dropped below its lower non-critical threshold.
02h
Lower critical
going low
non-fatal
Degraded
The voltage has dropped below its lower critical threshold.
07h
Upper non-critical
going high
Degraded
OK
The voltage has gone over its upper non-critical threshold.
09h
Upper critical
going high
non-fatal
Degraded
The voltage has gone over its upper critical threshold.
Sensor
Number
Sensor Name
Next Steps
19h
Baseboard +1.05V Processor3 Vccp
(BB +1.05Vccp P3)
This 1.05V line is supplied by the main board.
This 1.05V line is used by processor 1.
1. Ensure all cables are connected correctly.
2. Check the processor is seated properly.
3. Cross test the processors. If the issue remains with the processor socket, replace the main board,
otherwise the processor.
1Ah
Baseboard +1.05V Processor4 Vccp
(BB +1.05Vccp P4)
This 1.05V line is supplied by the main board.
This 1.05V line is used by processor 1.
1. Ensure all cables are connected correctly.
2. Check the processor is seated properly.
3. Cross test the processors. If the issue remains with the processor socket, replace the main board,
otherwise the processor.
System Event Log Troubleshooting Guide for EPSD Platforms Based on Intel® Xeon® Processor E5 4600/2600/2400/1600/1400 Product Families
Table 12: Threshold-based Voltage Sensors Event Triggers – Description
Table 13: Threshold-based Voltage Sensors – Next Steps
28 Intel order number G90620-002 Revision 1.1
Page 39

System Event Log Troubleshooting Guide for EPSD Platforms Based on Intel® Xeon® Processor E5 4600/2600/2400/1600/1400 Product Families
Sensor
Number
Sensor Name
Next Steps
D0h
Baseboard +12V
(BB +12.0V)
+12V is supplied by the power supplies.
+12V is used by SATA drives, Fans, and PCI cards. In addition it is used to generate various processor
voltages.
1. Ensure all cables are connected correctly.
2. Check connections on the fans and HDDs.
3. If the issue follows the component, swap it, otherwise, replace the board.
4. If the issue remains, replace the power supplies.
D1h
Baseboard +5V
(BB +5.0V)
+5.0V is supplied by the power supplies for pedestal systems, and supplied by the main board on rackoptimized systems.
+5.0V is used by the PCI slots.
1. Ensure all cables are connected correctly.
2. Reseat any PCI cards.
3. Try PCI cards in other PCI slots.
4. If the issue follows the card, swap it, otherwise, replace the main board.
5. If the issue remains, replace the power supplies.
D2h
Baseboard +3.3V
(BB +3.3V)
+3.3V is supplied by the power supplies for pedestal systems, and supplied by the main board on rackoptimized systems.
+3.3V is used by the PCIe and PCI-X slots.
1. Ensure all cables are connected correctly.
2. Reseat any PCI cards.
3. Try PCI cards in other PCI slots.
4. If the issue follows the card, swap it, otherwise, replace the main board.
5. If the issue remains, replace the power supplies.
D3h
Baseboard +5V Stand-by
(BB +5.0V STBY)
+5.0V STBY is supplied by the power supplies for pedestal systems, and supplied by the main board on
rack-optimized systems.
+5.0V STBY is used to generate other standby voltages.
1. Ensure all cables are connected correctly.
2. If the issue remains, replace the board.
3. If the issue remains, replace the power supplies.
Power Subsystems
Revision 1.1 Intel order number G90620-002 29
Page 40

Power Subsystems
Sensor
Number
Sensor Name
Next Steps
D4h
Baseboard +3.3V Auxiliary
(BB +3.3V AUX)
+3.3V AUX is supplied by the main board.
+3.3V AUX is used by the BMC, clock chips, PCI-E Slot, on-board NIC, Intel® C600 series Chipset, and
ICH.
1. Ensure all cables are connected correctly.
2. If the issue remains, replace the board.
3. If the issue remains, replace the power supplies.
D6h
Baseboard +1.05V Processor1 Vccp
(BB +1.05Vccp P1)
This 1.05V line is supplied by the main board.
This 1.05V line is used by processor 1.
1. Ensure all cables are connected correctly.
2. Check the processor is seated properly.
3. Cross test the processors. If the issue remains with the processor socket, replace the main board,
otherwise the processor.
D7h
Baseboard +1.05V Processor2 Vccp
(BB +1.05Vccp P2)
This 1.05V line is supplied by the main board.
This 1.05V line is used by processor 2.
1. Ensure all cables are connected correctly.
2. Check the processor is seated properly.
3. Cross test the processors. If the issue remains with the processor socket, replace the main board,
otherwise the processor.
D8h
Baseboard +1.5V P1 Memory AB
VDDQ
(BB +1.5 P1MEM AB)
This 1.5V line is supplied by the main board.
This 1.5V line is used by processor 1 memory slots A and B.
1. Ensure all cables are connected correctly.
2. Check the DIMMs are seated properly.
3. Cross test the DIMMs. If the issue remains with the DIMMs on this socket, replace the main
board, otherwise the DIMM.
D9h
Baseboard +1.5V P1 Memory CD
VDDQ
(BB +1.5 P1MEM CD)
This 1.5V line is supplied by the main board.
This 1.5V line is used by processor 1 memory slots C and D.
1. Ensure all cables are connected correctly.
2. Check the DIMMs are seated properly.
3. Cross test the DIMMs. If the issue remains with the DIMMs on this socket, replace the main
board, otherwise the DIMM.
System Event Log Troubleshooting Guide for EPSD Platforms Based on Intel® Xeon® Processor E5 4600/2600/2400/1600/1400 Product Families
30 Intel order number G90620-002 Revision 1.1
Page 41

System Event Log Troubleshooting Guide for EPSD Platforms Based on Intel® Xeon® Processor E5 4600/2600/2400/1600/1400 Product Families
Sensor
Number
Sensor Name
Next Steps
DAh
Baseboard +1.5V P2 Memory AB
VDDQ
(BB +1.5 P2MEM AB)
This 1.5V line is supplied by the main board.
This 1.5V line is used by processor 2 memory slots A and B.
1. Ensure all cables are connected correctly.
2. Check the DIMMs are seated properly.
3. Cross test the DIMMs. If the issue remains with the DIMMs on this socket, replace the main
board, otherwise the DIMM.
DBh
Baseboard +1.5V P2 Memory CD
VDDQ
(BB +1.5 P2MEM CD)
This 1.5V line is supplied by the main board.
This 1.5V line is used by processor 2 memory slots C and D.
1. Ensure all cables are connected correctly.
2. Check the DIMMs are seated properly.
3. Cross test the DIMMs. If the issue remains with the DIMMs on this socket, replace the main
board, otherwise the DIMM.
DCh
Baseboard +1.8V Aux
(BB +1.8V AUX)
+1.8V AUX is supplied by the main board.
+1.8V AUX is used by the BMC and on-board NIC.
1. Ensure all cables are connected correctly.
2. If the issue remains, replace the board.
3. If the issue remains, replace the power supplies.
DDh
Baseboard +1.1V Stand-by
(BB +1.1V STBY)
+1.1V STBY is supplied by the main board.
+1.1V STBY is used by the Intel® C600 series Chipset.
1. Ensure all cables are connected correctly.
2. If the issue remains, replace the board.
3. If the issue remains, replace the power supplies.
DEh
Baseboard CMOS Battery
(BB +3.3V Vbat)
+3.3V Vbat is supplied by the CMOS battery when power is off and by the main board when power is on.
+3.3V Vbat is used by the CMOS and related circuits.
1. Replace the CMOS battery. Any battery of type CR2032 can be used.
2. If error remains (unlikely), replace the board.
E4h
Baseboard +1.35V P1 Low Voltage
Memory AB VDDQ
(BB +1.35 P1LV AB)
This 1.35V line is supplied by the main board.
This 1.35V line is used by processor 1 memory slots A and B.
1. Ensure all cables are connected correctly.
2. Check the DIMMs are seated properly.
3. Cross test the DIMMs. If the issue remains with the DIMMs on this socket, replace the main
board, otherwise the DIMM.
Power Subsystems
Revision 1.1 Intel order number G90620-002 31
Page 42

Power Subsystems
Sensor
Number
Sensor Name
Next Steps
E5h
Baseboard +1.35V P1 Low Voltage
Memory CD VDDQ
(BB +1.35 P1LV CD)
This 1.35V line is supplied by the main board.
This 1.35V line is used by processor 1 memory slots C and D.
1. Ensure all cables are connected correctly.
2. Check the DIMMs are seated properly.
3. Cross test the DIMMs. If the issue remains with the DIMMs on this socket, replace the main
board, otherwise the DIMM.
E6h
Baseboard +1.35V P2 Low Voltage
Memory AB VDDQ
(BB +1.35 P2LV AB)
This 1.35V line is supplied by the main board.
This 1.35V line is used by processor 2 memory slots A and B.
1. Ensure all cables are connected correctly.
2. Check the DIMMs are seated properly.
3. Cross test the DIMMs. If the issue remains with the DIMMs on this socket, replace the main
board, otherwise the DIMM.
E7h
Baseboard +1.35V P2 Low Voltage
Memory CD VDDQ
(BB +1.35 P2LV CD)
This 1.35V line is supplied by the main board.
This 1.35V line is used by processor 2 memory slots C and D.
1. Ensure all cables are connected correctly.
2. Check the DIMMs are seated properly.
3. Cross test the DIMMs. If the issue remains with the DIMMs on this socket, replace the main
board, otherwise the DIMM.
EAh
Baseboard +3.3V Riser 1 Power Good
(BB +3.3 RSR1 PGD)
+3.3V Riser 1 Power Good is supplied by Riser 1 on specific platforms.
+3.3V Riser 1 Power Good is an indication of the +3.3V on Riser 1.
1. Ensure that the riser is seated correctly.
2. If issue remains, replace the riser.
3. If issue remains, replace the main board.
4. If the issue remains, replace the power supplies.
EBh
Baseboard +3.3V Riser 2 Power Good
(BB +3.3 RSR2 PGD)
+3.3V Riser 2 Power Good is supplied by Riser 2 on specific platforms.
+3.3V Riser 2 Power Good is an indication of the +3.3V on Riser 2.
1. Ensure that the riser is seated correctly.
2. If issue remains, replace the riser.
3. If issue remains, replace the main board.
4. If the issue remains, replace the power supplies.
System Event Log Troubleshooting Guide for EPSD Platforms Based on Intel® Xeon® Processor E5 4600/2600/2400/1600/1400 Product Families
32 Intel order number G90620-002 Revision 1.1
Page 43

System Event Log Troubleshooting Guide for EPSD Platforms Based on Intel® Xeon® Processor E5 4600/2600/2400/1600/1400 Product Families
Sensor
Number
Sensor Name
Next Steps
ECh
Baseboard +0.9V
(BB 0.9V Core IB)
+0.9V Core IB is supplied by the main board on specific platforms.
+0.9V Core IB is used by the on-board Infiniband* controller on those specific platforms.
1. Ensure all cables are connected correctly.
2. If the issue remains, replace the board.
3. If the issue remains, replace the power supplies.
EDh
Baseboard +1.8V
(BB 1.8V IB I/O)
+1.8V IB I/O is supplied by the main board on specific platforms.
+1.8V IB I/O is used by the on-board Infiniband* controller on those specific platforms.
1. Ensure all cables are connected correctly.
2. If the issue remains, replace the board.
3. If the issue remains, replace the power supplies.
EEh
Baseboard +1.1V
(BB 1.1V PCH)
This 1.1V line is supplied by the main board.
This 1.1V line is used by the Intel® C600 series Chipset.
1. Ensure all cables are connected correctly.
2. If the issue remains, replace the board.
EFh
Baseboard +1.2V
(BB +1.2V IB)
+1.2V is supplied by the main board on specific platforms.
+1.2V is used by the on-board Infiniband* controller on those specific platforms.
1. Ensure all cables are connected correctly.
2. If the issue remains, replace the board.
3. If the issue remains, replace the power supplies.
Power Subsystems
4.2 Voltage Regulator Watchdog Timer Sensor
The BMC FW monitors that the power sequence for the board VR controllers is completed when a DC power-on is initiated.
Incompletion of the sequence indicates a board problem, in which case the FW powers down the system.
The sequence is as follows:
BMC FW monitors the PowerSupplyPowerGood signal for assertion, indicating a DC-power-on has been initiated, and starts a
timer (VR Watchdog Timer). For EPSD Platforms Based on Intel® Xeon® Processor E5 4600/2600/2400/1600 Product Families
this timeout is 500ms.
Revision 1.1 Intel order number G90620-002 33
Page 44

Power Subsystems
Byte
Field
Description
11
Sensor Type
02h = Voltage
12
Sensor Number
0Bh
13
Event Direction and
Event Type
[7] Event direction
0b = Assertion Event
1b = Deassertion Event
[6:0] Event Type = 03h (“digital” Discrete)
14
Event Data 1
[7:6] – 00b = Unspecified Event Data 2
[5:4] – 00b = Unspecified Event Data 3
[3:0] – Event Trigger Offset = 1h = State Asserted
15
Event Data 2
Not used
16
Event Data 3
Not used
System Event Log Troubleshooting Guide for EPSD Platforms Based on Intel® Xeon® Processor E5 4600/2600/2400/1600/1400 Product Families
If the SystemPowerGood signal has not asserted by the time the VR Watchdog Timer expires, the FW powers down the system,
logs a SEL entry, and emits a beep code (1-5-1-2). This failure is termed as VR Watchdog Timeout.
Table 14: Voltage Regulator Watchdog Timer Sensor Typical Characteristics
4.2.1 Voltage Regulator Watchdog Timer Sensor – Next Steps
1. Ensure that all the connectors from the power supply are well seated.
2. Cross test the baseboard. If the issue remains with the baseboard, replace the baseboard.
4.3 Power Unit
The power unit monitors the power state of the system and logs the state changes in the SEL.
4.3.1 Power Unit Status Sensor
The power unit status sensor monitors the power state of the system and logs state changes. Expected power-on events such as DC
ON/OFF is logged and unexpected events are also logged, such as AC loss and power good loss.
34 Intel order number G90620-002 Revision 1.1
Page 45

System Event Log Troubleshooting Guide for EPSD Platforms Based on Intel® Xeon® Processor E5 4600/2600/2400/1600/1400 Product Families
Byte
Field
Description
11
Sensor Type
09h = Power Unit
12
Sensor Number
01h
13
Event Direction and
Event Type
[7] Event direction
0b = Assertion Event
1b = Deassertion Event
[6:0] Event Type = 6Fh (Sensor Specific)
14
Event Data 1
[7:6] – 00b = Unspecified Event Data 2
[5:4] – 00b = Unspecified Event Data 3
[3:0] = Sensor Specific offset as described in Table 16
15
Event Data 2
Not used
16
Event Data 3
Not used
Sensor Specific Offset
Description
Next Steps
Hex
Description
00h
Power down
System is powered down.
Informational Event
02h
240 VA power down
240 VA power limit was exceeded and the
hardware forced a power down.
This could have been caused by many things.
1. If you recently added hardware, try removing it.
2. Remove/replace any add-in adapters.
3. Remove/replace the power supply.
4. Remove/replace the processors, DIMM, and/or hard drives.
5. Remove/replace the boards in the system.
04h
A/C Lost
A/C power was removed.
Informational Event
Table 15: Power Unit Status Sensors Typical Characteristics
Table 16: Power Unit Status Sensor – Sensor Specific Offsets – Next Steps
Power Subsystems
Revision 1.1 Intel order number G90620-002 35
Page 46

Power Subsystems
Sensor Specific Offset
Description
Next Steps
Hex
Description
05h
Soft Power Control
Failure
Generally means power good was lost in
the system, causing a shutdown.
This could be cause by the power supply subsystem or system
components.
1. Verify all power cables and adapters are connected properly (AC
cables as well as the cables between the PSU and system
components).
2. Cross test the PSU if possible.
3. Replace the power subsystem.
06h
Power Unit Failure
Power subsystem experienced a failure.
Indicates a power supply failed.
1. Remove and reapply AC power.
2. If the power supply still fails, replace it.
Byte
Field
Description
11
Sensor Type
09h = Power Unit
12
Sensor Number
02h
13
Event Direction and
Event Type
[7] Event direction
0b = Assertion Event
1b = Deassertion Event
[6:0] Event Type = 0Bh (Generic Discrete)
14
Event Data 1
[7:6] – 00b = Unspecified Event Data 2
[5:4] – 00b = Unspecified Event Data 3
[3:0] – Event Trigger Offset as described in Table 18
15
Event Data 2
Not used
16
Event Data 3
Not used
System Event Log Troubleshooting Guide for EPSD Platforms Based on Intel® Xeon® Processor E5 4600/2600/2400/1600/1400 Product Families
4.3.2 Power Unit Redundancy Sensor
This sensor is enabled on the systems that support redundant power supplies. When a system has AC applied or if it loses
redundancy of the power supplies, a message will get logged into the SEL.
Table 17: Power Unit Redundancy Sensors Typical Characteristics
36 Intel order number G90620-002 Revision 1.1
Page 47

System Event Log Troubleshooting Guide for EPSD Platforms Based on Intel® Xeon® Processor E5 4600/2600/2400/1600/1400 Product Families
Event Trigger Offset
Description
Next Steps
Hex
Description
00h
Fully redundant
System is fully operational.
Informational Event
01h
Redundancy lost
System is not running in
redundant power supply mode.
This event is accompanied by specific power supply errors
(AC lost, PSU failure, and so on). Troubleshoot these events
accordingly.
02h
Redundancy degraded
03h
Non-redundant, sufficient from redundant
04h
Non-redundant, sufficient from insufficient
05h
Non-redundant, insufficient
06h
Non-redundant, degraded from fully redundant
07h
Redundant, degraded from non-redundant
Byte
Field
Description
11
Sensor Type
09h = Power Unit
12
Sensor Number
B8h
13
Event Direction and
Event Type
[7] Event direction
0b = Assertion Event
1b = Deassertion Event
Power Subsystems
Table 18: Power Unit Redundancy Sensor – Event Trigger Offset – Next Steps
4.3.3 Node Auto Shutdown Sensor
The BMC supports a Node Auto Shutdown sensor for logging a SEL event due to an emergency shutdown of a node due to loss of
power supply redundancy or PSU CLST throttling due to an over-current warning condition. This sensor is applicable only to multinode systems.
The sensor is rearmed on power-on (AC or DC power on transitions).
This sensor is only used for triggering SEL to indicate node or power auto shutdown assertion or deassertion.
Revision 1.1 Intel order number G90620-002 37
Table 19: Node Auto Shutdown Sensor Typical Characteristics
Page 48

Power Subsystems
Byte
Field
Description
[6:0] Event Type = 03h (“digital” discrete)
14
Event Data 1
[7:6] – 00b = Unspecified Event Data 2
[5:4] – 00b = Unspecified Event Data 3
[3:0] – Event Trigger Offset
1h = State Asserted
15
Event Data 2
Not used
16
Event Data 3
Not used
Byte
Field
Description
11
Sensor Type
08h = Power Supply
12
Sensor Number
50h = Power Supply 1 Status
51h = Power Supply 2 Status
13
Event Direction and
Event Type
[7] Event direction
0b = Assertion Event
1b = Deassertion Event
System Event Log Troubleshooting Guide for EPSD Platforms Based on Intel® Xeon® Processor E5 4600/2600/2400/1600/1400 Product Families
4.3.3.1 Node Auto Shutdown Sensor – Next Steps
This event is accompanied by specific power supply errors (AC lost, PSU failure, and so on) or other system events. Troubleshoot
these events accordingly.
4.4 Power Supply
The BMC monitors the power supply subsystem.
4.4.1 Power Supply Status Sensors
These sensors report the status of the power supplies in the system. When a system first AC applied or removed , it can log an event.
Also if there is a failure, predictive failure, or a configuration error, it can log an event.
38 Intel order number G90620-002 Revision 1.1
Table 20: Power Supply Status Sensors Typical Characteristics
Page 49

System Event Log Troubleshooting Guide for EPSD Platforms Based on Intel® Xeon® Processor E5 4600/2600/2400/1600/1400 Product Families
Byte
Field
Description
[6:0] Event Type = 6Fh (Sensor Specific)
14
Event Data 1
[7:6] – ED2 data in Table 21
[5:4] – ED3 data in Table 21
[3:0] – Sensor Specific offset as described in Table 21
15
Event Data 2
As described in Table 21
16
Event Data 3
As described in Table 21
Sensor Specific Offset
Description
ED2
ED3
Next Steps
Hex
Description
00h
Presence
Power supply detected
00b = Unspecified Event Data 2
00b = Unspecified Event Data 3
Informational Event
01h
Failure
Power supply failed
Check the data in ED2
and ED3 for more details.
10b = OEM code in Event Data 2
01h – Output voltage fault
02h – Output power fault
03h – Output over-current fault
04h – Over-temperature fault
05h – Fan fault
10b = OEM code in Event Data 3
Will have the contents of the
associated PMBus* Status
register. For example, Data 3 will
have the contents of the
VOLTAGE_STATUS register at
the time an Output Voltage fault
was detected. Refer to the
PMBus* Specification for details
on specific register contents.
Indicates a power supply
failed.
1. Remove and reapply
AC.
2. If the power supply
still fails, replace it.
Table 21: Power Supply Status Sensor – Sensor Specific Offsets – Next Steps
Power Subsystems
Revision 1.1 Intel order number G90620-002 39
Page 50

Power Subsystems
Sensor Specific Offset
Description
ED2
ED3
Next Steps
Hex
Description
02h
Predictive
Failure
Check the data in ED2
and ED3 for more details.
10b = OEM code in Event Data 2
01h – Output voltage warning
02h – Output power warning
03h – Output over-current
warning
04h –Over-temperature warning
05h – Fan warning
06h – Input under-voltage
warning
07h – Input over-current
warning
08h – Input over-power warning
10b = OEM code in Event Data 3
Will have the contents of the
associated PMBus* Status
register. For example, Data 3 will
have the contents of the
VOLTAGE_STATUS register at
the time an Output Voltage
warning was detected. Refer to
the PMBus* Specification for
details on specific register
contents
Depends on the warning
event.
1. Replace the power
supply.
2. Verify proper airflow
to the system.
3. Verify the power
source.
4. Replace the system
boards.
03h
A/C lost
AC removed
00b = Unspecified Event Data 2
00b = Unspecified Event Data 3
Informational Event.
06h
Configuration
error
Power supply
configuration is not
supported.
Check the data in ED2 for
more details.
10b = OEM code in Event Data 2
01h – The BMC cannot access
the PMBus* device on the PSU
but its FRU device is
responding.
02h – The PMBUS*_REVISION
command returns a version
number that is not supported
(only version 1.1 and 1.2 are
supported).
03h – The PMBus* device does
not successfully respond to the
PMBUS*_REVISION command.
04h – The PSU is incompatible
with one or more PSUs that are
present in the system.
05h –The PSU FW is operating
in a degraded mode (likely due
to a failed firmware update).
00b = Unspecified Event Data 3
Indicates that at least one of
the supplies is not correct for
your system configuration.
1. Remove the power
supply and verify
compatibility.
2. If the power supply is
compatible, it may be
faulty. Replace it.
System Event Log Troubleshooting Guide for EPSD Platforms Based on Intel® Xeon® Processor E5 4600/2600/2400/1600/1400 Product Families
40 Intel order number G90620-002 Revision 1.1
Page 51

System Event Log Troubleshooting Guide for EPSD Platforms Based on Intel® Xeon® Processor E5 4600/2600/2400/1600/1400 Product Families
Byte
Field
Description
11
Sensor Type
0Bh = Other Units
12
Sensor Number
54h = Power Supply 1 Status
55h = Power Supply 2 Status
13
Event Direction and
Event Type
[7] Event direction
0b = Assertion Event
1b = Deassertion Event
[6:0] Event Type = 01h(Threshold)
14
Event Data 1
[7:6] – 01b = Trigger reading in Event Data 2
[5:4] – 01b = Trigger threshold in Event Data 3
[3:0] – Event Trigger Offset as described in Table 23
15
Event Data 2
Reading that triggered event
16
Event Data 3
Threshold value that triggered event
Event Trigger Offset
Assertion
Severity
Deassert
Severity
Description
Next Steps
Hex
Description
07h
Upper non-critical
going high
Degraded
OK
PMBus* feature to monitor power
supply power consumption.
If you see this event, the system is pulling too much power on the
input for the PSU rating.
1. Verify the power budget is within the specified range.
2. Check http://www.intel.com/p/en_US/support/ for the
power budget tool for your system.
09h
Upper critical
going high
non-fatal
Degraded
4.4.2 Power Supply Power In Sensors
These sensors will log an event when a power supply in the system is exceeding its AC power in threshold.
Table 22: Power Supply Power In Sensors Typical Characteristics
Power Subsystems
The following table describes the severity of each of the event triggers for both assertion and deassertion.
Table 23: Power Supply Power In Sensor – Event Trigger Offset – Next Steps
Revision 1.1 Intel order number G90620-002 41
Page 52

Power Subsystems
Byte
Field
Description
11
Sensor Type
03h = Current
12
Sensor Number
58h = Power Supply 1 Current Out %
59h = Power Supply 2 Current Out %
13
Event Direction and
Event Type
[7] Event direction
0b = Assertion Event
1b = Deassertion Event
[6:0] Event Type = 01h (Threshold)
14
Event Data 1
[7:6] – 01b = Trigger reading in Event Data 2
[5:4] – 01b = Trigger threshold in Event Data 3
[3:0] – Event Trigger Offset as described in Table 25
15
Event Data 2
Reading that triggered event
16
Event Data 3
Threshold value that triggered event
Event Trigger Offset
Assertion
Severity
Deassert
Severity
Description
Next Steps
Hex
Description
07h
Upper non-critical
going high
Degraded
OK
PMBus* feature to monitor power
supply power consumption.
If you see this event, the system is using too much power on the
output for the PSU rating.
1. Verify the power budget is within the specified range.
2. Check http://www.intel.com/p/en_US/support/ for the
power budget tool for your system.
09h
Upper critical
going high
non-fatal
Degraded
System Event Log Troubleshooting Guide for EPSD Platforms Based on Intel® Xeon® Processor E5 4600/2600/2400/1600/1400 Product Families
4.4.3 Power Supply Current Out % Sensors
PMBus*-compliant power supplies may monitor the current output of the main 12v voltage rail and report the current usage as a
percentage of the maximum power output for that rail.
Table 24: Power Supply Current Out % Sensors Typical Characteristics
The following table describes the severity of each of the event triggers for both assertion and deassertion.
Table 25: Power Supply Current Out % Sensor – Event Trigger Offset – Next Steps
42 Intel order number G90620-002 Revision 1.1
Page 53

System Event Log Troubleshooting Guide for EPSD Platforms Based on Intel® Xeon® Processor E5 4600/2600/2400/1600/1400 Product Families
Byte
Field
Description
11
Sensor Type
01h = Temperature
12
Sensor Number
5Ch = Power Supply 1 Temperature
5Dh = Power Supply 2 Temperature
13
Event Direction and
Event Type
[7] Event direction
0b = Assertion Event
1b = Deassertion Event
[6:0] Event Type = 01h (Threshold)
14
Event Data 1
[7:6] – 01b = Trigger reading in Event Data 2
[5:4] – 01b = Trigger threshold in Event Data 3
[3:0] – Event Trigger Offset as described in Table 27
15
Event Data 2
Reading that triggered event
16
Event Data 3
Threshold value that triggered event
Event Trigger Offset
Assertion
Severity
Deassert
Severity
Description
Next Steps
Hex
Description
07h
Upper non-critical
going high
Degraded
OK
An upper non-critical or
critical temperature
threshold has been
crossed.
1. Check for clear and unobstructed airflow into and out of the chassis.
2. Ensure SDR is programmed and correct chassis has been selected.
3. Ensure there are no fan failures.
4. Ensure the air used to cool the system is within the thermal
specifications for the system (typically below 35°C).
09h
Upper critical going
high
non-fatal
Degraded
4.4.4 Power Supply Temperature Sensors
The BMC monitors one or two power supply temperature sensors for each installed PMBus*-compliant power supply.
Table 26: Power Supply Temperature Sensors Typical Characteristics
Power Subsystems
The following table describes the severity of each of the event triggers for both assertion and deassertion.
Table 27: Power Supply Temperature Sensor – Event Trigger Offset – Next Steps
Revision 1.1 Intel order number G90620-002 43
Page 54

Power Subsystems
Byte
Field
Description
11
Sensor Type
04h = Fan
12
Sensor Number
A0h = Power Supply 1 Fan Tachometer 1
A1h = Power Supply 1 Fan Tachometer 2
A4h = Power Supply 2 Fan Tachometer 1
A5h = Power Supply 2 Fan Tachometer 2
13
Event Direction and
Event Type
[7] Event direction
0b = Assertion Event
1b = Deassertion Event
[6:0] Event Type = 03h (“digital” Discrete)
14
Event Data 1
[7:6] – 00b = Unspecified Event Data 2
[5:4] – 00b = Unspecified Event Data 3
[3:0] – Event Trigger Offset = 1h = State Asserted
15
Event Data 2
Not used
16
Event Data 3
Not used
System Event Log Troubleshooting Guide for EPSD Platforms Based on Intel® Xeon® Processor E5 4600/2600/2400/1600/1400 Product Families
4.4.5 Power Supply Fan Tachometer Sensors
The BMC polls each installed power supply using the PMBus* fan status commands to check for failure conditions for the power
supply fans.
Table 28: Power Supply Fan Tachometer Sensors Typical Characteristics
4.4.5.1 Power Supply Fan Tachometer Sensors – Next Steps
These events only get generated in the systems with PMBus*-capable power supplies and normally when the airflow is obstructed to
the power supply:
1. Remove and then reinstall the power supply to see whether something might have temporarily caused the fan failure.
2. Swap the power supply with another one to see whether the problem stays with the location or follows the power supply.
3. Replace the power supply depending on the outcome of steps 1 and 2.
4. Ensure the latest FRUSDR update has been run and the correct chassis is detected or selected.
44 Intel order number G90620-002 Revision 1.1
Page 55

System Event Log Troubleshooting Guide for EPSD Platforms Based on Intel® Xeon® Processor E5 4600/2600/2400/1600/1400 Product Families
Byte
Field
Description
11
Sensor Type
04h = Fan
12
Sensor Number
30h-3Fh (Chassis specific)
BAh-BFh (Chassis specific)
13
Event Direction and
Event Type
[7] Event direction
0b = Assertion Event
1b = Deassertion Event
[6:0] Event Type = 01h (Threshold)
14
Event Data 1
[7:6] – 01b = Trigger reading in Event Data 2
[5:4] – 01b = Trigger threshold in Event Data 3
[3:0] – Event Trigger Offset as described in Table 30
15
Event Data 2
Reading that triggered event
16
Event Data 3
Threshold value that triggered event
Cooling Subsystem
5. Cooling Subsystem
5.1 Fan Sensors
There are three types of fan sensors that can be present on Intel® Server Systems: speed, presence, and redundancy. The last two
are only present in the systems with hot-swap redundant fans.
5.1.1 Fan Tachometer Sensors
Fan tachometer sensors monitor the rpm signal on the relevant fan headers on the platform. Fan speed sensors are threshold-based
sensors. Usually they only have lower (critical) thresholds set, so that a SEL entry is only generated if the fan spins too slowly.
Table 29: Fan Tachometer Sensors Typical Characteristics
The following table describes the severity of each of the event triggers for both assertion and deassertion.
Revision 1.1 Intel order number G90620-002 45
Page 56

Cooling Subsystem
Event Trigger Offset
Assertion
Severity
Deassert
Severity
Description
Next Steps
Hex
Description
00h
Lower non-critical
going low
Degraded
OK
The fan speed has dropped
below its lower non-critical
threshold.
A fan speed error on a new system build is typically not caused by the fan
spinning too slowly, instead it is caused by the fan being connected to the
wrong header (the BMC expects them on certain headers for each
chassis and will log this event if there is no fan on that header).
1. Refer to the Quick Start Guide or the Service Guide to identify
the correct fan headers to use.
2. Ensure the latest FRUSDR update has been run and the correct
chassis is detected or selected.
3. If you are sure this was done, the event may be a sign of
impending fan failure (although this only normally applies if the
system has been in use for a while). Replace the fan.
02h
Lower critical
going low
non-fatal
Degraded
The fan speed has dropped
below its lower critical
threshold.
Byte
Field
Description
11
Sensor Type
04h = Fan
12
Sensor Number
40h-4Fh (Chassis specific)
13
Event Direction and
Event Type
[7] Event direction
0b = Assertion Event
1b = Deassertion Event
[6:0] Event Type = 08h (Generic “digital” Discrete)
System Event Log Troubleshooting Guide for EPSD Platforms Based on Intel® Xeon® Processor E5 4600/2600/2400/1600/1400 Product Families
Table 30: Fan Tachometer Sensor – Event Trigger Offset – Next Steps
5.1.2 Fan Presence and Redundancy Sensors
Fan presence sensors are only implemented for hot-swap fans, and require an additional pin on the fan header. Fan redundancy is
an aggregate of the fan presence sensors and will warn when redundancy is lost. Typically the redundancy mode on Intel® servers is
an n+1 redundancy (if one fan fails there are still sufficient fans to cool the system, but it is no longer redundant) although other
modes are also possible.
Table 31: Fan Presence Sensors Typical Characteristics
46 Intel order number G90620-002 Revision 1.1
Page 57

System Event Log Troubleshooting Guide for EPSD Platforms Based on Intel® Xeon® Processor E5 4600/2600/2400/1600/1400 Product Families
Byte
Field
Description
14
Event Data 1
[7:6] – 00b = Unspecified Event Data 2
[5:4] – 00b = Unspecified Event Data 3
[3:0] – Event Trigger Offset as described in Table 32
15
Event Data 2
Not used
16
Event Data 3
Not used
Event Trigger Offset
Assertion
Severity
Deassert
Severity
Description
Next Steps
Hex
Description
01h
Device
Present
OK
Degraded
Assertion –A fan was inserted. This
event may also get logged when the
BMC initializes when AC is applied.
Informational only
Deassert – A fan was removed, or
was not present at the expected
location when the BMC initialized.
These events only get generated in the systems with hot-swappable fans,
and normally only when a fan is physically inserted or removed. If fans
were not physically removed:
1. Use the Quick Start Guide to check whether the right fan
headers were used.
2. Swap the fans round to see whether the problem stays with the
location or follows the fan.
3. Replace the fan or fan wiring/housing depending on the outcome
of step 2.
4. Ensure the latest FRUSDR update has been run and the correct
chassis is detected or selected.
Byte
Field
Description
11
Sensor Type
04h = Fan
12
Sensor Number
0Ch
The following table describes the severity of each of the event triggers for both assertion and deassertion.
Table 32: Fan Presence Sensors – Event Trigger Offset – Next Steps
Cooling Subsystem
Revision 1.1 Intel order number G90620-002 47
Table 33: Fan Redundancy Sensors Typical Characteristics
Page 58

Cooling Subsystem
Byte
Field
Description
13
Event Direction and
Event Type
[7] Event direction
0b = Assertion Event
1b = Deassertion Event
[6:0] Event Type = 0Bh (Generic Discrete)
14
Event Data 1
[7:6] – 00b = Unspecified Event Data 2
[5:4] – 00b = Unspecified Event Data 3
[3:0] – Event Trigger Offset as described in Table 34
15
Event Data 2
Not used
16
Event Data 3
Not used
Event Trigger Offset
Description
Next Steps
Hex
Description
00h
Fully redundant
The system has lost one or more fans and is running in nonredundant mode. There are enough fans to keep the system
properly cooled, but fan speeds will boost.
Fan redundancy loss indicates failure of
one or more fans.
Look for lower (non-) critical fan errors,
or fan removal errors in the SEL, to
indicate which fan is causing the
problem, and follow the troubleshooting
steps for these event types.
01h
Redundancy lost
02h
Redundancy degraded
03h
Non-redundant, sufficient from redundant
04h
Non-redundant, sufficient from insufficient
05h
Non-redundant, insufficient
The system has lost fans and may no longer be able to cool
itself adequately. Overheating may occur if this situation
remains for a longer period of time.
06h
Non-redundant, degraded from fully
redundant
The system has lost one or more fans and is running in nonredundant mode. There are enough fans to keep the system
properly cooled, but fan speeds will boost.
07h
Redundant, degraded from non-redundant
The system has lost one or more fans and is running in a
degraded mode, but still is redundant. There are enough fans
to keep the system properly cooled.
System Event Log Troubleshooting Guide for EPSD Platforms Based on Intel® Xeon® Processor E5 4600/2600/2400/1600/1400 Product Families
The following table describes the severity of each of the event triggers for both assertion and deassertion.
Table 34: Fan Redundancy Sensor – Event Trigger Offset – Next Steps
48 Intel order number G90620-002 Revision 1.1
Page 59

System Event Log Troubleshooting Guide for EPSD Platforms Based on Intel® Xeon® Processor E5 4600/2600/2400/1600/1400 Product Families
Byte
Field
Description
11
Sensor Type
01h = Temperature
12
Sensor Number
See Table 37
13
Event Direction and
Event Type
[7] Event direction
0b = Assertion Event
1b = Deassertion Event
[6:0] Event Type = 01h (Threshold)
14
Event Data 1
[7:6] – 01b = Trigger reading in Event Data 2
[5:4] – 01b = Trigger threshold in Event Data 3
[3:0] – Event Trigger Offset as described in Table 36
15
Event Data 2
Reading that triggered event
Cooling Subsystem
5.2 Temperature Sensors
There are a variety of temperature sensors that can be implemented on Intel® Server Systems. They are split into various types each
with their own events that can be logged.
Threshold-based Temperature
Thermal Margin
Processor Thermal Control %
Processor DTS Thermal Margin (Monitor only)
Discrete Thermal
DIMM Thermal Trip
5.2.1 Threshold-based Temperature Sensors
Threshold-based temperature sensors are sensors that report an actual temperature. These are linear, threshold-based sensors. In
most Intel® Server Systems, multiple sensors are defined: front panel temperature and baseboard temperature. There are also
multiple other sensors that can be defined and are platform-specific. Most of these sensors typically have upper and lower thresholds
set – upper to warn in case of an over-temperature situation, lower to warn against sensor failure (temperature sensors typically read
out 0 if they stop working).
Revision 1.1 Intel order number G90620-002 49
Table 35: Temperature Sensors Typical Characteristics
Page 60

Cooling Subsystem
Byte
Field
Description
16
Event Data 3
Threshold value that triggered event
Event Trigger
Assertion
Severity
Deassert
Severity
Description
Hex
Description
00h
Lower non-critical
going low
Degraded
OK
The temperature has dropped below its lower non-critical threshold.
02h
Lower critical
going low
non-fatal
Degraded
The temperature has dropped below its lower critical threshold.
07h
Upper non-critical
going high
Degraded
OK
The temperature has gone over its upper non-critical threshold.
09h
Upper critical
going high
non-fatal
Degraded
The temperature has gone over its upper critical threshold.
Sensor
Number
Sensor Name
Next Steps
21h
Front Panel Temp
If the front panel temperature reads zero, check:
1. It is connected properly.
2. The SDR has been programmed correctly for your chassis.
If the front panel temperature is too high:
1. Check the cooling of your server room.
14h
Baseboard Temperature 5
1. Check for clear and unobstructed airflow into and out of the chassis.
2. Ensure the SDR is programmed and correct chassis has been selected.
3. Ensure there are no fan failures.
4. Ensure the air used to cool the system is within the thermal specifications for the system (typically below
35°C).
15h
Baseboard Temperature 6
16h
I/O Mod2 Temp
17h
PCI Riser 5 Temp
18h
PCI Riser 4 Temp
20h
Baseboard Temperature 1
22h
SSB Temperature
System Event Log Troubleshooting Guide for EPSD Platforms Based on Intel® Xeon® Processor E5 4600/2600/2400/1600/1400 Product Families
Table 36: Temperature Sensors Event Triggers – Description
Table 37: Temperature Sensors – Next Steps
50 Intel order number G90620-002 Revision 1.1
Page 61

System Event Log Troubleshooting Guide for EPSD Platforms Based on Intel® Xeon® Processor E5 4600/2600/2400/1600/1400 Product Families
Sensor
Number
Sensor Name
Next Steps
23h
Baseboard Temperature 2
24h
Baseboard Temperature 3
25h
Baseboard Temperature 4
26h
I/O Mod Temp
27h
PCI Riser 1 Temp
28h
IO Riser Temp
2Ch
PCI Riser 2 Temp
2Dh
SAS Mod Temp
2Eh
Exit Air Temp
2Fh
LAN NIC Temp
Byte
Field
Description
11
Sensor Type
01h = Temperature
12
Sensor Number
See Table 40
Cooling Subsystem
5.2.2 Thermal Margin Sensors
Margin sensors are also linear sensors but typically report a negative value. This is not an actual temperature, but in fact an offset to
a critical temperature. Values reported are seen as number of degrees below a critical temperature for the particular component.
The BMC supports DIMM aggregate temperature margin IPMI sensors. The temperature readings from the physical temperature
sensors on each DIMM (such as, Temperature Sensor on DIMM, or TSOD) are aggregated into IPMI temperature margin sensors for
groupings of DIMM slots, the partitioning of which is platform/SKU specific and generally corresponding to fan domains.
The BMC supports global aggregate temperature margin IPMI sensors. There may be as many unique global aggregate sensors as
there are fan domains. Each sensor aggregates the readings of multiple other IPMI temperature sensors supported by the BMC FW.
The mapping of child-sensors into each global aggregate sensor is SDR-configurable. The primary usage for these sensors is to
trigger turning off fans when a lower threshold is reached.
Revision 1.1 Intel order number G90620-002 51
Table 38: Thermal Margin Sensors Typical Characteristics
Page 62

Cooling Subsystem
Byte
Field
Description
13
Event Direction and
Event Type
[7] Event direction
0b = Assertion Event
1b = Deassertion Event
[6:0] Event Type = 01h (Threshold)
14
Event Data 1
[7:6] – 01b = Trigger reading in Event Data 2
[5:4] – 01b = Trigger threshold in Event Data 3
[3:0] – Event Triggers as described in Table 39
15
Event Data 2
Reading that triggered event
16
Event Data 3
Threshold value that triggered event
Event Trigger
Assertion
Severity
Deassert
Severity
Description
Hex
Description
07h
Upper non-critical
going high
Degraded
OK
The thermal margin has gone over its upper non-critical threshold.
09h
Upper critical
going high
non-fatal
Degraded
The thermal margin has gone over its upper critical threshold.
Sensor
Number
Sensor Name
Next Steps
74h
P1 Therm Margin
Not a logged SEL event. Sensor is used for thermal management of the processor.
75h
P2 Therm Margin
76h
P3 Therm Margin
77h
P4 Therm Margin
B0h
P1 DIMM Thrm Mrgn1
1. Check for clear and unobstructed airflow into and out of the chassis.
2. Ensure the SDR is programmed and correct chassis has been selected.
3. Ensure there are no fan failures.
B1h
P1 DIMM Thrm Mrgn2
B2h
P2 DIMM Thrm Mrgn1
System Event Log Troubleshooting Guide for EPSD Platforms Based on Intel® Xeon® Processor E5 4600/2600/2400/1600/1400 Product Families
Table 39: Thermal Margin Sensors Event Triggers – Description
Table 40: Thermal Margin Sensors – Next Steps
52 Intel order number G90620-002 Revision 1.1
Page 63

System Event Log Troubleshooting Guide for EPSD Platforms Based on Intel® Xeon® Processor E5 4600/2600/2400/1600/1400 Product Families
Sensor
Number
Sensor Name
Next Steps
B3h
P2 DIMM Thrm Mrgn2
4. Ensure the air used to cool the system is within the thermal specifications for the system (typically below 35°C).
B4h
P3 DIMM Thrm Mrgn1
B5h
P3 DIMM Thrm Mrgn2
B6h
P4 DIMM Thrm Mrgn1
B7h
P4 DIMM Thrm Mrgn2
C8h
Agg Therm Mrgn 1
C9h
Agg Therm Mrgn 2
CAh
Agg Therm Mrgn 3
CBh
Agg Therm Mrgn 4
CCh
Agg Therm Mrgn 5
CDh
Agg Therm Mrgn 6
CEh
Agg Therm Mrgn 7
CFh
Agg Therm Mrgn 8
Byte
Field
Description
11
Sensor Type
01h = Temperature
12
Sensor Number
78h = Processor 1 Thermal Control %
79h = Processor 2 Thermal Control %
Cooling Subsystem
5.2.3 Processor Thermal Control Sensors
The BMC FW monitors the percentage of time that a processor has been operationally constrained over a given time window
(nominally six seconds) due to internal thermal management algorithms engaging to reduce the temperature of the device. This
monitoring is instantiated as one IPMI analog/threshold sensor per processor package.
If this is not addressed, the processor will overheat and shut down the system to protect itself from damage.
Table 41: Processor Thermal Control Sensors Typical Characteristics
Revision 1.1 Intel order number G90620-002 53
Page 64

Cooling Subsystem
Byte
Field
Description
7Ah = Processor 3 Thermal Control %
7Bh = Processor 4 Thermal Control %
13
Event Direction and
Event Type
[7] Event direction
0b = Assertion Event
1b = Deassertion Event
[6:0] Event Type = 01h (Threshold)
14
Event Data 1
[7:6] – 01b = Trigger reading in Event Data 2
[5:4] – 01b = Trigger threshold in Event Data 3
[3:0] – Event Triggers as described in Table 42
15
Event Data 2
Reading that triggered event
16
Event Data 3
Threshold value that triggered event
Event Trigger
Assertion
Severity
Deassert
Severity
Description
Hex
Description
07h
Upper non-critical
going high
Degraded
OK
The thermal margin has gone over its upper non-critical threshold.
09h
Upper critical
going high
non-fatal
Degraded
The thermal margin has gone over its upper critical threshold.
System Event Log Troubleshooting Guide for EPSD Platforms Based on Intel® Xeon® Processor E5 4600/2600/2400/1600/1400 Product Families
Table 42: Processor Thermal Control Sensors Event Triggers – Description
5.2.3.1 Processor Thermal Control % Sensors – Next Steps
These events normally occur due to failures of the thermal solution:
1. Verify heatsink is properly attached and has thermal grease.
2. If the system has a heatsink fan, ensure the fan is spinning.
3. Check all system fans are operating properly.
4. Check that the air used to cool the system is within limits (typically 35°C).
54 Intel order number G90620-002 Revision 1.1
Page 65

System Event Log Troubleshooting Guide for EPSD Platforms Based on Intel® Xeon® Processor E5 4600/2600/2400/1600/1400 Product Families
Byte
Field
Description
11
Sensor Type
01h = Temperature
12
Sensor Number
83h = Processor 1 DTS Thermal Margin
84h = Processor 2 DTS Thermal Margin
85h = Processor 3 DTS Thermal Margin
86h = Processor 4 DTS Thermal Margin
13
Event Direction and
Event Type
[7] Event direction
0b = Assertion Event
1b = Deassertion Event
[6:0] Event Type = 01h (Threshold)
Cooling Subsystem
5.2.4 Processor DTS Thermal Margin Sensors
Intel® Xeon® processor E5-4600/2600/2400/1600 v2 product families are incorporating a DTS-based thermal spec. This allows a
much more accurate control of the thermal solution and enables lower fan speeds and lower fan power consumption. For Intel®
Xeon® processor E5-4600/2600/2400/1600 product families, this requires significant BMC FW calculations to derive the sensor value.
Intel® Xeon® processor E5-4600/2600/2400/1600 v2 product families are the follow-on processors to Intel® Xeon® processor E54600/2600/2400/1600 product families. For Intel® Xeon® processor E5-4600/2600/2400/1600 v2 product families, the BMC’s
derivation of this value is greatly simplified because the majority of the calculations are performed within the processor itself.
The main usage of this sensor is as an input to the BMC’s fan control algorithms. The BMC implements this as a threshold sensor.
There is one DTS sensor for each installed physical processor package. Thresholds are not set and alert generation is not enabled
for these sensors.
Table 43: Processor DTS Thermal Margin Sensors Typical Characteristics
5.2.5 Discrete Thermal Sensors
Discrete thermal sensors do not report a temperature at all, instead they report an overheating event of some kind. For example,
VRD Hot (voltage regulator is overheating) or processor Thermal Trip (the processor got so hot that its over-temperature protection
was triggered and the system was shut down to prevent damage).
Revision 1.1 Intel order number G90620-002 55
Page 66

Cooling Subsystem
Byte
Field
Description
11
Sensor Type
01h = Temperature
12
Sensor Number
See Table 45
13
Event Direction and
Event Type
[7] Event direction
0b = Assertion Event
1b = Deassertion Event
[6:0] Event Type = See Table 45
14
Event Data 1
[7:6] – 00b = Unspecified Event Data 2
[5:4] – 00b = Unspecified Event Data 3
[3:0] – Event Trigger Offset as described in Table 45
15
Event Data 2
Not used
16
Event Data 3
Not used
Sensor
Number
Sensor Name
Event
Type
Event Trigger Offset
Description
Next Steps
Hex
Description
0Dh
SSB Thermal Trip
03h
01h
State Asserted
South Side Bridge (SSB) overheated
1. Check for clear and unobstructed
airflow into and out of the chassis.
2. Ensure the SDR is programmed and
correct chassis has been selected.
3. Ensure there are no fan failures.
4. Ensure the air used for cooling the
system is within the thermal
specifications for the system (typically
below 35°C).
90h
P1 VRD Hot
05h
01h
Limit Exceeded
Processor 1 voltage regulator overheated
91h
P2 VRD Hot
Processor 2 voltage regulator overheated
92h
P3 VRD Hot
Processor 3 voltage regulator overheated
93h
P4 VRD Hot
Processor 4 voltage regulator overheated
94h
P1 Mem01 VRD Hot
Processor 1 Memory 0/1 voltage regulator
overheated
95h
P1 Mem23 VRD Hot
Processor 1 Memory 2/3 voltage regulator
overheated
96h
P2 Mem01 VRD Hot
Processor 2 Memory 0/1 voltage regulator
overheated
System Event Log Troubleshooting Guide for EPSD Platforms Based on Intel® Xeon® Processor E5 4600/2600/2400/1600/1400 Product Families
Table 44: Discrete Thermal Sensors Typical Characteristics
Table 45: Discrete Thermal Sensors – Next Steps
56 Intel order number G90620-002 Revision 1.1
Page 67

System Event Log Troubleshooting Guide for EPSD Platforms Based on Intel® Xeon® Processor E5 4600/2600/2400/1600/1400 Product Families
Sensor
Number
Sensor Name
Event
Type
Event Trigger Offset
Description
Next Steps
Hex
Description
97h
P2 Mem23 VRD Hot
Processor 2 Memory 2/3 voltage regulator
overheated
98h
P3 Mem01 VRD Hot
Processor 3 Memory 0/1 voltage regulator
overheated
99h
P4 Mem23 VRD Hot
Processor 3 Memory 2/3 voltage regulator
overheated
9Ah
P4 Mem01 VRD Hot
Processor 4 Memory 0/1 voltage regulator
overheated
9Bh
P4 Mem23 VRD Hot
Processor 4 Memory 2/3 voltage regulator
overheated
Byte
Field
Description
11
Sensor Type
0Ch = Memory
12
Sensor Number
C0h = Processor 1 DIMM Thermal Trip
C1h = Processor 2 DIMM Thermal Trip
C2h = Processor 3 DIMM Thermal Trip
C3h = Processor 4 DIMM Thermal Trip
13
Event Direction and
Event Type
[7] Event direction
0b = Assertion Event
1b = Deassertion Event
[6:0] Event Type = 6Fh (Sensor Specific)
14
Event Data 1
[7:6] – 00b = Unspecified Event Data 2
[5:4] – 00b = Unspecified Event Data 3
Cooling Subsystem
5.2.6 DIMM Thermal Trip Sensors
The BMC supports DIMM Thermal Trip monitoring that is instantiated as one aggregate IPMI discrete sensor per CPU. When a
DIMM Thermal Trip occurs, the system hardware will automatically power down the server and the BMC will assert the sensor offset
and log an event.
Revision 1.1 Intel order number G90620-002 57
Table 46: DIMM Thermal Trip Typical Characteristics
Page 68

Cooling Subsystem
Byte
Field
Description
[3:0] – Event Trigger Offset = 0A = Critical over temperature
15
Event Data 2
Not used
16
Event Data 3
Not used
System Event Log Troubleshooting Guide for EPSD Platforms Based on Intel® Xeon® Processor E5 4600/2600/2400/1600/1400 Product Families
5.2.6.1 DIMM Thermal Trip Sensors – Next Steps
1. Check for clear and unobstructed airflow into and out of the chassis.
2. Ensure the SDR is programmed and correct chassis has been selected.
3. Ensure there are no fan failures.
4. Ensure the air used to cool the system is within the thermal specifications for the system (typically below 35°C).
5.3 System Air Flow Monitoring Sensor
The BMC provides an IPMI sensor to report the volumetric system airflow in CFM (cubic feet per minute). The airflow in CFM is
calculated based on the system fan PWM values. The specific Pulse Width Modulation (PWM or PWMs) used to determine the CFM
is SDR-configurable. The relationship between PWM and CFM is based on a lookup table in an OEM SDR.
The airflow data is used in the calculation for exit air temperature monitoring. It is exposed as an IPMI sensor to allow a data center
management application to access this data for use in rack-level thermal management.
This sensor is informational only and will not log events into the SEL.
58 Intel order number G90620-002 Revision 1.1
Page 69

System Event Log Troubleshooting Guide for EPSD Platforms Based on Intel® Xeon® Processor E5 4600/2600/2400/1600/1400 Product Families
Byte
Field
Description
11
Sensor Type
07h = Processor
12
Sensor Number
70h = Processor 1 Status
71h = Processor 2 Status
72h = Processor 3 Status
73h = Processor 4 Status
13
Event Direction and
Event Type
[7] Event direction
0b = Assertion Event
1b = Deassertion Event
[6:0] Event Type = 6Fh (Sensor Specific)
14
Event Data 1
[7:6] – 00b = Unspecified Event Data 2
[5:4] – 00b = Unspecified Event Data 3
[3:0] – Event Trigger Offset as described in Table 48
15
Event Data 2
Not used
16
Event Data 3
Not used
Processor Subsystem
6. Processor Subsystem
Intel® servers report multiple processor-centric sensors in the SEL.
6.1 Processor Status Sensor
The BMC provides an IPMI sensor of type processor for monitoring status information for each processor slot. If an event state
(sensor offset) has been asserted, it remains asserted until one of the following happens:
A rearm Sensor Events command is executed for the processor status sensor.
AC or DC power cycle, system reset, or system boot occurs.
CPU Presence status is not saved across A/C power cycles and therefore will not generate a deassertion after cycling AC power.
Table 47: Process Status Sensors Typical Characteristics
Revision 1.1 Intel order number G90620-002 59
Page 70

Processor Subsystem
Event Trigger
Offset
Processor Status
Next Steps
0h
Internal error (IERR)
1. Cross test the processors.
2. Replace the processors depending on the results of the test.
1h
Thermal trip
This event normally only happens due to failures of the thermal solution:
1. Verify heatsink is properly attached and has thermal grease.
2. If the system has a heatsink fan, ensure the fan is spinning.
3. Check all system fans are operating properly.
4. Check that the air used to cool the system is within limits (typically
35°C).
2h
FRB1/BIST failure
1. Cross test the processors.
2. Replace the processors depending on the results of the test.
3h
FRB2/Hang in POST failure
4h
FRB3/Processor startup/initialization failure (CPU fails to
start)
5h
Configuration error (for DMI)
6h
SM BIOS uncorrectable CPU-complex error
7h
Processor presence detected
Informational Event
8h
Processor disabled
1. Cross test the processors.
2. Replace the processors depending on the results of the test.
9h
Terminator presence detected
System Event Log Troubleshooting Guide for EPSD Platforms Based on Intel® Xeon® Processor E5 4600/2600/2400/1600/1400 Product Families
Table 48: Processor Status Sensors – Next Steps
60 Intel order number G90620-002 Revision 1.1
Page 71

System Event Log Troubleshooting Guide for EPSD Platforms Based on Intel® Xeon® Processor E5 4600/2600/2400/1600/1400 Product Families
Byte
Field
Description
11
Sensor Type
07h = Processor
12
Sensor Number
80h
13
Event Direction and
Event Type
[7] Event direction
0b = Assertion Event
1b = Deassertion Event
[6:0] Event Type = 03h (Digital Discrete)
14
Event Data 1
[7:6] – 10b = OEM code in Event Data 2
[5:4] – 10b = OEM code in Event Data 3
[3:0] – Event Trigger Offset = 1h (State Asserted)
15
Event Data 2
Event Data 2 values as described in Table 50.
16
Event Data 3
Bitmap of the CPU that causes the system CATERR.
[0]: CPU1
[1]: CPU2
[2]: CPU3
[3]: CPU4
Note: If more than one bit is set, the BMC cannot
determine the source of the CATERR.
ED2
Description
Next Steps
00h
Unknown
1. Cross test the processors.
2. Replace the processors depending on the results of the test.
Processor Subsystem
6.2 Catastrophic Error Sensor
When the Catastrophic Error signal (CATERR#) stays asserted, it is a sign that something serious has gone wrong in the hardware.
The BMC monitors this signal and reports when it stays asserted.
Table 49: Catastrophic Error Sensor Typical Characteristics
Table 50: Catastrophic Error Sensor – Event Data 2 Values – Next Steps
Revision 1.1 Intel order number G90620-002 61
Page 72

Processor Subsystem
ED2
Description
Next Steps
01h
CATERR
This error is typically caused by other platform components.
1. Check for other errors near the time of the CATERR event.
2. Verify all peripherals are plugged in and operating correctly, particularly Hard Drives, Optical Drives,
and I/O.
3. Update system firmware and drivers.
2h
CPU Core
Error
1. Cross test the processors.
2. Replace the processors depending on the results of the test.
3h
MSID
Mismatch
Verify the processor is supported by your baseboard. Check your boards Technical Product Specification
(TPS).
Byte
Field
Description
11
Sensor Type
07h = Processor
12
Sensor Number
82h
13
Event Direction and
Event Type
[7] Event direction
0b = Assertion Event
1b = Deassertion Event
[6:0] Event Type = 6Fh (Sensor Specific)
14
Event Data 1
[7:6] – 00b = Unspecified Event Data 2
[5:4] – 00b = Unspecified Event Data 3
[3:0] – Event Trigger Offset = 1h (State Asserted)
15
Event Data 2
Not used
16
Event Data 3
Not used
System Event Log Troubleshooting Guide for EPSD Platforms Based on Intel® Xeon® Processor E5 4600/2600/2400/1600/1400 Product Families
6.3 CPU Missing Sensor
The CPU Missing sensor is a discrete sensor reporting the processor is not installed. The most common instance of this event is due
to a processor populated in the incorrect socket.
Table 51: CPU Missing Sensor Typical Characteristics
62 Intel order number G90620-002 Revision 1.1
Page 73

System Event Log Troubleshooting Guide for EPSD Platforms Based on Intel® Xeon® Processor E5 4600/2600/2400/1600/1400 Product Families
Byte
Field
Description
8 9 Generator ID
0001h = BIOS POST
11
Sensor Type
13h = Critical Interrupt
12
Sensor Number
09h
13
Event Direction and
Event Type
[7] Event direction
0b = Assertion Event
1b = Deassertion Event
[6:0] Event Type = 77h (OEM Discrete)
14
Event Data 1
[7:6] – 10b = OEM code in Event Data 2
[5:4] – 00b = Unspecified Event Data 3
[3:0] – Event Trigger Offset
Processor Subsystem
6.3.1 CPU Missing Sensor – Next Steps
Verify the processor is installed in the correct slot.
6.4 Quick Path Interconnect Sensors
The Intel® Quick Path Interconnect (QPI) bus on Intel® EPSD Boards Based on Intel® Xeon® Processor E5‑
4600/2600/2400/1600/1400 Product Families is the interconnect between processors.
The QPI Link Width Reduced sensor is used by the BIOS POST to report when the link width has been reduced. Therefore the
Generator ID will be 01h.
The QPI Error sensors are reported by the BIOS SMI Handler to the BMC so the Generator ID will be 33h.
6.4.1 QPI Link Width Reduced Sensor
BIOS POST has reduced the QPI Link Width because of an error condition seen during initialization.
Revision 1.1 Intel order number G90620-002 63
Table 52: QPI Link Width Reduced Sensor Typical Characteristics
Page 74

Processor Subsystem
Byte
Field
Description
1h = Reduced to ½ width
2h = Reduced to ¼ width
15
Event Data 2
0-3 = CPU1-4
16
Event Data 3
Not used
Byte
Field
Description
8 9 Generator ID
0033h = BIOS SMI Handler
11
Sensor Type
13h = Critical Interrupt
12
Sensor Number
06h
13
Event Direction and
Event Type
[7] Event direction
0b = Assertion Event
1b = Deassertion Event
[6:0] Event Type = 72h (OEM Discrete)
14
Event Data 1
[7:6] – 10b = OEM code in Event Data 2
[5:4] – 00b = Unspecified Event Data 3
[3:0] – Event Trigger Offset = Reserved
System Event Log Troubleshooting Guide for EPSD Platforms Based on Intel® Xeon® Processor E5 4600/2600/2400/1600/1400 Product Families
6.4.1.1 QPI Link Width Reduced Sensor – Next Steps
If the error continues:
1. Check the processor is installed correctly.
2. Inspect the socket for bent pins.
3. Cross test the processor. If the issue remains with the processor socket, replace the main board, otherwise the processor.
6.4.2 QPI Correctable Error Sensor
The system detected an error and corrected it. This is an informational event.
Table 53: QPI Correctable Error Sensor Typical Characteristics
64 Intel order number G90620-002 Revision 1.1
Page 75

System Event Log Troubleshooting Guide for EPSD Platforms Based on Intel® Xeon® Processor E5 4600/2600/2400/1600/1400 Product Families
Byte
Field
Description
15
Event Data 2
0-3 = CPU1-4
16
Event Data 3
Not used
Byte
Field
Description
8 9 Generator ID
0033h = BIOS SMI Handler
11
Sensor Type
13h = Critical Interrupt
12
Sensor Number
07h
13
Event Direction and
Event Type
[7] Event direction
0b = Assertion Event
1b = Deassertion Event
[6:0] Event Type = 73h (OEM Discrete)
14
Event Data 1
[7:6] – 10b = OEM code in Event Data 2
[5:4] – 00b = Unspecified Event Data 3
[3:0] – Event Trigger Offset
0h = Link Layer Uncorrectable ECC Error
1h = Protocol Layer Poisoned Packet Reception Error
Processor Subsystem
6.4.2.1 QPI Correctable Error Sensor – Next Steps
This is an Informational event only. Correctable errors are acceptable and normal at a low rate of occurrence. If the error continues:
1. Check the processor is installed correctly.
2. Inspect the socket for bent pins.
3. Cross test the processor. If the issue remains with the processor socket, replace the main board, otherwise the processor.
6.4.3 QPI Fatal Error and Fatal Error #2
The system detected a QPI fatal or non-recoverable error. This is a fatal error.
Table 54: QPI Fatal Error Sensor Typical Characteristics
Revision 1.1 Intel order number G90620-002 65
Page 76

Processor Subsystem
Byte
Field
Description
2h = Link/PHY Init Failure with resultant degradation in link width
3h = PHY Layer detected drift buffer alarm
4h = PHY detected latency buffer rollover
5h = PHY Init Failure
6h = Link Layer generic control error (buffer overflow/underflow, credit underflow and so on)
7h = Parity error in link or PHY layer
8h = Protocol layer timeout detected
9h = Protocol layer failed response
Ah = Protocol layer illegal packet field, target Node ID Error, and so on
Bh = Protocol Layer Queue/table overflow/underflow
Ch = Viral Error
Dh = Protocol Layer parity error
Eh = Routing Table Error
Fh = (unused) = Reserved
15
Event Data 2
0-3 = CPU1-4
16
Event Data 3
Not used
Byte
Field
Description
8 9 Generator ID
0033h = BIOS SMI Handler
11
Sensor Type
13h = Critical Interrupt
12
Sensor Number
17h
13
Event Direction and
Event Type
[7] Event direction
0b = Assertion Event
1b = Deassertion Event
[6:0] Event Type = 74h (OEM Discrete)
14
Event Data 1
[7:6] – 10b = OEM code in Event Data 2
System Event Log Troubleshooting Guide for EPSD Platforms Based on Intel® Xeon® Processor E5 4600/2600/2400/1600/1400 Product Families
The QPI Fatal Error #2 is a continuation of QPI Fatal Error.
Table 55: QPI Fatal #2 Error Sensor Typical Characteristics
66 Intel order number G90620-002 Revision 1.1
Page 77

System Event Log Troubleshooting Guide for EPSD Platforms Based on Intel® Xeon® Processor E5 4600/2600/2400/1600/1400 Product Families
Byte
Field
Description
[5:4] – 00b = Unspecified Event Data 3
[3:0] – Event Trigger Offset
0h = Illegal inbound request
1h = IIO Write Cache Uncorrectable Data ECC Error
2h = IIO CSR crossing 32-bit boundary Error
3h = IIO Received XPF physical/logical redirect interrupt inbound
4h = IIO Illegal SAD or Illegal or non-existent address or memory
5h = IIO Write Cache Coherency Violation
15
Event Data 2
0-3 = CPU1-4
16
Event Data 3
Not used
Processor Subsystem
6.4.3.1 QPI Fatal Error and Fatal Error #2 – Next Steps
This is an Informational event only. Correctable errors are acceptable and normal at a low rate of occurrence. If the error continues:
1. Check the processor is installed correctly.
2. Inspect the socket for bent pins.
3. Cross test the processor. If the issue remains with the processor socket, replace the main board, otherwise the processor.
6.5 Processor ERR2 Timeout Sensor
The BMC supports an ERR2 Timeout Sensor (1 per CPU) that asserts if a CPU’s ERR2 signal has been asserted for longer than a
fixed time period (> 90 seconds). ERR[2] is a processor signal that indicates when the IIO (Integrated IO module in the processor)
has a fatal error which could not be communicated to the core to trigger SMI. ERR[2] events are fatal error conditions, where the
BIOS and OS will attempt to gracefully handle error, but may not always do so reliably. A continuously asserted ERR2 signal is an
indication that the BIOS cannot service the condition that caused the error. This is usually because that condition prevents the BIOS
from running.
When an ERR2 timeout occurs, the BMC asserts/deasserts the ERR2 Timeout Sensor, and logs a SEL event for that sensor. The
default behavior for BMC core firmware is to initiate a system reset upon detection of an ERR2 timeout. The BIOS setup utility
provides an option to disable or enable system reset by the BMC on detection of this condition.
Revision 1.1 Intel order number G90620-002 67
Page 78

Processor Subsystem
Byte
Field
Description
11
Sensor Type
07h = Processor
12
Sensor Number
7Ch = Processor 1 ERR2 Timeout
7Dh = Processor 2 ERR2 Timeout
7Eh = Processor 3 ERR2 Timeout
7Fh = Processor 4 ERR2 Timeout
13
Event Direction and
Event Type
[7] Event direction
0b = Assertion Event
1b = Deassertion Event
[6:0] Event Type = 03h (“digital” discrete)
14
Event Data 1
[7:6] – 00b = Unspecified Event Data 2
[5:4] – 00b = Unspecified Event Data 3
[3:0] – Event Trigger Offset = 1h (State Asserted)
15
Event Data 2
Not used
16
Event Data 3
Not used
System Event Log Troubleshooting Guide for EPSD Platforms Based on Intel® Xeon® Processor E5 4600/2600/2400/1600/1400 Product Families
Table 56: Processor ERR2 Timeout Sensor Typical Characteristics
6.5.1 Processor ERR2 Timeout – Next Steps
1. Check the SEL for any other events around the time of the failure.
2. Take note of all IPMI activity that was occurring around the time of the failure. Capture a System BMC Debug Log as soon as you
can after experiencing this failure. This log can be captured from the Integrated BMC Web Console or by using the Intel® Syscfg
utility (syscfg /sbmcdl private filename.zip). Send the log file to your system manufacturer or Intel representative for failure
analysis.
6.6 Processor MSID Mismatch Sensor
The BMC supports a MSID Mismatch sensor for monitoring for the fault condition that will occur if there is a power rating
incompatibility between a baseboard and a processor.
The sensor is rearmed on power-on (AC or DC power on transitions).
68 Intel order number G90620-002 Revision 1.1
Page 79

System Event Log Troubleshooting Guide for EPSD Platforms Based on Intel® Xeon® Processor E5 4600/2600/2400/1600/1400 Product Families
Byte
Field
Description
11
Sensor Type
07h = Processor
12
Sensor Number
81h = Processor 1 MSID Mismatch
87h = Processor 2 MSID Mismatch
88h = Processor 3 MSID Mismatch
89h = Processor 4 MSID Mismatch
13
Event Direction and
Event Type
[7] Event direction
0b = Assertion Event
1b = Deassertion Event
[6:0] Event Type = 03h (“digital” discrete)
14
Event Data 1
[7:6] – 00b = Unspecified Event Data 2
[5:4] – 00b = Unspecified Event Data 3
[3:0] – Event Trigger Offset = 1h (State Asserted)
15
Event Data 2
Not used
16
Event Data 3
Not used
Processor Subsystem
Table 57: Processor MSID Mismatch Sensor Typical Characteristics
6.6.1 Processor MSID Mismatch Sensor – Next Steps
Verify the processor is supported by your baseboard. Check your boards Technical Product Specification (TPS).
Revision 1.1 Intel order number G90620-002 69
Page 80

Memory Subsystem
Byte
Field
Description
8 9 Generator ID
0001h = BIOS POST
11
Sensor Type
0ch = Memory
12
Sensor Number
02h
System Event Log Troubleshooting Guide for EPSD Platforms Based on Intel® Xeon® Processor E5 4600/2600/2400/1600/1400 Product Families
7. Memory Subsystem
Intel® servers report memory errors, status, and configuration in the SEL.
7.1 Memory RAS Configuration Status
A Memory RAS Configuration Status event is logged after an AC power-on occurs, only if any RAS Mode is currently configured, and
only if RAS Mode is successfully initiated.
This is to make sure that there is a record in the SEL telling what the RAS Mode was at the time that the system started up. This is
only logged after AC power-on, not DC power-on.
The Memory RAS Configuration Status Sensor is also used to log an event during POST whenever there is a RAS configuration
error. This is a case where a RAS Mode has been selected but when the system boots, the memory configuration cannot support the
RAS Mode. The memory configuration fails, and operates in Independent Channel Mode.
In the SEL record logged, the ED1 Offset value is “RAS Configuration Disabled”, and ED3 contains the RAS Mode that is currently
selected but could not be configured. ED2 gives the reason for the RAS configuration failure – at present, only two “RAS
Configuration Error Type” values are implemented:
70 Intel order number G90620-002 Revision 1.1
0 = None – This is used for an AC power-on log record when the RAS configuration is successfully configured.
3 = Invalid DIMM Configuration for RAS Mode – The installed DIMM configuration cannot support the currently selected RAS
Mode. This may be due to DIMMs that have failed or been disabled, so when this reason has been logged, the user
should check the preceding SEL events to see whether there are DIMM error events.
Table 58: Memory RAS Configuration Status Sensor Typical Characteristics
Page 81

System Event Log Troubleshooting Guide for EPSD Platforms Based on Intel® Xeon® Processor E5 4600/2600/2400/1600/1400 Product Families
Byte
Field
Description
13
Event Direction and
Event Type
[7] Event direction
0b = Assertion Event
1b = Deassertion Event
[6:0] Event Type = 09h (digital Discrete)
14
Event Data 1
[7:6] – 10b = OEM code in Event Data 2
[5:4] – 10b = OEM code in Event Data 3
[3:0] – Event Trigger Offset as described in Table 59
15
Event Data 2
RAS Configuration Error Type
[7:4] = Reserved
[3:0] = Configuration Error
0 = None
3 = Invalid DIMM Configuration for RAS Mode
All other values are reserved.
16
Event Data 3
RAS Mode Configured
[7:4] = Reserved
[3:0] = RAS Mode
0h = None (Independent Channel Mode)
1h = Mirroring Mode
2h = Lockstep Mode
4h = Rank Sparing Mode
Event Trigger Offset
Description
Next Steps
Hex
Description
01h
RAS configuration
enabled.
User enabled mirrored channel mode
in setup.
Informational event only.
00h
RAS configuration
disabled.
Mirrored channel mode is disabled
(either in setup or due to unavailability
of memory at post, in which case post
error 8500 is also logged).
1. If this event is accompanied by a post error 8500, there was a problem
applying the mirroring configuration to the memory. Check for other errors
related to the memory and troubleshoot accordingly.
2. If there is no post error, mirror mode was simply disabled in BIOS setup and
this should be considered informational only.
Memory Subsystem
Table 59: Memory RAS Configuration Status Sensor – Event Trigger Offset – Next Steps
Revision 1.1 Intel order number G90620-002 71
Page 82

Memory Subsystem
Byte
Field
Description
8 9 Generator ID
0001h = BIOS POST
11
Sensor Type
0ch = Memory
12
Sensor Number
12h
13
Event Direction and
Event Type
[7] Event direction
0b = Assertion Event
1b = Deassertion Event
[6:0] Event Type = 09h (digital Discrete)
14
Event Data 1
[7:6] – 10b = OEM code in Event Data 2
[5:4] – 10b = OEM code in Event Data 3
[3:0] – Event Trigger Offset
0h = RAS Configuration Disabled
1h = RAS Configuration Enabled
15
Event Data 2
Prior RAS Mode
[7:4] = Reserved
[3:0] = RAS Mode
0h = None (Independent Channel Mode)
1h = Mirroring Mode
2h = Lockstep Mode
4h = Rank Sparing Mode
System Event Log Troubleshooting Guide for EPSD Platforms Based on Intel® Xeon® Processor E5 4600/2600/2400/1600/1400 Product Families
7.2 Memory RAS Mode Select
Memory RAS Mode Select events are logged to record changes in RAS Mode.
When a RAS Mode selection is made that changes the RAS Mode (including selecting a RAS Mode from or to Independent Channel
Mode), that change is logged to SEL in a Memory RAS Mode Select event message, which records the previous RAS Mode (from)
and the newly selected RAS Mode (to). The event also includes an Offset value in ED1 which indicates whether the mode change
left the system with a RAS Mode active (Enabled), or not (Disabled – Independent Channel Mode selected).This sensor provides the
Spare Channel mode RAS Configuration status. Memory RAS Mode Select is an informational event.
Table 60: Memory RAS Mode Select Sensor Typical Characteristics
72 Intel order number G90620-002 Revision 1.1
Page 83

System Event Log Troubleshooting Guide for EPSD Platforms Based on Intel® Xeon® Processor E5 4600/2600/2400/1600/1400 Product Families
Byte
Field
Description
16
Event Data 3
Selected RAS Mode
[7:4] = Reserved
[3:0] = RAS Mode
0h = None (Independent Channel Mode)
1h = Mirroring Mode
2h = Lockstep Mode
4h = Rank Sparing Mode
Byte
Field
Description
8 9 Generator ID
0033h = BIOS SMI Handler
11
Sensor Type
0ch = Memory
12
Sensor Number
01h
13
Event Direction and
Event Type
[7] Event direction
0b = Assertion Event
1b = Deassertion Event
[6:0] Event Type = 0Bh (Generic Discrete)
14
Event Data 1
[7:6] – 10b = OEM code in Event Data 2
[5:4] – 10b = OEM code in Event Data 3
[3:0] – Event Trigger Offset
0h = Fully Redundant
2h = Redundancy Degraded
Memory Subsystem
7.3 Mirroring Redundancy State
Mirroring Mode protects memory data by full redundancy – keeping complete copies of all data on both channels of a Mirroring
Domain (channel pair). If an Uncorrectable Error, which is normally fatal, occurs on one channel of a pair, and the other channel is
still intact and operational, then the Uncorrectable Error is “demoted” to a Correctable Error, and the failed channel is disabled.
Because the Mirror Domain is no longer redundant, a Mirroring Redundancy State SEL Event is logged.
Table 61: Mirroring Redundancy State Sensor Typical Characteristics
Revision 1.1 Intel order number G90620-002 73
Page 84

Memory Subsystem
Byte
Field
Description
15
Event Data 2
Location
[7:4] = Mirroring Domain
0-1 = Channel Pair for Socket
[3:2] = Reserved
[1:0] = Rank on DIMM
0-3 = Rank Number
16
Event Data 3
Location
[7:5] = Socket ID
0-3 = CPU1-4
[4:3] = Channel
0-3 = Channel A-D for Socket
[2:0] = DIMM
0-2 = DIMM 1-3 on Channel
System Event Log Troubleshooting Guide for EPSD Platforms Based on Intel® Xeon® Processor E5 4600/2600/2400/1600/1400 Product Families
7.3.1 Mirroring Redundancy State Sensor – Next Steps
This event is accompanied by memory errors indicating the source of the issue. Troubleshoot accordingly (probably replace affected
DIMM).
For boards with DIMM Fault LEDs, the appropriate Fault LED is lit to indicate which DIMM was the source of the error triggering the
Mirroring Failover action, that is, the failing DIMM.
7.4 Sparing Redundancy State
Rank Sparing Mode is a Memory RAS configuration option that reserves one memory rank per channel as a “spare rank”. If any rank
on a given channel experiences enough Correctable ECC Errors to cross the Correctable Error Threshold, the data in that rank is
copied to the spare rank, and then the spare rank is mapped into the memory array to replace the failing rank.
Rank Sparing Mode protects memory data by reserving a “Spare Rank” on each channel that has memory installed on it. If a
Correctable Error Threshold event occurs, the data from the failing rank is copied to the Spare Rank on the same channel, and the
failing DIMM is disabled. Because the Sparing Domain is no longer redundant, a Sparing Redundancy State SEL Event is logged.
74 Intel order number G90620-002 Revision 1.1
Page 85

System Event Log Troubleshooting Guide for EPSD Platforms Based on Intel® Xeon® Processor E5 4600/2600/2400/1600/1400 Product Families
Byte
Field
Description
8 9 Generator ID
0033h = BIOS SMI Handler
11
Sensor Type
0ch = Memory
12
Sensor Number
11h
13
Event Direction and
Event Type
[7] Event direction
0b = Assertion Event
1b = Deassertion Event
[6:0] Event Type = 0Bh (Generic Discrete)
14
Event Data 1
[7:6] – 10b = OEM code in Event Data 2
[5:4] – 10b = OEM code in Event Data 3
[3:0] – Event Trigger Offset
0h = Fully Redundant
2h = Redundancy Degraded
15
Event Data 2
Location
[7:4] = Sparing Domain
0-3 = Channel A-D for Socket
[3:2] = Reserved
[1:0] = Rank on DIMM
0-3 = Rank Number
16
Event Data 3
Location
[7:5]= Socket ID
0-3 = CPU1-4
[4:3] = Channel
0-3 = Channel A-D for Socket
[2:0] = DIMM
0-2 = DIMM 1-3 on Channel
Table 62: Sparing Redundancy State Sensor Typical Characteristics
Memory Subsystem
Revision 1.1 Intel order number G90620-002 75
Page 86

Memory Subsystem
Byte
Field
Description
8 9 Generator ID
0033h = BIOS SMI Handler
11
Sensor Type
0ch = Memory
12
Sensor Number
02h
13
Event Direction and
Event Type
[7] Event direction
0b = Assertion Event
1b = Deassertion Event
[6:0] Event Type = 6Fh (Sensor Specific)
14
Event Data 1
[7:6] – 10b = OEM code in Event Data 2
System Event Log Troubleshooting Guide for EPSD Platforms Based on Intel® Xeon® Processor E5 4600/2600/2400/1600/1400 Product Families
7.4.1 Sparing Redundancy State Sensor – Next Steps
This event is accompanied by memory errors indicating the source of the issue. Troubleshoot accordingly (probably replace affected
DIMM).
For boards with DIMM Fault LEDs, the appropriate Fault LED is lit to indicate which DIMM was the source of the error triggering the
Mirroring Failover action, that is, the failing DIMM.
7.5 ECC and Address Parity
1. Memory data errors are logged as correctable or uncorrectable.
2. Uncorrectable errors are fatal.
3. Memory addresses are protected with parity bits and a parity error is logged. This is a fatal error.
7.5.1 Memory Correctable and Uncorrectable ECC Error
ECC errors are divided into Uncorrectable ECC Errors and Correctable ECC Errors. A “Correctable ECC Error” actually represents a
threshold overflow. More Correctable Errors are detected at the memory controller level for a given DIMM within a given timeframe.
In both cases, the error can be narrowed down to particular DIMM(s). The BIOS SMI error handler uses this information to log the
data to the BMC SEL and identify the failing DIMM module.
76 Intel order number G90620-002 Revision 1.1
Table 63: Correctable and Uncorrectable ECC Error Sensor Typical Characteristics
Page 87

System Event Log Troubleshooting Guide for EPSD Platforms Based on Intel® Xeon® Processor E5 4600/2600/2400/1600/1400 Product Families
Byte
Field
Description
[5:4] – 10b = OEM code in Event Data 3
[3:0] – Event Trigger Offset as described in Table 64
15
Event Data 2
[7:2] – Reserved. Set to 0.
[1:0] – Rank on DIMM
0-3 = Rank number
16
Event Data 3
[7:5] – Socket ID
0-3 = CPU1-4
[4:3] –Channel
0-3 = Chan A-D for Socket
[2:0] DIMM
0-2 = DIMM 1-3 on Channel
Event Trigger Offset
Description
Next Steps
Hex
Description
01h
Uncorrectable ECC
Error
An uncorrectable (multi-bit) ECC error has occurred. This
is a fatal issue that will typically lead to an OS crash
(unless memory has been configured in a RAS mode).
The system will generate a CATERR# (catastrophic error)
and an MCE (Machine Check Exception Error).
While the error may be due to a failing DRAM chip on the
DIMM, it can also be cause by incorrect seating or
improper contact between socket and DIMM, or by bent
pins in the processor socket.
1. If needed, decode DIMM location from hex version of SEL.
2. Verify the DIMM is seated properly.
3. Examine gold fingers on edge of the DIMM to verify
contacts are clean.
4. Inspect the processor socket this DIMM is connected to for
bent pins, and if found, replace the board.
5. Consider replacing the DIMM as a preventative measure.
For multiple occurrences, replace the DIMM.
00h
Correctable ECC
Error threshold
reached
There have been too many (10 or more) correctable ECC
errors for this particular DIMM since last boot. This event
in itself does not pose any direct problems because the
ECC errors are still being corrected. Depending on the
RAS configuration of the memory, the IMC may take the
affected DIMM offline.
Even though this event doesn't immediately lead to problems, it
can indicate one of the DIMM modules is slowly failing. If this
error occurs more than once:
1. If needed, decode DIMM location from hex version of SEL.
2. Verify the DIMM is seated properly.
3. Examine gold fingers on edge of the DIMM to verify
contacts are clean.
4. Inspect the processor socket this DIMM is connected to for
bent pins, and if found, replace the board.
Table 64: Correctable and Uncorrectable ECC Error Sensor Event Trigger Offset – Next Steps
Memory Subsystem
Revision 1.1 Intel order number G90620-002 77
Page 88

Memory Subsystem
Event Trigger Offset
Description
Next Steps
Hex
Description
5. Consider replacing the DIMM as a preventative measure.
For multiple occurrences, replace the DIMM.
Byte
Field
Description
8 9 Generator ID
0033h = BIOS SMI Handler
11
Sensor Type
0ch = Memory
12
Sensor Number
13h
13
Event Direction and
Event Type
[7] Event direction
0b = Assertion Event
1b = Deassertion Event
[6:0] Event Type = 6Fh (Sensor Specific)
14
Event Data 1
[7:6] – 10b = OEM code in Event Data 2
[5:4] – 10b = OEM code in Event Data 3
[3:0] – Event Trigger Offset = 2h
15
Event Data 2
[7:5] – Reserved. Set to 0.
[4] – Channel Information Validity Check:
0b = Channel Number in Event Data 3 Bits[4:3] is not valid
1b = Channel Number in Event Data 3 Bits[4:3] is valid
[3] – DIMM Information Validity Check:
0b = DIMM Slot ID in Event Data 3 Bits[2:0] is not valid
System Event Log Troubleshooting Guide for EPSD Platforms Based on Intel® Xeon® Processor E5 4600/2600/2400/1600/1400 Product Families
7.5.2 Memory Address Parity Error
Address Parity errors are errors detected in the memory addressing hardware. Because these affect the addressing of memory
contents, they can potentially lead to the same sort of failures as ECC errors. They are logged as a distinct type of error because
they affect memory addressing rather than memory contents, but otherwise they are treated exactly the same as Uncorrectable ECC
Errors. Address Parity errors are logged to the BMC SEL, with Event Data to identify the failing address by channel and DIMM to the
extent that it is possible to do so.
Table 65: Address Parity Error Sensor Typical Characteristics
78 Intel order number G90620-002 Revision 1.1
Page 89

System Event Log Troubleshooting Guide for EPSD Platforms Based on Intel® Xeon® Processor E5 4600/2600/2400/1600/1400 Product Families
Byte
Field
Description
1b = DIMM Slot ID in Event Data 3 Bits[2:0] is valid
[2:0] – Error Type:
000b = Parity Error Type not known
001b = Data Parity Error (not used)
010b = Address Parity Error
All other values are reserved.
16
Event Data 3
[7:5] – Indicates the Processor Socket to which the DDR3 DIMM having the ECC error is attached:
0-3 = CPU1-4
All other values are reserved.
[4:3] – Channel Number (if valid) on which the Parity Error occurred. This value will be indeterminate and should be ignored if ED2
Bit [4] is 0b.
00b = Channel A
01b = Channel B
10b = Channel C
11b = Channel D
[2:0] – DIMM Slot ID (if valid) of the specific DIMM that was involved in the transaction that led to the parity error. This value will
be indeterminate and should be ignored if ED2 Bit [3] is 0b.
000b = DIMM Socket 1
001b = DIMM Socket 2
010b = DIMM Socket 3
All other values are reserved.
Memory Subsystem
7.5.2.1 Memory Address Parity Error Sensor – Next Steps
These are bit errors that are detected in the memory addressing hardware. An Address Parity Error implies that the memory address
transmitted to the DIMM addressing circuitry has been compromised, and data read or written is compromised in turn. An Address
Parity Error is logged as such in SEL but in all other ways is treated the same as an Uncorrectable ECC Error.
While the error may be due to a failing DRAM chip on the DIMM, it can also be cause by incorrect seating or improper contact
between the socket and DIMM, or by the bent pins in the processor socket.
1. If needed, decode DIMM location from hex version of SEL.
2. Verify the DIMM is seated properly.
3. Examine gold fingers on edge of the DIMM to verify contacts are clean.
Revision 1.1 Intel order number G90620-002 79
Page 90

Memory Subsystem
System Event Log Troubleshooting Guide for EPSD Platforms Based on Intel® Xeon® Processor E5 4600/2600/2400/1600/1400 Product Families
4. Inspect the processor socket this DIMM is connected to for bent pins, and if found, replace the board.
5. Consider replacing the DIMM as a preventative measure. For multiple occurrences, replace the DIMM.
80 Intel order number G90620-002 Revision 1.1
Page 91

System Event Log Troubleshooting Guide for EPSD Platforms Based on Intel® Xeon® Processor E5 4600/2600/2400/1600/1400 Product Families
Byte
Field
Description
8 9 Generator ID
0033h = BIOS SMI Handler
11
Sensor Type
13h = Critical Interrupt
12
Sensor Number
03h
13
Event Direction and
Event Type
[7] Event direction
0b = Assertion Event
1b = Deassertion Event
[6:0] Event Type = 6Fh (Sensor Specific)
14
Event Data 1
[7:6] – 10b = OEM code in Event Data 2
[5:4] – 10b = OEM code in Event Data 3
[3:0] – Event Trigger Offset
PCI Express* and Legacy PCI Subsystem
8. PCI Express* and Legacy PCI Subsystem
The PCI Express* (PCIe) Specification defines standard error types under the Advanced Error Reporting (AER) capabilities. The
BIOS logs AER events into the SEL.
The Legacy PCI Specification error types are PERR and SERR. These errors are supported and logged into the SEL.
8.1 PCI Express* Errors
PCIe error events are either correctable (informational event) or fatal. In both cases information is logged to help identify the source
of the PCIe error and the bus, device, and function is included in the extended data fields. The PCIe devices are mapped in the
operating system by bus, device, and function. Each device is uniquely identified by the bus, device, and function. PCIe device
information can be found in the operating system.
8.1.1 Legacy PCI Errors
Legacy PCI errors include PERR and SERR; both are fatal errors.
Revision 1.1 Intel order number G90620-002 81
Table 66: Legacy PCI Error Sensor Typical Characteristics
Page 92

PCI Express* and Legacy PCI Subsystem
Byte
Field
Description
4h = PCI PERR
5h = PCI SERR
15
Event Data 2
PCI Bus number
16
Event Data 3
[7:3] – PCI Device number
[2:0] – PCI Function number
Byte
Field
Description
8 9 Generator ID
0033h = BIOS SMI Handler
11
Sensor Type
13h = Critical Interrupt
12
Sensor Number
04h
13
Event Direction and
Event Type
[7] Event direction
0b = Assertion Event
1b = Deassertion Event
[6:0] Event Type = 70h (OEM Specific)
System Event Log Troubleshooting Guide for EPSD Platforms Based on Intel® Xeon® Processor E5 4600/2600/2400/1600/1400 Product Families
8.1.1.1 Legacy PCI Error Sensor – Next Steps
1. Decode the bus, device, and function to identify the card.
2. If this is an add-in card:
a. Verify the card is inserted properly.
b. Install the card in another slot and check whether the error follows the card or stays with the slot.
c. Update all firmware and drivers, including non-Intel components.
3. If this is an on-board device:
a. Update all BIOS, firmware, and drivers.
b. Replace the board.
8.1.2 PCI Express* Fatal Errors and Fatal Error #2
When a PCI Express* fatal error is reported to the BIOS SMI handler, it will record the error using the following format.
82 Intel order number G90620-002 Revision 1.1
Table 67: PCI Express* Fatal Error Sensor Typical Characteristics
Page 93

System Event Log Troubleshooting Guide for EPSD Platforms Based on Intel® Xeon® Processor E5 4600/2600/2400/1600/1400 Product Families
Byte
Field
Description
14
Event Data 1
[7:6] – 10b = OEM code in Event Data 2
[5:4] – 10b = OEM code in Event Data 3
[3:0] – Event Trigger
0h = Data Link Layer Protocol Error
1h = Surprise Link Down Error
2h = Completer Abort
3h = Unsupported Request
4h = Poisoned TLP
5h = Flow Control Protocol
6h = Completion Timeout
7h = Receiver Buffer Overflow
8h = ACS Violation
9h = Malformed TLP
Ah = ECRC Error
Bh = Received Fatal Message From Downstream
Ch = Unexpected Completion
Dh = Received ERR_NONFATAL Message
Eh = Uncorrectable Internal
Fh = MC Blocked TLP
15
Event Data 2
PCI Bus number
16
Event Data 3
[7:3] – PCI Device number
[2:0] – PCI Function number
Byte
Field
Description
8 9 Generator ID
0033h = BIOS SMI Handler
11
Sensor Type
13h = Critical Interrupt
PCI Express* and Legacy PCI Subsystem
The PCI Express* Fatal Error #2 is a continuation of the PCI Express* Fatal Error.
Revision 1.1 Intel order number G90620-002 83
Table 68: PCI Express* Fatal Error #2 Sensor Typical Characteristics
Page 94

PCI Express* and Legacy PCI Subsystem
Byte
Field
Description
12
Sensor Number
14h
13
Event Direction and
Event Type
[7] Event direction
0b = Assertion Event
1b = Deassertion Event
[6:0] Event Type = 76h (OEM Specific)
14
Event Data 1
[7:6] – 10b = OEM code in Event Data 2
[5:4] – 10b = OEM code in Event Data 3
[3:0] – Event Trigger Offset
0h = Atomic Egress Blocked
1h = TLP Prefix Blocked
Fh = Unspecified Non-AER Fatal Error
15
Event Data 2
PCI Bus number
16
Event Data 3
[7:3] – PCI Device number
[2:0] – PCI Function number
System Event Log Troubleshooting Guide for EPSD Platforms Based on Intel® Xeon® Processor E5 4600/2600/2400/1600/1400 Product Families
8.1.2.1 PCI Express* Fatal Error and Fatal Error #2 Sensor – Next Steps
1. Decode the bus, device, and function to identify the card.
2. If this is an add-in card:
a. Verify the card is inserted properly.
b. Install the card in another slot and check whether the error follows the card or stays with the slot.
c. Update all firmware and drivers, including non-Intel components.
3. If this is an on-board device:
a. Update all BIOS, firmware, and drivers.
b. Replace the board.
8.1.3 PCI Express* Correctable Errors
When a PCI Express* correctable error is reported to the BIOS SMI handler, it will record the error using the following format.
84 Intel order number G90620-002 Revision 1.1
Page 95

System Event Log Troubleshooting Guide for EPSD Platforms Based on Intel® Xeon® Processor E5 4600/2600/2400/1600/1400 Product Families
Byte
Field
Description
8 9 Generator ID
0033h = BIOS SMI Handler
11
Sensor Type
13h = Critical Interrupt
12
Sensor Number
05h
13
Event Direction and
Event Type
[7] Event direction
0b = Assertion Event
1b = Deassertion Event
[6:0] Event Type = 71h (OEM Specific)
14
Event Data 1
[7:6] – 10b = OEM code in Event Data 2
[5:4] – 10b = OEM code in Event Data 3
[3:0] – Event Trigger Offset
0h = Receiver Error
1h = Bad DLLP
2h = Bad TLP
3h = Replay Num Rollover
4h = Replay Timer timeout
5h = Advisory Non-fatal
6h = Link BW Changed
7h = Correctable Internal
8h = Header Log Overflow
Fh = Unspecified Non-AER Correctable Error
15
Event Data 2
PCI Bus number
16
Event Data 3
[7:3] – PCI Device number
[2:0] – PCI Function number
PCI Express* and Legacy PCI Subsystem
Table 69: PCI Express* Correctable Error Sensor Typical Characteristics
Revision 1.1 Intel order number G90620-002 85
Page 96

PCI Express* and Legacy PCI Subsystem
System Event Log Troubleshooting Guide for EPSD Platforms Based on Intel® Xeon® Processor E5 4600/2600/2400/1600/1400 Product Families
8.1.3.1 PCI Express* Correctable Error Sensor – Next Steps
This is an informational event only. Correctable errors are acceptable and normal at a low rate of occurrence. If the error continues:
1. Decode the bus, device, and function to identify the card.
2. If this is an add-in card:
a. Verify the card is inserted properly.
b. Install the card in another slot and check whether the error follows the card or stays with the slot.
c. Update all firmware and drivers, including non-Intel components.
3. If this is an on-board device:
a. Update all BIOS, firmware, and drivers.
b. Replace the board.
86 Intel order number G90620-002 Revision 1.1
Page 97

System Event Log Troubleshooting Guide for EPSD Platforms Based on Intel® Xeon® Processor E5 4600/2600/2400/1600/1400 Product Families
System BIOS Events
9. System BIOS Events
There are a number of events that are owned by the system BIOS. These events can occur during Power On Self Test (POST) or
when coming out of a sleep state. Not all of these events signify errors. Some events are described in other chapters in this
document (for example, memory events).
9.1 System Events
These events can occur during POST or when coming out of a sleep state. These are informational events only.
1. When logging events during BIOS POST uses generator ID 0001h.
2. When logging events during BIOS SMI Handler uses generator ID 0033h.
9.1.1 System Boot
At the end of POST, just before the actual OS boot occurs, a System Boot Event is logged. This basically serves to mark the
transition of control from completed POST to OS Loader. It is an informational only event.
9.1.2 Timestamp Clock Synchronization
These events are used when the time between the BIOS and the BMC is synchronized. Two events are logged. The BIOS does the
first one to send the time synch message to the BMC for synchronization, and the timestamp that message gets is unknown, that is,
the timestamp in the log can be anything because it gets the "before" timestamp.
So the BIOS sends a second time synch message to get a "baseline" correct timestamp in the log. That is the "starting time".
For example, say that the time the BMC has is March 1, 2011 21:00. The BIOS time synch updates that to the same date, 21:20 (the
BMC was running behind). Without that second time synch message, you don't know that the log time jumped ahead, and when you
get the next log message it looks like there was a 20-min delay during the boot for some unknown reasons.
Without that second time synch message, the time span to the next logged message is indeterminate. With the second time synch as
a baseline, the following log timestamps are always determinate.
Revision 1.1 Intel order number G90620-002 87
Page 98

System BIOS Events
Byte
Field
Description
8 9 Generator ID
0001h = BIOS POST
0033h = BIOS SMI Handler
11
Sensor Type
12h = System Event
12
Sensor Number
83h
13
Event Direction and
Event Type
[7] Event direction
0b = Assertion Event
1b = Deassertion Event
[6:0] Event Type = 6Fh (Sensor Specific)
14
Event Data 1
[7:6] – 00b = Unspecified Event Data 2
[5:4] – 00b = Unspecified Event Data 3
[3:0] – Event Trigger Offset
01h = System Boot
05h = Timestamp Clock Synchronization
15
Event Data 2
For Event Trigger Offset 05h only (Timestamp Clock
Synchronization)
00h = 1st in pair
80h = 2nd in pair
16
Event Data 3
Not used
System Event Log Troubleshooting Guide for EPSD Platforms Based on Intel® Xeon® Processor E5 4600/2600/2400/1600/1400 Product Families
The timestamp clock synchronization is run and the events are logged by the BIOS POST every time the system boots. In addition
during the shutdown from some Operating Systems the BIOS SMI Handler is called to run timestamp clock synchronization and log
the events.
Table 70: System Event Sensor Typical Characteristics
88 Intel order number G90620-002 Revision 1.1
Page 99

System Event Log Troubleshooting Guide for EPSD Platforms Based on Intel® Xeon® Processor E5 4600/2600/2400/1600/1400 Product Families
Byte
Field
Description
8 9 Generator ID
0001h = BIOS POST
11
Sensor Type
0Fh = System Firmware Progress (formerly POST Error)
12
Sensor Number
06h
13
Event Direction and
Event Type
[7] Event direction
0b = Assertion Event
1b = Deassertion Event
[6:0] Event Type = 6Fh (Sensor Specific)
14
Event Data 1
[7:6] – 10b = OEM code in Event Data 2
[5:4] – 10b = OEM code in Event Data 3
[3:0] – Event Trigger Offset = 0h
15
Event Data 2
Low Byte of POST Error Code
16
Event Data 3
High Byte of POST Error Code
System BIOS Events
9.2 System Firmware Progress (Formerly Post Error)
The BIOS logs any POST errors to the SEL. The 2-byte POST code gets logged in the ED2 and ED3 bytes in the SEL entry. This
event will be logged every time a POST error is displayed. Even though this event indicates an error, it may not be a fatal error. If this
is a serious error, there will typically also be a corresponding SEL entry logged for whatever was the cause of the error – this event
may contain more information about what happened than the POST error event.
Table 71: POST Error Sensor Typical Characteristics
9.2.1 System Firmware Progress (Formerly Post Error) – Next Steps
See the following table for POST Error Codes.
Revision 1.1 Intel order number G90620-002 89
Page 100

System BIOS Events
Error Code
Error Message
Response
0012
System RTC date/time not set
Major
0048
Password check failed
Major
0140
PCI component encountered a PERR error
Major
0141
PCI resource conflict
Major
0146
PCI out of resources error
Major
0191
Processor core/thread count mismatch detected
Fatal
0192
Processor cache size mismatch detected
Fatal
0194
Processor family mismatch detected
Fatal
0195
Processor Intel(R) QPI link frequencies unable to synchronize
Fatal
0196
Processor model mismatch detected
Fatal
0197
Processor frequencies unable to synchronize
Fatal
5220
BIOS Settings reset to default settings
Major
5221
Passwords cleared by jumper
Major
5224
Password clear jumper is Set
Major
8130
Processor 01 disabled
Major
8131
Processor 02 disabled
Major
8132
Processor 03 disabled
Major
8133
Processor 04 disabled
Major
8160
Processor 01 unable to apply microcode update
Major
8161
Processor 02 unable to apply microcode update
Major
8162
Processor 03 unable to apply microcode update
Major
8163
Processor 04 unable to apply microcode update
Major
8170
Processor 01 failed Self Test (BIST)
Major
8171
Processor 02 failed Self Test (BIST)
Major
8172
Processor 03 failed Self Test (BIST)
Major
8173
Processor 04 failed Self Test (BIST)
Major
8180
Processor 01 microcode update not found
Minor
8181
Processor 02 microcode update not found
Minor
8182
Processor 03 microcode update not found
Minor
8183
Processor 04 microcode update not found
Minor
System Event Log Troubleshooting Guide for EPSD Platforms Based on Intel® Xeon® Processor E5 4600/2600/2400/1600/1400 Product Families
Table 72: POST Error Codes
90 Intel order number G90620-002 Revision 1.1
 Loading...