

Page 1

Operat or Manua l
EA 400
Single beam hydrographic echo sounder
(CD6562a)
Page 2

Page 3

857-160981
EA 400
Single beam hydrographic echo
sounder
Operator manual
Page 4

About this document
Rev Date Written by Checked by Approved by
J
18.12.06 ASM TKj TKj
General updates. New software version 2.3.0.x implemented.
© 2006 Kongsberg Maritime AS. All rights reserved.
No part of this work covered by the copyright hereon may be reproduced or otherwise
copied without prior permission from Kongsberg Maritime AS.
The information contained in this document is subject to change without prior notice.
Kongsberg Maritime AS shall not be liable for errors contained herein, or for incidental
or consequential damages in connection with the furnishing, performance, or use of this
document.
Strandpro m enaden 50
P.O.Box 111
N-3191 Horten,
Norway
Page 5

Chapters
1 System description
This chapter presents a general description of the echo sounder system. Refer
to page 1.
2Displayviews
This chapterexplains the layoutof the echosounder displaypresentation. Refer
to page 24.
3 Getting started
This chapter provides an operational example to get you started with the
operation. Refer to page 40.
4 Operational procedures
Operator manual
This chapter provides specific procedures for common tasks. Refer to page 50.
5 Reference guide
This chapter explains the menus and dialogue boxes in detail. Refer to page 74.
6 Sound Velocity Profile (SVP) Editor
This chapter describes how to use the sound velocity profile editor. Refer to
page 163.
7 EA2Neptune
This chapter explains how to use the EA2Neptune conversion utility.
Refer to page 172.
8 Data and telegram formats
This chapter explains the file and directory names, as well as t he various input
and output telegrams. Refer to page 174.
857-160981 / J
I
Page 6

EA 400
II
857-160981 / J
Page 7

Operator manual
SYSTEM DESCRIPTION 1......................................
Introduction 1..................................................
System overview 2..............................................
Key facts 2...............................................
Main units 2..............................................
System diagrams 4...............................................
Wave propagation 9..............................................
Bottom echo 11..................................................
Sidescan 13.....................................................
Observation range 14..............................................
Technical specifications 15.........................................
Portable echo sounder system 16...............................
Echosounder system 17......................................
External interfaces 18........................................
General Purpose Tra nsceiver (GPT) 19..........................
Processor Unit 20...........................................
Operator Station 21.........................................
PC for Portable system 22....................................
Ethernet HUB 23...........................................
DISPLAY VIEWS 24..............................................
Introduction 24..................................................
Display organisation 25............................................
Main view 25..............................................
Moving the boundary lines 26.................................
Direct access to dialogue boxes 27.............................
”Hidden views” overview 27..................................
Menu bar 29.....................................................
Header view 30..................................................
Echo frames 31..................................................
Overview 31...............................................
Echogram and Range 32.....................................
Scope 33..................................................
Test presentation for passive or test mode 33.....................
Sidescan 34................................................
Status bar 36....................................................
History and printer views 37........................................
Overview 37...............................................
Display example 37.........................................
857-160981 / J
III
Page 8

EA 400
Printer example 38..........................................
GETTING STARTED 40...........................................
Introduction 40..................................................
Before you start 41...............................................
Start--up 42.....................................................
Overview 42...............................................
Power-up procedure 42......................................
The menu system 42........................................
Transceiver inspection 42.....................................
Environmental parameters 42..................................
Navigation interface 43......................................
Additional interfaces 43......................................
Operation 44....................................................
Overview 44...............................................
Selecting operational mode 44.................................
Transceiver settings 44.......................................
Bottom detector settings 45...................................
Colour scale 45.............................................
Echogram and Range view 45.................................
Scope view 47.............................................
Data storage 48..................................................
Overview 48...............................................
Define storage parameters 48..................................
Start and stop data storage 48..................................
OPERATIONAL PROCEDURES 50................................
Overview 50....................................................
Power on/off 51..................................................
Power on 51...............................................
Power off 51...............................................
Basic operations 53...............................................
Overview 53...............................................
Changing the echogram settings 53.............................
Changing the range 53.......................................
Changing the vertical resolution 54.............................
Changing the transmit power 54...............................
Setting minimum and maximum depth 55........................
Enabling the depth alarms 55..................................
Adding annotations 56.......................................
Transceiver installation 58..........................................
IV
857-160981 / J
Page 9

Operator manual
Overview 58...............................................
To install a channel 58.......................................
To uninstall a channel 58.....................................
To modify an IP address 59...................................
Restart the echo sounder 59...................................
Record and playback 60...........................................
Overview 60...............................................
Record 60.................................................
Playback 62...............................................
History 63.................................................
Software installation and upgrades 67.................................
Overview 67...............................................
Software installation procedure 67..............................
Software upgrade procedure 67................................
Un-installation procedure 68..................................
Licence installation 68.......................................
Sensor setup 69..................................................
Overview 69...............................................
The theory 69..............................................
Procedure 70...............................................
Sidescan 71.....................................................
Overview 71...............................................
Starting a sidescan survey 71..................................
Insert label name 72.........................................
Superimpose the current depth 72..............................
Finishing the sidescan survey 73...............................
REFERENCE GUIDE 74...........................................
Overview 74....................................................
Menus 75.......................................................
Main menu 75.............................................
File menu 76...............................................
View menu 77.............................................
Options menu 78...........................................
Interfaces menu 80..........................................
Install menu 81.............................................
Help menu 82..............................................
Status Bar 83....................................................
Dialogue boxes 85................................................
Introduction 85.............................................
857-160981 / J
V
Page 10

EA 400
Advanced Navigation 86.....................................
Advanced Transceiver 88.....................................
Annotation 90..............................................
Bottom Detector 93.........................................
Bottom Range 95...........................................
Colour Scale 96............................................
Depth Output 98............................................
Echogram 100..............................................
Echogram parameters 104.....................................
Environment 105............................................
Exit 108...................................................
Factory settings 109..........................................
Heading 110................................................
Heave Sensor 111............................................
History 114.................................................
GPT IP Address 115.........................................
Language 117...............................................
Layout 118.................................................
Load user settings 119........................................
Navigation Interface 120......................................
Network Interface 123........................................
Operation 126...............................................
Printer and History 129.......................................
Print Setup 131..............................................
Raw Data 133...............................................
Remote Display 134..........................................
Replay 136.................................................
Replay control 138...........................................
Reprocess heave 139.........................................
RS-232 Setup 141...........................................
Sensor setup 142............................................
Serial Interface 143..........................................
Sidescan Range 146..........................................
Status window 147...........................................
Store 148..................................................
Store user settings 152........................................
Surface Range 154...........................................
Real time Sound Velocity Profile (SVP) smart sensor 155............
Sound Velocity Profile (SVP) Editor 156.........................
Temperature Sensor 157.......................................
VI
857-160981 / J
Page 11

Operator manual
Transceiver Installation 158....................................
Transceiver Settings 160......................................
SVP EDITOR 163..................................................
Introduction 163..................................................
Description 164...................................................
Purpose 164................................................
Toolbar 164................................................
Profile view 165.............................................
Data view 165..............................................
Profile name 165............................................
Control bar 165.............................................
File formats 166.............................................
Procedures 167...................................................
Windows 167...............................................
Starting the editor 167........................................
Exit 167...................................................
Open existing profile 167......................................
Create new profile 167........................................
Save profile 168.............................................
Modifying a profile 168.......................................
Zoom and pan 169...........................................
References 170...................................................
Toolbar, left 170.............................................
Toolbar, bottom 171..........................................
EA2NEPTUNE 172.................................................
Introduction 172.............................................
Use 172....................................................
Datagrams description 173.....................................
TELEGRAM AND DATA FORMATS 174............................
Overview 174....................................................
Numeric presentation 175.....................................
Data encapsulation 176.......................................
File and directory names 177...................................
Raw data format 179.........................................
Out data file 183.............................................
xyz data file 186.............................................
857-160981 / J
VII
Page 12

EA 400
Echogram data file 188.......................................
NMEA datagrams 189........................................
Annotation datagram 192......................................
Remote Control datagram 193..................................
Tide datagram (real time draft) 194..............................
Output datagrams 195........................................
Echogram datagram 200.......................................
Status datagram 201..........................................
Georef Output datagram 202...................................
Navigation Output datagram 204................................
Motion Sensor datagram 205...................................
Sound Speed datagrams 206...................................
Sound speed output 210.......................................
Attitude 211................................................
Temperature sensor - output 215................................
VIII
857-160981 / J
Page 13

SYSTEM DESCRIPTION
Introduction
This chapter provides a brief introduction to the EA 400
hydrographic echosounder system.
Topics
→ Overview, page 2
→ System drawing, page 4
→ Wave propagation, page 9
→ Bottom echo, page 11
→ Sidescan, page 13
→ Observation range, page 14
→ Technical specifications, page 15
System description
Important notice
Windows NT, Windows 2000, Windows XP and Windows are
either registered trademarks or trademarks of Microsoft
Corporation in the United States and/or other countries.
Echosounder software version
This manual complies to echo sounder software version 2.3.0.x.
857-160981 / J
1
Page 14

EA 400
System overview
Key facts
The EA 400 is a single or multi frequency echo sounder
designed for the professional hydrography community. It can
operate with maximum four frequency channels simultanously.
• The EA 400 system is flexible and easy to configure due to
the modular design.
• The EA 400 is available in two versions. The standard EA
400 system uses a 15 inch LCD with integrated computer,
while the EA 400SP are portable systems.
• The complete EA 400SP is housed in a small rugged
suitcase, IP rated to IP56. It can be operated from a standard
car battery. The power consumption is low. All connections
are made through plugs at one side of the suitcase.
• Echo sounders ranging from relatively low-cost single beam
to large multi-frequency systems can be realised.
• Menus and dialogue boxes are operated with a standard
computer mouse and keyboard.
• Large colour liquid crystal displays (LCD) are used. A
standard computer mouse may be used.
• The EA 400 uses the Microsoft Windows® display interface.
Operation is to a large extent self-explanatory. Getting started
is easy if you are familiar with standard Microsoft
Windows® programs.
• A store/replay function reduces the need for echogram
printout on paper. The unprocessed transducer signal is
recorded on the internal harddisk. During replay, this signal
is injected into the EA 400 processing software as if it
arrived directly from the transceiver.
Main units
The standard EA 400 hydrographic echo sounder consists of one
or more transducers, a General Purpose Transceiver (GPT) and
an LCD unit with integrated computer.
• Transducers are available at frequencies ranging from 38 to
710 kHz.
2
857-160981 / J
Page 15

System description
• The General Purpose Transceiver (GPT) contains transmitter
and receiver electronics. It can be configured for single beam
operation. The receivers are designed for low noise, and they
can handle input signals spanning a very large instantaneous
dynamic amplitude range of 160 dB. All targets are correctly
measured and displayed. Output transmit power per
frequency channel is maximum 2 kW per channel.
• A twisted pair Ethernet cable connects the General Purpose
Transceiver (GPT) with the computer. The distance between
the computer and the GPT can be extended up to 100 meters.
• If more than one transceiver is used, a small Ethernet HUB
or switch is used to connect the General Purpose Transceivers
to the computer.
• Most of the echo sounder functions are implemented in
software. The bottom detection algorithm is implemented
solely in software with separate computation for each
frequency channel.
• When a portable computer is used, the power output is
maximum 1 kW per channel (Optionally, 2 kW is available).
• A rugged and/or splash proof suitcase houses the portable
version, this suitcase contains both the computer and the
General Purpose Transceiver (GPT). The GPT can be
operated from a standard car battery (+12 Vdc) . The PC to
be run from internal battery if the system should maintain the
IP rate.
• Interfaces are provided for depth telegram output as well as
navigation data, temperature sensor and motion sensor inputs.
An external push button may be connected for manually start
and stop of the survey lines.
• An external push button may be added for manual control of
the event triggering.
• Socket interface is included. To run the EA 400 software and
other software (for example survey- or classification
software) on the same computer, this socket interface is
required for data transmission between the software
packages.
857-160981 / J
3
Page 16

EA 400
System diagrams
The following system diagrams are provided:
• EA 400 with one transceiver
• EA 400 with two transceivers
• EA 400 with Hydrographic Operator Station (HOS) and two
transceivers
• EA 400SP portable system
4
857-160981 / J
Page 17
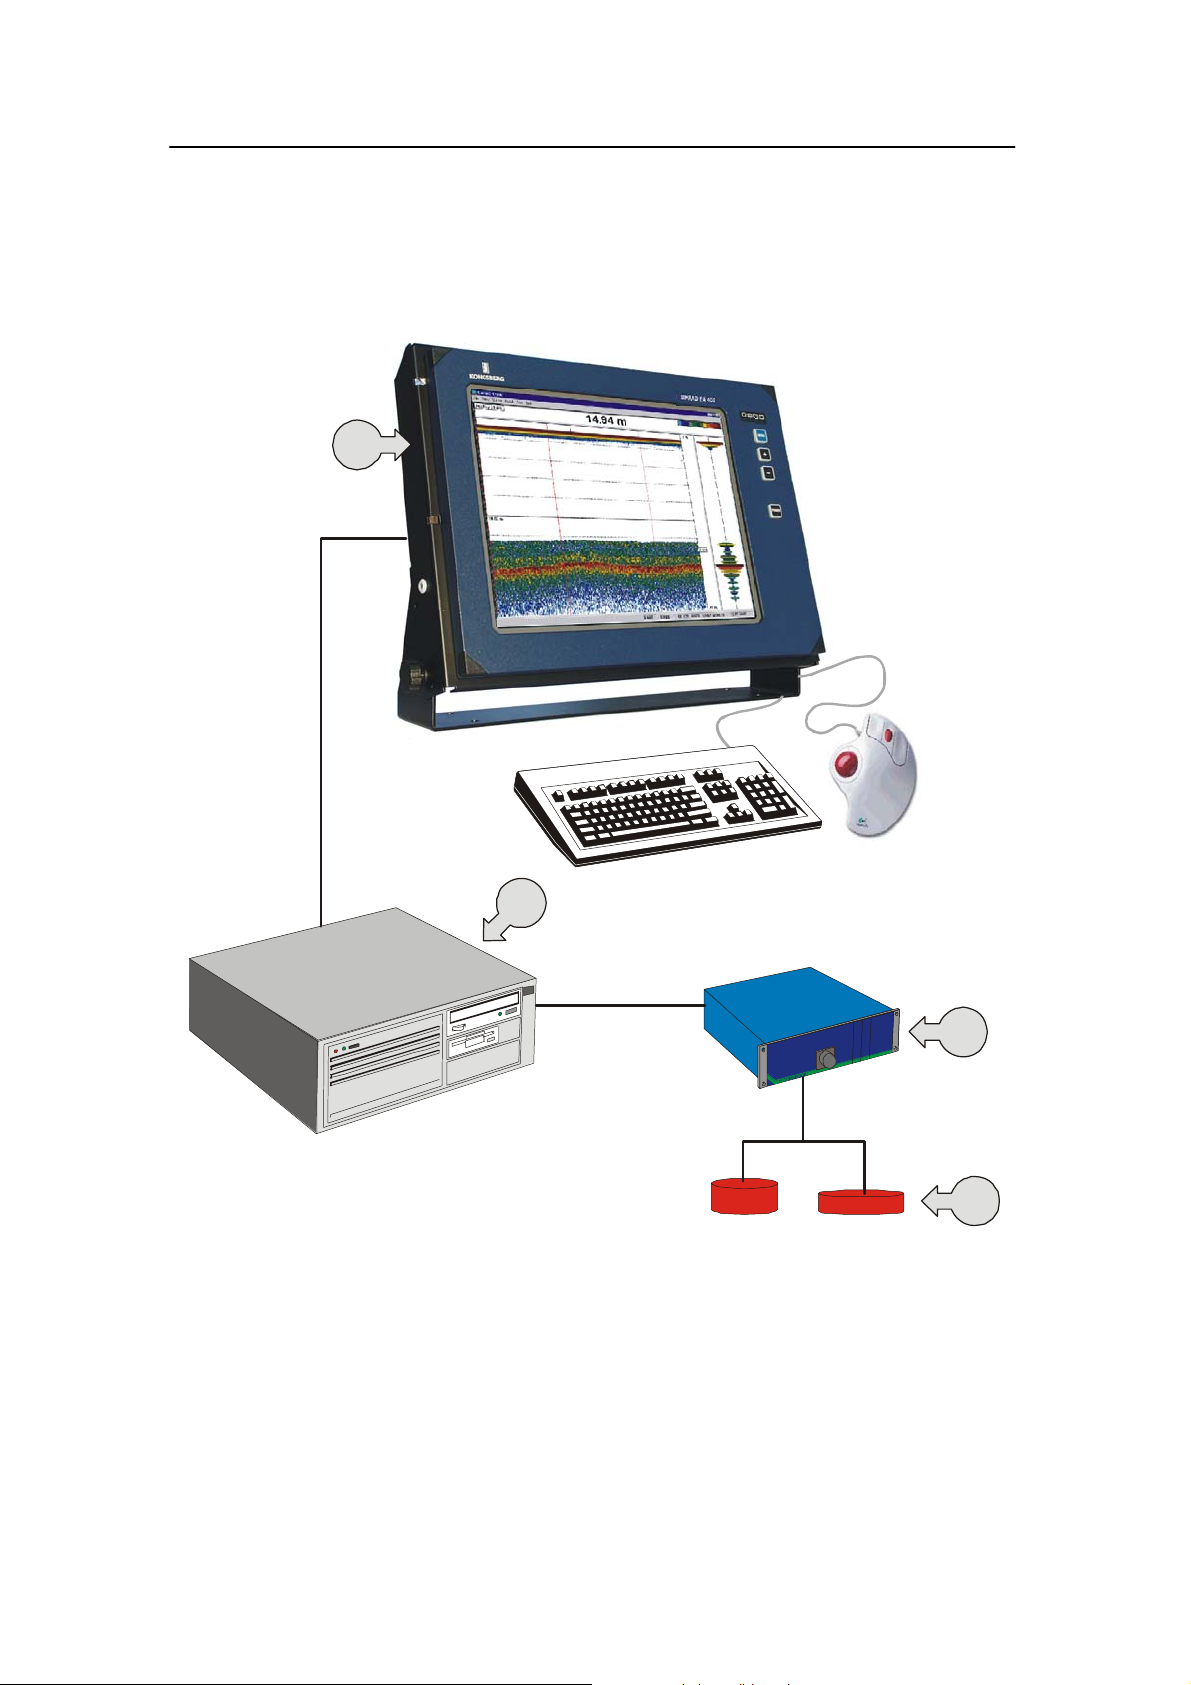
System description
System diagram with one transceiver
1) Display unit 2) Processor unit 3) General Purpose Tr ansceiver (GPT) 4) Transducers
1
(CD5014G)
2
857-160981 / J
3
4
5
Page 18
EA 400
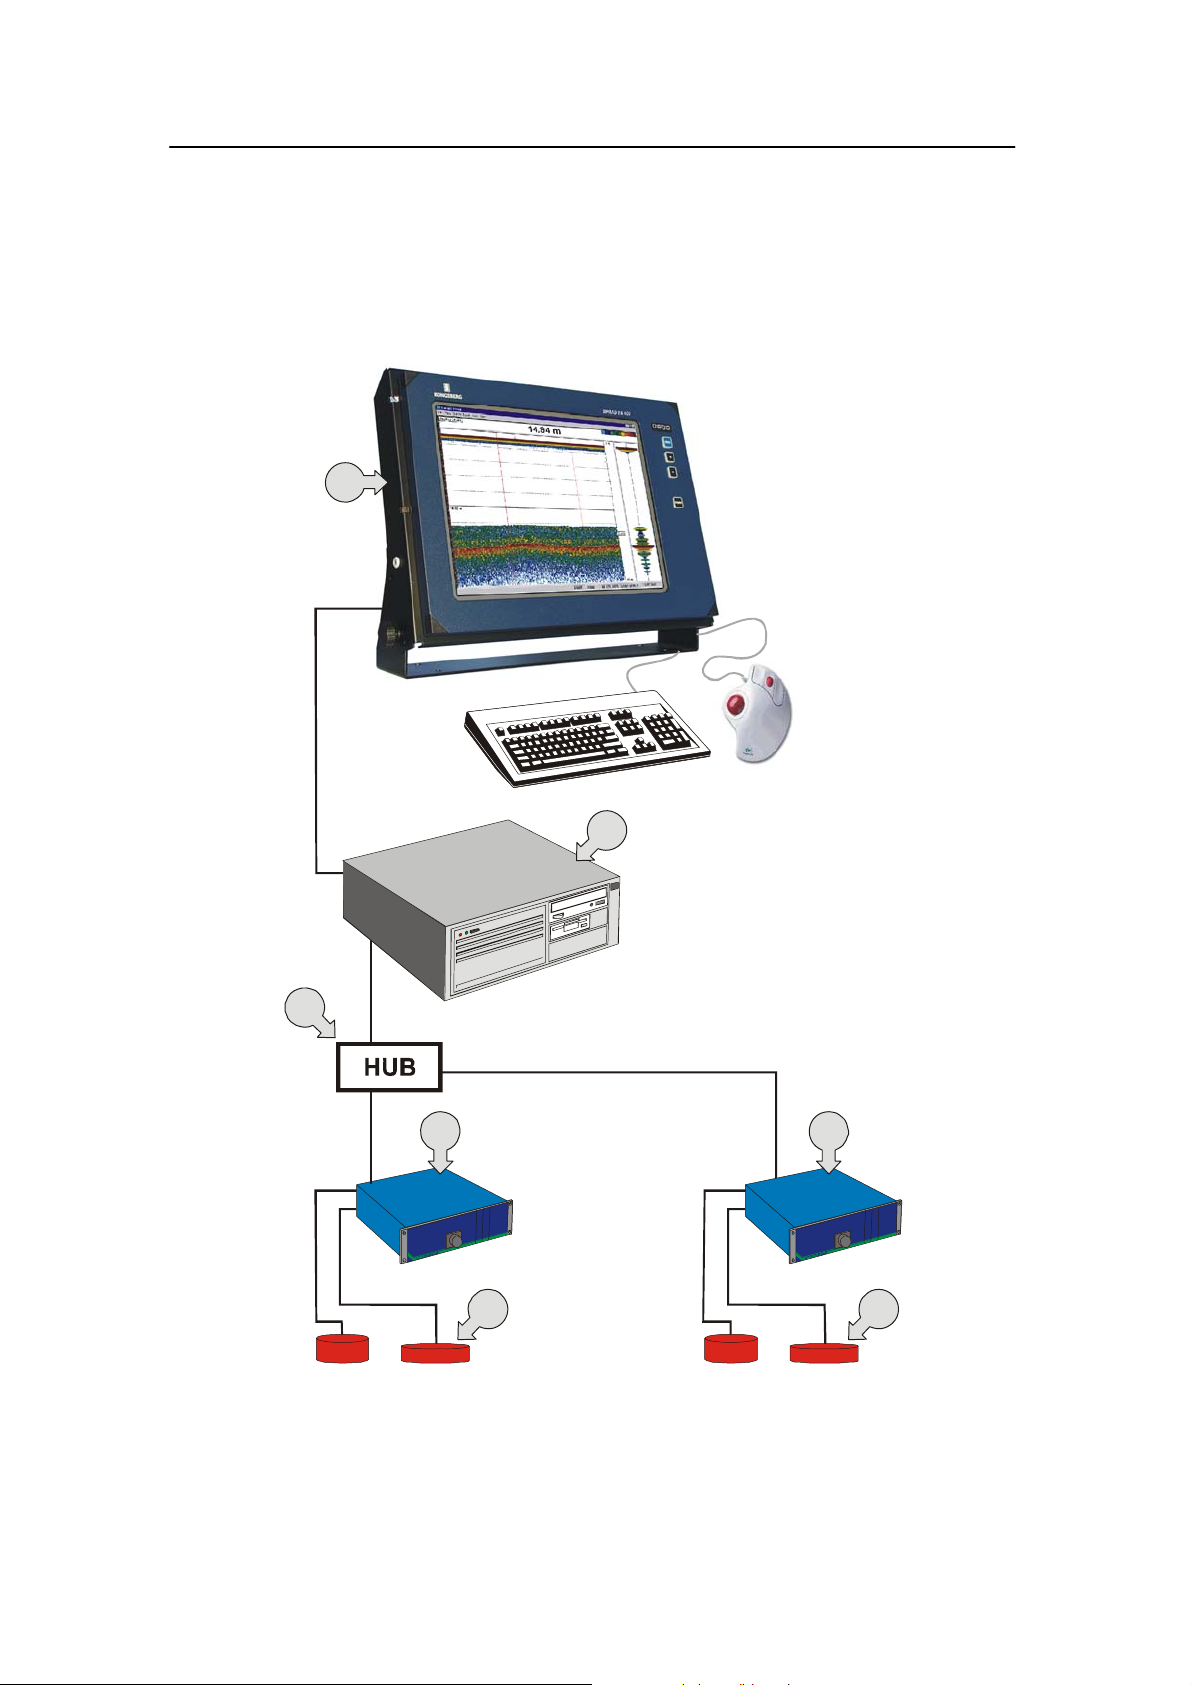
System diagram with two transceivers
1) Display unit 2) Processor unit 3) General Purpose Transceiver (GPT)
4) Transducers 5) Ethernet HUB or switch
1
5
2
(CD5014H)
33
44
6
857-160981 / J
Page 19
System description
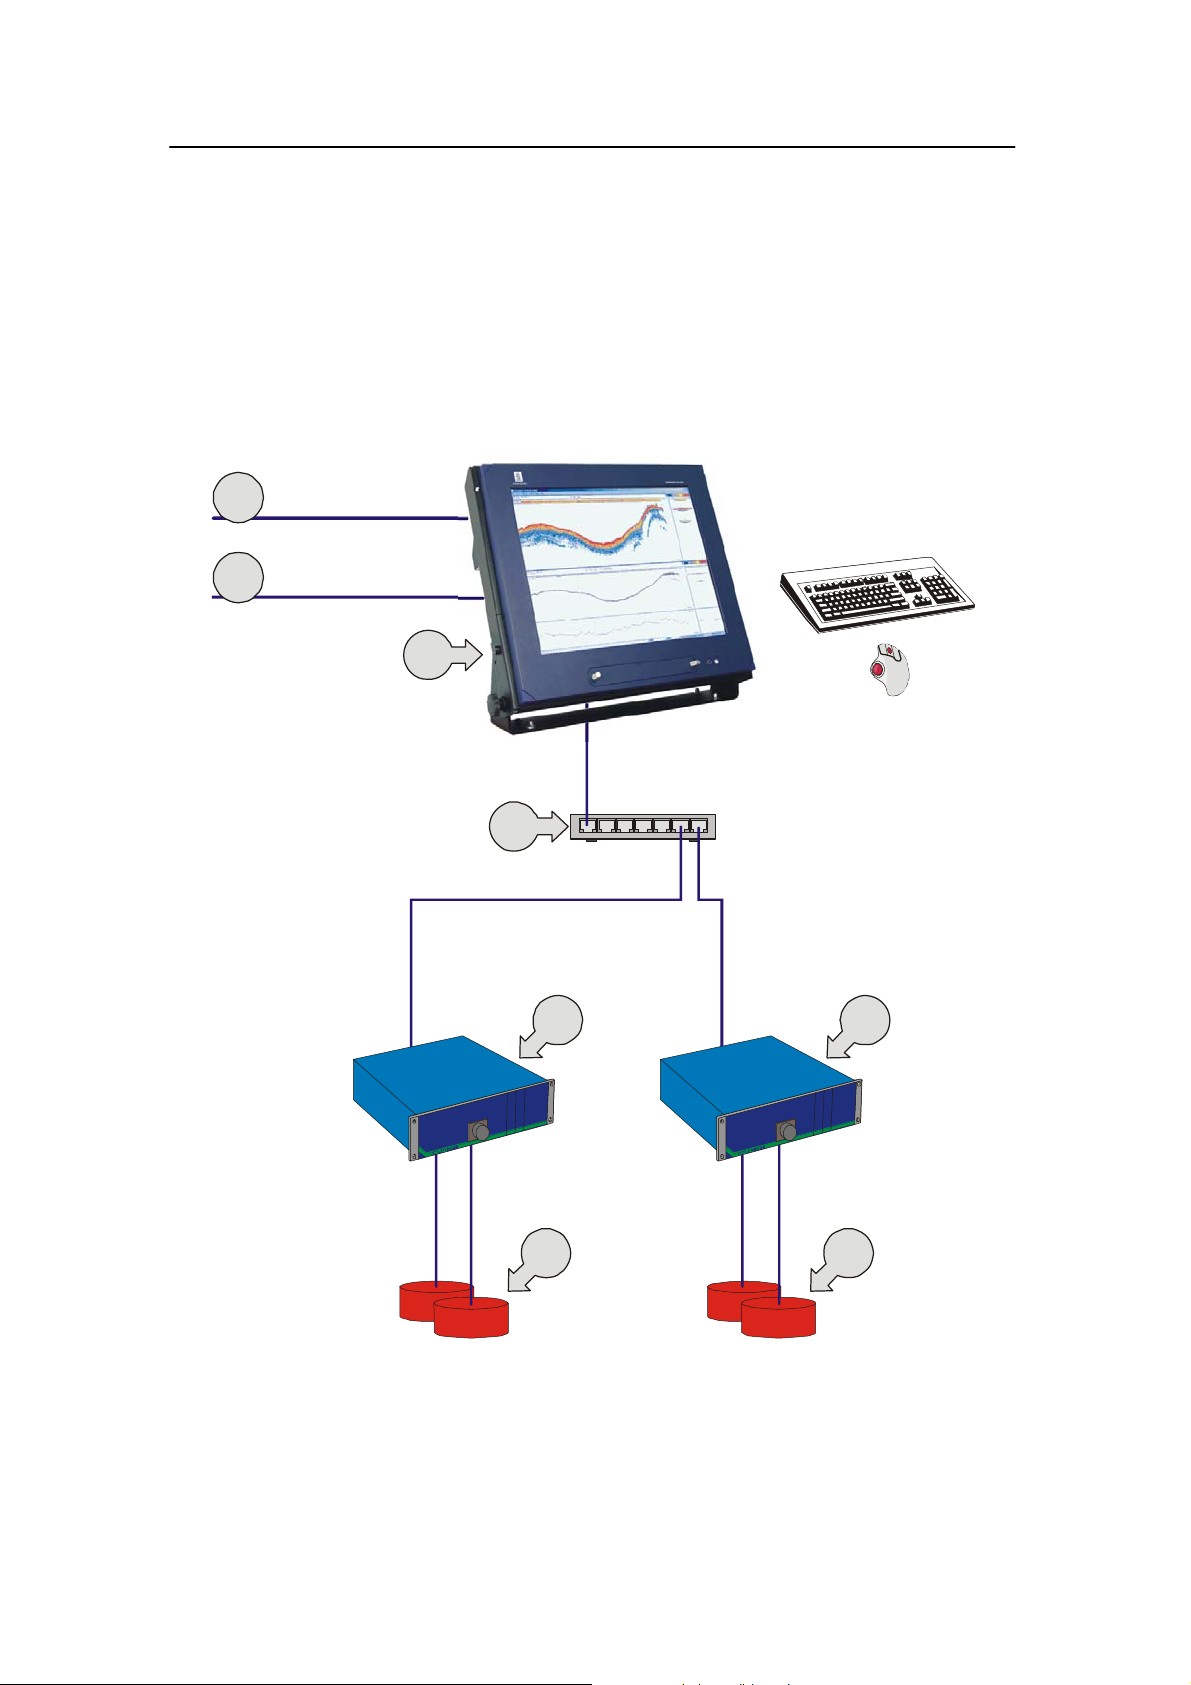
System diagram with Hydrographic Operator Station (HOS) and two transceivers
1) Hydrographic Operator Station (HOS) 2) General Purpose Transceiver (GPT)
3) Ethernet HUB or switch 4) Transducers A) Navigational data B) Motion sensor data
A
B
1
3
(CD5015I)
22
44
857-160981 / J
7
Page 20

EA 400
A
Portable system. IP56-rated suitcase with standard laptop or rugged notebook.
1) Portable computer 3) General Purpose Transceiver (GPT) 4) Transducers
A) COM 1 (Navigation) B) COM 2 (Input/output) C) 12 VDC power D) Connector
E) USB connector (Mouse)
B
1
C
D
E
(CD24209)
3
D
D
44
8
857-160981 / J
Page 21
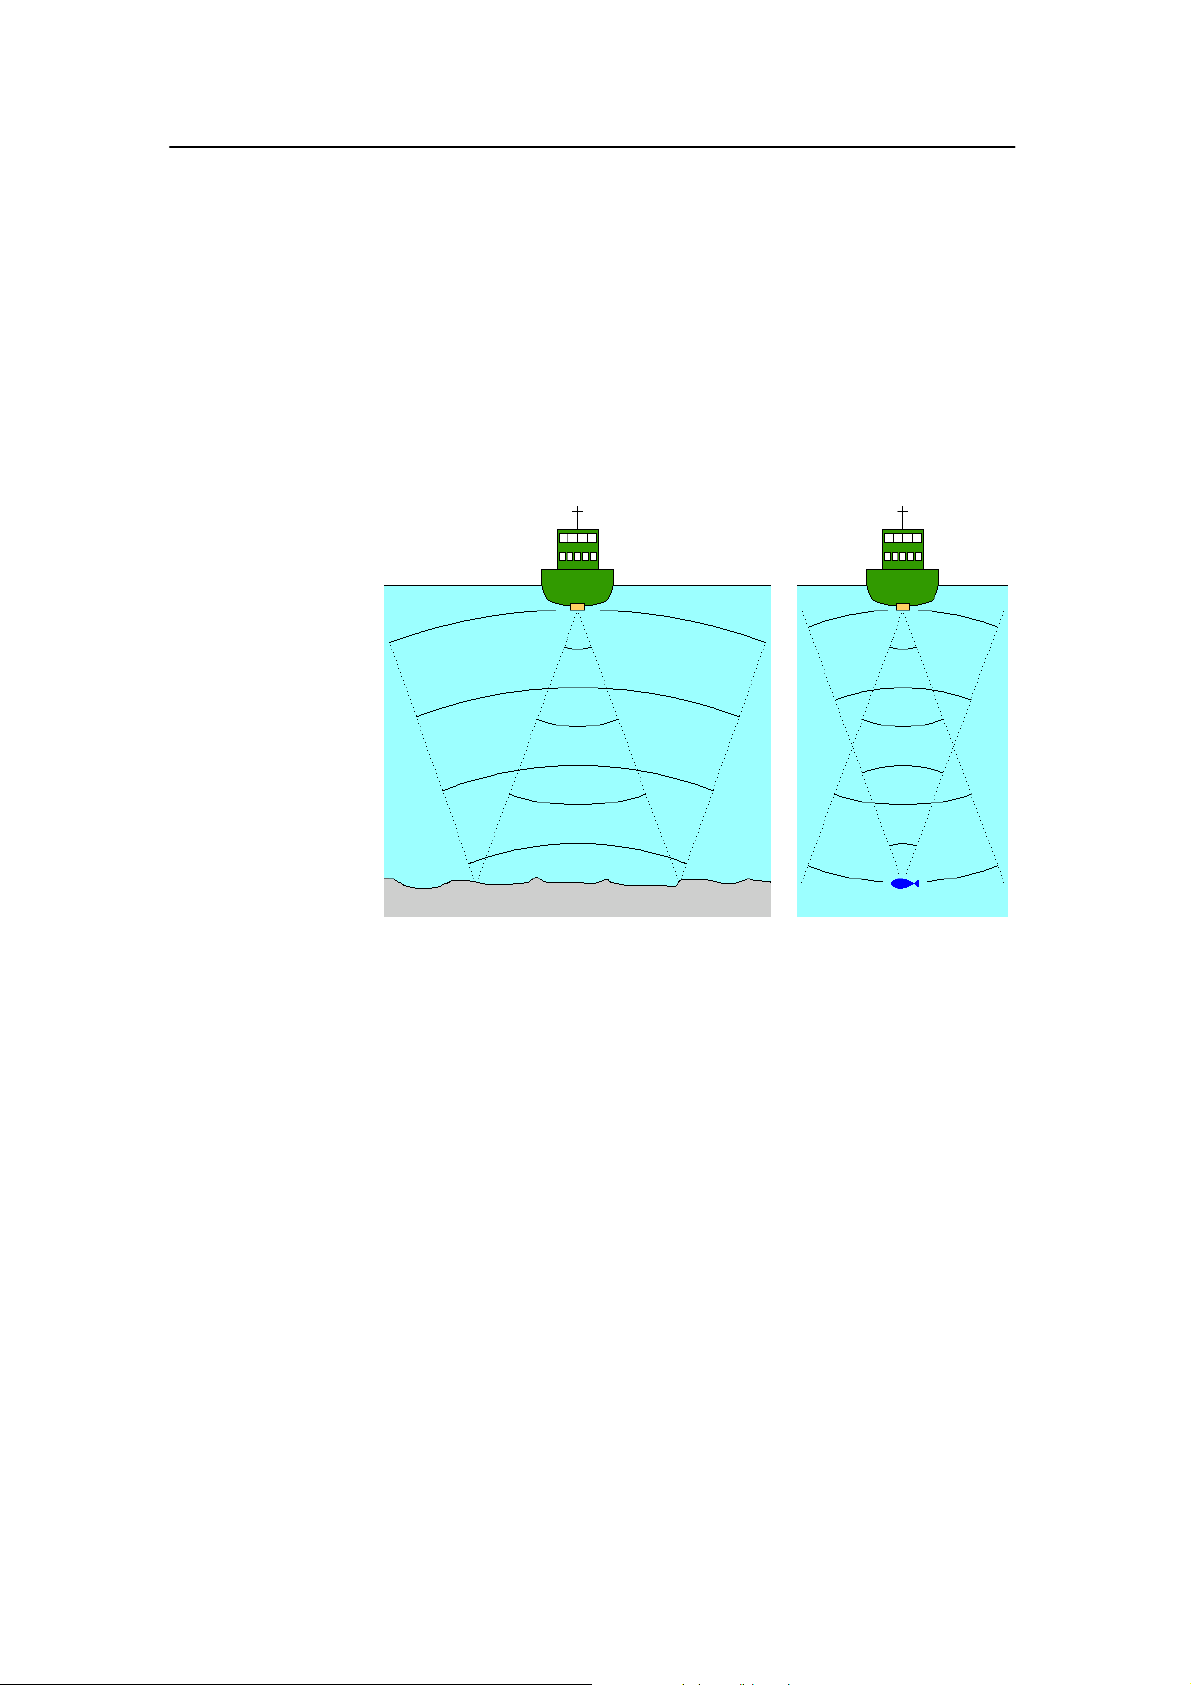
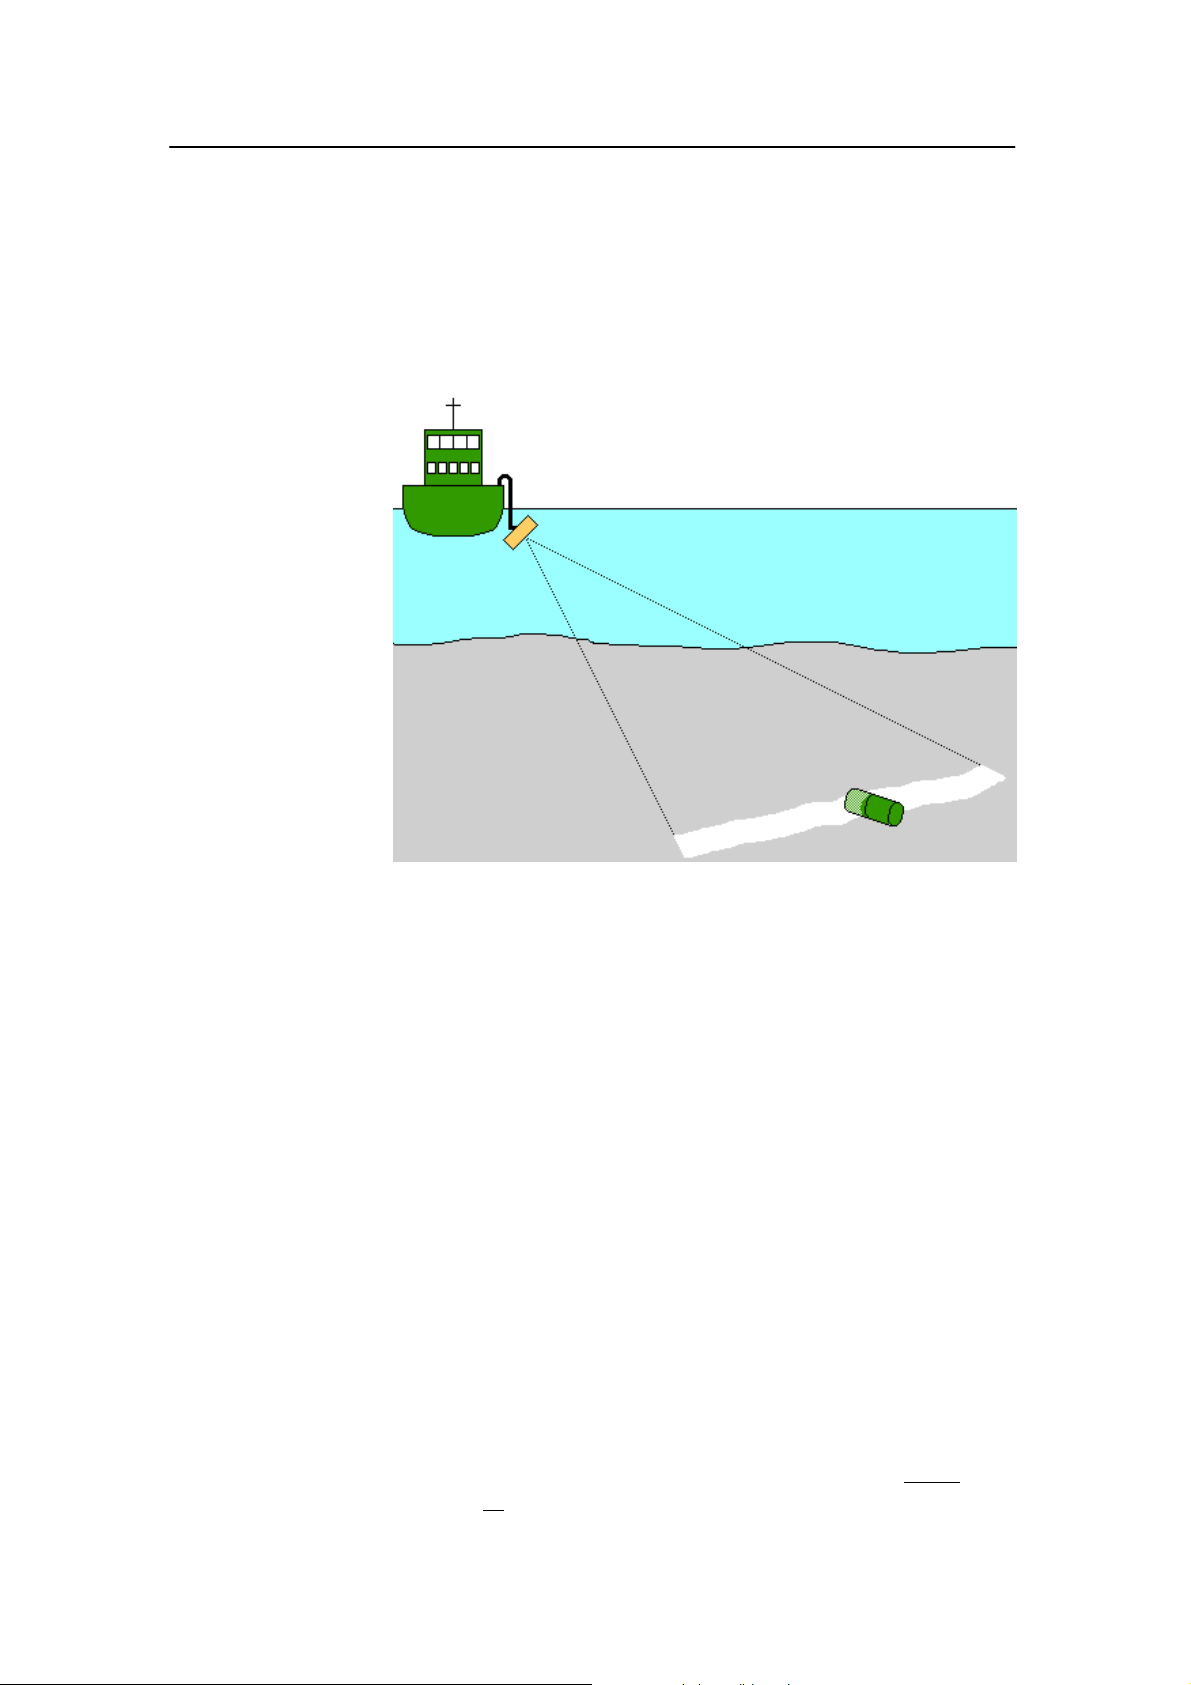
Wave propagation
The velocity of sound wave propagation in the sea varies
slightly with temperature, salinity and pressure. The velocity
varies between 1440 and 1520 m/s in shallow sea water, while a
velocity around 1480 m/s can be expected at 1000 m depth. In
shallow fresh water the velocity is approximately 1430 m/s.
A good average value to be used in the Environment dialogue
box is 1500 m/s.
Figure 1 The
wave propagation
principles
System description
The EA 400 transmits high energy sound wave pulses into the
sea. A f lat bottom reflects the transmitted wave as if it were a
mirror. The propagating energy is spread over a larger and larger
area as it travels down to the bottom and up again. The energy is
spread over a four times larger area every time the travel
distance doubles.
At the bottom there are many small targets. All targets within
the beam angle will be reflected. The area which is covered by
the beam will increase with the square-law or 20 log TVG
(Time Varying Gain) spreading. Bottom of the same type (same
backscatter) will be displayed with the same colour independent
of the depth.
The situation is slightly different when observing the echoes
from individual fish. The transmitted wave undergoes
square-law spreading when travelling from the surface and
down to the fish. The swim bladder of the fish scatters a small
fraction of the arriving energy in all directions. Travelling from
the fish and back towards the surface the scattered wave
undergoes another square-law spreading. The combined effect is
referred to as quad-law or 40 log TVG spreading.
857-160981 / J
9
Page 22

EA 400
Propagation losses due to absorption are much higher in sea
water than in fresh water. Absorption also increases with
frequency. At 38 kHz the absorption is 0.5 dB/km in fresh water
and 10 dB/km in sea water. At 200 kHz the absorption is 10
dB/km in fresh water and 50 dB/km in salt water. The echo
sounder must know which water type is present in order to
compensate for these losses correctly.
(The dB (decibel) unit has long traditions in underwater
acoustics and other fields in physics. It is a logarithmic measure
for the ratio between two quantities).
Related topics
→ Environment, page 105
→ Echogram, page 100
10
857-160981 / J
Page 23

Bottom echo
Figure 2
Bottom echo
System description
A hard flat bottom reflects the transmitted signal as if it were a
mirror. T he transmitted pulse hits the illuminated bottom area at
nearly the same instant, and the echo from different parts of this
area arrive back at the surface also at nearly the same instant.
The received echo signal is basically an attenuated copy of the
short transmit pulse. The echo signal from a sloped bottom is
characterised by having a longer duration and a slower rise and
fall time. The transmitted pulse first hits the slope at point A,
and as time elapses the reflection point travels along the slope
towards point B. Many locations do not have a solid hard
bottom. Frequently, the bottom is composed of layers of mud,
clay and sand which can be observed as coloured bands on the
echo sounder display.
The bottom detection algorithm is implemented solely in
software, and separate algorithms are run for each frequency
channel. The algorithm is designed with emphasis on reliability
in the sense that erroneous depth detections are never output.
Whenever the quality of a detection is questionable the
algorithm outputs a depth of 0.00 to indicate that no reliable
detection was obtained. The EA 400 algorithm is designed to
handle a number of difficult situations. The algorithm maintains
bottom lock for a discontinuous jump in bottom depth. It avoids
false bottom detections on a dense school of fish. The algorithm
chooses the upper boundary of the first layer when the bottom
consists of layers.
857-160981 / J
11
Page 24

EA 400
The bottom detection algorithm locks to the first good bottom
return. The depth at point A rather than the depth along the
transducer axis will be output for a sloped bottom. The detected
depth value is always smaller than the depth along the
transducer axis implying that a safety margin is automatically
included.
12
857-160981 / J
Page 25
Sidescan
System description
Specially designed transducers for hull or over-the-side
mounting are available from Kongsberg Maritime for sidescan
operation. The operating frequency is 120 or 200 kHz.
Figure 3 The
sidescan principle
A sonar side looking type of image is generated on the echo
sounder display when pointing this transducer near horizontally.
With a beam width of 50 degrees vertically and only 0.5 or 2
degrees horizontally the scanning sector is narrow enough to
resolve relatively small objects on the sea floor, but wide
enough to allow higher survey speeds than with conventional
side looking echo sounders. Bottom elevations and objects are
immediately recognised on the echo sounder colour display.
Side scan operation can be used for wreck searching and for
surveying navigable channels for obstacles. Monitoring
riverbanks, erosion, land slides and flow induced sediment
deposits are other useful applications.
The software in the EA 400 is prepared for dual sidescan
operation and presentation. The sidescan data is captured and
stored in a digital format. This allows for further data processing
to a sidescan sonar mosaic image by combining data from a
number of survey lines. It is even possible to allocate one or two
vertical channels for normal echo sounding while doing the dual
acoustic imaging.
857-160981 / J
Note that the EA 400P and EA 400SP are limited to either dual
sidescan or single sidescan with one vertical channel.
13
Page 26

EA 400
Observation range
Absorption increases dramatically with frequency in salt water.
For maximum observation range you should select a low
operating frequency, a large transducer and the maximum
transmit power.
Maximum detection depth
Transducer
type
38--7 38 4 7 766 2000 3000
38--9 38 4 9 766 1500 2600
38/200D 38 4 13x21 766 1000 2100
50/200D 50 2 10x16 1493 1000 1400
50--18 50 2 18 1526 500 1400
50--7 50 2 7 1493 2000 1900
120--25 120 1 10 3026 1000 800
200--7 200 1 7 3088 1000 500
710--36 710 1 2.8 3088 100 50
38/200 200 1 7 3026 1000 450
50/200 200 1 7 3088 1000 450
Frequency,
kHz
Pulse
duration,
ms
Beam
angle,
degrees
Band
width,
Hz
Transmit
power,
W
Range
bottom,
m
Typical observation ranges are shown in the table. Bottom
detection can be expected to work down to 3000 meters when
using the Simrad 38-7 transducer (37 kHz, 7x7 degrees, 2000
W). However, bottom detection becomes unreliable below 450
meters if you use the Simrad 50/200D transducer (200 kHz,
7x7 degrees, 1000 W)
14
These range calculations assume a normal sea water salinity
(3.5%) and temperature (+10 degC), an average bottom (surface
backscattering strength = -20 dB) and a noise level typical for a
moving vessel.
857-160981 / J
Page 27

Technical specifications
The following is a summary of the technical specifications for
the EA 400 echo sounder. Note that the specifications may be
changed without prior warning.
Topics
→ Portable system, page 16
→ Echo sounder system, page 17
→ Interfaces, page 18
→ General Purpose Transceiver (GPT), page 19
→ Processor Unit, page 20
→ Operator Station, page 21
→ PC for Portable system, page 22
→ Ethernet HUB, page 23
System description
857-160981 / J
15
Page 28

EA 400
Portable echo sounder system
• Frequency channels: 1 or 2 channels
• Operating frequencies: 33, 38, 50, 120, 200, 210 and
710 kHz
• Echogram types
- Surface echogram
- Bottom expansion
• Gain function: 20 log TVG, 30 log TVG, 40 log TVG or
None
• Colour scale: 12 colours (3 dB pr colour)
• Start depth and range: 5 to 15,000 meters in Manual, Auto
range or Auto start modes.
• Ping rate: Adjustable, maximum 20 pings per second
• Bottom detector: Software tracking algorithm, adjustable
minimum and maximum depth
• Scope presentation: Displays the echo strength of the most
recent ping.
16
857-160981 / J
Page 29

System description
Echosounder system
• Frequency channels: 1, 2, 3 or 4 channels
• Operating frequencies: 33, 38, 50, 120, 200, 210 and
710 kHz
• Echogram types:
- Surface echogram
- Bottom expansion
• Gain function: 20 log TVG, 30 log TVG, 40 log, TVG or
None.
• Ping rate: Adjustable, maximum 20 pings per second.
• Start depth and range: 5 to 15,000 meters in Manual, Auto
range or Auto start modes.
• Scope presentation: Displays the echo strength of the most
recent ping.
• Colour scale: 12 colours (3 dB pr colour)
• Bottom detector: Software tracking algorithm, adjustable
minimum and maximum depth
857-160981 / J
17
Page 30

EA 400
External interfaces
Numerous external interfaces are provided for the EA 400 echo
sounder system.
Outputs
• Echogram printer (Centronics parallel)
• Depth data (NMEA, Simrad or Atlas)
• Echogram (only on Ethernet)
• Navigation
• Relay navigation
• Motion sensor
• Status messages
• Annotation
• Sound Velocity Profile applied
• Temperature sensor
• Remote display
• Raw data (only Ethernet) (Classification)
• GeoRef data (only network)
Inputs
• Navigation receiver (NMEA)
• Heading (NMEA)
• Motion sensor (Heave, roll and pitch)
• Analogue heave, roll and pitch (+/- 10 V)
• Annotation
• Sound Velocity Profile
• Real time SVP smart sensor
• Transmit synchronization
• Temperature sensor
• Remote On/Off logging
• Remote On/Off pinging
18
• Remote On/Off history
Remote control toggle switches
• Survey Line
• Event
• Remote power
• Transmit synchronization
857-160981 / J
Page 31

System description
General Purpose Transceiver (GPT)
• Transmit power: Max 2 kW (Single or Dual frequency
transceiver)
• Receiver noise figure: 3dB
• Transducer impedance: 60 ohms
• Output protection: Short circuit and open circuit protection
• Receiver input range: Instantaneous dynamic amplitude
range -160 dBW to -20 dBW (dB relative to 1W)
• Connectors
- Transducer: 12-pin female Amphenol, Shell
MS3102A-24, Insert 24-19S
- AUI: 15-pin female Delta
- Network: 8-pin RJ-45 socket
- Auxiliary: 25-pin female Delta
• Physical dimensions
- Width: 284 mm
- Height: 112 mm
- Depth: 246 mm
• Weights
- With one TX board: 2.7 kg
- With two TX boards: 3.3 kg
• Supply power and fuses
- AC: 95 to 265 Vac, 50-60 Hz, 50-100 W
- DC: 11 to 15 Vdc, 50-100 W
• Fuses
- AC fuse: Ø5x20 mm, 2 A slow
- DC fuse: Ø5x20 mm, 10 A slow or fast
• Operational temperature: 0to+55degC
• Storage temperature: -40to+70degC
• Humidity: 5 to 95% relative non-condensing
857-160981 / J
19
Page 32

EA 400
Processor Unit
The Processor Unit comprises a standard personal computer. It
may be provided locally, but the following specifications are
recommended:
• Processor: Pentium 400 MHz
- Minimum requirement: Pentium 1 GHz
• Memory capacity:
- Minimum requir ement: 256 Mb
• Hard disk capacity:
- Minimum requirment: 40 GB
• Disk drives
- 1.44 Mb floppy
- CD-ROM Read/Write
• External interfaces
- Minimum 2 x RS-232 serial lines, recommended 4 x
RS-232 serial lines
- Parallel/USB port
- 2x ethernet RJ-45
• Operating systems: MS Windows 2000 or XP
• Additional software required: Internet Explorer 5.0 (or
later)
• Operational temperature: 0to+40degC
• Storage temperature: -40to+70degC
• Humidity: 5 to 95% relative non-condensing
Note Observe that the maximum total cable length used between the
Processor Unit and the General Purpose Transceiver (GPT) is
100 meters using CAT5 STP 10 Mbit cable.
20
857-160981 / J
Page 33

System description
Operator Station
The EA 400 is supplied with the HOS 152 Operator Station This
is a 15-inch display with a built-in computer. Optionally, the
larger HOS 192 can be supplied.
Earlier systems included the HOS 151 or HOS 181.
Refer to the applicable documentation provided with the unit for
more information.
857-160981 / J
21
Page 34

EA 400
PC for Portable system
The portable echo sounder can be supplied with either a
standard laptop or a rugged tablet personal computer. The
following minimum specifications are recommended:
• Processor: Pentium M
• Memory capacity: 256 Mb
• Hard disk capacity:40GB
• External interfaces
- 1 serial port
- 2 USB ports
- Ethernet RJ-45
• Operating systems: MS Windows 2000 or XP
Refer to the applicable documentation provided with the unit for
more information.
22
857-160981 / J
Page 35

System description
Ethernet HUB
When more than one General Purpose Transceiver is supplied,
the EA 400 will be supplied with an Ethernet HUB. Several
different switches are available. A standard commercial is HUB
supplied with the echo sounder, unless a specific type is
specified by the customer. Further specifications may be found
in the documentation supplied with the unit.
Standard HUB/switch:
• No. of ports: 5
• Network speed: 10 Mbps
• Interfaces: RJ-45 Ethernet and BNC (optional)
• External power supply: 230 Vac
• Power consumption: Max10W
• Power frequency: 50 to 60 Hz
• Operational temperature: 0to+40degC
• Storage temperature: -20to+80degC
• Humidity: 5 to 80% relative non-condensing
857-160981 / J
23
Page 36

EA 400
DISPLAY VIEWS
Introduction
This chapter provides a brief overview of the information
displayed by the EA 400, and how it is organised.
Related topics
→ Display layout and main view, page 25
→ Moving boundary lines, page 26
→ Direct access to dialog boxes, page 27
→ Menu bar, page 29
→ Header view, page 30
→ Echo frames, page 31
→ Status bar, page 36
→ History and printer views, page 37
24
857-160981 / J
Page 37

Display organisation
Main view
The EA 400 display is organised as follows (from top):
• Menu bar
• For each transceiver channel:
- One header view
- Two echo frames
• Status bar
A single channel display is shown below as an example.
Display views
3
1
2
4
857-160981 / J
5
(CD6 744A / BM30 0)
(1) Main menu (2) Header view
(3) Echogram and range view (4) Scope view
(5) Status bar
25
Page 38

EA 400
Menu
The Menu bar contains the echo sounder’s main menu. A
single click on one of the menu names will provide a new
drop-down menu where additional choices can be made.
Header
For each channel, the Header view contains the current
operational mode and frequency, the current depth, and the
colour scale.
Echo frames
The Echo frame takes up the largest part of the echo sounder
window. Each Echo frame contains (from left) the Echogram
and Range view and the Scope view.
The Echo frame view is are also described in more detail in the
Getting started chapter.
Status bar
The Status bar presents the current event and line numbers,
current time, and other information provided by the echo
sounder.
Moving the boundary lines
You can modify the vertical size of the echograms by moving
the horizontal boundary line between the two echograms.
To do this:
1 Position the cursor at the boundary line.
2 Press the left mouse button.
3 Drag the cursor up or down vertically while keeping the
left mouse button pressed.
4 Release the left mouse button.
Using the same operation, you can modify other boundary lines
on the display;
26
• The horizontal line between the upper Echo f rame and the
Header view
• The vertical line between the Echogram and Range view
and the Scope view
857-160981 / J
Page 39

Display views
Direct access to dialogue boxes
Several dialogue boxes are directly accessed from the various
views on the display.
Position the cursor, and right-click on the...
• Mode and frequency information in the Header view to
open the Transceiver Settings dialogue box.
• Depth value in the Header view to open the Bottom
Detector dialogue box.
• Colour scale in the Header view to open the Colour Scale
dialogue box.
• Range fieldintheEchogram and Range view to open one
of the Range dialogue boxes, depending of the current
echogram type.
• Echogram field in the Echogram and Range view to open
the Echogram dialogue box.
”Hidden views” overview
To present all hidden views in one main dialogue box:
• Position the cursor in the Header view.
• Press the left mouse button.
- A list of the dialogue boxes described above will be
displayed in one box, and you will have direct access to
each of them.
857-160981 / J
This pop-up menu also allows you access to the Status window,
which provides abbreviated information of the current echo
sounder parameters.
27
Page 40

EA 400
Related topics
→ Menu bar, page 29
→ Header view, page 30
→ Echo frames, page 31
→ Status bar, page 36
→ Getting started; Operation, page 44
→ Bottom Detector, page 93
→ Colour Scale, page 96
→ Echogram, page 100
→ Bottom Range, page 95
→ Status window, page 147
→ Surface Range, page 154
→ Transceiver settings, page 160
28
857-160981 / J
Page 41

Menu bar
Display views
The EA 400 Menu bar contains the Main menu.
1
(CD2 4214 / BM30 0B)
(1) The main menu
The main menu has the following options:
• File
• View
• Options
• Interfaces
• Install
• Step!
• Help
• Shortcuts
To operate, click on the menu name and observe the drop-down
menu. Select a new item on the drop-down menu by clicking on
the command. Commands shown with light grey colour are
unavailable in the present configuration or operational mode.
The menus are all explained in the Reference Guide.
Related topics
→ Main menu, page 75
→ Reference guide, page 74
857-160981 / J
29
Page 42

EA 400
Header view
1 2
The EA 400 Header view is shown directly above the two Echo
frames. The top Header view is thus located just below the
Menu bar. The Header view contains the following
information.
4
(CD674 4C / BM300B )
3
(1) Transceiver settings: Current mode and frequency
(2) Bottom detection: Current depth
(3) Colour Scale
(4) Action field for “hidden dialogue boxes”
(5) Current depth from one ov the other channels. Displayed in
red.
The Header view is a part of the channel. If more than one
channel is displayed, the Header view is duplicated as well.
The Header view provides direct access to the following
dialogue boxes:
• Right-click in the Transceiver settings field (on the Mode
and frequency information) to open the Transceiver
Settings dialogue box.
• Right-click in the Bottom detection field (on the Depth
value) to open the Bottom Detector dialogue box.
• Right-click on the Colour scale to open the Colour Scale
dialogue box.
• Left-clickontheHeader view to open all hidden dialogue
boxes in one menu.
Related topics
→ Transceiver Settings, page 160
30
→ Bottom Detector, page 93
→ Colour Scale, page 96
857-160981 / J
Page 43

Echo frames
Display views
Overview
The EA 400 Echo frames are the main information bearer on
the echo sounder display. The Echo frames are usually
presented in pairs with two echo frames for each channel.
The Echo frame contains the following views:
• Echogram and Range view
• Scope view
1
3
4
(1) Echogram and range view
(2) Scope view
(3) Echogram
6
2
5
(CD674 4D / BM300B )
857-160981 / J
(4) Echogram with bottom expansion
(5) Range
(6) Depth, coverage and TVG at cursor’s location
31
Page 44

EA 400
Echogram and Range
The Echogram and Range view consists of an Echogram field
to the left and a Range field to the right. These are separated by
the vertical range axis. The Echogram field contains
information about the acoustical values, while the Range field is
used for specifying the range used in the Echogram field. The
settings in the Colour Scale is used to present the information.
In the echogram field, the presentation can be of different views.
This can be selected in echogram dialogue bok as 1x, 3x, 5x, or
all. Fore examle: If a 20 tranducer system; all selected, 20
echogram in the echogram filed.
When you place the cursor in the Echogram field, you can use
the mouse wheel to modify the TVG value, and hence the
display colour sensitivity. Each click of the wheel corresponds
to a 1 dB change. The same colour sensitivity setting is
available from the Colour Scale dialogue box.
Whenever the cursor is located within the Echogram field, a
small yellow label is visible. The label provides the following
information:
• Left: Depth at the cursor position
• Middle: Diameter coverage from the transducer beam
• Right: Current TVG value
Note This information is only valid when #x echogram is selected.
To change the range, you can also use the mouse wheel. Place
the cursor inside the Range fieldtodothis:
• In a surface related echogram you will modify the range,
while for a bottom related echogram, you will change the
start range.
• If you press the left mouse button while you use the mouse
wheel, the surface echogram will change its start value, while
the bottom related echogram will change its range.
32
Related topics
→ Getting started, page 45
→ Colour Scale, page 96
857-160981 / J
Page 45

Display views
Scope
The Scope view is the rightmost view and shows a oscilloscope
view of the last ping corresponding to the settings in the
Echogram view.
This view draws a range of horizontal symmetrical colour lines.
The distance from the vertical centre axis and the line colour
reflects the received echo amplitude. A black horizontal line
across the view indicates the current bottom view.
If you press the right mouse button with the mouse pointer
positioned in the Scope view, the graphic presentation will be
replaced by a text based presentation of the data. The following
information is provided:
Channel:
Test presentation for passive or test mode
Passive:
Background Noise: yyy.y dBW
Receiver Amplitude: xxx.x dBW
The background noise shown is the median of 20 equidistant
power samples in the total range of the current ping. The
receiver is sampled at 100 m depth. During replay, you may find
that this depth setting is not available because the depth is less
than 100 m. The receiver amplitude is then set to a minimum
(235 dBW).
857-160981 / J
33
Page 46

EA 400
Sidescan
If the necessary transducers are available, the EA 400 can be set
up as a “sidescan sonar” with only a few easy commands. Two
echograms are used, but a third channel may be added to show
the current depth, provided that suitable hardware is installed.
(1) Sidescan echograms
(2) Depth echogram
(3) Sidescan range
(4) Annotation / Position
(5) Distance information
(6) Vertical depth (ext. depth)
6
3
2
4
1
5
(CD2407B
The illustration shows an excerpt from the echo sounder display.
It shows a dual sidescan presentation in the upper frame, and a
third channel in the lower frame providing current depth.
The sidescan echogram scrolls in its vertical direction.
)
34
To change the sidescan range, place the cursor inside the
sidescan range field. Click the right mouse button to open the
Sidescan Range dialogue.
When you place the cursor in the sidescan echogram, the
distance from the transducer to the object is given at the cursor
position.
857-160981 / J
Page 47

Display views
To export the position of an object, click on the left mouse
button in the side scan echogram view. The position will be
displayed in the status bar (bottom left of the display).
Simultaneously this position is also marked in the view by a red
cross.
The position is exported on the network. The port is defined in
the Network menu. This function will be carried out
automatically, so no tag has to be activated.
A specific procedure in the Operational Procedures chapter
explains how to set up the sidescan option.
Related topics
→ Operational procedures, page 71
→ Sidescan Range dialogue, page 146
857-160981 / J
35
Page 48

EA 400
Status bar
The EA 400 Status bar is located at the bottom of the display.
It contains the following information:
Note that the water temperature read-out will only be available
if a sensor is connected to the echo sounder. Also, navigational
information requires that the applicable position information is
connected to the echo sounder.
1234
(1) Information applicable for the current operation
(2) Event number
(3) Printer logo (when printer is active)
(4) Current temperature
(5) Line number
(6) History file number
(7) Navigational information (latitude and longitude)
(8) Time
Related topics
→ Status bar, page 83
5
6
8
(CD6 744E / BM 300D)
7
36
857-160981 / J
Page 49

History and printer views
Overview
The echogram information provided on the display will differ
slightly from the information provided on the printer and in the
History files. This is because the annotation settings differ
between the two media.
The annotations provided for display output are controlled by
the Annotations dialogue box. When enabled in the Prister
and History dialogue box, the annotations will also be sent to
the printer and to the History files.
The Printer and History dialogue box also enables additional
annotations to be printed.
Related topics
Display views
→ History, page 114
→ Annotations, page 90
→ Printer and History, page 129
Display example
The echogram shown on the display will contain a vertical red
line for every annotation selected in the Annotation dialogue.
The line is identified with free text entered in the dialogue box.
Figure 4 Display
example with a
single text
annotation
857-160981 / J
37
Page 50

EA 400
Printer example
A printout from the echo sounder is shown below.
2
1
3
4
6
5
7
8
9
(CD10210)
38
Figure 5 History and printer presentation
From the top left corner, you can see the following annotations.
(1) A depth annotation. This information will automatically
appear at regular intervals, and whenever you change the echo
sounder’s depth range.
(2) An external annotation with the text “This is an ATS
annotation”. This annotation has been imported on the serial line
from the navigation system.
(3) Two annotations with navigational information. This
information appears with regular intervals when enabled from
the Printer and History dialogue box.
857-160981 / J
Page 51

Display views
(4) One Event annotation with both navigational and time
information added. This annotation is controlled by the
parameters in the Annotation dialogue box. It will only appear
on the printer output and in the History when you press the
Event number in the Status bar.
(5) One annotation with navigational inf ormation. This is
identical to item 3.
(6) One Text annotation with the text “Test in Horten”. This text
is entered in the Annotation dialogue box. You will need a
keyboard connected to your echo sounder to do this.
(7) Two annotations with navigational information. This is
identical to item 3.
(8) One Event annotation with no additional information added.
The number shown (”0006”) is the event number. The
annotation appears on the printer output and in the History when
you press the Event number in the Status bar .
(9) One depth annotation. This is similar to item (1).
(Others) Several other annotations to provide examples.
To add Text, Time and Event annotation, you must open the
Annotation dialogue box. This box is accessed from the File
menu.
Additional text to the printer and History window is controlled
by the parameters in the Printer and History dialogue box. This
box is accessed from the File menu.
857-160981 / J
39
Page 52

EA 400
GETTING STARTED
Introduction
This chapter will guide you through the main operations of the
EA 400 by the use of an operational example. The intention
with this chapter is to provide you with an overview of the main
functions in the echo sounder, and to demonstrate how the EA
400 may be used in a realistic operational situation.
Topics
→ Before you start, page 41
→ Start-up, page 42
→ Operation, page 44
→ Data storage, page 48
→ Operational procedures, page 50
40
857-160981 / J
Page 53

Before you start
Before you start the EA 400, make sure that the necessary
hardware items are correctly installed and connected. The
transducer(s) must also be defined in the EA 400 software on
the computer.
EA computer IP setting
If the computer is supplied by Kongsberg Maritime, the
following address(es) and parameter(s) are entered and checked
out.
The computer’s default IP address is 157.237.16.12 and the sub
mask is 255.255.0.0. These addresses fit the IP address for GPT
transceiver.
→ See page 115
If use of other address, both computer and GPT must be
changed (for example: 10.10.x.x . The numbers 10.10. must be
equal in both computer and GPT).
Getting started
If two network cards in the computer, the network for GPT must
be 1. priority. Refer to “Network Connection” and “Advanced”
on your computer.
Firewall and other security software
Be aware that if the Windows Firewall is “on”, the network
communication can cause some problems. Turn it off or choose
“UNBLOCK”. Other type of security program can cause same
problem.
Related topics
→ Physical installation, see the Instruction Manual.
Refer to t he installation instructions in the paper manual for
more information.
857-160981 / J
41
Page 54

EA 400
Start-up
Overview
This chapter provides the basic procedure required to power up
the echo sounder and start the pinging.
Power-up procedure
After these initial preparations you can open the EA 400
program on the computer. The “power on” procedure is
describedindetailintheOperational procedures chapter.
The menu system
The menu system is based on the Microsoft Windows®
commercial standard interface. An overall explanation of the
menu system with a description of the various views are
presented in the Display views chapter.
Transceiver inspection
First, we need to check that the transceiver (or transceivers) are
connected.
Open the Install menu, choose the Transceiver command to
open the Transceiver Installation Mode dialogue box. In this
dialogue, press the Inspect button to open the Transceiver
Settings dialogue box.
You may now check that the transceivers are installed correctly.
Active transceivers appear in green text in the F requency
Channel Selection box.
Click the Cancel button to finish.
If none of the transceivers listed appear in green text, check the
connections and re-install the transceiver(s).
Environmental parameters
To obtain correct values for the various acoustical parameters
calculated by the EA 400 program, it is important that you
provide the EA 400 program with accurate parameters
describing the environment; sea temperature, salinity and sound
velocity.
42
These values are defined in the Environment dialogue box.
Open the Install menu, choose the Environment command to
open the Environment dialogue box.
857-160981 / J
Page 55

Getting started
Unless the default values are acceptable, you must enter data for
salinity, sound velocity and water temperature. These values are
used for calculating depths and absorption coefficient. The
values must be as accurate as possible!
Click OK when you have finished.
Navigation interface
To link acoustical data with navigational data the EA 400 must
be able to receive data provided by a GPS or another positioning
system. The Navigation Interface dialogue box is used to
define the parameters to achieve this.
Open the Install menu, choose the Navigation command to
open the Navigation Interface dialogue box.
Specify how the EA 400 will receive navigational data. Since
the NMEA standard has been implemented, you only need to
choose between NMEA or ASCII.
If ZDA clock is available, the PC system clock can automatic be
synchronised with ZDA input. Then choose “Automatic Set
Clock”.
Click OK when you have made the setting.
Additional interfaces
Additional interfaces have been provided for other peripheral
systems.
If you want to use a heave or a temperature sensor, choose the
Heave and Temperature commands on the Install menu to
specify these interfaces.
Related topics
→ Power on/off procedure, page 51
→ Display views, introduction, page 24
→ Frequency channels installation procedure, page 58
→ Transceiver Installation, page 158
857-160981 / J
→ Transceiver Settings, page 160
→ Environment, page 105
→ Navigation Interface, page 120
→ Heave Sensor, page 111
→ Temperature Sensor, page 157
43
Page 56

EA 400
Operation
Overview
This chapter describes a few of the most common functions used
during normal operation.
Selecting operational mode
You are now ready to start the actual operation of the EA 400
echo sounder. The first thing to do is to choose operational
mode.
Open the File menu, choose Operation to open the Operation
dialogue box. In the Mode group, click Normal for normal
mode.
(You may alternatively click Replay for replay mode, but you
must then also click Files to choose a replay file. Note that
operating in replay mode will restrict you from changing certain
parameters during operation.)
Next, you need to define the ping rate. To do this, locate the
Ping Rate group box, and set the ping rate to Interval for
manual setting of the ping interval. For this exercise, set the
ping interval time to 1 second, and click OK to finish.
The echo sounder will now start pinging, and after a few
moments the echogram field on the display will present a new
echo line. The various fields on the display are explained in
detail in the Display views chapter.
Transceiver settings
The operational mode and the transceiver frequency are
displayed to the far left in the Header view. A dedicated
dialogue box - Transceiver Settings -isusedtodefinevarious
parameters associated with the transceiver. These settings
include transceiver mode, the depth of the transducer surface,
the transmit power, and the pulse length.
To open this dialogue box, position the cursor over the mode
and frequency information in the Header view, and click the
right
mouse button. Specify the estimated depth of the
transducer surface, and set Transmit Power to its maximum
value. Set the Pulse Length to a medium value of 1.024 ms (for
38 kHz), and click OK to accept the settings.
44
The chosen pulse length will result in an acceptable resolution
of approximately 0.75 m, and acceptable signal-to-noise ratios at
the depths considered in this example.
857-160981 / J
Page 57

Getting started
Note that if you operate in Replay mode, the transceiver settings
can not be changed.
Additional information about the transceiver settings are
available if you press the Advanced buttonintheTransceiver
Settings dialogue box.
Bottom detector settings
The Header view on the display is also used to present the
current depth. The Bottom Detector dialogue box is used to
define various parameters associated with the bottom detection.
These include the depth range, where the EA 400 searches for
the bottom.
The EA 400 can also use the Detect Second Layer Bottom
function when using depth from a high frequency transducer.
This function is only used when the second layer is to be
displayed. Do not use for hydrographic surveying.
To open the Bottom Detector dialogue box, position the cursor
over the displayed depth in the Header view, and click the right
mouse button.
In our example we will assume that the depth will vary between
30 and 200 meters. Therefore, set Minimum Depth to 30 m and
Maximum Depth to 200 m. Click OK to accept the settings.
Note Setting both Minimum Depth and Maximum Depth to 0 m will
turn off bottom detection.
Colour scale
The Colour Scale field is used to display the colour scale for
mapping acoustical values. These colours are used in the
Echogram And Range view. Each colour always represents a
3 dB value range. Using all 12 colours in the colour scale thus
enables mapping of a 36 dB value range to colours.
Position the cursor over the colour scale, click the right mouse
button to open the Colour Scale dialogue box. Accept the
default settings and click OK.
857-160981 / J
Echogram and Range view
The Echogram and Range view consists of an Echogram field
to the left and a Range field to the right. These are separated by
the range axis. The Echogram field contains information about
the acoustical values, while the Range fieldisusedfor
specifying the range used in the Echogram field.
45
Page 58

EA 400
Echogram field
The Echogram field is used to display acoustical values for
each ping. The settings in the Colour Scale are used to
determine the colour sensitivity in the echogram.
Position the cursor in the Echogram field, and click the right
mouse button to open the Echogram dialogue box.
The Echogram dialogue box allows you to define the area of
interest for the echogram. Your choice will affect the meaning
and the options in the Range fieldintheEchogram view. You
can also choose the TVG function used to calculate the
acoustical values.
In this example, choose Surface – Manual to enable a surface
related echogram. Then, choose the Bottom gain TVG function
for calculating sV-values. Finally, click OK to accept the
settings.
Range field
The Range field allows you to read and specify the range used
in the Echogram field. The current range is displayed on the
range axis. In the Range dialogue box you can define the area of
interest for the echogram.
Position the cursor in the Range field, click the right mouse
button. Observe a dialogue box referring to either Surface or
Bottom depending on your choice in the Echogram dialogue
box.
In this case, check that you have the Surface Range dialogue
open.
Set Range to 200 m and Start Relative Surface to0m,then
click OK to accept the settings.
Comments to the Echogram and Range view
Two echograms are shown for each Channel. The second
echogram for the present Channel maybeusedinthecurrent
example to show the distribution of fish close to the bottom.
46
• Use the Echogram dialogue in the second Echogram view
to set the Echogram to Bottom and choose the 20 log TVG
function for calculating SV-values.
• Use the corresponding Bottom Range dialogue to set Range
to 20 m and Stop Relative Bottom to 5 m for the echogram
to show values calculated from 15 m above the detected
bottom to 5 m below the bottom.
857-160981 / J
Page 59

Getting started
When you place the cursor in the Echogram field, you can use
the mouse wheel to modify the receiver gain level, and hence
the display colour sensitivity. Each click of the wheel
corresponds to a 1 dB change. The same colour sensitivity
setting is available from the Color Scale dialogue box.
Whenever the cursor is located within the Echogram field, a
small yellow label is visible. The label provides the following
information:
• Left: Depth at the cursor position
• Middle: Diameter coverage from the transducer beam
• Right: Current TVG range
To change the range, you can also use the mouse wheel. Place
the cursor inside the Range fieldtodothis:
• In a surface related echogram you will modify the range,
while for a bottom related echogram, you will change the
start range.
• If you press the left mouse button while using the mouse
wheel, the surface echogram will change its start value, while
the bottom related echogram will change its range.
Scope view
The Scope view is the rightmost view and shows a scope view
of the last ping corresponding to the settings in the Echogram
view.
This view draws a range of horizontal symmetrical colour lines.
The distance from the vertical center axis and the line colour
reflects the received echo amplitude. A black horizontal line
across the view indicates the current bottom view.
Related topics
→ Display views, introduction, page 24
→ Transceiver Settings, page 160
→ Advanced Transceiver, page 88
→ Bottom Detector, page 93
→ Colour Scale, page 96
857-160981 / J
→ Echogram, page 100
→ Surface Range, page 154
47
Page 60

EA 400
Data storage
Overview
This chapter presents a brief description of the data storage
functionality.
Define storage parameters
It will often be beneficial to store raw acoustical data recorded
during a survey. This allows you to change certain parameter
settings when operating in replay mode at a later time.
Open the File menu, choose Store to open the Store dialogue
box.
Note Note that Store is not available when operating in Replay mode.
The Store dialogue box allows you to set various parameters
associated with data storage. You can define a specific directory ,
and limit the file sizes.
Click Browse in the Survey box. Browse to the desired
directory for file storage, or enter the directory name directly
into the text box. If the directory does not exists it will be
created.
Default directory is EA 400\data\
Click the Save Raw Data check box to save raw data. Define
maximum file sizes by entering the desired value in the Max
File Size box, and click OK to accept the settings.
When Save Raw Data is checked, the raw unprocessed
transceiver data containing amplitude and angle information for
the split beam transducers will be recorded.
Start and stop data storage
To start and stop data storing, use the Line field in the Status
bar.TheLine field is marked LXXXX and shows the current
survey line number.
Position the cursor over the Line field in the Status bar and
click the left mouse button. Observe that the survey line number
increments, and that the line colour changes from black to red.
To stop data recording click the Line field again.
48
The red colour indicates that data recording is active. When the
recording stops, the colour is changed back to black. The file
names used for the stored data are determined by the survey line
number and the date and time when recording started. A new
file is created for each new survey line number.
857-160981 / J
Page 61

Getting started
Note that the depth range used for data collection and data
storing is determined from the maximum range settings in the
Echogram view, the bottom detection settings, the settings for
Echogram Parameters, and the settings in the Network
Interface dialogue box.
Related topics
→ Store, page 148.
→ Echogram Parameters, page 104.
→ Network Interface, page 123.
857-160981 / J
49
Page 62

EA 400
OPERATIONAL PROCEDURES
Overview
This chapter contains a number of specific procedures to be
used with your EA 400 echo sounder.
Topics
→ Power on/off, page 51
→ Basic operations, page 53
→ Transceiver installation, page 58
→ Record and playback, page 60
→ Software installation and upgrade, page 67
→ Sensor setup, page 69
→ Sidescan, page 71
50
857-160981 / J
Page 63

Power on/off
Operational procedures
Use the following procedures to switch the EA 400 echo
sounder on and off.
Power on
It is assumed that the echo sounder’s hardware and software are
properly installed and configured.
1 Switch power on.
- The location of the power switches are individually
assigned. The computer has its own power switch. The
transceiver(s) must be connected to separate power
supplies, and should have a remote power switch.
2 Observe the hardware test messages and operating system
start-up messages.
- It takes a couple of minutes before the echo sounder
window appears on the display.
The echo sounder memorises all its settings when power is
switched off.
If pinging does not start you must check the settings in the
following dialogue boxes:
• Operation
• Layout
• Transceiver Settings
• Transceiver Installation
If you are not successful you should use this procedure:
1 Check the Transceiver Installation dialogue box.
2 All frequency channels must be properly installed.
3 Select Factory settings in the Options menu.
Power off
To switch off the EA 400 echo sounder, observe the following
procedure.
1 Select Exit on the File menu.
857-160981 / J
2 Allow the computer to close all the EA 400 software
applications.
- If desired, EA 400 can now be restarted using the
desktop icon.
3 Switch off the power on the General Purpose Transceiver
and other peripherals (if any).
51
Page 64

EA 400
When the EA 400 software has closed down, you may wish to
close down the computer as well.
1 ClickontheStart button in the lower left corner of the
display.
2 Exit the operating system in the normal manner.
3 When notified, switch off the power.
Related topics
→ Operation, page 126
→ Layout, page 118
→ Transceiver Settings, page 160
→ Transceiver Installation, page 158
→ Options menu, page 78
52
857-160981 / J
Page 65

Basic operations
Overview
This chapter presents a number of common procedures
frequently carried out on the EA 400 echo sounder.
Changing the echogram settings
To change the echogram settings:
1 Position the cursor in the Echogram field.
2 Click the right mouse button.
3 Observe the Echogram dialogue box.
4 Make the required changes.
or:
1 Left-clickintheHeader view, and select the required
Operational procedures
dialogue box from the pop-up menu.
2 Make the required changes.
Related topics
→ Echogram, page 100
Changing the range
To change the range:
1 Position the cursor in the Range field.
2 Click the right mouse button.
3 Observe the
box.
4 Make the required changes
or:
1 Left-clickintheHeader view, and select the required
dialogue box from the pop-up menu.
2 Make the required changes.
or:
1 Place the cursor in the Range field.
2 Use the mouse wheel to change the range.
Bottom Range or Surface Range dialogue
857-160981 / J
Related topics
→ Bottom Range, page 95
→ Surface Range, page 154
Changing the vertical resolution
The vertical resolution of the echogram increases with a shorter
pulse length.
53
Page 66

EA 400
For example, a pulse length of 1.024 millisecond gives a vertical
resolution of 19.2 cm, whereas a pulse length of 0.256
millisecond gives a vertical resolution of 4.8 cm. If the vertical
distance between two echoes is less than this, the two echoes
will be shown as one
To change the pulse length:
1 Position the cursor over the frequency information in the
Header view, and click the right mouse button.
-TheTransceiver Settings dialogue box opens.
2 Move the pulse length slider to the desired pulse length
value.
3 Click Ok.
or:
1 Left-clickintheHeader view, and select the Transceiver
Settings dialogue box from the pop-up menu.
2 Make the required changes.
A small value gives the best resolution, while larger values are
mostly used for surveys in deep waters.
Related topics
→ Header view, page 30
→ Transceiver Settings, page 160
Changing the transmit power
To change the transmit power:
1 Position the cursor over the frequency information in the
Header view, and click the right mouse button.
-TheTransceiver Settings dialogue box opens.
2 Move the transmit power slider to the desired value.
3 Click Ok.
or:
1 Left-clickintheHeader view, and select the Transceiver
Settings dialogue box from the pop-up menu.
54
2 Make the required changes.
Related topics
→ Header view, page 30
→ Transceiver Settings, page 160
857-160981 / J
Page 67

Operational procedures
Setting minimum and maximum depth
Setting the minimum and maximum depth controls where the
echo sounder will search for bottom lock.
Note Setting both Minimum Depth and Maximum Depth to 0 m will
turn off bottom detection.
1 Position the cursor over the depth information in the
Header view, and click the right mouse button.
-TheBottom detector dialogue box opens.
2 Set minimum and maximum depth to the desired values.
3 Click Ok.
or:
1 Left-clickintheHeader view, and select the Bottom
Detector dialogue box from the pop-up menu.
2 Make the required changes.
Related topics
→ Header view, page 30
→ Bottom Detector, page 93
Enabling the depth alarms
You can set individual alarms for minimum and maximum
depth. Y ou can also enable an alarm to sound off if the bottom
track is lost.
1 Position the cursor over the depth field in the
view, and click the right mouse button.
-TheBottom detector dialogue box opens.
2 Set the values for minimum and maximum depth alarm.
3 Enable the alarms by ticking the appropriate boxes.
4 Enable the BottomLostWarningif required.
5 Click Ok.
or:
1 Left-clickintheHeader view, and select the Bottom
Detector dialogue box from the pop-up menu.
Header
857-160981 / J
2 Make the required changes.
Related topics
→ Header view, page 30
→ Bottom Detector, page 93
55
Page 68

EA 400
Adding annotations
You can add several different annotations to the displayed and
printed information. All annotations are automatically
displayed, while you need to enable the annotations to be
printed.
Enable annotations to be printed
1 Select Print on the File menu.
-ThePrinter and History dialogue box opens.
2 Under Text to printer, click Annotation.
3 Click OK to exit.
The annotations will be printed until this procedure is repeated.
Enter annotations
Three different annotations may be controlled from the
Annotations dialogue box.
1 Select Annotation on the File menu.
-TheAnnotation dialogue box opens.
2 To enter a single text annotation to the display:
a Enter the desired annotation text into the Text box
b Click OK.
c The text you entered is displayed immediately, but it
will not be repeated.
3 To add the current time as an annotation:
a Under Time, click Active.
b Enter the desired interval (in seconds) between the
annotations.
c Click OK.
d The annotation will be repeated at the chosen interval
until it is switched off.
4 To add an event annotation:
a Under Event, select a start number.
56
b Click Increase or Decrease to count the Event number
up or down.
c Click Add Time if you wish the event annotation to
include the current time.
d Click Add Navigation if you wish the event annotation
to include the current position.
857-160981 / J
Page 69

Operational procedures
e Click the Event buttonontheStatus bar every time
you wish the annotation to be added to the display
and/or print.
Enable external annotations
The echo sounder will accept external text annotations when
these are input on the serial line and Ethernet. This function is
permanently enabled.
Related topics
→ Annotation, page 90
→ Printer and History, page 129
→ Annotation format, page 91
857-160981 / J
57
Page 70

EA 400
Transceiver installation
Overview
Use the following procedures to install, modify or delete
frequency channels from the echo sounder set-up.
General Purpose Transceivers (GPT) physically connected to the
echo sounder’s Ethernet interface are identified automatically by
the system. When you open the Transceiver Installation
dialogue box from the Install menu, a list will be provided.
A single frequency transceiver occupies one entry in the list, and
a dual frequency transceiver occupies two. Each entry is
identified as a frequency channel, and the line displays the
parameters for the channel. Entries in the frequency channel list
are shown in black, green or red colour identifying its current
status.
To install a channel
1 Select Transceiver on the Install menu.
2 Select Modify in the Transceiver Installation Mode
dialogue box.
-TheTransceiver Installation dialogue box opens, and
you are allowed to make changes.
3 Click the desired entry (one of the black colour line
alternatives) in the Frequency Channel Selection list.
4 Assign a transducer by selecting a transducer name in the
Transducer Selection list.
5 Click OK to accept the choice and exit the dialogue box.
6 Restart the echo sounder as described below.
To uninstall a channel
1 Select Transceiver on the Install menu.
2 Select Modify in the Transceiver Installation Mode
dialogue box.
-TheTransceiver Installation dialogue box opens, and
you are allowed to make changes.
58
3 Click the desired entry in the Frequency Channel
Selection list.
4 Select the alternative NONE in the Transducer Selection
list.
5 Click OK to accept the choice and exit the dialogue box.
857-160981 / J
Page 71

Operational procedures
6 Restart the echo sounder as described below.
To modify an IP address
This procedure allows you to modify the IP address of the
currently selected General Purpose Transceiver (GPT).
1 Select Transceiver on the Install menu.
2 Select Modify in the Transceiver Installation Mode
dialogue box.
-TheTransceiver Installation dialogue box opens, and
you are allowed to make changes.
3 Select the General Purpose Transceiver (GPT) you wish to
modify.
4 Click the Set New GP T IP Address button.
-TheIP Address dialogue box opens.
5 Enter the new IP address.
- The significance of the address numbers is described
with the IP Address dialogue box.
6 Click OK to accept the choice and exit the dialogue box.
7 Click OK to exit the Transceiver Installation dialogue
box.
8 Restart the echo sounder as described below.
Related topics
→ Transceiver Installation, page 158
→ IP Address, page 115
Restart the echo sounder
Whenever a change has been made to any of the frequency
channels, you must restart the echo sounder.
1 Select Operation on the File menu.
-TheOperation dialogue box opens.
2 Select Normal operation, and click OK.
857-160981 / J
Related topics
→ Operation, page 126
59
Page 72

EA 400
Record and playback
Overview
You can set up the echo sounder to record the unprocessed
transducer signals on the internal harddisk or other recordable
media. This recorded signal may later be injected into the echo
sounder’s processing software as if it arrived directly from the
transceiver.
During this replay, you may experiment with some of the echo
sounder settings.
This feature is useful during training and demonstration. It is
also useful for memorising a particularly interesting observation
from the survey.
You can also use the built-in History functiontorecord
echogram data.
Record
Preparations
The recording is prepared as follows.
1 Select Store on the File menu.
- Observe the Store dialogue box appear.
2 Select the complete path of the survey directory.
- The directory is selected when you click the OK
button. Click the Browse button if you wish to navigate
through the disk directories. A new directory is created
if the requested does not exist.
3 Select if you wish to save raw data, output data, xyz data,
echogram data, text data or feoref data:
- Raw data: The unprocessed transceiver data are stored
in standard computer files. These files contain all the
necessary data for r econstruction of the situation during
the real survey. Thus the data include amplitude, phase,
navigation data, annotation input etc. The echo sounder
program reads these files during replay.
- Output data: This is the processed output data;
navigational data, bottom detections, annotations etc
- xyz data: This is processed and interpolated xyz data
in ASCII format. Note that navigation input must be
available.
- Echogram data: This is user defined excerpts of the
processed sample data (pixel data), ie the backscatter
value of the targets. The echograms are stored as time
tagged datagrams in separate files.
60
857-160981 / J
Page 73

- Text data: This is stored depth data and raw navigation
data in ASCII format.
Note Navigation input must be available.
- Georef data: This is the stored vessels interpolated
position lat/long, heading across range and depth. In
the vertical view, only lat/long and depth..
4 Enter the maximum size of the storage files.
5 Select the initial line number.
6 Enter the maximum size of each replay file.
7 Click Ok.
Start recording
Operational procedures
Use the Line fieldintheStatus bar to start the recording.
1 Position the cursor over the Line field.
2 Press the left mouse button.
The line number increments, and the Line field is presented
with a red colour.
Stop recording
To stop the recording:
1 Click the Line field once again.
- The original colour is restored.
The recording may also be stopped from a remote position if
this function has been made available.
Size of stored raw data
The total size of raw data files stored on disk during operation
depends on several user selections. From these selections you
may estimate approximately the total amount of raw data stored
in a given time period for each installed channel using the
following equation:
857-160981 / J
X =(B bytes per sample) S ((8 S R) / (c S tau samples per ping))
S (M ping per sec) S 24 S (3600 sec per day) S (K days)
Where:
X = Total amount of stored raw data in bytes for one channel
B = 2 (Given by the echo sounder)
R = Maximum range in meters (User set)
61
Page 74

EA 400
c = Sound speed in water in meters per sec (User set)
tau = Pulse duration in seconds (User set)
M = Ping rate in ping per seconds (User set)
K = Number of operating/storage days (User set)
Thus, you can affect the amount of stored raw data by changing
e.g. the range, pulse duration, and ping rate settings.
Example:
With range = 10 m, pulse length = 256 μS, 15 pings per second
and sound velocity = 1500 m/s, the storage requirement will be
45 Mb per hour. If you increase the range to 80 m, and reduce
the ping rate to 7 pings per second, the storage requirement will
be 60 Mb per hour.
Related topics
→ Store, page 148
→ Status bar and Line field, page 83
Playback
When replaying the recorded signal, the ping rate is not limited
by the speed of sound in water. Hence, a higher ping rate is
possible during replay than during normal operation.
The playback is started as follows:
1 Select Operation on the File menu.
- Observe the
2 Click Replay.
3 Click Files...
- Observe the Replay dialogue box appear.
4 Select survey with the standard file selection dialogue.
5 Click on the file(s) you wish to replay.
- Observe that the currently selected file(s) appear in the
Selected files list box.
6 Click Loop if you wish the replay to loop through the
selected file(s) endlessly.
Operation dialogue box appear.
62
7 Click Save Data if you wish to record the file(s) in
processed format during playback.
8 Click Change Installation if you wish to change sensor
setup values, x, y, z or draught.
9 Click Change SVP Profile if you wish to change the
sound velocity profile during replay.
857-160981 / J
Page 75

Operational procedures
10 Click OK to return to the Operation dialogue box.
11 In the Operation dialogue box, click OK to start the
playback.
If you do not select Loop, the replay is stopped when the last
recorded ping has been processed.
Related topics
→ Operation, page 126.
→ Replay, page 136.
→ Reprocess heave, page 139.
History
The History function is used to store echograms on bitmap
format. The echo sounder may continuously save echogram
pictures to the internal harddisk or an other recordable media.
These can later be recalled on the display. The information in
the History window is the same as on the printer.
The horizontal width of each echogram picture roughly
corresponds to the the half width of t he display. The information
is stored as separate data files on the harddisk, and only the disk
size limits the space for History files. The history function
allows you to quickly look through echogram pictures covering
several hours.
Record
The History recording can either be started with the procedure
described below, or simply be pressing the History button on
the Status bar. The text in the Status shifts to red when the
recording is active.
To start History recording:
1 Select Operation on the File menu.
- Observe the Operation dialogue box appear.
2 Click Browse to select disk directory.
- Default directory is EA 400\history\
3 Create a new directory if required.
4 Click Save in the History field, or
857-160981 / J
5 Optionally, click Synchronize with logfile in the History
field.
- The history f iles will switch as the data log files are
switched.
6 Click Ok to start the recording.
63
Page 76

EA 400
- The text in the History field on the Status bar is red
while recording takes place.
Alternative method for History recording:
1 Select Operation on the File menu.
- Observe the Operation dialogue box appear.
2 Optionally, click Synchronize with logfile in the History
field.
- The history f iles will switch as the data log files are
switched.
3 Click Browse to select disk directory.
4 Click the History buttonontheStatus bar to start the
recording.
- The text in the History field on the Status bar is red
while recording takes place.
To stop History recording:
1 Select Operation on the File menu.
- Observe the Operation dialogue box appear.
2 De-select Save.
3 Click Ok.
Playback
To view the information recorded by the History function:
1 Select History on the View menu.
2 Browse the information in the History dialogue box.
The infor mation provided by the History view is presented in a
separate window. The echo sounder will operate normally in the
background. However, you will not have access to any of the
menues as long as the History window is open. When you wish
to focus on the echo sounder operation, close or minimize the
History window.
Print the current History information
To print the current view in the History window:
1 Select History on the View menu.
2 Press the printer symbol in the bottom right corner to print
a single history file.
- Note that only the file presented on the display is
printed.
64
Print multiple History files
To print several images recorded by the History function,
follow this procedure.
857-160981 / J
Page 77

Operational procedures
A
(CD5639A)
B
(A) Press to print current view
(B) Press to print multiple views
1 Select History on the View menu.
2 Browse the information in the History dialogue box until
you find the images you wish to print.
3 Press the left printer icon (with the + sign) in the lower
right corner of the History window.
4 Press the Ctrl key on the keyboard and the left mouse
button simultanously to select the images to be printed.
5 Press the right mouse button, observe the shortcut menu.
6 On the shortcut menu, select Print.
857-160981 / J
7 Press Cancel to close t he dialogue box.
Related topics
→ History window, page 37
→ History, page 114
65
Page 78

EA 400
→ Status bar; page 83
→ Operation; page 126
66
857-160981 / J
Page 79

Software installation and upgrades
Overview
The echo sounder is initially delivered with all necessary
software installed and configured. Software upgrades are useful
if your echo sounder fails, and you suspect a software error. An
upgrade is also required whenever the echo sounder software is
modified.
The computer should automatically detect the insertion of the
CD-ROM and open the Installation program dialogue box. If
this is not the case, you must manually run the Setup.exe
program on the CD-ROM’s root directory.
When the echo sounder software is upgraded, the software will
automatically detect the presence of General Purpose
Transceiver(s), but you will need to check that the correct
transducer(s) are enabled.
Operational procedures
Whenever new echo sounder software is installed, you will need
to define all serial lines, transducer(s) and transceiver(s).
Related topics
→ Transceiver installation procedure, page 58.
Software installation procedure
Use this procedure if you need to install the software on a new
computer. Note that minimum hardware and software
requirements must be met by the computer.
1 Power up the computer.
2 Insert the EA 400 CD-ROM.
3 Observe the Installation program dialogue box open.
4 Press Complete installation.
5 Allow the echo sounder installation to run. Follow the
instructions provided.
Do not remove the CD until the computer has powered up and
rebooted after the installation.
857-160981 / J
Software upgrade procedure
Use this procedure if you wish to reinstall the software, or
receive a new CD-ROM with a software upgrade.
1 Power up the computer, and allow the EA 400 to start.
2 Close the EA 400 program by selecting File - Exit.
67
Page 80

EA 400
3 Insert the EA 400 CD-ROM.
4 Observe the Installation program dialogue box open.
5 Press Update installation.
6 Allow the echo sounder files to be copied from the
CD-ROM to the computer’s hard disk.
Do not remove the CD until the computer has powered up and
rebooted after the installation.
Un-installation procedure
Use this procedure if you need to remove all the echo sounder
software from the computer. Note that all data in the EA 400
directory will be erased.
1 Power up the computer.
2 Insert the EA 400 CD-ROM.
3 Observe the Installation program dialogue box open.
4 Press Uninstall.
5 Allow the echo sounder un-installation program to run.
Follow the instructions provided.
68
857-160981 / J
Page 81

Sensor setup
Operational procedures
Overview
In order to ensure that the data from the vessel’s heave sensor
are interpreted and used correctly by the echo sounder, you must
position the heave sensor’s location in respect to the transducer.
Both locations are then referenced to the vessel’s global
Reference point.
Figure 6 The Vessel Coordinate system
3
-X
+Y
4
7
2
3
D
C
(
(1) Downwards (2) Starboard (3) Forward
(R) Reference point
The theory
A main function of the parameters required for system
installation is to inform the system of the relative positions
between the various sensors and the angular orientation of the
sensors with respect to the vessel. A reference point somewhere
on the vessel has to be selected, and a Cartesian right-handed
coordinate system - as shown in the figure below - must be
defined with its origin in the reference point. The location of
this reference point has no physical significance - it may be
anywhere on the vessel. The placement of the various
instruments must be identified with forward, starboard and
downward coordinates in this coordinate system.
1
-Z
2
)
B
-Y
R
+X
+Z
857-160981 / J
The forward axis (X) must be parallel to the vessel keel, and the
downward axis (Z) must be vertical when the vessel is trimmed
normally. The plane defined by the forward and starboard axes
will then be horizontal, and the attitude sensor should then, if
properly installed and calibrated, measure zero roll and pitch
with a normally trimmed vessel lying still.
69
Page 82

EA 400
• Forward position (X) - Forward position is defined on the
X-axis (refer to the illustration below). Locations further
forward than the reference point are positive.
• Downward position (Z) - Downward position is defined on
the Z-axis (refer to the illustration above). Locations below
the reference point are positive.
• Starboard position (Y) - If a sensor location is on the
starboard side of the reference point, the value will be
positive.
Figure 7 Sensor
locations (example)
(CD3514C)
5
-X +X
-Z
3
2
R
4
1
+Z
(1) Transducer (2) Motion sensor (3) GPS antenna
(4) Draught (5) Water line (R) Reference point
Procedure
70
1 Start the echo sounder, and make sure that normal
operation is activated (not Replay).
2 Open the Heave Sensor dialogue box from the
Installation menu.
3 Click the Sensor setup button, and observe the Sensor
Setup dialogue box appear.
4 Enter the coordinate values.
5 Click OK in both dialogue boxes to save the settings.
Related topics
→ Heave Sensor, page 111.
→ Sensor Setup, page 142.
857-160981 / J
Page 83

Sidescan
Operational procedures
Overview
To use the Sidescan facility, you will need one or two extra
transducers. If dedicated sidescan transducers are mounted,
these must be installed facing sideways in a suitable angle. 120
and 200 kHz transducers have been specially designed for this
purpose.
With only a few simple commands, you will turn your EA 400
into a “side looking sonar”.
857-160981 / J
Figure 8 Typical dual sidescan view
Starting a sidescan survey
1 When starting a sidescan survey for the first time, both
transducers are presented in views tiled horizontally. Hide
the depth view of the lower sidescan display by moving
the horizontal boundary line downwards.
2 Hide the scope view of the upper sidescan echogram by
moving the vertical boundary towards right.
71
Page 84

EA 400
3 In the upper echogram, click the right mouse button to
open the Echogram dialogue box.
4 Select Sidescan. The upper echogram will scroll
vertically.
5 Identify whether the upper sidescan echogram displays the
port or starboard transducer by selecting Port or
Starboard.
6 For a dual system, import the lower echogram into the
upper sidescan echogram. First select the second channel
from the drop-down menu, then click the Import box.
7 Click Ok. Both sidescan echograms will now show
side-by-side in the upper view.
8 In the upper echogram, click left mouse button over the
depth readout in the Header view to open the Bottom
detector dialogue box.
9 Set Maximum depth to zero, and click Ok.
10 Set Maximum depth to zero in the lower echogram as
well.
11 Hide the second channel in the lower view. Select Layout
in the View menu. Set up the echo sounder to allow only
the first sidescan channel to be shown, and click Ok.
If you do any other changes to the echo sounder parameters,
make sure that these parameters are set identical in both
echogram views. All changes made to parameters and views will
be stored when closing the EA 400.
You may wish to view the echograms using a grayscale
presentation, as this will enhance the sidescan view.
Insert label name
1 In the sidescan echogram, click the right mouse button
over the frequency in the Header view to open the
Transceiver Settings dialogue box.
2 In the Label field, enter a suitable description, and click
Ok.
72
Observe that the label is placed next to the frequency
information in the Header view.
Superimpose the current depth
If your echosounder is equipped with a third (or fourth) channel
and a transducer pointing straight down, you can superimpose
the current depth into the sidescan view.
857-160981 / J
Page 85

Operational procedures
1 Click the right mouse button in one of the two echograms
to open the Echogram dialogue box.
2 Enable Ext.depth (external depth), and select a transducer
frequency from the drop-down list.
3 Select Show annotation.
4 Click Ok.
Observe a red line appear on the echogram. The annotation lines
indicate the depth value. Additional in the header view, the
current depht is displayed in red (external depth).
You can also set up a third echogram channel to observe the
depth. This is done by selecting Layout on the View menu, and
then enabling a third channel.
Finishing the sidescan survey
1 In the top echogram, click the left mouse button to open
the Echogram dialogue box. De-select Sidescan,and
click OK.
2 Restore the other echo sounder setting to suit your
preferences.
Related topics
→ Echogram, page 100
→ Layout, page 118
→ Transceiver Settings, page 160
857-160981 / J
73
Page 86

EA 400
REFERENCE GUIDE
Overview
This chapter describes the menus and dialogue boxes in detail.
Related topics
→ Echo sounder menus, page 75
→ Dialogue boxes, page 85
→ Status bar, page 83
74
857-160981 / J
Page 87

Menus
Reference guide
Main menu
The Main menu contains the following options:
→ File, page 76
→ V iew, page 77
→ Options, page 78
→ Interfaces, page 80
→ Install, page 81
→ Help, page 82
→ Status Bar, page 83
→ Step, described below.
Note that a number of dialogue boxes are accessed directly
using right-click on certain display fields.
Step!
In single-step mode you command the echo sounder to perform
one ping at a time by left-clicking the Step command. This
command does not activate any separate menus or dialogue
boxes.
You can also press Alt+S on the keyboard to make one ping.
See the Operation dialogue box for further details.
Related topics
→ Direct access to dialogue boxes, page 27
→ Operation, page 126
857-160981 / J
75
Page 88

EA 400
File menu
The following commands are available on the File menu:
→ Operation, page 126
→ Store, page 148
→ Annotation, page 90
→ Print, page 129
→ Exit, page 76
Operation
This command option opens the Operation dialogue box. Use
these parameters to set echo sounder ping mode parameters;
normal/replay, ping interval etc.
Store
This command option opens the Store dialogue box. Use this
dialogue box to record data.
Annotation
This option opens the Annotation dialogue box. In this dialogue
box you can enter an annotation text message to be printed on
the echogram and/or saved to the current file.
Print
This command option opens the Printer and History dialogue
box. Use it to set printer parameters controlling echogram
printout on paper.
Exit
Select this command to terminate the echo sounder program.
Note You must always use this command before you turn off power!
76
857-160981 / J
Page 89

Reference guide
View menu
The View menu contains the following options:
→ Layout, page 118
→ History, page 114
Layout
This command opens the Layout dialogue box. Use it to modify
the layout of frequency channels on the display.
History
This command opens the History dialogue box. This is used to
activate a dialogue for viewing previously recorded echograms.
857-160981 / J
77
Page 90

EA 400
Options menu
The following commands are available on the Options menu:
→ Language, page 117
→ Depth unit, see below
→ Temperature unit, see below
→ Palette, see below
→ Beeper, see below
→ Save settings, see below
→ Restore settings, see below
→ Factory Settings, page 109
→ Load User Settings, page 119
→ Store User Settings, page 152
→ Replay Control, page 138
→ Status Window, page 147
Language
This entry opens the Language dialogue box for language
selection.
Depth unit
All depth values are expressed in meters, English feet (1 ft =
0.3048 m), nautical fathoms (1 ftm = 1.852 m) or Italian Passi
Braccia (1 pb = 1.65 m). The Depth Unit entry activates a
submenu to select one of these alternatives.
Temperature unit
Water temperature is shown in degrees Celsius or degrees
Fahrenheit on the Status Bar.TheTemperature Unit entry
activates a submenu to select one of the two alternatives.
78
Palette
Different light intensities on the display are provided according
to IMO (International Maritime Organisation)
recommendations. A bright display is required on a sunny
summer day, and a low light intensity is required at night in
order not to ruin the night vision of the crew at the bridge of the
vessel. The Palette entry activates a submenu to select the
display brightness.
857-160981 / J
Page 91

Reference guide
Beeper
This entry activates a submenu to control when the audible
warning signal is active to alert about status messages and
alarms. No dialogues are provided.
Save settings
The echo sounder memorises all its parameter settings between
power is turned off until it is turned on again at a later time. The
Save Settings entry writes a snapshot of all parameter settings
into static memory. No dialogues are provided.
Restore settings
This entry reads parameter settings from static memory into the
echo sounder application. No dialogues are provided.
Factory settings
This entry copies the default factory settings back into the
sounder. A proper clean-up of the complete menu system is
sometimes required in order to escape from unintentional
deadlocks. A dedicated dialogue box is used to acknowledge the
function.
Load user settings
This entry allows you to load your previously stored personal
settings. A dedicated dialogue box is provided.
Store user settings
This entry allows you to save your current settings to an
identified file on the computer harddisk. A dedicated dialogue
box is provided.
Replay control
This entry provides “cassette recorder” type control buttons to
be used during replay. It is also used to scroll and store new .raw
files.
857-160981 / J
Status window
This entry opens the Status Window, which provides current
information about the echo sounder settings.
79
Page 92

EA 400
Interfaces menu
The following commands are available on the Interfaces menu:
→ Network Interface, page 123
→ Serial Interface, page 143
→ Remote Display, page 134
→ Raw Data, page 133
Network Interface
This command option opens the Network Interface dialogue
box. The parameters in this dialogue box are used to define the
network settings for the input and output of data.
Serial Interface
This command option opens the Serial Interface dialogue box.
The parameters in this dialogue box are used to define the serial
line settings for the input and output of data.
Remote Display
This command option opens the Remote Display dialogue box.
The parameters in this dialogue box are used to define the use of
aremotedepthdisplay.
Raw Data
This command option opens the Raw Data dialogue box. This
dialogue box is used to export raw data to a EA Classification
software.
80
857-160981 / J
Page 93

Reference guide
Install menu
The following commands are available on the Install menu:
→ Transceiver, page 158
→ Environment, page 105
→ Navigation, page 120
→ Heave, page 111
→ Temperature, page 157
→ Heading, page 110
→ SVP Dialog, page 155
Transceiver
This command opens the Transceiver Installation dialogue box.
Use this to install a new transceiver, and to assign a transducer
to each frequency channel.
Environment
Select this command to open the Environemnt dialogue box.
The settings here are used to select water salinity, sound velocity
and water temperature.
Navigation
This command opens the Navigation Interface dialogue box. In
this box, you can select communication parameters for the
NMEA interface, and select input/output telegrams.
Heave
This command opens the Heave Sensor dialogue box. It is used
to select heave input source; analogue or RS-232.
Temperature
This command option opens the Temperature Sensor dialogue
box.
Heading
857-160981 / J
This command opens the Heading dialogue box. It is used to
select a heading input telegram.
SVP Dialog
This command opens the svp dialoge box. It is used to select
realtime svp input telegram.
81
Page 94

EA 400
Help menu
The Help menu contains the following options:
• Contents
• About the echo sounder
Contents
This command opens the on-line user manual. This user manual
is an HTML based document compiled to the CHM format
designed by Microsoftt.
The content of the on-line user manual is identical to the content
of the EA 400 Operator Manual.
The on-line manual is also accessed directly as context sensitive
help from the various dialogue boxes used throughout the echo
sounder software.
About the echo sounder
This command opens the About box. This box is f or
information only. It provides the current software version and
the copyright information.
82
857-160981 / J
Page 95

Status Bar
Reference guide
The Status Bar displays status messages, event number, printer
active symbol, temperature, survey line number, navigational
data, time of day and ping replay timer.
1234
The following information is provided on the Status bar:
1 Information - Various messages are displayed in this
field; warnings, status, information text.
2 Event - This field implements a push button for
generating an annotation of the event type. The event
number is automatically incremented or decremented by
one for each new event. The current event number is
displayed. An external Event toggle switch can also be
physically connected to the General Purpose Transceiver
(GPT).
3 Printer - A printer symbol is displayed whenever
echogram printing is active. Printing is delayed until the
echogram page has been completed.
4 Temperature - Water temperature is displayed in degrees
Celsius or in degrees Fahrenheit provided a temperature
sensor is connected to the system.
5
6
8
(CD674 4E / BM300 D )
7
857-160981 / J
5Line-This field acts as a toggle button. A left-click starts
the recording of a new survey line, and another left-click
terminates the recording of data. The survey line number
is automatically incremented (or decremented) by one
every second left-click. The current survey line number is
displayed on the button face. This line number is shown
with red colour during recording. The Line toggle button
can also be activated from a remote position if this
function was enabled during the installation.
6 History - ThisfieldisusedtostartandstopHistory
recording. Press the field to start recording History files,
and press again to stop,. The text is red when the
recording is active.
7 Navigational data - Geographical latitude and longitude
from the navigation receiver is displayed.
83
Page 96

EA 400
8Time-Local time of day is displayed. A small popup
window showing the current date appears when
positioning the cursor inside the time field. During replay,
this field is used as a timer.
Related topics
→ Recording procedure, page 60
→ Store, page 148
→ Print and History, pages 129
→ Print Setup, page 131
84
857-160981 / J
Page 97

Operator manual
Dialogue boxes
Introduction
The following chapters describe in detail all the dialogue boxes used in the EA 400
echo sounder. The dialogue boxes are presented in alphabetical order.
→ Advanced Navigation, page 86
→ Advanced Transceiver, page 88
→ Annotation, page 90
→ Bottom Detector, page 93
→ Bottom Range, page 95
→ Colour Scale, page 96
→ Depth Output, page 98
→ Echogram, page 100
→ Echogram Parameters, page 104
→ Environment, page 105
→ Exit, page 76
→ Factory Settings, page 109
→ Heading, page 110
→ Heave Sensor, page 111
→ History, page 114
→ IP Address, page 115
→ Language, page 117
→ Layout, page 118
→ Load User Settings, page 119
→ Navigation Interface, page 120
→ Network Interface, page 123
→ Operation, page 126
→ Printer and History, page 129
→ Print Setup, page 131
→ Raw Data, page 133
→ Remote Display, page 134
→ Replay, page 136
→ Replay control, page 138
→ Reprocess heave, page 139
→ RS-232 Setup, page 141
→ Sensor setup, page 142
→ Serial Interface, page 143
→ Sidescan Range, page 146
→ Status window, page 147
→ Store, page 148
→ Store user settings, page 152
→ Surface Range, page 154
→ SVP Editor, page 156
→ Real time SVP smart sensor, page 155
→ Temperature Sensor, page 157
→ Transceiver Installation, page 158
→ Transceiver Settings, page 160
857-160981 / J
85
Page 98

EA 400
Advanced Navigation
The Advanced Navigation dialogue box is accessed from the
Navigation Interface dialogue box. The Navigation Interface
dialogue box is in turn available from the Install menu.
NMEA Position sentence
These boxes specify which type of NMEA navigation sentence
should be automatically interpreted.
If ASCII has been chosen in the Navigation Interface dialogue
box, these settings will be unavailable.
ASCII Setup
Use this protocol if you wish to receive data on ASCII format.
If NMEA has been chosen in the Navigation Interface
dialogue box, these settings will be unavailable.
Decoding is based on a user specified datagram identification.
The information substring within the datagram may be
identified by specifying the position of the start field, the
number of fields to be extracted and the field separator.
Start sequence - Maximum six characters used to identify the
type of input. The question marks are used as “wild card”
characters. You can enter any format you wish.
86
857-160981 / J
Page 99

Operator manual
No. of fields - Identify the total number of fields in t he ASCII
message.
Start field - Identify which of the fields in the message is the
start field.
Field separator -Identify which ASCII character is used to
separate the fields in the message.
Terminator - Identify which character is used to terminate the
message.
Related topics
→ Navigation Interface, page 120
→ Data formats, page 189
857-160981 / J
87
Page 100

EA 400
Advanced Transceiver
This dialogue box is accessed from the Transceiver Settings
dialogue box. It displays detailed numeric information
characterising the channel. This includes transducer parameters,
exact transmit frequency and receiver processing parameters.
Parameters
The parameters shown in this dialogue box are determined
during the transceiver installation procedure.
Frequency [Hz] -This is the nominal resonant frequency for
the transducer.
Beam type - Three different transducer beam types are
available: Single, Split and Triple. If your system is capable of
operating a Split- or Triple beam transducer, it will also be able
to measure the position of a target in the beam. The echo
sounder can then compensate for the known beam pattern to
obtain a true target strength.
Gain [dB] - The transducer gain presented by calculating the
directivity multiplied with the transducer’s efficiency. The value
is obtained during system calibration. If no calibration takes
place, the manufacturer’s default setting is used.
Two-way beam angle [dB] - This is a key transducer
parameter. The value describes the solid angle at the apex of the
ideal conical beam.
88
Sa Correction [dB] -This parameter is not shown on the EA
400.
857-160981 / J
 Loading...