

Page 1
Competitive BenChmarking
©Kodak, 2009. Kodak is a trademark of Kodak.
All testing conducted in quality assurance labs at Kodak’s Document Imaging headquarters facility, 2600 Manitou Road, Rochester, NY from November 18th, 2008–December 11th, 2008.
Kodak i780 Scanner vs. Canon DR-X10C Scanner
Kodak i780 Scanner
Table of Contents
Speed and throughput
Speed and throughput appendix
Image and data integrity
Image and data integrity appendix
Sensor durability
➡
➡
➡
➡
➡
Canon DR-X10C Scanner
Misfeed management
Misfeed management appendix
Real-world environment
Real-world environment appendix
➡
➡
➡
➡
Count on Kodak for consistent and true performance.
Count out Canon.
Page 2
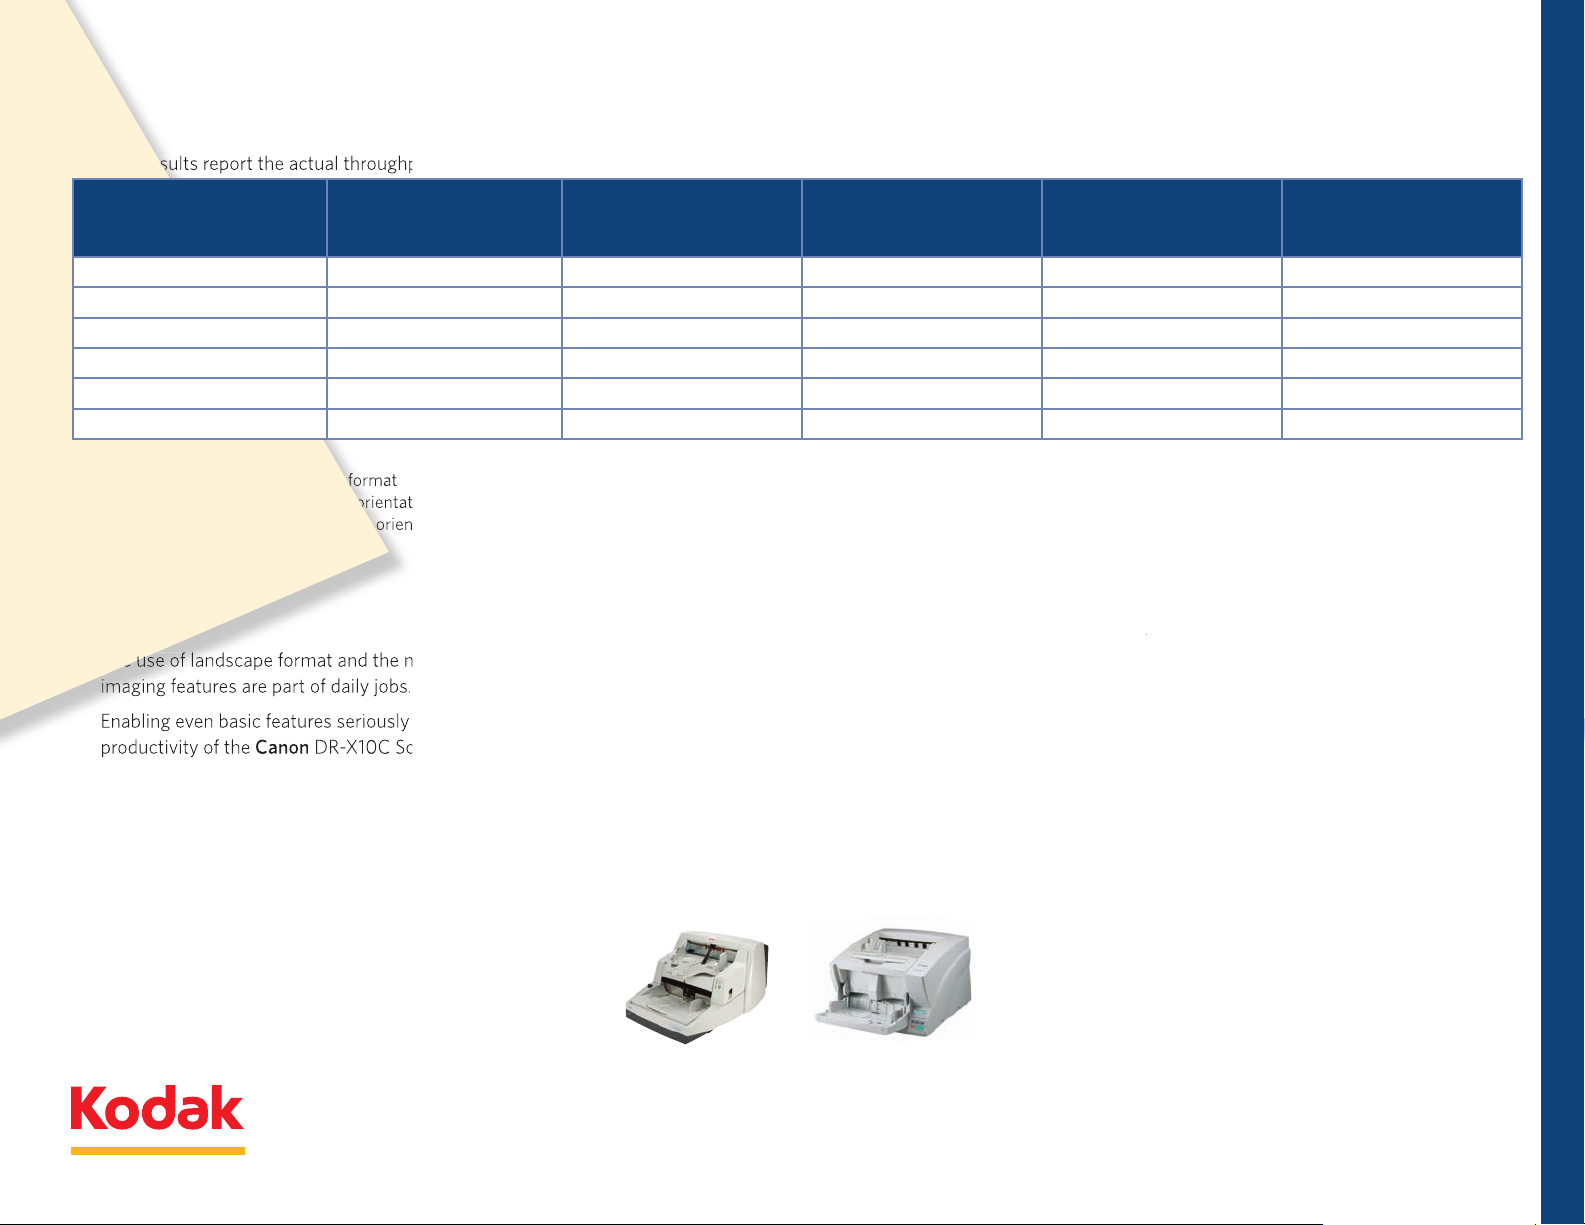
The test results report the actual throughput of each scanner using real-world scanner configurations.
1)
200 dpi, Bitonal, Duplex*
124.8 ppm
84.6 ppm
51.7 ppm
47%
141%
2)
300 dpi, Bitonal, Duplex*
126 ppm
39.8 ppm
52.4 ppm
217%
140%
3)
300 dpi, Bitonal, Simplex*
124.9 ppm
89.9 ppm
97.2 ppm
38%
28%
4) 200 dpi, Color, Duplex**
121.4 ppm
58 ppm
42.1 ppm
109%
188%
5) 300 dpi, Color, Duplex**
125.2 ppm
28.7 ppm
38.2 ppm
336%
227%
DR-X10C Scanner.
DR-X10C Scanner’s speed with the
DR-X10C Scanner productivity
Scanner.
i780 Scanner outperforms the
continues to have a detrimental eect on
Speed and throughput
i780 Scanner delivers speed, throughput
DR-X10C Scanner
Kodak i780 Scanner vs. Canon DR-X10C Scanner
Test 1 through 6 Settings Kodak i780 ISIS Results DR-X10C VRS Results DR-X10C ISIS Results
Testing observations and conclusions
i780 % performance
increase over
DR-X10C VRS
Competitive knockouts
i780 % performance
increase over
DR-X10C ISIS
Competitive BenChmarking
•
Kodak i780 Scanner
Canon DR-X10C Scanner
Count on Kodak for consistent and true performance.
Methodology
➡
➡
Count out Canon.
Page 3
Appendices
0
1000
2000
3000
4000
5000
6000
7000
8000
1 2 3 4 5 6
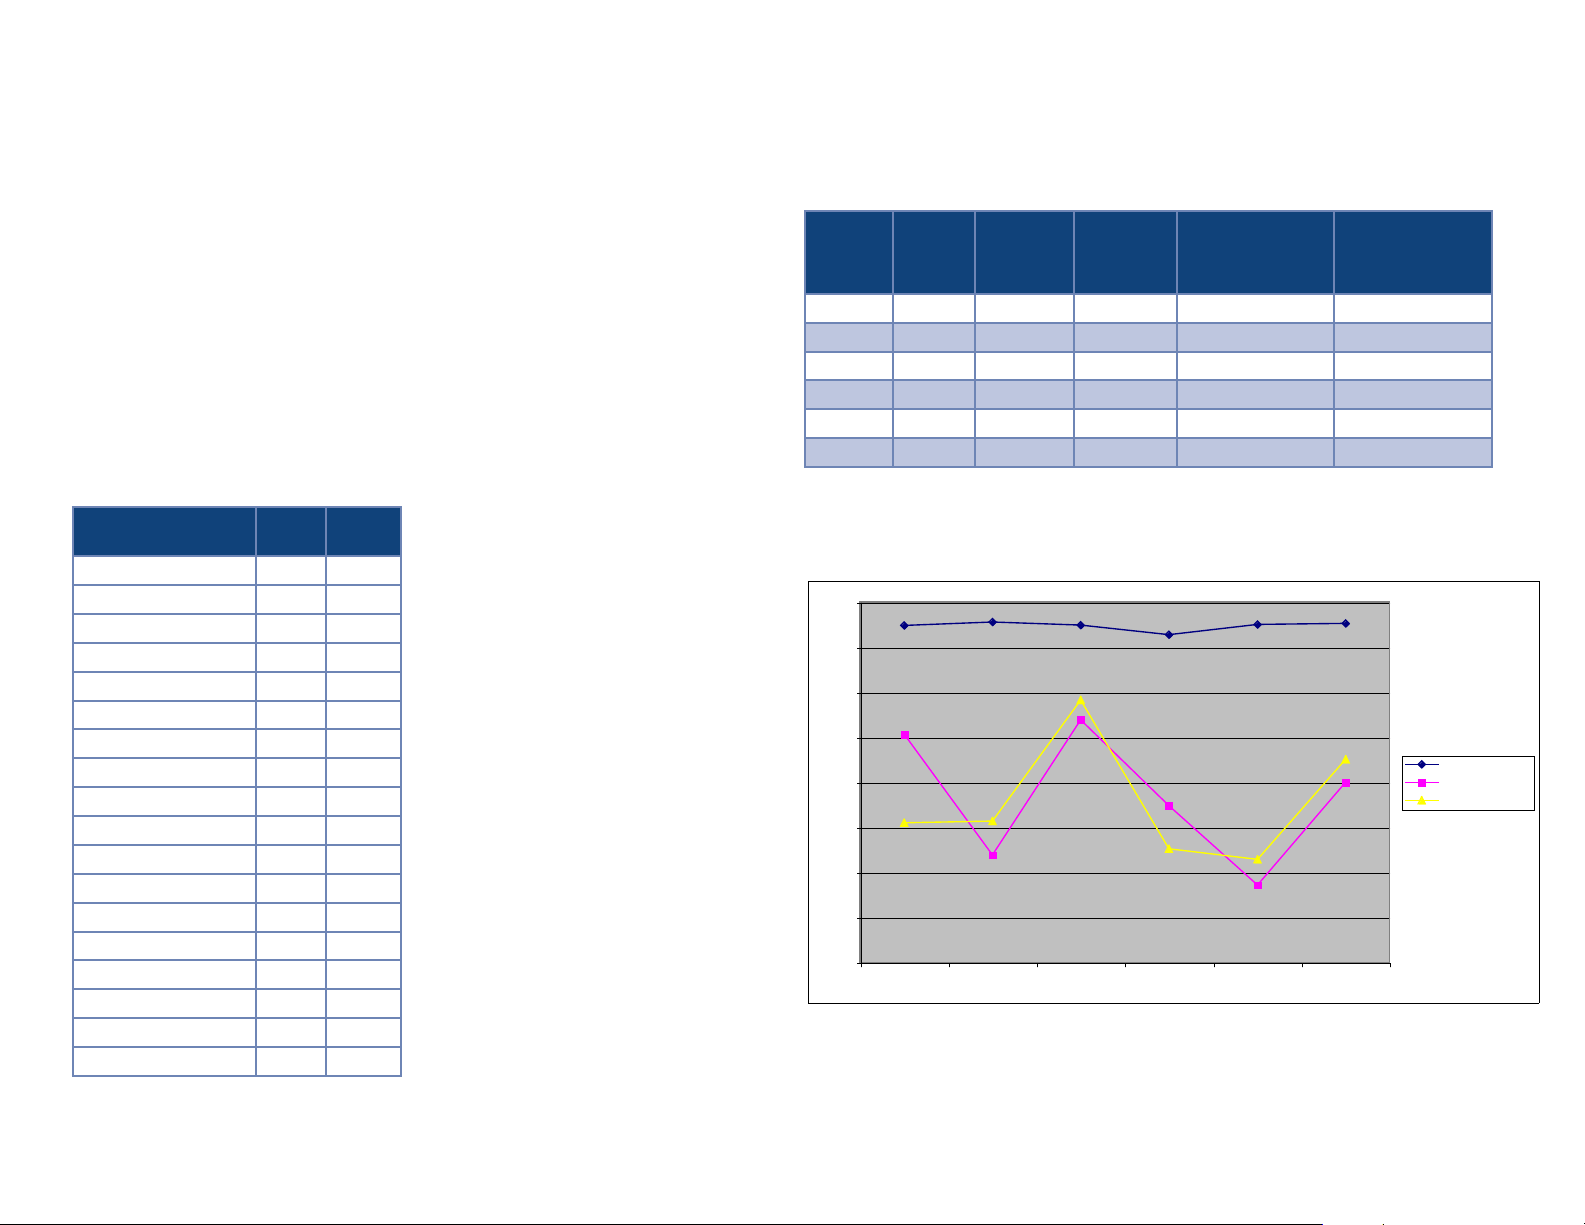
i780 ISIS
DR X10C VRS
DR X10C ISIS
Appendix 1—Testing methodology and results for speed and throughput
Kodak’s Quality Assurance Team conducted a series of comprehensive, competitive benchmark
tests comparing the Kodak i780 Scanner with ISIS to the Canon DR-X10C Scanner with VRS.
Throughput tests
The intent of these tests was to determine the throughput of each scanner using typical scanner
configurations. All scanners were configured with similar settings and all tests were conducted
with EMC QuickScan Pro v6.5.1 and run on the same PC host. EMC QuickScan Pro was chosen
because of its popularity as a third party application. The EMC QuickScan Pro demonstration
version was used so it would be easier for interested parties to validate results. (See Reference
A for configuration details.) The operator prepared documents prior to testing and fed them into
each scanner as quickly as possible. Five new sets of documents were used for each scanner
during testing. Each test was run for one hour with the total number of pages recorded.
Chart 1—Throughput testing
Test Number
i780 ISIS Test #1 74 87 124.8
i780 ISIS Test #2 7557 126.0
i780 ISIS Test #3 749 1 124.9
i780 ISIS Test #4 7283 121.4
i780 ISIS Test #5 7510 125.2
i780 ISIS Test #6 7528 125.5
DR-X10C VRS Test #1 5075 84.6
DR-X10C VRS Test #2 2390 39.8
DR-X10C VRS Test #3 5391 89.9
DR-X10C VRS Test #4 3477 58.0
DR-X10C VRS Test #5 1719 28.7
DR-X10C VRS Test #6 4009 66.8
DR-X10C ISIS Test #1 3102 51.7
DR-X10C ISIS Test #2 3142 52.4
DR-X10C ISIS Test #3 5829 9 7. 2
DR-X10C ISIS Test #4 2527 42.1
DR-X10C ISIS Test #5 2293 38.2
DR-X10C ISIS Test #6 4516 75.3
# Pgs
in 1 hr
Average
ppm
Chart 2—Data and dierences on number of pages scanned in one hour
i780
Test #1 7487 5075 3102 2412 (47%) 4385 (141%)
Test #2 7557 2390 3142 5167 (217%) 4415 (140%)
Test #3 7491 5391 5829 2100 (38%) 1662 (28%)
Test #4 7283 3477 2527 3806 (109%) 4756 (188%)
Test #5 7510 1719 2293 5791 (336%) 5217 (227%)
Test #6 7528 4009 4516 3519 (88%) 3012 (67%)
See Reference A for configuration details.
DR-X10C
VRS
DR-X10C
ISIS
i780 Increase
Over
DR-X10C VRS
Performance
i780 Increase
Over
DR-X10C ISIS
Performance
Chart 3—Graphic representation of data and dierences on number of pages scanned
in one hour
Pages in One Hour
Test #
For more information about testing methodology and laboratory test results, click here
Return to Speed and throughput
Table of Contents
➡
➡
-
-
➡
Page 4

Reference A—Testing configuration details*
Test Job 1 Test Job 2 Test Job 3 Test Job 4 Test Job 5 Test Job 6
EMC QuickScan Settings
QuickScan scan
profile name
Scan—show continue dialog
after scan
Scan—scan mode
Scan—scan type
Scan—dpi
Scan—page size
Image format and naming—
enter file name at…
Image format and naming—
file type
Image format and naming—
color format
Image format and naming—
compression
Image format and
naming— append standard
extension …
200 dpi, bitonal, duplex,
AO, auto thresholding,
multifeed detection,
multipage TIFF output
i780 Test job 01 i780 Test job 02 i780 Test job 03 i780 Test job 04 i780 Test job 05 i780 Test job 06
Checked Checked Checked Checked Checked Checked
Duplex Duplex Simplex Duplex Duplex Simplex
Black and white Black and white Black and white 24-Bit color 24-Bit color 24-Bit color
200 300 300 200 300 300
Scanner max Scanner max Scanner max Scanner max Scanner max Scanner max
Checked Checked Checked Checked Checked Checked
TIFF TIFF TIFF JPEG (*.jpg) JPEG (*.jpg) JPEG (*.jpg)
Binary Binary Binary 24-Bit color 24-Bit color 24-Bit color
Group 4 Group 4 Group 4 Sequential JPEG Sequential JPEG Sequential JPEG
Checked Checked Checked Checked Checked Checked
300 dpi, bitonal, duplex,
AO, auto thresholding,
multifeed detection,
multipage TIFF output
300 dpi, bitonal, simplex,
AO, auto thresholding,
multifeed detection,
multipage TIFF output
200 dpi, color, duplex,
AO, multifeed detection,
multipage TIFF output
300 dpi, color, duplex,
AO, multifeed detection,
multipage TIFF output
300 dpi, color, simplex,
AO, multifeed detection,
multipage TIFF output
For more information about testing methodology and
laboratory test results, click here
Return to Speed and throughput
Table of Contents
➡
➡
➡
Page 5

i780 ISIS driver, main,
cropping
i780 ISIS driver, main,
thresholding
i780 ISIS driver, main,
contrast
i780 ISIS driver, layout,
image orientation (both front
and back image #1)
i780 ISIS driver, layout, page
orientation (both front and
back image #1)
i780 ISIS driver, scanner,
document feeder
i780 ISIS driver, scanner,
ultrasonic detection
i780 ISIS driver, dropout,
blank image detection
i780 ISIS driver, image
processing, JPEG quality
i780 ISIS driver, image
processing, color correction
Test Job 1 Test Job 2 Test Job 3 Test Job 4 Test Job 5 Test Job 6
Aggressive Aggressive Aggressive Aggressive Aggressive Aggressive
iThresholding iThresholding iThresholding iThresholding iThresholding iThresholding
0 0 0 0 0 0
Automatic Automatic Automatic Automatic Automatic Automatic
Top edge first Top edge first Top edge first Top edge first Top edge first Top edge first
250—Automatically
start transport
Medium—
3 sensors—end job
Black and White
(back only)—2KB
N/A N/A N/A Good Good Good
N/A N/A N/A Text with pictures Text with pictures Text with pictures
250—Automatically
start transport
Medium—
3 sensors—end job
Black and White
(back only)—2KB
250—Automatically
start transport
Medium—
3 sensors—end job
Black and White
(back only)—2KB
250—Automatically
start transport
Medium—
3 sensors—end job
Color (back only)—
125KB
250—Automatically
start transport
Medium—
3 sensors—end job
Color (back only)—
125KB
250—Automatically
start transport
Medium—
3 sensors—end job
Color (back only)—
125KB
* Note: The Canon DR-X10C Scanner configurations were modeled as closely as possible to the Kodak i780 Scanner set-ups.
Return to Speed and throughput
Table of Contents
➡
➡
Page 6
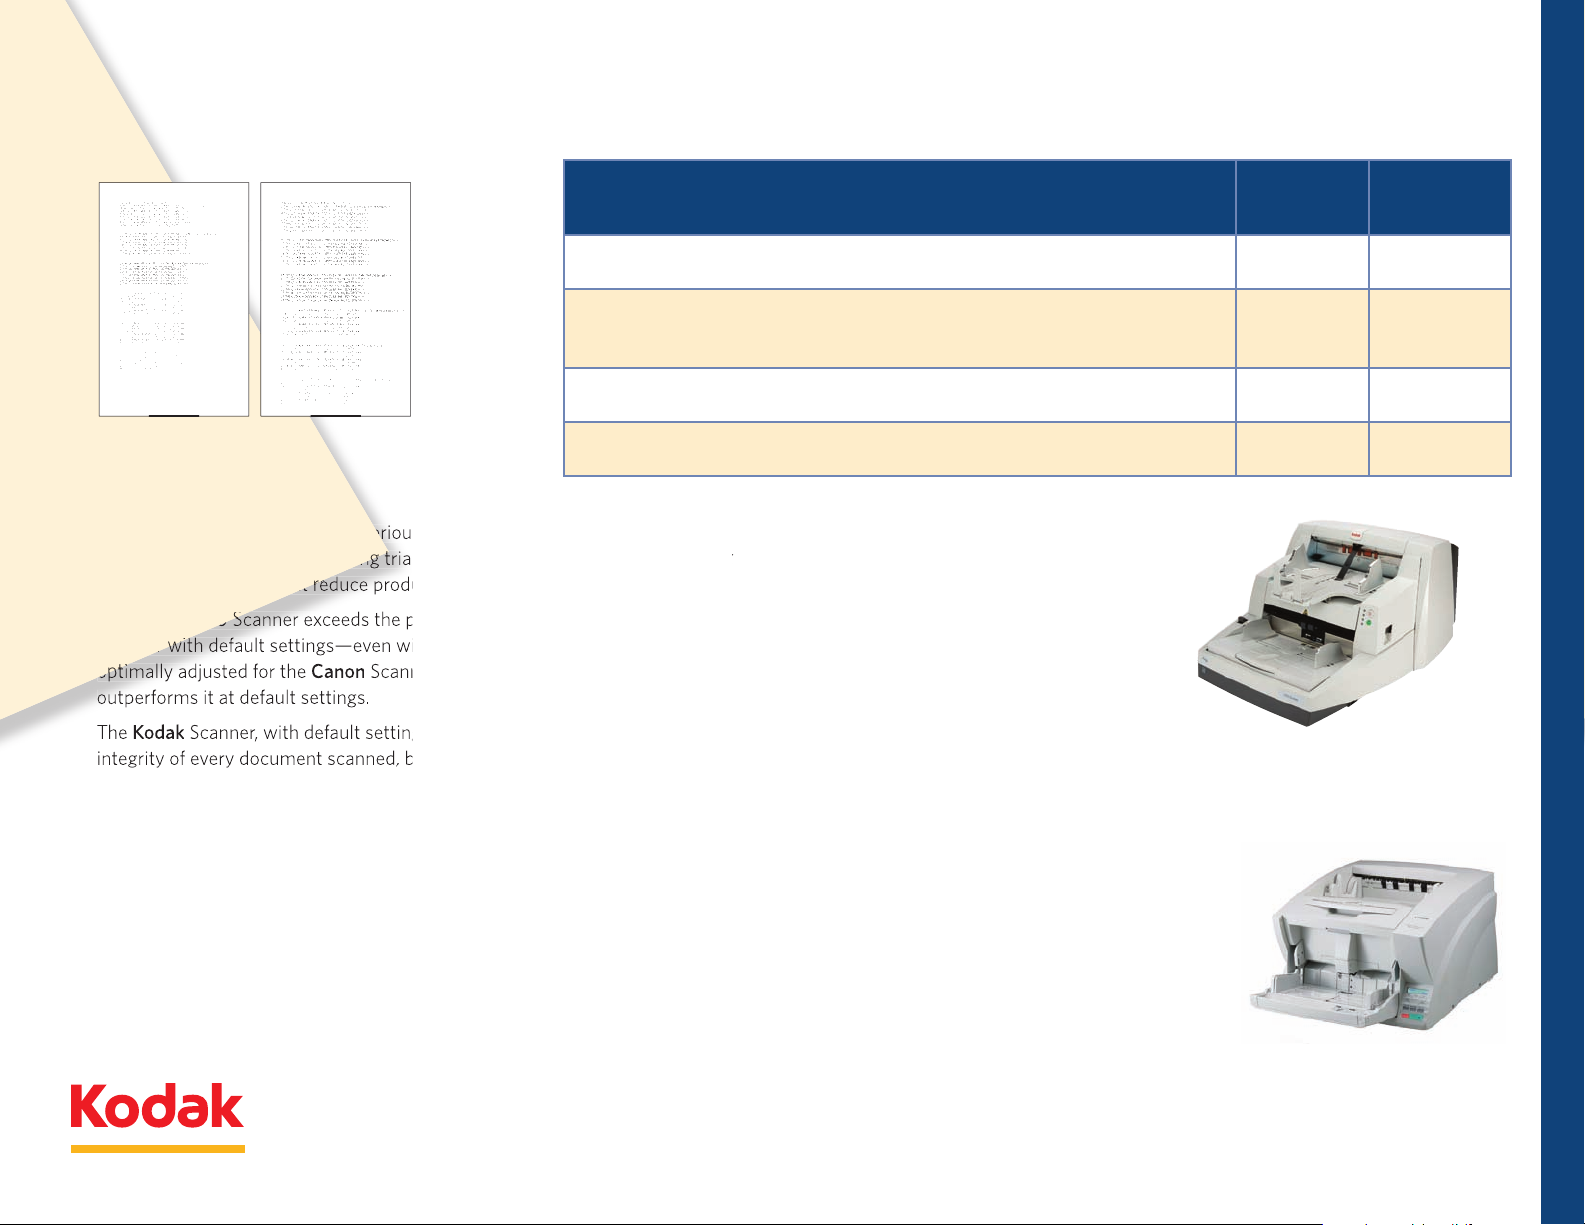
Image and data integrity
i780 Scanner exceeds the performance of the
Scanner, the
Scanner
Scanner, with default settings, maximizes the
i780 Scanner provides outstanding image and data
DR-X10C Scanner does not perform nearly as well.
i780 Scanner while the
DR-X10C
Scanner can only
DR-X10C Scanner delivers
Kodak i780 Scanner vs. Canon DR-X10C Scanner
Test: Light Document Challenge
OCR Read Rate
for Canon
DR-X10C
2
Scanner
OCR Read Rate
for Kodak i780
Scanner
2
Testing observations and conclusions
Competitive knockouts
Methodology
➡
Kodak i780 Scanner
Canon DR-X10C Scanner
Competitive BenChmarking
➡
Count on Kodak for consistent and true performance.
Count out Canon.
Page 7

Appendices
Appendix 2—Testing methodology and results for image and data integrity (OCR read rates)
Kodak’s Quality Assurance Team conducted a series of comprehensive, competitive benchmark tests comparing the Kodak i780
Scanner with VRS to the Canon DR-X10C Scanner ISIS.
Image and data integrity—complete testing results
Canon DR-X10C Scanner—
optimized brightness and
contrast settings
Percent
Font and dpi
variations*
L102 81.7918 L102 0.0000 L102 95.2331
L082 67.1692 L082 0.0000 L082 93.9025
L083 98.9587 L083 0.0000 L083 88.3379
Average Score = 82.6399 Average Score = 0.0000 Average Score = 92.4912
*Font and dpi variations: L = Light; 08 or 10 = Font Size; 2 or 3 = 200 or 300 dpi
from font
and dpi
variations
Canon DR-X10C Scanner—
Default configuration settings
Font and dpi
variations
Percent from
font and dpi
variations
Kodak i780 Scanner—
Default configuration settings
Font and dpi
variations
Percent from
font and dpi
variations
Return to Image and data integrity
Table of Contents
➡
➡
Page 8
DR-X10C Scanner
i780 Scanner
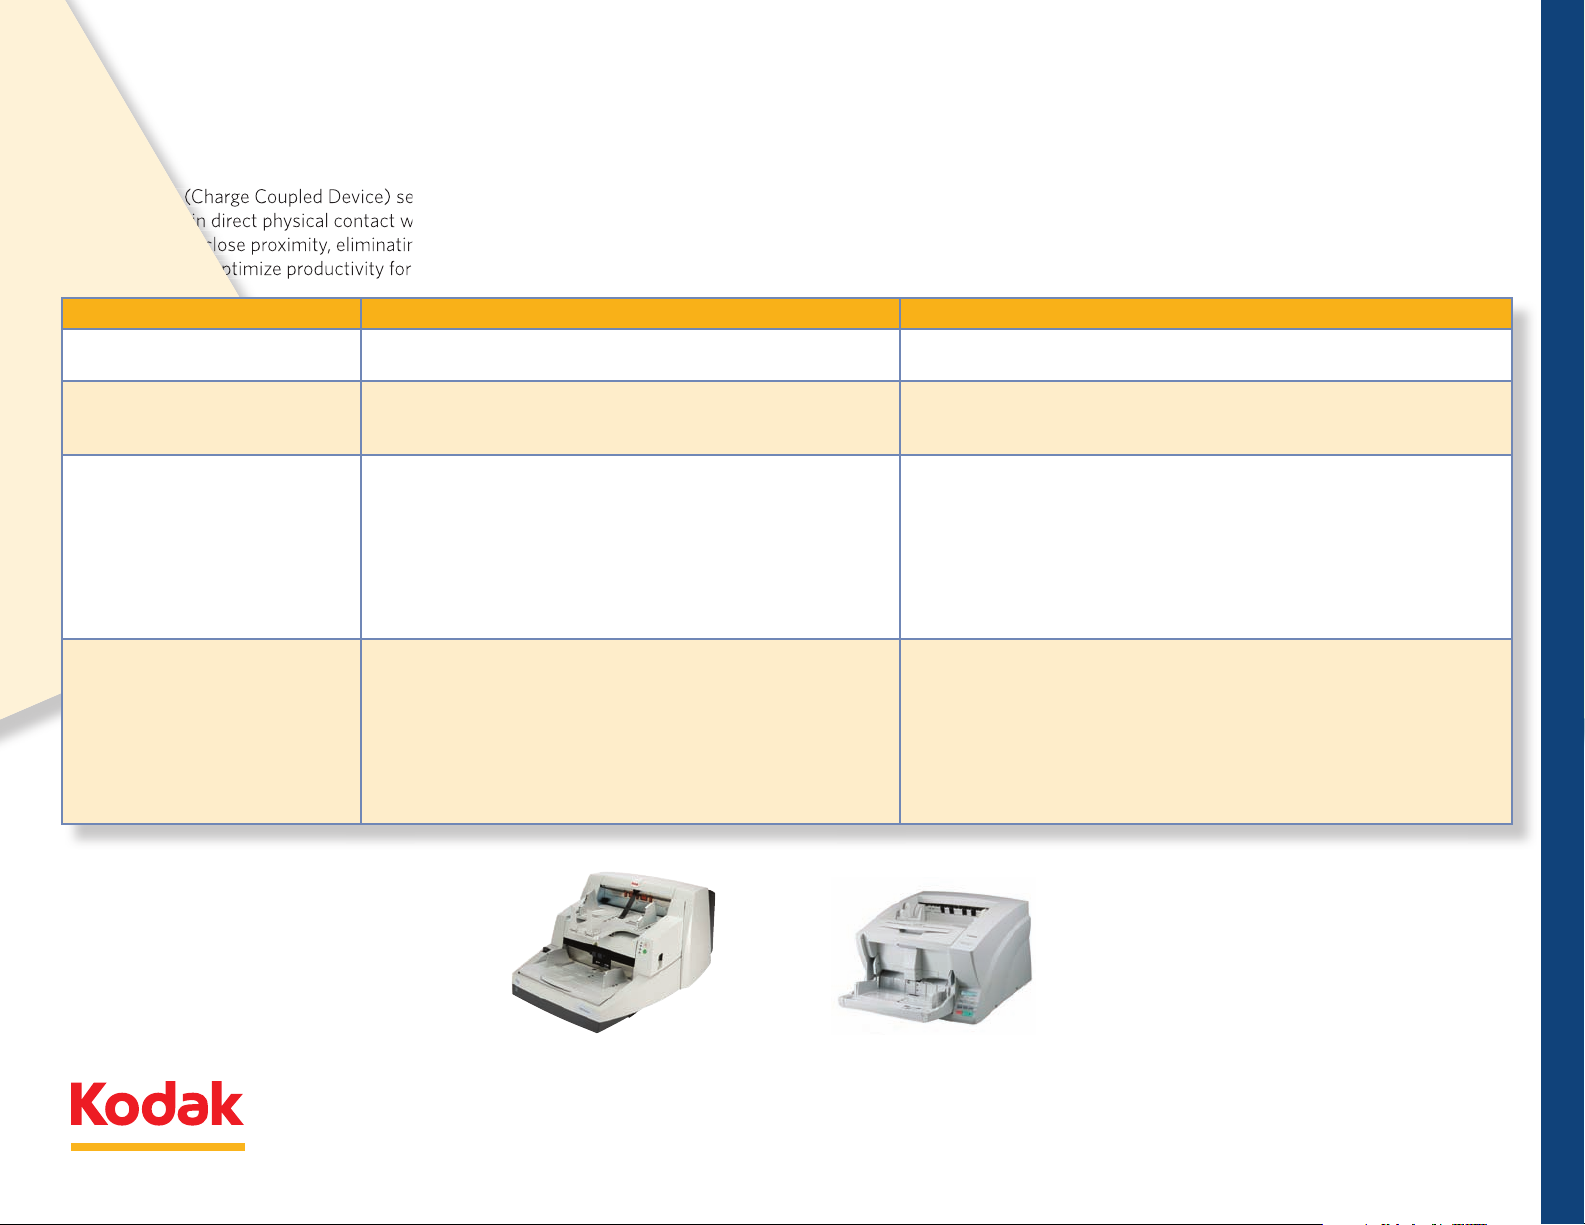
Contact Image Sensor during the scanning process.
Scanner design, the sensor is encased in glass that
CCD sensor design means it is not placed in the
i780 Scanner
Sensor durability
i780 Scanner is designed to maximize uptime, reduce
Kodak i780 Scanner vs. Canon DR-X10C Scanner
Competitive BenChmarking
Kodak i780 Scanner Canon DR-X10C Scanner
Count on Kodak for consistent and true performance.
Count out Canon.
Page 9
Conclusions
Scanner, because of its Contact Image Sensor, requires documents
Scanner, thanks to its CCD (Charged Coupled Device) sensor’s
i780 Scanner is not at risk of sensor damage due to physical contact with
i780 Scanner, using CCD technology, is designed to maximize uptime,
DR-X10C Scanner may be vulnerable to damage, and since sensor glass replacement
Scanner requires a service call, there is a potential negative impact to uptime
i780 Scanner handles occasional staples and common dust
Kodak
i780 Scanner’s sensor and scanner design easily tackles common real-
DR-X10C Scanner utilizes sensor technology that may be vulnerable to
i780 Scanner’s sensor design, including CCD technology, sensor
Competitive knockouts
Competitive BenChmarking
➡
Count on Kodak for consistent and true performance.
Count out Canon.
Page 10
DR-X10C Scanner Performance
i780 Scanner Performance
DR-X10C Scanner to re-feed
Scanner experiences
Scanner
DR-X10C Scanner’s retry
i780 Scanner’s misfeed detection feature settings,
Optimized operator control: “beep and stop”—alerts operator
job.
Optimized operator productivity: “beep and pause”—alerts
Optimized throughput: “beep and continue”—alerts operator
i780
Scanner by as much as 50%.
These results demonstrate
i780 Scanner design and architecture, outperform those
Misfeed management
misfeed detection/retry mechanism and required operator
Scanner with this challenge document set is
i780 Scanner’s performance with the same set of challenge documents.
The lack of flexible options for the operator to eectively manage misfeeds,
misfeed
Kodak i780 Scanner vs. Canon DR-X10C Scanner
Kodak i780 Scanner
Canon DR-X10C Scanner
Competitive BenChmarking
Count on Kodak for consistent and true performance.
Count out Canon.
Page 11
Testing observations and conclusions
DR-X10C Scanner does not oer flexible options for the operator to
i780 Scanner’s throughput performance and productivity exceeds
DR-X10C Scanner by as much as 50% with a challenge set
i780 Scanner provides far more elegant and flexible misfeed
i780 Scanner delivers far greater flexibility, customization and practical
DR-X10C Scanner’s options for handling misfeeds may at first
i780 Scanner). The
model does not oer this possibility.
i780 Scanner will eectively
Competitive knockouts
Methodology
➡
Competitive BenChmarking
➡
Count on Kodak for consistent and true performance.
Count out Canon.
Page 12

Appendices
Appendix 3—Part A—Misfeed management—Testing methodology and results
Kodak’s Quality Assurance Team conducted a series of comprehensive, competitive benchmark tests comparing the Kodak i780 Scanner/ISIS to the Canon DR-X10C Scanner ISIS/
Canon DR-X10C Scanner with VRS.
Misfeed management—test results
Multifeed productivity test
This test is intended to simulate a job set with pages that create real multifeeds where
two pages feed at the same time through the scanner and cannot be separated with
retry feeding.
The job stream consisted of 100 pages with induced multifeeds placed every 10 pages
in the document stack starting at page 5. The document stack was used for all multifeed
tests described.
Scanner features and settings profile used for multifeed productivity test:
300 dpi bitonal, duplex, auto orientation ON, auto thresholding ON, multifeed detection ON,
all zones ON, set to disable scanner on multifeed detect. Multipage TIFF output selected.
Canon “retry” count set to one attempt.
General test steps:
• Operatorscannedveprepared100-pagemultifeedstacks.
• Thestackswereloadedseparately,onefollowinganother.
• Eachmultifeedpagewasrescannedasquicklyaspossiblebyremovingthesticky
note and placing the document back in the feeder.
• Whentheimagesofthemultifeeddocumentweresenttothehosttheywereremoved
(deleted) from the batch before the rescan.
Multifeed Productivity Test
Time to scan batch of five sets of
100 pages with 10 induced multifeeds
in each set
Demonstrated performance in ppm 26.1 21.5
Kodak i780
Scanner ISIS
19 min 11 sec 23 min 15.75 sec
Canon DR-X10C
Scanner VRS
Challenging document productivity test
This test was intended to simulate a very challenging document including a wide range of sizes,
thicknesses and finishes.
General test steps:
•
Operator scanned five prepared challenge stacks.
• The stacks were loaded separately, one following another.
• Each real multifeed was rescanned.
• Images of real multifeeds were not included in the batch.
Scanner features and settings profile for challenge document productivity test:
200 dpi bitonal, duplex, auto orientation ON, auto thresholding ON, multifeed detection ON,
multifeed retry ON, all zones ON, set to disable scanner on multifeed. Multipage TIFF output.
Canon “retry” count set to one attempt.
Challenge Document
Productivity Test
Results
Product Tested # of Pages Total time Average ppm # Multifeeds
Kodak
i780 Scanner ISIS
Canon
DR-X10C Scanner ISIS
250 5:18:03 47. 2 25
250 11:36:63 21.5 25
Duration
For more information about testing methodology and
laboratory test results, click here
Return to Misfeed management
Table of Contents
➡
➡
➡
Page 13

Appendix 3—Part B—Misfeed management—Job stream configurations
This appendix defines the job streams used in the multifeed productivity test and the
challenge document productivity test.
Multifeed productivity test
This is a set of 100 pages of 20# 8.5in x 11in copier paper. Sticky notes (3in x 3in) were
placed on the documents as defined below.
Page # Sticky note
5 False multifeed
15 True multifeed
25 True multifeed (recovered)
35 False multifeed
45 True multifeed
55 False multifeed
65 False multifeed
75 True multifeed (recovered)
85 True multifeed
95 False multifeed
Challenge document productivity test
This document set was intended to be a collection of extremely dicult to scan documents.
Doc # Qty Description Orientation
1–5 5 Duplex printed copier paper (Pendleton) Portrait
6 1 Bank-sized check Landscape
7 1 Business card Portrait
8 1 Shipment air way bill Landscape
9 1 Personal check Landscape
10 1 W3 form (letter size) Portrait
11 1 Dark gray iThresholding document (Perfect Page set) Portrait
12 1 W2 form (letter size) Portrait
13 1 Empty business-sized envelope Landscape
14 1 Onionskin iThresholding document (Perfect Page set) Portrait
15 1 Kodak’s blue reseller questionnaire (Perfect Page set) Portrait
16 1 Value-added tax return (Perfect Page set) Portrait
17 1 5" x 7" Glossy color photo Landscape
18 1 8.5" x 17" Glossy chart Portrait
Challenge document productivity test, continued
Doc # Qty Description Orientation
19 1 8.125" x 17" Photo Portrait
20, 21 2 Personal checks (Perfect Page set) Landscape
22 1 Toggle patch 8.5" x 11" with 2 corners cut o Landscape
23 1 USPS Express Mail multipart mailing label (Label 11-B) Landscape
24, 25 2 Steno pad, torn from spiral but not cleaned Portrait
26 1 USPS PS Form 3811, 3½" x 11" card stock Landscape
3
/
16
27, 28 2 USPS Certified Mail receipt, PS Form 3800, 3
" x 5 ½" Landscape
29 1 USPS envelope EP14H w/large window, 5" x 10" Landscape
30–33 3 Duplex printed copier paper (Pendleton) Portrait
34 1 Gloss personal identification card, 3¾" x 6 ¾" Landscape
7
1
/
/
8
" x 8
8
35 1 Textured invitation card 3
36 1
37 1
Duplex printed copier paper, wrinkled and
torn corner (Pendleton)
Scissor-cut black card stock, edges not straight
(approx 3¾" x 4½")
" Landscape
Portrait
Landscape
38 1 Tri-folded Kodak i1200/i1300 Scanner Quick Tips Portrait
39 1 Order form photocopy, 11" x 17" Portrait
40 1 Extended warranty application (Perfect Page set) Portrait
41–47 6 Duplex printed copier paper (Pendleton) Portrait
48 1
49 1 Blue Extremely Urgent USPS mailing envelope, 11½" x 15
50 1 NexPress Press sample document, glossy, 8
Red Domestic/International USPS mailing envelope,
11 ½" x 15
1
/
8
"
1
1
/
/
8
" x 10
Portrait
1
/
8
" Portrait
8
" Portrait
For more information about testing
methodology and laboratory test
results, click here
Return to Misfeed management
Table of Contents
➡
➡
➡
Page 14

Appendix 3—Part C—Misfeedmanagement—Workstationcongurations
Workstation Components Version
OptiPlex 755 Minitower:
Operating system(s):
Memory: 2GB DDR2 Non-ECC SDRAM, 667MHz, (2 DIMM)
Boot Hard Drives: 250GB SATA 3.0Gb/s and 8MB DataBurst Cache
Video Card: Integrated Video, Intel GMA3100
Intel Core 2 Duo Processor E6850 (3.0GHz, 4M, VT,
1333MHz FSB)
Genuine Windows XP Professional, SP2, x32, with
Media, English
Scanner Related Components Version
PC Scanning Software EMC QuickScan Pro 6.5.1 demo (build 8372)
Created with QuickDriver Version
1.0.10710.10002
Canon DR-X10C Scanner ISIS Driver Canon DR-X10C version 1.1.10807.03001
Canon DR-X10C Scanner Firmware Version 2.10
Canon DR-X10C Scanner Driver Version 4.20.148
Interface Used (ISIS configuration) USB interface was used
Canon DR-X10C Kofax Card CGA Firmware Version 3.10.011
Interface Used (Canon VRS configuration) USB interface was used
Interface Used (Kodak) IEEE 1394—FireWire 400
Kodak i780 Scanner ISIS Drivers eki700 Version 2.0.10809.29001
Kodak i780 Scanner Firmware Version 2.00.21
PixTools 32-Bit Runtime Libraries Version 7.0 build 2124
For more information about testing
methodology and laboratory test
results, click here
Return to Misfeed management
Table of Contents
➡
➡
➡
Page 15

Appendix 3—Part D—Misfeed management—Scanner features and settings profile
Kodak i780 Scanner configuration EMC Captiva QuickScan Pro v6.5.1 demo settings
Kodak i780 Scanner ISIS Multifeed Productivity Test Challenge Document Productivity Test
200 dpi, bitonal, duplex, AO, auto thresholding,
multifeed detection, multipage TIFF output
QuickScan scan profile name i780 Test job 01 i780 Test job 02
General—save images to this folder
Scan—show continue dialog after scan Checked Checked
Scan—scan mode Duplex Duplex
Scan—scan type Black and white Black and white
Scan—dpi 200 300
Scan—page size Scanner max Scanner max
Image format and naming—enter file name at … Checked Checked
Image format and naming—file type TIFF TIFF
Image format and naming—color format Binary Binary
Image format and naming—compression Group 4 Group 4
Image format and naming—append standard extension … Checked Checked
i780 ISIS driver, main, cropping Aggressive Aggressive
i780 ISIS driver, main, thresholding iThresholding iThresholding
i780 ISIS driver, main, contrast 0 0
i780 ISIS driver, layout, image orientation
(both front and back image #1)
i780 ISIS driver, layout, page orientation
(both front and back image #1)
i780 ISIS driver, scanner, document feeder 250—Automatically start transport 250—Automatically start transport
i780 ISIS driver, scanner, ultrasonic detection Medium—3 sensors—end job Medium—3 sensors—end job
i780 ISIS driver, dropout, blank image detection Black and white (back only)—2KB Black and white (back only)—2KB
i780 ISIS driver, image processing, JPEG quality N /A N/A
C:\Program Files\EMC Captiva\QuickScan\
My Images\i780\Job01
Automatic Automatic
Top edge first Top edge first
300 dpi, bitonal, duplex, AO, auto thresholding,
multifeed detection, multipage TIFF output
C:\Program Files\EMC Captiva\QuickScan\
My Images\i780\Job02
i780 ISIS driver, image processing, color correction N /A N/A
For more information about testing methodology and
laboratory test results, click here
Return to Misfeed management
Table of Contents
➡
➡
➡
Page 16

Appendix 3—Part D— Misfeed management—Scanner features and settings profile, continued
Canon DR-X10C Scanner, VRS configuration EMC Captiva QuickScan Pro v6.5.1 demo settings
Canon DR-X10C with VRS Option Multifeed Productivity Test Challenge Document Productivity Test
200 dpi, bitonal, duplex, AO, auto thresholding,
multifeed detection, multipage TIFF output
QuickScan scan profile name DR-X10C VRS test job 01 DR-X10C VRS test job 02
General—save images to this folder
Scan—show continue dialog after scan Checked Checked
Scan—scan mode Duplex Duplex
Scan—scan type Black and white Black and white
Scan—dpi 200 300
Scan—page size Scanner max Scanner max
Image format and naming—enter file name at … Checked Checked
Image format and naming—file type TIFF TIFF
Image format and naming—color format Binary Binary
Image format and naming—compression Group 4 Group 4
Image format and naming—
append standard extension …
PixKofax, main tab, paper source Feeder Feeder
PixKofax, main tab, dpi 200 300
PixKofax, main tab, mode Black and white Black and white
PixKofax, main tab, page size Scanner’s maximum Scanner’s maximum
PixKofax, main tab, orientation Portrait Portrait
PixKofax, main tab, simplex/duplex Duplex Duplex
PixKofax, more, detect page size Checked Checked
PixKofax, main tab, (scanner preset) {preset
names are retained so you can use dierent
names as needed}
PixKofax, advanced (VRS adjustments), clarity,
auto brightness
PixKofax, advanced (VRS adjustments), clarity,
brightness
C:\Program Files\EMC Captiva\QuickScan\My Images\
x10c-VRS\Job01
Checked Checked
Test01 Test02
Checked Checked
N/A N/A
300 dpi, bitonal, duplex, AO, auto thresholding,
multifeed detection, multipage TIFF output
C:\Program Files\EMC Captiva\QuickScan\My Images\
x10c-VRS\Job02
For more information about testing methodology and
laboratory test results, click here
Return to Misfeed management
Table of Contents
➡
➡
➡
Page 17

Appendix 3—Part D— Misfeed management—Scanner features and settings profile, continued
Canon DR-X10C Scanner, VRS configuration, continued
Canon DR-X10C with VRS Option Multifeed Productivity Test Challenge Document Productivity Test
PixKofax, advanced (VRS adjustments), clarity, contrast 50 50
PixKofax, advanced (VRS adjustments), clarity,
advanced clarity
PixKofax, advanced (VRS adjustments), clarity, gamma 17 17
PixKofax, advanced (VRS adjustments), noise, line filter Normal Normal
PixKofax, advanced (VRS adjustments), noise, speckle removal Small Small
PixKofax, advanced (VRS adjustments), noise, fill holes Not checked Not checked
PixKofax, advanced (VRS adjustments), skew, deskew Deskew, auto crop, auto orientation Deskew, auto crop, auto orientation
PixKofax, advanced (VRS adjustments), color,
enable detection
PixKofax, advanced (VRS adjustments), background,
enable smoothing
PixKofax, advanced (VRS adjustments), blank page
PixKofax, advanced (VRS adjustments), (profile name) {profile
names are not retained in PixKofax so only use one}
PixKofax, VRS Admin, warnings, brightness out of range 35—Ignore error 35—Ignore error
PixKofax, VRS Admin, warnings, contrast out of range 40—Ignore error 40—Ignore error
PixKofax, VRS Admin, warnings, color confidence out of range 50—Ignore error 50—Ignore error
PixKofax, VRS Admin, errors, paper jam Auto resolve Auto resolve
PixKofax, VRS Admin, errors, multifeed Auto resolve Auto resolve
PixKofax, VRS Admin, errors, out of paper Auto resolve Auto resolve
PixKofax, VRS Admin, errors, cover open Auto resolve Auto resolve
PixKofax, VRS Admin, errors, auto crop failure boundary
note detected
PixKofax, VRS Admin, errors, auto deskew failure Ignore error Ignore error
PixKofax, VRS Admin, errors, staple detection Auto resolve Auto resolve
PixKofax, VRS Admin, errors, excessive skew Auto resolve Auto resolve
PixKofax, VRS Admin, accelerated scanning Best Best
PixKofax, advanced (VRS adjustments),
Canon ISIS, endorser
PixKofax, advanced (VRS adjustments), Canon ISIS,
color—front/rear color dropout
Enabled detection, delete, context @ 50,
Enabled @ level 2 Enabled @ level 2
N/A N/A
N/A N/A
Enabled detection, delete, context @ 50,
ignore holes
Test Test
Ignore error Ignore error
No endorser No endorser
None None
ignore holes
For more information about testing methodology and laboratory test results, click here
Return to Misfeed management
➡
Table of Contents
➡
➡
Page 18

Appendix 3—Part D— Misfeed management—Scanner features and settings profile, continued
Canon DR-X10C Scanner, VRS configuration, continued
Canon DR-X10C with VRS Option Multifeed Productivity Test Challenge Document Productivity Test
PixKofax, advanced (VRS Adjustments), Canon ISIS, color, JPEG compression Good Good
PixKofax, advanced (VRS Adjustments), Canon ISIS, picking rectangle Not checked Not checked
PixKofax, advanced (VRS Adjustments), Canon ISIS, rotation (front/rear) 0 0
PixKofax, advanced (VRS Adjustments), Canon ISIS, multifeed Enabled with 3 zones Enabled with 3 zones
PixKofax, advanced (VRS Adjustments), Canon ISIS, other (speed/quality) High speed scanning enabled High speed scanning enabled
PixKofax, advanced (VRS Adjustments), Canon ISIS, other, moire removal Checked Checked
PixKofax, advanced (VRS Adjustments), Canon ISIS, other, staple detection Checked Checked
PixKofax, advanced (VRS Adjustments), Canon ISIS, other, error recovery Checked Checked
Canon DR-X10C Operator control panel settings
Canon DR-X10C OCP—buzzer control (ON2 ON1 OFF) ON2 ON2
Canon DR-X10C OCP—double feed control (
Canon DR-X10C OCP—double feed retry (3-2-1-OFF) 1 1
Canon DR-X10C OCP—staple detection (ON/OFF) ON ON
Canon DR-X10C OCP—staple control (2/1/0) 0 0
Canon DR-X10C OCP—long document (ON/OFF)
Canon DR-X10C OCP—manual feed mode (ON/OFF) OFF OFF
Canon DR-X10C OCP—stand by mode (240-60-10) 240 240
Canon DR-X10C OCP—Japanese (ON/OFF) OFF OFF
Canon DR-X10C OCP—display contrast — —
Canon DR-X10C OCP—SCSI speed (20-10-5) 20 20
Canon DR-X10C OCP—USB short packet (ON/OFF) ON ON
Canon DR-X10C OCP—dust detection mode (ON/OFF) ON2 ON2
Canon DR-X10C OCP—tray position (2-1-0) 1 1
Canon DR-X10C OCP—torque control (5-4-3-2-1) 3 3
Canon DR-X10C OCP—auto USB power o (
Canon DR-X10C OCP—total counter (display only) N/A N/A
Canon DR-X10C OCP—roller counter (reset to 0) N/A N/A
Canon DR-X10C OCP—imprinter test N/A N/A
Canon DR-X10C OCP—cleaning mode N/A N/A
ON/OFF) ON ON
OFF OFF
ON/OFF) OFF OFF
For more information about testing methodology and laboratory test results, click here
Return to Misfeed management
➡
Table of Contents
➡
➡
Page 19

Appendix 3—Part D— Misfeed management—Scanner features and settings profile, continued
Canon DR-X10C Scanner, ISIS configuration EMC Captiva QuickScan Pro v6.5.1 demo settings
Canon DR-X10C ISIS Multifeed Productivity Test Challenge Document Productivity Test
200 dpi, bitonal, duplex, AO, auto thresholding,
multifeed detection, multipage TIFF output
QuickScan scan profile name DR-X10C ISIS test job 01 DR-X10
General—save images to this folder
Scan—show continue dialog after scan Checked Checked
Scan—scan mode Duplex Duplex
Scan—scan type Black and white Black and white
Scan—dpi 200 300
Scan—page size Scanner max Scanner max
Image format and naming—enter file name at… Checked Checked
Image format and naming—file type TIFF TIFF
Image format and naming—color format Binary Binary
Image format and naming—compression Group 4 Group 4
Image format and naming—append standard extension … Checked Checked
DR-X10C ISIS Driver, basic, user preference
DR-X10C ISIS Driver, basic, mode Black and white Black and white
DR-X10C ISIS Driver, basic, page size Auto detection Auto detection
DR-X10C ISIS Driver, basic, dpi 200 300
DR-X10C ISIS Driver, basic, scanning mode Duplex Duplex
DR-X10C ISIS Driver, basic, deskew Checked Checked
DR-X10C ISIS Driver, brightness, auto Checked Checked
DR-X10C ISIS Driver, brightness, gamma, custom Not checked Not checked
DR-X10C ISIS Driver, image processing, text orientation Checked Checked
DR-X10C ISIS Driver, other, rapid recovery system Checked Checked
DR-X10C ISIS Driver, other, JPEG transfer N/A N/A
DR-X10C ISIS Driver, other, staple detection Checked Checked
DR-X10C ISIS Driver, other, feeding option Standard feeding Standard feeding
DR-X10C ISIS Driver, other, double feed detection Ultrasonic Ultrasonic
DR-X10C ISIS Driver, other, double feed detection, setting 3 Sensors 3 Sensors
C:\Program Files\EMC Captiva\QuickScan\
My Images\x10c-ISIS\Job01
300 dpi, bitonal, duplex, AO, auto thresholding,
multifeed detection, multipage TIFF output
C ISIS test job 02
C:\Program Files\EMC Captiva\QuickScan\
My Images\x10c-ISIS\Job02
For more information about testing methodology and laboratory test results, click here
Return to Misfeed management
➡
Table of Contents
➡
➡
Page 20

Appendix 3—Part D— Misfeed management—Scanner features and settings profile, continued
Canon DR-X10C Scanner, ISIS configuration, continued
Canon DR-X10C ISIS Multifeed Productivity Test Challenge Document Productivity Test
Canon DR-X10C Operator control panel settings
Canon DR-X10C OCP—buzzer control (ON2 ON1 OFF) ON2 ON2
Canon DR-X10C OCP—double feed control (
Canon DR-X10C OCP—double feed retry (3-2-1-OFF) 1 1
Canon DR-X10C OCP—staple detection (
Canon DR-X10C OCP—staple control (2/1/0) 0 0
Canon DR-X10C OCP—long document (ON/OFF)
Canon DR-X10C OCP—manual feed mode (ON/OFF) OFF OFF
Canon DR-X10C OCP—stand by mode (240-60-10) 240 240
Canon DR-X10C OCP—Japanese (ON/OFF)
Canon DR-X10C OCP—display contrast N/A N/A
Canon DR-X10C OCP—SCSI speed (20-10-5) 20 20
Canon DR-X10C OCP—USB short packet (
Canon DR-X10C OCP—dust detection mode (ON/OFF) ON2 ON2
Canon DR-X10C OCP—tray position (2-1-0) 1 1
Canon DR-X10C OCP—torque control (5-4-3-2-1) 3 3
Canon DR-X10C OCP—auto USB power o (
Canon DR-X10C OCP—total counter (display only) N/A N/A
Canon DR-X10C OCP—roller counter (reset to 0) N/A N/A
Canon DR-X10C OCP—imprinter test N/A N/A
Canon DR-X10C OCP—cleaning mode N/A N/A
ON/OFF) ON ON
ON/OFF) ON ON
OFF OFF
OFF OFF
ON/OFF) ON ON
ON/OFF) OFF OFF
Return to Misfeed management
Table of Contents
➡
➡
Page 21

DR-X10C Scanner performance in real-world scanning scenarios
i780 Scanner performance in real-world scenarios
i780 Scanner’s design focuses on keeping dust away
Real-world environment
(Mixed Batches/Transport/Reliability/
SurePath/Dust Detection)
Kodak i780 Scanner vs. Canon DR-X10C Scanner
A variety of real-world scanning scenarios were created and tested with documents scanned by the Kodak i780 Scanner and Canon DR-X10C Scanner.
Kodak i780 Scanner
Canon DR-X10C Scanner
4, 5
Competitive BenChmarking
Count on Kodak for consistent and true performance.
Count out Canon.
Page 22

Testing observations and conclusions
DR-X10C Scanner must be constantly vigilant when
DR-X10C Scanner creates potential confusion because with misfeed
DR-X10C Scanner during
i780 Scanner delivers reliable productivity
i780 Scanner seamlessly
DR-X10C Scanner. The
Scanner arrives with a variety of
DR-X10C Scanner. Envelopes,
Scanner into misfeed detect/rapid recovery mode, which
DR-X10C Scanner side-by-side
i780 Scanner, the
Scanner’s retry feeding mechanism
i780 Scanner is not fooled by adhesive labels or varying paper
Scanner, as a questionable design for detecting and clearing dust may
Competitive knockouts
Methodology
➡
➡
➡
Competitive BenChmarking
Count on Kodak for consistent and true performance.
Count out Canon.
Page 23

Appendices
Appendix 4—Part A—Real-world environment—Testing methodology and results
Kodak’s Quality Assurance Team conducted a series of comprehensive, competitive benchmark tests comparing the Kodak i780 Scanner/ISIS to the Canon DR-X10C Scanner ISIS/
Canon DR-X10C Scanner with VRS.
Misfeed management—test results
Multifeed productivity test
This test is intended to simulate a job set with pages that create real multifeeds where
two pages feed at the same time through the scanner and cannot be separated with
retry feeding.
The job stream consisted of 100 pages with induced multifeeds placed every 10 pages
in the document stack starting at page 5. The document stack was used for all multifeed
tests described.
Scanner features and settings profile used for multifeed productivity test:
300 dpi bitonal, duplex, auto orientation ON, auto thresholding ON, multifeed detection ON,
all zones ON, set to disable scanner on multifeed detect. Multipage TIFF output selected.
Canon “retry” count set to one attempt.
General test steps:
• Operatorscannedveprepared100-pagemultifeedstacks.
• Thestackswereloadedseparately,onefollowinganother.
• Eachmultifeedpagewasrescannedasquicklyaspossiblebyremovingthesticky
note and placing the document back in the feeder.
• Whentheimagesofthemultifeeddocumentweresenttothehosttheywereremoved
(deleted) from the batch before the rescan.
Multifeed Productivity Test
Time to scan batch of five sets of
100 pages with 10 induced multifeeds
in each set
Demonstrated performance in ppm 26.1 21.5
Kodak i780
Scanner ISIS
19 min 11 sec 23 min 15.75 sec
Canon DR-X10C
Scanner VRS
Challenging document productivity test
This test was intended to simulate a very challenging document including a wide range of sizes,
thicknesses and finishes.
General test steps:
•
Operator scanned five prepared challenge stacks.
• The stacks were loaded separately, one following another.
• Each real multifeed was rescanned.
• Images of real multifeeds were not included in the batch.
Scanner features and settings profile for challenge document productivity test:
200 dpi bitonal, duplex, auto orientation ON, auto thresholding ON, multifeed detection ON,
multifeed retry ON, all zones ON, set to disable scanner on multifeed. Multipage TIFF output.
Canon “retry” count set to one attempt.
Challenge Document
Productivity Test
Results
Product Tested # of Pages Total time Average ppm # Multifeeds
Kodak
i780 Scanner ISIS
Canon
DR-X10C Scanner ISIS
250 5:18:03 47. 2 25
250 11:36:63 21.5 25
Duration
For more information about testing methodology and
laboratory test results, click here
Return to Real-world environment
Table of Contents
➡
➡
➡
Page 24

Appendix 4—Part B—Real-world environment—Job stream configurations
This appendix defines the job streams used in the multifeed productivity test and the
challenge document productivity test.
Multifeed productivity test
This is a set of 100 pages of 20# 8.5in x 11in copier paper. Sticky notes (3in x 3in) were
placed on the documents as defined below.
Page # Sticky note
5 False multifeed
15 True multifeed
25 True multifeed (recovered)
35 False multifeed
45 True multifeed
55 False multifeed
65 False multifeed
75 True multifeed (recovered)
85 True multifeed
95 False multifeed
Challenge document productivity test
This document set was intended to be a collection of extremely dicult to scan documents.
Doc # Qty Description Orientation
1–5 5 Duplex printed copier paper (Pendleton) Portrait
6 1 Bank-sized check Landscape
7 1 Business card Portrait
8 1 Shipment air way bill Landscape
9 1 Personal check Landscape
10 1 W3 form (letter size) Portrait
11 1 Dark gray iThresholding document (Perfect Page set) Portrait
12 1 W2 form (letter size) Portrait
13 1 Empty business-sized envelope Landscape
14 1 Onionskin iThresholding document (Perfect Page set) Portrait
15 1 Kodak’s blue reseller questionnaire (Perfect Page set) Portrait
16 1 Value-added tax return (Perfect Page set) Portrait
17 1 5" x 7" Glossy color photo Landscape
18 1 8.5" x 17" Glossy chart Portrait
Challenge document productivity test, continued
Doc # Qty Description Orientation
19 1 8.125" x 17" Photo Portrait
20, 21 2 Personal checks (Perfect Page set) Landscape
22 1 Toggle patch 8.5" x 11" with 2 corners cut o Landscape
23 1 USPS Express Mail multipart mailing label (Label 11-B) Landscape
24, 25 2 Steno pad, torn from spiral but not cleaned Portrait
26 1 USPS PS Form 3811, 3½" x 11" card stock Landscape
3
/
16
27, 28 2 USPS Certified Mail receipt, PS Form 3800, 3
" x 5 ½" Landscape
29 1 USPS envelope EP14H w/large window, 5" x 10" Landscape
30–33 3 Duplex printed copier paper (Pendleton) Portrait
34 1 Gloss personal identification card, 3¾" x 6 ¾" Landscape
7
1
/
/
8
" x 8
8
35 1 Textured invitation card 3
36 1
37 1
Duplex printed copier paper, wrinkled and
torn corner (Pendleton)
Scissor-cut black card stock, edges not straight
(approx 3¾" x 4½")
" Landscape
Portrait
Landscape
38 1 Tri-folded Kodak i1200/i1300 Scanner Quick Tips Portrait
39 1 Order form photocopy, 11" x 17" Portrait
40 1 Extended warranty application (Perfect Page set) Portrait
41–47 6 Duplex printed copier paper (Pendleton) Portrait
48 1
49 1 Blue Extremely Urgent USPS mailing envelope, 11½" x 15
50 1 NexPress Press sample document, glossy, 8
Red Domestic/International USPS mailing envelope,
11 ½" x 15
1
/
8
"
1
1
/
/
8
" x 10
Portrait
1
/
8
" Portrait
8
" Portrait
For more information about testing methodology and laboratory
test results, click here
Return to Real-world environment
Table of Contents
➡
➡
➡
Page 25

Appendix 4—Part C—Real-worldenvironment—Workstationcongurations
Workstation Components Version
OptiPlex 755 Minitower:
Operating system(s):
Memory: 2GB DDR2 Non-ECC SDRAM, 667MHz, (2 DIMM)
Boot Hard Drives: 250GB SATA 3.0Gb/s and 8MB DataBurst Cache
Video Card: Integrated Video, Intel GMA3100
Intel Core 2 Duo Processor E6850 (3.0GHz, 4M, VT,
1333MHz FSB)
Genuine Windows XP Professional, SP2, x32, with
Media, English
Scanner Related Components Version
PC Scanning Software EMC QuickScan Pro 6.5.1 demo (build 8372)
Created with QuickDriver Version
1.0.10710.10002
Canon DR-X10C Scanner ISIS Driver Canon DR-X10C version 1.1.10807.03001
Canon DR-X10C Scanner Firmware Version 2.10
Canon DR-X10C Scanner Driver Version 4.20.148
Interface Used (ISIS configuration) USB interface was used
Canon DR-X10C Kofax Card CGA Firmware Version 3.10.011
Interface Used (Canon VRS configuration) USB interface was used
Interface Used (Kodak) IEEE 1394—FireWire 400
Kodak i780 Scanner ISIS Drivers eki700 Version 2.0.10809.29001
Kodak i780 Scanner Firmware Version 2.00.21
PixTools 32-Bit Runtime Libraries Version 7.0 build 2124
For more information about testing methodology and
laboratory test results, click here
Return to Real-world environment
Table of Contents
➡
➡
➡
Page 26

Appendix 4—Part D—Real-world environment—Scanner features and settings profile
Kodak i780 Scanner configuration EMC Captiva QuickScan Pro v6.5.1 demo settings
Kodak i780 Scanner ISIS Multifeed Productivity Test Challenge Document Productivity Test
200 dpi, bitonal, duplex, AO, auto thresholding,
multifeed detection, multipage TIFF output
QuickScan scan profile name i780 Test job 01 i780 Test job 02
General—save images to this folder
Scan—show continue dialog after scan Checked Checked
Scan—scan mode Duplex Duplex
Scan—scan type Black and white Black and white
Scan—dpi 200 300
Scan—page size Scanner max Scanner max
Image format and naming—enter file name at … Checked Checked
Image format and naming—file type TIFF TIFF
Image format and naming—color format Binary Binary
Image format and naming—compression Group 4 Group 4
Image format and naming—append standard extension … Checked Checked
i780 ISIS driver, main, cropping Aggressive Aggressive
i780 ISIS driver, main, thresholding iThresholding iThresholding
i780 ISIS driver, main, contrast 0 0
i780 ISIS driver, layout, image orientation
(both front and back image #1)
i780 ISIS driver, layout, page orientation
(both front and back image #1)
i780 ISIS driver, scanner, document feeder 250—Automatically start transport 250—Automatically start transport
i780 ISIS driver, scanner, ultrasonic detection Medium—3 sensors—end job Medium—3 sensors—end job
i780 ISIS driver, dropout, blank image detection Black and white (back only)—2KB Black and white (back only)—2KB
i780 ISIS driver, image processing, JPEG quality N /A N/A
C:\Program Files\EMC Captiva\QuickScan\
My Images\i780\Job01
Automatic Automatic
Top edge first Top edge first
300 dpi, bitonal, duplex, AO, auto thresholding,
multifeed detection, multipage TIFF output
C:\Program Files\EMC Captiva\QuickScan\
My Images\i780\Job02
i780 ISIS driver, image processing, color correction N /A N/A
For more information about testing methodology and
laboratory test results, click here
Return to Real-world environment
Table of Contents
➡
➡
➡
Page 27

Appendix 4—Part D—Real-world environment—Scanner features and settings profile, continued
Canon DR-X10C Scanner, VRS configuration EMC Captiva QuickScan Pro v6.5.1 demo settings
Canon DR-X10C with VRS Option Multifeed Productivity Test Challenge Document Productivity Test
200 dpi, bitonal, duplex, AO, auto thresholding,
multifeed detection, multipage TIFF output
QuickScan scan profile name DR-X10C VRS test job 01 DR-X10C VRS test job 02
General—save images to this folder
Scan—show continue dialog after scan Checked Checked
Scan—scan mode Duplex Duplex
Scan—scan type Black and white Black and white
Scan—dpi 200 300
Scan—page size Scanner max Scanner max
Image format and naming—enter file name at … Checked Checked
Image format and naming—file type TIFF TIFF
Image format and naming—color format Binary Binary
Image format and naming—compression Group 4 Group 4
Image format and naming—
append standard extension …
PixKofax, main tab, paper source Feeder Feeder
PixKofax, main tab, dpi 200 300
PixKofax, main tab, mode Black and white Black and white
PixKofax, main tab, page size Scanner’s maximum Scanner’s maximum
PixKofax, main tab, orientation Portrait Portrait
PixKofax, main tab, simplex/duplex Duplex Duplex
PixKofax, more, detect page size Checked Checked
PixKofax, main tab, (scanner preset) {preset
names are retained so you can use dierent
names as needed}
PixKofax, advanced (VRS adjustments), clarity,
auto brightness
PixKofax, advanced (VRS adjustments), clarity,
brightness
C:\Program Files\EMC Captiva\QuickScan\My Images\
x10c-VRS\Job01
Checked Checked
Test01 Test02
Checked Checked
N/A N/A
300 dpi, bitonal, duplex, AO, auto thresholding,
multifeed detection, multipage TIFF output
C:\Program Files\EMC Captiva\QuickScan\My Images\
x10c-VRS\Job02
For more information about testing methodology and laboratory test results, click here
Return to Real-world environment
➡
Table of Contents
➡
➡
Page 28

Appendix 4—Part D—Real-world environment—Scanner features and settings profile, continued
Canon DR-X10C Scanner, VRS configuration, continued
Canon DR-X10C with VRS Option Multifeed Productivity Test Challenge Document Productivity Test
PixKofax, advanced (VRS adjustments), clarity, contrast 50 50
PixKofax, advanced (VRS adjustments), clarity,
advanced clarity
PixKofax, advanced (VRS adjustments), clarity, gamma 17 17
PixKofax, advanced (VRS adjustments), noise, line filter Normal Normal
PixKofax, advanced (VRS adjustments), noise, speckle removal Small Small
PixKofax, advanced (VRS adjustments), noise, fill holes Not checked Not checked
PixKofax, advanced (VRS adjustments), skew, deskew Deskew, auto crop, auto orientation Deskew, auto crop, auto orientation
PixKofax, advanced (VRS adjustments), color,
enable detection
PixKofax, advanced (VRS adjustments), background,
enable smoothing
PixKofax, advanced (VRS adjustments), blank page
PixKofax, advanced (VRS adjustments), (profile name) {profile
names are not retained in PixKofax so only use one}
PixKofax, VRS Admin, warnings, brightness out of range 35—Ignore error 35—Ignore error
PixKofax, VRS Admin, warnings, contrast out of range 40—Ignore error 40—Ignore error
PixKofax, VRS Admin, warnings, color confidence out of range 50—Ignore error 50—Ignore error
PixKofax, VRS Admin, errors, paper jam Auto resolve Auto resolve
PixKofax, VRS Admin, errors, multifeed Auto resolve Auto resolve
PixKofax, VRS Admin, errors, out of paper Auto resolve Auto resolve
PixKofax, VRS Admin, errors, cover open Auto resolve Auto resolve
PixKofax, VRS Admin, errors, auto crop failure boundary
note detected
PixKofax, VRS Admin, errors, auto deskew failure Ignore error Ignore error
PixKofax, VRS Admin, errors, staple detection Auto resolve Auto resolve
PixKofax, VRS Admin, errors, excessive skew Auto resolve Auto resolve
PixKofax, VRS Admin, accelerated scanning Best Best
PixKofax, advanced (VRS adjustments),
Canon ISIS, endorser
PixKofax, advanced (VRS adjustments), Canon ISIS,
color—front/rear color dropout
Enabled detection, delete, context @ 50,
Enabled @ level 2 Enabled @ level 2
N/A N/A
N/A N/A
Enabled detection, delete, context @ 50,
ignore holes
Test Test
Ignore error Ignore error
No endorser No endorser
None None
ignore holes
For more information about testing methodology and laboratory test results, click here
Return to Real-world environment
➡
Table of Contents
➡
➡
Page 29

Appendix 4—Part D—Real-world environment—Scanner features and settings profile, continued
Canon DR-X10C Scanner, VRS configuration, continued
Canon DR-X10C with VRS Option Multifeed Productivity Test Challenge Document Productivity Test
PixKofax, advanced (VRS Adjustments), Canon ISIS, color, JPEG compression Good Good
PixKofax, advanced (VRS Adjustments), Canon ISIS, picking rectangle Not checked Not checked
PixKofax, advanced (VRS Adjustments), Canon ISIS, rotation (front/rear) 0 0
PixKofax, advanced (VRS Adjustments), Canon ISIS, multifeed Enabled with 3 zones Enabled with 3 zones
PixKofax, advanced (VRS Adjustments), Canon ISIS, other (speed/quality) High speed scanning enabled High speed scanning enabled
PixKofax, advanced (VRS Adjustments), Canon ISIS, other, moire removal Checked Checked
PixKofax, advanced (VRS Adjustments), Canon ISIS, other, staple detection Checked Checked
PixKofax, advanced (VRS Adjustments), Canon ISIS, other, error recovery Checked Checked
Canon DR-X10C Operator control panel settings
Canon DR-X10C OCP—buzzer control (ON2 ON1 OFF) ON2 ON2
Canon DR-X10C OCP—double feed control (
Canon DR-X10C OCP—double feed retry (3-2-1-OFF) 1 1
Canon DR-X10C OCP—staple detection (ON/OFF) ON ON
Canon DR-X10C OCP—staple control (2/1/0) 0 0
Canon DR-X10C OCP—long document (ON/OFF)
Canon DR-X10C OCP—manual feed mode (ON/OFF) OFF OFF
Canon DR-X10C OCP—stand by mode (240-60-10) 240 240
Canon DR-X10C OCP—Japanese (ON/OFF) OFF OFF
Canon DR-X10C OCP—display contrast — —
Canon DR-X10C OCP—SCSI speed (20-10-5) 20 20
Canon DR-X10C OCP—USB short packet (ON/OFF) ON ON
Canon DR-X10C OCP—dust detection mode (ON/OFF) ON2 ON2
Canon DR-X10C OCP—tray position (2-1-0) 1 1
Canon DR-X10C OCP—torque control (5-4-3-2-1) 3 3
Canon DR-X10C OCP—auto USB power o (
Canon DR-X10C OCP—total counter (display only) N/A N/A
Canon DR-X10C OCP—roller counter (reset to 0) N/A N/A
Canon DR-X10C OCP—imprinter test N/A N/A
Canon DR-X10C OCP—cleaning mode N/A N/A
ON/OFF) ON ON
OFF OFF
ON/OFF) OFF OFF
For more information about testing methodology and laboratory test results, click here
Return to Real-world environment
➡
Table of Contents
➡
➡
Page 30

Appendix 4—Part D—Real-world environment—Scanner features and settings profile, continued
Canon DR-X10C Scanner, ISIS configuration EMC Captiva QuickScan Pro v6.5.1 demo settings
Canon DR-X10C ISIS Multifeed Productivity Test Challenge Document Productivity Test
200 dpi, bitonal, duplex, AO, auto thresholding,
multifeed detection, multipage TIFF output
QuickScan scan profile name DR-X10C ISIS test job 01 DR-X10
General—save images to this folder
Scan—show continue dialog after scan Checked Checked
Scan—scan mode Duplex Duplex
Scan—scan type Black and white Black and white
Scan—dpi 200 300
Scan—page size Scanner max Scanner max
Image format and naming—enter file name at… Checked Checked
Image format and naming—file type TIFF TIFF
Image format and naming—color format Binary Binary
Image format and naming—compression Group 4 Group 4
Image format and naming—append standard extension … Checked Checked
DR-X10C ISIS Driver, basic, user preference
DR-X10C ISIS Driver, basic, mode Black and white Black and white
DR-X10C ISIS Driver, basic, page size Auto detection Auto detection
DR-X10C ISIS Driver, basic, dpi 200 300
DR-X10C ISIS Driver, basic, scanning mode Duplex Duplex
DR-X10C ISIS Driver, basic, deskew Checked Checked
DR-X10C ISIS Driver, brightness, auto Checked Checked
DR-X10C ISIS Driver, brightness, gamma, custom Not checked Not checked
DR-X10C ISIS Driver, image processing, text orientation Checked Checked
DR-X10C ISIS Driver, other, rapid recovery system Checked Checked
DR-X10C ISIS Driver, other, JPEG transfer N/A N/A
DR-X10C ISIS Driver, other, staple detection Checked Checked
DR-X10C ISIS Driver, other, feeding option Standard feeding Standard feeding
DR-X10C ISIS Driver, other, double feed detection Ultrasonic Ultrasonic
DR-X10C ISIS Driver, other, double feed detection, setting 3 Sensors 3 Sensors
C:\Program Files\EMC Captiva\QuickScan\
My Images\x10c-ISIS\Job01
300 dpi, bitonal, duplex, AO, auto thresholding,
multifeed detection, multipage TIFF output
C ISIS test job 02
C:\Program Files\EMC Captiva\QuickScan\
My Images\x10c-ISIS\Job02
For more information about testing methodology and
laboratory test results, click here
Return to Real-world environment
Table of Contents
➡
➡
➡
Page 31

Appendix 4—Part D—Real-world environment—Scanner features and settings profile, continued
Canon DR-X10C Scanner, ISIS configuration, continued
Canon DR-X10C ISIS Multifeed Productivity Test Challenge Document Productivity Test
Canon DR-X10C Operator control panel settings
Canon DR-X10C OCP—buzzer control (ON2 ON1 OFF) ON2 ON2
Canon DR-X10C OCP—double feed control (
Canon DR-X10C OCP—double feed retry (3-2-1-OFF) 1 1
Canon DR-X10C OCP—staple detection (
Canon DR-X10C OCP—staple control (2/1/0) 0 0
Canon DR-X10C OCP—long document (ON/OFF)
Canon DR-X10C OCP—manual feed mode (ON/OFF) OFF OFF
Canon DR-X10C OCP—stand by mode (240-60-10) 240 240
Canon DR-X10C OCP—Japanese (ON/OFF)
Canon DR-X10C OCP—display contrast N/A N/A
Canon DR-X10C OCP—SCSI speed (20-10-5) 20 20
Canon DR-X10C OCP—USB short packet (
Canon DR-X10C OCP—dust detection mode (ON/OFF) ON2 ON2
Canon DR-X10C OCP—tray position (2-1-0) 1 1
Canon DR-X10C OCP—torque control (5-4-3-2-1) 3 3
Canon DR-X10C OCP—auto USB power o (
Canon DR-X10C OCP—total counter (display only) N/A N/A
Canon DR-X10C OCP—roller counter (reset to 0) N/A N/A
Canon DR-X10C OCP—imprinter test N/A N/A
Canon DR-X10C OCP—cleaning mode N/A N/A
ON/OFF) ON ON
ON/OFF) ON ON
OFF OFF
OFF OFF
ON/OFF) ON ON
ON/OFF) OFF OFF
For more information about testing methodology and
laboratory test results, click here
Return to Real-world environment
Table of Contents
➡
➡
➡
Page 32

Appendix 5—Real-world environment—Testing methodology and results (dust and contaminants)
Kodak’s Quality Assurance Team conducted a series of comprehensive, competitive benchmark
tests comparing the Kodak i780 Scanner with VRS to the Canon DR-X10C Scanner ISIS. Testing
parameters exceeded normal benchmark tests.
Real-world results: testing results (for dust and contaminants)
Tests performed:
1) Performance of Dust Evasion System
Result—This test was halted when we could not get the Dust Detection System to detect
dust in the scanner during normal operation.
2)
Determine the Dust Particle size needed to trigger the Canon DR-X10C Scanner Dust
Detection System
Result—This test was halted. We could not get dust to trigger the detection system.
Canon DR-X10C Scanner Streak Detection Software
Testing was performed using Dust Detect Modes ON1 and ON2.
Test 1—Description and detailed results
The intent of this test was to seed the imaging area of the Canon DR-X10C Scanner with
a large quantity of naturally made paper dust. Dust was collected from Kodak Scanners
normally used for testing purposes in the QA Lab. Dust was placed on the upper and lower
image paths.
This is a photo of the dust that was seeded in the scanner at the beginning of the test. The
dust was collected from several scanners in the QA Lab. This was not “manufactured” dust.
This photo was taken after the first sheet was scanned. Notice there is little sign of the piles
of dust that had been placed in the scanner.
Note: Dust Detection occurs prior to scanning the first image.
Canon DR-X10C Scanner Sleep Mode
The scanner has a configurable sleep mode. The settings are 10, 60, and 240 min.
We did not find a way to turn this o.
When the scanner is enabled after waking up from Stand-by Mode, the cleaning
system activates.
For more information about testing methodology and
laboratory test results, click here
Return to Real-world environment
Table of Contents
➡
➡
➡
Page 33

Appendix 5—Real-world environment—Testing methodology and results (dust and contaminants), continued
Performance of Dust Evasion System Test—detailed results, continued
This is a portion of the first image taken. There were streaks both in the image and in the
background.
s Streak on the document
s Streaks seen in the background
Conclusion
The scanner’s ability to remove large amounts of dust from the imaging area was observed.
However, there was still a noticeable streak in the image after the dust was removed.
Dust particle size to trigger Canon DR-X10C Dust Detection System
The intent of this test was to run the scanner until there was a visible streak in the image and
disable the scanner. When the scanner was re-enabled the dust detection system was to
detect the dust, clean the imaging area and continue scanning. This test would be repeated
until the Dust Detection System could no longer correct for the dust on the guides.
To speed up the creation of dust, the Dust Creator Tool was used.
Photo of Dust Creation Tool
During our testing we noticed that there were very visible streaks in the images. When the
scanner was disabled and re-enabled, the Dust Detection System did not detect the dust.
The dust streak grew from 1 pixel wide to about 49 pixels wide. Dust was not detected by the
Dust Detection System using either the ON1 or ON2 settings.
Conclusion
The Dust Detection System did not detect dust that was clearly visible in the image.
For more information about testing methodology
and laboratory test results, click here
Return to Real-world environment
Table of Contents
➡
➡
➡
Page 34

Appendix 5—Real-world environment—Testing methodology and results (dust and contaminants), continued
Test #2—Determine dust particle size to trigger DR-X10C Dust Detection System—
detailed results
The intent of this test was to determine under what conditions the Dust Detection System
would detect dust.
Using a “Dust Creation Tool” to create dust quickly, we also needed a way to prevent the dust
brush from cleaning the imaging area. We taped a piece of plastic document protector over
the brush mechanism.
To determine if the Dust Detection System was operating, we placed a sticky note over the
image guide. This action triggered a dust detection “event.”
We then cut the sticky notes into smaller and smaller width strips and placed them on the
image guides. This also triggered a dust event. We were able to create a sliver at about 1/16th
inch wide. This also triggered a dust detection event. We concluded that the Dust Detection
System was functioning.
We scanned for several days using the Dust Creation Tool. We were disabling and re-enabling
every 10 documents. The Dust Detection System did not detect dust.
We placed a pile of dust just before the image guide and allowed the document to spread dust
throughout the scanner. The dust was visible in the image, but the Dust Detection System did
not detect a dust error.
We scanned in bitonal image capture mode and got the same results.
As a last test we taped a human hair across the imaging area. This was immediately detected
when the scanner was enabled.
Overall testing conclusion
The Dust Detection System did not detect dust but could detect more dense or solid objects.
We concluded that if the test was run long enough, the dust would have built up to the point
were the Dust Detection System would have triggered an event. However, streaks caused by
dust would have been noticeable in images long before then.
Return to Real-world environment
Table of Contents
➡
➡
 Loading...