

Page 1
Keysight U4301 PCIe Gen3
Analyzer
User’s Guide
Page 2

Notices
CAUTION
WARNING
© Keysight Technologies 2008-2015, 2017
No part of this manual may be reproduced in
any form or by any means (including electronic storage and retrieval or translation
into a foreign language) without prior agreement and written consent from Keysight
Technologies as governed by United States
and international copyright laws.
Trademarks
UNIX is a registered trademark of UNIX System Laboratories in the U.S.A. and other
countries. Target is copyrighted by Thru-Put
Systems, Inc.
Manual Part Number
U4301-97001
Edition
May 2017
Available in electronic format only
Keysight Technologies
1900 Garden of the Gods Road
Colorado Springs, CO 80907 USA
Warranty
THE MATERIAL CONTAINED IN THIS
DOCUMENT IS PROVIDED "AS IS," AND IS
SUBJECT TO BEING CHANGED, WITHOUT
NOTICE, IN FUTURE EDITIONS. FURTHER,
TO THE MAXIMUM EXTENT PERMITTED BY
APPLICABLE LAW, KEYSIGHT DISCLAIMS
ALL WARRANTIES, EITHER EXPRESS OR
IMPLIED WITH REGARD TO THIS MANUAL
AND ANY INFORMATION CONTAINED
HEREIN, INCLUDING BUT NOT LIMITED TO
THE IMPLIED WARRANTIES OF
MERCHANTABILITY AND FITNESS FOR A
PARTICULAR PURPOSE. KEYSIGHT SHALL
NOT BE LIABLE FOR ERRORS OR FOR
INCIDENTAL OR CONSEQUENTIAL
DAMAGES IN CONNECTION WITH THE
FURNISHING, USE, OR PERFORMANCE OF
THIS DOCUMENT OR ANY INFORMATION
CONTAINED HEREIN. SHOULD KEYSIGHT
AND THE USER HAVE A SEPARATE WRITTEN
AGREEMENT WITH WARRANTY TERMS
COVERING THE MATERIAL IN THIS
DOCUMENT THAT CONFLICT WITH THESE
TERMS, THE WARRANTY TERMS IN THE
SEPARATE AGREEMENT WILL CONTROL.
Technology Licenses
The hardware and/or software described in
this document are furnished under a license
and may be used or copied only in accordance with the terms of such license.
U.S. Government Rights
The Software is "commercial computer software," as defined by Federal Acquisition
Regulation ("FAR") 2.101. Pursuant to FAR
12.212 and 27.405-3 and Department of
Defense FAR Supplement ("DFARS")
227.7202, the U.S. government acquires
commercial computer software under the
same terms by which the software is customarily provided to the public. Accordingly,
Keysight provides the Software to U.S. government customers under its standard commercial license, which is embodied in its
End User License Agreement (EULA), a copy
of which can be found at
sight.com/find/sweula
forth in the EULA represents the exclusive
authority by which the U.S. government may
use, modify, distribute, or disclose the Software. The EULA and the license set forth
therein, does not require or permit, among
other things, that Keysight: (1) Furnish technical information related to commercial
computer software or commercial computer
software documentation that is not customarily provided to the public; or (2) Relinquish
to, or otherwise provide, the government
rights in excess of these rights customarily
provided to the public to use, modify, reproduce, release, perform, display, or disclose
commercial computer software or commercial computer software documentation. No
additional government requirements beyond
those set forth in the EULA shall apply,
except to the extent that those terms, rights,
or licenses are explicitly required from all
providers of commercial computer software
pursuant to the FAR and the DFARS and are
set forth specifically in writing elsewhere in
the EULA. Keysight shall be under no obligation to update, revise or otherwise modify
the Software. With respect to any technical
data as defined by FAR 2.101, pursuant to
FAR 12.211 and 27.404.2 and DFARS
227.7102, the U.S. government acquires no
http://www.key-
. The license set
greater than Limited Rights as defined in
FAR 27.401 or DFAR 227.7103-5 (c), as
applicable in any technical data.
Safety Notices
A CAUTION notice denotes a hazard. It
calls attention to an operating procedure, practice, or the like that, if not
correctly performed or adhered to,
could result in damage to the product
or loss of important data. Do not proceed beyond a CAUTION notice until
the indicated conditions are fully
understood and met.
A WARNING notice denotes a hazard.
It calls attention to an operating procedure, practice, or the like that, if not
correctly performed or adhered to,
could result in personal injury or
death. Do not proceed beyond a
WARNING notice until the indicated
conditions are fully understood and
met.
2 Keysight U4301 PCIe Gen3 Analyzer User’s Guide
Page 3

Safety Summary
CAUTION
WARNING
General Do not use this product in any manner not specified by the manufacturer. The protective features of
The following general safety precautions must be observed during all phases of operation of this
instrument. Failure to comply with these precautions or with specific warnings or operating
instructions in the product manuals violates safety standards of design, manufacture, and intended
use of the instrument. Keysight Technologies assumes no liability for the customer's failure to comply
with these requirements. Product manuals are provided with your instrument on CD-ROM and/or in
printed form. Printed manuals are an option for many products. Manuals may also be available on
the Web. Go to www.keysight.com and type in your product number in the Search field at the top of
the page.
this product may be impaired if it is used in a manner not specified in the operation instructions.
Before Applying
Power
Ground the
Instrument
Fuses See the user's guide or operator's manual for information about line-fuse replacement. Some
Do Not Operate in
an Explosive
Atmosphere
Do Not Remove the
Instrument Cover
Cleaning Clean the outside of the instrument with a soft, lint-free, slightly dampened cloth. Do not use
Do Not Modify the
Instrument
Verify that all safety precautions are taken. Make all connections to the unit before applying power.
Note the instrument's external markings described in “Safety Symbols”.
If your product is provided with a grounding type power plug, the instrument chassis and cover must
be connected to an electrical ground to minimize shock hazard. The ground pin must be firmly
connected to an electrical ground (safety ground) terminal at the power outlet. Any interruption of
the protective (grounding) conductor or disconnection of the protective earth terminal will cause a
potential shock hazard that could result in personal injury.
instruments contain an internal fuse, which is not user accessible.
Do not operate the instrument in the presence of flammable gases or fumes.
Only qualified, service-trained personnel who are aware of the hazards involved should remove
instrument covers. Always disconnect the power cable and any external circuits before removing the
instrument cover.
detergent or chemical solvents.
Do not install substitute parts or perform any unauthorized modification to the product. Return the
product to a Keysight Sales and Service Office for service and repair to ensure that safety features
are maintained.
In Case of Damage Instruments that appear damaged or defective should be made inoperative and secured against
unintended operation until they can be repaired by qualified service personnel.
A CAUTION notice denotes a hazard. It calls attention to an operating procedure, practice,
or the like that, if not correctly performed or adhered to, could result in damage to the
product or loss of important data. Do not proceed beyond a CAUTION notice until the
indicated conditions are fully understood and met.
A WARNING notice denotes a hazard. It calls attention to an operating procedure,
practice, or the like that, if not correctly performed or adhered to, could result in
personal injury or death. Do not proceed beyond a WARNING notice until the indicated
conditions are fully understood and met.
Keysight U4301 PCIe Gen3 Analyzer User’s Guide 3
Page 4

Safety Symbols
Table 1 Safety Symbol
Symbol Description
Direct current
Alternating current
Both direct and alternating current
Three phase alternating current
Three phase alternating current
Earth ground terminal
Protective earth ground terminal
Frame or chassis ground terminal
N Neutral conductor on permanently
L Line conductor on permanently installed
Terminal is at earth potential
Equipotentiality
installed equipment
equipment
On (mains supply)
Off (mains supply)
Standby (mains supply). The instrument is
not completely disconnected from the
mains supply when the power switch is in
the standby position
In position of a bi-stable push switch
4 Keysight U4301 PCIe Gen3 Analyzer User’s Guide
Page 5
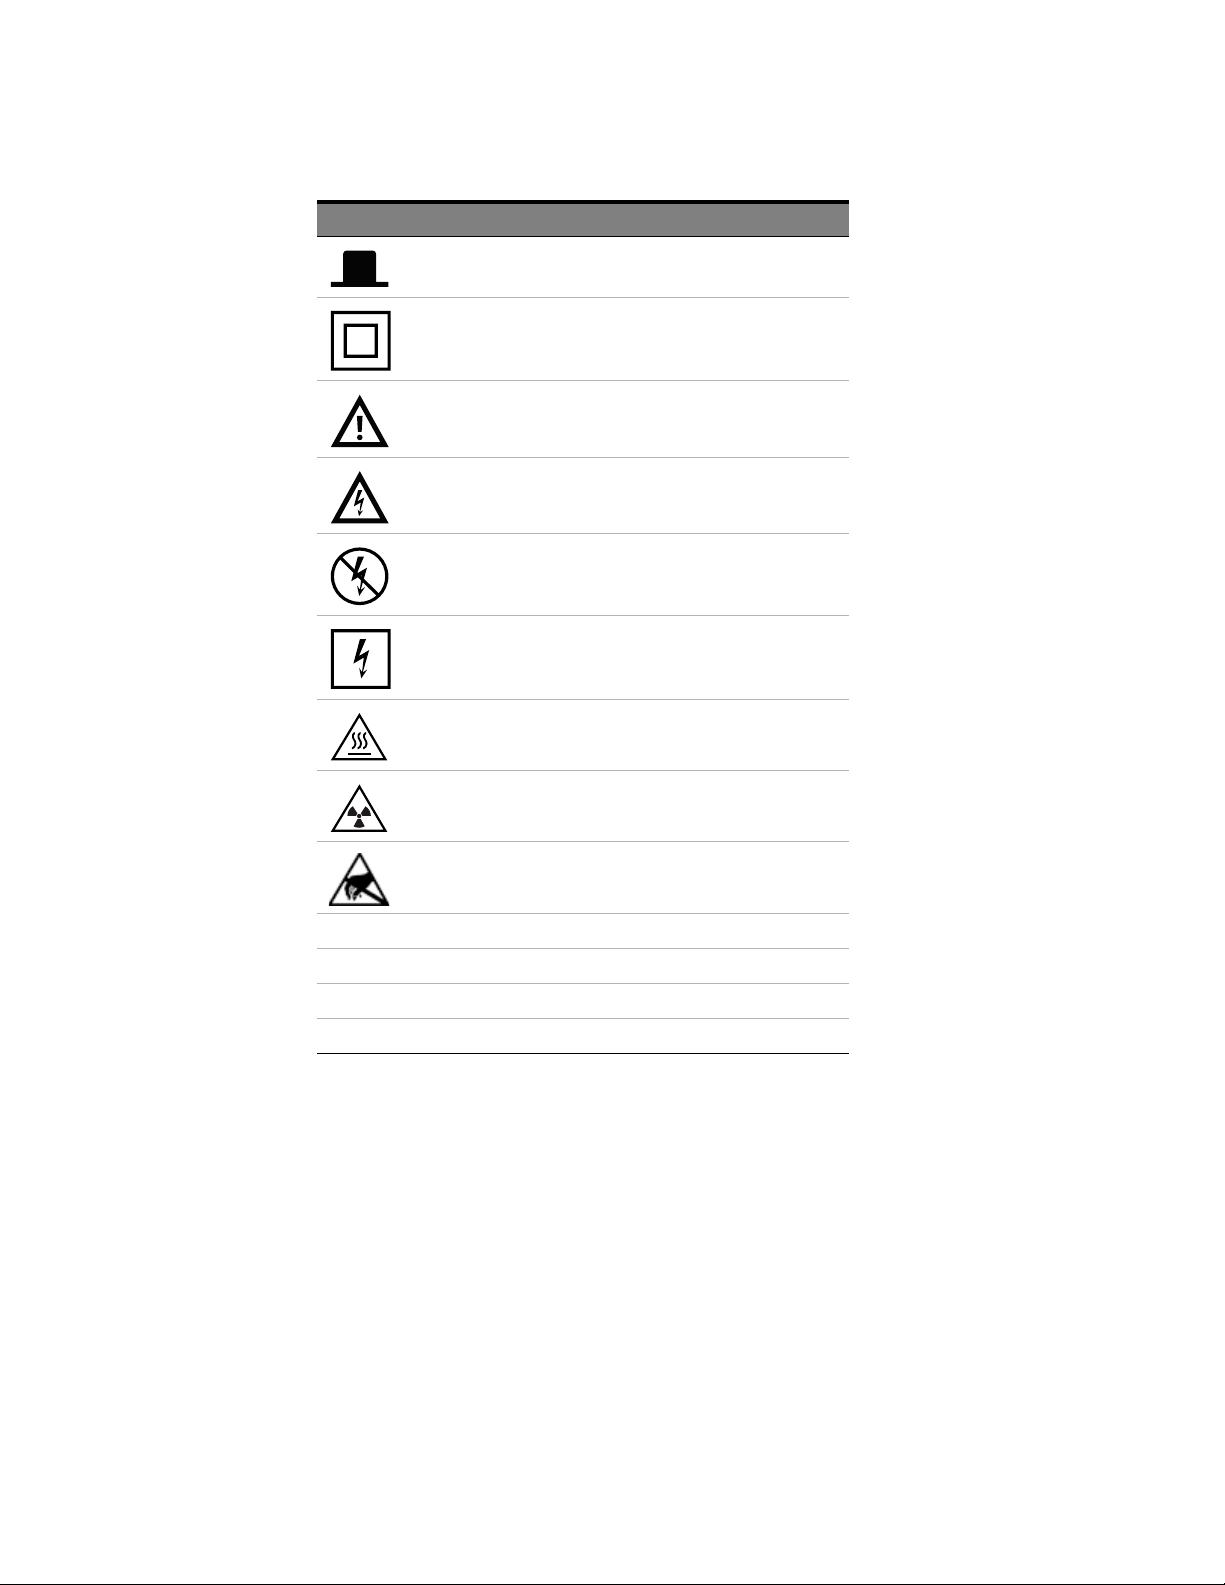
Symbol Description
Out position of a bi-stable push switch
Equipment protected throughout by
DOUBLE INSULATION or REINFORCED
INSULATION
Caution, refer to accompanying
documentation
Caution, risk of electric shock
Do not apply around or remove from
HAZARDOUS LIVE conductors
Application around and removal from
HAZARDOUS LIVE conductors is
permitted
Caution, hot surface
Ionizing radiation
Indicates that antistatic precautions
should be taken
CAT I IEC Measurement Category I
CAT II Measurement Category II
CAT III Measurement Category III
CAT IV Measurement Category IV
Keysight U4301 PCIe Gen3 Analyzer User’s Guide 5
Page 6
Compliance and Environmental Information
Table 2 Compliance and Environmental Information
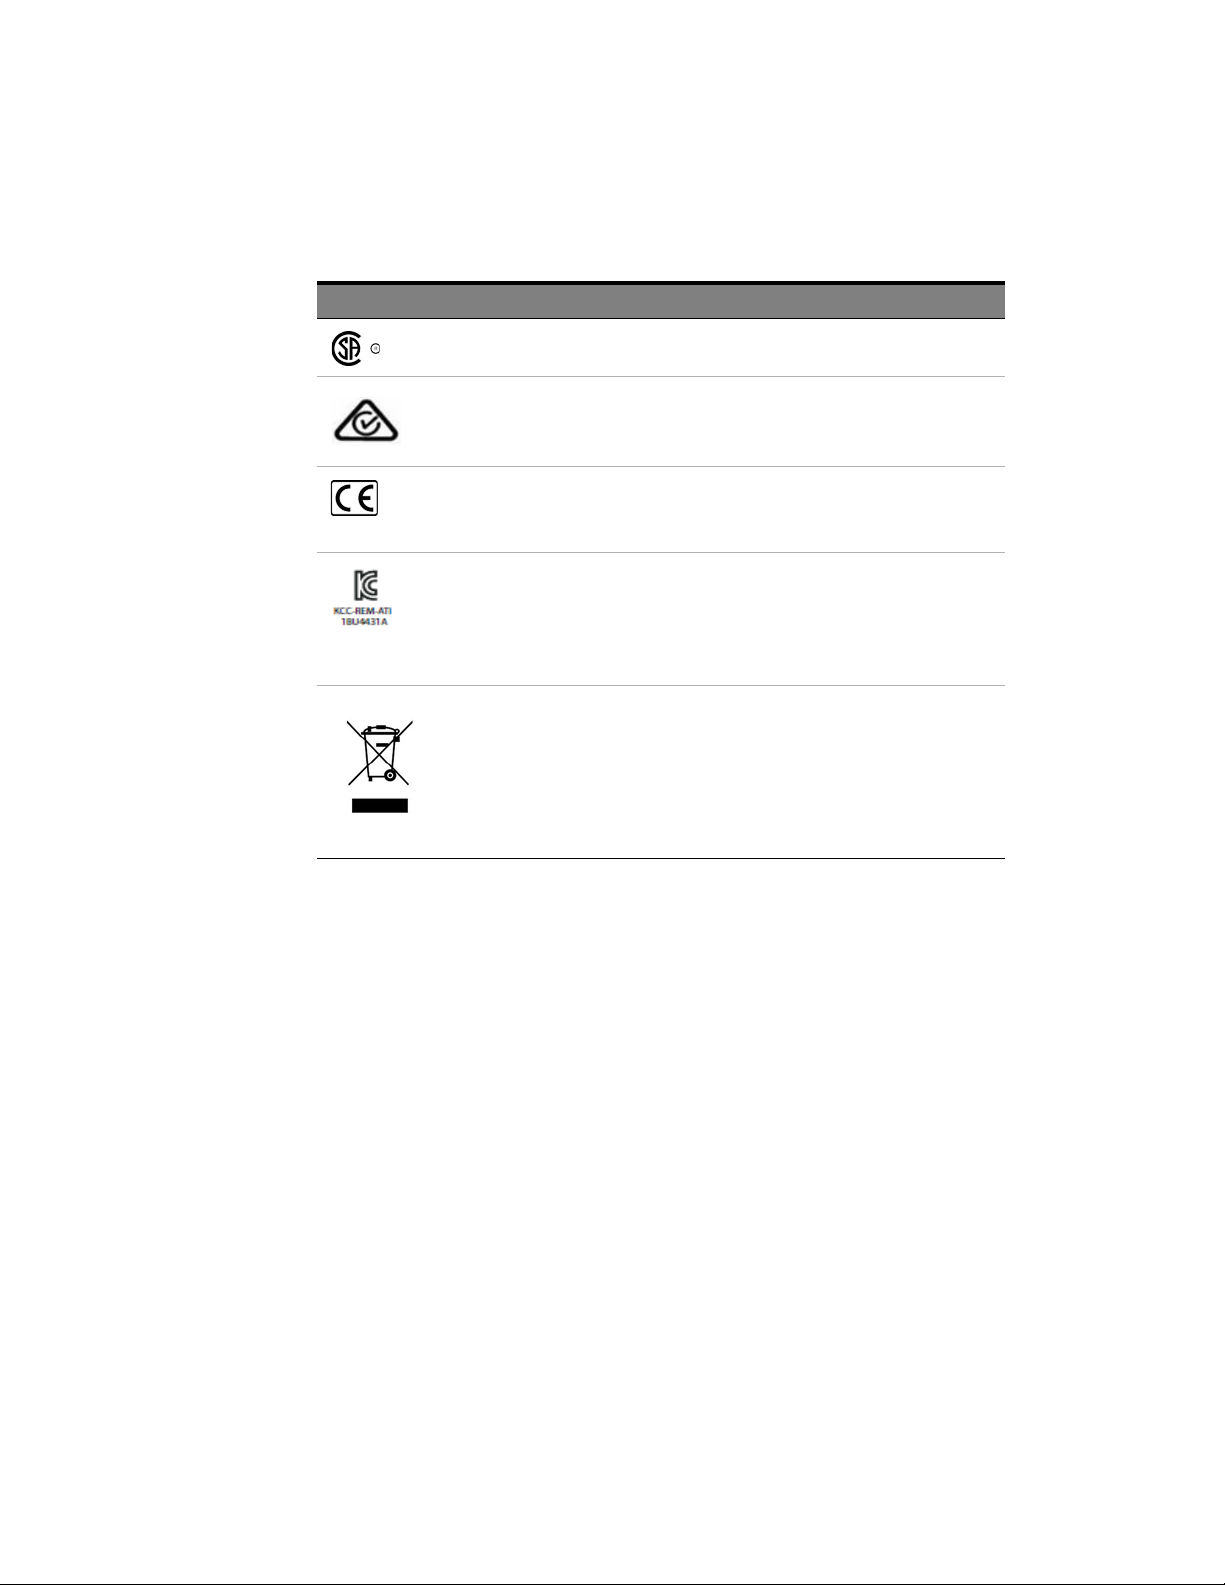
Safety Symbol Description
CSA is the Canadian certification mark to demonstrate compliance with the Safety
requirements.
The C-tick mark is a registered trademark of the Spectrum Management Agency of
Australia. This signifies compliance with the Australia EMC Framework regulations
under the terms of the Radio Communication Act of 1992.
CE compliance marking to the EU Safety and EMC Directives.
ISM GRP-1A classification according to the international EMC standard.
ICES/NMB-001 compliance marking to the Canadian EMC standard.
KC certification mark to demonstrate compliance with the South Korean EMC
requirements.
South Korean Class A EMC declaration
This equipment is Class A suitable for professional use and is for use in
electromagnetic environments outside of the home.
This product complies with the WEEE Directive (2002/96/EC) marking requirements.
The affixed label indicates that you must not discard this electrical/ electronic
product in domestic household waste.
Product Category: With reference to the equipment types in WEEE Directive Annex I,
this product is classified as a “Monitoring and Control instrumentation product”.
Do not dispose in household waste.
To return unwanted products, contact your local Keysight office, or see
www.keysight.com/environment/product/ for more information.
6 Keysight U4301 PCIe Gen3 Analyzer User’s Guide
Page 7

U4301A/B PCIe Gen3 Analyzer—At a Glance
NOTE
The U4301A/B PCIe Gen3 analyzer lets you capture and decode PCI Express 3.0 (PCIe 3.0) data and
view it in a Protocol Viewer window. The protocol analyzer supports all PCIe 3.0 speeds, including 2.5
GT/s (Gen1) and 5.0 GT/s (Gen2) through PCIe 8 GT/s (Gen3), and it supports link widths from x1 to
x16.
The U4301B PCIe Gen3 analyzer provides enhanced PCIe Gen3 features over the U4301A analyzer.
You can install the U4301B module in a Keysight AXIe chassis (for example, the M9502A 2 slot
chassis). The U4301A module can be installed in a Keysight Digital Test Console chassis (for
example, the U4002A portable 2-slot chassis) or a Keysight AXIe chassis (for example, the M9502A 2
slot chassis).
When a controller PC is connected to a Keysight chassis via an external PCIe interface and cable, the
Keysight Logic and Protocol Analyzer application (running on the controller PC) lets you connect to
the chassis, set up U4301A/B PCIe Gen3 analyzer data captures, and perform analysis.
You can upgrade your U4301A module and enhance its PCIe Gen3 features by using the System
level upgrade license (U4301U-GFP). This license includes a system level upgrade of the U4301A
module to match the features available with the latest U4301B module. This upgrade includes 8
GB Capture Buffer, LTSSM Viewer, Transaction Decoder, and Offline Performance Summary
features.
If there are multiple U4301A modules in a chassis, then installing the System Level Upgrade
license on one of these modules enables features such as LTSSM Viewer, Transaction Decoder,
and Offline Performance Summary on all the U4301A modules in the chassis. The capture buffer,
however, is upgraded only for the U4301A module on which the system level upgrade license has
been installed and not for all the U4301A modules in the chassis.
The U4301A/B PCIe Gen3 analyzer provides:
Effective presentation of protocol interactions from physical layer to transaction layer:
• Industry standard spreadsheet format protocol viewer with:
• Highlighting by packet type or direction.
• Easy flow columns to better understand the stimulus and response nature of the protocols.
• Context sensitive columns to show only the relevant information, minimizing the need to
scroll horizontally.
• Flexible GUI configuration to meet debug needs, with pre-defined GUI layouts for Link Training
debug, Config accesses, and general I/O.
Simple and powerful state-based triggering:
• New simple trigger mode makes it easy to setup single event triggers.
• Powerful state-based triggering including:
• Four states supported in trigger sequencer.
• Triggering on patterns (ordered set patterns or packet types).
• Internal counters and timers.
• Triggering on an ordered set on a specific lane.
• External trigger in/out.
Powerful hardware features ensure capture of important transition events:
• Dual phase lock loops (PLLs) per direction ensuring that the analyzer will lock on speed change
events quickly and not miss any critical data.
Keysight U4301 PCIe Gen3 Analyzer User’s Guide 7
Page 8

• 8 GB capture buffer for a U4301B module. 4 GB capture buffer for a U4301A module. This can be
upgraded to 8 GB if the System Level Upgrade license is installed on the U4301A module.
• PCIe Gen1 x4 link to the host PC, provides up to 10 Gbps of data download.
• LEDs to show lane status and speed for fast understanding of current link status.
Cross-triggering with an external oscilloscope and making time-correlated measurements (using
markers).
• You can display data captured by the oscilloscope in the Waveform and Listing display windows.
This external oscilloscope correlation and data display feature is also referred to as View Scope.
To know more about this feature and how to use it with the U4301 Analyzer, refer to the External
Oscilloscope Time Correlation and Data Display Online Help.
See • "Using the PCIe Gen3 Analyzer" on page 9
8 Keysight U4301 PCIe Gen3 Analyzer User’s Guide
Page 9

Using the PCIe Gen3 Analyzer
For an overview and list of features, see: "U4301A/B PCIe Gen3 Analyzer—At a Glance" on page 7
•Chapter 1, "Hardware and Software Installation" on page 17
•Chapter 2, "Probing Options for PCIe Gen3" on page 19
•Chapter 3, "Specifying the Connection Setup" on page 21
•Chapter 4, "Setting the Capture Options" on page 33
•Chapter 5, "Tuning the Analyzer for a Specific DUT" on page 37
•Chapter 6 "Setting Up Triggers" on page 55
•Chapter 7 "Running/Stopping Captures" on page 71
•Chapter 8, "Viewing PCIe Gen3 Packets and Traffic Overview" on page 73
•Chapter 9, "Viewing and Interpreting Equalization Summary Data" on page 106
• Chapter 10, "Configuring and Computing Decoded Transactions" on page 115
• Chapter 11 "Viewing Offline Performance Summary" on page 157
See Also • U4305 PCIe Gen3 exerciser documentation.
Keysight U4301 PCIe Gen3 Analyzer User’s Guide 9
Page 10

10 Keysight U4301 PCIe Gen3 Analyzer User’s Guide
Page 11

Contents
Safety Summary 3
Compliance and Environmental Information 6
U4301A/B PCIe Gen3 Analyzer—At a Glance 7
Using the PCIe Gen3 Analyzer 9
1 Hardware and Software Installation
2 Probing Options for PCIe Gen3
3 Specifying the Connection Setup
Probing options 21
U4321A Solid Slot Interposer Card 22
U4322A Soft Touch Midbus 3.0 probe 22
U4324A PCIe Gen 3 Flying Lead probe 22
U4328A M.2 (M-key) Interposer 23
U4330A U.2 (SFF-8639) Interposer 23
To specify the connection setup 23
4 Setting the Capture Options
5 Tuning the Analyzer for a Specific DUT
PCIe Gen3 Tuning Overview 38
What is Tuning 38
How Tuning Works 38
When to Perform Tuning 38
Default and User Defined .ptu Files 38
Tuning - Broad steps 39
Tuning Method 40
Preparing the U4301A/B Module and DUT for Tuning 41
Creating a Physical Layer Tuning File 42
To create a physical layer tuning file 42
LEDs display during BER Based Tuning 47
Loading a Tuning File in the Logic and Protocol Analyzer GUI 48
Tuning a Bidirectional Setup 50
Keysight U4301 PCIe Gen3 Analyzer User’s Guide 11
Page 12

Contents
6 Setting Up Triggers
Fine Tuning a .ptu File 51
Fine Tuning Flow 51
To fine tune a .ptu file 51
Setting Up Simple Triggers 56
Setting Up Advanced Triggers 59
Using Timers in Advanced Triggers 62
Setting General Trigger Options 64
To select which links the trigger is for 64
To set the trigger position 64
To save/recall favorite triggers 64
To clear the current trigger 65
Setting up a Trigger on Physical Layer Errors 66
Physical Layer Errors Supported for Triggering 66
To set up a trigger on error 66
To view the Trigger on Error and Errored Packet 68
Possible Reasons for an Errored Packet not Appearing in the Protocol Viewer After the Trigger on
Error Occurred
70
7 Running/Stopping Captures
8 Viewing PCIe Gen3 Packets and Traffic Overview
Filtering Packets Displayed in Protocol Viewer 75
Filtering Bidirectional Packets Data 77
Searching for Specific Packets in Protocol Viewer 80
Compacting the Display of Training Sequence Packets 82
Example - Compacted Display 82
To configure the Compact setup 83
To enable the compact display 84
To turn off the compact display 84
Viewing the Captured PCIe Traffic Statistics 85
Navigating through the captured PCIe packets 87
Viewing a Traffic Overview Chart 89
To display a traffic overview chart 89
Understanding the Displayed Traffic Overview Chart 89
Customizing the Traffic Overview Chart 89
Zooming In/Out the Traffic Overview Chart 90
Placing markers in the traffic overview chart 91
12 Keysight U4301 PCIe Gen3 Analyzer User’s Guide
Page 13

Exporting Packet Times from a Traffic Overview Chart to a .csv or an Excel File 93
Exporting Captured PCIe Data to a .csv File 95
9 Viewing LTSSM States, State Transitions, and Equalization Summary
LTSSM Overview 98
Prerequisites 101
Configuring and Computing LTSSM States and Equalization Summary 102
Viewing LTSSM States/Transitions Data 104
Viewing and Interpreting Equalization Summary Data 106
Exporting Equalization Summary Data to an Excel File 107
Customizing the Display in the Equalization Summary Section 108
Navigating Through the LTSSM Transitions/States/EQ occurrences 110
Interpreting LTSSM States and Transition Results 111
Contents
10 Computing and Viewing Decoded Transactions
Transaction Decoding - Overview 114
Types of Protocols Supported 114
Transaction Decode Tab 114
Configuring and Computing Decoded Transactions 115
Before you Start 115
Computing Transactions from the Captured Data 115
Defining / Verifying the Device Setup 117
Saving the Device Setup Details 121
Viewing the Configuration Space of a DUT 122
Configuring Timestamps Displayed in the Computed Transactions 123
Saving the Computed Transaction Data 124
Clearing the Computed Transaction Data 124
Interpreting and Navigating Through the Transaction Decode Results 126
Transaction Details Pane 126
Transaction Overview Pane 127
Navigating Through Transactions 130
Navigating Between Transactions and their Associated Packets 131
Visualizing a Transaction Set (Super Transaction) 133
Viewing NVMe Transactions 135
Viewing Transactions for NVMe Controller Initialization 135
Viewing Admin Command Transactions 136
Viewing NVMe I/O Command Transactions 137
Keysight U4301 PCIe Gen3 Analyzer User’s Guide 13
Page 14

Contents
Viewing a Transaction Performance Chart 139
Viewing a Complete Set of Transactions for a Command Submission and Completion 141
Viewing Decoded Payload for NVMe Commands 142
Viewing Decoded PRPs for NVMe Commands 143
Viewing Decoded MSI-X Table 144
Viewing AHCI Transactions 147
PCIe Configuration Space Registers Transactions - Examples 147
Generic Host Control Registers Transactions - Examples 148
Port Specific Registers Transactions - Examples 149
SATA Commands Transactions - Examples 150
Visualizing a Complete Set of AHCI Transactions 151
Viewing Decoded Payload for AHCI Commands 152
Viewing PRDT Entries for an ATA Command 153
11 Viewing Offline Performance Summary
Offline Performance Summary - Overview 158
Performance Overview Tab 158
The Overlay View - At a Glance 159
Configuring and Computing Offline Performance Summary 161
Before you Start 161
Computing Offline Performance Summary 161
Saving the Computed Performance Summary Data 162
Defining Chart Settings 163
Interpreting the Performance Summary Results 170
Performance Statistics panes 170
Charts pane 172
Flow Control 174
Flow Control- Examples 176
Saving the Favorite Overlay Chart 179
Navigating Through the Performance Summary Results 181
Navigating Through a Chart 181
Navigating Between Performance Statistics and Associated PCIe Data 181
Customizing Charts 186
Changing the Sampling Rate and Re-sampling the Chart 186
Changing the Chart Display 186
Showing/Hiding the Chart Legend 191
Showing/Hiding the Band Chart 191
Viewing the Center of the Chart 193
Zooming In/Out Charts 193
Moving a Performance Series Chart to Front 195
Exporting Performance Summary Charts Data to a .csv or an Excel File 197
14 Keysight U4301 PCIe Gen3 Analyzer User’s Guide
Page 15

12 Glossary
Contents
Index
Keysight U4301 PCIe Gen3 Analyzer User’s Guide 15
Page 16

Contents
16 Keysight U4301 PCIe Gen3 Analyzer User’s Guide
Page 17

Keysight U4301 PCIe Gen3 Analyzer
User’s Guide
1 Hardware and Software In-
stallation
You install the U4301B PCIe Gen3 analyzer in a Keysight AXIe chassis (for example, the M9502A 2
slot chassis). The U4301A PCIe Gen3 analyzer module can be installed in a Keysight Digital Test
Console chassis (for example, the U4002A portable 2-slot chassis) or a Keysight AXIe chassis (for
example, the M9502A 2-slot chassis).
The Keysight chassis is connected to a controller PC via a PCI Express interface and a cable.
The controller PC runs the Keysight Logic and Protocol Analyzer application software which lets you
set up the U4301A/B PCIe Gen3 analyzer, specify triggers and other data capture options, capture
data, and analyze the captured data using the Protocol Viewer window.
See the “Keysight AXIe based Logic Analysis and Protocol Test Modules Installation Guide” for information
on:
• Installing the U4301A/B PCIe Gen3 analyzer module into a Keysight AXIe chassis.
• Connecting the AXIe chassis to a controller PC via the PCIExpress interface.
• Installing the Keysight Logic and Protocol Analyzer software on the controller PC.
Page 18

1 Hardware and Software Installation
18 Keysight U4301 PCIe Gen3 Analyzer User’s Guide
Page 19

Keysight U4301 PCIe Gen3 Analyzer
User’s Guide
2 Probing Options for PCIe
Gen3
The currently available options for probing a PCIe Gen3 device under test (DUT) are:
• U4321A solid slot interposer
• U4322A midbus 3.0 probe
• U4324A PCIe Gen3 Flying Lead probe
• U4328A M.2 (M-key) Interposer
• U4330A U.2 (SFF-8639) Interposer
Details about these probing options (and other PCIe Gen3 tools) can be found in the "PCI Express
Gen3 Hardware and Probing Guide".
This guide is installed with the Logic and Protocol Analyzer software and can also be downloaded
from the Document Library tab of the U4301 module on
www.keysight.com.
Page 20

2 Probing Options for PCIe Gen3
20 Keysight U4301 PCIe Gen3 Analyzer User’s Guide
Page 21

Keysight U4301 PCIe Gen3 Analyzer
NOTE
User’s Guide
3 Specifying the Connection
Setup
Once you have connected the U4301A/B module, probing hardware, and DUT in the required
configuration based on your probing requirements, the next step is to configure the connection setup
for the U4301A/B module in the Keysight Logic and Protocol Analyzer application. You use the
Connection Setup tab of the analyzer's Setup dialog to configure the connection setup.
The connection setup details that you specify in this tab tells the Logic and Protocol Analyzer
software how the U4301A/B module is connected to the DUT in terms such as the probing option
used, the direction of data capture (upstream, downstream, or bidirectional), and the link width
needed. For instance, if you have connected the U4301A/B module hardware to the DUT using the
U4321A Solid Slot Interposer card in a x8 bidirectional setup, then you need to select the U4321 Slot
Interposer Both Dir x8 as the Footprint option, 1 Bidirectional upto x8 as the Link type, and x8 as the Link
Width in the Connection Setup tab to reflect the hardware setup that you have configured.
Probing options
For details on how to set up the hardware and probing connections between the
U4301A/B module and DUT, refer to PCI Express Gen3 Hardware and Probing
Guide.
For details on how to set up the chassis, U4301A/B module, and host PC, refer
to the AXIe based Logic Analysis and Protocol Test Modules Installation Guide.
These guides are installed with the Logic and Protocol Analyzer software and
can also be downloaded from www.keysight.com.
While specifying the connection setup, one of the key requirements is to select the probing option
that you have used with the U4301A/B module to probe the DUT and the data capture direction in
which you have configured the hardware setup.
Broadly, there are the following probing options available with the U4301A/B module:
• U4321A Solid Slot Interposer card
• U4322A Soft Touch Midbus 3.0 probe
• U4324A PCIe Gen3 Flying Lead probe
• U4328A M.2 (M-key) Interposer
• U4330A U.2 (SFF-8639) Interposer
• PCIe Gen2 probes with the U4317A adapter. This adapter is used for conversion between the PCIe
Gen2 probes and U4301A/B PCIe Gen3 Analyzer module. The PCIe Gen2 probes supported are:
• N5315A Solid Slot Interposer for PCIe Gen2
• N4241A straight, N4242A swizzled, and N4243A split cable Soft Touch Midbus 2.0 probe for
PCIe Gen2
• N5328A Half Size Midbus probe
• N4241F/Z Flying Lead probe for PCIe Gen2
Page 22

3 Specifying the Connection Setup
For each of the above probing types, different options are available in the Connection Setup tab
reflecting the data direction (upstream, downstream, or bidirectional). Upstream is the data direction
towards the root complex. Downstream is the data direction away from the root complex. Based on
your probing setup and the data capture direction in which you have configured the hardware setup,
you need to select an appropriate probing option in the Connection Setup tab.
U4321A Solid Slot Interposer Card
When used with a U4321A solid slot interposer card, one U4301A/B module can probe in the
upstream (x1-x16), downstream (x1-x16), or bidirectional (x1-x8) way.
If you need to probe in both upstream as well downstream directions with a x16 link width, you need
two U4301A/B Analyzer modules and a U4321A SSI card. To reflect such a hardware setup in the
Connection Setup tab of the Logic Analyzer application, you need to select U4321A Slot Interposer
Upstream as the probing option for one of the U4301A/B modules and U4321A Slot Interposer
Downstream as the probing option for the other U4301A/B module.
if you have connected the U4301A/B module hardware to the DUT using the U4321A Solid Slot
Interposer card in a x8 bidirectional setup, then you need to select the U4321 Slot Interposer Both
Dir x8 as the probing option.
U4322A Soft Touch Midbus 3.0 probe
The U4322A midbus 3.0 probes require footprints to be designed into the device under test. Each
probe requires its own footprint, and there are basically two variations:
• Bidirectional — where half the footprint pins are for the upstream data and the other half are for
the downstream data.
• Unidirectional — where all the pins on the footprint are for the data going in the same direction.
Reversed refers to optional lane reversal which is supported for upstream ports.
Based on how you have designed the footprint for the probe, you need to select an appropriate
probing option in the Connection Setup tab. For instance, if you have configured a x4 bidirectional
setup using a U4322A midbus probe, then you need to select U4322A Bidirectional Full as the
Footprint, 1 Bidirectional upto x8 as the Link type, and x4 as the Link Width in the Connection Setup
tab.
U4324A PCIe Gen 3 Flying Lead probe
When used with a U4324A Flying Lead probe, one U4301A/B module can probe in the upstream
(x1-x16), downstream (x1-x16), or bidirectional (x1-x8) way. For x1-x8 bidirectional link type, you can
use the U4324A Flying Lead probes in a straight or a swizzled configuration.
If you need to probe in both upstream as well downstream directions with a x16 link width, you need
two U4301A/B Analyzer modules and eight U4324A Flying Lead probes. To reflect such a hardware
setup in the Connection Setup tab of the Logic Analyzer application, you need to select the U4324A
Flying Lead Probe as the probing option and Unidirectional as the link type for both the U4301A/B
modules.
If you have connected the U4324A Flying Lead probes in a x1 to x8 bidirectional straight setup, then
you need to select the U4324A Flying Lead Probe as the probing option and Bidirectional as the link
type.
If you have set up a swizzled x1 to x8 bidirectional configuration using the U4324A Flying Lead
probes, then you need to select the U4324A Flying Lead Probe Bi Swizzled as the probing option and
Bidirectional as the link type.
22 Keysight U4301 PCIe Gen3 Analyzer User’s Guide
Page 23
U4328A M.2 (M-key) Interposer
When used with a U4328A M.2 (M-key) Interposer, one U4301A/B module can probe a x1, x2, or x4
bidirectional PCIe link configuration (as per the M.2 specifications).
To reflect such a probing hardware setup in the Connection Setup tab of the Logic and Protocol
Analyzer application, you need to select the U4328A M.2 (M-key) Interposer as the probing option
and Bidirectional as the link type for the U4301A/B module. The link width can be selected as x1, x2,
or x4.
U4330A U.2 (SFF-8639) Interposer
When used with a U4330A U.2 Interposer, one U4301A/B module can probe a Single Port
Configuration that is, a single x1, x2, or x4 unidirectional or bidirectional PCIe link (as per the U.2
SFF-8639 interconnection standard).
To reflect such a probing hardware setup in the Connection Setup tab of the Logic and Protocol
Analyzer application, you need to select the U4330A U.2 SFF-8639 Interposer as the probing option.
The link width can be selected as x1, x2, or x4.
To specify the connection setup
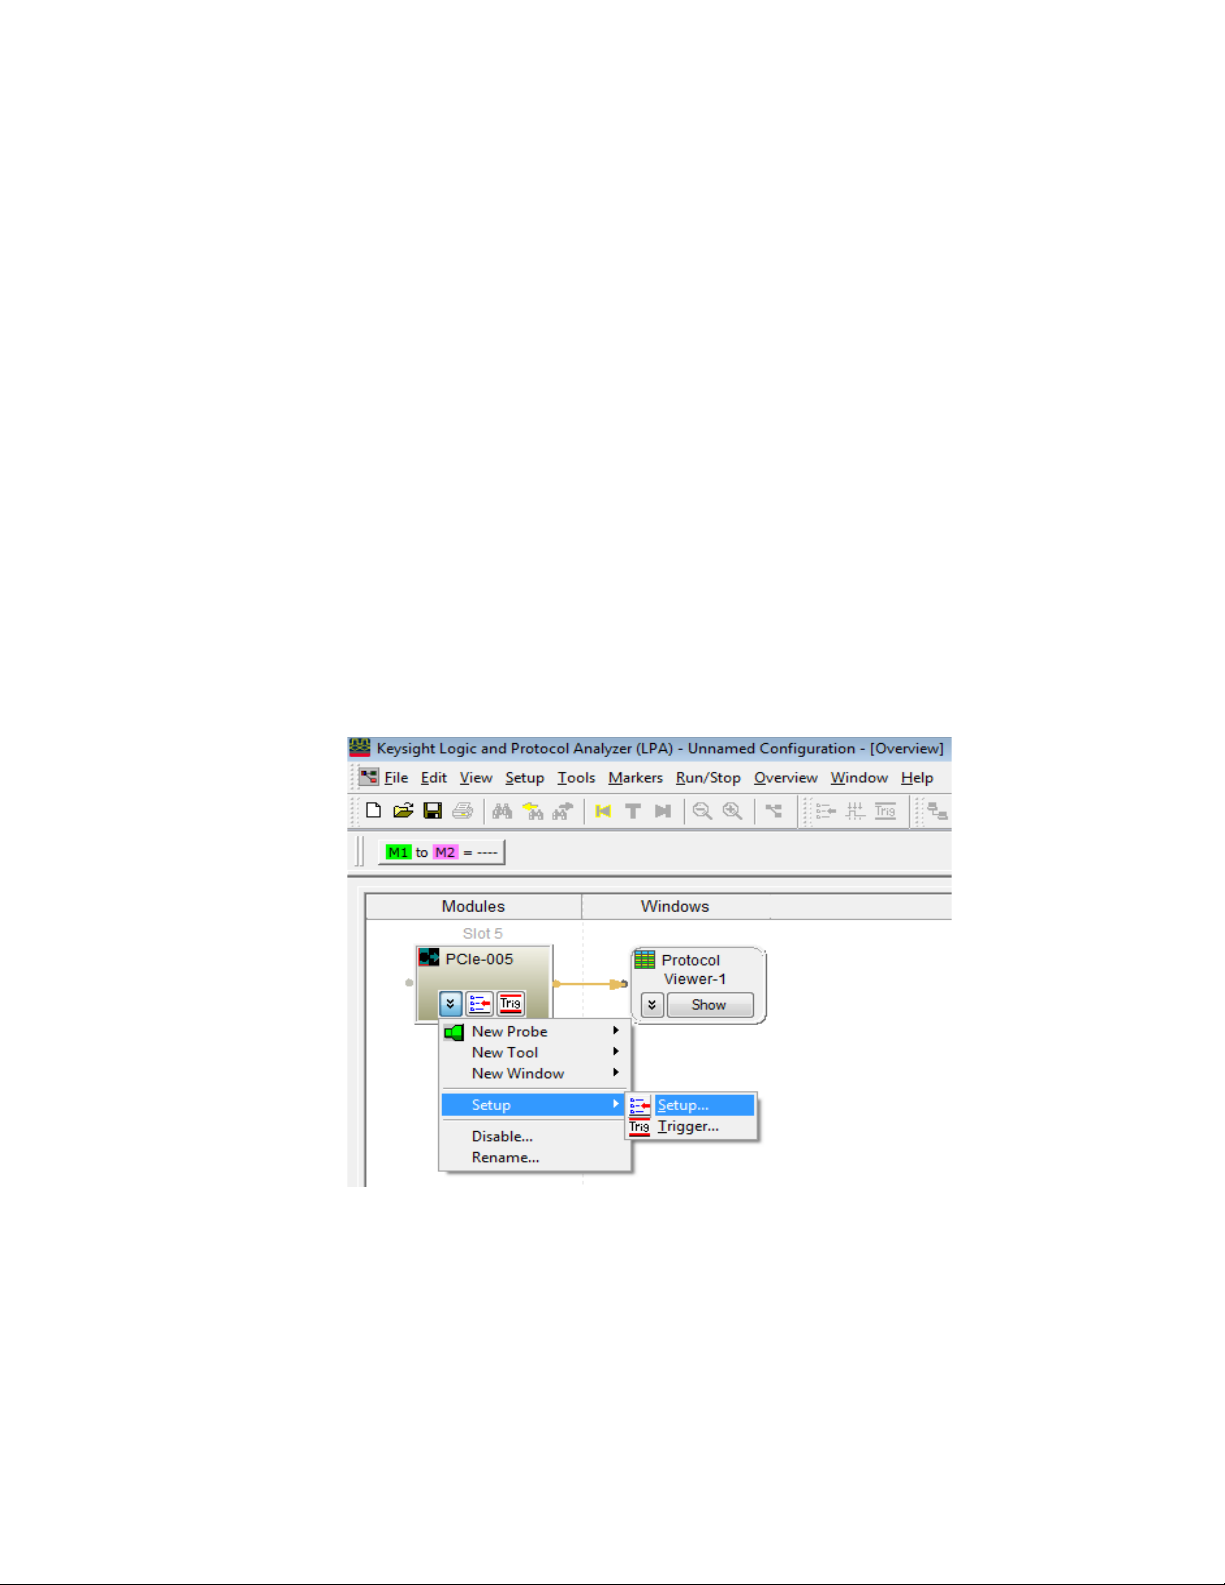
1In the Keysight Logic and Protocol Analyzer application's Overview window, from the PCIe
analyzer module's drop-down menu, select Setup>Setup....
Specifying the Connection Setup 3
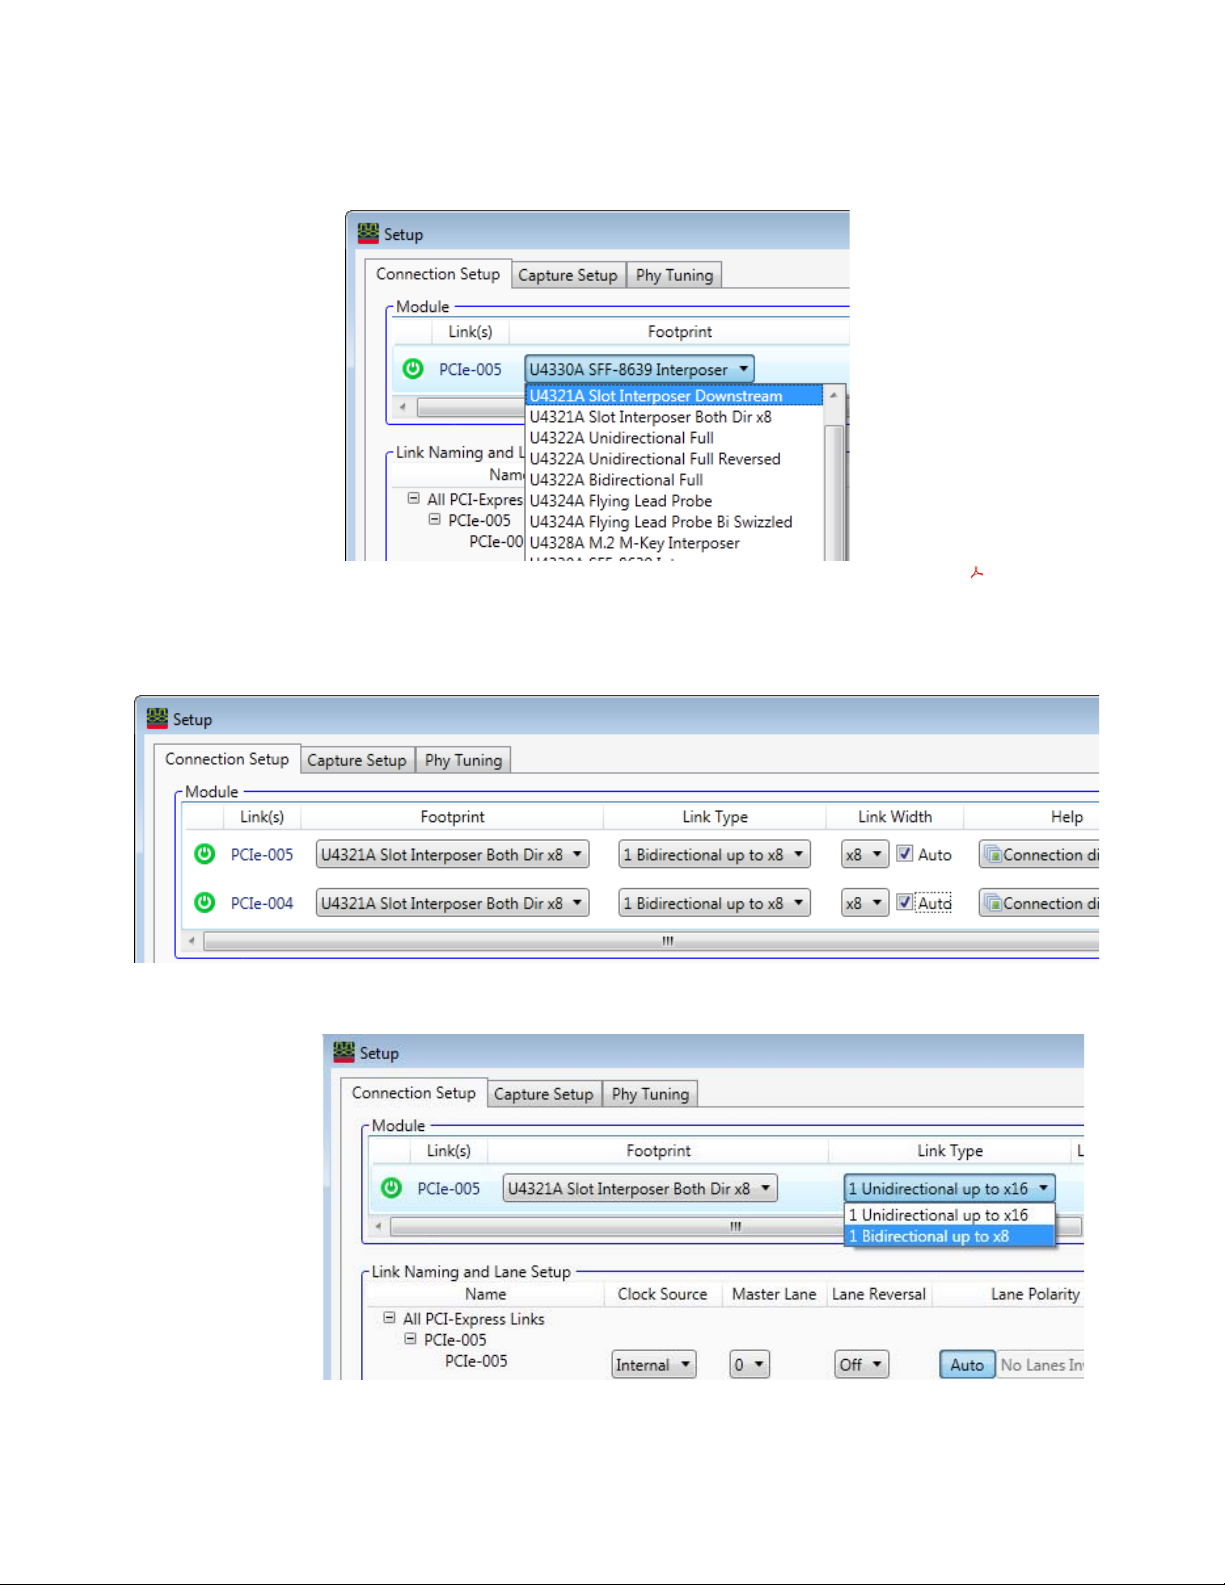
2From the Footprint Listbox, select the type of probing that you have set up between the U4301A/B
Analyzer module and DUT. For each of the supported four probing types, different probing
options are available in the Footprints listbox based on the data direction (upstream,
downstream, or bidirectional). Based on your probing setup and the link type needed, select an
appropriate probing option from the Footprint listbox. Refer to the “Probing options" on page 21
to know more about these options.
Keysight U4301 PCIe Gen3 Analyzer User’s Guide 23
Page 24
3 Specifying the Connection Setup
For more information on probing setups, click Connection diagram... or refer to the "PCI Express
Gen3 Hardware and Probing Guide".
If you have installed multiple U4301A/B modules in the chassis, all these modules are listed in
the Module section of the tab. You need to select the probing option individually for these
modules.
3 Specify the link type.
24 Keysight U4301 PCIe Gen3 Analyzer User’s Guide
Page 25
Specifying the Connection Setup 3
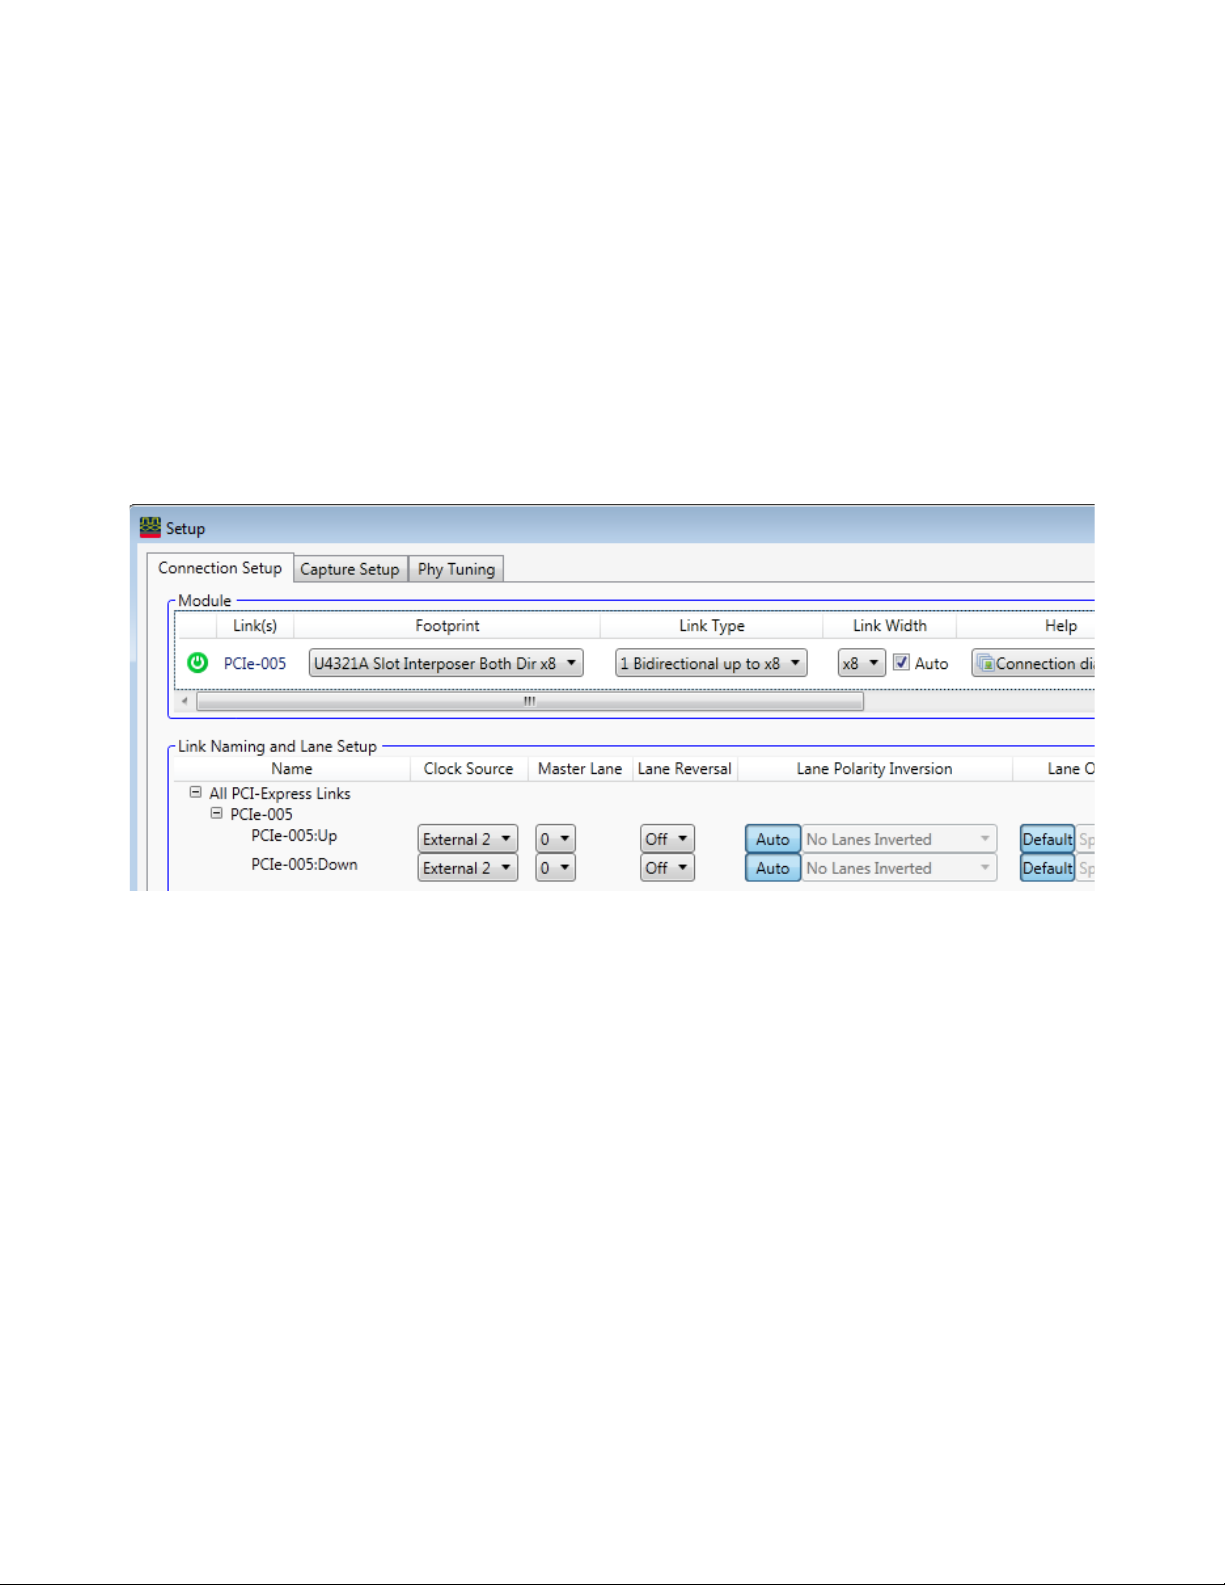
The Link Type refers to the type of link that you want to create between the U4301A/B module and
DUT. You can select the 1 Unidirectional up to x16 link type if you want the U4301A/B module to
probe and capture data in only one direction (upstream or downstream). In the Unidirectional link
type, the U4301A/B module can support a unidirectional link with upto 16 channels in the same
direction. You can select the 1 Bidirectional up to x8 link type if you want the same U4301A/B
module to probe and capture data in both directions (upstream as well as downstream). In the
bidirectional link type, the U4301A/B module can support one bidirectional link with upto eight
channels for each direction. When you select the bidirectional link type, two sub-links are created
for the two directions. You can set the link attributes such as clock source, master lane, and lane
ordering separately for these two sub-links. These attributes are available in the Link Naming and
Lane Setup section.
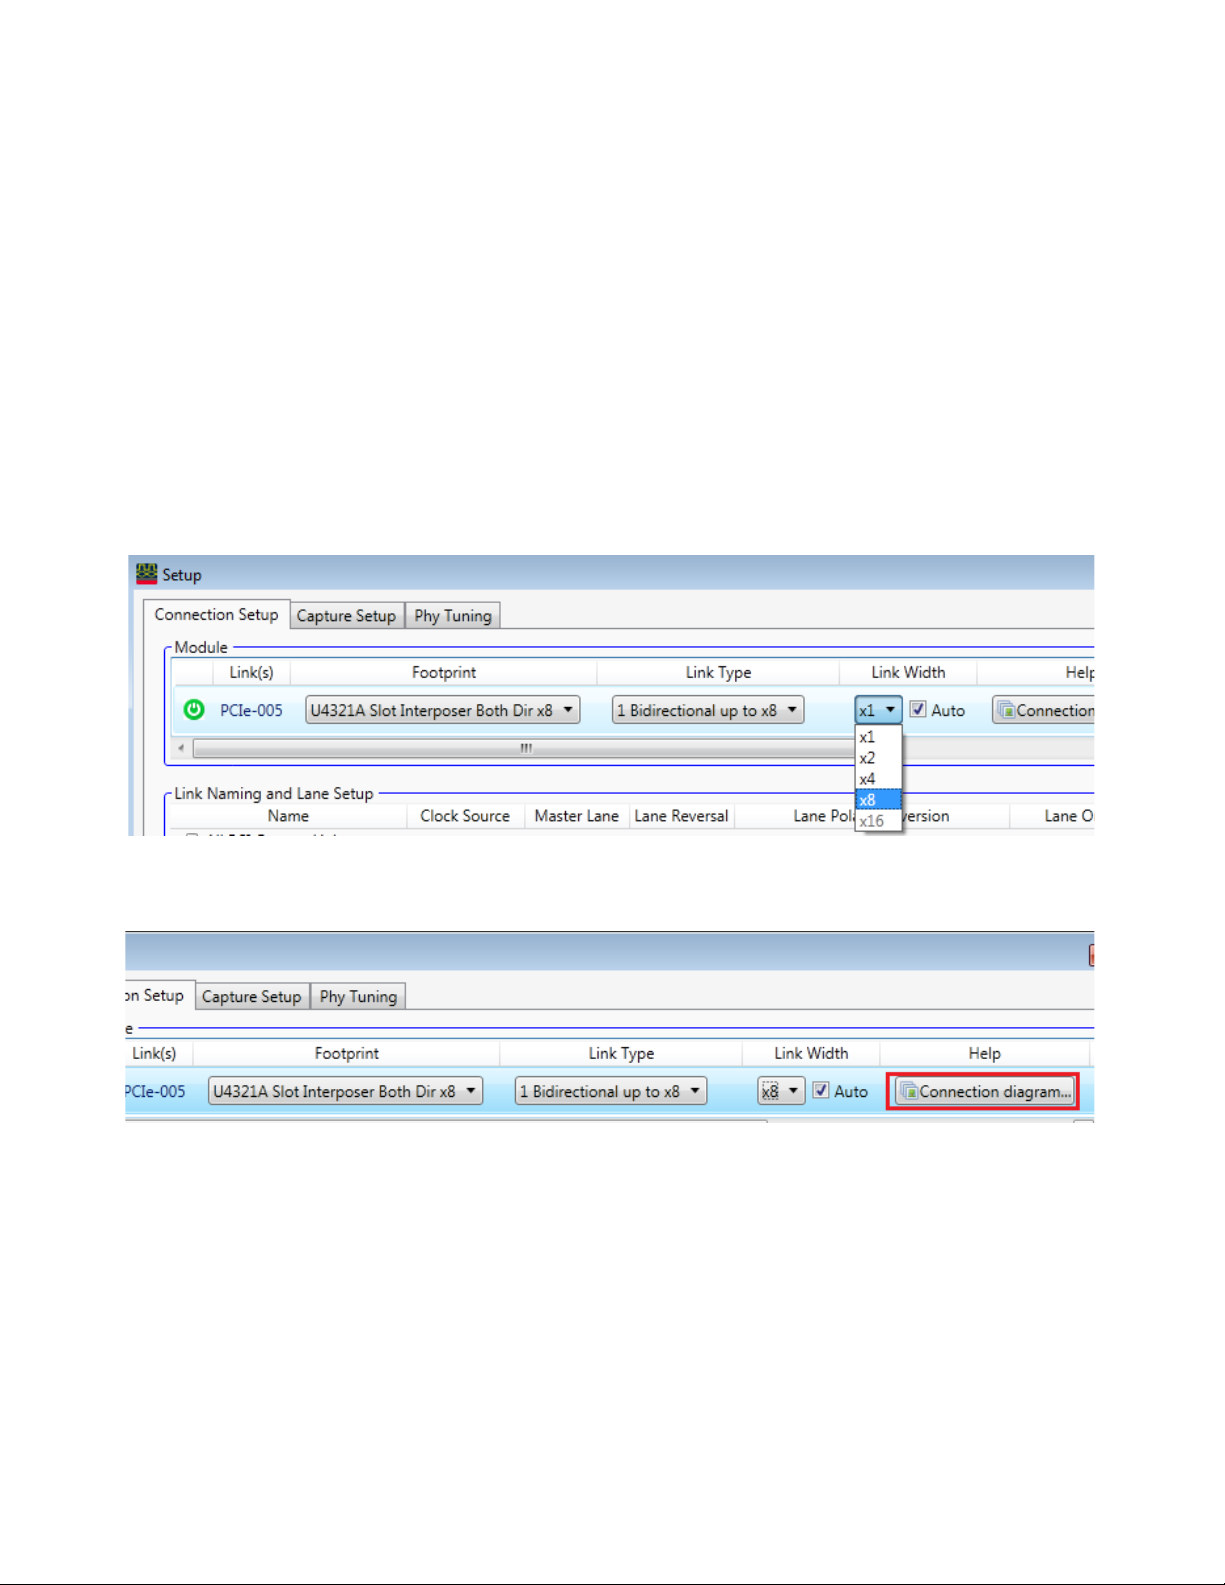
The following screen displays the sub-links of a x8 bidirectional link. These sub-links have been
renamed on the basis of the direction these represent.
If you have installed multiple U4301A/B modules in the chassis, all these modules are listed in
the Module section of the tab. You need to select the link type individually for these modules.
4 Select the link width.
By default, the link width is set to the maximum link width available to the U4301 module at
which it can capture data. This maximum link width available is based on the module’s license
options installed and the link type (Unidirectional/Bidirectional) that you selected. If you select
the Link Type as 1 Bidirectional upto x8, then you can select the Link Width from x1 to x8. The
x16 option is disabled in this case because a U4301 module can probe and capture data in both
directions with upto eight channels in each direction.
You can set the link width for the U4301 module in either of the following two ways:
a Set the link width manually using the Link Width listbox and make sure that you match the set
link width with the negotiated link width of the transmitter and receiver. Otherwise, the data
capture will not happen. For instance, if the negotiated link is at x8, then the module’s link
width should be set to x8, otherwise the capture will not happen.
b Retain the maximum link width set by default in the Link Width field and make sure that the
Auto checkbox displayed with the Link Width field is selected. By doing so, you enable the auto
link width detection feature. As a result, the U4301 module automatically detects link width
during initial link up as well as link width changes during up/down configurations and
accordingly sets its link width based on these changes as seen in the captured data. This
allows data capture as per the changing link width.
Keysight U4301 PCIe Gen3 Analyzer User’s Guide 25
Page 26
3 Specifying the Connection Setup
NOTE:
• If, however, you do not retain the maximum link width set by default and set the Auto
option, then the automatic link width detection is only within the limits of the set link
width. For instance, if you set the link width to x4 and set the Auto option, then the link
width detection and changes will be for x1, x2, and x4 only.
• If you do not select the Auto option, the link width of the U4301 module is fixed to the
value you set in the Link Width field. As a result, the data is captured only if the link width
in the captured data matches the set link width. For instance, If link width is set to x16,
and data is to be captured for x8, then capture will not happen.
• The Auto checkbox is selected by default. Using this checkbox, you can choose to
enable/disable the auto link width detection feature individually for each U4301 module.
• The Auto setting is not impacted by whether or not the link is going in/out of L0s or L1 or
when there is a change in the link speed.
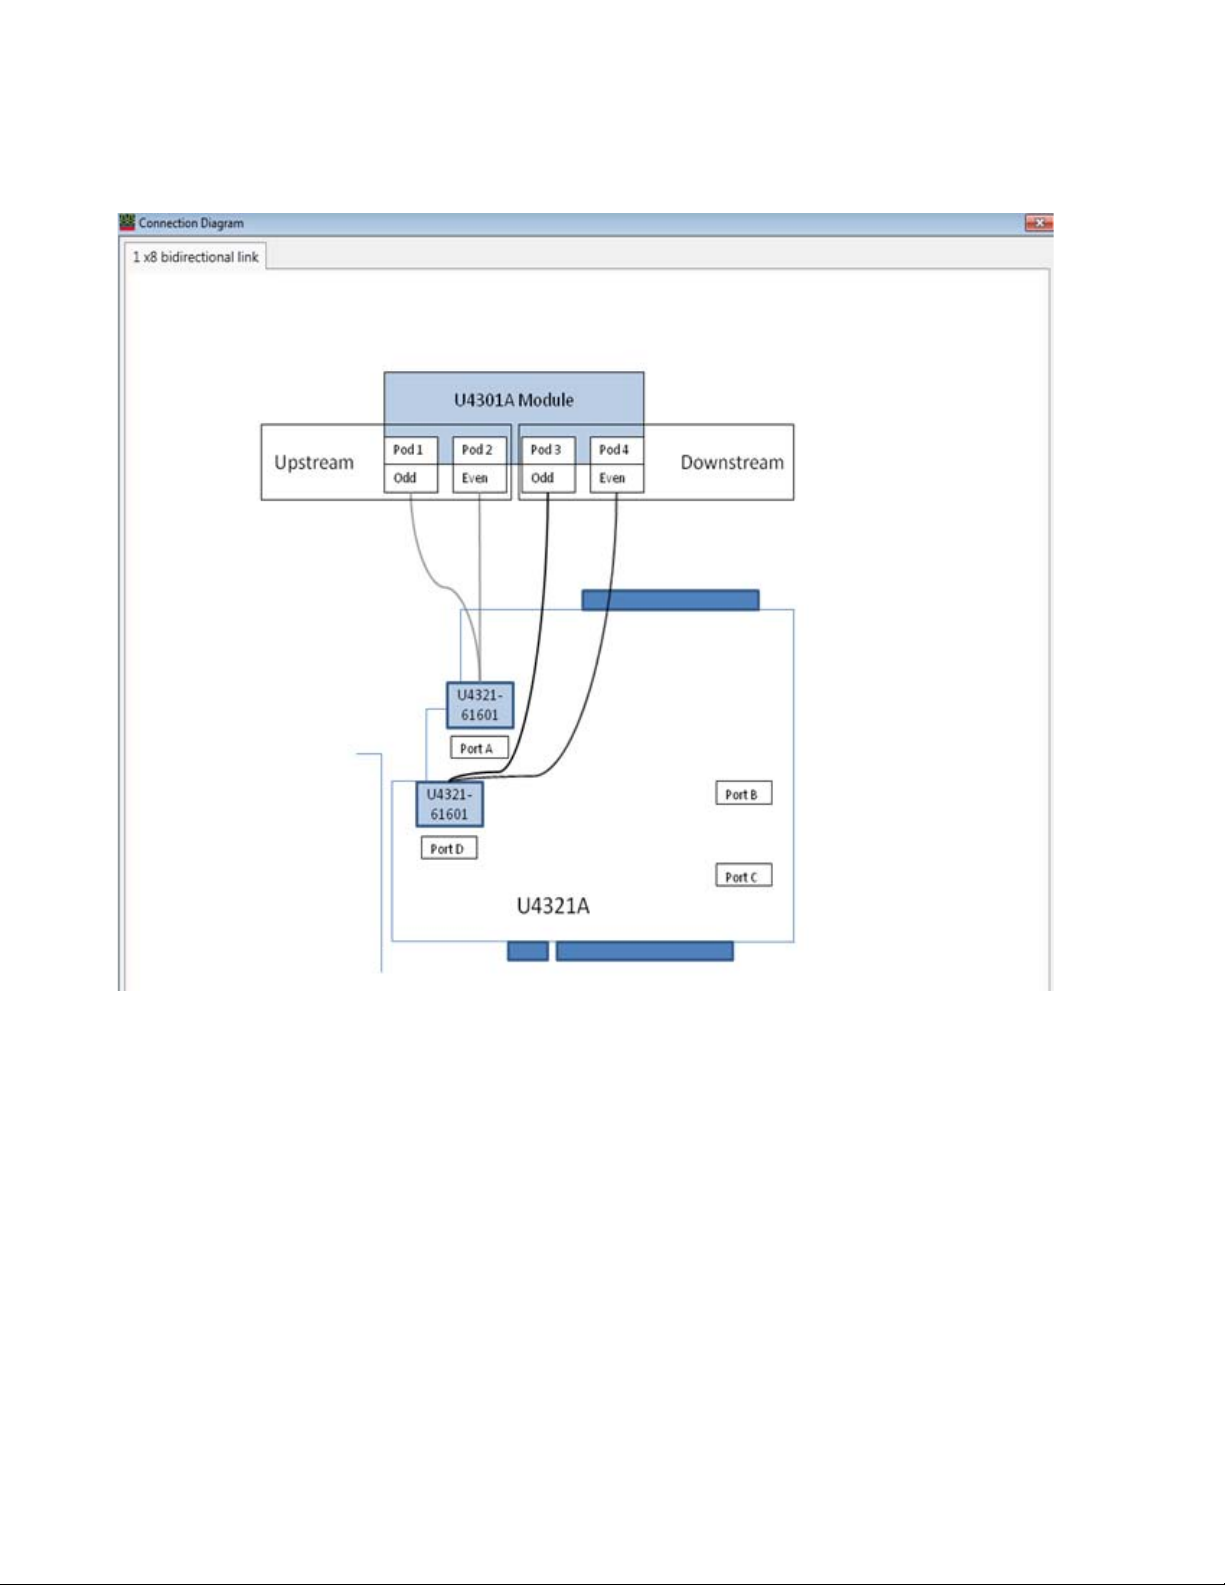
5 Verify the connection:
a Click Connection diagram....
b Use the Connection Diagram dialog to verify that your connection setup specification matches
the actual device under test connection.
26 Keysight U4301 PCIe Gen3 Analyzer User’s Guide
Page 27
Specifying the Connection Setup 3
c Close the Connection Diagram dialog.
6 Select the clock source:
Keysight U4301 PCIe Gen3 Analyzer User’s Guide 27
Page 28
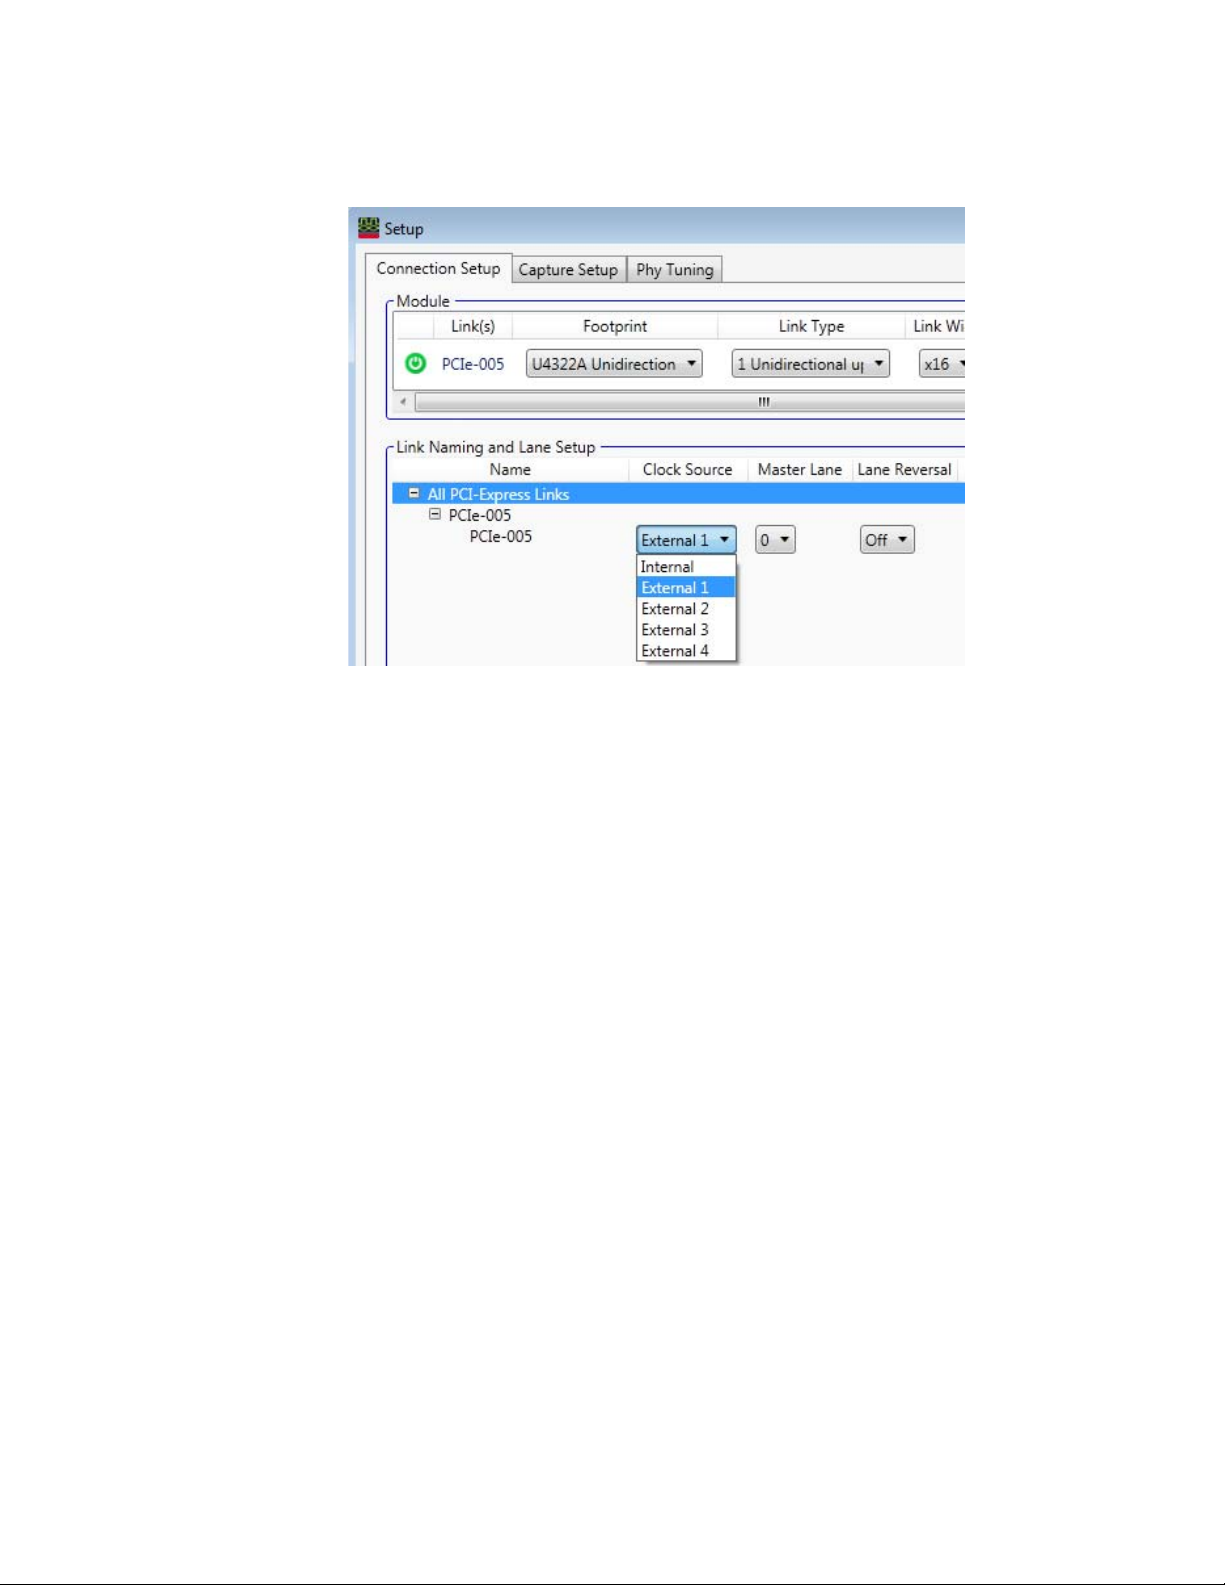
3 Specifying the Connection Setup
• Internal — selects an internal clock source. You should select Internal if the data rate is in the
range of 2.5 Gbps or 5 Gbps +/-50 ppm. Note that there is no input clock in this mode.
• External 1/2/3/4 — selects an external clock source. You should select External if the device
under test uses SSC or the data rate is in the range of 2.5 Gbps +/-300 ppm (+0% / -0.5% if
using SSC). The clock rate for external mode should be between 100 MHz +/-300 ppm (+0% /
-0.5% if using SSC).
Some important points about external reference clock selection
If you plan to use an external clock source, then you must ensure that the reference clock from
the DUT is available when you:
• select External as the Clock Source in the Setup dialog and apply the selection by clicking
Apply or OK.
• or load a configuration file that specifies the use of the external clock source.
If the reference clock from the DUT is not available to Analyzer when you apply the external
clock source selection, the Analyzer’s internal PLL may not be able to attain the initial lock with
the DUT’s reference clock resulting in an erratic behavior. Just making the DUT’s reference
clock available at this point does not establish the lock with the reference clock. In such a
situation, you can re-establish the lock with the DUT’s reference clock by performing the
following steps:
i Ensure that the reference clock of the DUT is available.
ii Then select Internal as the Clock Source in the Setup dialog and click Apply.
iii Finally, select External as the Clock Source in the Setup dialog and click Apply.
Once the initial lock is established, it is maintained. You need not re-establish the lock with the
reference clock on subsequent availability/unavailability of the reference clock in the event of
DUT power off/on or on any further changes to the Setup dialog except for Clock Source or Link
Typ e.
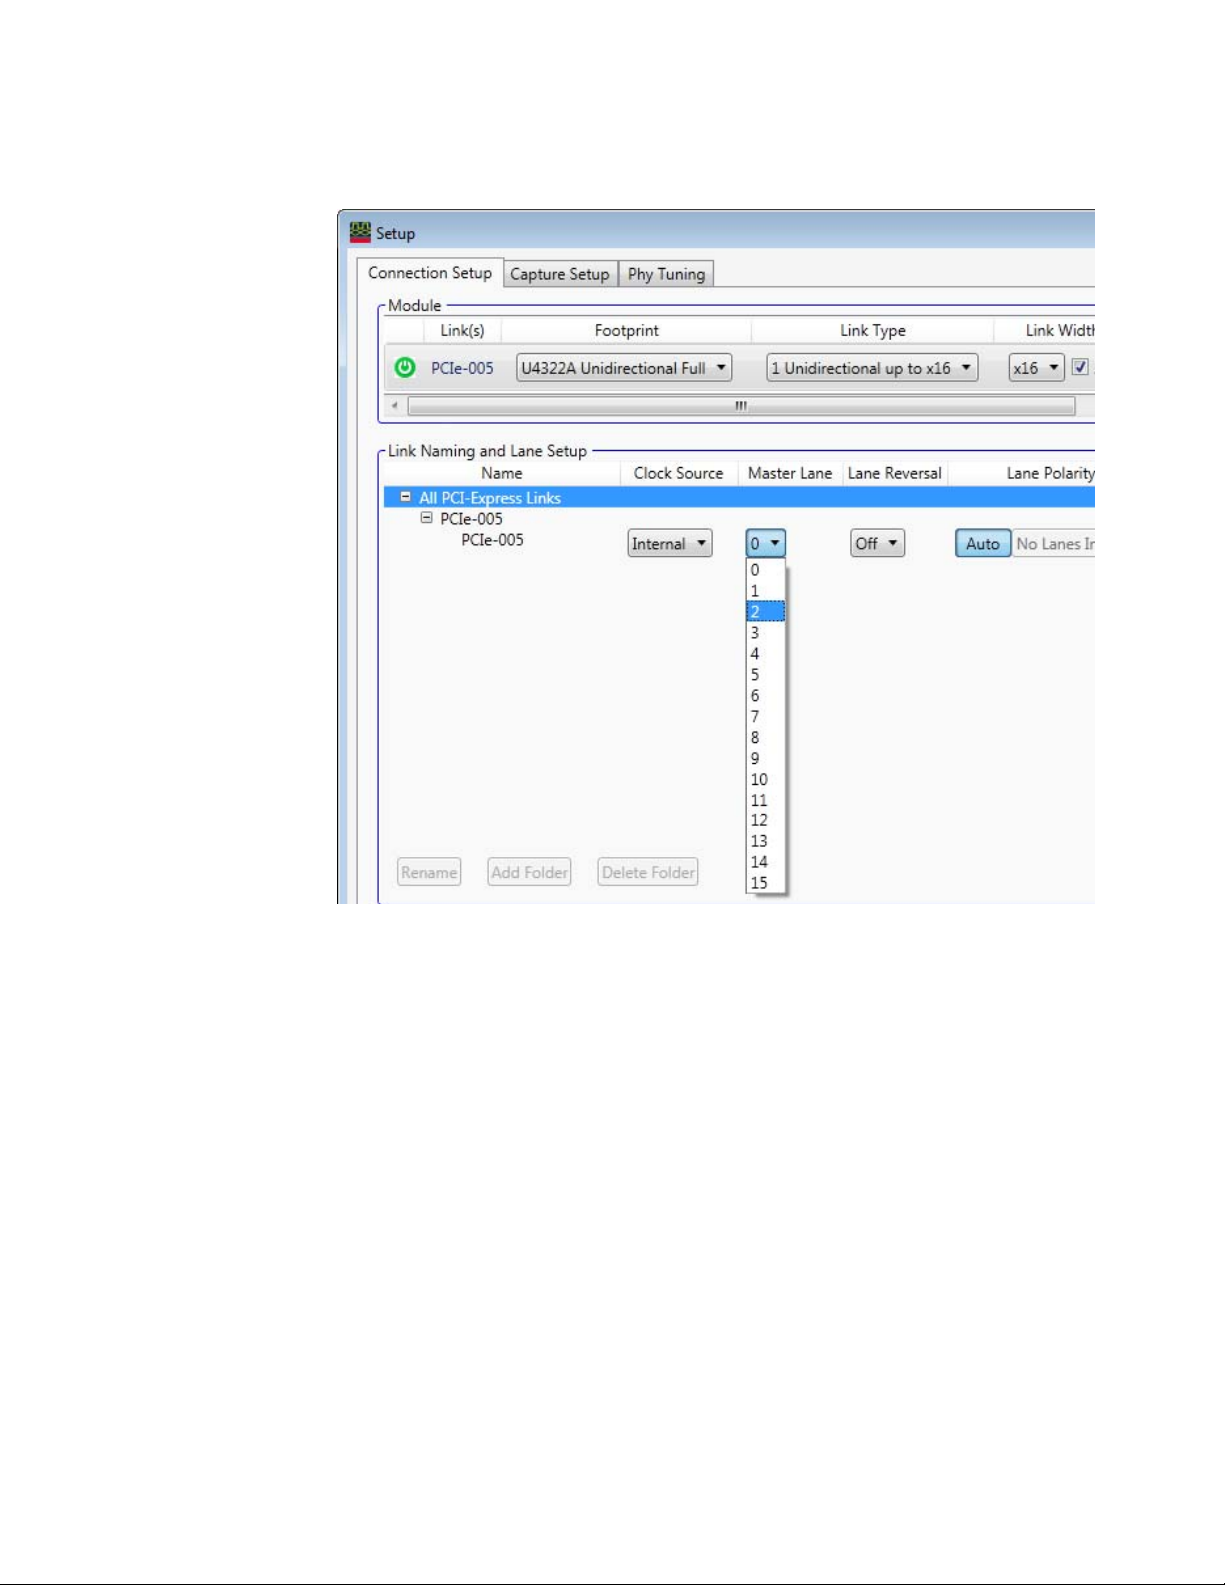
7 Select the master lane. You can select any lane as the master lane from the lanes displayed in the
Master Lane listbox. The lanes are displayed as per the selected link width. The lane that you
select as the master lane is considered the lane for capturing the ordered sets.
28 Keysight U4301 PCIe Gen3 Analyzer User’s Guide
Page 29
Specifying the Connection Setup 3
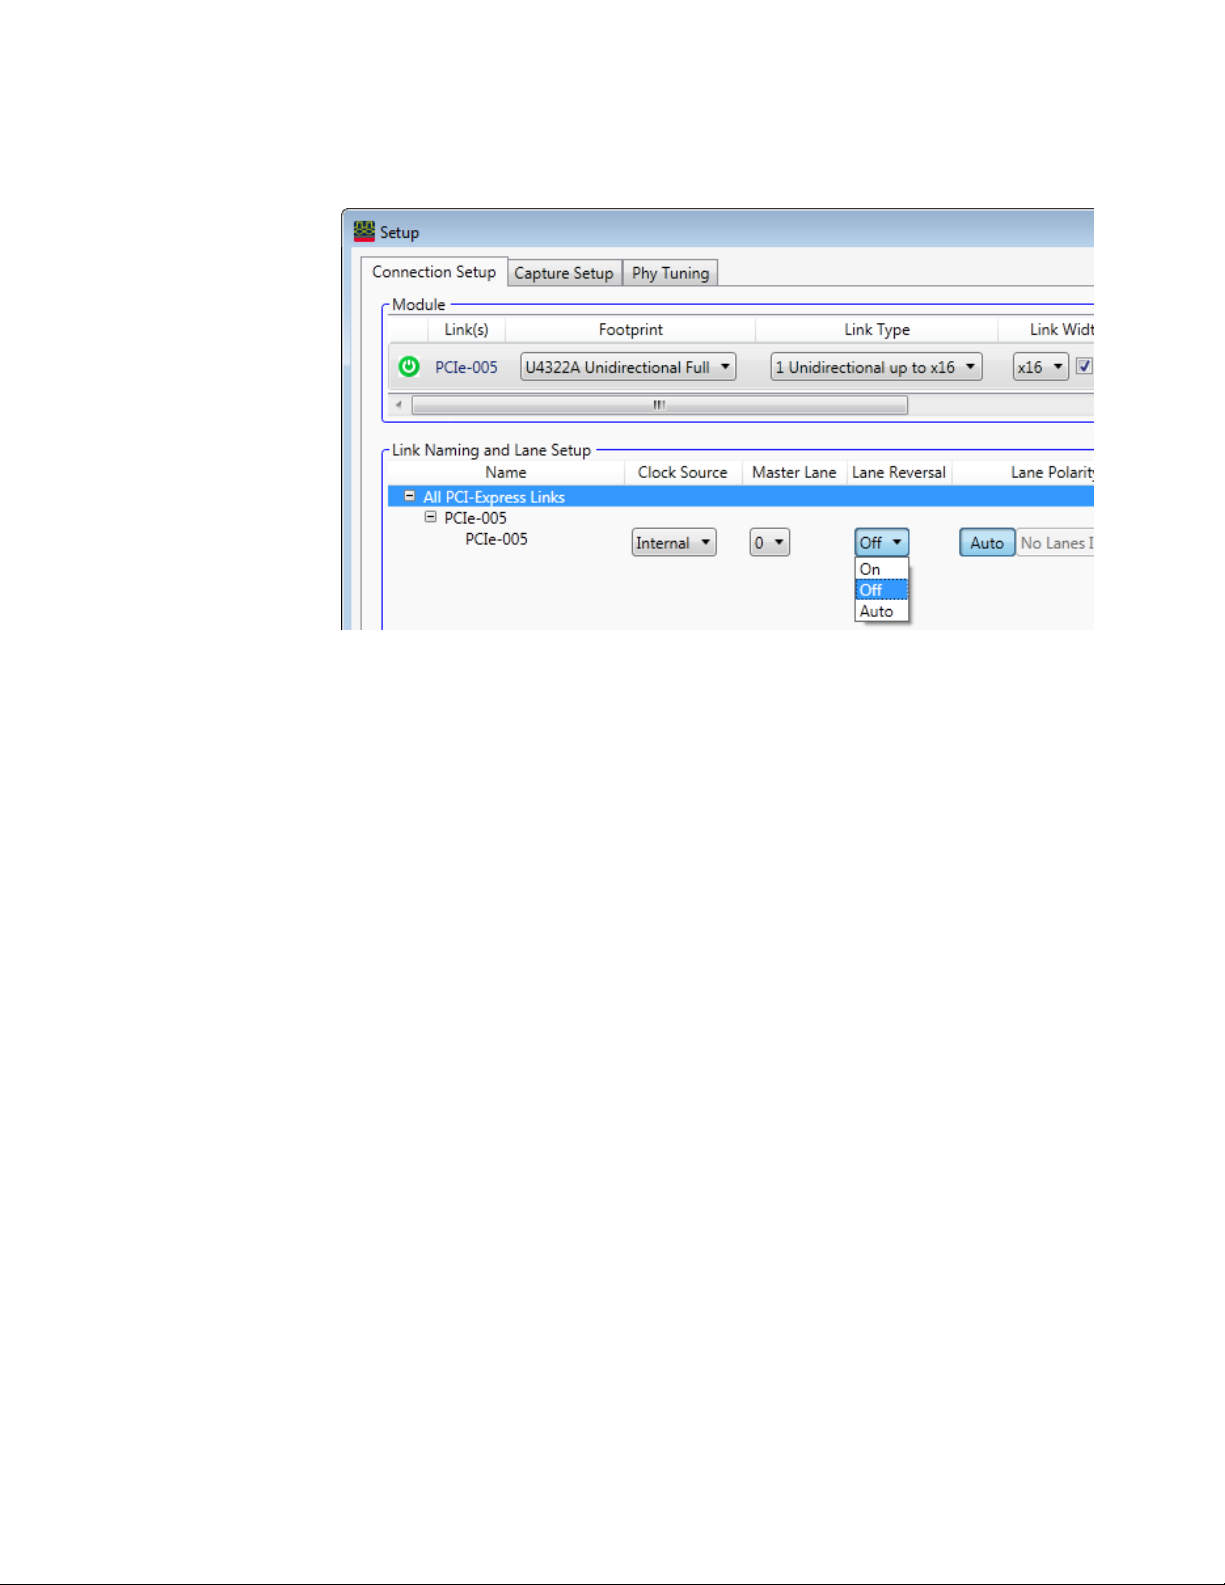
8 Specify whether lane reversal is on or off for the U4301 module.
•The On option sets the lane reversal feature to On for the U4301 module and configures the
module to perform lane reversal. This option requires that the lane reversal should be On for
the monitored link as well otherwise the data capture will not happen on encountering a
mismatch in the lane reversal On/Off value at the DUT and Analyzer ends.
•The Off option sets the lane reversal feature to Off for the U4301 module and configures the
module NOT to perform lane reversal. This option requires that the lane reversal should be Off
on the monitored link as well otherwise the data capture will not happen on encountering a
mismatch in the lane reversal On/Off value at the DUT and Analyzer ends.
•The Auto option configures the U4301 module to automatically detect lane reversal based on
the TS ordered sets that it sees during the LTSSM training of the monitored link. When this
option is selected, the module automatically switches its lane reversal feature to On or Off to
match the lane reversal On/Off that it detects on the monitored link.
Note:
• Automatic Lane reversal detection is not impacted if you have filtered packets such as TS
ordered sets.
• If you want to set the Lane Reversal to Auto, then you must ensure that the Capture Link
Speed is set to Auto in the Capture Setup tab.
• For the automatic lane reversal to work, make sure that the monitored link is Up after the
U4301 module is up and running so that the module can detect lane reversal for the
monitored link.
Keysight U4301 PCIe Gen3 Analyzer User’s Guide 29
Page 30
3 Specifying the Connection Setup
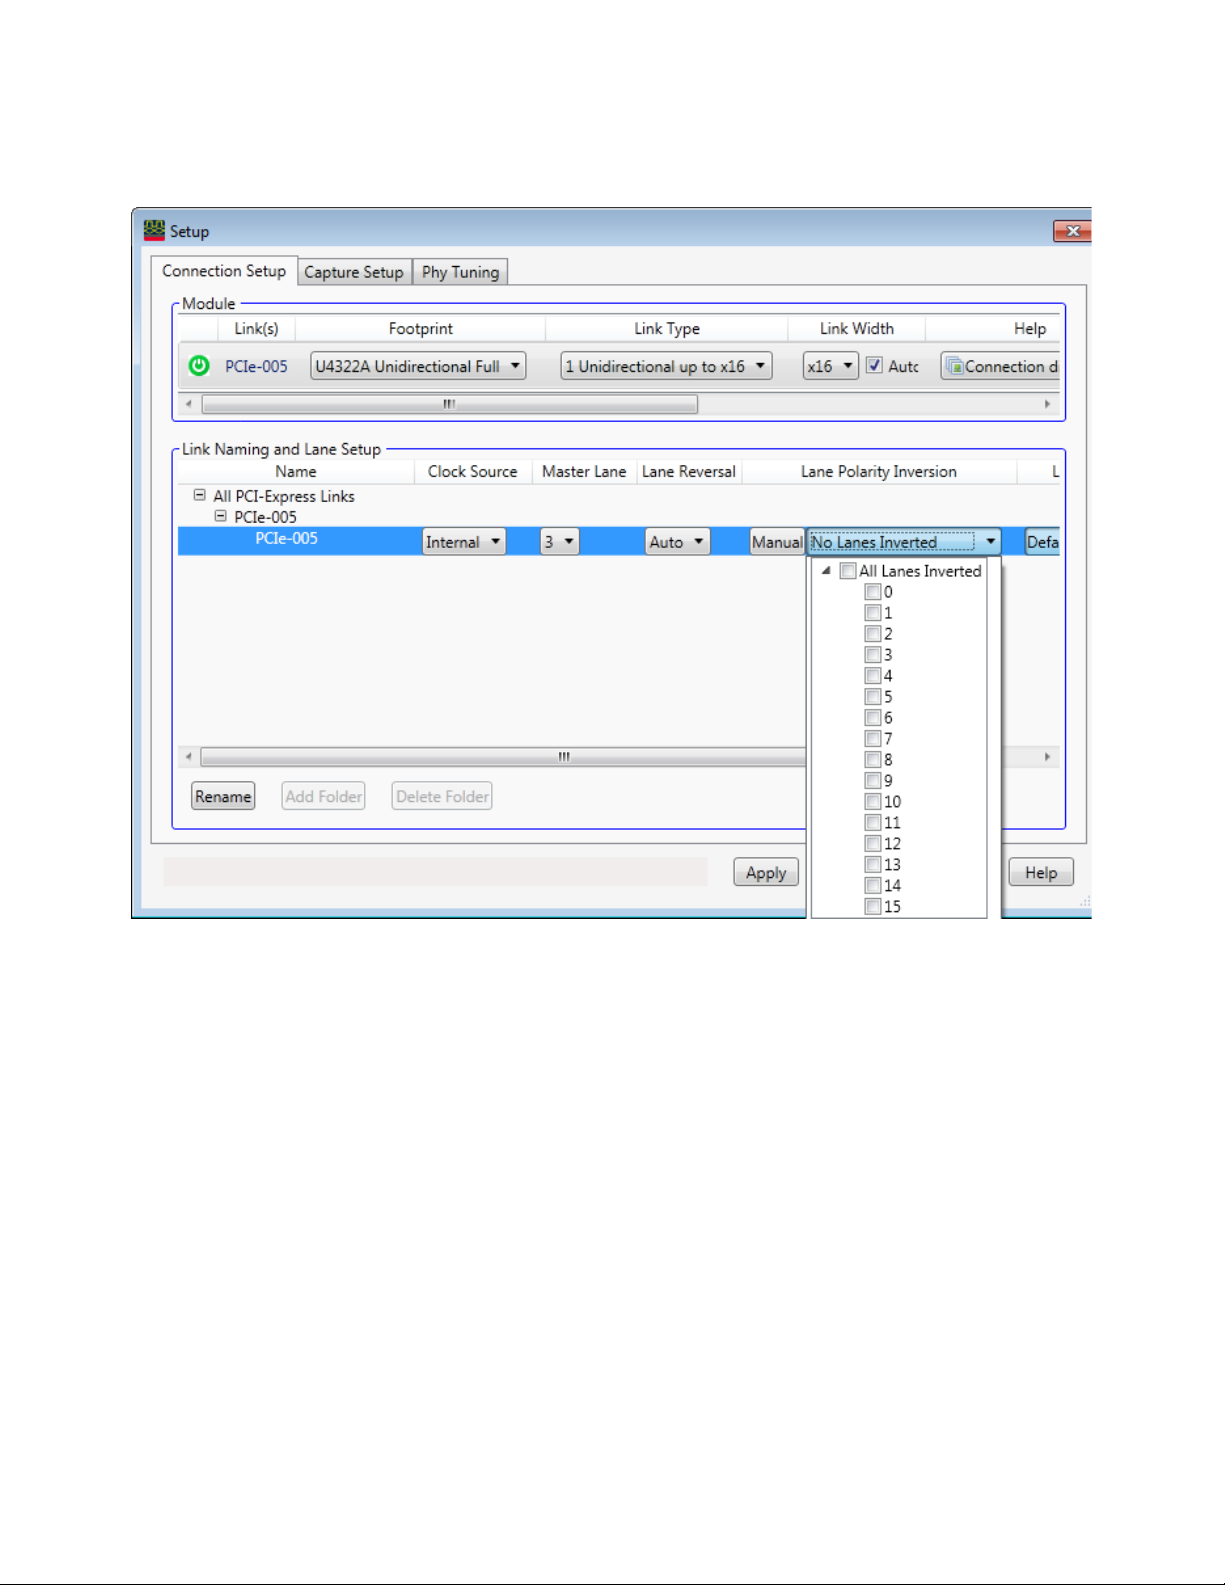
9 Specify any lane polarity inversion:
a Click Auto or Manual to toggle between the types of polarity inversion specification.
When Auto is selected, the polarity of the lanes is set automatically during the initial link
training.
b When manual selection is chosen, select the lanes that are inverted.
30 Keysight U4301 PCIe Gen3 Analyzer User’s Guide
Page 31
Specifying the Connection Setup 3
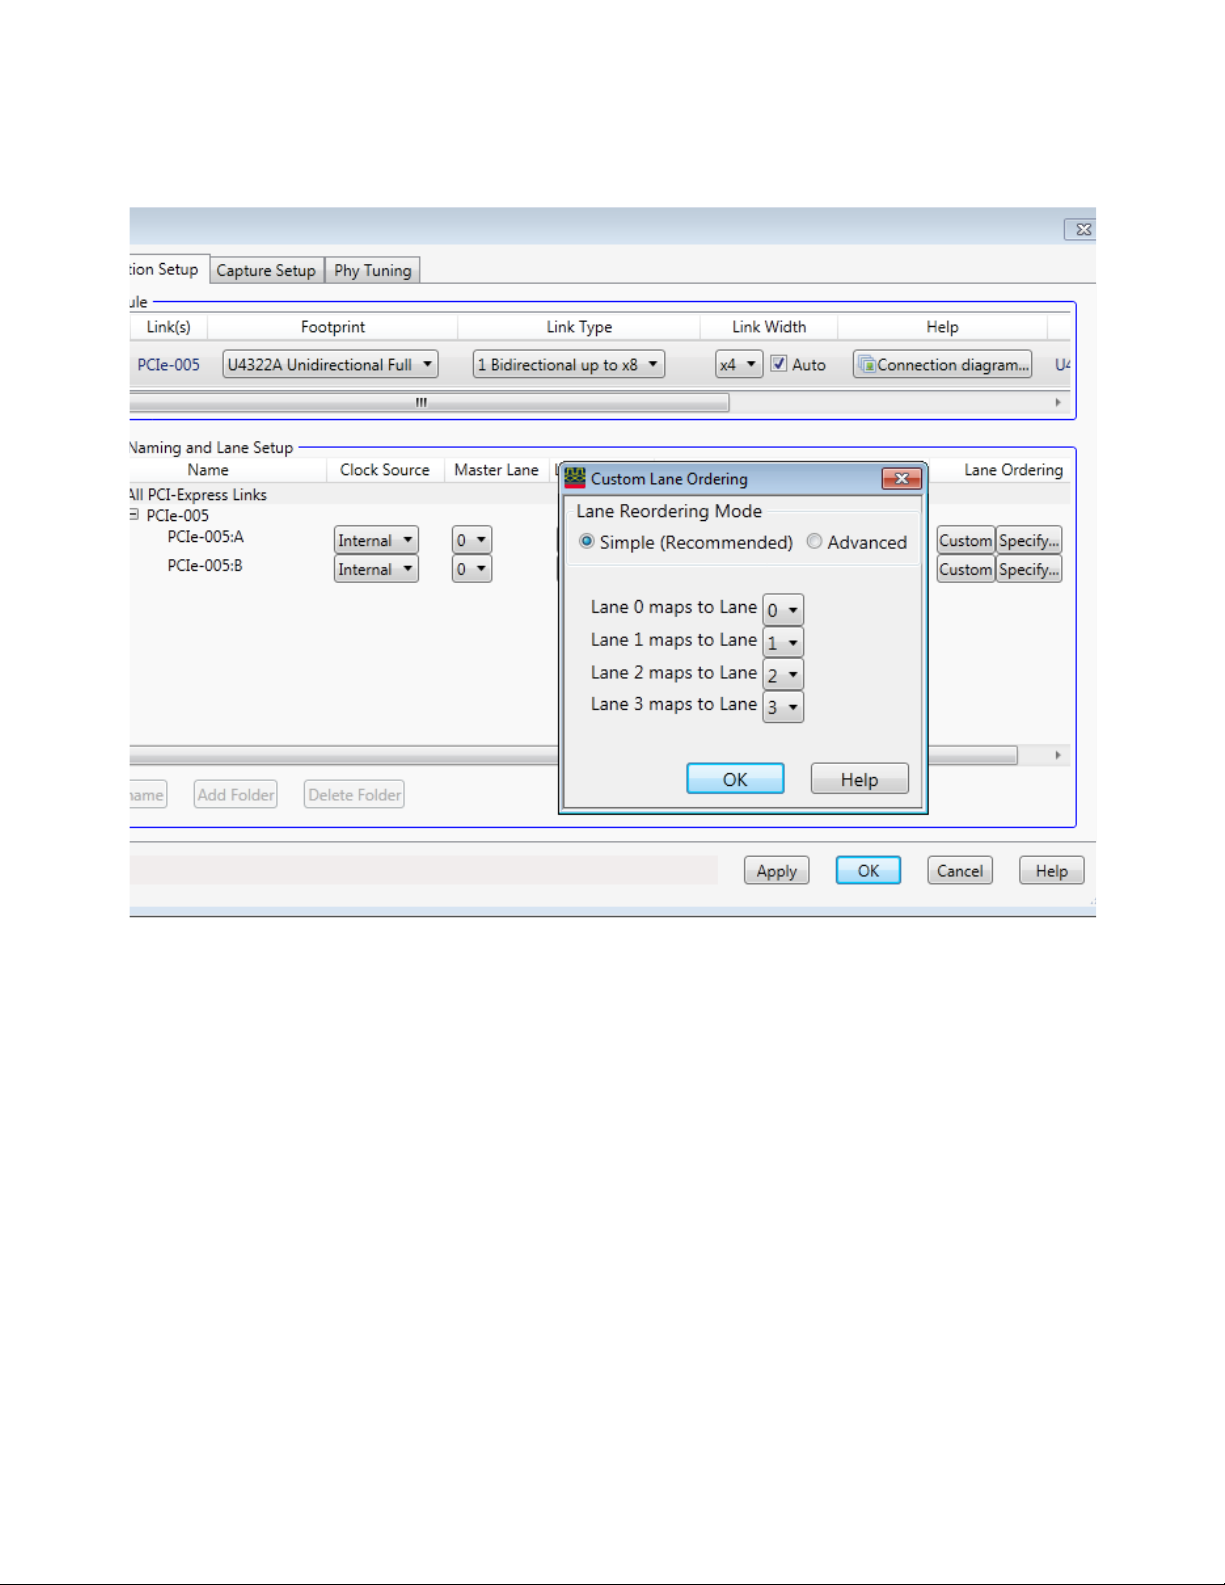
10 The Lane Ordering option lets you perform the ordering of the physical lanes of the link with the
logical lanes. You can either retain the Default lane ordering which means Lane 0 of the link maps
to logical Lane 0 and so on. If you want to map Lane 0 of the link to some other Lane, then select
Custom option from Lane Ordering and click Specify to display the Custom Lane Ordering dialog
box. In this dialog box, select the lane with which you want to map Lane 0. The number of lanes
displayed for lane ordering depend on the selected link width. For example, if the link width is
selected as x4, then the Lane 0, 1, 2, and 3 are available for lane ordering.
Keysight U4301 PCIe Gen3 Analyzer User’s Guide 31
Page 32
3 Specifying the Connection Setup
32 Keysight U4301 PCIe Gen3 Analyzer User’s Guide
Page 33
Keysight U4301 PCIe Gen3 Analyzer
User’s Guide
4 Setting the Capture Options
The Capture Setup tab in the PCIe Gen3 analyzer's Setup dialog lets you set basic capture options.
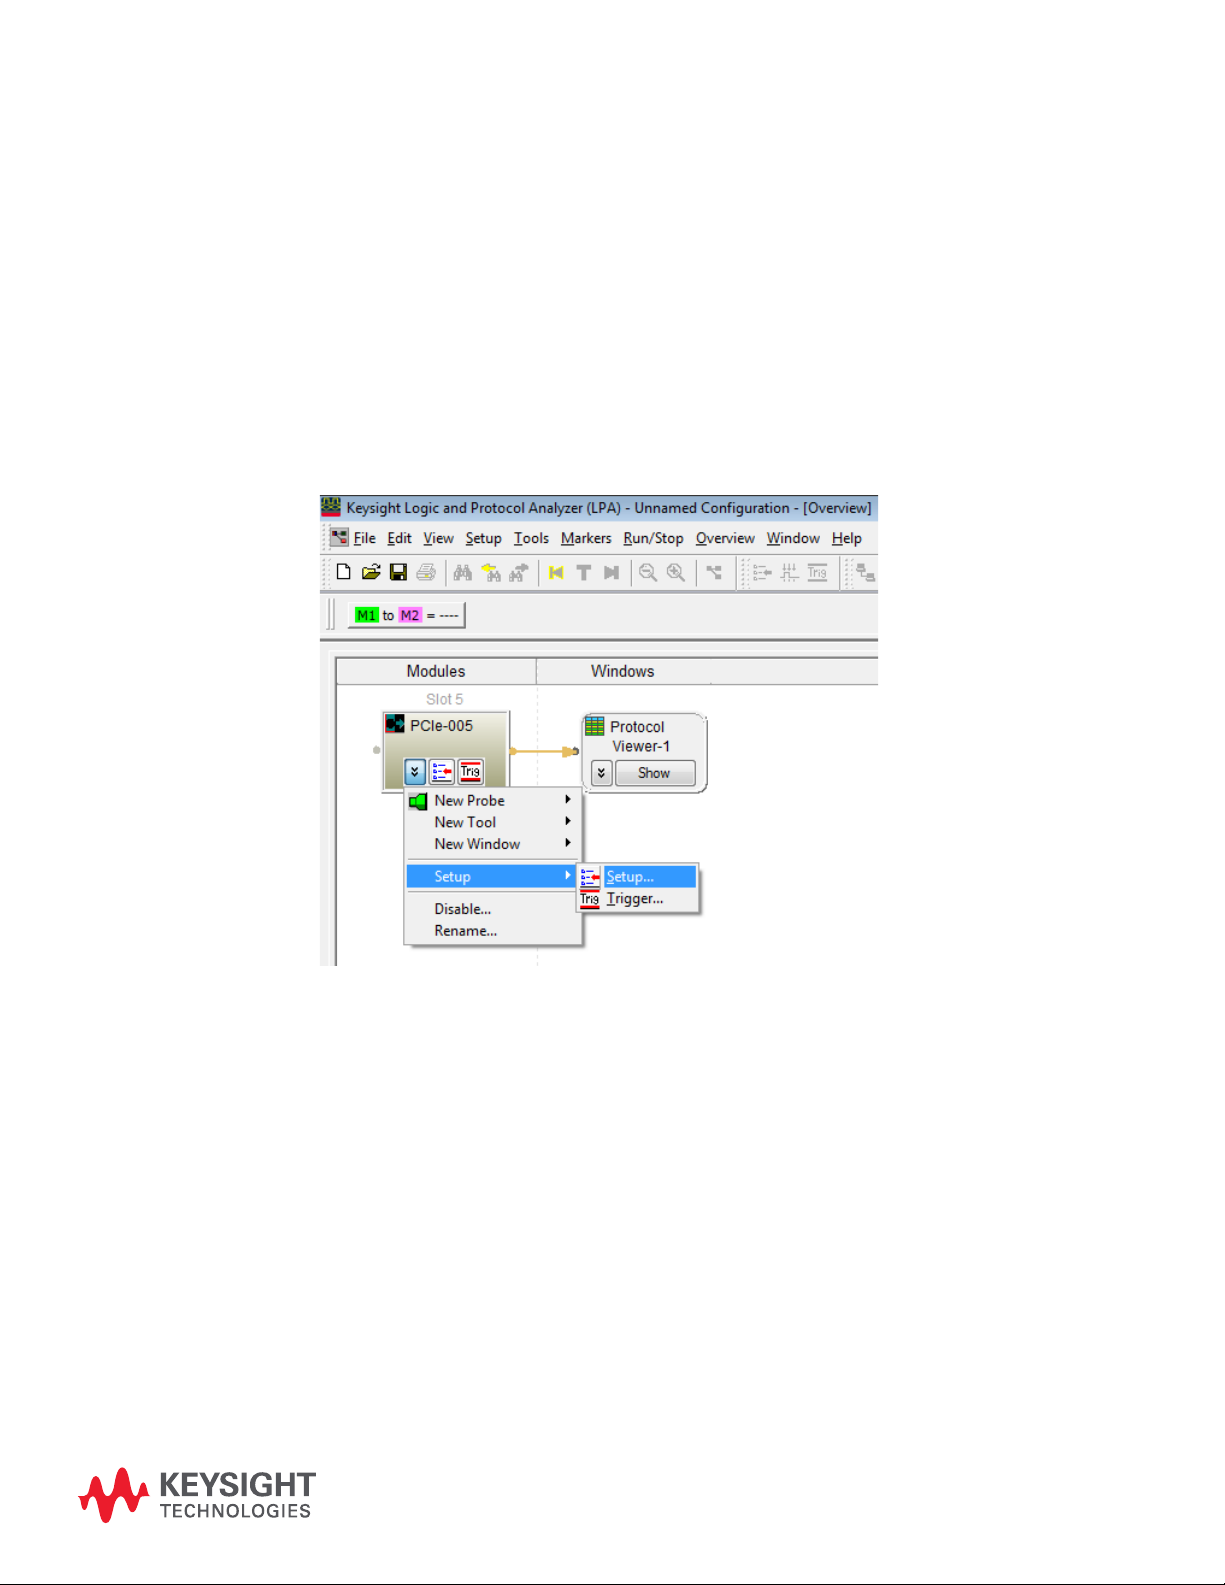
1In the Keysight Logic and Protocol Analyzer application's Overview window, from the PCIe Gen3
analyzer module's drop-down menu, select Setup>Setup....
Setup > Setup
Figure 1 Setup > Setup
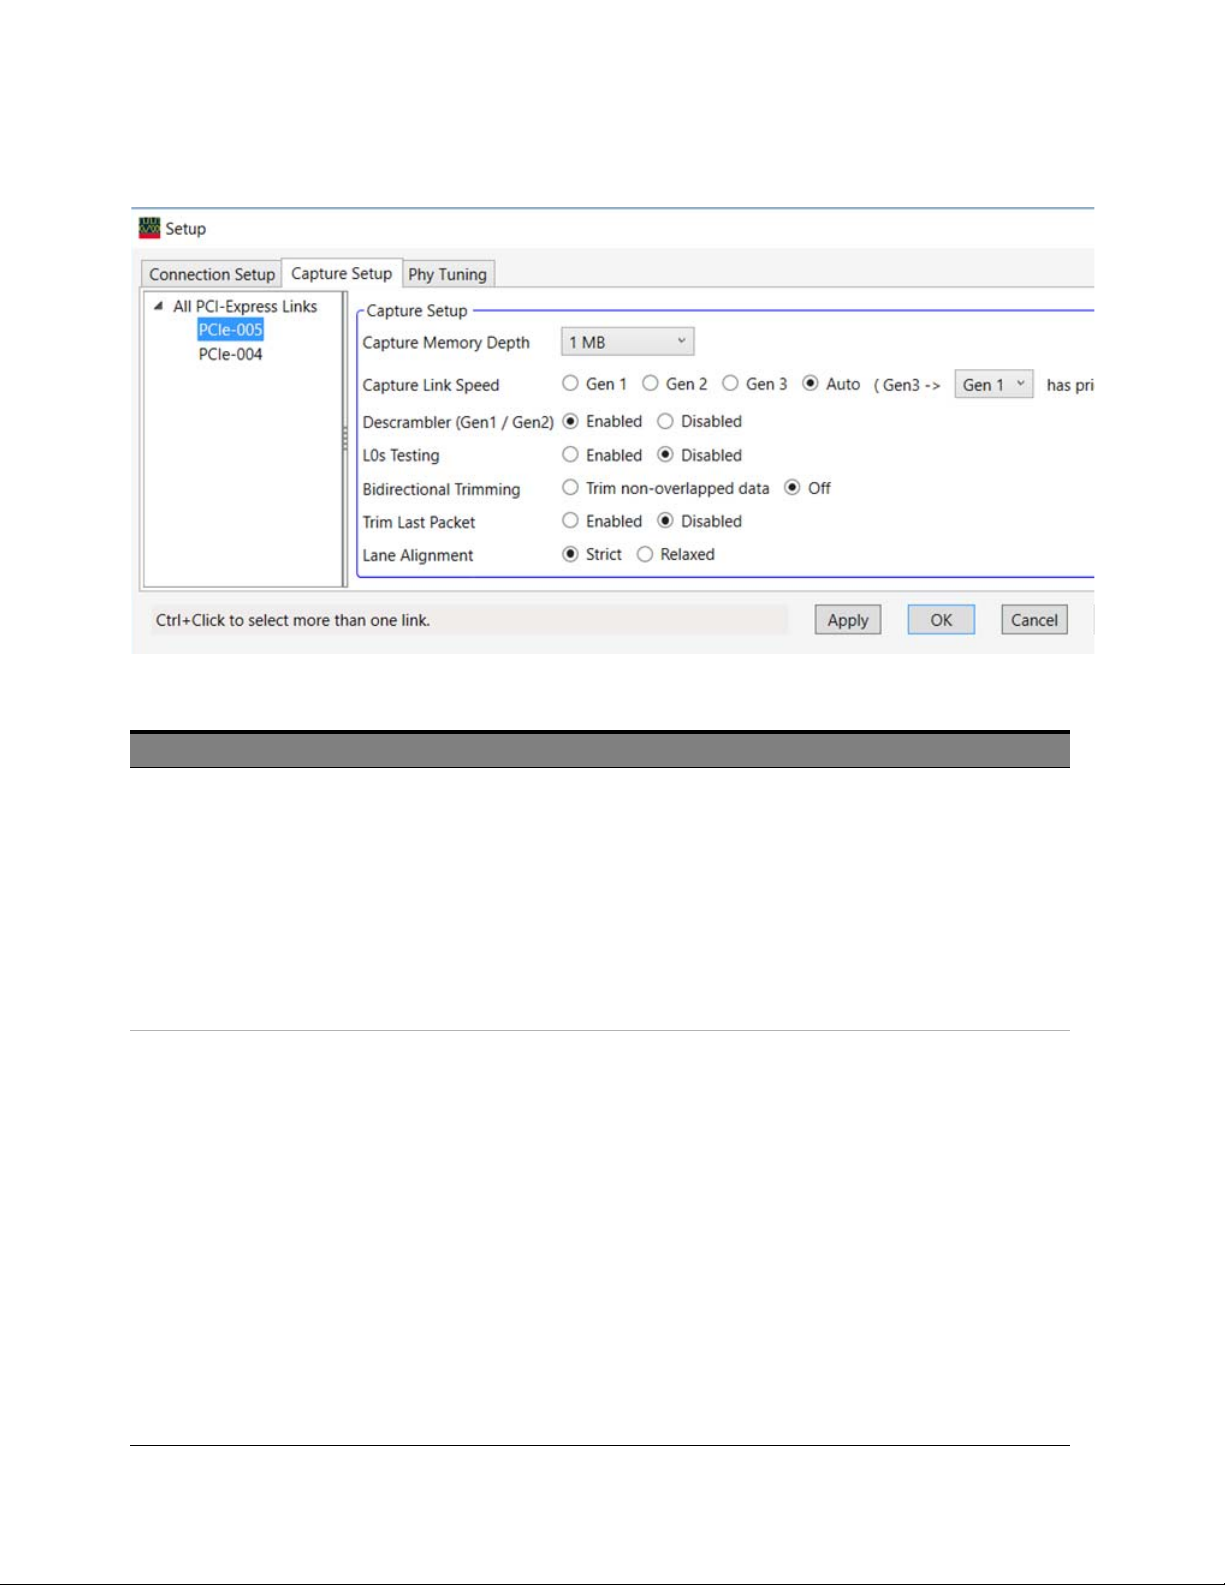
2Click the Capture Setup tab.
3 In the Capture Setup tab, select the appropriate options.
Page 34
4 Setting the Capture Options
Figure 2 Capture Setup
Field Description
Capture Memory Depth Lets you select the trace memory depth. Deeper traces capture more activity but take longer to save and process.
At times, in a bidirectional setup, the memory for one of the directions is filled up much earlier than the memory for
the other direction, for instance, when one of the directions starts sending training sequences even before the other
direction starts or when one direction sends large data packets as compared to smaller packets from the other
direction. This results in data capture for one of the directions to stop while the other direction’s data capture is still
running. In such a situation, you would see data of only one of the directions in the trace after the memory is full for
the other direction.
For such a situation, you should consider:
• increasing the memory depth for the direction to get data for both the directions.
• setting the trigger condition such that both directions are transmitting data when data capture starts.
• enabling bidirectional trimming (explained below) to remove extra non-overlapped packets for the two
directions.
Capture Link Speed Lets you specify the link speed of the data to be captured:
• Gen 1 — select this when capturing data on 2.5 Gbps links.
• Gen 2 — select this when capturing data on 5 Gbps links.
• Gen 3 — select this when capturing data on 8 Gbps links.
• Auto – select this option when testing link speed switching scenarios. On selecting this option, analyzer
automatically detects the link speed change and accordingly starts capturing data based on the changed link
speed. The Auto option also has a drop-down listbox displayed with it. From this listbox, you can select either
Gen1 or Gen2. If you select Gen1 from this listbox, then analyzer prioritizes and captures the Gen 1 ordered
sets while switching speed from Gen 3. If you select Gen2 from this listbox, then analyzer prioritizes and
captures the Gen 2 ordered sets while switching speed from Gen 3.
Based on the selected link speed, the speed LED of the Analyzer pod on which the logical Lane 0 is present will glow.
The following color coding is used to interpret the status of the speed LED.
• Off - This means that the system is not configured.
• Red - This means that the link speed is not detected or not configured.
• Yellow - This means that the link speed is 2.5 Gb/s.
• Green - This means that the link speed is 5 Gb/s.
• Blue - This means that the link speed is 8 Gb/s.
If you selected a fixed speed (Gen1, Gen2, or Gen3), then the speed LED will glow according to the selected speed. If
you selected the Auto speed option, then the speed LED will glow according to the detected speed.
NOTE: If you want to set the Capture Link Speed to Gen1, Gen2, or Gen3, then you must ensure that Lane Reversal is
not set to Auto in the Connection Setup tab.
34 Keysight U4301 PCIe Gen3 Analyzer User’s Guide
Page 35

Field Description
Setting the Capture Options 4
Descrambler (Gen1 / Gen2) Tells the analyzer whether the descrambler algorithm is necessary:
L0s Testing Lets you select whether or not the U4301A/B module will capture packets in the L0s state.
Bidirectional Trimming As the name suggests, the Bidirectional Trimming feature is useful only for bidirectional data capture setups.
• Enabled — activates the descrambler algorithm. This algorithm generates the descrambled packet stream
from an incoming scrambled packet stream.
• Disabled — deactivates the descrambler algorithm. Select this option when the DUT is transmitting the
non-scrambled data.
Garbage data is displayed if this is set incorrectly.
•Enabled - When you enable the L0s Testing option, the U4301A/B module captures packets in the L0s state and
the power management testing capabilities are enabled and enhanced in terms of :
• improvement in locking time
• faster data capture while coming out of the electrical idle
•Disabled - When you disable the L0s Testing option, the power management testing capabilities are available
but not enhanced.
The following two options are available for the Bidirectional Trimming field:
• Trim non-overlapped data - Select this option if you want the U4301 Analyzer to trim extra packets
(non-overlapped data) from both the directions of a bidirectional data capture. An example where this option is
particularly useful is when one of the directions is transmitting large data packets compared to the relatively
smaller packets transmitted by the other direction. This results in the memory being filled up quicker for one of
the directions and therefore overlapping bidirectional data is visible only around the Trigger in the trace. The
start and end of the trace have non-overlapping and non-correlated data. To overcome this problem, you can
choose to enable bidirectional trimming that trims the extra packets at the start and end of the trace making the
trace more useful for analysis.
If you enable the Trim non-overlapped data option and U4301 does not find any overlapping data for the two
directions, then it captures the non-overlapping data for both the directions instead of generating an empty trace
with no data.
See Also
See “Getting non-overlapped data in the trace even when the Bidirectional Trimming was set to On” on
page 35.
•Off - Select this option if you want the U4301 Analyzer to also capture extra packets (non-overlapped data) from
both the directions of a bidirectional data capture. The resulting data capture may have an uneven start and end
of trace for the two directions with extra upstream / downstream packets captured at the start / end of the trace.
You may want to turn off the Bidirectional trimming in troubleshooting situations, for example, when a link stops
working. In such situations, extra packets may help in analyzing the cause of the problem.
Trim Last Packet The following two options are available for this field:
•Enabled - Select this option if you want the U4301 Analyzer to trim the last packet from the trace. At times, the
last packet in the trace may not get captured completely and therefore you may want to trim this packet by
selecting this option.
•Disabled - Select this option if you want the U4301 Analyzer to keep the last packet in the trace as is.
Lane Alignment The following two options are available for the Lane Alignment field:
• Strict - Select this option if you want the U4301 Analyzer to start storing the data only after the lane alignment
has been achieved, that is, after the block alignment in case of Gen 3 and after the symbol alignment in case of
Gen 1/Gen 2. Any data prior to lane alignment is then ignored thereby avoiding the storage of data with
misaligned lanes.
• Relaxed - Select this option if you want the U4301 Analyzer to start storing the data even before the lanes have
been aligned, that is, prior to the block alignment in case of Gen 3 and the symbol alignment in case of Gen
1/Gen 2. Any data including packets when coming out of Electrical Idle, bit errors, and training sequences with
lanes not aligned are also stored.
NOTE: The Relaxed mode is primarily used in troubleshooting scenarios that involve the data before the lane
alignment and therefore some of the features such as triggering may not work as expected when using the
relaxed mode.
Getting non-overlapped data in the trace even when the Bidirectional Trimming was set to On
The following are examples of some specific situations when you get non-overlapped data for the
two directions even if you enable the Trim non-overlapped data option.
Keysight U4301 PCIe Gen3 Analyzer User’s Guide 35
Page 36
4 Setting the Capture Options
NOTE
Situation Recommended Solution
One direction starts training before the other direction. This results in the trace
being filled up with training sequences before the other direction even
starts.Consequently, the trace has non-overlapped data even if the trimming is
enabled in the capture setup.
There was no overlapping data available for the two directions.
When testing L0s/L1, ensure that you:
- set manual lane polarity.
- select a fixed capture link speed instead of the Auto speed.
Set up the trigger such that the capture starts only when both the directions start
transmitting data so that overlapping data can be obtained in the trace.
36 Keysight U4301 PCIe Gen3 Analyzer User’s Guide
Page 37

Keysight U4301 PCIe Gen3 Analyzer
User’s Guide
5 Tuning the Analyzer for a Spe-
cific DUT
PCIe Gen3 Tuning Overview / 38
Preparing the U4301A/B Module and DUT for Tuning / 41
Creating a Physical Layer Tuning File / 42
Loading a Tuning File in the Logic and Protocol Analyzer GUI / 48
Tuning a Bidirectional Setup / 50
Fine Tuning a .ptu File / 51
Page 38

5 Tuning the Analyzer for a Specific DUT
PCIe Gen3 Tuning Overview
What is Tuning
Tuning is the process of adjusting Keysight’s probing system to remove the effects of different driving
silicon, termination silicon (or other termination schemes), imperfect transmission paths, and the fact
that the probes may not be in the "ideal" location for receiving a high-speed signal (that is, at the end
of the transmission path).
Furthermore, a PCIe Gen3 system will negotiate its own TX Linear Equalization, and you would like to
have the largest eye possible. Tuning does not affect either the transmitter or the receiver; it is used
only to increase the eye as seen by the U4301 Analyzer module. This process involves getting the
system/device-under-test to a stable PCIe Gen3 transmission state which the analyzer then
optimizes its own equalizations settings for.
How Tuning Works
For tuning, you:
• either use a predefined physical layer tuning (.ptu) file with default tuning values appropriate for
your probing and connection setup.
• or create a physical layer tuning (.ptu) file..
The .ptu file contains the information necessary to adjust the probing system for a specific
device-under-test (DUT). At the 8 Gbps speed, you then need to load this .ptu file into the U4301
Analyzer module’s software to have the best possible eye at the Analyzer.
It is recommended that you first use a predefined .ptu file with default tuning values. If the default
tuning values do not provide robust and clean tracing results, you should consider creating your own
.ptu file.
You can create or fine tune a .ptu file using the Keysight Logic and Protocol Analyzer GUI.
When to Perform Tuning
You should only perform tuning when all of the following conditions are met:
• Poor trace quality which may include red packets, triggers on “Loss of Sync” or “Channel
Bonding”.
• No Recovery cycles (that is, cannot Trigger on “Any TS”) on the target.
• When no existing .ptu files are able to provide robust tracing.
Default and User Defined .ptu Files
A set of default tuning (.ptu) files are provided with the Keysight Logic and Protocol Analyzer
software. These tuning files contain the probe defaults to compensate for the signal impairments
associated with the probe. These files are named on the basis of the probe type for which these are
created. Based on the probe type you are using, one of these files is used and if the trace quality is
clean, you do not need to tune further by creating your own .ptu file. These default .ptu files work fine
and support robust tracing in situations where the targets have margin. The following screen displays
the location of these default ptu files.
38 Keysight U4301 PCIe Gen3 Analyzer User’s Guide
Page 39
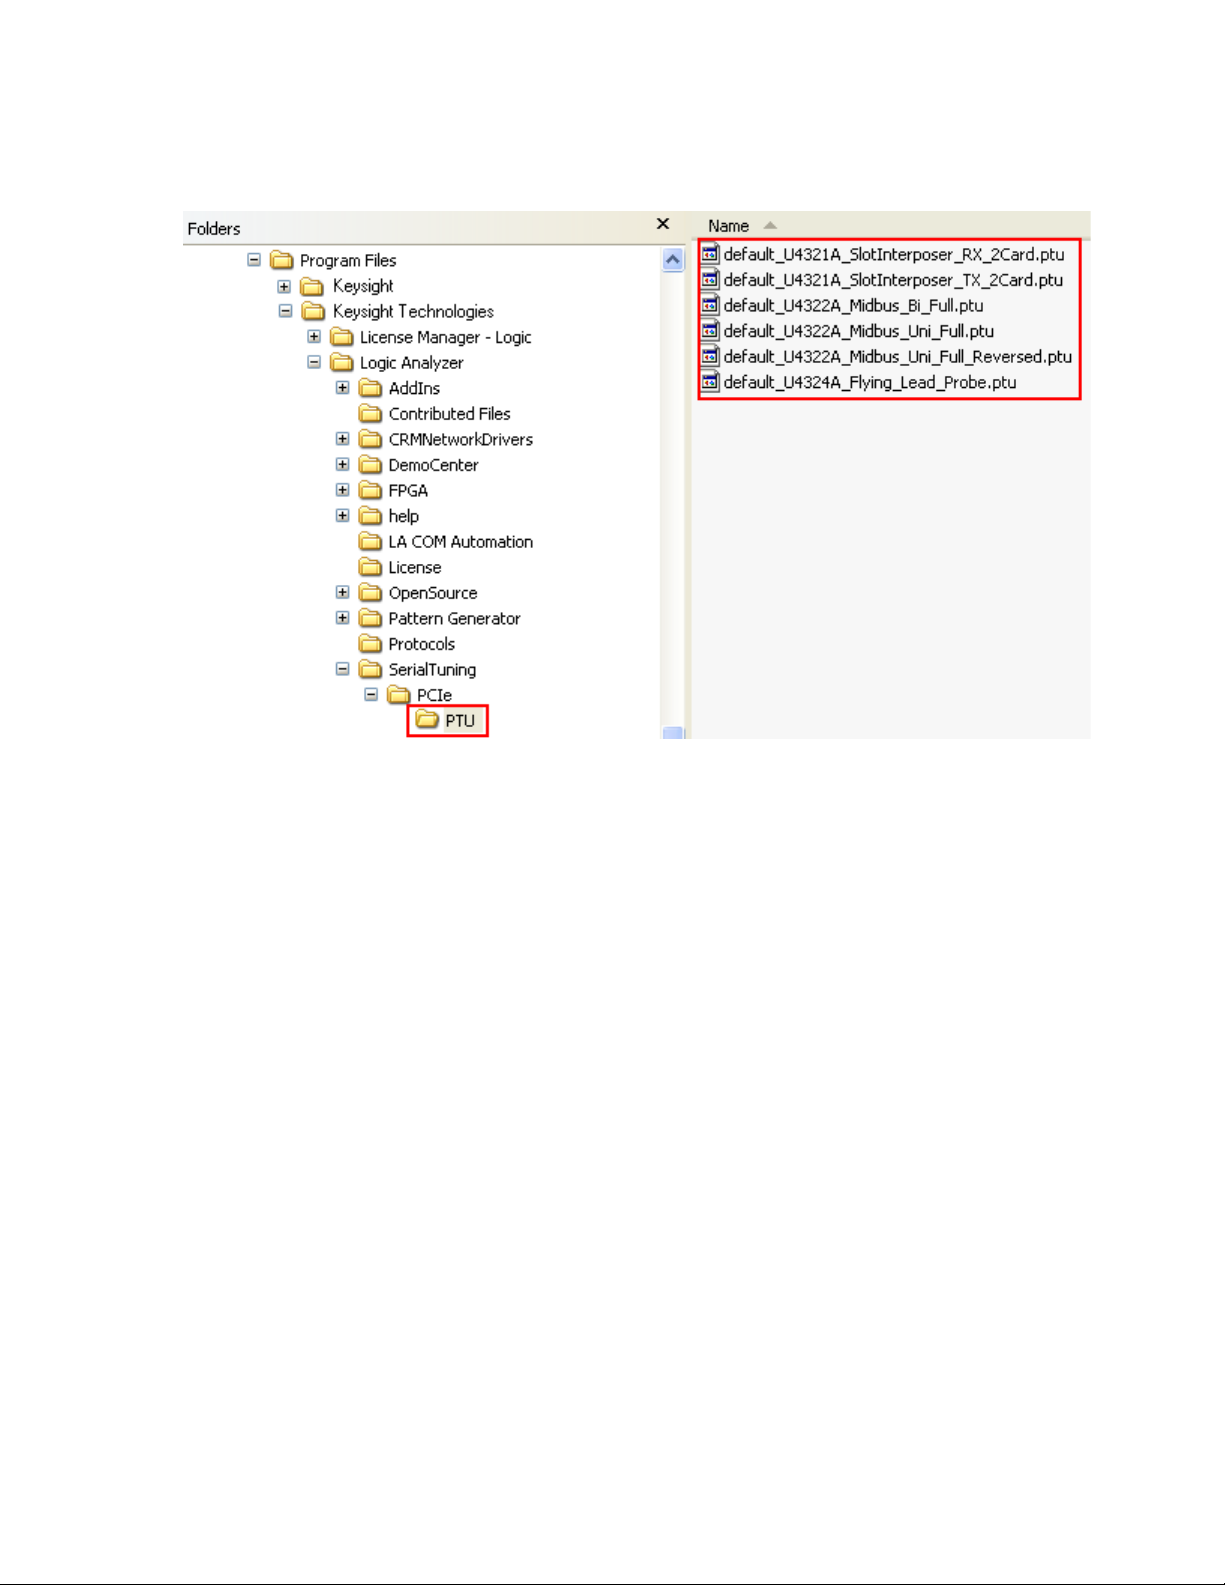
Tuning the Analyzer for a Specific DUT 5
However, if the default .ptu file does not serve the purpose and you find the trace quality to be poor,
you can create your own .ptu file with your specific parameters and use it in the Logic and Protocol
Analyzer GUI to perform tuning. You can create a .ptu file using the Logic and Protocol Analyzer GUI.
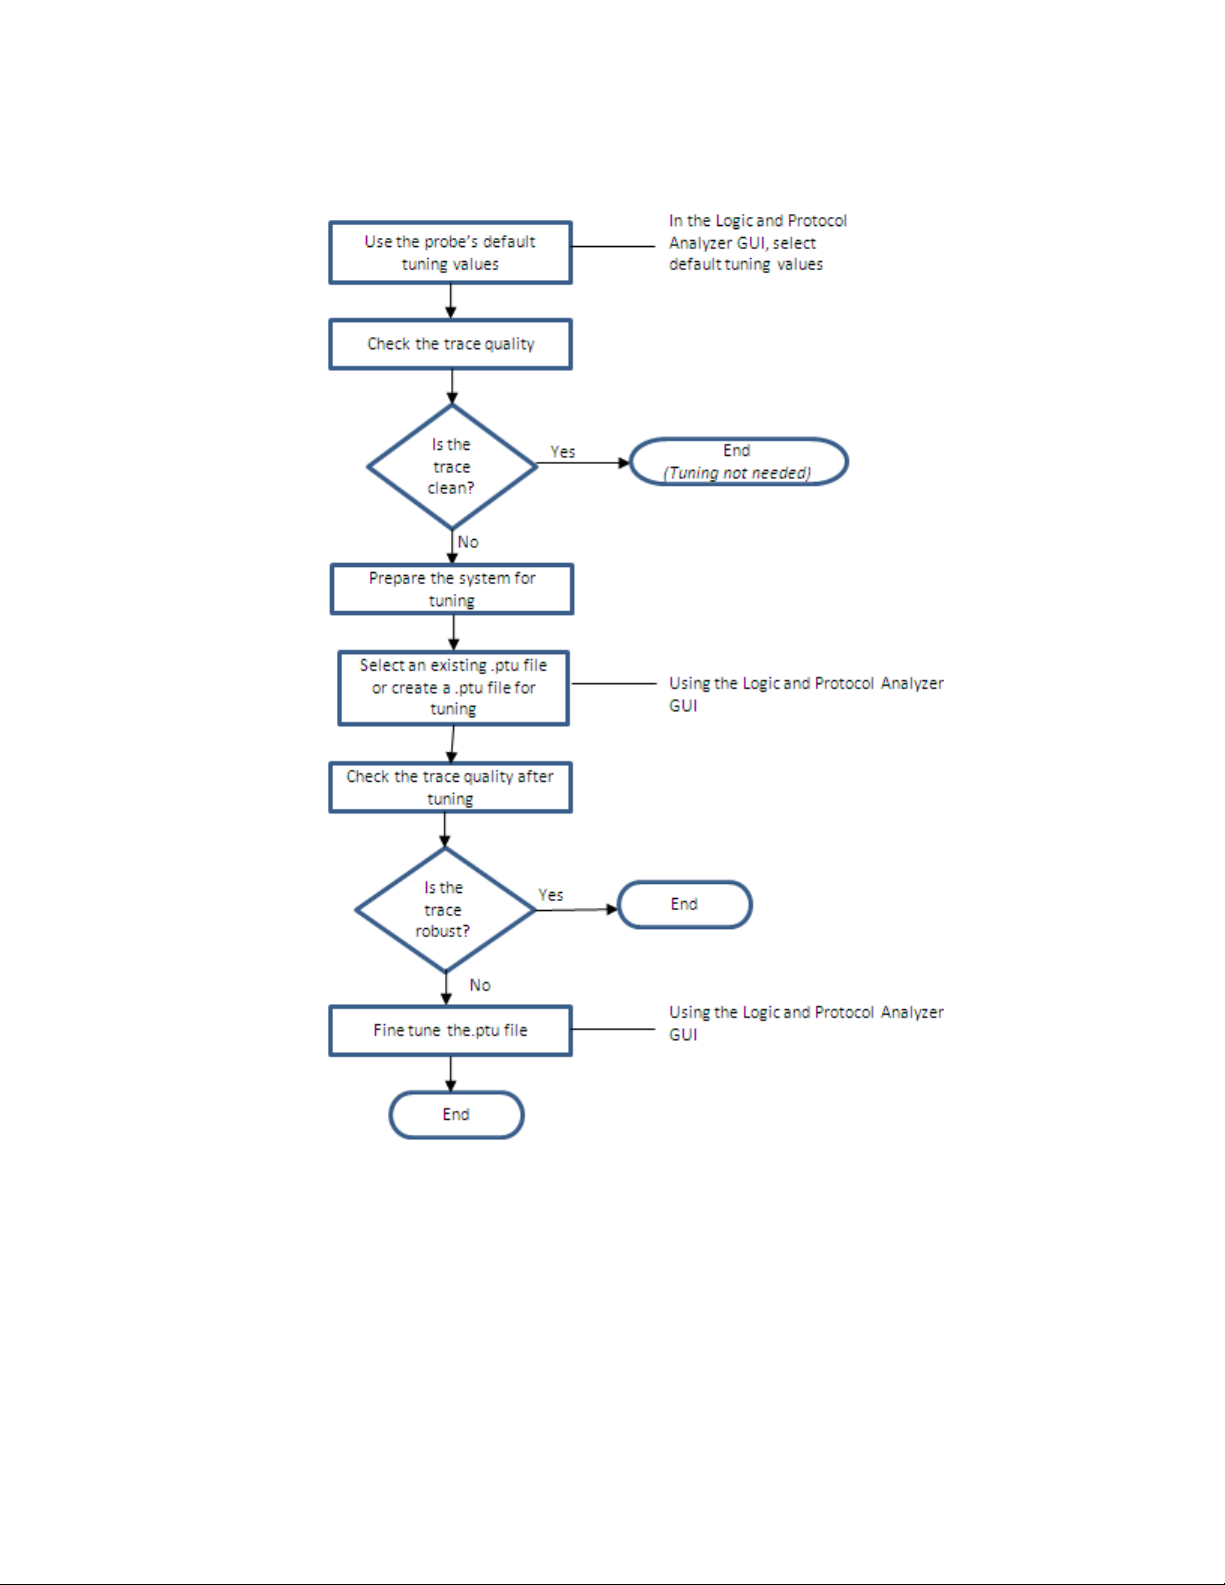
Tuning - Broad steps
The following picture illustrates the broad steps involved in the tuning flow.
Keysight U4301 PCIe Gen3 Analyzer User’s Guide 39
Page 40
5 Tuning the Analyzer for a Specific DUT
All these steps are described in detail in the topics that follow.
Tuning Method
While creating a .ptu file using the Logic and Protocol Analyzer GUI, the AnalogTune tuning method
is used. This method minimizes the deviations of the observed Vertical Eye characteristics versus the
desired Vertical Eye characteristics. From the DUT participation perspective, this method only
requires that the DUT must not have transitions to or from Electrical Idle at 8Gbps.
40 Keysight U4301 PCIe Gen3 Analyzer User’s Guide
Page 41

Preparing the U4301A/B Module and DUT for Tuning
Perform these steps to prepare the setup for tuning:
1 Connect the U4301A/B Analyzer module to the DUT. Refer to the PCI Express Gen3 Hardware
and Probing Guide to know how to connect Analyzer to the DUT based on your specific probing
situation.
The following Keysight probing options are supported for use with the Analyzer module.
• U4321A solid slot interposer.
Note that there are four connections on this interposer; the upper two are for the "To
Upstream" path (assuming that the card plugged into the top connector of the interposer is
the downstream side). The lower two connectors are for the "to Downstream" direction.
• U4322A soft touch midbus 3.0 probe.
Note that there are several supported footprints that define what lanes are at specific physical
connections.
• U4324A PCIe Gen3 flying lead probe.
• U4328A M.2 (M-key) Interposer
• U4330A SFF-8639 Interposer
2 If the Resource Bus connector is connecting two Analyzer modules together (the connector at
the left of the modules), remove the Resource Bus Connector and do the tuning of one module at
a time.
After you have tuned, you can reconnect the Resource Bus Connector without affecting the
tuning.
3 Your DUT must enter L0 at Gen3 speed (8 Gbps).
4 The DUT must not transition to or from Electrical Idle at 8Gbps and its TXEQ should have
stabilized before tuning. If the DUT is experiencing Recovery cycles, it is likely that it will change
its TXEQ to achieve stability.
5 Ensure that the connection settings such as the number of lanes in use and the lanes inverted by
the transmitter are correctly set up in the Connection Setup tab of the U4301A/B module’s Setup
dialog box before starting the tuning. These settings are used in the tuning process and incorrect
settings can result in incorrect tuning.
Tuning the Analyzer for a Specific DUT 5
Keysight U4301 PCIe Gen3 Analyzer User’s Guide 41
Page 42
5 Tuning the Analyzer for a Specific DUT
Creating a Physical Layer Tuning File
After you have prepared your system for tuning and configured the connection setup for the
U4301A/B module, you can create a physical layer tuning (.ptu) file. This file stores the information
about the test setup (lane inversions, number of lanes, etc) and the tuning parameters that were
discovered during tuning. You use this file in the PCIe Analyzer setup in the Logic and Protocol
Analyzer GUI to tune the system.
To create a physical layer tuning file
Perform these steps on the host PC that is physically connected to the U4301 Analyzer module.
1 Exit the Keysight Logic and Protocol Analyzer application if it is currently active.
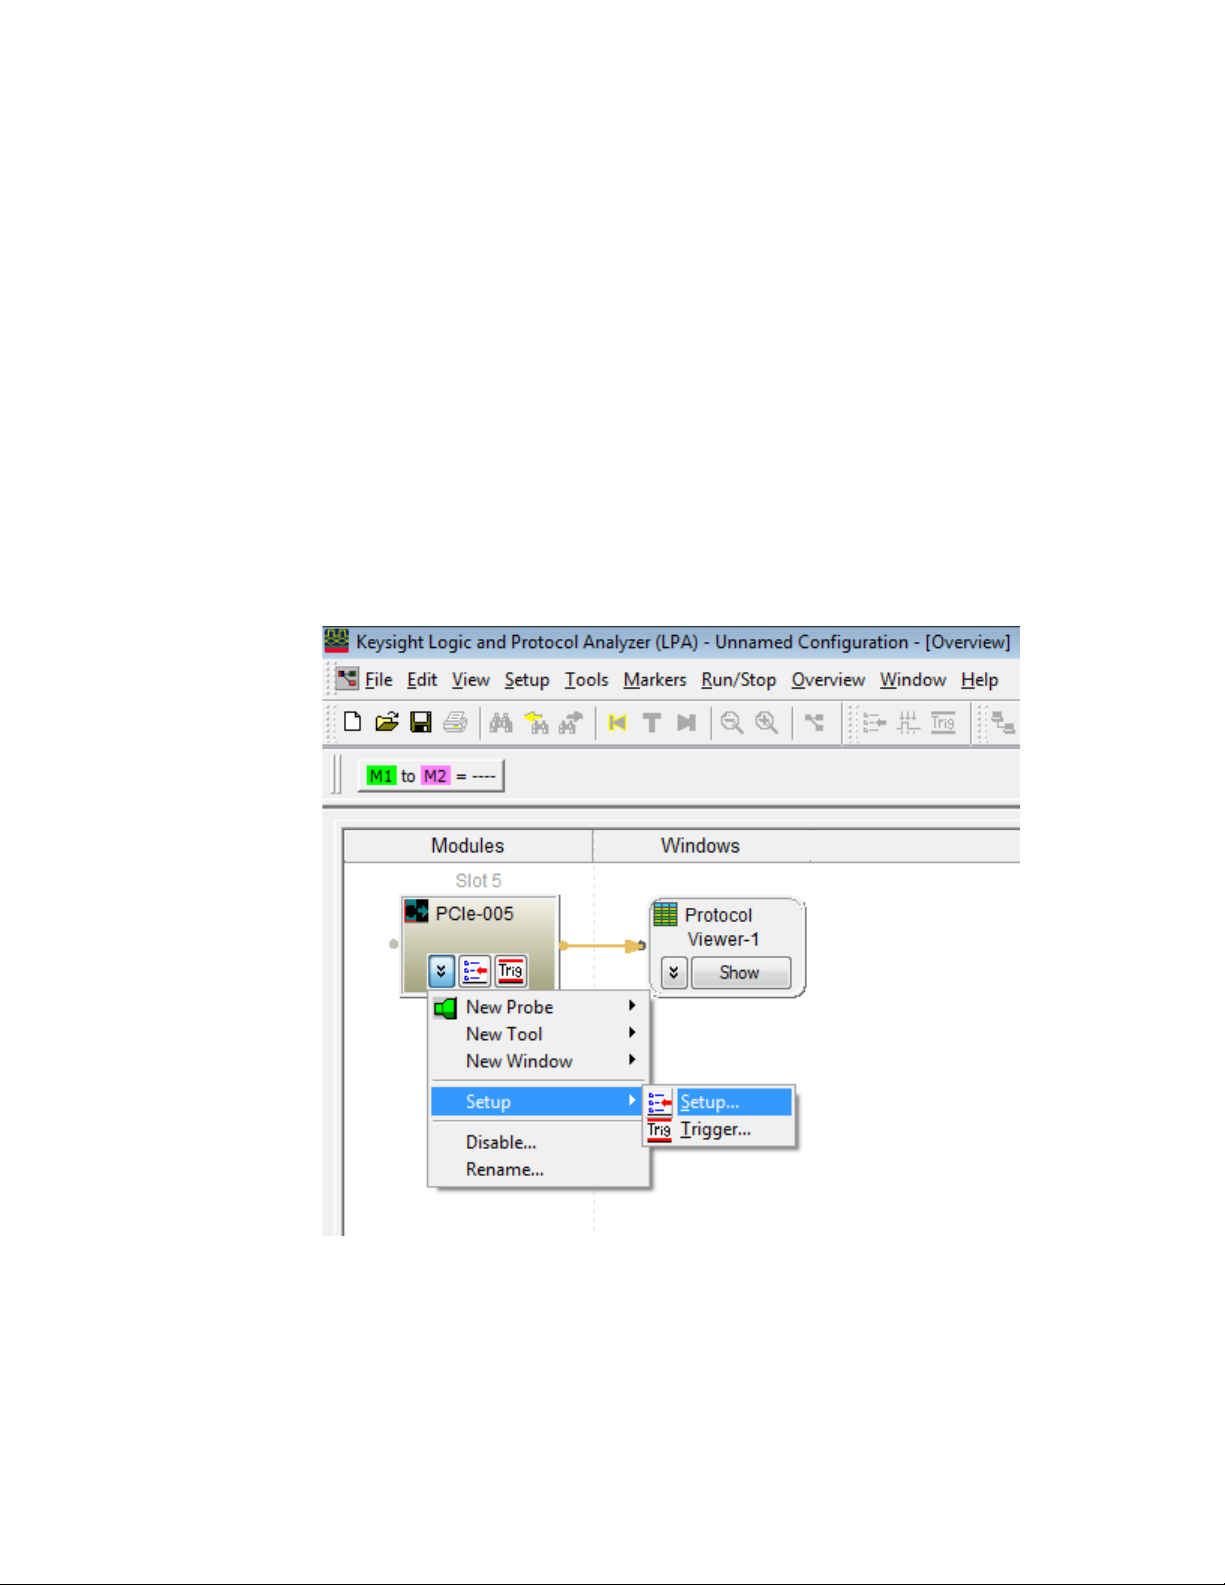
2 Start the Keysight Logic and Protocol Analyzer application.
This is done to ensure that all the default settings in the analyzer software are used.‘‘‘
3 In the Logic and Protocol Analyzer GUI’s Overview window, select Setup>Setup.... from the PCIe
analyzer module's drop-down menu to access its Setup dialog box.
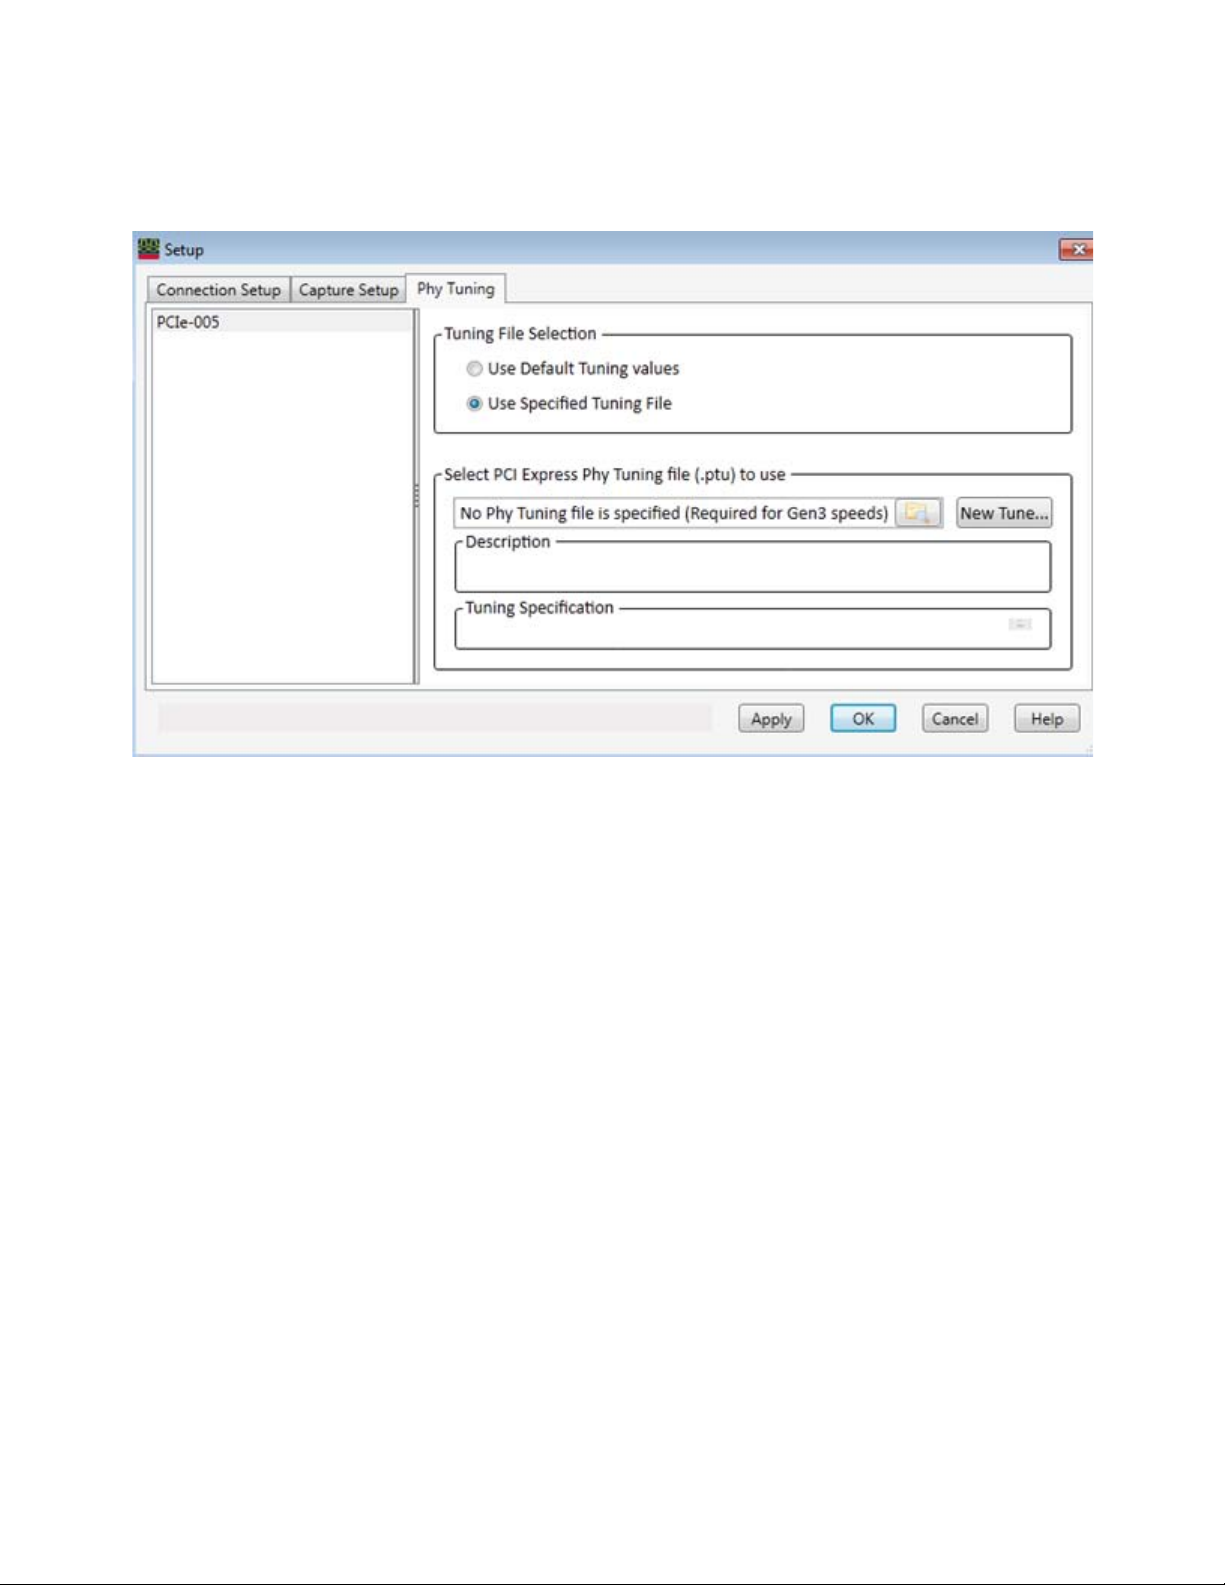
4Click the Phy Tuning tab of the Setup dialog box.
42 Keysight U4301 PCIe Gen3 Analyzer User’s Guide
Page 43
Tuning the Analyzer for a Specific DUT 5
5 The left pane of the Phy Tuning tab displays a list of the currently available PCIe Analyzer
modules. From this list, select the module which you want to tune.
6 Select the Use Specified Tuning File option from the Tuning File Selection section.
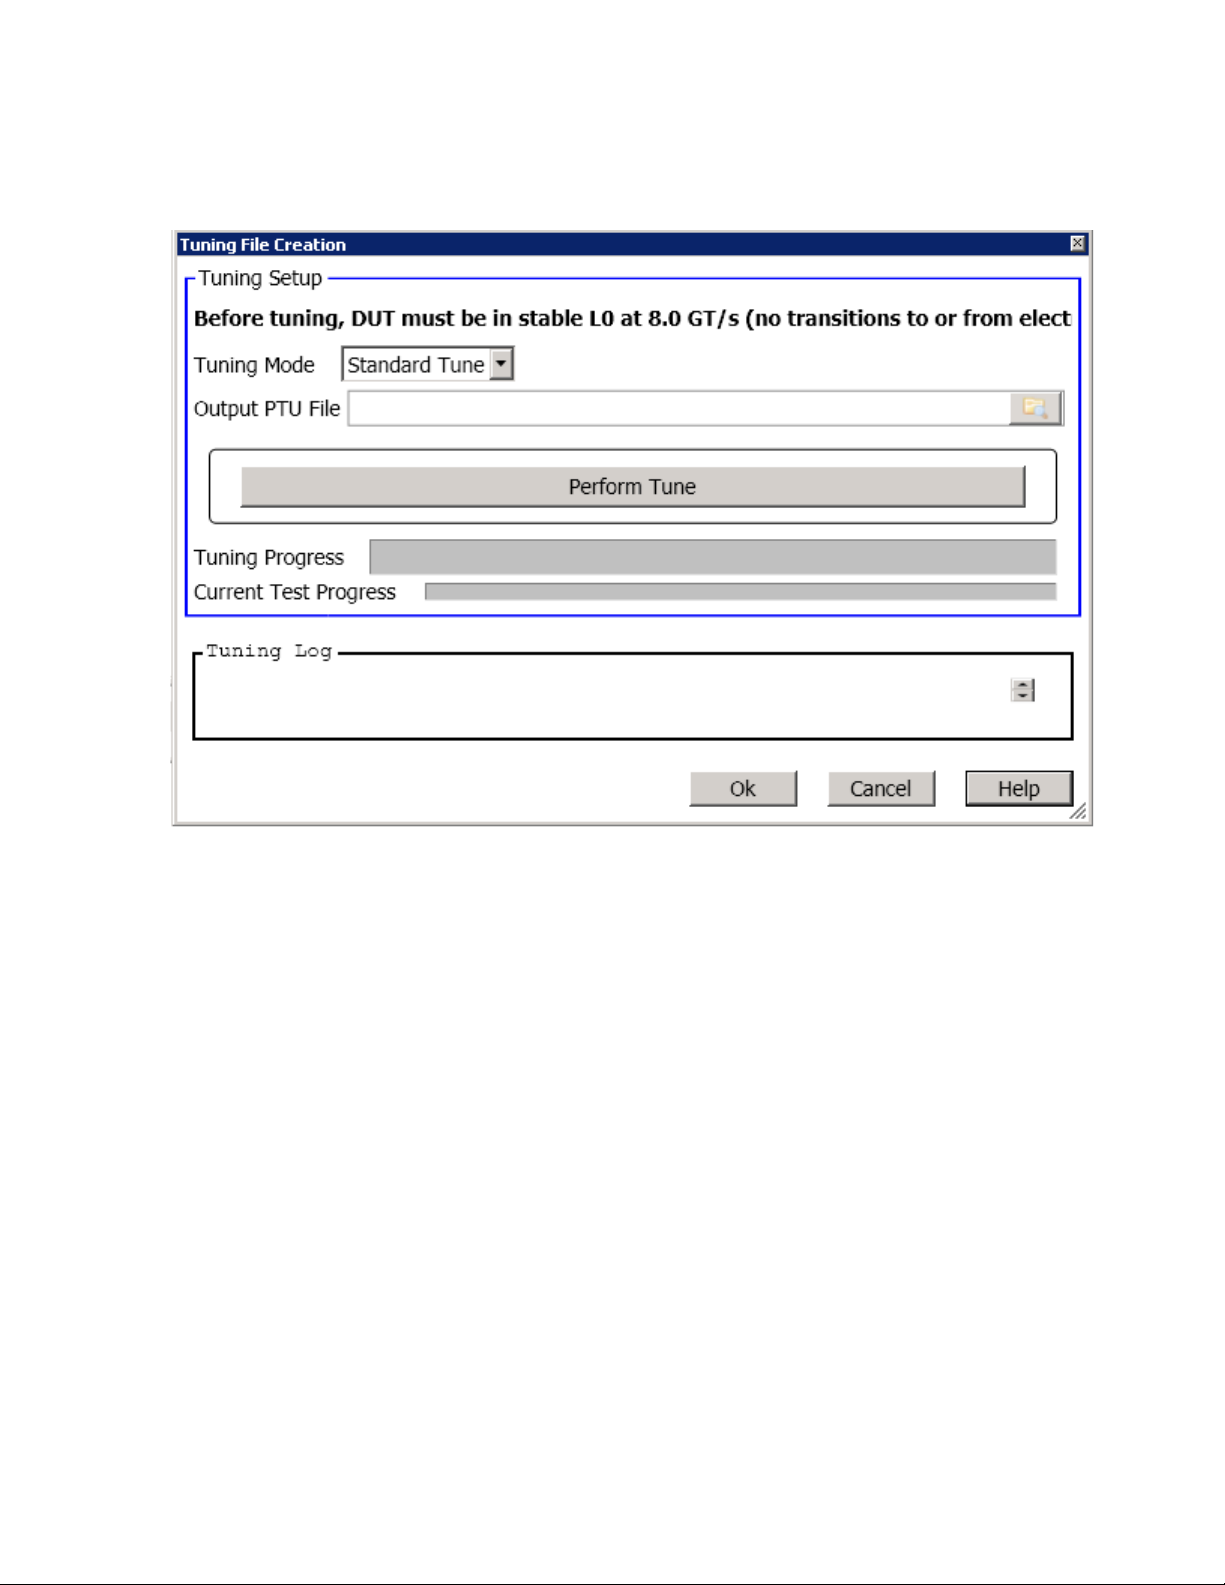
7Click the New Tune... button to open the Tuning File Creation dialog box.
Keysight U4301 PCIe Gen3 Analyzer User’s Guide 43
Page 44
5 Tuning the Analyzer for a Specific DUT
8 Select one of the following options from the Tuning Mode listbox. All the tuning modes listed below
performs an Analog tune.
• Standard Tune - This option performs an Analog Tune followed by a fine tune. In this option, the
number of iterations for a tuning test completion are more than the number of iterations in the
Quick Tune option. Standard Tune, therefore takes more time than Quick Tune.
• Quick Tune - Depending on your analysis needs, you may choose to spend less time on tuning
in order to start analysis of your system quicker. Quick Tune is useful in such situations. Like
Standard tune, this option also performs an Analog Tune followed by a fine tune. However, the
number of iterations for a tuning test are lesser making this option suitable for performing
tuning quickly.
• Fine Tune Previous Results - This option is meant for fine tuning a previously created .ptu file. If
the .ptu file that you created does not produce robust and clean tracing, then you can fine tune
it to get the desired results from tuning.
• Long Tune - This option is identical to the standard tune but takes more time in running the
tuning test iterations as compared to the standard tune. Long Tune, therefore, requires
considerably longer time to complete the tuning process than the standard tune but can
reduce the trace errors resulting from inadequate tuning. You should use this option only if you
are getting excessive errors in the captured traces even after a successful completion of
standard tune run with all lanes converged. This option is not recommended for use if all the
lanes are not converged.
44 Keysight U4301 PCIe Gen3 Analyzer User’s Guide
Page 45

Tuning the Analyzer for a Specific DUT 5
• Long Fine Tune - This option is identical to the Fine Tune Previous Results option but takes more
time in running the tuning test iterations as compared to Fine Tune Previous Results. Long Fine
Tune, therefore, requires considerably longer time to complete the tuning process than the
Fine tune but can reduce the trace errors resulting from inadequate tuning. You should use this
option only if you are getting excessive errors in the captured traces even after a successful
completion of Fine Tune Previous Results run with all lanes converged. This option is not
recommended for use if all the lanes are not converged.
9 Click the icon displayed with the Output PTU File field to browse and specify the name and
location for the .ptu file.
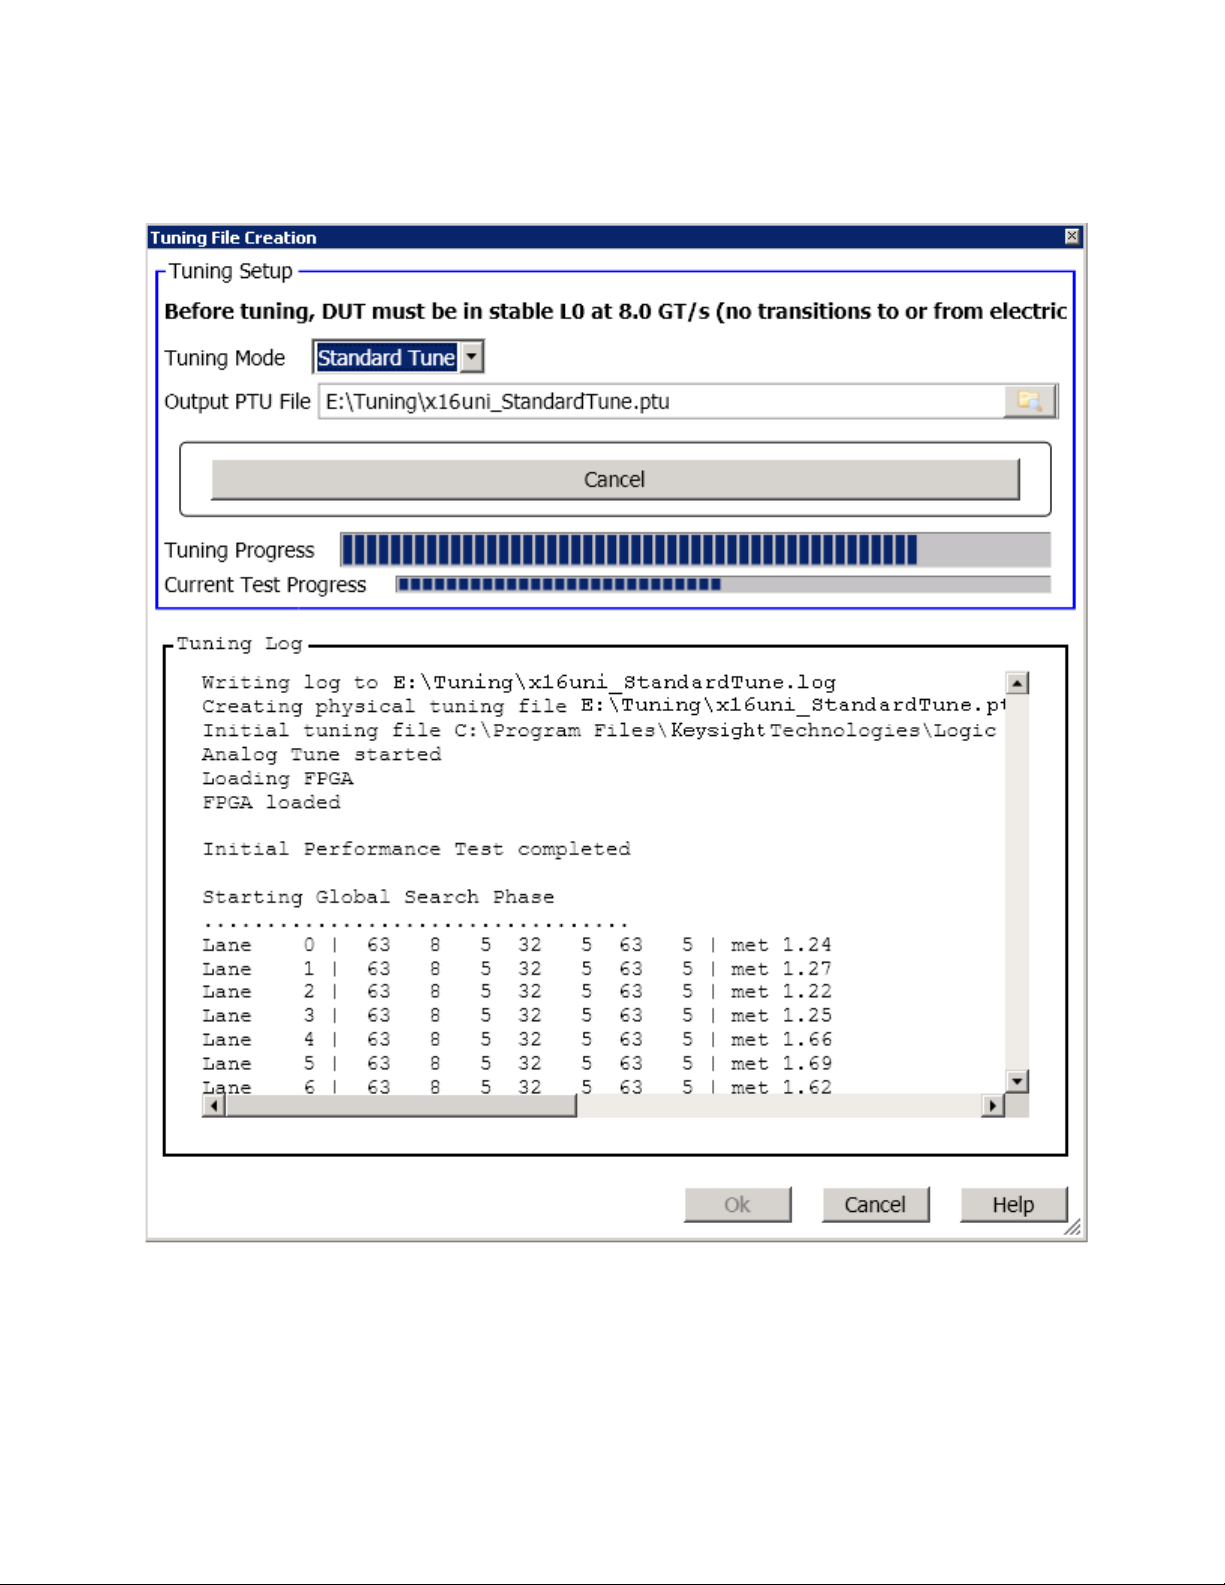
10 Click Perform Tune.
The tuning process starts. The Tuning Log section displays the results of the tuning process run
operation. If the tuning process completes successfully, the specified .ptu file gets created. A
tuning log file is also created with the same name and location as the tuning file.
Keysight U4301 PCIe Gen3 Analyzer User’s Guide 45
Page 46
5 Tuning the Analyzer for a Specific DUT
11 Click OK to close the Tuning File Creation dialog box.
The newly created tuning file is now loaded for use in the Phy Tuning tab.
46 Keysight U4301 PCIe Gen3 Analyzer User’s Guide
Page 47
Tuning the Analyzer for a Specific DUT 5
LEDs display during BER Based Tuning
The U4301 Analyzer module has 16 channel LEDs and four speed LEDs. The following table lists the
interpretation of these LEDs display during BER-based tuning.
Field Description
Channel LEDs
Green Indicates no bit errors on that lane.
Yellow Indicates loss of sync or “OK”/”ERROR” is toggling quickly. You get “shades of yellow”,
Red Indicates bit error on that lane.
Blinking Red / Off Indicates input FIFO overflow.
Speed LEDs
Off Indicates an Idle state.
Blue Indicates that the data is being taken.
usually, when there are frequent bit errors.
For a general description of the channel and speed LEDs, refer to the PCI Express Gen3 Hardware
and Probing guide. You can download this guide from www.keysight.com.
Keysight U4301 PCIe Gen3 Analyzer User’s Guide 47
Page 48

5 Tuning the Analyzer for a Specific DUT
Loading a Tuning File in the Logic and Protocol Analyzer GUI
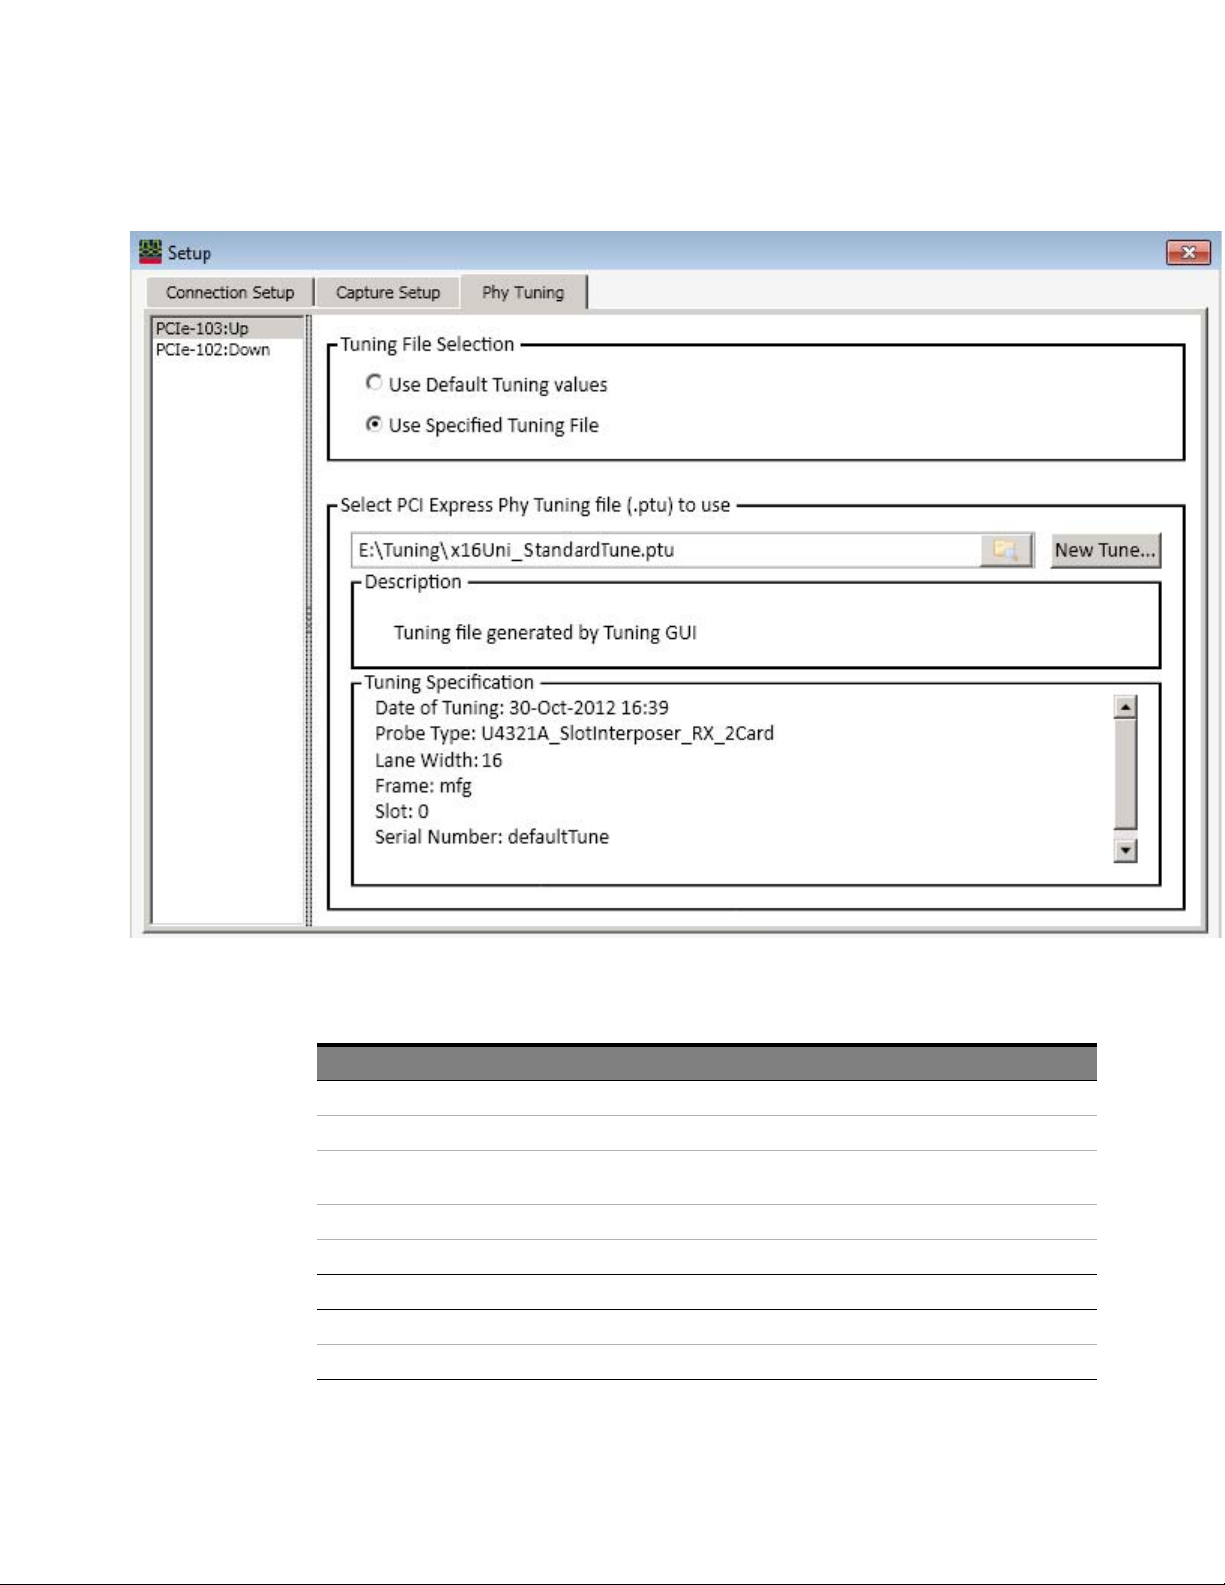
The Phy Tuning tab lets you load a user-created physical tuning (.ptu) file or the default tuning values
from a predefined tuning file.
To load a specified tuning file or default tuning values
1In the Keysight Logic and Protocol Analyzer application's Overview window, select Setup>Setup...
from the PCIe Gen3 analyzer module's drop-down menu.
2Click the Phy Tuning tab.
3 The left pane of the Phy Tuning tab displays a list of the currently available PCIe Analyzer
modules. From this list, select the module for which you want to select a tuning file.
4 To load default tuning values:
a Select the Use Default Tuning Values option from the Tuning File Selection section. On selecting
this option, the software automatically uses the default tuning values from the predefined .ptu
file applicable for your probing and connection setup. This is the default and recommended
option for an initial run. If the default tuning values do not produce robust and clean tracing
results, you should load a user-specified PTU file for tuning (described in the next step).
5 To load a user-specified tuning file:
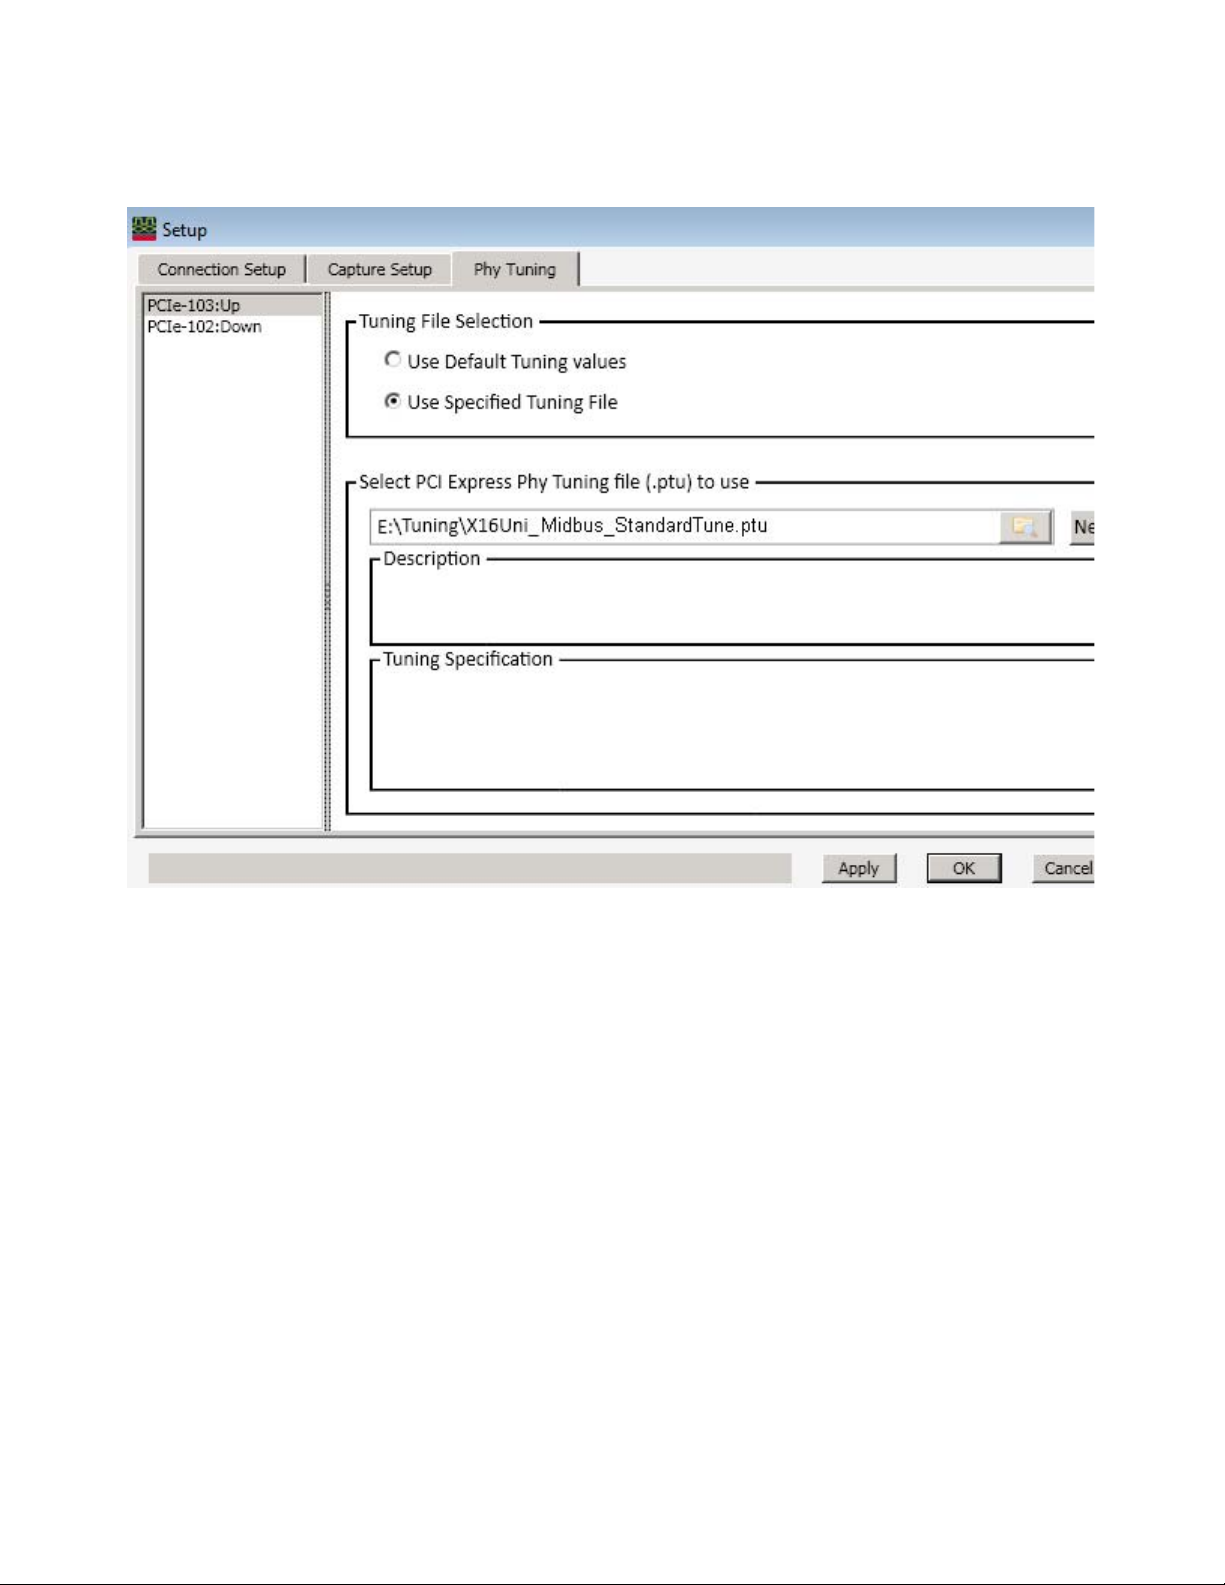
a Select the Use Specified Tuning File option to load a user-specified tuning file.
b Click the icon displayed with the Select PCI Express PHY Tuning File (.ptu) to use section to
browse and navigate to the tuning file that you want to load.
c Select the tuning file and click Open in the Open dialog box.
The tuning file is now loaded for use.
48 Keysight U4301 PCIe Gen3 Analyzer User’s Guide
Page 49
Tuning the Analyzer for a Specific DUT 5
6Click Apply or OK.
Keysight U4301 PCIe Gen3 Analyzer User’s Guide 49
Page 50

5 Tuning the Analyzer for a Specific DUT
Tuning a Bidirectional Setup
A single U4301A/B module can support a x1 to x8 bidirectional configuration. To tune a U4301A/B
module in a x1 to x8 bidirectional configuration, you just need to tune once. A single tuning file is
used to perform tuning for both directions.
However, for a x16 bidirectional configuration, you need two U4301A/B modules. Therefore, for such
a configuration, you need two separate tuning files, one for each module. Each module is tuned
separately using its tuning file.
50 Keysight U4301 PCIe Gen3 Analyzer User’s Guide
Page 51
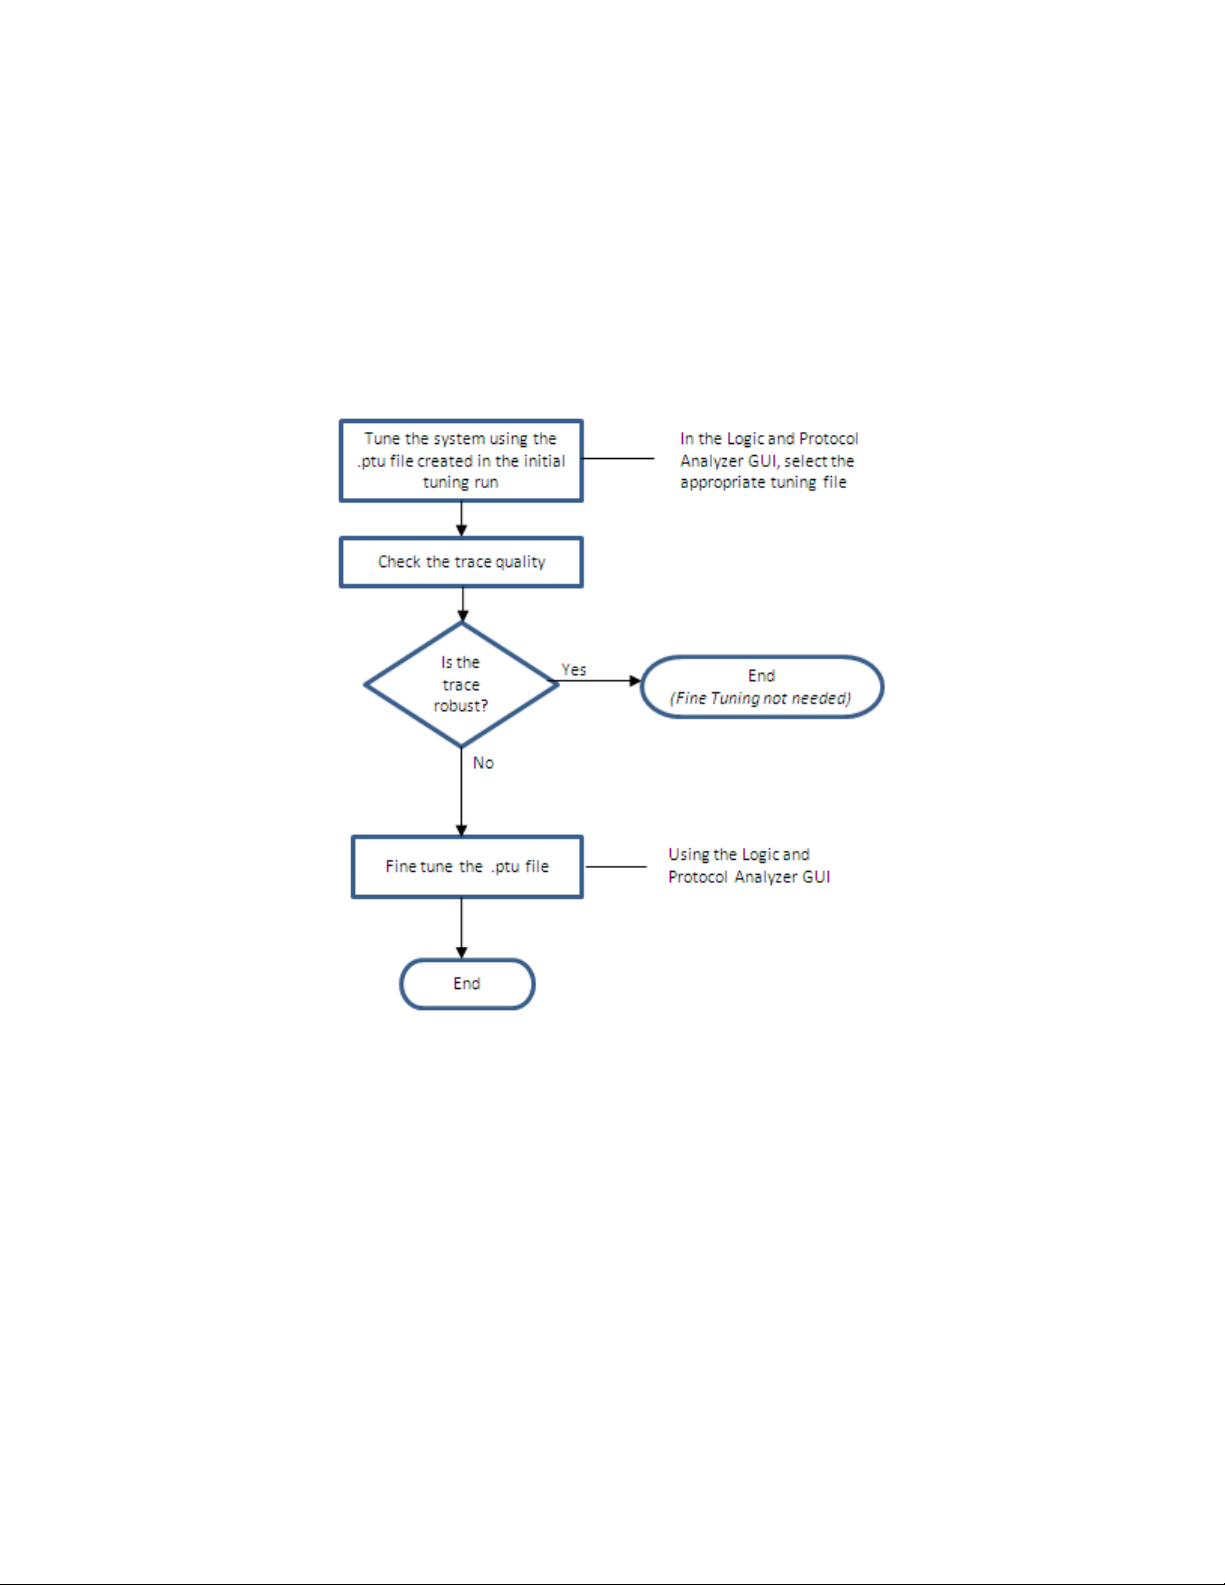
Fine Tuning a .ptu File
If the .ptu file that you created does not produce robust and clean tracing, then you can fine tune the
.ptu file to get the desired results from tuning.
Fine Tuning Flow
The following picture illustrates the fine tuning flow.
Tuning the Analyzer for a Specific DUT 5
To fine tune a .ptu file
1 In the Setup dialog box of the U4301A/B Analyzer module, click the Phy Tuning tab.
2 Ensure that the Use Specified Tuning File option is selected and the .ptu file that you want to fine
tune is selected in the Select PCI Express Phy Tuning File (.ptu) to use section. If no .ptu file is selected,
then the default predefined .ptu file applicable for your probe and connection setup is used for
fine tuning.
3Click New Tune....
4Select Fine Tune Previous Results from the Tuning Method listbox in the Tuning File Creation dialog box.
Keysight U4301 PCIe Gen3 Analyzer User’s Guide 51
Page 52

5 Tuning the Analyzer for a Specific DUT
NOTE
If you are getting excessive errors in the captured traces even after a successful completion
of Fine Tune Previous Results run with all lanes converged, then you can use the Long Fine
Tune option. This option is identical to the Fine Tune Previous Results option but takes more
time in running the tuning test iterations as compared to Fine Tune Previous Results. Long
Fine Tune, therefore, requires considerably longer time to complete the tuning process than
the Fine tune but can reduce the trace errors resulting from inadequate tuning.
The Long Fine Tune option is not recommended for use if all the lanes are not converged.
5 Click the icon displayed with the Output PTU File field to browse and specify the path and
location of the tuning file that will be generated after the fine tuning process.
6Click Perform Tune.
The fine tuning process starts and the fine tuning progress is displayed with a progress bar.
52 Keysight U4301 PCIe Gen3 Analyzer User’s Guide
Page 53
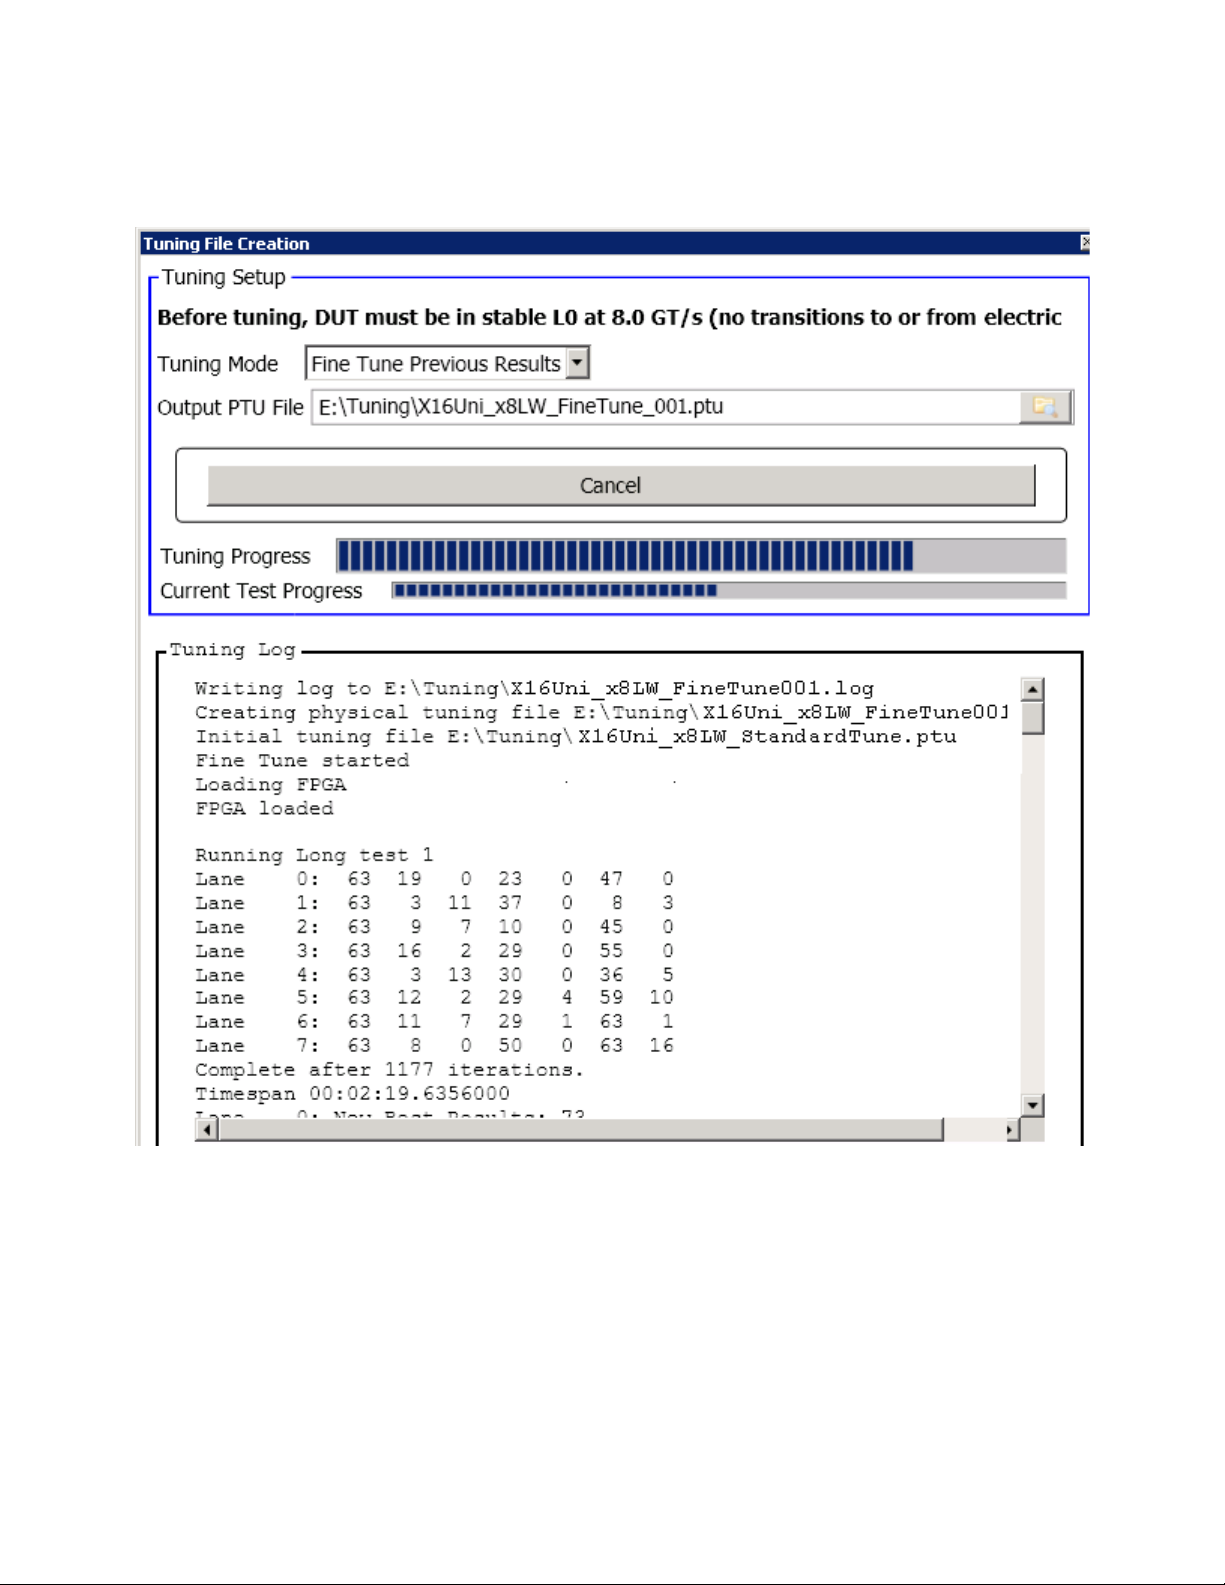
Tuning the Analyzer for a Specific DUT 5
7 When fine tuning completes, click OK to close the Tuning File Creation dialog box.
On successful completion, the fine-tuned PTU file is created at the specified location along with a
tuning log with the same name as the fine-tuned PTU file.
Keysight U4301 PCIe Gen3 Analyzer User’s Guide 53
Page 54

5 Tuning the Analyzer for a Specific DUT
54 Keysight U4301 PCIe Gen3 Analyzer User’s Guide
Page 55

Keysight U4301 PCIe Gen3 Analyzer
User’s Guide
6 Setting Up Triggers
Setting Up Simple Triggers / 56
Setting Up Advanced Triggers / 59
Setting General Trigger Options / 64
Setting up a Trigger on Physical Layer Errors / 66
The U4301A/B PCIe Gen3 analyzer lets you set up triggers (events that specify when to capture a
trace) with simple or advanced dialogs.
Page 56
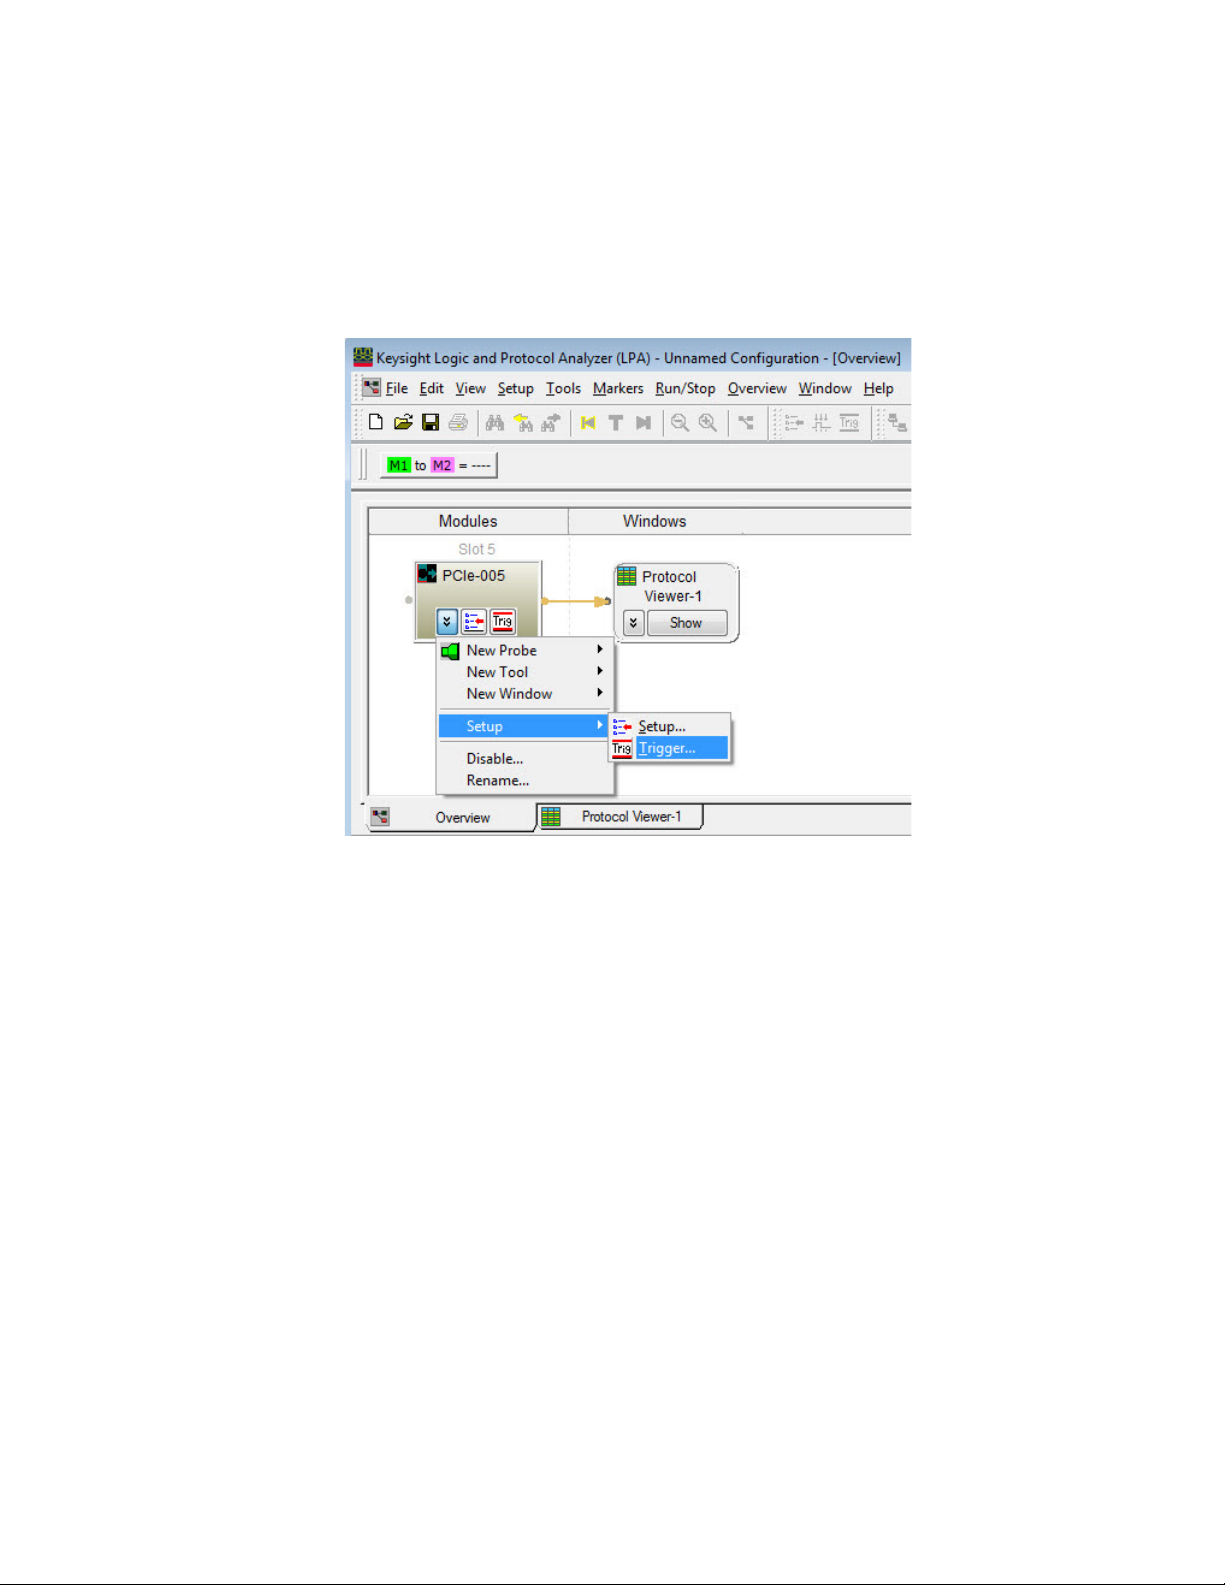
6 Setting Up Triggers
Setting Up Simple Triggers
1In the Keysight Logic and Protocol Analyzer application's Overview window, select
Setup>Trigger....from the PCIe analyzer module's drop-down menu,
2 In the Trigger dialog:
56 Keysight U4301 PCIe Gen3 Analyzer User’s Guide
Page 57
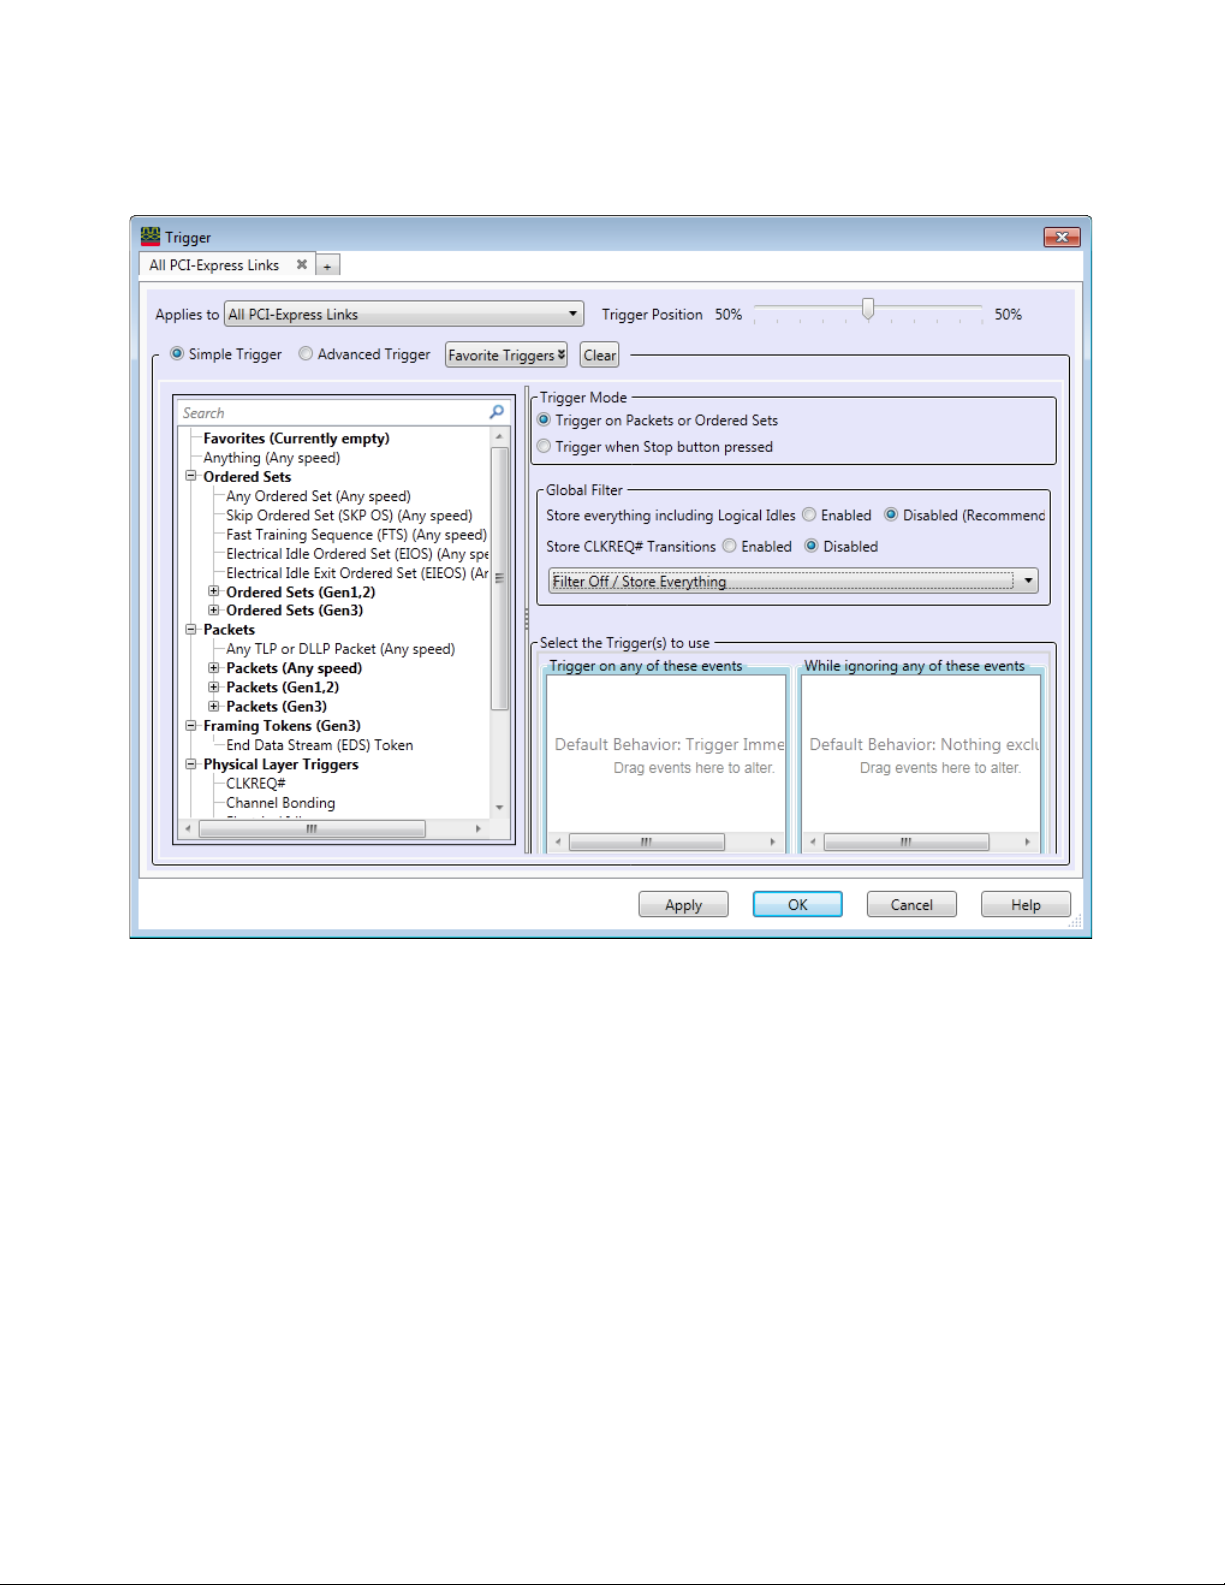
Setting Up Triggers 6
a Select the Simple Trigger option.
b Select the Trigger on Packets or Ordered Sets Trigger Mode option.
(The Trigger when Stop button is pressed Trigger Mode option can be useful, for example, to see
the events that lead up to a stop, halt, etc.)
c From the Global Filter listbox, select the following options:
i From the Store everything including Logical Idles field, select whether you want to enable or
disable the storage of all types of ordered sets and packets including the logical idles in
the capture memory.
ii From the Store CLKREQ# Transitions field, select whether you want to enable or disable the
storage of the Reference Clock Request - CLKREQ# signal’s assertion and deassertion in
the capture memory. Enabling this storage allows you to capture and view CLKREQ#
related data exchanged for the L1.1 and L1.2 substates transitions.
iii If you disable the Store everything including logical idles field, then the Filter Off/ Store
Everything drop-down list is activated. From this list, you can select the types of ordered
sets and TLP/DLLP packets that you want to filter out from getting stored in analyzer
memory. The options selected from this list act as the storage qualifiers. The selected
types of ordered sets and packets are acquired but are not qualified to be stored in the
analyzer's memory. If you select the Filter Everything option from this list, then none of
the acquired samples will qualify to be stored in the analyzer memory. As a result,
analyzer will keep running and you need to stop it manually because analyzer keeps
Keysight U4301 PCIe Gen3 Analyzer User’s Guide 57
Page 58
6 Setting Up Triggers
NOTE
acquiring data until the memory depth is full. If you do not select any option from the list,
then the filtering is considered Off and all the acquired data is stored in memory when the
trigger condition is met.
d Drag events you would like to trigger on from the left-side pane to the Trigger on any of these
events box.
The left-side pane contains an event hierarchy that can be expanded or collapsed.
To edit events in the trigger box, click the underlined event name.
To remove events from the trigger box, click the "X" to the left of the event name.
e Drag events you'd like to exclude from the trigger to the While ignoring any of these events box.
f Click Apply or OK.
Triggering on L1 Substates
In the Trigger dialog box, you can use the CLKREQ# event under the Physical Layer Triggers
group to set up a trigger on assertion, deassertion, or changes in the CLKREQ# signal.
To trigger on CLKREQ#, the Store CLKREQ# Transitions field must be set to Enabled.
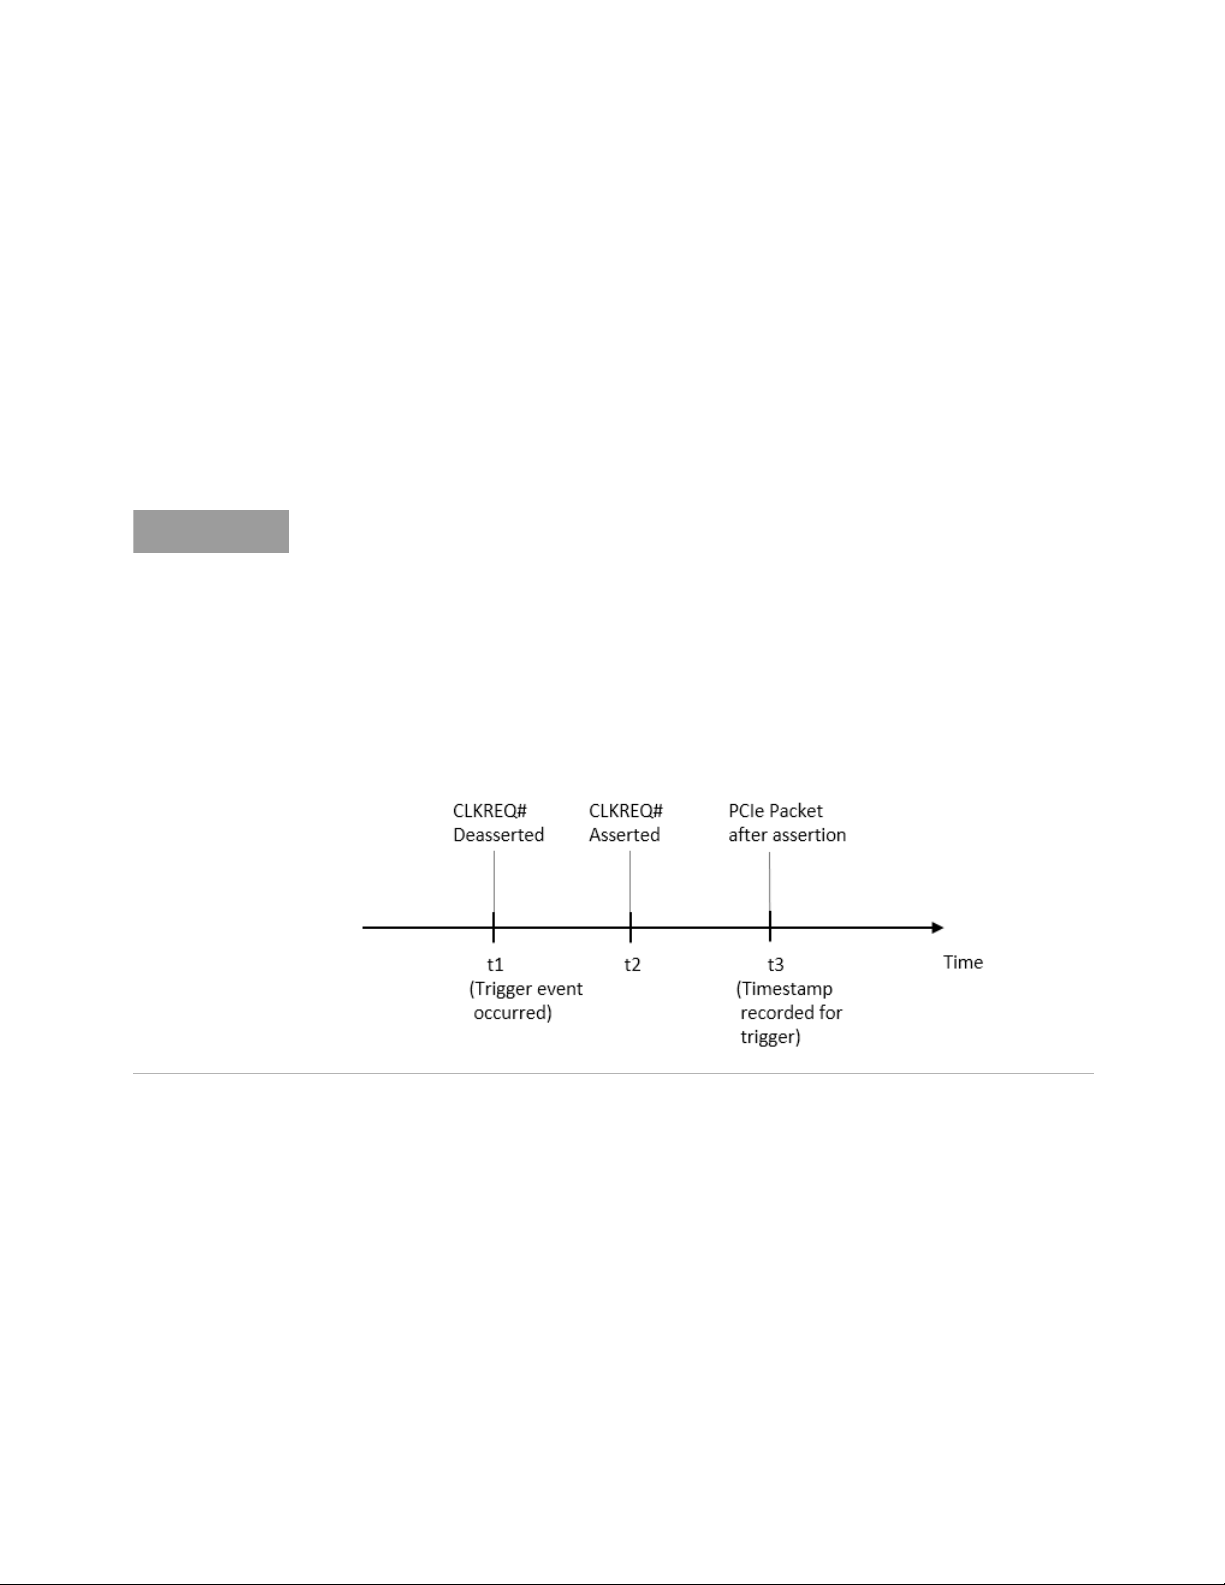
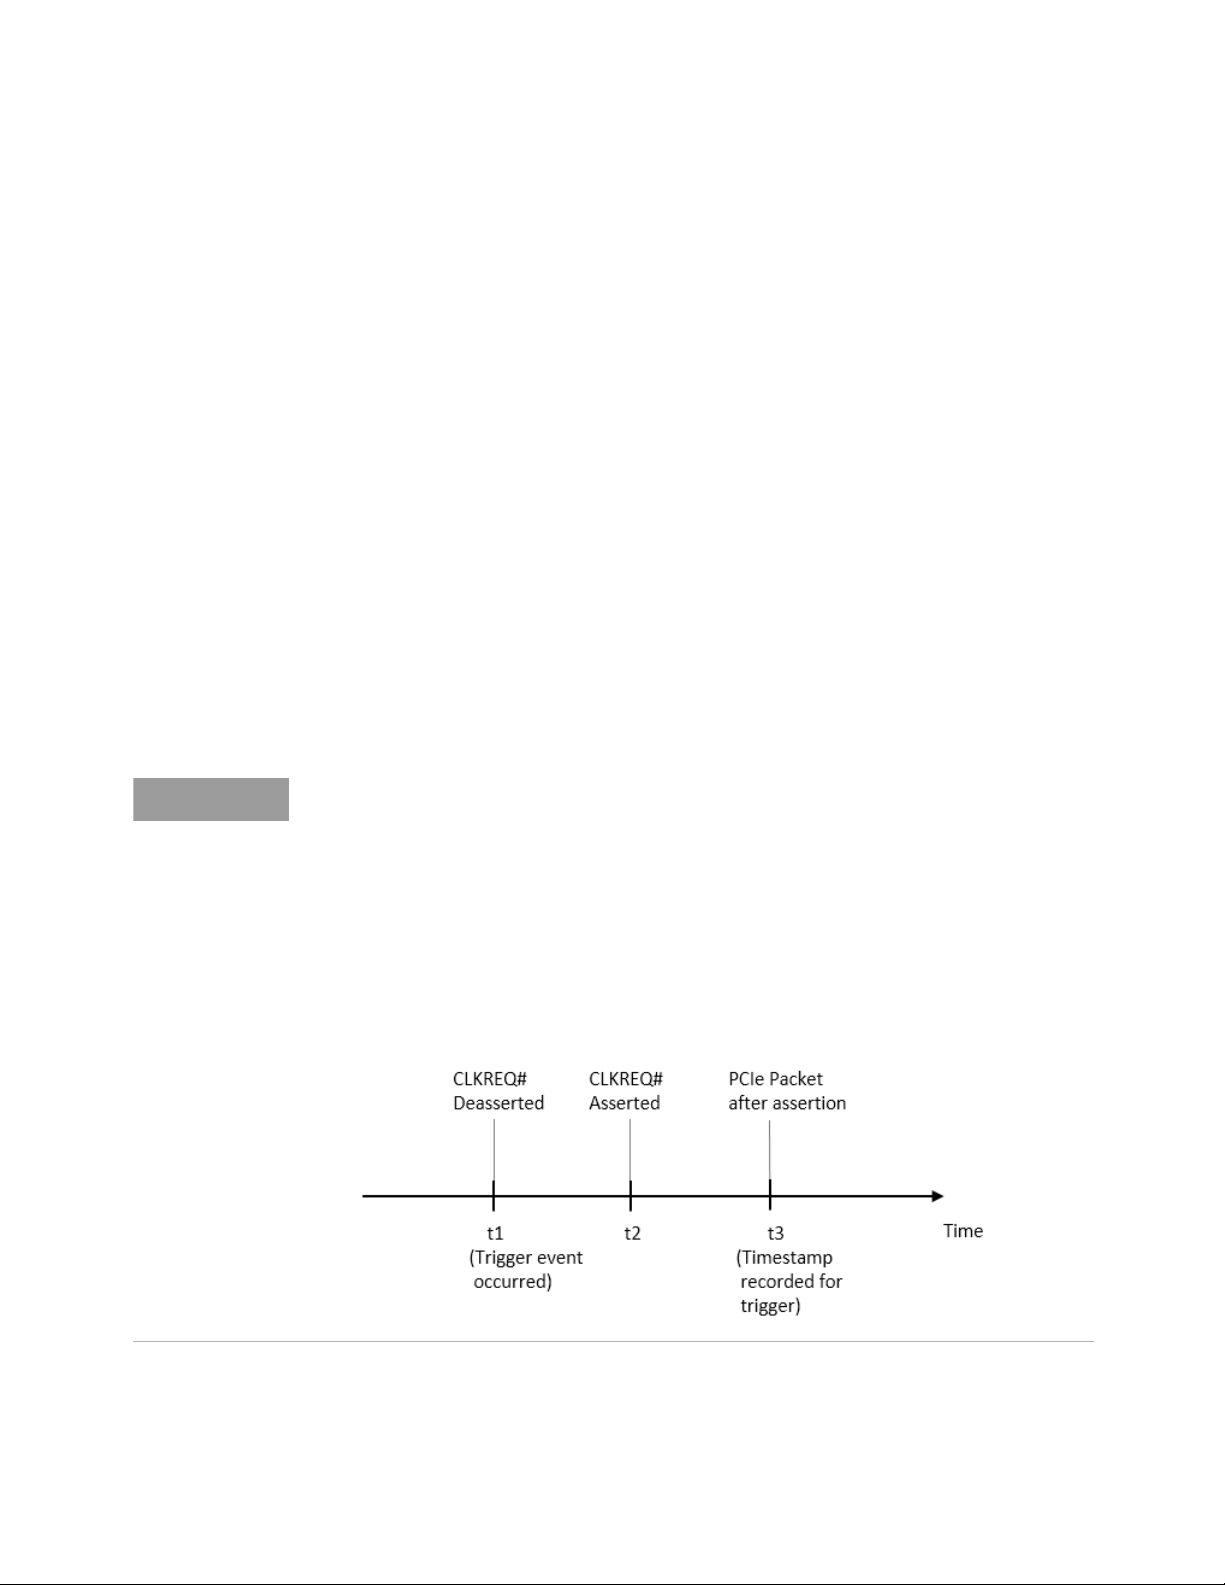
When CLKREQ# is used as the trigger event, the U4301 module triggers on encountering the
CLKREQ# asserted/deasserted packet (as the case maybe as per the trigger condition). The
timestamp of this trigger is recorded and displayed as the time of the first PCIe packet seen
after sampling the CLKREQ# assertion. The following figure illustrates an example of
triggering on the deassertion of the CLKREQ# signal.
See Also • “To select which links the trigger is for" on page 64
• “To set the trigger position" on page 64
• “To save/recall favorite triggers" on page 64
• “To clear the current trigger" on page 65
58 Keysight U4301 PCIe Gen3 Analyzer User’s Guide
Page 59
Setting Up Advanced Triggers
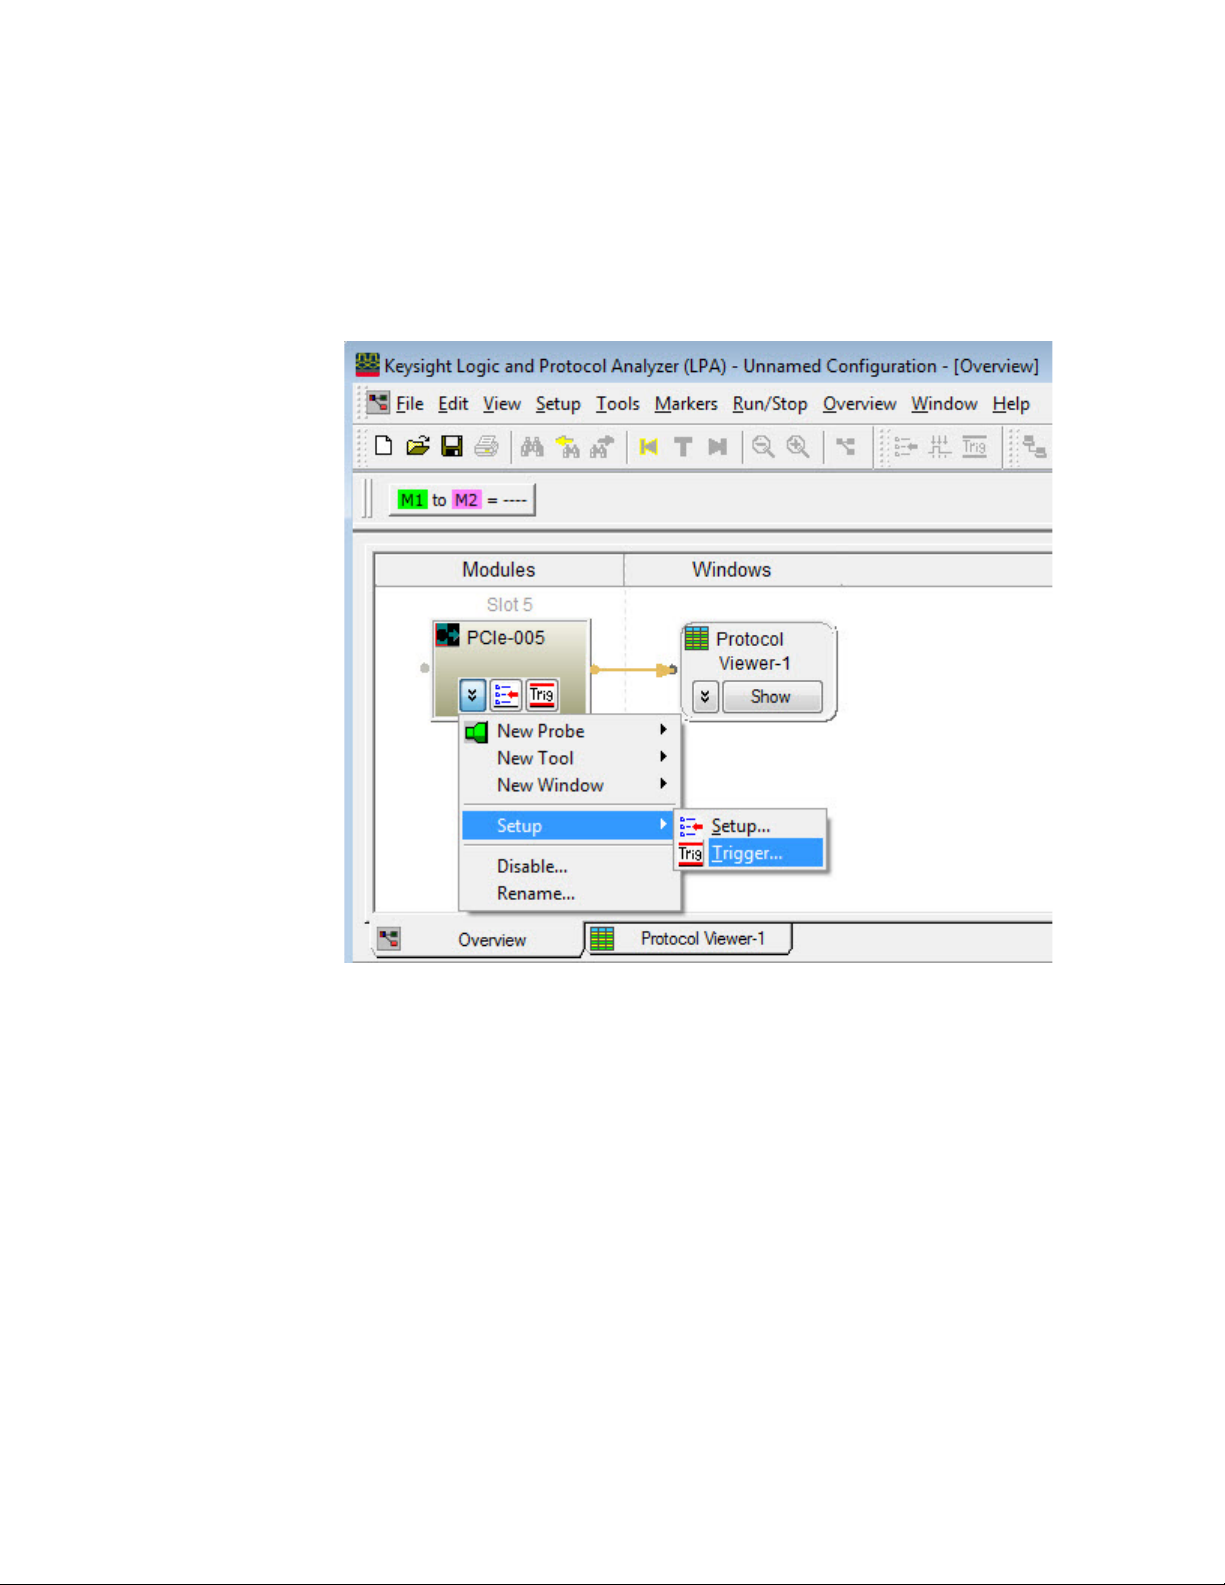
1In the Keysight Logic Analyzer application's Overview window, from the PCIe analyzer module's
drop-down menu, select Setup>Trigger....
Setting Up Triggers 6
2 In the Trigger dialog:
Keysight U4301 PCIe Gen3 Analyzer User’s Guide 59
Page 60
6 Setting Up Triggers
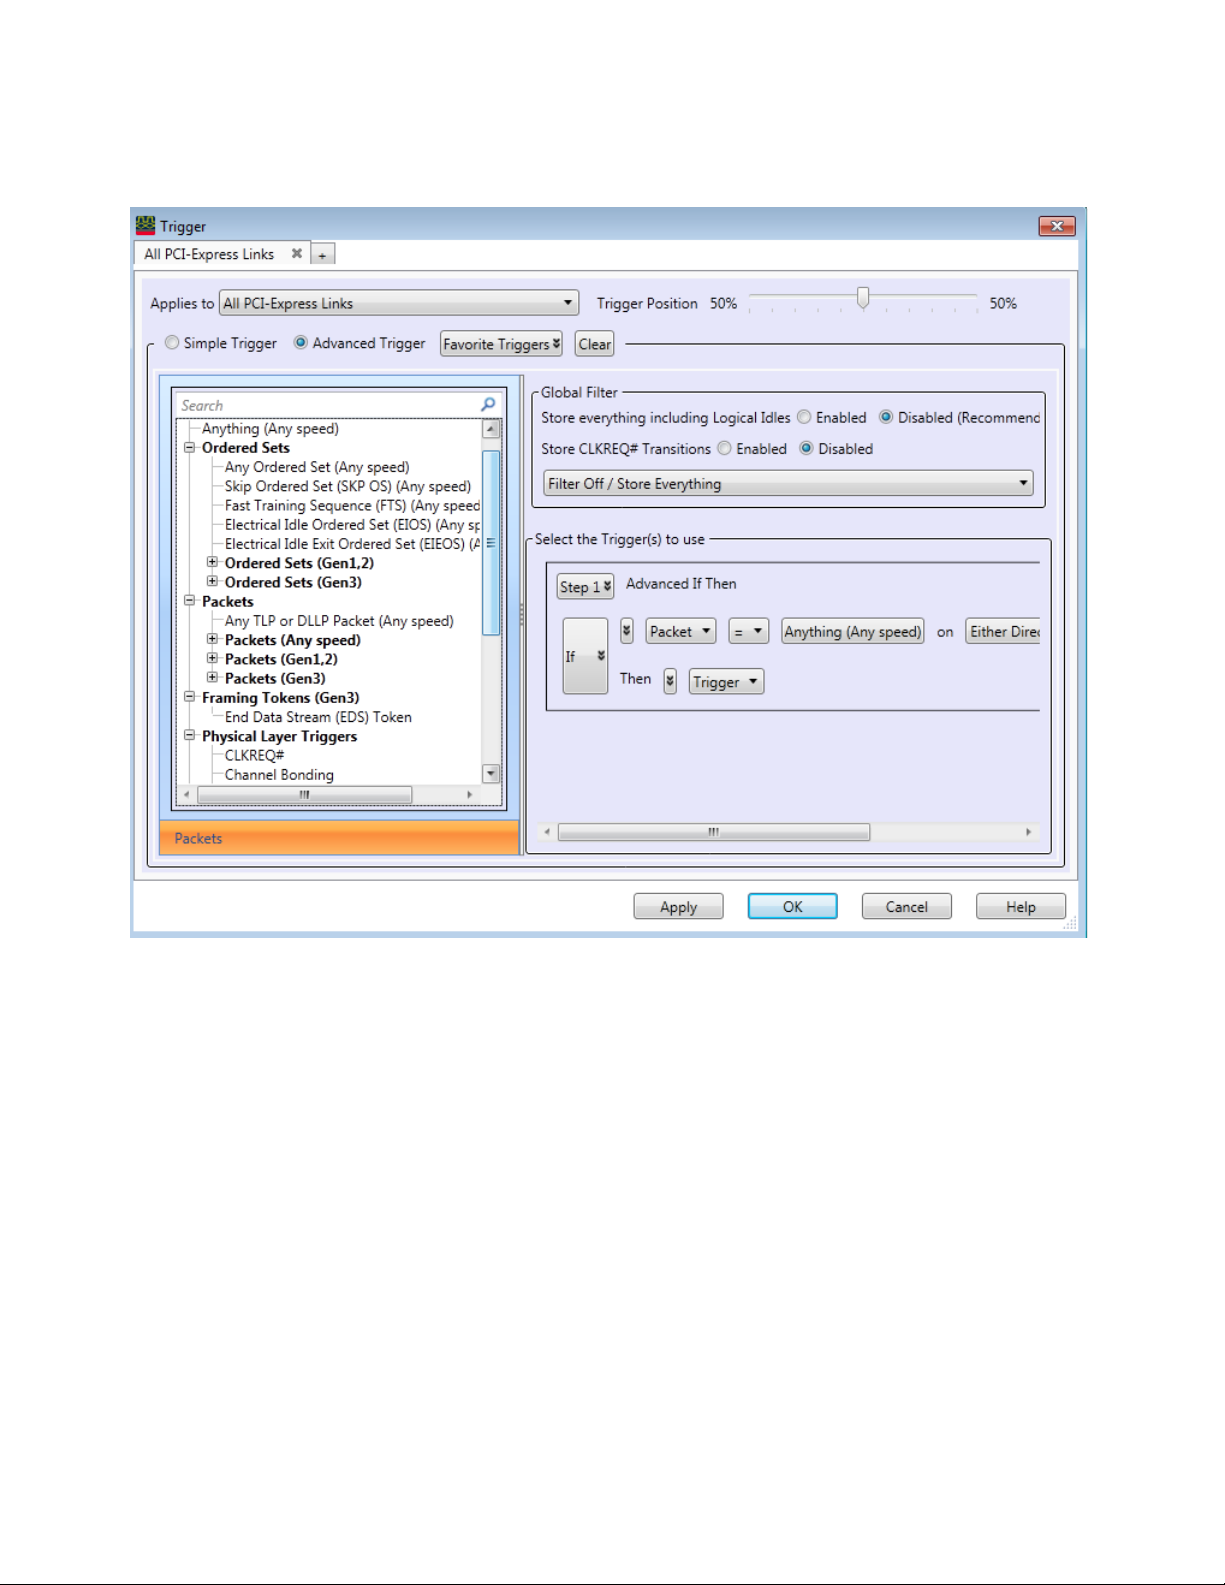
a Select the Advanced Trigger option.
b From the Global Filter listbox, select the following options:
i From the Store everything including Logical Idles field, select whether you want to enable or
disable the storage of all types of ordered sets and packets including the logical idles in
the capture memory.
ii From the Store CLKREQ# Transitions field, select whether you want to enable or disable the
storage of the Reference Clock Request - CLKREQ# signal’s assertion and deassertion in
the capture memory. Enabling this storage allows you to capture and view CLKREQ#
related data exchanged for the L1.1 and L1.2 substates transitions.
iii If you disable the Store everything including logical idles field, then the Filter Off/ Store
Everything drop-down list is activated. From this list, you can select the types of ordered
sets and TLP/DLLP packets that you want to filter out from getting stored in analyzer
memory. The options selected from this list act as the storage qualifiers. The selected
types of ordered sets and packets are acquired but are not qualified to be stored in the
analyzer's memory. If you select the Filter Everything option from this list, then none of
the acquired samples will qualify to be stored in the analyzer memory. As a result,
analyzer will keep running and you need to stop it manually because analyzer keeps
acquiring data until the memory depth is full. If you do not select any option from the list,
60 Keysight U4301 PCIe Gen3 Analyzer User’s Guide
Page 61
Setting Up Triggers 6
NOTE
then the filtering is considered Off and all the acquired data is stored in memory when the
trigger condition is met.
d Drag events you'd like to trigger on from the left-side pane to sequence steps in the Select the
Trigger(s) to use box.
The left-side pane contains an event hierarchy that can be expanded or collapsed. (This is the
same event hierarchy displayed in the simple trigger dialog.)
To edit events in the trigger box, click the event button.
To remove events from the trigger box, click the sequence step buttons.
e In the Select the Trigger(s) to use box, click buttons, make drop-down selections, and enter
values in fields to edit the steps in the trigger sequence:
• The Step buttons let you insert or delete steps.
• The If/Else if buttons let you insert or delete "if" clauses.
• The event chevron buttons let you insert, delete, or logically group (or negate) events.
• The direction drop-down listbox is displayed if you configured the U4301A/B module's
connection setup as a bidirectional setup. It lets you select the direction (upstream or
downstream) applicable for the trigger sequence. For a unidirectional data capture setup,
this listbox is not displayed.
• The action chevron buttons let you insert or delete actions.
• Use the Comment fields to document your advanced triggers.
f Click Apply or OK.
Triggering on L1 Substates
In the Trigger dialog box, you can use the CLKREQ# event under the Physical Layer Triggers
group to set up a trigger on assertion, deassertion, or changes in the CLKREQ# signal.
To trigger on CLKREQ#, the Store CLKREQ# Transitions field must be set to Enabled.
When CLKREQ# is used as the trigger event, the U4301 module triggers on encountering the
CLKREQ# asserted/deasserted packet (as the case maybe as per the trigger condition). The
timestamp of this trigger is recorded and displayed as the time of the first PCIe packet seen
after sampling the CLKREQ# assertion. The following figure illustrates an example of
triggering on the deassertion of the CLKREQ# signal.
Keysight U4301 PCIe Gen3 Analyzer User’s Guide 61
Page 62
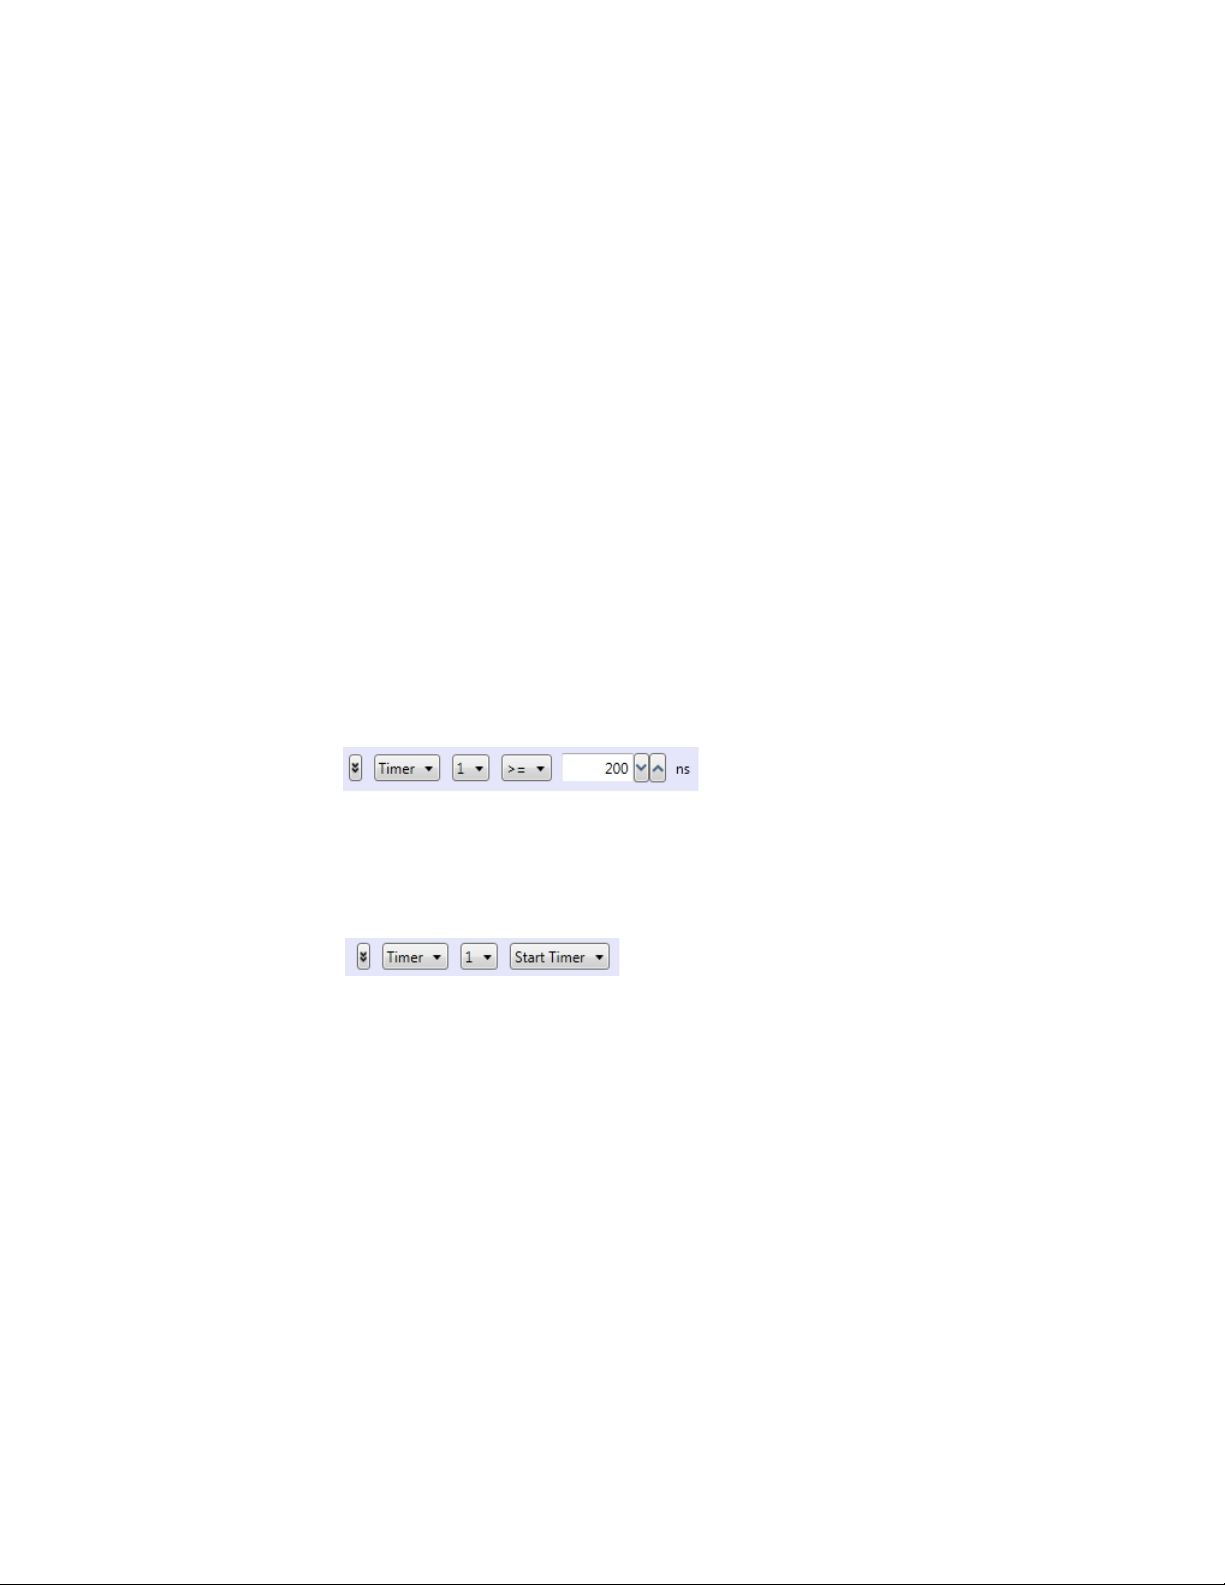
6 Setting Up Triggers
Using Timers in Advanced Triggers
You can use timers in events and actions of sequence step(s) of an advanced trigger setup. The
following section describes the purpose and usage of timers in a trigger setup.
In a trigger setup, timers are used to check the amount of time that has elapsed between events. For
example, if you want to trigger on a Memory Read packet that occurred within 500 ns of a Memory
write packet, you can use a timer.
When using timers in a U4301 trigger setup, following are some points to remember:
• Timers do not start automatically. You need to start a timer by using the Start Timer action in the
trigger setup before you can use the timer to check time condition in an event statement. (Refer
to the timer example given below in this topic)
• Starting a timer does not reset the timer. It only starts/restarts the timer from its existing count.
Therefore, you should reset the timer before starting it to get accurate triggering results. You use
the Reset and Stop Timer action to accomplish this. (Refer to the timer example given below in
this topic)
• The U4301 module provides two timers, Timer 1 and 2. Ensure that you use the correct timer in
both event and action.
To insert a timer in an event statement
1Drag the Timer event from the events list on the left of the Trigger dialog and drop it to the event
statement on the right.
2 Select the timer operator (>= or <) and timer value.
To insert a timer action
1Drag the Timer event from the events list on the left of the Trigger dialog and drop it to the action
statement on the right.
2 Select the timer action Start Timer or Reset and Stop Timer.
Timer Example
The following example illustrates the usage of a timer to trigger on a Memory Read packet that
occurred within 500 ns after a Memory write packet.
In step 1, the Timer 1 is first reset and then started when the event condition (Memory Write packet
in the Downstream direction) is met. In step 2, the Timer 1 is tested to check if a Memory Read
packet in the Downstream direction occurred within 500 ns. If the condition is met, the module is
triggered to start capture else the timer keeps running till it exceeds 500 ns without triggering. On
exceeding 500 ns without triggering, the Else If statement is executed to take the sequential flow of
the trigger back to step 1 to again start looking for a Memory Write packet in the Downstream
direction.
62 Keysight U4301 PCIe Gen3 Analyzer User’s Guide
Page 63
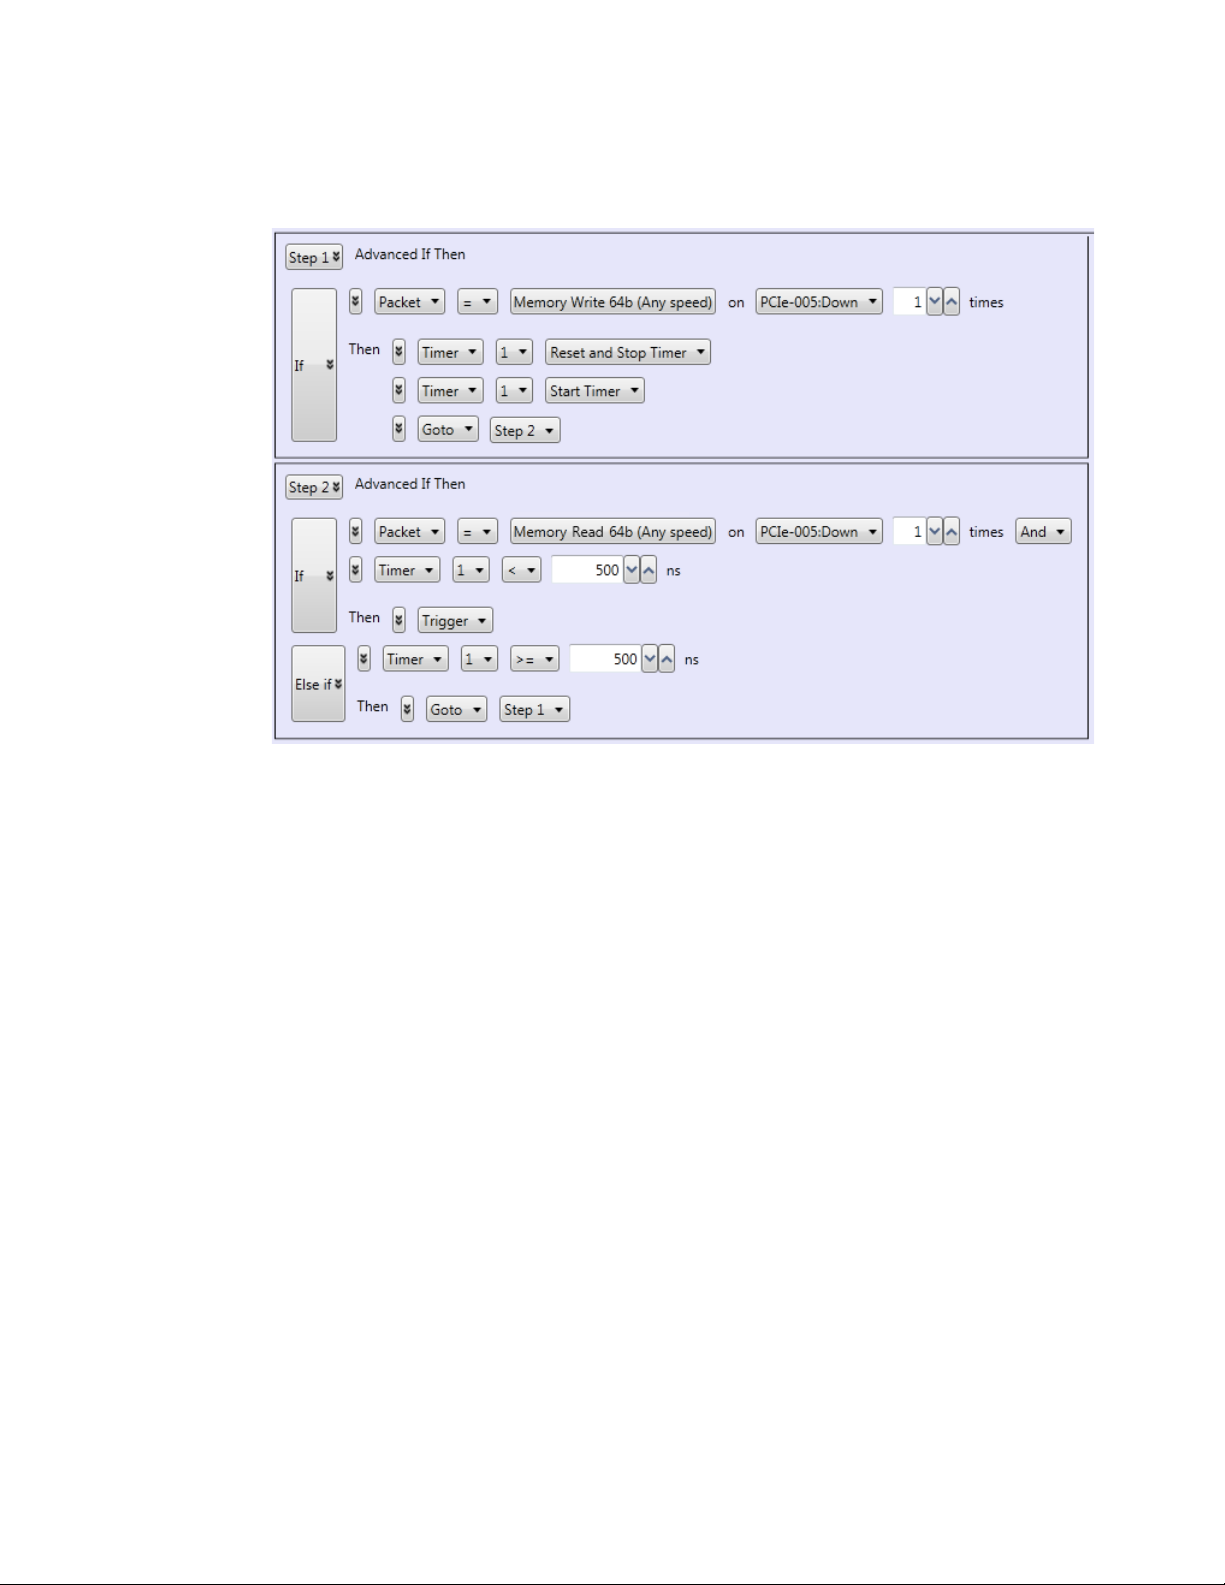
Setting Up Triggers 6
See Also • “To select which links the trigger is for" on page 64
• “To set the trigger position" on page 64
• “To save/recall favorite triggers" on page 64
• “To clear the current trigger" on page 65
Keysight U4301 PCIe Gen3 Analyzer User’s Guide 63
Page 64
6 Setting Up Triggers
Setting General Trigger Options
The top part of the Trigger dialog contains general options that apply to both simple and advanced
triggers.
• “To select which links the trigger is for" on page 64
• “To set the trigger position" on page 64
• “To save/recall favorite triggers" on page 64
• “To clear the current trigger" on page 65
To select which links the trigger is for
The top of the Trigger dialog has tabs that let you set up separate triggers for different links. You can
add tabs for separate triggers and apply them to the links that are set up in the Connection Setup
dialog (see “Specifying the Connection Setup”).
To set the trigger position
The top of the Trigger dialog has a slider for setting the trigger position within the capture memory.
Note that the pre-trigger portion of the capture memory is filled before searching for the trigger.
To save/recall favorite triggers
The top of the Trigger dialog has a Favorite Triggers drop-down menu for saving trigger setups and
recalling previously saved trigger setups.
Do not confuse these "favorite" triggers with the favorites that appear in the left-side pane (which are
added using the Event Editor dialog).
64 Keysight U4301 PCIe Gen3 Analyzer User’s Guide
Page 65
To clear the current trigger
The top of the Trigger dialog has a Clear button for erasing the current trigger setup and restoring the
default trigger setup.
Setting Up Triggers 6
Keysight U4301 PCIe Gen3 Analyzer User’s Guide 65
Page 66
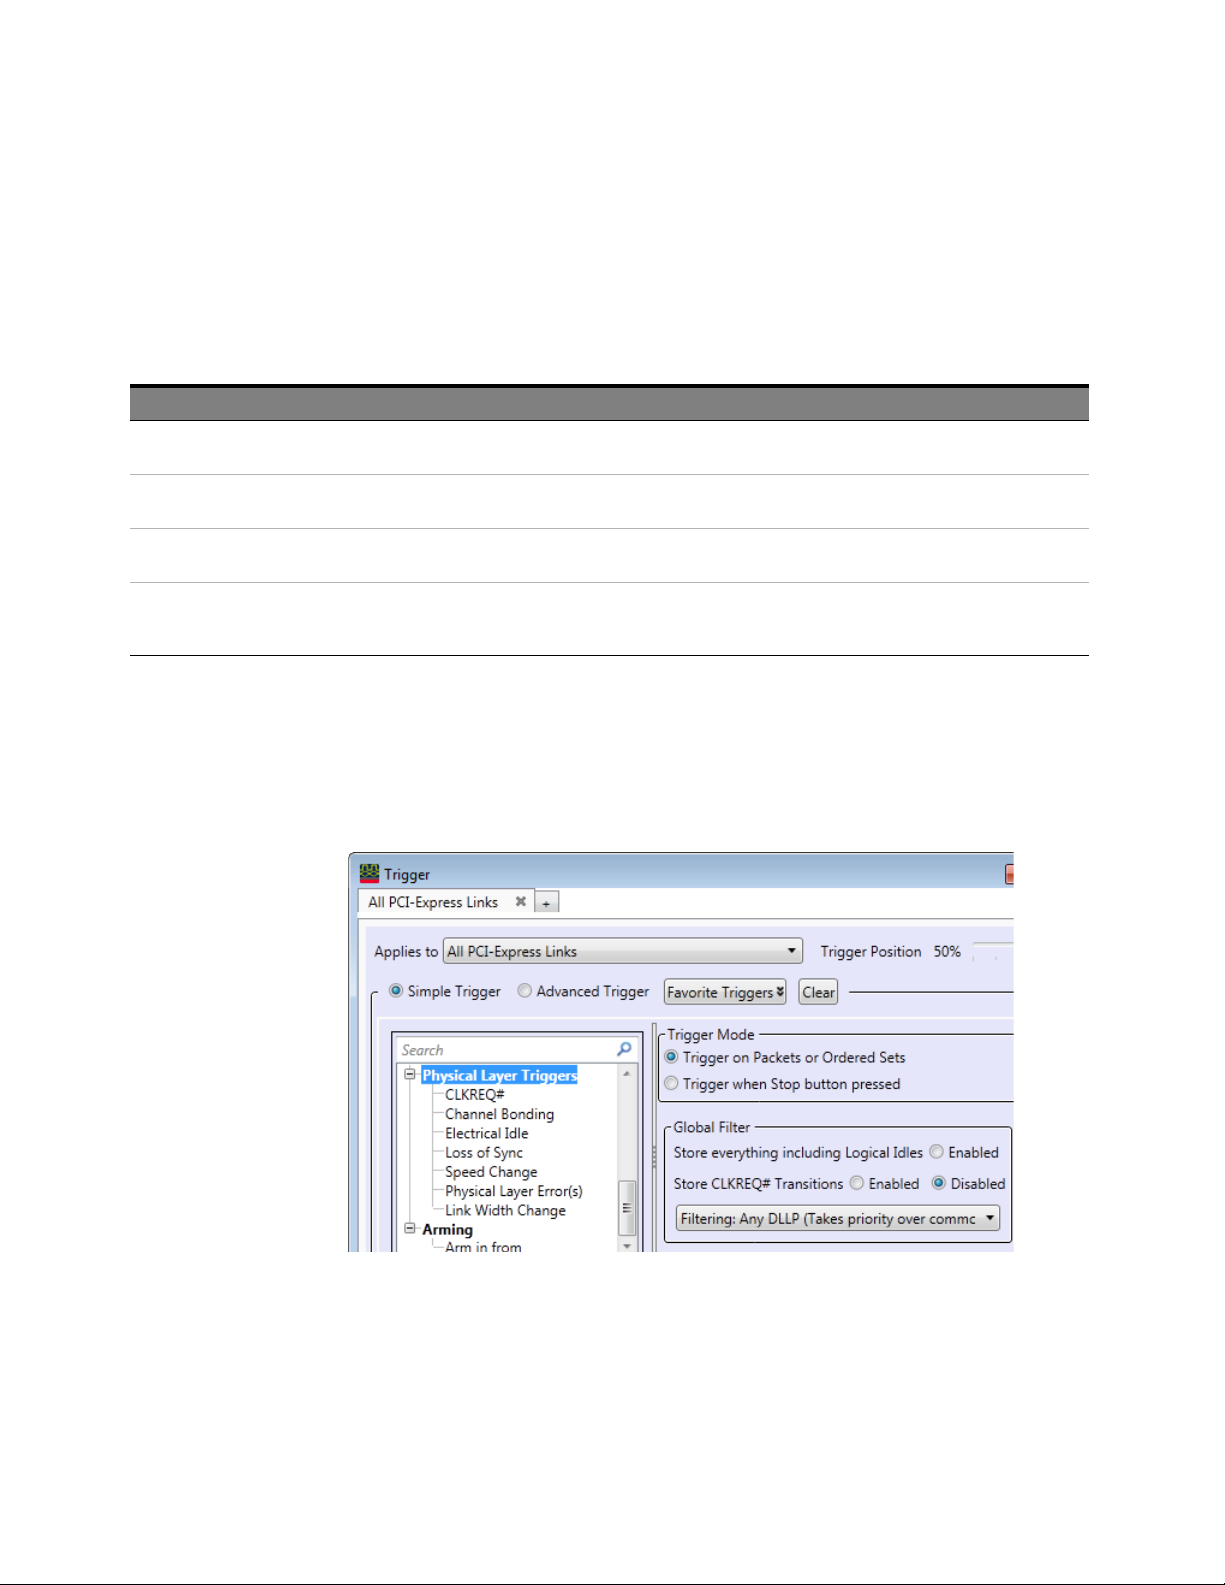
6 Setting Up Triggers
Setting up a Trigger on Physical Layer Errors
Physical Layer Errors Supported for Triggering
The U4301 Analyzer supports the following physical layer error types to allow you to set up a trigger
on error.
Physical Layer Error Occurrence of Trigger on Error
Symbol Error
(Applicable for Gen1 and Gen2 speeds)
Disparity Error
(Applicable for Gen1 and Gen2 speeds)
Block Header Error
(Applicable only for Gen3 speed)
Idle Symbol Error
(Applicable for Gen1, Gen2, and Gen3
speeds)
To set up a trigger on error
For a simple trigger
1In the Trigger dialog box, select the Simple Trigger radio button.
2 From the list of trigger events displayed in the left-side pane, expand the Physical Layer Triggers
events category.
On encountering an invalid symbol
On encountering an incorrect disparity
On encountering an error in Sync bits (start of block)
On encountering data other than Idle symbol during logical idle on an active lane.
3 Drag and drop the Physical Layer Error(s) event from the left-side to the Select the Trigger(s) to use
section on the right. By using this event, you set up trigger on all the supported physical layer
errors (described in the table above).
66 Keysight U4301 PCIe Gen3 Analyzer User’s Guide
Page 67
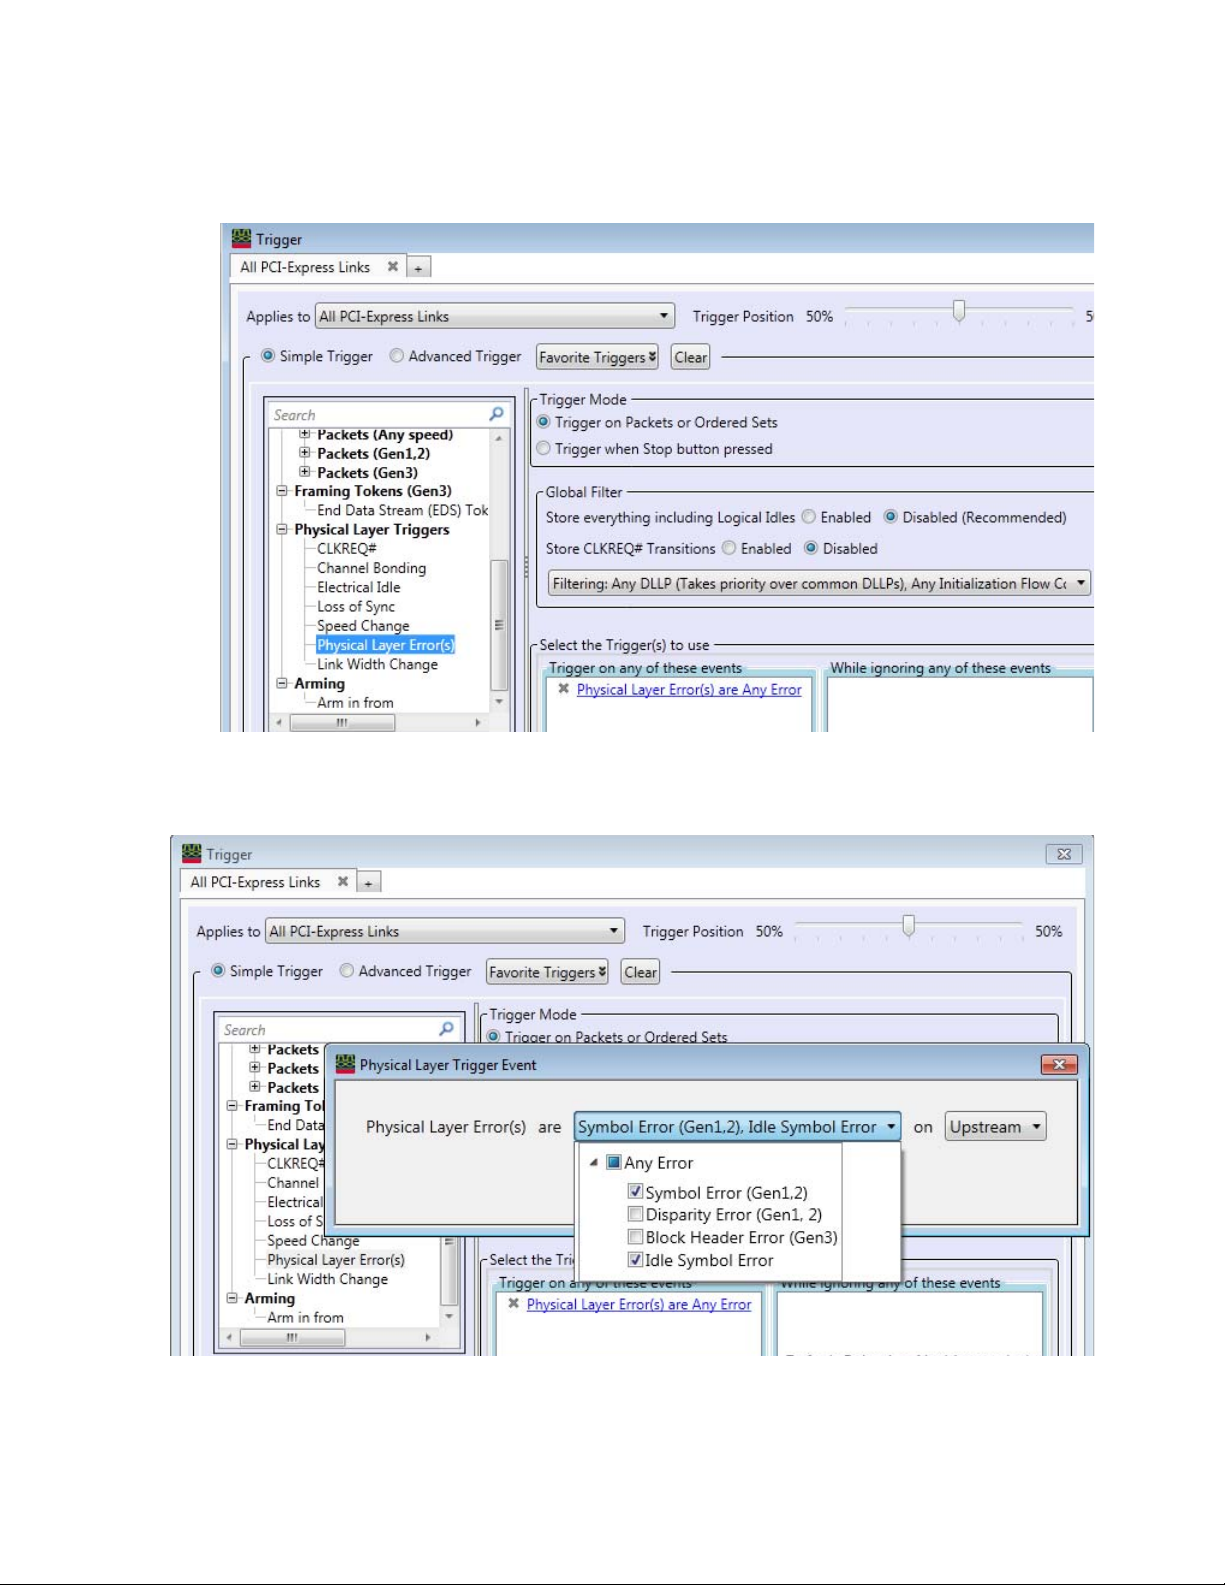
Setting Up Triggers 6
4 If you want to set up trigger on specific physical layer error type(s) only, you can click the added
event - Physical Layer Error(s) on Any Error and then select/deselect the physical layer errors on
which you want to set up a trigger.
5Click OK to reflect your error selections in the trigger event.
6Click Apply and then OK to complete the trigger on error setup.
For an advanced trigger
Keysight U4301 PCIe Gen3 Analyzer User’s Guide 67
Page 68
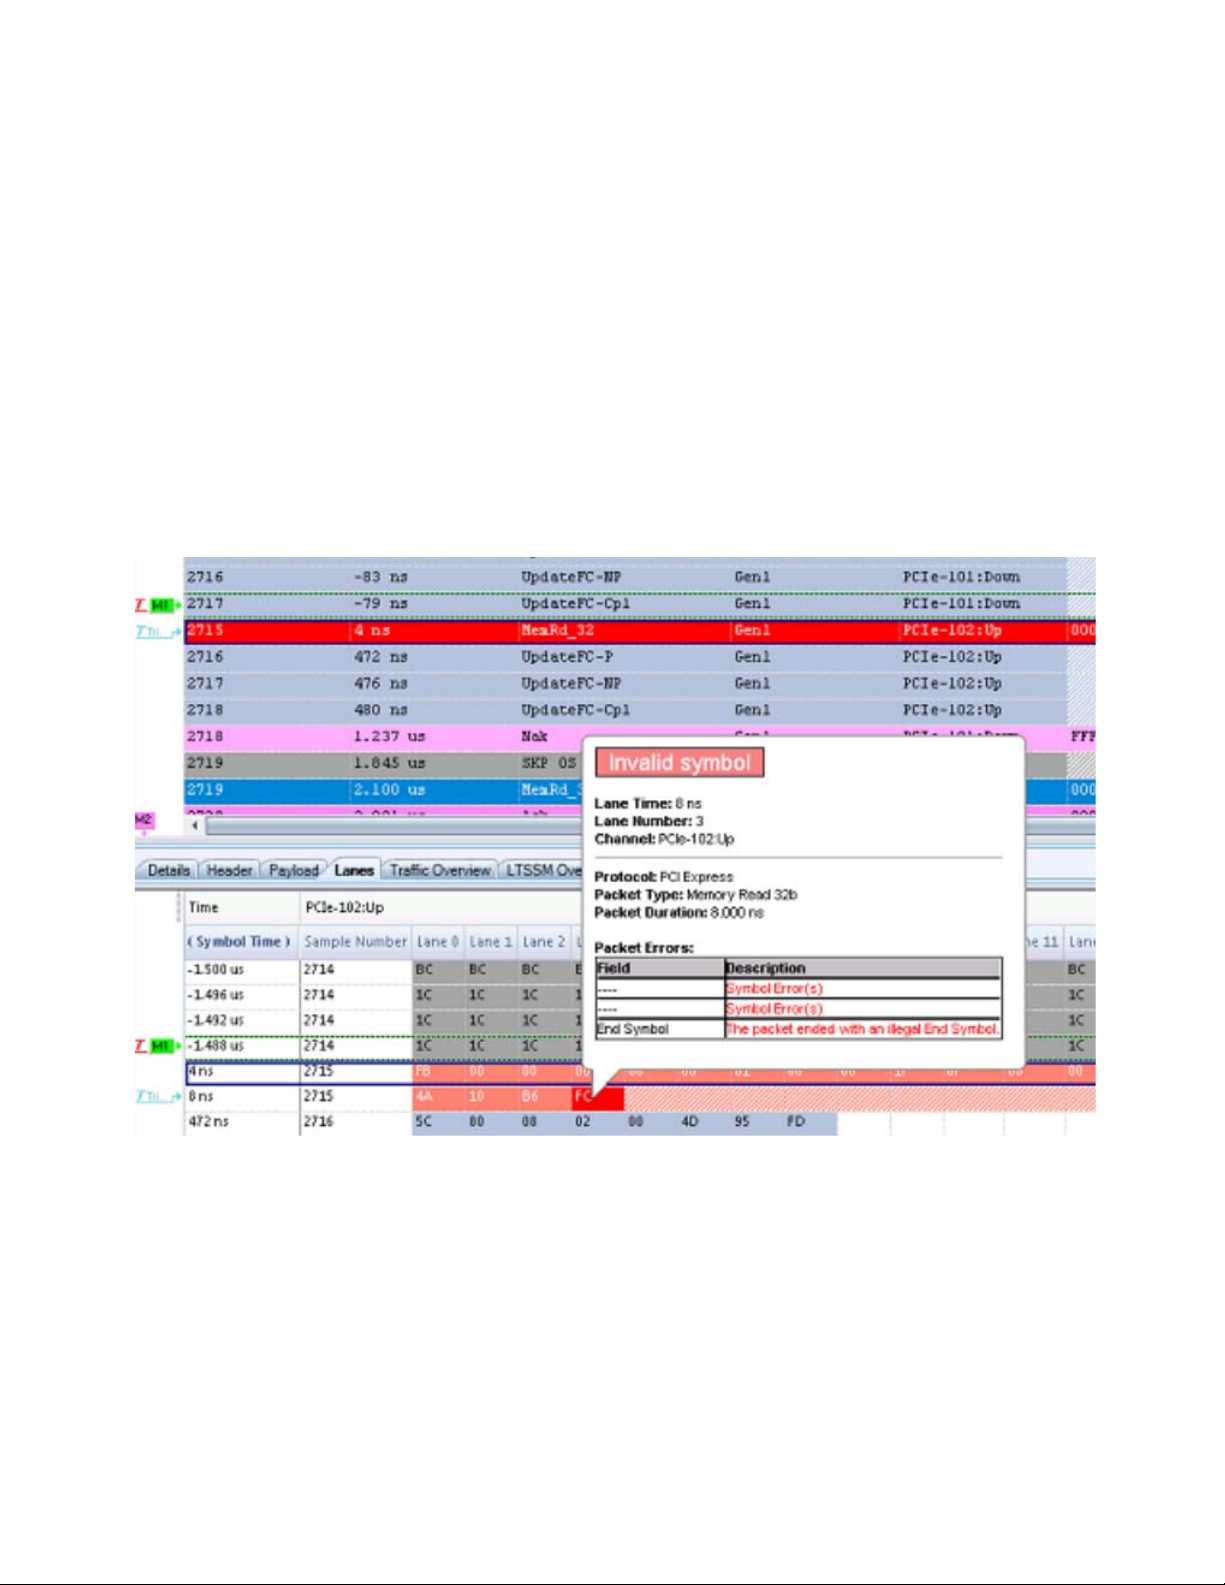
6 Setting Up Triggers
To view the Trigger on Error and Errored Packet
Symbol Error Example
The support for triggering on errors in an advanced trigger is the same as that available in a simple
trigger. You can drag and drop the Physical Layer Error(s) event in a step in an advanced trigger and
set the action when the trigger on error occurs.
This topic provides some examples of how to view the trigger on error and errorred packets in the
Protocol viewer after completing the trigger setup and running the Analyzer to capture data. It also
describes the situations when the errored packet may not be visible in the Protocol Viewer even
though the Analyzer triggered on the selected physical layer error(s).
In the following example, the Analyzer is triggered on encountering a packet ending with an illegal
END symbol. The Trigger on error position and errored packet are highlighted in the screen below.
Disparity Error Example
The following example displays a trigger on encountering a packet with an incorrect disparity.
68 Keysight U4301 PCIe Gen3 Analyzer User’s Guide
Page 69
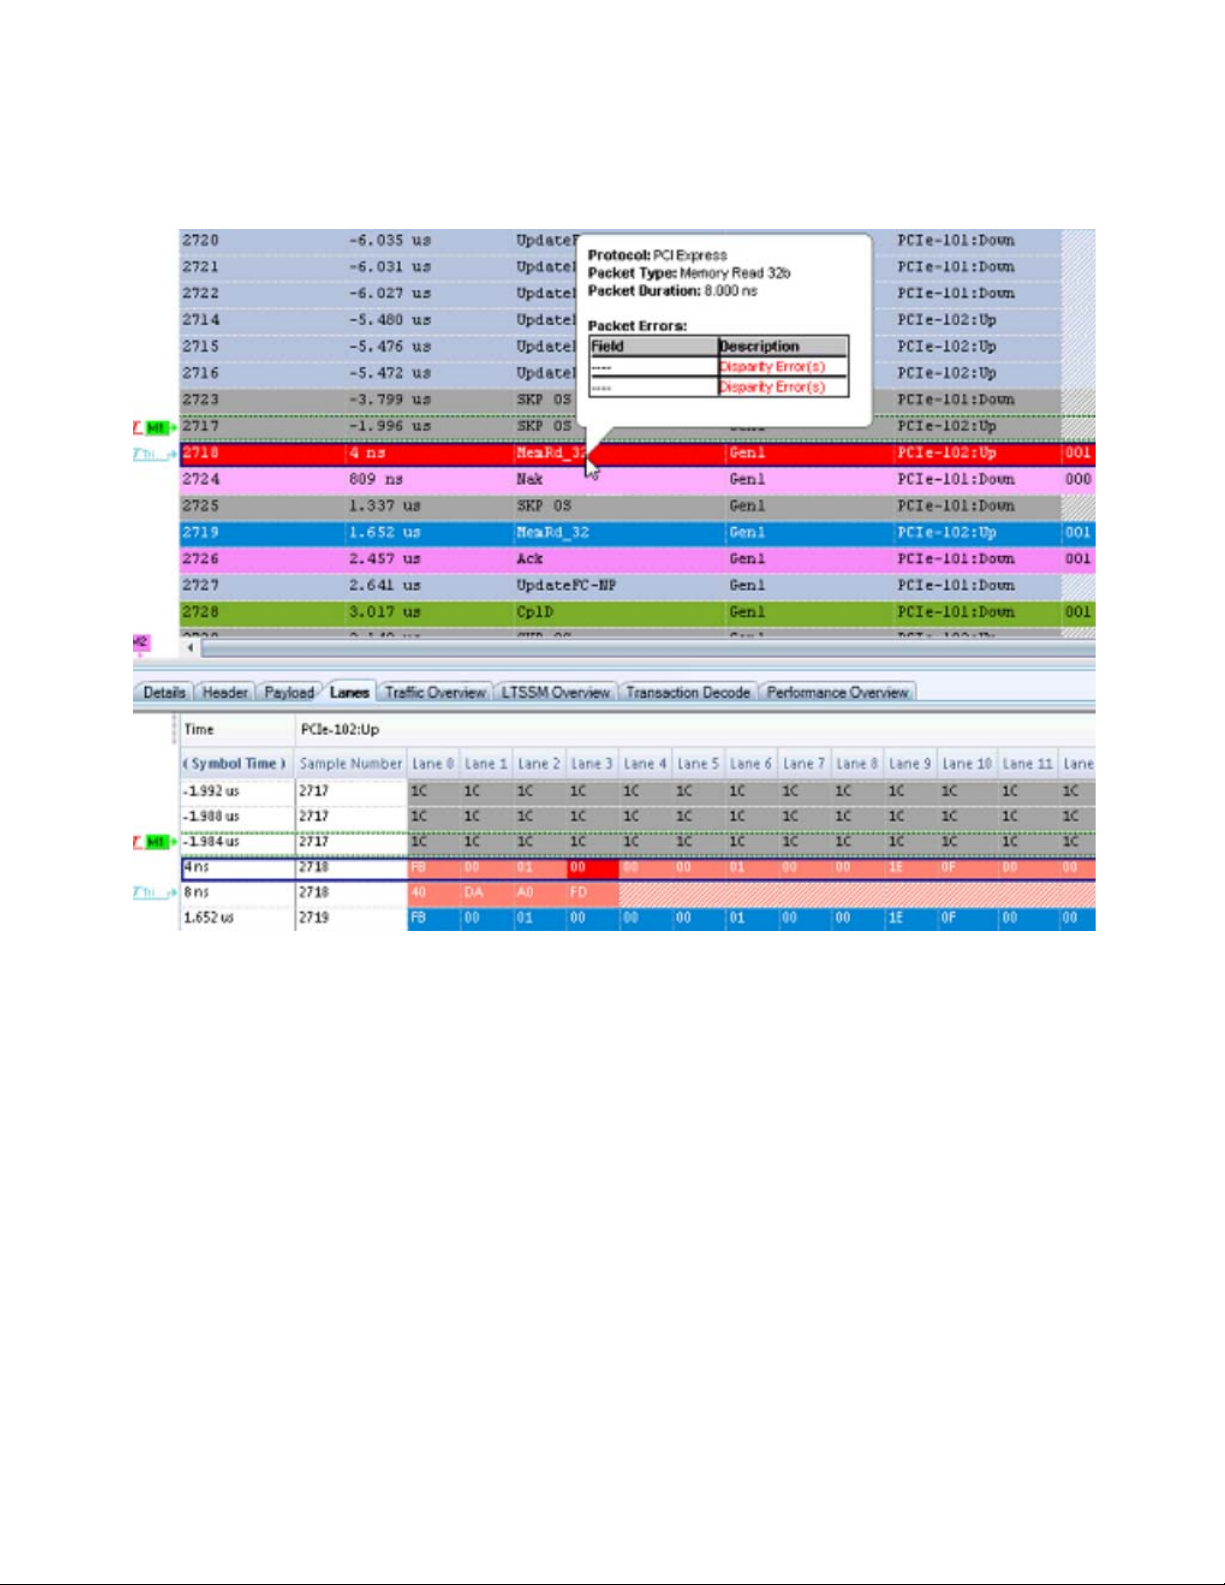
Setting Up Triggers 6
Idle Symbol Error Example
In the following example, the Idle Symbol error is generated and the Analyzer is triggered on
encountering this error event. Though the trigger occurred on encountering the error, the errored
packet is not captured and not available in the Protocol Viewer. In this example, this happened
because the errored packet occurred during Logical Idle and due to disabling of the Logical Idles
storage in the Trigger setup, this packet did not get stored. However, there may be other reasons for
an errored packet not appearing in the Protocol Viewer even when the trigger on error occurred. The
next topic describes the possible reasons.
Keysight U4301 PCIe Gen3 Analyzer User’s Guide 69
Page 70
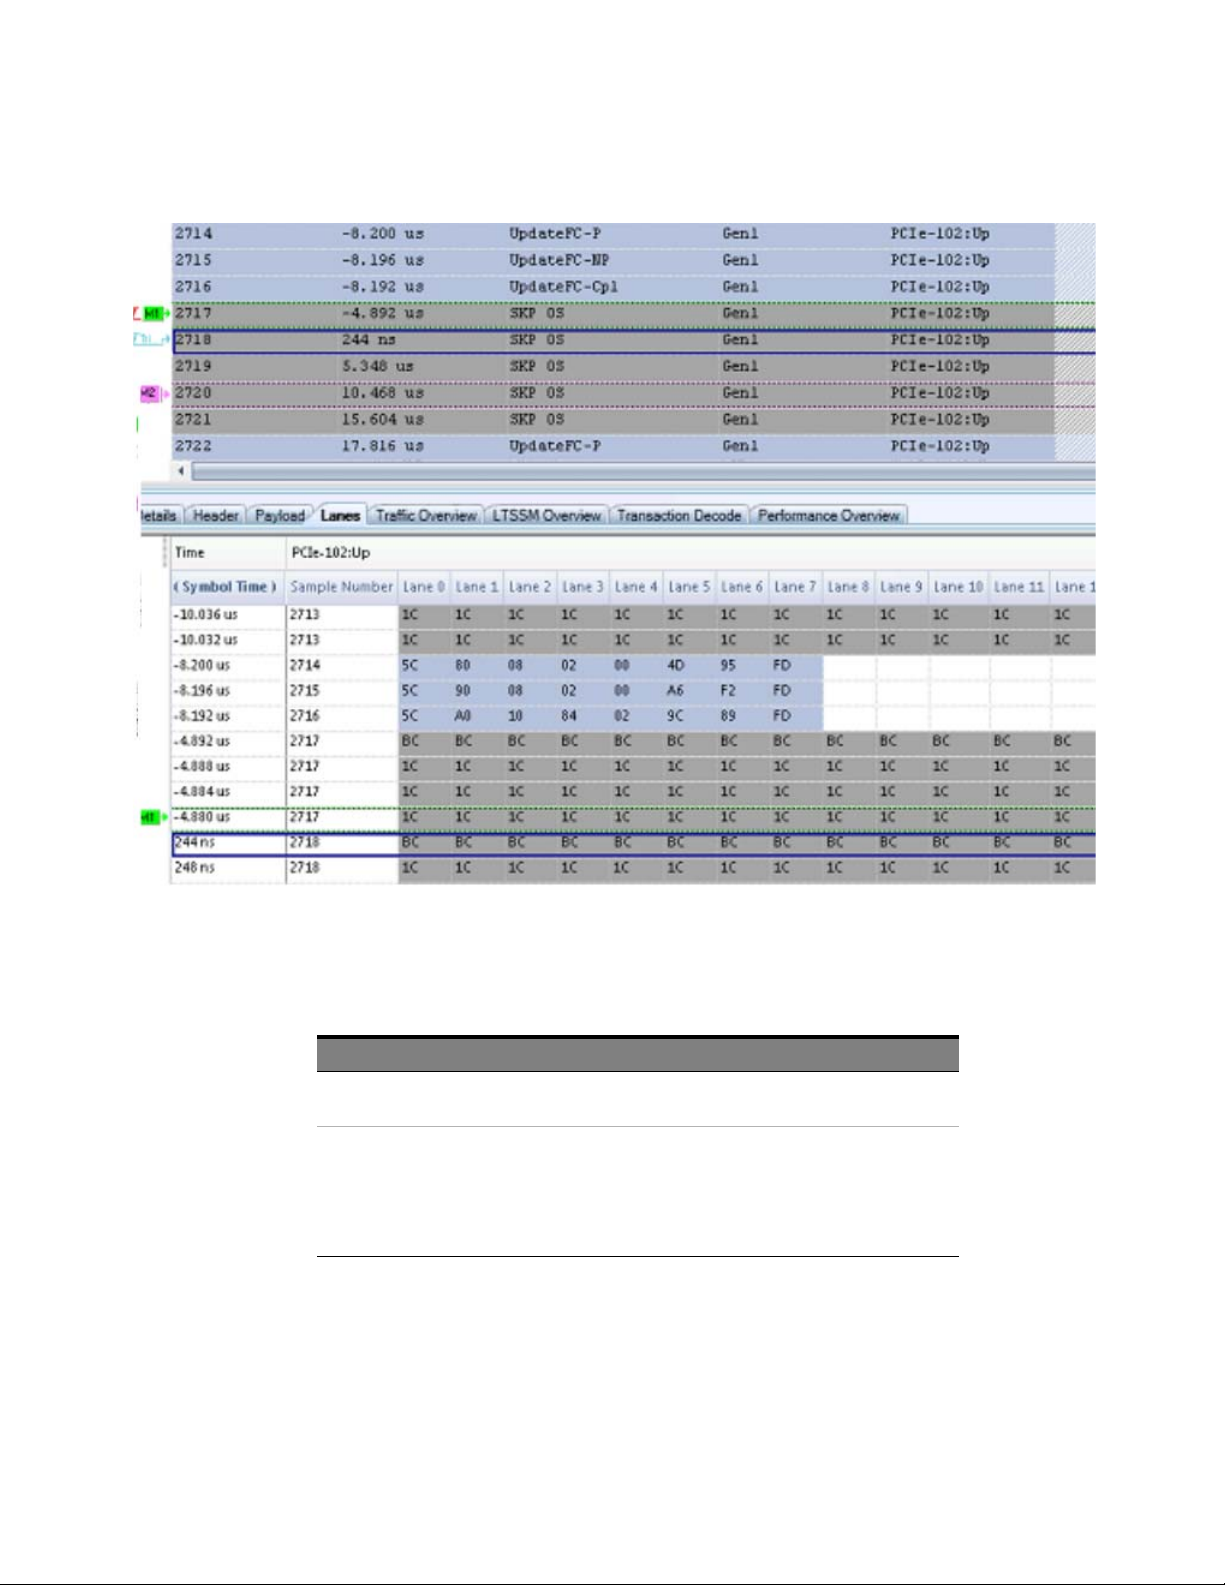
6 Setting Up Triggers
Possible Reasons for an Errored Packet not Appearing in the Protocol Viewer After the Trigger on Error Occurred
In case of an Idle Symbol error or a Block Header error, the trigger occurs on encountering the error
but you may not be able to see the errored data because of the reasons listed in the table below.
Reasons
The errored packet occurred during Logical Idle and you have not enabled Logical Idles storage in the Trigger
setup.
Even after enabling the Logical Idle storage, the errored packet may not get captured/displayed because:
• The U4301 Analyzer can store upto 10000 logical idle bytes. The errored packet may have occurred after
the Analyzer reached this limit resulting in this packet not getting stored.
• The error event may have occurred within one of the packets that is already being shown. If the error event
occurred outside a packet, then you can view the error data in the Lane view of the Protocol Viewer.
• The error event occurred between two packets and therefore cannot be shown.
70 Keysight U4301 PCIe Gen3 Analyzer User’s Guide
Page 71

Keysight U4301 PCIe Gen3 Analyzer
User’s Guide
7 Running/Stopping Captures
Running and stopping the U4301A/B PCIe Gen3 analyzer is just like running and stopping any other
analyzer. See "Running/Stopping Measurements" (in the online help).
Page 72

7 Running/Stopping Captures
72 Keysight U4301 PCIe Gen3 Analyzer User’s Guide
Page 73
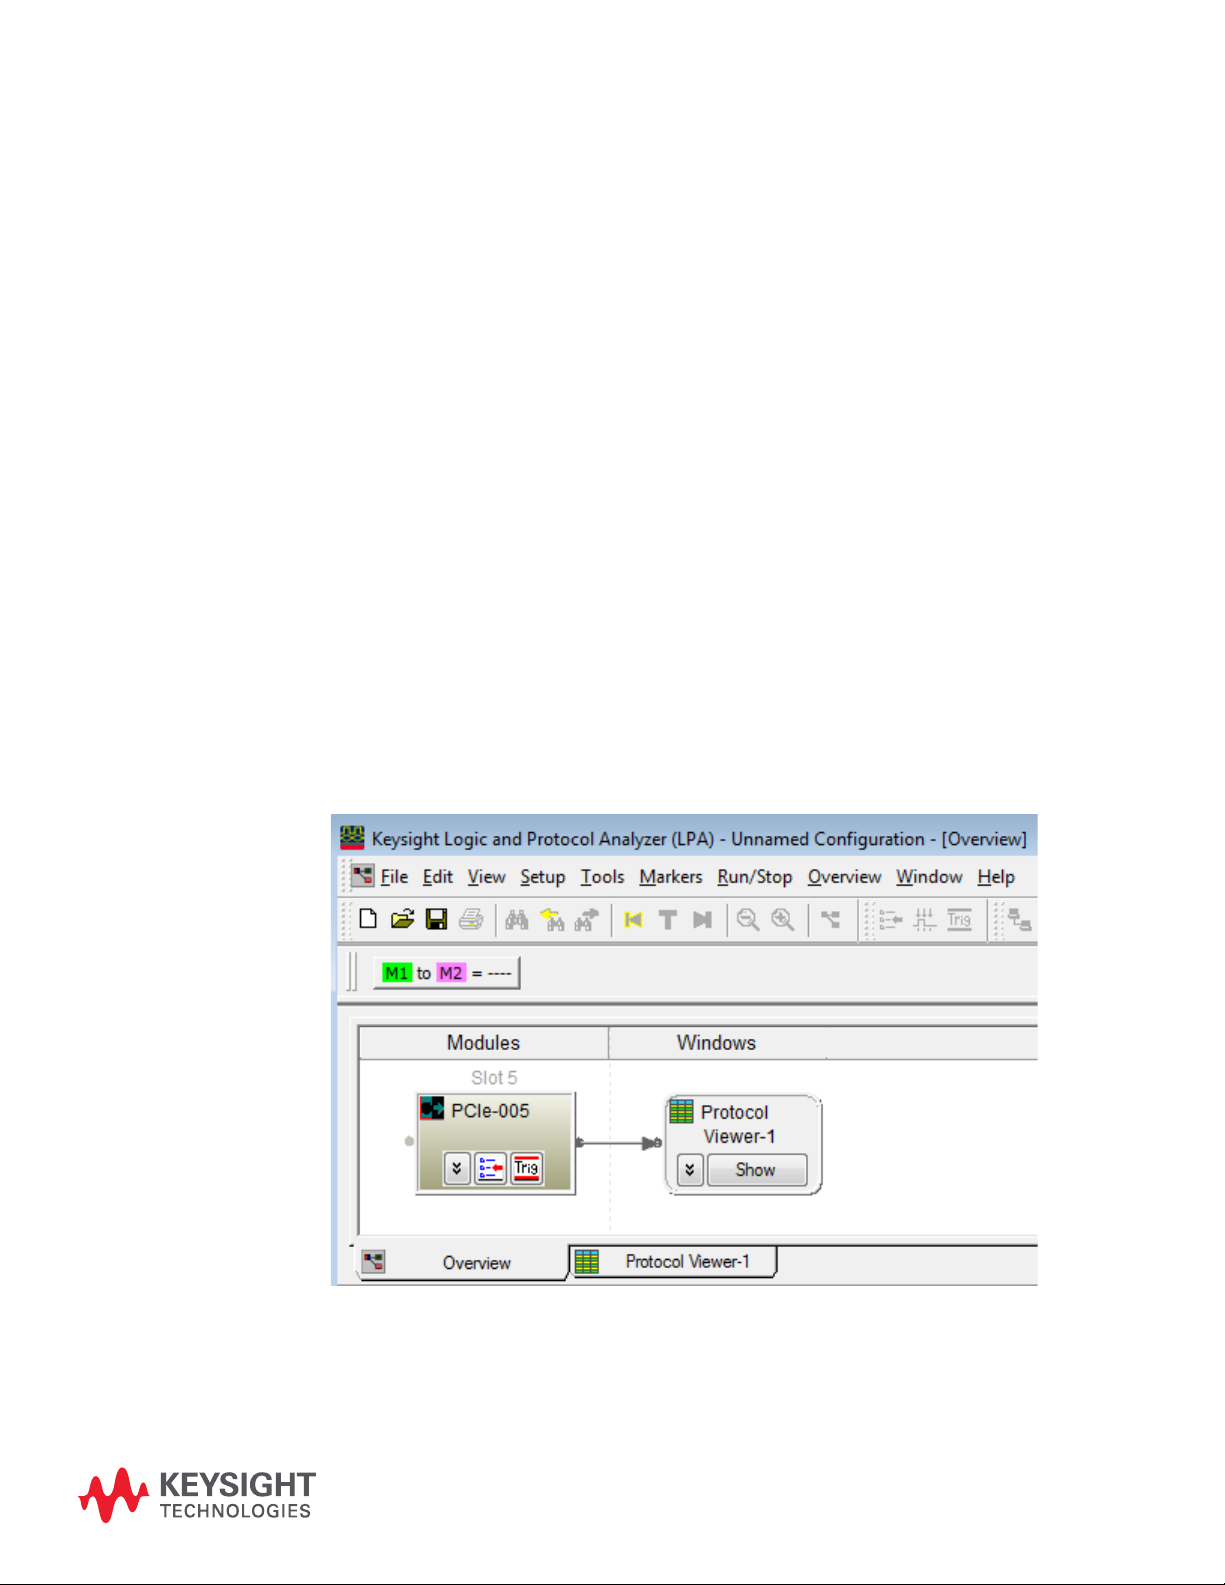
Keysight U4301 PCIe Gen3 Analyzer
User’s Guide
8 Viewing PCIe Gen3 Packets
and Traffic Overview
Filtering Packets Displayed in Protocol Viewer / 75
Searching for Specific Packets in Protocol Viewer / 80
Compacting the Display of Training Sequence Packets / 82
Viewing the Captured PCIe Traffic Statistics / 85
Navigating through the captured PCIe packets / 87
Viewing a Traffic Overview Chart / 89
Exporting Packet Times from a Traffic Overview Chart to a .csv or an Excel File / 93
Exporting Captured PCIe Data to a .csv File / 95
You can view the data captured by the U4301A/B PCIe Gen3 analyzer using the Protocol Viewer
window. See “Analyzing Packet Data” (in the Keysight Logic and Protocol Analyzer online help). A
Protocol Viewer is automatically added for a U4301A/B PCIe Gen3 analyzer module in the Logic and
Protocol Analyzer GUI.
The Protocol Viewer window displays the summarized and detailed packet information at the same
time within two panes. The upper pane lists the packets. On selecting a packet, the details of that
packet are displayed in the lower pane.
Page 74
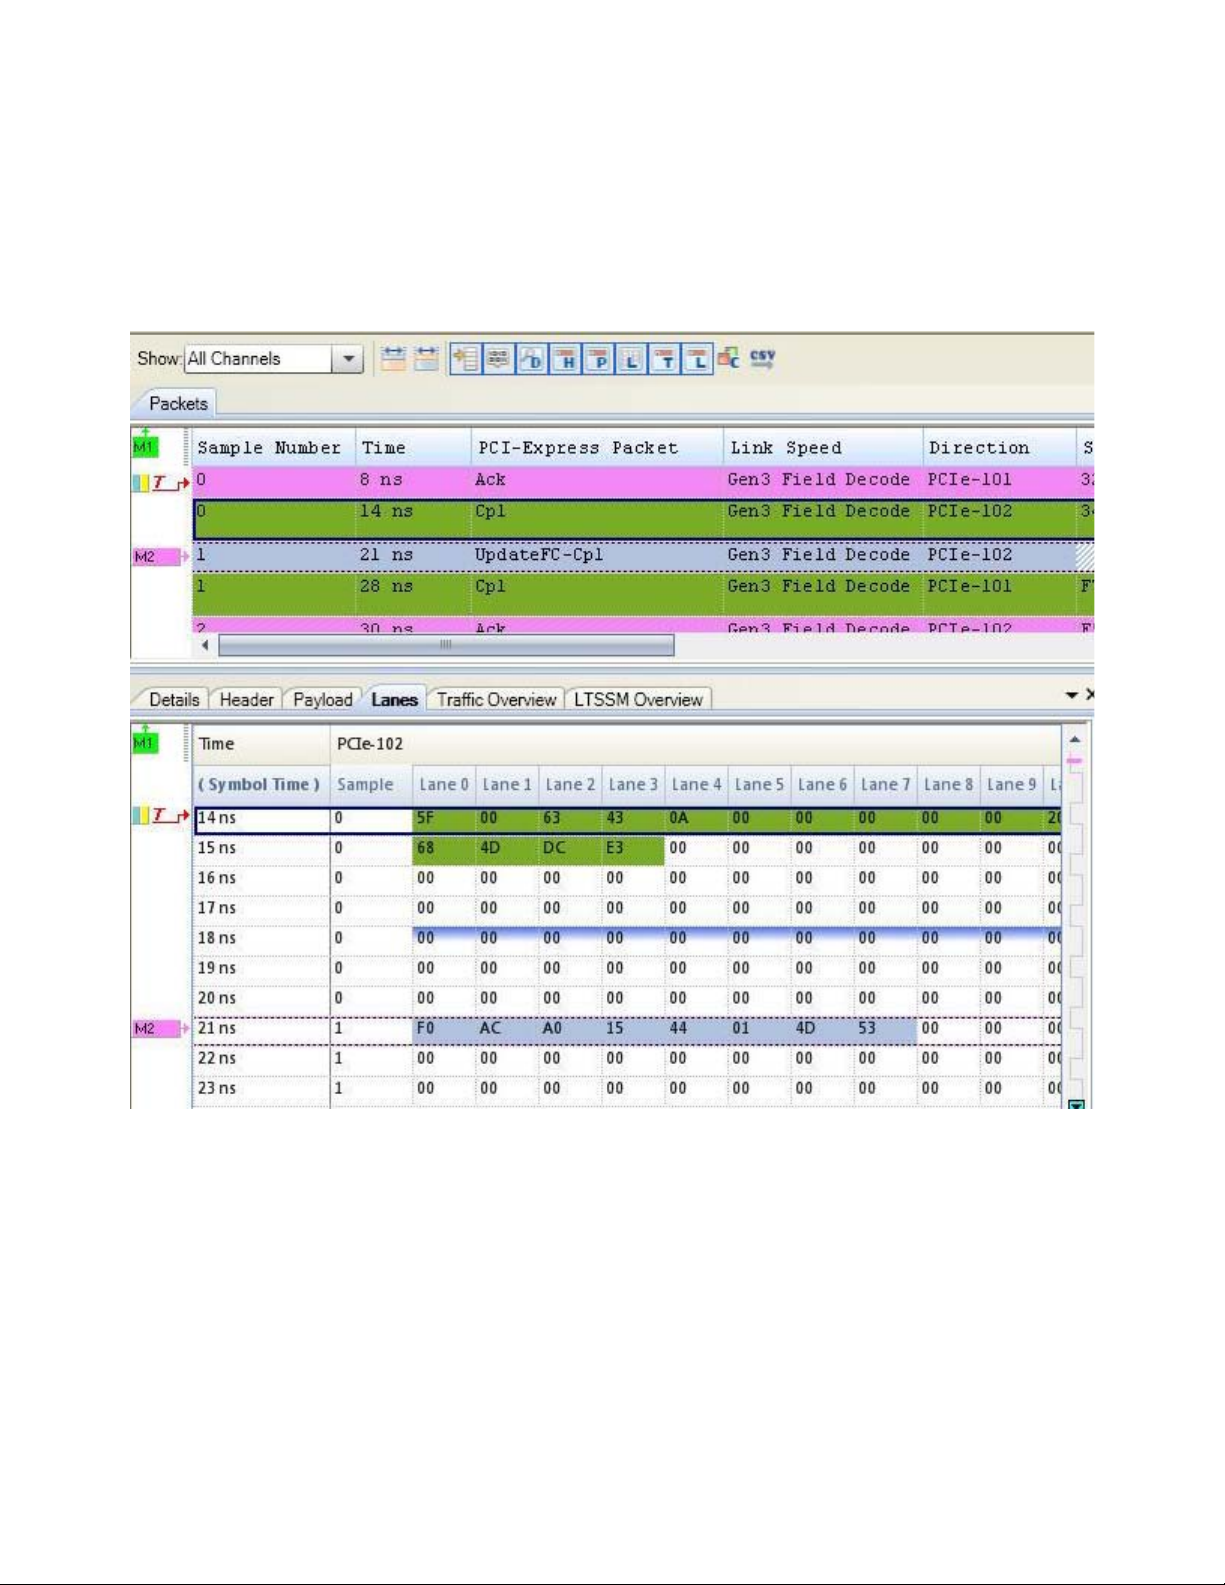
8 Viewing PCIe Gen3 Packets
The following screen displays a sample view of the captured PCIe data in the Protocol Viewer
window. In this screen, the Lanes tab of the Protocol Viewer window is displayed. The Lanes viewer
displays not just the selected packet data across lanes but also the post packet data represented by
colors matching the selected packet color in the upper pane.
74 Keysight U4301 PCIe Gen3 Analyzer User’s Guide
Page 75
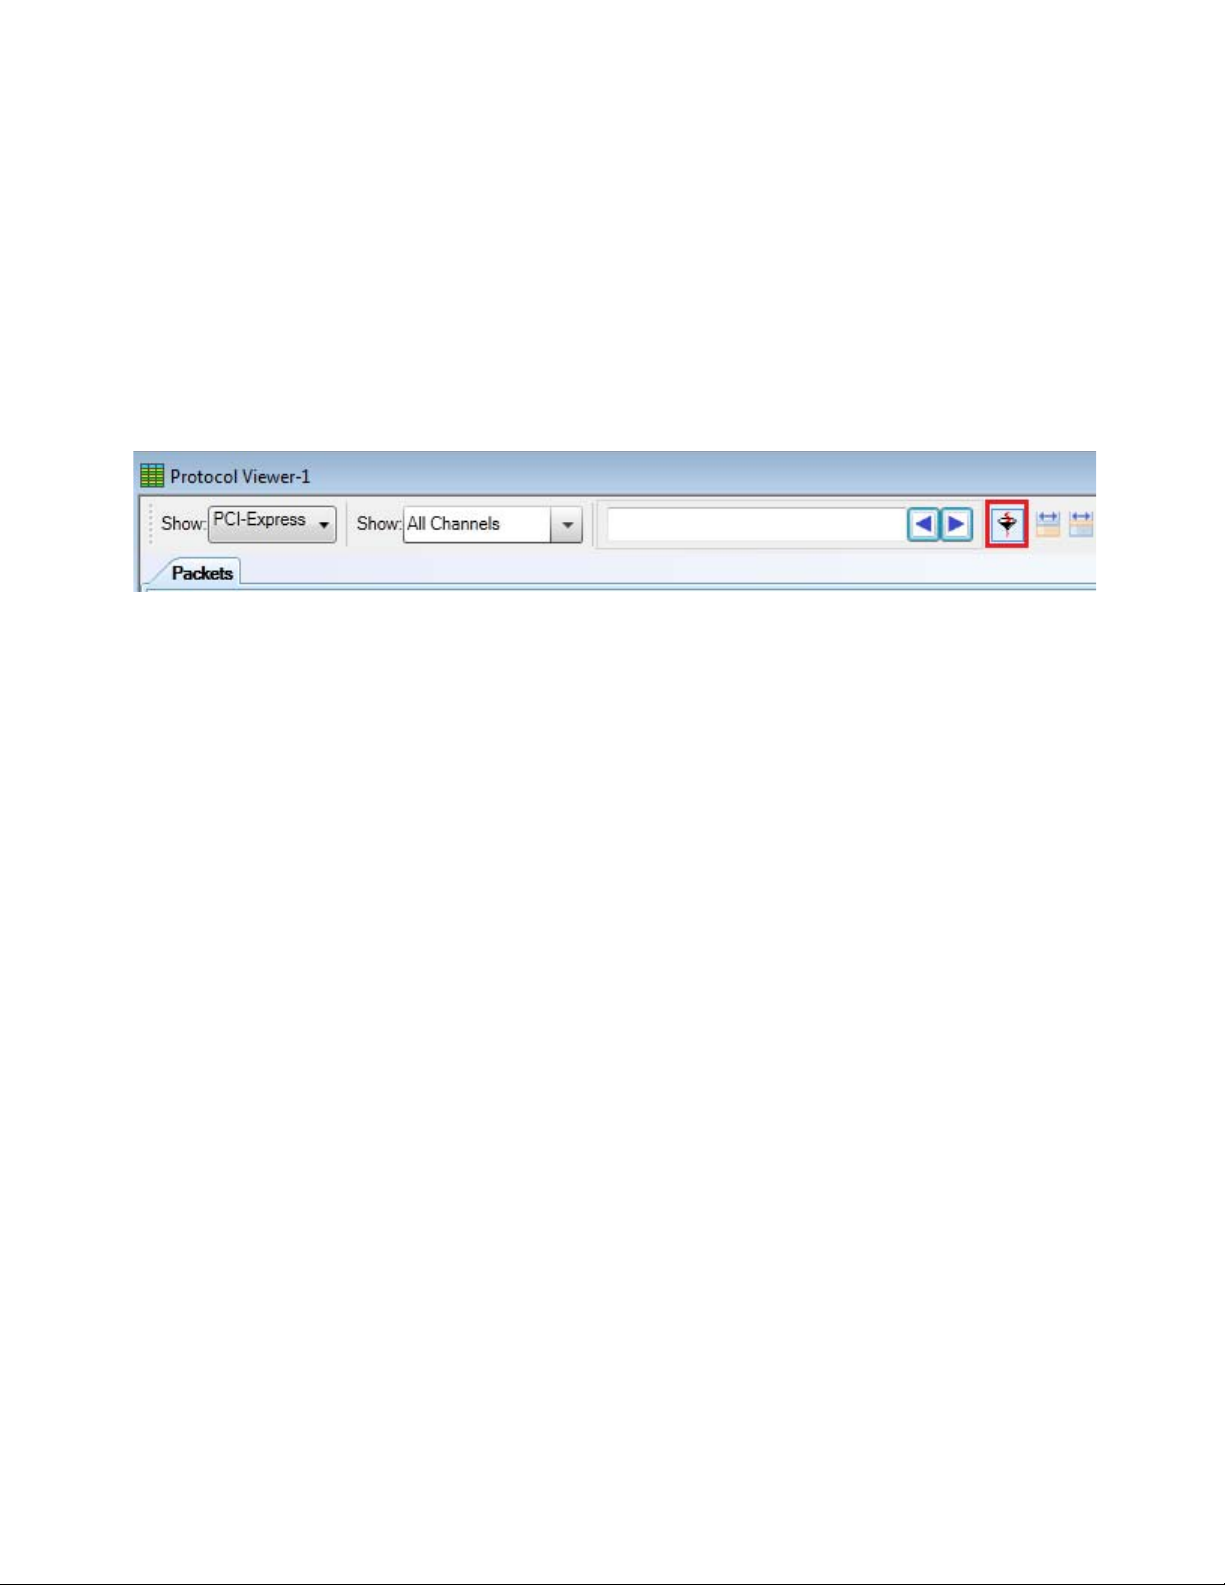
Filtering Packets Displayed in Protocol Viewer
You can filter the packets displayed in the Protocol viewer to display only those packets that are of
significance to you for analysis or debug.
Filtering packets changes only the display of data in the viewer and not the captured data. Once
filtered, you can refilter the data display at any time by applying new filter settings.
You can use the Simple Packet Filter button in the Protocol Viewer toolbar to filter packets displayed in
Protocol Viewer.
On clicking this button:
•a Filter/Colorize tool instance is added as an input to the Protocol Viewer in the Overview window.
•the Simple Packet Filter dialog box is displayed to allow you to define the filtering setup. The
defined filtering setup is also stored in the added Filter/Colorize tool instance.
In the Simple Packet Filter dialog box, you can select/deselect the packet types and then:
•click Hide to hide the selected packets from Protocol Viewer display.
•click Show to show only the selected packets in the Protocol Viewer display.
•click Disable to disable all the filtering options available in the Simple Packet Filter dialog box.
Viewing PCIe Gen3 Packets 8
You can filter the display of packets based on types of packets, ordered sets, framing tokens,
assertion or deassertion of the CLKREQ# signal, or errors. As an example, the filtering setup in the
following screen is defined to display only packets with errors.
Keysight U4301 PCIe Gen3 Analyzer User’s Guide 75
Page 76
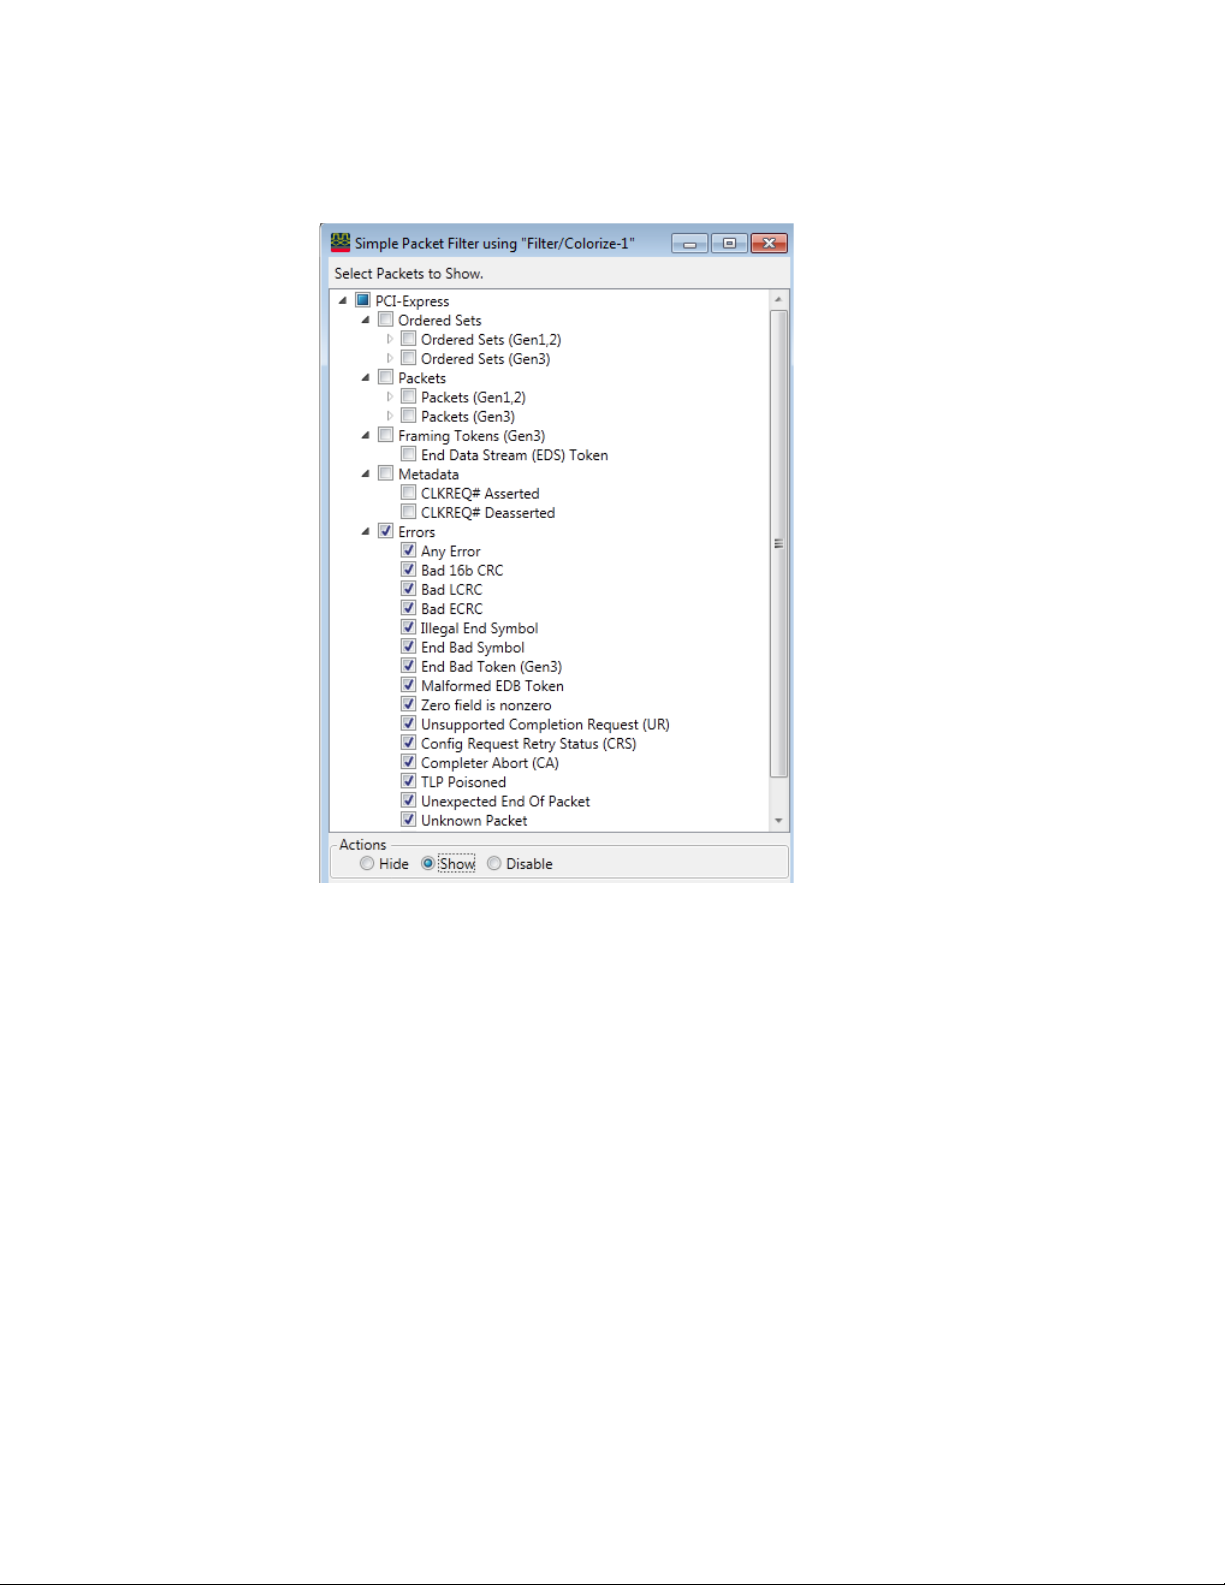
8 Viewing PCIe Gen3 Packets
You can also view the defined filtering setup in the Filter/Colorize tool that the Simple Packet Filter
added to the Overview window.
76 Keysight U4301 PCIe Gen3 Analyzer User’s Guide
Page 77
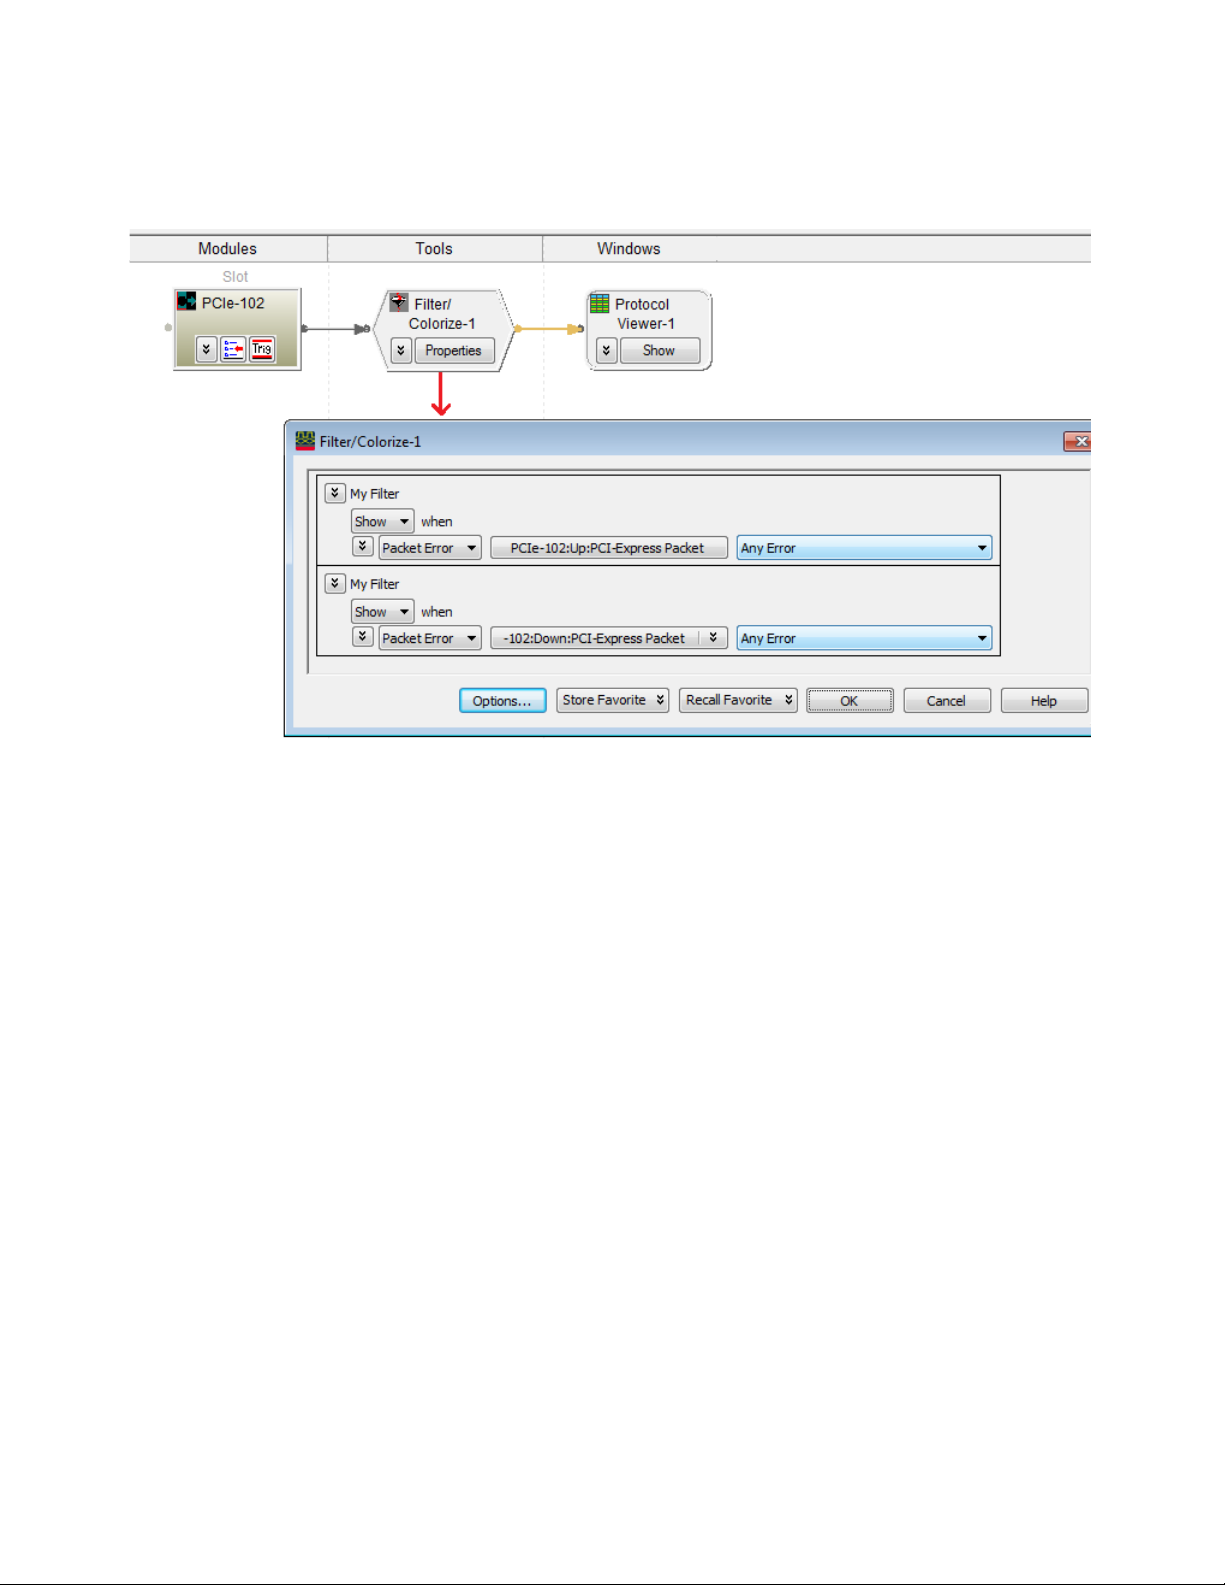
Viewing PCIe Gen3 Packets 8
If you make any filtering changes to the Filter/Colorize tool instance, these changes will not be
reflected or applied to the Simple Packet Filter dialog box. However, any changes to the Simple
Packet Filter dialog box will be reflected in the associated Filter/Colorize tool instance.
Filtering Bidirectional Packets Data
If the captured data (for which you want to define filtering setup) is for multiple or bi-directional
signals, the filtering options displayed and defined in the Simple Packet Filter dialog box are
applicable to multiple or bidirectional signals.
When filtering bidirectional or multiple signals data, the Simple Packet Filter creates a separate
filtering clause for each direction and applies the filtering setup that you defined to each of these
clauses. This avoids erroneous filtering results.
For instance, in the first screen below, the filtering setup is defined to hide Skip ordered set and Ack
packets for bidirectional data. In the second screen, the Simple Packet Filter creates two separate
clauses for the Upstream and Downstream data and reflects the filtering setup that you defined in
both these clauses. Finally, in the third screen, the filtered bidirectional data is displayed.
Keysight U4301 PCIe Gen3 Analyzer User’s Guide 77
Page 78
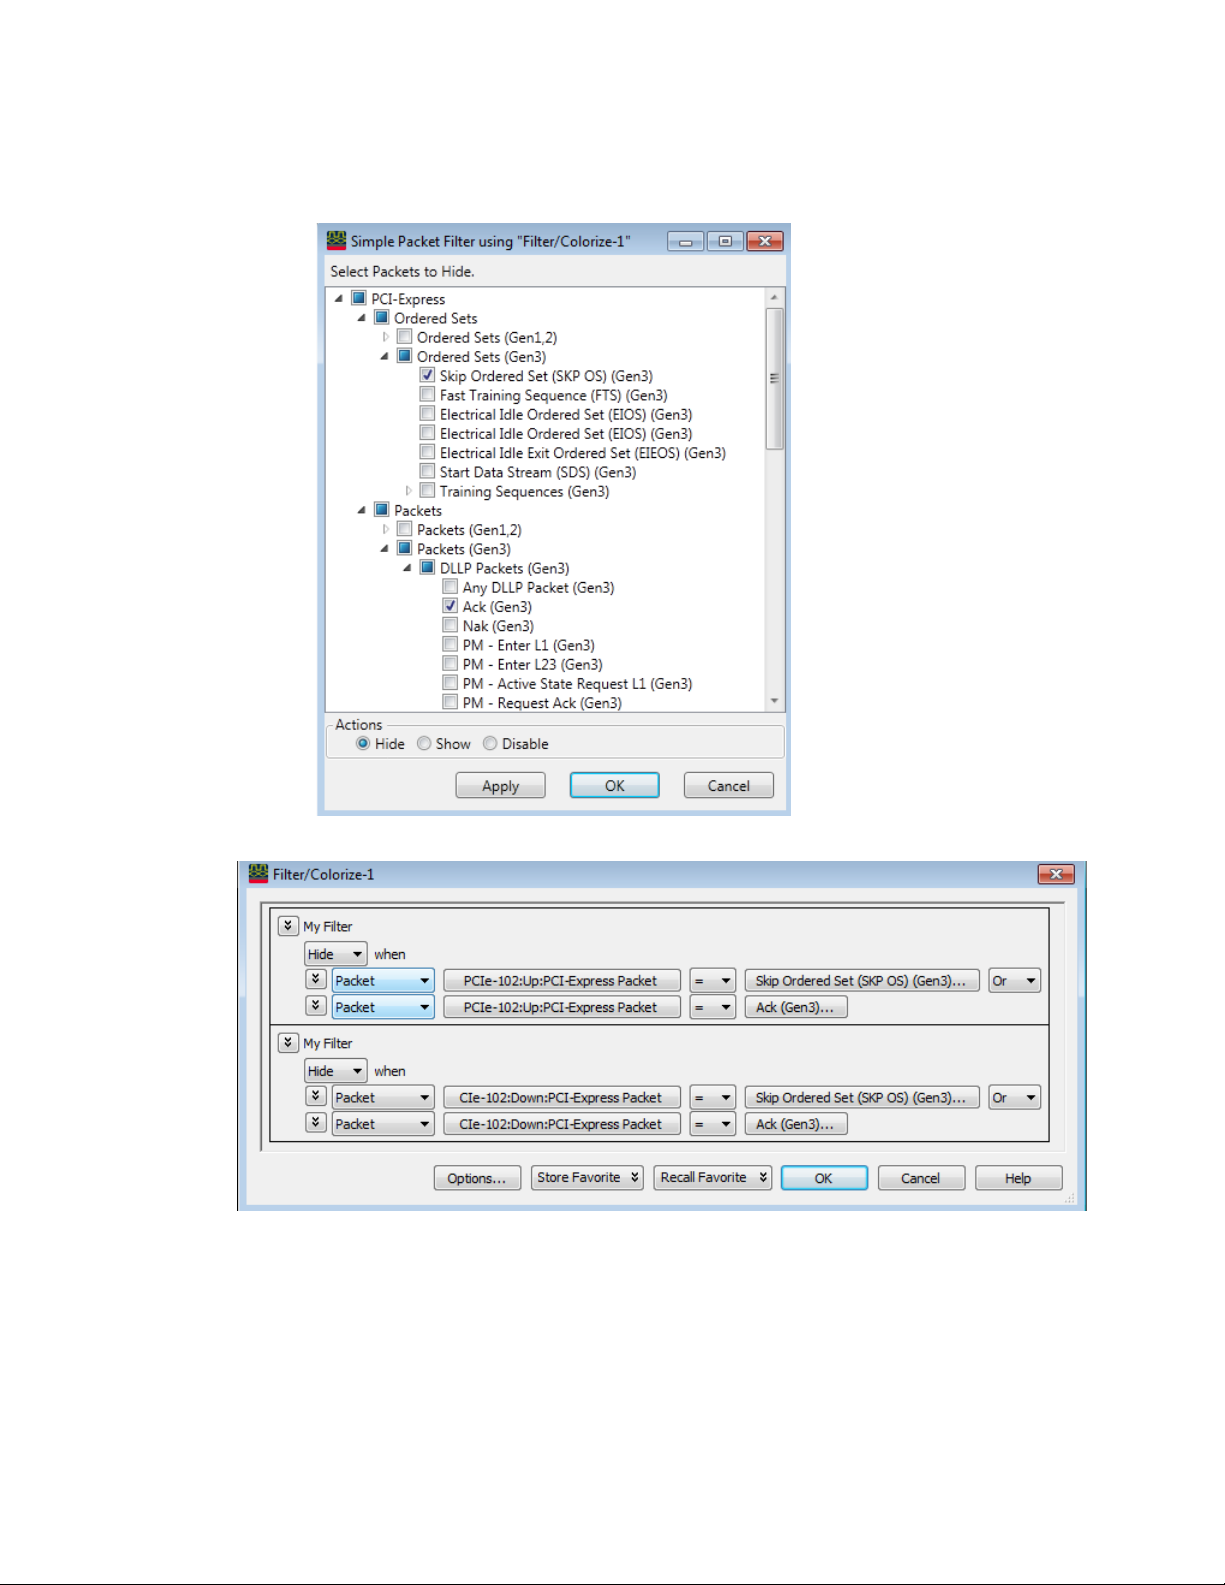
8 Viewing PCIe Gen3 Packets
78 Keysight U4301 PCIe Gen3 Analyzer User’s Guide
Page 79
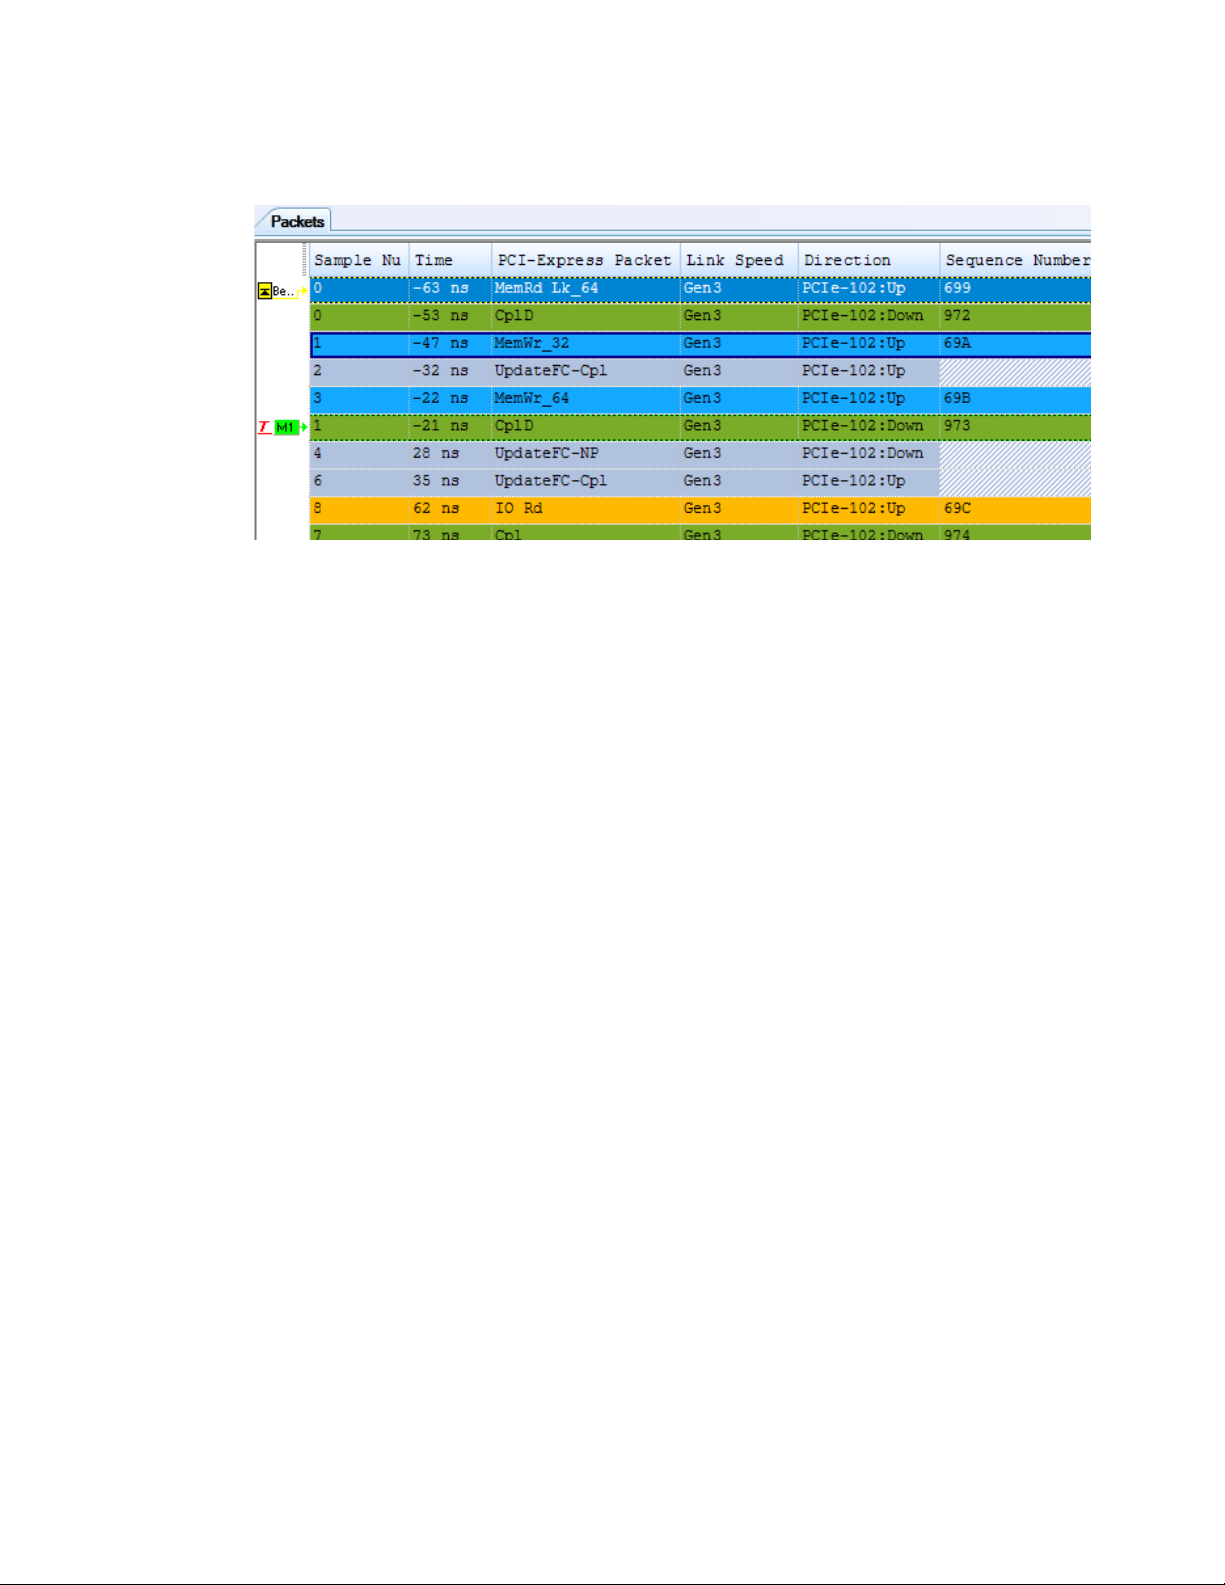
Viewing PCIe Gen3 Packets 8
Keysight U4301 PCIe Gen3 Analyzer User’s Guide 79
Page 80
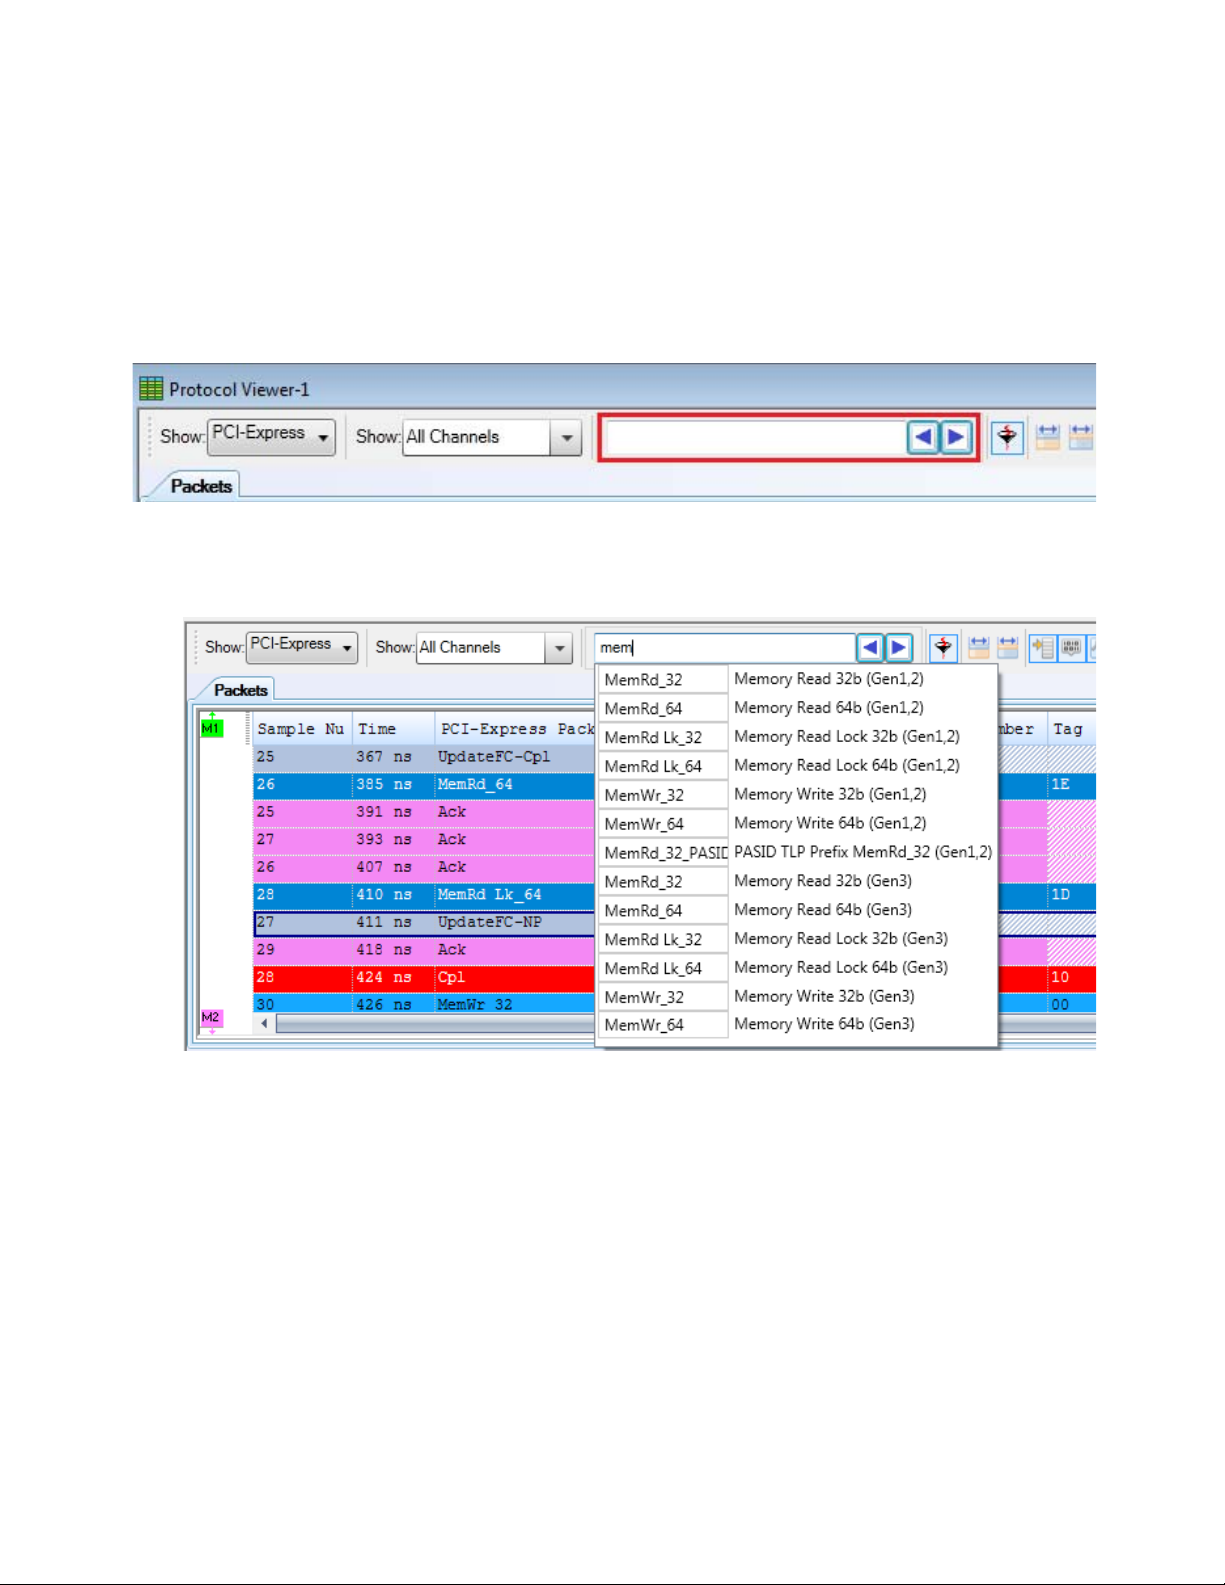
8 Viewing PCIe Gen3 Packets
Searching for Specific Packets in Protocol Viewer
You can quickly search for packets of interest from the list of packets displayed in the upper pane of
the Protocol Viewer. You can use the Search field displayed in the Protocol Viewer toolbar to
accomplish this.
You can specify the packet type you want to search in this field. The Search field includes an
AutoComplete feature that provides you a list of both the Short Name and Packet Type Name
matching the text typed by you.
Once you specify the packet type and press <Enter> or select the required packet type from the
Autocomplete popup, the search for the matching packets begins. The first packet (starting from the
currently highlighted position in the trace) that matches your search criterion is highlighted in the
upper pane of the Protocol Viewer. If there are multiple packets in the trace matching the search
criterion, then you can directly navigate to these packets using the Find Previous Packet and Find Next
Packet buttons displayed with the Search field.
80 Keysight U4301 PCIe Gen3 Analyzer User’s Guide
Page 81
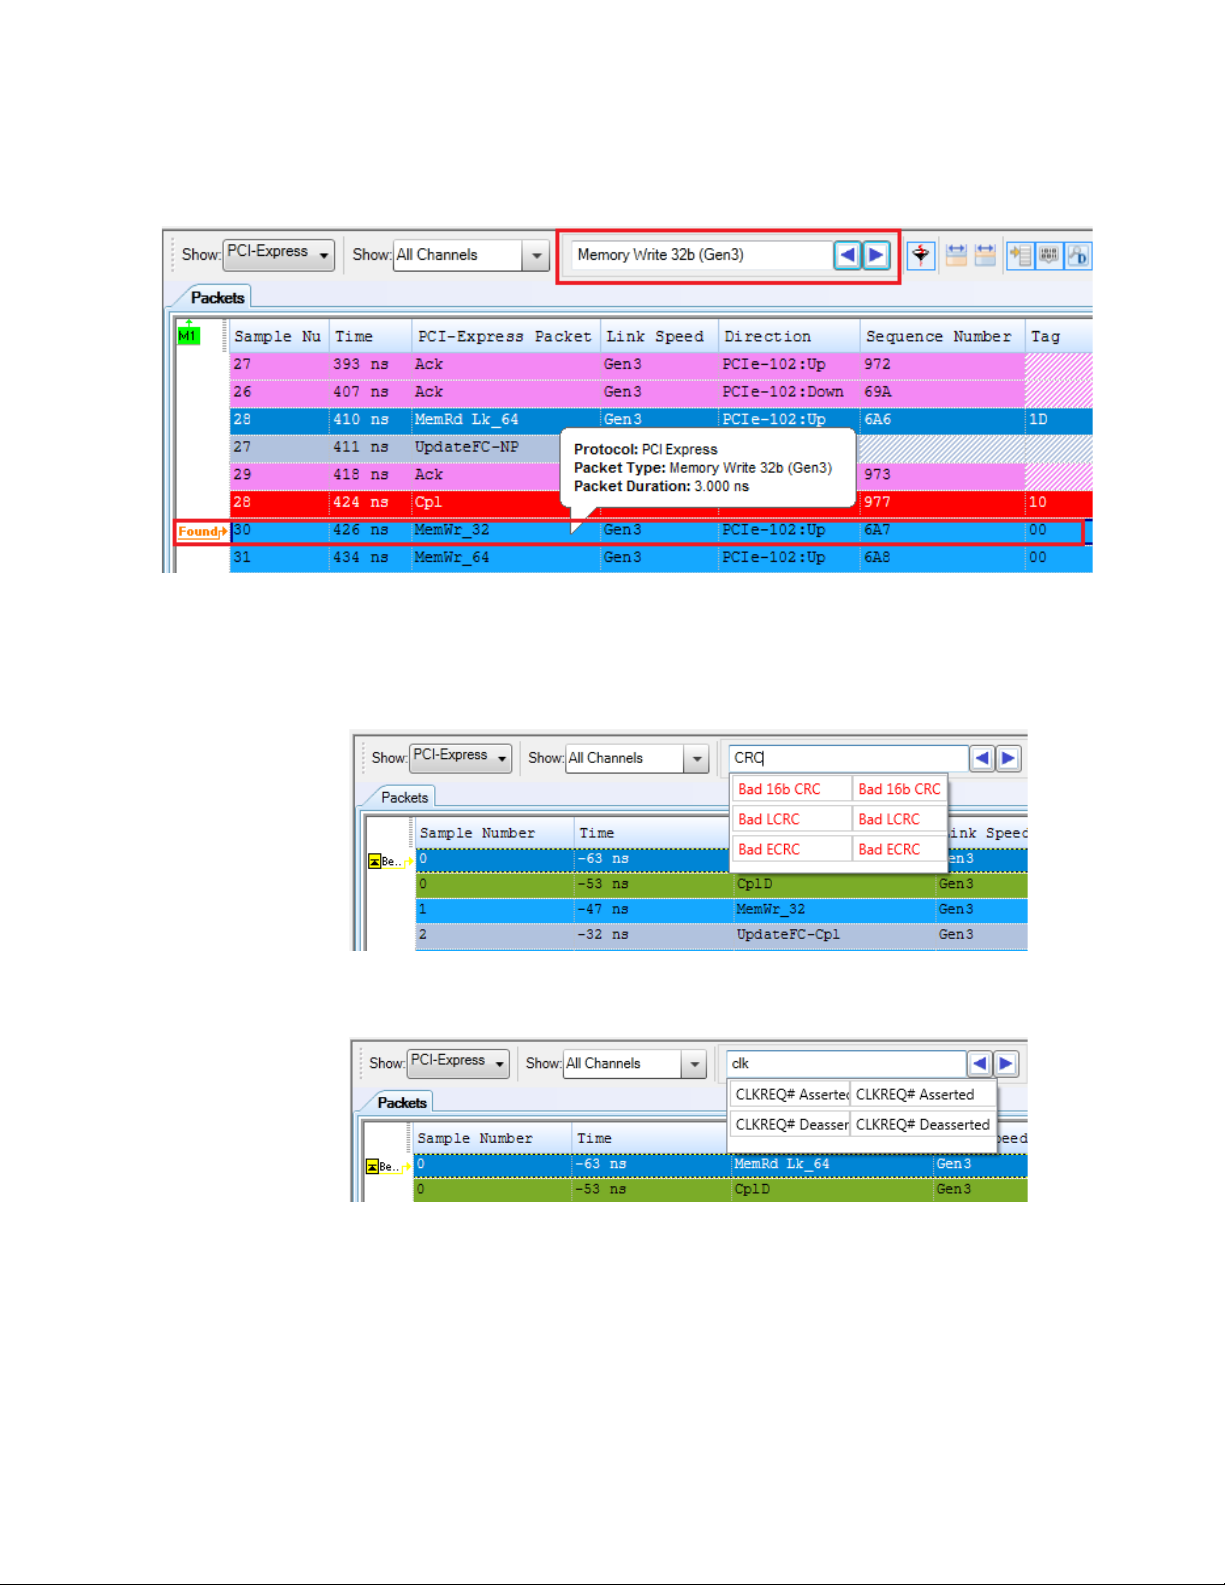
Viewing PCIe Gen3 Packets 8
The following screen shows a Memory Write packet found using the Search field.
Some more examples of searching packets
• You can also search packets on the basis of error types. When you start typing an error type in the
Search field, the AutoComplete feature provides you a list of supported error types matching the
text typed by you. The screen below displays some of the supported error types which you can use
as the search criteria.
• The Search feature also lets you search packets based on the assertion/deassertion of the
CLKREQ# signal.
Keysight U4301 PCIe Gen3 Analyzer User’s Guide 81
Page 82
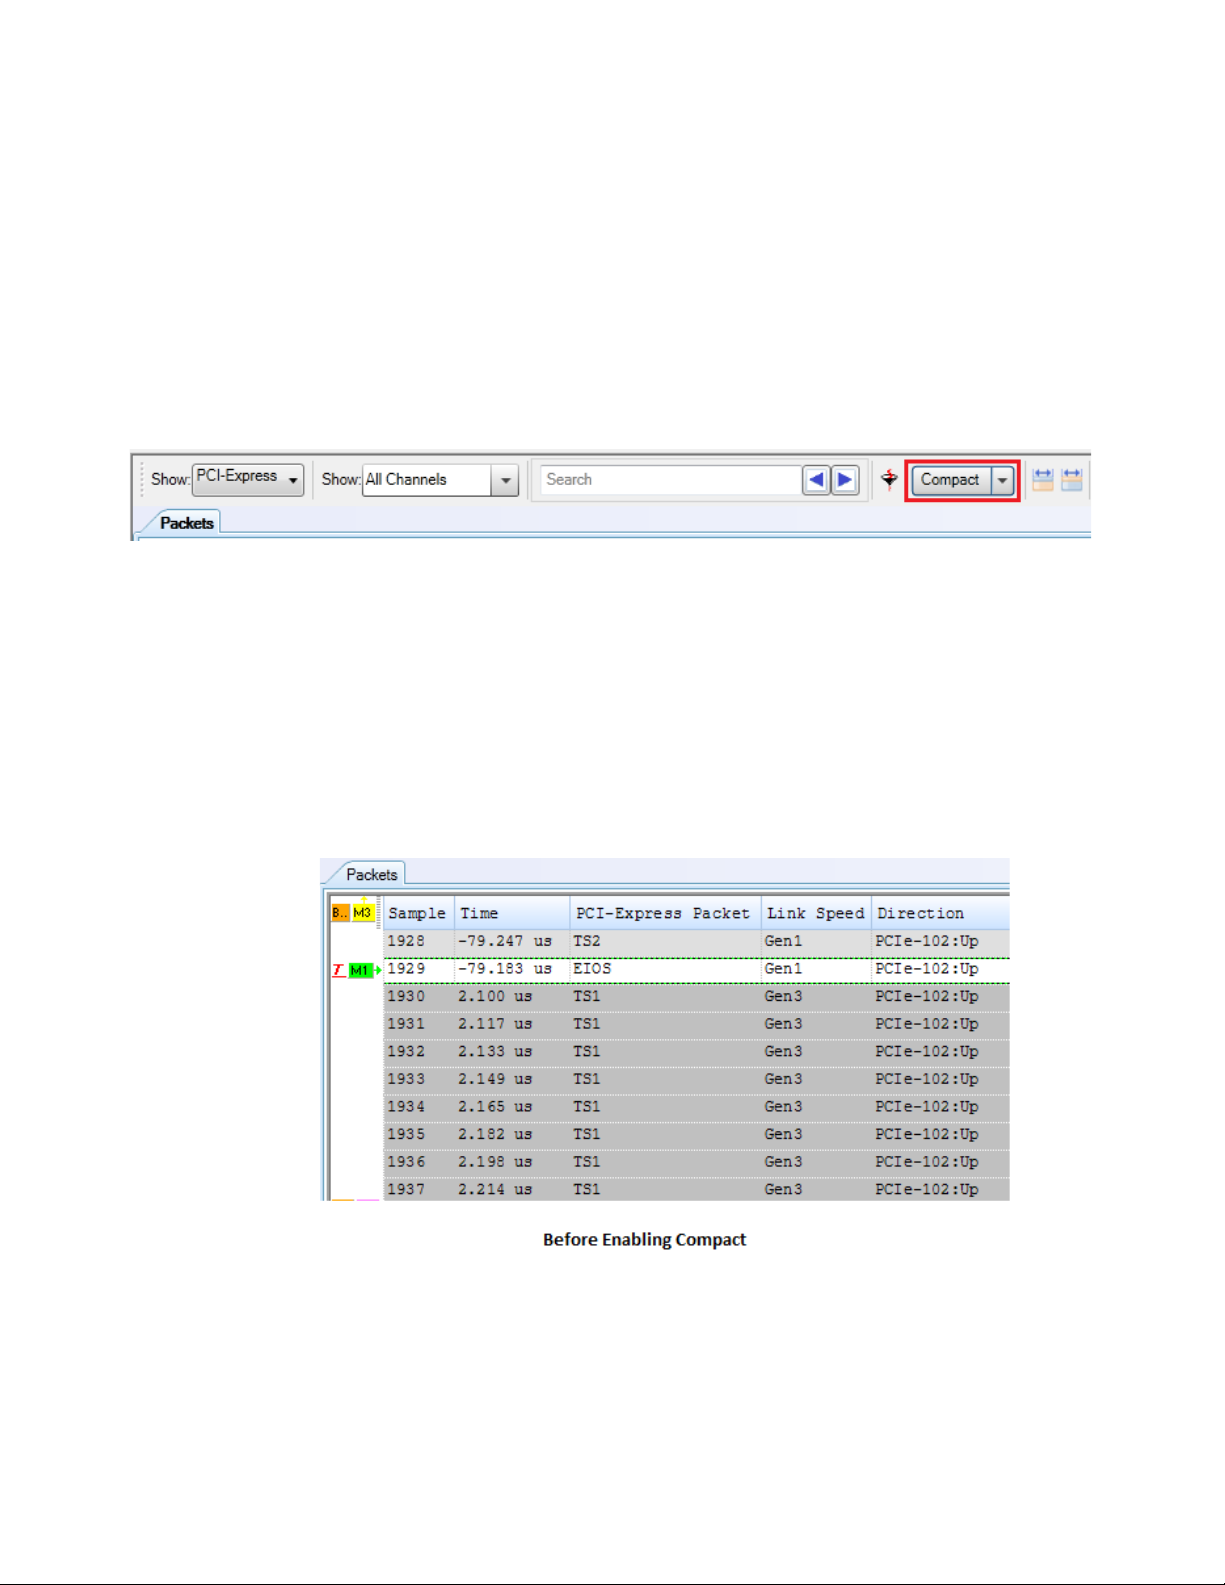
8 Viewing PCIe Gen3 Packets
Compacting the Display of Training Sequence Packets
By default, the captured training sequence packets are listed individually in the upper pane of the
Protocol Viewer. There are situations when there are numerous training sequence packets of a
particular type, say TS1, exchanged continuously over a period of time. In such situations, the listing
of packets in Protocol Viewer can become clogged with these training sequences thereby requiring
you to scroll significantly to view other types of packets. To overcome this, you can use the Compact
tool that compacts the display of training sequence packets into sets in Protocol Viewer. This tool is
available in the Protocol Viewer toolbar as displayed in the screen below.
On enabling Compact, the training sequence packets of the same type, transmitted in the same
direction in a time sequence are compacted into sets thereby reducing the packet entries in the
Protocol Viewer listing. The compacted view also provides you a clearer view of the transitions such
as TS1 to TS2 occurring in the exchange of training sequence packets.
Example - Compacted Display
The screens below display the packets in the Protocol Viewer before and after the Compact tool is
used. Notice that all the packets are listed individually before compact is enabled. After enabling
compact, the TS1 and TS2 packets are compacted as specific sets per direction and are listed as one
entry per set in the Protocol Viewer. The number of packets that have been compacted into one
entry/set is represented through the numeric value displayed with the entry/set.
82 Keysight U4301 PCIe Gen3 Analyzer User’s Guide
Page 83
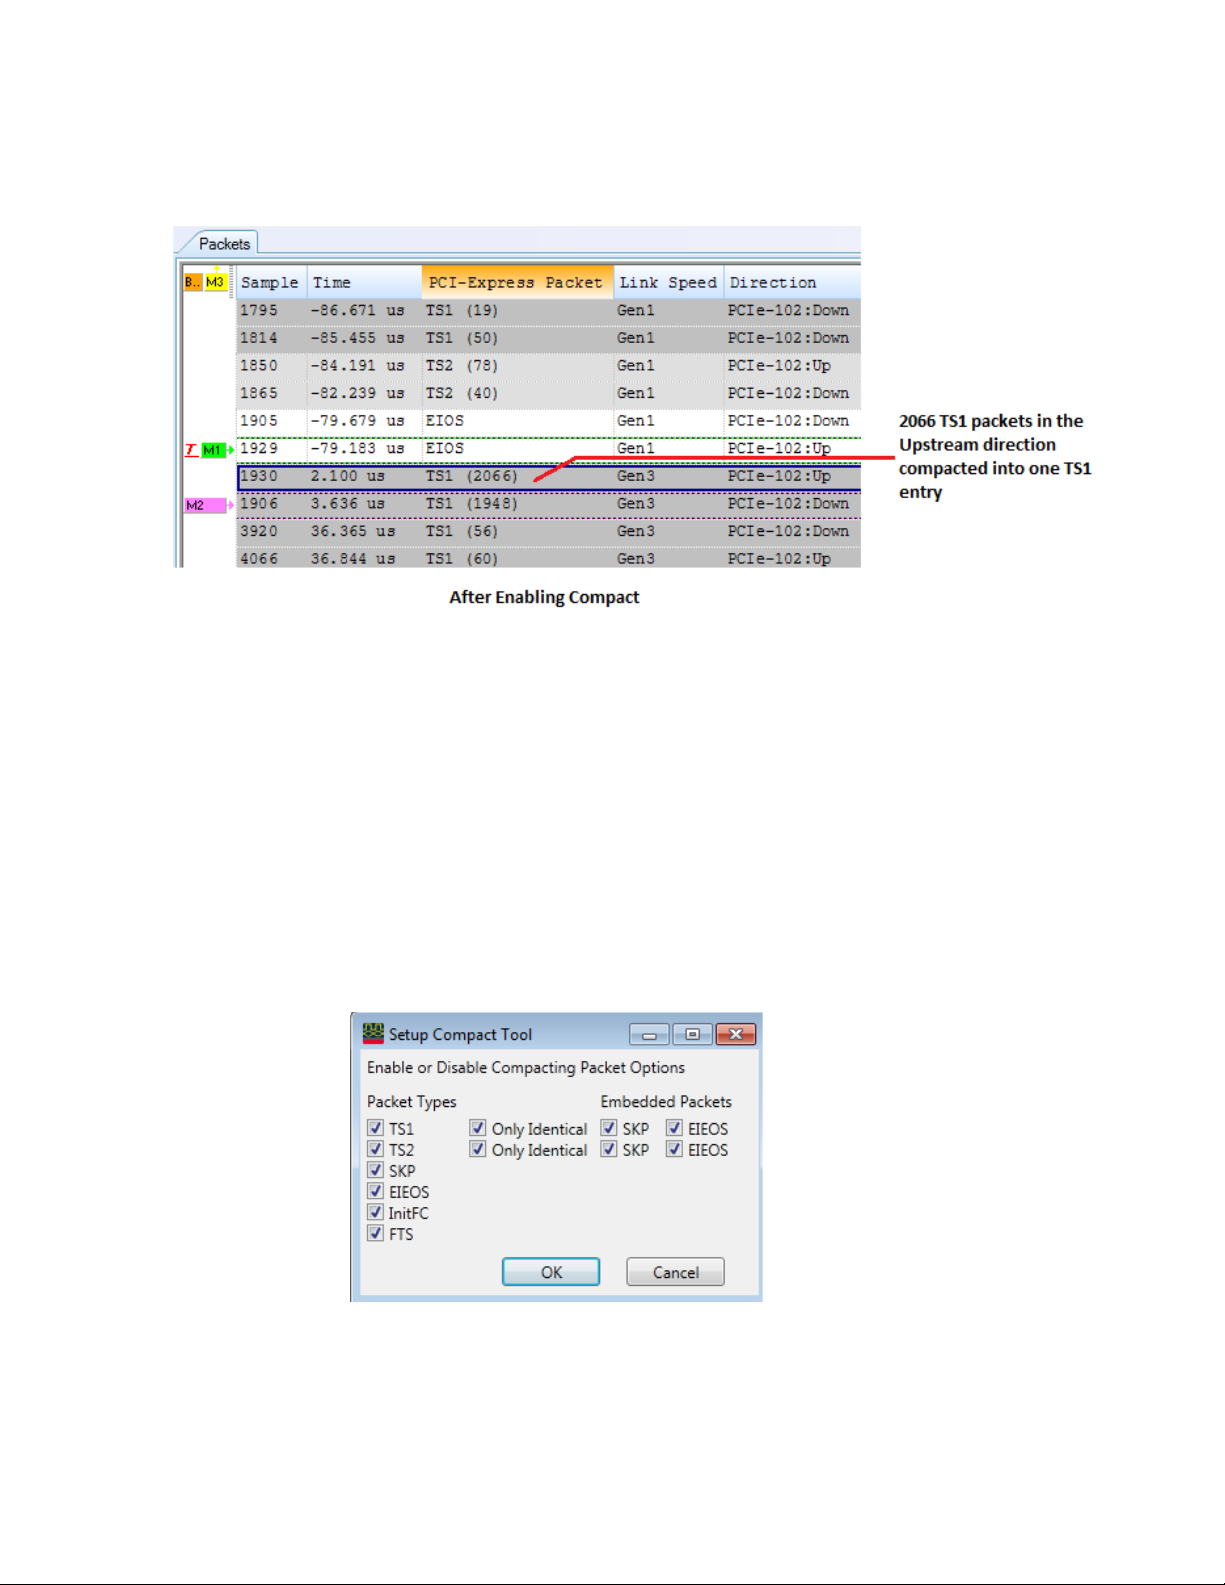
To configure the Compact setup
Viewing PCIe Gen3 Packets 8
1 Click the drop-down arrow displayed with the Compact button and then select Setup Compact.
The Setup Compact Tool dialog box is displayed.
2 Select the packet types that you want to compact into sets.
• You can compact TS1, TS2, SKP, EIEOS, InitFC, and FTS packet types.
• For TS1 and TS2 packets, you can select whether or not only identical or all TS1 and TS2
packets should be compacted. Selecting the Only Identical checkbox compacts only identical
TS packets (that is, packets with same field values). This allows you to view when a field of a TS
packet changes compared to the previous TS packet.
• You can also choose whether or not the SKP and EIEOS packets embedded within the TS1 and
TS2 packets should be compacted with the applicable TS1/TS2 packets. If you do not select
these checkboxes, the SKP and EiEOS packets appear as individual packets after compact.
The following screen displays the above-mentioned packet options for compact.
3Click OK.
The compact setup is now configured as per your selections. When you enable compact, the
packets will be compacted as per this configured setup. If the compact is already enabled, the
changed setup configuration will be automatically reflected in the compacted packets display.
Keysight U4301 PCIe Gen3 Analyzer User’s Guide 83
Page 84
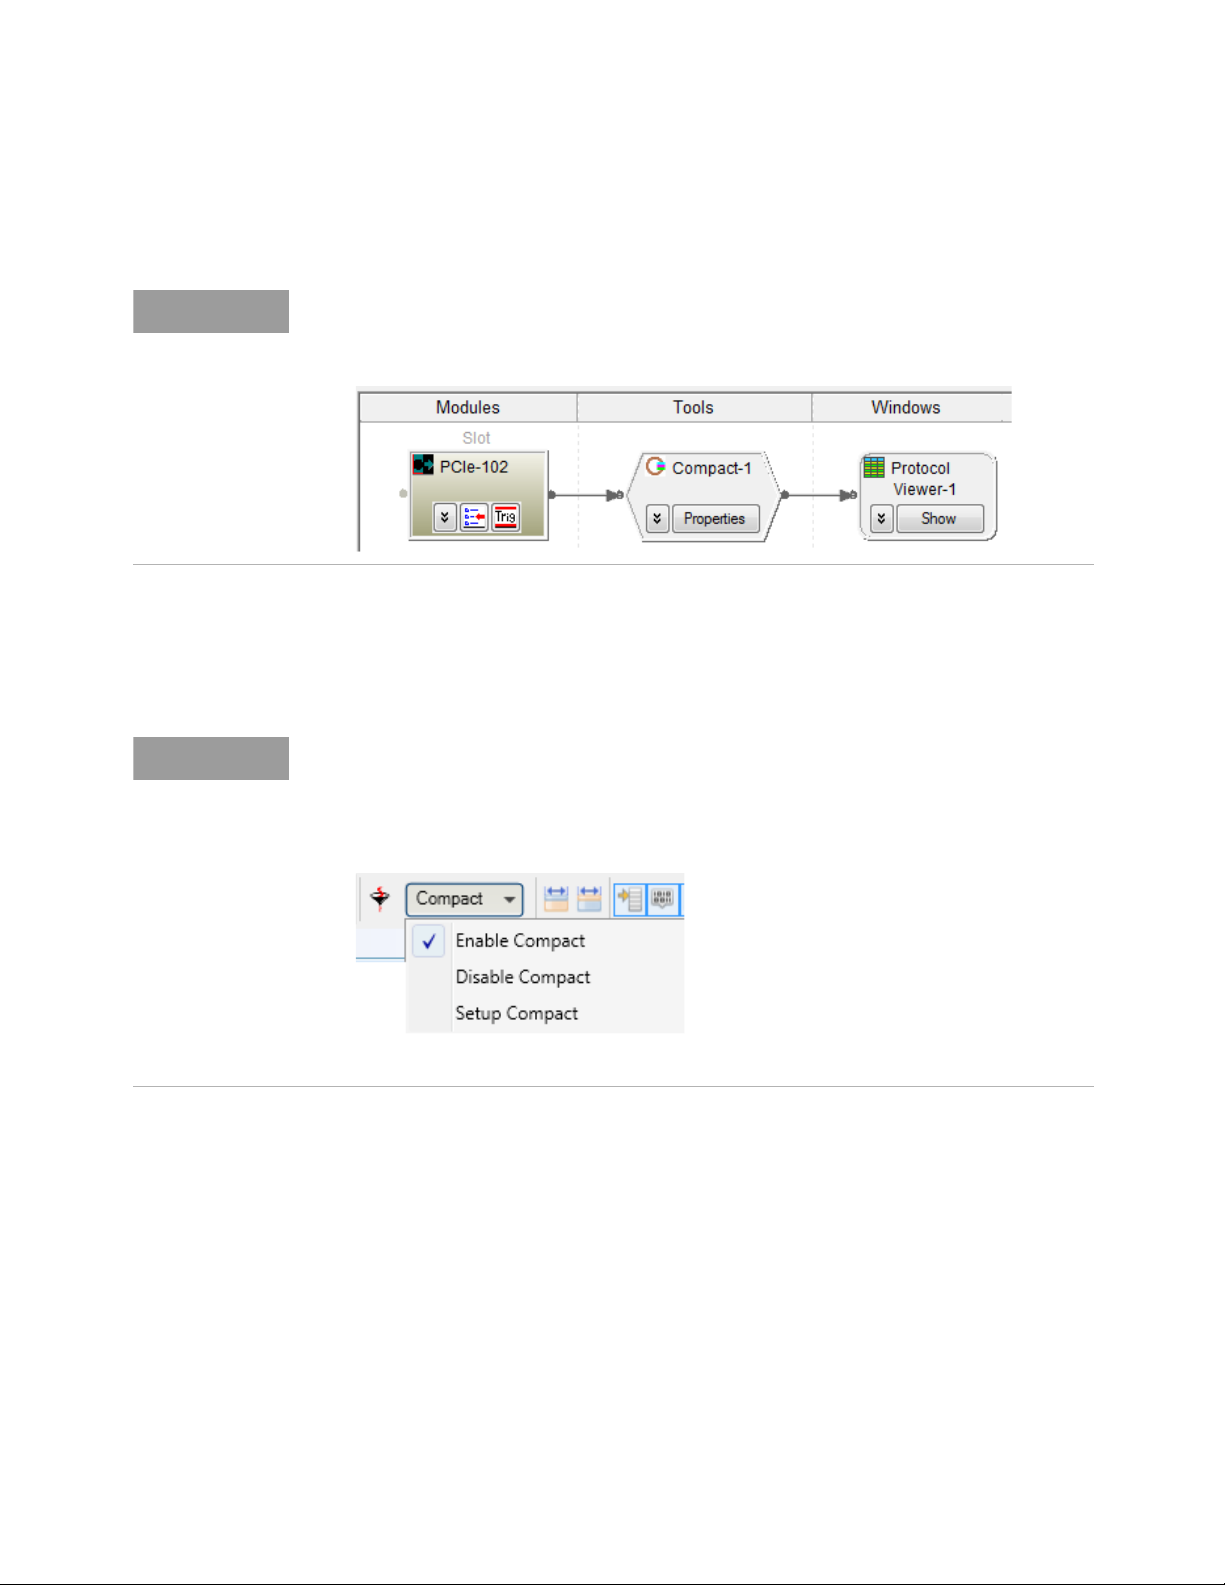
8 Viewing PCIe Gen3 Packets
NOTE
NOTE
To enable the compact display
1 Click the drop-down arrow displayed with the Compact button and then select Enable Compact.
To turn off the compact display
1 Click the drop-down arrow displayed with the Compact button and then select Disable Compact.
When you enable the compact display for the first time, an instance of the Compact tool is
added to your setup in the Overview window. Do not delete this tool’s instance as this tool is
used in the compact process.
All packets are then listed individually.
Clicking the Compact button flips the current display of packets from Compact to Not
Compact and vice versa.
The Compact button’s drop-down menu displays the current selection mode in terms of
whether or not compact is currently enabled.
84 Keysight U4301 PCIe Gen3 Analyzer User’s Guide
Page 85
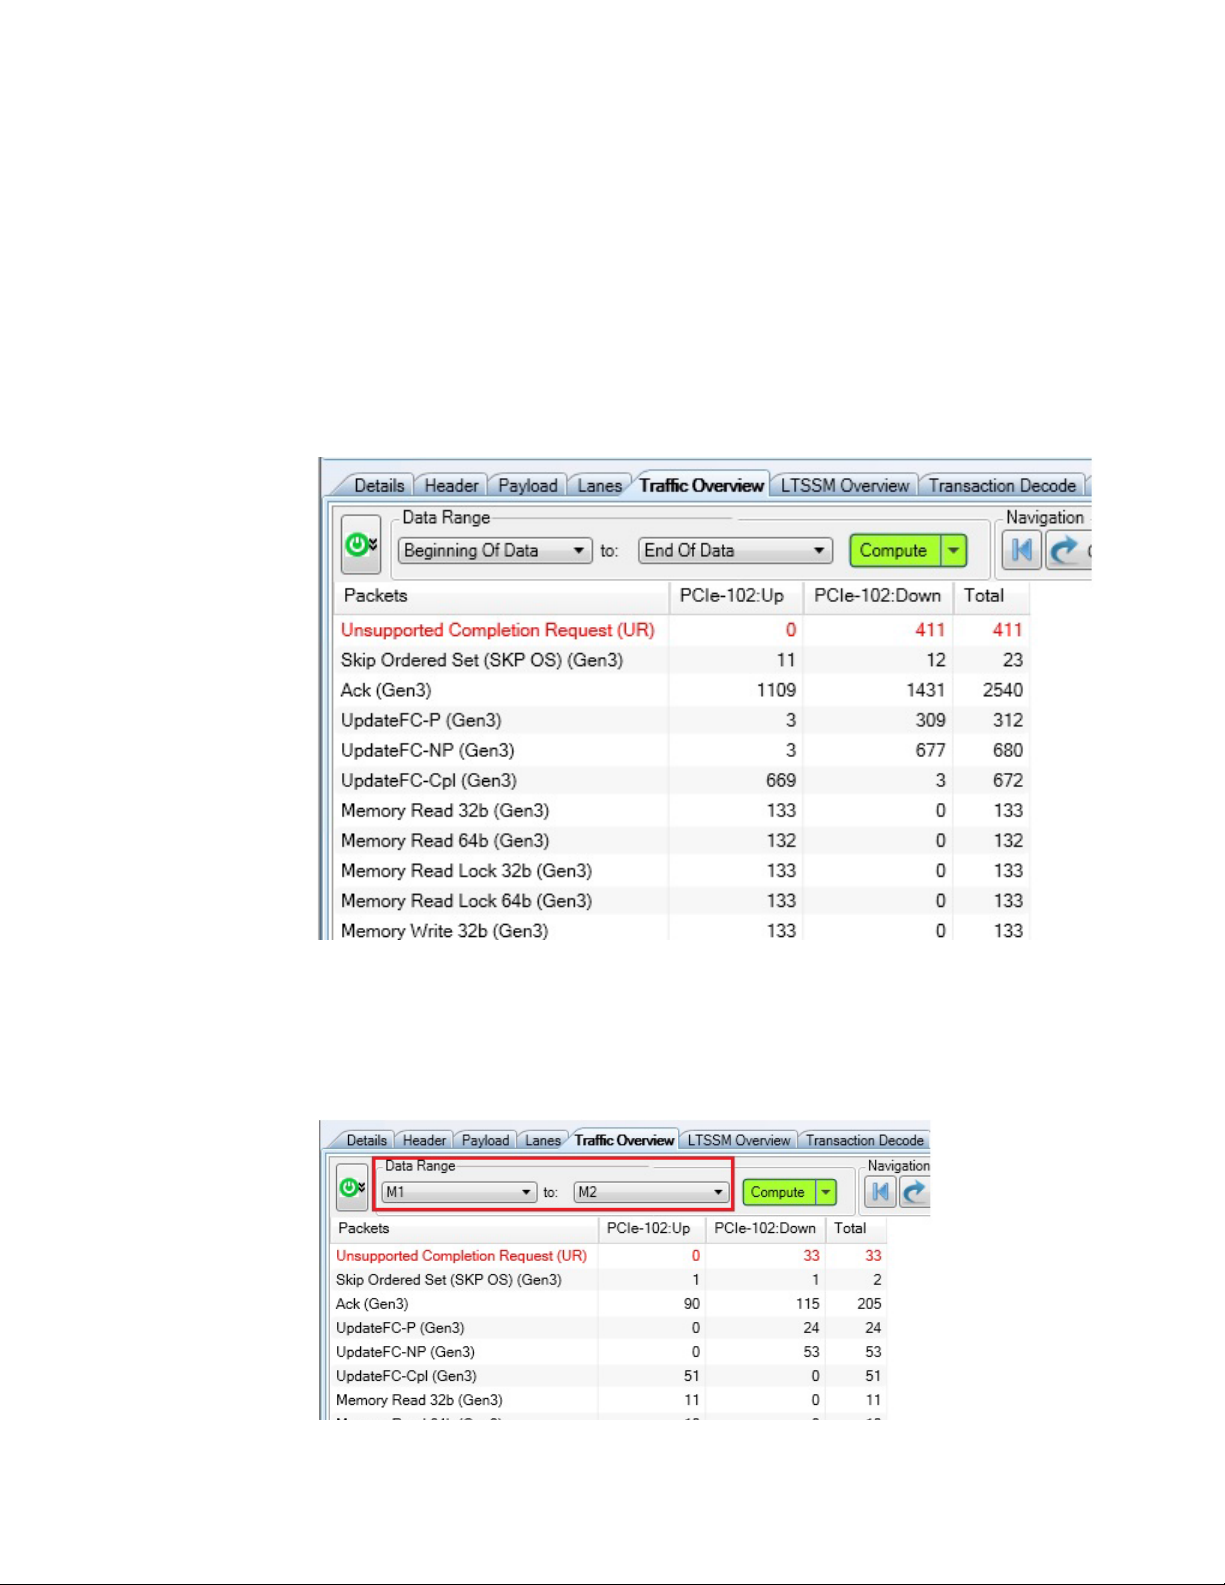
Viewing the Captured PCIe Traffic Statistics
You can use the Traffic Overview tab in the lower pane of Protocol Viewer to get an overview of the
PCIe traffic that is displayed in the upper pane of Protocol Viewer. This tab provides a count of
various PCIe packet types captured and displayed in the upper pane. The count of packets is
categorized on the basis of packet types.
For each packet type, the count of packets is further segregated based on the direction (upstream or
downstream). The following screen displays the traffic statistics in the lower pane. Notice that for
each packet type, the count of packets is displayed for upstream as well as downstream direction
along with a sum of packets in both directions.
Viewing PCIe Gen3 Packets 8
You can specify the data range based on which the traffic statistics get computed in the Traffic
Overview tab. For instance, you might want to view the traffic statistics only for the PCIe packets
between the markers M1 and M2. In such a situation, you can select M1 as the start point and M2 as
the end point in the Data Range group box and then click Compute. Then Protocol Viewer displays the
traffic statistics of only the packets that fall in the specified data range and not for all the PCIe
packets displayed in the upper pane. The following screen displays the traffic statistics for the data
range starting from M1 and ending at M2 markers.
Keysight U4301 PCIe Gen3 Analyzer User’s Guide 85
Page 86
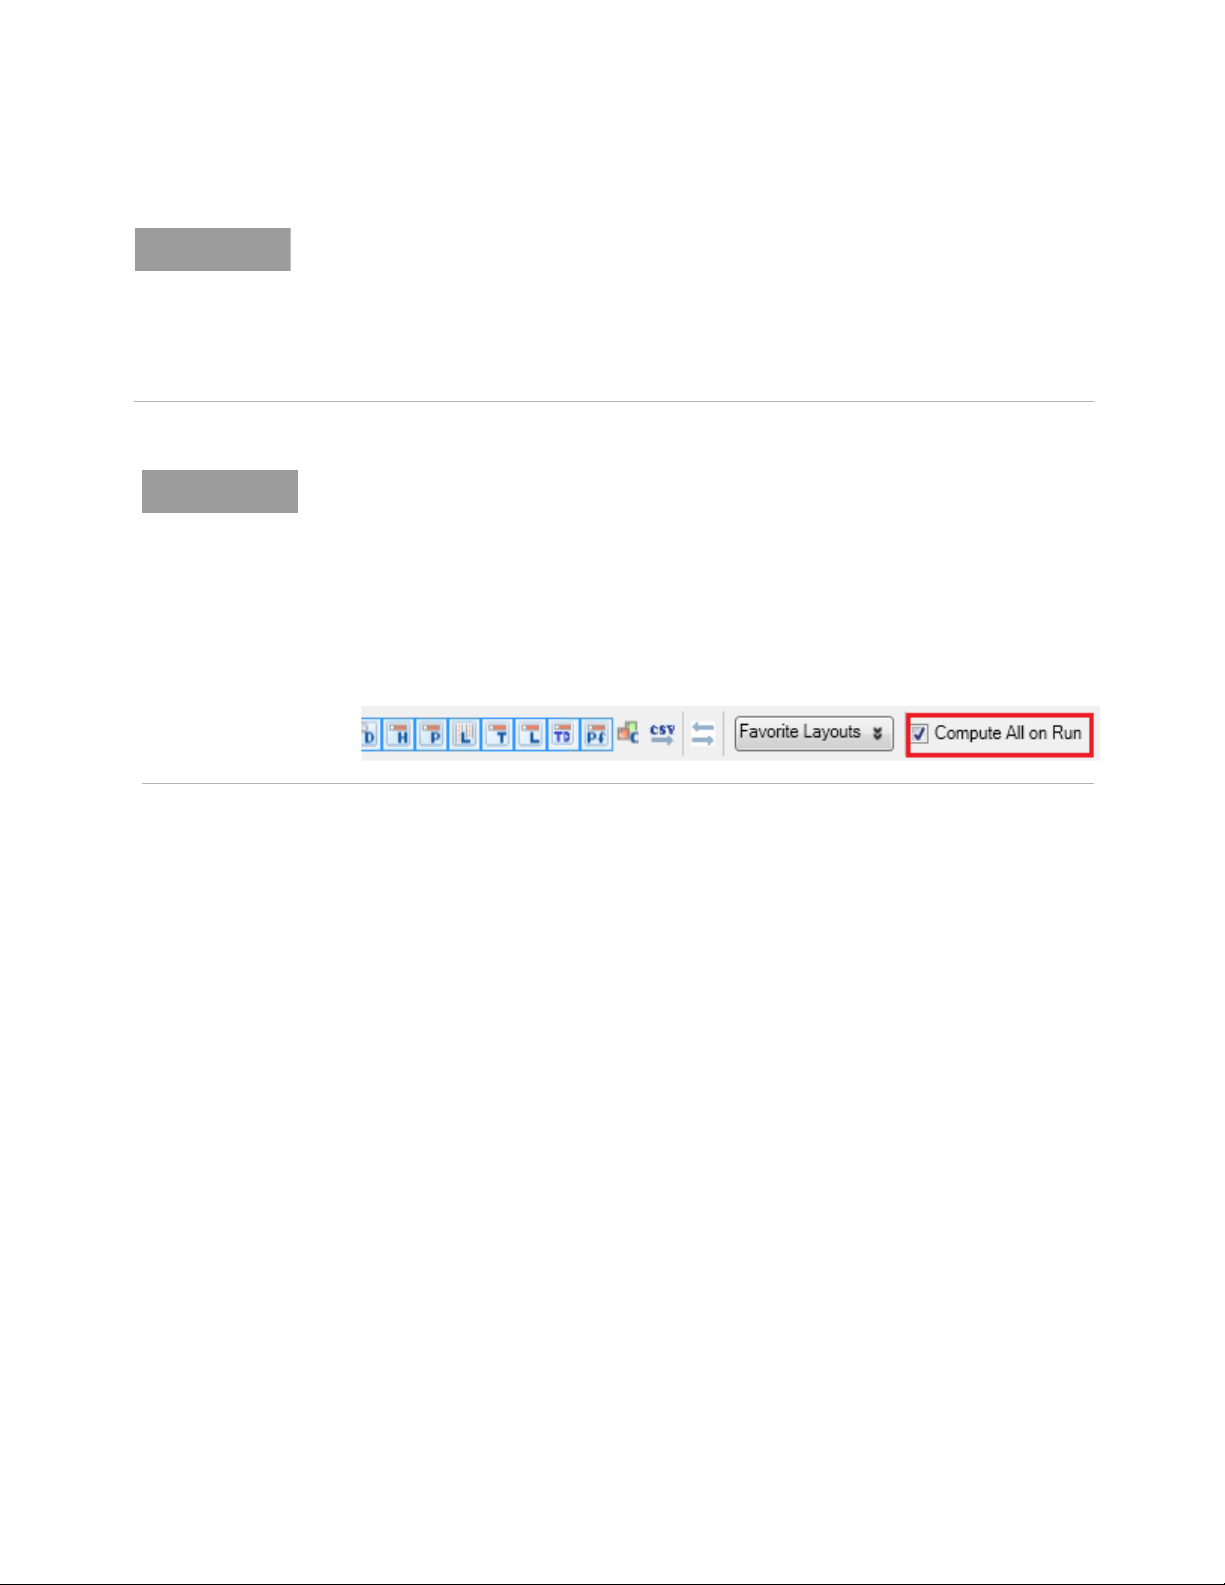
8 Viewing PCIe Gen3 Packets
NOTE
NOTE
Compute This and Compute All are the two options available with the Compute button.
- Compute All allows you to compute traffic overview statistics, decoded transactions, offline
performance summary, and LTSSM states (in their respective tabs) for the captured packets
by a single click of this button.
- Compute This allows you to compute only traffic overview statistics from the captured
packets. When you click Compute, then also only traffic overview statistics s computed.
The Compute button is disabled when U4301A/B PCIe Analyzer module is capturing data. It
becomes enabled when the capture has stopped.
If you want to compute traffic overview statistics in background while the U4301 module is
capturing PCIe data, then select the Compute All on Run check box in the Protocol Viewer
and click the Run toolbar button. This allows you to perform a compute for all the relevant
tabs in Protocol Viewer automatically after the data capture is complete. It thereby helps you
perform a faster compute than performing a compute for each tab individually after the data
is captured.
86 Keysight U4301 PCIe Gen3 Analyzer User’s Guide
Page 87
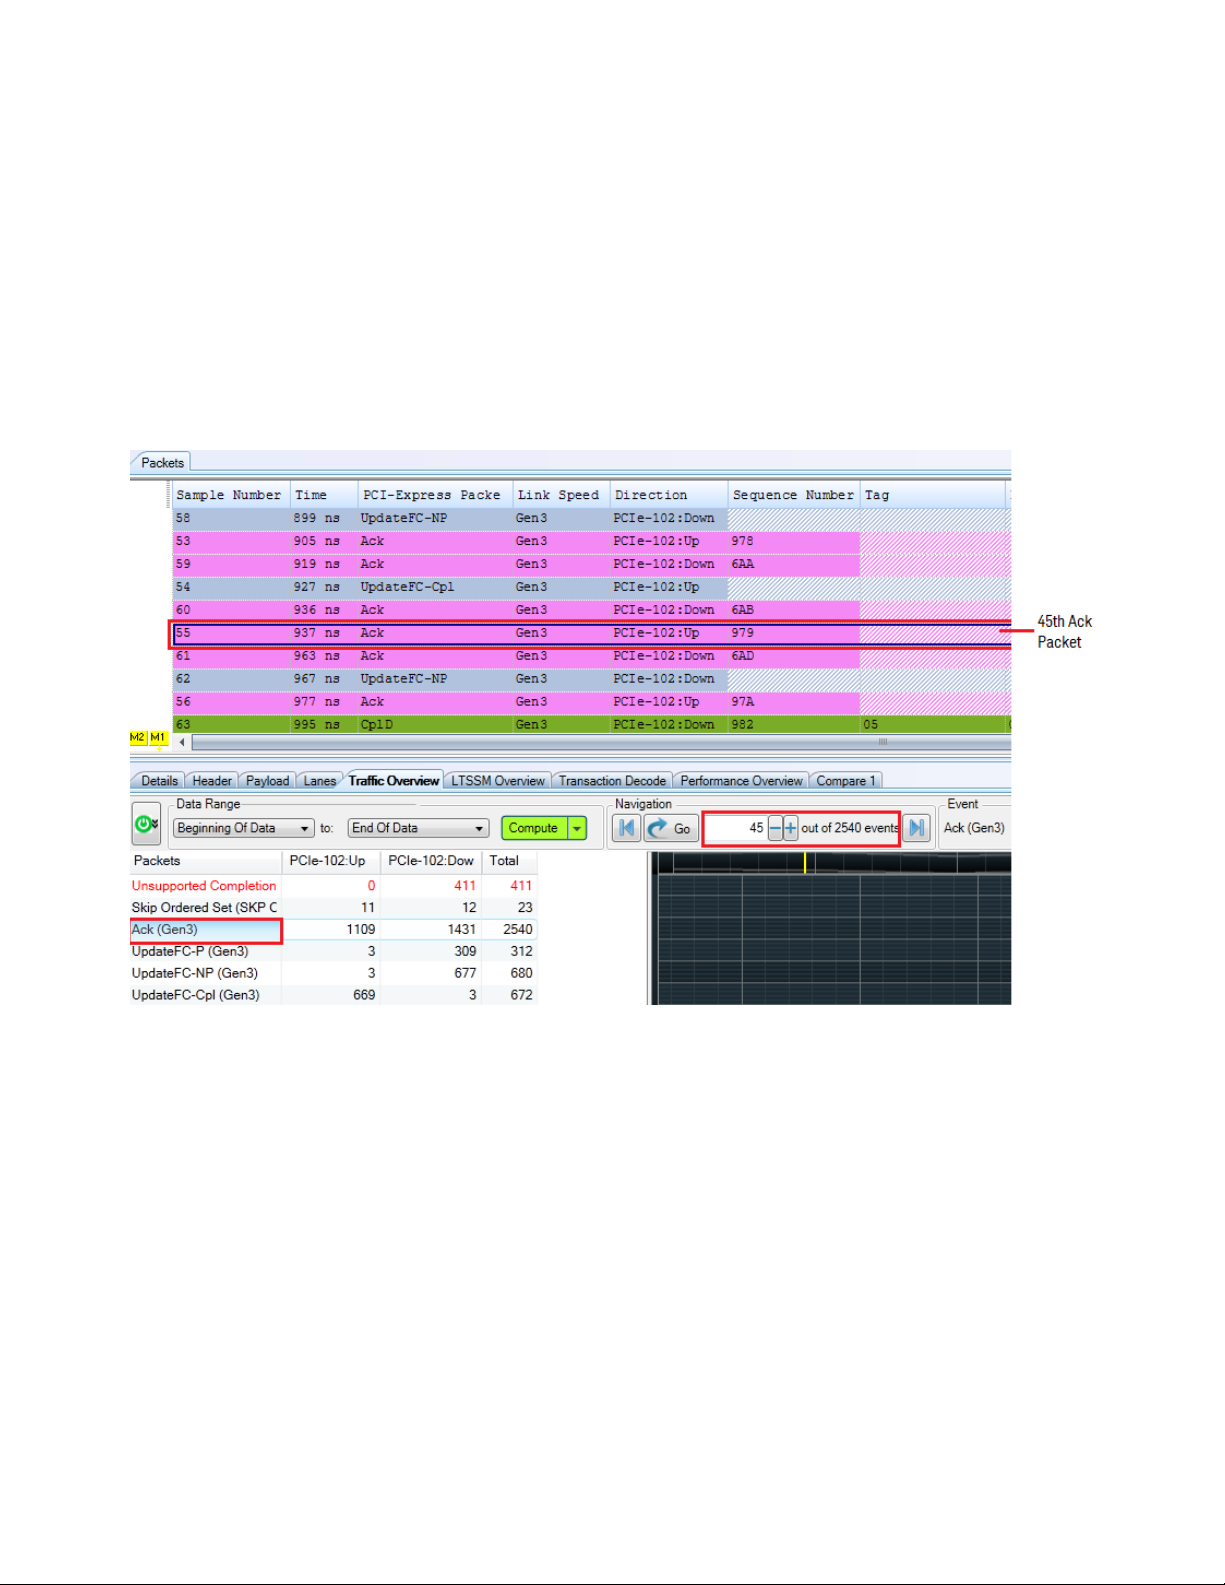
Navigating through the captured PCIe packets
From the displayed traffic overview statistics, you can select a particular packet type and then
navigate through the packets displayed in the upper pane for that packet type. For instance, there
are total 2540 packets of the type Ack in upstream and downstream directions and you want to view
the details of the 45th Ack packet out of these 2540 Ack packets. To go directly to the 45th Ack
packet out of these 2540 Ack packets, you can select this packet type in the Traffic Overview results
and then type 45 in the Navigation text box and click Go. This takes you directly to the 45th Ack
packet in the upper pane of Protocol Viewer.
Viewing PCIe Gen3 Packets 8
You can also navigate through the PCIe packets of a particular direction (upstream or downstream).
To do this, select the count of packets displayed for a particular packet type in the traffic statistics in
the required direction. Then specify the packet number in the Navigation text box and click Go to
reach directly to that packet.
Keysight U4301 PCIe Gen3 Analyzer User’s Guide 87
Page 88
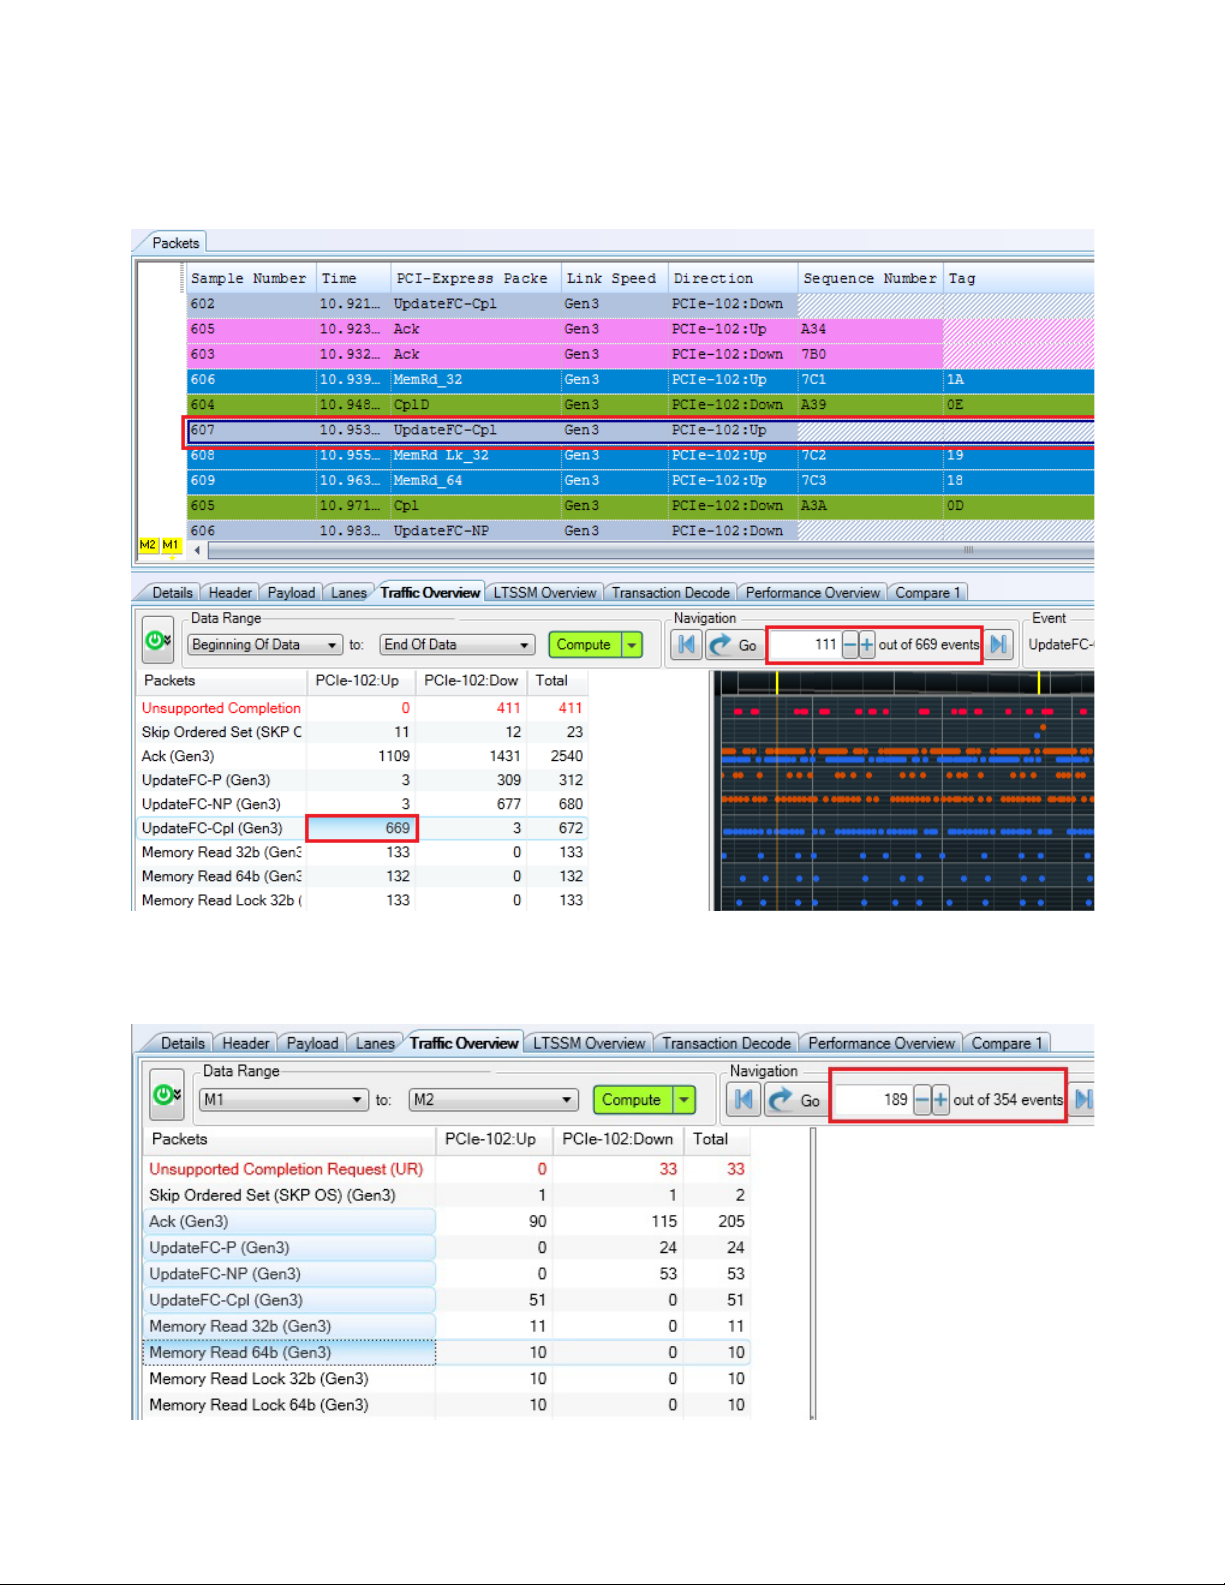
8 Viewing PCIe Gen3 Packets
You can also select multiple packet types in the Traffic Overview tab by clicking a packet type and
then dragging the mouse over to the other packet types that you want to select. When you select
multiple packet types, the Navigation section displays the total packet count for all the selected
packet types.
88 Keysight U4301 PCIe Gen3 Analyzer User’s Guide
Page 89
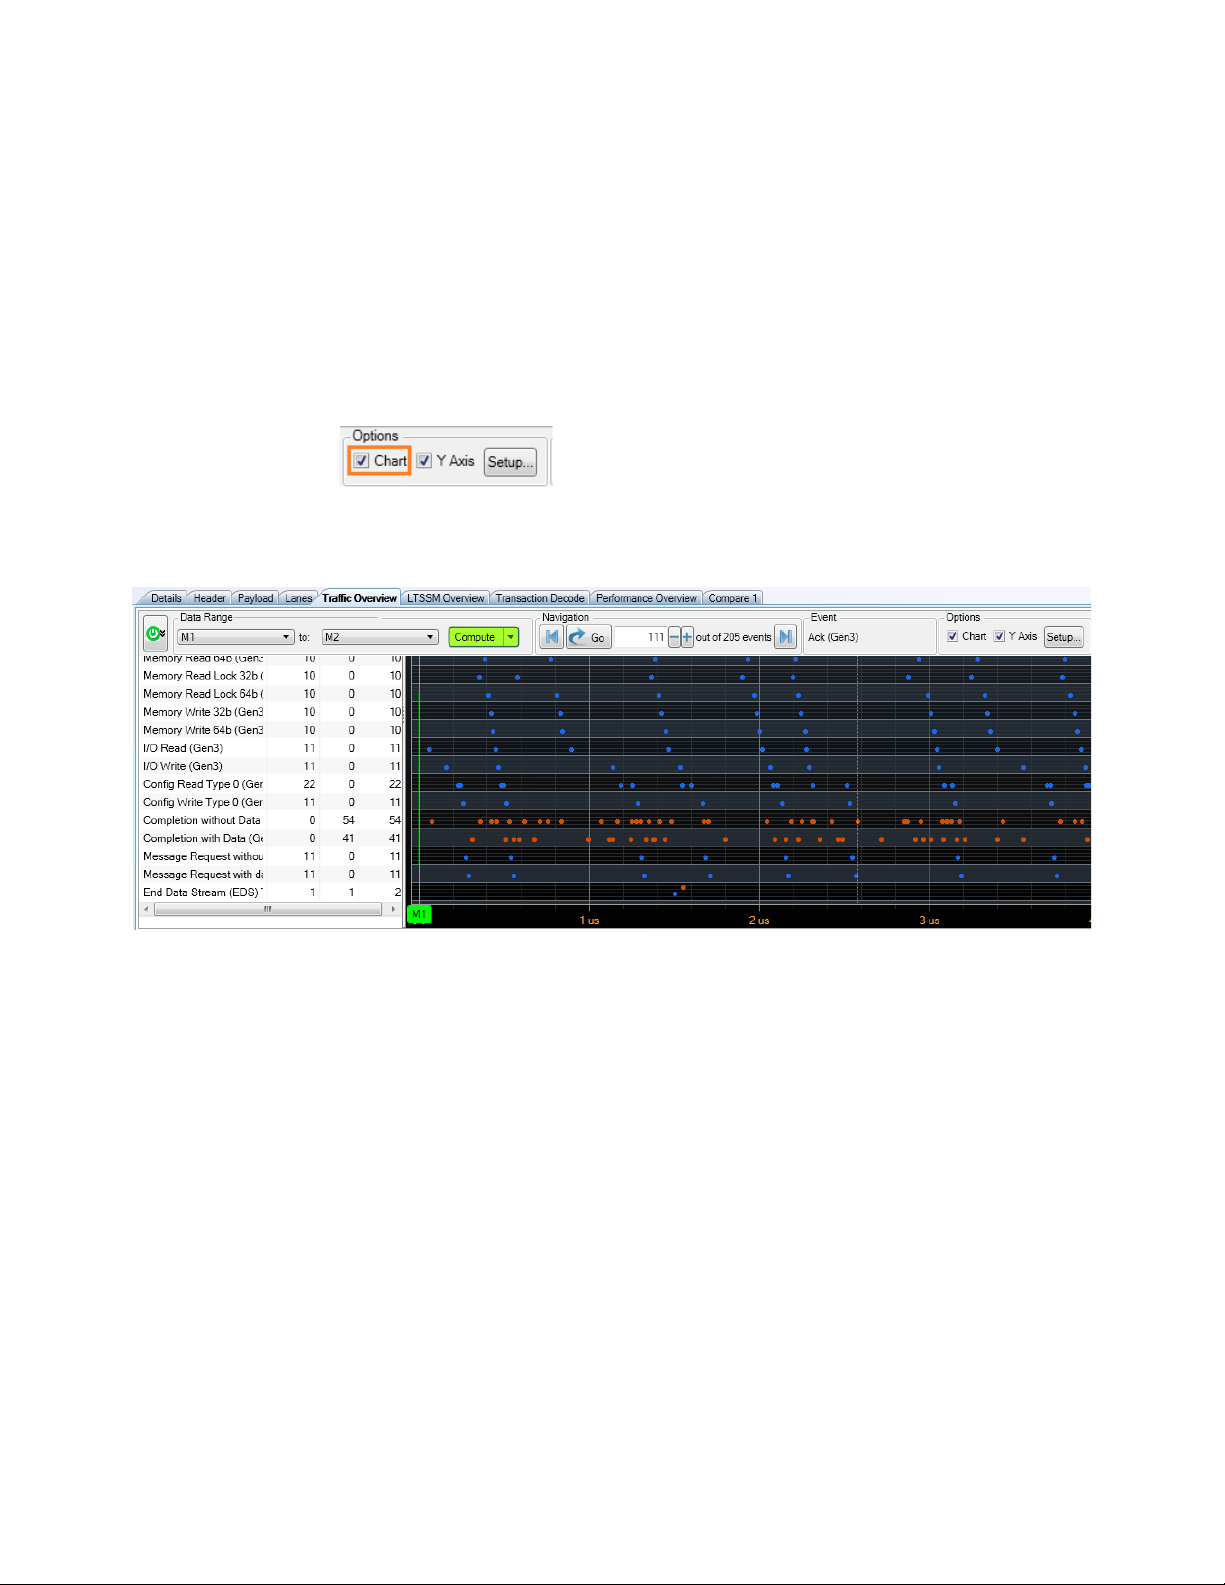
Viewing a Traffic Overview Chart
You can view the computed traffic overview statistics as a band chart in the Traffic Overview tab.
To display a traffic overview chart
1 After you have computed traffic overview statistics, click the Chart checkbox from the Options
groupbox in the Traffic Overview tab.
A band chart is displayed for the packet types found in the computed traffic overview statistics.
The following screen displays a traffic overview band chart.
Viewing PCIe Gen3 Packets 8
Understanding the Displayed Traffic Overview Chart
• In the traffic overview chart, color coding is used to differentiate packet types based on directions.
For instance, in the above screen, blue and orange colors are used to represent packet types in
the upstream and downstream directions respectively.
• For each packet type found in trace, there is a grid row in the chart. A grid row is used to plot the
number of packets of that type for upstream as well as downstream directions. The number of
packets for a packet type are plotted over the period of time as X-axis. The Y-Axis of the chart
displays the applicable packet types.
• The traffic overview chart is always aligned with the packet types list on the left to allow you to
easily map the band rows with the packet types.
Customizing the Traffic Overview Chart
If required, you can customize the traffic overview chart in terms of:
• the color coding used in the chart for packets in upstream and downstream directions and color
coding to represent packets with errors.
• the packets types which you want to display in the traffic overview statistics and chart.
• hiding or displaying the Y-axis of the chart.
Keysight U4301 PCIe Gen3 Analyzer User’s Guide 89
Page 90
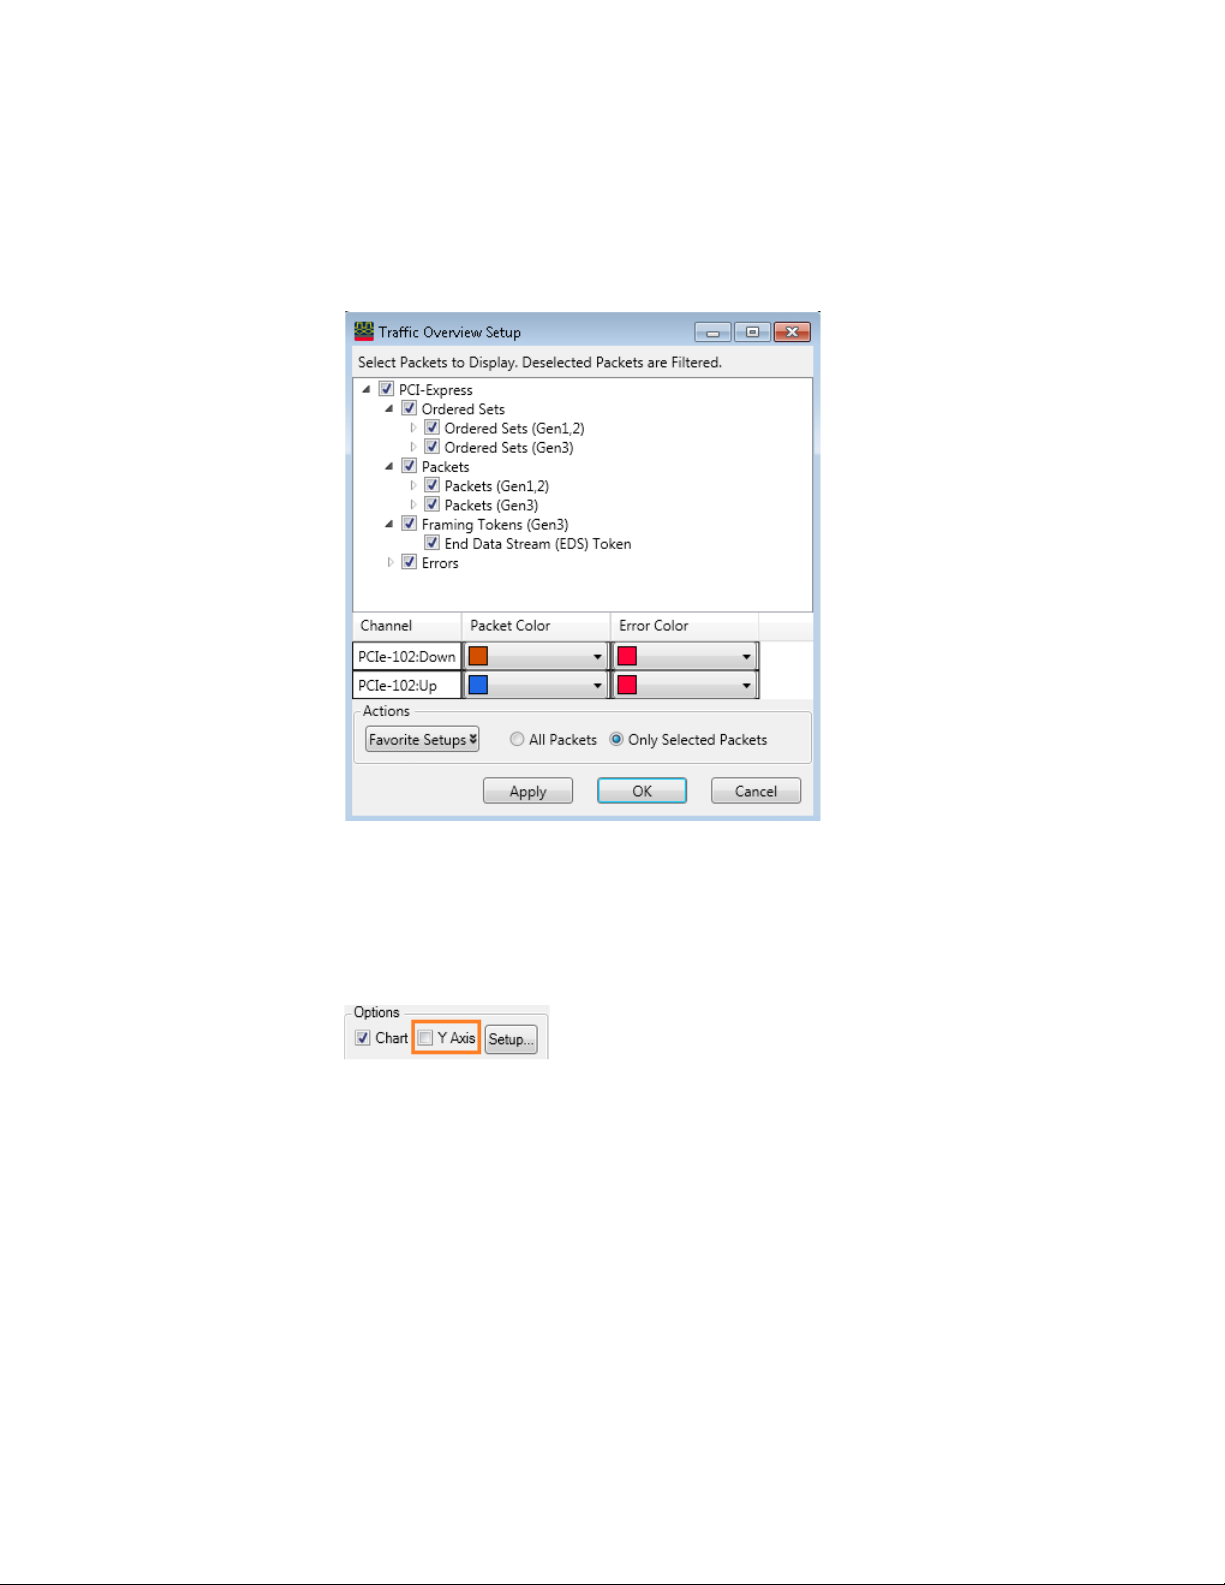
8 Viewing PCIe Gen3 Packets
To customize the traffic overview chart
1Click the Setup button from the Options groupbox in the Traffic Overview tab.
The Traffic Overview Setup dialog box is displayed.
2 Select the packet colors and packet types to display.
3Click OK.
The changes are reflected in the traffic overview chart.
To hide the Y-axis of the traffic overview chart
1 Deselect the Y Axis checkbox from the Options groupbox in the Traffic Overview tab.
Zooming In/Out the Traffic Overview Chart
You can zoom in or zoom out a defined area in the chart or the complete chart.
To zoom X-Axis for a defined area in the chart
1Click the Zoom X-Axis option from the combo box displayed in the Pan and Zoom section of the
chart pane to make it active.
2 Move the mouse pointer to the traffic overview chart location from which you want to begin
zooming.
3 Left-click at this location and while keeping the left mouse button pressed, drag the mouse to the
chart location till which you want to zoom the display. As you move the mouse, the zooming
extent is defined in chart and highlighted with gray.
When you release the left mouse button, the defined X-axis area is zoomed for the displayed chart.
Following screen displays a zoomed in traffic overview chart.
90 Keysight U4301 PCIe Gen3 Analyzer User’s Guide
Page 91
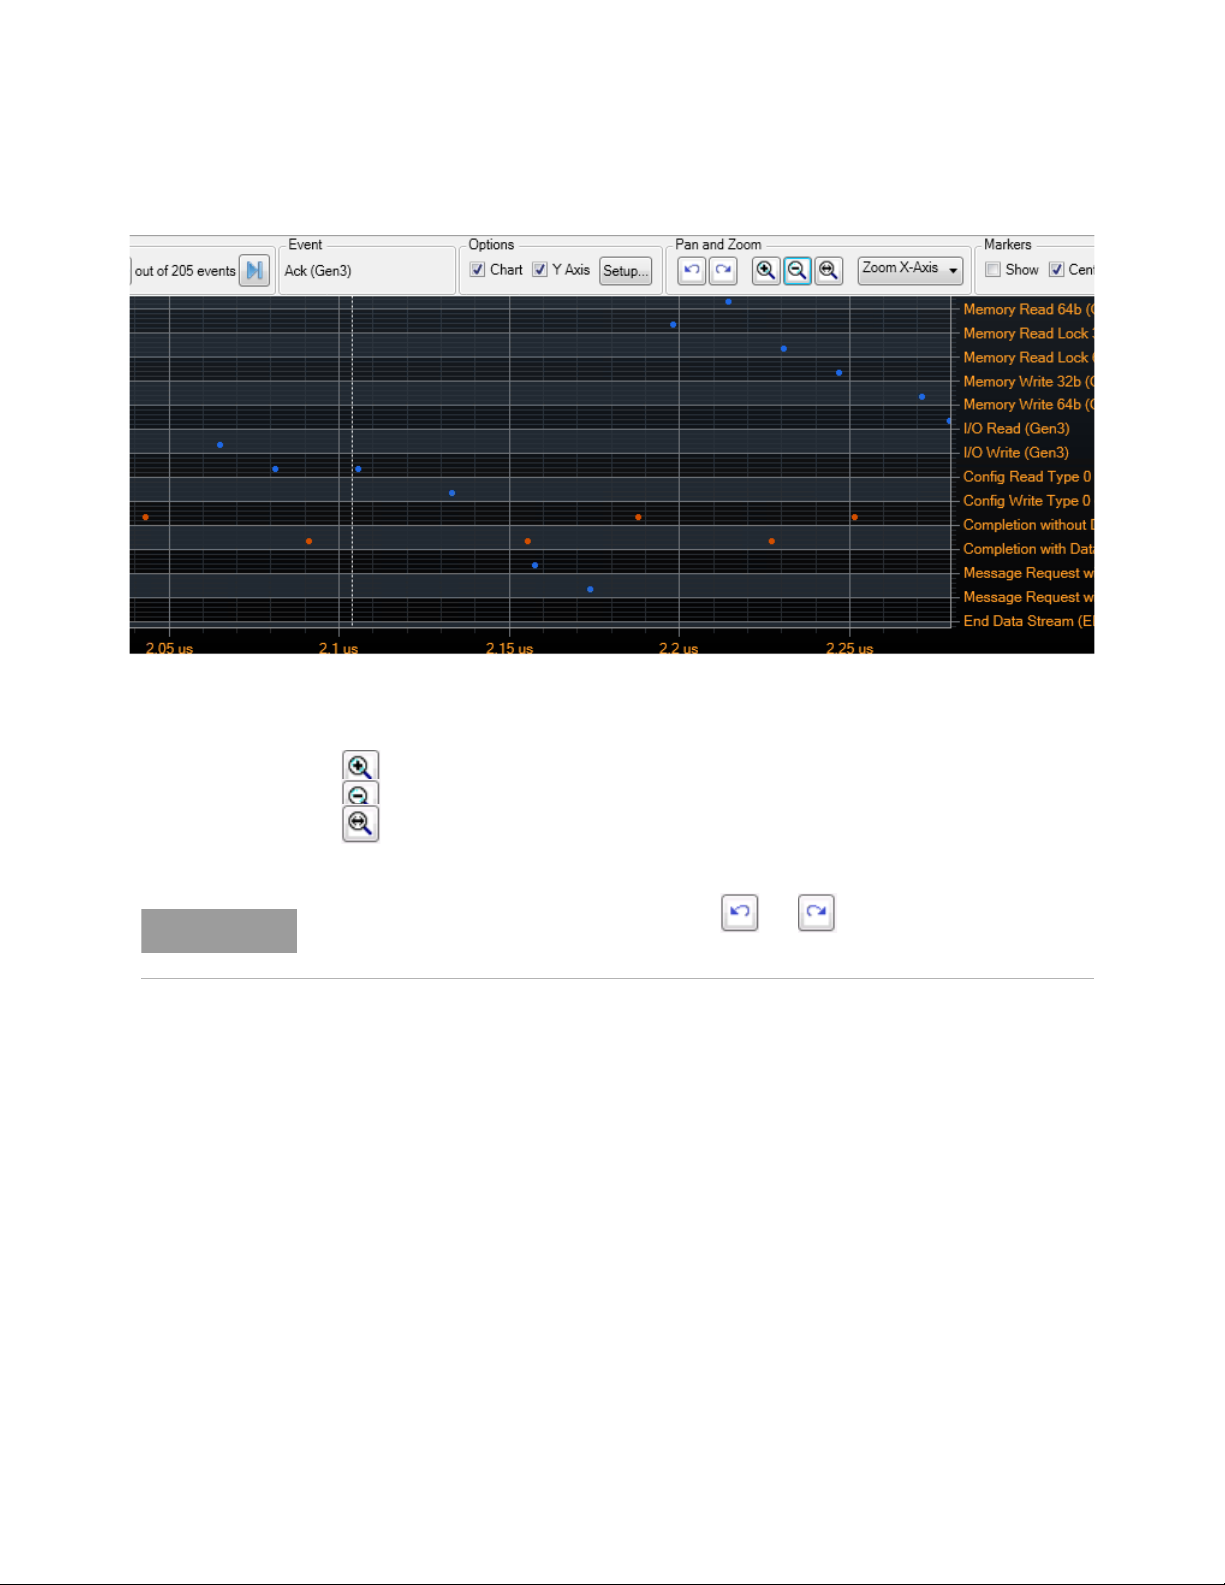
Viewing PCIe Gen3 Packets 8
NOTE
You can also zoom in or zoom out the complete chart. To do this, use the following buttons in the Pan
and Zoom section of the chart pane.
• - Zoom In magnifies the center 50% of the chart to the full width of the chart.
• - Zoom Out reverts the magnification in the chart.
• - Zoom Out Full displays the entire range of Computed data across the full width of the
chart.
You can undo and redo zooms by clicking the and buttons in the Pan and Zoom
section of the charts pane.
Placing markers in the traffic overview chart
You can place markers in the traffic overview chart and use these markers to navigate to the PCIe
packet associated with the chart location at which you placed a marker. This helps you navigate to
the exact trace position that corresponds to that chart location. Markers placed in the chart are
correlated to markers displayed in the trace data in the upper pane of the Protocol Viewer.
Keysight U4301 PCIe Gen3 Analyzer User’s Guide 91
Page 92
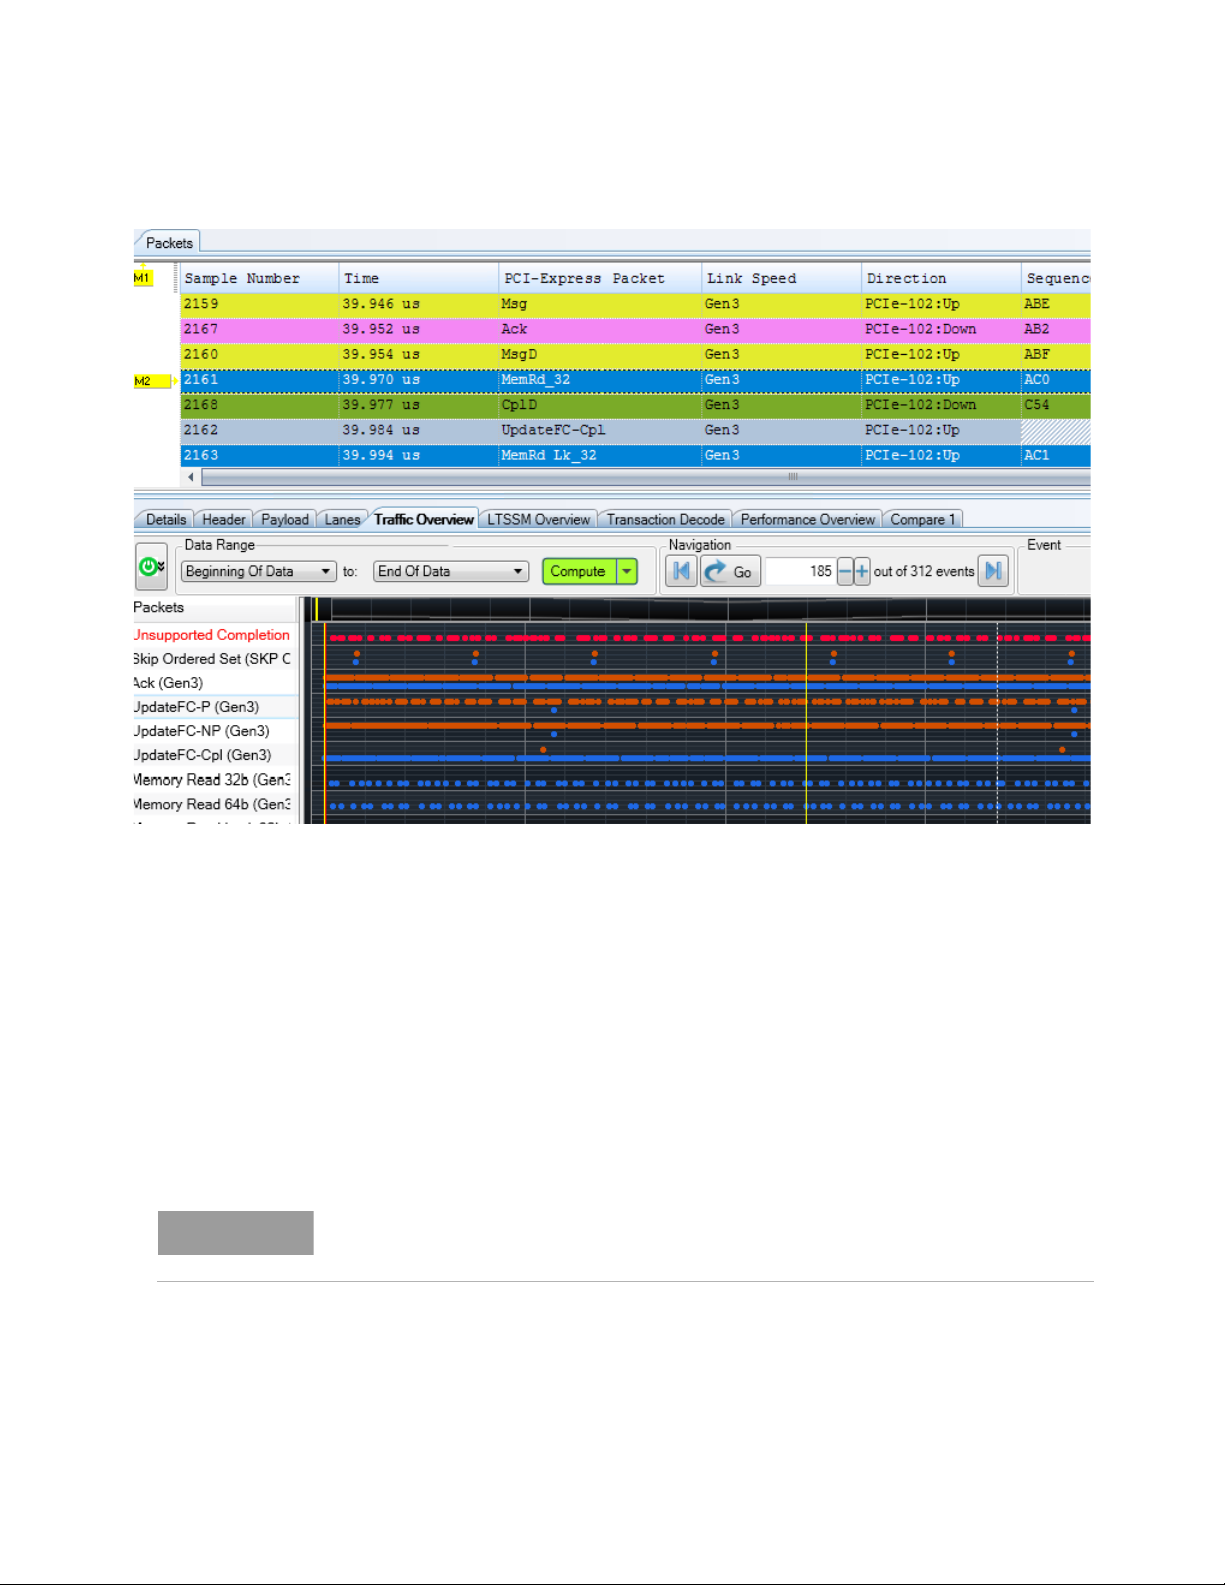
8 Viewing PCIe Gen3 Packets
NOTE
To place a marker in the traffic overview chart
1 Double-click the location in the chart at which you want to place a marker. A new marker is
added to that chart location as a yellow vertical line and at the corresponding trace location in
the upper pane.
Alternatively, right-click the chart location where you want to place a marker. Then select Place >
New Marker or select an existing marker to place that marker at the current location.
To navigate to a particular marker placed in the chart
In situations when you have placed multiple markers in the chart, you may want to navigate to a
particular marker and its associated trace position in the upper pane. To do so, right-click anywhere
in the chart, select Go To and then select the marker to which you want to navigate.
On doing so, the chart display moves to the point at which the selected marker is located. Also, the
trace position corresponding to the selected marker is highlighted in the upper pane.
If the markers are not displayed in the chart, click the Show Markers button at the top of the
chart pane.
92 Keysight U4301 PCIe Gen3 Analyzer User’s Guide
Page 93
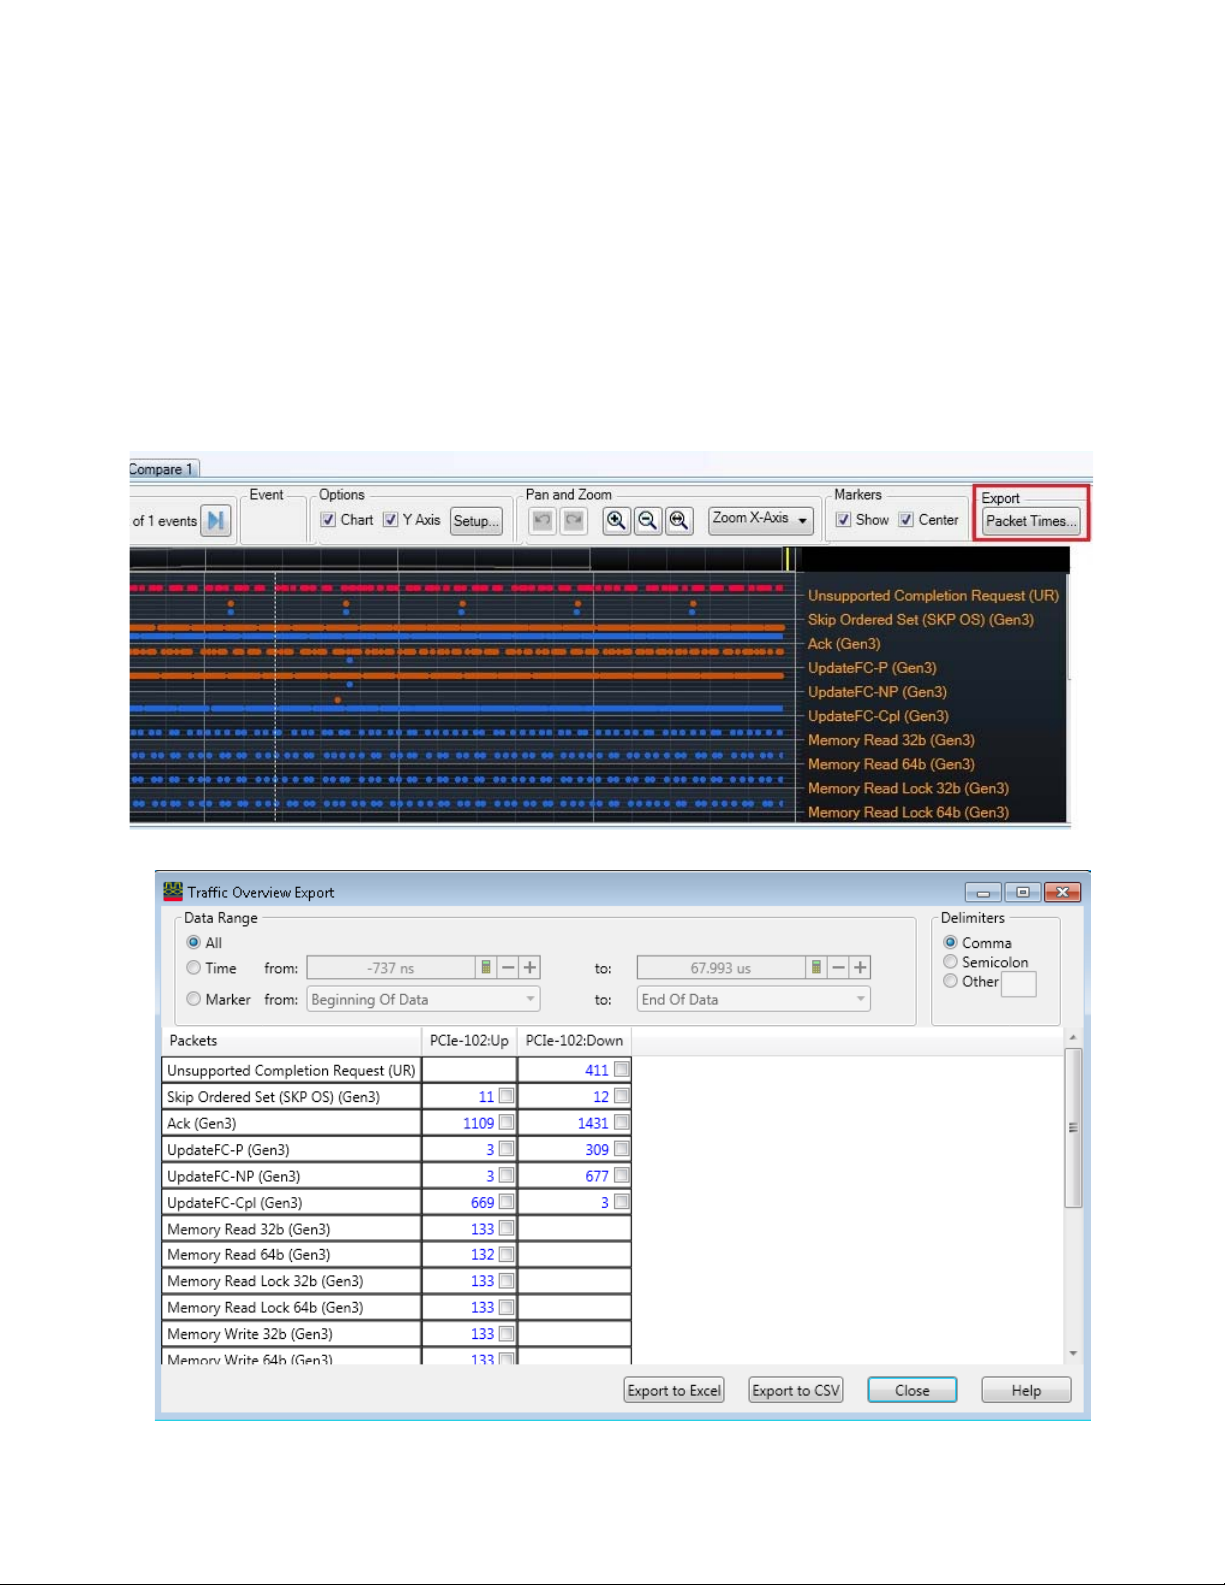
Viewing PCIe Gen3 Packets 8
Exporting Packet Times from a Traffic Overview Chart to a .csv or an Excel File
You can export the packet times from the data displayed in a traffic overview chart to a specified .csv
or Excel file.
To export packet times from a traffic overview chart
1 Ensure that the traffic overview chart is displayed in the Traffic Overview tab.
2Click the Packet Times button in the Export section of the Traffic Overview tab. This button is
disabled if the traffic overview chart is not displayed in the tab.
The Traffic Overview Export dialog box is displayed.
Keysight U4301 PCIe Gen3 Analyzer User’s Guide 93
Page 94
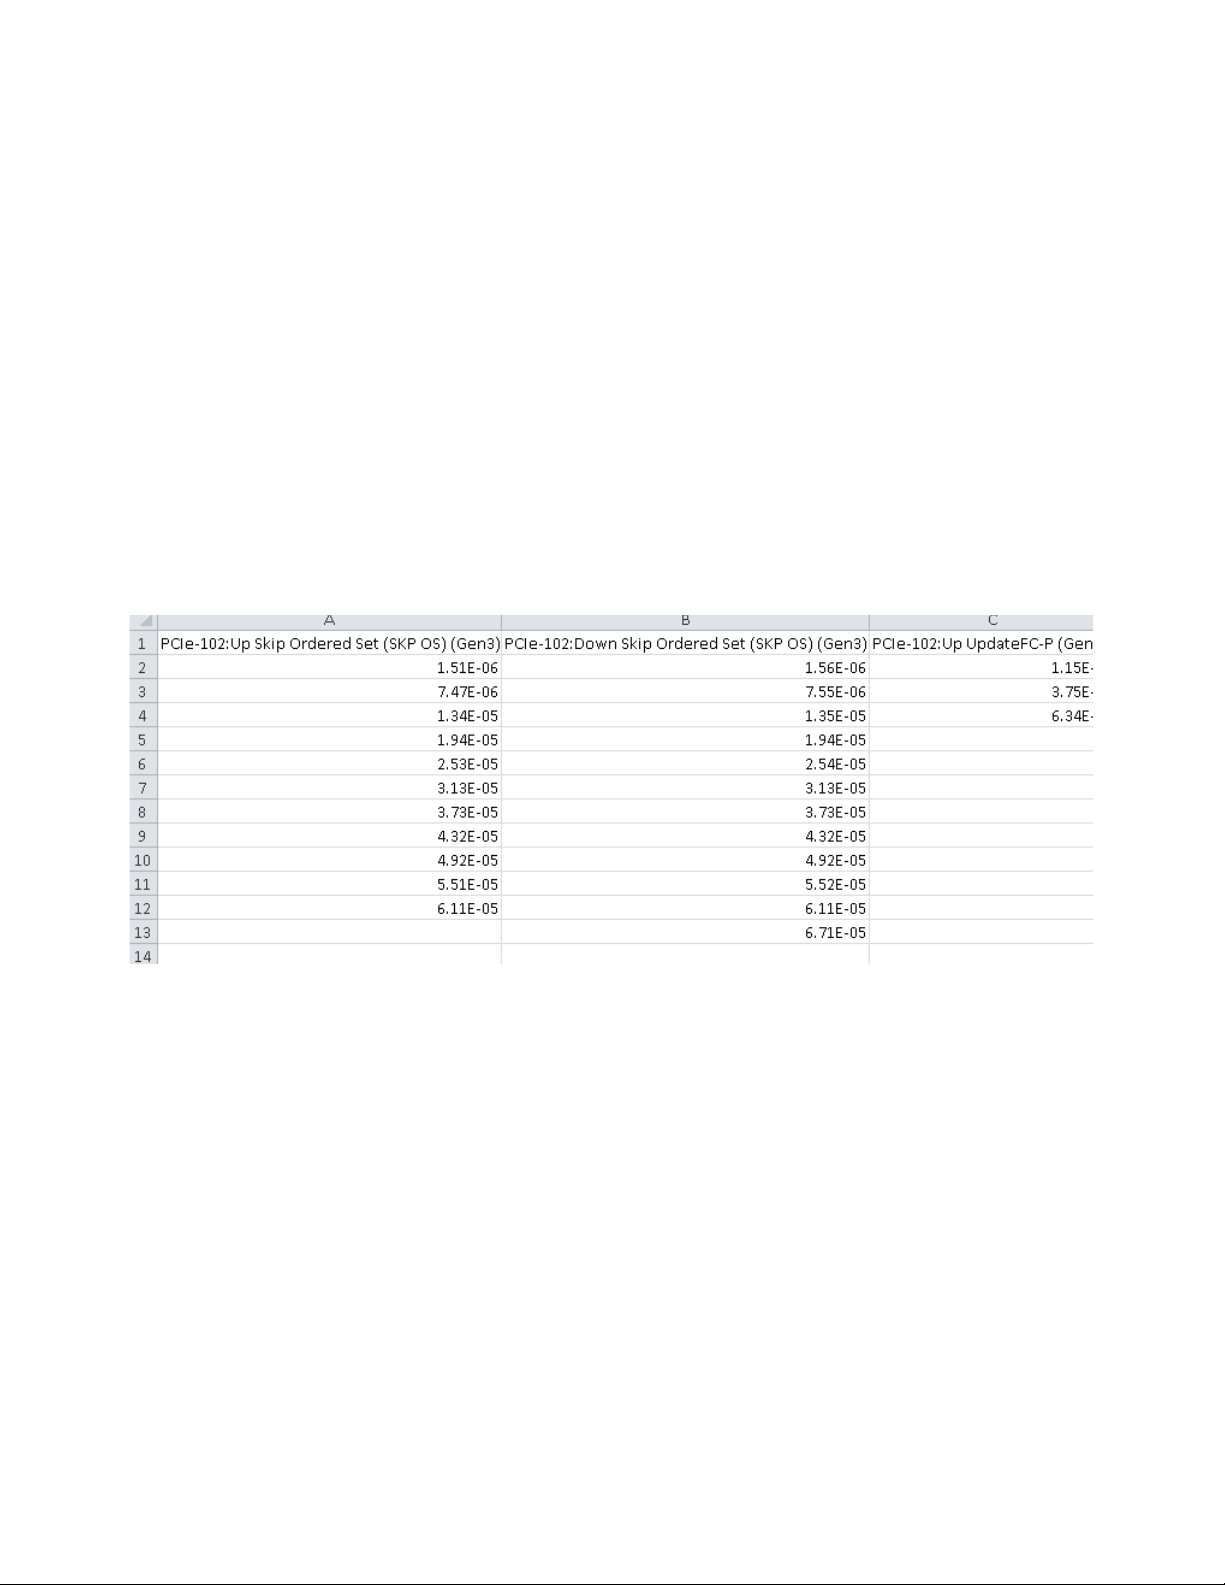
8 Viewing PCIe Gen3 Packets
3In the Data Range groupbox, specify the range of traffic data for which you want to export packet
4In the Delimiter groupbox, select the delimiter that you want to use to delimit the exported data in
5 In the lower pane, a checkbox is displayed with the statistical value applicable for a packet type
6Click Export to Excel or Export to CSV as per your requirement.
7Click Close.
The packet time (X-axis value) of each packet belonging to the selected packet types is exported to
the specified file. The direction and packet types are represented as column headers in this exported
data. A sample of the exported packet times is displayed.
times.
the specified file.
Based on the data range that you specify in Step 3, the applicable traffic statistics is displayed in
the lower pane of the Traffic Overview Export dialog box.
in a particular direction. Select the checkboxes displayed with the packet types to define the data
to be exported. The packet times of only those packet types are exported for which you select the
checkboxes.
94 Keysight U4301 PCIe Gen3 Analyzer User’s Guide
Page 95

Exporting Captured PCIe Data to a .csv File
You can export the captured PCIe packet information from the Protocol Viewer window to a specified
.csv file and use it later in other analysis tools. You do this by clicking the toolbar button in the
Protocol Viewer window. On clicking this toolbar button, the Protocol Export dialog box is displayed
in which you can specify the details of export such as the range of packet data that you want to
export and the delimiter that you want to use to delimit the exported data in the specified .csv file.
For details on how to export data to a .csv file, click the Help button in the Protocol Export dialog
box.
Viewing PCIe Gen3 Packets 8
Keysight U4301 PCIe Gen3 Analyzer User’s Guide 95
Page 96

8 Viewing PCIe Gen3 Packets
96 Keysight U4301 PCIe Gen3 Analyzer User’s Guide
Page 97

Keysight U4301 PCIe Gen3 Analyzer
User’s Guide
9 Viewing LTSSM States,
State Transitions, and
Equalization Summary
LTSSM Overview / 98
Configuring and Computing LTSSM States and Equalization Summary / 102
Viewing LTSSM States/Transitions Data / 104
Viewing and Interpreting Equalization Summary Data / 106
Navigating Through the LTSSM Transitions/States/EQ occurrences / 110
Interpreting LTSSM States and Transition Results / 111
The U4301A/B PCIe Gen3 analyzer lets you view LTSSM states, state transitions, and equalization
summary as detected in the data captured in a trace. Using this data, you can test or debug the
DUT’s LTSSM functions.
This chapter describes how you can view these LTSSM states and equalization summary data.
Page 98
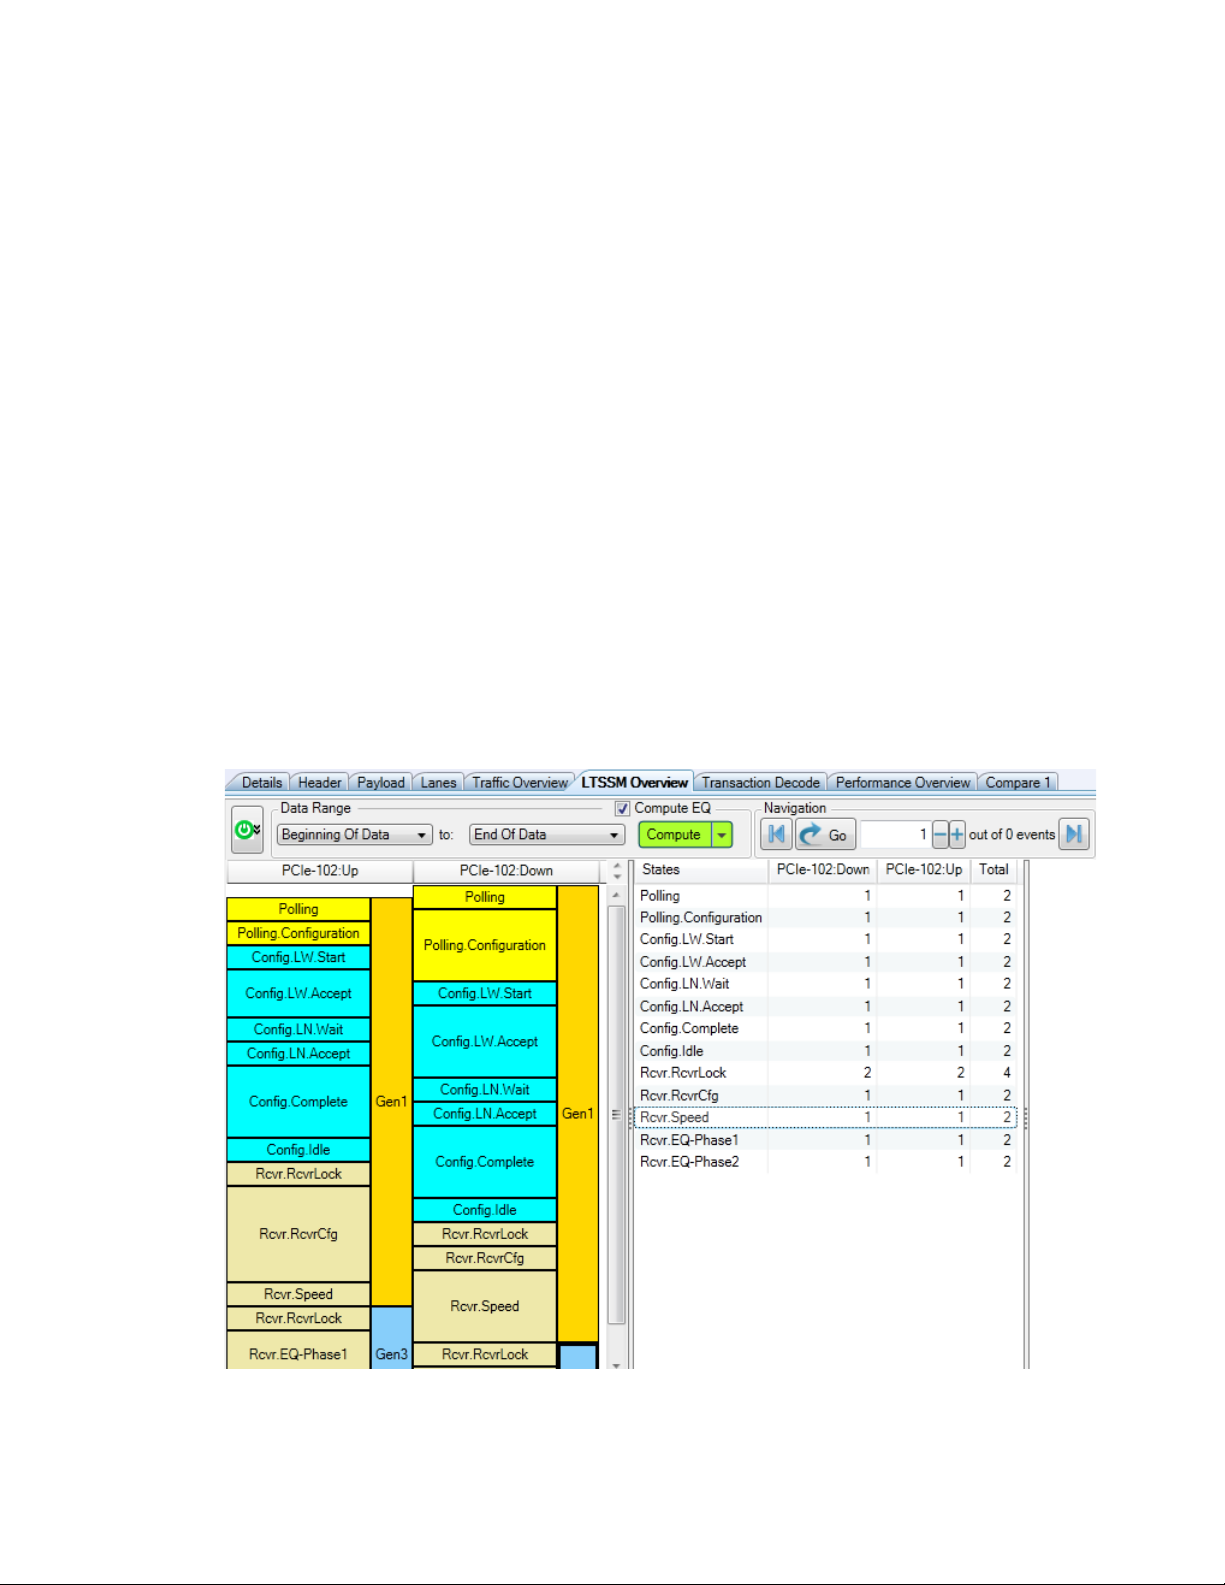
9 Viewing LTSSM States and State Transitions
LTSSM Overview
Link Training and Status State Machine (LTSSM) drives and controls the link initialization and
training process for a PCIe device to enable the normal data exchange between the two PCIe devices
over the link. LTSSM operates at the physical layer level and transits through various states and
substates during link initialization, training, and management. During each of these states,
appropriate physical layer packets (training sequences) are exchanged between the link partners to
initialize, train, and manage the link.
To begin communication with a PCIe device, the link training process must complete successfully.
This makes link training one of the most crucial process in testing and validating a DUT. The
participation in the equalization procedure at Gen 3 speed makes this process more challenging to
test and validate.
The LTSSM Overview pane in the Protocol Viewer window of the Logic and Protocol Analyzer GUI helps
you in verifying the link training process and finding out reasons for any failure in this process. This
pane provides an overview of the link training process by displaying:
• a sequential list of the LTSSM states and their transitions.
• equalization summary in terms of the number and values of equalization transmitter coefficients
exchanged in TS frames found in the trace.
To display these states, transitions and equalization summary, the software analyzes a user-specified
data range or the entire data captured in a trace and presents the list of transitions/states/EQ data,
from that trace.
98 Keysight U4301 PCIe Gen3 Analyzer User’s Guide
Page 99
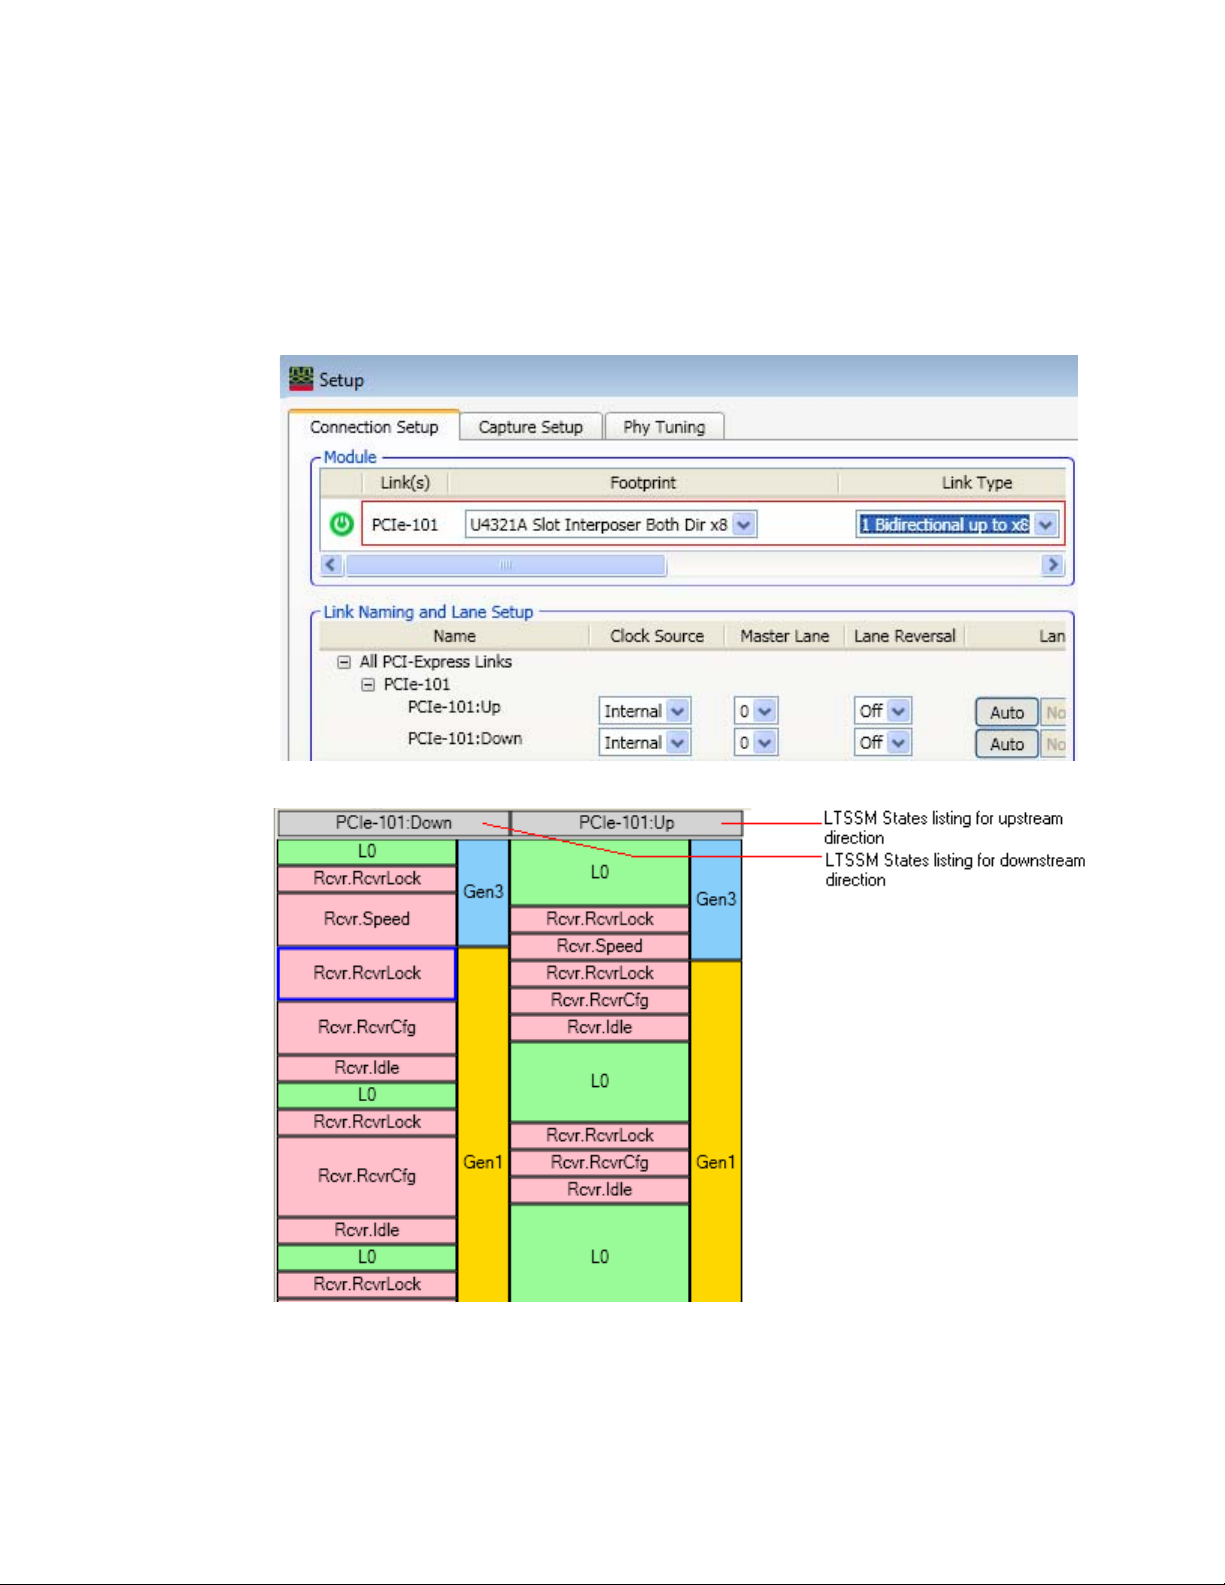
Viewing LTSSM States and State Transitions 9
The LTSSM Overview pane can display LTSSM transition, state and EQ data, for both upstream as
well as downstream link directions. However, this display depends on how you configured the
direction of data capture (upstream, downstream, or bidirectional) in the Connection Setup tab of the
Setup dialog box of the U4301A/B module. For instance, if you configured a bidirectional data
capture using U4301A/B, then LTSSM states are displayed for both directions.
Using the LTSSM Overview pane, you can view the LTSSM transitions, states and EQ, during events
such as:
• Link initialization and configuration to bring the link to an operational state.
• Link recovery or retraining in situations such as speed changes, power management, or
recovering from a link error.
Keysight U4301 PCIe Gen3 Analyzer User’s Guide 99
Page 100

9 Viewing LTSSM States and State Transitions
• Downgrading or upgrading the link speed in response to a link speed change request.
• Performing the Equalization procedure before reaching the Gen3 (8.0 GT/s) speed during the link
training or retraining.
100 Keysight U4301 PCIe Gen3 Analyzer User’s Guide
 Loading...