

Page 1

v.1.0
PT-14
Tracer
USER MANUAL
Page 2

KharkovEnergoPribor Ltd. | KEP Ltd.
+380 57 393 1069
www.kep.ua | info@kep.ua
PT-14
2
USER MANUAL
CONTENTS
GENERAL SAFETY SUMMARY ......................................................................................... 3
SAFETY TERMS AND SYMBOLS ...................................................................................... 3
1 INTRODUCTION .............................................................................................................. 4
1.1 Application ............................................................................................................. 4
1.2 Description ............................................................................................................ 4
2 SPECIFICATIONS ............................................................................................................ 5
2.1 Main technical data ............................................................................................... 5
2.2 Environmental condition ........................................................................................ 6
3 DESIGN ............................................................................................................................ 7
3.1 Appearance ........................................................................................................... 7
3.2 Packing .................................................................................................................. 8
4 OPERATION PROCEDURES .......................................................................................... 9
4.1 First use ................................................................................................................. 9
4.2 Battery charging .................................................................................................... 9
4.3 Selection and setting the main parameters via the MENU options ...................... 10
4.4 Operating Modes ................................................................................................. 12
4.5 Locating Methods ................................................................................................ 14
4.6 Depth and current intensity of the utilities ............................................................ 21
4.7 Testing of ground plots ........................................................................................ 23
5 METHODS OF LOCATING DAMAGED PIPELINES AND UTILITIES ............................ 26
5.1 Method of locating by current .............................................................................. 26
5.2 Fault finding with insulation control ...................................................................... 26
5.3 Cable breakdown location ................................................................................... 30
5.4 Picking-up cables and conductors ....................................................................... 34
5.5 Locating the line-to-ground faults of the overhead lines in the networks of 6 ~ 10
kW with isolated neutral. ................................................................................................ .... 35
6 TROUBLESHOOTING AND REMEDIES ........................................................................ 36
Page 3

KharkovEnergoPribor Ltd. | KEP Ltd.
+380 57 393 1069
www.kep.ua | info@kep.ua
3
PT-14
USER MANUAL
WARNING. Warning statement identifies conditions or practices that
could result in injury or death.
CAUTION. Caution statement identifies conditions or practices that
could result in damage to the Tester or equipment to which it is
connected.
This is the user manual for tracer PT-14 (hereinafter referred to as
Tracer). It contains all of the information a new user will need to
operate the Tracer effectively as well as safety conditions while using
the Tracer.
Note that all illustrations at this document are just for user’s
consideration. The actual design of the Tracer may be different.
The manufacturer can make changes into the Tracer construction,
which will not affect its operation, without special announcement.
GENERAL SAFETY SUMMARY
Review the following safety precautions to avoid injury and prevent
damage to this product or any products connected to it. To avoid
potential hazards, use this product only as specified. Only qualified
personnel should perform service procedures.
Do not operate with suspected failures. If you suspect
the product has been damaged, have it inspected by
qualified service personnel;
Do not operate in wet/damp conditions;
Do not operate in an explosive atmosphere. Keep
product surfaces clean and dry.
SAFETY TERMS AND SYMBOLS
These terms may appear on the Tracer or in the user manual:
Page 4

KharkovEnergoPribor Ltd. | KEP Ltd.
+380 57 393 1069
www.kep.ua | info@kep.ua
PT-14
4
USER MANUAL
1 INTRODUCTION
1.1 Application
The Tracer paired with the GT-75 and GT-15 Transmitters is
designed to locate and trace cable and pipe lines (hereinafter
referred to as Utilities).
1.2 Description
The Tracer:
locates the planimetric position, orientation and misalignment of
finds and traces the areas of faulty insulation of the utility line and
picks the cable conductors and detects the short-circuited areas or
logs readings with positional data received from external GPS
utilities with simultaneous indication of a target line depth and
intensity of current through the line in the TRACE mode;
locates the position and depth of the line in the «TRACE/ SONDE»
mode;
wire break (using the MD-01 mini-sensor);
module; transmits these data to a PC.
Without the aid of the Transmitter the Tracer:
on the «50Hz» and «550Hz» frequencies locates cables by
detection Power signals naturally occurred on the utilities;
on the «100Hz» and «300Hz» frequencies locates utilities and
finds areas of damaged insulation of pipes by detecting
Electrochemical protection signals;
on the «55Hz» and «1450Hz» frequencies locates the areas of
ground fault of overhead lines by detection Power current
harmonics;
in the «AIR» mode locates utilities by re-radiated broadcasting and
telephone signals within the frequency band from 48Hz to 14kHz;
in the «RADIO» modes locates utilities by re-radiated broadcasting
signals within the frequency band from 10kHz to 36kHz.
Page 5

KharkovEnergoPribor Ltd. | KEP Ltd.
+380 57 393 1069
www.kep.ua | info@kep.ua
5
PT-14
USER MANUAL
Parameter
Value
Frequency,
Hz
Sensitivity,
min, µA/m*
Rated values of operating frequencies
(with Transmitter); sensitivity on the
selected frequency
273
526
1024
8928
32768 (33k)
500
300
150
25
5
Rated values of operating frequencies
(with Transmitter), Hz
50, 100, 300, 550 and 1450
Dynamic range of input signals, dB, min
102
Bandwidth for each operating
frequency, max, Hz
at the level of
minus 3dB
at the level of
minus 60 dB
9
24
Utility depth, m
from 0.10 to 6.00
Operating frequency current in the
utility
from 10mA to 10.0A
Admissible error of the depth of single
extended utility line, max
± {[4+0.3h(h+1)]%+0.1m},
where h is a measured depth
Admissible error of planimetric location
of a single line at the depth of 2 m, min
± 0.1
Operating frequency voltage at the
SONDE jack input
from 0.01mV to 1.70V
Sensitivity at the SONDE jack input at
the signal-noise ratio of 6dB, mV, min
0.05
Limits of admissible main error of
voltage measurement, max, % + dgt
± (3 + 3)
Input resistance at the SONDE jack
input, MOhm
1
Overall dimensions, max, mm
700 × 300 × 140
Continuous operation under the normal
conditions with full battery, min, h
5
Weight, max, kg
1.8
* Note. Rated for the “Broad peak” method. The signal-noise ratio is 6 dB
2 SPECIFICATIONS
2.1 Main technical data
The main technical data of the Tracer are shown in Table 1.
Table 1 – Main technical data of Tracer
The Tracer provides signal gain adjustment with the step of 6 dB
(each step provides doubled gain).
Page 6
KharkovEnergoPribor Ltd. | KEP Ltd.
+380 57 393 1069
www.kep.ua | info@kep.ua
PT-14
6
USER MANUAL
Factors
Storage and
transportation
Operating
Ambient temperature, ˚С
- 50 … + 70
- 20 … + 55
Atmospheric pressure, mm Hg
460 to 800
Relative humidity, %
90 (at 30 ˚С / non-condensing)
Power supply voltage is from 7.5V to 5.2V. The Tracer is powered
form a rechargeable Ni-Mh battery with the rated voltage of 6 V and
capacity of 2000mA∙h. The Tracer may be powered from the pack of
five replacement batteries of the AA type put into the battery
compartment. You may also use five AA - type batteries with the
voltage of 1.2V.
The batteries may be replaced without breaking a seal.
The Tracer has a battery level indicator, and it goes off automatically
to avoid excessive discharge when the battery is low.
The Tracer is switched to a battery charging mode when the power
supply unit is connected. The Tracer secures the battery against
overcharge when the battery is on its place.
The Tracer provides wireless Bluetooth communication with external
GPS Bluetooth module and PC.
2.2 Environmental condition
Ordinary values of the environment climatic factors for operating the
Tracer are specified in Table 2.
Table 2 – Tracer environment conditions
The Tracer can only be transported in proper packaging, in
accordance with section 3.2 of this user manual. When transporting
the Tracer, avoid vibrations and other physical impact on the Tracer.
Page 7

KharkovEnergoPribor Ltd. | KEP Ltd.
+380 57 393 1069
www.kep.ua | info@kep.ua
7
PT-14
USER MANUAL
1
Jack for the power supply unit;
2
Jack for headphones;
3
Battery compartment cover;
4
SONDE jack for replacement sensors;
5
Front panel.
1 2 3 4 5
3 DESIGN
3.1 Appearance
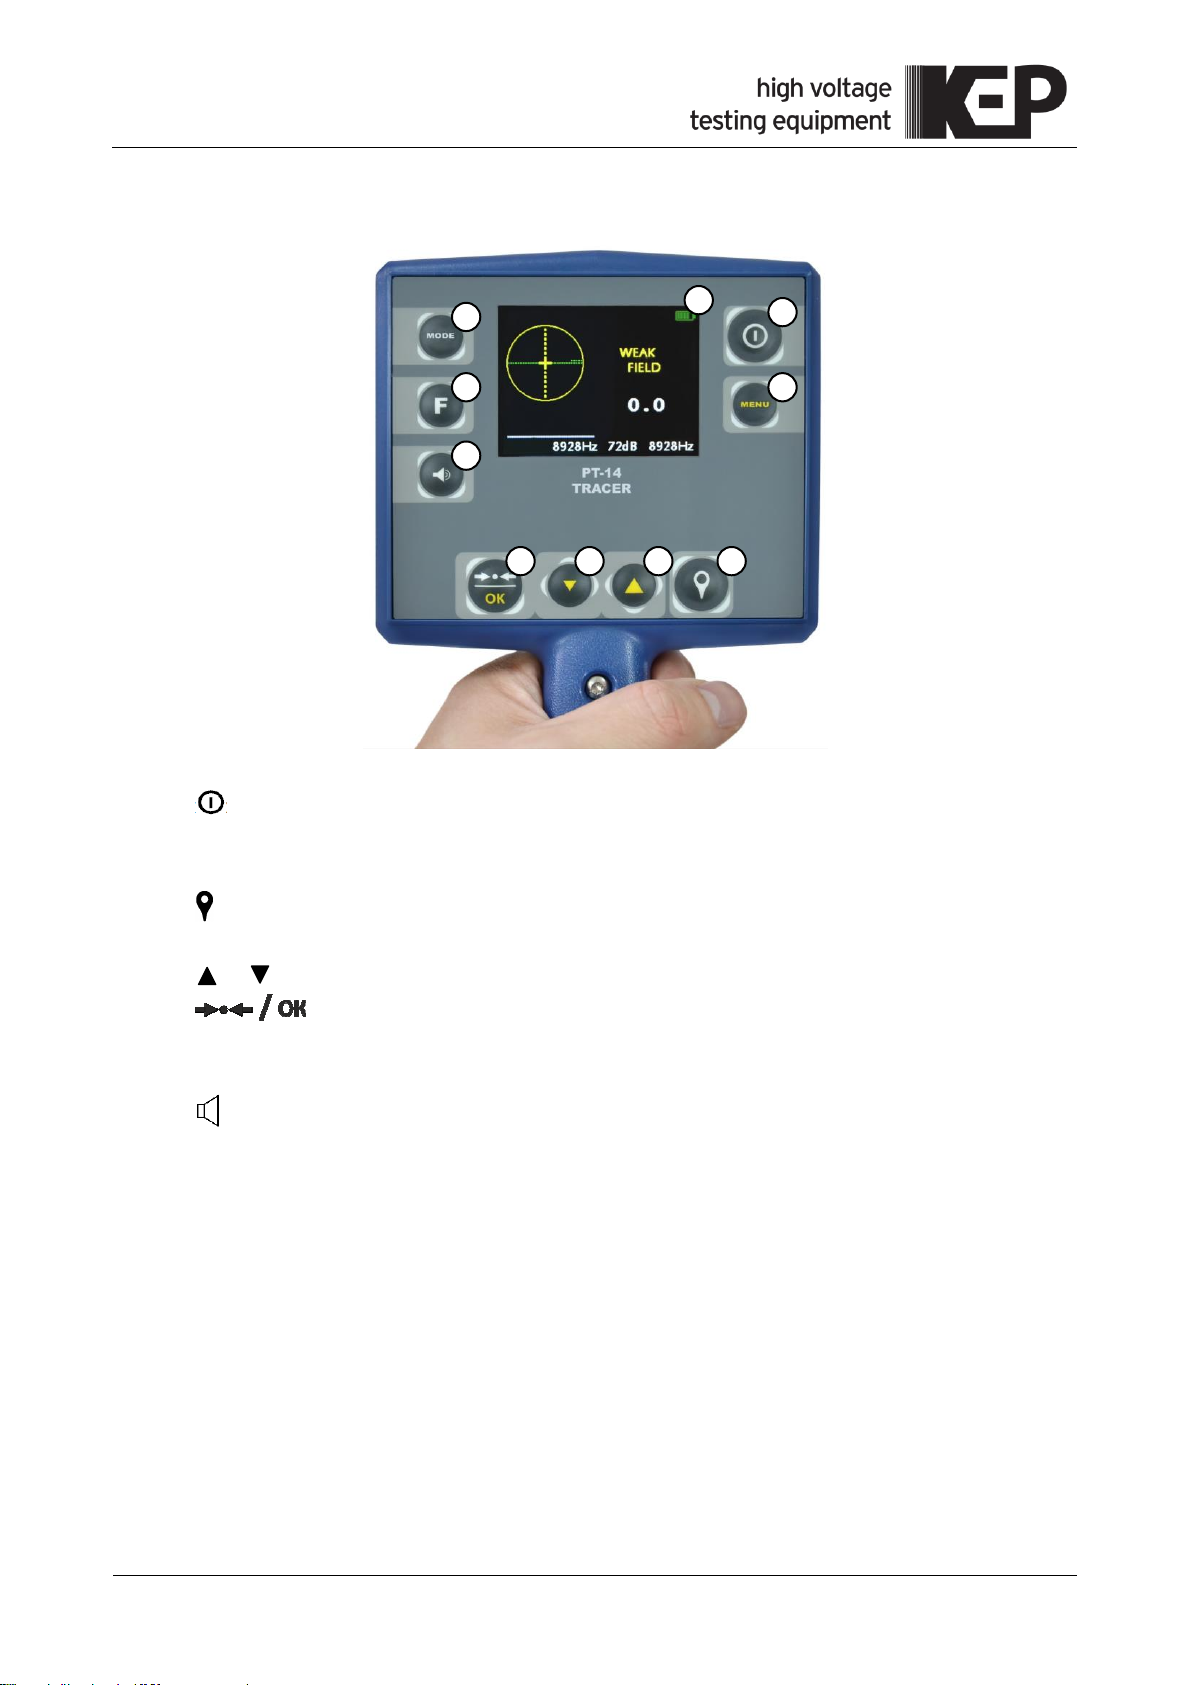
The exterior of the Tracer is shown in Figure 1.
Figure 1 – Exterior of Tracer
The Tracer is supplied with the sun-protective cover. The cover is
fixed in the handle area with a Velcro tape.
Page 8
KharkovEnergoPribor Ltd. | KEP Ltd.
+380 57 393 1069
www.kep.ua | info@kep.ua
PT-14
8
USER MANUAL
1
" " button. ON/OFF Tracer;
2
"MENU" button. Navigation key – enters/exits the menu;
3
Display;
4
" " button. Stores displayed parameters and GPS coordinates for further
transmission to a PC;
5, 6
" ", " " buttons. Adjusts signal gain; scrolls through the MENU options;
7
" " button. Sets optimum signal gain in the TRACE or SONDE channels
(depending on actual control area). Measures the utility depth and intensity of
current. Switches on/off the selected option in the MENU mode;
8
" " button. Adjusts the sound volume;
9
"F" button. Switches the available operating frequencies;
10
"MODE" button. Selects available locating modes. Switches the control areas to
change operating frequencies and amplify signal between the TRACE and SONDE
channels in the TRACE-SONDE mode.
2 1 3 5 6 4 7 8 9
10
The exterior of the front panel of the Tracer is shown in Figure 2.
Figure 2 – Front panel
3.2 Packing
Tracer and the operating documentation are wrapped with packaging
film in a way preventing dust and moisture from getting in and placed
in a packing crate.
The crates are supplied with labels containing the name of the Tracer
as well as shipping and storage instruction signs.
Page 9
KharkovEnergoPribor Ltd. | KEP Ltd.
+380 57 393 1069
www.kep.ua | info@kep.ua
9
PT-14
USER MANUAL
WARNING!
Always observe safety rules when you work with live cables.
Do not apply voltage of more than 42V to the open metal parts or
jacks of the Tracer.
WARNING!
Before charging, make sure that a rechargeable battery is put into
the battery compartment. If the battery case contains nonrechargeable batteries when charging, this may cause damage to
the Tracer.
The ambient temperature shall be from plus 10 ºС to plus 30 ºС
when charging. Charging at other temperatures may reduce battery
life.
4 OPERATION PROCEDURES
4.1 First use
If the Tracer was stored at low temperatures, it shall be kept at the
operating temperature for no less than 1 hour before use.
Take the Tracer out of its case and examine protective covers and
fasteners. Check the Tracer body and external power supply unit for
the mechanical damage.
The Tracer locates utilities and cable faults by the induction method.
Replacement sensors facilitate finding damaged insulation by the
voltage of current bleeding via the ground.
4.2 Battery charging
The alternating magnetic field induced by the utility and/or the
voltage generated in the replacement sensors are transformed into a
signal form. This signal is amplified and processed by the digital
signal processor. Then the signal levels are displayed in a form of
line bars and digital values in dB or Volts. The indication may be
supported with the audible signal.
The Ni-Mh batteries of the 5H-AA 2000B-1 type with the rated
capacity of 2000mA∙h are used to supply the device.
Charging rate is displayed as a battery icon.
Page 10

KharkovEnergoPribor Ltd. | KEP Ltd.
+380 57 393 1069
www.kep.ua | info@kep.ua
PT-14
10
USER MANUAL
If you want to charge the battery, connect a power supply unit plug
(included in the delivery set) to the corresponding jack of the Tracer.
Plug the power supply in. Full battery is shown with completely
highlighted BATTERY bar graph indicator.
Charging time is from 6 to 8 hours. If the Tracer is out of use for a
long time, recharge the batteries quarterly.
Note. Charging of standard battery is with the current from 400mA to
500mA. When charging the batteries with other rated capacity, always
check the temperature. If it rises quickly, stop charging.
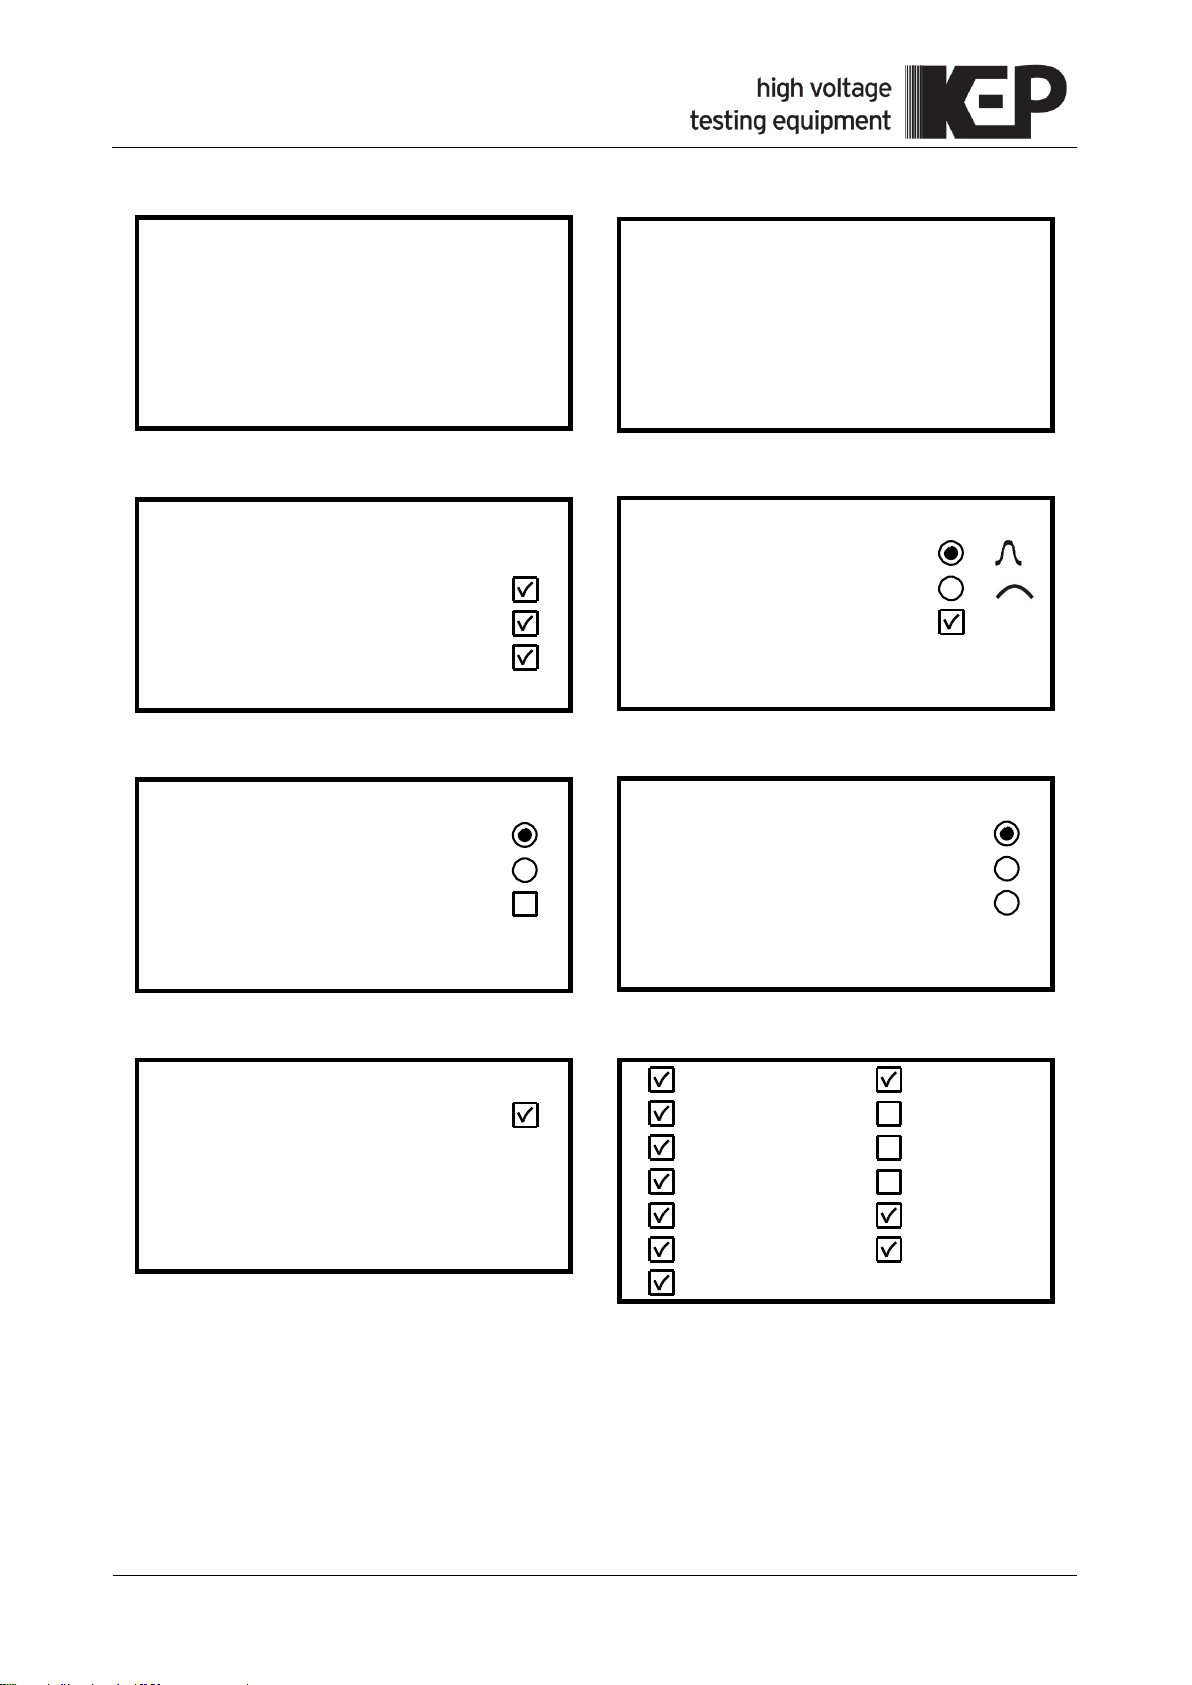
4.3 Selection and setting the main parameters via the MENU options
Press the "MENU" button to enter or exit the menu. The menu is
navigated with the signal gain buttons or sound volume buttons. The
options may be selected and changed with the «H» button.
4.3.1 In the INDICATION submenu (see Figure 3b)
the TRACE option (see Figure 3c) is used to select the signal peak
type (see Figure 3d) and to switch on/off the peak or null
indication;
the SONDE option (see Figure 3e) is used to expand the scale 1:4
and to select signal level at the of the SONDE jack input in dB or
Volts.
4.3.2 In the SOUND submenu (see Figure 3f) you may select an auditory
accompaniment of the indication:
as a single-frequency tone when the volume is proportional to the
signal level;
as a crack sound like in GM counter when the frequency of cracks
is proportional to the signal level;
as a direct audible signal from antenna on the frequencies of
«50 Hz» and «AIR». This function provides operation by ear.
In the TRACE mode the sound backs up the peak signal intensity.
When Peak mode is OFF, the sound level corresponds to the null
signal. In the TRACE-SONDE mode, the sound backs up the signal
at the SONDE jack input.
Page 11
KharkovEnergoPribor Ltd. | KEP Ltd.
+380 57 393 1069
www.kep.ua | info@kep.ua
11
PT-14
USER MANUAL
a)
b)
c)
d)
e)
f)
g)
h)
>
Indication…
Sound…
Measurements…
GPS
Exit
Indication
>
TRACE scale…
SONDE scale…
Back
TRACE scale
>
Peak type…
COMPASS
Peak scale
Null scale
Back
Maximum type
>
Sharp
Broad
Expansion 1:4
Back
SONDE scale
>
Scale in Volts
Scale in dB
Expansion 1:4
Back
Sound
>
Tone
Dosimeter
Live
Back
Measurements
>
Auto measurement H,I
Frequency set
Back
273Hz 100Hz
526Hz 300Hz
1024Hz 550Hz
8928Hz 1450Hz
φ 8928 RADIO
AIR 33kHz
50HZ
Figure 3 – Menus
Page 12

KharkovEnergoPribor Ltd. | KEP Ltd.
+380 57 393 1069
www.kep.ua | info@kep.ua
PT-14
12
USER MANUAL
WARNING!
For the correct operation of the Tracer in the TRACE-SONDE
mode, use the A-frame of new version with insulation joint.
4.3.3 In the MEASUREMENTS submenu you may use the following
options (see Figure 3g):
the AUTO, H and I options – to switch ON/OFF the continuous
FREQUENCY SET option – to set the frequency levels for further
4.4 Operating Modes
4.4.1 The Tracer operates in two modes:
TRACE – to locate the utility and detect its depth and operating
indication of utility depth («H») and the current flowing through the
utility line («I»);
shortcut selection with the «F» button (see Figure 3h). You may
enter the frequency levels into the list of available values or delete
them with the “H” button. You may exit with the MENU button.
frequency current flowing through it. The display of this mode is
shown in Figure 4a;
TRACE-SONDE – to locate the utility insulation damage and
detect the depth of damaged area; to detect the short-circuited
areas or wire break and select the conductors in the multi-core
cables. The display of this mode is shown in Figure 4c;
with the COMPASS option switched on, the direction of the
located cable relative to the Tracer will be displayed. The display
of the TRACE mode with COMPASS.
feature is shown in Figure 4b; in the TRACE-SONDE mode – in
Figure 4d.
To exit the TRACE mode and enter the TRACE-SONDE mode (and
vise versa), press the MODE key and hold it pressed for more than
two seconds.
Page 13

KharkovEnergoPribor Ltd. | KEP Ltd.
+380 57 393 1069
www.kep.ua | info@kep.ua
13
PT-14
USER MANUAL
a)
b)
c)
d)
1
Gain and operating frequency of the SONDE channel;
2
Gain and operating frequency of the TRACE channel;
3
Indicator of effective area for selected gain and/or operating frequency for the
TRACE and SONDE channels. To change the effective area, press the MODE key
shortly;
4
Barograph showing the relative signal strength at the SONDE jack input;
5
Voltage at the SONDE jack input – In Volts or dB;
6
Relative polarity caused by the leakage currents at the SONDE jack input;
7
Indication of the utility depth and the intensity of current via the utility;
8
Input signal from the magnetic antenna in dB and relative strength of input signal
(null bargraph). Locating is by null method with the preset direction of the utility;
2 7 8 9 10
11
12
13
14
15
16
17 4 13
15
14
20
16
17 7 20
19
18 9 15
14
12
16 7 18
19 4 3 2 1 1 2 3 4 5 6 8 9
10
13
15
14
12
16
17 5 6
17
Figure 4 – Mode displays
Page 14

KharkovEnergoPribor Ltd. | KEP Ltd.
+380 57 393 1069
www.kep.ua | info@kep.ua
PT-14
14
USER MANUAL
9
Relative strength of the input signal (peak bargraph). Locating is performed by the
peak method;
10
Indication of sharp peak (« ») or broad peak (« »);
11
Indication of scale extension « »;
12
Direction of current: « » - from Transmitter; « » - to Transmitter;
13
Input signal from the lower magnetic antenna in dB. Locating is by the peak
method;
14
Volume indicator;
15
GPS state, « » or « »;
16
Logging to the « » track, displayed at the moment of recording;
17
BATTERY state icon;
18
Tracer axis;
19
Utility position arrow;
20
Linear distance from the point logged by last pressing of “ ” button to present
position. Calculated according to the GPS readings.
CAUTION!
The indicator of the input signal strength in dB (for locating by peak
and null) turns red when the corresponding input channels are
overloaded (see Figure 4, Pos. 13 and 8).
4.5 Locating Methods
4.5.1 Selection of operating frequency
Frequency selection shall be performed depending on operating
conditions, targets and locating method. The operator shall have
corresponding qualification and practical skills.
We recommend you to start location at low frequencies both by direct
connection and induction methods. If the necessary signal strength
fails to be reached, you may operate the device at higher
frequencies.
Low-frequency location provides maximum range of search,
especially in the wet soil, and it reduces interferences to other
utilities. At the same time, the interferences of power signals and
adjacent utilities are stronger at lower frequencies.
Page 15

KharkovEnergoPribor Ltd. | KEP Ltd.
+380 57 393 1069
www.kep.ua | info@kep.ua
15
PT-14
USER MANUAL
At higher frequencies, the range of search is greater in dry or frozen
soil, and interferences of power signals and adjacent utilities are
lower. Moreover, signal losses caused by insulated joints are much
lower. At the same time, the Transmitter induces much noise to
adjacent utilities, and this may result in false trails.
You may locate the utilities and damaged insulation without
Transmitter at the operating frequencies as follows:
«50Hz» - according to power cable signals (main frequency or
harmonics);
«100Hz», «300Hz» - according to electrochemical protection
signals;
«AIR», «RADIO» - according to telephone and/or broadcasting
signals.
This method may cause false trails since the tracing of the utility may
be complicated by branching, and direction of the target utility may
not be detected by “own signal”. The operator shall have
corresponding qualification and practical skills for this method.
4.5.2 Peak, null and current direction modes.
The Tracer contains four magnetic antennas. The Tracer shall be
arranged vertically (see Figures 5 and 9). The «broad peak» tracing
requires a lower horizontal antenna only; two horizontal antennas
operate during «sharp peak» tracing; one lower horizontal and one
vertical antennas operate for tracing in the null mode.
The COMPASS mode requires all 4 antennas of the Tracer.
4.5.2.1. Peak mode
The Tracer is equipped with sharp peak (« ») and broad peak
(« ») functions, which facilitate high accuracy of tracing depending
on the depth and density of utilities in the target zone.
In Figure 5 shows the relationship between the signal level and
antenna displacement from the utility.
Page 16

KharkovEnergoPribor Ltd. | KEP Ltd.
+380 57 393 1069
www.kep.ua | info@kep.ua
PT-14
16
USER MANUAL
Figure 5 – The level of the responding signal depending
on the Tracer displacement from the utility axis
The «sharp peak» method provides high accuracy of the utility
tracing since the signal peak near the line axis is on the abrupt area
of the graph (see Figure 5, left display). When the antenna is
arranged right over the axis of the utility, the responding signal will be
on its peak. The signal gain in this point shall be set so that ¾ of the
scale were lighted; the sound volume shall be adjusted at the level,
comfortable for the operator. The « » button may be used
to adjust the optimum gain of each specific signal automatically.
The indicator barograph will grow down when the Tracer moves
away from the axis. Further displacement of the Tracer will result in
disappearing of the linear scale. The «--.-» icon will appear instead of
the signal level indication.
If the signal is weak or the depth of utility is sufficient, the indication
on the Peak scale may be unstable or missing. In this case you shall
use the «broad peak» method which demonstrates higher sensibility
to weak signals.
The indicator scale readings do not depend directly on the location of
the Tracer towards the utility at the «broad peak» method since the
signal peak is within the broadarea of the graph (see Figure 5, right
display). However, this method provides maximum sensitivity of the
Tracer.
Page 17

KharkovEnergoPribor Ltd. | KEP Ltd.
+380 57 393 1069
www.kep.ua | info@kep.ua
17
PT-14
USER MANUAL
As far as you move along the line, the Tracer gain and the sound
volume shall be adjusted depending on the strength of the received
signal. Along the route the signal strength may change depending on
the cable core twists. The strength of signal may also drop
considerably in the areas where the cables are laid under pipelines
or near connecting sleeves, or in the areas where they are shielded
with metal pipes.
In some cases, the peak scale is not sufficient, e.g. when the pipeline
branch of smaller diameter is traced deeply under the ground.
At that, some portion of tracing current leaks through the branch, and
the peak signal strength over the main pipeline drops slightly, and
this may go unnoticed.
The «peak scale expansion 1:4» option reduces the scale divisions
to increase its resolution. The « » icon (Pos. 11 in Figure 4) will
be displayed, a yellow strip will appear under the «peak» scale to
show the expansion bar graph relative to the normal (unexpanded)
scale.
Using the gain up/down buttons, place the end of the extended
«peak» bar graph within the visible area of the display. The gain-up
button is expands the scale. The gain- down button makes the scale
shorter.
The optimum gain and scale for a specific signal intensity may be
obtained by pressing the « » button.
The option of the peak scale extension may be selected by scrolling
the MENU options as follows: Menu > Indication> TRACE scale >
Peak type > Extension 1:4.
4.5.2.2. The null method
The method of null provides precise tracing of single utilities. The null
signal is within the abrupt area of the characteristic curve.
In Figure 5 shows relationship between the null signal intensity and
the displacement of the antenna away from the target utility. When
the antenna is exactly over the axis of the utility, the signal will be on
its minimum. When you move the antenna away from the utility, you
will get the signal gain, and there will be more lighted segments of
the barograph towards the utility. Subsequent disposal of the
antenna will result in smooth signal attenuation.
Page 18

KharkovEnergoPribor Ltd. | KEP Ltd.
+380 57 393 1069
www.kep.ua | info@kep.ua
PT-14
18
USER MANUAL
CAUTION!
The utility position arrow shall be used for visual presentation of
utility location only. It shall not be used for precise localization of
the target cable. If the signal is weak, the target line environment is
crowded and noisy, use the peak method as specified in 4.5.2.1.
When you use the null method you should maintain the optimum gain
level of the Tracer. If the gain is too low, the barograph drift from the
center will be minor or unnoticeable. If the gain is too high, the
barograph drift may be drastic. This may give the impression of
chaotic operation of the Tracer.
When you move along the route of the utility, the signal may rise
sharply. This means that the bending (or branching) of utility takes
place. The indicator will show its direction.
When you locate the utilities surrounded with other lines and cables,
use the method of sharp peak since the interferences of adjacent
lines is too high during peak tracing.
4.5.3 Locating with COMPASS option
The COMPASS mode is used to facilitate location of single longdistance utility lines with bends and turns. This COMPASS shows the
orientation of the located utility relative to the Tracer. This facilitates
the user operation.
The COMPASS option is selected via Menu as follows: Menu >
Indication> TRACE scale > COMPASS.
The COMPASS arrow will show the direction of the utility
(see Figure 4, Pos.19). In the TRACE mode, the Tracer displays the
peak scale and input signal strength; in the TRACE-SONDE mode,
the Tracer displays the scale, strength and polarity of signal at the
SONDE input.
Locating with the COMPASS feature is shown in Figure 6.
Moving along the target line, try to arrange the Tracer relative to the
utility so that the Utility position arrow (Figure 4 Pos.19) turned to be
aligned with the Tracer axis (Figure 4 Pos.18).
The utility position arrow may become fuzzy during location. This
may occur when the Tracer is perpendicular to the path of the utility
line or the Tracer and target utility are distant, or locating signal is too
weak.
Page 19

KharkovEnergoPribor Ltd. | KEP Ltd.
+380 57 393 1069
www.kep.ua | info@kep.ua
19
PT-14
USER MANUAL
Figure 6 – Locating with COMPASS
4.5.4 Locating by current direction
The method of current direction may be used to locate target line in
the areas with high concentration of utilities. Select the mode of
double-frequency signal of «1024Hz» on the Transmitter, and set the
operating frequency of the Tracer on the level of «1042Hz».
If the double-frequency signal strength is sufficient, the indication of
current direction (Figure 4, Pos. 12) will be active automatically.
If the COMPASS feature is used, the current direction will be shown
with the Utility position arrow direction (Figure 4, Pos. 19).
The Transmitter shall be connected directly to the target line for this
technique. The adjacent utilities shall be galvanically separated from
the target line in the point of connection (see Figure 7).
Page 20

KharkovEnergoPribor Ltd. | KEP Ltd.
+380 57 393 1069
www.kep.ua | info@kep.ua
PT-14
20
USER MANUAL
The «direct current» will go via the target utility line from the
Transmitter, and it will be displayed as the « » icon. The so-called
«return current» will flow back to the Transmitter via the adjacent
lines. This current is generated due to the distant galvanic or
capacitance coupling with the target line, and It will be indicated as
the « » icon.
Figure 7 – The direction of current in the galvanically separated adjacent lines
In case the adjacent utility lines are galvanically coupled with the
target line, all these lines will have the signals of equal direction
(see Figure 8). Signal amplitudes of the adjacent lines may differ
depending on the search current spreading.
Figure 8 – The direction of current in the galvanically coupled adjacent lines
Page 21

KharkovEnergoPribor Ltd. | KEP Ltd.
+380 57 393 1069
www.kep.ua | info@kep.ua
21
PT-14
USER MANUAL
WARNING!
The errors of depth measurements may be caused by the magnetic
field distortion produced by adjacent utilities or metal objects,
bends or branches, or in high-noise areas. Always observe the
rules of operation of the Tracer before operation to ensure against
errors.
The utility line depth and current strength are not displayed on the
«RADIO» and «AIR» frequencies. The error of depth is not rated
on the «50Hz» frequency.
CAUTION!
The depth is measured from the lower surface of the Tracer to the
center of the utility line.
4.6 Depth and current intensity of the utilities
Using the above techniques, keep the Tracer over the target utility
axis, as shown in Figure 9. The arrows on the Tracer body and
antenna plain shall be perpendicular to the utility line axis.
Figure 9 – Direct location of the utility depth
The Tracer displays the depth and current of target line by default.
You may switch this function off, and display these data by pressing
the « » button.
The line depth value is measured from the lower surface of the
antenna to the center of utility.
Page 22

KharkovEnergoPribor Ltd. | KEP Ltd.
+380 57 393 1069
www.kep.ua | info@kep.ua
PT-14
22
USER MANUAL
When the Tracer moves away from the utility axis the depth readings
will increase as the distance to the utility increases. Thus, the most
significant readout is the minimum value of the utility depth.
Perform two or three measurements of the depth in one point.
The depth level shall be calculated as the average value of the
obtained results.
To check the results of measurement you may perform the following:
lift the Tracer 1.3 meters up and repeat measurements, making sure
that you hold the Tracer evenly. The readings shall increase by the
height of lifting. You may perform measurements at various
frequencies.
The «LOW FIELD» indication means that the obtained result are
certainly wrong since the received signal is too weak or the Tracer is
moved away from the target line or the utility field is distorted by the
adjacent line currents. In this case, use “the 6dB method°”
(see Figure 10).
4.6.1 The indirect method of 6dB
When the Tracer fails to measure the depth of the utility line or the
depth shall be located on the passive frequencies, you may use the
indirect method of 6dB.
Figure 10 – Depth measurement by the 6dB method
Pinpoint the utility axis and store the readings of the input signal
strength on the peak scale in dB. Moving to the left and to the right of
the utility axis, find the positions in which the readings will be 6dB
less (this means that the signal strength is two times less).
The distance between these two points will be equal to double
distance from the Tracer to the utility line axis.
Page 23

KharkovEnergoPribor Ltd. | KEP Ltd.
+380 57 393 1069
www.kep.ua | info@kep.ua
23
PT-14
USER MANUAL
4.6.2 Locating by the utility current
When several utilities are running close together within the traced
area, return signals from wrong lines may cause false retrieval.
The problem sometimes occurs when the target line is deeper than
the wrong line carrying the return signal, and the return signal from
the wrong line is stronger than one from the target line.
The current intensity does not depend on the utility depth, and
maximum current will be detectable in the target line. The same level
of current will be detected in the target line, and the target line will be
identified easily.
When you use this technique, please be sure that the current
strength in the target line is much higher than in the adjacent utilities.
To achieve this, connect the Transmitter directly to the target line, or
use the current-control clamps. Connection through the transmitting
RP-02 frame gives less evident results.
The abrupt current change may represent branches or tie-in
connections of the utilities (if they are made of current-conducting
materials), since some current will leak thought the branches.
The first Kirchhoff’s law says that the total current inflowing in a
junction is equal to the total outflowing current. You should note,
however, that values of the current intensity near the branches will
differ from the actual values. Accurate and true measurements may
be performed within long-distance and uniform areas only.
4.7 Testing of ground plots
In order to avoid damage, the ground plots shall be tested to locate
and trace the current- conducting utilities before excavating.
4.7.1 Passive locating without Transmitter
The territory may be located in response to re-radiated power,
telephone, broadcasting signals or signals of electrochemical
protection. Make tracing on the «50Hz», «100Hz», «AIR» and
«RADIO» frequencies consecutively.
Set the Tracer gain so that a half of the peak bar graph is illuminated.
Move in zigzags with the zigzag step of from 1m to 5m in one
direction, and then – in perpendicular direction.
Increased signal strength on the peak scale shows the presence of
the utility line. To validate a target line location, perform steps
specified. Find the direction of the located utility rotating the Tracer
on vertical axis. The peak signal is generated when the Tracer plane
Page 24

KharkovEnergoPribor Ltd. | KEP Ltd.
+380 57 393 1069
www.kep.ua | info@kep.ua
PT-14
24
USER MANUAL
is perpendicular to the utility line, the minimum one – when it is
parallel.
4.7.2 Testing of ground plots with the RP-02 frame and transmitting
antenna AP-01
When the location on the passive frequencies in impossible because
of the weak signal, and when you need more accurate location of the
utility, you may perform tracing according to the Transmitter signals
induced by the Transmitting frame RP-02 or Transmitting antenna
AP-01 hereinafter referrers to as the inductors).
Please note that:
high Transmitter power and small distance from the inductors to
the Tracer cause strong direct connection, that will drown the utility
signals;
the strength of current induced in the utility line by means of the
inductors will be much lower than that at the direct connection;
the strength of current induced in the utility line by means of the
inductors will be high at high operating frequencies of the
Transmitter and close location of the inductor to the utility line;
the utility current strength depends on the grounding on the ends
of the utility line. If one of the ground contacts is missed, the
location will be difficult, so the Transmitter shall be set on the
maximum frequency to increase the currents via the capacity
between the utility and ground.
The testing shall be made by the following methods:
The first method
Split a studied territory into the plots with the size from 30×30m to
100×100m. Put the RP-02 frame on the ground horizontally, in the
center of the studied plot (see Figure 11). Place and fix the antenna
vertically. Set the Transmitter frequency on its maximum. Adjust the
Transmitter power to achieve minimum direct connection between
inductor and Tracer. In order to test the narrow plots, i.e. for a trench,
put the inductor apart from the tested plot (at the distance from 15m
to 20m).
Go along the perimeter of the plot. Peak signal will be at the crossing
of the plot bounds with the utility lines.
Page 25

KharkovEnergoPribor Ltd. | KEP Ltd.
+380 57 393 1069
www.kep.ua | info@kep.ua
25
PT-14
USER MANUAL
Figure 11 – Ground plot location with the RP-02 frame
The inductors placed as above fail to induce signals onto the utilities
arranged right below. These utilities may be left undetected. Move
the inductor some meters aside and repeat tracing.
To verify the utility location, place the RP-02 frame vertically over the
supposed utility axis, and put the AP-01 antenna across the utility
axis. Trace the utility line in both directions.
The second method
Connect the AP-01 antenna to the GT-15 Transmitter. Do not take
this equipment out of the carrying case. Select the «33k» frequency.
Set the optimum power.
Two operators go at the distance of 20m or 30m from each other.
The first operator goes along one edge of the testing plot, pointing
the antenna straight forward. The second operator goes along the
opposite edge of the testing plot and registers the changes of the
signal strength according to the peak scale (see Figure 12).
The signal peaks will appear in the areas of utilities.
Figure 12 – Tracing the plots with the AP-01 transmitting antenna
Repeat the above steps moving in perpendicular direction
Page 26

KharkovEnergoPribor Ltd. | KEP Ltd.
+380 57 393 1069
www.kep.ua | info@kep.ua
PT-14
26
USER MANUAL
CAUTION!
Do not supply the voltage of more than 42V to the SONDE jack
inputs.
5 METHODS OF LOCATING DAMAGED PIPELINES AND UTILITIES
The methods below are based on identification of relative distortions
of signals within the damaged areas. Sometimes these distortions
are unobservable so all the readings obtained during measurement
shall be stored in the PC memory for further analysis.
5.1 Method of locating by current
This method should be used to locate broken insulation of pipelines
or utilities with considerable leakage to ground.
If a sudden drop of the current strength is revealed in the areas
without tie-in connections and branches, this will mean that a
considerable damage of the line insulation takes place. This method
is true for high initial current (of more than 0.5A) and considerable
drop of current strength after the damaged area. We recommend you
to make tracing on the frequencies of 273Hz or 526Hz.
5.2 Fault finding with insulation control
Both contact sensors of insulation control DKI-02 and A-frame, and
non-contact sensors DKI-E and DKI-P are used for location. Turn the
Tracer into the TRACE-SONDE mode. The sensors shall be
connected to the SONDE jack (Pos. 4 in Figure 1). The broken areas
are detected according to the strength of the signal from the sensors
on the SONDE scale.
At that, the utility planimetric position control shall be performed with
the «peak» and «null» methods (see Figure 4c). If the COMPASS
function is activated, locating will be performed by the position of the
utility pointer relative to the Tracer (see Figure 4d). Always control
the depth of the utility and the strength and direction of current to
avoid false trials. The current direction shall be controlled when twofrequency signal of «1024Hz» is set on the Transmitter.
To adjust the line scale of the signal strength from the insulation
control sensors, set the pointer (Pos.3 in Figure 4) to the SONDE
position by pressing the MODE button. The gain may be selected
with the gain up/down arrows. For the automatic gain selection use
the button.
Page 27

KharkovEnergoPribor Ltd. | KEP Ltd.
+380 57 393 1069
www.kep.ua | info@kep.ua
27
PT-14
USER MANUAL
5.2.1 Insulation fault finding by signal drop.
The technique is the same for all types of sensors.
Both operators shall stand in trail over the axis of the target line
(for the DKI-E sensor) or both pins of the sensor shall be put into the
soil for survey as shown in Figure 13.
The point of insulation failure may be defined by the signal peaks
when one pin/operator is directly over the place of break. The signal
drops to it minimum when the point of insulation failure gets between
the pins/ operators. When you work near the area of failure, move
the pins closer to each other (to make their coordinate positions more
clear) and reduce the steps.
When the long-distance insulation failure takes place, the signal
peaks are located distantly from each other, on the bounds of failure.
The signal null is between the bounds of insulation damage.
To make a precise tracing you may define the polarity of signal at the
SONDE input. For this, switch the mode of double-frequency signal
of «1024 and 512Hz» and set the operating frequency of the Tracer
to the level of «1042» at the SONDE input. The indication of current
direction becomes active automatically, if the two-frequency signal
strength is sufficient (Figure 4, Pos. 6).
Figure 13 – Insulation fault finding by signal drop
When the operator moves along the undamaged part of the utility,
and then moves directly over the damaged area, the chaotic change
(or missing) of polarity at the SONDE input may occur because of
weak signal (see Figure 13).
Page 28

KharkovEnergoPribor Ltd. | KEP Ltd.
+380 57 393 1069
www.kep.ua | info@kep.ua
PT-14
28
USER MANUAL
CAUTION!
The polarity inversion without a specific signal fluctuation may not
be considered as a sign of fault.
As far as the operator approaches the bound of the damaged area,
and the signal increases, the polarity becomes stable. When the
operator passes the border of the damages area, the polarity will
change. In case the insulation is damaged in one point only, the
signal level over the damaged point will have a sharp null.
5.2.2 The search of the insulation failure by the signal rise
The technique of search is the same for all types of sensors
(see Figure 14).
One of the operators with the Tracer shall move along the target line
with the certain step (for the DKI-E sensor) or one of the pins shall be
embedded into the soil with a certain step for fault finding.
The second pin/ operator shall be away from the target line.
The area of the insulation failure shall be determined by the signal
peak.
Figure 14 – Connection diagram and search of the insulation failure by the signal rise
Page 29

KharkovEnergoPribor Ltd. | KEP Ltd.
+380 57 393 1069
www.kep.ua | info@kep.ua
29
PT-14
USER MANUAL
CAUTION!
Do not supply the voltage of more than 42V to the sensors inputs.
WARNING!
For correct readings of depth and direction during fault finding
always use the A-frame of a new type supplied with insulating
insert, as shown in Fig. Old A-frame may cause false readings of
depth.
5.2.3 Use of sensors
The DKI-02 sensor
This sensor facilitates operation in congested areas. The pins shall
be arranged or rearranged over the axis of the utility at the distance
from each other not exceeding the depth of line.
The “A-frame” sensor
As compared with the DKI-02 sencor, the “A-frame” provides more
accurate readings from measurement to measurement, since the
fixed distance between the pins
eliminates signal fluctation error caused by different distances.
Measurements with this sensor, however, require the pins to be
embedded into the soil, that may be unconvenient in some cases.
Keep the insulator surface of the A-frame clean. Soiling may cause
signal drop or loss of sensitivity.
The DKI-E sensor
This sensor accelerates tracing of single expanded utilities.
The sensor operability does not depend on the type of soil or paving.
The sensor, however, has lower sensitivity, particularly at low
frequencies. Each operator holds a contact electrode of the sensor
during operation. If tracing is performed close to the fault, the
distance between the operators shall be reduced to clarify the
position of cable failure.
The DKI-P sensor
This sensor is an electric antenna fixed to the magnetic antenna
module. The operation of this sensor is similar to the operation of the
DKI-E sensor, but it requires only one operator. This sensor,
however, has lower sensitivity. Strong wind or contact with grass may
cause instable readings.
Page 30

KharkovEnergoPribor Ltd. | KEP Ltd.
+380 57 393 1069
www.kep.ua | info@kep.ua
PT-14
30
USER MANUAL
CAUTION!
The ferromagnetic armature over the cable conductor may reduce
the detected signal strength so the search shall be made at
maximum possible current
5.3 Cable breakdown location
5.3.1 Finding of short-circuited conductors
In Figure 15 shows the diagram of tracing the short-circuited cables.
The Receiver shall be brought along the target utility, and the signal
strength shall be controlled on the peak scale. The signal strength
may change before the shorted area depending to the cable lay
pitch. The signal fluctuation stops behind the short-circuited area,
and signal strength may drop (case 1) or rise (case 2).
In the first case, the «dead short» takes place, when only the cable
conductors are shorted. In the second case, the cable conductors are
shorted to each other and to the armature.
Figure 15 – Layout and signal diagram at the method of search of short-circuited wires
5.3.2 Location of shorted conductor-armature areas
The layout of location of conductor-armature shorted area is shown
in Figure 16.
The signal strength may change before the shorted area depending
to the cable lay pitch. The signal fluctuation behind the short-circuited
area remains the same, and signal strength rise abruptly.
Page 31

KharkovEnergoPribor Ltd. | KEP Ltd.
+380 57 393 1069
www.kep.ua | info@kep.ua
31
PT-14
USER MANUAL
Figure 16 – Layout and signal strength of tracing of conductor-armature short-circuit
5.3.3 Tracing of damaged insulation and grounding areas
Cable insulation failure relative to the ground with the resistance of
hundreds Ohm may be located with insulation control sensors –
DKI-02, A-frame and DKI-E or DKI-P. Connect the Transmitter in
accordance with Figure 17. The grounding wire shall be connected to
the Transmitter jack with the « » marking. The methods of locating
are generally the same.
In case the cable insulation resistance relative to the ground does not
allow the use of the insulation control, the method of phase tracing
may be applied. The phase technique provides location of both lowresistance and high-resistance insulation failures with the leakage to
ground of up the 0.5MOhm. The area of damaged insulation shall be
determined initially with a reflection-coefficient meter. One operator
only locates by this method, and no additional sensors are required.
Figure 17 – Connecting diagram and signal strength for the method of
insulation damage tracing with insulation control sensors
Page 32

KharkovEnergoPribor Ltd. | KEP Ltd.
+380 57 393 1069
www.kep.ua | info@kep.ua
PT-14
32
USER MANUAL
Figure 18 – Connecting diagram and phase shift at the phase method of
cable insulation failure locating
Connect one lead of the GT-15 Transmitter to a damaged conductor
(see Figure 18). The opposite end shall be protected. The second
lead of the Transmitter shall be grounded with a pin placed at the
distance of no less than 5m from the cable. Preset the double
frequency «φ».
Select the TRACE mode and frequency of the «φ 8928» on the
Receiver. Stand directly over the utility line at the beginning of the
tested plot. Make sure that you are not closer than 20m to the point
of connection of the Transmitter. Press the « » button on
the Receiver to reset the phase indications. Move along the target
line, directly over it, and control the position with the null scale; take
phase readings carefully. The phase may change smoothly. The
phase readings will rise abruptly by several scale units behind the
area of insulation failure. When you pass the area with damaged
insulation, the phase readings will change smoothly.
The failures of this method are as follows:
phase fluctuation within the areas of damaged insulation is less
obvious than signal fluctuation by the insulation control sensor
tracing method;
interferences from adjacent utilities.
5.3.4 Tracing the area of wire break
In case the cable is inaccessible or protected with metal armature,
perform a high- voltage burn-down of the cable to achieve stable
short-circuit of the broken conductor to the adjacent wire or armature.
To make further search follow the steps.
Page 33

KharkovEnergoPribor Ltd. | KEP Ltd.
+380 57 393 1069
www.kep.ua | info@kep.ua
33
PT-14
USER MANUAL
WARNING!
Do not supply the voltage of more than 42V to the currentcollecting nozzle of the mini-sensor probe
Wire break area
Connect
Ground
If the cable has not armature, and it is easy-to-reach, the area of
conductor break may be found with mini-sensor of the MD-01 model.
The mini-sensor MD-01 is shown in Figure 19. Connect the minisensor to the SONDE jack.
Figure 19 – Mini-sensor MD-01
The sensor is compact, and it provides more accurate tracing in case
of close location of wires.
When you use the MD-01 sensor, switch the Transmitter to the mode
of limitation of the input voltage to the level of 30V.
If the cable is easy-to-reach and unshielded, the area of conductor
break may be found with the MD-01 mini-sensor. Set the switch of
the mini-sensor into the “O” position. The mini- sensor registers an
electric field near the conductors.
In Figure 20 shows the conductor break locating diagram.
Figure 20 – Connection diagram and signal strength for
conductor break locating on the unshielded lines
Page 34

KharkovEnergoPribor Ltd. | KEP Ltd.
+380 57 393 1069
www.kep.ua | info@kep.ua
PT-14
34
USER MANUAL
5.4 Picking-up cables and conductors
To pick the cables and wires up, set the mini-sensor switch into the
«3» position. The mini- sensor registers magnetic field near the live
conductors. The signal strength will be controlled with the SONDE
scale.
When you locate the de-energized cables, connect one Transmitter
output to the target cable (conductor) at the frequency of 273Hz or
526Hz. The Receiver shall be set to the operating frequency of
273Hz or 526Hz correspondingly or to the «AIR» frequency in the
TRACE-SONDE mode.
Below find the technique of picking-up of the cable from the bundle.
The picking-up of the wires from the multi-wire cable shall be the
same.
5.4.1 Finding the conductor in the multi-core cable by signal peak
One output of the Transmitter shall be connected to the target cable;
the other one shall be grounded.
With this method the maximum sensitivity zone of the mini-sensor in
the “SHORTING” mode is applied consecutively to the different
cables of the group of cables. Then the results of measurements are
compared. The target cable which is connected to the Transmitter
will have the signal of maximum strength.
Move the sensitive zone of the mini-sensor around the target cable in
the plane perpendicular to the cable axis. The signal strength will be
constant. When the sensitive zone of the mini-sensor is moved
around the other cables, the signal strength will vary according to the
position of the mini-sensor in regard to the target cable (cable with
maximum signal strength).
5.4.2 Locating the conductor in the multi-core cable by the method of
signal minimum
One output of the Transmitter shall be connected to the target
conductor; the other one shall be grounded.
If the mini-sensor end touches the target cable, the current flowing
through the cable will not induce the signal to the coil of the minisensor. The signal strength will depend on the signals induced by
adjacent cables of the group.
As far as the mini-sensor axis is displaced from the cable axis, the
signal generated by the target cable will amplify considerably.
Page 35

KharkovEnergoPribor Ltd. | KEP Ltd.
+380 57 393 1069
www.kep.ua | info@kep.ua
35
PT-14
USER MANUAL
In other words, when the mini-sensor is moved over the target cable
and with the axis of sensor crossing the axis of the cable, the abrupt
drop of signal over the cable may be observed. Other cables will not
cause so evident signal drop or they will not cause a signal drop
depending on the strength of the signal via the cables.
Put the mini-sensor at different angles for testing in order to avoid
false trials (you may detect a cable which goes over the sought one).
5.4.3 Check by the method of depth measurement
To check the results and eliminate errors of the measurement, apply
the module of magnetic antenna to the target cable and perform the
depth measurements. The depth readings shall be zero, other
readings mean the false trials.
5.5 Locating the line-to-ground faults of the overhead lines in the networks of
6 ~ 10 kW with isolated neutral
The search of line-to-ground faults is performed on the highharmonic level of zero- sequence current at the frequency of 550Hz
or 1450Hz. The faulty overhead line, which splits off from the station,
is detected according to the signal peak. The signal strength will be
much higher on the faulty line than on non-faulty one in the points
where the branches of the overhead line take place. The signal
strength behind the short-circuited area drops abruptly.
Page 36

KharkovEnergoPribor Ltd. | KEP Ltd.
+380 57 393 1069
www.kep.ua | info@kep.ua
PT-14
36
USER MANUAL
Fault
Possible cause
Remedies
The Receiver fails to
be switched- on or it is
switched off
spontaneously
Battery is defective or
discharged
Charge or replace
batteries
When power supply is
on the Receiver fails to
respond to the
Transmitter signal
No contact in antenna
plug connector
Check and restore
contacts
The headphones fail to
deliver sound whereas
the sound is good
through the internal
speakers
No contact in
headphone connector
Break in headphone
circuit
Repair or replace
headphones
The error of
measurement of the
depth of single long
utility exceeds its
allowable value
Drift of parameters of
the measuring channel
Adjustment at the
manufacturer is
recommended
6 TROUBLESHOOTING AND REMEDIES
The possible faults and remedies are listed in Table 3.
Table 3 – Possible faults and remedies
 Loading...