

Page 1

www.tek.com/keithley
Models 2450-EC, 2460-EC, and 2461-EC
Potentiostats and Galvanostats
User’s Manual
077110402 / November 2016
Test Equipment Depot - 800.517.8431 - 99 Washington Street Melrose, MA 02176 - TestEquipmentDepot.com
*P077110402*
077110402
A Greater Measure of Confidence
Page 2

Potentiostats And Galvanostats
Models 2450-EC, 2460-EC, and 2461-EC
User's Manual
© 2016, Keithley Instruments
Cleveland, Ohio, U.S.A.
All rights reserved.
Any unauthorized reproduction, photocopy, or use of the information herein, in whole or in part,
without the prior written approval of Keithley Instruments is strictly prohibited.
All Keithley Instruments product names are trademarks or registered trademarks of Keithley
Instruments. Other brand names are trademarks or registered trademarks of their respective
holders.
The Lua 5.0 software and associated documentation files are copyright © 1994 - 2015, Lua.org,
PUC-Rio. You can access terms of license for the Lua software and associated documentation at
the Lua licensing site (http://www.lua.org/license.html).
Microsoft, Visual C++, Excel, and Windows are either registered trademarks or trademarks of
Microsoft Corporation in the United States and/or other countries.
Document number: 077110402 / November 2016
Page 3

Safety precautions
The following safety precautions should be observed before using this product and any associated instrumentation. Although
some instruments and accessories would normally be used with nonhazardous voltages, there are situations where hazardous
conditions may be present.
This product is intended for use by qualified personnel who recognize shock hazards and are familiar with the safety precautions
required to avoid possible injury. Read and follow all installation, operation, and maintenance information carefully before using
the product. Refer to the user documentation for complete product specifications.
If the product is used in a manner not specified, the protection provided by the product warranty may be impaired.
The types of product users are:
Responsible body is the individual or group responsible for the use and maintenance of equipment, for ensuring that the
equipment is operated within its specifications and operating limits, and for ensuring that operators are adequately trained.
Operators use the product for its intended function. They must be trained in electrical safety procedures and proper use of the
instrument. They must be protected from electric shock and contact with hazardous live circuits.
Maintenance personnel perform routine procedures on the product to keep it operating properly, for example, setting the line
voltage or replacing consumable materials. Maintenance procedures are described in the user documentation. The procedures
explicitly state if the operator may perform them. Otherwise, they should be performed only by service personnel.
Service personnel are trained to work on live circuits, perform safe installations, and repair products. Only properly trained
service personnel may perform installation and service procedures.
Keithley Instruments products are designed for use with electrical signals that are measurement, control, and data I/O
connections, with low transient overvoltages, and must not be directly connected to mains voltage or to voltage sources with high
transient overvoltages. Measurement Category II (as referenced in IEC 60664) connections require protection for high transient
overvoltages often associated with local AC mains connections. Certain Keithley Instruments measuring instruments may be
connected to mains. These instruments will be marked as category II or higher.
Unless explicitly allowed in the specifications, operating manual, and instrument labels, do not connect any instrument to mains.
Exercise extreme caution when a shock hazard is present. Lethal voltage may be present on cable connector jacks or test
fixtures. The American National Standards Institute (ANSI) states that a shock hazard exists when voltage levels greater than
30 V RMS, 42.4 V peak, or 60 VDC are present. A good safety practice is to expect that hazardous voltage is present in any
unknown circuit before measuring.
Operators of this product must be protected from electric shock at all times. The responsible body must ensure that operators
are prevented access and/or insulated from every connection point. In some cases, connections must be exposed to potential
human contact. Product operators in these circumstances must be trained to protect themselves from the risk of electric shock. If
the circuit is capable of operating at or above 1000 V, no conductive part of the circuit may be exposed.
Do not connect switching cards directly to unlimited power circuits. They are intended to be used with impedance-limited
sources. NEVER connect switching cards directly to AC mains. When connecting sources to switching cards, install protective
devices to limit fault current and voltage to the card.
Before operating an instrument, ensure that the line cord is connected to a properly-grounded power receptacle. Inspect the
connecting cables, test leads, and jumpers for possible wear, cracks, or breaks before each use.
When installing equipment where access to the main power cord is restricted, such as rack mounting, a separate main input
power disconnect device must be provided in close proximity to the equipment and within easy reach of the operator.
For maximum safety, do not touch the product, test cables, or any other instruments while power is applied to the circuit under
test. ALWAYS remove power from the entire test system and discharge any capacitors before: connecting or disconnecting
cables or jumpers, installing or removing switching cards, or making internal changes, such as installing or removing jumpers.
Do not touch any object that could provide a current path to the common side of the circuit under test or power line (earth)
ground. Always make measurements with dry hands while standing on a dry, insulated surface capable of withstanding the
voltage being measured.
Page 4

For safety, instruments and accessories must be used in accordance with the operating instructions. If the instruments or
accessories are used in a manner not specified in the operating instructions, the protection provided by the equipment may be
impaired.
Do not exceed the maximum signal levels of the instruments and accessories. Maximum signal levels are defined in the
specifications and operating information and shown on the instrument panels, test fixture panels, and switching cards.
When fuses are used in a product, replace with the same type and rating for continued protection against fire hazard.
Chassis connections must only be used as shield connections for measuring circuits, NOT as protective earth (safety ground)
connections.
If you are using a test fixture, keep the lid closed while power is applied to the device under test. Safe operation requires the use
of a lid interlock.
If a screw is present, connect it to protective earth (safety ground) using the wire recommended in the user documentation.
The symbol on an instrument means caution, risk of danger. The user must refer to the operating instructions located in the
user documentation in all cases where the symbol is marked on the instrument.
The
contact with these voltages.
The
The
If this symbol is on a product, it indicates that mercury is present in the display lamp. Please note that the lamp must be
properly disposed of according to federal, state, and local laws.
The WARNING heading in the user documentation explains dangers that might result in personal injury or death. Always read
the associated information very carefully before performing the indicated procedure.
The CAUTION heading in the user documentation explains hazards that could damage the instrument. Such damage may
invalidate the warranty.
Instrumentation and accessories shall not be connected to humans.
Before performing any maintenance, disconnect the line cord and all test cables.
To maintain protection from electric shock and fire, replacement components in mains circuits — including the power
transformer, test leads, and input jacks — must be purchased from Keithley Instruments. Standard fuses with applicable national
safety approvals may be used if the rating and type are the same. The detachable mains power cord provided with the
instrument may only be replaced with a similarly rated power cord. Other components that are not safety-related may be
purchased from other suppliers as long as they are equivalent to the original component (note that selected parts should be
purchased only through Keithley Instruments to maintain accuracy and functionality of the product). If you are unsure about the
applicability of a replacement component, call a Keithley Instruments office for information.
Unless otherwise noted in product-specific literature, Keithley Instruments instruments are designed to operate indoors only, in
the following environment: Altitude at or below 2,000 m (6,562 ft); temperature 0 °C to 50 °C (32 °F to 122 °F); and pollution
degree 1 or 2.
symbol on an instrument means caution, risk of electric shock. Use standard safety precautions to avoid personal
symbol on an instrument shows that the surface may be hot. Avoid personal contact to prevent burns.
symbol indicates a connection terminal to the equipment frame.
To clean an instrument, use a damp cloth or mild, water-based cleaner. Clean the exterior of the instrument only. Do not apply
cleaner directly to the instrument or allow liquids to enter or spill on the instrument. Products that consist of a circuit board with
no case or chassis (e.g., a data acquisition board for installation into a computer) should never require cleaning if handled
according to instructions. If the board becomes contaminated and operation is affected, the board should be returned to the
factory for proper cleaning/servicing.
Safety precaution revision as of March 2016.
Page 5

Table of Contents
Introduction ............................................................................................................... 1-1
Introduction .......................................................................................................................... 1-1
Getting started ...................................................................................................................... 1-2
Configure the SMU Instrument for TSP® scripts ........................................................................ 1-3
Select the high-impedance, output-off state .............................................................................. 1-3
Copy a script to the instrument .................................................................................................. 1-4
Cable assembly details ........................................................................................................ 1-5
Connections and usage ....................................................................................................... 1-6
Make the SMU connections ...................................................................................................... 1-6
Make the device connections .................................................................................................... 1-7
Attach the alligator clips ............................................................................................................ 1-8
Prepare the analyte and assemble the test cell......................................................................... 1-8
Connect to the DUT .................................................................................................................. 1-8
Home and Menu screen overview ............................................................................................. 1-9
Cyclic Voltammetry ................................................................................................... 2-1
Cyclic Voltammetry .............................................................................................................. 2-1
Test application parameters ...................................................................................................... 2-2
Run the Cyclic Voltammetry test application ............................................................................. 2-3
Review the Menu controls ......................................................................................................... 2-4
Define the potential scan parameters ........................................................................................ 2-5
Define the Scan Settings ........................................................................................................... 2-7
Select the Sampling Rate Units, Sampling Rate, and Current Range ....................................... 2-8
Save or load the test parameter data ...................................................................................... 2-10
Run the test and view the graph .............................................................................................. 2-12
Acquire the open circuit potential (Eoc) ................................................................................... 2-13
Save the test data to the flash drive ........................................................................................ 2-14
View the results saved to the flash drive ................................................................................. 2-14
View the test reading table ...................................................................................................... 2-14
View the Event Log ................................................................................................................. 2-15
End the test application ........................................................................................................... 2-15
Cyclic Voltammetry theory....................................................................................................... 2-16
Open Circuit Potential .............................................................................................. 3-1
Open Circuit Potential .......................................................................................................... 3-1
Test application parameters ...................................................................................................... 3-2
Run the Open Circuit Potential test application ......................................................................... 3-2
Review the Menu controls ......................................................................................................... 3-3
Adjust the Measure Settings ..................................................................................................... 3-4
Save or load the test parameter data ........................................................................................ 3-6
Run the test and view the graph ................................................................................................ 3-7
Save the test data to the flash drive .......................................................................................... 3-8
View the results saved to the flash drive ................................................................................... 3-9
View the Reading Table or measurement Statistics .................................................................. 3-9
View the Event Log ................................................................................................................. 3-10
End the test application ........................................................................................................... 3-10
Potential Pulse & Square Wave ............................................................................... 4-1
Potential Pulse and Square Wave ....................................................................................... 4-1
Test application parameters ...................................................................................................... 4-2
Page 6

Table of Contents
Models 2450-EC, 2460-EC, and 2461-EC Potentiostats And Galvanostats
User's Manual
Run the Potential Pulse and Square Wave test application ...................................................... 4-3
Review the Menu controls ......................................................................................................... 4-4
Configure the Pulse Settings ..................................................................................................... 4-4
Adjust the End Conditions ......................................................................................................... 4-8
Save or load the test parameter data ........................................................................................ 4-9
Run the test and view the graph .............................................................................................. 4-11
Save the test data to the flash drive ........................................................................................ 4-12
View the results saved to the flash drive ................................................................................. 4-12
View the Reading Table or measurement Statistics ................................................................ 4-12
View the Event Log ................................................................................................................. 4-13
End the test application ........................................................................................................... 4-13
Current Pulse and Square Wave .............................................................................. 5-1
Current Pulse and Square Wave ......................................................................................... 5-1
Test application parameters ...................................................................................................... 5-2
Run the Current Pulse and Square Wave test application ........................................................ 5-3
Review the Menu controls ......................................................................................................... 5-4
Configure the Pulse Settings ..................................................................................................... 5-4
Adjust the End Conditions ......................................................................................................... 5-7
Save or load the test parameter data ........................................................................................ 5-9
Run the test and view the graph .............................................................................................. 5-10
Save the test data to the flash drive ........................................................................................ 5-11
View the results saved to the flash drive ................................................................................. 5-12
View the Reading Table or measurement Statistics ................................................................ 5-12
View the Event Log ................................................................................................................. 5-13
End the test application ........................................................................................................... 5-13
Chronoamperometry ................................................................................................ 6-1
Chronoamperometry ............................................................................................................ 6-1
Test application parameters ...................................................................................................... 6-2
Run the Chronoamperometry test application ........................................................................... 6-2
Review the Menu controls ......................................................................................................... 6-4
Configure the Step and Measure Settings ................................................................................ 6-4
Save or load the test parameter data ........................................................................................ 6-7
Run the test and view the graph ................................................................................................ 6-9
Save the test data to the flash drive ........................................................................................ 6-10
View the results saved to the flash drive ................................................................................. 6-10
View the Reading Table or measurement Statistics ................................................................ 6-10
View the Event Log ................................................................................................................. 6-11
End the test application ........................................................................................................... 6-11
Chronopotentiometry ............................................................................................... 7-1
Chronopotentiometry ............................................................................................................ 7-1
Test application parameters ...................................................................................................... 7-2
Run the Chronopotentiometry test application .......................................................................... 7-2
Review the Menu controls ......................................................................................................... 7-4
Configure the Step and Measure Settings ................................................................................ 7-4
Save or load the test parameter data ........................................................................................ 7-7
Run the test and view the graph ................................................................................................ 7-9
Save the test data to the flash drive ........................................................................................ 7-10
View the results saved to the flash drive ................................................................................. 7-10
View the Reading Table or measurement Statistics ................................................................ 7-10
View the Event Log ................................................................................................................. 7-11
End the test application ........................................................................................................... 7-11
Page 7

In this section:
Connections and usage ........................................................... 1-6
Introduction .............................................................................. 1-1
Getting started .......................................................................... 1-2
Cable assembly details ............................................................ 1-5
Introduction
The Keithley Instruments Models 2450-EC, 2460-EC, and 2461-EC Potentiostat/Galvanostat systems
are alternatives to traditional electrochemistry potentiostats and galvanostats. Your instrument
features a full-color, high-resolution touchscreen, which lets you configure tests and immediately view
results.
The following electrochemistry test applications are loaded in the memory of your instrument:
Section 1
Introduction
• Cyclic Voltammetry: Potential is swept at a user-programmable scan rate between two to four
defined potential vertices, and the resulting current is measured at specified intervals during the
sweep.
• Open Circuit Potential: Measures the cell potential difference between two electrodes with high
input impedance as a function of time.
• Potential Pulse and Square Wave with Current Measure: Sources potential at programmable
peak and base levels. The resulting current at the pulse peak level is recorded.
• Current Pulse and Square Wave with Potential Measure: Sources current at programmable
peak and base levels. The resulting potential at the pulse peak level is recorded.
• Chronoamperometry: Potential is stepped to a programmed value and the resulting current is
measured as a function of time.
• Chronopotentiometry: Current is stepped to a programmed value and the resulting potential is
measured as a function of time.
This kit is not intended to be used with a SMU interlock enabled. To prevent electric shock
and possible damage to the test cable assembly or test setup, do not activate the Keithley
Instruments 2450, 2460, or 2461 interlock.
When the interlock is not engaged on the 2450, 2460, or 2461 the nominal output is limited to
±42 V. However, review the "Safety Precautions" section of this document to ensure
responsible operation.
Page 8
Section
1: Introduction Models 2450-EC, 2460-EC, and 2461-EC Potentiostats And Galvanostats
User's Manual
CyclicVoltammetry.tsp
Application to perform Cyclic Voltammetry
OpenCircuitPotential.tsp
Application to measure the open circuit potential
Chronoamperometry.tsp
Application to measure the current as a function of time at
Chronopotentiometry.tsp
Application to measure the potential as a function of time
at a constant current
CurrentPulseAndSquareWave.tsp
measuring the potential
PotentialPulseAndSquareWave.tsp
Application to output a current pulse or square wave while
measuring the current
EC_Images.tsp
Potentiostat application images.
EC_Framework.tsp
Potentiostat application framework.
07711040x_2450-EC.pdf
Models 2450-EC, 2460-EC, and 2461-EC Potentiostats
User's Manual (this document)
07134730x_ECHEM-KIT.pdf
SMU Potentiostats and EC-UPGRADE Kit Quick Start
Guide
Getting started
In addition to your SourceMeter instrument, you should have received the following items:
• One electrochemistry interface cable that connects the instrument to a 2-, 3-, or 4-terminal
electrochemical cell
• Four insulated miniature alligator clips
• One flash drive that contains the test applications and supporting documentation.
• Six electrochemistry test applications
Before you can run an electrochemistry test, you will need to configure the instrument and make
basic connections. The following topics will explain how to set up and configure your instrument.
The 2450-EC or 2460-EC instrument must have firmware version 1.5.0 or later to run the
electrochemistry test applications. The 2461-EC must have firmware version 1.6.0 or later.
To view the firmware version, press the MENU key, then select Info/Manage under System. The
firmware version is at the upper-left of your display.
The following files are loaded onto the flash drive:
File Description
a constant potential
Application to output a current pulse or square wave while
1-2 077110402/November 2016
Page 9

Models 2450
-EC, 2460-EC, and 2461-EC Potentiostats And Galvanostats User's Manual Section 1:
Introduction
Configure the SMU Instrument for TSP® scripts
Make sure to select the TSP command set on your SourceMeter Instrument before running test
scripts on your instrument. You only need to select the TSP command set once.
To select the TSP command set:
1. Press the MENU key.
2. Under System, select Settings.
3. Select Command Set.
4. Choose TSP.
5. At the prompt to reboot, select Yes.
Select the high-impedance, output-off state
Before making physical connections from the instrument to the test cell, set the output of the
instrument to the high-impedance, output-off state. When the high-impedance output-off state is
selected, the output relay opens, disconnecting the instrument from the load.
To set the output of your SMU to the high-impedance, output-off state:
1. Press the MENU key.
2. Under Source, select Settings.
3. Select Output Off.
4. Choose High Z (high impedance).
You may receive a notification about making measurements with the output turned off. Select OK to
clear the message, or select Details to see more information.
077110402/November 2016 1-3
Page 10
Section
1: Introduction Models 2450-EC, 2460-EC, and 2461-EC Potentiostats And Galvanostats
User's Manual
Copy a script to the instrument
Your SMU is shipped with all test applications and supporting scripts loaded into memory.
If you accidentally delete a test application or a supporting script (EC_Framework.tsp or
EC_Images.tsp), you can copy the files from the flash drive to your instrument.
If you are upgrading your SMU with the EC-UPGRADE kit, you can run the test applications from the
flash drive or copy the files from the flash drive to the instrument. If you choose to copy the
applications, you must also copy the support files (EC_Framework.tsp and EC_Images.tsp) to
your SMU.
To copy a script to the SMU:
1. Insert the USB flash drive into the USB port on the front panel.
2. Press the MENU key.
3. Under Scripts, select Manage. The Manage Scripts menu opens. Your list of Internal Scripts may
appear different.
Figure 1: Manage Scripts menu
4. In the USB Scripts list, select the test script you want to copy to the SMU. For this example, you
will copy the Cyclic Voltammetry test script.
Figure 2: Selecting the test script to be copied
1-4 077110402/November 2016
Page 11

Models 2450
-EC, 2460-EC, and 2461-EC Potentiostats And Galvanostats User's Manual Section 1:
Introduction
7 A on HI and LO, less than 1 mA on SHI and SLO
5. Select <. The test script is transferred to the instrument, and the corresponding filename is
displayed in the Internal Scripts list.
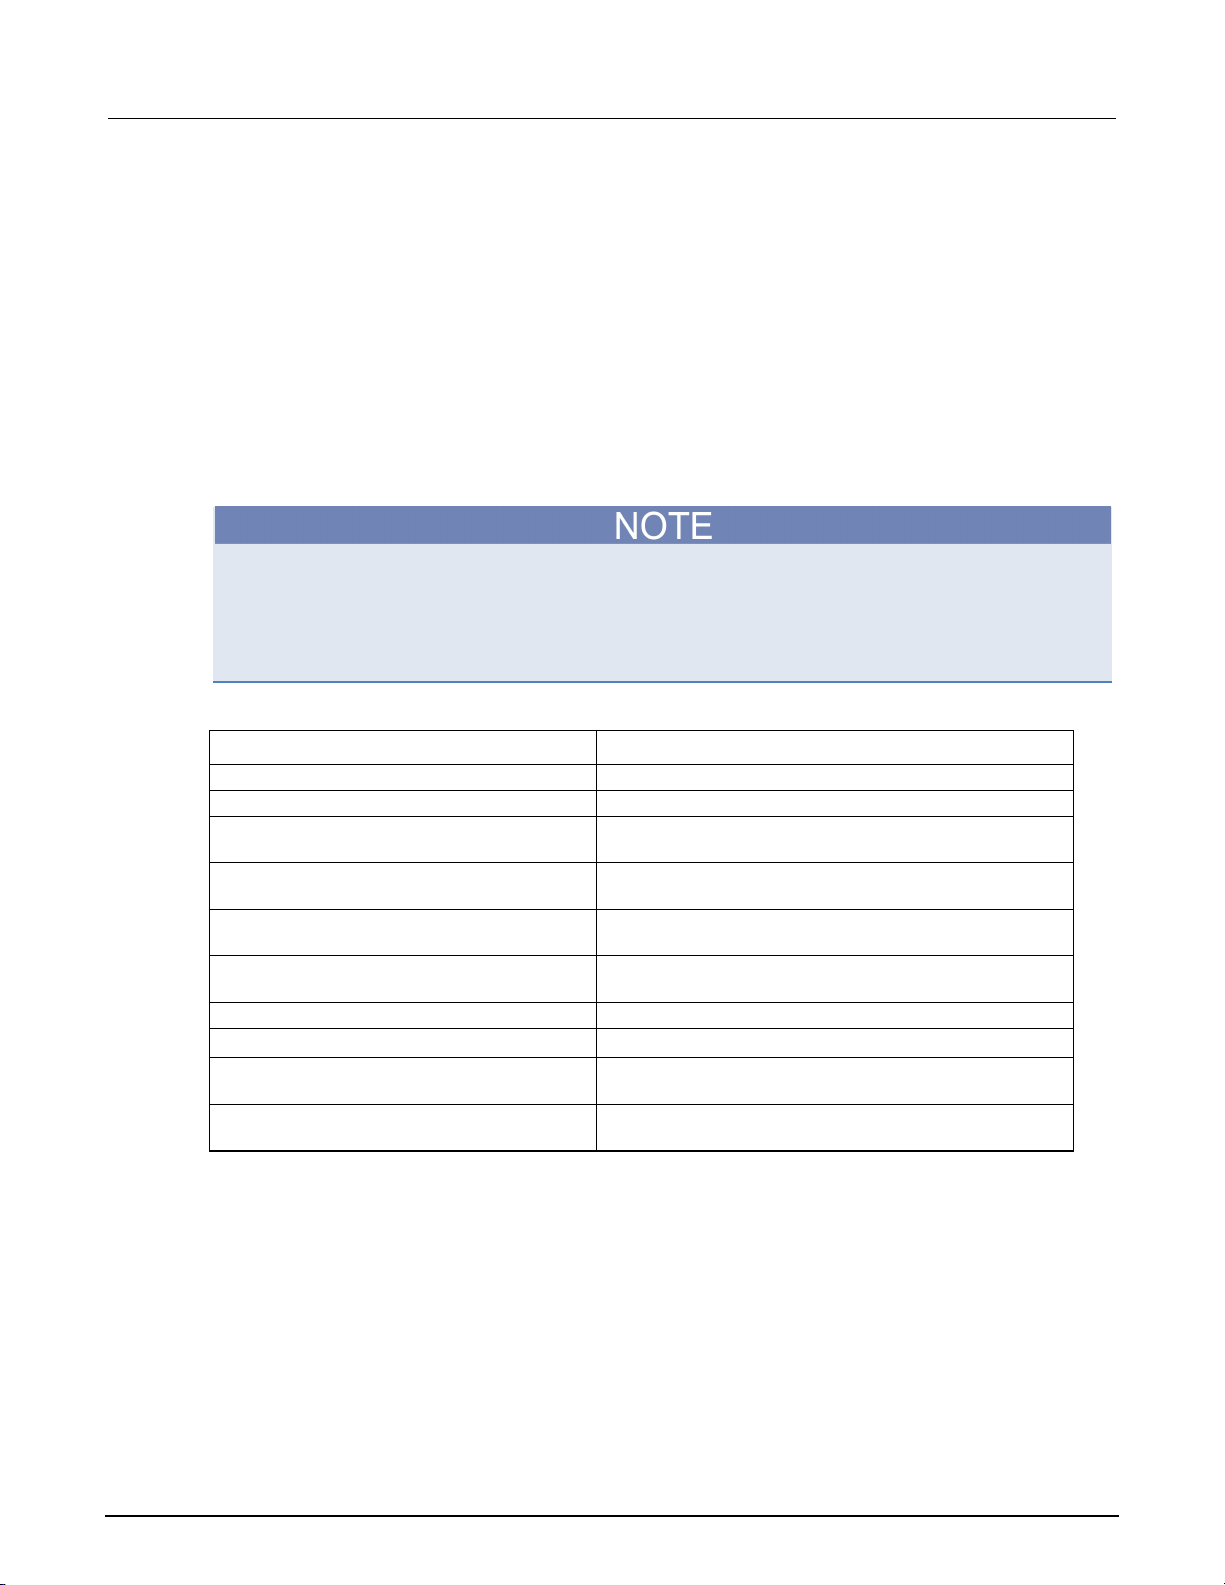
Cable assembly details
The cable is an electrically-shielded 1 m (39.37 in.) assembly with stackable, safety banana plugs on
both ends. This cable simplifies the connections between your SMU potentiostat or galvanostat and
an electrochemical test cell.
Figure 3: Copying the file to the instrument
Figure 4: ECHEM accessory cable dimensions
Electrical characteristics
Maximum voltage (assembly):
Maximum current (assembly):
42 V
077110402/November 2016 1-5
Page 12
Section
1: Introduction Models 2450-EC, 2460-EC, and 2461-EC Potentiostats And Galvanostats
User's Manual
Connections and usage
The cable assembly can be used with Keithley SMUs for electrochemistry applications. Each
connector of the assembly is labeled according to its function:
Figure 5: Cable assembly connector labels and definitions
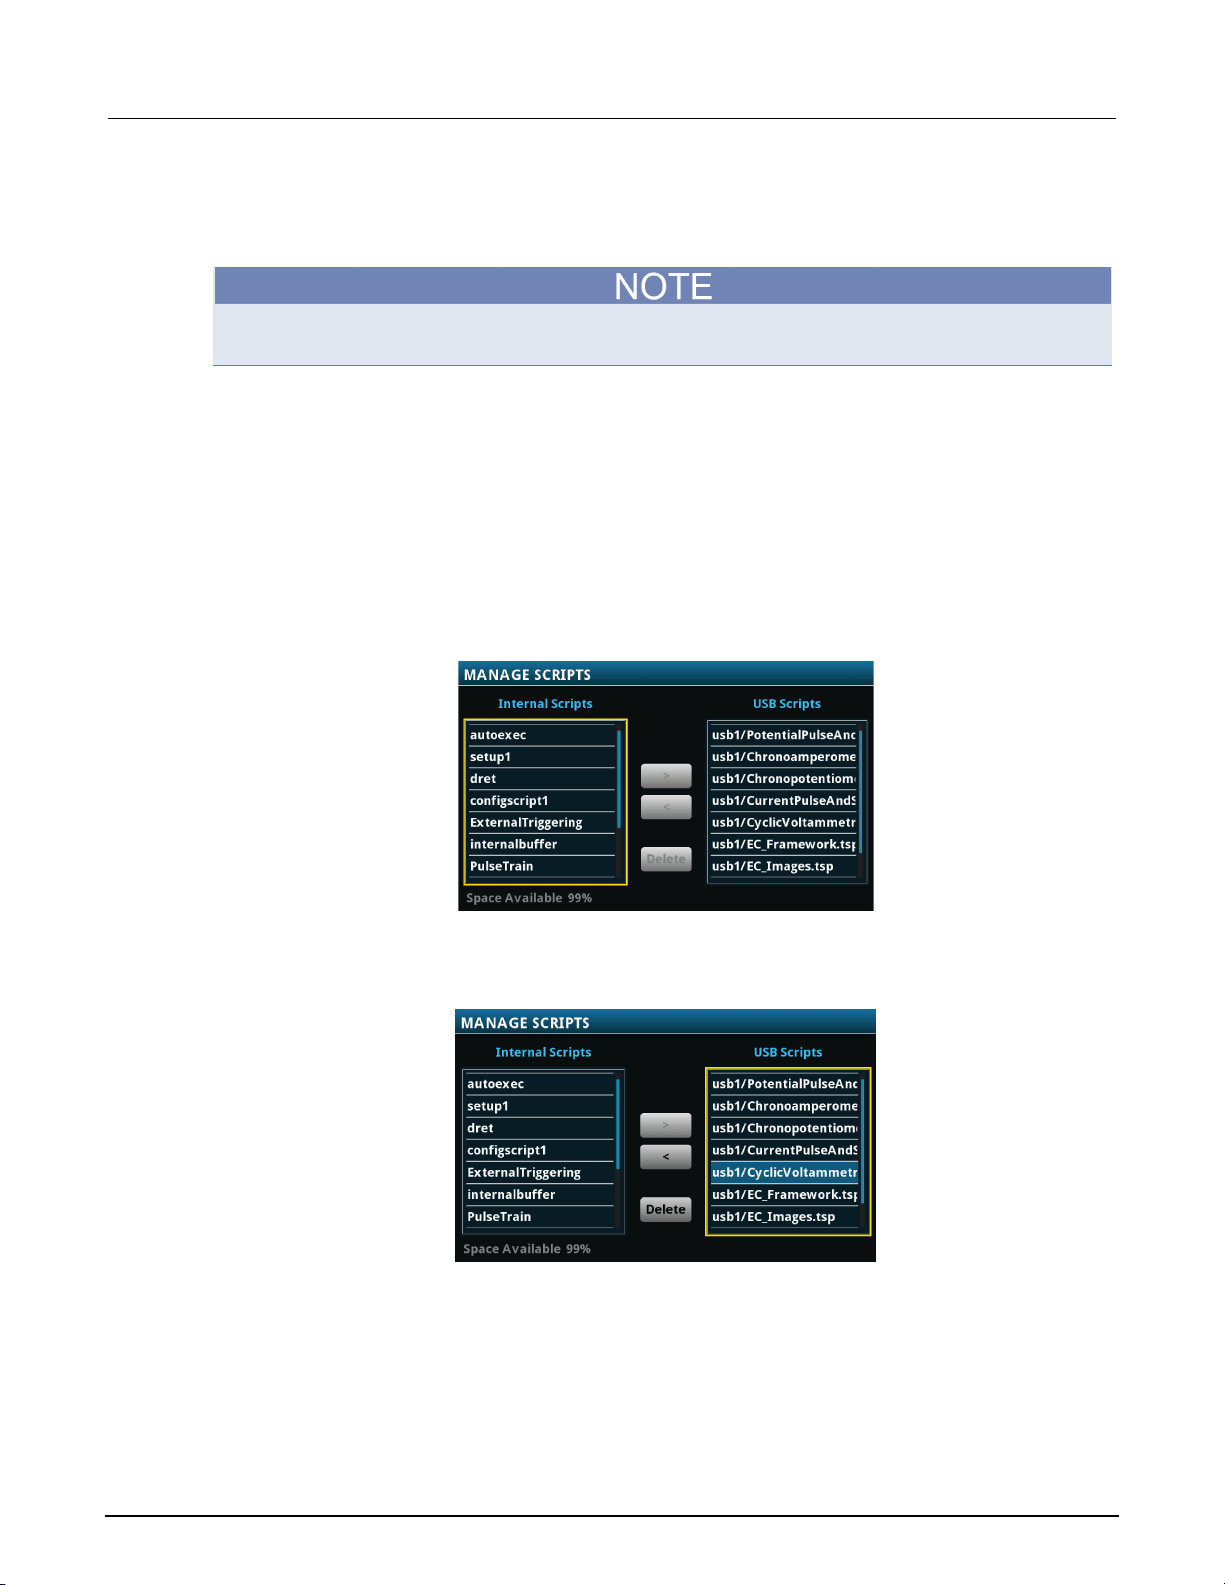
Make the SMU connections
Connect to the instrument (all tests):
The front panel of your SMU has four banana-style input and output jacks. You use the supplied
cable to connect your electrochemical cell to these jacks.
The SENSE terminals are used to measure voltage at the device under test (DUT). When you use
sense leads, the voltage drop across the force leads is eliminated from a measurement. This
produces more accurate voltage sourcing and measurement at the DUT. Plug the SHI and SLO
connectors into the SENSE terminals.
The FORCE terminals are used to source or sink voltage or current to or from a DUT. Plug the HI and
LO connectors into the FORCE terminals.
Plug the four SMU-side cable connectors into the front of your SMU instrument as shown in the below
graphic.
Figure 6: Connecting SMU-side cable connectors to the SMU front-panel inputs
1-6 077110402/November 2016
Page 13
Models 2450
Introduction
-EC, 2460-EC, and 2461-EC Potentiostats And Galvanostats User's Manual Section 1:
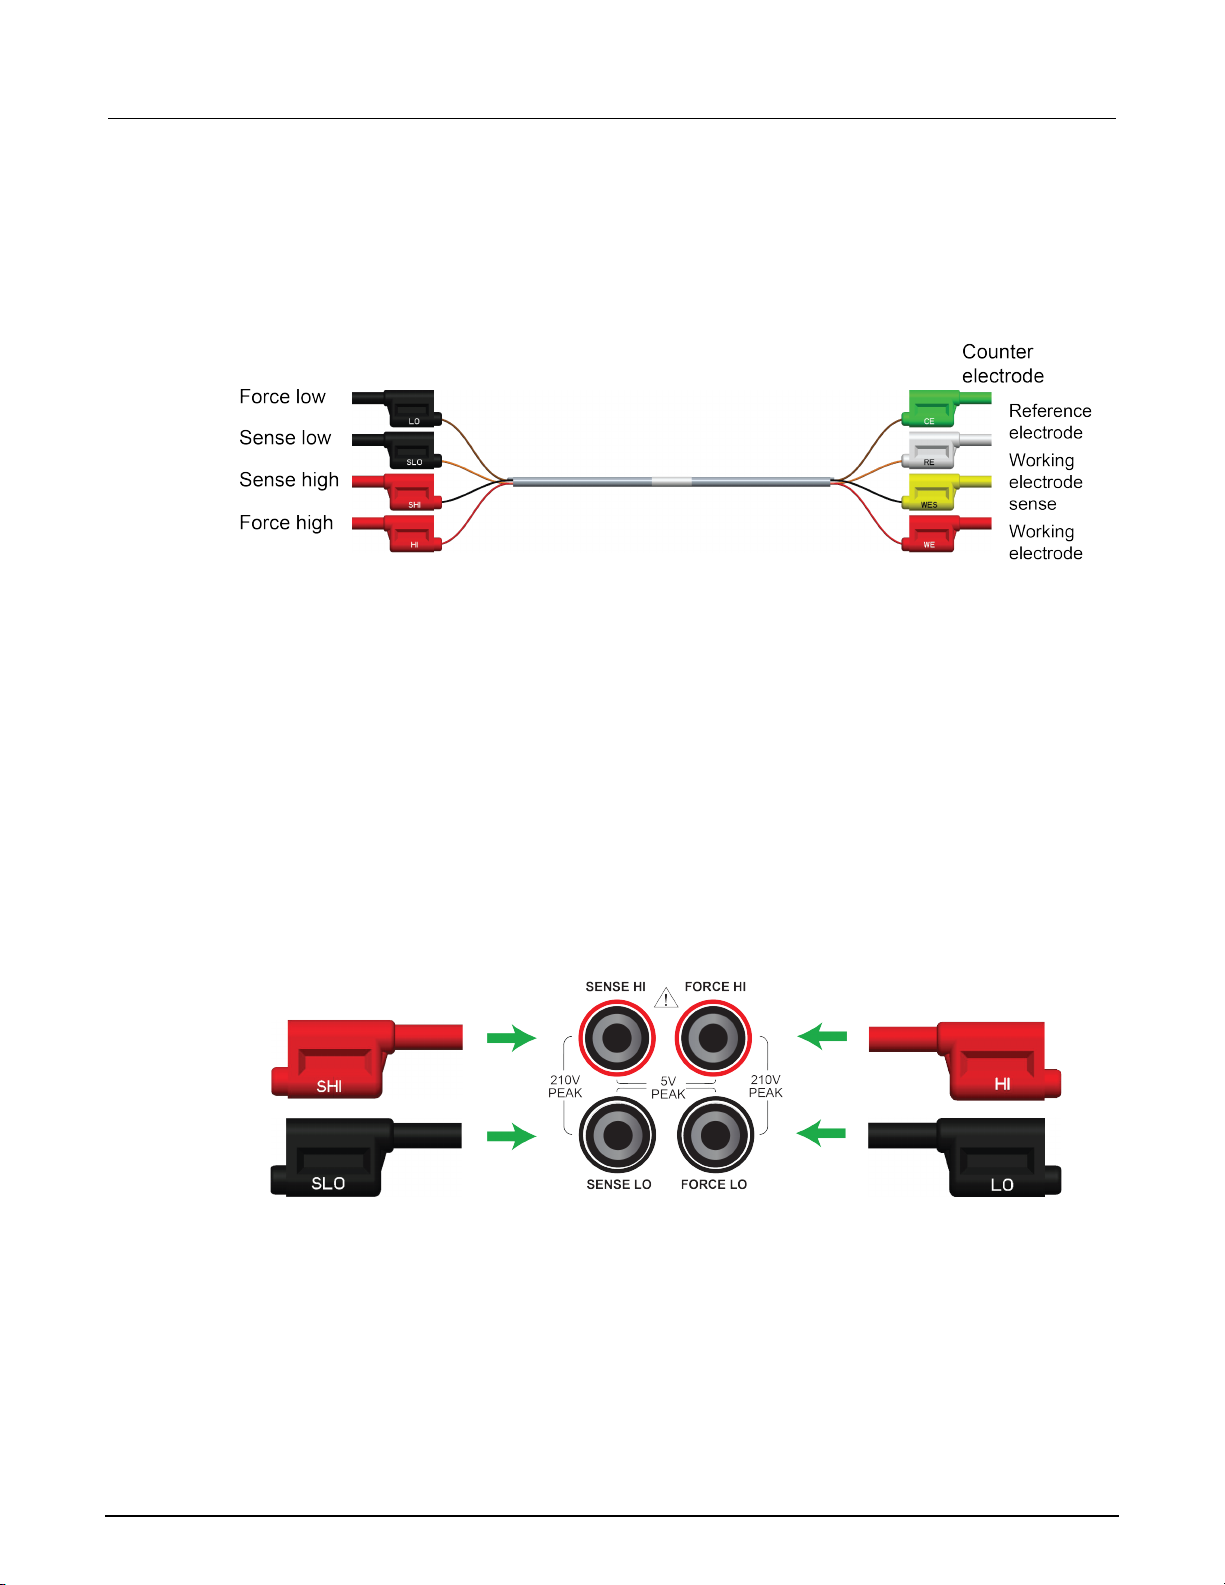
Make the device connections
The test cable lets you make connections to test cells with two, three, or four electrodes.
For two-electrode applications, the device-side cable connectors are used in stacked pairs. Connect
the WE and WES pair to the working electrode of your electrochemical cell, and connect the CE and
RE pair to the counter electrode of the cell.
Figure 7: Two-electrode cell testing cable connections
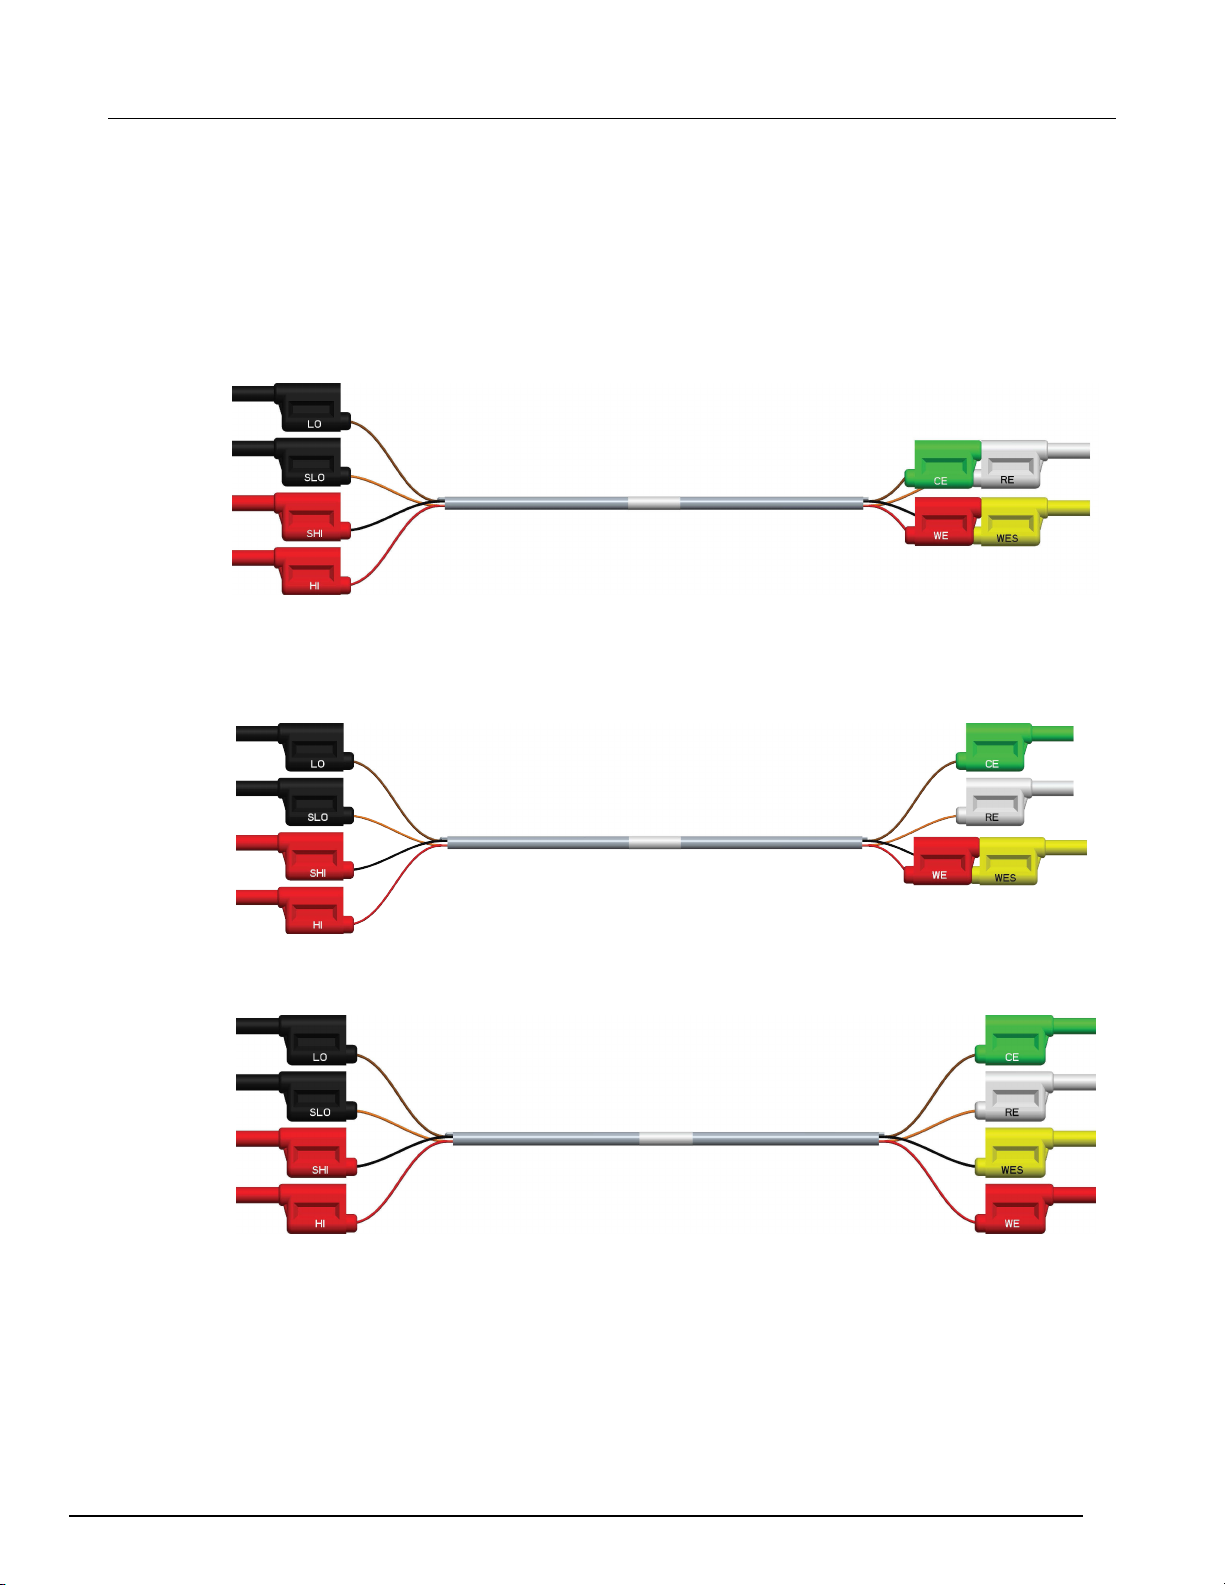
For three-electrode applications, the WE and WES connectors are stacked and attached to the
working electrode. The CE and RE connectors connect to the counter electrode and reference
electrode, respectively.
Figure 8: Three-electrode cell testing cable connections
For four-electrode applications, each device-side cable connector is used separately.
Figure 9: Four-electrode cell testing cable connections
077110402/November 2016 1-7
Page 14

Section
User's Manual
1: Introduction Models 2450-EC, 2460-EC, and 2461-EC Potentiostats And Galvanostats
Attach the alligator clips
Four insulated alligator clips are supplied. You can attach these clips to the ends of the device-side
connectors, as shown in the following graphic. The clips provide a safe, secure way to connect to
your device.
Figure 10: Alligator clip attached to accessory cable connector
For small cells and electrodes, you can use commercially available banana-to-microclip connectors
by plugging them directly into the cable connectors.
Prepare the analyte and assemble the test cell
Connect to the DUT
The next figure shows the connections from a SMU to a three-electrode test cell.
Figure 11: Front panel connections
Once the appropriate connectors or clips are attached, you are ready to connect to the test cell.
1-8 077110402/November 2016
Page 15
Models 2450
Introduction
-EC, 2460-EC, and 2461-EC Potentiostats And Galvanostats User's Manual Section 1:
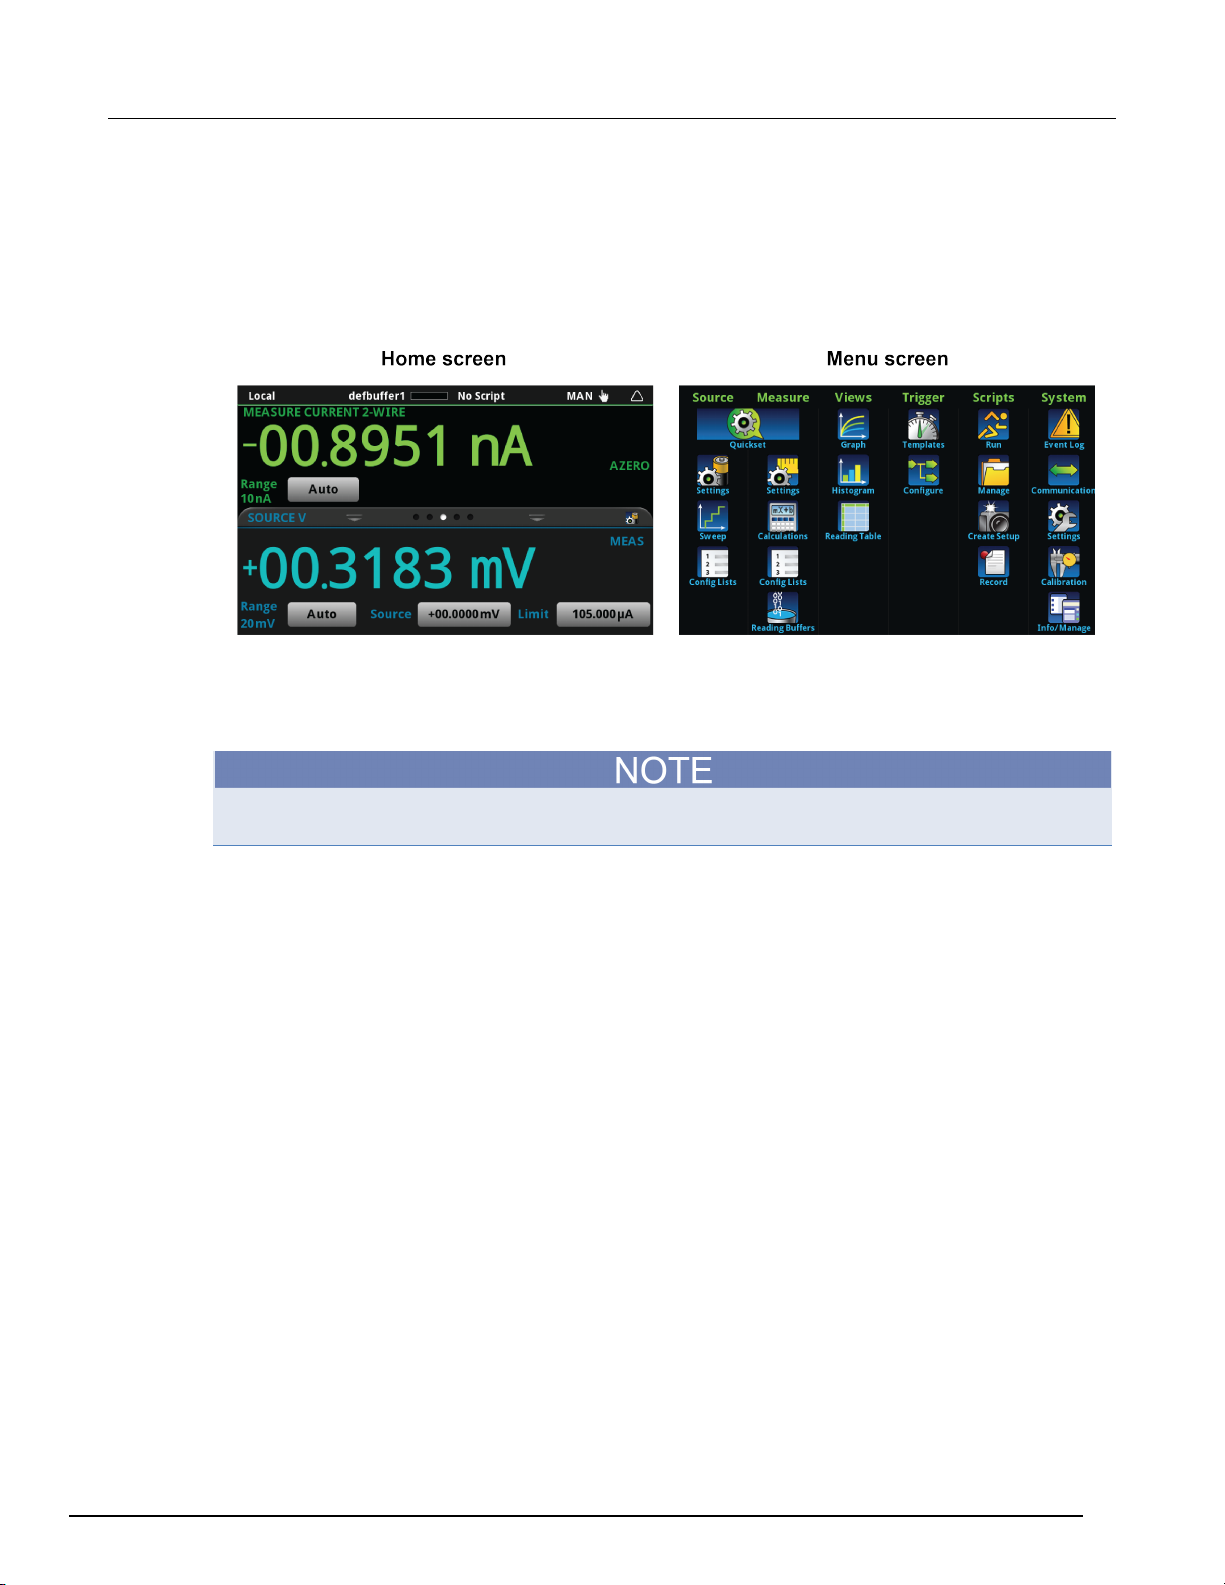
Home and Menu screen overview
Before you run a test application, the default Home and Menu screens of your SourceMeter
instrument appear like those in the next graphic. Press the HOME or MENU keys on your instrument
to access these screens.
Figure 12: SMU Home and Menu screens in standard mode
When you run an electrochemistry test application, the default Home and Menu screens are replaced
by application-specific Home and Menu screens. These screens vary, depending on the potentiostat
or galvanostat test application. You can access these screens with the HOME and MENU keys. You
will see examples of these screens later in this manual.
When a test application is running, you must select End App to exit the test and return to normal
SMU operation.
For more information on using your SMU, see your Interactive SourceMeter® Instrument Reference
Manual.
077110402/November 2016 1-9
Page 16

Cyclic Voltammetry .................................................................. 2-1
In this section:
Cyclic Voltammetry
Cyclic Voltammetry, a type of potential sweep method, is the most commonly-used measurement
electrochemical technique.
In a Cyclic Voltammetry experiment, the working electrode potential is ramped linearly versus time.
The current that flows through the circuit is measured. The resulting I-V data provides important
electrochemical properties about the analyte under investigation.
Section 2
Cyclic Voltammetry
You can make Cyclic Voltammetry measurements from the front panel of the instrument using the
Cyclic Voltammetry test application.
The Cyclic Voltammetry test application has adjustable parameter settings and enables real-time
graphing of a voltammogram on the display of the SMU potentiostat without using a computer. Test
parameters are input at source and measure setting screens that the user selects from an
application-specific menu. After the test executes, the data can be stored on a flash drive inserted in
the USB port on the front panel of the instrument.
The following topics describe how to set up and run the CyclicVoltammetry.tsp test application.
To ensure proper instrument operation, the potential difference between the reference electrode
(RE) and counter electrode (CE) terminals and between the working electrode (WE) and working
electrode sense (WES) terminals should not exceed 5 V.
Page 17

Section
User's Manual
2: Cyclic Voltammetry Models 2450-EC, 2460-EC, and 2461-EC Potentiostats And Galvanostats
Test application parameters
You must enter test parameters that are consistent with the following values. Otherwise, you may
receive unsettled and inaccurate measurements.
The Cyclic Voltammetry test application parameters are listed below.
Model 2450-EC
• Potential range: -20 V ≤ E ≤ +20 V
• Current measure ranges: 10 μA, 100 μA, 1 mA, 10 mA, 100 mA, 1 A
• Source limit (compliance): 100 % of selected current range
• Scan rate: 0.1 mV per second to 3500 mV per second
• Potential step size during scanning:
• 100 μV (0.1 mV per second ≤ scan rate < 35 mV per second)
• 1 mV (35 mV per second ≤ scan rate < 350 mV per second )
• 10 mV (350 mV per second ≤ scan rate ≤ 3500 mV per second)
• Number of cycles: 1 to 100
• User-selectable sampling intervals:
• Points per test (10 to 10,000)
• Points per cycle (10 to 10,000)
• Seconds per point (.01 to 100)
• Points per second (.01 to 100)
• Maximum total number of samples: 100,000
Models 2460-EC and 2461-EC
• Potential range: -20 V ≤ E ≤ +20 V
• Current measure ranges: 1 mA, 10 mA, 100 mA, 1 A, 4 A, 5 A, 7 A
• Source limit (compliance): 100 % of selected current range
• Scan rate: 0.1 mV per second to 3500 mV per second
• Potential step size during scanning:
• 100 μV (0.1 mV per second ≤ scan rate < 35 mV per second)
• 1 mV (35 mV per second ≤ scan rate < 350 mV per second )
• 10 mV (350 mV per second ≤ scan rate ≤ 3500 mV per second)
• Number of cycles: 1 to 100
• User-selectable sampling intervals:
• Points per test (10 to 10000)
• Points per cycle (10 to 10000)
• Seconds per point (.01 to 100)
• Points per second (.01 to 100)
• Maximum total number of samples: 100,000
2-2 077110402/November 2016
Page 18
Models 2450
Cyclic Voltammetry
-EC, 2460-EC, and 2461-EC Potentiostats And Galvanostats User's Manual Section 2:
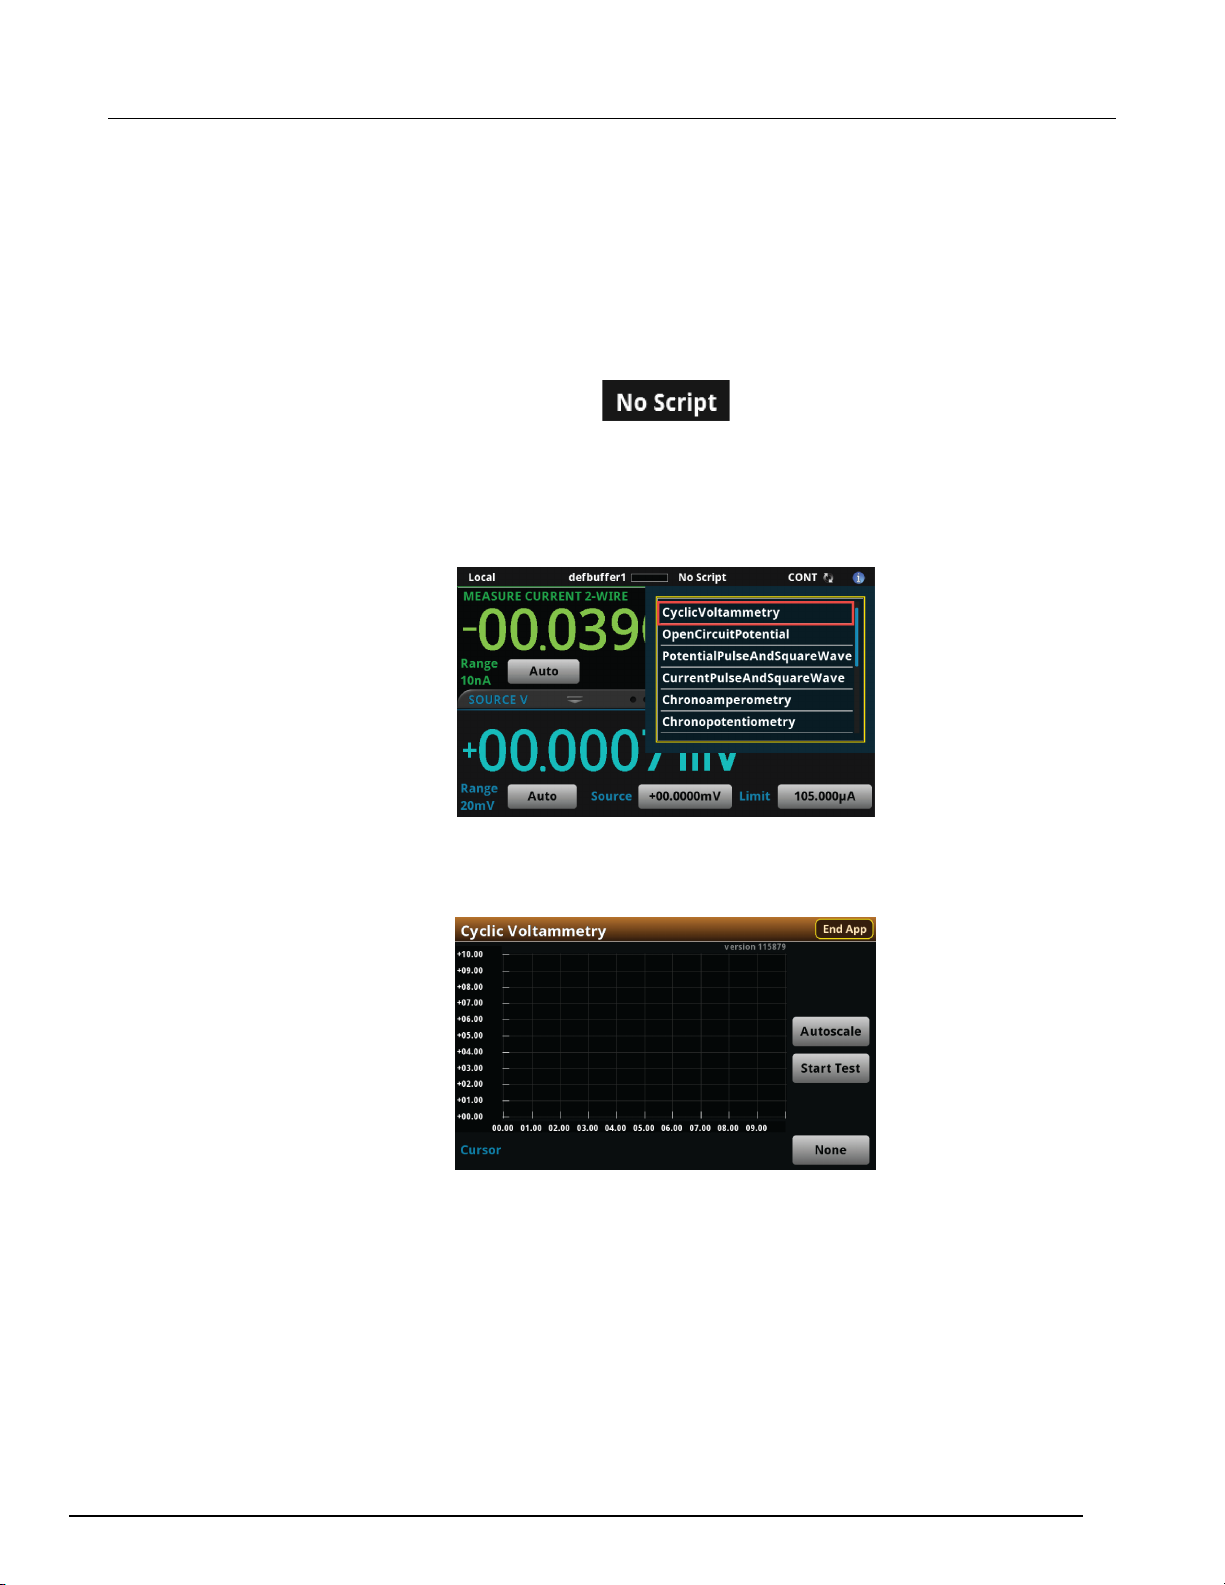
Run the Cyclic Voltammetry test application
To run the test application:
1. Press the HOME key.
2. Select the active script indicator at the top of your home screen. If there is no script activity, the
indicator displays "No Script."
Figure 13: Active script indicator
3. Select the preloaded Cyclic Voltammetry test script (potentiostats and galvanostats only) or
connect the supplied USB drive to your SMU instrument to locate the included Cyclic
Voltammetry test. If you connect the USB drive, scripts on the drive are displayed with usb1/
before the script file name.
Figure 14: Selecting the Cyclic Voltammetry test application
4. Select CyclicVoltammetry. The test application begins to run immediately and the Cyclic
Voltammetry Home screen is displayed.
Figure 15: Cyclic Voltammetry Home screen
077110402/November 2016 2-3
Page 19
Section
User's Manual
Select this control to immediately stop the test and return to normal SMU
operation.
useful for constraining all of the data to the screen's viewing size.
Select this control to immediately begin the test. This option becomes Stop
Test when the test runs.
option is only visible after the test runs.
Vertical, Horizontal, and Both.
2: Cyclic Voltammetry Models 2450-EC, 2460-EC, and 2461-EC Potentiostats And Galvanostats
The test home screen controls include:
End App
Autoscale
Select this control to define the graph based upon the plotted data. This is
Start Test
Save Data
Cursor
Select this control to save the test data to a .csv file on a flash drive. This
Select this control to cycle through the available cursor placements: None,
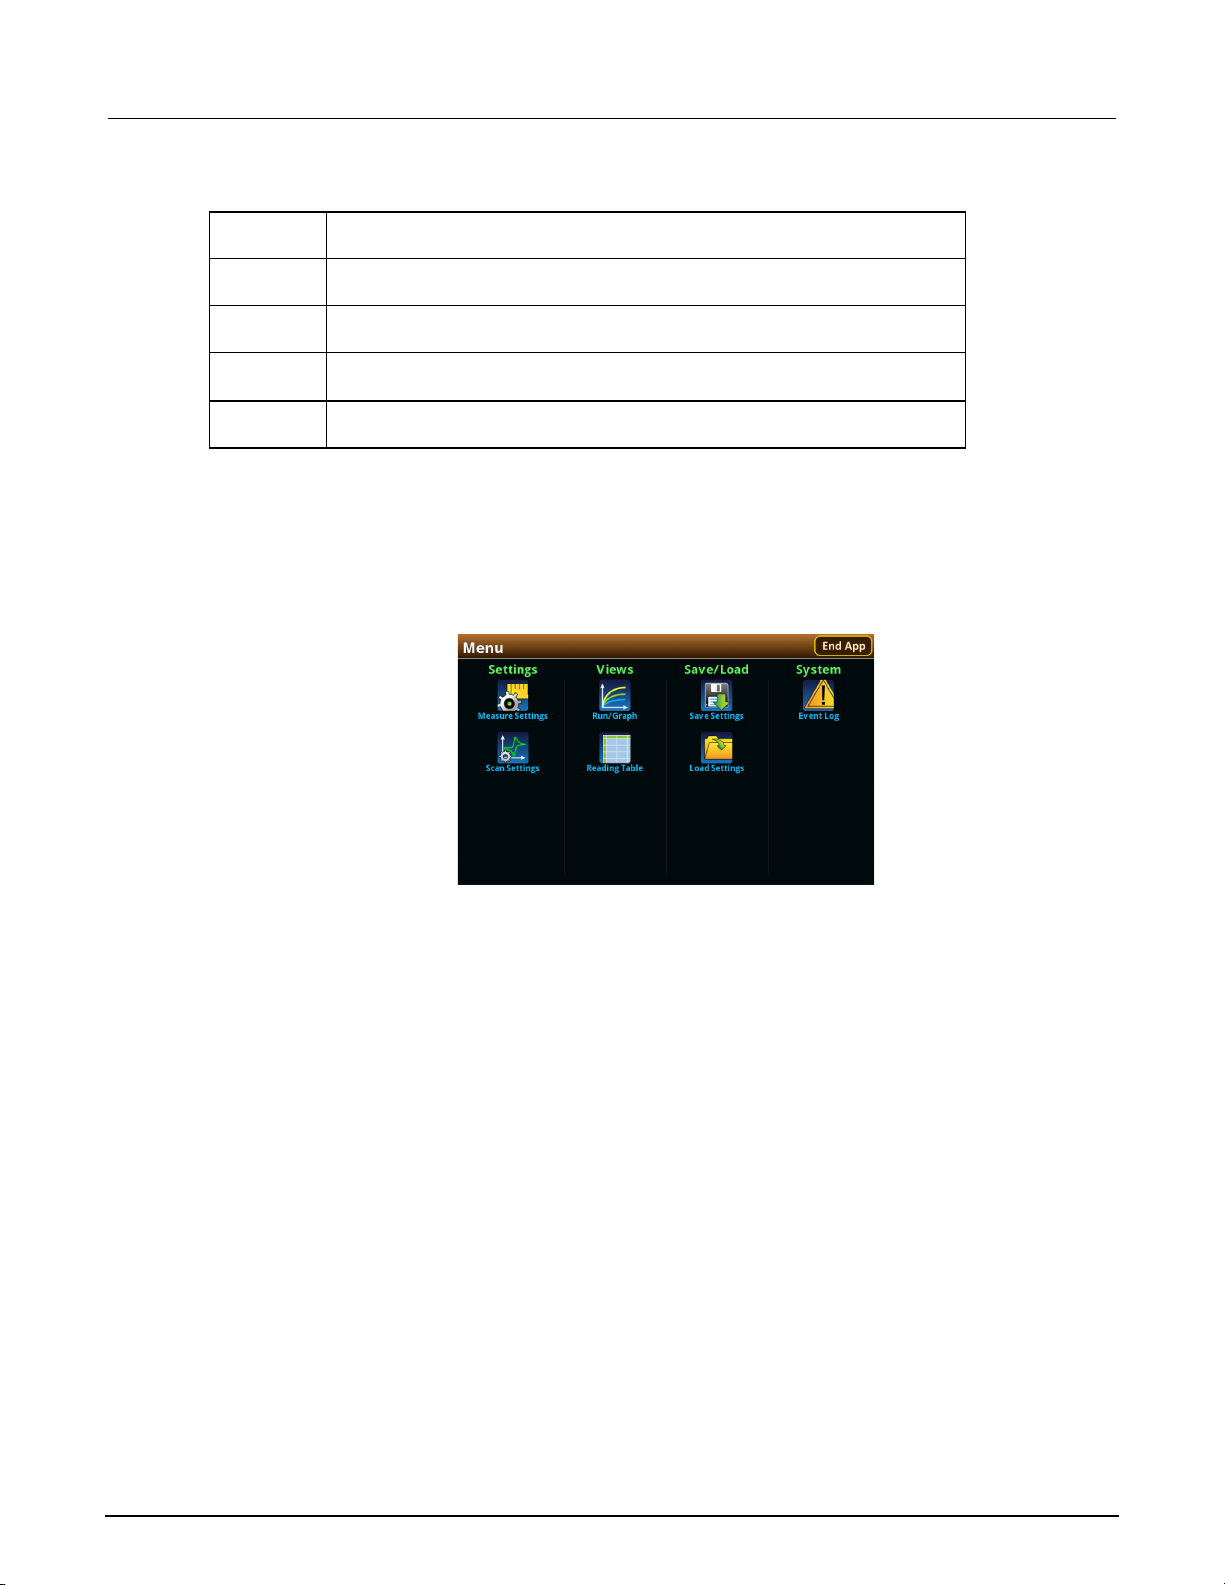
Review the Menu controls
You have different options in the Menu screen, depending on the application. The following graphic
shows the Cyclic Voltammetry main Menu. You will learn the function for each option later in this
section.
Figure 16: Cyclic Voltammetry main Menu
2-4 077110402/November 2016
Page 20
Models 2450
Cyclic Voltammetry
-EC, 2460-EC, and 2461-EC Potentiostats And Galvanostats User's Manual Section 2:
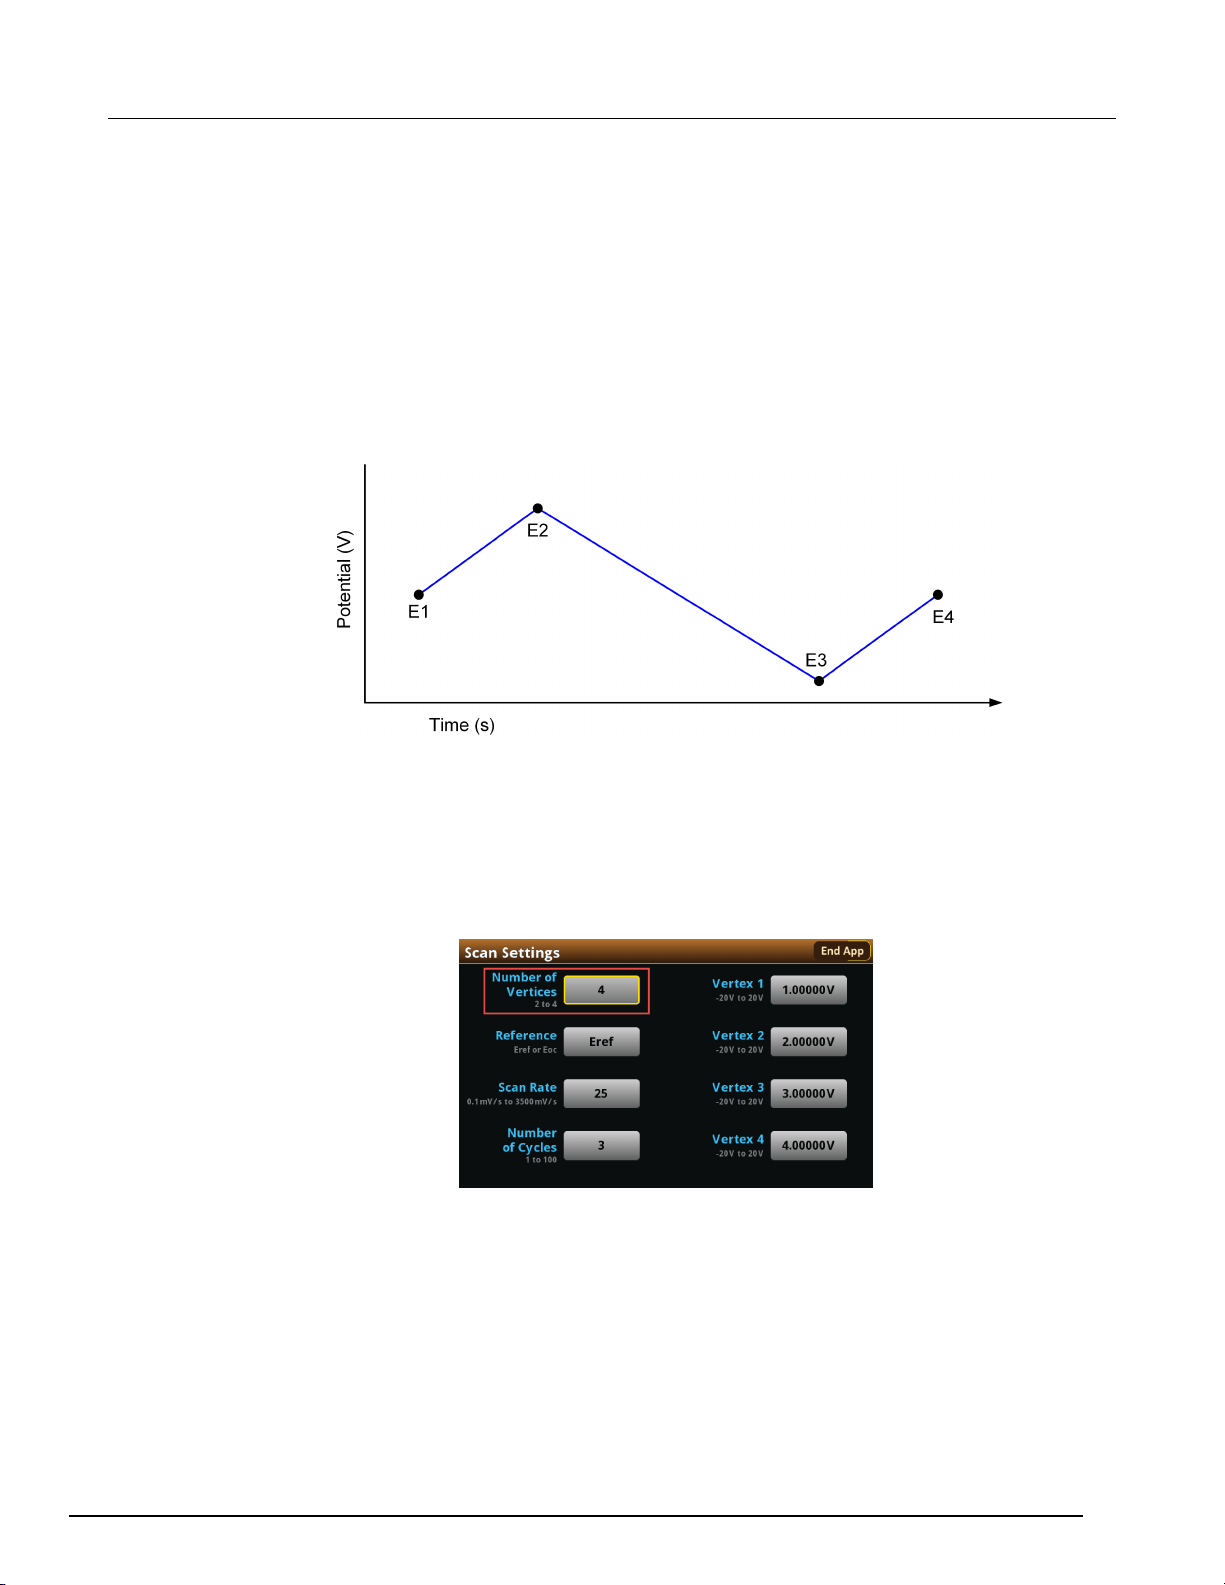
Define the potential scan parameters
You will define the potential scan parameters: Number of Vertices, vertex potentials, potential
reference, scan rate, and number of cycles.
An example of a potential scan performed during a Cyclic Voltammetry test is shown in the next
figure.
You can select up to four voltage potential vertices, which are defined as E1 (or E initial), E2, E3, and
E4 in the next figure. The slope of the lines is determined by the the scan rate that you use. You will
set the scan rate later in this step of the test.
Figure 17: Potential sweep versus time of Cyclic Voltammetry example
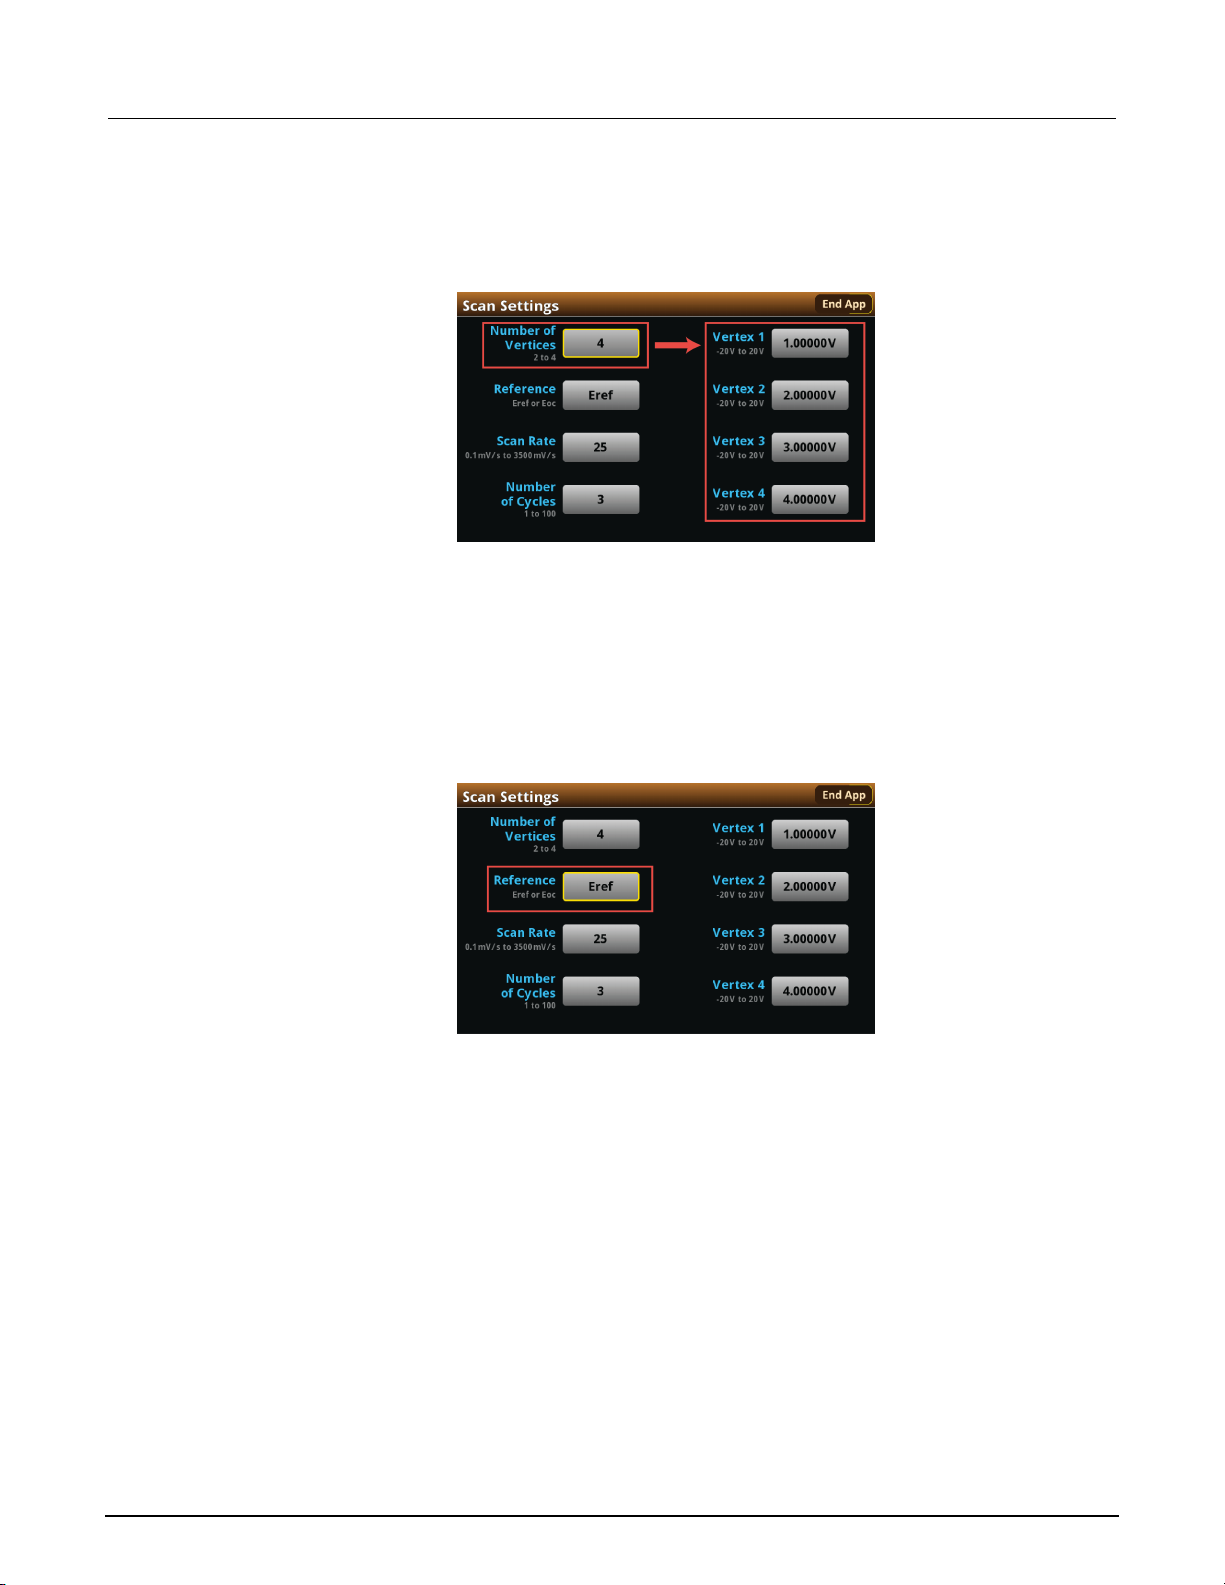
For this step, you will set the Number of Vertices, define their potentials, and specify the potential
reference.
To select the Number of Vertices:
1. Press the MENU key, then select Scan Settings.
2. Select Number of Vertices.
Figure 18: Scan Settings menu
077110402/November 2016 2-5
Page 21
Section
User's Manual
2: Cyclic Voltammetry Models 2450-EC, 2460-EC, and 2461-EC Potentiostats And Galvanostats
3. Enter the number of potential vertices. You can define two, three, or four vertices.
4. The vertex selections will change based on the number of vertices you choose. Select each
vertex to enter its potential. For this example, you will define four vertices.
Figure 19: Scan Settings menu, defining four vertices
5. Enter each vertex value in the range of ±20 V.
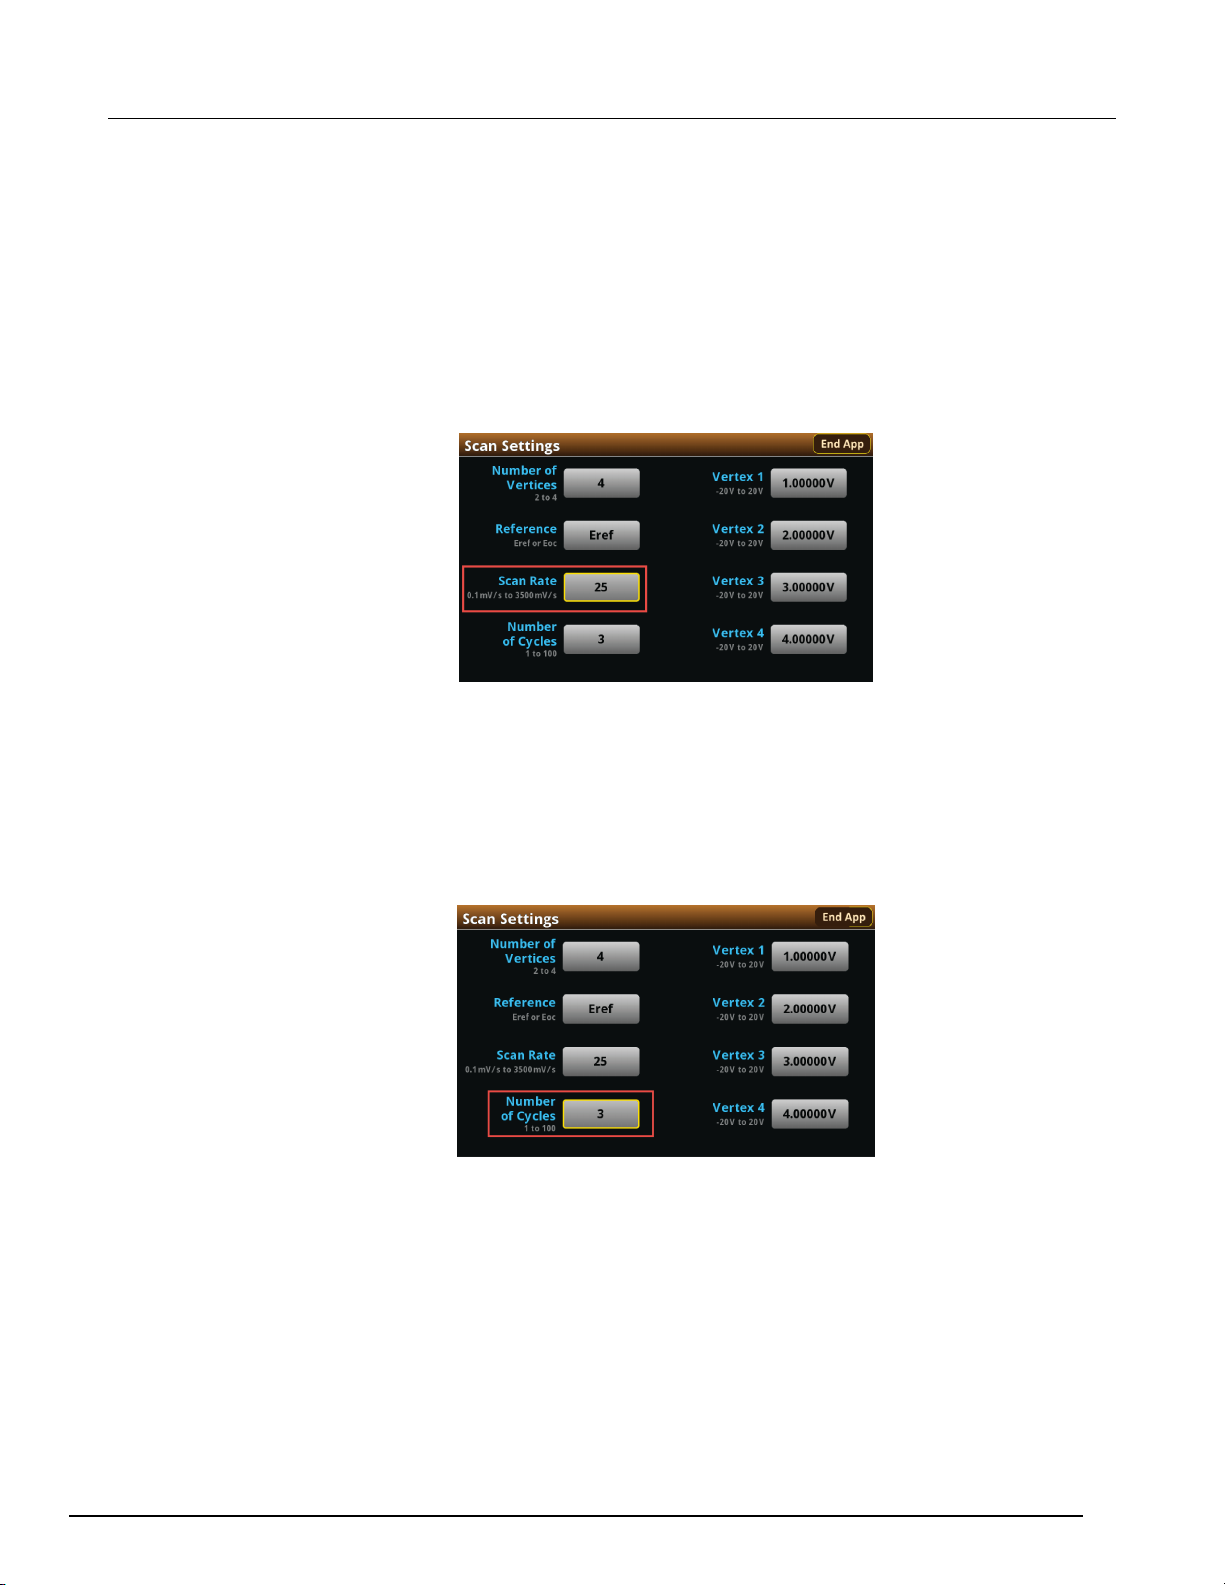
After you define the vertices, select the potential reference: Eref or Eoc. If you select Eref, the
applied potential is relative to the potential at the reference electrode. If you select Eoc, the applied
potential is relative to the open circuit potential of the cell (Eoc), which is measured immediately
before the scan begins.
To select the potential reference:
1. From the Scan Settings menu, select Reference.
Figure 20: Scan Settings menu, selecting Reference
2. Select Eref or Eoc.
2-6 077110402/November 2016
Page 22
Models 2450
Cyclic Voltammetry
-EC, 2460-EC, and 2461-EC Potentiostats And Galvanostats User's Manual Section 2:
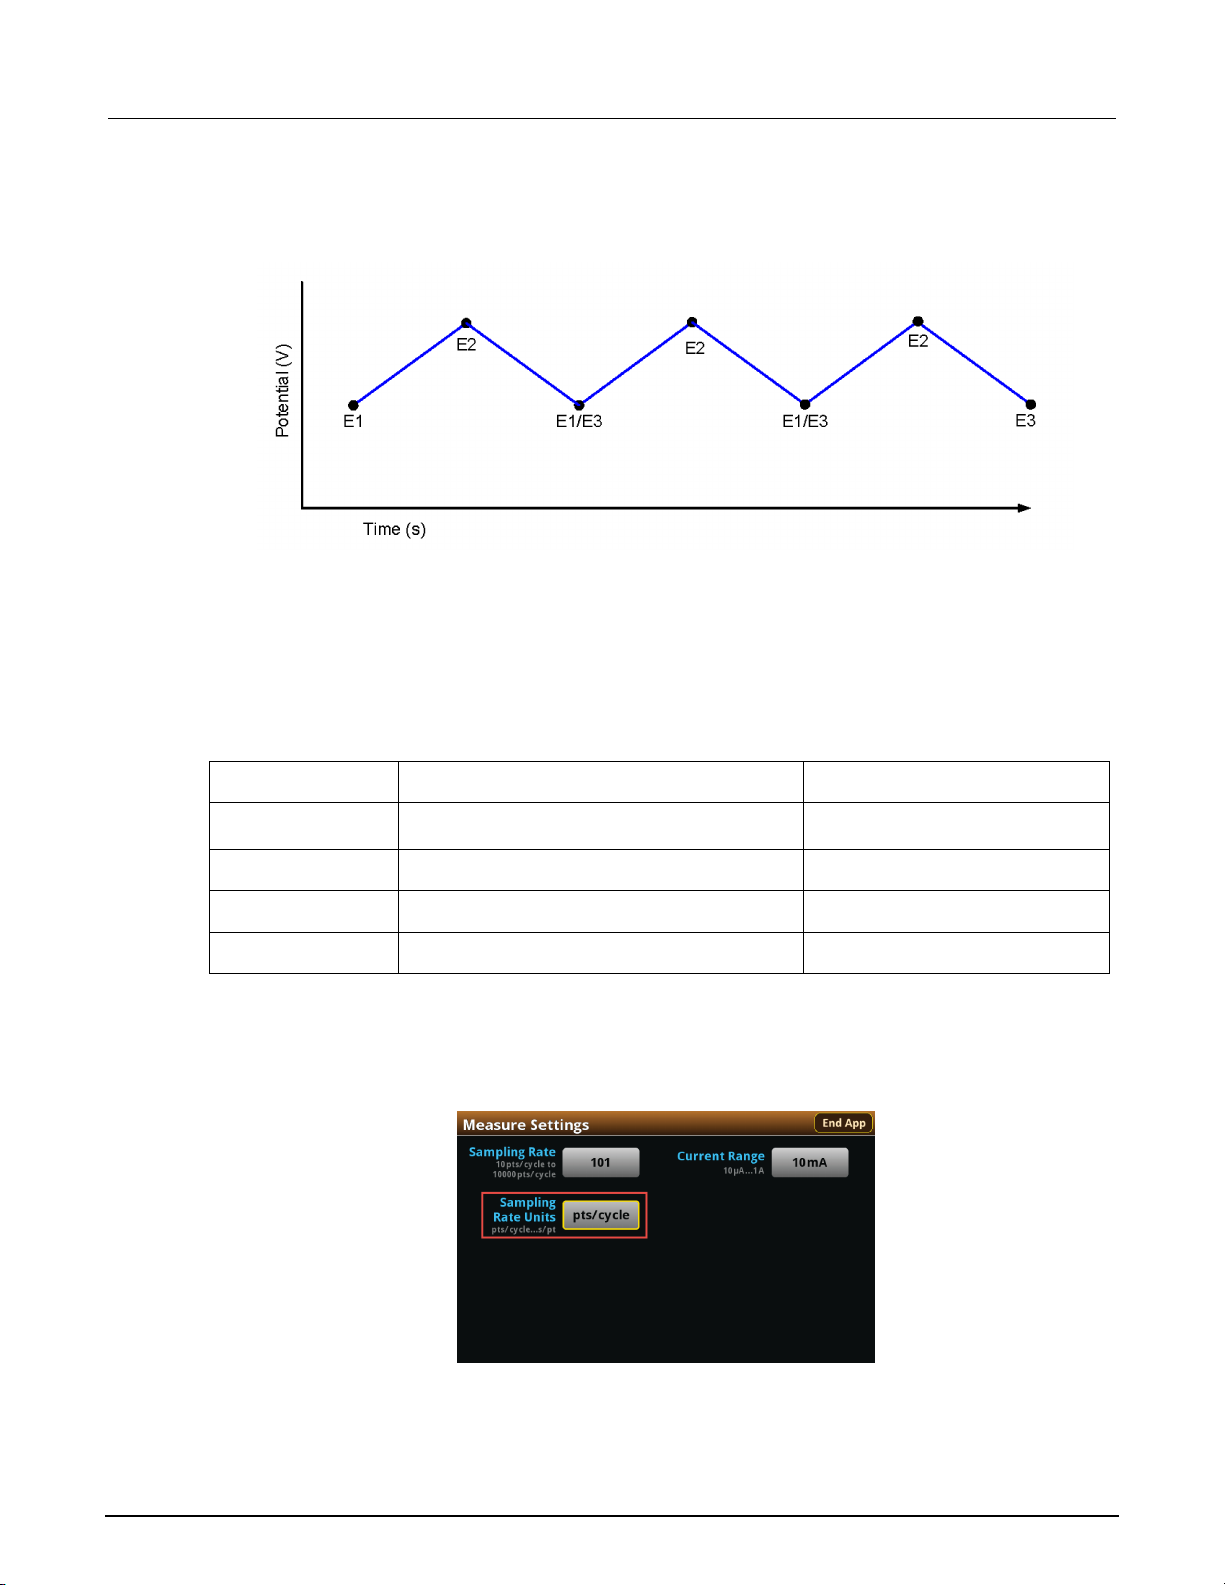
Define the Scan Settings
You can specify the scan rate in units of millivolts per second. The scan rate, defined as the change
of the potential as a function of time (∆E/∆t), determines the rate at which the potential is linearly
scanned during the experiment. You can select a scan rate of 0.1 mV per second to 3500 mV per
second.
To select the Scan Rate:
1. From the Scan Settings menu, select Scan Rate
Figure 21: Scan Settings menu, selecting the Scan Rate
2. Enter a value.
3. Select OK.
After entering the scan rate, you will choose the number of cycles, from 1 to 100. The number of
cycles determines how many times each scan is repeated.
To select the number of scan cycles:
1. From the Scan Settings screen, select Number of Cycles.
Figure 22: Scan Settings menu, selecting the Number of Cycles
2. Enter a value.
3. Select OK.
077110402/November 2016 2-7
Page 23
Section
User's Manual
regardless of how many cycles
s/point
The number of seconds per each point
0.01 to 100
points/s
The number of points taken per second
0.01 to 100
2: Cyclic Voltammetry Models 2450-EC, 2460-EC, and 2461-EC Potentiostats And Galvanostats
The following figure shows an example of a potential versus time graph showing three cycles of a
three-vertex voltage sweep.
Figure 23: Example potential versus time graph
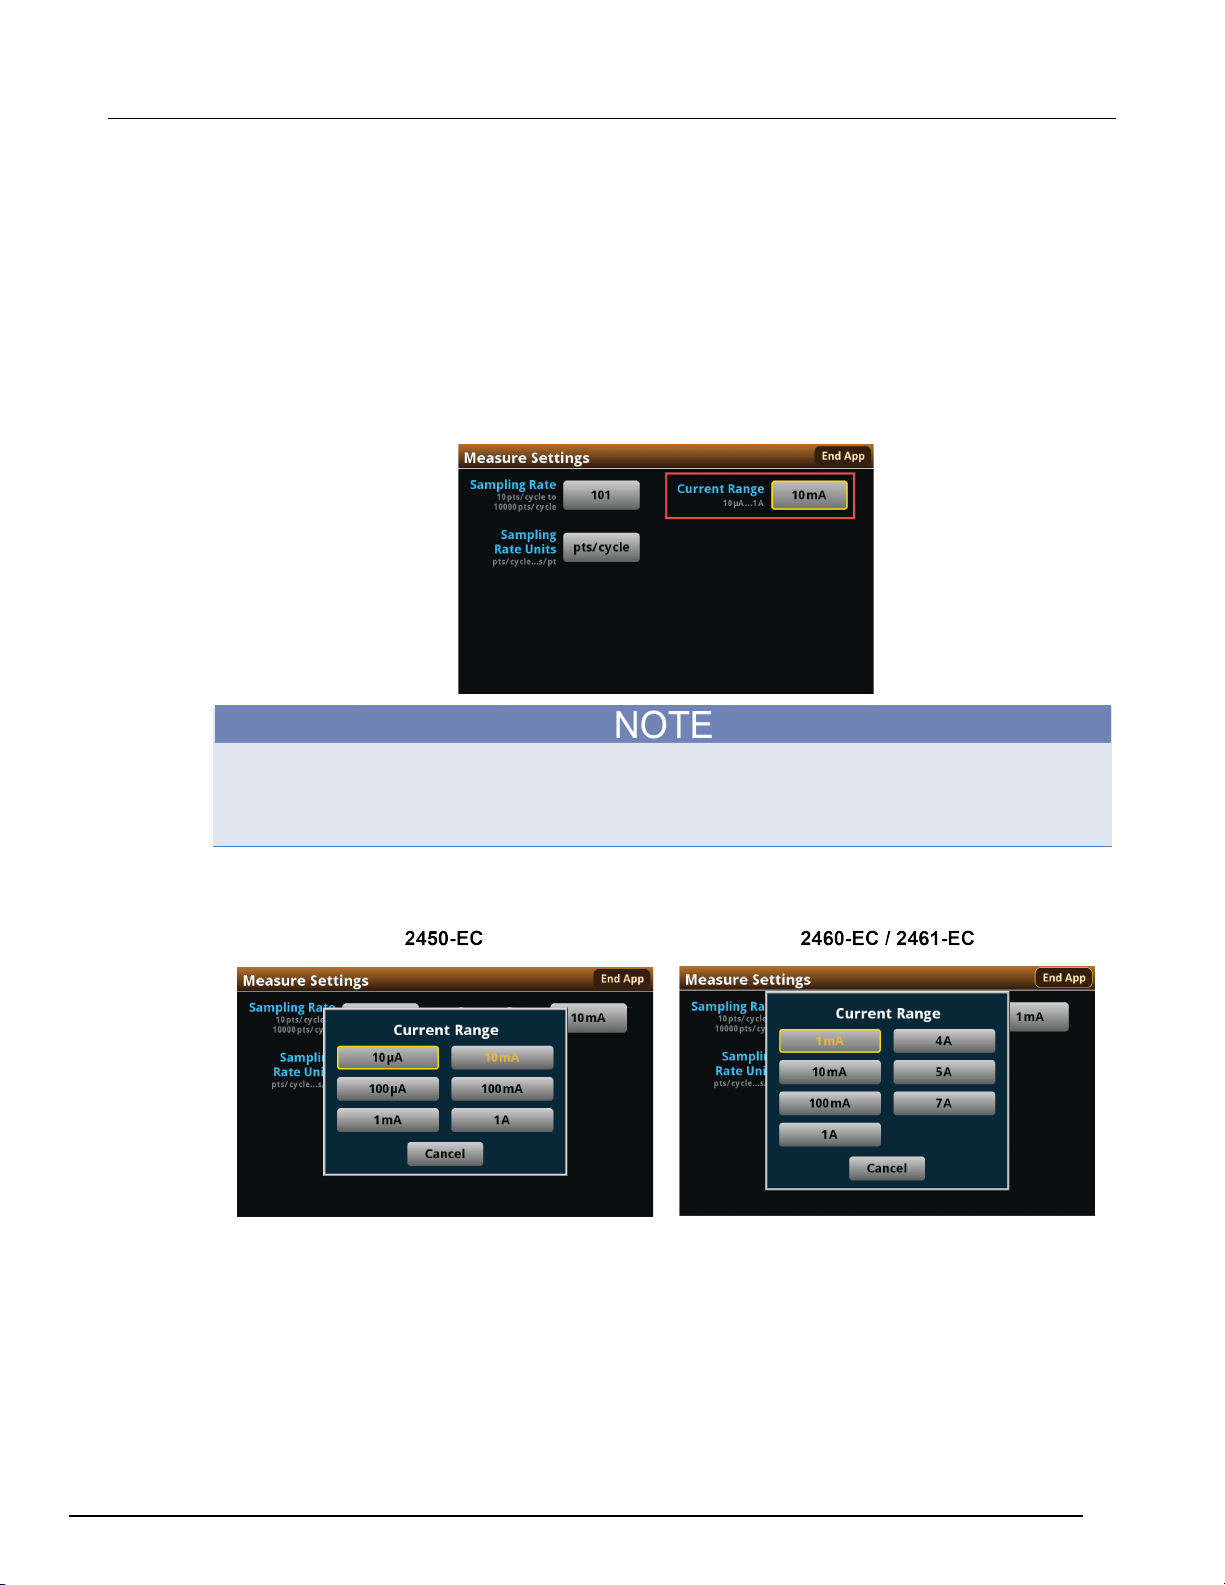
Select the Sampling Rate Units, Sampling Rate, and Current Range
Specify how often to make measurements during the scan by selecting one of the sampling rate units
shown in the following table and setting a value for the sampling rate. The acquired measurements
are stored in the active buffer of the instrument, cvBuffer. The buffer can hold a maximum of
100,000 readings.
The following table describes the available interval units and accompanying range of values.
Sampling rate unit Description Sampling rate range of values
points/test The number of points acquired during a test,
points/cycle The number of points acquired in each cycle 10 to 10,000
To select the Sampling Rate Units:
1. From the Menu screen, select Measure Settings.
2. Select Sampling Rate Units.
Figure 24: Measure Settings menu, selecting the Sampling Rate Units
10 to 10,000
3. Select the units you want to use for the test. You can now set a sampling rate.
2-8 077110402/November 2016
Page 24
Models 2450
try
-EC, 2460-EC, and 2461-EC Potentiostats And Galvanostats User's Manual Section 2: Cyclic Voltamme
To set the Sampling Rate:
1. From the Measure Settings screen, select Sampling Rate.
2. Enter a value.
3. Select OK.
Now, you will select the Current Range to measure the current from the scan. Choose the range
based upon the largest current magnitude you expect during the test.
To select the current measurement range:
1. From the Measure Settings screen, select Current Range.
Figure 25: Measure Settings menu, selecting the Current Range
When the test runs, your potentiostat will limit the magnitude of the maximum current that can flow in
the test circuit to 100 percent of the selected current range. This could affect your experiment results.
If your expected current is near the full scale of a range, select the next highest current range to
minimize the influence of your potentiostat on the test
2. Choose a value. Note that the choices are different depending on your potentiostat model.
Figure 26: Selecting the Current Range
077110402/November 2016 2-9
Page 25

Section
User's Manual
2: Cyclic Voltammetry Models 2450-EC, 2460-EC, and 2461-EC Potentiostats And Galvanostats
Save or load the test parameter data
You can save your test parameters to the front-panel flash drive at any time. Up to five test parameter
configurations can be stored.
To save the test parameters:
1. From the Menu screen, select Save Settings.
If you have saved a settings file previously with the same File Selection number, you will be
prompted to overwrite it.
Figure 27: Selecting Save Settings
2. Select a file number and then select Save Settings. You are notified when the save is complete,
as shown in the next figure. Select OK to clear the prompt.
Figure 28: Successful file save
2-10 077110402/November 2016
Page 26

Models 2450
Cyclic Voltammetry
-EC, 2460-EC, and 2461-EC Potentiostats And Galvanostats User's Manual Section 2:
To load saved test parameters:
Test parameters can only be loaded to the same instrument model on which they were created and
saved. For example, you cannot load test parameter settings created with a 2450-EC to a 2460-EC.
1. From the Menu screen, select Load Settings.
Figure 29: Selecting Load Settings
2. Select a file by choosing File Selection and then a file number.
Figure 30: Choosing a file to load
077110402/November 2016 2-11
3. Select Load Settings. You are notified when the load completes. Select OK to clear the prompt.
Page 27
Section
User's Manual
2: Cyclic Voltammetry Models 2450-EC, 2460-EC, and 2461-EC Potentiostats And Galvanostats
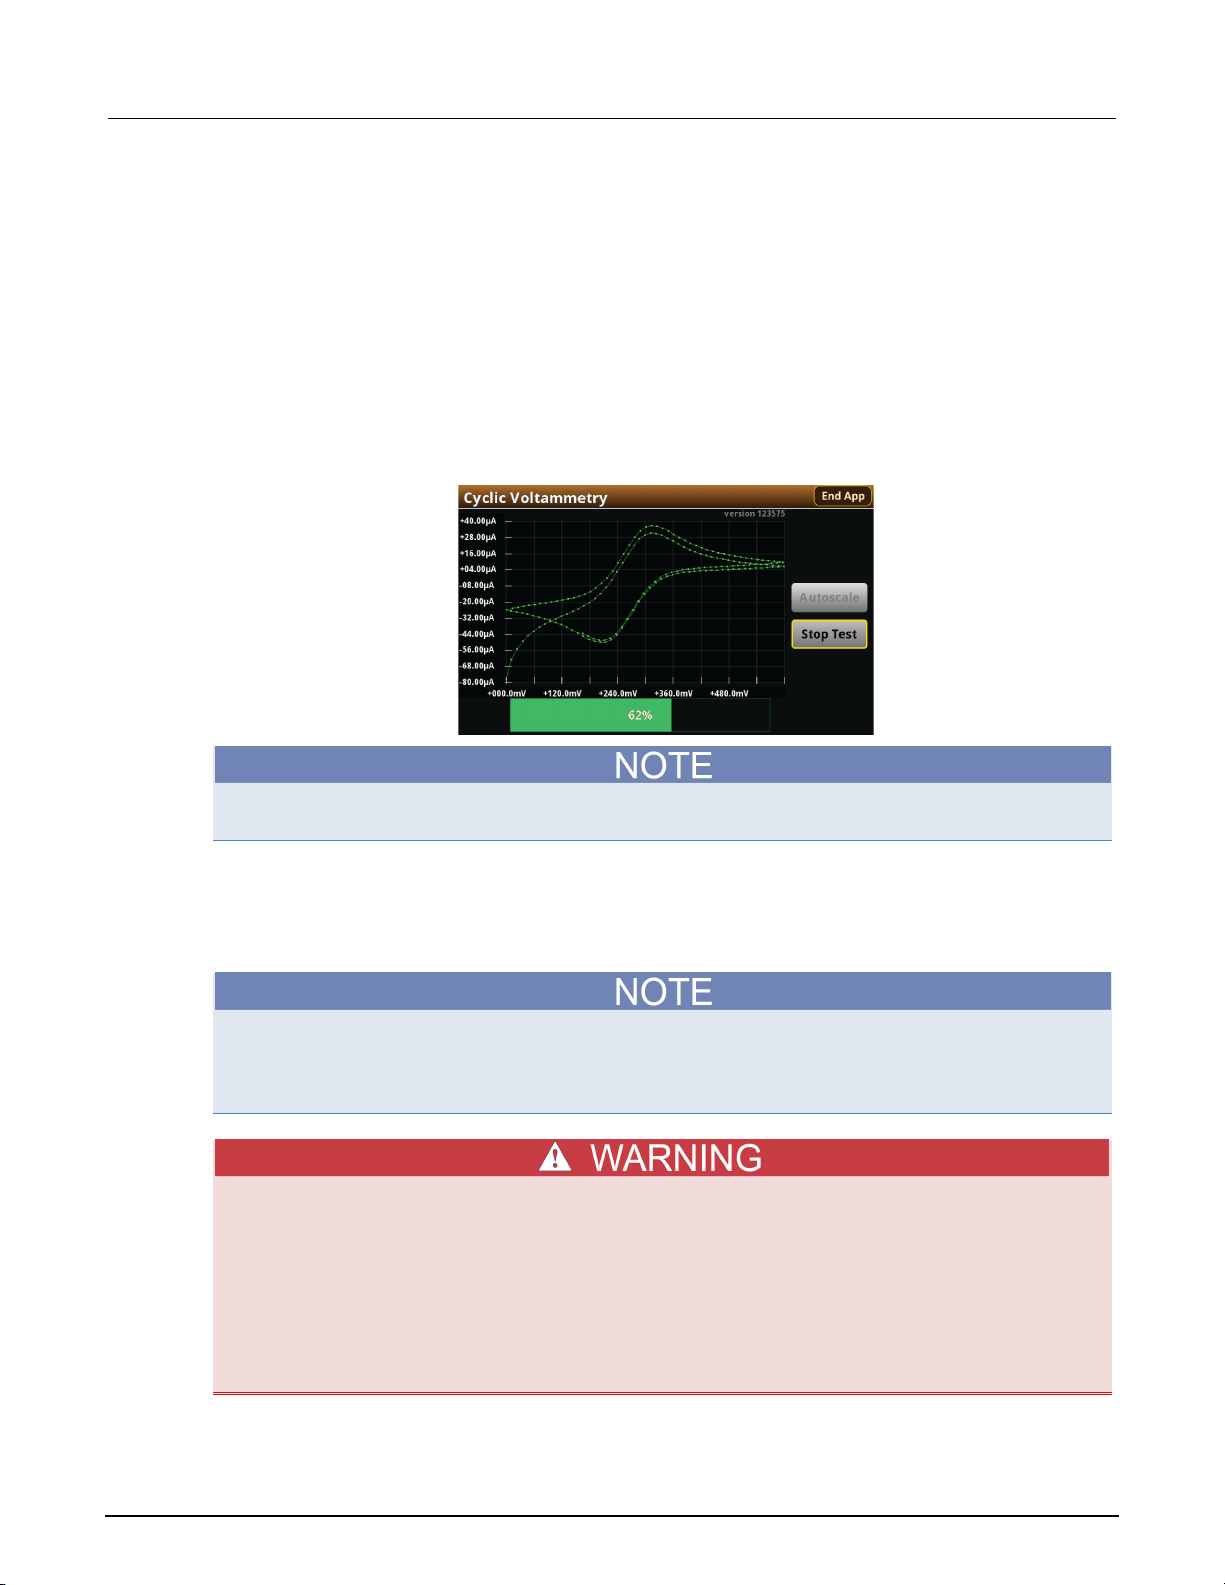
Run the test and view the graph
To run the test and view the graph:
1. Press the HOME key.
2. Select Start Test. The output turns on automatically, and the display shows the current
measurements plotting in real time, along with a progress bar at the bottom of the screen. The
Start Test control also changes to Stop Test for the duration of the test.
The output turns off when the test completes. The following graphic shows the test Home screen
during the test. You can return to this Home screen at any time when the test is running by selecting
the Run / Graph option from the Menu screen.
Figure 31: Cyclic Voltammetry test results graph
You can use the touchscreen to manipulate the graph or add cursors. See your Interactive
SourceMeter® Instrument Reference Manual for more information.
You can save a screen capture to a flash drive inserted into the USB port of the potentiostat by
simultaneously pressing the HOME key and the ENTER key. The file name has the format
imgmmdd_xxxxxx.png, where mmdd represents the instrument month and day and xxxxxx is a
system-generated number.
To end the test before the run completes, select Stop Test at any time. This stops the test and turns
off the the potentiostat output. You can then select End App to exit the test and return to normal
SMU operation.If there is a long interval between consecutive samples, there may be a long delay
between selecting Stop Test and when the test stops, as the current operation must complete.
Make sure to select Stop Test before selecting End App. Stop Test turns off the instrument's
output.
Hazardous voltages may be present on all output and guard terminals. To prevent electrical
shock that could cause injury or death, never make or break connections to the instrument
while the power is turned on. Turn off the equipment from the front panel or disconnect the
main power cord from the rear of the instrument before handling cables. Putting the
equipment into an output-off state does not guarantee that the outputs are powered off if a
hardware or software fault occurs.
2-12 077110402/November 2016
Page 28

Models 2450
Cyclic Voltammetry
-EC, 2460-EC, and 2461-EC Potentiostats And Galvanostats User's Manual Section 2:
Acquire the open circuit potential (Eoc)
If you selected Eoc as the potential reference for the scan, then the open circuit potential will be
measured immediately after starting the test. You are prompted by the test application, as shown in
the next figure.
Figure 32: Prompt for Eoc measurement
If you select Yes, the instrument measures the open circuit potential (Eoc) of your electrochemical
cell. If you select No, the test stops. After the Eoc is measured, the value is displayed in a prompt, as
shown in the next figure.
Figure 33: Eoc measurement displayed
If this value is acceptable, then select Yes to start the scan. If you select No, the test will stop. The
measured Eoc value is saved in the eocBuffer internal buffer of the instrument.
077110402/November 2016 2-13
Page 29

Section
User's Manual
2: Cyclic Voltammetry Models 2450-EC, 2460-EC, and 2461-EC Potentiostats And Galvanostats
Save the test data to the flash drive
You can save the data generated from the test to the front-panel flash drive. The data is stored in a
.csv file that also includes instrument information and parameter settings.
If there are more than 10,000 measurements stored, the process of saving the data may take several
minutes.
To save the test data to the flash drive:
1. Make sure your flash drive is inserted into the front panel USB port.
2. From the test application home screen, select Save Data.
3. Specify a file name, then select OK.
4. Select OK on the confirmation message.
Figure 34: Test results saved successfully
View the results saved to the flash drive
To view the test results, open the saved file in a spreadsheet program on a computer. Current,
voltage, time, and general parameters for the test are included in the file.
View the test reading table
You can view the individual data points by selecting Reading Table from the Menu screen. See the
next figure.
Figure 35: Viewing the Reading Table
2-14 077110402/November 2016
Page 30

Models 2450
Cyclic Voltammetry
-EC, 2460-EC, and 2461-EC Potentiostats And Galvanostats User's Manual Section 2:
View the Event Log
From the main Menu, you can select Event Log. The event log records events, which can be errors,
warnings, and information reported by your instrument. Through the Event Log menu, you can view
these events. You can also specify which events are shown in the event log, which ones are logged,
and which ones generate popup messages.
Figure 36: Viewing the Event Log
See your Keithley Instruments 2450, 2460, or 2461 Interactive SourceMeter® Instrument Reference
Manual for further details on the Event Log.
End the test application
When you are finished making measurements, select End App to exit the test and return to normal
SMU operation.
Make sure to always select Stop Test before selecting End App. Stop Test turns off the
instrument's output.
077110402/November 2016 2-15
Page 31

Section
User's Manual
2: Cyclic Voltammetry Models 2450-EC, 2460-EC, and 2461-EC Potentiostats And Galvanostats
Cyclic Voltammetry theory
A typical electrochemical measurement circuit, which consists of an electrochemical cell, an
adjustable voltage source (V
figure.
Figure 37: Simplified measurement circuit for performing Cyclic Voltammetry
), an ammeter (AM), and a voltmeter (VM), is shown in the following
S
The three electrodes of the electrochemical cell are the working electrode (WE), reference electrode
(RE), and the counter, or auxiliary, electrode (CE). The voltage source (V
) for the potential scan is
S
applied between the working electrode and the counter electrode. The potential (E) between the
reference electrode and the working electrode is measured with the voltmeter (V
voltage (V
) is adjusted to maintain the targeted potential at the working electrode with respect to the
s
). The overall
M
reference electrode. The resulting current (i) flowing to the working electrode is measured with the
ammeter (A
An example procedure to make a measurement for each point in the scan (E
). This process is usually repeated for a range of E.
M
):
i
1. Select a potential (E) for RE with respect to WE.
2. Adjust the voltage across the entire cell (CE to WE) to get desired E (closed loop control).
3. Measure i.
4. Step to a new E and repeat the procedure until the scan is finished. The procedure can be a
single sweep between two potentials (Linear Sweep Voltammetry) or one in which the sweep is
inverted when a certain potential is reached (Cyclic Voltammetry). This cycle may be repeated
multiple times during an experiment.
5. Plot the results and derive parameters of interest from the data.
Once the experiment is finished, the measured current is plotted as a function of the potential in a
graph known as a voltammogram. The example voltammogram in the following figure shows four
voltage vertices:
• E1 (initial potential)
• E2 (second, switching potential)
• E3 (third, switching potential)
• E4 (final potential)
2-16 077110402/November 2016
Page 32

Models 2450
Cyclic Voltammetry
-EC, 2460-EC, and 2461-EC Potentiostats And Galvanostats User's Manual Section 2:
The voltage peaks in the waveform are the anodic (Epa) and the cathodic (Epc) peak potentials.
Figure 38: Example voltammogram generated by a 2450-EC
In this example, the scan begins at E1 and the potential becomes more positive, causing the anodic
current (to rise rapidly and peak at the anodic peak potential (E
).
pa
At E2, the scan direction switches to negative for the reverse scan. As the current becomes more
negative, cathodic current flows as the electrode process is reduced. A cathodic peak potential
occurs at E
.
pc
At E3, the direction reverses again and the voltage is swept until it reaches E4. From the potential
sweep, important information about the experiment can be derived and analyzed.
Keithley galvanostat scan theory
The 2450-EC, 2460-EC, and 2461-EC digital potentiostats do not output a truly linear voltage; they
output very small, digitized steps from 0.1 mV to 10 mV for a specified time (dt), depending upon the
scan rate. See the next figure. While this will not cause significant errors in normal geometry cells
(such as 10 mL analytic and most galvanic cells), there might be errors when using micro and
ultramicro electrodes. The voltage step sizes used are calculated during scanning based on the user
set scan rate:
• 100 μV (0.1 mV per second ≤ scan rate < 35 mV per second)
• 1 mV (35 mV per second ≤ scan rate < 350 mV per second)
• 10 mV (350 mV per second ≤ scan rate ≤ 3500 mV per second)
Figure 39: Potential scan
077110402/November 2016 2-17
Page 33

Section
User's Manual
2: Cyclic Voltammetry Models 2450-EC, 2460-EC, and 2461-EC Potentiostats And Galvanostats
Analog integration current method
To measure the resulting current at each step, many digital potentiostats make a single current
measurement at a fixed point (t) for each discrete voltage step, which may not be at the same time for
each step. See the following figure.
Figure 40: Voltage step measurements
Conversely, the 2450-EC , 2460-EC, and 2461-EC use an internal analog integrator to integrate
current over most of the voltage step and report the average current over the aperture time (dt) of the
voltage step. See the following figure. This average current is used in the generation of the
voltammogram.
Figure 41: Current integration
2-18 077110402/November 2016
Page 34

Models 2450
Cyclic Voltammetry
-EC, 2460-EC, and 2461-EC Potentiostats And Galvanostats User's Manual Section 2:
Open circuit potential theory
When the open circuit potential is measured, no current or voltage is applied to the cell. This voltage
measurement is made using the galvanostat to source current and measure voltage (see the next
figure). The instrument sources 0 A on the 1e-6 range using a 4-wire configuration.
Figure 42: Measuring open circuit potential of an electrochemistry cell
You can use this potential measurement as the zero measurement when defining the voltage
vertices. When you do this, the Eoc measurement gets added to the voltage.
077110402/November 2016 2-19
Page 35

Open Circuit Potential .............................................................. 3-1
In this section:
Open Circuit Potential
The Open Circuit Potential (OCP) of an electrochemical cell is the voltage between the reference and
working electrodes. When the open circuit potential is measured, a voltmeter with high impedance is
used to measure the voltage with no current or voltage applied to the cell.
Because of its high input impedance, your galvanostat can be used to make OCP measurements
when configured for 4-wire measurements, as shown in the next figure. In this setup, the instrument is
configured to source 0 A and measure voltage.
Section 3
Open Circuit Potential
If you measure the OCP before performing any test, you do not have to change any test leads
between measurements, because your potentiostat or galvanostat can automatically change
functions.
Figure 43: Measuring the Open Circuit Potential
To ensure proper instrument operation, the potential difference between the reference electrode
(RE) and counter electrode (CE) terminals and between the working electrode (WE) and working
electrode sense (WES) terminals should not exceed 5 V.
Page 36

Section
User's Manual
3: Open Circuit Potential Models 2450-EC, 2460-EC, and 2461-EC Potentiostats And Galvanostats
Test application parameters
You must enter test parameters that are consistent with the following values. Otherwise, you may
receive unsettled and inaccurate measurements.
The Open Circuit Potential test application parameters are listed below.
Model 2450-EC
• Potential measure ranges: 20 mV, 200 mV, 2 V, 20 V
• Sample interval: 0.75 s ≤ sample interval ≤ 100 s
• Number of samples: 1 to 100,000
Models 2460-EC and 2461-EC
• Potential measure ranges: 200 mV, 2 V, 7 V, 10 V, 20 V
• Sample interval: 0.75 s ≤ sample interval ≤ 100 s
• Number of samples: 1 to 100,000
Run the Open Circuit Potential test application
To run the test application:
1. Press the HOME key.
2. Select the active script indicator at the top of your home screen. If there is no script activity, the
indicator displays "No Script."
Figure 44: Active script indicator
3. Select the preloaded OCP test script (potentiostats and galvanostats only) or connect the
supplied USB drive to your SMU instrument to locate the included OCP test. If you connect the
USB drive, scripts on the drive are displayed with usb1/ before the script file name.
Figure 45: Selecting the Open Circuit Potential test application
3-2 077110402/November 2016
Page 37

Models 2450
Open Circuit Potential
Select this control to immediately stop the test and return to normal SMU
operation.
useful for constraining all of the data to the screen's viewing size.
Select this control to immediately begin the test. This option becomes Stop
Test when the test runs.
option is only visible after the test runs.
Vertical, Horizontal, and Both.
-EC, 2460-EC, and 2461-EC Potentiostats And Galvanostats User's Manual Section 3:
4. Select OpenCircuitPotential. The test application begins to run immediately and the OCP
Home screen is displayed.
Figure 46: Open Circuit Potential test home screen
The test home screen controls include:
End App
Autoscale
Select this control to define the graph based upon the plotted data. This is
Start Test
Save Data
Cursor
Select this control to save the test data to a .csv file on a flash drive. This
Select this control to cycle through the available cursor placements: None,
Review the Menu controls
You have different options in the Menu screen, depending on the application. The following graphic
shows the Open Circuit Potential main Menu. You will learn the function for each option later in this
section.
Figure 47: Open Circuit Potential main Menu
077110402/November 2016 3-3
Page 38

Section
User's Manual
3: Open Circuit Potential Models 2450-EC, 2460-EC, and 2461-EC Potentiostats And Galvanostats
Adjust the Measure Settings
When you run the test application, you must define the parameters for the open circuit potential
measurements. These parameters are the Potential range, Sample Count, and the Sample Interval.
To select the Potential Range:
1. Press the MENU key, then select Measure Settings.
2. Select Potential Range.
Figure 48: Measure Settings menu, selecting Potential Range
3. Choose a value. Note that the choices are different depending on your galvanostat.
Figure 49: Selecting the Potential Range
Next, specify the number of Open Circuit Potential measurements to make. This is called the Sample
Count. You can set the Sample Count from 1 to 100,000.
To set the number of samples:
1. From the Measure Settings screen, select Sample Count.
Figure 50: Measure Settings menu, selecting Sample Count
3-4 077110402/November 2016
Page 39

Models 2450
Open Circuit Potential
-EC, 2460-EC, and 2461-EC Potentiostats And Galvanostats User's Manual Section 3:
2. Enter a value.
Now you will specify the sample interval time in seconds per point. The sample interval time is
illustrated in the next figure. You can choose an interval from 0.75 to 100 seconds per point.
Figure 51: Sample Interval time, graphic description
To specify the Sample Interval:
1. From the Measure Settings screen, select Sample Interval (s/pt).
2. Enter a value.
Figure 52: Entering the Measurement Interval
077110402/November 2016 3-5
Page 40

Section
User's Manual
3: Open Circuit Potential Models 2450-EC, 2460-EC, and 2461-EC Potentiostats And Galvanostats
Save or load the test parameter data
You can save your test parameters to the front-panel flash drive at any time. Up to five test parameter
configurations can be stored.
To save the test parameters:
1. From the Menu screen, select Save Settings. Note that your Menu screen options are different
depending on the test you are running.
If you have saved a settings file previously with the same File Selection number, you will be
prompted to overwrite it.
Figure 53: Selecting Save Settings
2. You are notified when the save is complete. Select OK to clear the prompt.
Figure 54: Successful file save
3-6 077110402/November 2016
Page 41

Models 2450
Open Circuit Potential
-EC, 2460-EC, and 2461-EC Potentiostats And Galvanostats User's Manual Section 3:
To load saved test parameters:
Test parameters can only be loaded to the same instrument model on which they were created and
saved. For example, you cannot load test parameter settings created with a 2450-EC to a 2460-EC.
1. From the Menu screen, select Load Settings.
2. Select a file by choosing File Selection and then a file number.
Figure 55: Choosing a file to load
3. Select Load Settings. You are notified when the load completes.
4. Select OK to clear the prompt.
Run the test and view the graph
To start the experiment and view the graph or data:
1. Press the HOME key.
2. Select Start Test. The output turns on and the display automatically shows the potential
measurements plotting in real time, along with a progress bar at the bottom of the screen. The
Start Test control also changes to Stop Test for the duration of the test.
The output turns off when the test completes. The following graphic shows the Home screen after the
test finishes. You can return to this Home screen at any time when the test is running by selecting the
Run / Graph option from the Menu screen.
Figure 56: Open Circuit Potential test results graph
077110402/November 2016 3-7
Page 42

Section
User's Manual
3: Open Circuit Potential Models 2450-EC, 2460-EC, and 2461-EC Potentiostats And Galvanostats
You can use the touchscreen to manipulate the graph or add cursors. See your Interactive
SourceMeter® Instrument Reference Manual for more information.
You can save a screen capture to a flash drive inserted into the USB port of the galvanostat by
simultaneously pressing the HOME key and the ENTER key. The file name has the format
imgmmdd_xxxxxx.png, where mmdd represents the instrument month and day and xxxxxx is a
system-generated number.
To end the test before the run completes, select Stop Test at any time. This stops the test and turns
off the the galvanostat output. You can then select End App to exit the test and return to normal
SMU operation. If there is a long interval between consecutive samples, there may be a long delay
between selecting Stop Test and when the test stops, as the current operation must complete.
Make sure to select Stop Test before selecting End App. Stop Test turns off the instrument's
output.
Hazardous voltages may be present on all output and guard terminals. To prevent electrical
shock that could cause injury or death, never make or break connections to the instrument
while the power is turned on. Turn off the equipment from the front panel or disconnect the
main power cord from the rear of the instrument before handling cables. Putting the
equipment into an output-off state does not guarantee that the outputs are powered off if a
hardware or software fault occurs.
Save the test data to the flash drive
You can save the data generated from the test to the front-panel flash drive. The data is stored in a
.csv file that also includes instrument information and parameter settings.
If there are more than 10,000 measurements stored, the process of saving the data may take several
minutes.
To save the test data to the flash drive:
1. Make sure your flash drive is inserted into the front panel USB port.
2. From the test application home screen, select Save Data.
3. Specify a file name, then select OK.
4. Select OK on the confirmation message.
Figure 57: Test results saved successfully
3-8 077110402/November 2016
Page 43

Models 2450
Open Circuit Potential
-EC, 2460-EC, and 2461-EC Potentiostats And Galvanostats User's Manual Section 3:
View the results saved to the flash drive
To view the test results, open the saved file in a spreadsheet program on a computer. Current,
voltage, time, and general parameters for the test are included in the file.
View the Reading Table or measurement Statistics
When the test completes, you can view the individual data points on the instrument by selecting
Reading Table from the Menu screen.
Figure 58: Viewing the Reading Table
You can also view the measurement statistics. Select Statistics from the Menu screen.
Figure 59: Viewing measurement Statistics
077110402/November 2016 3-9
Page 44

Section
User's Manual
3: Open Circuit Potential Models 2450-EC, 2460-EC, and 2461-EC Potentiostats And Galvanostats
View the Event Log
From the main Menu, you can select Event Log. The event log records events, which can be errors,
warnings, and information reported by your instrument. Through the Event Log menu, you can view
these events. You can also specify which events are shown in the event log, which ones are logged,
and which ones generate popup messages.
Figure 60: Viewing the Event Log
See your Keithley Instruments 2450, 2460, or 2461 Interactive SourceMeter® Instrument Reference
Manual for further details on the Event Log.
End the test application
When you are finished making measurements, select End App to exit the test and return to normal
SMU operation.
Make sure to always select Stop Test before selecting End App. Stop Test turns off the
instrument's output.
3-10 077110402/November 2016
Page 45

Potential Pulse and Square Wave ............................................ 4-1
Potential Pulse & Square Wave
In this section:
Potential Pulse and Square Wave
In the Potential Pulse and Square Wave test, the SMU potentiostat supplies a series of up to 100,000
potential pulses. At the end of each pulse, the SourceMeter measures the resulting current. You can
select both the peak and base levels of the pulses, as well as the period, pulse width, and sample
time.
Various parameters of the pulse wave are displayed in the figure below. Though not pictured, there is
also a brief latency period between the end of the measurement and the end of the pulse to allow the
instrument’s analog-to-digital converter to finish processing the reading.
Section 4
Figure 61: Potential versus Time
To ensure proper instrument operation, the potential difference between the reference electrode
(RE) and counter electrode (CE) terminals and between the working electrode (WE) and working
electrode sense (WES) terminals should not exceed 5 V.
Page 46

Section
ual
4: Potential Pulse & Square Wave Models 2450-, 2460-, & 2461-EC Potentiostats And Galvanostats User's Man
Test application parameters
You must enter test parameters that are consistent with the following values. Otherwise, you may
receive unsettled and inaccurate measurements.
The Potential Pulse and Square Wave test application parameters are listed below:
Model 2450-EC
• Peak potential: -20 V ≤ Epeak ≤ +20 V
• Base potential: -20 V ≤ Ebase ≤ +20 V
• Current measure ranges: 1 μA, 10 μA, 100 μA, 1 mA, 10 mA, 100 mA, 1 A
• Source limit (compliance): 105 % of selected current range
• Pulse period and width:
• Current measure range = 1 μA
• 200 ms ≤ period ≤ 3600 s
• 100 ms ≤ pulse width ≤ (0.99 × period)
• Current measure range > 1 μA
• 4 ms ≤ period ≤ 3600 s
• 2 ms ≤ pulse width ≤ (0.99 × period)
• Sample time:
• Minimum is 166.667 µs
• Maximum is lesser of 166.667 ms and (pulse width - 1 ms)
• Number of cycles: 1 to 100,000
• Program time: (1 × period) ≤ program time ≤ (100,000 × period)
Models 2460-EC and 2461-EC
• Peak potential: -20 V ≤ Epeak ≤ +20 V
• Base potential: -20 V ≤ Ebase ≤ +20 V
• Current measure ranges: 1 μA, 10 μA, 100 μA, 1 mA, 10 mA, 100 mA, 1 A, 4 A, 5 A, 7 A
• Source limit (compliance): 105 % of selected current range
• Pulse period and width:
• Current measure range ≤ 100 μA
• 80 ms ≤ period ≤ 3600 s
• 40 ms ≤ pulse width ≤ (0.99 × period)
• Current measure range > 100 μA
• 10 ms ≤ period ≤ 3600 s
• 5 ms ≤ pulse width ≤ (0.99 × period)
• Sample time:
• Minimum is 166.667 µs
• Maximum is lesser of 166.667 ms and (pulse width - 1 ms)
• Number of cycles: 1 to 100,000
• Program time: (1 × period) ≤ program time ≤ (100,000 × period)
4-2 077110402/November 2016
Page 47

Models 2450
Potential Pulse & Square Wave
-, 2460-, & 2461-EC Potentiostats And Galvanostats User's Manual Section 4:
Run the Potential Pulse and Square Wave test application
To run the test application:
1. Press the HOME key.
2. Select the active script indicator at the top of your home screen. If there is no script activity, the
indicator displays "No Script."
Figure 62: Active script indicator
3. Select the preloaded Potential Pulse and Square Wave test script (potentiostats and galvanostats
only) or connect the supplied USB drive to your SMU instrument to locate the included Potential
Pulse and Square Wave test. If you connect the USB drive, scripts on the drive are displayed with
usb1/ before the script file name.
Figure 63: Selecting the Potential Pulse and Square Wave test application
4. Select PotentialPulseAndSquareWave. The test application begins to run immediately and
the Potential Pulse and Square Wave Home screen is displayed.
Figure 64: Potential Pulse and Square Wave test home screen
077110402/November 2016 4-3
Page 48

Section
User's Manual
Select this control to immediately stop the test and return to normal SMU
operation.
useful for constraining all of the data to the screen's viewing size.
Select this control to immediately begin the test. This option becomes Stop
Test when the test runs.
option is only visible after the test runs.
Vertical, Horizontal, and Both.
4: Potential Pulse & Square Wave Models 2450-, 2460-, & 2461-EC Potentiostats And Galvanostats
The test home screen controls include:
End App
Autoscale
Select this control to define the graph based upon the plotted data. This is
Start Test
Save Data
Cursor
Select this control to save the test data to a .csv file on a flash drive. This
Select this control to cycle through the available cursor placements: None,
Review the Menu controls
You have different options in the Menu screen, depending on the application. The following graphic
shows the Potential Pulse and Square Wave main Menu. You will learn the function for each option
later in this section.
Figure 65: Potential Pulse and Square wave main Menu
Configure the Pulse Settings
Select Pulse Settings from the main menu to adjust the Base Potential, Peak Potential, Current
measure Range, Pulse Period, Pulse Width, and Sample Time.
To adjust the Pulse Settings:
1. Press the MENU key, then select Pulse Settings.
Figure 66: Pulse Settings menu
4-4 077110402/November 2016
Page 49

Models 2450
Potential Pulse & Square Wave
-, 2460-, & 2461-EC Potentiostats And Galvanostats User's Manual Section 4:
To adjust the Base Potential:
1. From the Pulse Settings screen, select Base Potential.
2. Enter a value.
Figure 67: Entering a Base Potential
3. Select OK.
Next, you will adjust the Peak Potential. This setting allows you to adjust the maximum potential that
the instrument will attempt to force, given that the generated current is within the programmed current
limit.
To adjust the Peak Potential:
1. From the Pulse Settings screen, select Peak Potential.
2. Enter a value.
3. Select OK.
Figure 68: Entering the Peak Potential
077110402/November 2016 4-5
Page 50

Section
User's Manual
4: Potential Pulse & Square Wave Models 2450-, 2460-, & 2461-EC Potentiostats And Galvanostats
To set the Current Range:
1. Select Current Range.
2. Choose a value. Note that the choices are different depending on your potentiostat.
Figure 69: Selecting the Current measure Range
The current measure range constrains the maximum current that will flow through the device under
test (DUT). Make sure to choose a range higher than your expected maximum current. Setting the
current range also sets a current limit, which can be used to stop the test or otherwise protect your
DUT. Your potentiostat will limit the current to 105 percent of the selected range.
Now you will adjust the Period. This setting lets you specify the duration of one cycle of the pulse
wave. The Period and Pulse Width settings are related. You cannot set the Pulse Width to a value
more than 99 percent of the Period. Adjusting the Period may also change the Pulse Width setting
automatically.
To adjust the Period:
1. From the Pulse Settings screen, select Period.
2. Enter a value.
Figure 70: Entering the pulse Period
3. Select OK.
4-6 077110402/November 2016
Page 51

Models 2450
Potential Pulse & Square Wave
-, 2460-, & 2461-EC Potentiostats And Galvanostats User's Manual Section 4:
To adjust the Pulse Width:
1. From the Pulse Settings screen, select Pulse Width.
2. Enter a value. The Pulse Width can be no more than 99 percent of the Period setting.
Figure 71: Entering the Pulse Width
3. Select OK.
The Sample Time is the length of time over which the actual measurement is taken. The Sample
Time cannot exceed the Pulse Width minus 1 ms (PW - 1 ms).
The measurement is taken at the end of the pulse. A brief latency period between the end of the
measurement and the end of the pulse allows the analog-to-digital converter in your potentiostat to
complete the measurement.
To adjust the Sample Time:
1. From the Pulse Settings screen, select Sample Time.
2. Enter a value.
Figure 72: Entering a Sample Time
3. Select OK.
077110402/November 2016 4-7
Page 52

Section
User's Manual
4: Potential Pulse & Square Wave Models 2450-, 2460-, & 2461-EC Potentiostats And Galvanostats
Adjust the End Conditions
The End Conditions menu lets you choose the conditions that stop the pulse wave. You can enable or
disable each condition. See the next graphic.
Figure 73: End Conditions menu enable or disable option
If you enable the Number of Cycles, the Program Time is disabled. Conversely, if you enable the
Program Time, the Number of Cycles condition is disabled. The Source Limit setting is independent
of the other two settings.
Use the Number of Cycles end condition to stop generating the waveform after the specified number
of cycles.
To configure the Number of Cycles end condition:
1. Press the MENU key, then select End Conditions.
Figure 74: End Conditions menu
2. Select the Number of Cycles Enabled control.
3. Select On.
4. Select the Number of Cycles Value control
5. Enter a value, then select OK.
4-8 077110402/November 2016
Page 53

Models 2450
Potential Pulse & Square Wave
-, 2460-, & 2461-EC Potentiostats And Galvanostats User's Manual Section 4:
Use the Program Time end condition to stop generating the waveform after a specified time interval.
The pulse wave stops at the nearest half-cycle after the time interval elapses.
To configure the Program Time end condition:
1. Press the MENU key, then select End Conditions.
2. Select the Program Time Enabled control.
3. Select On.
4. Select the Program Time Value control.
5. Enter a value, then select OK.
Use the Source Limit end condition to stop generating the waveform if the current level reaches the
programmed source, or compliance, limit. The source limit is set to 105 percent of the selected
current measure range.
To enable the Source Limit end condition:
1. Press the MENU key, then select End Conditions.
2. Select the Source Limit Enabled control.
3. Select On.
Save or load the test parameter data
You can save your test parameters to the front-panel flash drive at any time. Up to five test parameter
configurations can be stored.
To save the test parameters:
1. From the Menu screen, select Save Settings. Note that your Menu screen options are different
depending on the test you are running.
If you have saved a settings file previously with the same File Selection number, you will be
prompted to overwrite it.
Figure 75: Selecting Save Settings
077110402/November 2016 4-9
Page 54

Section
User's Manual
4: Potential Pulse & Square Wave Models 2450-, 2460-, & 2461-EC Potentiostats And Galvanostats
2. You are notified when the save is complete. Select OK to clear the prompt.
Figure 76: Successful file save
To load saved test parameters:
Test parameters can only be loaded to the same instrument model on which they were created and
saved. For example, you cannot load test parameter settings created with a 2450-EC to a 2460-EC.
1. From the Menu screen, select Load Settings.
2. Select a file by choosing File Selection and then a file number.
Figure 77: Choosing a file to load
3. Select Load Settings. You are notified when the load completes.
4. Select OK to clear the prompt.
4-10 077110402/November 2016
Page 55

Models 2450
Potential Pulse & Square Wave
-, 2460-, & 2461-EC Potentiostats And Galvanostats User's Manual Section 4:
Run the test and view the graph
To run the test and view the graph:
1. Press the HOME key.
2. Select Start Test. The output turns on and the display automatically shows the current
measurements plotting in real time, along with a progress bar at the bottom of the screen. The
Start Test control also changes to Stop Test for the duration of the test.
The output turns off when the test completes. The following graphic shows the test Home screen after
the test finishes. You can return to this Home screen at any time when the test is running by selecting
the Run / Graph option from the Menu screen.
Figure 78: Potential Pulse and Square Wave test results graph
You can use the touchscreen to manipulate the graph or add cursors. See your Interactive
SourceMeter® Instrument Reference Manual for more information.
You can save a screen capture to a flash drive inserted into the USB port of the potentiostat by
simultaneously pressing the HOME key and the ENTER key. The file name has the format
imgmmdd_xxxxxx.png, where mmdd represents the instrument month and day and xxxxxx is a
system-generated number.
To end the test before the run completes, select Stop Test at any time. This stops the test and turns
off the the potentiostat output. You can then select End App to exit the test and return to normal
SMU operation. If there is a long interval between consecutive samples, there may be a long delay
between selecting Stop Test and when the test stops, as the current operation must complete.
Make sure to select Stop Test before selecting End App. Stop Test turns off the instrument's
output.
Hazardous voltages may be present on all output and guard terminals. To prevent electrical
shock that could cause injury or death, never make or break connections to the instrument
while the power is turned on. Turn off the equipment from the front panel or disconnect the
main power cord from the rear of the instrument before handling cables. Putting the
equipment into an output-off state does not guarantee that the outputs are powered off if a
hardware or software fault occurs.
077110402/November 2016 4-11
Page 56

Section
User's Manual
4: Potential Pulse & Square Wave Models 2450-, 2460-, & 2461-EC Potentiostats And Galvanostats
Save the test data to the flash drive
You can save the data generated from the test to the front-panel flash drive. The data is stored in a
.csv file that also includes instrument information and parameter settings.
If there are more than 10,000 measurements stored, the process of saving the data may take several
minutes.
To save the test data to the flash drive:
1. Make sure your flash drive is inserted into the front panel USB port.
2. From the test application home screen, select Save Data.
3. Specify a file name, then select OK.
4. Select OK on the confirmation message.
Figure 79: Test results saved successfully
View the results saved to the flash drive
To view the test results, open the saved file in a spreadsheet program on a computer. Current,
voltage, time, and general parameters for the test are included in the file.
View the Reading Table or measurement Statistics
When the test completes, you can view the individual data points on the instrument by selecting
Reading Table from the Menu screen.
Figure 80: Viewing the Reading Table
4-12 077110402/November 2016
Page 57

Models 2450
Potential Pulse & Square Wave
-, 2460-, & 2461-EC Potentiostats And Galvanostats User's Manual Section 4:
You can also view the measurement statistics. Select Statistics from the Menu screen.
Figure 81: Viewing measurement Statistics
View the Event Log
From the main Menu, you can select Event Log. The event log records events, which can be errors,
warnings, and information reported by your instrument. Through the Event Log menu, you can view
these events. You can also specify which events are shown in the event log, which ones are logged,
and which ones generate popup messages.
Figure 82: Viewing the Event Log
See your Keithley Instruments 2450, 2460, or 2461 Interactive SourceMeter® Instrument Reference
Manual for further details on the Event Log.
077110402/November 2016 4-13
End the test application
When you are finished making measurements, select End App to exit the test and return to normal
SMU operation.
Make sure to always select Stop Test before selecting End App. Stop Test turns off the
instrument's output.
Page 58

Current Pulse and Square Wave .............................................. 5-1
Current Pulse and Square Wave
In this section:
Current Pulse and Square Wave
In the Current Pulse and Square Wave test, the SMU galvanostat supplies a series of up to 100,000
current pulses. At the end of each pulse, the SourceMeter measures the resulting potential. You can
select both the peak and base levels of the pulses, as well as the period, pulse width, and sample
time.
Various parameters of the pulse wave are displayed in the figure below. Though not pictured, there is
also a brief latency period between the end of the measurement and the end of the pulse to allow the
instrument’s analog-to-digital converter to finish processing the reading.
Section 5
Figure 83: Current versus Time
To ensure proper instrument operation, the potential difference between the reference electrode
(RE) and counter electrode (CE) terminals and between the working electrode (WE) and working
electrode sense (WES) terminals should not exceed 5 V.
Page 59

Section
User's Manual
5: Current Pulse and Square Wave Models 2450-, 2460-, & 2461-EC Potentiostats And Galvanostats
Test application parameters
You must enter test parameters that are consistent with the following values. Otherwise, you may
receive unsettled and inaccurate measurements.
The Current Pulse and Square Wave test application parameters are listed below:
Model 2450-EC
• Peak current: -1.05 A ≤ Ipeak ≤ +1.05 A
• Base current: -1.05 A ≤ Ibase ≤ +1.05 A
• Potential measure ranges: 20 mV, 200 mV, 2 V, 20 V
• Source limit (compliance): 105 % of selected potential range
• Pulse period and width:
• | Ipeak | and | Ibase | ≤ 1.05 μA
• 200 ms ≤ period ≤ 3600 s
• 100 ms ≤ pulse width ≤ (0.99 × period)
• | Ipeak | or | Ibase | > 1.05 μA
• 4 ms ≤ period ≤ 3600 s
• 2 ms ≤ pulse width ≤ (0.99 × period)
• Sample time:
• Minimum is 166.667 µs
• Maximum is lesser of 166.667 ms and (pulse width - 1 ms)
• Number of cycles: 1 to 100,000
• Program time: (1 × period) ≤ program time ≤ (100,000 × period)
Models 2460-EC and 2461-EC
• Peak current: -7.35 A ≤ Ipeak ≤ +7.35 A
• Base current: -7.35 A ≤ Ibase ≤ +7.35 A
• Potential measure ranges: 200 mV, 2 V, 7 V, 10 V, 20 V
• Source limit (compliance): 105 % of selected potential range
• Pulse period and width:
• | Ipeak | and | Ibase | ≤ 105 μA
• 80 ms ≤ period ≤ 3600 s
• 40 ms ≤ pulse width ≤ (0.99 × period)
• | Ipeak | or | Ibase | > 105 μA
• 10 ms ≤ period ≤ 3600 s
• 5 ms ≤ pulse width ≤ (0.99 × period)
• Sample time:
• Minimum is 166.667 µs
• Maximum is lesser of 166.667 ms and (pulse width - 1 ms)
• Number of cycles: 1 to 100,000
• Program time: (1 × period) ≤ program time ≤ (100,000 × period)
5-2 077110402/November 2016
Page 60

Models 2450
Current Pulse and Square Wave
-, 2460-, & 2461-EC Potentiostats And Galvanostats User's Manual Section 5:
Run the Current Pulse and Square Wave test application
To run the test application:
1. Press the HOME key.
2. Select the active script indicator at the top of your home screen. If there is no script activity, the
indicator displays "No Script."
Figure 84: Active script indicator
3. Select the preloaded Current Pulse and Square Wave test script (potentiostats and galvanostats
only) or connect the supplied USB drive to your SMU instrument to locate the included Current
Pulse and Square Wave test. If you connect the USB drive, scripts on the drive are displayed with
usb1/ before the script file name.
Figure 85: Selecting the Current Pulse and Square Wave test application
4. Select CurrentPulseAndSquareWave. The test application begins to run immediately and the
Current Pulse and Square Wave Home screen is displayed.
Figure 86: Current Pulse and Square Wave test Home screen
077110402/November 2016 5-3
Page 61

Section
User's Manual
Select this control to immediately stop the test and return to normal SMU
operation.
useful for constraining all of the data to the screen's viewing size.
Select this control to immediately begin the test. This option becomes Stop
Test when the test runs.
option is only visible after the test runs.
Vertical, Horizontal, and Both.
5: Current Pulse and Square Wave Models 2450-, 2460-, & 2461-EC Potentiostats And Galvanostats
The test home screen controls include:
End App
Autoscale
Select this control to define the graph based upon the plotted data. This is
Start Test
Save Data
Cursor
Select this control to save the test data to a .csv file on a flash drive. This
Select this control to cycle through the available cursor placements: None,
Review the Menu controls
You have different options in the Menu screen, depending on the application. The following graphic
shows the Current Pulse and Square Wave main Menu. You will learn the function for each option
later in this section.
Figure 87: Current Pulse and Square Wave main Menu
Configure the Pulse Settings
You can select Pulse Settings from the main Menu to adjust the Base Current, Peak Current,
Potential Range, Period, Pulse Width, and Sample time.
To adjust the Pulse Settings:
1. Press the MENU key, then select Pulse Settings.
Figure 88: Pulse Settings menu
5-4 077110402/November 2016
Page 62

Models 2450
Current Pulse and Square Wave
-, 2460-, & 2461-EC Potentiostats And Galvanostats User's Manual Section 5:
To adjust the Base Current:
1. From the Pulse Settings screen, select Base Current.
2. Enter a value.
Figure 89: Entering the Base Current
3. Select OK.
To adjust the Peak Current:
1. From the Pulse Settings screen, select Peak Current.
2. Enter a value.
Figure 90: Entering the Peak Current
3. Select OK.
To set the Potential Range:
1. From the Pulse Settings screen, select Potential Range.
2. Choose a value. Note that the choices are different depending on your galvanostat.
Figure 91: Selecting a Potential measure Range
077110402/November 2016 5-5
Page 63

Section
User's Manual
5: Current Pulse and Square Wave Models 2450-, 2460-, & 2461-EC Potentiostats And Galvanostats
The potential range constrains the potential that can develop across the device under test (DUT).
Make sure to choose a range higher than your expected maximum potential. Setting the potential
range also sets a potential limit, which can be used to stop the test or otherwise protect your DUT.
Your galvanostat will limit the potential to 105 percent of the selected range.
Now you will adjust the Period. This setting lets you specify the duration of one cycle of the pulse
wave. The Period and Pulse Width settings are related. You cannot set the Pulse Width to a value
more than 99 percent of the Period. Adjusting the Period may also change the Pulse Width setting
automatically.
To adjust the Period:
1. From the Pulse Settings screen, select Period.
2. Enter a value.
Figure 92: Entering the pulse Period
3. Select OK.
To adjust the Pulse Width:
1. From the Pulse Settings screen, select Pulse Width.
2. Enter a value. The Pulse Width can be no more than 99 percent of the Period setting.
Figure 93: Selecting the pulse Width
3. Select OK.
5-6 077110402/November 2016
Page 64

Models 2450
Current Pulse and Square Wave
-, 2460-, & 2461-EC Potentiostats And Galvanostats User's Manual Section 5:
The Sample Time is the length of time over which the actual measurement is taken. The sample time
cannot exceed the Pulse Width minus 1 ms (PW - 1 ms).
The measurement is taken at the end of the pulse. A brief latency period between the end of the
measurement and the end of the pulse allows the analog-to-digital converter in your galvanostat to
complete the measurement.
To adjust the Sample Time:
1. From the Pulse Settings screen, select Sample Time.
2. Enter a value.
3. Select OK.
Adjust the End Conditions
The End Conditions menu lets you choose the conditions that stop the pulse wave. You can enable or
disable each condition. See the next graphic.
Figure 94: End Conditions menu enable or disable option
077110402/November 2016 5-7
Page 65

Section
User's Manual
5: Current Pulse and Square Wave Models 2450-, 2460-, & 2461-EC Potentiostats And Galvanostats
If you enable the Number of Cycles, the Program Time is disabled, Conversely, if you enable the
Program Time, the Number of Cycles condition is disabled. The Source Limit setting is independent
of the other two settings.
Use the Number of Cycles end condition to stop generating the waveform after the specified number
of cycles.
To adjust the Number of Cycles end condition:
1. Press the MENU key, then select End Conditions.
Figure 95: End Conditions menu
2. Select the Number of Cycles Enabled control
3. Select On.
4. Select the Number of Cycles Value control.
5. Enter a value, then select OK.
Use the Program Time end condition to stop generating the waveform after a specified time interval.
The pulse wave stops at the nearest half-cycle after the time interval elapses.
To configure the Program Time end condition:
1. Press the MENU key, then select End Conditions.
2. Select the Program Time Enabled control.
3. Select On.
4. Select the Program Time Value control.
5. Enter a value, then select OK.
Use the Source Limit end condition to stop generating the waveform if the potential level reaches the
programmed source, or compliance, limit. The source limit is set to 105 percent of the selected
potential measure range.
To enable the Source Limit end condition:
1. Press the MENU key, then select End Conditions.
2. Select the Source Limit Enabled control.
3. Select On.
5-8 077110402/November 2016
Page 66

Models 2450
Current Pulse and Square Wave
-, 2460-, & 2461-EC Potentiostats And Galvanostats User's Manual Section 5:
Save or load the test parameter data
You can save your test parameters to the front-panel flash drive at any time. Up to five test parameter
configurations can be stored.
To save the test parameters:
1. From the Menu screen, select Save Settings. Note that your Menu screen options are different
depending on the test you are running.
If you have saved a settings file previously with the same File Selection number, you will be
prompted to overwrite it.
Figure 96: Selecting Save Settings
2. You are notified when the save is complete. Select OK to clear the prompt.
Figure 97: Successful file save
077110402/November 2016 5-9
Page 67

Section
User's Manual
5: Current Pulse and Square Wave Models 2450-, 2460-, & 2461-EC Potentiostats And Galvanostats
To load saved test parameters:
Test parameters can only be loaded to the same instrument model on which they were created and
saved. For example, you cannot load test parameter settings created with a 2450-EC to a 2460-EC.
1. From the Menu screen, select Load Settings.
2. Choose a file by selecting File Selection and then a file number.
Figure 98: Choosing a file to load
3. Select Load Settings. You will be notified when the load completes.
4. Select OK to clear the prompt.
Run the test and view the graph
To run the test and view the graph:
1. Press the HOME key.
2. Select Start Test. The output turns on and the display automatically shows the current
measurements plotting in real time, along with a progress bar at the bottom of the screen. The
Start Test control also changes to Stop Test for the duration of the test.
The output turns off when the test completes. The following graphic shows the test Home screen after
the test finishes. You can return to this Home screen at any time when the test is running by selecting
the Run / Graph option from the Menu screen.
Figure 99: Current Pulse and Square Wave test results graph
5-10 077110402/November 2016
Page 68

Models 2450
Current Pulse and Square Wave
-, 2460-, & 2461-EC Potentiostats And Galvanostats User's Manual Section 5:
You can use the touchscreen to manipulate the graph or add cursors. See your Interactive
SourceMeter® Instrument Reference Manual for more information.
You can save a screen capture to a flash drive inserted into the USB port of the galvanostat by
simultaneously pressing the HOME key and the ENTER key. The file name has the format
imgmmdd_xxxxxx.png, where mmdd represents the instrument month and day and xxxxxx is a
system-generated number.
To end the test before the run completes, select Stop Test at any time. This stops the test and turns
off the the galvanostat output. You can then select End App to exit the test and return to normal
SMU operation. If there is a long interval between consecutive samples, there may be a long delay
between selecting Stop Test and when the test stops, as the current operation must complete.
Make sure to select Stop Test before selecting End App. Stop Test turns off the instrument's
output.
Hazardous voltages may be present on all output and guard terminals. To prevent electrical
shock that could cause injury or death, never make or break connections to the instrument
while the power is turned on. Turn off the equipment from the front panel or disconnect the
main power cord from the rear of the instrument before handling cables. Putting the
equipment into an output-off state does not guarantee that the outputs are powered off if a
hardware or software fault occurs.
Save the test data to the flash drive
You can save the data generated from the test to the front-panel flash drive. The data is stored in a
.csv file that also includes instrument information and parameter settings.
If there are more than 10,000 measurements stored, the process of saving the data may take several
minutes.
To save the test data to the flash drive:
1. Make sure your flash drive is inserted into the front panel USB port.
2. From the test application home screen, select Save Data.
3. Specify a file name, then select OK.
4. Select OK on the confirmation message.
Figure 100: Test results saved successfully
077110402/November 2016 5-11
Page 69

Section
User's Manual
5: Current Pulse and Square Wave Models 2450-, 2460-, & 2461-EC Potentiostats And Galvanostats
View the results saved to the flash drive
To view the test results, open the saved file in a spreadsheet program on a computer. Current,
voltage, time, and general parameters for the test are included in the file.
View the Reading Table or measurement Statistics
When the test completes, you can view the individual data points on the instrument by selecting
Reading Table from the Menu screen.
Figure 101: Viewing the Reading Table
You can also view the measurement statistics. Select Statistics from the Menu screen.
Figure 102: Viewing measurement Statistics
5-12 077110402/November 2016
Page 70

Models 2450
Current Pulse and Square Wave
-, 2460-, & 2461-EC Potentiostats And Galvanostats User's Manual Section 5:
View the Event Log
From the main Menu, you can select Event Log. The event log records events, which can be errors,
warnings, and information reported by your instrument. Through the Event Log menu, you can view
these events. You can also specify which events are shown in the event log, which ones are logged,
and which ones generate popup messages.
Figure 103: Viewing the Event Log
See your Keithley Instruments 2450, 2460, or 2461 Interactive SourceMeter® Instrument Reference
Manual for further details on the Event Log.
End the test application
When you are finished making measurements, select End App to exit the test and return to normal
SMU operation.
Make sure to always select Stop Test before selecting End App. Stop Test turns off the
instrument's output.
077110402/November 2016 5-13
Page 71

Chronoamperometry ................................................................ 6-1
In this section:
Chronoamperometry
In the Chronoamperometry test, your SMU potentiostat steps the potential to a user-defined value
where it is held constant for a specified period. As this potential is held, the instrument measures the
resulting current at user-defined time intervals. The SMU potentiostat can repeat this process for up
to ten defined steps.
Key timing parameters are shown in the figure below. Note that there is always a measurement at the
beginning of each step.
Section 6
Chronoamperometry
Figure 104: Example double-step Chronoamperometry (DSCA) plot
To ensure proper instrument operation, the potential difference between the reference electrode
(RE) and counter electrode (CE) terminals and between the working electrode (WE) and working
electrode sense (WES) terminals should not exceed 5 V.
Page 72

Section
User's Manual
6: Chronoamperometry Models 2450-EC, 2460-EC, and 2461-EC Potentiostats And Galvanostats
Test application parameters
You must enter test parameters that are consistent with the following values. Otherwise, you may
receive unsettled and inaccurate measurements.
The Chronoamperometry test application parameters are listed below:
Model 2450-EC
• Step potential: -20 V ≤ Estep ≤ +20 V
• Current measure ranges: 10 nA, 100 nA, 1 μA, 10 μA, 100 μA, 1 mA, 10 mA, 100 mA, 1 A
• Source limit (compliance): 100 % of selected current range
• Number of steps: 1 to 10
• Step duration: 10 ms ≤ step duration ≤ 99,999 s
• Sample interval: 10 ms ≤ sample interval ≤ 100 s
• Sample time:
• Minimum is 166.667 µs
• Maximum is lesser of 166.667 ms and (sample interval - 5 ms) and (step duration - 5 ms)
• Maximum number of samples: 100,000 total for all steps
Models 2460-EC and 2461-EC
• Step potential: -20 V ≤ Estep ≤ +20 V
• Current measure ranges: 1 μA, 10 μA, 100 μA, 1 mA, 10 mA, 100 mA, 1 A, 4 A, 5 A, 7 A
• Source limit (compliance): 100 % of selected current range
• Number of steps: 1 to 10
• Step duration: 10 ms ≤ step duration ≤ 99,999 s
• Sample interval: 10 ms ≤ sample interval ≤ 100 s
• Sample time:
• Minimum is 166.667 µs
• Maximum is lesser of 166.667 ms and (sample interval - 5 ms) and (step duration - 5 ms)
• Maximum number of samples: 100,000 total for all steps
Run the Chronoamperometry test application
To run the test application:
1. Press the HOME key.
2. Select the active script indicator at the top of your home screen. If there is no script activity, the
indicator displays "No Script."
Figure 105: Active script indicator
6-2 077110402/November 2016
Page 73

Models 2450
Chronoamperometry
operation.
Select this control to define the graph based upon the plotted data. This is
useful for constraining all of the data to the screen's viewing size.
Select this control to immediately begin the test. This option becomes Stop
Test when the test runs.
Select this control to save the test data to a .csv file on a flash drive. This
option is only visible after the test runs.
Select this control to cycle through the available cursor placements: None,
Vertical, Horizontal, and Both.
-EC, 2460-EC, and 2461-EC Potentiostats And Galvanostats User's Manual Section 6:
3. Select the preloaded Chronoamperometry test script (potentiostats and galvanostats only) or
connect the supplied USB drive to your SMU instrument to locate the included
Chronoamperometry test. If you connect the USB drive, scripts on the drive are displayed with
usb1/ before the script file name.
Figure 106: Selecting the Chronoamperometry test application
4. Select Chronoamperometry. The test application begins to run immediately and the following
screen is displayed.
Figure 107: Chronoamperometry test home screen
The test home screen controls include:
End App
Autoscale
Start Test
Save Data
Cursor
Select this control to immediately stop the test and return to normal SMU
077110402/November 2016 6-3
Page 74

Section
User's Manual
6: Chronoamperometry Models 2450-EC, 2460-EC, and 2461-EC Potentiostats And Galvanostats
Review the Menu controls
You have different options in the Menu screen, depending on the application. The following graphic
shows the Chronoamperometry main Menu. You will learn the function for each option later in this
section.
Figure 108: Chronoamperometry main Menu
Configure the Step and Measure Settings
Select Step Settings to specify the number, level, and duration of potential steps to be sequentially
executed.
Figure 109: Step Settings menu
6-4 077110402/November 2016
Page 75

Models 2450
Chronoamperometry
-EC, 2460-EC, and 2461-EC Potentiostats And Galvanostats User's Manual Section 6:
The Chronoamperometry test application allows you to add up to ten steps, though such multi-step
procedures are not common. The most common protocols for Chronoamperometry tests use a single
step.
To define the Number of Steps:
1. Press the MENU key, then select Step Settings.
2. Select Number of Steps.
3. Enter a value, then select OK. The next figure shows three steps defined.
Figure 110: Step Settings menu
Next, you must define the Potential and Duration for each step.
To define the Potential and Duration:
1. From the Step Settings menu, select a step Potential.
2. Enter a step Potential value, then select OK.
3. Select a step Duration.
4. Enter a step Duration value, then select OK.
Now, you will define the measurement setting parameters of Current Range, Sample Time, and
Sample Interval.
Figure 111: Measure Settings menu
077110402/November 2016 6-5
Page 76

Section
User's Manual
6: Chronoamperometry Models 2450-EC, 2460-EC, and 2461-EC Potentiostats And Galvanostats
To select the Current Range:
1. From the Measure Settings window, select Current Range.
2. Choose a range greater than the highest current you expect to measure.
The available current ranges for the 2450-EC and 2460-EC / 2461-EC are shown in the next figure.
Figure 112: Selecting the Current Range
Your instrument will integrate and average the current over the Sample Time duration. Longer sample
times will reduce the effect of noise on the measurement.
The Current measure Range constrains the currents that will flow through the device under test
(DUT). Make sure to choose a range higher than your expected maximum current. Setting the
current range also sets a current limit, which can be used to stop the test or otherwise protect your
DUT. Your potentiostat will limit the current to 105 percent of the selected range.
Now, you will specify the timing of consecutive measurements. This value is the time from the start of
one measurement to the beginning of the next measurement during a particular potential step. The
sample interval and sample time settings are related. The sample time can be no more than the
sample interval minus 5 ms (SI - 5 ms). Adjusting the sample interval may also change the sample
time setting automatically.
To specify the Sample Interval:
1. From the Measure Settings window, select Sample Interval.
2. Enter a value, then select OK.
Figure 113: Entering the Sample Interval
6-6 077110402/November 2016
Page 77

Models 2450
Chronoamperometry
-EC, 2460-EC, and 2461-EC Potentiostats And Galvanostats User's Manual Section 6:
To select the Sample Time:
1. From the Measure Settings window, select Sample Time.
2. Enter a value, then select OK.
Figure 114: Entering the Sample Time
Save or load the test parameter data
You can save your test parameters to the front-panel flash drive at any time. Up to five test parameter
configurations can be stored.
To save the test parameters:
1. From the Menu screen, select Save Settings. Note that your Menu screen options are different
depending on the test you are running.
If you have saved a settings file previously with the same File Selection number, you will be
prompted to overwrite it.
Figure 115: Selecting Save Settings
077110402/November 2016 6-7
Page 78

Section
User's Manual
6: Chronoamperometry Models 2450-EC, 2460-EC, and 2461-EC Potentiostats And Galvanostats
2. You are notified when the save is complete. Select OK to clear the prompt.
Figure 116: Successful file save
To load saved test parameters:
Test parameters can only be loaded to the same instrument model on which they were created and
saved. For example, you cannot load test parameter settings created with a 2450-EC to a 2460-EC.
1. From the Menu screen, select Load Settings.
2. Select a file by choosing File Selection and then a file number.
Figure 117: Choosing a file to load
3. Select Load Settings. You are notified when the load completes.
4. Select OK to clear the prompt.
6-8 077110402/November 2016
Page 79

Models 2450
etry
-EC, 2460-EC, and 2461-EC Potentiostats And Galvanostats User's Manual Section 6: Chronoamperom
Run the test and view the graph
To start the experiment and view the graph:
1. Press the HOME key.
2. Select Start Test. The output turns on and the display automatically shows the current
measurements plotting in real time, along with a progress bar at the bottom of the screen. The
Start Test control also changes to Stop Test for the duration of the test.
The output turns off when the test completes. The following graphic shows the Home screen after the
test finishes. You can return to this Home screen at any time when the test is running by selecting the
Run / Graph option from the Menu screen.
Figure 118: Chronoamperometry test results graph
You can use the touchscreen to manipulate the graph or add cursors. See your Interactive
SourceMeter® Instrument Reference Manual for more information.
You can save a screen capture to a flash drive inserted into the USB port of the potentiostat by
simultaneously pressing the HOME key and the ENTER key. The file name has the format
imgmmdd_xxxxxx.png, where mmdd represents the instrument month and day and xxxxxx is a
system-generated number.
To end the test before the run completes, select Stop Test at any time. This stops the test and turns
off the the potentiostat output. You can then select End App to exit the test and return to normal
SMU operation. If there is a long interval between consecutive samples, there may be a long delay
between selecting Stop Test and when the test stops, as the current operation must complete.
Make sure to select Stop Test before selecting End App. Stop Test turns off the instrument's
output.
Hazardous voltages may be present on all output and guard terminals. To prevent electrical
shock that could cause injury or death, never make or break connections to the instrument
while the power is turned on. Turn off the equipment from the front panel or disconnect the
main power cord from the rear of the instrument before handling cables. Putting the
equipment into an output-off state does not guarantee that the outputs are powered off if a
hardware or software fault occurs.
077110402/November 2016 6-9
Page 80

Section
User's Manual
6: Chronoamperometry Models 2450-EC, 2460-EC, and 2461-EC Potentiostats And Galvanostats
Save the test data to the flash drive
You can save the data generated from the test to the front-panel flash drive. The data is stored in a
.csv file that also includes instrument information and parameter settings.
If there are more than 10,000 measurements stored, the process of saving the data may take several
minutes.
To save the test data to the flash drive:
1. Make sure your flash drive is inserted into the front panel USB port.
2. From the test application home screen, select Save Data.
3. Specify a file name, then select OK.
4. Select OK on the confirmation message.
Figure 119: Test results saved successfully
View the results saved to the flash drive
To view the test results, open the saved file in a spreadsheet program on a computer. Current,
voltage, time, and general parameters for the test are included in the file.
View the Reading Table or measurement Statistics
When the test completes, you can view the individual data points on the instrument by selecting
Reading Table from the Menu screen.
Figure 120: Viewing the Reading Table
6-10 077110402/November 2016
Page 81

Models 2450
Chronoamperometry
-EC, 2460-EC, and 2461-EC Potentiostats And Galvanostats User's Manual Section 6:
You can also view the measurement statistics. Select Statistics from the Menu screen.
Figure 121: Viewing measurement Statistics
View the Event Log
From the main Menu, you can select Event Log. The event log records events, which can be errors,
warnings, and information reported by your instrument. Through the Event Log menu, you can view
these events. You can also specify which events are shown in the event log, which ones are logged,
and which ones generate popup messages.
Figure 122: Viewing the Event Log
See your Keithley Instruments 2450, 2460, or 2461 Interactive SourceMeter® Instrument Reference
Manual for further details on the Event Log.
077110402/November 2016 6-11
End the test application
When you are finished making measurements, select End App to exit the test and return to normal
SMU operation.
Make sure to always select Stop Test before selecting End App. Stop Test turns off the
instrument's output.
Page 82

Chronopotentiometry ................................................................ 7-1
In this section:
Chronopotentiometry
In the Chronopotentiometry test, your SMU steps the supplied current to a user-defined value where it
is held constant for a specified period. As this current is held, the instrument measures the resulting
potential at user-defined time intervals. The SMU galvanostat can repeat this process for up to ten
defined steps.
Key timing parameters are displayed in the figure below. Note that there is always a measurement at
the beginning of each step.
Section 7
Chronopotentiometry
Figure 123: Possible double-step Chronopotentiometry (DSCP) plot
To ensure proper instrument operation, the potential difference between the reference electrode
(RE) and counter electrode (CE) terminals and between the working electrode (WE) and working
electrode sense (WES) terminals should not exceed 5 V.
Page 83

Section
User's Manual
7: Chronopotentiometry Models 2450-EC, 2460-EC, and 2461-EC Potentiostats And Galvanostats
Test application parameters
You must enter test parameters that are consistent with the following values. Otherwise, you may
receive unsettled and inaccurate measurements.
The Chronopotentiometry test application parameters are listed below:
Model 2450-EC
• Step current: -1.05 A ≤ Istep ≤ +1.05 A
• Potential measure ranges: 20 mV, 200 mV, 2 V, 20 V
• Source limit (compliance): 100 % of selected potential range
• Number of steps: 1 to 10
• Step duration: 10 ms ≤ step duration ≤ 99,999 s
• Sample interval: 10 ms ≤ sample interval ≤ 100 s
• Sample time:
• Minimum is 166.667 µs
• Maximum is lesser of 166.667ms and (sample interval - 5 ms) and (step duration - 5 ms)
• Maximum number of samples: 100,000 total for all steps
Models 2460-EC and 2461-EC
• Step current: -7.35 A ≤ Istep ≤ +7.35 A
• Potential measure ranges: 200 mV, 2 V, 7 V, 10 V, 20 V
• Source limit (compliance): 100 % of selected potential range
• Number of steps: 1 to 10
• Step duration: 10 ms ≤ step duration ≤ 99,999 s
• Sample interval: 10 ms ≤ sample interval ≤ 100 s
• Sample time:
• Minimum is 166.667 µs
• Maximum is lesser of 166.667 ms and (sample interval - 5 ms) and (step duration - 5 ms)
• Maximum number of samples: 100,000 total for all steps
Run the Chronopotentiometry test application
To run the test application:
1. Press the HOME key.
2. Select the active script indicator at the top of your home screen. If there is no script activity, the
indicator displays "No Script."
Figure 124: Active script indicator
7-2 077110402/November 2016
Page 84

Models 2450
Chronopotentiometry
Select this control to immediately stop the test and return to normal SMU
operation.
useful for constraining all of the data to the screen's viewing size.
Select this control to immediately begin the test. This option becomes Stop
Test when the test runs.
option is only visible after the test runs.
Select this control to cycle through the available cursor placements: None,
Vertical, Horizontal, and Both.
-EC, 2460-EC, and 2461-EC Potentiostats And Galvanostats User's Manual Section 7:
3. Select the preloaded Chronopotentiometry test script (potentiostats and galvanostats only) or
connect the supplied USB drive to your SMU instrument to locate the included
Chronopotentiometry test. If you connect the USB drive, test scripts on the drive are displayed
with usb1/ before the script file name.
Figure 125: Selecting the Chronopotentiometry test application
4. Select Chronopotentiometry. The test application begins to run immediately and the following
screen is displayed.
Figure 126: Chronopotentiometry test home screen
The test home screen controls include:
End App
Autoscale
Start Test
Save Data
Cursor
Select this control to define the graph based upon the plotted data. This is
Select this control to save the test data to a .csv file on a flash drive. This
077110402/November 2016 7-3
Page 85

Section
User's Manual
7: Chronopotentiometry Models 2450-EC, 2460-EC, and 2461-EC Potentiostats And Galvanostats
Review the Menu controls
You have different options in the Menu screen, depending on the application. The following graphic
shows the Chronopotentiometry main Menu. You will learn the function for each option later in this
section.
Figure 127: Chronopotentiometry main Menu
Configure the Step and Measure Settings
Select Step Settings to specify the number, level, and duration of current steps to be sequentially
executed.
Figure 128: Step Settings menu
The Chonopotentiometry test application allows you to add up to ten steps, though such multi-step
procedures are not common. The most common protocols for Chronopotentiometry tests use a single
step.
Figure 129: Step Settings menu
7-4 077110402/November 2016
Page 86

Models 2450
Chronopotentiometry
-EC, 2460-EC, and 2461-EC Potentiostats And Galvanostats User's Manual Section 7:
To define the Number of Steps:
1. Press the MENU key, then select Step Settings.
2. Select Number of Steps.
3. Enter a value, then select OK. The next figure shows three steps defined.
Figure 130: Step Settings menu
Next, you must define the Current and Duration for each step.
To define the Current and Duration:
1. From the Measure Settings menu, select a step Current.
2. Enter step Current value, then select OK.
3. Select a step Duration.
4. Enter a step Duration value, then select OK.
Now, you will define the Measure Settings parameters of Potential Range, Sample Time, and Sample
Interval.
Figure 131: Measure Settings menu
077110402/November 2016 7-5
Page 87

Section
User's Manual
7: Chronopotentiometry Models 2450-EC, 2460-EC, and 2461-EC Potentiostats And Galvanostats
To select the Potential Range:
1. From the Measure Settings window, select Potential Range.
2. Choose a range greater than the highest voltage you expect to measure.
The available potential ranges for the 2450-EC and 2460-EC / 2461-EC are shown in the next figure.
Figure 132: Selecting the Voltage Range
Your instrument will integrate and average the measurement over the Sample Time duration. Longer
sample times will reduce the effect of noise on the measurement.
The Potential measure Range constrains the potential that can develop across the device under test
(DUT). Make sure to choose a range higher than your expected maximum potential. Setting the
Potential Range also sets a potential limit, which can be used to stop the test or otherwise protect
your DUT. Your galvanostat will limit the potential to 105 percent of the selected range.
Now, you will specify the timing of consecutive measurements. This value is the time from the start of
one measurement to the beginning of the next measurement during a particular current step. The
sample interval and sample time settings are related. The sample time can be no more than the
sample interval minus 5 ms (SI - 5 ms). Adjusting the sample interval may also change the sample
time setting automatically.
To set the Sample Interval:
1. From the Measure Settings window, select Sample Interval.
2. Enter a value, then select OK.
Figure 133: Entering the Sample Interval
7-6 077110402/November 2016
Page 88

Mod
Chronopotentiometry
els 2450-EC, 2460-EC, and 2461-EC Potentiostats And Galvanostats User's Manual Section 7:
To select the Sample Time:
1. From the Measure Settings window, select Sample Time.
2. Enter a value, then select OK.
Figure 134: Entering the Sample Time
Save or load the test parameter data
You can save your test parameters to the front-panel flash drive at any time. Up to five test parameter
configurations can be stored.
To save the test parameters:
1. From the Menu screen, select Save Settings. Note that your Menu screen options are different
depending on the test you are running.
If you have saved a settings file previously with the same File Selection number, you will be
prompted to overwrite it.
Figure 135: Selecting Save Settings
077110402/November 2016 7-7
Page 89

Section
7: Chronopotentiometry Models 2450-EC, 2460-EC, and 2461-EC Potentiostats And Galvanostats
User's Manual
2. You are notified when the save is complete. Select OK to clear the prompt.
Figure 136: Successful file save
To load saved test parameters:
Test parameters can only be loaded to the same instrument model on which they were created and
saved. For example, you cannot load test parameter settings created with a 2450-EC to a 2460-EC.
1. From the Menu screen, select Load Settings.
2. Select a file by choosing File Selection and then a file number.
Figure 137: Choosing a file to load
3. Select Load Settings. You are notified when the load completes..
4. Select OK to clear the prompt.
7-8 077110402/November 2016
Page 90

Models 2450
Chronopotentiometry
-EC, 2460-EC, and 2461-EC Potentiostats And Galvanostats User's Manual Section 7:
Run the test and view the graph
To start the experiment and view the graph:
1. Press the HOME key.
2. Select Start Test. The output turns on and the display automatically shows the potential
measurements plotting in real time, along with a progress bar at the bottom of the screen. The
Start Test control also changes to Stop Test for the duration of the test.
The output turns off when the test completes. The following graphic shows the Home screen after the
test finishes. You can return to this Home screen at any time when the test is running by selecting the
Run / Graph option from the Menu screen.
You can use the touchscreen to manipulate the graph or add cursors. See your Interactive
SourceMeter® Instrument Reference Manual for more information.
You can save a screen capture to a flash drive inserted into the USB port of the galvanostat by
simultaneously pressing the HOME key and the ENTER key. The file name has the format
imgmmdd_xxxxxx.png, where mmdd represents the instrument month and day and xxxxxx is a
system-generated number.
To end the test before the run completes, select Stop Test at any time. This stops the test and turns
off the the galvanostat output. You can then select End App to exit the test and return to normal
SMU operation. If there is a long interval between consecutive samples, there may be a long delay
between selecting Stop Test and when the test stops, as the current operation must complete.
Make sure to select Stop Test before selecting End App. Stop Test turns off the instrument's
output.
Hazardous voltages may be present on all output and guard terminals. To prevent electrical
shock that could cause injury or death, never make or break connections to the instrument
while the power is turned on. Turn off the equipment from the front panel or disconnect the
main power cord from the rear of the instrument before handling cables. Putting the
equipment into an output-off state does not guarantee that the outputs are powered off if a
hardware or software fault occurs.
077110402/November 2016 7-9
Page 91

Section
User's Manual
7: Chronopotentiometry Models 2450-EC, 2460-EC, and 2461-EC Potentiostats And Galvanostats
Save the test data to the flash drive
You can save the data generated from the test to the front-panel flash drive. The data is stored in a
.csv file that also includes instrument information and parameter settings.
If there are more than 10,000 measurements stored, the process of saving the data may take several
minutes.
To save the test data to the flash drive:
1. Make sure your flash drive is inserted into the front panel USB port.
2. From the test application home screen, select Save Data.
3. Specify a file name, then select OK.
4. Select OK on the confirmation message.
Figure 138: Test results saved successfully
View the results saved to the flash drive
To view the test results, open the saved file in a spreadsheet program on a computer. Current,
voltage, time, and general parameters for the test are included in the file.
View the Reading Table or measurement Statistics
When the test completes, you can view the individual data points on the instrument by selecting
Reading Table from the Menu screen.
Figure 139: Viewing the Reading Table
7-10 077110402/November 2016
Page 92

Models 2450
Chronopotentiometry
-EC, 2460-EC, and 2461-EC Potentiostats And Galvanostats User's Manual Section 7:
You can also view the measurement statistics. Select Statistics from the Menu screen.
Figure 140: Viewing measurement Statistics
View the Event Log
From the main Menu, you can select Event Log. The event log records events, which can be errors,
warnings, and information reported by your instrument. Through the Event Log menu, you can view
these events. You can also specify which events are shown in the event log, which ones are logged,
and which ones generate popup messages.
Figure 141: Viewing the Event Log
See your Keithley Instruments 2450, 2460, or 2461 Interactive SourceMeter® Instrument Reference
Manual for further details on the Event Log.
077110402/November 2016 7-11
End the test application
When you are finished making measurements, select End App to exit the test and return to normal
SMU operation.
Make sure to always select Stop Test before selecting End App. Stop Test turns off the
instrument's output.
Page 93

All Keithley trademarks and trade names are the property of Keithley Instruments.
Specifications are subject to change without notice.
All other trademarks and trade names are the property of their respective companies.
A Greater Measure of Confidence
12/15
 Loading...