

Page 1

Model 2015/2015P THD Multimeter
User’s Manual
2015-900-01 Rev. F / August 2003
Test Equipment Depot - 800.517.8431 - 99 Washington Street Melrose, MA 02176 - TestEquipmentDepot.com
A GREATER MEASURE OF CONFIDENCE
Page 2

Model 2015/2015P THD Multimeter
User’s Manual
When this manual refers to the Model 2015 it is also referring to the
Model 2015P. Information that pertains exclusively to the Model 2015P will be
clearly indicated.
©1998, Keithley Instruments, Inc.
All rights reserved.
Cleveland, Ohio, U.S.A.
Sixth Printing, August 2003
Document Number: 2015-900-01 Rev. F
Page 3

Manual Print History
The print history shown below lists the printing dates of all Revisions and Addenda created
for this manual. The Revision Level letter increases alphabetically as the manual undergoes
subsequent updates. Addenda, which are released between Revisions, contain important change
information that the user should incorporate immediately into the manual. Addenda are
numbered sequentially. When a new Revision is created, all Addenda associated with the
previous Revision of the manual are incorporated into the new Revision of the manual. Each new
Revision includes a revised copy of this print history page.
Revision A (Document Number 2015-900-01)................................................................. May 1998
Revision B (Document Number 2015-900-01) ............................................................. August 1998
Revision C (Document Number 2015-900-01) ................................................................. June 1999
Revision D (Document Number 2015-900-01)............................................................October 2000
Revision E (Document Number 2015-900-01) ........................................................December 2001
Revision F (Document Number 2015-900-01)............................................................. August 2003
All Keithley product names are trademarks or registered trademarks of Keithley Instruments, Inc.
Other brand names are trademarks or registered trademarks of their respective holders.
Page 4

Safety Precautions
The following safety precautions should be observed before using this product and any associated instrumentation.
Although some instruments and accessories would normally be used with non-hazardous voltages, there are
situations where hazardous conditions may be present.
This product is intended for use by qualified personnel who recognize shock hazards and are familiar with the safety
precautions required to avoid possible injury. Read and follow all installation, operation, and maintenance
information carefully before using the product. Refer to the user documentation for complete product specifications.
If the product is used in a manner not specified, the protection provided by the product warranty may be impaired.
The types of product users are:
Responsible body is the individual or group responsible for the use and maintenance of equipment, for ensuring
that the equipment is operated within its specifications and operating limits, and for ensuring that operators are
adequately trained.
Operators use the product for its intended function. They must be trained in electrical safety procedures and proper
use of the instrument. They must be protected from electric shock and contact with hazardous live circuits.
Maintenance personnel perform routine procedures on the product to keep it operating properly, for example,
setting the line voltage or replacing consumable materials. Maintenance procedures are described in the user
documentation. The procedures explicitly state if the operator may perform them. Otherwise, they should be
performed only by service personnel.
Service personnel are trained to work on live circuits, perform safe installations, and repair products. Only properly
trained service personnel may perform installation and service procedures.
Keithley Instruments products are designed for use with electrical signals that are rated Measurement Category I
and Measurement Category II, as described in the International Electrotechnical Commission (IEC) Standard IEC
60664. Most measurement, control, and data I/O signals are Measurement Category I and must not be directly
connected to mains voltage or to voltage sources with high transient over-voltages. Measurement Category II
connections require protection for high transient over-voltages often associated with local AC mains connections.
Assume all measurement, control, and data I/O connections are for connection to Category I sources unless
otherwise marked or described in the user documentation.
Exercise extreme caution when a shock hazard is present. Lethal voltage may be present on cable connector jacks
or test fixtures. The American National Standards Institute (ANSI) states that a shock hazard exists when voltage
levels greater than 30V RMS, 42.4V peak, or 60VDC are present. A good safety practice is to expect that hazardous
voltage is present in any unknown circuit before measuring.
Operators of this product must be protected from electric shock at all times. The responsible body must ensure that
operators are prevented access and/or insulated from every connection point. In some cases, connections must be
exposed to potential human contact. Product operators in these circumstances must be trained to protect
themselves from the risk of electric shock. If the circuit is capable of operating at or above 1000 volts, no conductive
part of the circuit may be exposed.
Do not connect switching cards directly to unlimited power circuits. They are intended to be used with impedancelimited sources. NEVER connect switching cards directly to AC mains. When connecting sources to switching cards,
install protective devices to limit fault current and voltage to the card.
Before operating an instrument, make sure the line cord is connected to a properly grounded power receptacle.
Inspect the connecting cables, test leads, and jumpers for possible wear, cracks, or breaks before each use.
When installing equipment where access to the main power cord is restricted, such as rack mounting, a separate
main input power disconnect device must be provided in close proximity to the equipment and within easy reach of
the operator.
11/ 07
Page 5

For maximum safety, do not touch the product, test cables, or any other instruments while power is applied to the
!
circuit under test. ALWAYS remove power from the entire test system and discharge any capacitors before:
connecting or disconnecting cables or jumpers, installing or removing switching cards, or making internal changes,
such as installing or removing jumpers.
Do not touch any object that could provide a current path to the common side of the circuit under test or power line
(earth) ground. Always make measurements with dry hands while standing on a dry, insulated surface capable of
withstanding the voltage being measured.
The instrument and accessories must be used in accordance with specifications and operating instructions, or the
safety of the equipment may be impaired.
Do not exceed the maximum signal levels of the instruments and accessories, as defined in the specifications and
operating information, and as shown on the instrument or test fixture panels, or switching card.
When fuses are used in a product, replace with the same type and rating for continued protection against fire hazard.
Chassis connections must only be used as shield connections for measuring circuits, NOT as safety earth ground
connections.
If you are using a test fixture, keep the lid closed while power is applied to the device under test. Safe operation
requires the use of a lid interlock.
If a screw is present, connect it to safety earth ground using the wire recommended in the user documentation.
The symbol on an instrument indicates that the user should refer to the operating instructions located in the
documentation.
The symbol on an instrument shows that it can source or measure 1000 volts or more, including the combined
effect of normal and common mode voltages. Use standard safety precautions to avoid personal contact with these
voltages.
The symbol on an instrument shows that the surface may be hot. Avoid personal contact to prevent burns.
The symbol indicates a connection terminal to the equipment frame.
If this symbol is on a product, it indicates that mercury is present in the display lamp. Please note that the lamp
must be properly disposed of according to federal, state, and local laws.
The WARNING heading in the user documentation explains dangers that might result in personal injury or death.
Always read the associated information very carefully before performing the indicated procedure.
The CAUTION heading in the user documentation explains hazards that could damage the instrument. Such
damage may invalidate the warranty.
Instrumentation and accessories shall not be connected to humans.
Before performing any maintenance, disconnect the line cord and all test cables.
To maintain protection from electric shock and fire, replacement components in mains circuits - including the power
transformer, test leads, and input jacks - must be purchased from Keithley Instruments. Standard fuses with
applicable national safety approvals may be used if the rating and type are the same. Other components that are
not safety-related may be purchased from other suppliers as long as they are equivalent to the original component
(note that selected parts should be purchased only through Keithley Instruments to maintain accuracy and
functionality of the product). If you are unsure about the applicability of a replacement component, call a Keithley
Instruments office for information.
To clean an instrument, use a damp cloth or mild, water-based cleaner. Clean the exterior of the instrument only. Do
not apply cleaner directly to the instrument or allow liquids to enter or spill on the instrument. Products that consist
of a circuit board with no case or chassis (e.g., data acquisition board for installation into a computer) should never
require cleaning if handled according to instructions. If the board becomes contaminated and operation is affected,
the board should be returned to the factory for proper cleaning/servicing.
Page 6

Table of Contents
1 General Information
Introduction ................................................................................ 1-2
Feature overview ........................................................................ 1-2
Warranty information ................................................................. 1-3
Manual addenda ......................................................................... 1-3
Safety symbols and terms .......................................................... 1-3
Specifications ............................................................................. 1-4
Inspection ................................................................................... 1-4
Options and accessories ............................................................. 1-4
General purpose probes ....................................................... 1-4
Low thermal probes ............................................................ 1-5
Cables and adapters ............................................................. 1-5
Rack mount kits .................................................................. 1-5
Carrying case ...................................................................... 1-5
2 Basic Measurements
Introduction ................................................................................ 2-2
Front panel summary ................................................................. 2-3
Rear panel summary ................................................................... 2-6
Power-up .................................................................................... 2-8
Line power connection ........................................................ 2-8
Setting line voltage and replacing fuse ............................... 2-9
Power-up sequence ........................................................... 2-10
High energy circuit safety precautions ............................. 2-11
Power-on defaults ............................................................. 2-12
GPIB primary address ....................................................... 2-15
Warm-up time ................................................................... 2-15
Display ..................................................................................... 2-16
Status and error messages ................................................. 2-16
Measuring voltage .................................................................... 2-16
Connections ....................................................................... 2-16
Crest factor ........................................................................ 2-17
Low level considerations .................................................. 2-17
Measuring current .................................................................... 2-20
Connections ....................................................................... 2-20
AMPS fuse replacement ................................................... 2-21
Measuring resistance ................................................................ 2-22
Connections ....................................................................... 2-22
Shielding ........................................................................... 2-23
Page 7

Measuring frequency and period .............................................. 2-24
Trigger level ...................................................................... 2-24
Gate time ........................................................................... 2-24
Connections ....................................................................... 2-25
Measuring temperature ............................................................. 2-26
Connections ....................................................................... 2-26
Configuration .................................................................... 2-27
Math .......................................................................................... 2-27
MX + B .............................................................................. 2-28
Percent ............................................................................... 2-29
dBm calculation ................................................................. 2-30
dB calculation .................................................................... 2-31
Measuring continuity ................................................................ 2-32
Connections ....................................................................... 2-32
Threshold resistance level ................................................. 2-32
Testing diodes ........................................................................... 2-33
Connections ....................................................................... 2-33
Range ................................................................................. 2-33
Measuring distortion ................................................................. 2-34
Configuration .................................................................... 2-35
Connections ....................................................................... 2-40
Measurement examples ..................................................... 2-42
Analyzing frequency spectrum (Model 2015P only) ............... 2-47
Peak commands ................................................................. 2-47
Operation overview ........................................................... 2-48
Typical peak analysis ........................................................ 2-48
Frequency list analysis ...................................................... 2-49
Peak analysis programming example ................................ 2-50
Delta programming example ............................................. 2-52
Frequency list programming example ............................... 2-53
Measurement Queries ............................................................... 2-54
:FETCh? ............................................................................ 2-54
:READ? ............................................................................. 2-55
:MEAS:[function]? ............................................................ 2-55
[:SENSe[1]]:DATA:FRESh? ............................................. 2-56
[:SENSe[1]]:DATA:LATest? ............................................. 2-56
Examples ........................................................................... 2-57
Page 8

3 Measurement Options
Introduction ................................................................................ 3-2
Measurement configuration ....................................................... 3-2
Range .................................................................................. 3-2
Filter .................................................................................... 3-3
Relative ............................................................................... 3-5
Digits ................................................................................... 3-5
Rate ..................................................................................... 3-6
Trigger operations ...................................................................... 3-8
Trigger model ...................................................................... 3-8
Reading hold (autosettle) .................................................. 3-10
External triggering ............................................................ 3-11
Buffer operations ...................................................................... 3-16
Storing readings ................................................................ 3-17
Recalling readings ............................................................. 3-17
Buffer statistics ................................................................. 3-18
Limit operations ....................................................................... 3-18
Setting limit values ........................................................... 3-19
Enabling limits .................................................................. 3-20
Scan operations ........................................................................ 3-21
Scanning overview ............................................................ 3-21
Front panel scanner controls ............................................. 3-21
Stepping and scanning trigger model additions ................ 3-21
Using SHIFT-CONFIG to configure stepping
and scanning ................................................................... 3-23
Scanning examples ............................................................ 3-24
System operations .................................................................... 3-26
Calibration ......................................................................... 3-26
4 Remote Operation
Introduction ................................................................................ 4-2
Selecting an interface .......................................................... 4-2
RS-232 ................................................................................ 4-3
GPIB bus ............................................................................. 4-3
RS-232 operation ....................................................................... 4-4
Sending and receiving data ................................................. 4-4
Selecting baud rate .............................................................. 4-4
Selecting signal handshaking (flow control) ....................... 4-5
Setting terminator ................................................................ 4-5
RS-232 connections ............................................................ 4-6
Error messages .................................................................... 4-6
Page 9

GPIB bus operation and reference .............................................. 4-7
Introduction ......................................................................... 4-7
GPIB bus standards ............................................................. 4-7
GPIB bus connections ......................................................... 4-8
Selecting the primary address ........................................... 4-10
QuickBASIC 4.5 programming ......................................... 4-10
General Bus Commands .................................................... 4-12
Front panel GPIB operation .............................................. 4-15
Status structure ......................................................................... 4-16
Condition registers ............................................................ 4-17
Event registers ................................................................... 4-17
Enable registers ................................................................. 4-17
Queues ............................................................................... 4-20
Status Byte and Service Request (SRQ) ........................... 4-21
Trigger model (GPIB operation) .............................................. 4-24
Idle and initiate .................................................................. 4-25
Trigger model operation .................................................... 4-25
Programming syntax ................................................................. 4-27
Command words ............................................................... 4-27
Query commands ............................................................... 4-29
Case sensitivity .................................................................. 4-29
Long-form and short-form versions .................................. 4-29
Short-form rules ................................................................ 4-30
Program messages ............................................................. 4-31
Response messages ........................................................... 4-33
Message exchange protocol .............................................. 4-33
Common Commands ................................................................ 4-34
*CLS — Clear Status ........................................................ 4-35
*ESE <NRf> — Event Enable .......................................... 4-35
*ESE? — Event Enable Query .......................................... 4-35
*ESR? — Event Status Register Query ............................ 4-36
*IDN? — Identification Query ......................................... 4-38
*OPC — Operation Complete ........................................... 4-38
*OPC? — Operation Complete Query ............................. 4-40
*OPT? — Option Identification Query ............................ 4-41
*RCL — Recall ................................................................. 4-41
*RST — RESET ............................................................... 4-42
*SAV — Save ................................................................... 4-42
*SRE <NRf> — Service Request Enable ......................... 4-42
*SRE? — Service Request Enable Query ......................... 4-42
*STB? — Status Byte Query ............................................ 4-44
*TRG — Trigger ............................................................... 4-45
*TST?-Self-Test Query ..................................................... 4-45
*WAI — Wait-to-Continue................................................ 4-46
Page 10

5 SCPI Command Reference
SCPI Signal oriented measurement commands ......................... 5-2
CONFigure Command ........................................................ 5-2
FETCh? command .............................................................. 5-4
READ? command ............................................................... 5-5
MEASure command ............................................................ 5-6
SCPI command subsystems reference tables ............................. 5-7
Calculate subsystem ................................................................. 5-23
:CALCulate[1] .................................................................. 5-23
:CALCulate2 ..................................................................... 5-25
:CALCulate3 ..................................................................... 5-27
DISPlay subsystem .................................................................. 5-29
:FORMat subsystem ................................................................. 5-31
:DATA command .............................................................. 5-31
:BORDer command .......................................................... 5-34
:ELEMents command ....................................................... 5-35
OUTPut subsystem .................................................................. 5-36
ROUTe subsystem ................................................................... 5-38
[SENSe[1]] subsystem ............................................................. 5-39
:FUNCtion Command ....................................................... 5-39
:DATA command .............................................................. 5-40
:HOLD Command ............................................................. 5-40
Speed Commands .............................................................. 5-41
:RANGe commands .......................................................... 5-42
:REFerence <n> commands .............................................. 5-44
:DIGits command .............................................................. 5-46
:AVERage commands ....................................................... 5-47
Bandwidth command ........................................................ 5-48
:THReshold commands ..................................................... 5-49
Thermocouple commands ................................................. 5-49
:DIODe command ............................................................. 5-50
:CONTinuity command .................................................... 5-50
:DISTortion commands ..................................................... 5-51
:PEAK commands (Model 2015P only) ........................... 5-55
STATus subsystem .................................................................. 5-58
[:EVENt]? command ........................................................ 5-59
:ENABle command ........................................................... 5-62
:CONDition? command .................................................... 5-64
:PRESet command ............................................................ 5-64
:QUEue commands ........................................................... 5-65
Page 11

:SYSTem subsystem ................................................................. 5-67
:BEEPer command ............................................................ 5-67
:PRESet command ............................................................. 5-67
:KCLick command ............................................................ 5-67
:POSetup <name> command ............................................. 5-68
:FRSWitch? command ...................................................... 5-68
:VERSion? command ........................................................ 5-68
:ERRor? command ............................................................ 5-69
:AZERo commands ........................................................... 5-69
:CLEar command .............................................................. 5-70
:KEY <NRf> command .................................................... 5-70
RS-232 interface commands ............................................. 5-71
Line frequency query ........................................................ 5-72
:TRACe subsystem ................................................................... 5-72
:CLEar command .............................................................. 5-72
:FREE? command ............................................................. 5-72
:POINts command ............................................................. 5-72
:FEED command ............................................................... 5-73
:DATA? command ............................................................ 5-73
Trigger subsystem .................................................................... 5-74
:INITiate commands .......................................................... 5-74
:ABORt command ............................................................. 5-74
:TRIGger commands ......................................................... 5-75
:UNIT subsystem ...................................................................... 5-77
:TEMPerature command ................................................... 5-77
:VOLTage commands ....................................................... 5-77
:DISTortion commands ..................................................... 5-79
A Specifications
Accuracy calculations ................................................................ A-6
Calculating DC characteristics accuracy ............................ A-6
Calculating AC characteristics accuracy ............................ A-6
Calculating dBm characteristics accuracy .......................... A-7
Calculating dB characteristics accuracy ............................. A-8
Additional derating factors ................................................. A-8
Optimizing measurement accuracy ........................................... A-9
Optimizing measurement speed ................................................ A-9
B Status and Error Messages
Page 12

C Example Programs
Program examples ..................................................................... C-2
Changing function and range ............................................. C-2
One-shot triggering ............................................................ C-4
Generating SRQ on buffer full ........................................... C-5
Storing readings in buffer .................................................. C-6
Taking readings using the :READ? command ................... C-8
Controlling the Model 2015 via the RS-232 COM2 port .. C-8
D IEEE-488 Bus Overview
Introduction ............................................................................... D-2
Bus description .......................................................................... D-4
Bus lines .................................................................................... D-6
Data lines ........................................................................... D-6
Bus management lines ....................................................... D-6
Handshake lines ................................................................. D-7
Bus commands .......................................................................... D-8
Uniline commands ............................................................. D-9
Universal multiline commands .......................................... D-9
Addressed multiline commands ....................................... D-10
Address commands .......................................................... D-10
Unaddress commands ...................................................... D-10
Common commands ........................................................ D-11
SCPI commands ............................................................... D-11
Command codes ............................................................... D-11
Typical command sequences ........................................... D-13
IEEE command groups .................................................... D-14
Interface function codes .......................................................... D-15
E IEEE-488 and SCPI Conformance Information
Introduction ................................................................................ E-2
Page 13

Page 14

List of Illustrations
2 Basic Measurements
Figure 2-1 Model 2015 front panel .......................................................... 2-3
Figure 2-2 Model 2015 rear panel ........................................................... 2-6
Figure 2-3 Power module ........................................................................ 2-8
Figure 2-4 DC and AC voltage measurements ...................................... 2-17
Figure 2-5 DC and AC current measurements ...................................... 2-20
Figure 2-6 Two- and four- wire resistance measurements .................... 2-23
Figure 2-7 Frequency and period measurements ................................... 2-25
Figure 2-8 Thermocouple temperature measurements .......................... 2-26
Figure 2-9 Continuity measurements .................................................... 2-32
Figure 2-10 Diode testing ........................................................................ 2-33
Figure 2-11 Distortion measurements ..................................................... 2-41
Figure 2-12 DUT connections when using the internal sine source
to stimulate a device ....................................................... 2-46
Figure 2-13 Peak analysis ........................................................................ 2-48
3 Measurement Options
Figure 3-1 Moving average and repeating filters .................................... 3-4
Figure 3-2 Front panel triggering without stepping/scanning ................. 3-8
Figure 3-3 Rear panel pinout ................................................................. 3-11
Figure 3-4 Trigger link input pulse specifications (EXT TRIG) ........... 3-12
Figure 3-5 Trigger link output pulse specifications (VMC) .................. 3-12
Figure 3-6 DUT test system .................................................................. 3-13
Figure 3-7 Trigger link connections ...................................................... 3-13
Figure 3-8 Operation model for triggering example ............................. 3-14
Figure 3-9 DIN to BNC trigger cable .................................................... 3-16
Figure 3-10 Buffer locations .................................................................... 3-17
Figure 3-11 Using limit test to sort 100W, 10% resistors ....................... 3-20
Figure 3-12 Front panel triggering with stepping .................................... 3-22
Figure 3-13 Front panel triggering with scanning ................................... 3-22
Figure 3-14 External scanning example with Model 7001 ...................... 3-25
4 Remote Operation
Figure 4-1 RS-232 interface connector ................................................... 4-6
Figure 4-2 IEEE-488 connector ............................................................... 4-8
Figure 4-3 IEEE-488 connections ........................................................... 4-8
Figure 4-4 IEEE-488 connector location ................................................. 4-9
Page 15

Figure 4-5 Model 2015 status register structure .................................... 4-16
Figure 4-6 Standard event status ............................................................ 4-18
Figure 4-7 Operation event status .......................................................... 4-18
Figure 4-8 Measurement event status .................................................... 4-19
Figure 4-9 Questionable event status ..................................................... 4-19
Figure 4-10 Status byte and service request (SRQ) ................................. 4-21
Figure 4-11 Trigger model (remote operation) ........................................ 4-24
Figure 4-12 Device action (trigger model) .............................................. 4-26
Figure 4-13 Standard event enable register ............................................. 4-36
Figure 4-14 Standard event status register ............................................... 4-37
Figure 4-15 Service request enable register ............................................. 4-43
Figure 4-16 Status byte register ............................................................... 4-45
5 SCPI Command Reference
Figure 5-1 ASCII data format ................................................................ 5-32
Figure 5-2 IEEE754 single precision data format (32 data bits) ........... 5-32
Figure 5-3 IEEE754 double precision data format (64 data bits) .......... 5-33
Figure 5-4 Measurement event register ................................................. 5-60
Figure 5-5 Questionable event register .................................................. 5-61
Figure 5-6 Operation event register ....................................................... 5-61
Figure 5-7 Measurement event enable register ...................................... 5-63
Figure 5-8 Questionable event enable register ....................................... 5-63
Figure 5-9 Operation event enable register ............................................ 5-63
Figure 5-10 Key-press codes ................................................................... 5-71
D IEEE-488 Bus Overview
Figure D-1 IEEE-488 bus configuration .................................................. D-5
Figure D-2 IEEE-488 handshake sequence ............................................. D-7
Figure D-3 Command codes .................................................................. D-12
Page 16

List of Tables
2 Basic Measurements
Table 2-1 Fuse ratings ............................................................................ 2-9
Table 2-2 Factory defaults .................................................................... 2-13
Table 2-3 PEAK commands ................................................................. 2-47
Table 2-4 Peak analysis programming example .................................. 2-51
Table 2-5 Delta programming example ............................................... 2-52
Table 2-6 Frequency list programming example ................................. 2-53
3 Measurement Options
Table 3-1 Rate settings for the measurement functions ......................... 3-7
Table 3-2 Auto delay settings ................................................................ 3-9
4 Remote Operation
Table 4-1 RS-232 connector pinout ....................................................... 4-6
Table 4-2 General bus commands and associated statements .............. 4-12
Table 4-3 IEEE-488.2 common commands and queries ...................... 4-34
5 SCPI Command Reference
Table 5-1 Signal oriented measurement command summary ................ 5-2
Table 5-2 CALCulate command summary ............................................ 5-8
Table 5-3 DISPlay command summary ................................................. 5-9
Table 5-4 FORMat command summary ............................................... 5-10
Table 5-5 OUTPut command summary ............................................... 5-10
Table 5-6 ROUTe command summary ................................................ 5-11
Table 5-7 SENSe command summary ................................................. 5-11
Table 5-8 STATus command summary ............................................... 5-19
Table 5-9 SYSTem command summary .............................................. 5-20
Table 5-10 TRACe command summary ................................................ 5-20
Table 5-11 Trigger command summary ................................................. 5-21
Table 5-12 UNIT command summary ................................................... 5-22
Page 17

B Status and Error Messages
Table B-1 Status and error messages ..................................................... B-2
D IEEE-488 Bus Overview
Table D-1 IEEE-488 bus command summary ........................................ D-8
Table D-2 Hexadecimal and decimal command codes ........................ D-11
Table D-3 Typical addressed command sequence ................................ D-13
Table D-4 Typical addressed command sequence ................................ D-13
Table D-5 IEEE command groups ....................................................... D-14
Table D-6 Model 2015 interface function codes .................................. D-15
E IEEE-488 and SCPI Conformance Information
Table E-1 IEEE-488 documentation requirements ................................ E-2
Table E-2 Coupled commands ............................................................... E-3
Page 18

1
General Infor-
mation
1
General
Information
Page 19

1-2 General Information
Introduction
NOTES
information is organized as follows:
The Models 2015 and 2015P are almost identical in function. The exception is that
the Model 2015P has the capability to analyze the frequency spectrum of a signal,
while the Model 2015 does not.
Over the bus, the *IDN? command can be used to identify the model number of the
unit. The response message will be either Model 2015 or Model 2015P (see
“Common commands” in Section 4).
When this manual refers to the Model 2015, it is also referring to the Model 2015P.
Information that pertains exclusively to the Model 2015P will be clearly indicated.
This section contains general information about the Model 2015 THD Multimeter. The
• Feature overview
• Warranty information
• Manual addenda
• Safety symbols and terms
• Specifications
• Inspection
• Options and accessories
If you have any questions after reviewing this information, please contact your local
Keithley representative or call one of our Applications Engineers at 1-800-348-3735 (U.S.
and Canada only). Worldwide phone numbers are listed at the front of this manual.
Feature overview
The Model 2015 is a 6½-digit high-performance digital multimeter. It has 0.002% 90-day
basic DC voltage accuracy and 0.008% 90-day basic resistance accuracy. At 6
multimeter delivers 50 triggered readings/sec over the IEEE-488 bus. At 4
up to 2000 readings/sec into its internal buffer. The Model 2015 has broad measurement ranges:
• THD, THD+n, and SINAD from 20Hz to 50kHz with 0.0001% (0.00001 dB) resolution.
• Frequency spectrum analysis from 20Hz to 50kHz (Model 2015P only).
• DC voltage from 0.1
• AC (RMS) voltage from 0.1
• DC current from 10nA to 3A.
• AC (RMS) current from 1
• Two and four-wire resistance from 100µ
• Frequency from 3Hz to 500kHz.
• Thermocouple temperature from -200°C to +1372°C.
µ
V to 1000V.
µ
µ
A to 3A.
V to 750V, 1000V peak.
Ω
to 120MΩ.
½
-digits, the
½
-digits, it can read
Page 20

Some additional capabilities of the Model 2015 include:
• Full range of functions — In addition to those listed above, the Model 2015 functions
include period, dB, dBm, continuity, diode testing, mX+b, and percent.
• Optional scanning — For external scanning, the Model 2015 is compatible with
Keithley's Model 7001 and 7002 switch matrices and cards.
• Programming language and remote interfaces — The Model 2015 has the SCPI
programming language and two remote interface ports (IEEE-488/GPIB and RS-232C).
• Reading and setup storage — Up to 1024 readings and two setups (user and factory
defaults) can be stored and recalled.
• Closed-cover calibration — The instrument can be calibrated either from the front
panel or remote interface.
Warranty information
Warranty information is located at the front of this instruction manual. Should your
Model 2015 require warranty service, contact the Keithley representative or authorized repair
facility in your area for further information. When returning the instrument for repair, be sure to
fill out and include the service form at the back of this manual to provide the repair facility with
the necessary information.
General Information 1-3
Manual addenda
Any improvements or changes concerning the instrument or manual will be explained in an
addendum included with the manual. Be sure to note these changes and incorporate them into
the manual.
Safety symbols and terms
The following symbols and terms may be found on the instrument or used in this manual.
!
The symbol on the instrument indicates that the user should refer to the operating
instructions located in the manual.
The
symbol
Use standard safety precautions to avoid personal contact with these voltages.
The
WARNING
injury or death. Always read the associated information very carefully before performing the
indicated procedure.
The
CAUTION
instrument. Such damage may invalidate the warranty.
on the instrument shows that high voltage may be present on the terminal(s).
heading used in this manual explains dangers that might result in personal
heading used in this manual explains hazards that could damage the
Page 21

1-4 General Information
Specifications
Full Model 2015 specifications are included in Appendix A.
Inspection
The Model 2015 was carefully inspected electrically and mechanically before shipment.
After unpacking all items from the shipping carton, check for any obvious signs of physical
damage that may have occurred during transit. (Note: There may be a protective film over the
display lens, which can be removed.) Report any damage to the shipping agent immediately.
Save the original packing carton for possible future reshipment. The following items are
included with every Model 2015 order:
• Model 2015 THD Multimeter with line cord.
• Safety test leads (Model 1751).
• Accessories as ordered.
• Certificate of calibration.
• Product Information CD-ROM that contains a PDF of the Model 2015/2015P User's
Manual.
If an additional manual is required, order the appropriate manual package. The manual
packages include a manual and any pertinent addenda.
Options and accessories
The following options and accessories are available from Keithley for use with the
Model 2015.
General purpose probes
Model 1754 Universal Test Lead Kit:
lugs, two banana plugs, two hooks, and two alligator clips.
Model 8605 High Performance Modular Test Leads:
test probes and leads. The test leads are terminated with a banana plug with retractable sheath
on each end.
Model 8606 High Performance Probe Tip Kit:
clips, and two spring hook test probes. (The spade lugs and alligator clips are rated at 30V RMS,
42.4V peak; the test probes are rated at 1000V.) These components are for use with high
performance test leads terminated with banana plugs, such as the Model 8605.
The following test leads and probes are rated at 30V RMS, 42.4V peak:
Models 5805 and 5805-12 Kelvin Probes:
with banana plug termination. Designed for instruments that measure 4-terminal resistance. The
Model 5805 is 0.9m long; the Model 5805-12 is 3.6m long.
Consists of one set of test leads (0.9m), two spade
Consists of two high voltage (1000V)
Consists of two spade lugs, two alligator
Consists of two spring-loaded Kelvin test probes
Page 22

General Information 1-5
Model 5806 Kelvin Clip Lead Set:
plug termination. Designed for instruments that measure 4-terminal resistance. A set of eight
replacement rubber bands is available as Keithley P/N GA-22.
Model 8604 SMD Probe Set:
surface mount device “grabber” clip on one end and a banana plug with a retractable sheath on
the other end.
Low thermal probes
Model 8610 Low Thermal Shorting Plug:
1-inch square circuit board, interconnected to provide a short circuit among all plugs.
Cables and adapters
Models 7007-1 and 7007-2 Shielded GPIB Cables:
bus using shielded cables and connectors to reduce electromagnetic interference (EMI). The
Model 7007-1 is 1m long; the Model 7007-2 is 2m long.
Models 8501-1 and 8501-2 Trigger Link Cables:
instruments with Trigger Link connectors (e.g., Model 7001 Switch System). The Model 8501-1
is 1m long; the Model 8501-2 is 2m long.
Model 8502 Trigger Link Adapter:
of the Model 2015 to instruments that use the standard BNC trigger connectors.
Model 8504 DIN to BNC Trigger Cable:
(Voltmeter Complete) and two (External Trigger) of the Model 2015 to instruments that use
BNC trigger connectors. The Model 8504 is 1m long.
Includes two Kelvin clip test leads (0.9m) with banana
Consists of two test leads (0.9m), each terminated with a
Consists of four banana plugs mounted to a
Connect the Model 2015 to the GPIB
Connect the Model 2015 to other
Allows you to connect any of the six Trigger Link lines
Allows you to connect Trigger Link lines one
Rack mount kits
Model 4288-1 Single Fixed Rack Mount Kit:
19-inch rack.
Model 4288-2 Side-by-Side Rack Mount Kit:
486, 487, 2000, 2001, 2002, 2010, 2015, 6517, 7001) side-by-side in a standard 19-inch rack.
Model 4288-3 Side-by-Side Rack Mount Kit:
side-by-side in a standard 19-inch rack.
Model 4288-4 Side-by-Side Rack Mount Kit:
instrument (Models 195A, 196, 220, 224, 230, 263, 595, 614, 617, 705, 740, 775, etc.)
side-by-side in a standard 19-inch rack.
Carrying case
Model 1050 Padded Carrying Case:
shoulder strap.
Mounts a single Model 2015 in a standard
Mounts two instruments (Models 182, 428,
Mounts a Model 2015 and a Model 199
Mounts a Model 2015 and a 5.25-inch
A carrying case for a Model 2015. Includes handles and
Page 23

1-6 General Information
Page 24

2
Basic Measure-
ments
2
Basic
Measurements
Page 25

2-2 Basic Measurements
Introduction
This section summarizes front panel operation of the Model 2015. It is organized as follows:
•
Front panel summary —
connections.
•
Rear panel summary —
•
Power-up —
the warm-up time, and default conditions.
•
Display —
instrument.
•
Measuring voltage —
level voltage considerations.
•
Measuring current —
fuse replacement.
•
Measuring resistance —
shielding considerations.
•
Measuring frequency and period —
connections.
•
Measuring temperature —
measurements.
•
Math —
readings.
•
Measuring continuity —
•
Testing diodes —
•
Measuring distortion
calculations used.
•
Analyzing frequency spectrum (Model 2015P only)
Model 2015P to analyze the frequency spectrum of a signal over the bus.
Includes an illustration and summarizes keys, display, and
Includes an illustration and summarizes connections.
Describes connecting the instrument to line power, the power-up sequence,
Discusses the display format and messages that may appear while using the
Covers DC and AC voltage measurement connections and low
Covers DC and AC current measurement connections and current
Details two and four-wire measurement connections and
Covers frequency and period measurement
Describes the use of thermocouples for temperature
Covers the mX+b, percent, dBm, and dB math functions performed on single
Explains setting up and measuring continuity of a circuit.
Describes testing general-purpose and zener diodes.
— Explains how to measure total harmonic distortion and the
— Explains how to use the
Page 26

Front panel summary
Fi
1
M
p
The front panel of the Model 2015 is shown in Figure 2-1. This figure includes important
abbreviated information that should be reviewed before operating the instrument.
Basic Measurements 2-3
gure 2-
odel 2015 front
anel
5
1
3
SHIFT
LOCAL
POWER
1 Function keys
STEP CH2 CH3 CH4 CH5 CH6 CH7 CH8 CH9 CH10
SCAN
CH1REM
TALK
LSTN
SRQ
SHIFT
TIMER
HOLD TRIG FAST MED SLOW AUTO ERR
MATH
THD
DCV
ACV
HOLD
EX TRIG
TRIG
SAVE SETUP
SOURCE
MEAS
THD
dBm
DCI
LIMITS ON/OFFDELAY
STORE
CONFIG HALT
STEP SCAN
REL FILT
dB
ACI
RECALL
(shifted and unshifted)
CONT
Ω2 Ω4
TEST
RELFILTER
RS232
GPIB
DIGITS RATE
BUFFER
STAT
2015 THD MULTIMETER
PERIOD TCOUPL
FREQ
CAL
EXIT ENTER
MATH
REAR
4W
TEMP
RANGE
AUTO
RANGE
SENSE
INPUT
Ω 4 WIRE
HI
350V
PEAK
INPUTS
F
FRONT/REAR
4
78 2
1000V
!
PEAK
LO
500V
PEAK
R
3A 250V
AMPS
6
Select measurement function (DC and AC voltage, DC and AC current, 2-wire and 4-wire
resistance, frequency, period, temperature with thermocouples), math function (mX+b, %,
dBm, dB), THD (total harmonic distortion) or special function (continuity, diode test).
2 Operation keys
EXTRIG Selects external triggers (front panel, bus, trigger link) as the trigger
source.
TRIG Triggers a measurement from the front panel.
STORE Enables reading storage.
RECALL Displays stored readings and buffer statistics (maximum, minimum,
average, standard deviation). Use ▲ and ▼ to scroll through buffer; use
and to toggle between reading number and reading.
FILTER Displays digital filter status for present function and toggles filter on/off.
REL Enables/disables relative reading on present function (not applicable for
distortion measurements).
and Moves through selections within functions and operations. If scanner
card installed, manually scans channels.
THD SOURCE Selects and configures the internal function generator.
THD MEAS Configures distortion measurements.
STEP Steps through channels; sends a trigger after each channel.
SCAN Scans through channels; sends a trigger after last channel.
DIGITS Changes number of digits of resolution.
RATE Changes reading rate: fast, medium, slow.
EXIT Cancels selection, moves back to measurement display.
ENTER Accepts selection, moves to next choice or back to measurement display.
SHIFT Used to access shifted keys.
LOCAL Cancels GPIB remote mode.
Page 27

2-4 Basic Measurements
3 Shifted operation keys
DELAY Sets user delay between trigger and measurement.
HOLD Holds reading when the selected number of samples is within the selected
LIMITS Sets upper and lower limit values for readings.
ON/OFF Enables/disables limits; selects beeper operation for limit testing.
TEST Selects built-in tests, diagnostics, display test.
CAL Accesses calibration.
SAVE Saves present configuration for power-on user default.
SETUP Restores factory or user default configuration.
CONFIG Selects minimum/maximum channels, timer, and reading count for step/scan.
HALT Turns off step/scan.
GPIB Enables/disables GPIB interface; selects address and language.
RS232 Enables/disables RS-232 interface; selects baud rate, flow control, terminator.
4 Range keys
▲ Moves to higher range; increments digit; moves to next selection.
▼ Moves to lower range; decrements digit; moves to previous selection.
AUTO Enables/disables autorange. SHIFT-AUTO displays the most recent error
5 Annunciators
* (asterisk) Reading being stored.
(diode) Instrument is in diode testing function.
)))
(speaker) Beeper on for continuity or limits testing.
(more) Indicates additional selections are available.
4W 4-wire resistance reading displayed.
AUTO Autoranging enabled.
BUFFER Recalling stored readings.
ERR Questionable reading; invalid cal step.
FAST Fast reading rate.
FILT Digital filter enabled.
HOLD Instrument is in hold mode.
LSTN Instrument addressed to listen over GPIB.
MATH Math function (mX+b, %, dB, dBm) enabled.
MED Medium reading rate.
REAR Reading acquired from rear inputs.
REL Relative reading displayed.
REM Instrument is in GPIB remote mode.
SCAN Instrument is in scan mode.
SHIFT Accessing shifted keys.
SLOW Slow reading rate.
SRQ Service request over GPIB.
STAT Displaying buffer statistics.
STEP Instrument is in step mode.
TALK Instrument addressed to talk over GPIB.
TIMER Timed scans in use.
TRIG Indicates external trigger (front panel, bus, trigger link) selected.
tolerance.
message.
Page 28

Basic Measurements 2-5
6 Input connections
INPUT HI and LO Used for making DC volts, AC volts, 2-wire resistance measurements.
AMPS Used in conjunction with INPUT LO to make DC current and
SENSE
Ω4 WIRE Used with INPUT HI and LO to make 4-wire resistance measure-
HI and LO ments.
AC current measurements. Also holds current input fuse (3A, 250V,
fast blow, 5×20mm).
7 INPUTS
Selects input connections on front or rear panel.
8 Handle
Pull out and rotate to desired position.
Page 29

Fi
2
M
p
2-6 Basic Measurements
Rear panel summary
The rear panel of the Model 2015 is shown in Figure 2-2. This figure includes important
abbreviated information that should be reviewed before operating the instrument.
gure 2-
odel 2015 rear
anel
23 4
1
HI
!
LO
42V PEAK
INPUT
1000V
PEAK
!
INV/PULSE
SOURCE
OUTPUT
PEAK
500V
350V
PEAK
SOURCE
OUTPUT
SENSE
Ω 4W
7
6
1
2
!
FUSE LINE
500 mAT
(SB)
250 mAT
(SB)
3 5
4 6
100 VAC
120 VAC
220 VAC
240 VAC
8
TRIGGER
LINK
7
!
VMC
EXT TRIG
LINE RATING
50, 60Hz
40VA MAX
5
2
1
#2
EXTERNAL TRIGGER INPUT
Trigger Reading
>10µsec
TTL HI
TTL LO
MADE IN
U.S.A.
RS232
(CHANGE IEEE ADDRESS
FROM FRONT PANEL)
6
34
#1
VOLT METER COMPLETE OUTPUT
Reading
Complete
>10µsec
TTL HI
TTL LO
IEEE-488
120
5
Page 30

Basic Measurements 2-7
1 Input connections
INPUT HI and LO Used for making DC volts, AC volts, 2-wire resistance measurements
SENSE
Ω4 WIRE Used with INPUT HI and LO to make 4-wire resistance measurements
and for connecting scanner card.
HI and LO and also for connecting scanner card.
2 TRIGGER LINK
One 8-pin micro-DIN connector for sending and receiving trigger pulses among other
instruments. Use a trigger link cable or adapter, such as Models 8501-1, 8501-2, 8502, 8504.
3 RS-232
Connector for RS-232 operation. Use a straight-through (not null modem) DB-9 cable.
4 IEEE-488
Connector for IEEE-488 (GPIB) operation. Use a shielded cable, such as Models 7007-1 and
7007-2.
5 Power module
Contains the AC line receptacle, power line fuse, and line voltage setting. The Model 2015
can be configured for line voltages of 100V/120V/220V/240VAC at line frequencies of 45Hz
to 66Hz.
6. INV/PULSE SOURCE OUTPUT
A BNC connector that provides an inverted sine wave or pulsed output for exciting
devices under test during distortion measurement or for general purpose use. This
connector also may provide a square wave pulse for triggering or synchronizing other
systems to the SOURCE OUTPUT sine wave.
7 SOURCE OUTPUT
A BNC connector that provides a sine wave output for exciting devices under test during
distortion measurement or for general purpose use.
Page 31

WARNING:NO INTERNAL OPERATOR SERVICABLE PARTS,SERVICE BY QUALIFIED PERSONNEL ONLY.
WARNING:NO INTERNAL OPERATOR SERVICABLE PARTS,SERVICE BY QUALIFIED PERSONNEL ONLY.
CAUTION:FOR CONTINUED PROTECTION AGAINST FIRE HAZARD,REPLACE FUSE WITH SAME TYPE AND RATING.
CAUTION:FOR CONTINUED PROTECTION AGAINST FIRE HAZARD,REPLACE FUSE WITH SAME TYPE AND RATING.
Fi
3
P
2-8 Basic Measurements
Power-up
Line power connection
Follow the procedure below to connect the Model 2015 to line power and turn on the
instrument.
1. Check to see that the line voltage selected on the rear panel (see Figure 2-3) is correct
for the operating voltage in your area. If not, refer to the next procedure, “Setting line
voltage and replacing fuse.”
CAUTION Operating the instrument on an incorrect line voltage may cause damage to
2. Before plugging in the power cord, make sure that the front panel power switch is in the
off (0) position.
3. Connect the female end of the supplied power cord to the AC receptacle on the rear
panel. Connect the other end of the power cord to a grounded AC outlet.
WARNING The power cord supplied with the Model 2015 contains a separate ground
the instrument, possibly voiding the warranty.
wire for use with grounded outlets. When proper connections are made,
instrument chassis is connected to power line ground through the ground
wire in the power cord. Failure to use a grounded outlet may result in
personal injury or death due to electric shock.
gure 2-
ower module
4. Turn on the instrument by pressing the front panel power switch to the on (1) position.
Model 2015
350V
PEAK
SOURCE
OUTPUT
HI
1000V
TRIGGER
PEAK
!
500V
PEAK
LO
SENSE
INPUT
Ω 4W
42V PEAK
INV/PULSE
SOURCE
OUTPUT
3 5
1
4 6
2
!
!
FUSE LINE
100 VAC
500 mAT
120 VAC
(SB)
220 VAC
250 mAT
240 VAC
(SB)
LINK
MADE IN
U.S.A.
RS232
!
VMC
EXT TRIG
LINE RATING
50, 60Hz
40VA MAX
Line Voltage Selector
IEEE-488
(CHANGE IEEE ADDRESS
FROM FRONT PANEL)
120
Fuse
Spring
120
Window
Fuse Holder Assembly
Page 32

Setting line voltage and replacing fuse
A rear panel fuse located next to the AC receptacle protects the power line input of the
instrument. If the line voltage setting needs to be changed or the line fuse needs to be replaced,
perform the following steps.
WARNING Make sure the instrument is disconnected from the AC line and other
equipment before changing the line voltage setting or replacing the line
fuse.
1. Place the tip of a flat-blade screwdriver into the power module by the fuse holder
assembly (see Figure 2-3). Gently push in and to the left. Release pressure on the
assembly and its internal spring will push it out of the power module.
2. Remove the fuse and replace it with the type listed in Table 2-1.
CAUTION For continued protection against fire or instrument damage, only replace
fuse with the type and rating listed. If the instrument repeatedly blows
fuses, locate and correct the cause of the trouble before replacing the fuse.
See the optional Model 2015 Service Manual for troubleshooting
information.
3. If configuring the instrument for a different line voltage, remove the line voltage selector
from the assembly and rotate it to the proper position. When the selector is installed into
the fuse holder assembly, the correct line voltage appears inverted in the window.
4. Install the fuse holder assembly into the power module by pushing it in until it locks in
place.
Basic Measurements 2-9
Table 2-1
Fuse ratings
Line voltage Fuse rating Keithley P/N
100/120V
220/240V
0.5A, 250V, slo-blo, 5 × 20 mm
0.25A, 250V, slo-blo, 5 × 20 mm
FU-71
FU96-4
Page 33

2-10 Basic Measurements
Power-up sequence
On power-up, the Model 2015 performs self-tests on its EPROM and RAM and momentarily
lights all segments and annunciators. If a failure is detected, the instrument momentarily displays
an error message and the ERR annunciator turns on. (Error messages are listed in Appendix B.)
NOTE If a problem develops while the instrument is under warranty, return it to Keithley
If the instrument passes the self-tests, the firmware revision levels are displayed. An example
of this display is:
REV: A01 A02
where: A01 is the main board ROM revision.
NOTE The unit will display USER SETUP during power-up if a user setup has been saved.
After the power-up sequence, the instrument begins its normal display of readings.
Instruments, Inc., for repair.
A02 is the display board ROM revision.
Page 34

High energy circuit safety precautions
To optimize safety when measuring voltage in high energy distribution circuits, read and use
the directions in the following warning.
WARNINGS Dangerous arcs of an explosive nature in a high energy circuit can cause
severe personal injury or death. If the multimeter is connected to a high
energy circuit when set to a current range, low resistance range, or any
other low impedance range, the circuit is virtually shorted. Dangerous
arcing can result even when the multimeter is set to a voltage range if the
minimum voltage spacing is reduced in the external connections.
• When making measurements in high energy circuits, use test leads that
meet the following requirements:
• Test leads should be fully insulated.
• Only use test leads that can be connected to the circuit (e.g., alligator
clips, spade lugs, etc.) for hands-off measurements.
• Do not use test leads that decrease voltage spacing. These diminishes arc
protection and create a hazardous condition.
Use the following sequence when testing power circuits:
Basic Measurements 2-11
1. De-energize the circuit using the regular installed connect-disconnect
device, such as a circuit breaker, main switch, etc.
2. Attach the test leads to the circuit under test. Use appropriate safety
rated test leads for this application.
3. Set the multimeter to the proper function and range.
4. Energize the circuit using the installed connect-disconnect device and
make measurements without disconnecting the multimeter.
5. De-energize the circuit using the installed connect-disconnect device.
6. Disconnect the test leads from the circuit under test.
The maximum common-mode voltage (voltage between INPUT LO and the
chassis ground) is 500V peak. Exceeding this value may cause a breakdown
in insulation, creating a shock hazard.
The maximum common-made voltage (voltage between SOURCE
OUTPUT and the chassis ground, and INV/PULSE SOURCE OUTPUT
and the chassis ground) is 42V peak. Exceeding this value may cause a
breakdown in insulation, creating a shock hazard.
Page 35

2-12 Basic Measurements
Power-on defaults
Power-on defaults are the settings the instrument assumes when it is turned on. The
Model 2015 offers two choices for the settings: factory and user. The power-on default will be
the last configuration you saved. The SAVE and SETUP keys select the two choices of power-on
defaults.
To save present configuration as user settings:
1. Configure the instrument as desired for USER default.
2. Press SHIFT then SAVE.
3. Use the ▲ and ▼ keys to select FACTory or USER.
4. Press ENTER.
NOTE The unit will display USER SETUP during power-up if a user setup has been saved.
To restore factory or user settings:
1. Press SHIFT then SETUP.
2. Use the ▲ and ▼ keys to select FACTory or USER.
3. Press ENTER.
Since the basic measurement procedures in this manual assume the factory defaults, reset the
instrument to the factory settings when following step-by-step procedures. Table 2-2 lists the
factory default settings.
Page 36

Table 2-2
Factory defaults
Setting Factory default
Basic Measurements 2-13
Autozero
Buffer
Continuity
Beeper
Digits
Rate
Threshold
Current (AC and DC)
Digits (AC)
Digits (DC)
Filter
Count
Mode
Range
Relative
Value
Rate (AC)
Rate (DC)
Diode test
Digits
Range
Rate
Distortion
Measurement type
Frequency
Number of harmonics
Units
Shaping filter
Fundamental frequency
Bandpass filter
Low cutoff
State
High cutoff
State
Frequency and Period
Digits
Range
Relative
Value
Rate
Function
On
No effect
On
4H
Fast (0.1 PLC)
10Ω
5½
6½
On
10
Moving average
Auto
Off
0.0
Medium*
Medium (1 PLC)
6½
1mA
Medium (1 PLC)
THD
Auto
2
Percent
None
60Hz
20Hz
Off
50kHz
Off
6½
10V
Off
0.0
Slow (1 sec)
DCV
Page 37

2-14 Basic Measurements
Table 2-2 (cont.)
Factory defaults
Setting Factory default
GPIB
Address
Limits
Beeper
High limit
Low limit
mX+b
Scale factor
Offset
Percent
References
Resistance (2-wire and 4-wire)
Digits
Filter
Count
Mode
Range
Relative
Value
Rate
RS-232
Baud
Flow
Tx term
Scanning
Source output
Sine wave frequency
Sine wave output impedance
Sine wave amplitude
Sine wave channel 2 shape
Temperature
Digits
Filter
Count
Mode
Junction
Temperature
Relative
Value
Rate
Thermocouple
Units
No effect
(16 at factory)
Off
Never
+1
-1
Off
1.0
0.0
Off
1.0
½
On
10
Moving average
Auto
Off
0.0
Medium (1 PLC)
Off
No effect
No effect
No effect
Off
Off
60Hz
50Ω
0.5Vrms with 50Ω impedance
Inverted sine
5½
On
10
Moving average
Simulated
23°C
Off
0.0
Medium (1 PLC)
J
°C
Page 38

Table 2-2 (cont.)
Factory defaults
Setting Factory default
Triggers
Continuous
Delay
Source
Voltage (AC and DC)
dB reference
dBm reference
Digits (AC)
Digits (DC)
Filter
Count
Mode
Range
Relative
Value
Rate (AC)
Rate (DC)
*DETector:BANDwidth 30
On
Auto
Immediate
No effect
75Ω
5½
½
On
10
Moving average
Auto
Off
0.0
Medium*
Medium (1 PLC)
Basic Measurements 2-15
GPIB primary address
The GPIB primary address of the instrument must be the same as the primary address you
specify in the controller’s programming language. The default primary address of the instrument
is 16, but you can set the address to any value from 0 to 30 by using the following step by step
instructions.
1. Press SHIFT then GPIB.
2. Use the ▲ and ▼ keys to select ADDRess. Or, press ENTER. Once you have pressed
ENTER, the unit automatically displays the address selection.
3. Use the and keys to toggle from ADDRess to the numeric entry. Notice the
values are blinking.
4. Use the ▲ and ▼ keys to change the numeric entries to the desired address.
5. Press ENTER.
See Section Four — Remote Operation for more GPIB information.
Warm-up time
The Model 2015 is ready for use as soon as the power-up sequence has completed. However,
to achieve rated accuracy, allow the instrument to warm up for one hour. If the instrument has
been subjected to extreme temperatures, allow additional time for internal temperatures to
stabilize.
Page 39

2-16 Basic Measurements
Display
The display of the Model 2015 is primarily used to display readings, along with the units and
type of measurement. Annunciators are located on the top, bottom, right, and left of the reading
or message display. The annunciators indicate various states of operation. See Figure 2-1 for a
complete listing of annunciators.
Status and error messages
Status and error messages are displayed momentarily. During Model 2015 operation and
programming, you will encounter a number of front panel messages. Typical messages are either
of status or error variety, as listed in Appendix B.
Measuring voltage
The Model 2015 can make DCV measurements from 0.1µV to 1000V and ACV measurements from 0.1µV to 750V RMS, 1000V peak.
Connections
Assuming factory default conditions, the basic procedure is as follows:
1. Connect test leads to the INPUT HI and LO terminals. Either the front or rear inputs can
be used; place the INPUTS button in the appropriate position.
2. Select the measurement function by pressing DCV or ACV.
3. Pressing AUTO toggles autoranging. Notice the AUTO annunciator is displayed with
autoranging. If you want manual ranging, use the RANGE
measurement range consistent with the expected voltage.
4. Connect test leads to the source as shown in Figure 2-4.
WARNING
CAUTION
WARNING
5. Observe the display. If the “OVERFLOW” message is displayed, select a higher range
until a normal reading is displayed (or press AUTO for autoranging). Use the lowest
possible range for the best resolution.
6. Take readings from the display.
Maximum common mode voltage (voltage between LO and chassis ground)
is 500V peak. Exceeding this value may cause a shock hazard.
Do not apply more than 1000V peak to the input or instrument damage
may occur. The voltage limit is subject to the 8
The source and measurement connections are provided with overvoltage
protection rated up to 2500V for 50µs. Do not connect sources that produce
transient voltages greater than 2500V or the protection provided by the
equipment may be degraded.
▲
and ▼ keys to select a
×
107V•Hz product.
Page 40

Fi
4
D
Basic Measurements 2-17
gure 2-
C and AC voltage
measurements
SHIFT
LOCAL
POWER
TALK
LSTN
SRQ
SHIFT
TIMER
MATH
DCV
EX TRIG
SAVE SETUP
SOURCE
THD
Model 2015
CH1REM
STEP CH2 CH3 CH4 CH5 CH6 CH7 CH8 CH9 CH10
SCAN
CONT
Ω2 Ω4
TEST
GPIB
DIGITS RATE
RELFILTER
RS232
CAL
BUFFER
PERIOD TCOUPL
FREQ
EXIT ENTER
HOLD TRIG FAST MED SLOW AUTO ERR
HOLD
TRIG
MEAS
REL FILT
dBm
dB
THD
ACI
ACV
DCI
LIMITS ON/OFFDELAY
STORE
RECALL
CONFIG HALT
STEP SCAN
MATH
REAR
4W
STAT
2015 THD MULTIMETER
TEMP
RANGE
RANGE
SENSE
INPUT
Ω 4 WIRE
HI
350V
PEAK
AUTO
INPUTS
F
FRONT/REAR
1000V
!
PEAK
LO
500V
PEAK
R
3A 250V
AMPS
DC Voltage
Source
Input Resistance = 10MΩ on 1000V and 100V ranges;
> 10GΩ on 10V, 1V and 100mV ranges.
Caution: Maximum Input = 1010V peak
Maximum Common Mode = 500V peak
Model 2015
SENSE
INPUT
Ω 4 WIRE
PEAK
350V
INPUTS
F
FRONT/REAR
HI
1000V
!
PEAK
LO
500V
PEAK
R
3A 250V
AMPS
AC Voltage
Source
CAL
RELFILTER
RS232
MATH
REAR
4W
BUFFER
STAT
2015 THD MULTIMETER
PERIOD TCOUPL
FREQ
TEMP
EXIT ENTER
RANGE
AUTO
RANGE
CH1REM
STEP CH2 CH3 CH4 CH5 CH6 CH7 CH8 CH9 CH10
SCAN
TALK
LSTN
SRQ
SHIFT
TIMER
HOLD TRIG FAST MED SLOW AUTO ERR
MATH
SHIFT
DCV
EX TRIG
SAVE SETUP
SOURCE
HOLD
TRIG
MEAS
THD
LOCAL
POWER
REL FILT
dBm
dB
DCI
LIMITS ON/OFFDELAY
STORE
CONFIG HALT
STEP SCAN
RECALL
CONT
ACI
Ω2 Ω4
TEST
GPIB
DIGITS RATE
THD
ACV
Input Impedance = 1MΩ and 100pF
Caution: Maximum Input = 1000V peak, 8
Maximum Common Mode = 500V peak
Crest factor
AC voltage and current accuracies are affected by the crest factor of the waveform, the ratio
of the peak value to the RMS value. 500Hz is the maximum fundamental frequency at which the
corresponding crest factor must be taken into account for accuracy calculations.
Low level considerations
For sensitive measurements, external considerations beyond the Model 2015 affect the
accuracy. Effects not noticeable when working with higher voltages are significant in microvolt
signals. The Model 2015 reads only the signal received at its input; therefore, it is important that
this signal be properly transmitted from the source. The following paragraphs indicate factors
that affect accuracy, including stray signal pick-up and thermal offsets.
× 107 V•Hz
Page 41

2-18 Basic Measurements
Shielding
AC voltages that are extremely large compared with the DC signal to be measured may
produce an erroneous output. Therefore, to minimize AC interference, the circuit should be
shielded with the shield connected to the Model 2015 INPUT LO (particularly for low level
sources). Improper shielding can cause the Model 2015 to behave in one or more of the
following ways:
• Unexpected offset voltages.
• Inconsistent readings between ranges.
• Sudden shifts in reading.
To minimize pick-up, keep the voltage source and the Model 2015 away from strong AC
magnetic sources. The voltage induced due to magnetic flux is proportional to the area of the
loop formed by the input leads. Therefore, minimize the loop area of the input leads and connect
each signal at only one point.
Thermal EMFs
Thermal EMFs (thermoelectric potentials) are generated by thermal differences between the
junctions of dissimilar metals. These can be large compared to the signal that the Model 2015
can measure. Thermal EMFs can cause the following conditions:
• Instability or zero offset is much higher than expected.
• The reading is sensitive to (and responds to) temperature changes. This effect can be
demonstrated by touching the circuit, by placing a heat source near the circuit, or by a
regular pattern of instability (corresponding to changes in sunlight or the activation of
heating and air conditioning systems).
To minimize the drift caused by thermal EMFs, use copper leads to connect the circuit to the
Model 2015. A banana plug generates a few microvolts. A clean copper conductor such as #10
bus wire is ideal for this application. The leads to the input may be shielded or unshielded, as
necessary. Refer to “Shielding”.
Widely varying temperatures within the circuit can also create thermal EMFs. Therefore,
maintain constant temperatures to minimize these thermal EMFs. A shielded enclosure around
the circuit under test also helps by minimizing air currents.
The REL control can be used to null out constant offset voltages.
NOTE Additional thermals may be generated by the optional scanner cards.
Page 42

Basic Measurements 2-19
AC voltage offset
The Model 2015, at 5½-digits resolution, will typically display 100 counts of offset on AC
volts with the input shorted. This offset is caused by the offset of the TRMS converter. This offset
will not affect reading accuracy and should not be zeroed out using the REL feature. The following equation expresses how this offset (V
) is added to the signal input (VIN):
OFFSET
Displayed reading VIN()2V
()
+=
OFFSET
2
Example: Range = 1VAC
Offset = 100 counts (1.0mV)
Input = 100mV RMS
Displayed reading 100mV()21.0mV()
Displayed reading 0.01V()1106–V×()+=
Displayed reading 0.100005 =
+=
2
The offset is seen as the last digit, which is not displayed. Therefore, the offset is negligible.
If the REL feature were used to zero the display, the 100 counts of offset would be subtracted
from V
, resulting in an error of 100 counts in the displayed reading.
IN
See Section 3 — Measurement Options for information that explain the configuration options
for DC and AC voltage measurements.
Page 43

Fi
5
D
2-20 Basic Measurements
Measuring current
The Model 2015 can make DCI measurements from 10nA to 3A and ACI measurements from
1µAm to 3A RMS.
NOTE See the previous discussion about crest factor in “Measuring voltage” in this section.
Connections
Assuming factory default conditions, the basic procedure is as follows:
1. Connect test leads to the AMPS and INPUT LO terminals. The front inputs must be used;
place the INPUTS button in the FRONT position.
2. Select the measurement function by pressing DCI or ACI.
3. Pressing AUTO toggles autoranging. Notice the AUTO annunciator is displayed with
autoranging. If you want manual ranging, use the RANGE ▲ and ▼ keys to select a
measurement range consistent with the expected current.
4. Connect test leads to the source as shown in Figure 2-5.
CAUTION Do not apply more than 3A, 250V to the input or the AMPS fuse will
open-circuit.
gure 2-
C and AC current
measurements
5. Observe the display. If the “OVERFLOW” message is displayed, select a higher range
until a normal reading is displayed (or press AUTO for autoranging). Use the lowest
possible range for the best resolution.
6. Take readings from the display.
Model 2015
SENSE
INPUT
Ω 4 WIRE
350V
PEAK
INPUTS
F
FRONT/REAR
HI
1000V
!
PEAK
LO
500V
PEAK
R
3A 250V
AMPS
Current
Source
SHIFT
LOCAL
POWER
STEP CH2 CH3 CH4 CH5 CH6 CH7 CH8 CH9 CH10
SCAN
CH1REM
TALK
LSTN
SRQ
SHIFT
TIMER
HOLD TRIG FAST MED SLOW AUTO ERR
MATH
THD
DCV
ACV
HOLD
EX TRIG
TRIG
SAVE SETUP
SOURCE
MEAS
THD
dBm
DCI
LIMITS ON/OFFDELAY
STORE
CONFIG HALT
STEP SCAN
RECALL
REL FILT
dB
CONT
ACI
Ω2 Ω4
TEST
GPIB
DIGITS RATE
CAL
RELFILTER
RS232
MATH
REAR
4W
BUFFER
STAT
2015 THD MULTIMETER
PERIOD TCOUPL
FREQ
TEMP
EXIT ENTER
Caution: Maximum Input = 3A DC or RMS
RANGE
AUTO
RANGE
Page 44

AMPS fuse replacement
WARNING Make sure the instrument is disconnected from the power line and other
equipment before replacing the AMPS fuse.
1. Turn off the power and disconnect the power line and test leads.
2. From the front panel, gently push in the AMPS jack with your thumb and rotate the fuse
carrier one-quarter turn counter-clockwise. Release pressure on the jack and its internal
spring will push the jack out of the socket.
3. Remove the fuse and replace it with the same type (3A, 250V, fast blow, 5 × 20mm). The
Keithley part number is FU-99-1.
CAUTION Do not use a fuse with a higher current rating than specified or instrument
damage may occur. If the instrument repeatedly blows fuses, locate and correct the cause of the trouble before replacing the fuse. See the Model 2015
Service Manual for troubleshooting information.
4. Install the new fuse by reversing the procedure above.
See Section 3 — Measurement Options for information that explains the configuration
options for DC and AC current measurements.
Basic Measurements 2-21
Page 45

2-22 Basic Measurements
Measuring resistance
The Model 2015 can make 2-wire and 4-wire resistance measurements from 100µΩ to
120MΩ.
Connections
Assuming factory default conditions, the basic procedure is as follows:
1. Connect test leads to the Model 2015 as follows:
A. For Ω2-wire, connect the test leads to INPUT HI and LO.
B. For Ω4-wire, connect the test leads to INPUT HI and LO, and SENSE Ω4 WIRE
HI and LO. Recommended Kelvin test probes include the Keithley Models 5805
and 5806. Either the front or rear inputs can be used; place the INPUTS button in
the appropriate position.
2. Select the measurement function by pressing Ω2 or Ω4.
3. Pressing AUTO toggles autoranging. Notice the AUTO annunciator is displayed with
autoranging. If you want manual ranging, use the RANGE ▲ and ▼ keys to select a
measurement range consistent with the expected resistance.
4. Connect test leads to the resistance as shown in Figure 2-6.
CAUTION Do not apply more than 1000V peak between INPUT HI and LO or
instrument damage may occur.
5. Observe the display. If the “OVERFLOW” message is displayed, select a higher range
until a normal reading is displayed. Use the lowest possible range for the best resolution.
6. Take a reading from the display.
Page 46
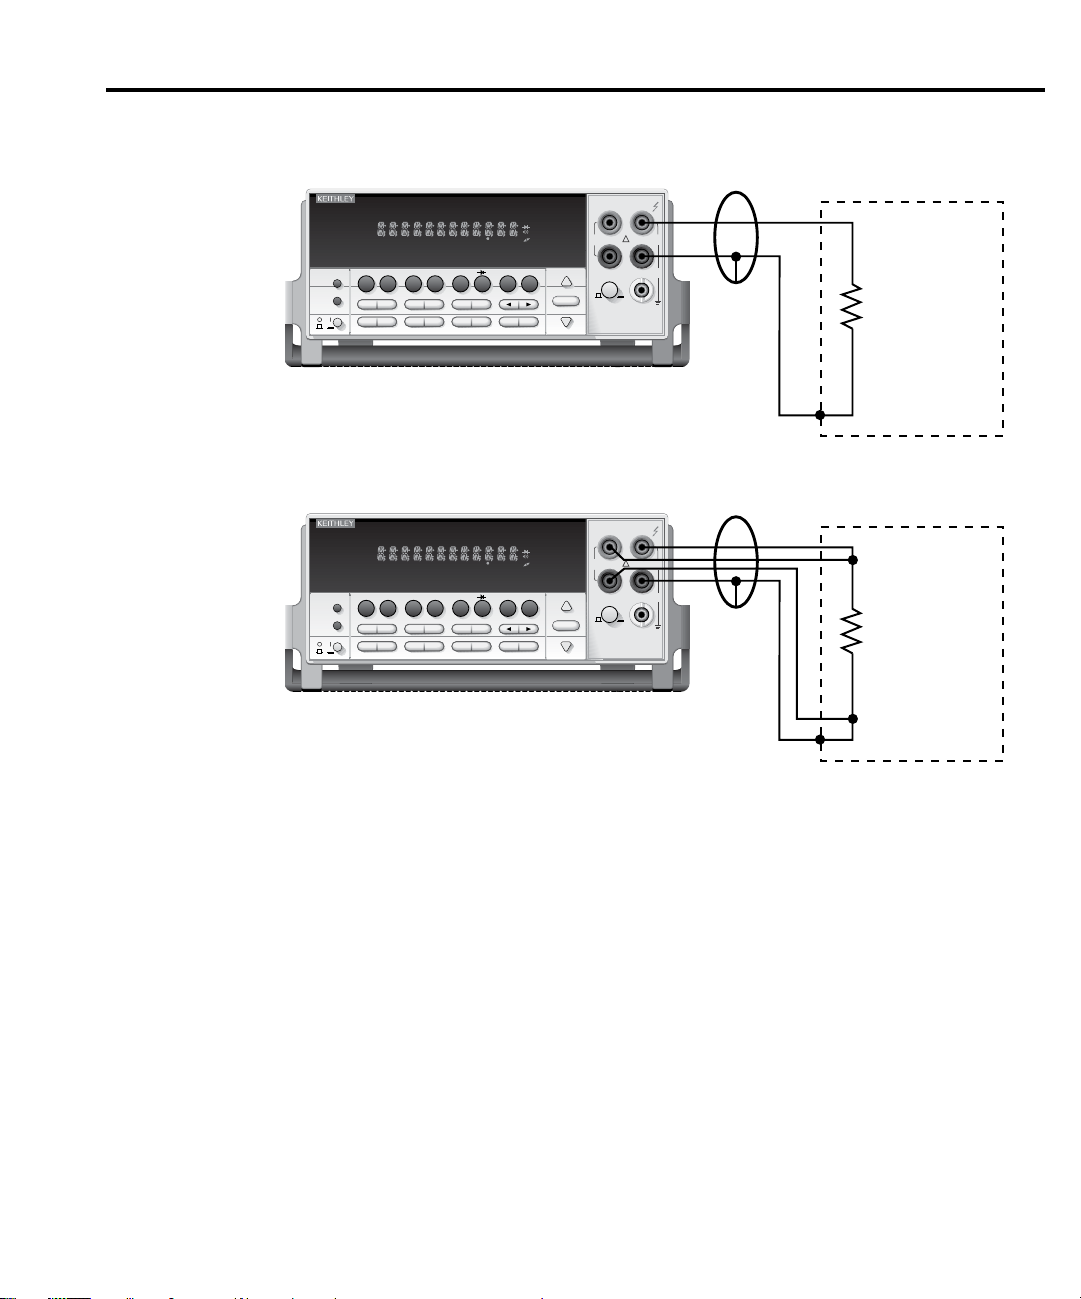
Basic Measurements 2-23
Figure 2-6
Two- and fourwire resistance
measurements
Model 2015
SENSE
LOCAL
POWER
STEP CH2 CH3 CH4 CH5 CH6 CH7 CH8 CH9 CH10
SCAN
TALK
LSTN
SRQ
SHIFT
TIMER
HOLD TRIG FAST MED SLOW AUTO ERR
MATH
DCV
EX TRIG
SAVE SETUP
SOURCE
THD
ACV
HOLD
TRIG
MEAS
THD
SHIFT
CH1REM
dBm
DCI
LIMITS ON/OFFDELAY
STORE
CONFIG HALT
STEP SCAN
RECALL
REL FILT
dB
ACI
CONT
Ω2 Ω4
TEST
GPIB
DIGITS RATE
CAL
RELFILTER
RS232
STAT
2015 THD MULTIMETER
PERIOD TCOUPL
FREQ
TEMP
EXIT ENTER
MATH
REAR
4W
BUFFER
RANGE
AUTO
RANGE
Ω 4 WIRE
350V
PEAK
INPUTS
F
R
FRONT/REAR
Note: Source current flows from the INPUT HI to
INPUT LO terminals.
Model 2015
SENSE
LOCAL
POWER
STEP CH2 CH3 CH4 CH5 CH6 CH7 CH8 CH9 CH10
SCAN
TALK
LSTN
SRQ
SHIFT
TIMER
HOLD TRIG FAST MED SLOW AUTO ERR
MATH
DCV
EX TRIG
SAVE SETUP
SOURCE
THD
ACV
HOLD
TRIG
MEAS
THD
SHIFT
CH1REM
dBm
DCI
LIMITS ON/OFFDELAY
STORE
CONFIG HALT
STEP SCAN
RECALL
MATH
REAR
CAL
RELFILTER
RS232
4W
BUFFER
STAT
2015 THD MULTIMETER
PERIOD TCOUPL
FREQ
TEMP
EXIT ENTER
REL FILT
dB
CONT
ACI
Ω2 Ω4
TEST
GPIB
DIGITS RATE
RANGE
AUTO
RANGE
Ω 4 WIRE
350V
PEAK
INPUTS
F
R
FRONT/REAR
Note: Source current flows from the INPUT HI to
INPUT LO terminals.
Shielded
Cable
INPUT
HI
1000V
!
PEAK
LO
500V
PEAK
3A 250V
AMPS
Optional Shield
Resistance
Under Test
Shielded
Cable
INPUT
HI
1000V
!
PEAK
LO
500V
PEAK
3A 250V
AMPS
Optional Shield
Resistance
Under Test
Shielding
resistance in a shielded enclosure and connect the shield to the INPUT LO terminal of the
instrument electrically.
for 2-wire and 4-wire resistance measurements.
To achieve a stable reading, it helps to shield resistances greater than 100kΩ. Place the
See Section 3—Measurement Options for information that explains the configuration options
Page 47

2-24 Basic Measurements
Measuring frequency and period
The Model 2015 can make frequency measurements from 3Hz to 500kHz on voltage ranges
of 100mV, 1V, 10V, 100V, and 750V. Period measurements can be taken from 2µs to 333ms on
the same voltage ranges as the frequency.
The instrument uses the volts input terminals to measure frequency. The AC voltage range can
be changed with the RANGE ▲ and ▼ keys. The signal voltage must be greater than 10% of
the full-scale range.
CAUTION The voltage limit is subject to the 8 × 10
Trigger level
Frequency and Period use a zero-crossing trigger, meaning that a count is taken when the
frequency crosses the zero level. The Model 2015 uses a reciprocal counting technique to
measure frequency and period. This method generates constant measurement resolution for any
input frequency. The multimeter’s AC voltage measurement section performs input signal
conditioning.
Gate time
The gate time is the amount of time the Model 2015 uses to sample frequency or period
readings. The RATE key setting yields gate times as follows:
FAST = 0.01s
MEDium = 0.1s
SLOW = 1.0s
The Model 2015 completes a reading when it receives its first zero-crossing after the gate
time expires. In other words, the reading is completed 1/2 cycle after the gate time has expired.
For example, with a 1sec gate time to sample a 3Hz frequency, you may wait up to 3 seconds
before the Model 2015 returns a reading.
7
V•Hz product.
Page 48

Connections
Fi
7
F
Assuming factory default conditions, the basic procedure is as follows:
1. Connect test leads to the INPUT HI and LO terminals of the Model 2015. Either the front
2. Select the FREQ or PERIOD function.
3. Connect test leads to the source as shown in Figure 2-7.
CAUTION Do not exceed 1000V peak between INPUT HI and INPUT LO or
4. Take a reading from the display.
See Section 3—Measurement Options for information that explains the configuration options
for frequency and period measurements.
Basic Measurements 2-25
or rear inputs can be used; place the INPUTS button in the appropriate position.
instrument damage may occur.
gure 2-
requency and period
measurements
SHIFT
LOCAL
POWER
MATH
DCV
EX TRIG
SOURCE
Model 2015
STEP CH2 CH3 CH4 CH5 CH6 CH7 CH8 CH9 CH10
SCAN
CH1REM
TALK
LSTN
SRQ
SHIFT
TIMER
HOLD TRIG FAST MED SLOW AUTO ERR
THD
ACV
HOLD
TRIG
SAVE SETUP
MEAS
THD
dBm
DCI
LIMITS ON/OFFDELAY
STORE
CONFIG HALT
STEP SCAN
RECALL
REL FILT
dB
CONT
ACI
Ω2 Ω4
TEST
RS232
GPIB
DIGITS RATE
CAL
RELFILTER
MATH
REAR
4W
BUFFER
STAT
2015 THD MULTIMETER
PERIOD TCOUPL
FREQ
TEMP
EXIT ENTER
RANGE
AUTO
RANGE
350V
PEAK
SENSE
Ω 4 WIRE
INPUTS
F
FRONT/REAR
INPUT
HI
1000V
!
PEAK
LO
500V
PEAK
R
3A 250V
AMPS
AC Voltage
Source
Input Impedance = 1MΩ in parallel with <100pF
Caution: Maximum Input = 1000V peak, 8
× 107 V•Hz
Page 49

Fi
8
2-26 Basic Measurements
Measuring temperature
The Model 2015 measures temperature with thermocouples. The temperature measurement
ranges available depend on the type of thermocouple chosen.
Thermocouples can be connected to an external thermocouple card, such as a Model 7057A,
7402, or 7014 installed in a Model 7001 or 7002 Switch System (Figure 2-8).
Connections
gure 2-
Thermocouple temperature measurements
POWER
TALK
LSTN
SRQ
SHIFT
TIMER
MATH
SHIFT
DCV
LOCAL
EX TRIG
SAVE SETUP
SOURCE
Note: This thermocouple card must be inserted into a
Keithley Model 7001 or 7002 Switch System.
Model 2015
CH1REM
STEP CH2 CH3 CH4 CH5 CH6 CH7 CH8 CH9 CH10
SCAN
HOLD TRIG FAST MED SLOW AUTO ERR
REL FILT
dBm
dB
CONT
THD
ACI
ACV
Ω2 Ω4
DCI
HOLD
LIMITS ON/OFFDELAY
TEST
STORE
CONFIG HALT
STEP SCAN
CAL
RECALL
RELFILTER
RS232
GPIB
DIGITS RATE
TRIG
MEAS
THD
MATH
REAR
BUFFER
STAT
2015 THD MULTIMETER
PERIOD TCOUPL
FREQ
EXIT ENTER
SENSE
Ω 4 WIRE
4W
TEMP
HI
350V
PEAK
LO
INPUTS
F
R
RANGE
AUTO
FRONT/REAR
RANGE
Input
INPUT
!
3A 250V
AMPS
HI
1000V
PEAK
500V
PEAK
Input
LO
Cable
Clamp
Out HI
Out LO
THERMOCOUPLE SCANNER
CH4
CH5
CH6
OUTPUT
CH10
CH9
H L
CH 9
CH3
CH8
H L
CH 8
CH2
CH7
HI HILO LO
GUARD
Page 50

Math
Basic Measurements 2-27
Configuration
The following information explains the various configuration options for temperature
measurements. To select and configure the thermocouple measurement:
Press SHIFT then TCOUPL. Three choices are available using the ▲ and ▼ keys:
• UNITS — C, K, F (Centigrade, Kelvin, Fahrenheit). This parameter selects the displayed
units for temperature measurements.
• TYPE — J, K, T (thermocouple type).
• JUNC — SIM. Typically, a thermocouple card uses a single reference junction. The
Model 2015 simulates a reference junction temperature. Typical reference junction
temperatures are 0°C and 23°C.
A simulated reference temperature is the temperature of the junction where the thermocouple
voltage is sensed. It is room temperature if the thermocouple wire is terminated to banana jacks
and corrected directly to the multimeter. The accuracy of a temperature measurement depends
on the accuracy of the reference junction.
Model 2015 math operations are divided into four categories:
• mX+b and percent
• dBm and dB calculations
• Statistics of buffered readings
• Limit testing
The first two categories are discussed here; buffered reading statistics and reading limit
testing are described in Section 3 — Measurement Options.
The procedure to select and configure a math operation is summarized as follows:
1. Press SHIFT then the appropriate math key.
2. Configure the parameters for the math operation. Press ENTER when done. (Press
SHIFT then the related math function to end the calculation.)
NOTES Once enabled for a function, the mX+b and percentage calculations are in effect
across function changes.
The Model 2015 uses IEEE-754 floating point format for math calculations.
Page 51

2-28 Basic Measurements
MX + B
This math operation lets you manipulate normal display readings (X) mathematically
according to the following calculation:
Y= mX + b
where: X is the normal display reading
m and b are user-entered constants for scale factor and offset
Y is the displayed result
Configuration
To configure the mX+b calculation, perform the following steps:
1. Press SHIFT then MATH to display a math calculation. Use the ▲ and ▼ keys to select
MX+B.
2. Press ENTER to display the present scale factor:
M: +1.000000 ^
3. Enter a value and units prefix. Use the and keys to choose a numerical place and
use the ▲ and ▼ keys to increment or decrement the digits.
4. Press ENTER to confirm the M value and display the B value:
B: +00.00000 m
5. Enter a value and units prefix.
6. Press ENTER to confirm the B value and display the UNITS designation:
MXB
7. Scroll through the letters to change and press ENTER when done.
The Model 2015 then displays the result of the calculation.
Page 52

Percent
Basic Measurements 2-29
This item selects the percentage calculation and lets you specify a reference value. The
displayed reading will be expressed as a percent deviation from the reference value. The
percentage calculation is performed as follows:
Input - Reference
Percent
where: Input is the normal display reading.
Reference is the user entered constant.
Percent is the displayed result.
------------------------------------------
Reference
100%×=
Configuration
To configure the percent calculation, perform the following steps:
1. Press SHIFT then MATH to display a math calculation. Use the ▲ and ▼ keys to select
PERC.
2. Press ENTER to display the present value:
REF:+1.000000^
3. Enter a reference sign, value, and units prefix. Use the and keys to choose a
numerical place and use the ▲ and ▼ keys to increment or decrement the digits.
4. Press ENTER when done.
The Model 2015 will display the result of the calculation. The result is positive when the input
exceeds the reference and negative when the input is less than the reference. Engineering units
are used to show values in the range 1 nano to 1000G. Exponential notation is used above that
range.
Page 53

2-30 Basic Measurements
dBm calculation
dBm is defined as decibels above or below a 1mW reference. With a user-programmable
reference impedance, the Model 2015 reads 0dBm when the voltage needed to dissipate 1mW
through the reference impedance is applied. The relationship between dBm, a reference
impedance, and the voltage is defined by the following equation:
dBm = 10 log
2
/Z
V
REF
IN
--------------------------------1mW
Where: V
is the DC or AC input signal.
IN
is the specified reference impedance.
Z
REF
NOTE Do not confuse reference impedance with input impedance. The input impedance of
the instrument is not modified by the dBm parameter.
If a relative value is in effect when dBm is selected, the value is converted to dBm then REL
is applied to dBm. If REL is applied after dBm has been selected, dBm math has REL applied
to it.
Configuration
To set the reference impedance, perform the following steps:
1. After selecting dBm, the present reference impedance is displayed (1-9999Ω):
REF: 0000
2. To change the reference impedance, use the and keys to select the numeric
position. Then use the ▲ and ▼ keys to select the desired value. Be sure to press ENTER
after changing the reference impedance.
NOTES dBm is valid for positive and negative values of DC volts.
The mX+b and percent math operations are applied after the dBm or dB math. For
example, if mX+b is selected with m=10 and b=0, the display will read 10.000 MXB
for a 1VDC signal. If dBm is selected with Z
= 50Ω, the display will read 130MXB.
REF
Page 54

dB calculation
Expressing DC or AC voltage in dB makes it possible to compress a large range of
measurements into a much smaller scope. The relationship between dB and voltage is defined
by the following equation:
dB= 20 log
V
IN
-----------------V
REF
Basic Measurements 2-31
where: V
is the DC or AC input signal.
IN
is the specified voltage reference level.
V
REF
The instrument will read 0dB when the reference voltage level is applied to the input.
If a relative value is in effect when dB is selected, the value is converted to dB then REL is
applied to dB. If REL is applied after dB has been selected, dB has REL applied to it.
Configuration
To set the reference voltage, perform the following steps:
1. After selecting dB, the present reference voltage level is displayed:
REF: +0.000000
2. To change the reference level, use the and keys to select the numeric position.
Then use the ▲ and ▼ keys to select the desired value. Be sure to press ENTER after
changing the reference voltage.
NOTES The dB calculation takes the absolute value of the ratio V
The largest negative value of dB is -160dB. This will accommodate a ratio of
= 1µV and V
V
IN
= 1000V.
REF
/ V
IN
REF
Page 55

Fi
9
C
2-32 Basic Measurements
Measuring continuity
The Model 2015 uses the 1kΩ range to measure circuit continuity. After selecting continuity,
the unit prompts you for a threshold resistance level (1Ω-1000Ω). The Model 2015 alerts you
with a beep when a reading is below the set level.
To measure the continuity of a circuit, press SHIFT then CONT, set the threshold resistance
level and connect the circuit.
NOTE Continuity has a non-selectable reading rate of FAST (0.1 PLC).
Connections
Connect the circuit you want to test to the INPUT HI and INPUT LO terminals of the
Model 2015. The test current flows from the INPUT HI as shown in Figure 2-9.
gure 2-
ontinuity measurements
Threshold resistance level
these steps to define the resistance level:
Model 2015
SENSE
INPUT
Ω 4 WIRE
350V
PEAK
INPUTS
F
FRONT/REAR
HI
1000V
!
PEAK
LO
500V
PEAK
R
3A 250V
AMPS
Resistance
Under Test
SHIFT
LOCAL
POWER
STEP CH2 CH3 CH4 CH5 CH6 CH7 CH8 CH9 CH10
SCAN
CH1REM
TALK
LSTN
SRQ
SHIFT
TIMER
HOLD TRIG FAST MED SLOW AUTO ERR
MATH
THD
DCV
ACV
HOLD
EX TRIG
TRIG
SAVE SETUP
SOURCE
MEAS
THD
dBm
DCI
LIMITS ON/OFFDELAY
STORE
CONFIG HALT
STEP SCAN
ACI
RECALL
REL FILT
dB
CONT
Ω2 Ω4
TEST
GPIB
DIGITS RATE
CAL
RELFILTER
RS232
MATH
REAR
4W
BUFFER
STAT
2015 THD MULTIMETER
PERIOD TCOUPL
FREQ
TEMP
EXIT ENTER
RANGE
AUTO
RANGE
Note: Source current flows from the INPUT
HI to INPUT LO terminals.
You can define a threshold resistance from 1Ω to 1000Ω. The factory setting is 10Ω. Follow
1. Press SHIFT then CONT.
2. Use the and keys to choose a numerical place and use the ▲ and ▼ keys to
increment or decrement the digits. Enter a value from 1 to 1000.
3. Press ENTER to confirm your setting.
Page 56

Testing diodes
Fi
10
D
With a Model 2015, you can measure the forward voltage drop of general-purpose diodes and
the zener voltage of zener diodes. To test diodes, press SHIFT then , set the test current
range, connect the diode, and take a reading from the display.
NOTE Diode test has a non-selectable reading rate of MEDium (1 PLC).
Connections
Connect the diode leads to the INPUT HI and INPUT LO terminals on the Model 2015. The
test current flows from the INPUT HI terminal as shown in Figure 2-10.
Basic Measurements 2-33
gure 2-
iode testing
Range
Model 2015
SENSE
INPUT
Ω 4 WIRE
350V
PEAK
INPUTS
F
FRONT/REAR
HI
1000V
!
PEAK
LO
500V
PEAK
R
3A 250V
AMPS
SHIFT
LOCAL
POWER
STEP CH2 CH3 CH4 CH5 CH6 CH7 CH8 CH9 CH10
SCAN
CH1REM
TALK
LSTN
SRQ
SHIFT
TIMER
HOLD TRIG FAST MED SLOW AUTO ERR
MATH
DCV
HOLD
EX TRIG
TRIG
SAVE SETUP
SOURCE
MEAS
THD
REL FILT
dBm
dB
DCI
LIMITS ON/OFFDELAY
STORE
CONFIG HALT
STEP SCAN
RECALL
CONT
ACI
Ω2 Ω4
TEST
GPIB
DIGITS RATE
THD
ACV
CAL
RELFILTER
RS232
MATH
REAR
4W
BUFFER
STAT
2015 THD MULTIMETER
PERIOD TCOUPL
FREQ
TEMP
EXIT ENTER
RANGE
AUTO
RANGE
Note: Source current flows from the INPUT HI to INPUT LO terminals.
General-Purpose
Diode
Zener
Diode
You can set the test current range from the front panel. The choices are 1mA, 100µA, and
10µA. The factory test current setting is 1mA. To set the test current, do following:
1. Press SHIFT then .
2. Use the ▲ and ▼ keys to scroll through the three test current selections.
The diode test measures voltages on the 3V range for the 1mA test current and the 10V range
for the 100µA and 10µA ranges. If a reading is more than 10V, the Model 2015 displays the
“OVERFLOW” status message.
Page 57

2-34 Basic Measurements
Measuring distortion
The Model 2015 can make distortion measurements from 0.002% to 100% (-94dB to 0dB).
The 2015 uses a digital signal processor (DSP) to perform a fast Fourier transform on the signal
applied to the front or rear voltage inputs. It then analyzes the levels of the harmonics present in
the signal to calculate THD, THD+noise, and SINAD. A direct digital synthesis module
included in the distortion circuitry provides a programmable sine source. The source has a
second output that can provide the inverse of the sine output (shifted 180˚), or output 0-5V logic
level pulses in phase with the main output. Distortion measurement types are explained below:
• THD — Total harmonic distortion is the default distortion measurement type. It is
expressed in percent or dB. The measurement is calculated as follows:
… h
2
i
where h
2
++ +
h
2
-------------------------------------------------------------------
is magnitude of the ith harmonic and f is the magnitude of the fundamental wave-
i
2
2
h
h
4
3
f
form.
• THD+n — This is total harmonic distortion plus noise. It is what conventional (analog)
THD meters display. A conventional THD meter has a notch filter that removes the
fundamental frequency from the signal, and measures THD based on what remains. This
includes all of the harmonics, but also includes any random noise in the signal. Since the
Model 2015 uses a DSP to perform a Fourier transform on the signal, noise can be
eliminated from the distortion measurement, thus providing a true reading. This
measurement is expressed in percent or dB, and is calculated as follows:
2
h
2
-----------------------------------------------------------------------------------
2
2
h
h
4
3
… h
f
2
1024
n++ + +
where h is the harmonic, n is the noise, and f is the magnitude of the fundamental waveform.
• SINAD — This is another way of expressing THD+noise. It is the RMS magnitude of
the signal divided by the RMS magnitude of the difference between the signal and the
fundamental. This measurement is expressed only in dB. The calculation is as follows:
… h
2
h
4
2
1024
… h
2
1024
2
h
++ + ++
2
--------------------------------------------------------------------------------------------------------
2
h
2
2
2
h
h
4
3
2
h
++ + +
3
n2f
n
2
2
where h is the harmonic, n is the noise, and f is the magnitude of the fundamental waveform.
The digital averaging filter (moving or repeating) can be used with distortion measurements.
The RATE key has no effect on distortion measurements, because there is no NPLC setting.
NOTE The Rel key is not supported for distortion measurements.
Page 58

Configuration
These configuration options are presented in the order commonly used to make a distortion
measurement. The SCPI commands are generic; actual syntax depends on the test programming
language used. Factory defaults are assumed.
Select the function
From the front panel, select the measurement function by pressing SHIFT then THD. For
remote operation, send the command:
:SENSe:FUNCtion 'DISTortion' ;select distortion measurement function
Set the distortion measurement type
1. Press THD-MEAS and the display shows "TYPE: THD".
2. Use the right cursor to highlight the type selection, then use the ▲ and ▼ keys to select
THD, THD+N, or SINAD.
3. Press ENTER, then press EXIT.
For remote operation, send the command:
:SENSe:DISTortion:TYPE THD|THDN|SINAD ;select THD, THD+n, or SINAD
Set the distortion frequency acquisition
Basic Measurements 2-35
The Model 2015 must know the fundamental frequency of the input waveform. Even a
difference of a few hertz can cause large errors. The choices are AUTO, SET, and ACQUIRE.
AUTO acquires the frequency before each distortion reading. This slows down the reading rate,
but it is useful if the source frequency is unknown or unstable. ACQUIRE takes a frequency
measurement once and uses it for distortion measurements. SET allows you to select a frequency
between 20 and 20kHz (60Hz is default). AUTO or ACQUIRE are recommended instead of SET,
as the programmed frequency of the external source may not be accurate.
1. Press THD-MEAS.
2. Press ENTER once and the display shows "FREQ: AUTO".
3. Use the cursor keys to select AUTO, SET, or ACQUIRE. (The source must be connected
and turned on for ACQUIRE.)
4. Press ENTER. If SET was selected, you are prompted for the frequency to be used. Use
the cursor keys and press ENTER to select it.
5. Press EXIT.
The following commands set the distortion frequency acquisition:
:SENSe:DISTortion:FREQuency:ACQuire ;acquire the frequency once
:SENSe:DISTortion:FREQuency:AUTO ON|OFF ;turn AUTO on or off
:SENSe:DISTortion:FREQuency xxxxx.xxx ;set frequency in hertz
Page 59

2-36 Basic Measurements
Set number of highest harmonic
This option sets the number (n) of the highest harmonic included in the distortion calculation,
where "n" is between 2 and 64 (2 is default). For example, the harmonic with a frequency twice
that of the fundamental is the second harmonic (n=2). This function acts as a brick-wall, lowpass filter. It has an upper limit of 50kHz or 64 times the fundamental frequency, whichever is
lower. This option has no effect in the THD+n or SINAD modes.
1. Press THD-MEAS.
2. Press ENTER until the display shows "UPPR HARM: 02".
3. Set the number of the highest harmonic using the cursor keys.
4. Press ENTER, then press EXIT.
Use this remote command:
:SENSe:DISTortion:HARMonic xx ;set number of highest harmonic
Set measurement units
For the THD and THD+n modes, the measurement units can be percent or dB. SINAD is
always displayed as dB.
1. Press THD-MEAS.
2. Press ENTER until the display shows "UNITS: PERC".
3. Select PERC or dB using the cursor keys.
4. Press ENTER, then EXIT.
For remote operation, use this command:
:UNIT:DISTortion PERCent|DB ;select percent or dB for units
Select shaping filter
The Model 2015 has digital shaping filters to simulate having the sample signal pass through
various types of telephone lines. The filter is turned off by default (NONE).
1. Press THD-MEAS.
2. Press ENTER until the display shows "SFIL: NONE".
3. Select NONE, C (C message weighting), CCITT, CCIRARM, A (A weighting), or CCIR
using the cursor keys.
4. Press ENTER.
For remote operation, use this command:
:SENSe:DISTortion:SFILter NONE|C|CCITT|CCIRARM|A|CCIR ;select shaping filter
Set the voltage range
The Model 2015 defaults to autoranging for the voltage input range. If you prefer manual
ranging, use the lowest possible range for the signal level. Not using the appropriate range
causes inaccurate readings, or the display may show "OVRFLW" or "UDRFLW."
Page 60

Basic Measurements 2-37
While the 2015 is measuring distortion, press the manual range keys. The display shows the
new range briefly. Press AUTO for autoranging. For remote operation, use these commands:
:SENSe:DISTortion:RANGe xxx.xx ;set range based on parameter
:SENSe:DISTortion:RANGe:AUTO ON|OFF ;turn autoranging on or off
Configure the internal function generator
The Model 2015 has a 10Hz-20kHz (60Hz default) two-channel function generator. It can be
used to evaluate amplifiers, filters or other devices, or can be connected to the 2015 inputs. The
function generator has selectable output impedances of 50Ω, 600Ω, and HIZ (50Ω default), and
is unbalanced (coaxial). Its amplitude is 0-2Vrms for 50Ω and 600Ω (0.5Vrms default), and
0-4Vrms for HIZ (1.0Vrms default). A second output provides an inverted sine (opposite in
phase to the main output), or a 0-5V logic level pulse in phase with the main output and having
the same frequency.
NOTE The output impedance needs to be set before the amplitude. The impedance of the
second output reflects the impedance of the main output.
The only difference between 50Ω and HIZ is that the requested output voltage is corrected
for the actual load. For example, if 1.5V is requested:
1. With 50Ω selected and a 50Ω load, the result is 1.5V (correct).
2. With HIZ selected and a high impedance load, the result is 1.5V (correct).
3. With HIZ selected and a 50Ω load, the result is 0.75V (half of expected).
4. With 50Ω selected and a high impedance load, the result is 3.0V (twice expected).
5. With 50Ω selected and a 25Ω load, the result is 1.0V (incorrect for either 50Ω or high
impedance).
From the front panel:
1. Press THD-SOURCE and the display shows "SINE OUT: OFF".
2. Use the cursor keys to select ON, then press ENTER.
3. When the display shows "FREQ: 00.0600k", use the cursor keys to select the frequency
(.01 to 20k), then press ENTER.
4. When the display shows "IMPEDANCE: 50", use the cursor keys to select 50, HIZ, or
600, then press ENTER.
5. When the display shows "AMPL: 0.5000V", use the cursor keys to set the amplitude
(0 to 2V for 50Ω and 600Ω, 0 to 4V for HIZ), then press ENTER.
6. When the display shows "CHAN2: ISINE", use the cursor keys to select ISINE (inverted
sine) or PULSE (square wave), then press ENTER.
For remote operation:
:OUTPut ON|OFF ;turn output on or off
:OUTPut:FREQuency xxxxx.xxx ;set frequency of source
:OUTPut:IMPedance OHM50|OHM600|HIZ ;set output impedance
:OUTPut:AMPLitude x.xxx ;set amplitude of source
:OUTPut:CHANnel2:SHAPe ISINE|PULSE ;set Channel 2 waveform
Page 61

2-38 Basic Measurements
Retrieve magnitude of individual harmonic
(remote operation only)
The 2015 can return the levels of individual harmonics (relative to the level of the
fundamental, in dB). The parameters for this command are the starting and ending harmonics.
Specify 2,3 for the second and third harmonics, or 2,2 for the second harmonic. The harmonic
levels returned correspond to the last triggered reading, and the unit has to be set for one-shot
readings (:INIT:CONT OFF). For remote operation, send this command:
:SENSe:DISTortion:HARMonic:MAGNitude? xx,xx ;query individual harmonic levels
Retrieve RMS volts, THD+n, or THD for an acquired reading
(remote operation only)
Once a single reading has been triggered, the corresponding RMS volts value, THD+noise
value, or THD value can be read for the same set of data, regardless of what distortion mode is
set. SINAD can be calculated from the THD+noise reading. Note that the following commands
only work if the unit is set to trigger one reading at a time (:INIT:CONT OFF). Errors occur if
the unit is continuously updating.
:SENSe:DISTortion:RMS? ;return the calculated RMS volts value for the last
:SENSe:DISTortion:THD? ;return the THD+noise reading for the last triggered
:SENSe:DISTortion:THDN? ;return the THD reading (number of harmonics depends
triggered reading
reading
on the last setting of harmonic number)
Querying the RMS volts value in the distortion mode with :sens:dist:rms? may yield a reading
slightly different from a reading in AC volts mode. This is because of the differences in how the
two modes make the measurement.
Page 62

Basic Measurements 2-39
Configuring and using the internal sweep
(remote operation only)
The Model 2015's internal source can be set to sweep up to 200 frequencies and then return
the distortion and/or RMS volts for each frequency. Sweep results can be returned using the
SREAL data format (fastest—IEEE754 single precision), DREAL data format (IEEE754
double precision), or in ASCII (default). The sweep uses the present distortion measurement
settings and must be allowed to complete before requesting the data (otherwise the data will be
incomplete). Sweep end can be detected by reading bit 3 of the Operation Event register
(:stat:oper?) which is set to 1 at the end of a sweep. Bit 3 of the Operation Event register can
also be used to trigger a service request when the sweep is completed.
The output sweep can only be performed in distortion mode. When performing a sweep, use
SET mode for the distortion frequency acquisitions mode for maximum speed (remote command is :sens:dist:freq:auto off).
NOTE Do not place the unit in autorange mode while sweeping. A value of +812 (Not
permitted in autorange) will be returned if this command is issued while in autorange
mode. Refer to Appendix B for a complete list of status and error messages.
:OUTPut:LIST:MODE LIST ;Sets single frequency or sweep mode
:OUTPut:LIST <ampl1>, <freq1>, <ampl2>, <freq2>… ;Creates a sweep list (50 points
max)
:OUTPut:LIST:APPend: <ampl#x>, <freq#x> ;Adds additional points to the existing
sweep list (change trigger count to match
number of points)
:OUTPut:LIST:ELEMents DIST,AMPL ;Selects data to be returned (distortion,
RMS volts, or both)
:OUTPut:LIST:DELay xxx.xxx ;Sets the source delay time (the time
between setting the source and taking the
measurement) in seconds
:TRIGger:COUNt xx ;Sets the number of measurements to make
during the sweep; must equal the number
of sweep points
:OUTPut ON ;Output must be on before starting sweep
:INIT ;Starts the sweep
:OUTPut:LIST:DATA? ;Returns the list of sweep data in the format
<dist1>, <ampl1>, <dist2>,… (dependent
on data elements selected)
Page 63

2-40 Basic Measurements
Configuring high and low cutoff filters
(remote operation only)
The Model 2015 includes low and high cutoff filters used to limit the range of frequencies
used in distortion measurements. The filters can be set in the range of 20Hz to 50kHz. Use the
low cutoff to limit noise frequencies below the fundamental for THD+noise and SINAD
measurements (the low filter does not have an effect in THD mode). When setting the low cutoff,
set the value lower than the fundamental signal frequency. Similarly, the high cutoff filter limits
noise frequencies above the specified frequency for THD+noise and SINAD measurements. In
THD mode, the limiting frequency is equal to the lower of the high cutoff filter or the harmonic
value.
:SENSe:DISTortion:LCO xxxx ;Sets the low cutoff frequency
:SENSe:DISTortion:LCO:STATe ON|OFF ;Turns the low cutoff on or off
:SENSe:DISTortion:HCO xxxx ;Sets the high cutoff frequency
:SENSe:DISTortion:HCO:STATe ON|OFF ;Turns the high cutoff on or off
The digital averaging filter (moving or repeat) can be used for THD. The RATE key sets the
gate time (FAST = 0.01s, MEDium = 0.1s, and SLOW = 1.0s).
Auto or Acquire frequency modes are recommended instead of Set mode, as the programmed
frequency of an external source may not be accurate.
Querying the RMS volts value in the distortion mode (:sens:dist:rms?) may yield a reading
slightly different from a reading in AC volts modes due to a difference in the how each mode
make measurements.
The output impedance needs to be set prior to setting the amplitude of starting the sweep. The
impedance of the second output reflects the impedance of the main output.
:LCO <NRf> ;Sets the low cutoff frequency of the Bandpass filter.
:LCO? ;Queries the low cutoff frequency of the Bandpass filter.
:HCO <NRf> ;Sets the high cutoff frequency of the Bandpass filter.
:HCO? ;Queries the high cutoff frequency of the Bandpass filter.
Connections
Assuming factory default conditions, the basic procedure is as follows:
1. Connect test leads to the INPUT HI and LO terminals. Either the front or rear inputs can
NOTE If the internal source is connected directly to the inputs, be sure the outer conductor
2. Select the measurement function by pressing SHIFT then THD.
:STATe <b> ;Sets LCO state on or off.
:STATe? ;Queries LCO state.
:STATe <b> ;Sets HCO state on or off.
:STATe? ;Queries HCO state.
be used; place the INPUTS button in the appropriate position.
is connected to INPUT LO.
Page 64

Fi
11
D
Basic Measurements 2-41
3. Pressing AUTO toggles autoranging. Notice the AUTO annunciator is displayed with
autoranging. If you want manual ranging, use the RANGE ▲ and ▼ keys to select a
measurement range consistent with the expected voltage.
NOTE
gure 2-
istortion measurements
CAUTION Do not apply more than 1000V peak to the input or instrument damage
Pressing AUTO to turn off autoranging for distortion readings displays a message
indicating the present range.
4. Connect test leads to the source as shown in Figure 2-11.
Model 2015
SENSE
INPUT
Ω 4 WIRE
350V
PEAK
INPUTS
F
FRONT/REAR
HI
1000V
!
PEAK
LO
500V
PEAK
R
3A 250V
AMPS
AC Voltage
Source
SHIFT
LOCAL
POWER
STEP CH2 CH3 CH4 CH5 CH6 CH7 CH8 CH9 CH10
SCAN
CH1REM
TALK
LSTN
SRQ
SHIFT
TIMER
HOLD TRIG FAST MED SLOW AUTO ERR
MATH
THD
DCV
ACV
HOLD
EX TRIG
TRIG
SAVE SETUP
SOURCE
MEAS
THD
dBm
DCI
LIMITS ON/OFFDELAY
STORE
CONFIG HALT
STEP SCAN
RECALL
REL FILT
dB
CONT
ACI
Ω2 Ω4
TEST
GPIB
DIGITS RATE
CAL
RELFILTER
RS232
MATH
REAR
4W
BUFFER
STAT
2015 THD MULTIMETER
PERIOD TCOUPL
FREQ
TEMP
EXIT ENTER
RANGE
AUTO
RANGE
Input Impedance = 1MΩ and <100pF
7
Caution: Maximum Input = 1000V peak, 8 × 10
may occur. The voltage limit is subject to the 8×10
V•Hz
7
V•Hz product.
5. Observe the display. If the “UDRFLW %THD” or “UDRFLW dB” message is displayed
(2% of range), select a lower range until a normal reading is displayed (or press AUTO
for autoranging). Use the lowest possible range for the best resolution.
NOTE Pressing the AUTO key to turn off autorange for distortion readings will display a
short message indicating the present range.
When the fundamental frequency is outside the 20Hz to 20kHz range, an underflow or
overflow condition exists. When a traping filter is enabled, the range can be much
narrower, depending on the type of filter enabled.
6. Take readings from the display.
NOTE When measuring distortion on the 100mV range or autoranging, open input leads
cause the distortion modes to display apparently valid readings. This is noise pickup
at the power line frequency. The amplitude of the signal depends on the type and
length of input connections. If the issue cannot be resolved by selecting a higher
range, place a resistor across the input leads, creating an underflow condition when
the leads are open. The resistor value depends on the amount of noise present, but
typically is 50kΩ to 150kΩ.
Page 65

2-42 Basic Measurements
Measurement examples
Measuring distortion
NOTE The Rel key is not supported for distortion measurements.
Turn on the Model 2015 and connect the function generator output (SOURCE OUTPUT) to
the front or rear voltage inputs (INPUT HI/LO). Set the INPUTS button accordingly.
1. Press SHIFT then ACV(THD) to put the 2015 into distortion measurement mode.
2. Press MEAS (the THD measure key).
3. When the display shows "TYPE” select THD and press ENTER.
4. When the display shows "FREQ:” select AUTO and press ENTER.
5. When the display shows "UPPR HARM:” select 02 and press ENTER.
6. When the display shows "UNITS:” select PERC and press ENTER.
7. When the display shows "SFIL:” select NONE and press ENTER.
8. Press SOURCE (the THD source key).
9. When the display shows "SINE OUT:" select ON and press ENTER.
10. When the display shows "FREQ:" select 01.0000kHz and press ENTER.
11. When the display shows "IMPEDANCE: 50", select HIZ and press ENTER. (Setting is
ignored in this example.)
12. When the display shows "AMPL:” select 1.0000V and press ENTER.
13. When the display shows "CHAN2:” select ISINE and press ENTER.
The display should read approximately 0.2 %THD.
To illustrate why the 2015 needs to know the exact source frequency, perform the following:
1. Press THD-MEAS and press ENTER once.
2. When the display shows "FREQ:", select SET and press ENTER.
3. For the frequency, enter 01.0002kHz and press ENTER four times.
The display should read approximately 0.02 %THD and will be unstable. Note that the setting
for the function generator did not change.
Page 66

Basic Measurements 2-43
Using the steps listed previously, return to the THD-MEAS menu and select ACQUIRE for
the frequency mode. The readings will return to approximately 0.02 %THD.
To perform this example remotely, send these commands:
*RST ;start from defaults
:sens:func 'dist' ;select distortion function
:sens:dist:type thd ;select THD type
:sens:dist:harm 2 ;set highest harmonic to 2
:unit:dist:perc ;select percent distortion
:sens:dist:sfil none ;no shaping filter
:sens:dist:rang:auto on ;turn on autoranging
:outp:freq 1000 ;set frequency to 1kHz
:outp:imp HIZ ;set high impedance source
:outp:ampl 1 ;set one volt
:outp:chan2 isine ;select inverted sine
:outp on ;turn on source
:read? ;trigger one reading, the distortion measurement can be read from
the bus
:sens:dist:rms? ;return the RMS volts value corresponding to the above
measurement
Measuring AC volts or frequency
To measure AC volts or frequency using the Model 2015, follow this procedure. Note that the
function generator does not work outside the distortion function.
1. Select ACV or frequency.
Front panel:
• Press ACV or FREQ.
Remote:
:sens:func 'volt:ac' ;select ACV
:sens:func 'freq' ;select frequency
2. Set voltage range.
Front panel:
• Press RANGE ▲ and ▼. The display briefly shows the new range. Autorange is
available for ACV but not frequency.
Remote:
:sens:volt:ac:rang xxx.xxx ;select ACV range based on number
:sens:volt:ac:rang:auto on|off ;turn autorange on or off
:sens:freq:thr:volt:rang xxx.xxx ;select frequency range
Page 67

2-44 Basic Measurements
3. Set integration rate for ACV.
Front panel:
• Press RATE. An annunciator indicates FAST (0.1 NPLC), MED (1 NPLC), or SLOW
Remote:
:sens:volt:ac:nplc xx.xx ;set number of power line cycles to integrate over
4. Set number of displayed digits.
Front panel:
• Press DIGITS to cycle through the number of digits.
Remote:
:sens:volt:ac:dig x ;select number of display digits in ACV
:sens:freq:dig x ;select number of display digits in frequency
5. Set digital filter for ACV.
The 2015 has a digital averaging filter to stabilize readings. The repeating filter takes the
set number of readings, averages, then updates the display. The moving filter throws out
the oldest reading, takes a new reading, then updates the display. The moving filter
updates the display faster, but takes longer for readings to stabilize.
Front panel:
• Press FILTER.
• When the display shows "010 RDGS", select the number of readings to average (1 to
• When the display shows "TYPE:MOVING AV", select MOVING AV or REPEAT and
• The display will have the FILT annunciator lit to indicate the filter is on. Press
Remote:
:sens:volt:ac:aver:tcon mov|rep ;select moving or repeating filter for ACV
:sens:volt:ac:aver:coun xxx ;set number of averaged readings
:sens:volt:ac:aver:stat on|off ;turn filter on or off
(10 NPLC).
100) and press ENTER.
press ENTER.
FILTER again to disable the filter.
Page 68

Basic Measurements 2-45
Distortion and RMS Volts Sweep Example
This is an example of the bus commands which should be sent to the 2015 to configure start,
and receive the data for a 10-point sweep. This also includes the use of the high and low cutoff
filters. This example executes a sweep of 10 frequencies from 1000Hz to 1900Hz in 100Hz
steps. The source is set for an amplitude of 1 V RMS.
*RST ;Resets the 2015 to default conditions
*CLS ;Clears the status registers
:STAT:OPER:ENAB 8 ;This will cause the Operation Summary Bit to set
when the sweep has been completed, so that the
sweep end can be detected
*SRE 128 ;Enables the Operation Summary Bit mask to cause
the SRQ line to be asserted when the sweep is
completed
:SENS:FUNC 'DIST' ;Selects Distortion mode
:SENS:DIST:RANG 10 ;Selects 10V range
:SENS:DIST:FREQ:AUTO OFF ;Turns off the AUTO frequency mode
:SENS:DIST:TYPE THDN ;Selects THD+noise mode
:SENS:DIST:LCO 500 ;Configures the low cutoff to filter out noise below
500 Hz
:SENS:DIST:LCO:STAT ON ;Turns on the low cutoff filter
:SENS:DIST:HCO 10000 ;Configures the high cutoff to filter out noise above
10kHz
:SENS:DIST:HCO: STAT ON ;Turns on the high cutoff filter
:OUTP:LIST 1,1000,1,1100,1,1200,1,1300,1,1400,1,1500,1,1600,1,1700,1,1800,1,1900
;This will set 10 sweep points, from 1000 Hz to 1900
Hz in 100Hz steps, all at one volt amplitude
:OUTP:MODE LIST ;Selects sweep mode
:OUTP:LIST:DEL .1 ;Sets a source delay of 0.1 seconds
:OUTP:LIST:ELEM DIST,AMPL ;Selects distortion and amplitude as the data
elements to be returned
:TRIG:COUN 10 ;The 2015 will take 10 triggered measurements
OUTP ON ;Turns the output on
:INIT ;Begins the sweep (Wait for SRQ to be asserted)*
:OUTP:LIST:DATA? ;Queries the sweep data (Read data from the 2015)*
The actual syntax for these steps depends on the type of GPIB interface and control software
used. For example, the WaitSRQ function can be used with a National Instruments interface to
wait for the SRQ, and the IBRD function can be used to read the data.
Running this same sweep again only requires sending *cls and init over the bus. Sending the
*cls again is necessary to reset the sweep done bit.
Page 69

WARNING:NO INTERNAL OPERATOR SERVICABLE PARTS,SERVICE BY QUALIFIED PERSONNEL ONLY.
WARNING:NO INTERNAL OPERATOR SERVICABLE PARTS,SERVICE BY QUALIFIED PERSONNEL ONLY.
CAUTION:FOR CONTINUED PROTECTION AGAINST FIRE HAZARD,REPLACE FUSE WITH SAME TYPE AND RATING.
CAUTION:FOR CONTINUED PROTECTION AGAINST FIRE HAZARD,REPLACE FUSE WITH SAME TYPE AND RATING.
Fi
12
D
2-46 Basic Measurements
Frequency response sweep example
Figure 2-12 is an example of how to perform a frequency response sweep on a device using
the Model 2015’s fast sweep capability. Since the Model 2015 must remain on one range while
sweeping, some preliminary work is necessary to find the appropriate input range, output levels,
and output frequencies to use in a sweep. In order for the Model 2015 to return usable readings,
the input RMS voltage level should be between 5% and 100% of the input range. For example,
on the 100mV, the input level should be between 5 and 100mV. In addition to choosing the input
range, the source amplitude needs to be adjusted so the peak voltage from the DUT does not
exceed 100% of the selected measurement range. Once the appropriate source level is found,
find the low and high frequencies where the voltage from the DUT falls to 5% of the selected
measurement range.
gure 2-
UT connections when using the internal sine source to stimulate a device
Input HI
Input LO
Model 2015
Device
Under Test
Output
350V
PEAK
SOURCE
OUTPUT
SENSE
Ω 4W
HI
!
LO
42V PEAK
INPUT
1000V
PEAK
!
INV/PULSE
SOURCE
OUTPUT
500V
PEAK
1
4 6
2
!
FUSE LINE
100 VAC
500 mAT
120 VAC
(SB)
220 VAC
250 mAT
240 VAC
(SB)
TRIGGER
3 5
LINK
VMC
EXT TRIG
LINE RATING
!
50, 60Hz
40VA MAX
RS232
MADE IN
U.S.A.
IEEE-488
(CHANGE IEEE ADDRESS
FROM FRONT PANEL)
120
Page 70

Basic Measurements 2-47
Analyzing frequency spectrum (Model 2015P only)
The Model 2015P has the ability to analyze the frequency spectrum of a signal. The
instrument can find and report the frequencies of the peak amplitude values. This is a bus-only
operation and cannot be performed from the front panel.
Peak commands
PEAK commands that control the Model 2015P peak functions are summarized in Table 2-3
below.
Table 2-3
PEAK commands
Command Description
DIST:PEAK:MAX? Looks at all the frequency bin values to find the maximum amplitude value.
Updates the current location position to this frequency. NOTE: This command
must be sent before using the NEXT, LEFT, or RIGHT commands (below).
DIST:PEAK:NEXT? Finds the maximum amplitude value of the frequency bins that have not yet
been returned. Updates the current location position to this frequency.
DIST:PEAK:LEFT? Finds the maximum amplitude value of frequency bins that have not already
been reported and are lower in frequency than the present location frequency.
Updates the current location position to this frequency.
DIST:PEAK:RIGHT? Finds the maximum amplitude value of frequency bins that have not already
been reported and are higher in frequency than the present location frequency.
Updates the current location position to this frequency.
DIST:PEAK:SREF Sets the “reference marker” to the current frequency location.
DIST:PEAK:DELTA? Returns the difference in frequency and amplitude (dBV) between the
reference marker and the present location.
DIST:PEAK:SFR <freq> Moves the present location marker to the bin associated with the frequency
sent.
DIST:PEAK:LOC? Returns the frequency and amplitude of the present location.
DIST:PEAK:LOWER <freq> Defines lower bound of search frequency (will not search frequencies below
this point). (Default is 20.)
DIST:PEAK:LOWER? Query lower bound of search frequency.
DIST:PEAK:UPPER <freq> Defines upper bound of search frequency (will not search frequencies above
this point). (Default is 20480.)
DIST:PEAK:UPPER? Query upper bound of search frequency.
DIST:PEAK:LIST <freqlist> Specify list of frequencies (up to 50) to be analyzed.
DIST:PEAK:LIST? Query frequencies in the list.
DIST:PEAK:LIST:DATA? Returns amplitudes for frequencies in the list.
Page 71

Fi
13
P
2-48 Basic Measurements
Operation overview
The PEAK commands apply only to a captured waveform. For that reason, the instrument
must be put into a single trigger state; otherwise, errors will occur if the instrument is continually
triggered. To select a single trigger state, set the state of INIT:CONT to OFF, and set
TRIG:COUNT to 1.
In order to get maximum frequency resolution from the FFT calculation, the distortion
frequency must be programmed to 20Hz so the FFT can provide information that is separated
into 20Hz bins. To accomplish this, send the command: DIST:FREQ 20.
Setting the distortion frequency to 20Hz is done so that waveform is analyzed appropriately;
however, it does not mean that the excitation frequency must be 20Hz. For a THD measurement,
the source frequency and the distortion analysis frequency are the same, but for this peak
method, the analysis is set up to yield maximum frequency bin information instead of THD
information.
Typical peak analysis
Once readings have been acquired, use the basic steps for peak analysis below. Figure 2-13
shows these steps graphically.
gure 2-
eak analysis
1. Set the lower and upper bounds for the frequency search using the LOWER and UPPER
commands.
2. Request the maximum amplitude, frequency pair using the MAX? query.
3. Request the subsequently lower maximum amplitudes and corresponding frequencies by
repeatedly sending the NEXT? query.
4. To obtain the next lower amplitude at a frequency lower or higher than the present
frequency, use the LEFT? and RIGHT? queries, respectively.
MAX?
NEXT?
Amplitude
LOWER UPPER
NEXT?
Frequency
Page 72

Frequency list analysis
Once readings have been acquired, a specified list of frequencies (up to 50) can be analyzed
using the PEAK:LIST commands. The PEAK:LIST <freqlist> command is used to specify the
frequencies (in Hz) to be analyzed. The PEAK:LIST:DATA? command is then used to return the
amplitudes (in dBV) of the listed frequencies.
NOTE The distortion frequency must be set to 20Hz in order to analyze a list of frequencies.
The distortion frequency is set to 20Hz by sending the following command:
DIST:FREQ 20
The Model 2015P can only analyze frequencies that are a multiple of 20. If a listed frequency
is not a multiple of 20, the frequency that will be analyzed is the next lowest multiple of 20. For
example, if 1019Hz is a listed frequency, the amplitude for 1000Hz will be returned by
LIST:DATA?.
The following command shows proper syntax for specifying a frequency list (1.0kHz,
1.1kHz, and 1.2kHz):
:DIST:PEAK:LIST 1000,1100,1200
When LIST:DATA? is used, the magnitudes for the above frequencies will be returned. If, for
example, the amplitudes for the above frequencies are -6dBV (1kHz), -7dBV (1.1kHz) and
-8dBV (1.2kHz), the following values will be returned:
Basic Measurements 2-49
-6, -7, -8
The programming example in Table 2-7 shows how to analyze a list of frequencies.
Page 73

2-50 Basic Measurements
Peak analysis programming example
Working through a typical case will illustrate the program flow and the sequencing of
command steps. For this example, a device is being stimulated with a 1kHz signal at 250mV
(-12dBV). The device is reacting to this excitation by resonating at 600Hz and at 3kHz. The
amplitudes of those two frequencies are 100mV (-20dBV) and 200mV (-14dBV), respectively.
The procedure below will take you step-by-step through the process. Table 2-4 summarizes the
command sequence.
Step 1. Set the trigger model for single reading mode
Set the instrument to the single trigger state with these commands:
Step 2. Select distortion function
Send this command to select the distortion function:
Step 3. Force the analysis to 20Hz frequency bins
Set the distortion frequency to 20Hz so that the FFT can separate into 20Hz bins with this
command:
init:cont off
trig:count 1
func 'dist'
dist:freq 20
Step 4. Program the output sine wave
Program the desired output frequency and amplitude as follows:
outp:freq 1000
outp:ampl 0.250
outp on
NOTE The above commands need to be sent only once during setup. The following
commands can then be sent as many times as necessary for analysis.
Step 5. Trigger reading
Since the instrument is currently in the idle state, it must be triggered to acquire a reading
with this command:
init
Step 6. Synchronize reading
Before starting the peak analysis, the unit must be synchronized to the reading being
completed. One way of doing so would be to read back the resulting THD reading even though
it may not be used. Another method would be to check the RAV (Reading Available) bit (bit 5)
in the Measurement Condition Register. (See Section 4, “Status structure” for details.)
The following command will request a THD reading, once available:
fetch?
Page 74

Basic Measurements 2-51
Table 2-4
Peak analysis programming example
Command Description
init:cont off Set the trigger model for single reading mode.
trig:count 1 Set trigger count to 1.
func ‘dist’ Set the function to measure distortion.
dist:freq 20 Force the analysis to 20Hz frequency bins.
outp:freq 1000 Program the output sine wave frequency.
outp:ampl 0.250 Program the output sine wave amplitude.
outp on Turn on source.
init Trigger a reading.
fetch? Request reading to synchronize.
dist:peak:max? Return the frequency, amplitude pair of the maximum peak value.
dist:peak:next? Search buffer for the second highest peak value.
dist:peak:next? Search buffer for the third highest peak value.
Step 7. Send peak commands to analyze waveform
Since most of the peak commands operate relative to the last found frequency position, the
initial position must first be established. This is usually done by finding the peak frequency first
with this command:
dist:peak:max?
The above command returns the frequency, amplitude pair of the maximum peak value. For
the current example, a value of 1000,-12 would be returned, a frequency of 1kHz and an
amplitude of -12dBV.
Now we can search the buffer for the second highest peak value:
dist:peak:next?
In this example, a value of 3e3,-14 would be returned, a frequency of 3kHz and an amplitude
of -14dBV.
Finally, this command can be sent to search for the third highest peak value:
dist:peak:next?
With the current example, a value of 600,-20 would be returned, a frequency of 600Hz and
an amplitude of -20dBV.
Page 75

2-52 Basic Measurements
Delta programming example
The delta function returns the difference in amplitude (in dBV) between the reference marker
amplitude and the present location amplitude. As an example of using the delta function, assume
once again the device is being stimulated with a 1kHz signal at 250mV (-12dBV), and that there
are three dominant amplitudes at three frequencies:
• 600Hz, 100mV (-20dBV)
• 1000Hz, 250mV (-12dBV)
• 3000Hz, 200mV (-14dBV)
A summary of commands and a brief description of each for the delta programming example
are provided in Table 2-5.
Table 2-5
Delta programming example
Command Description
init:cont off Set the trigger model for single reading mode.
trig:count 1 Set trigger count to 1.
func ‘dist’ Set the function to measure distortion.
dist:freq 20 Force the analysis to 20Hz frequency bins.
outp:freq 1000 Program the output sine wave frequency.
outp:ampl 0.250 Program the output sine wave amplitude.
outp on Turn on source.
init Trigger reading.
fetch? Request reading to synchronize.
dist:peak:max? Find max value (it is at 1kHz, -12dBV).
dist:peak:sref Mark location as the reference point.
dist:peak:sfr 600 Move to 600Hz location.
dist:peak:delta? Query the delta frequency and delta amplitude (relative to the amplitude at 1kHz). Will
return 400Hz (1kHz – 600Hz) and +8dBV [-12dBV – (–20dBV)].
dist:peak:sfr 3e3 Move to the 3kHz location.
dist:peak:delta? Query the delta frequency and delta amplitude (relative to the amplitude at 1kHz). Will
return -2000Hz (1kHz – 3kHz) and +2dBV [-12dBV – (–14dBV)].
Page 76

Frequency list programming example
The command sequence in Table 2-6 analyzes a list of frequencies. When the last command
in the table (LIST:DATA?) is executed and the Model 2015P is addressed to talk, the amplitudes
for 1000Hz, 1100Hz, and 1200Hz are sent to the computer.
Table 2-6
Frequency list programming example
Command Description
init:cont off Set the trigger model for single reading mode.
trig:count 1 Set trigger count to 1.
func ‘dist’ Select the distortion measurement function.
dist:freq 20 Force the analysis to 20Hz frequency bins.
output:freq 1000 Program the output sine wave frequency (1000Hz).
output:ampl 0.25 Program the output sine wave amplitude (0.25V rms).
output on Turn on source.
init Trigger reading.
fetch? Request reading to synchronize.
dist:peak:list 1e3, 1.1e3, 1.2e3 Specify frequency list (1000Hz, 1100Hz, and 1200Hz).
dist:peak:list:data? Request the amplitudes for the three frequencies in the list.
Basic Measurements 2-53
Page 77

2-54 Basic Measurements
Measurement Queries
This is to summarize the various queries found in the Model 2000 and its derivatives (2010,
2015, 2016, 2700, 2750). Specifically, this is to clarify exactly what each query does, what its
limitations are, and when each is appropriate.
:FETCh?
What it does:
This command will simply return the latest available reading from an instrument.
Limitations:
If the instrument does not have a reading available (indicated by dashes in the display), sending this command will cause a –230, "Data corrupt or stale" error. This query will not cause the
box to trigger a reading, nor will it "wait" for a result if a reading is in progress. It is possible to
get the same reading over and over using this query. It will continue to give the same result until
one of two things has happened:
• A new reading has been triggered
• The old reading has been invalidated by changing ranges, or by changing function.
When appropriate:
Since this query does not trigger a reading, and can give duplicate results, there are not many
cases where this command should be used. The ":DATA:FRESh?" query (see page 2-56) is often
a better choice. If this query is used, the following conditions should be met:
• A reading has been triggered, either by free running (:INIT:CONT ON and
:TRIG:SOUR IMM), by some event such as a bus trigger (*TRG), or by an external
trigger (:TRIG:SOUR EXT).
• It is confirmed that the reading is completed, either by the setting of the RAV bit in
the status model, or by allowing sufficient time to pass for the reading to complete.
Page 78

:READ?
Basic Measurements 2-55
What it does:
This command performs three actions. It will reset the trigger model to the idle layer
(equivalent to the :ABORt command), take the trigger model out of idle (equivalent to the :INIT
command), and return a reading (equivalent to a "FETCh?" query). This command will always
return a new reading, since aborting the trigger model will invalidate any old readings and
trigger a new one. This query will "wait" for a new reading to become available before the
instrument sends a result back.
Limitations:
This command will not work if the trigger source is set for BUS or EXTERNAL. This will
cause a –214, "Trigger deadlock" error. Under this condition, one should use a ":FETCh?" query
or a ":DATA:FRESh?" Query (see below). If the trigger model is continuously initiating
(:INIT:CONT ON), sending this query may cause a –213, "Init ignored" error, but will still give
a new reading.
When appropriate:
If the box receives a *RST command, then it defaults to :INIT:CONT OFF, :TRIG:SOUR
IMM, and :TRIG:COUNT 1. Sending a ":READ?" query under these conditions will trigger a
new reading.
:MEAS:[function]?
What it does:
This query will reconfigure the instrument to the function specified in the query, set the
trigger source for immediate, set the trigger count to 1, and configure the measurement
parameters to *RST defaults. It will then trigger a single reading, and return the result.
Limitations:
This query is much slower than a ":READ?" or ":FETCh?" query because it has to
reconfigure the instrument each time it is sent. It will reset the NPLC, autoranging, and
averaging to defaults.
When appropriate:
This is an ideal command for taking one-shot measurements if the default settings for a
measurement are appropriate and speed is not a requirement.
Page 79

2-56 Basic Measurements
[:SENSe[1]]:DATA:FRESh?
What it does:
This query is similar to the ":FETCh?" in that it returns the latest reading from the instrument,
but has the advantage of making sure that it does not return the same reading twice.
Limitations:
Like the ":FETCh?" query, this command does not trigger a reading.
When appropriate:
This is a much better choice than the ":FETCh?" query because it can not return the same
reading twice. This would be a good query when triggering by BUS or EXTERNAL, because it
will wait for a reading to complete if a reading is in progress.
The ":CALC:DATA:FRESh?" query is similar to the ":DATA:FRESh?" query, but applies to
readings which have math applied to them (e.g.: the MX+B scaling).
[:SENSe[1]]:DATA:LATest?
What it does:
This query will return the last reading the instrument had, regardless of what may have
invalidated that reading, such as changing ranges or functions.
Limitations:
This query is fully capable of returning meaningless, old data.
When appropriate:
If, for some reason, the user wanted the last completed reading, even after changing ranges
or other measurement settings, which would invalidate the old reading.
The ":CALC:DATA:LATest?" query is similar to the ":DATA:LAT?" query, but applies to
readings which have math applied to them (e.g.: the MX+B scaling).
Page 80

Examples
One-shot reading, DC volts, no trigger, fastest rate
One-shot reading, DC volts, bus trigger, auto ranging
Basic Measurements 2-57
*RST
:INITiate:CONTinuous OFF;:ABORt
SENSe:FUNCtion ‘VOLTage:DC’
:SENSe:VOLTage:DC:RANGe 10 //Use fixed range for fastest
readings
:SENSe:VOLTage:DC:NPLC 0.01 //Use lowest NPLC setting for
fastest readings
:DISPlay:ENABle OFF //Turn off display to increase
speed
:SYSTem:AZERo:STATe OFF //Turn off autozero to increase
speed, but may cause drift over
time
:SENSe:VOLTage:DC:AVERage:STATe OFF //Turn off averaging filter for
speed
:TRIGger:COUNt 1
:READ?
(Enter reading)
*RST
:INITiate:CONTinuous OFF;:ABORt
:TRIGger:SOURce BUS
:SENSe:FUNCtion ‘VOLTage:DC’
:SENSe:VOLTage:DC:RANGe:AUTO ON
:TRIGger:COUNt 1
:INITiate
*TRG
-orGPIB GET command – triggers reading
:SENSe:DATA:FRESh?
(Enter reading)
One-shot reading, external trigger, auto delay enabled
*RST
:INITiate:CONTinuous OFF;:ABORt
:TRIGger:SOURce EXTernal
:TRIGger:DELay:AUTO ON //Note: auto trigger delay only
takes effect with trigger
source set for BUS or EXTernal
:SENSe:FUNCtion ‘VOLTage:DC’
:SENSe:VOLTage:DC:RANGe:AUTO ON
:INITiate
(external trigger)
:SENSe:DATA:FRESh?
(enter reading) //This step will time out if the
trigger has not occurred
Page 81

2-58 Basic Measurements
Page 82

3
Measurement
Options
3
Measurement
Options
Page 83

3-2 Measurement Options
Introduction
This section describes the front panel features of the Model 2015. For those measurement
options accessible only by a remote interface, refer to Sections 4 and 5. This section is organized
as follows:
• Measurement configuration — Describes ranging, filtering, relative readings, digits of
resolution, and measurement rate.
• Trigger operations — Uses a trigger model to explain trigger modes and sources.
• Buffer operations — Discusses the reading storage buffer and buffer statistics.
• Limit operations — Defines how to set reading limits.
• Scan operations — Explains the external scanning capabilities.
• System operations — Gives details on setup saving and restoring, selecting a remote
interface, and accessing test and calibration.
Measurement configuration
The following paragraphs discuss configuring the multimeter for making measurements. See
the end of Appendix A for information about optimizing readings for speed or accuracy.
Range
The selected measurement range affects both the ultimate digits and accuracy of the measurements as well as the maximum signal that can be measured. The range setting (fixed or auto) for
each measurement function is saved when changing functions.
Maximum readings
The full scale readings for every range on each function are 20% overrange except for the
1000VDC, 750VAC, 3ADC, 3AAC, diode test, and distortion ranges.
Input values more than the maximum readings cause the "OVERFLOW" messages to be
displayed.
Manual ranging
To select a range, simply press the RANGE ▲ or ▼ key. The instrument changes one range
per keypress. The selected range is displayed for one second.
If the instrument displays the "OVERFLOW" message on a particular range, select a higher
range until an on-range reading is displayed. Use the lowest range possible without causing an
overflow to ensure best accuracy and resolution.
NOTE Temperature and continuity functions have just one range.
Page 84

Filter
Measurement Options 3-3
Autoranging
To enable autoranging, press the AUTO key. The AUTO annunciator turns on when
autoranging is selected. While autoranging is selected, the instrument automatically chooses the
best range to measure the applied signal. Autoranging should not be used when optimum speed
is required.
Note that up-ranging occurs at 120% of range, while down-ranging occurs at 10% of nominal
range, except for distortion measurements. Up-ranging for the distortion function is 106-112%
of range, while down-ranging is approximately 8.5% of range.
To cancel autoranging, press AUTO or the RANGE ▲ or ▼ key. Pressing AUTO to cancel
autoranging leaves the instrument on the present range.
The AUTO key has no effect on the temperature, continuity, and diode test functions.
FILTER lets you set the filter response to stabilize noisy measurements. The Model 2015 uses
a digital filter, which is based on reading conversions. The displayed, stored, or transmitted reading is simply an average of a number of reading conversions (from 1 to 100).
To select a filter:
1. Press FILTER once if the FILT annunciator is off; press twice if FILT is on.
2. Enter the number of readings.
3. Select the type of filter you want (moving average or repeating), then press ENTER.
The FILT annunciator turns on. When a filter is enabled, the selected filter configuration for
that measurement function is in effect.
Pressing FILTER once disables the filter.
NOTE The filter can be set for any measurement function except frequency, period,
continuity, and diode test.
Page 85

Fi
1
M
3-4 Measurement Options
Filter types
The moving average filter (Figure 3-1) uses a first-in, first-out stack. When the stack becomes
full, the measurement conversions are averaged, yielding a reading. For each subsequent
conversion placed into the stack, the oldest conversion is discarded, and the stack is re-averaged,
yielding a new reading.
For the repeating filter (Figure 3-1), the stack is filled and the conversions are averaged to
yield a reading. The stack is then cleared and the process starts over. Choose this filter for scanning so readings from other channels are not averaged with the present channel.
gure 3-
oving average and
repeating filters
Conversion #10
#9
Conversion #1
Conversion #10
#9
Conversion #1
#8
#7
#6
#5
#4
#3
#2
A. Type - Moving Average, Readings = 10
#8
#7
#6
#5
#4
#3
#2
B. Type - Repeating, Readings = 10
Reading
#1
Reading
#1
Conversion #11
#10
Conversion #2
Conversion #20
#19
Conversion #11
#9
#8
#7
#6
#5
#4
#3
#18
#17
#16
#15
#14
#13
#12
Reading
#2
Reading
#2
Conversion #12
#11
#8
Conversion #3
Conversion #30
#29
#26
Conversion #21
#10
#9
#7
#6
#5
#4
#28
#27
#25
#24
#23
#22
Reading
#3
Reading
#3
Response time
The filter parameters have speed and accuracy tradeoffs for the time needed to display, store,
or output a filtered reading. These affect the number of reading conversions for speed versus
accuracy and response to input signal changes.
Page 86

Relative
Measurement Options 3-5
The rel (relative) function can be used to null offsets or subtract a baseline reading from
present and future readings. When rel is enabled, the instrument uses the present reading as a
relative value. Subsequent readings will be the difference between the actual input value and the
rel value.
NOTE The rel function is not supported for distortion measurements.
You can define a rel value for each function. Once a rel value is established for a measurement
function, the value is the same for all ranges. For example, if 50V is set as a rel value on the
100V range, the rel is also 50V on the 1000V, 10V, 1V, and 100mV ranges.
Thus, when you perform a zero correction for DCV, Ω2, and Ω4 measurements by enabling
REL, the displayed offset becomes the reference value. Subtracting the offset from the actual
input zeroes the display, as follows:
Actual Input – Reference = Displayed Reading
A rel value can be as large as the highest range.
Selecting a range that cannot accommodate the rel value does not cause an overflow
condition, but it also does not increase the maximum allowable input for that range. For
example, on the 10V range, the Model 2015 still overflows for a 12V input.
Digits
To set a rel (relative) value, press REL key when the display shows the value you want as the
relative value. The REL annunciator turns on. Pressing REL a second time disables rel.
You can input a REL value manually using the mX+b function. Set M for 1 and B for any
value you want. Pressing REL enables that value to be the relative value. See Section 2 for more
information on the mX+b function.
The display resolution of a Model 2015 reading depends on the DIGITS setting. It has no
effect on the remote reading format. The number of displayed digits does not affect accuracy or
speed. Those parameters are controlled by the RATE setting.
Perform the following steps to set digits for a measurement function:
1. Press the desired function.
2. Press the DIGITS key until the desired number of digits is displayed (3½ to 6½).
NOTE Frequency and period can be displayed with four to seven digits.
Page 87

3-6 Measurement Options
Rate
The RATE operation sets the integration time of the A/D converter, the period of time the
input signal is measured (also known as aperture). The integration time affects the usable digits,
the amount of reading noise, as well as the ultimate reading rate of the instrument. The
integration time is specified in parameters based on a number of power line cycles (NPLC),
where 1 PLC for 60Hz is 16.67msec and 1 PLC for 50Hz and 400Hz is 20msec.
In general, the fastest integration time (FAST (0.1 PLC) from the front panel, 0.01 PLC from
the bus) results in increased reading noise and fewer usable digits, while the slowest integration
time (10 PLC) provides the best common-mode and normal-mode rejection. In-between settings
are a compromise between speed and noise.
The RATE parameters are explained as follows:
• FAST sets integration time to 0.1 PLC. Use FAST if speed is of primary importance (at
the expense of increased reading noise and fewer usable digits).
• MEDium sets integration time to 1 PLC. Use MEDium when a compromise between
noise performance and speed is acceptable.
• SLOW sets integration time to 10 PLC. SLOW provides better noise performance at the
expense of speed.
NOTE The integration time can be set for any measurement function except frequency,
period, continuity (FAST), diode test (MEDium) and distortion. For frequency and
period, this value is gate time or aperture.
For the AC functions, MEDium and SLOW have no effect on the number of power line
cycles. See the discussion on “Bandwidth” that follows.
Page 88

Measurement Options 3-7
Bandwidth
The rate setting for AC voltage and current measurements determines the bandwidth setting:
• Slow — 3Hz to 300kHz.
• Medium — 30Hz to 300kHz.
• Fast — 300Hz to 300kHz.
Bandwidth is used to specify the lowest frequency of interest. When the Slow bandwidth
(3Hz to 300kHz) is chosen, the signal goes through an analog RMS converter. The output of the
RMS converter goes to a fast (1kHz) sampling A/D and the RMS value is calculated from 1200
digitized samples (1.2s).
When the Medium bandwidth (30Hz to 300kHz) is chosen, the same circuit is used. However,
only 120 samples (120ms) are needed for an accurate calculation because the analog RMS
converter has turned most of the signal to DC.
In the Fast bandwidth (300Hz to 300kHz), the output of the analog RMS converter (nearly
pure DC at these frequencies) is simply measured at 1 PLC (16.6ms).
Table 3-1 lists the rate settings for the various measurement functions. The FAST, MED, and
SLOW annunciators are only lit when conditions in the table are met. In other case, the
annunciators are turned off.
Table 3-1
Rate settings for the measurement functions
Function
DCV, DCI
ACV, ACI
Ω2W, Ω4W
FREQ, PERIOD
dB, dBm (ACV)
dB, dBm (DCV)
Continuity
Diode test
Distortion
Notes:
NPLC = number of power line cycles.
BW = lower limit of bandwidth (in Hz).
APER = aperture in seconds.
N/A = not available.
X = setting ignored.
Fast Medium Slow
NPLC=0.1
NPLC=1, BW=300
NPLC=0.1
APER=0.01s
NPLC=1, BW=300
NPLC=0.1
NPLC=0.1
N/A
NPLC=X
NPLC=1
NPLC=X, BW=30
NPLC=1
APER=0.1s
NPLC=X, BW=30
NPLC=1
N/A
NPLC=1
NPLC=X
Rate
NPLC=10
NPLC=X, BW=3
NPLC=10
APER=1.0s
NPLC=X, BW=3
NPLC=10
N/A
N/A
NPLC=X
Page 89
Fi
2
F
3-8 Measurement Options
Trigger operations
The following paragraphs discuss front panel triggering, the programmable trigger delay, the
reading hold feature, and external triggering.
Trigger model
The flowchart of Figure 3-2 summarizes triggering as viewed from the front panel. It is called
a trigger model because it is modeled after the SCPI commands used to control triggering. Note
that for stepping and scanning, the trigger model has additional control blocks. These are
described in “Scan operations” later in this section.
gure 3-
ront panel triggering
without stepping/
scanning
Idle
Control
Source
Immediate
External
Event
Detection
Delay
Device
Action
Output
Trigger
Idle
The instrument is considered to be in the idle state whenever it is not performing any
measurements or scanning functions. From the front panel, the unit is considered idle at the end
of a step or scan operation when the reading for the last channel remains displayed. To restore
triggers, use the SHIFT-HALT keys.
Once the Model 2015 is taken out of idle, operation proceeds through the flowchart.
Control source and event detection
The control source holds up operation until the programmed event occurs and is detected. The
control sources are described as follows:
• Immediate — With this control source, event detection is immediately satisfied allowing
operation to continue.
• External — Event detection is satisfied for any of three conditions:
• An input trigger via the Trigger Link line EXT TRIG is received.
• A bus trigger (GET or *TRG) is received.
• The front panel TRIG key is pressed. (The Model 2015 must be taken out of remote
before it will respond to the TRIG key. Use the LOCAL key or send LOCAL 716 over
the bus.)
Page 90

Measurement Options 3-9
Delay
A programmable delay is available after event detection. It can be set manually or an auto
delay can be used. With auto delay, the Model 2015 selects a delay based on the function and
range. The AUTO settings are listed in Table 3-2.
Table 3-2
Auto delay settings
Function Range and delay
DCV
ACV, Distortion
FREQ
DCI
ACI
Ω2W, Ω4W
Continuity
Diode testing
The delay function is accessed by pressing the SHIFT-DELAY keys. The present delay
setting (AUTO or MANual) is displayed. Use the ▲ and ▼ keys to select the type of delay. If
MANual is chosen, also enter the duration of the delay. The maximum is shown following:
Press ENTER to accept the delay or EXIT for no change.
100mV
1ms
100mV
400ms
100mV
1ms
10mA
2ms
100Ω
3ms
1V
1ms
1V
400ms
1V
1ms
100mA
2ms
1kΩ
3ms
1kΩ
3ms
1mA
1ms
10V
1ms
10V
400ms
10V
1ms
1A
2ms
1A
400ms
10kΩ
13ms
100µA
1ms
99H:99M:99.999S
100V
5ms
100V
400ms
100V
1ms
3A
2ms
3A
400ms
100kΩ
25ms
10µA
1ms
1000V
5ms
750V
400ms
750V
1ms
1MΩ
100ms
10MΩ
150ms
100MΩ
250ms
Changing the delay to MANual on one function changes the delays on all functions to MANual.
Page 91

3-10 Measurement Options
Device actions
The primary device action is a measurement. However, the device action block could include
the following additional actions:
• Source and Delay (while in LIST mode) — If MODE is set to LIST (rather than FIXED),
readings will be taken for each listed amplitude and frequency pair, up to the maximum
number of pairs allowed (see :OUTPut:LIST command in Section 5). This sweep
functionality is tied into Device Action so all trigger model features such as
SAMP:COUN, TRIG:COUN, and also the different trigger sources are functional while
in LIST mode.
• Filtering — If the repeating filter is enabled, the instrument samples the specified
number of reading conversions to yeildl single filtered reading. Only one reading
conversion is performed if the filter is disabled, or after the specified number of reading
conversions for a moving average filter is reached. The output of filter feeds hold.
• Hold — With hold enabled, the first processed reading becomes the “seed” reading and
operation loops back within the device action block. After the next reading is processed,
it is checked to see if it is within the selected window (0.01%, 0.1%, 1%, 10%) of the
“seed” reading. If the reading is within the window, operation again loops back within
the device action block. This looping continues until the specified number (2 to 100)
consecutive readings are within the window. If one of the readings is not within the
window, the instrument acquires a new “seed” reading and the hold process continues.
• Channel closure — When stepping or scanning, the last device action is to open the
previous channel (if closed) and close the next channel. Using the hold feature provides
an auto settling time for the scanner relays. Each open/close transition will restart the
hold process and a reading for each channel will not occur until the relay settles.
Output trigger
After the device action, an output trigger occurs and is available at the rear panel Trigger Link
connector. This trigger can be used to trigger another instrument to perform an operation (e.g.,
select the next channel for an external scan).
Counters
The trigger model for stepping and scanning contains additional blocks for counting samples
(the number of channels to scan) and counting triggers. These counters are explained in the
paragraph “Scan operations” later in this section.
Reading hold (autosettle)
When a hold reading is acquired as described in “Device actions”, an audible beep is sounded
(if enabled) and the reading is considered a “true measurement”. The reading is held on the
display until an “out of window” reading occurs to restart the hold process.
When operating remotely or scanning, the hold process seeks a new “seed” once it has been
satisfied and the reading has been released. When operating from the front panel, the hold
process does not seek a new “seed” until the held condition is removed.
Page 92

Hold example
Fi
3
R
1. Enable HOLD, select a window percentage and enter a count.
2. Apply test probes to a signal. Once the signal becomes stable enough to satisfy the hold
condition, the reading is released, and the beeper sounds (if enabled).
3. Remove the hold condition by lifting the probes. Hold will then seek a new “seed”.
External triggering
The EXT TRIG key selects triggering from two external sources: trigger link and the TRIG
key. When EXT TRIG is pressed, the TRIG annunciator lights and dashes are displayed to
indicate that instrument is waiting for an external trigger. From the front panel, you can press
the TRIG key to trigger a single reading. Pressing the EXT TRIG key again toggles you back to
continuous triggers.
The Model 2015 uses two lines of the Trigger Link rear panel connector as External Trigger
(EXT TRIG) input and Voltmeter Complete (VMC) output. The EXT TRIG line allows the
Model 2000 to be triggered by other instruments. The VMC line allows the Model 2000 to
trigger other instruments.
At the factory, line 1 is configured as VMC and line 2 as EXT TRIG. (Changing this
configuration is described in the optional Model 2015 Repair Manual.) A connector pinout is
shown in Figure 3-3.
Measurement Options 3-11
gure 3-
ear panel pinout
Rear Panel Pinout
Pin 2
External
Trigger
Input
678
34
5
2
1
Pin 1
Voltmeter
Complete
Output
Pin Number Description
Voltmeter Complete Output
1
External Trigger Input
2
3
4
5
6
7
8
* Either pin 3 or 5 may be configured as an output instead
of pin 1. Either pin 4 or 6 may be configured as an input
instead of pin 2. See the optional Model 2000 Repair
Manual for details.
no connection *
no connection *
no connection *
no connection *
Signal Ground
Signal Ground
Page 93
Fi
4
p
Fi
5
3-12 Measurement Options
External trigger
The EXT TRIG input requires a falling-edge, TTL-compatible pulse with the specifications
shown in Figure 3-4. In general, external triggers can be used to control measure operations. For
the Model 2015 to respond to external triggers, the trigger model must be configured for it.
gure 3-
Trigger link input
ulse specifications
(EXT TRIG)
Voltmeter complete
The VMC output provides a TTL-compatible output pulse that can be used to trigger other
instruments. The specifications for this trigger pulse are shown in Figure 3-5. Typically, you
would want the Model 2015 to output a trigger after the settling time of each measurement.
gure 3-
Trigger link output pulse
specifications (VMC)
TTL High
(2V-5V)
TTL Low
(≤0.8V)
TTL High
(3.4V Typical)
Triggers on
Leading Edge
2µs
Minimum
Meter
Complete
TTL Low
(0.25V Typical)
10µs
Minimum
External triggering example
In a typical test system, you may want to close a channel and then measure the DUT
connected to the channel with a multimeter. Such a test system is shown in Figure 3-6, which
uses a Model 2015 to measure ten DUTs switched by a Model 7011 multiplexer card in a
Model 7001/7002 Switch System.
Page 94

Fi
gure 3-
6
D
WARNING:NO INTERNAL OPERATOR SERVICABLE PARTS,SERVICE BY QUALIFIED PERSONNEL ONLY.
WARNING:NO INTERNAL OPERATOR SERVICABLE PARTS,SERVICE BY QUALIFIED PERSONNEL ONLY.
CAUTION:FOR CONTINUED PROTECTION AGAINST FIRE HAZARD,REPLACE FUSE WITH SAME TYPE AND RATING.
CAUTION:FOR CONTINUED PROTECTION AGAINST FIRE HAZARD,REPLACE FUSE WITH SAME TYPE AND RATING.
WARNING:NO INTERNAL OPERATOR SERVICABLE PARTS,SERVICE BY QUALIFIED PERSONNEL ONLY.
WARNING:NO INTERNAL OPERATOR SERVICABLE PARTS,SERVICE BY QUALIFIED PERSONNEL ONLY.
CAUTION:FOR CONTINUED PROTECTION AGAINST FIRE HAZARD,REPLACE FUSE WITH SAME TYPE AND RATING.
CAUTION:FOR CONTINUED PROTECTION AGAINST FIRE HAZARD,REPLACE FUSE WITH SAME TYPE AND RATING.
Fi
7
UT test system
DUT
#1
Measurement Options 3-13
1
OUTPUT
gure 3-
Trigger link
connections
DUT
#2
2
SHIFT
LOCAL
POWER
STEP CH2 CH3 CH4 CH5 CH6 CH7 CH8 CH9 CH10
SCAN
CH1REM
TALK
LSTN
SRQ
SHIFT
TIMER
HOLD TRIG FAST MED SLOW AUTO ERR
dBm
dB
MATH
THD
ACI
DCV
ACV
DCI
HOLD
LIMITS ON/OFFDELAY
TRIG
EX TRIG
STORE
RECALL
SAVE SETUP
CONFIG HALT
SOURCE
MEAS
STEP SCAN
THD
REL FILT
SENSE
INPUT
Ω 4 WIRE
HI
MATH
REAR
4W
350V
1100V
BUFFER
STAT
!
PEAK
PEAK
2015 MULTIMETER
LO
CONT
Ω2 Ω4
TEST
CAL
RELFILTER
RS232
GPIB
DIGITS RATE
500V
PERIODTCOUPL
PEAK
INPUTS
FREQ
TEMP
F
R
RANGE
AUTO
FRONT/REAR
2A 250V
AMPS
RANGE
EXIT ENTER
2015 Multimeter
DUT
#10
10
Card 1
7011 MUX Card
The Trigger Link connections for this test system are shown in Figure 3-7. Trigger Link of
the Model 2015 is connected to Trigger Link (either IN or OUT) of the Model 7001/7002. Note
that with the default trigger settings on the Model 7001/7002, line #1 is an input and line #2 is
an output. This complements the trigger lines on the Model 2015.
HI
1000V
PEAK
!
500V
PEAK
LO
INPUT
!
INV/PULSE
SOURCE
FUSE LINE
OUTPUT
500 mAT
(SB)
250 mAT
(SB)
2015 Multimeter
MADE IN
U.S.A.
TRIGGER
LINK
RS232
!
3 5
1
VMC
4 6
2
EXT TRIG
!
LINE RATING
100 VAC
50, 60Hz
120 VAC
40VA MAX
220 VAC
240 VAC
Trigger
Link
IEEE-488
(CHANGE IEEE ADDRESS
FROM FRONT PANEL)
120
7001 or 7002 Switch System
MADE IN USA
IN
OUT
Trigger
Link
350V
PEAK
SOURCE
OUTPUT
Trigger
Link Cable
(8501)
SENSE
Ω 4W
42V PEAK
For this example, the Model 2015 and 7001/7002 are configured as follows:
Model 2015:
Factory defaults restored (accessed from SHIFT-SETUP)
External scanning, channels 1 - 10, no timer, 10 readings (accessed from SHIFT-CONFIG)
External triggers (accessed from EXT TRIG)
Model 7001 or 7002:
Factory defaults restored
Scan list = 1!1-1!10,
Number of scans = 1
Channel spacing = TrigLink
To run the test and store readings in the Model 2015 with the unit set for external triggers,
press STEP or SCAN. The Model 2015 waits (with the asterisk annunciator lit) for an external
trigger from the Model 7001/7002.
Page 95

Fi
8
3-14 Measurement Options
Press STEP on the Model 7001/7002 to take it out of idle and start the scan. The scanner's
output pulse triggers the Model 2015 to take a reading, store it, and send a trigger pulse. The
following explanation on operation is referenced to the operation model shown in Figure 3-8.
gure 3-
Operation model for
triggering example
7001or 7002
Press STEP to start scan
Idle
Bypass
Wait for
Trigger Link
Trigger
C
D
No
Scan
Channel
Output
Trigger
Scanned
10
Channels
2015
Arm
B
Trigger
?
Trigger
Measurements
A
Wait for
Trigger Link
Trigger
Make
Measurement
Output
Trigger
Made
10
?
E
F
No
Yes
Yes
Page 96

Measurement Options 3-15
A
Pressing EXT TRIG then STEP or SCAN on the multimeter places it at point A in the
flowchart, where it is waiting for an external trigger.
B
Pressing STEP takes the Model 7001/7002 out of the idle state and places operation at
point B in the flowchart.
C
For the first pass through the model, the scanner does not wait at point B for a trigger.
Instead, it closes the first channel.
D
After the relay settles, the Model 7001/7002 outputs a Channel Ready pulse. Since the
instrument is programmed to scan ten channels, operation loops back up to point B, where it
waits for an input trigger.
E F
and Remember that the Model 2015 operation is at point A waiting for a trigger.
The output Channel Ready pulse from the Model 7001/7002 triggers the multimeter to measure
DUT #1 (point E). After the measurement is complete, the Model 2015 outputs a completion
pulse (point F) and then loops back to point A, where it waits for another input trigger.
The trigger applied to the Model 7001/7002 from the Model 2015 closes the next channel in
the scan. This triggers the multimeter to measure the next DUT. The process continues until all
ten channels are scanned and measured.
Page 97

WARNING:NO INTERNAL OPERATOR SERVICABLE PARTS,SERVICE BY QUALIFIED PERSONNEL ONLY.
WARNING:NO INTERNAL OPERATOR SERVICABLE PARTS,SERVICE BY QUALIFIED PERSONNEL ONLY.
CAUTION:FOR CONTINUED PROTECTION AGAINST FIRE HAZARD,REPLACE FUSE WITH SAME TYPE AND RATING.
CAUTION:FOR CONTINUED PROTECTION AGAINST FIRE HAZARD,REPLACE FUSE WITH SAME TYPE AND RATING.
Fi
9
D
3-16 Measurement Options
External triggering with BNC connections
An adapter cable is available to connect the micro-DIN Trigger Link of the Model 2015 to
instruments with BNC trigger connections. The Model 8503 DIN to BNC Trigger Cable has a
micro-DIN connector at one end and two BNC connectors at the other end. The BNC cables are
labeled VMC (trigger line 1) and EXT TRIG (trigger line 2).
Figure 3-9 shows how a Keithley Model 706 Scanner can be connected to the Trigger Link
of the Model 2015 using the adapter cable. With this adapter, a Model 706 could be substituted
for the Model 7001/7002 in the previous example. With the Model 706 set for External
Triggering, the test would start when the single scan mode is selected and initiated.
If the Model 2015 trigger line configuration has been changed from the factory setting, the
Model 8502 Trigger Link Adapter must be used to interface with instruments having BNC
trigger connections. It has two micro-DIN connectors and six BNC connectors, one for each
trigger line.
gure 3-
IN to BNC trigger cable
Model 8503 DIN to BNC Trigger Cable
350V
PEAK
SOURCE
OUTPUT
HI
1000V
TRIGGER
PEAK
!
500V
PEAK
LO
SENSE
INPUT
Ω 4W
42V PEAK
INV/PULSE
SOURCE
OUTPUT
3 5
1
4 6
2
!
!
FUSE LINE
100 VAC
500 mAT
120 VAC
(SB)
220 VAC
250 mAT
240 VAC
(SB)
LINK
!
VMC
EXT TRIG
LINE RATING
50, 60Hz
40VA MAX
MADE IN
U.S.A.
RS232
2015 Multimeter
Buffer operations
The Model 2015 has a buffer to store from two to 1024 readings and units. It also stores the
channel number for scanned readings and overflow readings. In addition, recalled data includes
statistical information, such as minimum, maximum, average, and standard deviation.
The buffer fills with the requested number of readings and stops. Readings are placed in the
buffer after any math operations are performed. Buffered data is overwritten each time the
storage operation is selected. The data is volatile; it is not saved through a power cycle.
The following paragraphs discuss storing and recalling buffered data.
IEEE-488
(CHANGE IEEE ADDRESS
FROM FRONT PANEL)
Channel
Ready
External
120
Trigger
706 Scanner
Page 98

Storing readings
Fi
10
B
Use the following procedure to store readings:
1. Set up the instrument for the desired configuration.
2. Press the STORE key.
3. Using the , , ▲, and ▼ keys to select the number of readings desired.
4. Press ENTER. The asterisk (*) annunciator turns on to indicate a data storage operation.
It will turn off when the storage is finished.
Recalling readings
Use the following steps to view stored readings and buffer statistics:
1. Press RECALL. The BUFFER annunciator indicates that stored readings are being
displayed. The arrow annunciator indicates that more data can be viewed with the ,
, ▲, and ▼ keys.
2. As shown in Figure 3-10, use the cursor keys to navigate through the reading numbers,
reading values, and statistics. For any of the buffer statistics (maximum, minimum,
average, statndard deviation), the STAT annunciator is on.
3. Use the EXIT key to return to the normal display.
Measurement Options 3-17
gure 3-
uffer locations
RANGE
RANGE
RDG NO. 10 Reading Value
RDG NO. 9 Reading Value
RDG NO. 8 Reading Value
RDG NO. 7 Reading Value
RDG NO. 6 Reading Value
RDG NO. 5 Reading Value
RDG NO. 4 Reading Value
RDG NO. 3 Reading Value
RDG NO. 2 Reading Value
RDG NO. 1 Reading Value
STD DEV Standard Deviation Value
Average Average Value
Min At XX Minimum Value
Max At XX Maximum Value
Page 99

3-18 Measurement Options
Buffer statistics
The MAX AT and MIN AT values are the maximum and minimum values in the buffer. The
AVERAGE value is the mean of the buffered readings. The equation used to calculate the mean
is:
where: xi is a stored reading
The STD DEV value is the standard deviation of the buffered readings. The equation used to
calculate the standard deviation is:
n
X
∑
i
i1=
-----------------=
y
n
n is the number of stored readings
where: xi is a stored reading
n is the number of stored readings
NOTE The Model 2015 uses IEEE-754 floating point format for math calculations.
Limit operations
Limit operations set and control the values that determine the HI / IN / LO status of
subsequent measurements. Limits can be applied to all measurement functions except
continuity. The limit test is performed after mX+b and percent math operations. Unit prefixes
are applied before the limit test, for example:
• Low limit = -1.0, High limit = 1.0
A 150mV reading equals 0.15V (IN).
• Low limit = -1.0, High limit = 1.0
A 0.6kΩ reading equals 600Ω (HI).
You can configure the multimeter to beep or not when readings are inside or outside of the
limit range.
n
∑
y =
i1=
--------------------------------------------------------------
2
1
X
---X
–
n
i
n-1
n
i1=
∑
2
i
Page 100

Setting limit values
Use the following steps to enter high and low limit values:
1. Press the SHIFT-LIMITS keys to view the present HI1 limit value:
Measurement Options 3-19
HI1:+1.000000
This value represents the absolute value of that function.
2. Use the or keys to move to the number field. Use the , , ▲, and ▼ keys to
enter the desired value. Move the cursor to the rightmost position (^) and use the ▲ and
▼ keys to move the decimal point.
3. Press ENTER to view the present LO1 limit value:
LO1:-1.000000
This value represents the absolute value of that function.
4. Enter the desired value for this low limit.
5. Press ENTER to view the present HI2 limits value:
HI2: +2.000000^
This value represents the absolute value of that function.
6. Enter the desired value for this high limit.
7. Press ENTER to view the present LO2 limit value:
LO2: -2.000000^
This value represents the absolute value of that function.
8. Enter the desired value for the low limit. Pressing ENTER returns to the normal display.
^
^
 Loading...