

Page 1

Test Equipment Depot - 800.517.8431 - 99 Washington Street Melrose, MA 02176 - TestEquipmentDepot.com
Model 2001 Multimeter
Operator’s Manual
2001-900-01 Rev. H / February 2009
EC N E D I FN OC F O E RUSA E MR E TA E R GA
Page 2

Page 3

WARRANTY
Keithley Instruments, Inc. warrants this product to be free from defects in material and workmanship for a period of
one (1) year from date of shipment.
Keithley Instruments, Inc. warrants the following items for 90
software, rechargeable batteries, diskettes, and documentation.
During the warranty period, Keithley Instruments will, at its option, either rep
to be defective.
To exercise this warranty, write or call your local Keithley Instruments representative, or contact
Keithley Instruments headquarters in Cleveland, Ohio. You will be given prompt assis
Send the product, transportation prepaid, to the indicated service facility. Repairs will be made and the product
returned, transportation prepaid. Repaired or replaced products are warranted for the balance of the original
warranty period, or at least 90 days.
days from the date of shipment: probes, cables,
air or replace any product that proves
tance and return instructions.
LIMITATION OF WARRANTY
This warranty does not apply to defects resulting from product modification without Keithley Instruments’ express
written consent, or misuse of any product or part. This warranty also does not apply to fuses, software,
non-rechargeable batteries, damage from battery leakage, or
instructions.
THIS WARRANTY IS IN LIEU OF ALL OTHER WARRANTIES, EXPRESSED OR IMPLIED, INCLUDING ANY
IMPLIED W
PROVIDED HEREIN ARE BUYER’S SOLE AND EXCLUSIVE REMEDIES.
NEITHER KEITHLEY INSTRUMENTS, INC. NOR ANY OF ITS EMPLOYEES
DIRECT, INDIRECT, SPECIAL, INCIDENTAL, OR CONSEQUENTIAL DAMAGES ARISING OUT OF THE USE
OF ITS INSTRUMENTS AND SOFTWARE, EVEN IF KEITHLEY INSTRUMENTS, INC. HAS BEEN ADVISED IN
ADVANCE OF THE POSSIBILITY OF SUCH DAMAGES. SUCH EXCLUDED DAMAGES SHALL INCLUDE, BUT
ARE NOT LIMITED TO: COST OF REMOVAL AND INSTALLATION, LOSSES SUSTAINED AS THE RESULT OF
INJURY TO ANY PERSON, OR DAMAGE TO PROPERTY.
ARRANTY OF MERCHANTABILITY OR FITNESS FOR A PARTICULAR USE. THE REMEDIES
problems arising from normal wear or failure to follow
SHALL BE LIABLE FOR ANY
A G R E A T E R M E A S U R E O F C O N F I D E N C E
3/07
Page 4

Page 5

Model 2001 Multimeter
Operator’s Manual
©2009, Keithley Instruments, Inc.
Cleveland, Ohio, U.S.A.
All rights reserved.
Any unauthorized reproduction, photocopy, or use of the information herein, in whole or in part, without the prior written approval
of Keithley Instruments, Inc. is strictly prohibited.
TSP™, TSP-Link™, and TSP-Net™ are trademarks of Keithley Instruments, Inc. All Keithley Instruments product names are
trademarks or registered trademarks of Keithley Instruments, Inc. Other brand names are trademarks or registered trademarks of
their respective holders.
Document Number: 2001-900-01 Rev. H / February 2009
Page 6

Page 7

The following safety precautions should be observed before using this product and any associated instrumentation. Although some
instruments and accessories would normally be used with non-hazardous voltages, there are situations where hazardous conditions may
be present.
This product is intended for use by qualified personnel who recognize shock hazards and are familiar with the safety precautions required
to avoid possible injury. Read and follow all installation, operation, and maintenance information carefully before using the product. Refer
to the user documentation for complete product specifications.
If the product is used in a manner not specified, the protection provided by the product warranty may be impaired.
The types of product users are:
Safety Precautions
Responsible body is t
operated within its specifications and operating limits, and for ensuring that operators are adequately trained.
Operators
ey must be protected from electric shock and contact with hazardous live circuits.
Th
Maintenance personnel
replacing consumable materials. Maintenance procedures are described in the user documentation. The procedures explicitly state if the
operator may perform them. Otherwise, they should be performed only by service personnel.
Service personnel are trained to work on live circuits, perform safe installations, and repair products. Only properly trained service
personnel may perform installation and service procedures.
Keithley Instruments products are designed for use with electrical signals that are rated Measurement Category I and Measurement
Category
data I/O signals are Measurement Category I and must not be directly connected to mains voltage or to voltage sources with high transient
over-voltages. Measurement Category II connections require protection for high transient over-voltages often associated with local AC
mains connections. Assume all measurement, control, and data I/O connections are for connection to Category I sources unless otherwise
marked or described in the user documentation.
Exercise extreme caution when a shock hazard is present. Lethal vo
American National Standards Institute (ANSI) states that a shock hazard exists when voltage levels greater than 30V RMS, 42.4V peak,
or 60VDC are present. A good safety practice is to expect that hazardous voltage is present in any unknown circuit before measuring.
Operators of this product must be protected from electric shock at all times. The responsible body must ensure that operators are
prev
Product operators in these circumstances must be trained to protect themselves from the risk of electric shock. If the circuit is capable of
operating at or above 1000V, no conductive part of the circuit may be exposed.
use the product for its intended function. They must be trained in electrical safety procedures and proper use of the instrument.
II, as described in the International Electrotechnical Commission (IEC) Standard IEC 60664. Most measurement, control, and
ented access and/or insulated from every connection point. In some cases, connections must be exposed to potential human contact.
he individual or group responsible for the use and maintenance of equipment, for ensuring that the equipment is
perform
routine procedures on the product to keep it operating properly, for example, setting the line voltage or
ltage may be present on cable connector jacks or test fixtures. The
Do not connect switching cards directly to unlimited power circuits. They are intended to be used with impedance-limited sources. NEVER
nnect switching cards directly to AC mains. When connecting sources to switching cards, install protective devices to limit fault current
co
and voltage to the card.
cti
Before operating an instrument, ensure that the line cord is connected to a properly-grounded power receptacle. Inspect the conne
cables, test leads, and jumpers for possible wear, cracks, or breaks before each use.
ng
11/0 7
Page 8

When installing equipment where access to the main power cord is restricted, such as rack mounting, a separate main input power
!
disconnect device must be provided in close proximity to the equipment and within easy reach of the operator.
For maximum safety, do not touch the product, test cables, or any other instruments while power is applied to the circuit under test.
AYS remove power from the entire test system and discharge any capacitors before: connecting or disconnecting cables or jumpers,
ALW
installing or removing switching cards, or making internal changes, such as installing or removing jumpers.
Do not touch any object that could provide a current path to the common side of the circuit under test or power line (earth) ground. Al
make measurements with dry hands while standing on a dry, insulated surface capable of withstanding the voltage being measured.
The instrument and accessories must be used in accordance with its specifications and operating instructions, or the safety of the
pment may be impaired.
equi
Do not exceed the maximum signal levels of the instruments and accessories, as defined in the specifications and operating inform
and as shown on the instrument or test fixture panels, or switching card.
When fuses are used in a product, replace with the same type and rating for continued protection against fire hazard.
Chassis connections must only be used as shield connections for measuring circuits, NOT as safety earth ground connections.
If you are using a test fixture, keep the lid closed while power is applied to the device under test. Safe operation requires the
interlock.
If a screw is present, connect it to safety earth ground using the wire recommended in the user documentation.
The symbol on an instrument indicates that the user should refer to the operating instructions located in the user documentation.
The symbol on an instrument shows that it can source or measure 1000V or more, including the combined effect of normal and
common mode voltages. Use standard safety precautions to avoid personal contact with these voltages.
The symbol on an instrument shows that the surface may be hot. Avoid personal contact to prevent burns.
The symbol indicates a connection terminal to the equipment frame.
use o
ways
atio
f a lid
n,
If this symbol is on a product, it indicates that mercury is present in the display lamp. Please note that the lamp must be properly
disposed of according to federal, state, and local laws.
ARNING heading in the user documentation explains dangers that might result in personal injury or death. Always read the
The W
associated information very carefully before performing the indicated procedure.
The CA
warranty.
Instrumentation and accessories shall not be connected to humans.
Before performing any maintenance, disconnect the line cord and all test cables.
To maintain protection from electric shock and fire, replacement components in mains circuits - including the power transformer, tes
and input jacks - must be purchased from Keithley Instruments. Standard fuses with applicable national safety approvals may be used if
the rating and type are the same. Other components that are not safety-related may be purchased from other suppliers as long as they
are equivalent to the original component (note that selected parts should be purchased only through Keithley Instruments to maintain
accuracy and functionality of the product). If you are unsure about the applicability of a replacement component, call a Keithley Instruments
office for information.
To clean an instrument, use a damp cloth or mild, water-based cleaner. Clean the exterior of the instrument only. Do not apply cl
directly to the instrument or allow liquids to enter or spill on the instrument. Products that consist of a circuit board with no case or chassis
(e.g., a data acquisition board for installation into a computer) should never require cleaning if handled according to instructions. If the
board becomes contaminated and operation is affected, the board should be returned to the factory for proper cleaning/servicing.
UTION he
ading in the user documentation explains hazards that could damage the instrument. Such damage may invalidate the
ads,
t le
eaner
Page 9

Table of Contents
1 General Information
1.1 Introduction......................................................................................................................................................... 1-1
1.2 Features ............................................................................................................................................................... 1-1
1.3 Warranty information.......................................................................................................................................... 1-2
1.4 Manual addenda .................................................................................................................................................. 1-2
1.5 Safety symbols and terms ................................................................................................................................... 1-2
1.6 Specifications ...................................................................................................................................................... 1-2
1.7 Inspection ............................................................................................................................................................ 1-2
1.8 Options and accessories ...................................................................................................................................... 1-2
2 Getting Started
2.1 Introduction......................................................................................................................................................... 2-1
2.2 Front and rear panel summary ............................................................................................................................ 2-1
2.2.1 Front panel .................................................................................................................................................. 2-1
2.2.2 Rear panel ................................................................................................................................................... 2-1
2.2.3 Front panel display...................................................................................................................................... 2-4
2.3 Overview of measurement process ..................................................................................................................... 2-6
2.3.1 Idle .............................................................................................................................................................. 2-7
2.3.2 Arm layer .................................................................................................................................................... 2-7
2.3.3 Scan layer.................................................................................................................................................... 2-7
2.3.4 Measure layer.............................................................................................................................................. 2-7
2.4 Initial configuration............................................................................................................................................. 2-7
2.5 Front panel operation .......................................................................................................................................... 2-8
2.5.1 Measuring DC voltage example.................................................................................................................. 2-8
2.5.2 Storing DC voltage readings example ...................................................................................................... 2-11
2.6 IEEE-488.2 and SCPI basics............................................................................................................................. 2-13
2.6.1 SCPI overview .......................................................................................................................................... 2-13
2.6.2 Compatibility ............................................................................................................................................ 2-13
2.6.3 Bus connection.......................................................................................................................................... 2-13
2.6.4 Primary address......................................................................................................................................... 2-13
2.6.5 Abbreviated common command summary ............................................................................................... 2-13
2.6.6 Abbreviated SCPI command summary..................................................................................................... 2-14
2.6.7 Syntax rules............................................................................................................................................... 2-16
2.6.8 Programming examples............................................................................................................................. 2-17
i
Page 10

3 Front Panel Operation
3.1 Introduction ......................................................................................................................................................... 3-1
3.2 Power-up procedure............................................................................................................................................. 3-1
3.2.1 Line power connections............................................................................................................................... 3-1
3.2.2 Line fuse replacement.................................................................................................................................. 3-2
3.2.3 Power-up sequence...................................................................................................................................... 3-2
3.2.4 High energy circuit safety precautions ........................................................................................................ 3-4
3.2.5 Power-on default conditions........................................................................................................................ 3-4
3.2.6 Warm-up period........................................................................................................................................... 3-4
3.2.7 IEEE-488 primary address .......................................................................................................................... 3-4
3.3 Display................................................................................................................................................................. 3-4
3.3.1 Display format ............................................................................................................................................. 3-4
3.3.2 Multiple displays ......................................................................................................................................... 3-6
3.3.3 Information messages.................................................................................................................................. 3-9
3.3.4 Status and error messages............................................................................................................................ 3-9
3.3.5 Menu structures ......................................................................................................................................... 3-11
3.3.6 EXIT key ................................................................................................................................................... 3-11
3.4 Functions ........................................................................................................................................................... 3-12
3.4.1 DC and AC voltage ................................................................................................................................... 3-13
3.4.2 DC and AC current.................................................................................................................................... 3-28
3.4.3 Two and four-wire resistance .................................................................................................................... 3-35
3.4.4 Frequency .................................................................................................................................................. 3-40
3.4.5 Temperature............................................................................................................................................... 3-43
3.5 Range................................................................................................................................................................. 3-52
3.5.1 Display resolution...................................................................................................................................... 3-52
3.5.2 Maximum readings.................................................................................................................................... 3-52
3.5.3 Manual ranging.......................................................................................................................................... 3-52
3.5.4 Autoranging............................................................................................................................................... 3-53
3.6 Relative.............................................................................................................................................................. 3-53
3.6.1 Configuring rel .......................................................................................................................................... 3-53
3.6.2 Enabling rel ............................................................................................................................................... 3-54
3.6.3 Multiple display of rel ............................................................................................................................... 3-54
3.7 Triggers.............................................................................................................................................................. 3-54
3.7.1 Trigger model ............................................................................................................................................ 3-54
3.7.2 Configuring the measure layer .................................................................................................................. 3-59
3.7.3 Configuring the scan layer......................................................................................................................... 3-62
3.7.4 Configuring the arm layer ......................................................................................................................... 3-64
3.7.5 Halting triggers.......................................................................................................................................... 3-66
3.7.6 External triggering..................................................................................................................................... 3-66
3.7.7 Trigger Link............................................................................................................................................... 3-69
3.8 Buffer................................................................................................................................................................. 3-80
3.8.1 Burst mode................................................................................................................................................. 3-80
3.8.2 Configuring data storage ........................................................................................................................... 3-83
3.8.3 Storing and recalling readings ................................................................................................................... 3-84
3.8.4 Buffer multiple displays ............................................................................................................................ 3-85
3.9 Filters................................................................................................................................................................. 3-86
3.9.1 Digital filter types...................................................................................................................................... 3-86
3.9.2 Digital filter modes.................................................................................................................................... 3-86
3.9.3 Response time (Digital filter) .................................................................................................................... 3-88
3.9.4 Auto filtering (Digital) .............................................................................................................................. 3-88
3.9.5 Configuring the digital filter...................................................................................................................... 3-88
3.9.6 Enabling/disabling the filter ...................................................................................................................... 3-90
3.9.7 Analog filter............................................................................................................................................... 3-91
ii
Page 11

3.10 Math .................................................................................................................................................................. 3-92
3.10.1 mX+b ........................................................................................................................................................ 3-92
3.10.2 Percent....................................................................................................................................................... 3-93
3.10.3 Percent deviation ...................................................................................................................................... 3-93
3.10.4 Configuring math ...................................................................................................................................... 3-93
3.10.5 Enabling math ........................................................................................................................................... 3-94
3.10.6 Calculate multiple display......................................................................................................................... 3-94
3.11 Scanning............................................................................................................................................................ 3-94
3.11.1 Scanning overview.................................................................................................................................... 3-94
3.11.2 Front panel scanner controls ..................................................................................................................... 3-95
3.11.3 Using CHAN to close and open internal channels.................................................................................... 3-95
3.11.4 Using CONFIG-CHAN to configure channels ......................................................................................... 3-96
3.11.5 Using CONFIG-SCAN to configure scanning.......................................................................................... 3-98
3.11.6 Using SCAN to configure scan parameters .............................................................................................. 3-99
3.11.7 Starting and stopping scanning ................................................................................................................. 3-99
3.11.8 Scanner operation examples.................................................................................................................... 3-101
3.12 Menu ............................................................................................................................................................... 3-105
3.12.1 SAVESETUP .......................................................................................................................................... 3-107
3.12.2 GPIB........................................................................................................................................................ 3-114
3.12.3 CALIBRATION...................................................................................................................................... 3-115
3.12.4 TEST ....................................................................................................................................................... 3-116
3.12.5 LIMITS ................................................................................................................................................... 3-116
3.12.6 STATUS-MSG........................................................................................................................................ 3-119
3.12.7 GENERAL .............................................................................................................................................. 3-119
4 IEEE-488 Reference
4.1 Introduction......................................................................................................................................................... 4-1
4.2 IEEE-488 bus connections .................................................................................................................................. 4-1
4.3 Primary address selection.................................................................................................................................... 4-3
4.4 Controller programming ..................................................................................................................................... 4-4
4.5 Front panel aspects of IEEE-488 operation ........................................................................................................ 4-4
4.5.1 Error and status messages ........................................................................................................................... 4-4
4.5.2 IEEE-488 status indicators.......................................................................................................................... 4-4
4.5.3 LOCAL key................................................................................................................................................. 4-5
4.6 Status structure.................................................................................................................................................... 4-5
4.6.1 Standard event status................................................................................................................................... 4-5
4.6.2 Operation event status................................................................................................................................. 4-7
4.6.3 Arm event status.......................................................................................................................................... 4-9
4.6.4 Sequence event status................................................................................................................................ 4-11
4.6.5 Trigger event status................................................................................................................................... 4-13
4.6.6 Measurement event status ......................................................................................................................... 4-15
4.6.7 Questionable event status.......................................................................................................................... 4-16
4.6.8 Queues....................................................................................................................................................... 4-18
4.6.9 Status byte and service request (SRQ)...................................................................................................... 4-19
4.7 Trigger Model (IEEE-488 operation)................................................................................................................ 4-21
4.8 General bus commands ..................................................................................................................................... 4-25
4.8.1 REN (remote enable) ................................................................................................................................ 4-26
4.8.2 IFC (interface clear) .................................................................................................................................. 4-26
4.8.3 LLO (local lockout) .................................................................................................................................. 4-26
4.8.4 GTL (go to local) and local....................................................................................................................... 4-27
4.8.5 DCL (device clear).................................................................................................................................... 4-27
4.8.6 SDC (selective device clear) ..................................................................................................................... 4-27
4.8.7 GET (group execute trigger) ..................................................................................................................... 4-27
iii
Page 12

4.8.8 SPE, SPD (serial polling) .......................................................................................................................... 4-27
4.9 Programming syntax.......................................................................................................................................... 4-29
4.10 Common commands.......................................................................................................................................... 4-35
4.10.1 *CLS
4.10.2 *ESE
4.10.3 *ESE?
4.10.4 *ESR?
4.10.5 *IDN?
4.10.6 *OPC
4.10.7 *OPC?
4.10.8 *OPT?
4.10.9 *RCL
4.10.10 *RST
4.10.11 *SAV
4.10.12 *SRE
4.10.13 *SRE?
4.10.14 *STB?
4.10.15 *TRG
4.10.16 *TST?
4.10.17 *WAI
4.11 Signal oriented measurement commands .......................................................................................................... 4-51
4.12 SCPI command subsystems............................................................................................................................... 4-57
4.13 Calculate subsystems......................................................................................................................................... 4-59
4.13.1 :CALCulate[1]............................................................................................................................................4-60
4.13.2 :CALCulate2.............................................................................................................................................. 4-65
4.13.3 :CALCulate3.............................................................................................................................................. 4-68
4.14 :CALibration subsystem.................................................................................................................................... 4-77
4.15 :DISPlay subsystem........................................................................................................................................... 4-79
4.16 :FORMat subsystem .......................................................................................................................................... 4-85
4.17 :OUTput subsystem ........................................................................................................................................... 4-92
4.18 :ROUTe subsystem............................................................................................................................................ 4-94
4.18.1 :CLOSe <list>............................................................................................................................................ 4-95
4.18.2 :OPEN <list> ............................................................................................................................................. 4-96
4.18.3 :OPEN:ALL............................................................................................................................................... 4-97
4.18.4 :SCAN commands ..................................................................................................................................... 4-98
4.19 Sense subsystems............................................................................................................................................. 4-107
4.19.1 [:SENse[1]] subsystem ............................................................................................................................ 4-115
4.19.2 :ALTernate[1] commands ....................................................................................................................... 4-116
4.19.3 :FUNCtion <name>................................................................................................................................. 4-116
4.19.4 DATA commands.................................................................................................................................... 4-117
4.19.5 :APERture <n> ........................................................................................................................................ 4-118
4.19.6 :NPLCycles <n> ...................................................................................................................................... 4-123
4.19.7 :COUPling AC|DC .................................................................................................................................. 4-127
4.19.8 RANGe commands.................................................................................................................................. 4-128
4.19.9 :REFerence <n>....................................................................................................................................... 4-133
4.19.10 :DIGits <n>.............................................................................................................................................. 4-137
4.19.11 :AVERage commands ............................................................................................................................. 4-141
4.19.12 :Filter ....................................................................................................................................................... 4-148
4.19.13 :DETector commands.............................................................................................................................. 4-149
4.19.14 :PWINdow <n> ....................................................................................................................................... 4-150
4.19.15 :METHod <name> .................................................................................................................................. 4-151
4.19.16 :SOURce <name>.................................................................................................................................... 4-151
4.19.17 THReshold commands ............................................................................................................................ 4-152
4.19.18 :TRANsducer <name> ............................................................................................................................ 4-155
clear status.................................................................................................................................. 4-36
event enable................................................................................................................................ 4-36
event enable query .................................................................................................................... 4-38
event status register query ........................................................................................................ 4-38
identification query................................................................................................................... 4-40
operation complete..................................................................................................................... 4-40
operation complete query......................................................................................................... 4-41
option identification query ....................................................................................................... 4-42
recall .......................................................................................................................................... 4-43
reset ............................................................................................................................................ 4-43
save ............................................................................................................................................ 4-43
service request enable ................................................................................................................ 4-44
service request enable query..................................................................................................... 4-45
status byte query....................................................................................................................... 4-46
trigger ........................................................................................................................................ 4-47
self-test query ........................................................................................................................... 4-48
wait-to-continue......................................................................................................................... 4-48
iv
Page 13

4.19.19 :RTD commands .................................................................................................................................... 4-156
4.19.20 :SPRTD .................................................................................................................................................. 4-159
4.19.21 :TCouple:TYPE <name> ........................................................................................................................ 4-160
4.19.22 :RJUNctionX........................................................................................................................................... 4-161
4.19.23 :REAL commands .................................................................................................................................. 4-163
4.19.24 :OCOMpensated <b> .............................................................................................................................. 4-165
4.19.25 :SENSe2 subsystem ................................................................................................................................ 4-165
4.20 :SOURce subsystem........................................................................................................................................ 4-167
4.21 :STATus subsystem ........................................................................................................................................ 4-169
4.21.1 [:EVENt]? ............................................................................................................................................... 4-170
4.21.2 :ENABle <NRf> ..................................................................................................................................... 4-176
4.21.3 :PTRansition <NRf> ............................................................................................................................... 4-180
4.21.4 :NTRansition <NRf>............................................................................................................................... 4-188
4.21.5 :CONDition? ........................................................................................................................................... 4-191
4.21.6 :PRESET ................................................................................................................................................. 4-192
4.21.7 :QUEue commands ................................................................................................................................. 4-192
4.22 :SYSTem subsystem ....................................................................................................................................... 4-197
4.22.1 :PRESet ................................................................................................................................................... 4-197
4.22.2 :POSetup <name> ................................................................................................................................... 4-198
4.22.3 :FRSWitch?............................................................................................................................................. 4-198
4.22.4 :VERSion? .............................................................................................................................................. 4-199
4.22.5 :ERRor?................................................................................................................................................... 4-199
4.22.6 :AZERo commands................................................................................................................................. 4-200
4.22.7 :AMEThod <name> ................................................................................................................................ 4-202
4.22.8 :LSYNc:STATe <b> ............................................................................................................................... 4-206
4.22.9 :KEY <NRf> ........................................................................................................................................... 4-207
4.22.10 :CLEar..................................................................................................................................................... 4-209
4.22.11 :FETCh:FORMat <name> ...................................................................................................................... 4-209
4.23 :TRACe subsystem ......................................................................................................................................... 4-211
4.23.1 :CLEar [BUFFER,] ................................................................................................................................. 4-211
4.23.2 :FREE? [BUFFER,] ................................................................................................................................ 4-212
4.23.3 :EGRoup [BUFFER,] <name>................................................................................................................ 4-212
4.23.4 :POINts [BUFFER,] <n> ........................................................................................................................ 4-213
4.23.5 :FEED [BUFFER,] <name>.................................................................................................................... 4-214
4.23.6 :DATA? [BUFFER,]............................................................................................................................... 4-219
4.24 Trigger subsystem ........................................................................................................................................... 4-221
4.24.1 :INITiate commands ............................................................................................................................... 4-222
4.24.2 :ABORt ................................................................................................................................................... 4-223
4.24.3 :IMMediate.............................................................................................................................................. 4-223
4.24.4 :COUNt <n>............................................................................................................................................ 4-224
4.24.5 :DELay <n>............................................................................................................................................. 4-225
4.24.6 :SOURce <name> ................................................................................................................................... 4-226
4.24.7 :TIMer <n>.............................................................................................................................................. 4-227
4.24.8 :SIGNal ................................................................................................................................................... 4-228
4.24.9 TCONfigure commands.......................................................................................................................... 4-228
4.25 :UNIT subsystem ............................................................................................................................................ 4-233
v
Page 14

APPENDICES
A Specifications ............................................................................................................................................ A-1
B Default Conditions...................................................................................................................................... B-1
C IEEE-488.2 Common Commands .............................................................................................................. C-1
D SCPI Command Subsystems ...................................................................................................................... D-1
E Interface Function Codes............................................................................................................................ E-1
F ASCII Character Codes and IEEE-488 Multiline Interface Command Messages ..................................... F-1
G Controller Programs ................................................................................................................................... G-1
H IEEE-488 Bus Overview ............................................................................................................................ H-1
I IEEE-488 Conformance Information .......................................................................................................... I-1
J SCPI Conformance Information.................................................................................................................. J-1
vi
Page 15

List of Illustrations
2 Getting Started
Figure 2-1 Model 2001 front panel............................................................................................................................... 2-2
Figure 2-2 Model 2001 rear panel ................................................................................................................................ 2-3
Figure 2-3 Simplified model of measurement operation .............................................................................................. 2-6
Figure 2-4 Typical DC voltage connections ................................................................................................................. 2-9
3 Front Panel Operation
Figure 3-1 Model 2001 display formats ....................................................................................................................... 3-5
Figure 3-2 Scientific notation with calculate multiple display ..................................................................................... 3-5
Figure 3-3 Bar graph (zero-at-left) multiple display..................................................................................................... 3-8
Figure 3-4 Zero-centered bar graph multiple display ................................................................................................... 3-8
Figure 3-5 Maximum and minimum multiple display.................................................................................................. 3-9
Figure 3-6 DC voltage measurements ........................................................................................................................ 3-14
Figure 3-7 AC voltage measurements ........................................................................................................................ 3-14
Figure 3-8 Positive and negative peak spikes............................................................................................................. 3-21
Figure 3-9 DC voltage multifunction multiple displays ............................................................................................. 3-22
Figure 3-10 AC voltage multifunction multiple displays ............................................................................................. 3-26
Figure 3-11 DC and AC current measurements............................................................................................................ 3-29
Figure 3-12 DC in-circuit current measurements ......................................................................................................... 3-33
Figure 3-13 AC current multifuncton multiple displays............................................................................................... 3-35
Figure 3-14 Two-wire resistance measurements .......................................................................................................... 3-36
Figure 3-15 Four-wire resistance measurements .......................................................................................................... 3-37
Figure 3-16 Frequency measurements.......................................................................................................................... 3-41
Figure 3-17 4-wire RTD temperature measurements ................................................................................................... 3-44
Figure 3-18 3-wire RTD temperature measurements ................................................................................................... 3-45
Figure 3-19 2-wire RTD temperature measurements ................................................................................................... 3-45
Figure 3-20 Thermocouple configuration..................................................................................................................... 3-46
Figure 3-21 Temperature equations.............................................................................................................................. 3-48
Figure 3-22 Trigger model (front panel operation)....................................................................................................... 3-56
Figure 3-23 External triggering connectors (BNC) ...................................................................................................... 3-66
Figure 3-24 External triggering and asynchronous trigger link input pulse specifications .......................................... 3-66
Figure 3-25 Meter complete and asynchronous trigger link output pulse specifications ............................................. 3-67
Figure 3-26 DUT test system........................................................................................................................................ 3-67
Figure 3-27 External trigger connectors ....................................................................................................................... 3-68
Figure 3-28 Trigger link connectors ............................................................................................................................. 3-69
Figure 3-29 DUT test system........................................................................................................................................ 3-70
Figure 3-30 Trigger Link connections (asynchronous example #1)............................................................................. 3-70
Figure 3-31 Operation model for asynchronous trigger link example #1..................................................................... 3-72
Figure 3-32 Connections using Trigger Link adapter................................................................................................... 3-73
vii
Page 16

Ω
Figure 3-33 DUT test system (asynchronous example #2) ........................................................................................... 3-73
Figure 3-34 Trigger Link connections (asynchronous example #2) ............................................................................. 3-74
Figure 3-35 Operation model for asynchronous Trigger Link example #2 .................................................................. 3-76
Figure 3-36 Semi-synchronous Trigger Link specifications......................................................................................... 3-77
Figure 3-37 Typical semi-synchronous mode connections........................................................................................... 3-77
Figure 3-38 Trigger Link connections (semi-synchronous example) ........................................................................... 3-78
Figure 3-39 Operation mode for semi-synchronous Trigger Link example ................................................................. 3-79
Figure 3-40 Digital filter ............................................................................................................................................... 3-87
Figure 3-41 Analog filter............................................................................................................................................... 3-92
Figure 3-42 SCAN key menu structure....................................................................................................................... 3-100
Figure 3-43 SCAN key menu structure for ratio and delta ......................................................................................... 3-101
Figure 3-44 Limits bar graph example........................................................................................................................ 3-117
Figure 3-45 Using limit test to sort 100
Figure 3-46 Digital I/O port ........................................................................................................................................ 3-120
Figure 3-47 Digital I/O port simplified schematic ..................................................................................................... 3-121
Figure 3-48 Sample externally powered relay ........................................................................................................... 3-122
Figure 3-49 Line cycle synchronization...................................................................................................................... 3-125
resistors..................................................................................................... 3-119
4 IEEE-488 Reference
Figure 4-1 IEEE-488 connector .................................................................................................................................... 4-2
Figure 4-2 IEEE-488 connections ................................................................................................................................. 4-2
Figure 4-3 IEEE-488 connector location ...................................................................................................................... 4-2
Figure 4-4 Contact assignments .................................................................................................................................... 4-3
Figure 4-5 Model 2001 status register structure............................................................................................................ 4-6
Figure 4-6 Standard event status ................................................................................................................................... 4-7
Figure 4-7 Operation event status ................................................................................................................................. 4-8
Figure 4-8 Arm event status ........................................................................................................................................ 4-10
Figure 4-9 Sequence event status ................................................................................................................................ 4-11
Figure 4-10 Trigger event status ................................................................................................................................... 4-13
Figure 4-11 Measurement event status.......................................................................................................................... 4-15
Figure 4-12 Questionable event status .......................................................................................................................... 4-17
Figure 4-13 Status byte and service request (SRQ) ...................................................................................................... 4-19
Figure 4-14 Trigger Model (IEEE-488 bus operation) ................................................................................................. 4-22
Figure 4-15 Standard Event Enable Register ................................................................................................................ 4-37
Figure 4-16 Standard Event Status Register ................................................................................................................. 4-39
Figure 4-17 Service Request Enable Register............................................................................................................... 4-45
Figure 4-18 Status Byte Register .................................................................................................................................. 4-47
Figure 4-19 ASCII data format ..................................................................................................................................... 4-86
Figure 4-20 IEEE754 single precision data format (32 data bits)................................................................................. 4-87
Figure 4-21 IEEE754 double precision data format (64 data bits) ............................................................................... 4-87
Figure 4-22 Measurement Event Register................................................................................................................... 4-172
Figure 4-23 Questionable Event Register ................................................................................................................... 4-173
Figure 4-24 Operation Event Register ........................................................................................................................ 4-174
Figure 4-25 Trigger Event Register ............................................................................................................................ 4-174
Figure 4-26 Arm Event Register ................................................................................................................................. 4-175
Figure 4-27 Sequence Event Register ......................................................................................................................... 4-175
Figure 4-28 Measurement Event Enable Register....................................................................................................... 4-177
Figure 4-29 Questionable Event Enable Register ....................................................................................................... 4-178
Figure 4-30 Operation Event Enable Register ............................................................................................................ 4-178
Figure 4-31 Trigger Event Enable Register ................................................................................................................ 4-179
Figure 4-32 Arm Event Enable Register ..................................................................................................................... 4-179
Figure 4-33 Sequence Event Enable Register ............................................................................................................. 4-179
viii
Page 17

Figure 4-34 Measurement Transition Filter................................................................................................................ 4-182
Figure 4-35 Questionable Transition Filter ................................................................................................................ 4-183
Figure 4-36 Operation Transition Filter...................................................................................................................... 4-184
Figure 4-37 Trigger Transition Filter.......................................................................................................................... 4-185
Figure 4-38 Arm Transition Filter .............................................................................................................................. 4-186
Figure 4-39 Sequence Transition Filter ...................................................................................................................... 4-187
Figure 4-40 Key-press codes ...................................................................................................................................... 4-208
APPENDICES
Figure H-1 IEEE-488 bus configuration....................................................................................................................... H-2
Figure H-2 IEEE-488 handshake sequence .................................................................................................................. H-3
Figure H-3 Commands codes ....................................................................................................................................... H-6
ix
Page 18

Ω
Ω
Ω
Ω
Ω
Ω
List of Tables
2 Getting Started
Table 2-1 DCV multiple displays............................................................................................................................... 2-5
Table 2-2 Menu summary .......................................................................................................................................... 2-6
Table 2-3 CONFIGURE DCV menu structure ........................................................................................................ 2-10
Table 2-4 Multiple displays for recalled readings.................................................................................................... 2-12
Table 2-5 Burst mode availability ............................................................................................................................ 2-12
Table 2-6 Abbreviated common command summary .............................................................................................. 2-14
Table 2-7 Abbreviated SCPI command summary.................................................................................................... 2-15
3 Front Panel Operation
Table 3-1 Data checked on power-up......................................................................................................................... 3-3
Table 3-2 Power-up error messages ........................................................................................................................... 3-3
Table 3-3 Multiple displays by function .................................................................................................................... 3-7
Table 3-4 Status and error messages ........................................................................................................................ 3-10
Table 3-5 EXIT key actions ..................................................................................................................................... 3-12
Table 3-6 CONFIGURE DCV menu structure ........................................................................................................ 3-15
Table 3-7 CONFIGURE ACV menu structure ........................................................................................................ 3-16
Table 3-8 DCV and ACV integration times set-by-resolution................................................................................. 3-17
Table 3-9 DCV and ACV auto filter ........................................................................................................................ 3-18
Table 3-10 DCV and ACV auto resolution ................................................................................................................ 3-18
Table 3-11 CONFIGURE DCI menu structure .......................................................................................................... 3-30
Table 3-12 CONFIGURE ACI menu structure .......................................................................................................... 3-31
Table 3-13 DCI and ACI integration time set-by-resolution...................................................................................... 3-31
Table 3-14 DCI and ACI auto filter ........................................................................................................................... 3-32
Table 3-15 DCI and ACI auto resolution ................................................................................................................... 3-32
Table 3-16 CONFIGURE OHMS-2W menu structure .............................................................................................. 3-37
Table 3-17 CONFIGURE OHMS-4W menu structure .............................................................................................. 3-38
Table 3-18
Table 3-19
Table 3-20
Table 3-21 Trigger level range and increments.......................................................................................................... 3-41
Table 3-22 CONFIGURE FREQUENCY menu structure ......................................................................................... 3-42
Table 3-23 CONFIG TEMPERATURE menu structure ............................................................................................ 3-47
Table 3-24 Translating SPRTD coefficients .............................................................................................................. 3-49
Table 3-25 Temperature integration time set-by-resolution....................................................................................... 3-50
Table 3-26 Temperature auto resolution .................................................................................................................... 3-51
Table 3-27 Allowable rel values................................................................................................................................. 3-53
Table 3-28 CONFIGURE TRIGGER menu structure................................................................................................ 3-55
Table 3-29 Reading storage options ........................................................................................................................... 3-80
2 and
2 and
2 and
4 integration time set-by-resolution ......................................................................................... 3-38
4 auto filter ............................................................................................................................... 3-39
4 auto resolution....................................................................................................................... 3-39
xi
Page 19

Ω
Ω
Ω
Ω
Ω
Ω
Table 3-30 CONFIG DATA STORE menu structure.................................................................................................. 3-80
Table 3-31 Available functions in burst mode............................................................................................................. 3-81
Table 3-32 Burst mode sequence ................................................................................................................................. 3-82
Table 3-33 Fill-and-stop sequence ............................................................................................................................... 3-84
Table 3-34 Pretrigger sequence ................................................................................................................................... 3-85
Table 3-35 Continuous sequence ................................................................................................................................. 3-85
Table 3-36 Auto filters ................................................................................................................................................. 3-89
Table 3-37 CONFIG-FILTER menu structure ............................................................................................................ 3-89
Table 3-38 CONFIGURE MATH menu structure....................................................................................................... 3-93
Table 3-39 CHANNEL SELECTION menu structure ................................................................................................ 3-95
Table 3-40 CONFIGURE CHANNELS menu structure ............................................................................................. 3-96
Table 3-41 SCAN OPERATION menu structure ........................................................................................................ 3-98
Table 3-42 Main menu structure ................................................................................................................................ 3-106
Table 3-43 Factory default conditions ....................................................................................................................... 3-109
Table 3-44 Limit values and actions ......................................................................................................................... 3-118
4 IEEE-488 Reference
Table 4-1 IEEE contact designations........................................................................................................................... 4-3
Table 4-2 HP BASIC 4.0 IEEE-488 statements .......................................................................................................... 4-4
Table 4-3 General bus commands and associated BASIC statements....................................................................... 4-26
Table 4-4 IEEE-488.2 common commands and queries ........................................................................................... 4-35
Table 4-5 Signal oriented measurement command summary.................................................................................... 4-51
Table 4-6 Calculate command summary ................................................................................................................... 4-59
Table 4-7 CALibrate command summary ................................................................................................................. 4-77
Table 4-8 DISPlay command summary..................................................................................................................... 4-79
Table 4-9 FORMat command summary .................................................................................................................... 4-85
Table 4-10 OUTPut command summary ..................................................................................................................... 4-92
Table 4-11 ROUTe command summary ...................................................................................................................... 4-94
Table 4-12 SENSe command summary ..................................................................................................................... 4-107
Table 4-13 Auto aperture; ACI .................................................................................................................................. 4-121
Table 4-14 Auto aperture; DCI .................................................................................................................................. 4-121
Table 4-15 Auto aperture; ACV ................................................................................................................................ 4-122
Table 4-16 Auto aperture; DCV,
Table 4-17 Auto NPLC; ACI ..................................................................................................................................... 4-126
Table 4-18 Auto NPLC; DCI ..................................................................................................................................... 4-126
Table 4-19 Auto NPLC; ACV ................................................................................................................................... 4-126
Table 4-20 Auto NPLC; DCV,
Table 4-21 Auto resolution; ACI ............................................................................................................................... 4-139
Table 4-22 Auto resolution; DCI ............................................................................................................................... 4-140
Table 4-23 Auto resolution; ACV.............................................................................................................................. 4-140
Table 4-24 Auto resolution; DCV,
Table 4-25 Auto resolution; TEMP ........................................................................................................................... 4-141
Table 4-26 RTD coefficients to Model 2001 coefficients ........................................................................................ 4-159
Table 4-27 SOURce command summary .................................................................................................................. 4-167
Table 4-28 STATus command summary ................................................................................................................... 4-169
Table 4-29 SYSTem command summary .................................................................................................................. 4-197
Table 4-30 Minimum delay times for stream mode................................................................................................... 4-205
Table 4-31 TRACe command summary .................................................................................................................... 4-211
Table 4-32 Trigger command summary .................................................................................................................... 4-221
Table 4-33 UNIT command summary ....................................................................................................................... 4-233
2 and
2 and
2 and
4............................................................................................................. 4-122
4 ............................................................................................................... 4-127
4.......................................................................................................... 4-140
xii
Page 20

APPENDICES
Table D-1 Calculate command summary.................................................................................................................... D-2
Table D-2 CALibrate command summary.................................................................................................................. D-3
Table D-3 DISPlay command summary ..................................................................................................................... D-4
Table D-4 FORMat command summary..................................................................................................................... D-5
Table D-5 OUTPut command summary ..................................................................................................................... D-5
Table D-6 ROUTe command summary ...................................................................................................................... D-6
Table D-7 SENSe command summary ....................................................................................................................... D-7
Table D-8 SOURce command summary................................................................................................................... D-16
Table D-9 STATus command summary ................................................................................................................... D-16
Table D-10 SYSTem command summary .................................................................................................................. D-17
Table D-11 TRACe command summary..................................................................................................................... D-18
Table D-12 Trigger command summary ..................................................................................................................... D-19
Table D-13 UNIT command summary ....................................................................................................................... D-20
Table E-1 Model 2001 interface function codes.......................................................................................................... E-1
Table G-1 BASIC statements necessary to send bus commands ................................................................................ G-3
Table H-1 IEEE-488 bus command summary ............................................................................................................ H-4
Table H-2 Hexadecimal and decimal command codes ............................................................................................... H-7
Table H-3 Typical addressed command sequence ...................................................................................................... H-7
Table H-4 Typical common command sequence ........................................................................................................ H-7
Table H-5 IEEE command groups .............................................................................................................................. H-8
Table I-1 IEEE-488 documentation requirements ....................................................................................................... I-1
Table I-2 Coupled commands ...................................................................................................................................... I-2
Table J-1 Syntax of SCPI confirmed commands implemented by Model 2001......................................................... J-1
Table J-2 Syntax of non-SCPI commands implemented by Model 2001................................................................... J-7
xiii
Page 21

1
General Information
1.1 Introduction
This section contains general information about the Model
2001 Multimeter. It is arranged in the following manner:
1.2 Features
1.3 Warranty information
1.4 Manual addenda
1.5 Safety symbols and terms
1.6 Specifications
1.7 Inspection
1.8 Options and accessories
1.2 Features
Some important Model 2001 features include:
• Full range of functions
multimeter can measure DC voltage (normal and peak
spikes), AC voltage (RMS, average, and peak), DC current (normal and in-circuit), AC current (RMS and average), two and four-wire resistance (normal and offsetcompensated), frequency, and temperature (resistance
temperature devices or thermocouples).
• Two-line display
are shown on an alphanumeric display having a 20character top line and a 32-character bottom line.
• Multifunction measuring and display
panel, you can configure the instrument to sequentially
measure and simultaneously display readings of multiple functions.
Among other functions, the
Readings and front panel messages
From the front
• Reading and setup storage
can be stored and recalled from the front panel or over
the IEEE-488 bus. For example, the buffer can be programmed to store up to 850 readings at 4.5 digits, or up
to 250 time-stamped readings at 6.5 digits. The Model
2001 can be configured with memory options that extend the storage capacity up to 30,000 readings and ten
setups.
• High-speed measurements
of acquiring, for example, 2000 readings/second at 4.5
digits of resolution, and 215 readings/second at 6.5
digits.
• Talk-only mode
instrument to send readings to an IEEE-488 printer or,
with an optional adapter, to a Centronics printer.
• Digital calibration
calibrated from either the front panel or over the bus.
• Standard IEEE-488 interface
forms to the IEEE-488.2 and SCPI standards.
• Trigger link
vides more versatile and precise external triggering. It
is in addition to the standard Trigger In/Measurement
Complete BNC external triggering techniques.
• Optional field-installable internal scanner
10-channel scanner card, which includes eight channels
of 2-pole relay switching and two channels of 2-pole
solid-state switching. All channels can be configure
for 4-pole operation.
From the front panel, you can set the
The instrument may be digitally
This is a new trigger concept that pro-
Readings and setup data
The instrument is capable
Bus operation con-
This is a
1-1
Page 22

General Information
1.3 Warranty information
Warranty information is located on the inside front cover of
this instruction manual. Should your Model 2001 require
warranty service, contact the Keithley representative or authorized repair facility in your area for further information.
When returning the instrument for repair, be sure to fill out
and include the service form at the back of this manual to
provide the repair facility with the necessary information.
1.4 Manual addenda
Any improvements or changes concerning the instrument or
manual will be explained in an addendum included with the
manual. Be sure to note these changes and incorporate them
into the manual.
1.5 Safety symbols and terms
The following symbols and terms may be found on an instrument or used in this manual.
!
The symbol on an instrument indicates that the user
should refer to the operating instructions located in the manual.
physical damage that may have occurred during transit.
(Note: There may be a protective film over the display lens,
which can be removed.) Report any damage to the shipping
agent immediately. Save the original packing carton for possible future reshipment. The following items are included
with every Model 2001 order:
• Model 2001 Multimeter (with MEM1 or MEM2 memory option, if ordered) with line cord.
• Model 8605 High Performance Modular Test Leads.
• Model 2001 Operator’s Manual and Model 2001 Calibration Manual.
• Accessories as ordered.
• Full calibration data (conforming to MIL-STD
45662A).
If an additional manual is required, order the appropriate
manual package:
• Keithley part number 2001-900-00 for the Operator’s
Manual.
• Keithley part number 2001-905-00 for the Calibration
Manual.
• Keithley part number 2001-902-00 for the Repair Manual.
The manual packages include a manual and any pertinent addenda.
The symbol on an instrument shows that high voltage
may be present on the terminal(s). Use standard safety precautions to avoid personal contact with these voltages.
The
WARNING
gers that might result in personal injury or death. Always
read the associated information very carefully before performing the indicated procedure.
The
CAUTION
ards that could damage the instrument. Such damage may invalidate the warranty.
heading used in this manual explains dan-
heading used in this manual explains haz-
1.6 Specifications
Full Model 2001 specifications are included in Appendix A.
1.7 Inspection
The Model 2001 was carefully inspected, both electrically
and mechanically before shipment. After unpacking all items
from the shipping carton, check for any obvious signs of
1.8 Options and accessories
The following options and accessories are available from
Keithley for use with the Model 2001.
Model 1050 Padded Carrying Case —
a Model 2001 or a Model 7001. Includes handles and shoulder strap.
Models 2001/MEM1 and 2001/MEM2 —
configurations of the Model 2001 extend its storage capacity.
The MEM1 option has 32K-bytes for non-volatile storage of
fi e setups, and 7000 readings in compact format or 1400
readings in full format. The MEM2 option has 128K-bytes
for non-volatile storage of ten setups, and 30000 compact
readings or 6000 full readings.
Model 2001-SCAN —
that installs within the Model 2001. It has eight channels of
2-pole relay switching and two channels of 2-pole solid-state
switching. All channels can be configured for 4-pole operation. Included are two pairs of leads for connection to Model
2001 rear panel inputs (Keithley part number CA-109).
This is a 10-channel scanner card
A carrying case for
These optional
1-2
Page 23

General Information
Model 4288-1 Single Fixed Rack Mount Kit —
single Model 2001 in a standard 19-inch rack.
Model 4288-2 Side-by-side Rack Mount Kit —
two instruments (Models 182, 428, 486, 487, 2001, 7001)
side-by-side in a standard 19-inch rack.
Model 4288-3 Side-by-side Rack Mount Kit —
Model 2001 and a Model 199 side-by-side in a standard 19inch rack.
Model 4288-4 Side-by-side Rack Mount Kit —
Model 2001 and a 5-inch instrument (Models 195A, 196,
220, 224, 230, 263, 595, 614, 617, 705, 740, 775, etc.) sideby-side in a standard 19-inch rack.
Models 7007-1 and 7007-2 Shielded IEEE-488 Cables —
Connect the Model 2001 to the IEEE-488 bus using shielded
cables and connectors to reduce electromagnetic interference
(EMI). The Model 7007-1 is one meter long; the Model
7007-2 is two meters long.
Models 8501-1 and 8501-2 Trigger Link Cables —
nect the Model 2001 to other instruments with Trigger Link
connectors (e.g., Model 7001 Switch System). The Model
8501-1 is one meter long; the Model 8501-2 is two meters
long.
Model 8502 Trigger Link Adapter —
nect the Trigger Link of the Model 2001 to instruments that
use the standard BNC (In/Out) external triggering technique.
Allows you to con-
Mounts a
Mounts
Mounts a
Mounts a
Con-
Models 5805 and 5805-12 Kelvin Probes —
two spring-loaded Kelvin test probes with banana plug termination. Designed to be used with instruments that measure
4-terminal resistance. The Model 5805 is 0.9m long; the
Model 5805-12 is 3.6m long.
Model 5806 Kelvin Clip Lead Set —
clip test leads (0.9m) with banana plug termination. Designed for instruments that measure 4-terminal resistance. A
set of eight replacement rubber bands for the Model 5806 is
available as Keithley P/N GA-22.
Model 8604 SMD Probe Set —
(3ft), each terminated with a surface mount device “grabber”
clip on one end and a banana plug with retractable sheath on
the other end.
Model 8610 Low Thermal Shorting Plug —
four banana plugs mounted to a 1-inch square circuit board,
interconnected to provide a short circuit among all plugs.
Model 8611 Low Thermal Patch Leads —
test leads (3ft), each with a banana plug with a retractable
sheath at each end. These leads minimize the thermallyinduced offsets that can be created by test leads.
Model 8612 Low Thermal Spade Leads —
test leads (3ft), each terminated with a spade lug on one end
and a banana plug with a retractable sheath on the other end.
These leads minimize the thermally-induced offsets that can
be created by test leads.
Includes two Kelvin
Consists of two test leads
Consists of
Consists of
Consists of two
Consists of two
Model 8530 IEEE-488 to Centronics Printer Adapter Cable —
Translates the IEEE-488 connector pinout and signal
level to a Centronics termination. This permits a standard
Centronics parallel printer to be connected to a Model 2001
in TALK-ONLY mode.
Model 8605 High Performance Modular Test Leads —
Consists of two high voltage (1000V) test probes and leads.
The test leads are terminated with a banana plug with retractable sheath on each end. (Each Model 2001 is shipped with
one set of these test leads.)
Model 8606 High Performance Probe Tip Kit —
of two spade lugs, two alligator clips, and two spring hook
test probes. (The spade lugs and alligator clips are rated at
30V RMS, 42.4V peak; the test probes are rated at 1000V.)
These components are designed to be used with high performance test leads terminated with banana plugs, such as the
Model 8605 High Performance Modular Test Leads.
The following test leads and probes are rated at 30V RMS,
42.4V peak:
Consists
Model 8680 RTD Probe Adapter —
terminated and unterminated cables to instruments with banana jacks for measuring 4-terminal resistance. It has a 4-pin
“T”-style connector and a 4-pin screw terminal block.
Model 8681 Miniature RTD Surface Probe —
cost platinum 4-wire-RTD with unterminated wires. It is designed to measure the temperature of flat surfaces or free
space.
Model 8693 General Purpose/Immersion RTD Probe —
This probe has a platinum RTD sensor. It is designed for immersion in liquids as well as other general purpose applications.
Model 8695 Surface RTD Probe —
num RTD sensor. It is designed to measure the temperature
of flat sur aces of solids.
Model 8696 Air/Gas RTD Probe —
num RTD sensor. It has an exposed junction within a protective shroud for measuring the temperature of air or gases.
This adapts RTDs with
This is a low
This probe has a plati-
This probe has a plati-
1-3
Page 24

The Keithley Applications Department is available at
1-800-348-3735 (U.S. only) to answer any questions
about the Model 2001.
2.1 Introduction
2
Getting Started
This section contains introductory information on operating
your Model 2001 Multimeter. For detailed front panel and
IEEE-488 bus operation, refer to Sections 3 and 4 respectively.
The information in this section is arranged as follows:
2.2 Front and rear panel summary:
trols and connectors on the front and rear panels, and
the front panel display of the instrument.
2.3 Overview of measurement process:
description of the measurement process.
2.4 Initial configuration:
information that should be considered before operation.
2.5 Front panel operation:
el operation through the use of simple examples.
2.6 IEEE-488.2 and SCPI basics:
information concerning operation over the IEEE-488
bus, including programming examples.
The IEEE-488 bus is also referred to as
GPIB, the general purpose interface bus.
Both terms are used with the Model 2001
and in this manual.
Reviews initial configuratio
Demonstrates basic front pan-
NOTE
Describes the con-
Provides a brief
Discusses fundamental
2.2 Front and rear panel summary
2.2.1 Front panel
The front panel controls and connections of the Model 2001
are shown in Figure 2-1. This figure includes important abbreviated information that should be reviewed before operating the instrument. Notice that some of the controls are dualfunction, rocker-action type keys. These include REL/TRIG,
STORE/RECALL, FILTER/MATH, / , INFO/LOCAL, CHAN/SCAN, CONFIG/MENU, and EXIT/ENTER.
2.2.2 Rear panel
The rear panel of the Model 2001 is shown in Figure 2-2.
This figure also includes abbreviated information that should
be reviewed before operating the instrument.
2-1
Page 25

Getting Started
ERR REM TALK LSTN SRQ REAR REL FILT MATH 4W AUTO ARM TRIG SMPL
Reading Display Line
Status Line/Additional
Reading Display Line
2
5
6
PREV
DISPLAY
NEXT
POWER
DCV ACV DCI ACI Ω2 Ω4
REL TRIG
INFO LOCAL EXIT ENTER
1 ANNUNCIATORS
ERR: Questionable reading (see paragraph 4.21)
REM: In remote
TALK: Addressed to talk
LSTN: Addressed to listen
SRQ: Service Request
REAR: Reading acquired from rear inputs
REL: Relative reading displayed
FILT: Digital filter enabled
MATH: Math calculation enabled
4W: 4-wire resistance reading displayed
AUTO: Autoranging enabled
ARM: Trigger armed; not in idle.
*(asterisk): Readings being stored
2 FUNCTION KEYS
DCV: DC voltage Ω2: 2-wire resistance
ACV: AC voltage Ω4: 4-wire resistance
DCI: DC current FREQ: Frequency
ACI: AC current TEMP: Temperature
3 RANGE KEYS
: Moves to higher range; increments digit
: Moves to lower range; increments digit
AUTO: Enables/disables autorange
4 HANDLE (not shown)
Pull out and rotate to desired position
5 DISPLAY KEYS
PREV: Moves to previous multiple display of a function
NEXT: Moves to next multiple display of a function
6 POWER
0 = OFF
1 = ON
1
Range : 200mVDC
STORE RECALL
CHAN SCAN
7 OPERATION KEYS
8 INPUT CONNECTIONS
9 INPUTS
10 CAL
4
INPUT
2A 250V
AMPS
1100V
PEAK
500V
PEAK
8
FILTER MATH
CONFIG MENU
7
2001 MULTIMETER
FREQ TEMP
RANGE
AUTO
RANGE
3
SENSE
Ω 4 WIRE
350V
PEAK
INPUTS
FR
FRONT/REAR
CAL
HI
!
LO
910
REL: Enables/disables relative reading
TRIG: Triggers unit
STORE: Enables data storage
RECALL: Displays reading data (reading, number, time). Use PREV/NEXT
DISPLAY for maximum
FILTER: Displays digital filter status for present function and toggles filter on/
off
MATH: Displays math calculation and toggles math on/off if configured
and : Moves cursor among data entry digits, menu selections, and
information displays
INFO: Shows context-sensitive information about the present display
LOCAL: Cancels IEEE-488 remote
CHAN: Selects internal scanner channel to measure (1-10)
SCAN: Performs scan of internal or external scanner channels, or ratio or
delta
CONFIG: Configures functions and operations
MENU: Saves/restores instrument conditions; sets up GPIB; performs cali-
bration and self-tests; defines limits, buffer, digital I/O, autozero
EXIT: Cancels selection, moves back within menu structure
ENTER: Holds reading, enters selection, moves down within menu structure
INPUT HI and LO: Used for making DC volts, AC volts, and 2-wire resis-
tance measurements
AMPS: Used in conjunction with INPUT LO to make DC current and AC
current measurements. Also holds current input fuse (2A, 250V, fast blow,
5×20mm)
SENSE Ω4 WIRE HI and LO: Used with INPUT HI and LO to make 4-wire
resistance measurements
Selects input connections on front or rear panels
Enables calibration functions
Figure 2-1
Model 2001 front panel
2-2
Page 26
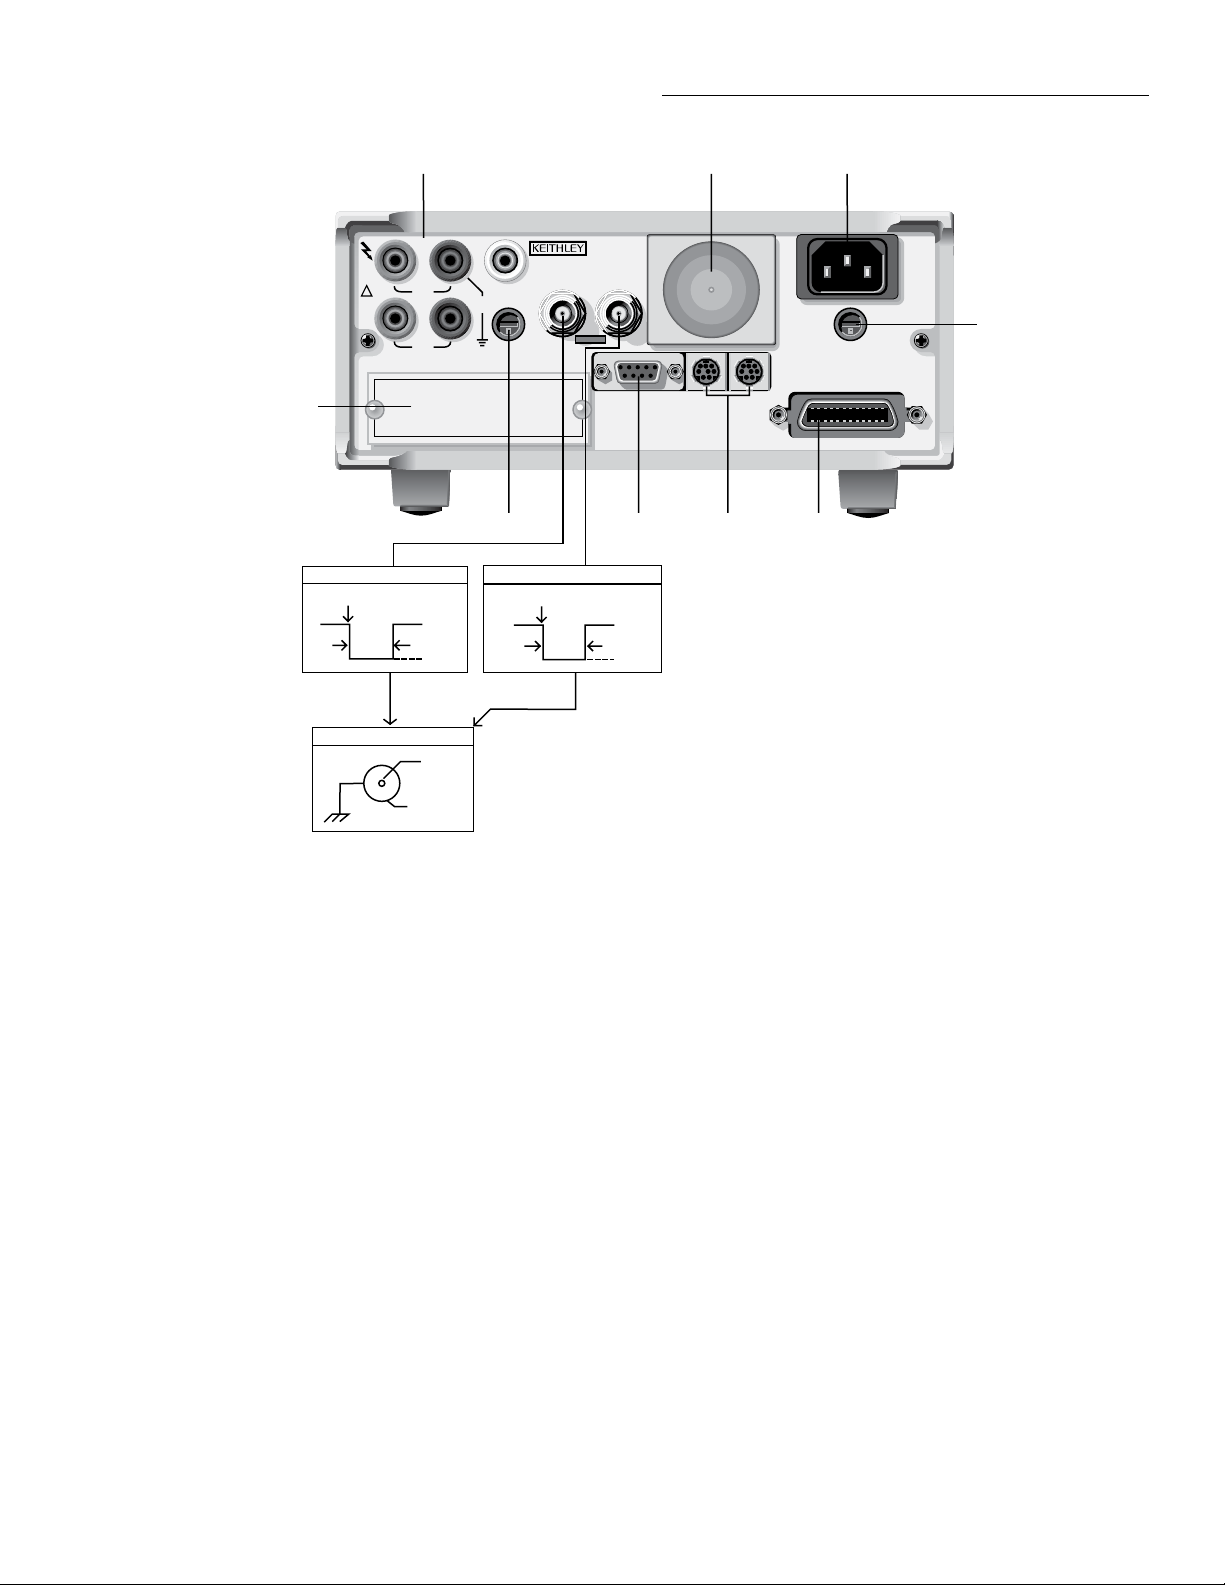
WARNING:NO INTERNAL OPERATOR SERVICABLE PARTS,SERVICE BY QUALIFIED PERSONNEL ONLY.
WARNING:NO INTERNAL OPERATOR SERVICABLE PARTS,SERVICE BY QUALIFIED PERSONNEL ONLY.
CAUTION:FOR CONTINUED PROTECTION AGAINST FIRE HAZARD,REPLACE FUSE WITH SAME TYPE AND RATING.
CAUTION:FOR CONTINUED PROTECTION AGAINST FIRE HAZARD,REPLACE FUSE WITH SAME TYPE AND RATING.
1 2 3
Getting Started
INPUT
1100V
!
HI LO
PEAK
350V
PEAK
SENSE
Ω 4 WIRE
5
EXTERNAL TRIGGER INPUT
Trigger Reading
TTL HI
>10µsec
BNC CONNECTIONS
TTL LO
HI
LO (Chassis)
EXTERNAL
AMPS
500V
2A MAX
PEAK
AMPS
FUSE
2A, 250V
OPTION SLOT
6 7
METER COMPLETE OUTPUT
TRIGGER
INPUT
Reading
Complete
>10µsec
MADE IN
U.S.A.
METER
COMPLETE
OUTPUT
DIGITAL I/O
TTL HI
TTL LO
IN OUT
TRIGGER
LINK
8
LINE RATING
90-134VAC
180-250VAC
50, 60, 400HZ
55VA MAX
IEEE-488
(CHANGE IEEE ADDRESS
WITH FRONT PANEL MENU)
9
LINE FUSE
SLOWBLOW
1/2A, 250V
4
1 INPUT CONNECTIONS
INPUT HI and LO: Used for making DC volts, AC volts,
and 2-wire resistance measurements.
AMPS: Used in conjunction with INPUT LO to make DC
current and AC current measurements.
SENSE Ω4 WIRE HI and LO: Used with INPUT HI and LO
to make 4-wire resistance measurements
2 FAN
Keep filter clean to ensure proper instrument cooling.
3 POWER LINE INPUT
90-134VAC and 180-250VAC (universal); 50, 60, or
400Hz (self-identifying)
WARNING: Connect to grounded outlet using 3-wire
power cord.
4 LINE FUSE
Provides protection on the AC power line, Replace only
with 0.5A, 250V, slow blow, 5×20mm
Figure 2-2
Model 2001 rear panel
5 SCANNER
Optional Model 2001-SCAN Scanner Card installs in this slot
6 AMPS FUSE
Holds current input fuse (2A, 250V, fast blow, 5×20mm)
7 DIGITAL I/O
A DB-9 connector for the TTL-compatible digital I/O with on in-
put and four outputs
8 TRIGGER LINK IN and OUT
Two 8-pin micro DIN connectors for sending and receiving trig-
ger pulses among other instruments. (See paragraph 3.7.7)
9 IEEE-488 CONNECTOR
Connects the instrument to the IEEE-488 (GPIB) bus. NOTE: Use
shielded IEEE-488 cables
2-3
Page 27

Getting Started
2.2.3 Front panel display
Normal displays
In the normal display mode, the front panel of the Model
2001 shows the following:
• Top line
scanning. Where needed for clarification, the type of
measurement.
• Bottom line
frequency coupling and terminals; temperature sensor.
Most readings have from 3.5 to 7.5 digits of resolution. For
example, an AC voltage measurement (RMS type), at 5.5
digits on the 200VAC range would be displayed as follows:
+000.000 VAC RMS
Range: 200 VAC Coupling: AC
With a math operation enabled (percent or mX+b), the reading could be expressed in scientific notation, such as
+5.0000e+03 VAC %
Range: 200 VAC Coupling: AC
Multiple displays
The mode called multiple display is accessed from the normal display by pressing the NEXT or PREVious DISPLAY
keys. Each measurement function has its own set of multiple
displays.
In the multiple display mode, the Model 2001 can show the
readings of up to three separate measurements. For example,
in the DC voltage function, one of the multiple displays
shows DC volts, AC ripple voltage, and ripple frequency:
+00.00000 VDC
+00.0000 VAC +000.00 Hz
Or, a multiple display can show a bar graph, such as:
Readings, units, and channel number if
Range, if fi ed; ACV and ACI coupling;
INFO displays
There are context-sensitive information message displays for
most front panel operations. The explanatory information is
toggled on and off with the INFO key. For example, the
INFO message for one of the DCV multiple displays is:
INFO: VDC, VAC, Hz
Shows DC value, AC ripple, and
the ripple frequency.
where the blinking and characters signify that the
front panel cursor keys must be used to view the complete
bottom line.
INFO messages are listed in Appendix H.
Configuration menu displays
Each measurement function is individually configured by
pressing CONFIG followed by the function key. In addition,
operations that affect all measurement functions, such as
triggers, data storage, and limits, are also configured by
pressing CONFIG followed by the operation key.
The top level of the configurationmenu for DC voltage is accessed by pressing the CONFIG key, and then the DCV key.
The resulting display reads:
CONFIGURE DCV
SPEED FILTER RESOLUTION
In some cases, menu selections branch off to further defin
the options, such as the following for the SPEED option:
DCV MEASUREMENT SPEED
NORMAL FAST MEDIUM HIACCURACY
SET-SPEED-EXACTLY SET-BY-RSLN
Configuration menus for all functions and operations are
shown in Appendix H. Guidelines for navigating the front
panel menus are summarized in Table 2-2.
+12.00000 VDC
0|=====|=====|== | |+20V
The complete set of multiple displays is listed in Appendix
H. They are described in detail in Section 3. The set for the
DC voltage function is also shown in Table 2-1.
2-4
Page 28

Table 2-1
DCV multiple displays
Display Description
Getting Started
+00.00000 VDC
Range: 20 VDC
NEXT ↓↑ PREV
+00.00000 VDC
+00.0000 VAC +000.00 Hz
NEXT ↓↑ PREV
+00.00000 VDC
Pos-Pk=+00.00 V Highest=+00.00 V
NEXT ↓↑ PREV
+00.00000 VDC
Neg-Pk=+00.00 V Lowest=+00.00 V
NEXT ↓↑ PREV
+00.00000 VDC
Pos-Pk=+00.00 V Neg-Pk=+00.00 V
NEXT ↓↑ PREV
+10.00000 VDC
0|=====|=====| | |+20V
NEXT ↓↑ PREV
+10.00000 VDC
-50% | | |====|====| +50%
NEXT ↓↑ PREV
+00.00000 VDC
Max=+00.00000 Min=+00.00000
NEXT ↓↑ PREV
+00.00000 VDC
Actual=+00.00000 (without REL)
NEXT ↓↑ PREV
+00.00000 VDC
Reading=+00.00000
NEXT ↓↑ PREV
+00.00000 VDC PASS
LLIM1| | |====| |HLIM1
NEXT ↓↑ PREV
+00.00000 VDC CH02
CH01=+00.0000 V CH03=+00.0000 V
NEXT ↓↑ PREV
Note: Press the NEXT and PREV DISPLAY keys to scroll through the multiple displays (with wraparound).
Normal display. (Range not shown if auto-range.)
AC ripple voltage and frequency.
Positive peak spikes and highest value.
Negative peak spikes and lowest value.
Positive and negative peak spikes.
Bar graph to + or - full scale.
Zero-centered bar graph with adjustable limits.
Maximum and minimum values.
Value with REL applied.
Actual value.
Result of math operation.
Reading before math.
HI/LO/PASS bar graph with adjustable limits.
Readings of adjacent internal channels
(with Model 2001-SCAN option).
.
2-5
Page 29
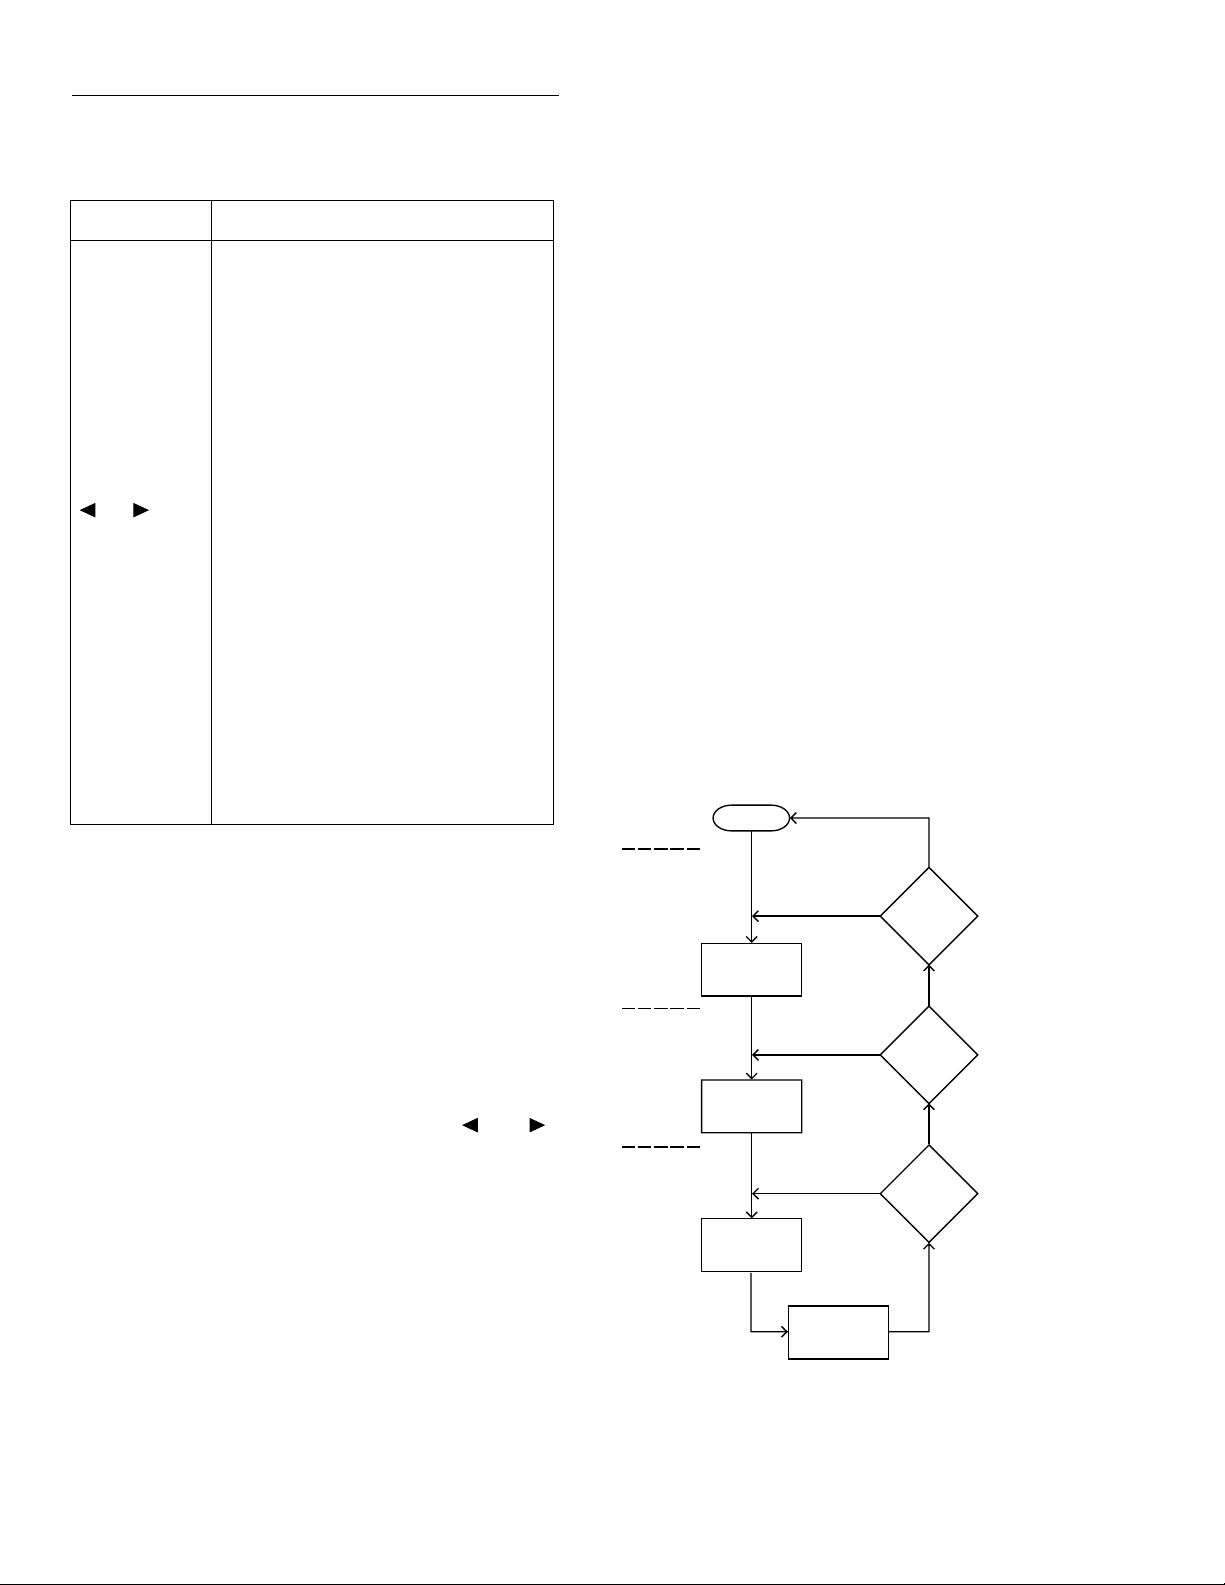
Getting Started
F
S
Table 2-2
Menu summary
Action Description
CONFIG-DCV Press the CONFIG key, then the DCV
key, to view the top level of the DCV
configuration menu. Access to other
function and operation configurations are
similar, e.g., CONFIG-ACV or CONFIG-TRIG.
MENU Press the MENU key to view the top
level of the main menu. The operations
that have no corresponding key are
included in the main menu.
or Use the cursor keys to move the high-
lighted cursor among menu selections, or
the digits of a parameter value, or change
channels on the scanner.
RANGE
RANGE
Use the RANGE keys to increment and
decrement digits of a parameter value.
ENTER Accepts menu selection or data entry.
EXIT Cancels changed menu selection. Also
returns you to the previous menu level.
INFO Displays context-sensitive information
about the present menu level. Toggles
information message on/off.
Message displays
While operating the Model 2001, the front panel display is
also used for showing status and error messages. These messages are shown to inform you of parameter conflicts, trigger
overruns, etc. Refer to paragraph 3.3.4 for a complete list of
these messages.
Section 4, IEEE-488 Reference, describes the programming
of user messages to be shown on the front panel. (See the
DISPlay subsystem.) Both lines of the display are available
for this purpose.
2.3 Overview of measurement process
The following overview is intended to acquaint you with the
basic measurement fundamentals without overwhelming
you with the details of enhanced capabilities. This brief overview is sufficient to support the operation examples in paragraphs 2.5 (front panel) and 2.6 (IEEE-488 bus). For a
complete explanation on all aspects of the measurement process, see paragraph 3.7.
The simplified model for a measurement operation is shown
in Figure 2-3. As shown, the measurement operation consists
of three layers: the arm layer, scan layer, and measure layer.
Idle
Buffered readings display
After readings have been stored in the buffer, they are displayed on the front panel by pressing the RECALL key. This
action brings up the first reading in the uffer, such as:
+00.00000 VDC
Rdg#+00000 @Time=+000.000000 sec
where the top line shows the reading, and the bottom line
shows the reading number and time-stamp. The RANGE
and keys scroll through the readings and the and
keys change the digit being scrolled. You can scroll through
statistical data on the buffered readings by pressing the
NEXT and PREVious DISPLAY keys. This also gives you
the option of printing the data.
NOTE
Buffered readings are preserved across
power transition when the memory options are installed.
Yes
Yes
Yes
Another
Arm
?
Another
Scan
?
Another
Measure-
ment
?
Arm
Layer
Scan
Layer
Measure
Layer
Arm
Event
Scan
Event
Measure
Event
Device
Action
igure 2-3
implified model of measu ement operation
No
Arm
Count
No
Scan
Count
No
Measure
Count
2-6
Page 30

Getting Started
2.3.1 Idle
The instrument is considered to be in the idle state whenever
it is not operating within one of the layers of the model. The
front panel ARM indicator is off when the instrument is in
the idle state.
When the Model 2001 is taken out of the idle state by pressing TRIG (or sending the :INIT or :INIT:CONT ON command over the IEEE-488 bus), the ARM indicator turns on
and operation proceeds into the arm layer.
2.3.2 Arm layer
In general, the instrument requires an arm event to allow operation to proceed to the scan layer. With an arm source of
Immediate (the factory default), operation immediately proceeds to the next layer when the instrument is taken out of the
idle state. With one of the other arm sources selected, the instrument waits until the appropriate event occurs, as explained below:
• External The instrument waits for an input trigger
(via EXTERNAL TRIGGER connector on rear panel).
• Manual The instrument waits until the front panel
TRIG key is pressed.
• GPIB The instrument waits until a bus trigger (GET
or *TRG) is received.
• Trigger Link The instrument waits until an input
trigger is received (via TRIGGER LINK).
• Hold The instrument waits in the arm layer until the
arm source is changed. (Note: the signal and immediate
layer commands, that is, :ARM:LAY1:SIGN and
:ARM:LAY1:IMM, will satisfy the event detection
logic.)
NOTE
With the Immediate trigger source selected, a “trigger ignored” message will be
displayed if an external trigger is sent to
the Model 2001 or a manual trigger (i.e.,
pressing TRIG key) occurs. The external
or manual trigger is not used (ignored).
After all scan and measure operations are complete, the instrument can be returned to the arm layer by programming
the instrument for additional arms. The arm count can be set
to a finite value (1 to 99,999) or to infinit . The factory default value is one.
After the instrument leaves the arm layer, operation proceeds
into the scan layer.
2.3.3 Scan layer
In general, the instrument requires a scan event to allow operation to proceed to the measure layer. With a scan source
of Immediate (the factory default), operation immediately
proceeds to the next layer. With one of the other scan sources
selected (External, Manual, GPIB, Trigger Link, Timer, or
Hold), the instrument waits until the appropriate event occurs.
With a scan source of Timer, the first pass through the scan
layer occurs immediately. If programmed for additional
scans, the instrument waits for an interval between 1msec
and 999,999.999 seconds.
The scan count (number of scans) can be set to a finite value
(1 to 99,999) or to infinit . The “bench” factory default value
is infinit .
NOTE
With the Immediate trigger source selected, a “trigger ignored” message will be
displayed if an external trigger is sent to
the Model 2001 or a manual trigger (i.e.,
pressing TRIG key) occurs. The external
or manual trigger is not used (ignored).
After the instrument leaves the scan layer, operation proceeds into the measure layer.
2.3.4 Measure layer
In general, measure events control the reading rate. With a
measure source of Immediate (the factory default), a device
action occurs immediately. The device action consists of taking a reading. If scanning is selected, the device action consists of taking a reading, opening a channel, configuring for
next function in scan list, and closing a channel.
With one of the other measure sources selected (External,
Manual, GPIB, Trigger Link, Timer, or Hold), the instrument
waits until the appropriate event occurs before taking a reading and, optionally, scanning a channel.
With a measure source of Timer, the first reading is taken immediately. Each additional reading waits for the Timer to
time out before it is taken.
NOTE
With the Immediate trigger source selected, a “trigger ignored” message will be
displayed if an external trigger is sent to
the Model 2001 or a manual trigger (i.e.,
pressing TRIG key) occurs. The external
or manual trigger is not used (ignored).
2-7
Page 31

Getting Started
The measure count (number of readings to take) is set to a fi
nite value (1 to 99,999) or to infinit . The factory default value is infinit .
In factory default conditions, the arm layer and scan layer are
transparent to the measurement operation.
2.4 Initial configuration
WARNING
Before turning on the Model 2001, make
sure it is connected to a grounded power
receptacle using the supplied power
cord or the equivalent. Failure to properly ground the unit creates a shock hazard that could result in injury or death.
The Model 2001 can save from one to ten user setups in
memory, depending on the installed memory option. You can
select one of the user setups as the power-on default, or have
the instrument power up to either of the two factory defaults
(optimized for “BENCH” or “GPIB” operation). Since the
examples in paragraph 2.5 assume BENCH defaults, reset
the instrument to those settings by performing the following
steps:
1. Press the MENU key to display the MAIN MENU options as shown below:
MAIN MENU
SAVESETUP GPIB CALIBRATION
TEST LIMITS STATUS-MSG GENERAL
When the lower display line is longer than one line, the
right-most character will be a symbol. Repeatedly
press the key to view the second half of the lower
line, and press the key to return to the first half display.
NOTE
Additional information is available for
most front panel operations. Simply press
the INFO key to toggle an INFO display.
Use the and keys to see the complete lower line.
3. Press the key until the RESET option of the SETUP
MENU is blinking and then press ENTER to view the
reset menu:
RESET ORIGINAL DFLTS
BENCH GPIB
4. Select the BENCH option by making it blink and pressing ENTER. The following confirmationmessage is displayed:
RESETTING INSTRUMENT
ENTER to conÞrm; EXIT to abort
5. Press ENTER to confirm. The parameters accessed by
the front panel are now reset to factory defaults for
bench operation. The display will show DC voltage
readings with autorange enabled. The default settings
for DC voltage are:
• Measurement speed (integration time) Normal, 1
power line cycle.
• Digital filter Advanced, 10 readings, 1% noise tol-
erance, moving average, enabled.
• Display resolution 6.5 digits.
2.5 Front panel operation
Basic front panel operation will be demonstrated by examples of measuring DC voltages. The first example shows
readings at default settings and high accuracy readings. The
second example shows storing high speed readings. These
examples are only intended to teach basic operation.
Details for using the full capabilities of the Model 2001 from
the front panel are contained in Section 3 of this manual. The
manual for the Model 2001-SCAN Scanner Card has examples for closing and opening channels and scanning lists of
channels.
NOTE
The front panel operation examples assume that the Model 2001 is initially set
up for proper operation as explained in
paragraph 2.4.
2.5.1 Measuring DC voltage example
2. If the SAVESETUP option is not blinking, press the
key until it is and then press ENTER to view the setup
menu:
SETUP MENU
SAVE RESTORE POWERON RESET
2-8
Before starting this example, the front panel display should
show triggered DC voltage measurements. If it does not, perform a bench reset following the procedure of paragraph 2.4.
Perform the following steps to make DC voltage measurements with the Model 2001 Multimeter.
Page 32
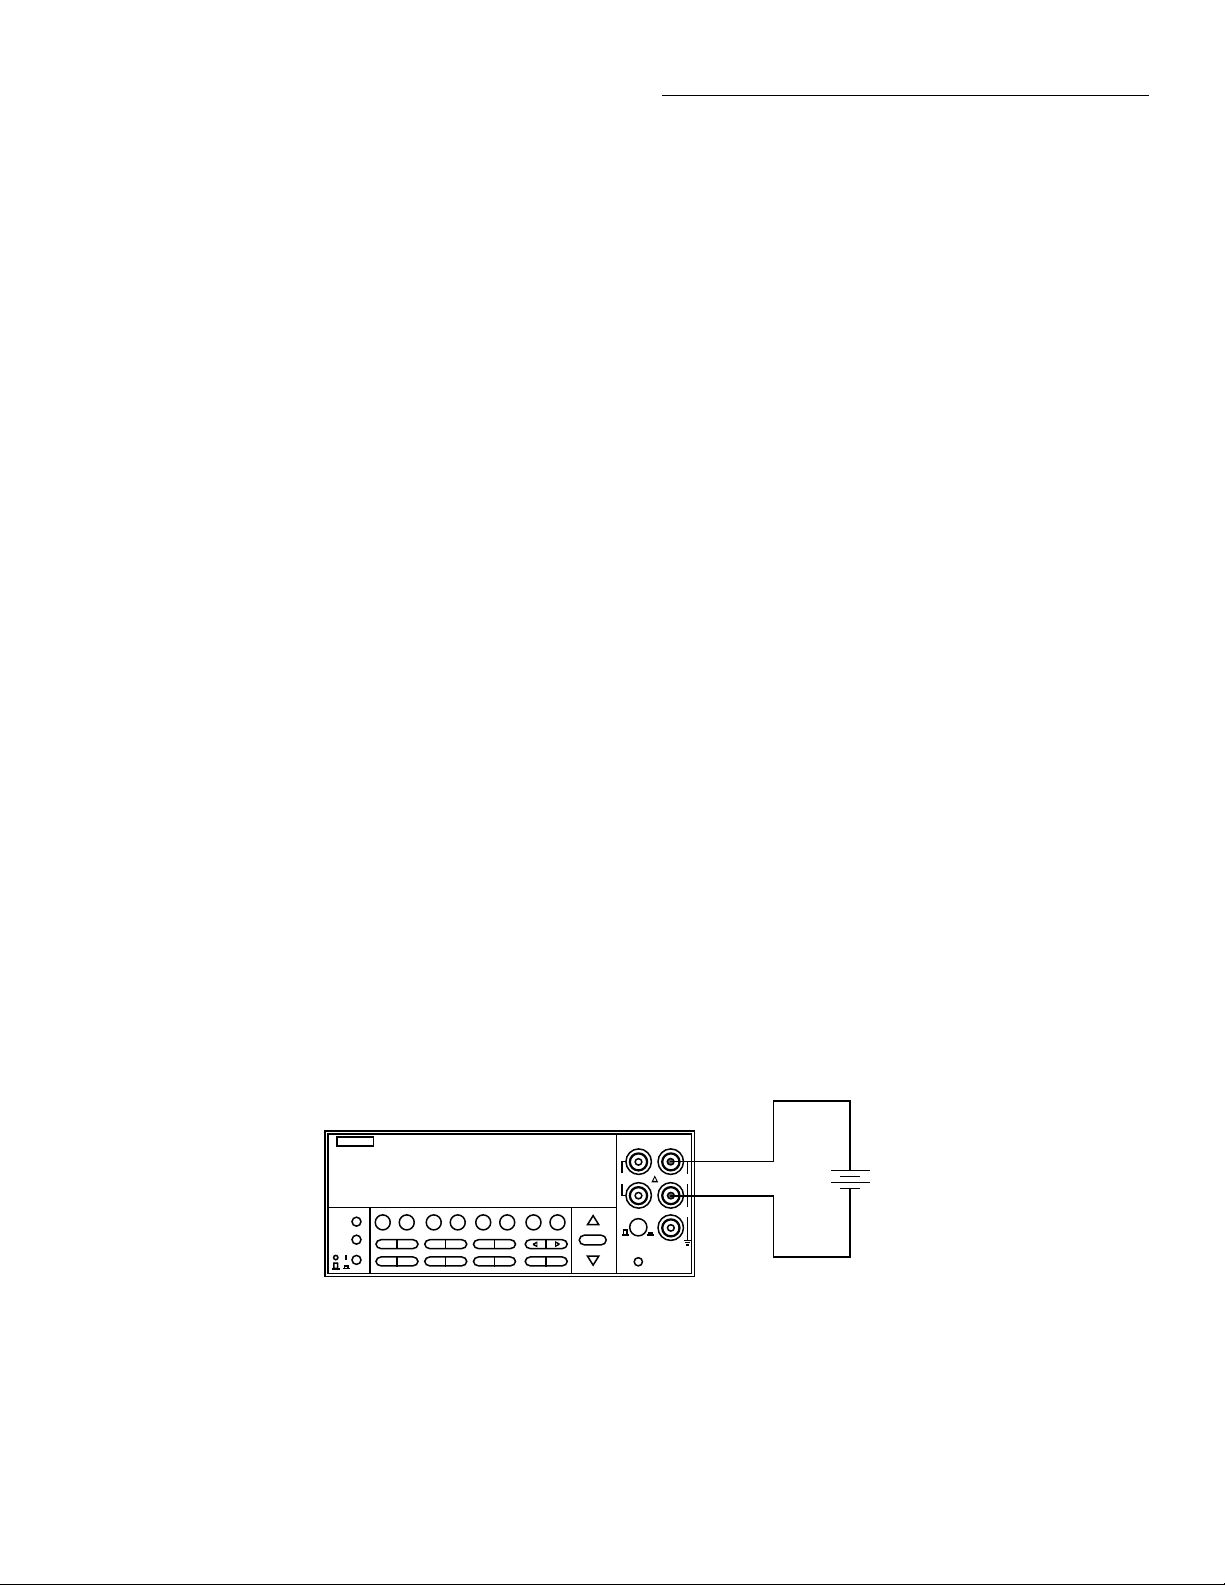
Getting Started
Step 1 Connect a DC voltage source
The Model 2001 can be used to make DC voltage measurements in the range of ±10nV to ±1100V. Low level measurement techniques need to be used at resolutions of 5.5 digits
and more. See paragraph 3.4.1 for low level measurement
considerations.
WARNING
The maximum input voltage between
INPUT HI and INPUT LO is 1100V
peak. The maximum common-mode
voltage (voltage between INPUT LO
and chassis ground) is 500V peak. Exceeding these values may create a shock
hazard.
1. Select the front input jacks with the INPUTS button
(outer position for front jacks, inner position for rear).
2. Using the set of supplied test leads, connect the Model
2001 to a DC voltage source (e.g., a battery) as shown in
Figure 2-4.
Step 2 Select a range and display a reading
3. For the 200mV range, short the probe ends and allow the
reading to settle. Press REL to null any offsets. Leave
REL enabled while making measurements. Reconnect
the probes to the voltage source.
NOTE
A reading can be held by pressing the ENTER key. This freezes the display until the
EXIT key is pressed, returning the display
to normal. If the ENTER key is pressed instead, the display is updated with another
reading.
Step 3 View the default configu ation
The DCV function has the following defaults for speed, fil
ter, and resolution:
• Measurement speed (integration time) Normal (1
power line cycle; 16.7msec for 60Hz, 20msec for 50Hz
and 400Hz).
• Digital filter Advanced, 10 readings, 1% noise toler-
ance, moving average, enabled.
• Display resolution 6.5 digits.
Use the RANGE keys to select autoranging or a manual
range:
1. As indicated by the AUTO annunciator, bench reset returns the instrument to autoranging. Pressing the AUTO
range key toggles autoranging.
2. You can select a different range with the RANGE and
RANGE keys. When using manual ranging, be sure
to use a range high enough for the signal level. If the
“Overfl w” message is displayed on a manual range, select the next higher range until you obtain an on-range
reading. Use the lowest possible range to obtain the best
accuracy and resolution.
Model 2001
2001 MULTIMETER
PREV
DCV ACV DCI ACI Ω2 Ω4
DISPLAY
NEXT
REL TRIG STORE RECALL
POWER
INFO LOCAL CHAN SCAN CONFIG MENU EXIT ENTER
FILTER MATH
FREQ TEMP
RANGE
AUTO
RANGE
Input Resistance = 10MΩ on 1000V and 200V ranges ;
> 10GΩ on 20V, 2V and 200mV ranges.
= 1MΩ on DCV peak spikes measurement.
Caution: Maximum Input = 1100V peak
Figure 2-4
Typical DC voltage connections
If these settings are not sufficient for your DCV measurement, they can be changed through the DCV configuratio
menu:
1. Press the CONFIG key and then the DCV or ENTER
key. The instrument displays the following menu:
CONFIGURE DCV
SPEED FILTER RESOLUTION
NOTE
Pressing CONFIG, then ENTER displays
the top level of the configuration menu for
the present function.
SENSE
INPUT
Ω 4 WIRE
HI
350V
1100V
PEAK
PEAK
LO
500V
PEAK
INPUTS
F
R
FRONT/REAR
2A 250V
AMPS
CAL
DC Voltage
Source
2-9
Page 33

Getting Started
Table 2-3
CONFIGURE DCV menu structure
Menu item Description
SPEED
NORMAL
FAST
MEDIUM
HIACCURACY
SET-SPEED-EXACTLY
SET-BY-RSLN
FILTER
AUTO
AVERAGING
ADVANCED
Measurement speed (integration time) menu:
Select 1 PLC (power line cycle, 16.67msec for 60Hz, 20msec for 50Hz and 400Hz).
Select 0.01 PLC.
Select 0.1 PLC.
Select 10 PLC.
Set integration time in PLC (0.01-10).
Default to setting appropriate for resolution.
Digital filter menu
Default to filter appropriate for int gration time.
Program a simple average filter (1-100 readings)
Program a simple average filter (1-100 readings) with a noise tolerance
window (0-100% of range).
AVERAGING-MODE
RESOLUTION
AUTO
3.5d, 4.5d, 5.5d, 6.5d, 7.5d
Select moving average or repeating average mode.
Display resolution menu:
Default to resolution appropriate for integration time.
Select a specific resolution
2. You can view the present selections of each CONFIGURE DCV option by pressing the and keys to
move to the desired option, then pressing ENTER. The
present selection is shown blinking. (Remember that additional information is available by pressing the INFO
key.)
This is the top level of the menu shown in Table 2-3.
Step 4 Configu e for high accuracy
To make high accuracy readings of a voltage source, change
the configuration of the DC voltage measurement, as follows:
4. Using the cursor keys, select the AVERAGING option,
then press ENTER. The instrument displays the following:
AVG: 010 RDGS (1-100)
Use , , , , ENTER,EXIT, or INFO
5. This is a simple moving average filter of 10 readings,
which is the minimum recommended for high accuracy
DC voltage measurements. If it is sufficient, just press
ENTER or EXIT. If you want the instrument to average
more readings, use the cursor keys and RANGE keys to
increase the value (up to 100 readings). Press ENTER to
make the change.
1. Select SPEED from the CONFIGURE DCV menu, then
press ENTER. The multimeter displays the following
menu:
DCV MEASUREMENT SPEED
NORMAL FAST MEDIUM HIACCURACY
SET-SPEED-EXACTLY SET-BY-RSLN
2. Using the cursor keys, select the HIACCURACY option
(integration time of 10 power line cycles), then press
ENTER.
3. Select FILTER from the CONFIGURE DCV menu,
then press ENTER. The following menu is displayed:
DCV DIGITAL FILTER
AUTO AVERAGING ADVANCED
AVERAGING-MODE
2-10
NOTE
This step does not enable the digital filte .
That is done by pressing the FILTER key
while outside the menu structure.
6. Select RESOLUTION from the CONFIGURE DCV
menu. The following menu is displayed:
SET DCV RESOLUTION
AUTO 3.5d 4.5d 5.5d 6.5d 7.5d
7. Using the cursor keys, select 7.5 digits of resolution,
then press ENTER.
8. Press EXIT to return to the normal display. The reading
should reflect the speed and resolution changes. (Changes will affect only the DCV function.)
Page 34

Getting Started
Step 5 Enable the digital filte
If the filter is not on, press FILTER to enable the digital filte .
The type of filter and number of readings selected is displayed momentarily, for example:
Filter Enabled
Digital = AVG(10)
The reading should now be less noisy. The digital filter can
be disabled by pressing the FILTER key again.
Step 6 View the multiple displays
Each measurement function has a series of front panel displays. The displays are accessed with the NEXT DISPLAY
and PREV DISPLAY keys.
1. From the normal display of DC voltage, press the NEXT
DISPLAY key once to also view AC voltage and frequency measurements of the signal, for example:
+000.0000 mVDC
+000.000 mVAC +000.00 Hz
2. Return to the normal DCV display by pressing PREV
DISPLAY, or view the remaining DCV displays by
pressing NEXT DISPLAY, which wraps around to the
normal display. The DC voltage multiple displays were
shown in Table 2-1.
NOTE
Pressing and holding either the NEXT
DISPLAY or PREV DISPLAY key returns
to the normal display.
DCV MEASUREMENT SPEED
NORMAL FAST MEDIUM HIACCURACY
SET-SPEED-EXACTLY SET-BY-RSLN
3. Using the cursor keys, select the FAST option, then
press ENTER. Since the resolution is set to AUTO,
where it defaults to a value appropriate for the speed, it
will be set to 4.5d automatically.
4. Press EXIT to return to the normal display.
Step 2 Store the readings
To store readings in the instrument’s data storage buffer, perform the following:
1. Press the STORE key. The following message is displayed:
STORE 00100 READINGS
Use , , , , ENTER,EXIT, or INFO
2. The factory default number of readings to store is 100.
Use the cursor and RANGE keys to make changes. The
maximum possible number of readings depends on the
following:
• The data group selected for storage (full or compact).
This is selected under the CONFIG DATA STORE
menu.
• The memory option (STD, MEM1, or MEM2).
3. Press ENTER to start storing readings. The asterisk annunciator lights to indicate a data storage operation. The
bottom line of the display counts up the data storage
points.
2.5.2 Storing DC voltage readings example
This example assumes the Model 2001 is reset to its bench
defaults, as outlined in paragraph 2.4. It also assumes the instrument is connected to a DC voltage source, and the front
panel displays on-scale readings.
Step 1 Configu e for high speed measurements
To make high speed readings of a voltage source, change the
configuration of DC oltage measurements, as follows:
1. Press CONFIG-DCV to view the DCV configuratio
menu:
CONFIGURE DCV
SPEED FILTER RESOLUTION
2. Select SPEED from the menu, then press ENTER. The
multimeter displays the following menu:
Step 3 Recall the readings
To recall the stored readings, perform the following:
1. Press RECALL to view the readings. The following
message is displayed with the cursor on the least significant digit of the reading number:
+00.00000 VDC
Rdg#+00000 @Time=+000.000000 sec
2. Use the RANGE and keys to increment and decrement the reading number and scroll through the buffer.
3. The NEXT and PREV DISPLAY keys can be used
while recalling readings to access additional data, as
shown in Table 2-4.
2-11
Page 35

Getting Started
Table 2-4
Multiple displays for recalled readings
Display Description
+00.00000 VDC
Rdg#+00000 @Time=+000.000000 sec
NEXT ↓↑ PREV
+00.00000 VDC
MAX=+0.000000e+00 at RDG# +00000
NEXT ↓↑ PREV
+00.00000 VDC
MIN=+0.000000e+00 at RDG# +00000
NEXT ↓↑ PREV
+00.00000 VDC
AVG=+0.0000e+00 SDEV=+0.0000e+00
NEXT ↓↑ PREV
PRINT BUFFER DATA
Press ENTER to start printing.
NEXT ↓↑ PREV
Note: Press the NEXT and PREV DISPLAY keys to scroll through the multiple displays (with wraparound.)
Step 4 Configu e for burst of high speed readings
There are two data acquisition modes, normal and burst. The
burst reading rate is 2000 readings/sec into the buffer (plus
post-processing time of the raw readings, typically 2msec/
reading). To achieve this speed, certain tradeoffs are made
with fl xibility, as listed in Table 2-5.
1. To continue the reading storage example with burst
mode selected, display the CONFIG DATA STORE
menu by pressing the CONFIG key, then the STORE
key:
CONFIG DATA STORE
BURST-MODE DATA-GROUP CONTROL
CLEAR-ALL COUNT FEED
2. Select BURST-MODE and press ENTER. After a momentary message about clearing the buffer, the display
shows:
BURST MODE
OFF ON
3. Select ON and press ENTER. (Certain instrument parameters are saved when burst is enabled, and are restored when burst is disabled. See paragraph 3.8.1 for
further details on burst mode.)
Normal stored reading.
Reading number and time-stamp.
Maximum value of stored readings.
Minimum value of stored readings.
Average and standard deviation.
Prompt to dump readings to a printer.
Table 2-5
Burst mode availability
Function/operation Setting
DC voltage
AC voltage
DC current
AC current
2-wire resistance
4-wire resistance
Frequency
Temperature
Range
Autozero
Speed
Filter
Resolution
Multiple displays
Data grouping
Normal (no peak spikes)
Normal RMS or average
Normal (no in-circuit)
RMS or average
Normal (no offset compensation)
Not available
Not available
Not available
Fixed
Disabled
FAST (0.01 PLC)
Repeat acts like moving.
4.5 digits
Disabled
Compact (reading and reading
number)
Delay
Notes:
1. The measurement display is not updated during burst.
2. A math operation slows post-processing time.
As set.
2-12
Page 36

Getting Started
4. The next message sets the number of burst readings to
store:
BURST: 00100 READINGS
Use , , , , ENTER,EXIT, or INFO
5. Use the cursor and RANGE and keys to change the
buffer size. Then press ENTER for the change to take effect:
00100 READING BURST
Use TRIG to start; EXIT to abort
Step 5 Acquire the burst readings
Initiate burst mode by pressing the TRIG key.
The ARM annunciator comes on when the raw readings are
being acquired. The asterisk annunciator comes on when the
readings are being post-processed. Both indicators go out
when post-processing is complete.
Step 6 Recall the burst readings
1. Examine the contents of the buffer by pressing
RECALL:
+00.000 VDC
Rdg#+00000
2. Press the EXIT key once to leave the buffer contents display. Press it a second time to disable the burst mode.
2.6 IEEE-488.2 and SCPI basics
The following paragraphs discuss fundamental information
concerning operation over the IEEE-488 bus. Detailed information on operating the instrument over the bus is contained
in Section 4 of this manual.
2.6.1 SCPI overview
IEEE-488.2 defines a syntax and protocol for sending data to
and from instruments. It also defines a set of common commands that are used to perform basic operations, such as
reading status registers, providing triggers, and resetting the
instrument to default conditions.
2.6.2 Compatibility
An instrument that uses the IEEE-488.2 standard and SCPI
does not have any special hardware requirements. The IEEE488 interface that you used with the old standard (IEEE-
488.1) will work with the new standard. Simply connect the
Model 2001 to a computer that is equipped with an IEEE488 interface.
NOTE
The term GPIB (General Purpose Interface Bus) is used in this manual and in the
menu structure of the instrument. GPIB is
simply another term for the IEEE-488 bus.
2.6.3 Bus connection
Before using the instrument over the bus, you must connect
the IEEE-488 connector on the rear panel of the instrument
to the IEEE-488 connector of your controller. Use a Keithley
Model 7007 or similar IEEE-488 cable for this connection.
2.6.4 Primary address
The primary address of the Model 2001 must agree with the
primary address you intend to specify in the controller’s programming language. The factory setting for the primary address is 16, so if you intend to use that address, you need not
change it. However, the primary address can be set to any
value between 0 and 30 by using the GPIB setup menu (ADDRESSABLE selection) available with the MENU key.
2.6.5 Abbreviated common command summary
Table 2-6 provides an abbreviated list of common commands
that are defined by the IEEE-488.2 standard. These are the
common commands that are most used for bus operation.
Note that each common command is preceded by an asterisk
(*).
SCPI (Standard Commands for Programmable Instruments)
defines a standard set of commands (and format) to control
every aspect of instrument operation. Together, IEEE-488.2
and SCPI create a command structure for all programmable
instruments.
2-13
Page 37

Getting Started
2.6.6 Abbreviated SCPI command summary
Most instrument operations are controlled using SCPI commands. Table 2-7 provides an abbreviated list of the SCPI
commands necessary to perform some basic operations.
Not shown in the table are companion query commands for
the :ARM and :TRIGger subsystem commands (:COUNt?,
Table 2-6
Abbreviated common command summary
Mnemonic Name Description
*CLS Clear status Clears error queue, event registers, and IEEE-488 bus service request (SRQ) line.
*RCL <n> Recall Returns the instrument to the setup configuration stored in memory (n = 0 for
STD, n = 0 to 4 for MEM1, or n = 0 to 9 for MEM2).
*RST Reset Returns the Model 2001 to *RST default conditions (see Appendix B).
*SAV <n> Save Saves the present setup configuration in memory (n = 0 for STD, n = 0 to 4 for
MEM1, or n = 0 to 9 for MEM2).
*TRG Trigger Issues a bus trigger (same as group execute trigger command; GET).
:DELay?, :SOURce?, and :TIMer?). For example, the
:TRIGger:SOURce? query command is used to request the
presently selected control source. After the query command
is sent and the Model 2001 is addressed to talk, a message
identifying the selected control source will be sent to the
computer.
2-14
Page 38

Table 2-7
Abbreviated SCPI command summary
Command Description
Getting Started
:SYSTem
:PRESet
[:SENSe[1]]
:VOLTage[:DC]
:APERture <n>
:AVERage
:COUNt <n>
:STATe ON|OFF
:NPLCycles <n>
:RANGe
[:UPPer] <n>
:AUTO <b>
:REFerence <n>
:RESolution <n>
:INITiate
:ABORt
:ARM
:LAYer2
:COUNt <n>|INF
:DELay <num>
:SOURce HOLD|IMMediate| TIMer|
Subsystem command path.
Set unit to a default configuration (see Appendix B).
Subsystem command path.
Path to configure DC oltage.
Specify integration time in seconds (n = 166.67e-6 to 200e-3).
Path to control averaging filter
Specify number of points to average (n = 1 to 100).
Enable/disable averaging filte .
Specify integration time in number of line cycles (n = 0.01 to 10).
Path to configure measurement range
Select range (n = -1100 to +1100).
Enable (1 or ON) or disable (0 or OFF) autorange.
Specify REL value (n = -1100 to +1100).
Specify measurement resolution (number of digits; n = 4 to 8).
Initiate one trigger (measure) cycle.
Reset trigger system and go to idle state.
Subsystem command path to configure scan
Path to program scan layer:
Program number of scans (1 to 99999 or INFinite).
Program delay (0 to 999999.999sec).
Select event to control scan trigger.
MANual|BUS|TLINk| EXTernal
:TIMer <num>
:TRIGger
:COUNt <n>|INF
:DELay <num>
:SOURce HOLD|IMMediate|MANual|
Set timer interval (0.001 to 999999.999sec).
Subsystem command path to program measure layer:
Program number of measurements (1 to 99999, or INFinite).
Program delay (0 to 999999.999sec).
Select event to control measure trigger.
BUS| TLINK| EXTernal|TIMer
:TIMer <num>
:ROUTe
:CLOSe <list>
:STATe?
:OPEN <list>|ALL
:SCAN <list>
:EXTernal <list>
Notes:
1. Command short form is indicated by the uppercase characters. For example, instead of sending “:arm:layer2:source immediate”, you can send
“:arm:lay2:sour imm”.
2. The brackets [ ] indicate optional names that need not be sent. For example: [:SENSe[1]]:VOLTage:DC:RANGe:[UPPer] 5 is the same as
:VOLTage:DC:RANGe 5.
Set timer interval (0.001 to 999999.999sec).
Subsystem command path for scanning.
Path and command to close channel.
Request closed status of channel list.
Open specified channels
Path and command to specify internal list.
Command to specify external list.
2-15
Page 39

Getting Started
2.6.7 Syntax rules
The following information explains some of the programming syntax for the Model 2001. For more complete information, see Programming Syntax, which is located just after
the tab labeled “SCPI Command Subsystems”.
General form
The general form for SCPI commands is demonstrated in Table 2-7. Notice that they are hierarchical in nature and begin
with a root command. For example, to set autoranging on the
DC voltage function, you would send the following command:
:VOLT:DC:RANG:AUTO ON
The root command for the above example is [:SENSe[1]].
This is an optional command word (as indicated by the
brackets in the table) and need not be used.
Note that there must be a space between the command word
and the parameter. In the above example, there is a space between the :AUTO command word and the ON parameter.
SCPI command words and common commands are not case
sensitive. They can be sent in uppercase or lowercase. The
commands in Table 2-7 show a combination of upper and
lowercase characters. The uppercase characters identify the
short-form version of the command. For example, all the following versions of the same program message are valid:
1. 4 This integer parameter sets the DC voltage resolu-
tion to 3.5 digits.
2. 0.5 This real number parameter sets the trigger delay
period in seconds.
3. ON This Boolean parameter enables the display of
user text messages on the display, in this case, the bottom line. A “1” could have been used instead. “OFF” or
“0” disables the function.
4. Model 2001 This string parameter specifies the user
text message. Single or double quotes delimit the message. Note that the previous command must be sent to
enable the display of user text messages.
5. MOVing This name parameter specifies the mode of
the averaging or advanced digital filte .
6. (@1:3,5) This list parameter specifies an internal
scan list for the Model 2001-SCAN. Parentheses are
used to enclose the list of channels. The @ symbol must
precede the first channel in the list. A colon is used as a
separator for the range limits (channels 1 through 3).
Each channel or channel range in the list must be separated by a comma.
Multiple commands
Multiple commands can be sent in the same message as long
as they are separated by semicolons. For example:
Instead of sending ...
:system:error?
:system:preset
:ARM:LAYER2:SOURCE MANUAL
:ARM:LAY2:SOURCE MAN
:ARM:LAY2:SOUR MAN
:arm:layer2:source manual
:arm:lay2:sour man
:Arm:Lay2:Sour Man
:ArM:LaY2:SouR MaN
Parameters
As previously mentioned, a parameter is separated from the
command word by a space character. The parameter can consist of one or more data types, such as integer, real, Boolean,
string, name, or list. Some examples follow:
1. :voltage:dc:resolution 4
2. :trigger:delay 0.5
3. :display:window2:text:state on
4. :display:window2:text:data ‘Model 2001’
5. :voltage:dc:average:tcontrol moving
6. :route:scan:internal (@1:3,5)
You can send ...
:system:error?;preset
When the above message is sent, the first command word is
recognized as the root command. When the command parser
sees a colon after a semicolon, it resets the path pointer to the
root before processing the next command.
Proper use of the path pointer allows commands in the same
command level to be serviced without having to retype the
entire command path. For example, the command
:ARM:LAYer2:SOURce MANual moves the path pointer
down to the last command level in the path. As a result, the
:count, :delay, and :timer commands and their companion
query commands can be included in the same program message without repeating the entire path. Some examples follow:
Instead of sending ...
:arm:lay2:sour man;:arm:lay2:sour?
You can send ...
:arm:lay2:sour man;sour?
2-16
Page 40

Getting Started
Instead of sending ...
:trig:coun 1;:trig:del 1;:trig:tim 1
You can send ...
:trig:coun 1;del 1;tim 1
Notice that the colon for the additional commands is not included. Remember, when a colon (not preceded by a semicolon) is seen, the path pointer moves down to the next
command level. For example:
:trig:del 1;tcon:prot asyn
When this message is sent, the path pointer moves down one
command level for the DELAY and TCONFIGURE commands. The colon after the TCONFIGURE command then
moves the pointer down to the next command level and enables PROTOCOL.
A few important points:
1. The path pointer can only move down. It cannot be
moved up a level. (Note: It can be reset to the root mode
by a preceding colon. For example, :ARM:LAY2:
SOUR MAN; :TRIG:SOUR MAN.)
2. Each new message (line) must begin with the root command.
3. The colon at the beginning of a program message is optional.
4. The end of a program message moves the path pointer
back to the root; so does a leading colon.
5. Any time one or more query commands are included in
a program message, the Model 2001 must be addressed
to talk to send the response message to the computer.
2.6.8 Programming examples
The following programming examples are written in the
Hewlett-Packard BASIC 4.0 programming language. The
programs assume that the Model 2001 is set to primary address 16.
Programming example #1 Default DC voltage reading
The following code fragment resets the Model 2001 to a default configuration and gets a DC oltage reading:
100 OUTPUT 716;“:syst:pres”
110 OUTPUT 716;“:fetch?”
120 ENTER 716;A$
130 PRINT A$
Line 100 Return Model 2001 to :SYSTem:PRESet default
configuration (DC volts, autorange, 1 PLC, filte
enabled, 6.5 digits).
Line 110 Request new reading.
Line 120 Address to talk.
Line 130 Display reading, status, units, time-stamp, read-
ing number, and channel.
Programming example #2 High accuracy DC voltage reading
The following code fragment configures the Model 2001 for
high accuracy DC voltage readings and gets one reading:
100 OUTPUT 716;“:syst:pres”
110 OUTPUT 716;“:volt:dc:nplc 10”
120 OUTPUT 716;“:fetch?”
130 ENTER 716;A$
140 PRINT A$
Line 100 Return Model 2001 to default configuration
Line 110 Change integration time to 10 PLC (and resolu-
tion to 7.5d).
Line 120 Request new reading.
Line 130 Address to talk.
Line 140 Display reading status, units, time-stamp, read-
ing number, and channel.
Programming example #3 High speed DC voltage
readings
The following code fragment configures the Model 2001 for
high speed DC voltage readings, stores 100 readings, and
sends the readings over the bus:
100 OUTPUT 716;“:syst:pres”
110 OUTPUT 716;“:volt:dc:nplc 0.01”
120 OUTPUT 716;“:trac:clear”
130 OUTPUT 716;“:trac:feed calc”
140 OUTPUT 716;“:trac:egr full”
150 OUTPUT 716;“:trac:poin 100”
160 OUTPUT 716;“:trac:feed:cont next”
170 OUTPUT 716;“:trac:data?”
180 ENTER 716;A$
190 PRINT A$
Line 100 Return Model 2001 to default configuration
Line 110 Change integration time to 0.01 PLC.
Line 120 Clear all stored readings.
Line 130 Perform any math before storing readings.
Line 140 Store full data group (reading, reading number,
units, timestamp, status, and channel).
Line 150 Set buffer count to 100 readings.
Line 160 Start storing, stop when done.
2-17
Page 41

Getting Started
Line 170 Request readings (default is reading only, ASCII
format).
Line 180 Address to talk.
Line 190 Display readings, status, units, time-stamps,
reading numbers, and channels.
Programming example #4 Burst speed DC voltage
readings
The following code fragment configures the Model 2001 for
burst speed DC voltage readings, stores 100 readings, and
sends the readings over the bus:
100 OUTPUT 716;“:syst:pres”
110 OUTPUT 716;“:syst:amet burs”
120 OUTPUT 716; “form:elem read, rnum, unit,
stat”
130 OUTPUT 716;“:trac:clear”
140 OUTPUT 716;“:trac:feed calc”
150 OUTPUT 716;“:trac:poin 100”
160 OUTPUT 716;“:init”
170 WAIT 2
180 OUTPUT 716;”:trac:data?”
190 ENTER 716;A$
200 PRINT A$
Line 100 Return Model 2001 to default configuration
Line 110 Change acquisition method to burst; put unit in
idle.
Line 120 Specify data elements (reading, reading number,
units, and status).
Line 130 Clear all stored readings.
Line 140 Perform any math before storing readings.
Line 150 Set buffer count to 10 readings.
Line 160 Take unit out of idle; perform reading burst; re-
turn to idle.
Line 170 Wait for burst to complete.
Line 180 Request readings (default is readings only, ASCII
format).
Line 190 Address to talk.
Line 200 Display readings.
2-18
Page 42

3
Front Panel Operation
3.1 Introduction
This section contains detailed information on front panel operation of the Model 2001. It is organized as follows:
3.2 Power-up procedure:
ing the instrument to line power, warm-up period, default conditions, and the power-up sequence.
3.3 Display:
may appear while using the instrument.
3.4 Functions:
the instrument (DC and AC voltage, DC and AC current, 2-wire and 4-wire resistance, frequency, and temperature) and typical test connections.
3.5 Range:
tion.
3.6 Relative:
that can be used to null offsets or subtract a baseline
value from present and future readings.
3.7 Triggering:
trigger sources that can be used.
Covers display format and messages that
Describes the measurement functions of
Covers both manual and autoranging opera-
Gives details on using the relative feature
Details types of trigger modes as well as
Covers information on connect-
3.12 Menu:
Covers selections controlled from the main
menu, such as saving instrument setups, GPIB (IEEE488 bus) configuration, calibration, self-tests, limits,
and the digital I/O port.
3.2 Power-up procedure
3.2.1 Line power connections
Follow the procedure below to connect the Model 2001 to
line power and turn on the instrument.
1. The Model 2001 operates from a line voltage in the
range of 90-134V or 180-250V at a frequency of 50, 60,
or 400Hz. Check to see that the operating voltage in
your area is compatible.
CAUTION
Operating the instrument on an incorrect line voltage may cause damage to
the instrument, possibly voiding the
warranty.
3.8 Buffer:
gramming buffer size and recalling data, time stamp,
and statistics information.
3.9 Filter:
be used to reduce reading noise.
3.10 Math:
formed on readings in continuous operation.
3.11 Scanning:
scans, along with ratio and delta calculations.
Covers use of the reading buffer including pro-
Covers the use of the digital filter types that can
Describes the calculations that can be per-
Discusses setting up internal and external
2. Before plugging in the power cord, make sure the front
panel power switch is in the off (0) position.
3. Connect the female end of the supplied power cord to
the AC receptacle on the rear panel. Connect the other
end of the power cord to a grounded AC outlet.
WARNING
The power cord supplied with the Model
2001 contains a separate ground wire
for use with grounded outlets. When
3-1
Page 43

Front Panel Operation
×
proper connections are made, instrument chassis is connected to power line
ground through the ground wire in the
power cord. Failure to use a grounded
outlet may result in personal injury or
death due to electric shock.
3.2.2 Line fuse replacement
A rear panel fuse located below the AC receptacle protects
the power line input of the instrument. If the fuse needs to be
replaced, perform the following steps:
WARNING
Make sure the instrument is disconnected from the power line and other equipment before replacing the line fuse.
1. With the power off, place the end of a flat-blade screwdriver into the rear panel LINE FUSE holder. Push in
gently and rotate the fuse carrier one-quarter turn counterclockwise. Release pressure on the holder and its internal spring will push the fuse carrier out of the holder.
2. Remove the fuse and replace it with the same type
(0.5A, 250V, slow blow, 5
number is FU-71.
CAUTION
Do not use a fuse with a higher current
rating than specified, or instrument
damage may occur. If the instrument repeatedly blows fuses, locate and correct
the cause of the trouble before replacing
the fuse. See the optional Model 2001
Repair Manual for troubleshooting information.
20mm). The Keithley part
On power-up, the Model 2001 performs self-tests on its
EPROM and RAM, and checksum tests on data stored in
non-volatile memory. (See Table 3-1.) If a failure is detected,
the instrument momentarily displays an error message and
the ERR annunciator turns on. (Messages are listed in Table
3-2.)
NOTE
If a problem develops while the
instrument is under warranty, return it to
Keithley Instruments, Inc. for repair. (See
paragraph 1.3.)
If the instrument passes the self-tests, the firm are revision
levels, memory option (if installed), and presently selected
IEEE-488 primary address are displayed. An example of this
display is shown as follows:
Model 2001
Rev. A01 A01 MEM1 IEEE Addr=16
The firm are revision levels (left to right) are for the main
microcontroller and display microcontroller. The revision
level number may be different in your particular unit. If the
MEM1 or MEM2 memory options are not present, that portion of the bottom line is left blank. The IEEE-488 address is
its default value of 16.
Next, if the unit is configured to display the calibration due
date at power-up, the unit shows the following:
Model 2001
Calibration due: mmm/dd/yy
where “mmm” is the month abbreviation, “dd” is the day,
and “yy” is the year. If no calibration date is set, the display
shows that it is due now. (See the Model 2001 Calibration
Manual to set the calibration due date and paragraph 3.12.3
of this manual to set the display option.)
3. Install the new fuse and fuse carrier into the holder by
reversing the above procedure.
3.2.3 Power-up sequence
To turn on the power, simply push in the front panel POWER
switch. Power is on when the switch is in the inner (1) position. To turn off power, press POWER a second time to release the switch.
3-2
After the power-up sequence, the instrument begins its normal display, for example:
000.0000 mVDC
Power-up error messages
Error messages that may be displayed during power-up are
summarized in Table 3-2. These are shown when one of the
checksum tests of Table 3-1 fails.
Page 44

Table 3-1
Data checked on power-up
Data Type of storage Memory option
Front Panel Operation
IEEE-488 address
Power-on default
Calibration constants
Calibration dates
Instrument setups 1 in electrically-erasable PROM
Reading buffer (Volatile RAM)
Note: STD is standard memory, MEM1 is memory option #1, MEM2 is memory option #2.
Electrically-erasable PROM
Electrically-erasable PROM
Electrically-erasable PROM
Electrically-erasable PROM
4 more in non-volatile RAM
9 more in non-volatile RAM
Non-volatile RAM
STD, MEM1, MEM2
STD, MEM1, MEM2
STD, MEM1, MEM2
STD, MEM1, MEM2
STD, MEM1, MEM2
MEM1
MEM2
STD
MEM1, MEM2
Table 3-2
Power-up error messages
Message Action
Error +515,
Calibration dates lost
Error +514,
DC calibration data lost
Error +513,
AC calibration data lost
Error +512,
The cal dates are set to factory default values, but they are not stored into EEPROM. To do
this, perform a comprehensive calibration.
DC cal constants are set to factory default values, but they are not stored into EEPROM. To
do this, perform a comprehensive calibration.
AC cal constants are set to factory default values, but they are not stored into EEPROM. To
do this, perform a comprehensive calibration.
Power-on defaults are reset to factory defaults (bench) and stored into EEPROM.
Power-on state lost
Error +511,
GPIB address is reset to factory default (16) and stored into EEPROM.
GPIB address lost
Error +510,
Reading buffer data lost
Error -314,
The reading buffer controls are reset to factory defaults, but they are not stored into
NVRAM. To do this, store readings in the buffer.
Instrument setup is reset to bench defaults and stored into EEPROM.
Save/recall memory lost
Notes:
1. Any of these error conditions may occur the first time a unit is turned on or after replacing the fir are.
2. Error +510, Reading buffer data lost, applies to units with optional memory.
3. Error +512, Power-on state lost, may occur the first time the unit is p wered-up after replacing the MEM2 memory option with MEM1.
3-3
Page 45

Front Panel Operation
3.2.4 High energy circuit safety precautions
To optimize safety when measuring voltage in high energy
distribution circuits, read and use the directions in the following warning.
WARNING
Dangerous arcs of an explosive nature
in a high energy circuit can cause severe
personal injury, or death. If the multimeter is connected to a high energy circuit
when set to a current range, low resistance range, or any other low impedance range, the circuit is virtually
shorted. Dangerous arcing can result
even when the multimeter is set to a
voltage range if the minimum voltage
spacing is reduced.
When making measurements in high energy circuits, use test
leads that meet the following requirements:
• Test leads should be fully insulated.
• Only use test leads that can be connected to the circuit
(e.g., alligator clips, spade lugs, etc.) for hands-off measurements.
• Do not use test leads that decrease voltage spacing. This
diminishes arc protection and creates a hazardous condition.
Use the following sequence when testing power circuits:
1. De-energize the circuit using the regular installed connect-disconnect device, such as a circuit breaker, main
switch, etc.
2. Attach the test leads to the circuit under test. Use appropriate safety rated test leads for this application.
3. Set the multimeter to the proper function and range.
4. Energize the circuit using the installed connect-disconnect device and make measurements without disconnecting the multimeter.
5. De-energize the circuit using the installed connect-disconnect device.
6. Disconnect the test leads from the circuit under test.
WARNING
value may cause a breakdown in insulation, creating a shock hazard.
3.2.5 Power-on default conditions
Power-on default conditions are those conditions the instrument assumes when it is first turned on. You can change these
power-on default conditions (except the primary address) by
using the save setup feature that is available with the MENU
key, as described in paragraph 3.12.1. Depending on the installed memory option, either one, fi e, or ten user-define
setups can be stored, any one of which could be selected as
the power-on default.
A table in paragraph 3.12.1 lists the default conditions that
are set at the factory to optimize bench and GPIB (IEEE-
488) operation.
3.2.6 Warm-up period
The Model 2001 can be used within one minute after it is
turned on. However, the instrument should be turned on and
allowed to warm up for at least one hour before use to
achieve rated accuracy.
3.2.7 IEEE-488 primary address
The IEEE-488 primary address of the instrument must be the
same as the primary address you specify in the controller’s
programming language. The default primary address of the
instrument is 16, but you can set the address to any value
from 0 to 30 by using the MENU key. Refer to paragraph
3.12.2 for step-by-step instructions on setting the primary
address. Section 4 contains details on using the Model 2001
over the IEEE-488 bus.
3.3 Display
The display of the Model 2001 is primarily used to display
readings along with the units and type of measurement.
When not displaying readings, it is used for informational
messages, such as menu headings and selections. At the top
of the display are annunciators to indicate various states of
operation.
3-4
The maximum common-mode voltage
(voltage between INPUT LO and chassis ground) is 500V peak. Exceeding this
3.3.1 Display format
As shown in Figure 3-1, the front panel has two lines of display information:
Page 46

F
M
Reading after calculation
+2.0582673 e + 08mVAC
Reading = 002.058673
Reading before calculation
Figure 3-2
Scientific notation with calculate multiple displa
Front Panel Operation
Reading and Units
+002.056 mVAC RMS
Range: 200 mVAC Coupling: AC
Range and other measurement parameters
Stored Reading
-10.38649 VDC CH20
Rdg#+00099 @Time = +003.286492 sec
Stored reading parameter
Menu Heading
CONFIG TEMPERATURE
Sensor Units Speed Filter Resln
Menu Items
Type of
Measurement
External
Channel
igure 3-1
odel 2001 display formats
• The top line can display readings up to 7 ½ digits, along
with units. It can also indicate the measurement type
(e.g., RMS), display “hold”, type of math operation,
channel number, or limits pass/fail. It is also used for
menu headings, values of stored readings, and
messages.
• The bottom line displays the range and other measurement parameters (e.g., coupling or ratio), multiple displays, menu items, parameters of stored readings, and
messages. For longer text strings, the bottom line is split
in half. These are indicated by and characters at
the left or right end of the bottom line. Press the cursor
keys ( and ) to view each half.
The actual value of the reading, before the relative or math
operation, can be viewed on the bottom line with the appropriate multiple display. (See Figure 3-2). The units and multiplier prefix on the bottom line are assumed to be the same
as those on the top line reading.
Annunciators
The annunciators at the top of the display indicate the following conditions:
ERR:
The displayed reading is questionable. See paragraph
4.21 for the conditions that define a questionable reading
REM:
Indicates the Model 2001 is in remote when used over
the IEEE-488 bus. The Model 2001 can be placed in remote
by addressing it to listen with the bus REN line true.
TALK:
Shows that the Model 2001 is the active talker on the
IEEE-488 bus. The unit can be placed in the talker active
state by sending it the correct bus talk command, which is
derived from the primary address.
LSTN:
Turns on when the unit is an active IEEE-488 bus listener. The Model 2001 can be placed in the active listener
state by addressing it to listen.
SRQ:
Turns on when the unit requests service over the IEEE488 bus. The SCPI STATus command allows you to control
which conditions generate an SRQ (see paragraph 4.21).
Scientific notation
Enabling a relative or math operation might cause the reading value to exceed the display resolution of the top line. In
these cases, the instrument displays in 7 ½ digits of scientifi
notation. If the units have a multiplier prefix (milli-, micro-,
etc.), the exponent of the value reflectsthat. Labels on the far
right, such as channel number, may be sacrificed to provide
the desired precision. Note that ratio measurements are always shown in 7 ½ digit scientific notation with no prefix or
channel number.
REAR:
Turns on when a reading has been acquired through
the rear inputs.
REL:
Turns on/off to indicate the present state of the relative
reading feature.
FILT:
When filtering has been selected for a particular function, this indicator turns on when the FILTER key is pressed.
For those functions with auto-filtering, it turns on when
AUTO is selected.
3-5
Page 47

Front Panel Operation
*:
MATH:
has been selected from the CONFIGURE MATH menu, this
indicator turns on when the MATH key is pressed.
4W:
circuit current, or temperature with a 4-wire RTD.
AUTO:
current (except in-circuit current, which has a fi ed 12A
range), or resistance measurements.
ARM:
state (by the TRIG key or the :INIT or :INIT:CONT ON bus
command). A measurement can only be performed with the
Model 2001 out of the idle state.
When a math operation (percent, mX+b, or none)
Turns on to indicate the 4-wire resistance function, in-
Turns on when autoranging is selected for voltage,
Turns on when the Model 2001 is taken out of the idle
Indicates when normal readings are being stored.
3.3.2 Multiple displays
Each measurement function has its own set of “multiple displays” shown on the bottom line of the front panel display.
The PREVious and NEXT DISPLAY keys scroll through the
selections for the present function.
Some of the multiple displays are for multiple functions,
where different functions are measured sequentially from the
same set of test leads. The readings are shown simultaneously, such as:
• Top line shows a DC voltage measurement; bottom line
shows positive and negative peak spike measurements.
• Top line shows an AC RMS voltage reading; bottom
line shows an AC frequency measurement and a crest
factor calculation.
Also, the multiple displays can show a reading in a different
form, or give additional information about the reading, for
example:
• Top line shows a reading; bottom line shows a zerocentered bar graph with adjustable limits.
• Top line shows a frequency measurement; bottom line
shows the adjustable trigger level.
To scroll through the multiple displays available for each
measurement function, repeatedly press and release the
NEXT DISPLAY key. The same action with the PREVious
DISPLAY key does a reverse scroll through the displays. To
return to the default reading display, just press and hold either key.
Multiple displays that are specific to a particular function or
operation are discussed later in this section, such as the peak
spikes displays in DC voltage, and the calculations display in
math. (See Table 3-3 for paragraph references.) Displays that
are common to most of the measurement functions are discussed here. Appendix H shows a complete listing of the
multiple displays by function.
3-6
Page 48

Table 3-3
Multiple displays by function
Function Next display Paragraph
Front Panel Operation
All Bar graph
Zero-centered bar graph
Maximum and minimum values
Relative and actual values
Calculated and actual values (see Note 1)
Limits bar graph (see Note 1)
Adjacent channel readings (see Note 2)
DC voltage DC volts, AC ripple voltage and frequency
3.3.2
3.3.2
3.3.2
3.6
3.10
3.12.5
3.11
3.4.1
Positive peak spikes and highest value
Negative peak spikes and lowest value
Positive and negative peak spikes
AC voltage AC RMS voltage, frequency, and crest factor
3.4.1
AC RMS, average, and peak voltages
DC current (none specific to function) 3.4.2
AC current AC RMS (or average) current and frequency
3.4.2
AC RMS and average current
2-wire resistance Source current
3.4.3
Voltage drop across DUT
4-wire resistance Source current
3.4.3
Voltage drop across DUT
Lead resistance
Frequency Period calculation
3.4.4
Trigger level
Temperature Celsius, Fahrenheit, and Kelvin units
3.4.5
RTD resistance (or thermocouple voltage)
Reference junction (thermocouples only)
Data storage buffer Maximum and minimum values
3.8
Average and standard deviation
Notes:
1. Multiple displays for calculated values and limits bar graph are not available for the frequency function.
2. The multiple display for adjacent channel readings is not available for the DC and AC current functions.
3-7
Page 49

Front Panel Operation
F
B
F
Bar graph
The “normal” bar graph, with a zero at the left end, is a
graphical representation of a reading as a portion of a range.
(See Figure 3-3.) The vertical lines displayed along the bar
designate 0%, 25%, 50%, 75%, and 100% of full scale. Each
full segment of the bar represents approximately 4% of the
range limit
.
-11.96859 VDC
0 -20V
Full
Range
25% of
full range
50% of
full range
75% of full range
igure 3-3
ar graph (zero-at-left) multiple display
For measurement functions with a range (voltage, current,
and resistance), the right endpoint of the bar graph is plus full
scale of the present range for positive readings, and minus
full scale for negative readings. When the 100% line changes
to an arrow, the reading exceeds the present range.
Note that the normal bar graph is not available when the
ACV units are dB or dBm.
For functions without a range (frequency and temperature),
the right endpoint of the bar graph is user-programmable by
pressing either CONFIG-NEXT DISPLAY or CONFIGPREV DISPLAY. Note that these configuration menus are
context-sensitive. If the unit is in any function except frequency or temperature, CONFIG-NEXT DISPLAY results
in the zero bar graph configuration displa .
2Hz 20Hz 200Hz 2kHz 20kHz
200kHz 2MHz 15MHz
For temperature:
BARGRAPH:0 to 0040°C
3. Change the frequency range by highlighting one of the
selections and pressing ENTER. For the temperature
range, use the cursor keys and the RANGE and
keys to enter a numeric value (0 - 9999°C). Press ENTER when done.
Zero-centered bar graph
The zero-centered bar graph is a graphical representation of
a reading with plus and minus limits. (See Figure 3-4.) The
limits are expressed in a user-selectable percentage of range
for voltage, current, and resistance, and a user-selectable value for frequency and temperature.
-05.95770 VDC
-50% +50%
-50% of range
-25% of range
0%
+50% of range
25% of range
igure 3-4
Zero-centered bar graph multiple display
The vertical lines displayed along the bar designate the plus
and minus limits, zero, and halfway to either limit. There are
ten full segments between zero and each end, so each full
segment represents 10% of the limit. When a line at the limit
changes to an arrow, the reading exceeds the programmed
range.
Perform the following to view or change the range of the bar
graph:
1. From the frequency or temperature function, press the
CONFIG key and then the NEXT or PREV DISPLAY
key. The following menu is displayed:
BARGRAPH TYPE
ZERO-AT-LEFT ZERO-CENTERED
2. Use the cursor keys ( and ) to place the cursor on
ZERO-AT-LEFT and press ENTER. You will access one
of the following menus:
The plus and minus percentage of range that is programmed
(0.01 - 99.99%) applies to all voltage, current, and resistance
functions. Because of rounding, values greater than 99.5%
are shown as 100% and, likewise, values greater than 1%
(such as 1.67%) are shown rounded to the nearest integer
percent.
Note that the zero-centered bar graph is not available when
the ACV units are dB or dBm.
Perform the following to view or change the plus and minus
percentage of range:
For frequency:
FREQ BARGRAPH RANGE
3-8
Page 50

1. From a voltage, current, or resistance function, press
Figure 3-5
Maximum and minimum multiple display
Minimum
value
-15.82867 VDC
Max = -05.74602 Min = -15.82867
Maximum
value
CONFIG and then NEXT or PREV DISPLAY. The following is displayed:
ZERO-BARGRAPH±50.00%
2. Change the percentage by using the cursor keys and the
RANGE and keys to enter a numeric value (0.01
- 99.99%). Press ENTER when done. The same percentage of range is used for voltage, current, and resistance
measurements.
Perform the following to view or change the plus and minus
value limit:
1. From the frequency or temperature function, press
CONFIG and then NEXT or PREV DISPLAY. The following menu is displayed:
BARGRAPH TYPE
ZERO-AT-LEFT ZERO-CENTERED
Front Panel Operation
The resolution, units, and prefix on the bottom line are the
same as shown for top line reading. If necessary, the bottom
line values automatically change to scientific notation,
rounded to 4.5 digits.
3.3.3 Information messages
2. Use the cursor keys ( and ) to place the cursor on
ZERO-CENTERED and press ENTER. You will access
one of the following menus:
For frequency:
FREQ ZEROBARGRAPH(±)
1Hz 10Hz 100Hz 1kHz 10kHz
100kHz 1MHz 10MHz 15MHz
For temperature:
ZERO-BARGRAPH±0002°C
3. Change the frequency limits by highlighting one of the
selections and pressing ENTER. For the temperature,
use the cursor keys and the RANGE and keys to
enter a numeric value (0 - 9999°C). Press ENTER when
done.
Maximum and minimum
The maximum and minimum multiple display shows the
maximum and minimum readings since the display was entered. (See Figure 3-5.) The maximum and minimum values
are reset by the following:
Press the INFO key to view context-sensitive information
from most of the displays. An arrow ( or ) on the bottom line indicates that there is more information. Use the
cursor keys ( and ) to view the complete line. To exit
an INFO display, just press INFO, ENTER, EXIT, or a function key.
Information messages are included with the listing of menu
structures in Appendix H.
3.3.4 Status and error messages
During Model 2001 operation and programming, you will
encounter a number of front panel messages. Typical
messages are either of status or error variety, as listed in
Table 3-4.
For firm are revisions A02 and greater, the most recent status or error messages can be momentarily displayed. Just enter a configuration menu or the main menu, and press the
AUTO range key. (The display is blank if no message is
queued.)
• Pressing the present function key.
• Leaving the display by changing function or entering a
menu.
3-9
Page 51

Front Panel Operation
Table 3-4
Status and error messages
Number Description Event
+900 “Internal System Error” EE
+611
+610
+515
+514
+513
+512
+511
+510
+444 to
+350
+312
+310
+309
+308
+306
+305
+304
+303
+302
+301
+174
+173
+172
+171
“Questionable Temperature”
“Questionable Calibration”
“Calibration dates lost”
“DC calibration data lost”
“AC calibration data lost”
“Power-on state lost”
“GPIB address lost”
“Reading buffer data lost”
Calibration Errors
(see Calibration Manual)
“Buffer Pretriggered”
“Buffer full”
“Buffer half full”
“Buffer Available”
“Reading Available”
“High limit 2 event”
“Low limit 2 event”
“High limit 1 event”
“Low limit 1 event”
“Reading overfl w”
“Re-entering the idle layer”
“Waiting in arm layer 2”
“Waiting in arm layer 1”
“Waiting in trigger layer”
SE
SE
EE
EE
EE
EE
EE
EE
EE
SE
SE
SE
SE
SE
SE
SE
SE
SE
SE
SE
SE
SE
SE
+161 “Program running” SE
+126
+125
+124
+123
+122
+121
“Device calculating”
“Device measuring”
“Device sweeping”
“Device ranging”
“Device settling”
“Device calibrating”
SE
SE
SE
SE
SE
SE
+101 “Operation Complete” SE
+000 “No Error” SE
-100
-101
-102
-103
-104
-105
-108
-109
-110
-111
-112
-113
-114
“Command Error”
“Invalid Character”
“Syntax Error”
“Invalid Separator”
“Data Type Error”
“GET not allowed”
“Parameter not allowed”
“Missing Parameter”
“Command Header Error”
“Command Header Separator Error”
“Program mnemonic too long”
“Undefined header”
“Header suffix out of range
EE
EE
EE
EE
EE
EE
EE
EE
EE
EE
EE
EE
EE
Table 3-4 (Continued)
Status and error messages
Number Description Event
-120
-121
-123
-124
-128
-140
-141
-144
-148
-150
-151
-154
-158
-160
-161
-168
-170
-171
-178
-200
-201
-202
“Numeric data error”
“Invalid character in number”
“Exponent too large”
“Too many digits in number”
“Numeric data not allowed”
“Character data error”
“Invalid character data”
“Character data too long”
“Character data not allowed”
“String data error”
“Invalid string data”
“String too long”
“String data not allowed”
“Block data error”
“Invalid block data”
“Block data not allowed”
“Expression error”
“Invalid expression”
“Expression data not allowed”
“Execution error”
“Invalid while in local”
“Settings lost due to rtl”
EE
EE
EE
EE
EE
EE
EE
EE
EE
EE
EE
EE
EE
EE
EE
EE
EE
EE
EE
EE
EE
EE
(return to local)
-210
-211
-212
-213
-214
-215
-220
-221
-222
-223
-224
-230
-241
-260
-314
-330
-350
-410
-420
-430
-440
“Trigger error”
“Trigger ignored”
“Arm ignored”
“Init ignored”
“Trigger deadlock”
“Arm deadlock”
“Parameter Error”
“Settings conflict
“Parameter data out of range”
“Too much data”
“Illegal parameter value”
“Data corrupt or stale”
“Hardware missing”
“Expression Error”
“Save/recall memory lost”
“Self Test failed”
“Queue overfl w”
“Query interrupted”
“Query unterminated”
“Query deadlocked”
“Query unterminated after indefinite
EE
EE
EE
EE
EE
EE
EE
EE
EE
EE
EE
EE
EE
EE
EE
EE
EE
EE
EE
EE
EE
response”
SE = Status event
EE = Error event
3-10
Page 52

Ω
Ω
Front Panel Operation
3.3.5 Menu structures
From the front panel of the Model 2001, you configure measurements through the use of menus. A complete listing of
the menus is given in Appendix H. The menus are grouped
into three areas:
• Measurement functions: DC voltage, AC voltage, DC
current, AC current, 2-wire resistance, 4-wire resistance, frequency, and temperature.
• Measurement operations: Multiple displays, relative
readings, triggers, reading storage, digital filte , math,
channels, and scanning.
• Other menu operations: Setup storage, IEEE-488
(GPIB) setup, calibration, self-tests, limits, status messages, and general operations.
The first two groups have specific keys on the front panel.
The third group does not. The desired menu is displayed by
pressing the appropriate key or key sequence:
• CONFIG and then DCV (or ACV, DCI, ACI,
FREQ, TEMP): Shows the configuration menu for each
measurement function.
• CONFIG and then NEXT DISPLAY (or PREV DISPLAY, REL, TRIG, STORE, FILTER, MATH, CHAN,
SCAN): Shows the configuration menu for the multiple
displays and each measurement operation.
• MENU: The main menu accesses items for which there
are no dedicated keys.
2,
3. Pressing the ENTER key selects an item and, if further
definition is needed, moves down within the menu structure. Pressing the EXIT key backs up within a menu
structure.
4. The cursor position is denoted by a blinking menu item
or parameter. The cursor is moved from one item to the
next using the cursor keys ( and ). To select an
item, highlight it with the cursor, then press ENTER.
5. A displayed arrow ( or ) on the bottom line indicates there is more information or additional menu items
to select from. When “ ” is displayed, use the cursor key to display the additional message(s), and conversely, when “ “ is displayed, use the cursor key.
The cursor keys have an auto-repeat feature.
6. A numeric parameter is keyed in by placing the cursor
on the digit to be changed, and pressing the RANGE
or keys to increment or decrement the digit.
7. A change is only executed when the ENTER key is
pressed. Entering an invalid parameter generates an error, and the entry is ignored. Changes are also ignored if
4,
an EXIT is performed.
8. The INFO key can be used anywhere in a menu to display helpful information messages concerning operation. To cancel an information message and remain in
the menu, press INFO a second time, EXIT, or ENTER.
Pressing a function key cancels INFO and a menu, and
returns the instrument to a reading display.
3.3.6 EXIT key
Navigating menus
1. From the instrument’s normal state of displaying readings, you can:
• View a configuration menu by pressing CONFIG and
then the desired function or operation key (DCV,
TRIG, etc.).
• View the top level of the main menu by pressing the
MENU key.
2. The unit is returned to the normal reading display by:
• Pressing EXIT or MENU from the top level of the
main menu.
• Pressing EXIT from the top level of a configuratio
menu.
• Pressing a measurement function key from within a
menu.
The EXIT key has more actions than those mentioned in
paragraph 3.3.5. Table 3-5 lists the action for single conditions.
When more than one of the conditions of Table 3-5 is
present, the hierarchy for the action taken by each press of
the EXIT key is as follows:
1. Cancels any temporary or error messages that are displayed.
2. Cancels INFO message and shows the normal reading
display.
3. Cancels reading display hold and returns to normal
reading display.
4. Disables scanning and returns to normal operation. Also
interrupts data storage if enabled.
5. Interrupts data storage and returns to normal operation.
3-11
Page 53

Front Panel Operation
Table 3-5
EXIT key actions
Condition EXIT key action
Temporary message displayed
(e.g., TRIGGERS HALTED)
INFO message displayed Cancels INFO message, returns to menu or normal reading display.
Reading display hold Cancels reading display hold, resumes normal reading display.
Scanning Disables scanning. Also stops data storage if enabled.
Data storage Stops data storage. Temporary message STORAGE INTERRUPTED is displayed.
Some examples of when multiple conditions are cancelled
by pressing the EXIT key follow.
Example 1:
play, press INFO to view the message. The first press of
EXIT returns you to the held reading; a second press cancels
reading display hold.
Example 2:
ENTER to hold the display, then press INFO to view the
message. The first press of EXIT returns you to the held
reading; the second press returns you to the normal reading
display. A third press of EXIT stops the scan and returns to
normal operation.
Example 3:
into a buffer. Press EXIT once. Scanning and storing are terminated; normal operation is resumed. Note that the trigger
model is restored to its pre-scanning configuration
Example 4: Configure a scan list and start scanning readings
into a buffer. Press ENTER to hold the reading display. Press
INFO to view the message. The first press of EXIT returns
you to the held reading display. A second press of EXIT
cancels the held reading and shows normal storage. A third
press of EXIT stops scanning and storing; normal operation
is resumed.
After pressing ENTER to hold the reading dis-
Configure a scan list and start scanning. Press
Configure a scan list and start scanning readings
3.4 Functions
The Model 2001 has much fl xibility when configuring the
measurement functions. This fl xibility must be used sensibly in order to balance the various settings for a particular application. For example, you can configure DC volts with an
integration time of 0.01 PLC (power line cycle) at 7.5 digits
of resolution and no filte , but the reading will be extremely
noisy. As another example, DCV peak spikes can be config
ured for 7.5 digits of resolution, yet the measurement is spec-
Cancels display of temporary message.
ified at 3.5 digits. When in doubt, use the default settings and
the auto selections until you become more familiar with the
effects of other settings.
The instrument can be configured to display multiple functions, where different functions are measured sequentially
from the same leads. These are referred to as “multiple displays” and they are shown on the bottom line of the display.
The displays for multiple functions are discussed in the following paragraphs.
NOTE
All measurements in the multiple display
mode will be within specifications. However, for optimum measurement integrity,
the primary display mode should be used.
To minimize the need to reprogram setup conditions every
time you switch from one function to another, each function
“remembers” its own unique setup configuration. Setup configuration parameters that are remembered include
• Range
• Relative
• Integration time
• Filtering
• Display resolution
• Multiple displays
To access the configuration menus for the measurement
functions, press the CONFIG key and then a function key
(DCV, ACV, DCI, ACI, Ω2, Ω4, FREQ, TEMP). Rules for
navigating the menu structures are covered in paragraph
3.3.5.
3-12
Page 54

Front Panel Operation
3.4.1 DC and AC voltage
DC voltage measurements
The Model 2001 can make DC voltage measurements between 10nV and 1100V. Assuming “bench reset” conditions
(see paragraph 3.12.1), the basic procedure is as follows:
1. Connect the test leads to the INPUT HI and LO terminals of the Model 2001. Either the front or rear inputs
can be used; place the INPUTS button in the appropriate
position.
2. Select the DCV function.
3. Select a range consistent with the expected voltage. For
automatic range selection, press the AUTO key. The
AUTO annunciator denotes whether auto-ranging is enabled.
4. Connect the test leads to the source as shown in Figure
3-6.
CAUTION
Do not exceed 1100V peak between INPUT HI and LO, or instrument damage
may occur.
4. Press the REL key. The display will read zero.
5. Remove the short and connect the test leads to the signal
to be measured.
Also, use shielded, low-thermal connections for the 200mV
range to avoid errors caused by noise or thermal offsets. Connect the shield to the negative source terminal.
AC voltage measurements
The Model 2001 can make true RMS AC voltage measurements between 100nV and 775V. Assuming “bench reset”
conditions (see paragraph 3.12.1), the basic procedure is as
follows:
1. Connect the test leads to the INPUT HI and LO terminals of the Model 2001.
2. Select the ACV function.
3. Select a range consistent with the expected voltage. For
automatic range selection, press the AUTO key. The
AUTO annunciator denotes whether autoranging is enabled.
4. Connect the test leads to the source as shown in Figure
3-7.
5. Observe the display. If the “Overfl w” message is
shown, select a higher range until a normal reading is
displayed. Always use the lowest possible range for the
best resolution.
6. Take a reading from the display.
Zeroing
The term “when properly zeroed” means that you must establish a baseline for subsequent measurements on that
range. The 200mV DC range requires zero to be set to
achieve rated accuracy. This procedure should be performed
whenever the ambient temperature changes. To zero (rel) the
Model 2001, use the following procedure:
1. Disable rel, if presently enabled, by pressing the REL
key. The REL annunciator will turn off.
2. Select the 200mVDC range.
3. Connect the test leads to INPUT HI and LO of the Model 2001 and short them together. Noise and thermal offsets may require a few moments to stabilize.
CAUTION
Do not apply more than 1100V peak between INPUT HI and LO, or
7
V•Hz input, or instrument dam-
2×10
age may occur.
5. Observe the display. If the “Overfl w” message is
shown, select a higher range until a normal reading is
displayed. Always use the lowest possible range for the
best resolution.
6. Take a reading from the display.
Voltage configuration
The following paragraphs detail how to change the Model
2001 from its bench reset conditions for DC and AC voltage
measurements. The configuration menus are summarized in
Tables 3-6 and 3-7. Note that a function does not have to be
selected in order to be configured. When the function is selected, it will assume the programmed status.
3-13
Page 55
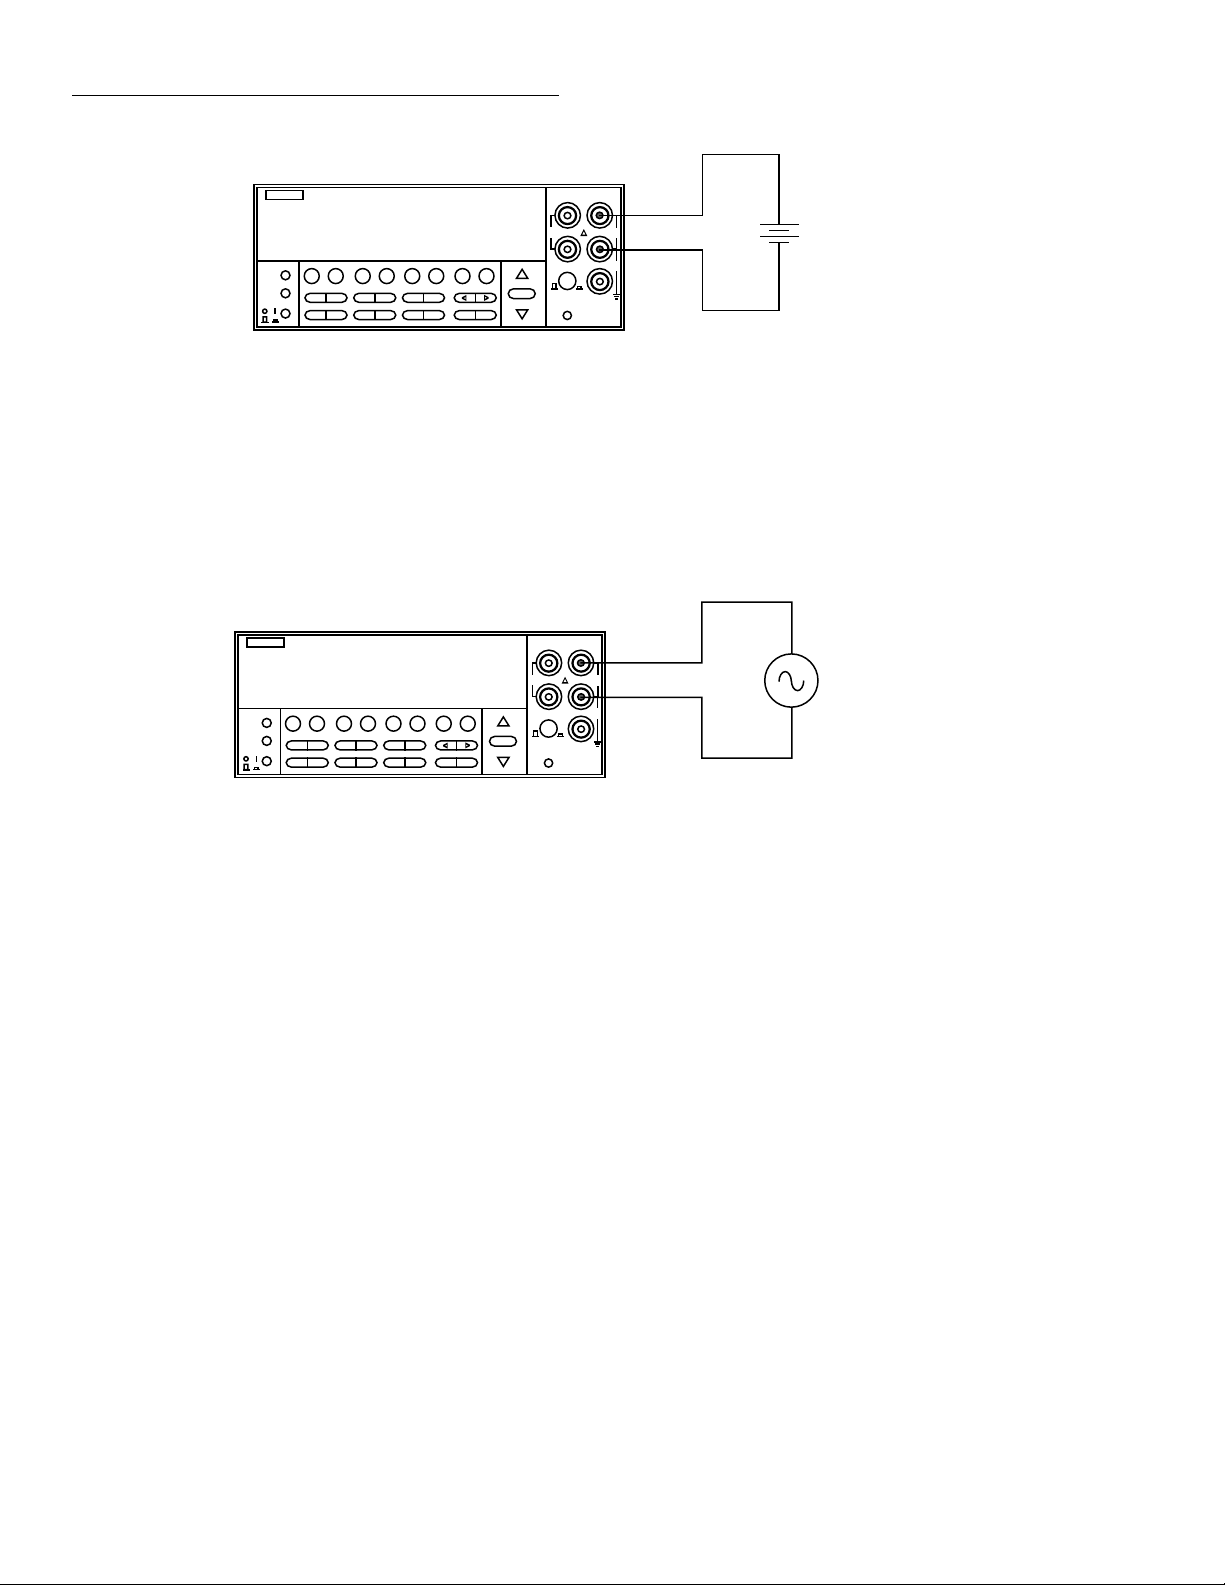
Front Panel Operation
DISPLAY
POWER
Figure 3-6
DC voltage measurements
PREV
DISPLAY
NEXT
POWER
Model 2001
+000.0001 mVDC
Range : 200 mVDC
PREV
DCV ACV DCI ACI Ω2 Ω4
NEXT
REL TRIG STORE RECALL
INFO LOCAL CHAN SCAN CONFIG MENU EXIT ENTER
FILTER MATH
Input Resistance = 10MΩ on 1000V and 200V ranges ;
> 10GΩ on 20V, 2V and 200mV ranges.
= 1MΩ on DCV peak spikes measurement.
Model 2001
+000.100 mVAC RMS
Range: 200 mVAC Coupling: AC
DCV ACV DCI ACI Ω2 Ω4
REL TRIG STORE RECALL
INFO LOCAL CHAN SCAN CONFIG MENU EXIT ENTER
FILTER MATH
SENSE
INPUT
Ω 4 WIRE
HI
350V
1100V
PEAK
2001 MULTIMETER
FREQ TEMP
RANGE
RANGE
AUTO
PEAK
LO
500V
PEAK
INPUTS
F
R
FRONT/REAR
2A 250V
AMPS
CAL
Caution: Maximum Input = 1100V peak
SENSE
INPUT
Ω 4 WIRE
HI
350V
1100V
PEAK
PEAK
2001 MULTIMETER
FREQ TEMP
RANGE
AUTO
RANGE
LO
500V
PEAK
INPUTS
F
R
FRONT/REAR
2A 250V
AMPS
CAL
DC Voltage
Source
AC Voltage
Source
Figure 3-7
AC voltage measurements
Input Impedance = 1MΩ shunted by <140pF
Caution: Maximum Input = 1100V peak, 2 x 10⁷ V•Hz
3-14
Page 56

Table 3-6
CONFIGURE DCV menu structure
Menu item Description
Front Panel Operation
SPEED
NORMAL
FAST
MEDIUM
HIACCURACY
SET-SPEED-EXACTLY
SET-BY-RSLN
ANALOG-FILTER Enable (ON) or disable (OFF) analog filte .
FILTER
AUTO
AVERAGING
ADVANCED
AVERAGING-MODE
RESOLUTION
AUTO
3.5d, 4.5d, 5.5d, 6.5d, 7.5d
Measurement speed (integration time) menu:
Select 1 PLC (power line cycle, 16.67msec for 60Hz, 20msec for 50Hz
and 400Hz).
Select 0.01 PLC.
Select 0.1 PLC.
Select 10 PLC.
Set integration time in PLC (0.01-10).
Default to setting appropriate for resolution.
Digital filter menu
Default to filter appropriate for int gration time.
Program a simple average filter (1-100 readings)
Program a simple average filter (1-100 readings) with a noise tolerance
window (0-100% of range).
Select moving average or repeating average mode.
Display resolution menu:
Default to resolution appropriate for integration time.
Select a specific resolution
3-15
Page 57

Front Panel Operation
Table 3-7
CONFIGURE ACV menu structure
Menu item Description
SPEED
NORMAL
FAST
MEDIUM
HIACCURACY
SET-SPEED-EXACTLY
SET-BY-RSLN
FILTER
AUTO
AVERAGING
ADVANCED
AVERAGING-MODE
RESOLUTION
AUTO
3.5d, 4.5d, 5.5d, 6.5d, 7.5d
UNITS
VOLTS
dB
dBm
COUPLING
AC
AC+DC
AC-TYPE
RMS
AVERAGE
PEAK
LOW-FREQ-RMS
POSITIVE-PEAK
NEGATIVE-PEAK
Measurement speed (integration time) menu:
Select 1 PLC (power line cycle, 16.67msec for 60Hz, 20msec for 50Hz and 400Hz).
Select 0.01 PLC.
Select 0.1 PLC.
Select 10 PLC.
Set integration time in PLC (0.01-10).
Default to setting appropriate for resolution.
Digital filter menu
Default to filter appropriate for int gration time.
Program a simple average filter (1-100 readings)
Program a simple average filter (1-100 readings) with a noise tolerance wind w
(0-100% of range).
Select moving average or repeating average mode.
Display resolution menu:
Default to resolution appropriate for integration time.
Select a specific resolution.
Display units menu:
Select volts.
Select dB and set voltage reference level.
Select dBm and set reference impedance.
Coupling menu:
Select AC coupled measurements.
Select DC coupled measurements.
Type of ACV measurement menu:
Select true RMS ACV.
Select average ACV.
Select peak ACV.
Select low frequency (typically <50Hz) true RMS ACV.
Select positive DCV peak spikes measurements.
Select negative DCV peak spikes measurements.
SPEED
The SPEED parameter sets the integration time of the A/D
converter, the period of time the input signal is measured
(also known as aperture). The integration time affects the
usable resolution, the amount of reading noise, as well as the
ultimate reading rate of the instrument. Any triggers received
while the instrument is processing a reading are ignored.
From the front panel, the integration time is specified in
parameters based on a number of power line cycles (NPLC),
where 1 PLC for 60Hz is 16.67msec and 1 PLC for 50Hz and
400Hz is 20msec.
3-16
The optimum integration time setting for a given application
depends on your measurement requirements. If speed is of
primary importance, use the FAST (0.01 PLC) integration
time at the expense of increased reading noise and less usable resolution. For maximum common-mode and normalmode rejection, use the HIACCURACY (10 PLC) integration time. The NORMAL (1 PLC) and MEDIUM (0.1 PLC)
can be used when a compromise between noise performance
and speed is acceptable. The additional parameters for integration time, SET-SPEED-EXACTLY and SET-BY-RSLN,
are discussed below.
Page 58
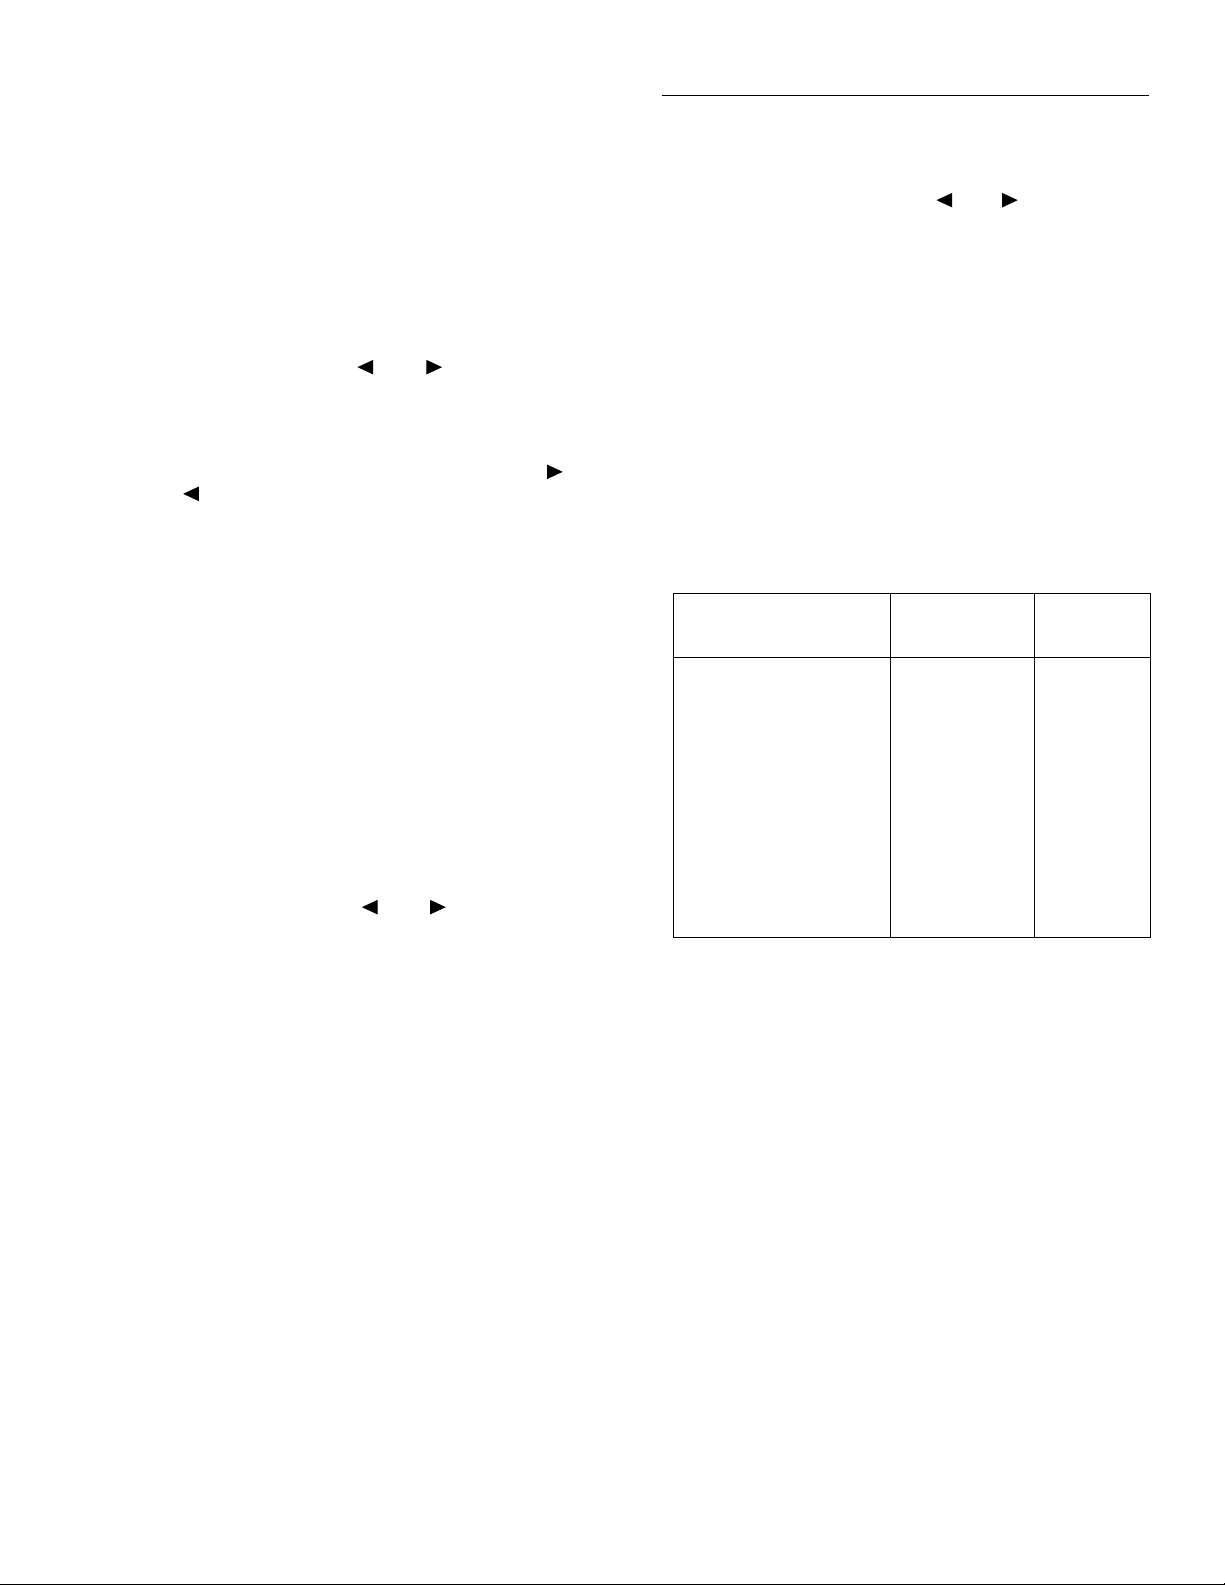
Front Panel Operation
You can program the integration time parameter as follows:
1. From the normal reading display, press the CONFIG
key and then the appropriate function key to access the
top level of a function configurationmenu. For example,
the CONFIGURE DCV menu is displayed as follows:
CONFIGURE DCV
SPEED FILTER RESOLUTION
2. Use the cursor keys ( and ) to highlight SPEED
and press ENTER. The following typical menu is
shown:
DCV MEASUREMENT SPEED
NORMAL FAST MEDIUM HIACCURACY
SET-SPEED-EXACTLY SET-BY-RSLN
3. Highlight the desired integration time and press ENTER. For all functions (except frequency), the parameters are as follows:
NORMAL = 1 PLC
FAST = 0.01 PLC
MEDIUM = 0.1 PLC
HIACCURACY = 10 PLC
There are two additional parameters, SET-SPEEDEXACTLY and SET-BY-RSLN. If the SET-SPEEDEXACTLY parameter is chosen, the following message is
displayed:
NPLC=01.00 (.01-10)
By using the cursor keys ( and ) and the RANGE
and keys, you can enter the integration time expressed in
power line cycles. Note that integer integrations time will increase noise rejection.
The SET-BY-RSLN parameter optimizes the integration
time for the present resolution setting. See Table 3-8 for the
default integration times of the DCV and ACV functions.
The default set-by-resolution integration times of other functions are listed in paragraphs 3.4.2, 3.4.3, and 3.4.5.
ANALOG FILTER
After selecting this menu item, cursor position indicates the
present state (ON or OFF) of the analog filte . To change the
state, place the cursor (using the and keys) on the alternate selection and press ENTER.
FILTER
The FILTER parameter lets you set the digital filter response
and control its on/off operation. It is described in paragraph
3.9. Only the specifics for DC and AC voltage are covered
here.
The AUTO parameter for a digital filter optimizes its use for
the present measurement function. The defaults for automatic filtering of DCV and ACV are listed in Table 3-9.
Table 3-8
DCV and ACV integration times set-by-resolution
Measurement function
and type Resolution
DCV 3.5d, 4.5d
5.5d
6.5d
7.5d
Integration
time
0.01 PLC
0.02 PLC
0.20 PLC
2.00 PLC
DCV peak spikes 3.5d (to 7.5d) Not used
RMS, average 3.5d, 4.5d
5.5d
6.5d, 7.5d
0.01 PLC
0.02 PLC
10.00 PLC
Low frequency RMS 3.5d to 7.5d Not used
ACV peak 4d (to 8d) Not used
Notes:
1. For DCV measurements, if the integration time is SET-BY-RSLN and
the resolution AUTO, the integration time will be 1.0 PLC and the
resolution 6.5 digits.
2. For RMS and average measurements, if the integration time is SETBY-RSLN and the resolution is AUTO, the integration will be 1.0
PLC and the resolution 5.5 digits.
3. For DCV peak spikes, low frequency RMS, and ACV peak measurements, the integration time setting is ignored.
4. The resolution of DCV peak spikes can be from 3.5d to 7.5d, but the
accuracy is specified at 3.5d. The resolution of ACV peak can be from
4d to 8d, but the accuracy is specified at 4d
The ANALOG-FILTER menu item is used to check and/or
change the state of the analog filter for the DCV function. It
is described in paragraph 3.9.
3-17
Page 59
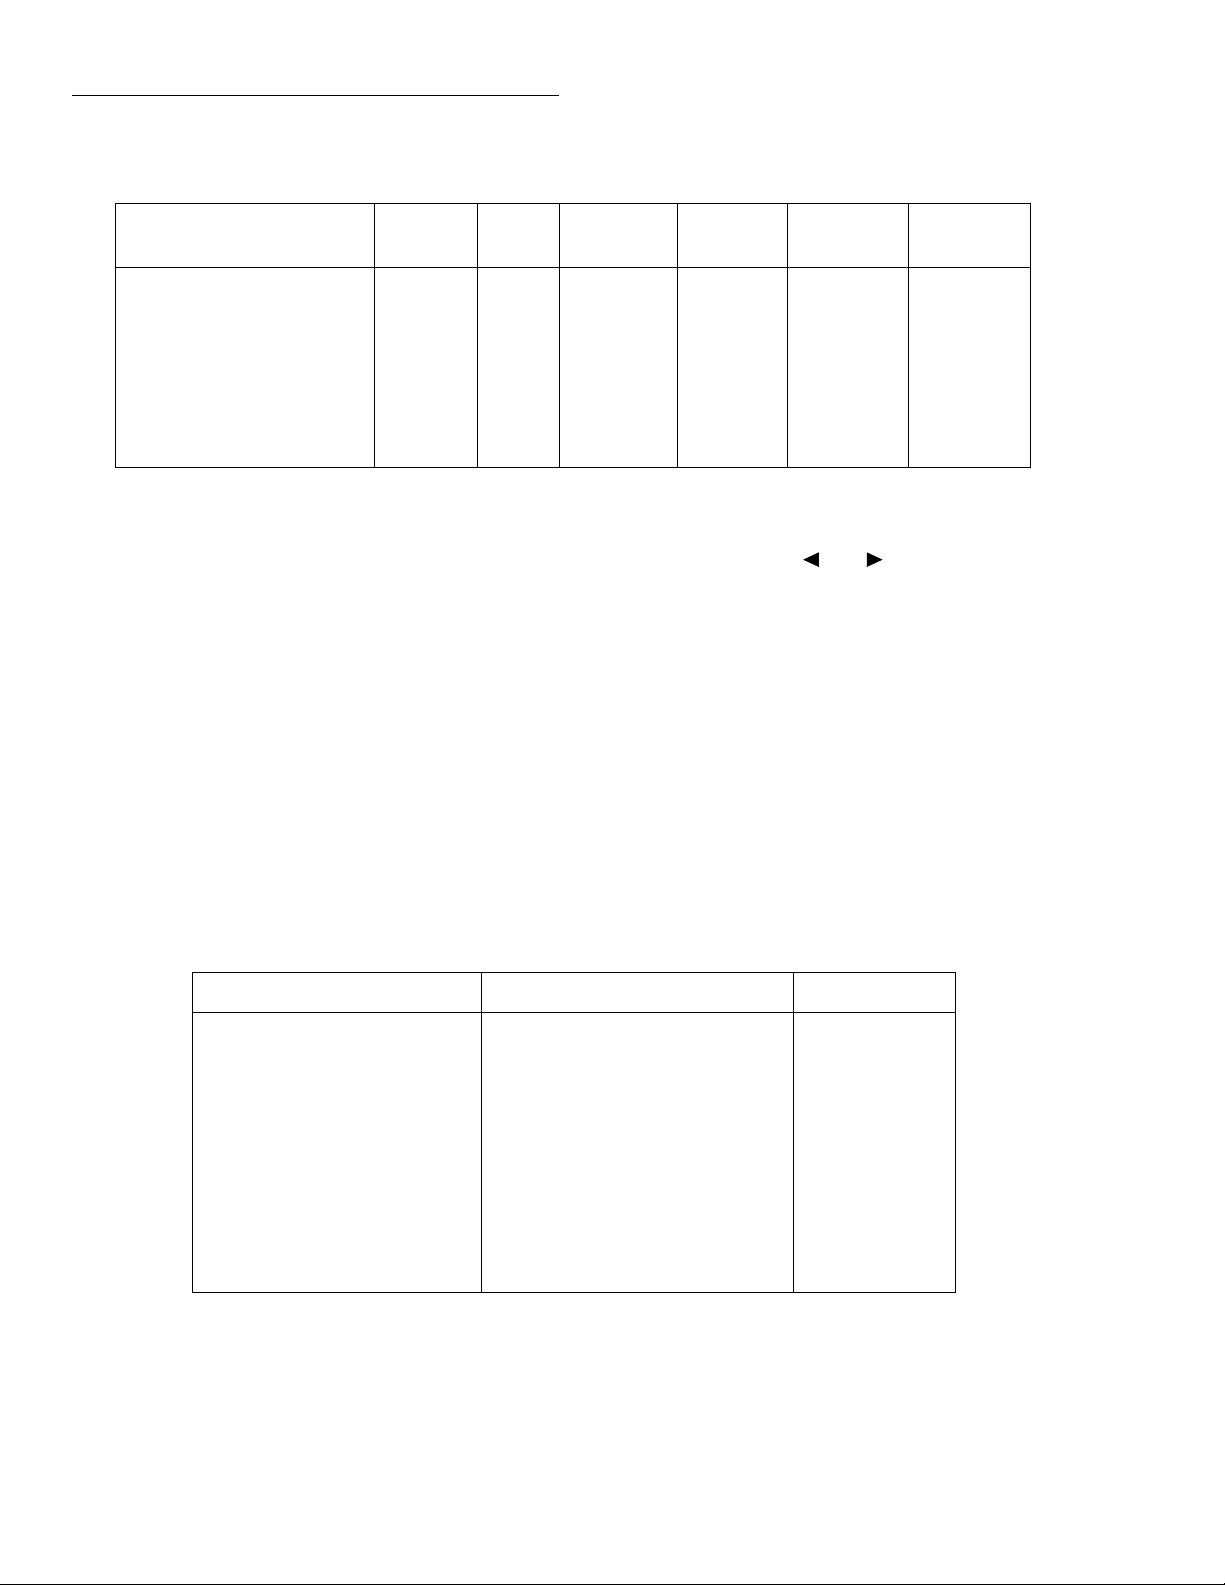
Front Panel Operation
Table 3-9
DCV and ACV auto filte
Measurement function and
type Units State Type Readings
Noise
tolerance
DCV - On Advanced 10 1.0% Moving
DCV peak spikes - On Advanced 10 5.0% Moving
RMS, average, low frequency
Any Off Advanced 10 5.0% Moving
RMS
ACV peak Volts
dB, dBmOnOn
RESOLUTION
Except for frequency, temperature, and some special cases of
AC voltage, all functions can operate with 3.5, 4.5, 5.5, 6.5,
or 7.5-digit resolution, or they can default to a setting appropriate for the selected integration time. You can program the
resolution parameter as follows:
Advanced
Averaging1010
5.0%
-
2. Use the cursor keys ( and ) to highlight RESOLUTION and press ENTER. The following typical menu is
shown:
SET DCV RESOLUTION
AUTO 3.5d 4.5d 5.5d 6.5d 7.5d
3. Highlight the desired resolution and press ENTER.
1. From the normal reading display, press the CONFIG
key and then the appropriate function key to access the
top level of a function configurationmenu. For example,
the CONFIGURE DCV menu is displayed as follows:
CONFIGURE DCV
SPEED FILTER RESOLUTION
The AUTO selection optimizes the resolution for the present
integration time setting. See Table 3-10 for the default resolutions of the DCV and ACV functions. The default resolutions of other functions are listed in paragraphs 3.4.2, 3.4.3,
and 3.4.5.
Averaging
Mode
Moving
Moving
Table 3-10
DCV and ACV auto resolution
Measurement function and type Integration time Resolution
DCV 0.01 to <0.02 PLC
0.02 to <0.20 PLC
0.20 to <2.00 PLC
2.00 to 10.00 PLC
4.5d
5.5d
6.5d
7.5d
DCV peak spikes Not used 3.5d
RMS, average 0.01 to <0.02 PLC
0.02 to <10.00 PLC
10.00 PLC
4.5d
5.5d
6.5d
Low frequency RMS Not used 5.5d
ACV peak Not used 4d
Notes:
1. If the DCV resolution is AUTO and the integration time SET-BY-RSLN, the resolution will be 6.5 digits and the
integration time 1.0 PLC.
2. For DCV peak spikes, low frequency RMS, and ACV peak measurements, the integration time setting is ignored.
3. For RMS and average measurements, if the resolution is AUTO and the integration time is SET-BY-RSLN, the resolution will be 5.5 digits and the integration time 1.0 PLC.
3-18
Page 60

Front Panel Operation
dBm = 10 log
V
IN
2
/
Z
REF
()
1mW
-----------------------------
UNITS
This parameter selects the displayed units for AC voltage
measurements. You can program the ACV units parameter as
follows:
1. From the CONFIGURE ACV menu, select UNITS and
press ENTER. The following menu is displayed:
SET ACV DISP UNITS
VOLTS dB dBm
2. Highlight the desired units and press ENTER.
VOLTS: With volts selected as the units, AC voltage mea-
surements are expressed in volts.
dB: Expressing AC voltage in dB makes it possible to com-
press a large range of measurements into a much smaller
scope. The relationship between dB and voltage is definedby
the following equation:
V
IN
------------
V
REF
where: V
dB = 20 log
is the AC input signal.
IN
V
is the specified oltage reference level.
REF
dBm: dBm is defined as decibels above or below a 1mW ref-
erence. With a user-programmable reference impedance, the
Model 2001 reads 0dBm when the voltage needed to dissipate 1mW through the reference impedance is applied. The
relationship between dBm, a reference impedance, and the
voltage is defined by the foll wing equation:
where: V
is the AC input signal.
IN
Z
is the specified reference impedance
REF
NOTE
Do not confuse reference impedance with
input impedance. The input impedance of
the instrument is not modified by the dBm
parameter.
If a relative value is in effect when dBm is selected, the value
is converted to dBm. If a relative value is stored after dB
units are selected, the units of the relative value is dBm.
To set the reference impedance, perform the following steps:
The instrument will read 0dB when the reference voltage
level is applied to the input. dB measurements are possible
on all ACV measurement types except positive peak spikes
and negative peak spikes, as these may be negative, and the
log of a negative number is not defined. Note that dB measurements are specified only for the low frequency RMS
measurement type.
If a relative value is in effect when dB is selected, the value
is converted to dB. If a relative value is stored after dB units
are selected, the units of the relative value are dB.
To set the reference voltage level, perform the following
steps:
1. From the SET ACV DISP UNITS menu, select the dB
option. The following typical message is shown:
dB REF LEV:001.000 V
2. By using the cursor keys ( and ) and the RANGE
and keys, you can enter the desired voltage reference level (0.001V to 750V).
3. Press ENTER to complete the change. If positive peak
spikes or negative peak spikes is the selected AC type,
the change is not allowed.
1. From the SET ACV DISP UNITS menu, select the dBm
option. The following menu is shown:
SET dBm REFERENCE
50Ω 75Ω 93Ω 132Ω 300Ω 600Ω
2. Highlight the desired reference impedance and press
ENTER to complete the change. If positive peak spikes
or negative peak spikes is the selected AC type, the
change is not allowed.
dB/dBm notes:
1. dB and dBm units are not allowed with positive or negative peak spike measurements.
2. dB and dBm units are not allowed with an advanced fil
ter.
3. With dB or dBm units selected, there is no bar graph on
zero-centered bar graph multiple display.
4. When units are changed from volts to dB or dBm with
A02 and greater firm are, all values less than zero that
depend on the new units are made equal to zero. This includes, for example, relative values and stored readings.
This avoids the overfl w condition of a log of a negative
number.
3-19
Page 61

Front Panel Operation
COUPLING
This parameter selects the input coupling for the ACV function. When AC coupling is selected, a DC blocking capacitor
is placed in series with the input. This removes the DC component from the RMS, average, or peak ACV measurement.
When AC+DC coupling is selected, the blocking capacitor is
removed. Subsequent RMS, average, or peak ACV measurements will reflect both the AC and DC components of the
signal.
While displaying readings, the present coupling setting is
shown on the bottom line, if not showing a multiple display.
You can set the ACV coupling as follows:
1. From the CONFIGURE ACV menu, select COUPLING
and press ENTER. The following menu is displayed:
SET AC COUPLING
AC AC+DC
2. Highlight the desired coupling and press ENTER.
Note that the coupling settings for ACV and ACI are discrete.
Thus, setting the coupling of ACV has no effect on the coupling of ACI.
AC-TYPE
This parameter selects the measurement type for the ACV
function. The Model 2001 directly measures RMS, average,
and peak AC voltages. For a 330V peak-to-peak sine wave,
which is line voltage in the U.S., the measurements would
be:
• RMS = 117V
• Average = 105V (full wave rectified
• Peak AC = 165V
The peak detector is also used to measure positive and negative peak spikes riding on a DC signal and they are, therefore,
also configured from the AC-TYPE menu.
RMS and LOW-FREQ-RMS:
RMS mode and low frequency RMS mode depends on the
desired accuracy and speed. Low frequency RMS mode is
more accurate, but slower.
Both modes are specified between 20Hz and 2MHz, with
low frequency RMS specified additionally down to 1Hz.
Some guidelines for choosing between the two modes follow:
• Below 50Hz, use low frequency RMS mode for its
greater accuracy.
• Between 50 and 100Hz, use either mode.
• Above 100Hz, use normal RMS mode for its greater
speed.
AVERAGE:
the instrument bypasses the RMS converter, so the average
ACV measurement is just the filtered output of a full wave
rectifie .
PEAK:
the largest peak (positive or negative) of the input signal. The
measurement window is fi ed at 100msec.
Note that you can configure the resolution of ACV peak measurements from 4 digits (3.5d from SET ACV RESOLUTION menu) to 8 digits (7.5d), but the accuracy is specifie
at 4 digits. In addition, the accuracy specifications for AC
peak measurements assume AC+DC coupling below 200Hz.
POSITIVE-PEAK and NEGATIVE-PEAK:
measurements are available as an ACV primary display (top
line). They are also available as a DCV multiple display (bottom line). The menu items POSITIVE-PEAK and NEGATIVE-PEAK enable the measurement as a primary display.
See Figure 3-8 for a description of the primary display.
After selecting a positive or negative peak spikes measurement from the SET ACV MEASUREMENT menu, you are
asked to enter a value for the measurement window. A typical
message follows:
When this item is selected, the signal path in
For AC peak measurements, the instrument displays
Selecting between normal
Peak spike
You can program the ACV type parameter as follows:
1. From the CONFIGURE ACV menu, select AC-TYPE
and press ENTER. The following menu is displayed:
SET ACV MEASUREMENT
RMS AVERAGE PEAK LOW-FREQ-RMS
POSITIVE-PEAK NEGATIVE-PEAK
2. Highlight the desired measurement type and press ENTER.
3-20
PEAK WINDOW = 0.1 s
This sets the time the signal is sampled before the display is
updated with a new reading. It can range from 0.1sec to
9.9sec.
As a primary display, the resolution of peak spikes can be set
from 3.5d to 7.5d, but the accuracy is specified at 3.5d. (As a
multiple display, the resolution is fi ed at 3.5d.)
Page 62
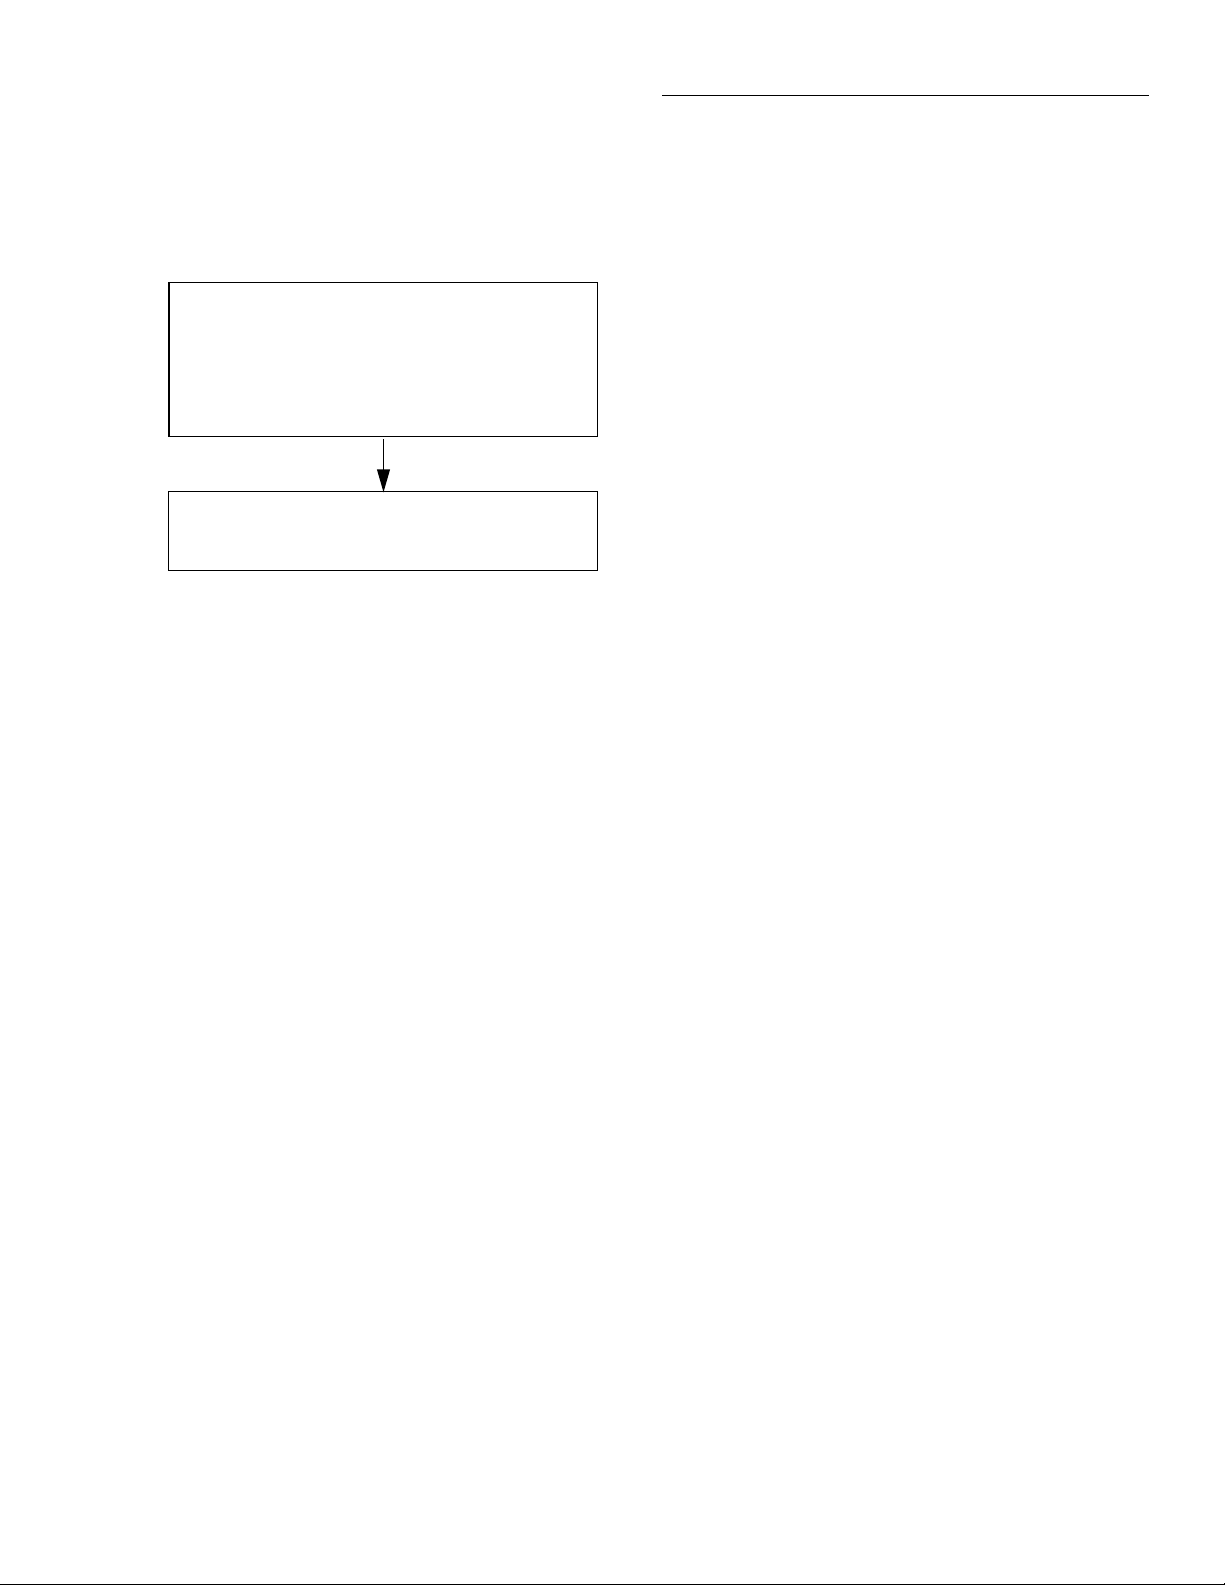
Front Panel Operation
Note that dB and dBm are not allowed as valid units for peak
spikes. Positive-going spikes on a negative DC level could
still read as a negative value, and the log of a negative number is not defined.
RANGE = Set by ACV range (auto or fixed).
REL = Operates normally.
SPEED = Set by peak window (0.1-9.9sec)
FILTER = Set by ACV filter (AUTO=ADV (10)).
RESOLUTION = Set by ACV resolution (AUTO = 3.5d)
UNITS = Fixed on volts.
COUPLING = Set by ACV coupling.
+000.0 mVAC +Pk
Coupling: AC+DC
NOTES:
1. Positive peak spikes and negative peak spikes are selected
in the CONFIGURE-ACV menu.
2. Peak spikes measurement is specified for volts at 3.5 digits.
3. “Peak window” is the time a signal is sampled before a
reading is displayed.
Multiple displays
The displays for DC and AC voltage that show multiple functions are shown in Figures 3-9 and 3-10. The multiple display for crest factor, which is calculated from the peak and
RMS values, is described here.
Figure 3-8
Positive and negative peak spikes
3-21
Page 63

Front Panel Operation
DCV
RANGE = Set by DCV range (auto or fixed).
Autoranges independently of other functions.
REL = Operates normally.
SPEED = Set by DCV speed.
FILTER = Set by DCV filter.
RESOLUTION = Set by DCV resolution.
+000.0000 mVDC
+000.000 mVAC +000.00 Hz
ACV
RANGE = Set by ACV range (auto or fixed).
Autoranges independently of other functions.
REL = No effect.
SPEED = Set by ACV speed.
FILTER = Unaffected by DCV and ACV filters.
RESOLUTION = Set by ACV resolution.
UNITS = Fixed on volts.
COUPLING = Fixed on AC coupling.
AC-TYPE = Fixed on normal mode RMS.
A. DC voltage, AC voltage, and frequency functions
Figure 3-9
DC voltage multifunction multiple displays
FREQ
RANGE = Set by MAX-SIGNAL-LEVEL in CONFIGURE
FREQUENCY menu.
Autorange has no effect.
REL = No effect.
TRIGGER LEVEL = Set while in FREQ. Not available in
CONFIGURE FREQUENCY menu.
FILTER = Unaffected by DCV filter. FREQ has no filter.
RESOLUTION = Fixed at 5 digits.
COUPLING = Fixed on AC coupling.
INPUT TERMINALS = Fixed on VOLTAGE.
3-22
Page 64
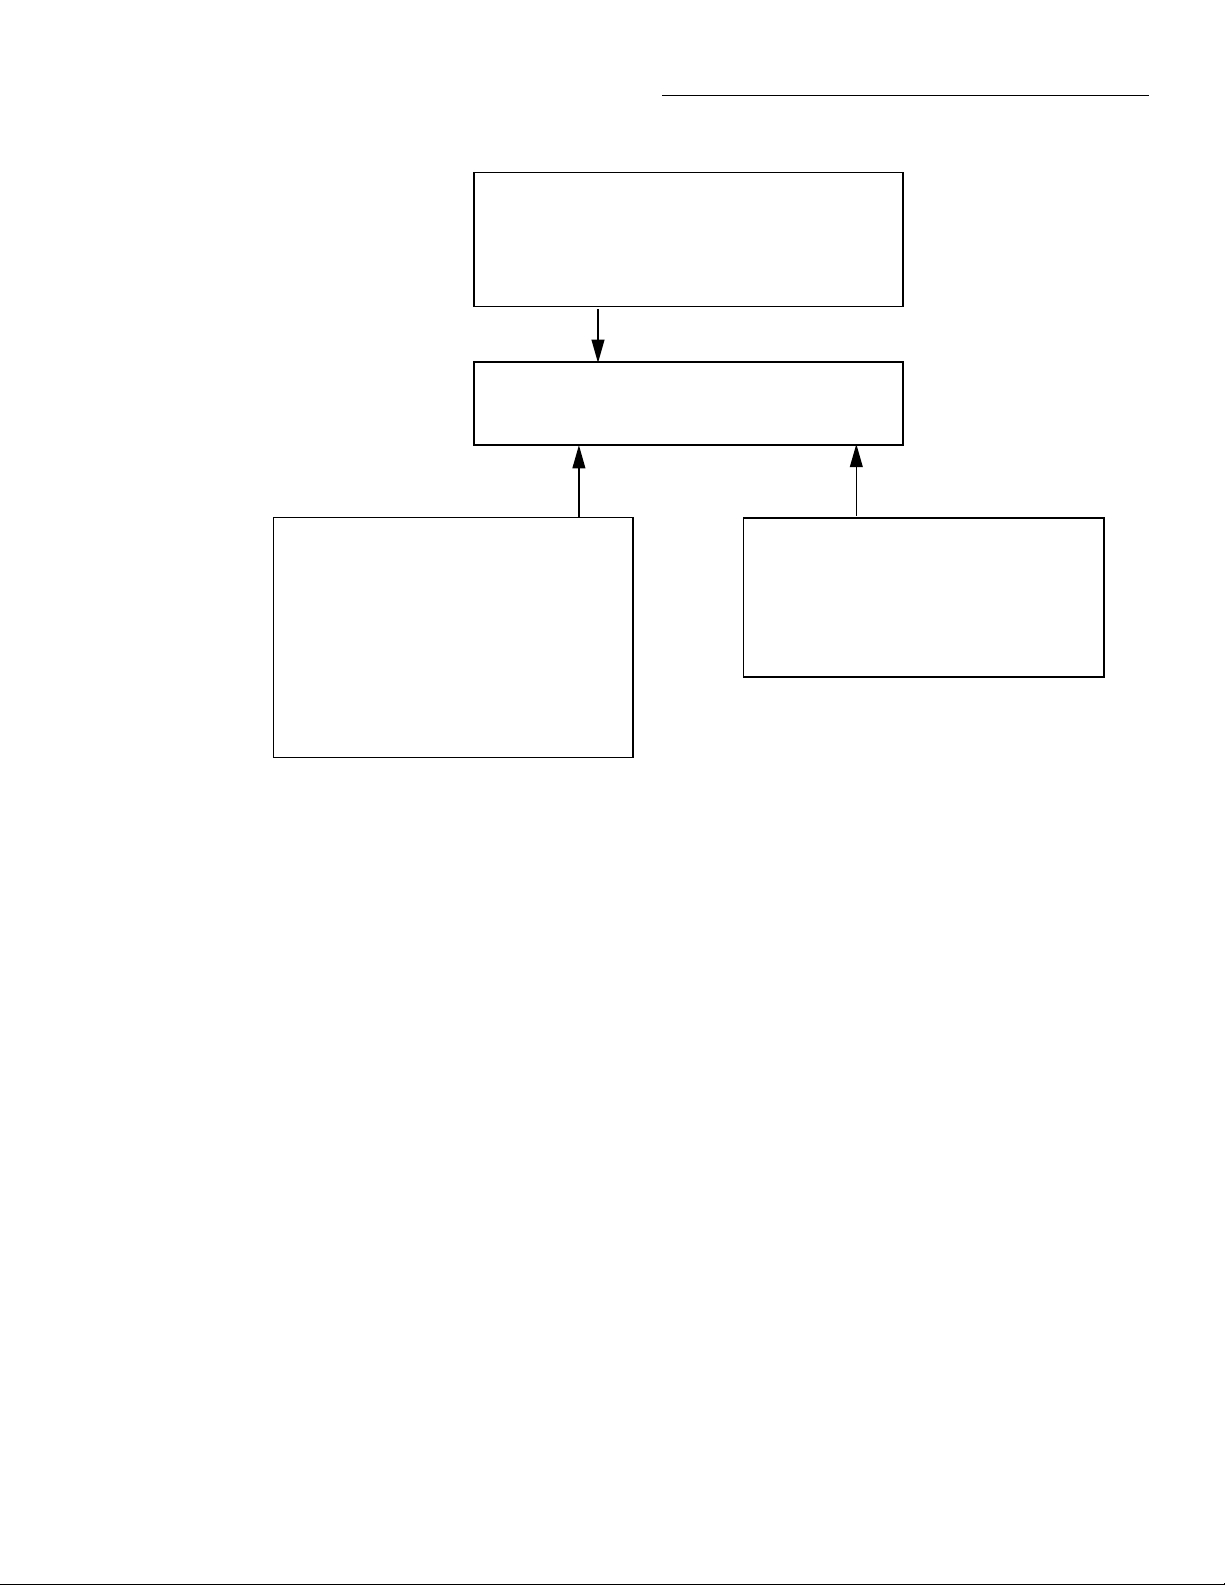
DCV
RANGE = Set by DCV range (auto or Þxed).
Autoranges independently of other functions.
REL = Operates normally.
SPEED = Set by DCV speed.
FILTER = Set by DCV Þlter.
RESOLUTION = Set by DCV resolution.
+000.0000 mVDC
Pos-Pk=+000.0mV Highest=+000.0mV
Front Panel Operation
Pos-Pk
RANGE = Follows the DCV range.
REL = No effect.
SPEED = Fixed at 100msec.
Peak window has no effect.
FILTER = Unaffected by DCV and ACV filters.
RESOLUTION = Fixed at 3.5 digits.
UNITS = Fixed on volts.
COUPLING = Fixed on AC+DC coupling.
NOTE: The peak detector captures the maximum
value of the input signal.
B. DC voltage and positive peak spikes functions
Figure 3-9 (continued)
DC voltage multifunction multiple displays
Highest
REL = No effect.
RESOLUTION = Fixed at 3.5 digits.
UNITS = Fixed on volts.
NOTE: The highest value is reset by pressing the
DCV key, or changing function (i.e., leaving this
display).
3-23
Page 65

Front Panel Operation
DCV
RANGE = Set by DCV range (auto or fixed).
Autoranges independently of other functions.
REL = Operates normally.
SPEED = Set by DCV speed.
FILTER = Set by DCV filter.
RESOLUTION = Set by DCV resolution.
+000.0000 mVDC
Neg-Pk=-000.0mV Lowest=-000.0mV
Neg-Pk
RANGE = Follows the DCV range.
REL = No effect.
SPEED = Fixed at 100msec.
Peak window has no effect.
FILTER = Unaffected by DCV and ACV filters.
RESOLUTION = Fixed at 3.5 digits.
UNITS = Fixed on volts.
COUPLING = Fixed on AC+DC coupling.
NOTE: The peak detector captures the minimum
value of the input signal.
C. DC voltage and negative peak spikes functions
Figure 3-9 (continued)
DC voltage multifunction multiple displays
Lowest
REL = No effect.
RESOLUTION = Fixed at 3.5 digits.
UNITS = Fixed on volts.
NOTE: The lowest value is reset by pressing the
DCV key, or changing function (i.e., leaving this
display).
3-24
Page 66
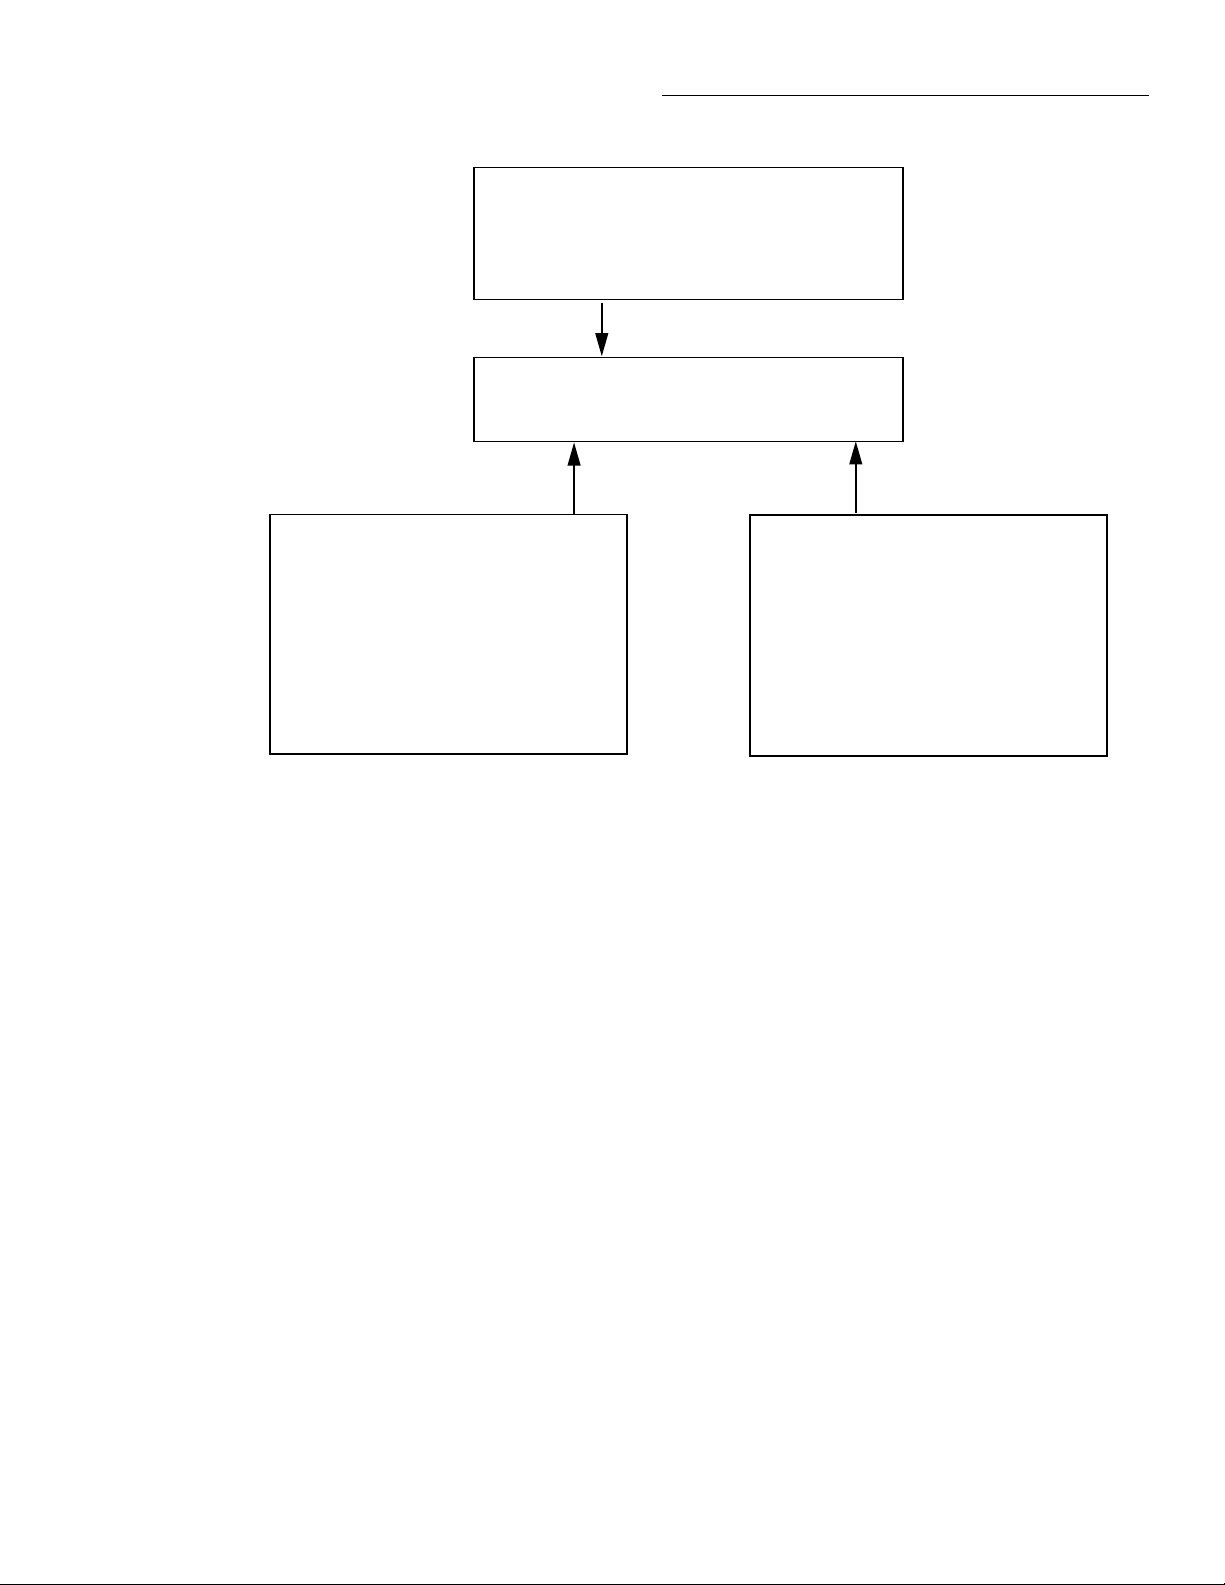
DCV
RANGE = Set by DCV range (auto or fixed).
Autoranges independently of other functions.
REL = Operates normally.
SPEED = Set by DCV speed.
FILTER = Set by DCV filter.
RESOLUTION = Set by DCV resolution.
+000.0000 mVDC
Pos-Pk=+000.0mV Neg-Pk=-000.0mV
Front Panel Operation
Pos-Pk
RANGE = Follows the DCV range.
REL = No effect.
SPEED = Fixed at 100msec.
Peak window has no effect.
FILTER = Unaffected by DCV and ACV filters.
RESOLUTION = Fixed at 3.5 digits.
UNITS = Fixed on volts.
COUPLING = Fixed on AC+DC coupling.
NOTE: The peak detector captures the maximum
value of the input signal.
D. DC voltage, positive and negative peak spikes functions
Figure 3-9 (continued)
DC voltage multifunction multiple displays
Neg-Pk
RANGE = Follows the DCV range.
REL = No effect.
SPEED = Fixed at 100msec.
Peak window has no effect.
FILTER = Unaffected by DCV and ACV filters.
RESOLUTION = Fixed at 3.5 digits.
UNITS = Fixed on volts.
COUPLING = Fixed on AC+DC coupling.
NOTE: The peak detector captures the minimum
value of the input signal.
3-25
Page 67
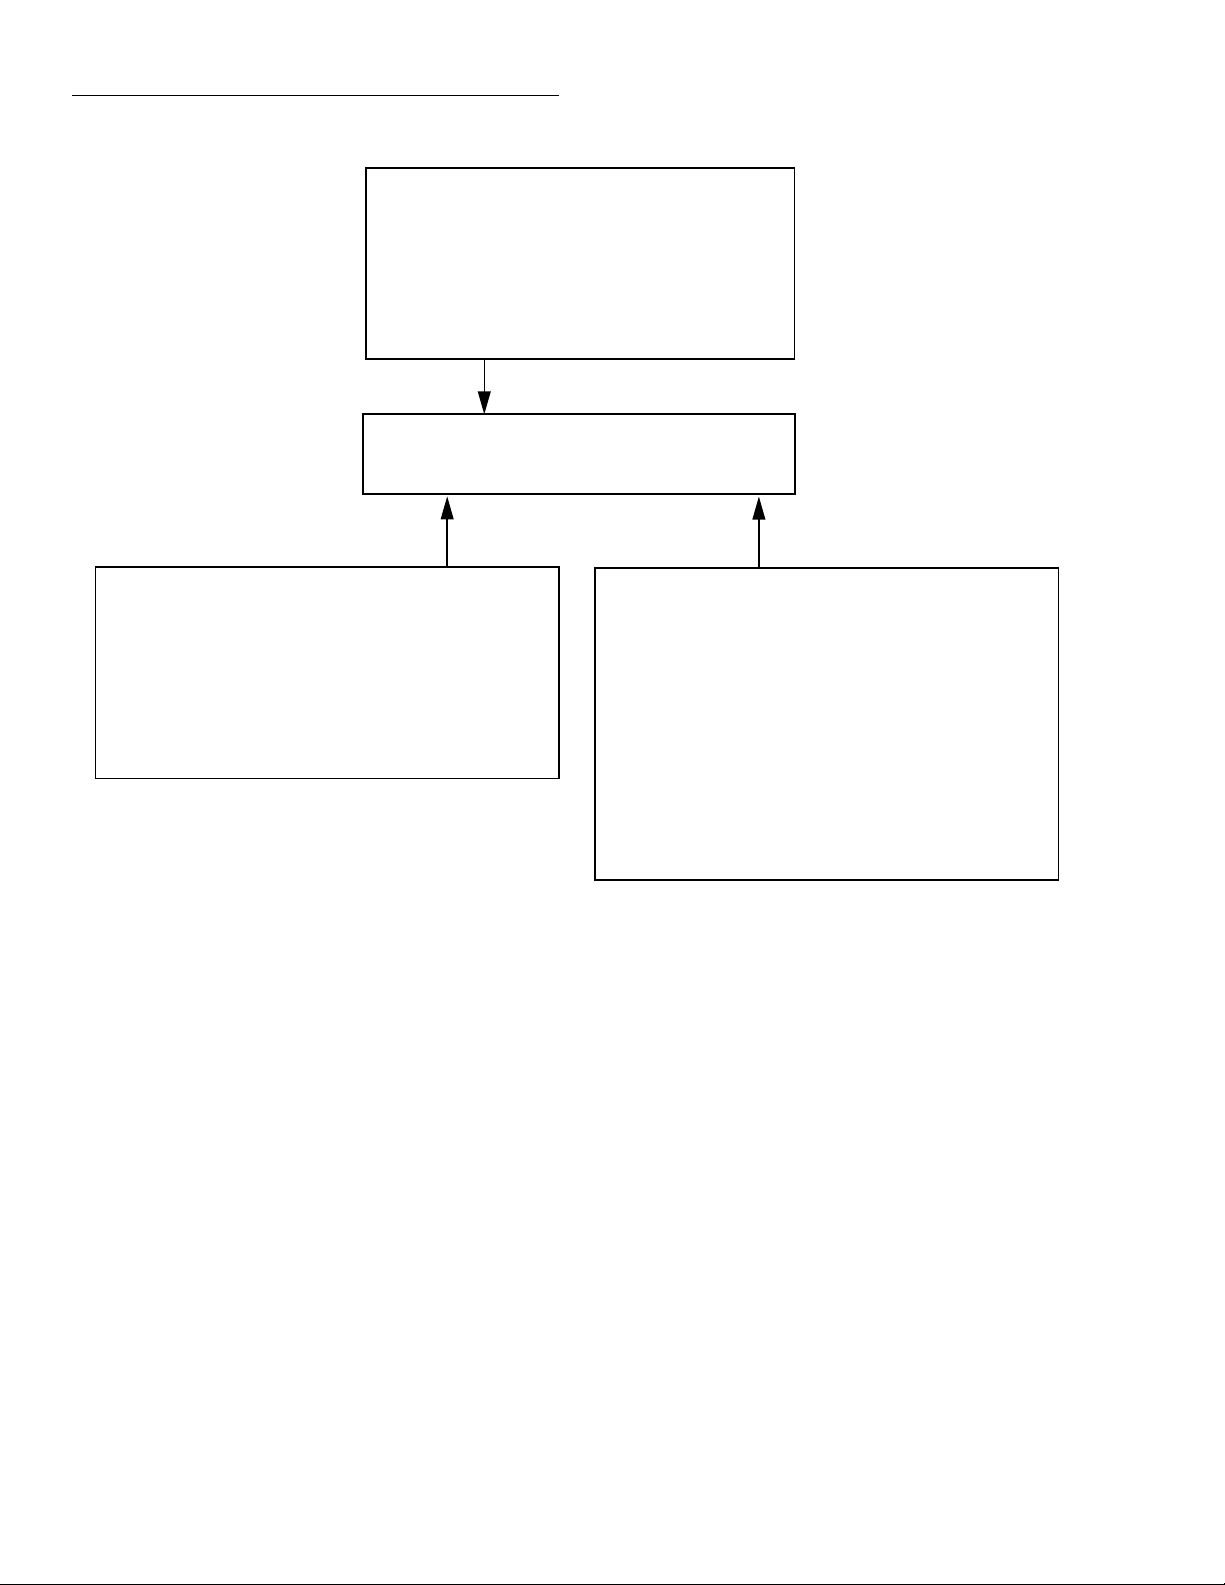
Front Panel Operation
RMS
RANGE = Set by ACV range (auto or fixed).
Autoranges independently of other functions.
REL = Operates normally.
SPEED = Set by ACV speed.
FILTER = Set by ACV filter.
RESOLUTION = Set by ACV resolution.
UNITS = Set by ACV units.
COUPLING = Set by ACV coupling.
AC-TYPE = Fixed on normal mode RMS.
+000.000 mVAC RMS
+000.00Hz Crest Factor=0.00
FREQ
RANGE = Set by MAX-SIGNAL-LEVEL in CONFIGURE
FREQUENCY menu.
Autorange has no effect.
REL = No effect.
TRIGGER LEVEL= Set while in FREQ. Not available in
CONFIGURE FREQUENCY menu.
FILTER = Unaffected by ACV filter. FREQ has no filter.
RESOLUTION = Fixed at 5 digits.
COUPLING = Set by ACV coupling.
INPUT TERMINALS =Fixed on VOLTAGE.
A. AC RMS voltage, frequency, and crest factor
Figure 3-10
AC voltage multifunction multiple displays
Crest Factor
RANGE = ACV peak measurement range set by ACV range
(auto or fixed). Peak measurement autoranges independently
of other functions.
REL = No effect.
SPEED = Fixed at 100msec. Peak window has no effect.
FILTER = If ACV filter is on, crest factor is effectively filtered as
well.
RESOLUTION = Fixed at 3 digits.
UNITS = None.
COUPLING = ACV peak measurement coupling set by ACV
coupling.
NOTE: Crest factor (up to 9.99) is calculated from an ACV peak
measurement divided by the raw (without rel) ACV RMS measurement.
3-26
Page 68
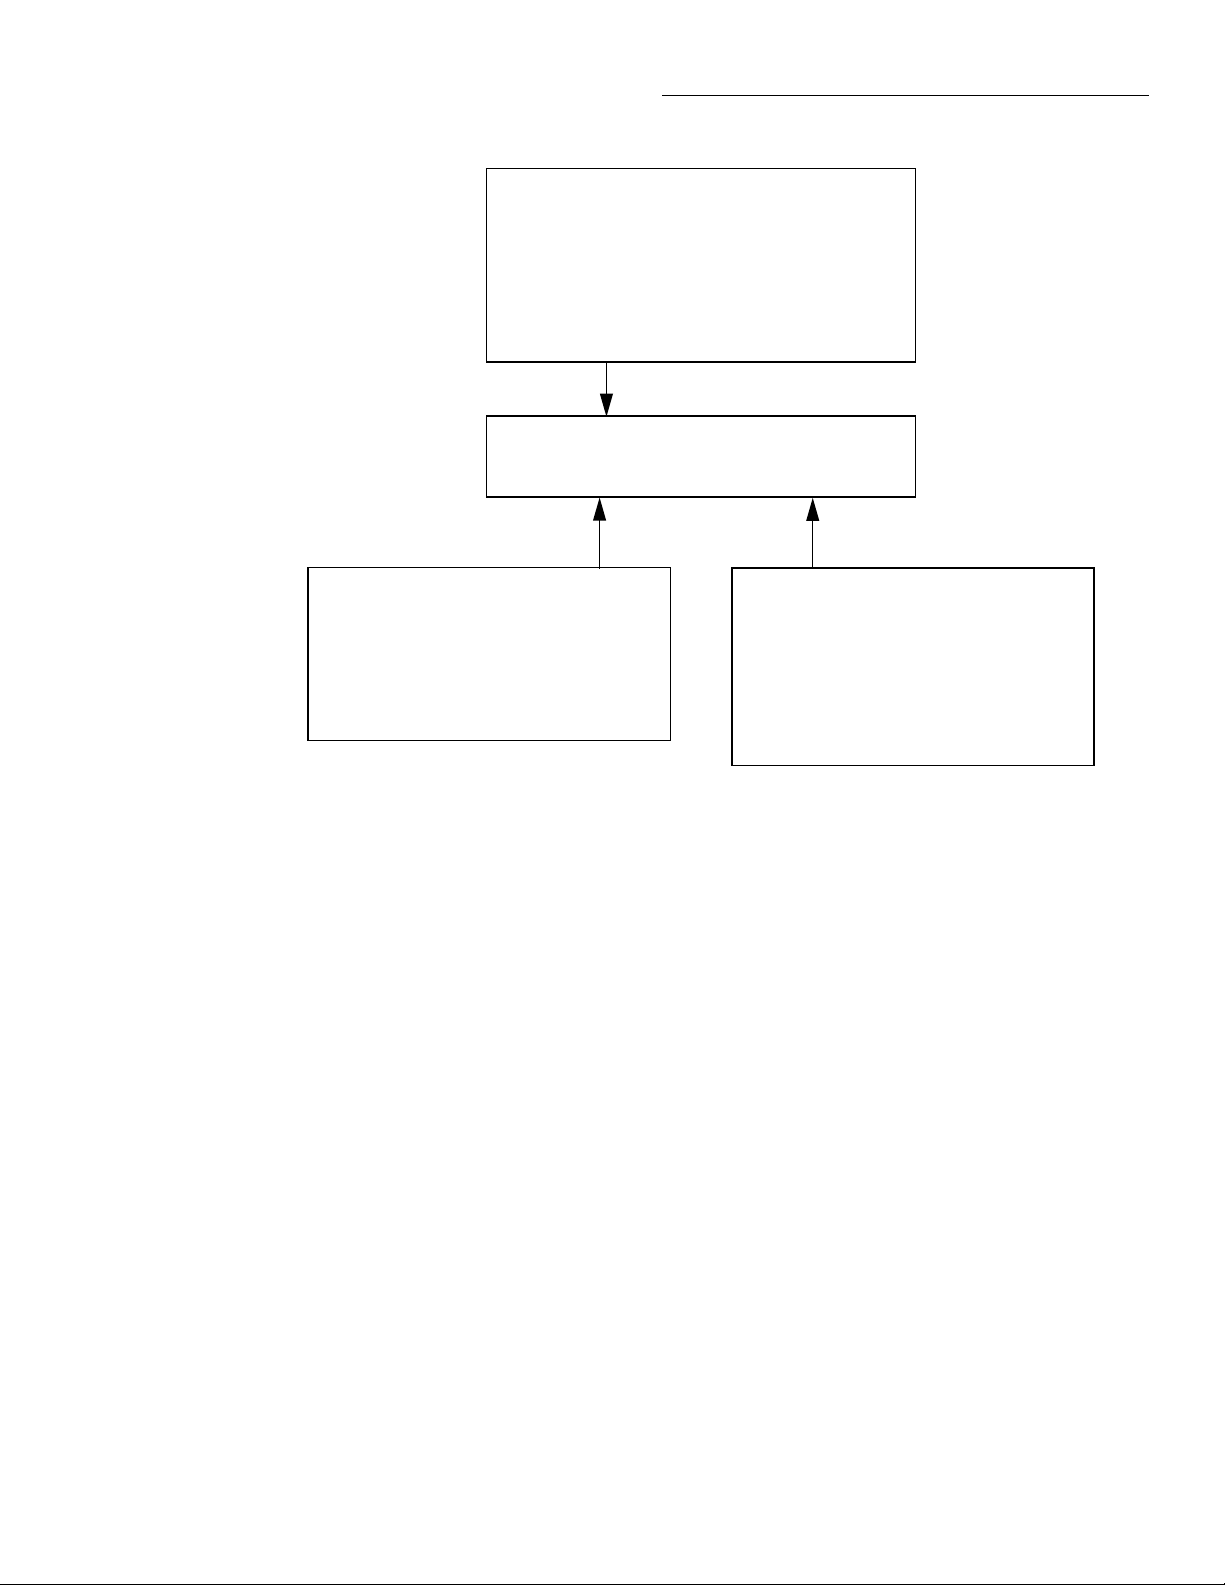
RMS
RANGE = Set by ACV range (auto or fixed).
Autoranges independently of other functions.
REL = Operates normally.
SPEED = Set by ACV speed.
FILTER = Set by ACV filter.
RESOLUTION = Set by ACV resolution.
UNITS = Set by ACV units.
COUPLING = Set by ACV coupling.
AC-TYPE = Fixed on normal mode RMS.
+000.000 mVAC RMS
AVG=000.000mV Peak=000.0mV
Front Panel Operation
AVG
RANGE = Set by ACV range (auto or fixed).
Autoranges independently of other functions.
REL = No effect.
SPEED= Set by ACV speed.
FILTER = Unaffected by ACV filter.
RESOLUTION = Fixed at 5.5 digits.
UNITS = Fixed on volts.
COUPLING = Set by ACV coupling.
B. AC RMS, average, and peak voltages
Figure 3-10 (continued)
AC voltage multifunction multiple displays
Crest factor: The crest factor of a waveform is the ratio of its
peak value to its RMS value. Thus, the crest factor specifie
the dynamic range of a true RMS instrument. For sinusoidal
waveforms, the crest factor is 1.414. For a symmetrical
square wave, the crest factor is unity. The crest factor of a
rectangular pulse is related to its duty cycle; as the duty cycle
decreases, the crest factor increases.
For the Model 2001, the additional error term for RMS measurements caused by a high crest factor is specified up to a
value of fi e. The maximum displayable value is 9.99, or else
it shows “over”.
Note that the crest factor is not calculated if dB or dBm is the
presently selected units.
Low level considerations
For sensitive measurements, external considerations besides
the Model 2001 affect the accuracy. Effects not noticeable
Peak
RANGE = Set by ACV range (auto or fixed).
Autoranges independently of other functions.
REL = No effect.
SPEED = Fixed at 100msec. Peak window has no
effect.
FILTER = Unaffected by ACV filter.
RESOLUTION = Fixed at 4 digits.
UNITS = Fixed on volts.
COUPLING = Set by ACV coupling.
when working with higher voltages are significant in microvolt signals. The Model 2001 reads only the signal received
at its input; therefore, it is important that this signal be properly transmitted from the source. The following paragraphs
indicate factors that affect accuracy, including thermal offsets and stray pick-up.
Shielding: AC voltages that are extremely large compared
with the DC signal to be measured may produce an erroneous output. Therefore, to minimize AC interference, the circuit should be shielded with the shield connected to the
Model 2001 INPUT LO (particularly for low-level sources).
Improper shielding can cause the Model 2001 to behave in
one or more of the following ways:
• Unexpected offset voltages.
• Inconsistent readings between ranges.
• Sudden shifts in reading.
3-27
Page 69

Front Panel Operation
To minimize pick-up, keep the voltage source and the Model
2001 away from strong AC magnetic sources. The voltage induced due to magnetic flux is proportional to the area of the
loop formed by the input leads. Therefore, minimize the loop
area of the input leads and connect each signal at only one
point.
Thermal EMFs: Thermal emfs (thermoelectric potentials)
are generated by thermal differences between the junctions
of dissimilar metals. These can be large compared to the signal that the Model 2001 can measure. Thermal emfs can
cause the following conditions:
• Instability or zero offset is much higher than expected.
• The reading is sensitive to (and responds to) temperature changes. This effect can be demonstrated by touching the circuit, by placing a heat source near the circuit,
or by a regular pattern of instability (corresponding to
heating and air conditioning systems, or changes in sunlight).
To minimize the drift caused by thermal emfs, use copper
leads to connect the circuit to the Model 2001. A banana plug
generates a few microvolts. A clean copper conductor such
as #10 bus wire is ideal for this application. The leads to the
input may be shielded or unshielded, as necessary. Refer to
Shielding.
Widely varying temperatures within the circuit can also create thermal emfs. Therefore, maintain constant offset temperatures to minimize these thermal emfs. A cardboard box
around the circuit under test also helps by minimizing air
currents.
The REL control can be used to null out constant offset voltages.
Note that additional thermals may be generated by the optional Model 2001-SCAN scanner card.
AC voltage offset: The Model 2001, at 5½d resolution, will
typically display 150 counts of offset on AC volts with the input shorted. This offset is caused by the offset of the TRMS
converter. This offset will not affect reading accuracy and
should not be zeroed out using the rel feature. The following
equation expresses how this offset (V
) is added to the
OFFSET
signal input (VIN):
+
Displayed reading
=
2
V
()
IN
V
()
2
OFFSET
Example: Range = 2VAC
Offset = 150 counts (1.5mV)
Input = 200mV RMS
Display reading 200mV () 2 + 1.5mV () 2 =
= 0.04V 2.25 10
= .200005V
-6
V×()+
The offset is seen as the last digit which is not displayed.
Therefore, the offset is negligible. If the rel feature were used
to zero the display, the 150 counts of offset would be subtracted from V
resulting in an error of 150 counts in the dis-
IN
played reading.
3.4.2 DC and AC current
DC current measurements
The Model 2001 can make normal DC current measurements
between 10pA and 2.1A. Assuming “bench reset” conditions
(see paragraph 3.12.1), the basic procedure is as follows:
1. Connect the test leads to the AMPS and INPUT LO terminals of the Model 2001. Either the front or rear inputs
can be used; place the INPUTS button in the appropriate
position.
2. Select the DCI function.
3. Select a range consistent with the expected current. For
automatic range selection, press the AUTO key. The
AUTO annunciator denotes whether auto-ranging is enabled.
4. Connect the test leads to the source as shown in Figure
3-11.
CAUTION
Do not apply more than 2.1A, 250V to
the AMPS input, or the amps protection
fuse will blow.
5. Observe the display. If the “Overfl w” message is
shown, select a higher range until a normal reading is
displayed. Always use the lowest possible range for the
best resolution.
6. Take a reading from the display.
3-28
Page 70
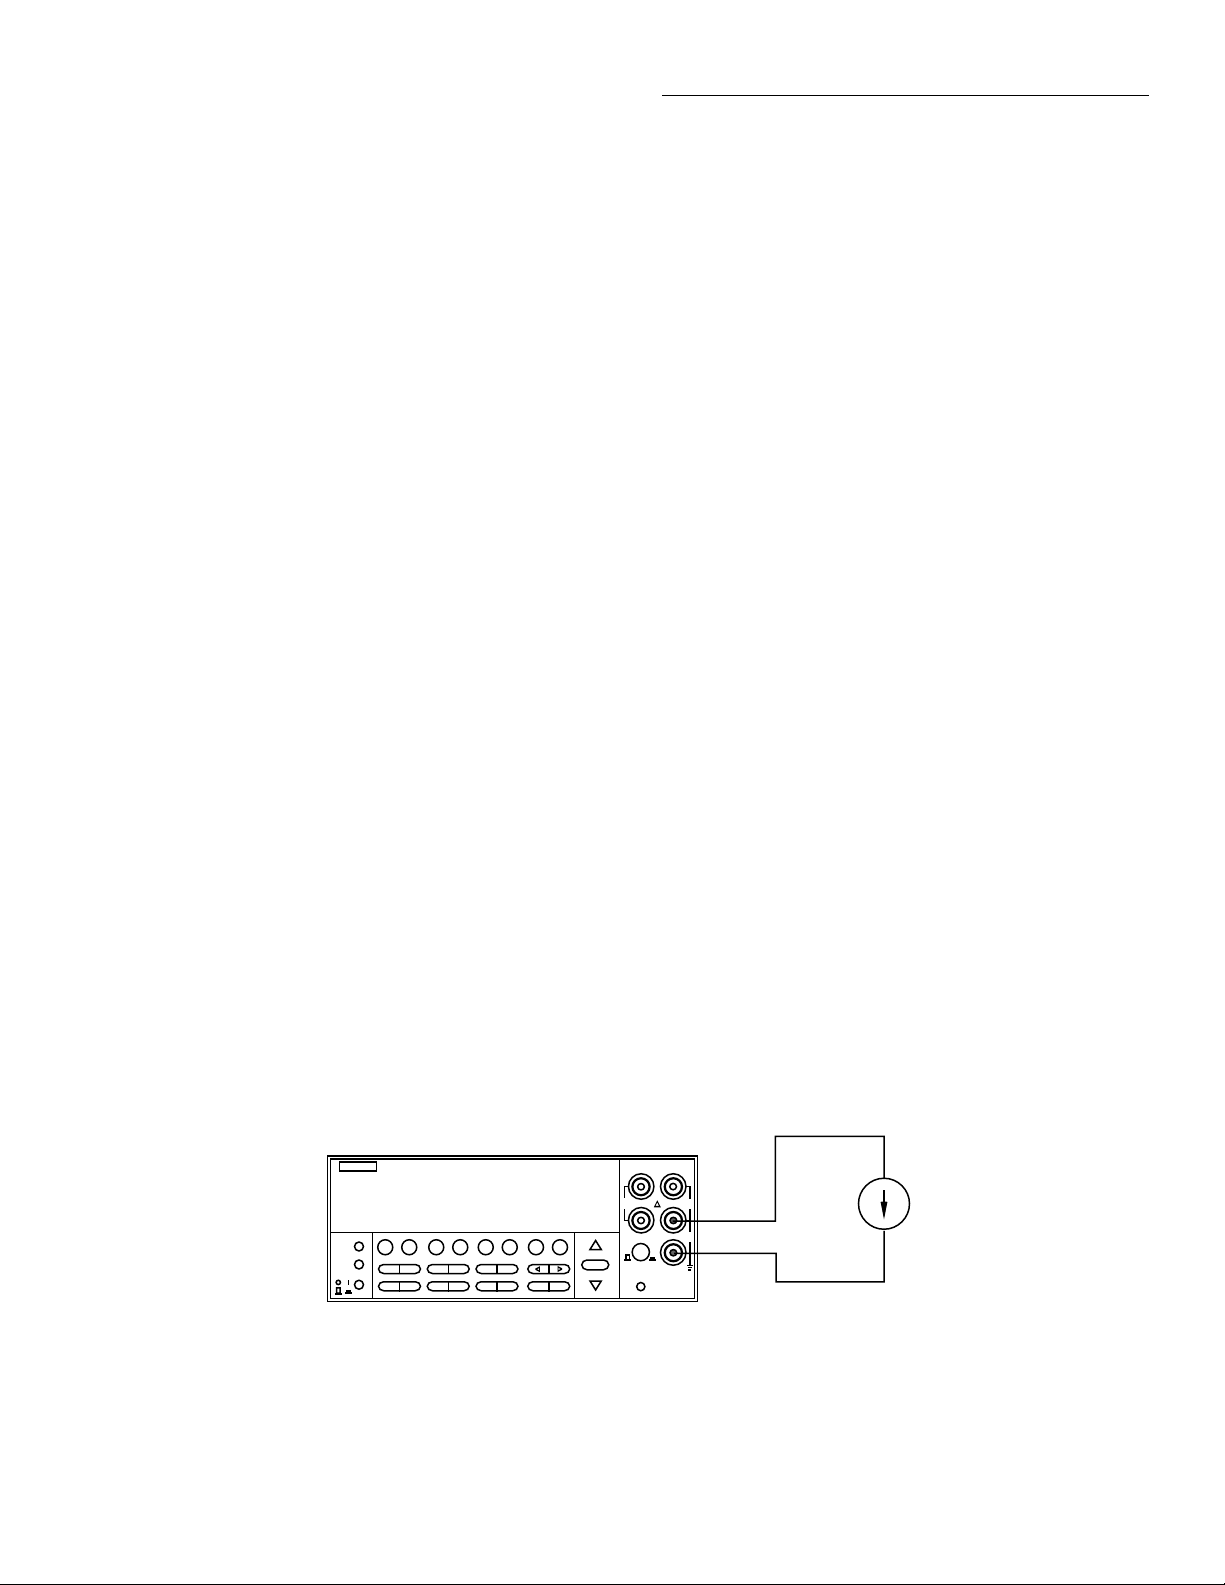
Front Panel Operation
AC current measurements
The Model 2001 can make AC current measurements between 100pA and 2.1A. Assuming “bench reset” conditions
(see paragraph 3.12.1), the basic procedure is as follows:
1. Connect the test leads to the AMPS and INPUT LO terminals of the Model 2001. Either the front or rear inputs
can be used; place the INPUTS button in the appropriate
position.
2. Select the ACI function.
3. Select a range consistent with the expected current. For
automatic range selection, press the AUTO key. The
AUTO annunciator denotes whether auto-ranging is enabled.
4. Connect the test leads to the source as shown in Figure
3-11.
CAUTION
Do not apply more than 2.1A, 250V to
the AMPS input, or the amps protection
fuse will blow.
5. Observe the display. If the “Overfl w” message is
shown, select a higher range until a normal reading is
displayed. Always use the lowest possible range for the
best resolution.
6. Take a reading from the display.
1. Turn off the power and disconnect the power line and
test leads.
2. Perform one of the following steps:
A. For the front panel AMPS fuse, gently push in the
AMPS jack with your thumb and rotate the fuse carrier one-quarter turn counter-clockwise. Release
pressure on the jack and its internal spring will push
the jack out of the socket.
B. For the rear panel AMPS fuse, place the end of a
flat-blade screwdriver into the rear panel AMPS
holder. Push in gently and rotate the fuse carrier
one-quarter turn counter-clockwise. Release pres-
×
sure on the holder and its internal spring will push
the fuse carrier out of the holder.
3. Remove the fuse and replace it with the same type (2A,
250V, fast blow, 5
20mm). The Keithley part number
is FU-48.
CAUTION
Do not use a fuse with a higher current
rating than specified, or instrument
damage may occur. If the instrument repeatedly blows fuses, locate and correct
the cause of the trouble before replacing
the fuse. See the optional Model 2001
Repair Manual for troubleshooting information.
AMPS fuse replacement
There are two protection fuses for the current ranges, one for
the front terminals, another for the rear. This procedure describes how to change an AMPS fuse.
WARNING
Make sure the instrument is disconnected from the power line and other equipment before replacing an AMPS fuse.
Model 2001
+000.0050 µADC
Range: 200 µADC
PREV
DCV ACV DCI ACI Ω2 Ω4
DISPLAY
NEXT
REL TRIG STORE RECALL
POWER
INFO LOCAL CHAN SCAN CONFIG MENU EXIT ENTER
FILTER MATH
2001 MULTIMETER
FREQ TEMP
RANGE
AUTO
RANGE
Caution : Maximum Input = 2.1A
Figure 3-11
DC and AC current measurements
4. Install the new fuse by reversing the above procedure.
SENSE
INPUT
Ω 4 WIRE
HI
350V
1100V
PEAK
PEAK
LO
500V
PEAK
INPUTS
F
R
FRONT/REAR
2A 250V
AMPS
CAL
Current
Source
3-29
Page 71

Front Panel Operation
Current configuration
The following paragraphs detail how to change the Model
2001 from its bench reset conditions for DC and AC current
measurements. The configuration menus are summarized in
Table 3-11
CONFIGURE DCI menu structure
Menu item Description
SPEED
NORMAL
FAST
MEDIUM
HIACCURACY
SET-SPEED-EXACTLY
SET-BY-RSLN
FILTER
AUTO
AVERAGING
ADVANCED
AVERAGING-MODE
RESOLUTION
AUTO
3.5d, 4.5d, 5.5d, 6.5d, 7.5d
MEASUREMENT-MODE
NORMAL
IN-CIRCUIT
Measurement speed (integration time) menu:
Select 1 PLC (power line cycle, 16.67msec for 60Hz, 20msec for 50Hz and
400Hz).
Select 0.01 PLC.
Select 0.1 PLC.
Select 10 PLC.
Set integration time in PLC (0.01-10).
Default to setting appropriate for resolution.
Digital filter menu
Default to filter appropriate for int gration time.
Program a simple average filter (1-100 readings)
Program a simple average filter (1-100 readings) with a noise tolerance wind w
(0-100% of range).
Select moving average or repeating average mode.
Display resolution menu:
Default to resolution appropriate for integration time.
Select a specific resolution.
Measurement mode menu:
Select normal current measurement (use AMPS terminals).
Select in-circuit current measurement (use INPUT and SENSE terminals).
Tables 3-11 and 3-12. Note that a function does not have to
be selected in order to be configured. When the function is
selected, it will assume the programmed status.
3-30
Page 72

Table 3-12
CONFIGURE ACI menu structure
Menu item Description
Front Panel Operation
SPEED
NORMAL
FAST
MEDIUM
HIACCURACY
SET-SPEED-EXACTLY
SET-BY-RSLN
FILTER
AUTO
AVERAGING
ADVANCED
AVERAGING-MODE
RESOLUTION
AUTO
3.5d, 4.5d, 5.5d, 6.5d, 7.5d
COUPLING
AC
AC+DC
AC-TYPE
RMS
AVERAGE
Measurement speed (integration time) menu:
Select 1 PLC (power line cycle, 16.67msec for 60Hz, 20msec for 50Hz and 400Hz).
Select 0.01 PLC.
Select 0.1 PLC.
Select 10 PLC.
Set integration time in PLC (0.01-10).
Default to setting appropriate for resolution.
Digital filter menu
Default to filter appropriate for int gration time.
Program a simple average filter (1-100 readings)
Program a simple average filter (1-100 readings) with a noise tolerance wind w
(0-100% of range).
Select moving average or repeating average mode.
Display resolution menu:
Default to resolution appropriate for integration time.
Select a specific resolution.
Coupling menu:
Select AC coupled measurements.
Select DC coupled measurements.
Type of ACI measurement menu:
Select true RMS ACI.
Select average ACI.
SPEED
The SPEED parameter sets the integration time of the A/D
converter, the period of time the input signal is measured (also known as aperture). It is discussed in paragraph 3.4.1, DC
and AC voltage. Only the differences for DC and AC current
are noted here.
The SET-BY-RSLN parameter optimizes the integration
time for the present resolution setting. The defaults for setby-resolution integration times of DCI and ACI are listed in
Table 3-13.
Table 3-13
DCI and ACI integration time set-by-resolution
Measurement
function and type Resolution Integration time
DC current 3.5d, 4.5d
5.5d
6.5d
7.5d
0.01 PLC
0.02 PLC
0.20 PLC
2.00 PLC
DC in-circuit current 3.5d to 7.5d Not used
RMS, average 3.5d, 4.5d
5.5d
6.5d, 7.5d
Notes:
1. For normal DC current, if the integration time is SET-BY-RSLN
and the resolution is AUTO, the integration time will be 1.0 PLC
and the resolution 6.5 digits.
2. For DC in-circuit current, the integration time setting is ignored.
3. For AC current, if the integration time is SET-BY-RSLN and the
resolution is AUTO, the integration time will be 1.0 PLC and the
resolution 5.5 digits.
0.01 PLC
0.02 PLC
10.00 PLC
3-31
Page 73

Front Panel Operation
FILTER
The FILTER parameter lets you set the digital filter response
and control its on/off operation. It is described in paragraph
3.9. Only the specifics for DC and AC current are covered
here.
The AUTO parameter for a digital filter optimizes its use for
the present measurement function. The defaults for automatic filtering of DCI and ACI are listed in Table 3-14.
Table 3-14
DCI and ACI auto filte
Measurement function
and type State Type Readings
DC current On Advanced 10 1.0% Moving
DC in-circuit current On Advanced 10 1.0% Moving
AC current Off Advanced 10 5.0% Moving
RESOLUTION
The RESOLUTION parameter sets the display resolution. It
is discussed in paragraph 3.4.1, DC and AC voltage. Only the
differences for DC and AC current are noted here.
The available resolution on all current functions and types is
3.5 digits to 7.5 digits. If the DCI or ACI resolution is AUTO,
refer to Table 3-15 for the resolution associated with the integration time.
Noise
tolerance Mode
Table 3-15
DCI and ACI auto resolution
Measurement function and
type Integration time Resolution
DC current 0.01 to <0.02 PLC
0.02 to <0.20 PLC
0.20 to <2.00 PLC
2.00 to 10.00 PLC
4.5d
5.5d
6.5d
7.5d
DC in-circuit current Not used 5.5d
RMS, average 0.01 to <0.02 PLC
0.02 to <10.00 PLC
10.00 PLC
Notes:
1. For normal DC current, if the resolution is AUTO and the integration time is SET-BY-RSLN, the
resolution will be 6.5 digits and the integration time 1.0 PLC.
2. For DC in-circuit current, the integration time setting is ignored.
3. For AC current, if the resolution is AUTO and the integration time is SET-BY-RSLN, the resolution
will be 5.5 digits and the integration time 1.0 PLC.
4.5d
5.5d
6.5d
3-32
Page 74
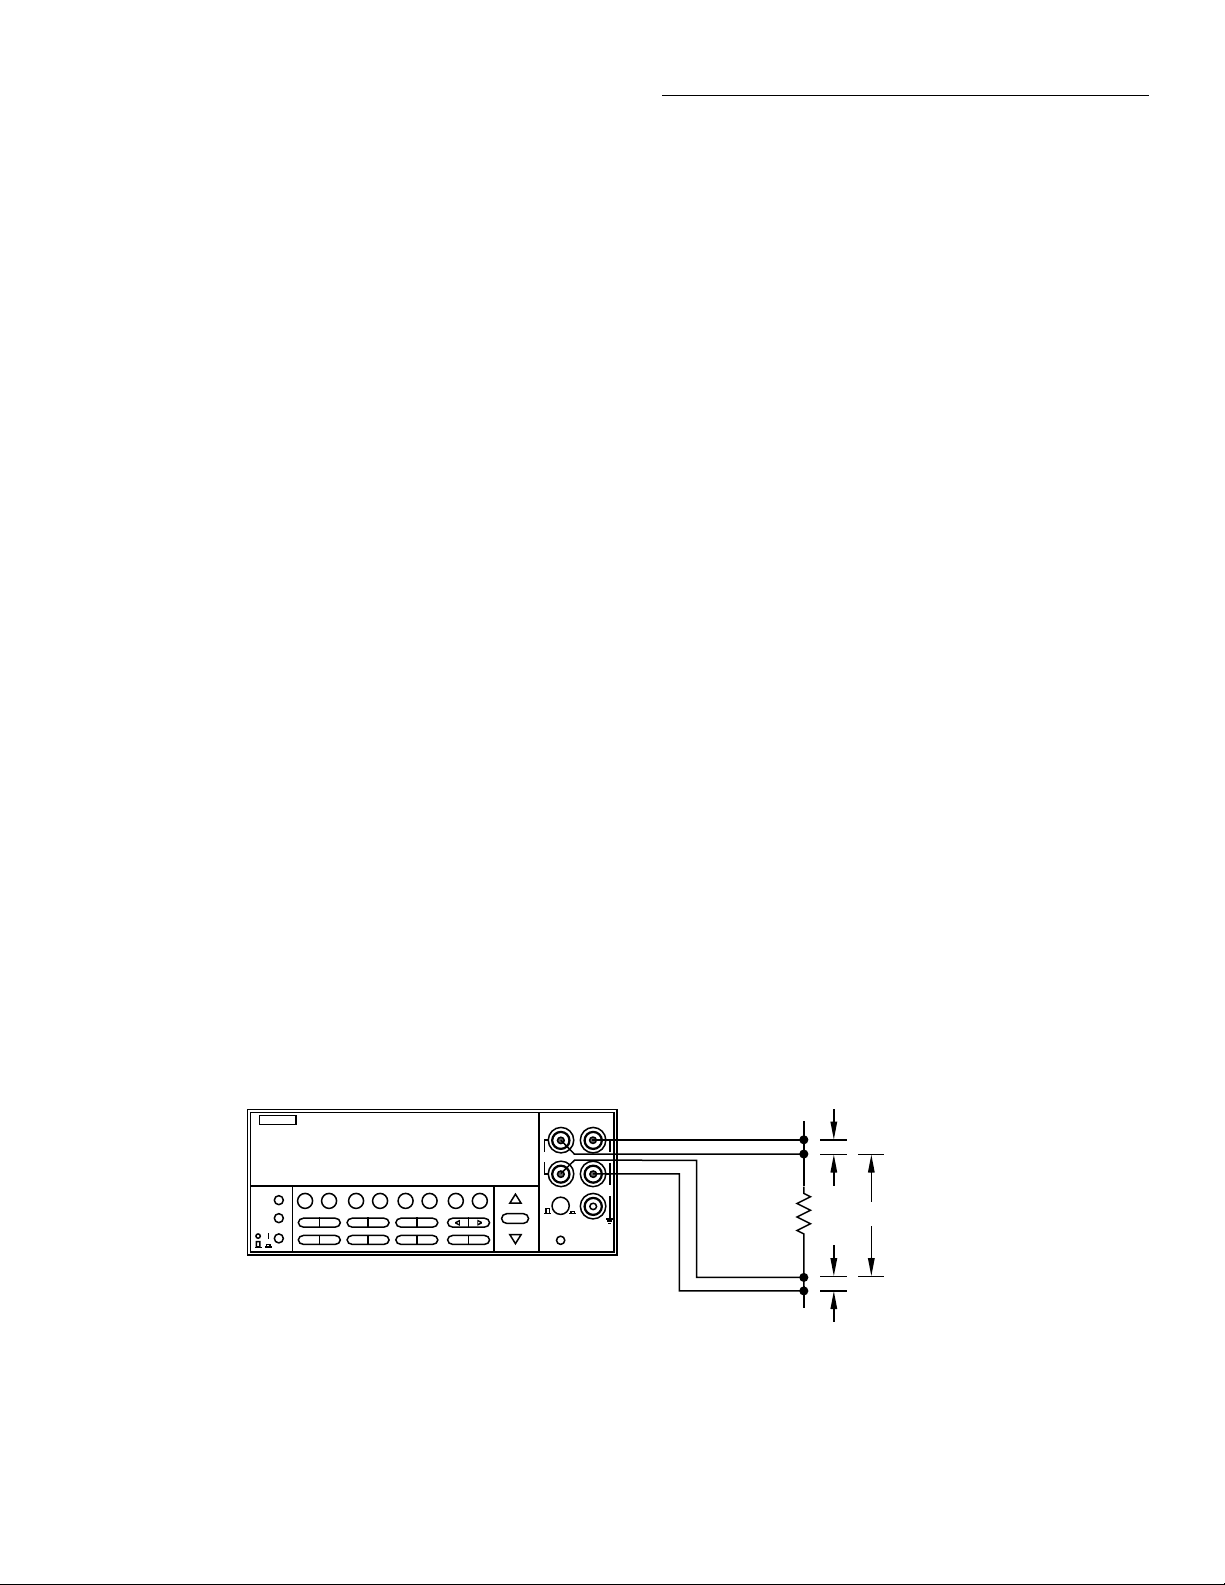
Front Panel Operation
V
MEAS1
I
IN-CKTISOURCE
+()R
TRACE
=
R
TRACE
V
MEAS1
I
IN-CKTISOURCE
+()
--------------------------------------------------=
V
MEAS2
I
IN-CKT
()R
TRACE
=
R
TRACE
V
MEAS2
I
IN-CKT
()
-----------------------=
V
MEAS1
I
IN-CKTISOURCE
+()
--------------------------------------------------
V
MEAS2
I
IN-CKT
()
-----------------------=
V
MEAS1IIN-CKT
()V
MEAS2IIN-CKTISOURCE
+()=
V
MEAS1IIN-CKT
()-V
MEAS2IIN-CKT
()V
MEAS2ISOURCE
()=
I
IN-CKTVMEAS1-VMEAS2
()=V
MEAS2ISOURCE
()
I
IN-CKT
V
MEAS2ISOURCE
()
V
MEAS1-VMEAS2
()
----------------------------------------------=
MEASUREMENT-MODE
This option selects the DC current measurement mode, either normal or in-circuit measurements. It is programmed as
follows:
1. From the CONFIGURE DCI menu, select
MEASUREMENT-MODE and press ENTER. The
following menu is shown:
DCI MEASUREMENT MODE
NORMAL IN-CIRCUIT
2. Highlight the desired mode and press ENTER.
NORMAL:
where the meter is placed in series with the current path and
the voltage across an internal shunt resistor is measured. The
specifications are derated by 50ppm for currents over 0.5A
because of the self-heating effects on the shunt resistor.
IN-CIRCUIT:
4-wire resistance measurement and a voltage measurement.
It is similar to an offset-compensated ohms reading.
A measurement overfl w occurs for any of the following
conditions:
This option is for normal current measuring,
In-circuit current is a calculation based on a
1. Using one set of the Kelvin probe tips, the instrument
sources a known current (I
) through the conductor
SOURCE
and simultaneously measures the resulting voltage
(V
) with the other set of probe tips:
MEAS1
or
2. The instrument then measures the voltage (V
MEAS2
across the conductor without sourcing an additional current:
or
3. It then calculates the in-circuit current by combining the
equations and solving for I
IN-CKT
:
Ω
Ω
)
• The measured voltage exceeds |±200mV|.
• The trace resistance is less than 1m
10
.
or greater than
• The in-circuit current is greater than 12A.
The current in a low resistance conductor (e.g., a printed circuit trace) can be measured without breaking the current
path. The Model 2001 can do this with a pair of Kelvin test
probes across the conductor. See Figure 3-12. The method
follows:
Model 2001
SENSE
INPUT
Ω 4 WIRE
+00.207 ADC ICkt
Trace resistance: 1.0000Ω
PREV
DCV ACV DCI ACI Ω2 Ω4
DISPLAY
NEXT
REL TRIG STORE RECALL
POWER
INFO LOCAL CHAN SCAN CONFIG MENU EXIT ENTER
Caution : Maximum Input = +200mV on (I
where I
SOURCE
= 10mA.
FILTER MATH
2001 MULTIMETER
FREQ TEMP
RANGE
AUTO
RANGE
350V
PEAK
F
FRONT/REAR
HI
LO
INPUTS
R
CAL
IN - CKT
1100V
PEAK
500V
PEAK
2A 250V
AMPS
+ I
SOURCE
) • R
Circuit
Under Test
,
TRACE
Y
Note: The distance
"X" must be greater
than 10 times the
x
distance "Y" or
additional errors will
be introduced.
Y
Figure 3-12
DC in-circuit current measurements
3-33
Page 75

Front Panel Operation
Because of accuracy considerations, in-circuit current read-
ings are limited to traces with a resistance of 1mΩ to 10Ω. If
either of these limits is exceeded in the resistance calculation, the in-circuit current cannot be calculated. The bottom
line of the front panel display will show and update the trace
resistance.
A procedure to measure in-circuit current follows:
1. Select the in-circuit current measurement mode from the
CONFIGURE DCI menu and place the instrument in
the DCI function. Note that the 4W annunciator lights to
indicate this is a 4-wire measurement.
2. Connect a set of Kelvin test probes, such as Keithley
Model 5805 or 5806, to the Model 2001 INPUT HI and
LO terminals and SENSE HI and LO terminals.
3. For R
<50mΩ, or where the conductors are physi-
TRACE
cally hot, rel out (zero correct) any thermal offsets that
are present before measuring in-circuit current. With
power to the test circuit removed, place the probes on
the desired trace and enable rel from the DCI function.
4. Turn on the power to the test circuit and read the in-circuit current calculation. The speed of this measurement
is four readings per second at 1PLC. Its range is fi ed at
12A. The default filter for in-circuit current is a moving
average of ten readings. Additional filtering may be
needed at low voltage levels.
You can set the ACI coupling as follows:
1. From the CONFIGURE ACI menu, select COUPLING
and press ENTER. The following menu is displayed:
SET AC COUPLING
AC AC+DC
2. Highlight the desired coupling and press ENTER.
Note that the coupling settings for ACI and ACV are discrete.
Thus, setting the coupling of ACI has no effect on the coupling of ACV.
AC-TYPE
This parameter selects the measurement type for the ACI
function. The Model 2001 directly measures RMS and average AC current. You can program the ACI type parameter as
follows:
1. From the CONFIGURE ACI menu, select AC-TYPE
and press ENTER. The following menu is displayed:
SET ACI MEASUREMENT
RMS AVERAGE
2. Highlight the desired measurement type and press ENTER.
COUPLING
This parameter selects the input coupling for the ACI function. When AC coupling is selected, a DC blocking capacitor
is placed in series with the AC measurement circuit. (Note
that the current shunt resistors are always DC coupled to the
inputs.) This removes the DC component from the RMS and
average ACI measurement.
When AC+DC coupling is selected, the blocking capacitor is
removed. Subsequent RMS or average ACI measurements
will reflect both the AC and DC components of the signal.
RMS: With this parameter selected, the instrument performs
RMS AC current measurements.
AVERAGE: When this item is selected, the signal path in
the instrument bypasses the RMS converter, so the average
ACI measurement is just the filtered output of a full wave
rectifie .
Multiple displays
The multiple displays for AC current that show multiple
functions are shown in Figure 3-13. There are no multifunction displays for DC current.
3-34
Page 76

Front Panel Operation
F
A
RMS (or AVG)
RANGE = Set by ACI range (auto or fixed).
Autoranges independently of other function.
REL = Operates normally.
SPEED = Set by ACI speed.
FILTER = Set by ACI filter.
RESOLUTION = Set by ACI resolution.
COUPLING = Set by ACI coupling.
AC-TYPE = Set by ACI AC-Type.
+000.000 µAAC RMS (or AVG)
+0.0000 Hz
FREQ
RANGE = Set by MAX-SIGNAL-LEVEL in CONFIGURE
FREQUENCY menu.
Autorange has no effect.
REL = No effect.
TRIGGER LEVEL = Set while in FREQ. Not available in
CONFIGURE FREQUENCY menu.
FILTER = Unaffected by ACI filter. FREQ has no filter.
RESOLUTION = Fixed at 5 digits.
COUPLING = Set by ACI coupling.
INPUT TERMINALS = Fixed on CURRENT
RMS
RANGE = Set by ACI range (auto or fixed).
Autoranges independently of other function.
REL = Operates normally.
SPEED = Set by ACI speed.
FILTER = Set by ACI filter.
RESOLUTION = Set by ACI resolution.
COUPLING = Set by ACI coupling.
+000.000 µAAC RMS
AVG=000.000 µAAC
AVG
RANGE = Set by ACI range (auto or fixed).
Autoranges independently of other function.
REL = No effect.
SPEED = Set by ACI speed.
FILTER = Unaffected by ACI filter.
RESOLUTION = Fixed at 5.5 digits.
COUPLING = Set by ACI coupling.
B. AC RMS and average current functions
A. AC RMS (or average) current and frequency functions
igure 3-13
C current multifuncton multiple displays
3.4.3 Two and four-wire resistance
2-wire resistance measurements
The Model 2001 can make 2-wire resistance measurements
between 1µΩ and 1.05GΩ. Assuming “bench reset” condi-
tions (see paragraph 3.12.1), the basic procedure is as follows:
1. Connect test leads to the INPUT HI and LO terminals of
the Model 2001. Either the front or rear inputs can be
used; place the INPUTS button in the appropriate position.
2. Select the Ω2 function.
3. Select a range consistent with the expected resistance.
For automatic range selection, press the AUTO key. The
AUTO annunciator denotes whether auto-ranging is enabled.
4. Enable offset compensation if needed (refer to the procedure later in this paragraph).
NOTE
Whether or not offset compensation is be-
ing used, the 20Ω, 200Ω, 2kΩ, 20kΩ, and
200kΩ ranges require zero correction in
order to achieve the best accuracy. The
zero correction procedure is located in a
following paragraph.
5. Connect the test leads to the resistance as shown in Figure 3-14.
CAUTION
Do not exceed 1100V peak between INPUT HI and LO, or instrument damage
may occur.
3-35
Page 77

Front Panel Operation
F
Model 2001
+00.00100 Ω
Range: 20Ω
PREV
DCV ACV DCI ACI Ω2 Ω4
DISPLAY
NEXT
REL TRIG STORE RECALL
POWER
INFO LOCAL CHAN SCAN CONFIG MENU EXIT ENTER
Note: Source current flows from the
INPUT HI to INPUT LO terminals.
FILTER MATH
2001 MULTIMETER
FREQ TEMP
RANGE
RANGE
AUTO
igure 3-14
Two-wire resistance measurements
6. Observe the display. If the “Overfl w” message is
shown, select a higher range until a normal reading is
displayed. Always use the lowest possible range for the
best resolution.
7. Take a reading from the display.
4-wire resistance measurements
Shielded
SENSE
INPUT
Ω 4 WIRE
HI
350V
PEAK
LO
INPUTS
F
R
FRONT/REAR
2A 250V
AMPS
CAL
Cable
1100V
PEAK
500V
PEAK
Optional shield
Resistance
Under Test
5. Connect the test leads to the resistance as shown in Figure 3-15.
CAUTION
Do not exceed 1100V peak between INPUT HI and LO, or instrument damage
may occur.
The Model 2001 can make 4-wire resistance measurements
between 1µΩ and 210kΩ. Assuming “bench reset” condi-
tions (see paragraph 3.12.1), the basic procedure is as follows:
1. Connect test leads to the INPUT HI and LO and SENSE
Ω4 WIRE HI and LO terminals of the Model 2001. Rec-
ommended Kelvin test probes include the Keithley
Models 5805 and 5806. Either the front or rear inputs
can be used; place the INPUTS button in the appropriate
position.
2. Select the Ω4 function.
3. Select a range consistent with the expected resistance.
For automatic range selection, press the AUTO key. The
AUTO annunciator denotes whether auto-ranging is enabled.
4. Enable offset compensation if needed (refer to the procedure later in this paragraph).
NOTE
If offset compensation is not being used,
the 20Ω and 200Ω ranges require zero cor-
rection in order to achieve the best accuracy. The zero correction procedure is
located in a following paragraph.
6. Observe the display. If the “Overfl w” message is
shown, select a higher range until a normal reading is
displayed. Always use the lowest possible range for the
best resolution.
7. Take a reading from the display.
Zeroing
The term “when properly zeroed” means that you must establish a baseline for subsequent measurements on that
range. The 20Ω and 200Ω resistance ranges require zero cor-
rection to correct for thermal offsets. This procedure should
be performed whenever the ambient temperature changes. To
zero (rel) the Model 2001, use the following procedure:
1. Disable rel, if presently enabled, by pressing the REL
key. The REL annunciator will turn off.
2. Select the desired function (Ω2 or Ω4) and range.
3. Connect the test leads to INPUT HI and LO (and
SENSE Ω4 WIRE if the Ω4 function is selected) of the
Model 2001 and short them together. Noise and thermal
offsets may require a few moments to stabilize.
4. Press the REL key. The display will read zero.
5. Remove the short and connect the test leads to the resistance to be measured.
3-36
Page 78

Front Panel Operation
F
Model 2001
Ω 4 WIRE
+00.00020 Ω
Range: 20Ω
PREV
DCV ACV DCI ACI Ω2 Ω4
DISPLAY
NEXT
REL TRIG STORE RECALL
POWER
INFO LOCAL CHAN SCAN CONFIG MENU EXIT ENTER
2001 MULTIMETER
FREQ TEMP
FILTER MATH
RANGE
RANGE
350V
PEAK
F
AUTO
Note: Source current flows from the
INPUT HI to INPUT LO terminals.
igure 3-15
Four-wire resistance measurements
Shielding
It helps to shield resistance greater than 100kΩ to achieve a
stable reading. Place the resistance in a shielded enclosure
and electrically connect the shield to the INPUT LO terminal
of the instrument.
SENSE
INPUTS
FRONT/REAR
Shielded
INPUT
HI
LO
R
2A 250V
AMPS
CAL
Cable
1100V
PEAK
500V
PEAK
Optional shield
Resistance
Under Test
Resistance configuration
The following paragraphs detail how to change the Model
2001 from its bench reset conditions for 2-wire and 4-wire
resistance measurements. The configuration menus are summarized in Tables 3-16 and 3-17. Note that a function does
not have to be selected in order to be configured. When the
function is selected, it will assume the programmed status.
Table 3-16
CONFIGURE OHMS-2W menu structure
Menu item Description
SPEED
NORMAL
FAST
MEDIUM
HIACCURACY
SET-SPEED-EXACTLY
SET-BY-RSLN
FILTER
AUTO
AVERAGING
ADVANCED
Measurement speed (integration time) menu:
Select 1 PLC (power line cycle, 16.67msec for 60Hz, 20msec for 50Hz and 400Hz).
Select 0.01 PLC.
Select 0.1 PLC.
Select 10 PLC.
Set integration time in PLC (0.01-10).
Default to setting appropriate for resolution.
Digital filter menu
Default to filter appropriate for int gration time.
Program a simple average filter (1-100 readings)
Program a simple average filter (1-100 readings) with a noise tolerance wind w
(0-100% of range).
AVERAGING-MODE
RESOLUTION
AUTO
3.5d, 4.5d, 5.5d, 6.5d, 7.5d
Select moving average or repeating average mode.
Display resolution menu:
Default to resolution appropriate for integration time.
Select a specific resolution.
OFFSETCOMP Enable/disable offset compensation (20Ω-20kΩ ranges).
MAXAUTORANGE
1GΩ, 200MΩ, 20MΩ, 2MΩ,
Set upper limit for autoranging of 2-wire resistance.
Select a specific range.
200kΩ, 20kΩ
3-37
Page 79

Front Panel Operation
Table 3-17
CONFIGURE OHMS-4W menu structure
Menu item Description
SPEED
NORMAL
Measurement speed (integration time) menu:
Select 1 PLC (power line cycle, 16.67msec for 60Hz, 20msec for 50Hz and 400Hz).
Select 0.01 PLC.
FAST
MEDIUM
HIACCURACY
SET-SPEED-EXACTLY
Select 0.1 PLC.
Select 10 PLC.
Set integration time in PLC (0.01-10).
Default to setting appropriate for resolution.
SET-BY-RSLN
FILTER
AUTO
AVERAGING
ADVANCED
Digital filter menu
Default to filter appropriate for int gration time.
Program a simple average filter (1-100 readings)
Program a simple average filter (1-100 readings) with a noise tolerance wind w
(0-100% of range).
AVERAGING-MODE
RESOLUTION
AUTO
3.5d, 4.5d, 5.5d, 6.5d, 7.5d
Select moving average or repeating average mode.
Display resolution menu:
Default to resolution appropriate for integration time.
Select a specific resolution.
OFFSETCOMP Enable/disable offset compensation (20Ω-20kΩ ranges).
MAXAUTORANGE
200kΩ, 20kΩ, 2kΩ
SPEED
The SPEED parameter sets the integration time of the A/D
converter, the period of time the input signal is measured (also known as aperture). It is discussed in paragraph 3.4.1, DC
and AC voltage. Only the differences for 2-wire and 4-wire
resistance are noted here.
Set upper limit for autoranging of 4-wire resistance.
Select a specific range
Table 3-18
Ω
2 and Ω4 integration time set-by-resolution
Resolution Integration time
3.5d, 4.5d
5.5d
6.5d
The SET-BY-RSLN parameter optimizes the integration
7.5d
time for the present resolution setting. The defaults for set-
by-resolution integration times of Ω2 and Ω4 are listed in
Table 3-18.
Note: If the integration time is SET-BY-RSLN and
the resolution AUTO, the integration time will be 1.0
PLC and the resolution 6.5 digits.
0.01 PLC
0.02 PLC
0.20 PLC
2.00 PLC
3-38
FILTER
The FILTER parameter lets you set the digital filter response
and control its on/off operation. It is described in paragraph
3.9. Only the specifics for 2- and 4-wire resistance are covered here.
The AUTO parameter for a digital filter optimizes its use for
the present measurement function. The defaults for
automatic filtering of Ω2 and Ω4 are listed in Table 3-19.
Page 80

Table 3-19
Ω
2 and Ω4 auto filte
Front Panel Operation
Measurement
function State Type Reading Noise tolerance
2-wire resistance On Advanced 10 1.0% Moving
4-wire resistance On Advanced 10 1.0% Moving
RESOLUTION
The RESOLUTION parameter sets the display resolution. It
is discussed in paragraph 3.4.1, DC and AC voltage. Only the
differences for Ω2 and Ω4 are noted here.
The available resolution on all resistance functions and types
is 3.5 digits to 7.5 digits. If the Ω2 or Ω4 resolution is AUTO,
refer to Table 3-20 for the resolution associated with the integration time.
Table 3-20
Ω
2 and Ω4 auto resolution
Integration time Resolution
0.01 to <0.02 PLC
0.02 to <0.20 PLC
0.20 to <2.00 PLC
2.00 to 10.00 PLC
Note: If the resolution is AUTO and the integration time
SET-BY-RSLN, the resolution will be 6.5 digits and the
integration time 1.0 PLC.
4.5d
5.5d
6.5d
7.5d
Averaging
Mode
2. Turns off the internal current source and again measures
the voltage drop across the device. This is the voltage
caused by an external device.
3. Calculates and displays the corrected resistance value.
Offset compensation not only corrects for small error voltages in the measurement circuit, but it also compensates for
thermal voltages generated within the Model 2001. In normal mode ohms, these thermal EMF offsets are accounted
for during calibration.
You can enable/disable offset compensation as follows:
1. From the CONFIGURE OHMS-2W or CONFIGURE
OHMS-4W menu, select OFFSETCOMP and press ENTER. The following menu is displayed:
SET OFFSET COMP
ON OFF
2. Highlight the desired selection and press ENTER.
Offset compensated readings are indicated by “OCmp” to
the right of the reading.
OFFSETCOMP
Offset compensation is used to compensate for voltage potentials, such as thermal offsets, across the device under test.
This feature eliminates errors due to a low level external voltage source configured in series with the unknown resistor.
Offsets up to ±0.2V on the 20Ω and 200Ω ranges, and from
-0.2V to +2V on the 2kΩ and 20kΩ ranges can be corrected
with offset compensation. Offset compensation is available
for 2- and 4-wire resistance measurements.
During offset compensated resistance measurements, the
Model 2001 performs the following steps for each A/D conversion:
1. Makes a normal resistance measurement of the device.
In general, this consists of sourcing a current through
the device, and measuring the voltage drop across the
device.
Note that the offset compensation settings of the ohms functions are discrete. Thus, enabling offset compensation in 2wire ohms has no effect on 4-wire ohms.
MAXAUTORANGE
By setting an upper limit on autoranging, you can prevent
changes to ranges that you do not want to use. This speeds up
the reading rate while still using auto-ranging. You can program the MAXAUTORANGE as follows:
1. From the CONFIGURE OHMS-2W or CONFIGURE
OHMS-4W menu, select MAXAUTORANGE and
press ENTER. One of the following menus is displayed:
SET Ω2 MAX AUTORANGE
1GΩ 200MΩ 20MΩ 2MΩ 200kΩ 20kΩ
3-39
Page 81

Front Panel Operation
or
SET Ω4 MAX AUTORANGE
200kΩ 20kΩ 2kΩ
2. Highlight the desired maximum range for autoranging
and press ENTER.
Multiple displays
There are three multiple displays available just for the resistance functions:
• Source current
• Voltage drop
• Lead resistance (Ω4 only)
Source current: This is the value of the current being
sourced for the present resistance range. It is based on the
calibration constants and is shown as follows:
Source Current = 0.0000 mA
V oltage drop: This display shows the voltage drop across the
resistance under test. It is shown as follows:
Voltage Drop = 0.0000 mV
3.4.4 Frequency
The Model 2001 can make frequency measurements from
1Hz to 15MHz through its INPUT HI and INPUT LO terminals, and from 1Hz to 1MHz through its AMPS and INPUT
LO terminals. Assuming “bench reset” conditions (see paragraph 3.12.1), the basic procedure is as follows:
1. Connect the test leads to the INPUT HI and LO terminals of the Model 2001. Either the front or rear inputs
can be used; place the INPUTS button in the appropriate
position.
NOTE
A bench reset defaults the frequency input
terminals to INPUT HI and LO.
2. Select the FREQ function.
3. Connect the test leads to the source as shown in Figure
3-16A.
CAUTION
Do not exceed 1100V peak between INPUT HI and INPUT LO, or instrument
damage may occur.
This voltage drop is determined by multiplying the source
current by the resistance and does not include voltage contributions from other current that may be fl wing through the
resistance.
Lead Resistance: This display, available only for 4-wire
ohms, shows the value of the lead resistance that is being
nulled by using the Ω4 function. You can use the information
to decide if a 4-wire measurement is necessary. The display
is as follows:
Lead Resistance = 0.0000 Ω
If the lead resistance exceeds 1kΩ, the display is:
Lead Resistance > 1000Ω
4. Take a reading from the display.
The procedure for measuring frequency with the AMPS and
INPUT LO terminals is similar. (See Figure 3-16B for a connection diagram.) Be sure the frequency function is config
ured to use the current terminals.
CAUTION
Do not apply more than 2.1A, 250V to
the AMPS input, or the amps protection
fuse will blow. (Refer to paragraph 3.4.2
for the AMPS fuse replacement procedure.)
3-40
Page 82

+000.00 mHz
Terminals: VOLT Coupling: AC
PREV
DCV ACV DCI ACI Ω2 Ω4
DISPLAY
NEXT
REL TRIG STORE RECALL
POWER
INFO LOCAL CHAN SCAN CONFIG MENU EXIT ENTER
Caution : Maximum Input = 1100V peak, 2 x 10⁷ V•Hz
A. AC Voltage Input
+000.00 mHz
Terminals: CURR Coupling: AC
PREV
DCV ACV DCI ACI Ω2 Ω4
DISPLAY
NEXT
REL TRIG STORE RECALL
POWER
INFO LOCAL CHAN SCAN CONFIG MENU EXIT ENTER
Model 2001
SENSE
INPUT
Ω 4 WIRE
HI
350V
RANGE
RANGE
PEAK
LO
INPUTS
F
R
FRONT/REAR
AUTO
2A 250V
AMPS
CAL
2001 MULTIMETER
FREQ TEMP
FILTER MATH
Model 2001
SENSE
INPUT
Ω 4 WIRE
HI
350V
RANGE
RANGE
PEAK
LO
INPUTS
F
R
FRONT/REAR
AUTO
2A 250V
AMPS
CAL
2001 MULTIMETER
FREQ TEMP
FILTER MATH
Caution : Maximum Input = 1A peak
Front Panel Operation
1100V
PEAK
500V
PEAK
1100V
PEAK
500V
PEAK
AC Voltage
Source
AC Current
Source
B. AC Current Input
Figure 3-16
Frequency measurements
Trigger level
The frequency function has an adjustable trigger level. An
appropriate trigger level is needed for the frequency counter
to operate properly. The instrument only counts cycles with
peak amplitudes that reach the trigger level. For example, if
the trigger level is set for 5V, cycles with peak amplitudes
less than 5V are not counted.
If using AC+DC coupling, make sure the trigger level accounts for the DC bias level. For example, if a 1V peak-topeak input signal is riding on a 5V DC bias level, a trigger
level of 5.5V is appropriate.
While the display is showing frequency measurements, the
RANGE and keys can be used to change the trigger lev-
el of the measurement.
Each press of a RANGE or key adjusts the trigger level
by 0.5% of the presently selected maximum signal level to a
maximum of 60% of the range. The AUTO RANGE key returns the trigger level to 0V or 0mA. After pressing one of
the range keys, the present trigger level is momentarily displayed. The trigger level is also available as a multiple display.
See Table 3-21 for the trigger level ranges and increments.
Table 3-21
Trigger level range and increments
Trigger level
Maximum
signal level
1V
10V
100V
1000V
1mA
10mA
100mA
1A
Note: The trigger level for TTL triggering defaults to +0.80V.
Range Increment
-0.600 to +0.600V
-6.00 to +6.00V
-60.0 to +60.0V
-600 to +600V
-0.600mA to +0.600mA
-6.00mA to +6.00mA
-60.0mA to +60.0mA
-600mA to +600mA
0.005V
0.05V
0.5V
5V
0.005mA
0.05mA
0.5mA
5mA
Frequency configuration
The following paragraphs detail how to change the Model
2001 from its bench reset conditions for frequency measurements. The configuration menu is summarized in Table 3-22.
Note that a function does not have to be selected in order to
be configured. When the function is selected, it will assume
the programmed status.
3-41
Page 83

Front Panel Operation
Table 3-22
CONFIGURE FREQUENCY menu structure
Menu item Description
MAX-SIGNAL-LEVEL
1V, 10V, 100V, 1000V, TTL
1mA, 10mA, 100mA, 1A
RESOLUTION
4-DIGITS, 5-DIGITS
INPUT-TERMINALS
VOLTAGE
CURRENT
COUPLING
AC
AC+DC
Note: The maximum signal level menu is coupled to the input terminals menu, i.e., voltage levels are shown if
voltage is the selected input.
Display maximum signal level menu:
Select maximum voltage level for voltage inputs.
Select maximum current level for current inputs.
Display resolution menu:
Select a specific resolution
Input terminals for frequency measurements menu:
Select INPUT HI and INPUT LO terminals.
Select AMPS and INPUT LO terminals.
Coupling menu:
Select AC coupled measurements.
Select DC coupled measurements.
MAX-SIGNAL-LEVEL
The maximum signal level is used to specify the maximum
expected input voltage or current level for frequency measurements. The maximum signal level is set as follows:
1. From the CONFIGURE FREQUENCY menu, select
MAX-SIGNAL-LEVEL and press ENTER. Depending
on the presently selected input terminals (VOLTAGE or
CURRENT), one of the following menus is displayed:
MAXIMUM SIGNAL LEVEL
1V 10V 100V 1000V TTL
or
MAXIMUM SIGNAL LEVEL
1mA 10mA 100mA 1A
2. Highlight the desired maximum signal level and press
ENTER. Selecting the TTL parameter configures the
maximum signal level to 10V and the trigger level to
+0.80V.
RESOLUTION
The available display resolutions are 4 digits and 5 digits.
There is no auto resolution parameter on the frequency
function.
You can set the resolution as follows:
1. From the CONFIGURE FREQUENCY menu, select
RESOLUTION and press ENTER. The following menu
is displayed:
SET FREQ RESOLUTION
4-DIGITS 5-DIGITS
2. Highlight the desired resolution and press ENTER.
INPUT-TERMINALS
Both the volts and amps input terminals can be used to measure frequency. The upper limit on the voltage terminals is
15MHz; on the amps terminals it is 1MHz. The voltage limit
is subject to the 2 × 10
7
V•Hz product.
The input terminals for frequency measuring are set as follows:
1. From the CONFIGURE FREQUENCY menu, select
INPUT-TERMINALS and press ENTER. The following
menu is shown:
FREQ INPUT SOURCE
VOLTAGE CURRENT
2. Highlight the desired input source and press ENTER.
3-42
Page 84

Front Panel Operation
COUPLING
This parameter selects the input coupling for the frequency
function. When AC coupling is selected, a DC blocking capacitor is placed in series with the input. This removes the
DC component of the input signal.
When AC+DC coupling is selected, the blocking capacitor is
removed. Subsequent frequency measurements will reflec
both the AC and DC components of the signal.
You can set the frequency coupling as follows:
1. From the CONFIGURE FREQUENCY menu, select
COUPLING and press ENTER. The following menu is
displayed:
SET FREQ COUPLING
AC AC+DC
2. Highlight the desired coupling and press ENTER.
Multiple displays
There are two multiple displays just for the frequency function:
• Period calculation
• Trigger level
The multiple display showing the period of the waveform is
calculated from the frequency measurement and, as such, is
only available when the frequency does not equal 0Hz. It is
also unavailable when math is enabled.
The trigger level multiple display is the same message that is
displayed when the trigger level is changed, but it is a permanent display.
3.4.5 Temperature
The Model 2001 measures temperature with two different
sensor types: RTDs and thermocouples. With RTDs, the
Model 2001 can measure temperature between -200°C and
+630°C. RTDs can be connected to the input terminals or the
optional Model 2001-SCAN scanner card.
With thermocouples connected to an external thermocouple
card, such as a Model 7057A or 7402 in a Model 7001
Switch System, the instrument measures temperature over a
range that is dependent on the thermocouple type. (Refer to
the specifications in Appendix A.)
Temperature measurements
Assuming “bench reset” conditions (see paragraph 3.12.1),
the basic procedure to measure temperature with a type
PT385 4-wire RTD (the default sensor) is as follows:
1. Connect the RTD sensor to the Model 2001 as shown in
Figure 3-17. You can use banana plugs (with the front or
rear inputs), or the optional Model 8680 RTD Probe
Adapter (with the front inputs). Place the INPUTS button in the appropriate position. RTDs can also be connected to the optional Model 2001-SCAN scanner card.
(See the Model 2001-SCAN manual.)
2. Select the TEMP function.
CAUTION
Do not exceed 1100V peak between INPUT HI and LO, or 350V peak between
SENSE Ω4 WIRE HI and LO, or instrument damage may occur.
3. Observe the display. If the “Overfl w” message is
shown, the RTD might not be connected properly.
4. Take a reading from the display.
The procedure for measuring temperature with 3-wire and 2wire RTDs is similar. (See Figures 3-18 and 3-19 for connection diagrams.) Be sure that the temperature function is configured for the correct sensor type. (Use the 4-WIRE-RTD
selection for a 3-wire RTD sensor.)
To measure temperature with thermocouples, you need to
connect the thermocouples to a suitable external scanner
card, such as the Keithley Model 7057A or 7402. These
cards must be inserted into a Model 705 or 706 Scanner or
the Model 7001 Switch System, as shown in Figure 3-20.
The thermocouple cards use Channel 1 as the reference junction, and must be configured on the Model 2001 for voltage
reference and offset.
3-43
Page 85

Front Panel Operation
+000.00 °C
4W-RTD type : PT385
PREV
DCV ACV DCI ACI Ω2 Ω4
DISPLAY
NEXT
REL TRIG STORE RECALL
POWER
INFO LOCAL CHAN SCAN CONFIG MENU EXIT ENTER
A. Connections to Banana Jacks
Model 2001
FREQ TEMP
FILTER MATH
2001 MULTIMETER
Sense Ω4-wire HI
SENSE
INPUT
Ω 4 WIRE
HI
350V
PEAK
RANGE
AUTO
RANGE
Input HI
1100V
PEAK
Input LO
LO
500V
PEAK
INPUTS
F
R
FRONT/REAR
2A 250V
AMPS
CAL
Platinum
RTD
Sense Ω4-wire LO
Model 2001
+000.00 °C
4W-RTD type : PT385
PREV
DCV ACV DCI ACI Ω2 Ω4
DISPLAY
NEXT
REL TRIG STORE RECALL
POWER
INFO LOCAL CHAN SCAN CONFIG MENU EXIT ENTER
FILTER MATH
2001 MULTIMETER
FREQ TEMP
B. Connections to Circular Jack
Model 2001
+000.00 °C
4W-RTD type : PT385
PREV
DCV ACV DCI ACI Ω2 Ω4
DISPLAY
NEXT
REL TRIG STORE RECALL
POWER
INFO LOCAL CHAN SCAN CONFIG MENU EXIT ENTER
FILTER MATH
2001 MULTIMETER
FREQ TEMP
C. Connections to Terminal Block
Figure 3-17
4-wire RTD temperature measurements
Model 8680 RTD
Probe Adapter
SENSE
Ω 4 WIRE
HI
RTD PROBE ADAPTER
350V
PEAK
RANGE: -220°C TO 630°C
-360°F TO 1100°F
MADE
LO
IN
INPUTS
U.S.A.
F
R
HI LO
HI
RANGE
SENSE
RTD
FRONT/REAR
AUTO
RANGE
CAL
Model 8680 RTD
Probe Adapter
SENSE
Ω 4 WIRE
HI
RTD PROBE ADAPTER
350V
PEAK
RANGE: -220°C TO 630°C
-360°F TO 1100°F
MADE
LO
IN
INPUTS
U.S.A.
F
R
HI
HI LO
RANGE
SENSE
RTD
FRONT/REAR
AUTO
RANGE
CAL
Sense Ω4-wire HI
8680
INPUT
Input HI
1100V
PEAK
Input LO
42V
500V
PEAK
PEAK
LO
SENSE
2A 250V
AMPS
Platinum
RTD
2
Sense Ω4-wire HI
4
1
3
Input HI
Sense Ω4-wire LO
Input LO
Sense Ω4-wire LO
WARNING : To avoid a shock hazard and possible instrument damage,
do not use the Model 8680 RTD Probe Adapter to measure voltages
exceeding 30V RMS, 42.4V peak.
8680
INPUT
1100V
PEAK
42V
500V
PEAK
PEAK
Sense Ω4-wire HI
LO
SENSE
2A 250V
Input HI
AMPS
Input LO
Sense Ω4-wire LO
Platinum
RTD
Sense Ω4-wire HI
Input HI
1234
Sense Ω4-wire LO
Input LO
3-44
Page 86
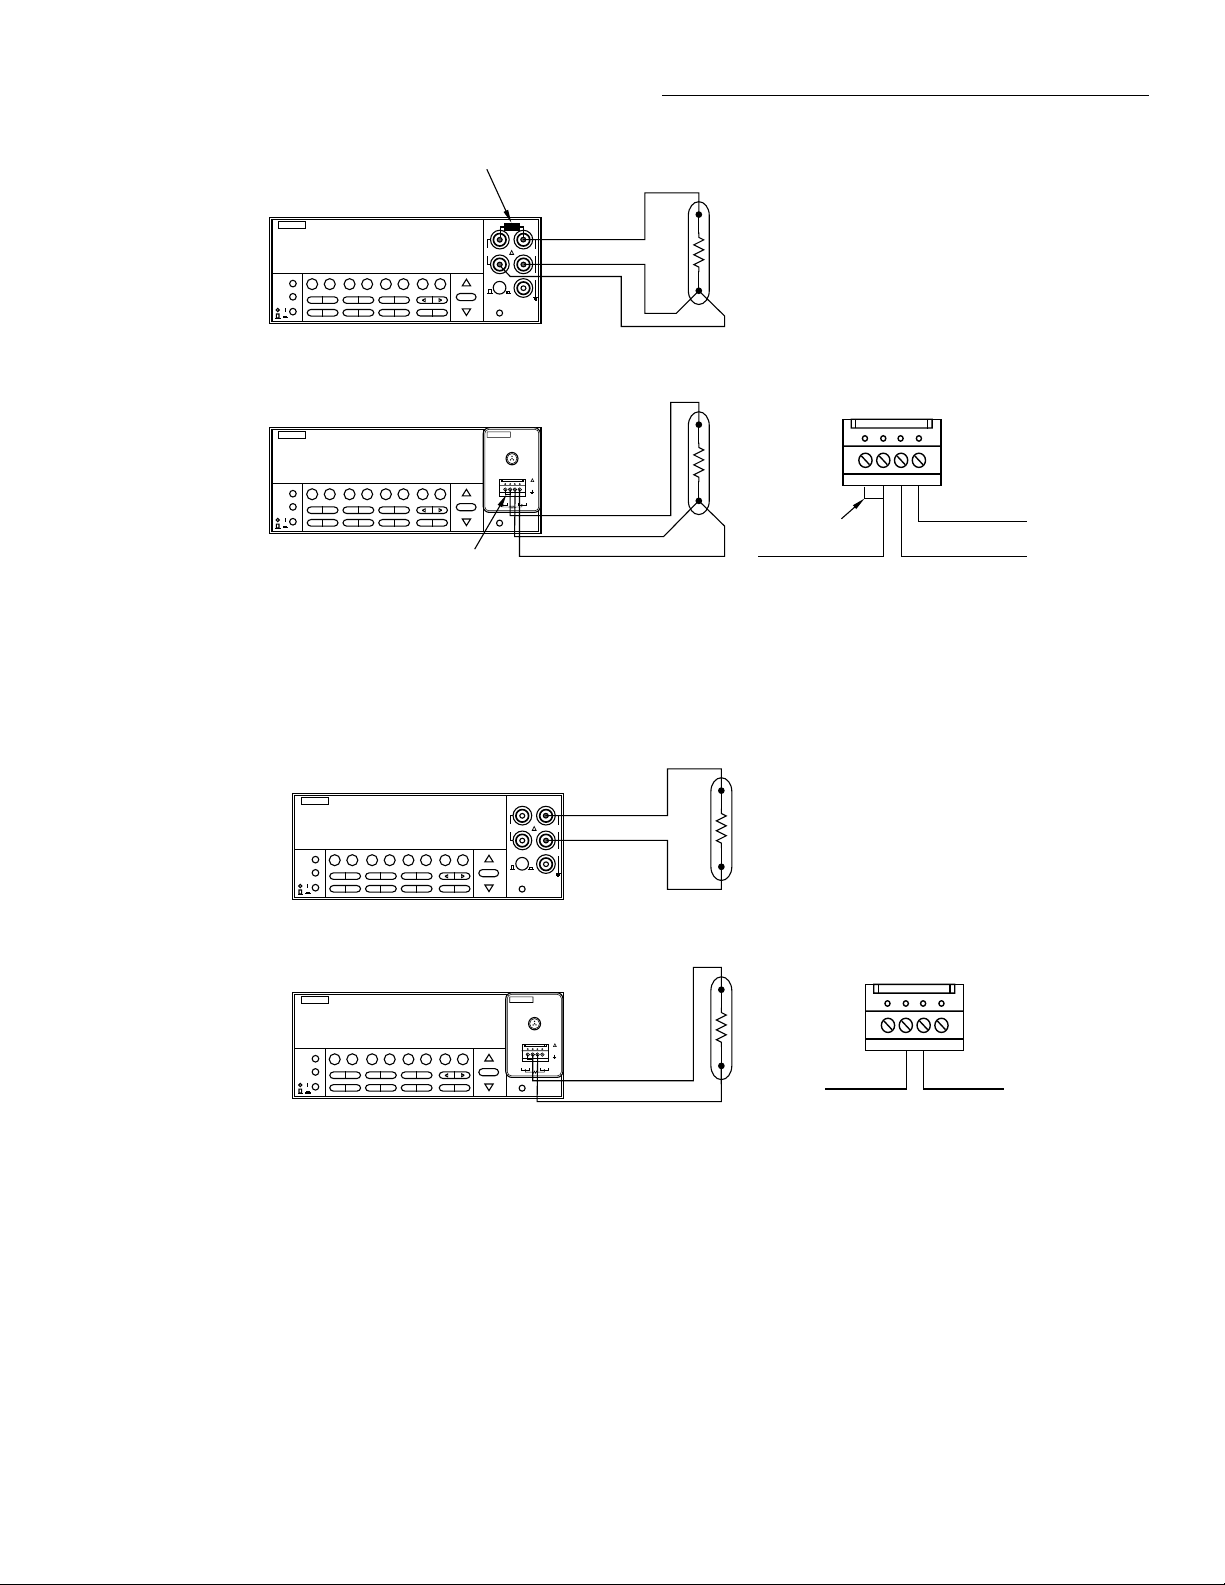
Short
Front Panel Operation
Model 2001
+000.00 °C
4W-RTD type : PT385
PREV
DCV ACV DCI ACI Ω2 Ω4
DISPLAY
NEXT
REL TRIG STORE RECALL
POWER
INFO LOCAL CHAN SCAN CONFIG MENU EXIT ENTER
FILTER MATH
2001 MULTIMETER
FREQ TEMP
A. Connections to Banana Jacks
Model 2001
+000.00 °C
4W-RTD type : PT385
PREV
DCV ACV DCI ACI Ω2 Ω4
DISPLAY
NEXT
REL TRIG STORE RECALL
POWER
INFO LOCAL CHAN SCAN CONFIG MENU EXIT ENTER
FILTER MATH
2001 MULTIMETER
FREQ TEMP
Short
B. Connections to Terminal Block
Figure 3-18
3-wire RTD temperature measurements
Model 2001
+000.00 °C
RTD type : PT385
PREV
DCV ACV DCI ACI Ω2 Ω4
DISPLAY
NEXT
REL TRIG STORE RECALL
POWER
INFO LOCAL CHAN SCAN CONFIG MENU EXIT ENTER
FILTER MATH
2001 MULTIMETER
FREQ TEMP
RANGE
AUTO
RANGE
RANGE
AUTO
RANGE
SENSE
Ω 4 WIRE
HI
350V
PEAK
LO
INPUTS
F
R
FRONT/REAR
CAL
SENSE
Ω 4 WIRE
HI
RTD PROBE ADAPTER
350V
PEAK
RANGE: -220°C TO 630°C
-360°F TO 1100°F
MADE
LO
IN
INPUTS
U.S.A.
F
R
HI
HI LO
SENSE
RTD
FRONT/REAR
CAL
350V
PEAK
F
RANGE
AUTO
RANGE
INPUT
2A 250V
AMPS
1100V
PEAK
500V
PEAK
Input HI
Input LO
Platinum
RTD
Sense Ω4-wire LO
8680
INPUT
1100V
PEAK
42V
500V
PEAK
PEAK
LO
SENSE
2A 250V
Input HI
AMPS
Input LO
Sense Ω4-wire LO
WARNING : To avoid a shock hazard and possible instrument damage,
do not use the Model 8680 RTD Probe Adapter to measure voltages
exceeding 30V RMS, 42.4V peak.
SENSE
INPUT
Ω 4 WIRE
HI
Input HI
1100V
PEAK
Input LO
LO
500V
PEAK
INPUTS
R
FRONT/REAR
2A 250V
AMPS
CAL
Platinum
RTD
Platinum
Short
Input HI
RTD
1234
Sense Ω4-wire LO
Input LO
A. Connections to Banana Jacks
Model 2001
+000.00 °C
RTD type : PT385
PREV
DCV ACV DCI ACI Ω2 Ω4
DISPLAY
NEXT
REL TRIG STORE RECALL
POWER
INFO LOCAL CHAN SCAN CONFIG MENU EXIT ENTER
FILTER MATH
2001 MULTIMETER
FREQ TEMP
B. Connections to Terminal Block
Figure 3-19
2-wire RTD temperature measurements
RANGE
AUTO
RANGE
SENSE
8680
INPUT
Ω 4 WIRE
HI
RTD PROBE ADAPTER
350V
1100V
PEAK
PEAK
RANGE: -220°C TO 630°C
-360°F TO 1100°F
MADE
LO
42V
500V
IN
PEAK
PEAK
INPUTS
U.S.A.
F
R
HI
HI LO
LO
SENSE
SENSE
RTD
FRONT/REAR
2A 250V
Input HI
AMPS
CAL
Input LO
WARNING : To avoid a shock hazard and possible instrument damage,
do not use the Model 8680 RTD Probe Adapter to measure voltages
exceeding 30V RMS, 42.4V peak.
Platinum
RTD
Input HI Input LO
1234
3-45
Page 87

Front Panel Operation
MODEL 7402
or
Model 7057A
Thermocouple
Scanner Card
Note: The thermocouple card must be inserted into a Keithley
Model 705 or 706 Scanner or Model 7001 Switch System.
PREV
DISPLAY
NEXT
POWER
Figure 3-20
Thermocouple configu ation
Model 2001
+0000.0 °C
Thermocouple type : J
DCV ACV DCI ACI Ω2 Ω4
REL TRIG STORE RECALL
INFO LOCAL CHAN SCAN CONFIG MENU EXIT ENTER
FREQ TEMP
FILTER MATH
2001 MULTIMETER
RANGE
AUTO
RANGE
THERMOCOUPLE SCANNER
CH 6
OUTPUT
CABLE
CLAMP
OUTPUT
HI
SENSE
INPUT
Ω 4 WIRE
HI
350V
PEAK
1100V
PEAK
LO
500V
PEAK
INPUTS
F
R
FRONT/REAR
2A 250V
AMPS
CAL
CH 4
CH 5
CH 10
CH 9
R2
LO
H
H
CH 9 CH 8
HI HI
CH 2
CH 3 CH 8
LO
GUARD
CH 7
LO
LL
3-46
Page 88

Front Panel Operation
Table 3-23
CONFIG TEMPERATURE menu structure
Menu item Description
SENSOR
4-WIRE-RTD
PT100
D100
F100
PT385
PT3916
USER-RTD
SPRTD
RTD
PT100
D100
F100
PT385
PT3916
USER-RTD
SPRTD
THERMOCOUPLE
THERMOCOUPLE-TYPE
REF-JUNCTIONS
CONFIGURE
ACQUIRE-REF-TEMP
Sensor type menu:
4-wire RTD type menu:
Select PT100 type.
Select D100 type.
Select F100 type.
Select PT385 type.
Select PT3916 type.
Set desired R-zero, alpha, beta and delta.
Select SPRTD type.
2-wire RTD type menu:
Select PT100 type.
Select D100 type.
Select F100 type.
Select PT385 type.
Select PT3916 type.
Set desired R-zero, alpha, beta and delta.
Select SPRTD type.
UNITS
DEG-C, DEG-F, K
Temperature units menu:
Select desired temperature units.
SPEED
NORMAL
FAST
MEDIUM
HIACCURACY
SET-SPEED-EXACTLY
SET-BY-RSLN
Measurement speed (integration time) menu:
Select 1 PLC (power line cycle, 16.67msec for 60Hz, 20msec for 50Hz and 400Hz).
Select 0.01 PLC.
Select 0.1 PLC.
Select 10 PLC.
Set integration time in PLC (0.01-10).
Default to setting appropriate for resolution.
FILTER
AUTO
AVERAGING
AVERAGING-MODE
Digital filter menu
Default to filter appropriate for int gration time.
Select simple average filter (1-100 readings)
Select moving average or repeating average mode.
RESLN
AUTO
1°, 0.1°, 0.01°, 0.001°
Display resolution menu:
Default to resolution appropriate for sensor.
Select a specific resolution.
Temperature configuration
The following paragraphs detail how to change the Model
2001 from its bench reset conditions for temperature mea-
surements. The configuration menu is summarized in Table
3-23. Note that a function does not have to be selected in order to be configured.When the function is selected, it will assume the programmed status.
3-47
Page 89

Front Panel Operation
SENSOR
This parameter is used to select the temperature sensor. If using a 4- or 3-wire RTD sensor, choose 4-WIRE-RTD. If using a 2-wire RTD, choose RTD. Select THERMOCOUPLE
when using an external thermocouple scanner card (Model
7057A or Model 7402).
For T < 0°C:
RTR01ATBT2CT3T-100()++ +[]=
For 0°C < T < 630°C:
You can select the temperature sensor as follows:
1. From the CONFIG TEMPERATURE menu, highlight
SENSOR and press ENTER. The following menu is displayed:
TEMP SENSOR TYPE
4-WIRE-RTD RTD THERMOCOUPLE
2. Use the cursor keys to highlight the desired sensor and
press ENTER. For the 4-WIRE-RTD and RTD parameters, the following menu is displayed:
SET RTD TYPE
PT385 PT3916 USER-RTD SPRTD
Choosing THERMOCOUPLE displays the following menu:
THERMOCOUPLE SETUP
THERMOCOUPLE-TYPE REF-JUNCTIONS
RTD Type: This menu has six options for RTD standards.
Five are configured for common RTDs, and the sixth allows
you to enter your own RTD factors:
• PT100 – Selects default parameters for the PT100 standard.
• D100 – Selects default parameters for the D100 standard.
• F100 – Selects default parameters for the F100 standard.
• PT385 – Selects default parameters for the PT385 standard.
• PT3916 – Selects default parameters for the PT3916
standard.
• USER-RTD – Selects user-defined parameters
R
R01ATBT
T
++()=
2
Where:
A α 1
=
B αδ 10
C αβ 10
---------+
100
-4
•–=
-8
•–=
δ
Above 0°C, the equation solves faster by applying:
2
A
- 4B 1 -
–
A +
T
---------------------------------------------------------=
2B
R
T
------
R
0
Below 0°C, it is an iterative solution and it runs slower.
Figure 3-21
Temperature equations
If you want to change one or more of these factors, select
USER-RTD, and enter the desired values. The equations using the factors are shown in Figure 3-21.
SPRTD: Choosing type SPRTD takes you to the SPRTD
COEFFICIENTS menu, which allows you to program the
following parameters:
R-ZERO: RTD 0˚C resistance value
A4: set A4 coefficient
B4: set B4 coefficient
A7: set A7 coefficient
B7: set B7 coefficient
C7: set C7 coefficient
When one of the fi e common standards is selected, the instrument uses the following defaults:
Type Standard Alpha Beta Delta Ω at 0°C
PT100 ITS-90 0.003850 0.10863 1.49990 100Ω
D100 ITS-90 0.003920 0.10630 1.49710 100Ω
F100 ITS-90 0.003900 0.11000 1.49589 100Ω
PT385 IPTS-68 0.003850 0.11100 1.50700 100Ω
PT3916 IPTS-68 0.003916 0.11600 1.50594 100Ω
3-48
The ITS-90 standard provides two reference equations for
Standard Platinum Resistance Thermometers covering the
temperature range 18.8033K to 1234.93K. A single SPRTD,
however, usually cannot be used to cover the entire
range.The temperature range is therefore broken up into several subranges. These subranges depend on the calibration
points of the temperature scale and are based on the melting
or triple points of various pure substances. For an exact list
Page 90

Front Panel Operation
Table 3-24
Translating SPRTD coefficient
Coefficients RTD coefficients to Model 2001 coefficients
Subrange #1: 13.8033K - 273.16K
Subrange #2: 24.5561K - 273.16K
Subrange #3: 54.3584K - 273.16K
Subrange #4: 83.8058K - 273.16K
Subrange #5: 234.3156K - 302.9146K
Subrange #6: 273.15K - 1234.93K
Subrange #7: 273.15K - 933.473K
Subrange #8: 273.15K - 692.677K
Subrange #9: 273.15K - 505.078K
Subrange #10: 273.15K - 429.7485K
Subrange #11: 273.15K - 302.9146K
of the elements needed and details on RTD calibration, refer
to NIST Technical Note 1265 "Guidelines For Realizing the
International Temperature Scale of 1990". In each subrange,
the calibration constants required for that range are listed.
An SPRTD as supplied from the manufacturer will come
with a certificate of calibration that lists the calibration
constants and the temperature range supported. In all cases
except subranges #4 and #7, translation of the supplied
coefficients to Model 2001 values will be required. In most
cases, this translation is done simply entering the A value
(for example) supplied with the SPRTD into the A4 position
(temperatures less than 0°C) or A7 value (temperatures
above 0°C) required by the Model 2001. The same procedure
is used for translating the B and, where applicable, C
constants.
Table 3-24 should be helpful in translating SPRTD
coefficients to Model 2001 SPRTD coefficients. The Model
2001 supports SPRTD temperatures between 83.805K and
933.473K. For any of the subranges below, only
temperatures within the range from 83.805K to 933.47K will
be measured.
Not applicable
A2 to A4, B2 to B4
A3 to A4, B3 to B4
No substitution needed
A5 to A4, A5 to A7, B5 to B4
B5 to B7, Set C7 = 0. A5 value entered for both A4 and A7;
B5 value entered for both B4 and B7
Not applicable
No substitution needed
A8 to A7, B8 to B7, Set C7 = 0
A9 to A7, B9 to B7, Set C7 = 0
A10 to A7, B10 to B7, Set C7 = 0
A11 to A7, Set B7 = 0, C7 = 0
and 273.16K. The Model 2001, however, supports only
SPRTD temperatures down to 83.805K, so temperatures below this value will be reported as an overfl w even though
the SPRTD is capable of measuring lower. The calibration
certificate lists A2, B2, C1, C2, and C3 as the calibration coefficients. You can set up the Model 2001 for this measurement as follows:
1. Set the temperature sensor type to be FRTD (4-wire
measurement) from the CONFIG/TEMP/SENSOR/
TYPE menu.
2. Choose the SPRTD RTD type using the CONFIG/
TEMP/SENSOR/TYPE/FRTD/SPRTD menu.
3. From the SPRTD COEFFICIENTS menu, set the RTD
0°C resistance value and the following coefficients
• Set the Model 2001 A4 coefficient to the RTD certifi
cate A2 value.
• Set the Model 2001 B4 coefficient to the RTD certifi
cate B2 value.
Note that the A7, B7, and C7 values will not be used for this
sensor.
Measurement Example: Suppose you are using an SPRTD
that has been calibrated for subrange #2 above, in which case
the RTD is calibrated for measurements between 24.5561
4. Switch to the temperature function, and begin taking
readings.
3-49
Page 91

Front Panel Operation
THERMOCOUPLE TYPE:
This option of the THERMOCOUPLE SETUP menu brings up a menu of thermocouple
types:
THERMOCOUPLE TYPE
JKTERSBN
To select a type, highlight it and press ENTER.
REF-JUNCTIONS:
This item of the THERMOCOUPLE
SETUP menu allows you to select one of fi e reference junctions for further configuration. Typically, each thermocouple
card uses a single reference junction. The menu is displayed
as follows:
CONFIGURE REFJCNS
JCN1 JCN2 JCN3 JCN4 JCN5
After choosing one of the reference junctions, you can configure it further or acquire a reference temperature (to update
the stored reference temperature), as shown in the typical
following menu:
REFERENCE JUNCTION#1
CONFIGURE ACQUIRE-REF-TEMP
Choosing the ACQUIRE-REF-TEMP option updates the
stored reference temperature used for generating a temperature measurement. If the junction type (JCN) is simulated,
the defined simulated junction temperature is used. If the
junction type is real, you must manually close that channel
from the scanner before acquiring the temperature.
Selecting the CONFIGURE option displays a configuratio
menu for a particular reference junction (#1 through #5):
CONFIGURE REFJCN#1
SIMULATED-TEMP REAL-JUNCTION
1. From the CONFIG TEMPERATURE menu, select
UNITS and press ENTER. The following menu is displayed:
SET TEMP UNITS
DEG-C DEG-F K
2. Highlight the desired units and press ENTER.
There is a multiple display for the temperature function that
shows the reading expressed in all three temperature units.
SPEED
The SPEED parameter sets the integration time of the A/D
converter, the period of time the input signal is measured (also known as aperture). It is discussed in paragraph 3.4.1, DC
and AC voltage. Only the differences for temperature are
noted here.
The SET-BY-RSLN parameter optimizes the integration
time for the present resolution setting. The defaults for setby-resolution integration times of temperature are listed in
Table 3-25.
Table 3-25
Temperature integration time set-by-resolution
Resolution
degrees
1 degree
0.1 degree
0.01 degree
0.001 degree
Note: If the integration time is SET-BY-RSLN and the resolution
AUTO, the integration time will be 1.0 PLC and the resolution set
by sensor.
Resolution
digits
3.5d
4.5d
5.5d
6.5d
Integration
time
1.0 PLC
1.0 PLC
1.0 PLC
1.0 PLC
The SIMULATED-TEMP option allows you to enter a default temperature. Typical reference junction temperatures
are 0°C and 23°C. (Note the reference junction temperature
is shown in the units selected by the SET TEMP UNITS
menu.) The REAL-JUNCTION option lets you enter values
for a temperature coefficient for the selected reference junction (in mV/°C) and an offset voltage (in mV at 0°C). Consult the Model 7057A or 7402 manual for correct
configuration
UNITS
This parameter selects the displayed units for temperature
measurements. You can program the temperature units parameter as follows:
3-50
FILTER
The FILTER parameter lets you set the digital filter response
and control its on/off operation. It is described in paragraph
3.9. Only the specifics for temperature are c vered here.
The advanced filter is not available for the temperature function.
The AUTO parameter for a digital filter optimizes its use for
the present measurement function. The defaults for automatic filtering of temperature are as foll ws:
Averaging
State Type Readings Mode
On Averaging 10 Moving
Page 92

Front Panel Operation
RESLN
The RESLN parameter sets the display resolution. It is discussed in paragraph 3.4.1, DC and AC voltage. Only the differences for temperature are noted here.
Resolution for temperature is not expressed in number of
digits, but in fractions of a degree, ranging from 1° to 0.001°.
The accuracy of RTD and thermocouple measurements are
rated at different resolutions; refer to the specifications in
Appendix A for details.
If the temperature resolution is AUTO, the resolution is
forced to match the sensor type. Refer to Table 3-26 for the
resolution associated with the various sensors.
Table 3-26
Temperature auto resolution
Resolution
Sensor
RTDs 2-, 3-, or 4-wire 0.01 5.5d
Thermocouples J, K, T, E 0.1 4.5d
Thermocouples R, S, B, N 1 3.5d
Note: If the resolution is AUTO and the integration time SET-BYRSLN, the integration time will be 1.0 PLC.
Degree Digits
Multiple displays
The available multiple displays for temperature depend on
the presently selected sensor type, except for the multiple
display that shows temperature in three different units:
+0000.0 °C
+0000.0 °F +0000.0 K
RTD measurements have a multiple display for the resistance of the RTD, such as:
RTD Resistance = +0.0000 Ω
Thermocouple measurements have multiple displays for the
thermocouple voltage and reference junction temperature.
Sample displays are:
Thermocouple Voltage = 0.0000mV
Reference junction = 00.0 °C
Note that the reference junction temperature is shown in the
units selected by the SET TEMP UNITS menu. The display
of two blinking question marks at the right of the reference
junction temperature indicates an overfl w of the reference
junction measurement. Thermocouple measurements will be
made normally using the existing reference temperature
value.
3-51
Page 93

Front Panel Operation
3.5 Range
The selected measurement range affects both the ultimate
resolution and accuracy of the measurements as well as the
maximum signal that can be measured. The range setting
(fi ed or auto) for each measurement function is saved when
changing functions.
The following paragraphs discuss range resolution and manual and auto-range operation.
3.5.1 Display resolution
The display resolution of a Model 2001 reading depends on
the selected range and the resolution setting. The default and
maximum display resolutions for every range on each function are included in the specifications of Appendix A.
You can set the display resolution, as described in paragraph
3.4.
3.5.2 Maximum readings
The full scale readings for every range on each function are
included in the specifications of Appendix A. Input values
more than the maximum reading listed cause the “Overfl w”
message to be displayed.
3.5.3 Manual ranging
To select a manual range, simply press the RANGE or
RANGE key. The instrument changes one range per key
press. The selected range is displayed on the bottom line of
the display, such as:
+000.0094 mVDC
Range: 200 mVDC
Once the highest or lowest range has been selected, pressing
the corresponding key has no further effect, except for the
display of a momentary informational message, for example:
Range at maximum: 1000 VDC
If the instrument displays the “Overfl w” message on a particular range, select a higher range until an on-range reading
is displayed. Use the lowest range possible without causing
an overfl w to ensure best accuracy and resolution.
Note that the frequency and temperature functions have just
one range. For the frequency functions, the RANGE and
keys increase and decrease the trigger level by 0.5%. On
temperature the keys have no effect.
3-52
Page 94

Ω
Ω
Ω
Front Panel Operation
3.5.4 Autoranging
To enable autoranging, press the AUTO key. The AUTO annunciator turns on when autoranging is selected. While autoranging is selected, the instrument automatically chooses
the best range to measure the applied signal.
NOTE
Autoranging should not be used when optimum speed is required. Autoranging
speeds are covered in the specifications of
Appendix A.
Note that up-ranging occurs at 105% of range, while downranging occurs at 10% of range.
To cancel autoranging, press AUTO or the RANGE or
key. Pressing AUTO to cancel autoranging leaves the instrument on the present range.
Pressing the RANGE key when the instrument has
autoranged to the lowest range displays the following
momentary typical message and leaves the instrument in
autorange:
Range at minimum: 200 mVDC
set as a rel value on the 200µA range, then the rel is also
100µA on the 2mA, 20mA, 200mA, and 2A ranges. Similarly, if 150V is set as a rel value on the 200V range, the rel is
also 150V on the 1000V, 20V, 2V, and 200mV ranges.
A relative value can be as large as the highest range for the
particular function. Table 3-27 lists the allowable range of rel
values for each function.
Selecting a range that cannot accommodate the rel value
does not cause an overfl w condition, but it also does not increase the maximum allowable input for that range. For example, on the 2mA range, the Model 2001 still overfl ws for
a 2.1mA input.
Table 3-27
Allowable rel values
Function Rel range
DC voltage
AC voltage
DC current
AC current
2-wire resistance
4-wire resistance
Frequency
Temperature
-1.1e3 to +1.1e3
-7.75e2 to +7.75e2
-1.2e1 to +1.2e1
-2.1e0 to +2.1e0
0 to +1.05e9
0 to +2.1e5
0 to +1.5e7
-3.28e2 to +3.31e3
(±1100V)
(±775V)
(±12A)
(±2.1A)
(0 to 1.05G
(0 to 210k
(0 to 15MHz)
(-328 to +3310°)
)
)
The instrument operates similarly if the RANGE key is
pressed when the instrument has autoranged to the highest
range.
For the frequency function, pressing the AUTO key returns
the trigger level to 0.0V. The AUTO key has no effect for the
temperature function.
3.6 Relative
The rel (relative) operation subtracts a reference value from
actual readings. When rel is enabled by the REL key, the instrument uses the present reading as a relative value. Subsequent readings will be the difference between the actual
input value and the rel value. You can also enter and enable a
relative value from the CONFIG-REL display.
A rel value can be established for each measurement function. For example, a 10µA reference can be set for DC current measurements, and a 100
resistance. The state and value of rel for each measurement
function are saved when changing functions.
Once a rel value is established for a measurement function,
the value is the same for all ranges. For example, if 100µA is
reference for 2-wire
3.6.1 Configuring rel
From the CONFIG-REL display, you can view or change the
rel value for the present measurement function. To view or
change the rel value of a different function, you must firstselect it by pressing the appropriate function key.
Press the CONFIG key, and then the REL key to access the
following display:
RELVAL=+0.000000e+00
Use the cursor ( and ) and RANGE keys to move
among the digits and set their desired values. If the value is
too large for the present measurement function, the following typical message is displayed when you press ENTER:
MAXIMUM ALLOWED VAL:
1.100000e+03
and rel is not enabled. If the value is within the limits shown
in Table 3-27, you are returned to the normal reading display
with that value of rel already enabled.
3-53
Page 95

Front Panel Operation
Previously stored rel values are converted if temperature or
AC voltage units are changed. For example, a rel value of
100 that was stored with units of DEG-C is converted to 212
if temperature units are changed to DEG-F.
Note that a bench or GPIB reset clears any stored rel values
and disables rel for all functions.
3.6.2 Enabling rel
From the normal reading display, the REL key toggles the rel
operation on and off. The present state is indicated by the
REL annunciator. Each time rel is enabled by the REL key,
the present reading becomes the new rel value for that function. You cannot rel an overfl w reading.
To make a new reading the rel value, rel must first be disabled and then enabled again. Disabling rel does not clear
any stored rel value.
The present rel value for each measurement function can be
viewed from the CONFIG-REL display, as described in
paragraph 3.6.1.
3.6.3 Multiple display of rel
One of the “multiple displays” allows you to view the reading without rel applied on the bottom line of the display and
the rel’d reading on the top line. The display is available by
repeatedly pressing either the NEXT or PREVious DISPLAY key to scroll through the multiple displays of the particular function. The following is a typical message for a rel
multiple display:
+000.012 mVAC RMS
Actual=+001.012 (without REL)
3.7 T riggers
The following paragraphs discuss front panel triggering,
trigger configuration, and external triggering, including example setups.
Model 2001 triggers are set up in the CONFIGURE TRIGGER menu. The menu structure is shown and summarized in
Table 3-28. Some general rules to navigate menus are given
in paragraph 3.3.
When rel is enabled, the resulting reading is the algebraic
difference between the actual input value and the rel value:
rel'd reading = actual value - relative value
With percent or mX+b math enabled, the rel’d reading is acted on by the math operation:
displayed reading = math operation (rel'd reading)
A rel value expressed in dB or dBm is applied after the reading is referenced to the selected level.
3.7.1 Trigger model
The following information describes triggering of the Model
2001 from the front panel. The fl wchart of Figure 3-22 summarizes front panel triggering. It is called the Trigger Model
because it is patterned after the SCPI commands sent over
the IEEE-488 bus to control triggering.
3-54
Page 96

Table 3-28
CONFIGURE TRIGGER menu structure
Menu item Description
Front Panel Operation
MEASURE
SOURCE
IMMEDIATE
EXTERNAL
MANUAL
GPIB
TRIGLINK
TIMER
HOLD
DELAY
COUNT
INFINITE
ENTER-CHAN-COUNT
CONTROL
SOURCE
ACCEPTOR
SCAN
SOURCE
IMMEDIATE
EXTERNAL
MANUAL
GPIB
TRIGLINK
TIMER
HOLD
DELAY
COUNT
INFINITE
ENTER-SCAN-COUNT
CONTROL
SOURCE
ACCEPTOR
ARM
SOURCE
IMMEDIATE
EXTERNAL
MANUAL
GPIB
TRIGLINK
HOLD
COUNT
INFINITE
ENTER-ARM-COUNT
CONTROL
SOURCE
ACCEPTOR
HALT Use to halt triggers. Press TRIG key to resume triggering.
Measure layer menu:
Select measure source:
Use to make measurements immediately.
Use external triggers to control measuring.
Use TRIG key to control measuring.
Use bus triggers to control measuring.
Use Trigger Link triggers to control measuring. Enter Trigger Link mode and
lines.
Use a timer to control measuring and enter interva between triggers
(0.001-999999.999sec.).
Use to hold up the measurement in the measure layer.
Use to delay measurement in the measure layer (0.001-999999.999sec.).
Define number of measurements to ma e:
Repeat measuring indefinitel .
Count = use defined alue (1-99999).
Select trigger control mode:
Enable Source Bypass.
Disable Source Bypass.
Scan layer menu:
Select scan source:
Use to pass operation immediately into the measure layer.
Use external triggers to control scanning.
Use TRIG key to control scanning.
Use bus triggers to control scanning.
Use Trigger Link triggers to control scanning. Enter Trigger Link lines.
Use a timer to control scanning and enter interval between scans
(0.001-999999.999sec.).
Use to hold up the measurement in the scan layer.
Use to delay scan in the scan layer (0.001-999999.999sec.).
Define number of scans to be performed
Repeat scanning indefinitel .
Count = user defined alue (1-99999).
Select trigger control mode:
Enable Source Bypass.
Disable Source Bypass.
Arm layer menu:
Select arm source:
Use to arm meter immediately and pass operation into the scan layer.
Use external triggers to arm meter.
Use TRIG key to arm meter.
Use bus triggers to arm meter.
Use Trigger Link triggers to arm meter. Enter Trigger Lin lines.
Use to hold up the measurement in the arm layer.
Define number of times to arm meter
Continuously re-arm meter.
User defined count alue (1-99999).
Select trigger control mode:
Enable Source Bypass.
Disable Source Bypass.
3-55
Page 97

Front Panel Operation
Idle
Arm Layer
(Arm Layer 1)
Halt triggers,
enable scanning or
burst mode
Idle
TRIG (or SCAN)
Arm Trigger Control = Source
(Source Bypass Enabled)*
Yes
No
Another
Arm
?
Arm Count
Scan Layer
(Arm Layer 2)
Measure Layer
(Trigger Layer)
Source
Immediate
External
Manual
GPIB
Triglink
Hold
Source
Immediate
External
Manual
GPIB
Triglink
Timer
Hold
Scan Delay
Arm Event
Detection
Scan Trigger Control = Source
(Source Bypass Enabled)*
Scan Event
Detection
Delay
Measure Trigger Control = Source
(Source Bypass Enabled)*
Yes
Yes
No
No
Output
Trigger
Yes
Source
Bypass
Enabled
?
No
Another
Scan
?
Output
Trigger
Yes
Source
Bypass
Enabled
?
No
Another
Measure
?
Scan Count
Measure Count
Source
Immediate
External
Manual
GPIB
Triglink
Timer
Hold
Measure Delay
Figure 3-22
Trigger model (front panel operation)
3-56
Measure Event
Detection
Delay
* Take bypass path the first time a layer is entered
Device
Action
Output
Trigger
Page 98

Front Panel Operation
Idle
The instrument is considered to be in the idle state whenever
it is not operating within one of the three layers of the Trigger
Model. The front panel ARM indicator is off when the instrument is in the idle state. While in the idle state, the instrument
cannot perform any measurement or scanning functions.
From the front panel there are four ways to put the instrument into idle:
• Select RESET GPIB from the SAVESETUP option of
the main menu. Press the TRIG key to take a reading.
After each reading, the instrument returns to the idle
state.
• Select HALT from the CONFIGURE TRIGGER menu.
Press the TRIG key to resume triggering.
• Enable BURST-MODE from the CONFIGURE DATA
STORE menu. This places the instrument in idle until
the TRIG key is pressed. After each burst acquisition
the instrument returns to idle.
• Configure an internal or external scan with the SCAN
key. Disabling the scan resumes triggering.
Once the instrument is taken out of the idle state, operation
proceeds into the arm layer (arm layer 1) of the Trigger
Model.
NOTE
With the Immediate trigger source selected, a “trigger ignored” message will be
displayed if an external trigger is sent to
the Model 2001 or a manual trigger (i.e.,
pressing TRIG key) occurs. The external
or manual trigger is not used (ignored).
As can be seen in the fl wchart, there is a path that allows operation to loop around the source. When Source Bypass is
enabled (Arm Trigger Control set to Source) and the event
source is External or Trigger Link, operation loops around
the source on the initial pass through the arm layer. If programmed for another arm (arm count > 1), the bypass loop is
not in effect even though it is still enabled. The Source Bypass loop resets (is in effect) if operation goes into Idle.
Enabling Source Bypass also enables the Output Trigger.
When operation returns to the arm layer from the scan layer,
an output trigger pulse occurs. If the event source is Trigger
Link, an output trigger pulse is available on the programmed
TRIGGER LINK output line. For all other event sources, the
output trigger pulse is available at the METER COMPLETE
connector. The Output Trigger in this layer is disabled when
Source Bypass is disabled (Arm Trigger Control set to Acceptor).
Arm layer
NOTE
For bus operation, this layer is called arm
layer 1.
In general, the instrument requires an arm event to allow operation to proceed to the next layer (scan layer). With an arm
source of Immediate, operation proceeds to the next layer
when the instrument is taken out of the idle state. Selecting
BENCH or GPIB RESET from the SAVESETUP option of
the main menu also sets the arm source to Immediate. With
one of the other sources selected, the instrument waits until
the appropriate event occurs:
• With the External source selected, the instrument waits
for an input trigger via EXTERNAL TRIGGER on the
rear panel.
• With the Manual source selected, the instrument waits
until the front panel TRIG key is pressed.
• With the GPIB source selected, the instrument waits for
a bus trigger (GET or *TRG).
• With the Trigger Link source selected, the instrument
waits for an input trigger via TRIGGER LINK on the
rear panel.
• With the HOLD source selected, the instrument does
not respond to any of the event sources.
After all other instrument operations are complete, the instrument can be returned to the arm layer by programming
the instrument for additional arms. The Arm Count option is
used to set the arm count to a finite value (where n = 1 to
99999) or for an infinite number of arms. Selecting BENCH
or GPIB RESET from the SAVESETUP option of the main
menu sets the arm count to one.
After the instrument leaves the arm layer, operation proceeds
into the scan layer (arm layer 2).
Scan layer
NOTE
For bus operation, this layer is called arm
layer 2.
In general, the instrument requires a scan event to allow operation to proceed to the next layer (measure layer). With a
scan source of Immediate, operation immediately proceeds
to the next layer. Selecting BENCH or GPIB RESET from
the SAVESETUP option of the main menu also sets the scan
source to Immediate. With one of the other sources selected,
the instrument waits until the appropriate event occurs:
• With the External source selected, the instrument waits
for an input trigger via EXTERNAL TRIGGER on the
rear panel.
3-57
Page 99

Front Panel Operation
• With the Manual source selected, the instrument waits
until the front panel TRIG key is pressed.
• With the GPIB source selected, the instrument waits for
a bus trigger (GET or *TRG).
• With the Trigger Link source selected, the instrument
waits for an input trigger via TRIGGER LINK on the
rear panel.
• With the Timer source selected, operation immediately
proceeds into the measure layer on the initial pass
through the scan layer. Each additional scan does not
occur until the programmed timer interval elapses. The
timer can be set from 1msec to 999999.999sec.
• With the HOLD source selected, the instrument does
not respond to any of the event sources.
NOTE
With the Immediate trigger source selected, a “trigger ignored” message will be
displayed if an external trigger is sent to
the Model 2001 or a manual trigger (i.e.,
pressing TRIG key) occurs. The external
or manual trigger is not used (ignored).
After the programmed scan event is detected, the instrument
waits for the programmed Delay to time out. The scan layer
Delay can be set from 0 to 999999.999sec. Selecting
BENCH or GPIB RESET from the SAVESETUP option of
the main menu sets the Delay to zero seconds.
As can be seen in the fl wchart, there is a path that allows operation to loop around the source. When Source Bypass is
enabled (Scan Trigger Control set to Source) and the event
source is External or Trigger Link, operation loops around
the source on the initial pass through the scan layer. If programmed for another scan (scan count > 1), the bypass loop
is not in effect even though it is still enabled. The Source Bypass loop resets (is in effect) if operation goes back into the
arm layer.
Enabling Source Bypass also enables the Output Trigger.
When operation returns to the scan layer from the measure
layer, an output trigger pulse occurs. If the event source is
Trigger Link, an output trigger pulse is available on the programmed TRIGGER LINK output line. For all other event
sources, the output trigger pulse is available at the METER
COMPLETE connector. The Output Trigger in this layer is
disabled when Source Bypass is disabled (Scan Trigger Control set to Acceptor).
After all other operations in the next layer are complete, the
instrument can be returned to the scan layer by programming
the instrument for additional scans. The Scan Count option
is used to set the scan count to a finite value (where n = 1 to
99999) or for an infinite number of scans. Selecting BENCH
RESET from the SAVESETUP option of the main menu sets
the scan count to infinite; selecting GPIB RESET sets the
scan count to one.
After the instrument leaves the scan layer, operation proceeds into the measure layer (trigger layer).
Measure layer
NOTE
For bus operation, this layer is called Trigger.
In general, measure events control the measurement (or
scan) rate. With a measure source of Immediate, operation
immediately proceeds to the Delay. Selecting BENCH or
GPIB RESET from the SAVESETUP option of the main
menu also sets the measure source to Immediate. With one of
the other sources selected, the instrument waits until the appropriate event occurs:
• With the External source selected, the instrument waits
for an input trigger via EXTERNAL TRIGGER on the
rear panel.
• With the Manual source selected, the instrument waits
until the front panel TRIG key is pressed.
• With the GPIB source selected, the instrument waits for
a bus trigger (GET or *TRG).
• With the Trigger Link source selected, the instrument
waits for an input trigger via TRIGGER LINK on the
rear panel.
• With the Timer source selected, the first measurement
occurs immediately. Each additional measurement occurs at a rate determined by the programmed timer interval (1msec to 999999.999sec).
• With the HOLD source selected, the instrument does
not respond to any of the event sources. Another source
must be selected to acquire a reading.
NOTE
With the Immediate trigger source selected, a “trigger ignored” message will be
displayed if an external trigger is sent to
the Model 2001 or a manual trigger (i.e.,
pressing TRIG key) occurs. The external
or manual trigger is not used (ignored).
After the programmed measure event is detected, the instrument waits for the programmed Delay to time out. The measure layer Delay can be set from 0 to 999999.999sec.
Selecting BENCH or GPIB RESET from the SAVESETUP
option of the main menu sets the Delay to zero seconds.
3-58
Page 100

Front Panel Operation
As can be seen in the fl wchart, there is a path that allows operation to loop around the source. When Source Bypass is
enabled (Measure Trigger Control set to Source) and the
event source is External or Trigger Link, operation loops
around the source on the initial pass through the measure layer. If programmed for another measurement (measure count
> 1), the bypass loop is not in effect even though it is still enabled. The Source Bypass loop resets (is in effect) if operation goes back into the scan layer.
At this point, a measurement is performed (Device Action).
Note that a Device Action could include, among others, a
function change, range change, or a channel scan (if scanner
is enabled). A channel is scanned (closed) before a measurement is taken. When scanning channels, the previous channel
opens and the next channel closes (break-before-make). In
this case, the settling time delay for the relay is included in
the Device Action.
After a Device Action is performed, an Output Trigger occurs. If the measure source is programmed for Immediate,
External, Manual, GPIB, or Timer, the output trigger pulse is
available at the METER COMPLETE connector. If the Trigger Link source is selected, Output Trigger action occurs as
follows:
• If the asynchronous Trigger Link mode is selected, the
output trigger pulse is available on the programmed
TRIGGER LINK output line.
• If the semi-synchronous Trigger Link mode is selected
and the Source Bypass is disabled (Measure Trigger
Control set to Acceptor), the Trigger Link line is released (goes high).
• If the semi-synchronous Trigger Link mode is selected
and the Source Bypass is enabled (Measure Trigger
Control set to Source), the Trigger Link line is pulled
low and then released.
NOTE
See paragraph 3.7.7 for details on using
the Trigger Link.
After the Device Action and an output trigger occurs, the instrument returns (if programmed to do so) to the beginning
of the measure layer to perform another measurement. The
Measure Count option is used to set the measure count to a
finite value (where n = 1 to 99999) or for an infinite number
of measurements. Selecting BENCH RESET from the
SAVESETUP option of the main menu sets the measure
count to infinite; selecting GPIB RESET sets the measure
count to one.
3.7.2 Configuring the measure layer
The measure layer is used for the following operations:
• To select the measuring event (SOURCE) for the instrument.
• To delay operation in the measure layer.
• To designate the number of measurements the instrument will make (COUNT).
• To enable or disable the Source Bypass.
Perform the following steps to display the measure layer
menu:
1. Display the CONFIGURE TRIGGER menu by pressing
the CONFIG key and then the TRIG key.
2. Use the cursor keys ( and ) to place the cursor on
MEASURE and press ENTER to access the following
menu:
SETUP MEASURE LAYER
SOURCE DELAY COUNT CONTROL
SOURCE
This menu item selects the event that controls the measure
source. To select it, place the cursor on SOURCE and press
ENTER. The following menu is displayed:
SELECT MEASURE SRC
IMMEDIATE EXTERNAL MANUAL
GPIB TRIGLINK TIMER HOLD
IMMEDIATE:
and EXTERNAL triggers) do not control the measurement
interval. Once the Model 2001 starts measuring, it will take
readings as fast as its measurement configuration all ws.
Select immediate triggering from the SELECT MEASURE
SRC menu by placing the cursor on IMMEDIATE and pressing ENTER. The instrument returns to the SETUP measure
layer menu.
EXTERNAL:
to control the measure source. Each trigger stimulus applied
to the Model 2001 performs a device action, as defined by
the trigger model. In addition to a measurement, this may include range changing, filtering, calculations, data storing,
scanning, and other operations.
The external trigger is applied to the rear panel “EXTERNAL TRIGGER” BNC connector. See paragraph 3.7.6 for
detailed information on external triggering.
With this selection, events (such as TIMER
With this selection, external triggers are used
NOTE
Front panel TRIG key (see MANUAL) is
active with external triggering selected.
Pressing the TRIG key performs a device
action.
3-59
 Loading...